MOUNT POLLEY MINING CORPORATION TECHNICAL REPORT ON MULTI-ELECTRODE RESISTIVITY AND SEISMIC REFRACTION SURVEYS MOUNT POLLEY TAILINGS DAM PROJECT LIKELY, B.C. by Claudia Krumbiegel, M.Sc. Cliff Candy, P.Geo. PROJECT FGI-1370 October, 2014 ________________________________________________________________ Frontier Geosciences Inc. 237 St. Georges Avenue, North Vancouver, B.C., Canada V7L 4T4 Tel: 604.987.3037 Fax: 604.984.3074

Welcome message from author
This document is posted to help you gain knowledge. Please leave a comment to let me know what you think about it! Share it to your friends and learn new things together.
Transcript
MOUNT POLLEY MINING CORPORATION
TECHNICAL REPORT ON
MULTI-ELECTRODE RESISTIVITY AND
SEISMIC REFRACTION SURVEYS
MOUNT POLLEY TAILINGS DAM PROJECT
LIKELY, B.C.
by
Claudia Krumbiegel, M.Sc.
Cliff Candy, P.Geo.
PROJECT FGI-1370October, 2014________________________________________________________________
Frontier Geosciences Inc. 237 St. Georges Avenue, North Vancouver, B.C., Canada V7L 4T4Tel: 604.987.3037 Fax: 604.984.3074
CONTENTS
74. LIMITATIONS
6 3.3 Data Processing method6 3.2 Survey Procedure6 3.1 Equipment63. THE SEISMIC REFRACTION SURVEY METHOD
5 2.3 Data Processing4 2.2 Survey Procedure 3 2.1 Equipment 32. THE MULTI-ELECTRODE RESISTIVITY SURVEY
11. INTRODUCTIONpage
(i)
Frontier Geosciences Inc.

ILLUSTRATIONS
AppendixSeismic Refraction Profile SL-8Figure 24AppendixSeismic Refraction Profile SL-6Figure 23AppendixSeismic Refraction Profile SL-5Figure 22AppendixSeismic Refraction Profile SL-3Figure 21AppendixSeismic Refraction Profile SL-2Figure 20AppendixSeismic Refraction Profile SL-1Figure 19AppendixInverted Chargeability Profile RL-8Figure 18AppendixInverted Chargeability Profile RL-7Figure 17AppendixInverted Chargeability Profile RL-6Figure 16AppendixInverted Chargeability Profile RL-5Figure 15AppendixInverted Chargeability Profile RL-4Figure 14AppendixInverted Chargeability Profile RL-3Figure 13AppendixInverted Chargeability Profile RL-2Figure 12AppendixInverted Chargeability Profile RL-1Figure 11AppendixInverted Resistivity Profile RL-8Figure 10AppendixInverted Resistivity Profile RL-7Figure 9AppendixInverted Resistivity Profile RL-6Figure 8AppendixInverted Resistivity Profile RL-5Figure 7AppendixInverted Resistivity Profile RL-4Figure 6AppendixInverted Resistivity Profile RL-3Figure 5AppendixInverted Resistivity Profile RL-2Figure 4AppendixInverted Resistivity Profile RL-1Figure 3AppendixSite PlanFigure 2
Page 2Survey Location PlanFigure 1location
(ii)
Frontier Geosciences Inc.

1. INTRODUCTION
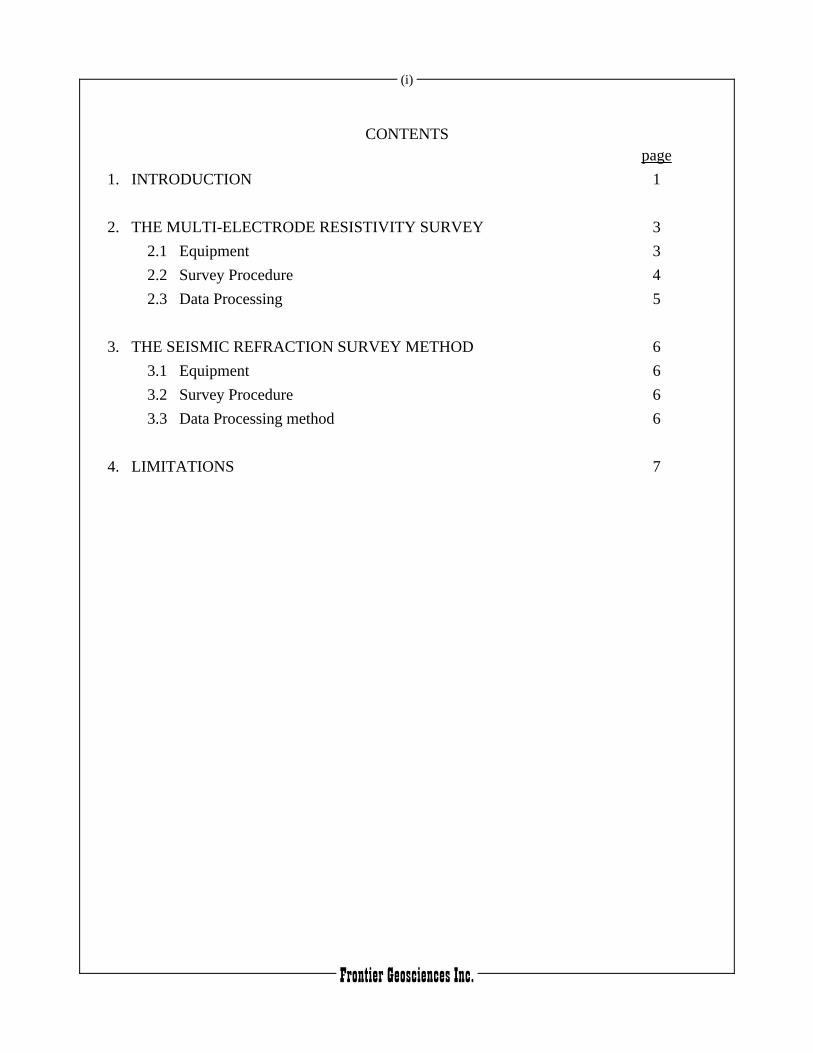
In the periods September 16 to 19 and September 22 to 25, 2015 Frontier Geosciences Inc.carried out a resistivity imaging investigation for Mount Polley Mining Corporation at theMount Polley Mine Site. This work was undertaken together with a program of seismicrefraction investigations, in the periods October 3 to 5 and October 11 to 13, 2014. ASurvey Location Plan of the area is shown at a scale of 1:250,000 in Figure 1.
The purpose of the survey was to assist in determining geological conditions in closeproximity to the Mount Polley Tailings Pond Breach which occurred on August 4, 2014. Thesite area is located approximately 11 kilometres south of Likely, B.C. A detailed Site Plan ofthe area is illustrated at 1:2,500 scale in Figure 2, in the Appendix. A grid of eight resistivitylines was surveyed extending north and west to east of the breach. Additionally, six seismicrefraction lines, partially overlapping the resistivity, were carried out.
A total of approximately 3.0 kilometres of multi-electrode resistivity imaging and1.9 kilometres of seismic refraction surveying on sixteen separate seismic spreads wasconducted.
1
Frontier Geosciences Inc.
2
FIG. 1SCALE 1:250,000DATE: OCT. 2014
FRONTIER GEOSCIENCES INC.
SURVEY LOCATION PLAN
GEOPHYSICAL SURVEY
MOUNT POLLEY TAILINGS DAM PROJECTMOUNT POLLEY MINING CORPORATION
KILOMETRES
570000E 575000E 580000E 585000E 590000E 595000E 600000E 605000E5795000N
5800000N
5805000N
5810000N
5815000N
5820000N
5825000N
5830000N
5835000N
5840000N
0 2.5 5 7.5 10
SURVEY AREA

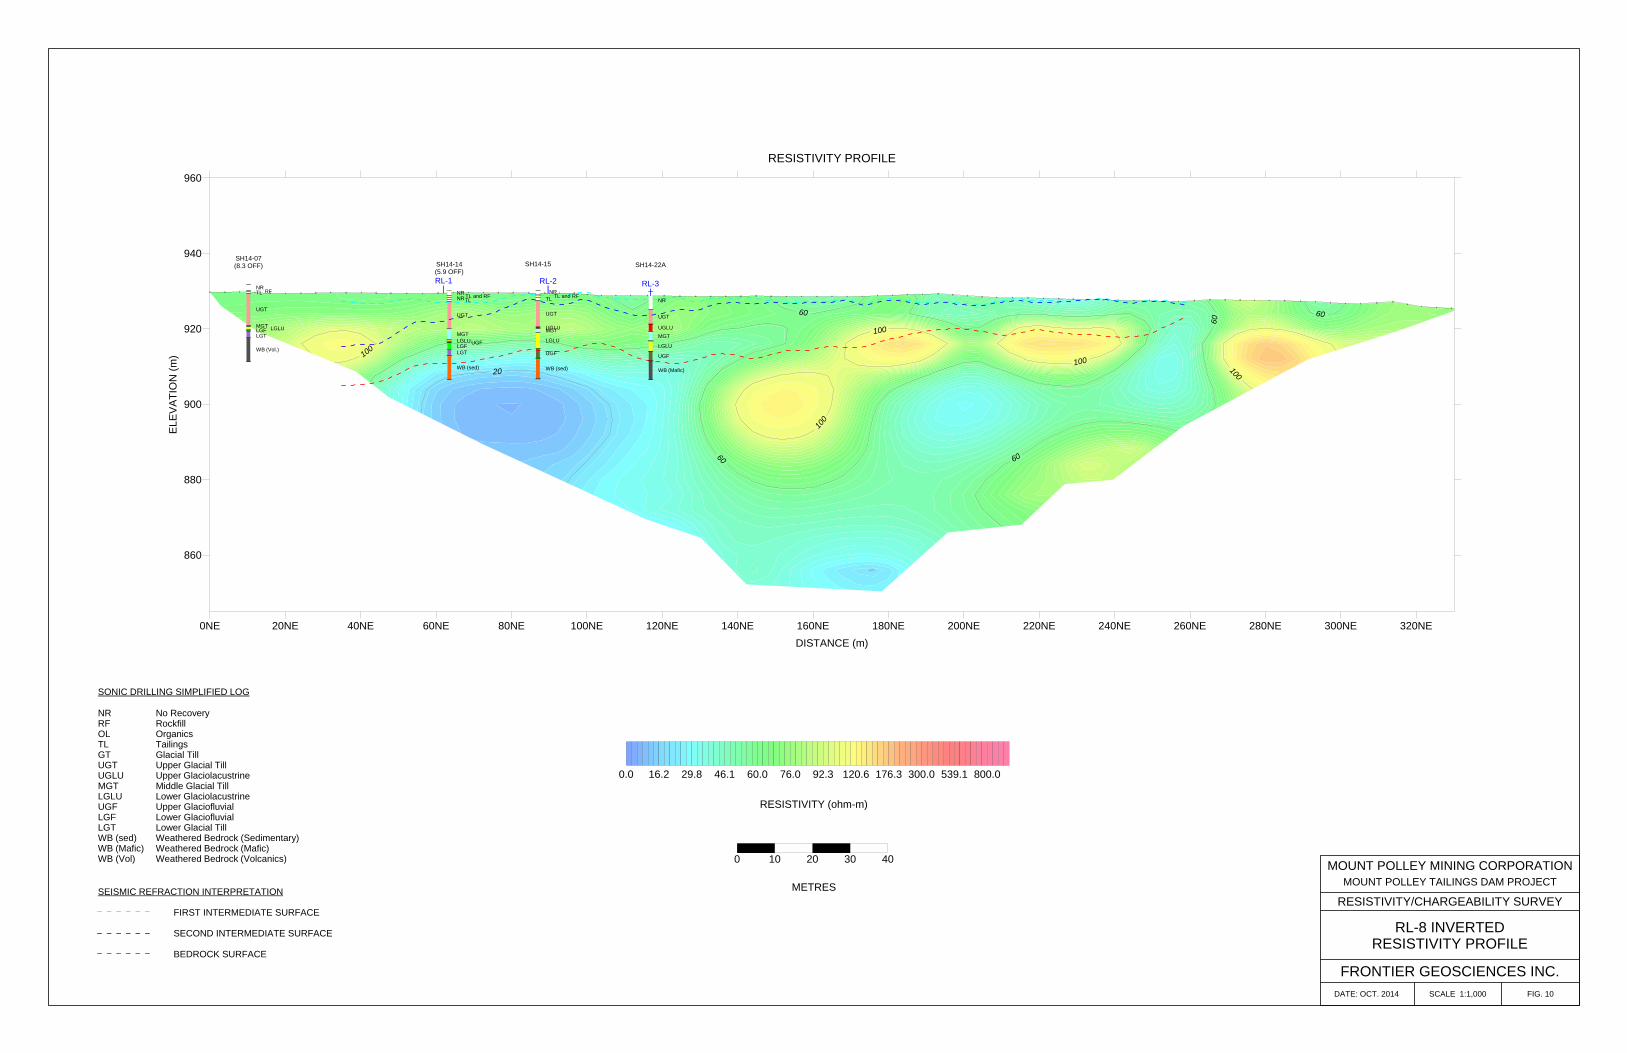
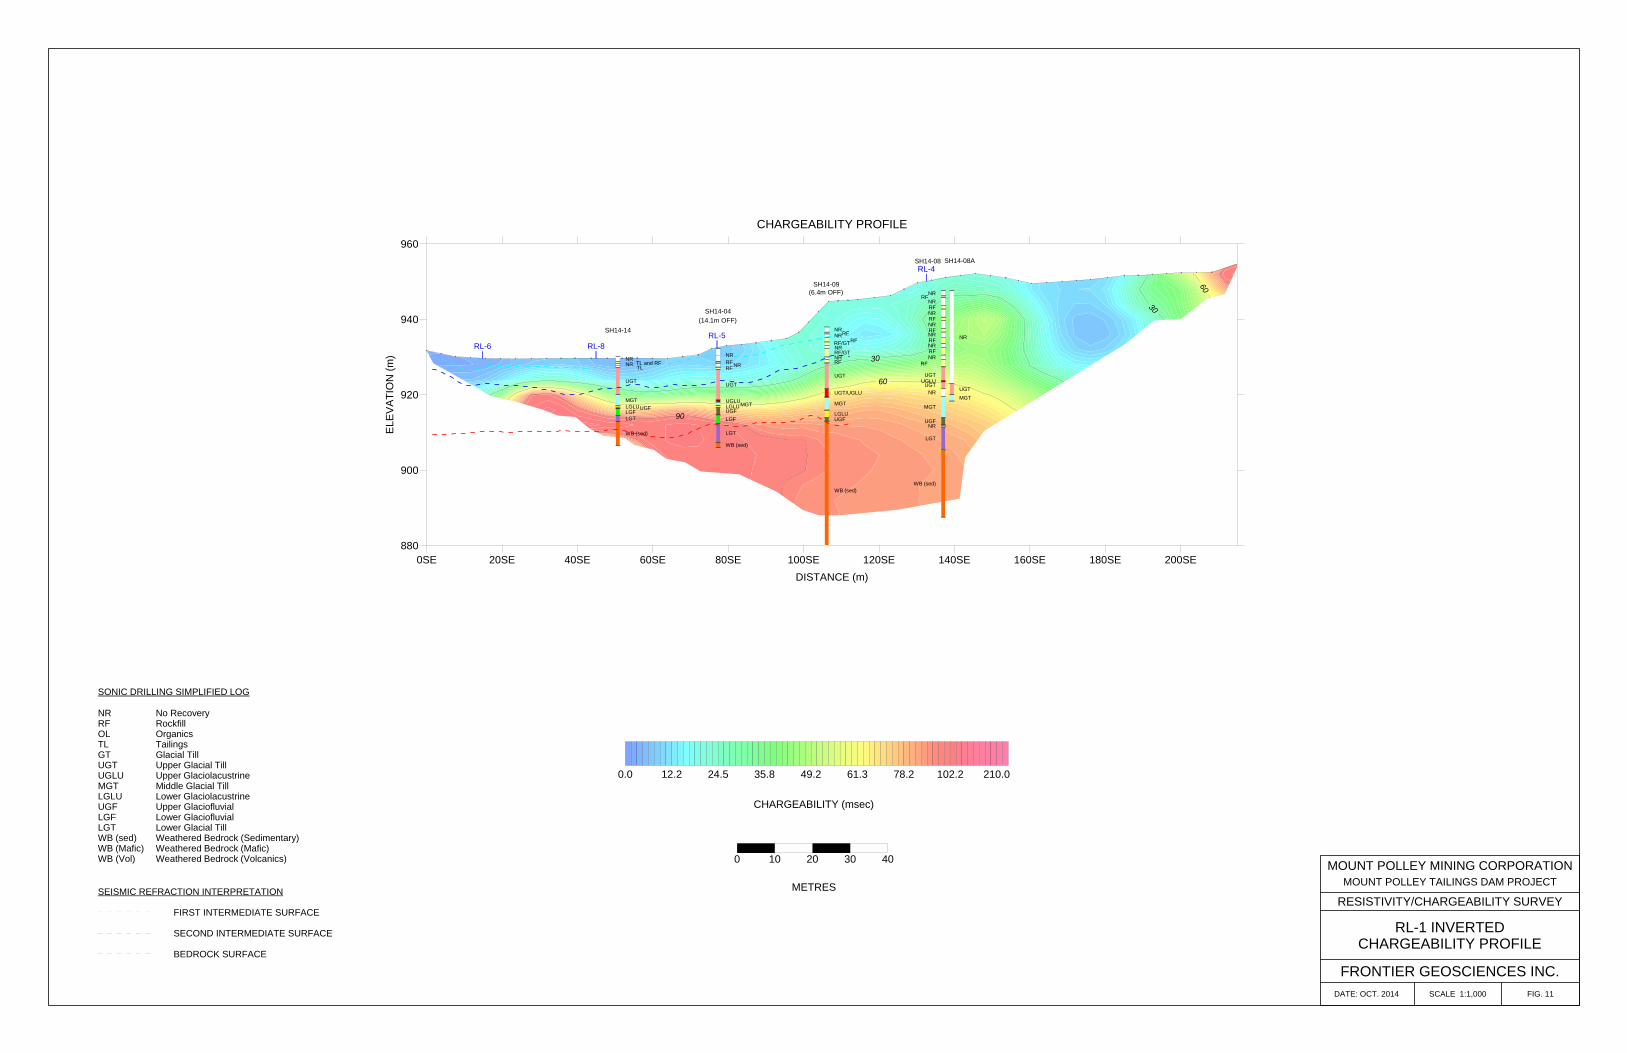
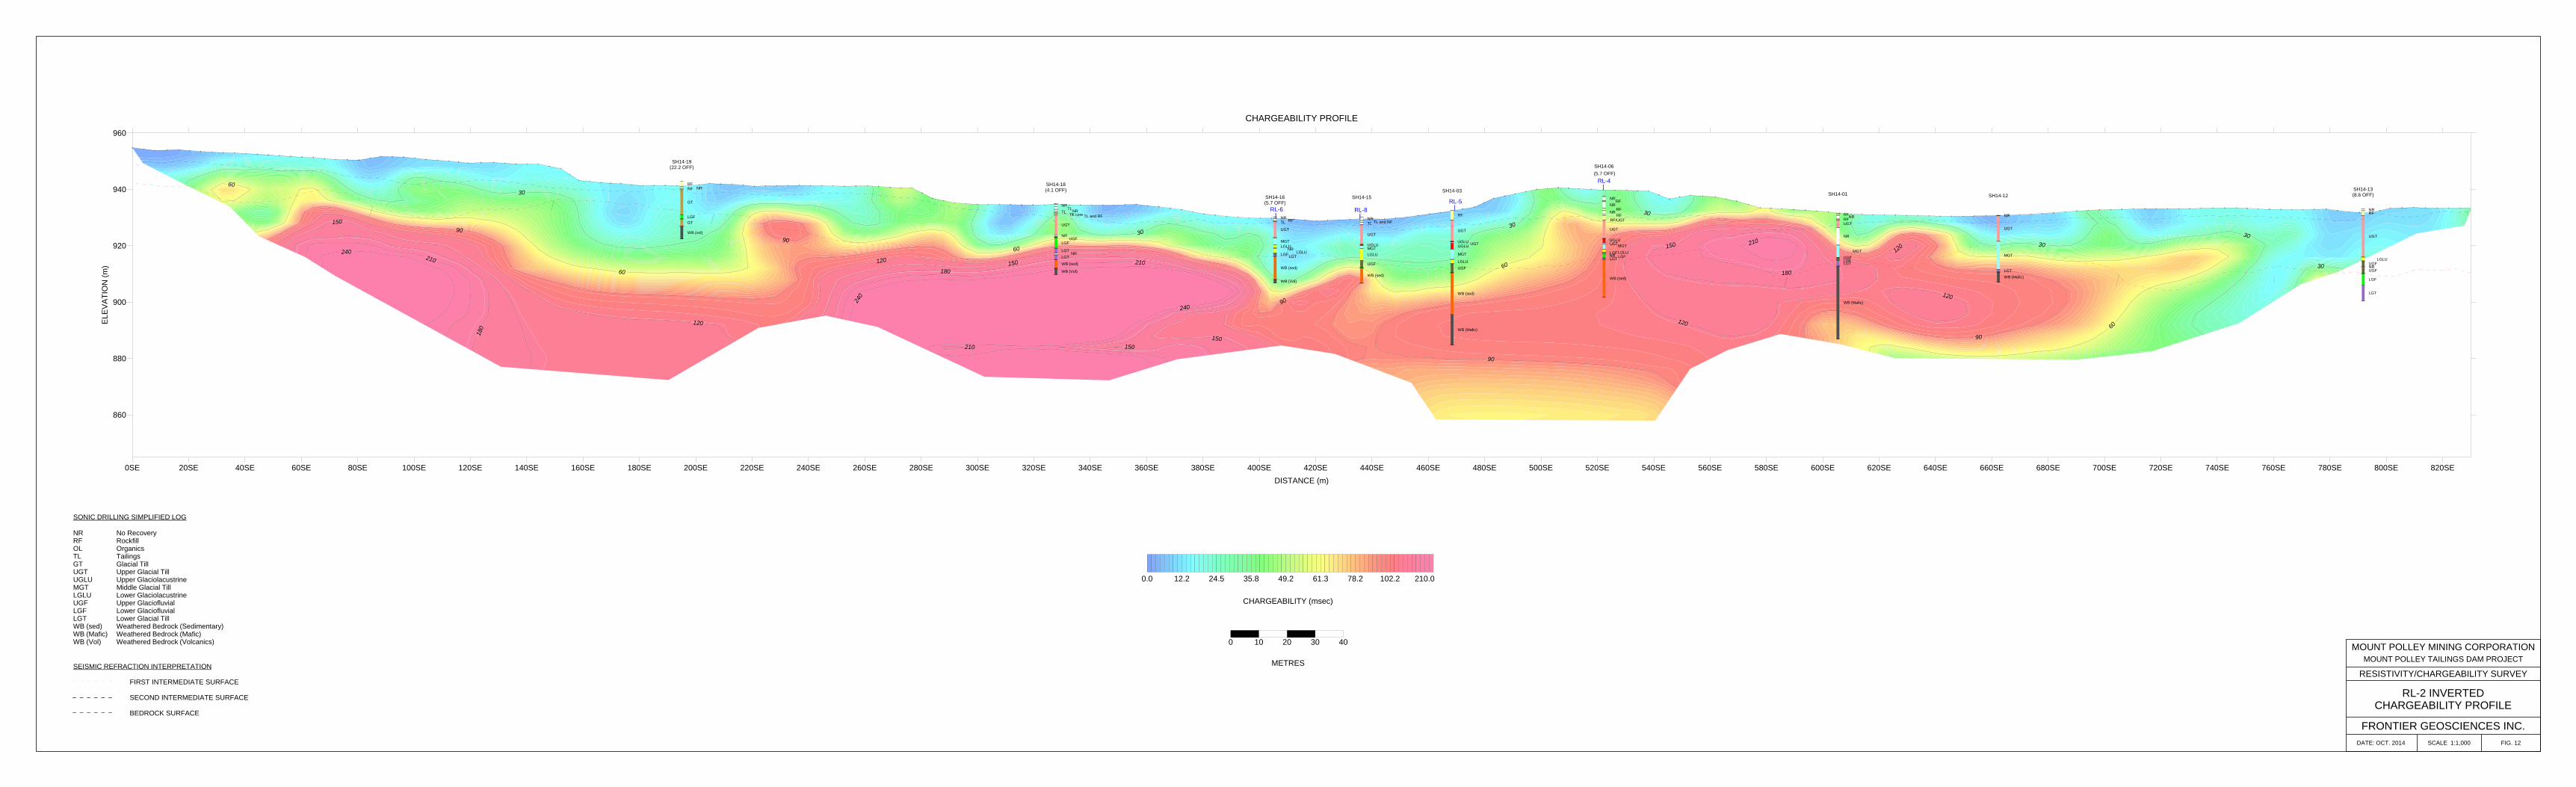
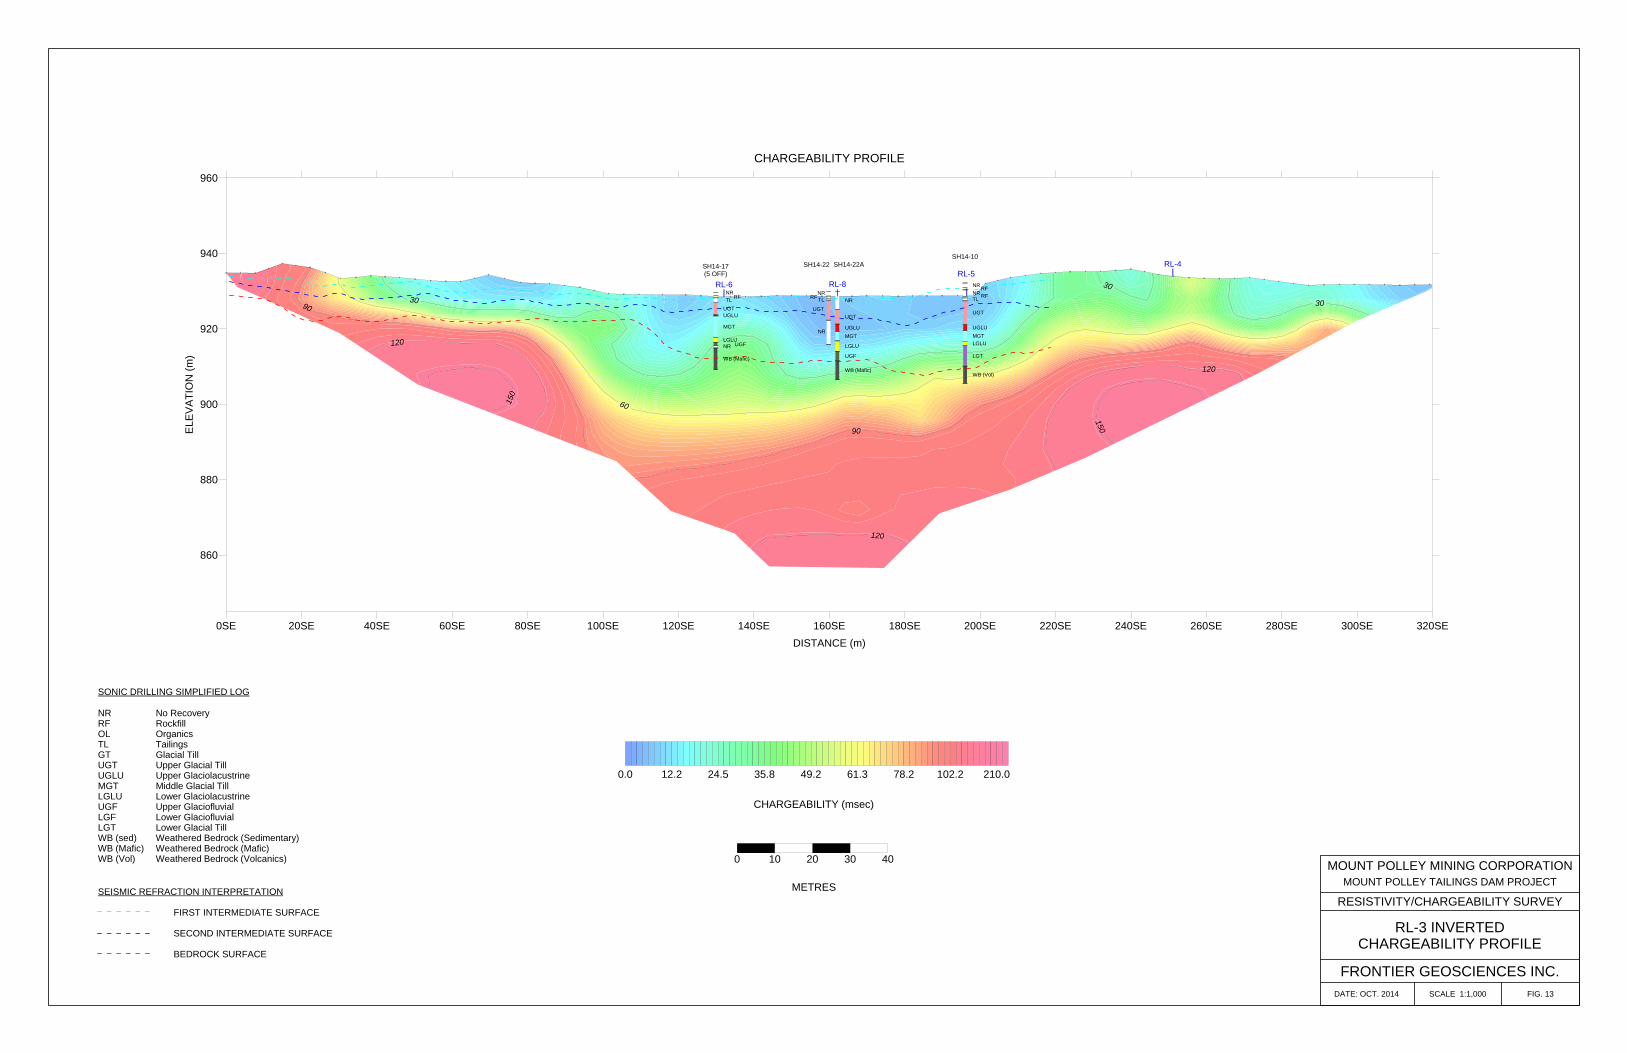
2. THE MULTI-ELECTRODE RESISTIVITY SURVEY
2.1 Equipment
The purpose of electrical surveying is to determine the subsurface resistivity distribution bymaking detailed measurements along survey lines laid out on the ground surface. From thesemeasurements, the true resistivity of the subsurface can be estimated. Ground resistivity isrelated to various geological parameters such as the sulphide, clay mineral and fluid content,porosity and degree of water saturation in weathered material layering and the underlyingmaterials.
The surface multi-electrode imaging resistivity/IP survey was carried out using the FrontierGeosciences Inc. Resistivity/IP system. The instrument has eight receiver channels, allowingmeasurements on multiple electrodes to proceed simultaneously, which significantly speedsup the data collection process allowing dense and detailed resistivity and IP profiles to beobtained.
During multi-electrode surveying, a central switching system is used to address the array ofelectrodes. This switching is accomplished using a multiplexer that directs the signals fromany of the field electrodes to the eight input channels of the receiver. Similarly, a system ofhigh voltage relays in the central switching system allows the transmitter to utilise any pair ofelectrodes for current injection. By means of a command file programmed in the receiver,electrode arrays including Schlumberger, Wenner, dipole-dipole, pole-dipole and pole-pole,or multiple combinations of arrays, may be chosen for execution by the system.
The high resolution, full waveform receiver records the entire waveform for eight channelssimultaneously. With the full 24 bit waveform available for processing, self-potential drift,transient effects, and several other noise sources are accurately identified and removed fromthe signal. This results in full waveform data acquisition, providing high resolutioninformation in lower signal level situations such as higher current electrode spacings andcorresponding deeper penetration in a dipole-dipole survey, or in geologic settings withunfavourable signal-to-noise levels.
3
Frontier Geosciences Inc.

In addition to resistivity measurements, Induced Polarisation readings were collectedsimultaneously. This measurement records the degree to which the earth materials tend toretain an apparent voltage after removal of the transmitted voltage. The effect is termedInduced Polarisation (IP) and has its origins in the electrolytic nature of groundwater and theconductive nature of certain minerals. The system measures the IP effect in the time domainby determining the residual decay voltage after the current is switched off. The time domainunit of measurement of chargeability is milliseconds. The IP effect is caused by two differentmechanisms: membrane and electrode polarisation effects. The membrane polarisation effectis usually created by clay minerals present in the earth. The electrode polarisation effect islargely caused by conductive materials such as sulphides in the rock and (usually) to a lesserextent by graphite. This effect is the basis for application of the IP method in surveys for thedetection of metallic minerals, such as disseminated sulphides.
2.2 Survey Procedure
Cable layouts for each system were identical, consisting of six 70-metre receiver cables laidout along the survey line and connected to the multiplexing switchbox controller. Theswitchbox controller allows the electrodes to be in either standby, current or measuringpotential modes. Each individual cable consists of 14 electrode takeouts at a spacing of5 metres, with a full array covering approximately 420 metres.
The system was configured to permit two different data acquisition procedures. The firstprocedure, typically the initial array of a new line, collects data files encompassing the fullsequence of measurements. After the full array reading, three cables were detached from thefront of the receiver line, and three cables were attached to the front of the receiver line,effectively shifting the array 210 metres along the survey line by ‘rolling’ the array. Thecomputer system was shifted to the same relative position within the rolled array, and theprocess repeated. Data quality was monitored in the field through a full-panel display ofreceived waveforms. If the data was suspect, individual channels could be displayed atenhanced scale for closer inspection and field processing.
4
Frontier Geosciences Inc.

2.3 Data Processing
The data were downloaded from the instruments and converted into the input file format forthe cell-based inversion method developed by M. H. Loke and referred to as the RES2DINVprogram. This software utilises a finite difference modelling approach to calculate theresistivity values that best fit the observed data. The model parameters are the resistivityvalues of the model cell, while the data is the measured apparent resistivity and apparentInduced Polarisation values. The mathematical link between the model parameters and themodel response is provided by the finite-difference or finite-element methods. In alloptimisation methods, an initial model is modified in an iterative manner so that thedifference between the model response and the data values is reduced.
To increase the accuracy of the modelling process, the elevation of each electrode wasincorporated into the input data file.
5
Frontier Geosciences Inc.

3. THE SEISMIC REFRACTION SURVEY METHOD
3.1 Equipment
The seismic refraction investigation was carried out using a Geometrics, Geode, 24 channel,signal enhancement seismograph and Oyo Geo Space, 10 Hz geophones. Geophone intervalsalong the multicored seismic cables were maintained at 5 metres in order to produce highresolution data on subsurface layering and the basal bedrock surface. Electrical blasting capsin the small explosive charges used for energy input were detonated with a high voltage,capacitor type blaster.
3.2 Survey Procedure
For each spread, the seismic cable was stretched out in a straight line and the geophonesimplanted. Six separate ‘shots’ were then initiated: one at either end of the geophone array,two at intermediate locations along the seismic cable, and one off each end of the line toensure adequate coverage of the basal layer. The shots were detonated individually andarrival times for each geophone were recorded digitally in the seismograph. Data recordedduring field surveying operations was generally of good to excellent quality.
Throughout the survey, notes were recorded regarding seismic line positions in relation totopographic and geological features, and survey stations in the area. Relative elevations onthe seismic lines were recorded by chain and inclinometer with absolute elevations providedby Mount Polley Mine Corporation.
3.3 Data Processing Method
The seismic profiles were prepared using the method of differences technique. This methodutilises the time taken to travel to a geophone from shotpoints located to either side of thegeophone. Using the total time, a small vertical time is computed which represents the timetaken to travel from the refractor up to the ground surface. This time is then multiplied bythe velocity of each overburden layer to obtain the thickness of each layer at that point.
6
Frontier Geosciences Inc.

4. LIMITATIONS
The multi-electrode resistivity / IP method results in repeatable measurements of thegeoelectric section. The methods are successful providing adequate contrasts exist in thesubsurface in electrical resistivity and chargeability between distinct geologicalmaterials. Conductors identified in resistivity surveying are diverse and depending ongeological settings, may include mineralisation, graphite, argillite, shear or fault zones, claybeds, marl, saturated materials, clay shale, clay till, mineralised leachate and zones of saltwater intrusion. Electrically resistive materials include but are not limited to sand and gravel,dry soils, glacial moraine, coarse glacial till, permafrost, underground voids and competentbedrock. Also affecting resistivity are the degree of saturation of materials and the porosity,the concentration of dissolved electrolytes, the temperature and the amount and compositionof colloids. With few exceptions, no unique resistivity value defines a specific geologicalmaterial.
Sources of IP response include almost all the sulphides, oxides such as magnetite, graphiteand clay materials. Penetration depths may be affected by the presence of highly conductivesurficial materials that may partially mask deeper geological layering. In addition, theresolution of the resistivity and IP methods decreases exponentially with depth. Given thediffuse nature of the methods, resolution is inherently poorer at depth. The survey results canalso be influenced by electrode coupling, presence of noise such as SP, capacitive coupling,electromagnetic coupling and the presence of power lines.
In the modelling process, a number of limitations constrain modelling of subsurfaceresistivity and chargeability. For instance, due to non-uniqueness, more than one model canproduce the same response that agrees with the observed data. The resulting model thusdepends to a significant extent on the constraints used and will closely approximate the truesubsurface conditions only if the constraints closely correspond to actual subsurfaceconditions.
7
Frontier Geosciences Inc.

930
930
930
930
930
940
940
940
940
940
940
950
950
950
950 950
950
960
960
960
960
970
970
970970
0
100
200
0
100 200 300
400
500
600
700
800
0
100
200
300
0
100
200
300
0
100
200
300
0
100
200
300
0
100
200
300
0
100
200
300
SH14-01
SH14-02A
SH14-03
SH14-04
SH14-05ASH14-06
SH14-07
SH14-08 SH14-08A
SH14-09
SH14-10
SH14-11SH14-11B
SH14-12
SH14-13
SH14-14
SH14-15
SH14-16
SH14-17
SH14-18
SH14-19
SH14-20
SH14-21
SH14-22 SH14-22A
594600E 594650E 594700E 594750E 594800E 594850E 594900E 594950E 595000E 595050E 595100E 595150E 595200E 595250E 595300E 595350E 595400E 595450E 595500E5819700N
5819750N
5819800N
5819850N
5819900N
5819950N
5820000N
5820050N
5820100N
5820150N
5820200N
FIG. 2SCALE 1:2,500DATE: OCT. 2014
FRONTIER GEOSCIENCES INC.
SITE PLAN
GEOPHYSICAL SURVEY
MOUNT POLLEY TAILINGS DAM PROJECTMOUNT POLLEY MINING CORPORATION
RL-4
RL-5RL
-8
RL-6
RL-2
RL-3
RL-7RL-1
0 25 50 75 100
METRES
100RESISTIVITY LINE AND STATION
SEISMIC REFRACTION LINE
BOREHOLESH14-01
60
60
100
100
100
100
200
200
200
300
300
400
400
500
500
600
800
RL-4
RL-5RL-8RL-6
SH14-14
SH14-04(14.1m OFF)
SH14-09(6.4m OFF)
SH14-08 SH14-08A
NRRF
NRRFNRRFNRRFNRRFNRRFNR
RF
UGTUGLU
UGTNR
MGT
UGFNR
LGT
WB (sed)
NRTL and RFNR TL
UGT
MGTLGLUUGFLGFLGT
WB (sed)
NRRFNRRF
UGT
UGLUMGTLGLUUGFLGF
LGT
WB (sed)
NRRFNR
RFRF/GTNRRF/GTNRRF
UGT
UGT/UGLU
MGT
LGLUUGF
WB (sed)
NR
UGTMGT
0SE 20SE 40SE 60SE 80SE 100SE 120SE 140SE 160SE 180SE 200SEDISTANCE (m)
RESISTIVITY PROFILE
880
900
920
940
960
ELE
VA
TIO
N (m
)
FIG. 3SCALE 1:1,000DATE: OCT. 2014
FRONTIER GEOSCIENCES INC.
RL-1 INVERTEDRESISTIVITY PROFILE
RESISTIVITY/CHARGEABILITY SURVEY
MOUNT POLLEY TAILINGS DAM PROJECTMOUNT POLLEY MINING CORPORATION
RESISTIVITY (ohm-m)
0.0 16.2 29.8 46.1 60.0 76.0 92.3 120.6 176.3 300.0 539.1 800.0
METRES
0 10 20 30 40
FIRST INTERMEDIATE SURFACE
SECOND INTERMEDIATE SURFACE
BEDROCK SURFACE
SEISMIC REFRACTION INTERPRETATION
NRRFOLTLGTUGTUGLUMGTLGLUUGFLGFLGTWB (sed)WB (Mafic)WB (Vol)
No RecoveryRockfillOrganicsTailingsGlacial TillUpper Glacial TillUpper GlaciolacustrineMiddle Glacial TillLower GlaciolacustrineUpper GlaciofluvialLower GlaciofluvialLower Glacial TillWeathered Bedrock (Sedimentary)Weathered Bedrock (Mafic)Weathered Bedrock (Volcanics)
SONIC DRILLING SIMPLIFIED LOG

20
20
20
2020
60
60
60
6060
60
60
60
6060
60
60
60
60
60
60
60
60
60
60
60
60
60
60
60
100
100
100
100
100
100
100
100
100
100
100
100
100
100
100
100
100
100200
200
200
200
200 200 200
200
200300
300
300
300
300
400
400
400
500
RL-4
RL-5RL-8RL-6
RFNRRF
GT
LGFGT
WB (vol)
NRTLNRTL Till core TL and RF
UGT
NRUGF
LGF
LGTNR
LGT
WB (sed)
WB (Vol)
NR RFTL
UGT
MGTLGLU
NRLGLULGFLGT
WB (sed)
WB (Vol)
NRTL and RFTL
UGT
UGLUMGTLGLU
UGF
WB (sed)
RF
UGT
UGLU UGTUGLU
MGT
LGLU
UGF
WB (sed)
WB (Mafic)
NRRF
NRRF
NRRF
RF/UGT
UGT
UGLUUGTMGT
LGLULGFNR LGFLGT
WB (sed)
RFNRRFUGT
NR
MGTUGFLGFLGT
WB (Mafic)
NR
UGT
MGT
LGTWB (Mafic)
NRRF
UGT
LGLUUGFNRUGF
LGF
LGT
SH14-19(22.2 OFF)
SH14-18(4.1 OFF)
SH14-16(5.7 OFF)
SH14-15SH14-03
SH14-06(5.7 OFF)
SH14-01 SH14-12SH14-13(8.6 OFF)
0SE 20SE 40SE 60SE 80SE 100SE 120SE 140SE 160SE 180SE 200SE 220SE 240SE 260SE 280SE 300SE 320SE 340SE 360SE 380SE 400SE 420SE 440SE 460SE 480SE 500SE 520SE 540SE 560SE 580SE 600SE 620SE 640SE 660SE 680SE 700SE 720SE 740SE 760SE 780SE 800SE 820SEDISTANCE (m)
RESISTIVITY PROFILE
860
880
900
920
940
960
ELE
VA
TIO
N (m
)
FIG. 4SCALE 1:1,000DATE: OCT. 2014
FRONTIER GEOSCIENCES INC.
RL-2 INVERTEDRESISTIVITY PROFILE
RESISTIVITY/CHARGEABILITY SURVEY
MOUNT POLLEY TAILINGS DAM PROJECTMOUNT POLLEY MINING CORPORATION
RESISTIVITY (ohm-m)
0.0 16.2 29.8 46.1 60.0 76.0 92.3 120.6 176.3 300.0 539.1 800.0
METRES
0 10 20 30 40
FIRST INTERMEDIATE SURFACE
SECOND INTERMEDIATE SURFACE
BEDROCK SURFACE
SEISMIC REFRACTION INTERPRETATION
NRRFOLTLGTUGTUGLUMGTLGLUUGFLGFLGTWB (sed)WB (Mafic)WB (Vol)
No RecoveryRockfillOrganicsTailingsGlacial TillUpper Glacial TillUpper GlaciolacustrineMiddle Glacial TillLower GlaciolacustrineUpper GlaciofluvialLower GlaciofluvialLower Glacial TillWeathered Bedrock (Sedimentary)Weathered Bedrock (Mafic)Weathered Bedrock (Volcanics)
SONIC DRILLING SIMPLIFIED LOG

20
20
60
60
60 60
100
100
100
200
200
300
400
500
600
800
RL-4RL-5
RL-8RL-6
SH14-17(5 OFF)
SH14-22 SH14-22ASH14-10
NRRFTL
UGTUGLU
MGT
LGLUUGFNR
WB (Mafic)
NRRF TL
UGT
NR
NR
UGT
UGLUMGT
LGLU
UGF
WB (Mafic)
NRRFNR RFTL
UGT
UGLUMGTLGLU
LGT
WB (Vol)
0SE 20SE 40SE 60SE 80SE 100SE 120SE 140SE 160SE 180SE 200SE 220SE 240SE 260SE 280SE 300SE 320SEDISTANCE (m)
RESISTIVITY PROFILE
860
880
900
920
940
960E
LEV
ATI
ON
(m)
FIG. 5SCALE 1:1,000DATE: OCT. 2014
FRONTIER GEOSCIENCES INC.
RL-3 INVERTEDRESISTIVITY PROFILE
RESISTIVITY/CHARGEABILITY SURVEY
MOUNT POLLEY TAILINGS DAM PROJECTMOUNT POLLEY MINING CORPORATION
RESISTIVITY (ohm-m)
0.0 16.2 29.8 46.1 60.0 76.0 92.3 120.6 176.3 300.0 539.1 800.0
METRES
0 10 20 30 40
FIRST INTERMEDIATE SURFACE
SECOND INTERMEDIATE SURFACE
BEDROCK SURFACE
SEISMIC REFRACTION INTERPRETATION
NRRFOLTLGTUGTUGLUMGTLGLUUGFLGFLGTWB (sed)WB (Mafic)WB (Vol)
No RecoveryRockfillOrganicsTailingsGlacial TillUpper Glacial TillUpper GlaciolacustrineMiddle Glacial TillLower GlaciolacustrineUpper GlaciofluvialLower GlaciofluvialLower Glacial TillWeathered Bedrock (Sedimentary)Weathered Bedrock (Mafic)Weathered Bedrock (Volcanics)
SONIC DRILLING SIMPLIFIED LOG

60
60
6060
60 60
100
100
100
100
100
100
200
200
300
300
400
400
500
500
600
600800
900
RL-1
RL-2RL-7
RL-3
NRRF
NRRFNRRFNRRFNRRF
NRRFNRRF
UGTUGLU
UGTNR
MGT
UGFNR
LGT
WB (sed)
NRRF
NRRF
NRRFRF/UGT
UGT
UGLUUGT
MGTLGLU
LGFNRLGFLGT
WB (sed)
NRRFOL NRUGT
NRUGTNR
UGT
UGLUUGTMGTLGLULGFLGT/WB (Mafic)
WB (Mafic)
RFNRRF NROL
UGT
UGLUUGT UGLUMGTLGFLGT
WB (Mafic)
SH14-08
(4.6m OFF)
SH14-06 SH14-05A(8.3m OFF)
SH14-02A
0NE 20NE 40NE 60NE 80NE 100NE 120NE 140NE 160NE 180NE 200NE 220NE 240NE 260NE 280NE 300NE 320NEDISTANCE (m)
RESISTIVITY PROFILE
860
880
900
920
940
960E
LEV
ATI
ON
(m)
FIG. 6SCALE 1:1,000DATE: OCT. 2014
FRONTIER GEOSCIENCES INC.
RL-4 INVERTEDRESISTIVITY PROFILE
RESISTIVITY/CHARGEABILITY SURVEY
MOUNT POLLEY TAILINGS DAM PROJECTMOUNT POLLEY MINING CORPORATION
RESISTIVITY (ohm-m)
0.0 16.2 29.8 46.1 60.0 76.0 92.3 120.6 176.3 300.0 539.1 800.0
METRES
0 10 20 30 40
NRRFOLTLGTUGTUGLUMGTLGLUUGFLGFLGTWB (sed)WB (Mafic)WB (Vol)
No RecoveryRockfillOrganicsTailingsGlacial TillUpper Glacial TillUpper GlaciolacustrineMiddle Glacial TillLower GlaciolacustrineUpper GlaciofluvialLower GlaciofluvialLower Glacial TillWeathered Bedrock (Sedimentary)Weathered Bedrock (Mafic)Weathered Bedrock (Volcanics)
SONIC DRILLING SIMPLIFIED LOG
20
60
60
60 6060
60 60100
100
100
200300
400
500
600
800
900
RL-1 RL-2 RL-7 RL-3
NRRF NRRF
UGT
UGLU MGTLGLUUGFLGF
LGT
WB (sed)
RF
UGT
UGLU UGTUGLU
MGT
LGLUUGF
WB (sed)
WB (Mafic)
NRRF
NRRFTL
UGT
UGLUMGTLGLU
LGT
WB (Vol)
NRRF
RFOL
UGT
MGTUGFLGT
WB (Mafic)
NRRF TLRFOLUGT
NRUGT
MGTUGFLGT
WB (Mafic)
SH14-04 SH14-03 SH14-10
SH14-11B SH14-11
0NE 20NE 40NE 60NE 80NE 100NE 120NE 140NE 160NE 180NE 200NE 220NE 240NE 260NE 280NE 300NE 320NEDISTANCE (m)
RESISTIVITY PROFILE
860
880
900
920
940
960E
LEV
ATI
ON
(m)
FIG. 7SCALE 1:1,000DATE: OCT. 2014
FRONTIER GEOSCIENCES INC.
RL-5 INVERTEDRESISTIVITY PROFILE
RESISTIVITY/CHARGEABILITY SURVEY
MOUNT POLLEY TAILINGS DAM PROJECTMOUNT POLLEY MINING CORPORATION
RESISTIVITY (ohm-m)
0.0 16.2 29.8 46.1 60.0 76.0 92.3 120.6 176.3 300.0 539.1 800.0
METRES
0 10 20 30 40
FIRST INTERMEDIATE SURFACE
SECOND INTERMEDIATE SURFACE
BEDROCK SURFACE
SEISMIC REFRACTION INTERPRETATION
NRRFOLTLGTUGTUGLUMGTLGLUUGFLGFLGTWB (sed)WB (Mafic)WB (Vol)
No RecoveryRockfillOrganicsTailingsGlacial TillUpper Glacial TillUpper GlaciolacustrineMiddle Glacial TillLower GlaciolacustrineUpper GlaciofluvialLower GlaciofluvialLower Glacial TillWeathered Bedrock (Sedimentary)Weathered Bedrock (Mafic)Weathered Bedrock (Volcanics)
SONIC DRILLING SIMPLIFIED LOG
20
20
6060
60
6060 60
60
100
100100
100200
300
400
RL-1 RL-2 RL-3NR RFTL
UGT
MGTLGLUNRLGLU
LGFLGT
WB (sed)
WB (Vol)
NRRFTLUGTUGLU
MGT
LGLUUGFNR
WB (Mafic)
SH14-16 SH14-17
0NE 20NE 40NE 60NE 80NE 100NE 120NE 140NE 160NE 180NE 200NE 220NE 240NE 260NE 280NE 300NE 320NEDISTANCE (m)
RESISTIVITY PROFILE
860
880
900
920
940
960E
LEV
ATI
ON
(m)
FIG. 8SCALE 1:1,000DATE: OCT. 2014
FRONTIER GEOSCIENCES INC.
RL-6 INVERTEDRESISTIVITY PROFILE
RESISTIVITY/CHARGEABILITY SURVEY
MOUNT POLLEY TAILINGS DAM PROJECTMOUNT POLLEY MINING CORPORATION
RESISTIVITY (ohm-m)
0.0 16.2 29.8 46.1 60.0 76.0 92.3 120.6 176.3 300.0 539.1 800.0
METRES
0 10 20 30 40
FIRST INTERMEDIATE SURFACE
SECOND INTERMEDIATE SURFACE
BEDROCK SURFACE
SEISMIC REFRACTION INTERPRETATION
NRRFOLTLGTUGTUGLUMGTLGLUUGFLGFLGTWB (sed)WB (Mafic)WB (Vol)
No RecoveryRockfillOrganicsTailingsGlacial TillUpper Glacial TillUpper GlaciolacustrineMiddle Glacial TillLower GlaciolacustrineUpper GlaciofluvialLower GlaciofluvialLower Glacial TillWeathered Bedrock (Sedimentary)Weathered Bedrock (Mafic)Weathered Bedrock (Volcanics)
SONIC DRILLING SIMPLIFIED LOG

20
60
60
60
60
100
100100
100
200
200
200
300
RL-4
RL-5 NRRFOLNRUGT
NRUGTNR
UGT
UGLUUGTMGTLGLU
LGFLGT/WB (Mafic)
WB (Mafic)WB (Mafic)
SH14-05A
0SE 20SE 40SE 60SE 80SE 100SE 120SE 140SE 160SE 180SE 200SE 220SE 240SE 260SE 280SE 300SE 320SEDISTANCE (m)
RESISTIVITY PROFILE
860
880
900
920
940
960E
LEV
ATI
ON
(m)
FIG. 9SCALE 1:1,000DATE: OCT. 2014
FRONTIER GEOSCIENCES INC.
RL-7 INVERTEDRESISTIVITY PROFILE
RESISTIVITY/CHARGEABILITY SURVEY
MOUNT POLLEY TAILINGS DAM PROJECTMOUNT POLLEY MINING CORPORATION
RESISTIVITY (ohm-m)
0.0 16.2 29.8 46.1 60.0 76.0 92.3 120.6 176.3 300.0 539.1 800.0
METRES
0 10 20 30 40
NRRFOLTLGTUGTUGLUMGTLGLUUGFLGFLGTWB (sed)WB (Mafic)WB (Vol)
No RecoveryRockfillOrganicsTailingsGlacial TillUpper Glacial TillUpper GlaciolacustrineMiddle Glacial TillLower GlaciolacustrineUpper GlaciofluvialLower GlaciofluvialLower Glacial TillWeathered Bedrock (Sedimentary)Weathered Bedrock (Mafic)Weathered Bedrock (Volcanics)
SONIC DRILLING SIMPLIFIED LOG
20
60
60
60
60
60
100
100
100
100
100
RL-1 RL-2 RL-3NRRFTL
UGT
MGT LGLULGFLGT
WB (Vol.)
NR TL and RFNRTL
UGT
MGTLGLUUGFLGFLGT
WB (sed)
NRTL and RFTL
UGT
UGLUMGT
LGLU
UGF
WB (sed)
NR
UGT
UGLUMGT
LGLU
UGF
WB (Mafic)
SH14-07(8.3 OFF) SH14-14
(5.9 OFF)SH14-15 SH14-22A
0NE 20NE 40NE 60NE 80NE 100NE 120NE 140NE 160NE 180NE 200NE 220NE 240NE 260NE 280NE 300NE 320NEDISTANCE (m)
RESISTIVITY PROFILE
860
880
900
920
940
960E
LEV
ATI
ON
(m)
FIG. 10SCALE 1:1,000DATE: OCT. 2014
FRONTIER GEOSCIENCES INC.
RL-8 INVERTEDRESISTIVITY PROFILE
RESISTIVITY/CHARGEABILITY SURVEY
MOUNT POLLEY TAILINGS DAM PROJECTMOUNT POLLEY MINING CORPORATION
RESISTIVITY (ohm-m)
0.0 16.2 29.8 46.1 60.0 76.0 92.3 120.6 176.3 300.0 539.1 800.0
METRES
0 10 20 30 40
FIRST INTERMEDIATE SURFACE
SECOND INTERMEDIATE SURFACE
BEDROCK SURFACE
SEISMIC REFRACTION INTERPRETATION
NRRFOLTLGTUGTUGLUMGTLGLUUGFLGFLGTWB (sed)WB (Mafic)WB (Vol)
No RecoveryRockfillOrganicsTailingsGlacial TillUpper Glacial TillUpper GlaciolacustrineMiddle Glacial TillLower GlaciolacustrineUpper GlaciofluvialLower GlaciofluvialLower Glacial TillWeathered Bedrock (Sedimentary)Weathered Bedrock (Mafic)Weathered Bedrock (Volcanics)
SONIC DRILLING SIMPLIFIED LOG
30
30
60
6090
RL-4
RL-5RL-8RL-6
SH14-14
SH14-04(14.1m OFF)
SH14-09(6.4m OFF)
SH14-08 SH14-08A
NRRF
NRRFNRRFNRRFNRRFNRRFNR
RF
UGTUGLU
UGTNR
MGT
UGFNR
LGT
WB (sed)
NRTL and RFNR TL
UGT
MGTLGLUUGFLGFLGT
WB (sed)
NRRFNRRF
UGT
UGLUMGTLGLUUGFLGF
LGT
WB (sed)
NRRFNR
RFRF/GTNRRF/GTNRRF
UGT
UGT/UGLU
MGT
LGLUUGF
WB (sed)
NR
UGTMGT
0SE 20SE 40SE 60SE 80SE 100SE 120SE 140SE 160SE 180SE 200SEDISTANCE (m)
CHARGEABILITY PROFILE
880
900
920
940
960
ELE
VA
TIO
N (m
)
FIG. 11SCALE 1:1,000DATE: OCT. 2014
FRONTIER GEOSCIENCES INC.
RL-1 INVERTEDCHARGEABILITY PROFILE
RESISTIVITY/CHARGEABILITY SURVEY
MOUNT POLLEY TAILINGS DAM PROJECTMOUNT POLLEY MINING CORPORATION
CHARGEABILITY (msec)
0.0 12.2 24.5 35.8 49.2 61.3 78.2 102.2 210.0
METRES
0 10 20 30 40
FIRST INTERMEDIATE SURFACE
SECOND INTERMEDIATE SURFACE
BEDROCK SURFACE
SEISMIC REFRACTION INTERPRETATION
NRRFOLTLGTUGTUGLUMGTLGLUUGFLGFLGTWB (sed)WB (Mafic)WB (Vol)
No RecoveryRockfillOrganicsTailingsGlacial TillUpper Glacial TillUpper GlaciolacustrineMiddle Glacial TillLower GlaciolacustrineUpper GlaciofluvialLower GlaciofluvialLower Glacial TillWeathered Bedrock (Sedimentary)Weathered Bedrock (Mafic)Weathered Bedrock (Volcanics)
SONIC DRILLING SIMPLIFIED LOG
30
30
30
30
3030
30
60
60
60
60
60
90
90
90
90
90
120
120
120
120
120
150
150
150150
150
180
180 180
210 210
210
210
240
240
240
RL-4
RL-5RL-8RL-6
RFNRRF
GT
LGFGT
WB (vol)
NRTLNRTL Till core TL and RF
UGT
NRUGF
LGF
LGTNR
LGT
WB (sed)
WB (Vol)
NR RFTL
UGT
MGTLGLU
NRLGLULGFLGT
WB (sed)
WB (Vol)
NRTL and RFTL
UGT
UGLUMGTLGLU
UGF
WB (sed)
RF
UGT
UGLU UGTUGLU
MGT
LGLUUGF
WB (sed)
WB (Mafic)
NRRF
NRRF
NRRF
RF/UGT
UGT
UGLUUGTMGT
LGLULGFNR LGFLGT
WB (sed)
RFNRRFUGT
NR
MGTUGFLGFLGT
WB (Mafic)
NR
UGT
MGT
LGTWB (Mafic)
NRRF
UGT
LGLUUGFNRUGF
LGF
LGT
SH14-19(22.2 OFF)
SH14-18(4.1 OFF)
SH14-16(5.7 OFF)
SH14-15SH14-03
SH14-06(5.7 OFF)
SH14-01 SH14-12SH14-13(8.6 OFF)
0SE 20SE 40SE 60SE 80SE 100SE 120SE 140SE 160SE 180SE 200SE 220SE 240SE 260SE 280SE 300SE 320SE 340SE 360SE 380SE 400SE 420SE 440SE 460SE 480SE 500SE 520SE 540SE 560SE 580SE 600SE 620SE 640SE 660SE 680SE 700SE 720SE 740SE 760SE 780SE 800SE 820SEDISTANCE (m)
CHARGEABILITY PROFILE
860
880
900
920
940
960
ELE
VA
TIO
N (m
)
FIG. 12SCALE 1:1,000DATE: OCT. 2014
FRONTIER GEOSCIENCES INC.
RL-2 INVERTEDCHARGEABILITY PROFILE
RESISTIVITY/CHARGEABILITY SURVEY
MOUNT POLLEY TAILINGS DAM PROJECTMOUNT POLLEY MINING CORPORATION
CHARGEABILITY (msec)
0.0 12.2 24.5 35.8 49.2 61.3 78.2 102.2 210.0
METRES
0 10 20 30 40
FIRST INTERMEDIATE SURFACE
SECOND INTERMEDIATE SURFACE
BEDROCK SURFACE
SEISMIC REFRACTION INTERPRETATION
NRRFOLTLGTUGTUGLUMGTLGLUUGFLGFLGTWB (sed)WB (Mafic)WB (Vol)
No RecoveryRockfillOrganicsTailingsGlacial TillUpper Glacial TillUpper GlaciolacustrineMiddle Glacial TillLower GlaciolacustrineUpper GlaciofluvialLower GlaciofluvialLower Glacial TillWeathered Bedrock (Sedimentary)Weathered Bedrock (Mafic)Weathered Bedrock (Volcanics)
SONIC DRILLING SIMPLIFIED LOG
30 30
30
60
90
90
120
120
120
150
150
RL-4RL-5
RL-8RL-6
SH14-17(5 OFF)
SH14-22 SH14-22ASH14-10
NRRFTL
UGTUGLU
MGT
LGLUUGFNR
WB (Mafic)
NRRF TL
UGT
NR
NR
UGT
UGLUMGT
LGLU
UGF
WB (Mafic)
NRRFNR RFTL
UGT
UGLUMGTLGLU
LGT
WB (Vol)
0SE 20SE 40SE 60SE 80SE 100SE 120SE 140SE 160SE 180SE 200SE 220SE 240SE 260SE 280SE 300SE 320SEDISTANCE (m)
CHARGEABILITY PROFILE
860
880
900
920
940
960E
LEV
ATI
ON
(m)
FIG. 13SCALE 1:1,000DATE: OCT. 2014
FRONTIER GEOSCIENCES INC.
RL-3 INVERTEDCHARGEABILITY PROFILE
RESISTIVITY/CHARGEABILITY SURVEY
MOUNT POLLEY TAILINGS DAM PROJECTMOUNT POLLEY MINING CORPORATION
CHARGEABILITY (msec)
0.0 12.2 24.5 35.8 49.2 61.3 78.2 102.2 210.0
METRES
0 10 20 30 40
FIRST INTERMEDIATE SURFACE
SECOND INTERMEDIATE SURFACE
BEDROCK SURFACE
SEISMIC REFRACTION INTERPRETATION
NRRFOLTLGTUGTUGLUMGTLGLUUGFLGFLGTWB (sed)WB (Mafic)WB (Vol)
No RecoveryRockfillOrganicsTailingsGlacial TillUpper Glacial TillUpper GlaciolacustrineMiddle Glacial TillLower GlaciolacustrineUpper GlaciofluvialLower GlaciofluvialLower Glacial TillWeathered Bedrock (Sedimentary)Weathered Bedrock (Mafic)Weathered Bedrock (Volcanics)
SONIC DRILLING SIMPLIFIED LOG
30
30
30
30
30
60
60
60
90
90
90
120
120
150
150
RL-1
RL-2RL-7
RL-3
NRRF
NRRFNRRFNRRFNRRF
NRRFNRRF
UGTUGLU
UGTNR
MGT
UGFNR
LGT
WB (sed)
NRRF
NRRF
NRRFRF/UGT
UGT
UGLUUGT
MGTLGLU
LGFNRLGFLGT
WB (sed)
NRRFOL NRUGT
NRUGTNR
UGT
UGLUUGTMGTLGLULGFLGT/WB (Mafic)
WB (Mafic)
RFNRRF NROL
UGT
UGLUUGT UGLUMGTLGFLGT
WB (Mafic)
SH14-08
(4.6m OFF)
SH14-06 SH14-05A(8.3m OFF)
SH14-02A
0NE 20NE 40NE 60NE 80NE 100NE 120NE 140NE 160NE 180NE 200NE 220NE 240NE 260NE 280NE 300NE 320NEDISTANCE (m)
CHARGEABILITY PROFILE
860
880
900
920
940
960E
LEV
ATI
ON
(m)
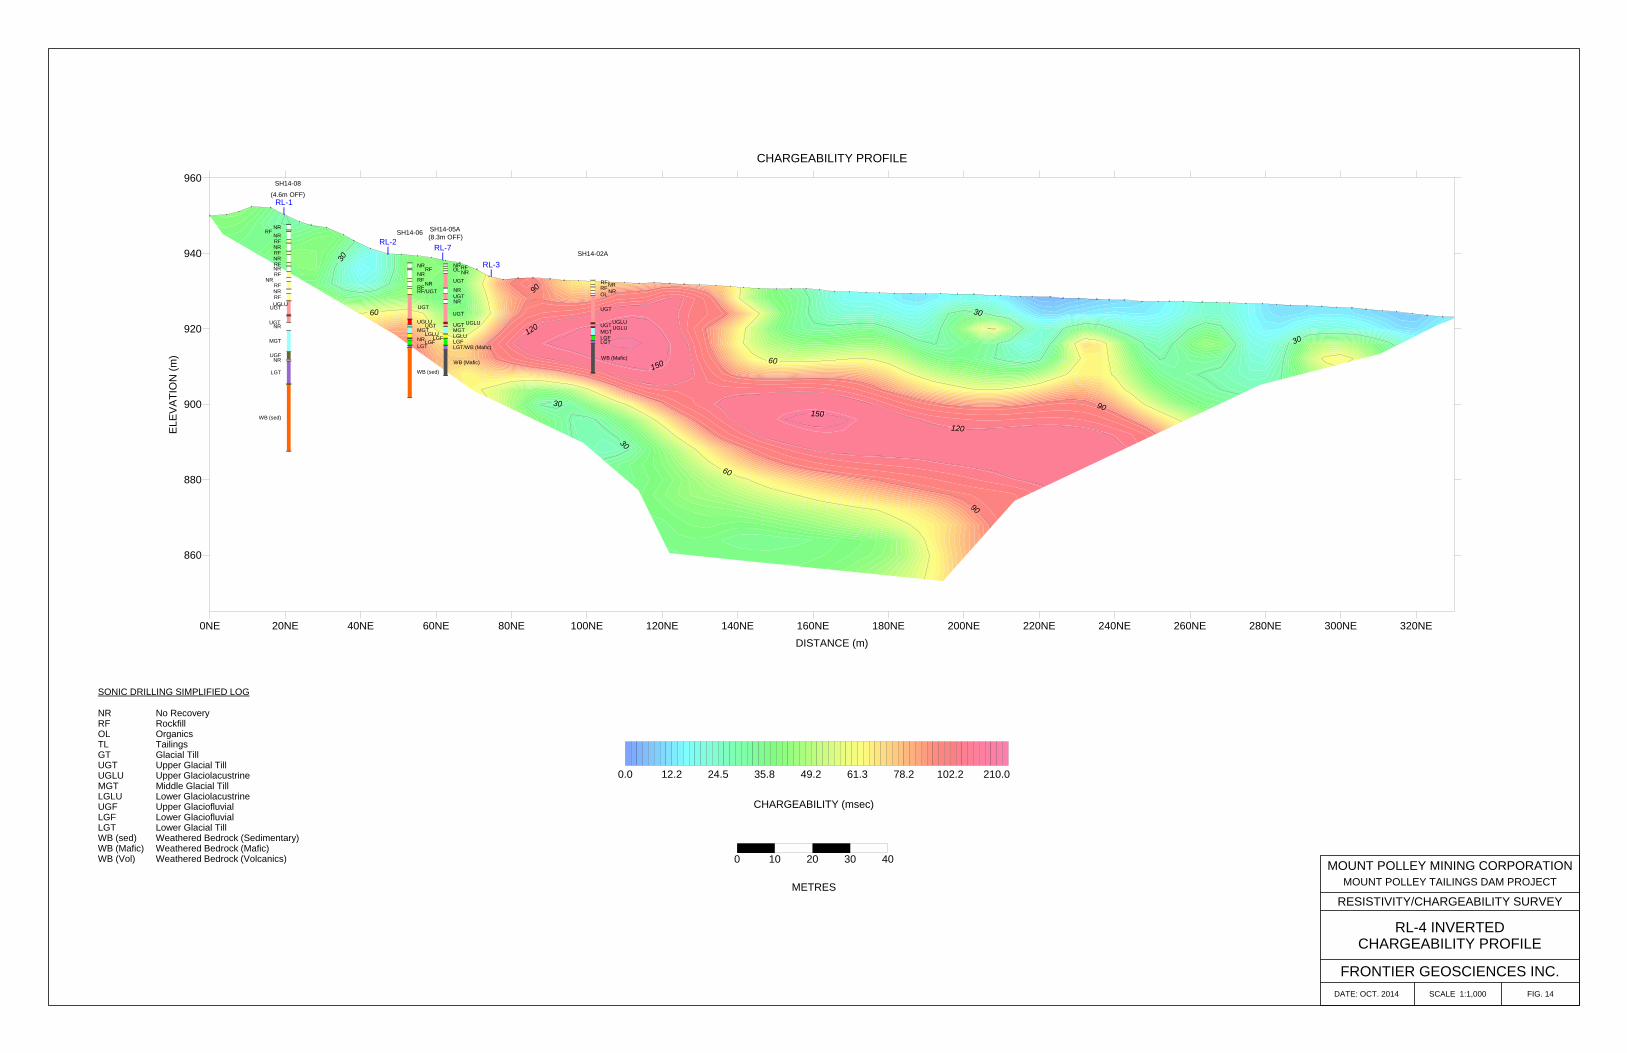
FIG. 14SCALE 1:1,000DATE: OCT. 2014
FRONTIER GEOSCIENCES INC.
RL-4 INVERTEDCHARGEABILITY PROFILE
RESISTIVITY/CHARGEABILITY SURVEY
MOUNT POLLEY TAILINGS DAM PROJECTMOUNT POLLEY MINING CORPORATION
CHARGEABILITY (msec)
0.0 12.2 24.5 35.8 49.2 61.3 78.2 102.2 210.0
METRES
0 10 20 30 40
NRRFOLTLGTUGTUGLUMGTLGLUUGFLGFLGTWB (sed)WB (Mafic)WB (Vol)
No RecoveryRockfillOrganicsTailingsGlacial TillUpper Glacial TillUpper GlaciolacustrineMiddle Glacial TillLower GlaciolacustrineUpper GlaciofluvialLower GlaciofluvialLower Glacial TillWeathered Bedrock (Sedimentary)Weathered Bedrock (Mafic)Weathered Bedrock (Volcanics)
SONIC DRILLING SIMPLIFIED LOG

30
30
6060
RL-1 RL-2 RL-7 RL-3
NRRF NRRF
UGT
UGLU MGTLGLUUGFLGF
LGT
WB (sed)
RF
UGT
UGLU UGTUGLU
MGT
LGLUUGF
WB (sed)
WB (Mafic)
NRRF
NRRFTL
UGT
UGLUMGTLGLU
LGT
WB (Vol)
NRRF
RFOL
UGT
MGTUGFLGT
WB (Mafic)
NRRF TLRFOLUGT
NRUGT
MGTUGFLGT
WB (Mafic)
SH14-04 SH14-03 SH14-10
SH14-11B SH14-11
0NE 20NE 40NE 60NE 80NE 100NE 120NE 140NE 160NE 180NE 200NE 220NE 240NE 260NE 280NE 300NE 320NEDISTANCE (m)
CHARGEABILITY PROFILE
860
880
900
920
940
960E
LEV
ATI
ON
(m)
FIG. 15SCALE 1:1,000DATE: OCT. 2014
FRONTIER GEOSCIENCES INC.
RL-5 INVERTEDCHARGEABILITY PROFILE
RESISTIVITY/CHARGEABILITY SURVEY
MOUNT POLLEY TAILINGS DAM PROJECTMOUNT POLLEY MINING CORPORATION
CHARGEABILITY (msec)
0.0 12.2 24.5 35.8 49.2 61.3 78.2 102.2 210.0
METRES
0 10 20 30 40
FIRST INTERMEDIATE SURFACE
SECOND INTERMEDIATE SURFACE
BEDROCK SURFACE
SEISMIC REFRACTION INTERPRETATION
NRRFOLTLGTUGTUGLUMGTLGLUUGFLGFLGTWB (sed)WB (Mafic)WB (Vol)
No RecoveryRockfillOrganicsTailingsGlacial TillUpper Glacial TillUpper GlaciolacustrineMiddle Glacial TillLower GlaciolacustrineUpper GlaciofluvialLower GlaciofluvialLower Glacial TillWeathered Bedrock (Sedimentary)Weathered Bedrock (Mafic)Weathered Bedrock (Volcanics)
SONIC DRILLING SIMPLIFIED LOG
3030
60
6060
90
120
120
RL-1 RL-2 RL-3NR RFTL
UGT
MGTLGLUNRLGLU
LGFLGT
WB (sed)
WB (Vol)
NRRFTLUGTUGLU
MGT
LGLUUGFNR
WB (Mafic)
SH14-16 SH14-17
0NE 20NE 40NE 60NE 80NE 100NE 120NE 140NE 160NE 180NE 200NE 220NE 240NE 260NE 280NE 300NE 320NEDISTANCE (m)
CHARGEABILITY PROFILE
860
880
900
920
940
960E
LEV
ATI
ON
(m)
FIG. 16SCALE 1:1,000DATE: OCT. 2014
FRONTIER GEOSCIENCES INC.
RL-6 INVERTEDCHARGEABILITY PROFILE
RESISTIVITY/CHARGEABILITY SURVEY
MOUNT POLLEY TAILINGS DAM PROJECTMOUNT POLLEY MINING CORPORATION
CHARGEABILITY (msec)
0.0 12.2 24.5 35.8 49.2 61.3 78.2 102.2 210.0
METRES
0 10 20 30 40
FIRST INTERMEDIATE SURFACE
SECOND INTERMEDIATE SURFACE
BEDROCK SURFACE
SEISMIC REFRACTION INTERPRETATION
NRRFOLTLGTUGTUGLUMGTLGLUUGFLGFLGTWB (sed)WB (Mafic)WB (Vol)
No RecoveryRockfillOrganicsTailingsGlacial TillUpper Glacial TillUpper GlaciolacustrineMiddle Glacial TillLower GlaciolacustrineUpper GlaciofluvialLower GlaciofluvialLower Glacial TillWeathered Bedrock (Sedimentary)Weathered Bedrock (Mafic)Weathered Bedrock (Volcanics)
SONIC DRILLING SIMPLIFIED LOG

30
30
3030 60
60
60
60
60
60
90
90
90
90
120
NRRFOLNRUGT
NRUGTNR
UGT
UGLUUGTMGTLGLU
LGFLGT/WB (Mafic)
WB (Mafic)WB (Mafic)
SH14-05ARL-4
RL-5
0SE 20SE 40SE 60SE 80SE 100SE 120SE 140SE 160SE 180SE 200SE 220SE 240SE 260SE 280SE 300SE 320SEDISTANCE (m)
CHARGEABILITY PROFILE
860
880
900
920
940
960E
LEV
ATI
ON
(m)
FIG. 17SCALE 1:1,000DATE: OCT. 2014
FRONTIER GEOSCIENCES INC.
RL-7 INVERTEDCHARGEABILITY PROFILE
RESISTIVITY/CHARGEABILITY SURVEY
MOUNT POLLEY TAILINGS DAM PROJECTMOUNT POLLEY MINING CORPORATION
CHARGEABILITY (msec)
0.0 12.2 24.5 35.8 49.2 61.3 78.2 102.2 210.0
METRES
0 10 20 30 40
NRRFOLTLGTUGTUGLUMGTLGLUUGFLGFLGTWB (sed)WB (Mafic)WB (Vol)
No RecoveryRockfillOrganicsTailingsGlacial TillUpper Glacial TillUpper GlaciolacustrineMiddle Glacial TillLower GlaciolacustrineUpper GlaciofluvialLower GlaciofluvialLower Glacial TillWeathered Bedrock (Sedimentary)Weathered Bedrock (Mafic)Weathered Bedrock (Volcanics)
SONIC DRILLING SIMPLIFIED LOG
3030
30
60
60
60
90
90
90
90
120
120
RL-1 RL-2 RL-3NRRFTL
UGT
MGT LGLULGFLGT
WB (Vol.)
NR TL and RFNRTL
UGT
MGTLGLUUGFLGFLGT
WB (sed)
NRTL and RFTL
UGT
UGLUMGT
LGLU
UGF
WB (sed)
NR
UGT
UGLUMGT
LGLU
UGF
WB (Mafic)
SH14-07(8.3 OFF) SH14-14
(5.9 OFF)SH14-15 SH14-22A
0NE 20NE 40NE 60NE 80NE 100NE 120NE 140NE 160NE 180NE 200NE 220NE 240NE 260NE 280NE 300NE 320NEDISTANCE (m)
CHARGEABILITY PROFILE
860
880
900
920
940
960E
LEV
ATI
ON
(m)
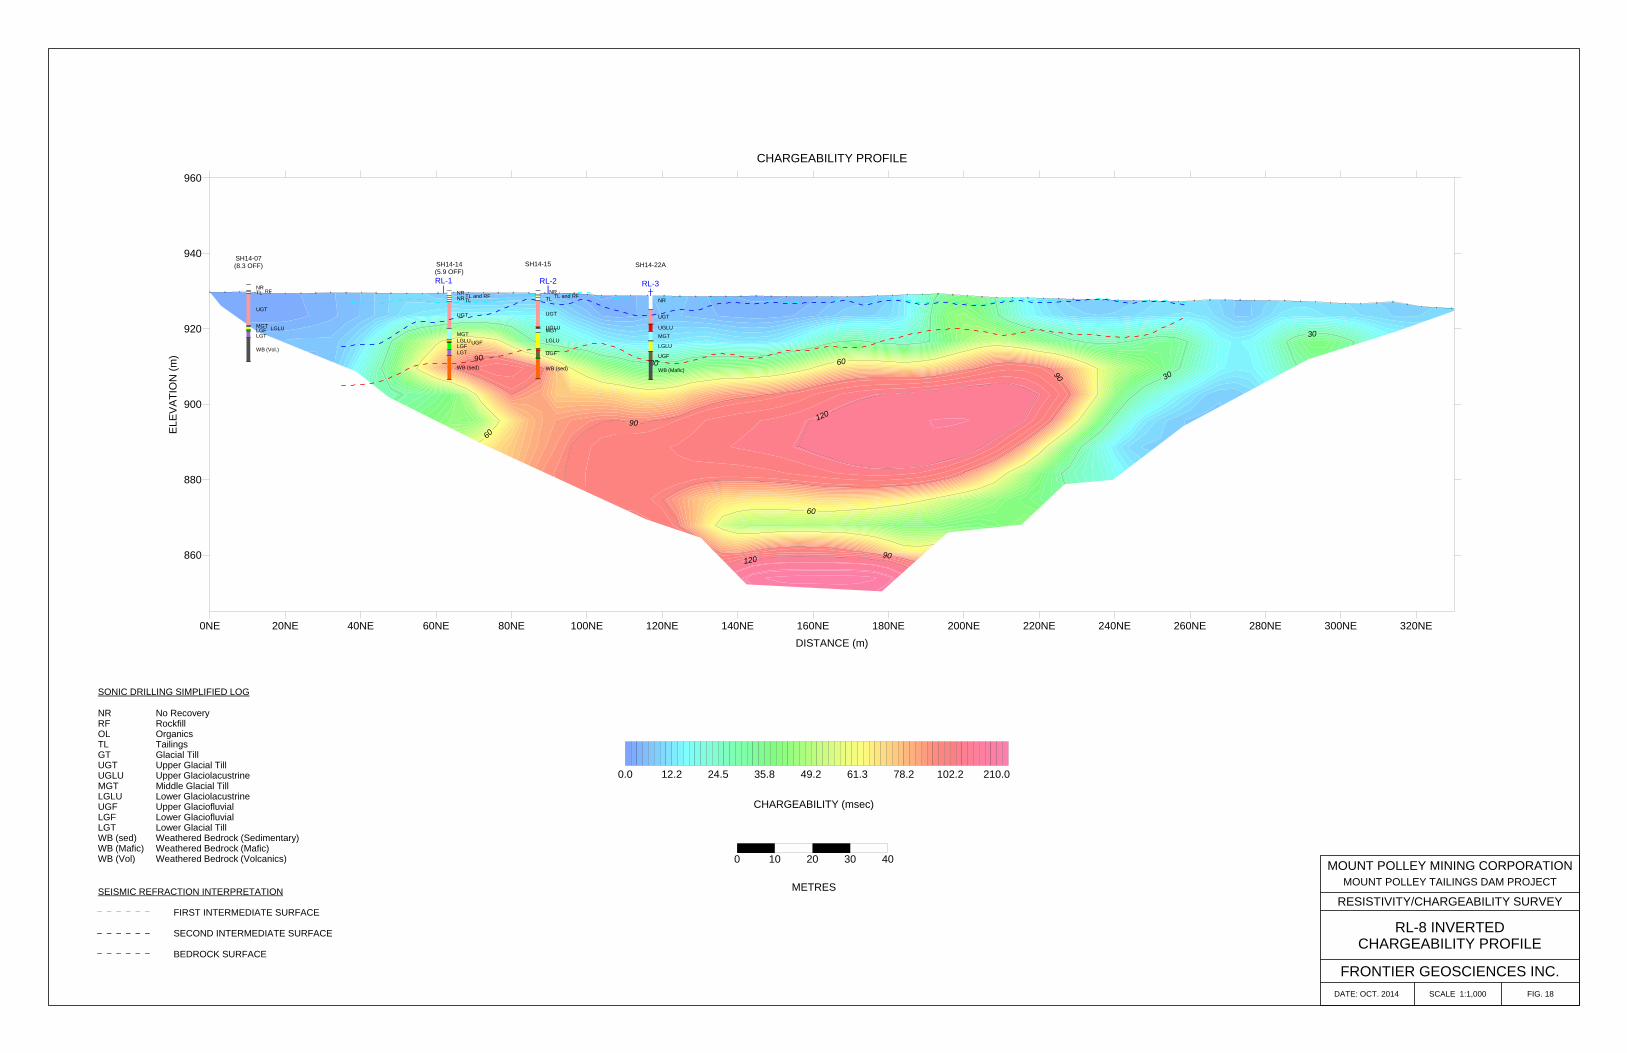
FIG. 18SCALE 1:1,000DATE: OCT. 2014
FRONTIER GEOSCIENCES INC.
RL-8 INVERTEDCHARGEABILITY PROFILE
RESISTIVITY/CHARGEABILITY SURVEY
MOUNT POLLEY TAILINGS DAM PROJECTMOUNT POLLEY MINING CORPORATION
CHARGEABILITY (msec)
0.0 12.2 24.5 35.8 49.2 61.3 78.2 102.2 210.0
METRES
0 10 20 30 40
FIRST INTERMEDIATE SURFACE
SECOND INTERMEDIATE SURFACE
BEDROCK SURFACE
SEISMIC REFRACTION INTERPRETATION
NRRFOLTLGTUGTUGLUMGTLGLUUGFLGFLGTWB (sed)WB (Mafic)WB (Vol)
No RecoveryRockfillOrganicsTailingsGlacial TillUpper Glacial TillUpper GlaciolacustrineMiddle Glacial TillLower GlaciolacustrineUpper GlaciofluvialLower GlaciofluvialLower Glacial TillWeathered Bedrock (Sedimentary)Weathered Bedrock (Mafic)Weathered Bedrock (Volcanics)
SONIC DRILLING SIMPLIFIED LOG
SL-5SL-8SL-6
SH14-14
SH14-04(14.1m OFF)
SH14-09(6.4m OFF)
SH14-08 SH14-08A
NRRF
NRRFNRRFNRRFNRRFNRRFNR
RF
UGTUGLU
UGTNR
MGT
UGFNR
LGT
WB (sed)
NRTL and RFNR TL
UGT
MGTLGLUUGFLGFLGT
WB (sed)
NRRFNRRF
UGT
UGLUMGTLGLUUGFLGF
LGT
WB (sed)
NRRFNR
RFRF/GTNRRF/GTNRRF
UGT
UGT/UGLU
MGT
LGLUUGF
WB (sed)
NR
UGTMGT
360 m/s
850 m/s
1690 m/s
2360 m/s
360 m/s
850 m/s
1750 m/s
2360 m/s
0SE 20SE 40SE 60SE 80SE 100SE 120SE 140SE 160SE 180SE 200SEDISTANCE (m)
SEISMIC REFRACTION PROFILE
880
900
920
940
960
ELE
VA
TIO
N (m
)
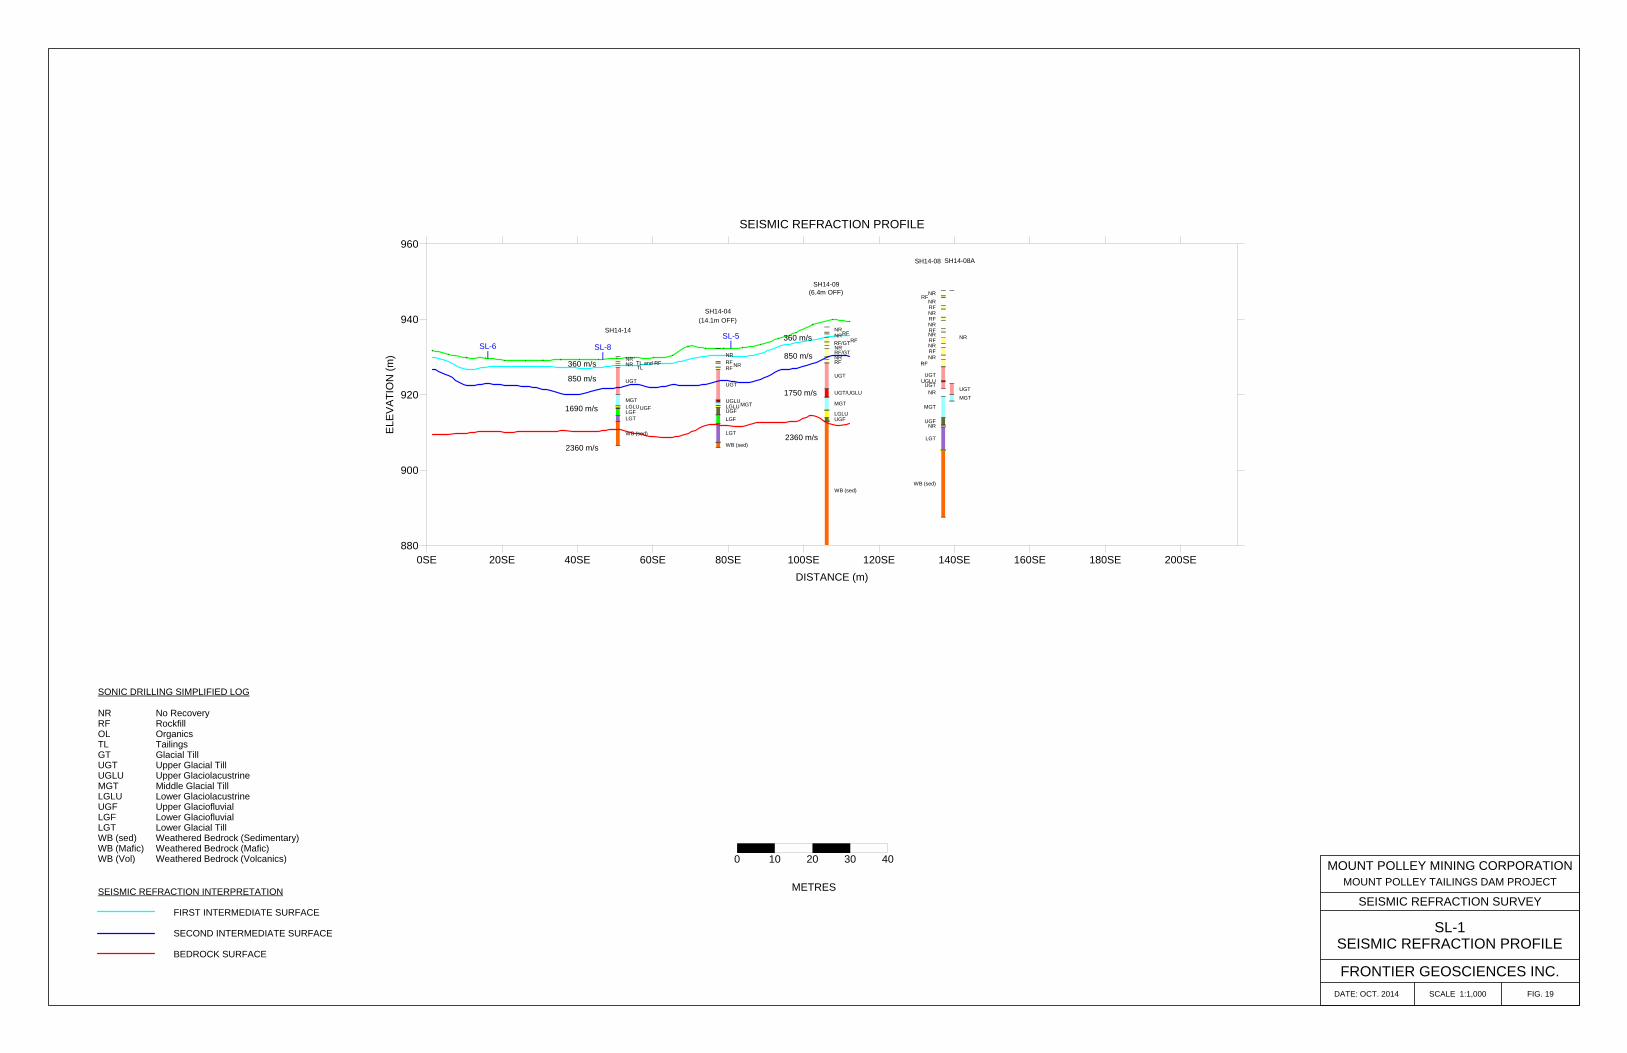
FIG. 19SCALE 1:1,000DATE: OCT. 2014
FRONTIER GEOSCIENCES INC.
SL-1SEISMIC REFRACTION PROFILE
SEISMIC REFRACTION SURVEY
MOUNT POLLEY TAILINGS DAM PROJECTMOUNT POLLEY MINING CORPORATION
METRES
0 10 20 30 40
FIRST INTERMEDIATE SURFACE
SECOND INTERMEDIATE SURFACE
BEDROCK SURFACE
SEISMIC REFRACTION INTERPRETATION
NRRFOLTLGTUGTUGLUMGTLGLUUGFLGFLGTWB (sed)WB (Mafic)WB (Vol)
No RecoveryRockfillOrganicsTailingsGlacial TillUpper Glacial TillUpper GlaciolacustrineMiddle Glacial TillLower GlaciolacustrineUpper GlaciofluvialLower GlaciofluvialLower Glacial TillWeathered Bedrock (Sedimentary)Weathered Bedrock (Mafic)Weathered Bedrock (Volcanics)
SONIC DRILLING SIMPLIFIED LOG

SL-5SL-8SL-6
RFNRRF
GT
LGFGT
WB (vol)
NRTLNRTL Till core TL and RF
UGT
NRUGF
LGF
LGTNR
LGT
WB (sed)
WB (Vol)
NR RFTL
UGT
MGTLGLU
NRLGLULGFLGT
WB (sed)
WB (Vol)
NRTL and RFTL
UGT
UGLUMGTLGLU
UGF
WB (sed)
RF
UGT
UGLU UGTUGLU
MGT
LGLUUGF
WB (sed)
WB (Mafic)
NRRF
NRRF
NRRF
RF/UGT
UGT
UGLUUGTMGT
LGLULGFNR LGFLGT
WB (sed)
RFNRRFUGT
NR
MGTUGFLGFLGT
WB (Mafic)
NR
UGT
MGT
LGTWB (Mafic)
NRRF
UGT
LGLUUGFNRUGF
LGF
LGT
SH14-19(22.2 OFF)
SH14-18(4.1 OFF)
SH14-16(5.7 OFF)
SH14-15SH14-03
SH14-06(5.7 OFF)
SH14-01 SH14-12SH14-13(8.6 OFF)
340 m/s675 m/s
1860 m/s
3200 m/s
340 m/s
675 m/s
1860 m/s
2170 m/s
330 m/s
615 m/s1570 m/s
3100 m/s
330 m/s615 m/s
1570 m/s
2450 m/s
330 m/s
1665 m/s
2330 m/s
330 m/s
1665 m/s
2120 m/s
370 m/s715 m/s
1665 m/s
2200 m/s
370 m/s715 m/s
1665 m/s
2200 m/s
380 m/s800 m/s
1675 m/s
2375 m/s
380 m/s
800 m/s
1675 m/s
2375 m/s
350 m/s
840 m/s
2010 m/s
3200 m/s
350 m/s
2010 m/s
3200 m/s
330 m/s735 m/s
2000 m/s
2950 m/s
330 m/s735 m/s
2000 m/s
2400 m/s
330 m/s850 m/s
1820 m/s
2300 m/s
0SE 20SE 40SE 60SE 80SE 100SE 120SE 140SE 160SE 180SE 200SE 220SE 240SE 260SE 280SE 300SE 320SE 340SE 360SE 380SE 400SE 420SE 440SE 460SE 480SE 500SE 520SE 540SE 560SE 580SE 600SE 620SE 640SE 660SE 680SE 700SE 720SE 740SE 760SE 780SE 800SE 820SEDISTANCE (m)
SEISMIC REFRACTION PROFILE
860
880
900
920
940
960
ELE
VA
TIO
N (m
)
FIG. 20SCALE 1:1,000DATE: OCT. 2014
FRONTIER GEOSCIENCES INC.
SL-2SEISMIC REFRACTION PROFILE
SEISMIC REFRACTION SURVEY
MOUNT POLLEY TAILINGS DAM PROJECTMOUNT POLLEY MINING CORPORATION
METRES
0 10 20 30 40
FIRST INTERMEDIATE SURFACE
SECOND INTERMEDIATE SURFACE
BEDROCK SURFACE
SEISMIC REFRACTION INTERPRETATION
NRRFOLTLGTUGTUGLUMGTLGLUUGFLGFLGTWB (sed)WB (Mafic)WB (Vol)
No RecoveryRockfillOrganicsTailingsGlacial TillUpper Glacial TillUpper GlaciolacustrineMiddle Glacial TillLower GlaciolacustrineUpper GlaciofluvialLower GlaciofluvialLower Glacial TillWeathered Bedrock (Sedimentary)Weathered Bedrock (Mafic)Weathered Bedrock (Volcanics)
SONIC DRILLING SIMPLIFIED LOG

SL-5SL-8SL-6
SH14-17(5 OFF)
SH14-22 SH14-22ASH14-10
NRRFTL
UGTUGLU
MGT
LGLUUGFNR
WB (Mafic)
NRRF TL
UGT
NR
NR
UGT
UGLUMGT
LGLU
UGF
WB (Mafic)
NRRFNR RFTL
UGT
UGLUMGTLGLU
LGT
WB (Vol)
385 m/s850 m/s
1820 m/s
2500 m/s
385 m/s850 m/s
1820 m/s
2500 m/s
330 m/s805 m/s
1750 m/s
2500 m/s
330 m/s
805 m/s
1750 m/s
2500 m/s
0SE 20SE 40SE 60SE 80SE 100SE 120SE 140SE 160SE 180SE 200SE 220SE 240SE 260SE 280SE 300SE 320SEDISTANCE (m)
SEISMIC REFRACTION PROFILE
860
880
900
920
940
960E
LEV
ATI
ON
(m)
FIG. 21SCALE 1:1,000DATE: OCT. 2014
FRONTIER GEOSCIENCES INC.
SL-3SEISMIC REFRACTION PROFILE
SEISMIC REFRACTION SURVEY
MOUNT POLLEY TAILINGS DAM PROJECTMOUNT POLLEY MINING CORPORATION
METRES
0 10 20 30 40
FIRST INTERMEDIATE SURFACE
SECOND INTERMEDIATE SURFACE
BEDROCK SURFACE
SEISMIC REFRACTION INTERPRETATION
NRRFOLTLGTUGTUGLUMGTLGLUUGFLGFLGTWB (sed)WB (Mafic)WB (Vol)
No RecoveryRockfillOrganicsTailingsGlacial TillUpper Glacial TillUpper GlaciolacustrineMiddle Glacial TillLower GlaciolacustrineUpper GlaciofluvialLower GlaciofluvialLower Glacial TillWeathered Bedrock (Sedimentary)Weathered Bedrock (Mafic)Weathered Bedrock (Volcanics)
SONIC DRILLING SIMPLIFIED LOG

SL-1 SL-2 SL-3
NRRF NRRF
UGT
UGLU MGTLGLUUGFLGF
LGT
WB (sed)
RF
UGT
UGLU UGTUGLU
MGT
LGLUUGF
WB (sed)
WB (Mafic)
NRRF
NRRFTL
UGT
UGLUMGTLGLU
LGT
WB (Vol)
NRRF
RFOL
UGT
MGTUGFLGT
WB (Mafic)
NRRF TLRFOLUGT
NRUGT
MGTUGFLGT
WB (Mafic)
SH14-04 SH14-03 SH14-10
SH14-11B SH14-11
345 m/s
875 m/s
1800 m/s
2400 m/s
345 m/s
875 m/s
1800 m/s
2400 m/s
370 m/s830 m/s
1750 m/s
2800 m/s
370 m/s830 m/s1750 m/s
2800 m/s
0NE 20NE 40NE 60NE 80NE 100NE 120NE 140NE 160NE 180NE 200NE 220NE 240NE 260NE 280NE 300NE 320NEDISTANCE (m)
SEISMIC REFRACTION PROFILE
860
880
900
920
940
960E
LEV
ATI
ON
(m)
FIG. 22SCALE 1:1,000DATE: OCT. 2014
FRONTIER GEOSCIENCES INC.
SL-5SEISMIC REFRACTION PROFILE
SEISMIC REFRACTION SURVEY
MOUNT POLLEY TAILINGS DAM PROJECTMOUNT POLLEY MINING CORPORATION
METRES
0 10 20 30 40
FIRST INTERMEDIATE SURFACE
SECOND INTERMEDIATE SURFACE
BEDROCK SURFACE
SEISMIC REFRACTION INTERPRETATION
NRRFOLTLGTUGTUGLUMGTLGLUUGFLGFLGTWB (sed)WB (Mafic)WB (Vol)
No RecoveryRockfillOrganicsTailingsGlacial TillUpper Glacial TillUpper GlaciolacustrineMiddle Glacial TillLower GlaciolacustrineUpper GlaciofluvialLower GlaciofluvialLower Glacial TillWeathered Bedrock (Sedimentary)Weathered Bedrock (Mafic)Weathered Bedrock (Volcanics)
SONIC DRILLING SIMPLIFIED LOG

SL-1 SL-2 SL-3NR RFTL
UGT
MGTLGLUNRLGLU
LGFLGT
WB (sed)
WB (Vol)
NRRFTLUGTUGLU
MGT
LGLUUGFNR
WB (Mafic)
SH14-16 SH14-17
430 m/s1030 m/s
1650 m/s
2500 m/s
1030 m/s
1670 m/s
2500 m/s
430 m/s760 m/s
1785 m/s
2450 m/s
430 m/s760 m/s
1785 m/s
2450 m/s
0NE 20NE 40NE 60NE 80NE 100NE 120NE 140NE 160NE 180NE 200NE 220NE 240NE 260NE 280NE 300NE 320NEDISTANCE (m)
SEISMIC REFRACTION PROFILE
860
880
900
920
940
960E
LEV
ATI
ON
(m)
FIG. 23SCALE 1:1,000DATE: OCT. 2014
FRONTIER GEOSCIENCES INC.
SL-6SEISMIC REFRACTION PROFILE
SEISMIC REFRACTION SURVEY
MOUNT POLLEY TAILINGS DAM PROJECTMOUNT POLLEY MINING CORPORATION
METRES
0 10 20 30 40
FIRST INTERMEDIATE SURFACE
SECOND INTERMEDIATE SURFACE
BEDROCK SURFACE
SEISMIC REFRACTION INTERPRETATION
NRRFOLTLGTUGTUGLUMGTLGLUUGFLGFLGTWB (sed)WB (Mafic)WB (Vol)
No RecoveryRockfillOrganicsTailingsGlacial TillUpper Glacial TillUpper GlaciolacustrineMiddle Glacial TillLower GlaciolacustrineUpper GlaciofluvialLower GlaciofluvialLower Glacial TillWeathered Bedrock (Sedimentary)Weathered Bedrock (Mafic)Weathered Bedrock (Volcanics)
SONIC DRILLING SIMPLIFIED LOG

SL-1 SL-2 SL-3NRRFTL
UGT
MGT LGLULGFLGT
WB (Vol.)
NR TL and RFNRTL
UGT
MGTLGLUUGFLGFLGT
WB (sed)
NRTL and RFTL
UGT
UGLUMGT
LGLU
UGF
WB (sed)
NR
UGT
UGLUMGT
LGLU
UGF
WB (Mafic)
SH14-07(8.3 OFF) SH14-14
(5.9 OFF)SH14-15 SH14-22A
480 m/s
1005 m/s
1660 m/s
2430 m/s
480 m/s1005 m/s
1660 m/s
2430 m/s
560 m/s900 m/s
1720 m/s
2490 m/s
560 m/s900 m/s
1720 m/s
2490 m/s
0NE 20NE 40NE 60NE 80NE 100NE 120NE 140NE 160NE 180NE 200NE 220NE 240NE 260NE 280NE 300NE 320NEDISTANCE (m)
SEISMIC REFRACTION PROFILE
860
880
900
920
940
960E
LEV
ATI
ON
(m)
FIG. 24SCALE 1:1,000DATE: OCT. 2014
FRONTIER GEOSCIENCES INC.
SL-8SEISMIC REFRACTION PROFILE
SEISMIC REFRACTION SURVEY
MOUNT POLLEY TAILINGS DAM PROJECTMOUNT POLLEY MINING CORPORATION
METRES
0 10 20 30 40
FIRST INTERMEDIATE SURFACE
SECOND INTERMEDIATE SURFACE
BEDROCK SURFACE
SEISMIC REFRACTION INTERPRETATION
NRRFOLTLGTUGTUGLUMGTLGLUUGFLGFLGTWB (sed)WB (Mafic)WB (Vol)
No RecoveryRockfillOrganicsTailingsGlacial TillUpper Glacial TillUpper GlaciolacustrineMiddle Glacial TillLower GlaciolacustrineUpper GlaciofluvialLower GlaciofluvialLower Glacial TillWeathered Bedrock (Sedimentary)Weathered Bedrock (Mafic)Weathered Bedrock (Volcanics)
SONIC DRILLING SIMPLIFIED LOG
Related Documents