Mount Polley Mining Corporation an Imperial Metals company Page 1 of 1 November 10, 2016 Via Email: Brian Yamelst Sr. Environmental Protection Officer BC Ministry of Environment – Regional Operations Branch RE: Third Quarter 2016 Report for Permit 11678 Mount Polley Mining Corporation (MPMC) is pleased to present this third quarter monitoring report for 2016 as required under Permit 11678. Surface water and groundwater monitoring was conducted throughout this time period as specified in the Comprehensive Environmental Monitoring Plan (CEMP) Rev1 submitted to the Ministry of Environment on June 23, 2016. Sampling events from the third quarter are outlined in Table 1. With regard to the CEMP, the following items should be noted: • Hydrological monitoring was conducted at seven stations: H1, H2, H3, W1b, W4a, W5, and W12. No monitoring was conducted at H4 due to construction activities in Hazeltine Creek. • Climate data including temperature, wind direction, rainfall, wind speed, and snowpack were collected. Solar radiation and relative humidity data were also collected to allow for calculation of evaporation rates. These data will be reported in the 2016 Annual Report. • There were 124 surface water quality sampling events. • There were 38 groundwater quality sampling events. • Quality assurance monitoring included six duplicate samples, three field blanks, and three trip blanks. • Weekly updates on Springer Pit groundwater have been submitted to MEM and MoE starting on December 9, 2015. • Monitoring was conducted three times at QUL-57, -58, and -59 in the third quarter of 2016. During each sampling and/or profiling event, 1-2 hours were spent (dependent on weather conditions and time constraints) trying to locate the discharge plume based on the plume dispersion model. If no plume was detected, sampling occurred at the default locations for these sites. The plume dispersion model indicated the discharge would be in a thin layer underneath the thermocline in the initial dilution zone during the months when the lake is stratified. All sampling events occurred at the default sampling locations; the plume was detected only twice underneath the thermocline, and where predicted and sampled twice at the QUL-58 default location.

Welcome message from author
This document is posted to help you gain knowledge. Please leave a comment to let me know what you think about it! Share it to your friends and learn new things together.
Transcript
Mount Polley Mining Corporation an Imperial Metals company
Page 1 of 1
November 10, 2016 Via Email: Brian Yamelst Sr. Environmental Protection Officer BC Ministry of Environment – Regional Operations Branch
RE: Third Quarter 2016 Report for Permit 11678
Mount Polley Mining Corporation (MPMC) is pleased to present this third quarter monitoring report for 2016 as required under Permit 11678. Surface water and groundwater monitoring was conducted throughout this time period as specified in the Comprehensive Environmental Monitoring Plan (CEMP) Rev1 submitted to the Ministry of Environment on June 23, 2016. Sampling events from the third quarter are outlined in Table 1.
With regard to the CEMP, the following items should be noted: • Hydrological monitoring was conducted at seven stations: H1, H2, H3, W1b, W4a, W5, and W12. No
monitoring was conducted at H4 due to construction activities in Hazeltine Creek. • Climate data including temperature, wind direction, rainfall, wind speed, and snowpack were
collected. Solar radiation and relative humidity data were also collected to allow for calculation of evaporation rates. These data will be reported in the 2016 Annual Report.
• There were 124 surface water quality sampling events. • There were 38 groundwater quality sampling events. • Quality assurance monitoring included six duplicate samples, three field blanks, and three trip
blanks. • Weekly updates on Springer Pit groundwater have been submitted to MEM and MoE starting on
December 9, 2015. • Monitoring was conducted three times at QUL-57, -58, and -59 in the third quarter of 2016. During
each sampling and/or profiling event, 1-2 hours were spent (dependent on weather conditions and time constraints) trying to locate the discharge plume based on the plume dispersion model. If no plume was detected, sampling occurred at the default locations for these sites. The plume dispersion model indicated the discharge would be in a thin layer underneath the thermocline in the initial dilution zone during the months when the lake is stratified. All sampling events occurred at the default sampling locations; the plume was detected only twice underneath the thermocline, and where predicted and sampled twice at the QUL-58 default location.

Mount Polley Mining Corporation Permit 11678 3rd Quarter Report
BOX 12 • LIKELY, BC • V0L 1NO • PHONE: 250-790-2215 • FAX: 250- 790- 2268 Page 2 of 1
• Cariboo Pit has been removed from the water balance reporting as it is no longer storing water and the water level of the pit is continually being maintained as low as practicable.
• There were no exceedances of permitted levels or toxicity failures in the third quarter.
Table 1: Sampling events in the third quarter 2016
Site Name BC EMS Code
Full Sample Suite Frequency
Required Samples
Completed Samples
Required Profiles
Completed Profiles
E1 E225309 Monthly(a) 0(b) 0 - - E11 E302090 Monthly 3 3 - - E11a E305894 Weekly 13 14 - - E19 E305050 Weekly 13 13 - - HAD-3 E304230 Weekly(c) 13 16 - - HAC-10 E303010 Monthly 3 3 - - HAC-13 E304810 Weekly 13 13 - - HAC-05a E304510 Monthly 3 3 - - HAC-08 E303013 Monthly 3 3 - - HAC-12 E304351 Weekly 13 13 - - QUL-57 E304874 Weekly/Monthly(d,e) - - 3 3 QUL-58 E304876 Weekly/Monthly(d) 3 3 3 3 QUL-59 E304875 Weekly/Monthly(d,e) - - 3 3 QUL-18 E303019 Monthly/Twice(f) 3 3 3 3 QUL-2a E303020 Monthly/Twice(f) 3 3 3 3 QUL-120a E303022 Seasonally(g) 1 2 1 2 QUL-ZOO-1 E306455 Bi-annually 1 1 1 1 QUL-ZOO-7 E306456 Bi-annually 1 1 1 1 QUL-ZOO-8 E306457 Bi-annually 1 1 1 1 QUR-11 E306454 Monthly 3 3 - - W1 E225084 Monthly 3 3 - - W4a E298551 Monthly 3 3 - - W5 E208039 Monthly 3 3 - - W8 E216743 Quarterly 1 1 - - W8Z E223292 Quarterly 1 1 - - W10 E291209 Monthly 3 3 - - W12 E216744 Quarterly 1 1 - - W20 E297070 Quarterly 1 0(h) - - EDC-01 E303014 Monthly 3 3 - - P1 E207974 Monthly/bi-monthly(i) 3 3 6 6 P2 E207975 Monthly/bi-monthly(i) 3 3 6 6 B1 E207972 Bi-annually/bi-monthly(j) 1 1 6 6 B2 E215897 Bi-annually/bi-monthly(j) 1 1 6 6 GW96-1b E229680 Bi-annually 1 1 - - GW96-2a E229681 Bi-annually 1 1 - - GW96-2b E229682 Bi-annually 1 1 - -
Mount Polley Mining Corporation Permit 11678 3rd Quarter Report
BOX 12 • LIKELY, BC • V0L 1NO • PHONE: 250-790-2215 • FAX: 250- 790- 2268 Page 3 of 1
Site Name BC EMS Code
Full Sample Suite Frequency
Required Samples
Completed Samples
Required Profiles
Completed Profiles
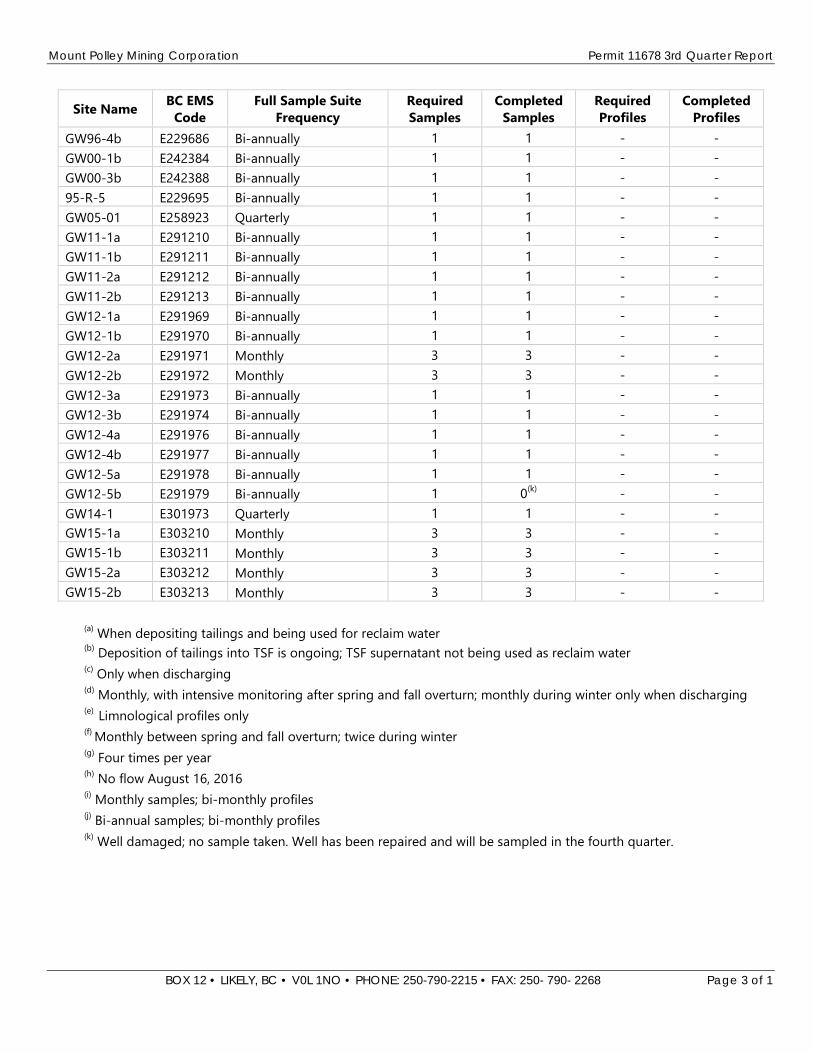
GW96-4b E229686 Bi-annually 1 1 - - GW00-1b E242384 Bi-annually 1 1 - - GW00-3b E242388 Bi-annually 1 1 - - 95-R-5 E229695 Bi-annually 1 1 - - GW05-01 E258923 Quarterly 1 1 - - GW11-1a E291210 Bi-annually 1 1 - - GW11-1b E291211 Bi-annually 1 1 - - GW11-2a E291212 Bi-annually 1 1 - - GW11-2b E291213 Bi-annually 1 1 - - GW12-1a E291969 Bi-annually 1 1 - - GW12-1b E291970 Bi-annually 1 1 - - GW12-2a E291971 Monthly 3 3 - - GW12-2b E291972 Monthly 3 3 - - GW12-3a E291973 Bi-annually 1 1 - - GW12-3b E291974 Bi-annually 1 1 - - GW12-4a E291976 Bi-annually 1 1 - - GW12-4b E291977 Bi-annually 1 1 - - GW12-5a E291978 Bi-annually 1 1 - - GW12-5b E291979 Bi-annually 1 0(k) - - GW14-1 E301973 Quarterly 1 1 - - GW15-1a E303210 Monthly 3 3 - - GW15-1b E303211 Monthly 3 3 - - GW15-2a E303212 Monthly 3 3 - - GW15-2b E303213 Monthly 3 3 - -
(a) When depositing tailings and being used for reclaim water (b) Deposition of tailings into TSF is ongoing; TSF supernatant not being used as reclaim water (c) Only when discharging (d) Monthly, with intensive monitoring after spring and fall overturn; monthly during winter only when discharging (e) Limnological profiles only (f) Monthly between spring and fall overturn; twice during winter (g) Four times per year (h) No flow August 16, 2016 (i) Monthly samples; bi-monthly profiles (j) Bi-annual samples; bi-monthly profiles (k) Well damaged; no sample taken. Well has been repaired and will be sampled in the fourth quarter.

Mount Polley Mining Corporation Permit 11678 3rd Quarter Report
BOX 12 • LIKELY, BC • V0L 1NO • PHONE: 250-790-2215 • FAX: 250- 790- 2268 Page 4 of 1
This report includes the following appendices: • Appendix 1: Surface water quality results • Appendix 2: Groundwater quality results • Appendix 3: Field parameters • Appendix 4: Hydrology results • Appendix 5: QA/QC Results • Appendix 6: Site Water Balance Update Sincerely,
Colleen Hughes, EP Environmental Coordinator Mount Polley Mining Corporation 250-790-2617
Mount Polley Mining Corporation Permit 11678 – Third Quarter 2016 Report
Appendix 1

1-Jul-2016 30-Sep-2016
Monitoring data report for:
Bootjack Lake
This report covers the period from: to:
Mount Polley
Mining CorporationIMPERIAL METALS CORPORATION
Co
nd
ucti
vit
y (
µs/c
m)
Hard
nes
s (
mg
/L)
pH
(p
H)
TD
S (
mg
/L)
TS
S (
mg
/L)
NT
U (
ntu
)
Alk
alin
ity
(C
aC
O3)
(mg
/L)
Am
mo
nia
(a
s N
) (m
g/L
)
B1-B 23/08/16 100 45.8 7.32 77 2 4.51 47.3 0.025
B1-S 23/08/16 94.5 43.1 7.84 67 <1.0 0.65 43.9 <0.0050
B1-5 23/08/16 93.9 43.2 7.83 69 <1.0 1.26 42.9 <0.0050
B2-B 23/08/16 95.1 43.6 7.82 72 1.2 1.12 43.4 <0.0050
B2-S 23/08/16 94.6 43.5 7.82 70 <1.0 0.81 43.3 <0.0050
B2-5 23/08/16 94.9 43.8 7.8 68 1.3 0.87 43.7 <0.0050
Co
nd
ucti
vit
y (
µs/c
m)
Hard
ness (
mg
/L)
pH
(p
H)
TD
S (
mg
/L)
TS
S (
mg
/L)
NT
U (
ntu
)
Alk
alin
ity (
CaC
O3)
(mg
/L)
Am
mo
nia
(as N
) (m
g/L
)
EDC-01 06/07/16 157 82.7 8.04 136 2.1 1.02 76.6 0.0089
02/08/16 250 133 8.05 199 <1.0 0.56 100 0.0078
06/09/16 394 185 8.17 276 <1.0 0.41 163 <0.0050
Printed Date: 19/10/2016
1-Jul-2016 30-Sep-2016
Monitoring data report for:
Bootjack Lake
This report covers the period from: to:
Mount Polley
Mining CorporationIMPERIAL METALS CORPORATION
Mount Polley
Mining CorporationIMPERIAL METALS CORPORATION
Ch
lori
de (
mg
/L)
Flo
rid
e (
mg
/L)
Nit
rate
(N
) (m
g/L
)
Nit
rate
an
d N
itri
te
(mg
/L)
Nit
rite
(N
) (m
g/L
)
Dis
s-O
rth
op
ho
sp
hate
(mg
/L)
Dis
s-P
ho
sp
ho
rus
(mg
/L)
To
tal P
ho
sp
ho
rus
(mg
/L)
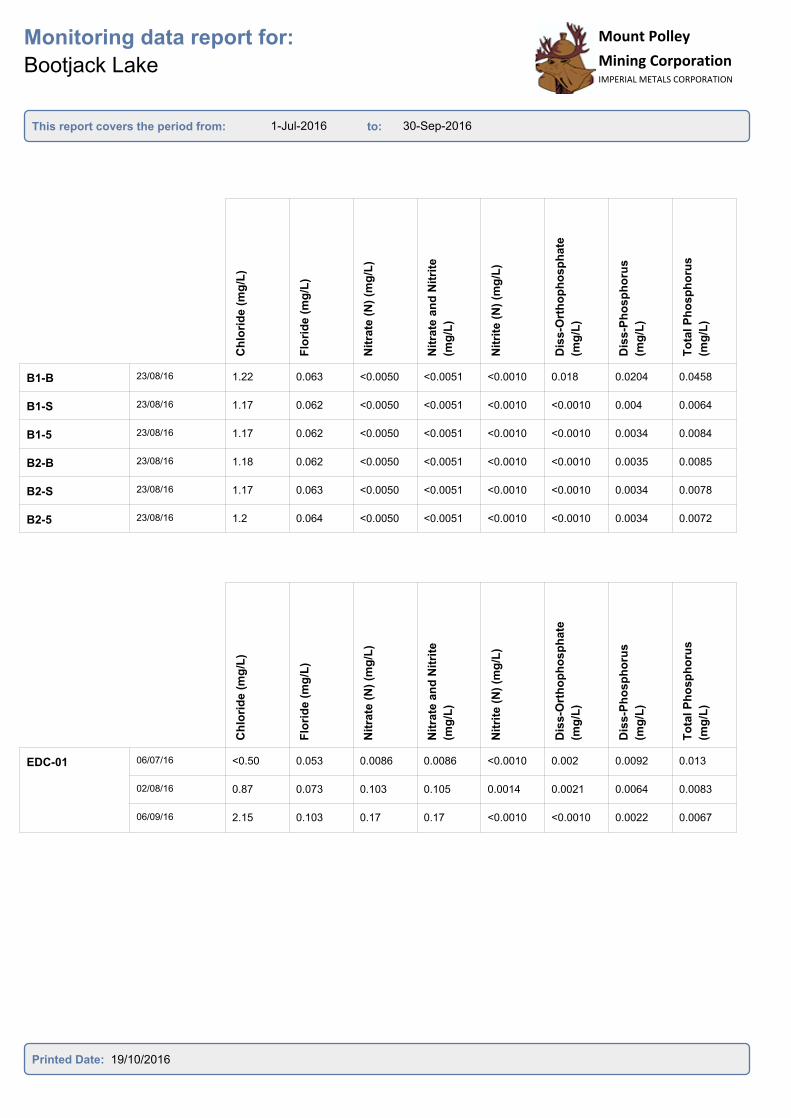
B1-B 23/08/16 1.22 0.063 <0.0050 <0.0051 <0.0010 0.018 0.0204 0.0458
B1-S 23/08/16 1.17 0.062 <0.0050 <0.0051 <0.0010 <0.0010 0.004 0.0064
B1-5 23/08/16 1.17 0.062 <0.0050 <0.0051 <0.0010 <0.0010 0.0034 0.0084
B2-B 23/08/16 1.18 0.062 <0.0050 <0.0051 <0.0010 <0.0010 0.0035 0.0085
B2-S 23/08/16 1.17 0.063 <0.0050 <0.0051 <0.0010 <0.0010 0.0034 0.0078
B2-5 23/08/16 1.2 0.064 <0.0050 <0.0051 <0.0010 <0.0010 0.0034 0.0072
Ch
lori
de (
mg
/L)
Flo
rid
e (
mg
/L)
Nit
rate
(N
) (m
g/L
)
Nit
rate
an
d N
itri
te
(mg
/L)
Nit
rite
(N
) (m
g/L
)
Dis
s-O
rth
op
ho
sp
hate
(mg
/L)
Dis
s-P
ho
sp
ho
rus
(mg
/L)
To
tal P
ho
sp
ho
rus
(mg
/L)
EDC-01 06/07/16 <0.50 0.053 0.0086 0.0086 <0.0010 0.002 0.0092 0.013
02/08/16 0.87 0.073 0.103 0.105 0.0014 0.0021 0.0064 0.0083
06/09/16 2.15 0.103 0.17 0.17 <0.0010 <0.0010 0.0022 0.0067
Printed Date: 19/10/2016
1-Jul-2016 30-Sep-2016
Monitoring data report for:
Bootjack Lake
This report covers the period from: to:
Mount Polley
Mining CorporationIMPERIAL METALS CORPORATION
Mount Polley
Mining CorporationIMPERIAL METALS CORPORATION
Su
lph
ate
(m
g/L
)
To
tal N
itro
ge
n (
mg
/L)
Dis
so
lved
Org
an
ic C
a
(mg
/L)
To
tal A
lum
inu
m (
mg
/L)
An
tim
on
y (
Sb
)-T
ota
l
(mg
/L)
Ars
en
ic (
As)-
To
tal
(mg
/L)
Bari
um
(B
a)-
To
tal
(mg
/L)
Bery
lliu
m (
Be)-
To
tal
(mg
/L)
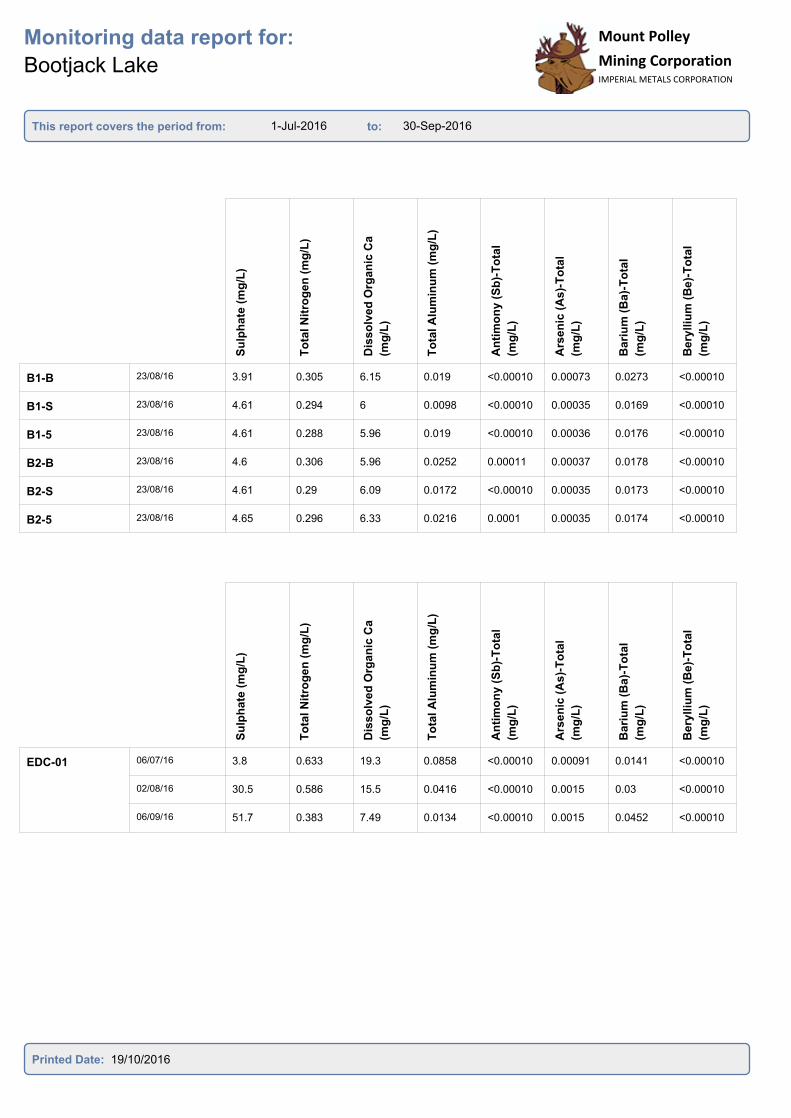
B1-B 23/08/16 3.91 0.305 6.15 0.019 <0.00010 0.00073 0.0273 <0.00010
B1-S 23/08/16 4.61 0.294 6 0.0098 <0.00010 0.00035 0.0169 <0.00010
B1-5 23/08/16 4.61 0.288 5.96 0.019 <0.00010 0.00036 0.0176 <0.00010
B2-B 23/08/16 4.6 0.306 5.96 0.0252 0.00011 0.00037 0.0178 <0.00010
B2-S 23/08/16 4.61 0.29 6.09 0.0172 <0.00010 0.00035 0.0173 <0.00010
B2-5 23/08/16 4.65 0.296 6.33 0.0216 0.0001 0.00035 0.0174 <0.00010
Su
lph
ate
(m
g/L
)
To
tal N
itro
gen
(m
g/L
)
Dis
so
lved
Org
an
ic C
a
(mg
/L)
To
tal A
lum
inu
m (
mg
/L)
An
tim
on
y (
Sb
)-T
ota
l
(mg
/L)
Ars
en
ic (
As)-
To
tal
(mg
/L)
Bari
um
(B
a)-
To
tal
(mg
/L)
Bery
lliu
m (
Be)-
To
tal
(mg
/L)
EDC-01 06/07/16 3.8 0.633 19.3 0.0858 <0.00010 0.00091 0.0141 <0.00010
02/08/16 30.5 0.586 15.5 0.0416 <0.00010 0.0015 0.03 <0.00010
06/09/16 51.7 0.383 7.49 0.0134 <0.00010 0.0015 0.0452 <0.00010
Printed Date: 19/10/2016
1-Jul-2016 30-Sep-2016
Monitoring data report for:
Bootjack Lake
This report covers the period from: to:
Mount Polley
Mining CorporationIMPERIAL METALS CORPORATION
Mount Polley
Mining CorporationIMPERIAL METALS CORPORATION
Bis
mu
th (
Bi)
-To
tal
(mg
/L)
Bo
ron
(B
)-T
ota
l (m
g/L
)
To
tal C
ad
miu
m (
mg
/L)
Calc
ium
(C
a)-
To
tal
(mg
/L)
Ch
rom
ium
(C
r)-T
ota
l
(mg
/L)
Co
balt
(C
o)-
To
tal
(mg
/L)
To
tal C
op
per
(mg
/L)
To
tal Ir
on
(m
g/L
)
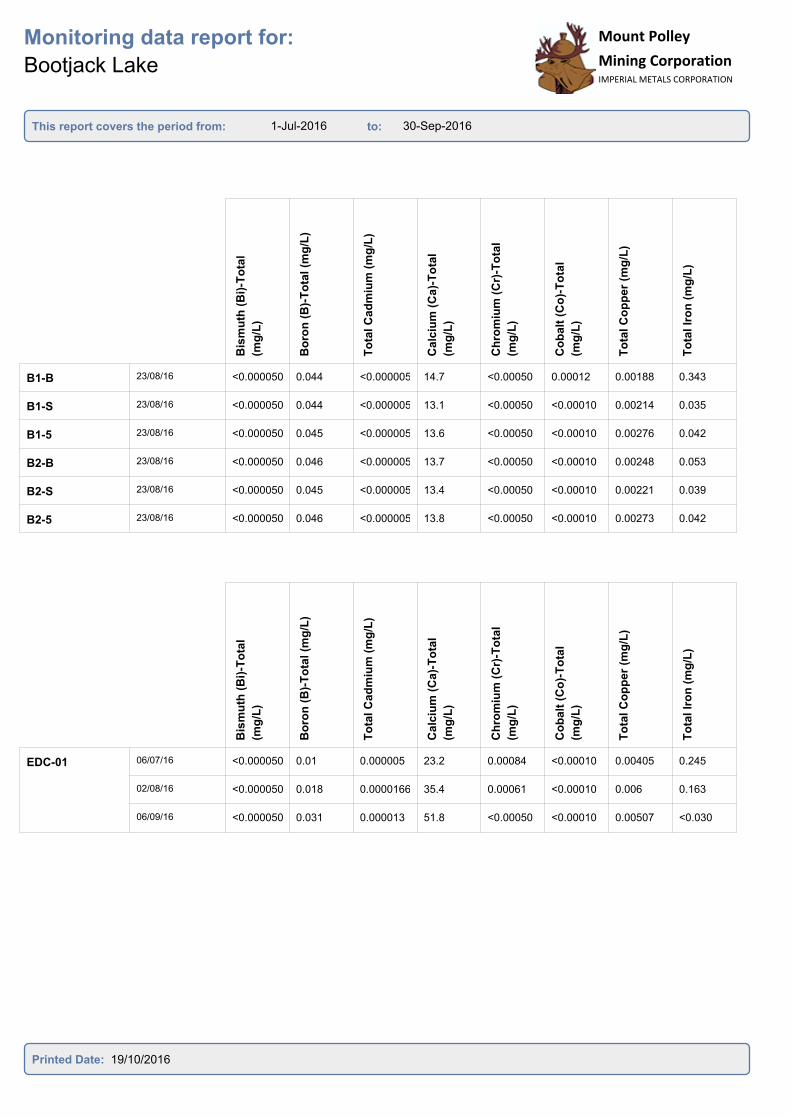
B1-B 23/08/16 <0.000050 0.044 <0.000005 14.7 <0.00050 0.00012 0.00188 0.343
B1-S 23/08/16 <0.000050 0.044 <0.000005 13.1 <0.00050 <0.00010 0.00214 0.035
B1-5 23/08/16 <0.000050 0.045 <0.000005 13.6 <0.00050 <0.00010 0.00276 0.042
B2-B 23/08/16 <0.000050 0.046 <0.000005 13.7 <0.00050 <0.00010 0.00248 0.053
B2-S 23/08/16 <0.000050 0.045 <0.000005 13.4 <0.00050 <0.00010 0.00221 0.039
B2-5 23/08/16 <0.000050 0.046 <0.000005 13.8 <0.00050 <0.00010 0.00273 0.042
Bis
mu
th (
Bi)
-To
tal
(mg
/L)
Bo
ron
(B
)-T
ota
l (m
g/L
)
To
tal C
ad
miu
m (
mg
/L)
Calc
ium
(C
a)-
To
tal
(mg
/L)
Ch
rom
ium
(C
r)-T
ota
l
(mg
/L)
Co
balt
(C
o)-
To
tal
(mg
/L)
To
tal C
op
per
(mg
/L)
To
tal Ir
on
(m
g/L
)
EDC-01 06/07/16 <0.000050 0.01 0.000005 23.2 0.00084 <0.00010 0.00405 0.245
02/08/16 <0.000050 0.018 0.0000166 35.4 0.00061 <0.00010 0.006 0.163
06/09/16 <0.000050 0.031 0.000013 51.8 <0.00050 <0.00010 0.00507 <0.030
Printed Date: 19/10/2016
1-Jul-2016 30-Sep-2016
Monitoring data report for:
Bootjack Lake
This report covers the period from: to:
Mount Polley
Mining CorporationIMPERIAL METALS CORPORATION
Mount Polley
Mining CorporationIMPERIAL METALS CORPORATION
To
tal L
ea
d (
mg
/L)
Lit
hiu
m (
Li)
-To
tal
(mg
/L)
Mag
nes
ium
(M
g)-
To
tal
(mg
/L)
To
tal M
an
ga
nese
(mg
/L)
To
tal M
oly
bd
en
um
(mg
/L)
Nic
ke
l (N
i)-T
ota
l (m
g/L
)
Po
tas
siu
m (
K)-
To
tal
(mg
/L)
To
tal S
ele
niu
m (
mg
/L)
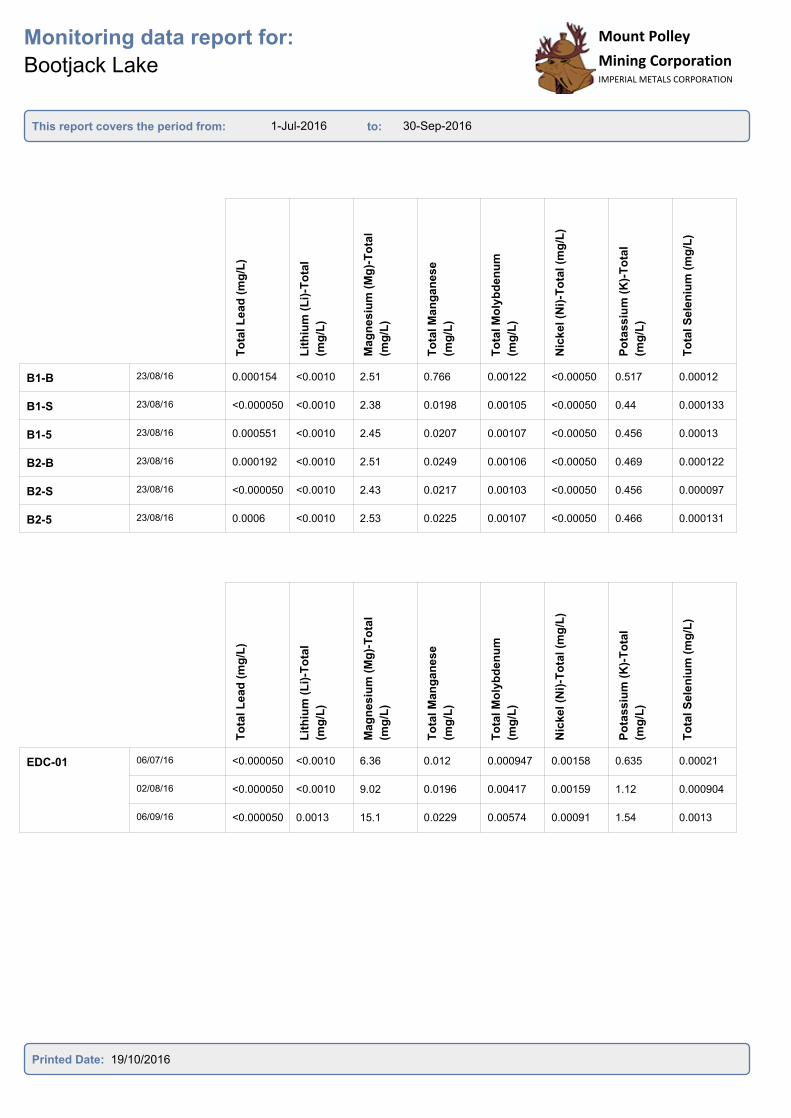
B1-B 23/08/16 0.000154 <0.0010 2.51 0.766 0.00122 <0.00050 0.517 0.00012
B1-S 23/08/16 <0.000050 <0.0010 2.38 0.0198 0.00105 <0.00050 0.44 0.000133
B1-5 23/08/16 0.000551 <0.0010 2.45 0.0207 0.00107 <0.00050 0.456 0.00013
B2-B 23/08/16 0.000192 <0.0010 2.51 0.0249 0.00106 <0.00050 0.469 0.000122
B2-S 23/08/16 <0.000050 <0.0010 2.43 0.0217 0.00103 <0.00050 0.456 0.000097
B2-5 23/08/16 0.0006 <0.0010 2.53 0.0225 0.00107 <0.00050 0.466 0.000131
To
tal L
ead
(m
g/L
)
Lit
hiu
m (
Li)
-To
tal
(mg
/L)
Mag
nesiu
m (
Mg
)-T
ota
l
(mg
/L)
To
tal M
an
gan
ese
(mg
/L)
To
tal M
oly
bd
en
um
(mg
/L)
Nic
kel (N
i)-T
ota
l (m
g/L
)
Po
tassiu
m (
K)-
To
tal
(mg
/L)
To
tal S
ele
niu
m (
mg
/L)
EDC-01 06/07/16 <0.000050 <0.0010 6.36 0.012 0.000947 0.00158 0.635 0.00021
02/08/16 <0.000050 <0.0010 9.02 0.0196 0.00417 0.00159 1.12 0.000904
06/09/16 <0.000050 0.0013 15.1 0.0229 0.00574 0.00091 1.54 0.0013
Printed Date: 19/10/2016
1-Jul-2016 30-Sep-2016
Monitoring data report for:
Bootjack Lake
This report covers the period from: to:
Mount Polley
Mining CorporationIMPERIAL METALS CORPORATION
Mount Polley
Mining CorporationIMPERIAL METALS CORPORATION
Silic
on
(S
i)-T
ota
l (m
g/L
)
Silve
r (A
g)-
To
tal (m
g/L
)
So
diu
m (
Na)-
To
tal
(mg
/L)
Str
on
tiu
m (
Sr)
-To
tal
(mg
/L)
Th
alliu
m (
Tl)
-To
tal
(mg
/L)
Tin
(S
n)-
To
tal (m
g/L
)
Tit
an
ium
(T
i)-T
ota
l
(mg
/L)
Ura
niu
m (
U)-
To
tal
(mg
/L)
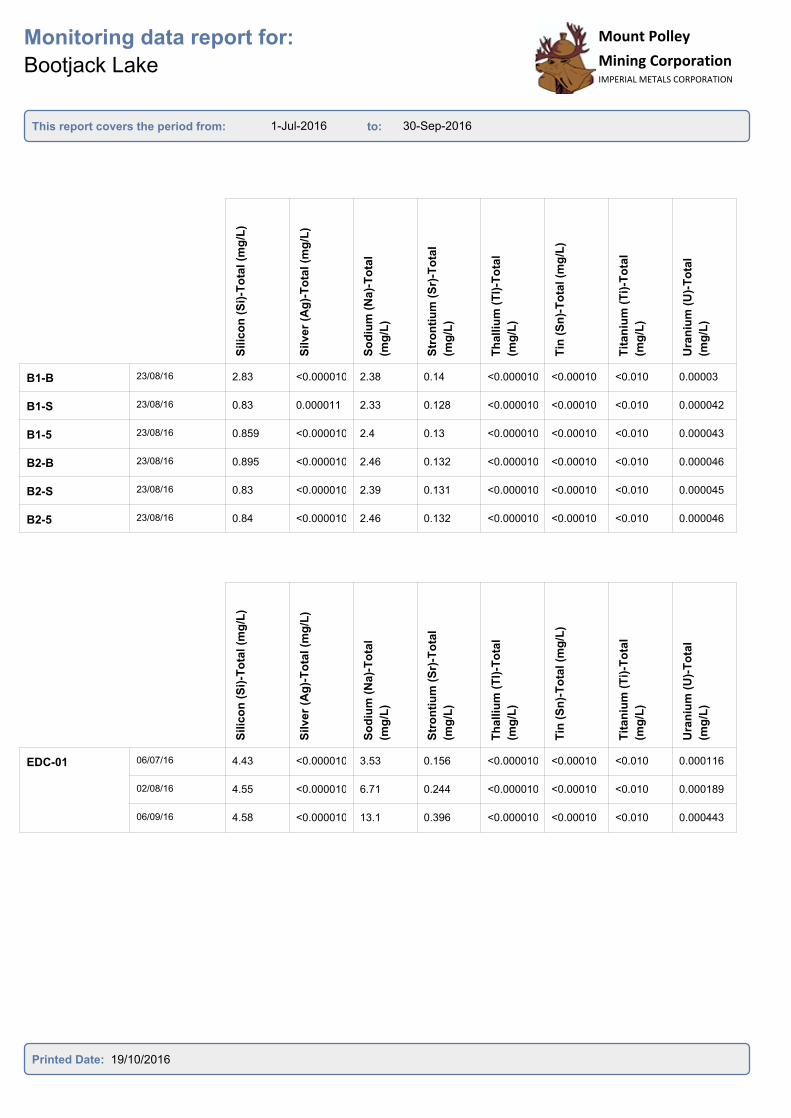
B1-B 23/08/16 2.83 <0.000010 2.38 0.14 <0.000010 <0.00010 <0.010 0.00003
B1-S 23/08/16 0.83 0.000011 2.33 0.128 <0.000010 <0.00010 <0.010 0.000042
B1-5 23/08/16 0.859 <0.000010 2.4 0.13 <0.000010 <0.00010 <0.010 0.000043
B2-B 23/08/16 0.895 <0.000010 2.46 0.132 <0.000010 <0.00010 <0.010 0.000046
B2-S 23/08/16 0.83 <0.000010 2.39 0.131 <0.000010 <0.00010 <0.010 0.000045
B2-5 23/08/16 0.84 <0.000010 2.46 0.132 <0.000010 <0.00010 <0.010 0.000046
Silic
on
(S
i)-T
ota
l (m
g/L
)
Silver
(Ag
)-T
ota
l (m
g/L
)
So
diu
m (
Na)-
To
tal
(mg
/L)
Str
on
tiu
m (
Sr)
-To
tal
(mg
/L)
Th
alliu
m (
Tl)
-To
tal
(mg
/L)
Tin
(S
n)-
To
tal (m
g/L
)
Tit
an
ium
(T
i)-T
ota
l
(mg
/L)
Ura
niu
m (
U)-
To
tal
(mg
/L)
EDC-01 06/07/16 4.43 <0.000010 3.53 0.156 <0.000010 <0.00010 <0.010 0.000116
02/08/16 4.55 <0.000010 6.71 0.244 <0.000010 <0.00010 <0.010 0.000189
06/09/16 4.58 <0.000010 13.1 0.396 <0.000010 <0.00010 <0.010 0.000443
Printed Date: 19/10/2016
1-Jul-2016 30-Sep-2016
Monitoring data report for:
Bootjack Lake
This report covers the period from: to:
Mount Polley
Mining CorporationIMPERIAL METALS CORPORATION
Mount Polley
Mining CorporationIMPERIAL METALS CORPORATION
Van
ad
ium
(V
)-T
ota
l
(mg
/L)
Zin
c (
Zn
)-T
ota
l (m
g/L
)
Dis
s-A
lum
inu
m (
Al)
(mg
/L)
Dis
s-A
nti
mo
ny
(S
b)
(mg
/L)
Dis
s-A
rsen
ic (
As
)
(mg
/L)
Dis
s-B
ari
um
(B
a)
(mg
/L)
Dis
s-B
ery
lliu
m (
Be)
(mg
/L)
Dis
s-B
ism
uth
(B
i)
(mg
/L)
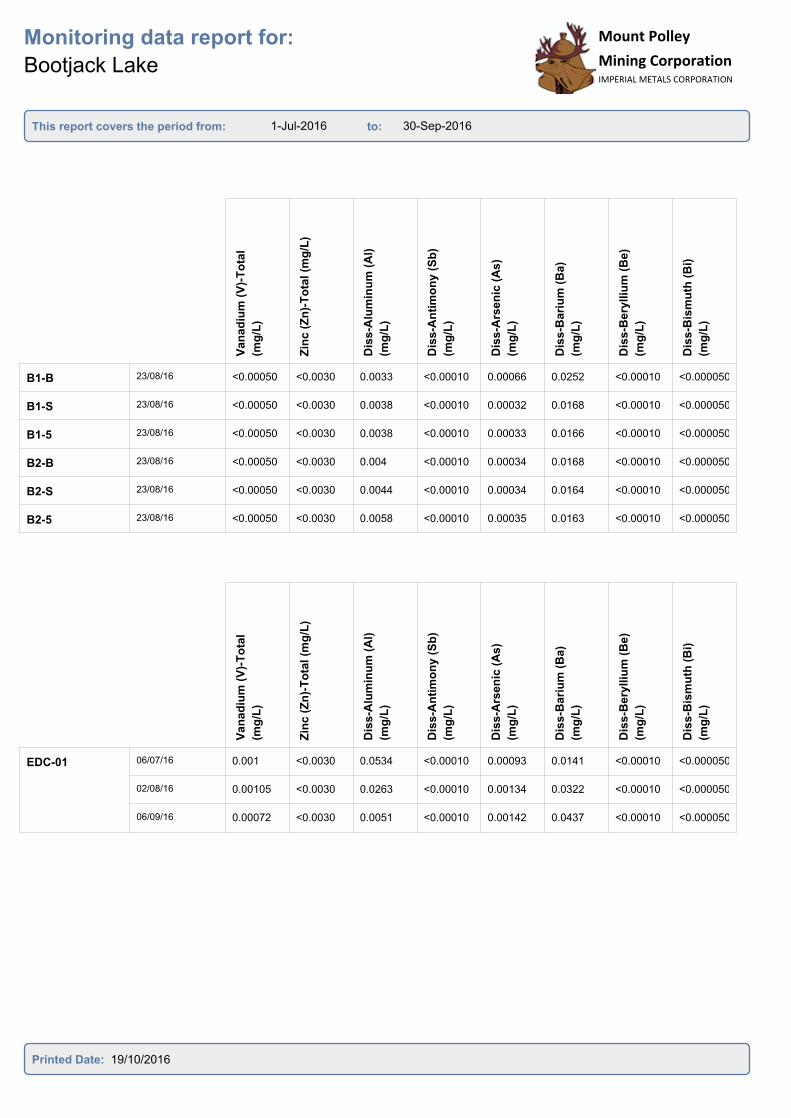
B1-B 23/08/16 <0.00050 <0.0030 0.0033 <0.00010 0.00066 0.0252 <0.00010 <0.000050
B1-S 23/08/16 <0.00050 <0.0030 0.0038 <0.00010 0.00032 0.0168 <0.00010 <0.000050
B1-5 23/08/16 <0.00050 <0.0030 0.0038 <0.00010 0.00033 0.0166 <0.00010 <0.000050
B2-B 23/08/16 <0.00050 <0.0030 0.004 <0.00010 0.00034 0.0168 <0.00010 <0.000050
B2-S 23/08/16 <0.00050 <0.0030 0.0044 <0.00010 0.00034 0.0164 <0.00010 <0.000050
B2-5 23/08/16 <0.00050 <0.0030 0.0058 <0.00010 0.00035 0.0163 <0.00010 <0.000050
Van
ad
ium
(V
)-T
ota
l
(mg
/L)
Zin
c (
Zn
)-T
ota
l (m
g/L
)
Dis
s-A
lum
inu
m (
Al)
(mg
/L)
Dis
s-A
nti
mo
ny (
Sb
)
(mg
/L)
Dis
s-A
rsen
ic (
As)
(mg
/L)
Dis
s-B
ari
um
(B
a)
(mg
/L)
Dis
s-B
ery
lliu
m (
Be)
(mg
/L)
Dis
s-B
ism
uth
(B
i)
(mg
/L)
EDC-01 06/07/16 0.001 <0.0030 0.0534 <0.00010 0.00093 0.0141 <0.00010 <0.000050
02/08/16 0.00105 <0.0030 0.0263 <0.00010 0.00134 0.0322 <0.00010 <0.000050
06/09/16 0.00072 <0.0030 0.0051 <0.00010 0.00142 0.0437 <0.00010 <0.000050
Printed Date: 19/10/2016
1-Jul-2016 30-Sep-2016
Monitoring data report for:
Bootjack Lake
This report covers the period from: to:
Mount Polley
Mining CorporationIMPERIAL METALS CORPORATION
Mount Polley
Mining CorporationIMPERIAL METALS CORPORATION
Dis
s-B
oro
n (
B)
(mg
/L)
Dis
s-C
ad
miu
m (
Cd
)
(mg
/L)
Dis
s-C
alc
ium
(C
a)
(mg
/L)
Dis
s-C
hro
miu
m (
Cr)
(mg
/L)
Dis
s-C
ob
alt
(C
o)
(mg
/L)
Dis
s-C
op
pe
r (C
u)
(mg
/L)
Dis
s-I
ron
(F
e)
(mg
/L)
Dis
s-L
ead
(P
b)
(mg
/L)
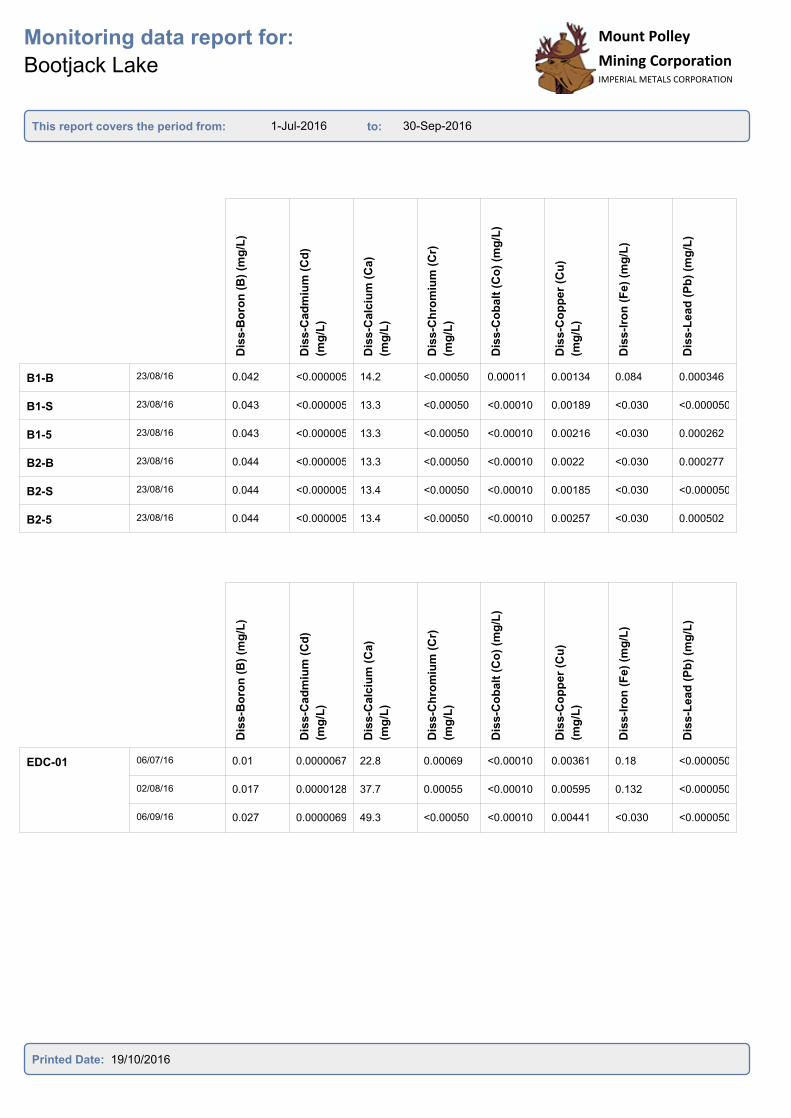
B1-B 23/08/16 0.042 <0.000005 14.2 <0.00050 0.00011 0.00134 0.084 0.000346
B1-S 23/08/16 0.043 <0.000005 13.3 <0.00050 <0.00010 0.00189 <0.030 <0.000050
B1-5 23/08/16 0.043 <0.000005 13.3 <0.00050 <0.00010 0.00216 <0.030 0.000262
B2-B 23/08/16 0.044 <0.000005 13.3 <0.00050 <0.00010 0.0022 <0.030 0.000277
B2-S 23/08/16 0.044 <0.000005 13.4 <0.00050 <0.00010 0.00185 <0.030 <0.000050
B2-5 23/08/16 0.044 <0.000005 13.4 <0.00050 <0.00010 0.00257 <0.030 0.000502
Dis
s-B
oro
n (
B)
(mg
/L)
Dis
s-C
ad
miu
m (
Cd
)
(mg
/L)
Dis
s-C
alc
ium
(C
a)
(mg
/L)
Dis
s-C
hro
miu
m (
Cr)
(mg
/L)
Dis
s-C
ob
alt
(C
o)
(mg
/L)
Dis
s-C
op
per
(Cu
)
(mg
/L)
Dis
s-I
ron
(F
e)
(mg
/L)
Dis
s-L
ead
(P
b)
(mg
/L)
EDC-01 06/07/16 0.01 0.0000067 22.8 0.00069 <0.00010 0.00361 0.18 <0.000050
02/08/16 0.017 0.0000128 37.7 0.00055 <0.00010 0.00595 0.132 <0.000050
06/09/16 0.027 0.0000069 49.3 <0.00050 <0.00010 0.00441 <0.030 <0.000050
Printed Date: 19/10/2016
1-Jul-2016 30-Sep-2016
Monitoring data report for:
Bootjack Lake
This report covers the period from: to:
Mount Polley
Mining CorporationIMPERIAL METALS CORPORATION
Mount Polley
Mining CorporationIMPERIAL METALS CORPORATION
Dis
s-L
ith
ium
(L
i) (
mg
/L)
Dis
s-M
ag
nesiu
m (
Mg
)
(mg
/L)
Dis
s-M
an
gan
ese
(M
n)
(mg
/L)
Dis
s-M
oly
bd
en
um
(M
o)
(mg
/L)
Dis
s-N
ickel (N
i) (
mg
/L)
Dis
s-P
ota
ssiu
m (
K)
(mg
/L)
Dis
s-S
ele
niu
m (
mg
/L)
Dis
s-S
ilic
on
(S
i) (
mg
/L)
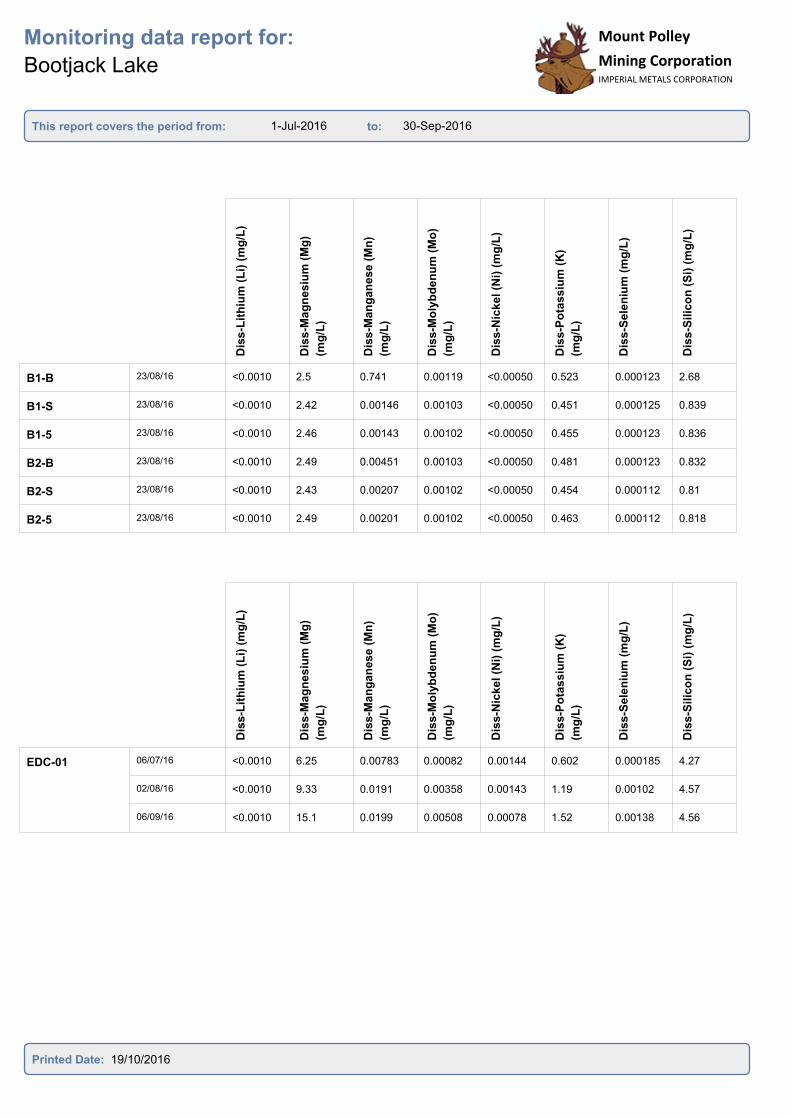
B1-B 23/08/16 <0.0010 2.5 0.741 0.00119 <0.00050 0.523 0.000123 2.68
B1-S 23/08/16 <0.0010 2.42 0.00146 0.00103 <0.00050 0.451 0.000125 0.839
B1-5 23/08/16 <0.0010 2.46 0.00143 0.00102 <0.00050 0.455 0.000123 0.836
B2-B 23/08/16 <0.0010 2.49 0.00451 0.00103 <0.00050 0.481 0.000123 0.832
B2-S 23/08/16 <0.0010 2.43 0.00207 0.00102 <0.00050 0.454 0.000112 0.81
B2-5 23/08/16 <0.0010 2.49 0.00201 0.00102 <0.00050 0.463 0.000112 0.818
Dis
s-L
ith
ium
(L
i) (
mg
/L)
Dis
s-M
ag
nesiu
m (
Mg
)
(mg
/L)
Dis
s-M
an
gan
ese (
Mn
)
(mg
/L)
Dis
s-M
oly
bd
en
um
(M
o)
(mg
/L)
Dis
s-N
ickel (N
i) (
mg
/L)
Dis
s-P
ota
ssiu
m (
K)
(mg
/L)
Dis
s-S
ele
niu
m (
mg
/L)
Dis
s-S
ilic
on
(S
i) (
mg
/L)
EDC-01 06/07/16 <0.0010 6.25 0.00783 0.00082 0.00144 0.602 0.000185 4.27
02/08/16 <0.0010 9.33 0.0191 0.00358 0.00143 1.19 0.00102 4.57
06/09/16 <0.0010 15.1 0.0199 0.00508 0.00078 1.52 0.00138 4.56
Printed Date: 19/10/2016
1-Jul-2016 30-Sep-2016
Monitoring data report for:
Bootjack Lake
This report covers the period from: to:
Mount Polley
Mining CorporationIMPERIAL METALS CORPORATION
Mount Polley
Mining CorporationIMPERIAL METALS CORPORATION
Dis
s-S
ilv
er
(Ag
) (m
g/L
)
Dis
s-S
od
ium
(N
a)
(mg
/L)
Dis
s-S
tro
nti
um
(S
r)
(mg
/L)
Dis
s-T
halliu
m (
Tl)
(mg
/L)
Dis
s-T
in (
Sn
) (m
g/L
)
Dis
s-T
itan
ium
(T
i)
(mg
/L)
Dis
s-U
ran
ium
(U
)
(mg
/L)
Dis
s-V
an
ad
ium
(V
)
(mg
/L)
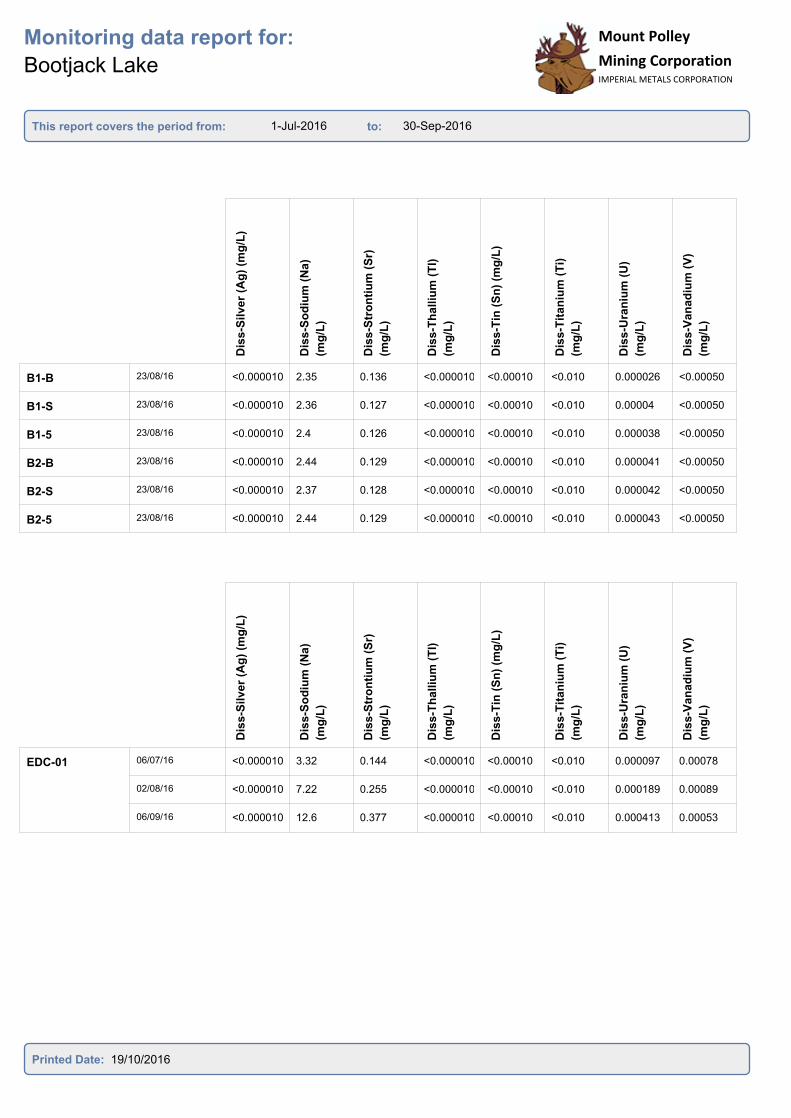
B1-B 23/08/16 <0.000010 2.35 0.136 <0.000010 <0.00010 <0.010 0.000026 <0.00050
B1-S 23/08/16 <0.000010 2.36 0.127 <0.000010 <0.00010 <0.010 0.00004 <0.00050
B1-5 23/08/16 <0.000010 2.4 0.126 <0.000010 <0.00010 <0.010 0.000038 <0.00050
B2-B 23/08/16 <0.000010 2.44 0.129 <0.000010 <0.00010 <0.010 0.000041 <0.00050
B2-S 23/08/16 <0.000010 2.37 0.128 <0.000010 <0.00010 <0.010 0.000042 <0.00050
B2-5 23/08/16 <0.000010 2.44 0.129 <0.000010 <0.00010 <0.010 0.000043 <0.00050
Dis
s-S
ilver
(Ag
) (m
g/L
)
Dis
s-S
od
ium
(N
a)
(mg
/L)
Dis
s-S
tro
nti
um
(S
r)
(mg
/L)
Dis
s-T
halliu
m (
Tl)
(mg
/L)
Dis
s-T
in (
Sn
) (m
g/L
)
Dis
s-T
itan
ium
(T
i)
(mg
/L)
Dis
s-U
ran
ium
(U
)
(mg
/L)
Dis
s-V
an
ad
ium
(V
)
(mg
/L)
EDC-01 06/07/16 <0.000010 3.32 0.144 <0.000010 <0.00010 <0.010 0.000097 0.00078
02/08/16 <0.000010 7.22 0.255 <0.000010 <0.00010 <0.010 0.000189 0.00089
06/09/16 <0.000010 12.6 0.377 <0.000010 <0.00010 <0.010 0.000413 0.00053
Printed Date: 19/10/2016

1-Jul-2016 30-Sep-2016
Monitoring data report for:
Bootjack Lake
This report covers the period from: to:
Mount Polley
Mining CorporationIMPERIAL METALS CORPORATION
Mount Polley
Mining CorporationIMPERIAL METALS CORPORATION
Dis
s-Z
inc (
Zn
) (m
g/L
)
B1-B 23/08/16 <0.0030
B1-S 23/08/16 <0.0030
B1-5 23/08/16 <0.0030
B2-B 23/08/16 <0.0030
B2-S 23/08/16 <0.0030
B2-5 23/08/16 <0.0030
Dis
s-Z
inc (
Zn
) (m
g/L
)
EDC-01 06/07/16 <0.0030
02/08/16 <0.0030
06/09/16 <0.0030
Printed Date: 19/10/2016
1-Jul-2016 30-Sep-2016
Monitoring data report for:
Effluent Water Quality Site
This report covers the period from: to:
Mount Polley
Mining CorporationIMPERIAL METALS CORPORATION
Co
nd
ucti
vit
y (
µs/c
m)
Hard
nes
s (
mg
/L)
pH
(p
H)
TD
S (
mg
/L)
TS
S (
mg
/L)
NT
U (
ntu
)
Alk
alin
ity
(C
aC
O3)
(mg
/L)
Am
mo
nia
(a
s N
) (m
g/L
)
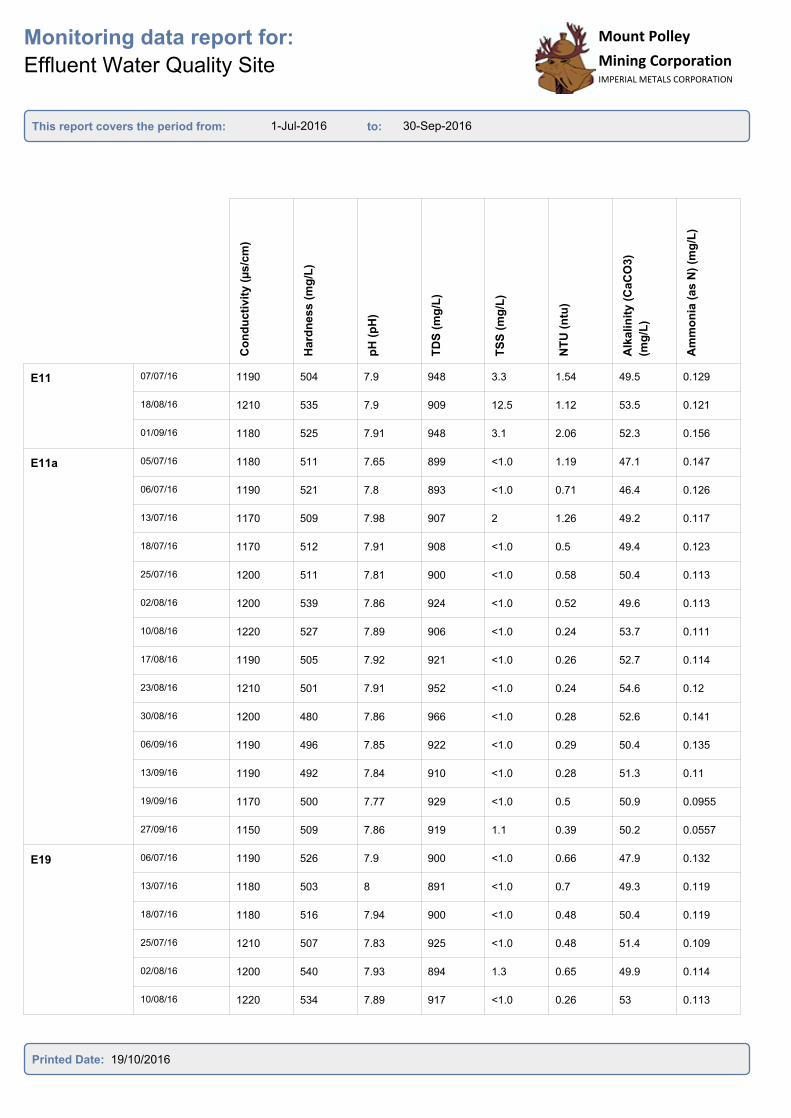
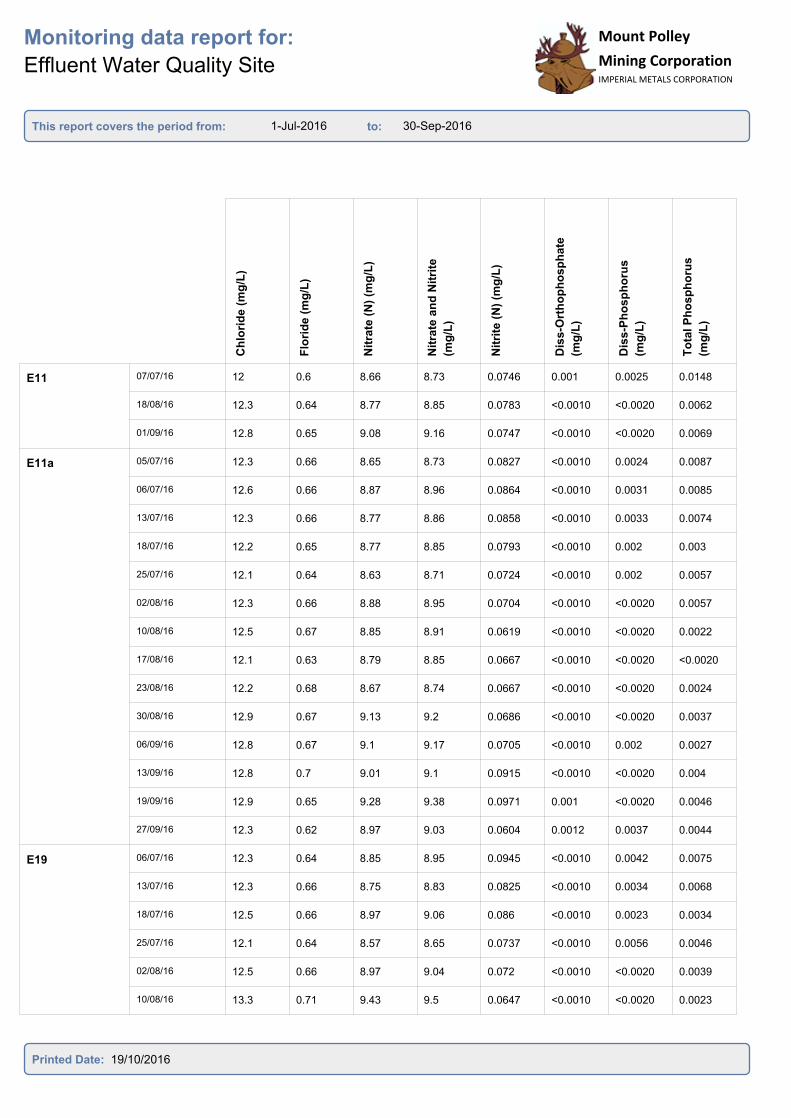
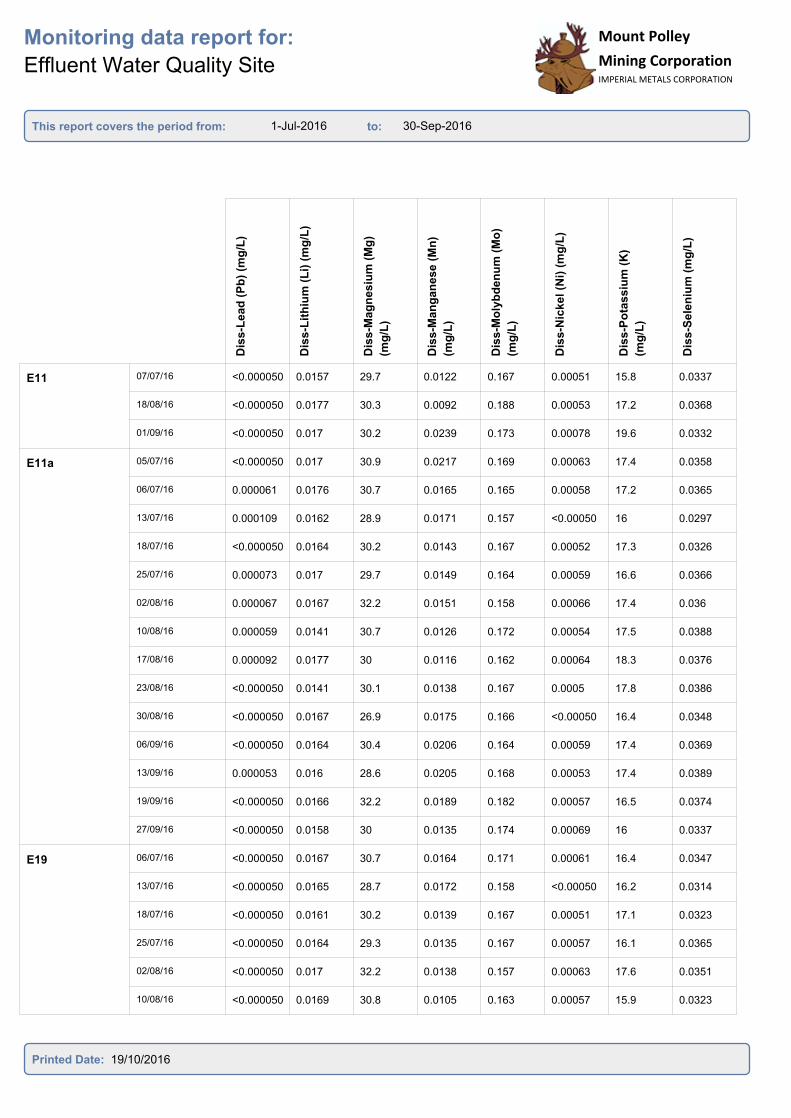
E11 07/07/16 1190 504 7.9 948 3.3 1.54 49.5 0.129
18/08/16 1210 535 7.9 909 12.5 1.12 53.5 0.121
01/09/16 1180 525 7.91 948 3.1 2.06 52.3 0.156
E11a 05/07/16 1180 511 7.65 899 <1.0 1.19 47.1 0.147
06/07/16 1190 521 7.8 893 <1.0 0.71 46.4 0.126
13/07/16 1170 509 7.98 907 2 1.26 49.2 0.117
18/07/16 1170 512 7.91 908 <1.0 0.5 49.4 0.123
25/07/16 1200 511 7.81 900 <1.0 0.58 50.4 0.113
02/08/16 1200 539 7.86 924 <1.0 0.52 49.6 0.113
10/08/16 1220 527 7.89 906 <1.0 0.24 53.7 0.111
17/08/16 1190 505 7.92 921 <1.0 0.26 52.7 0.114
23/08/16 1210 501 7.91 952 <1.0 0.24 54.6 0.12
30/08/16 1200 480 7.86 966 <1.0 0.28 52.6 0.141
06/09/16 1190 496 7.85 922 <1.0 0.29 50.4 0.135
13/09/16 1190 492 7.84 910 <1.0 0.28 51.3 0.11
19/09/16 1170 500 7.77 929 <1.0 0.5 50.9 0.0955
27/09/16 1150 509 7.86 919 1.1 0.39 50.2 0.0557
E19 06/07/16 1190 526 7.9 900 <1.0 0.66 47.9 0.132
13/07/16 1180 503 8 891 <1.0 0.7 49.3 0.119
18/07/16 1180 516 7.94 900 <1.0 0.48 50.4 0.119
25/07/16 1210 507 7.83 925 <1.0 0.48 51.4 0.109
02/08/16 1200 540 7.93 894 1.3 0.65 49.9 0.114
10/08/16 1220 534 7.89 917 <1.0 0.26 53 0.113
Printed Date: 19/10/2016
1-Jul-2016 30-Sep-2016
Monitoring data report for:
Effluent Water Quality Site
This report covers the period from: to:
Mount Polley
Mining CorporationIMPERIAL METALS CORPORATION
Mount Polley
Mining CorporationIMPERIAL METALS CORPORATION
Ch
lori
de (
mg
/L)
Flo
rid
e (
mg
/L)
Nit
rate
(N
) (m
g/L
)
Nit
rate
an
d N
itri
te
(mg
/L)
Nit
rite
(N
) (m
g/L
)
Dis
s-O
rth
op
ho
sp
hate
(mg
/L)
Dis
s-P
ho
sp
ho
rus
(mg
/L)
To
tal P
ho
sp
ho
rus
(mg
/L)
E11 07/07/16 12 0.6 8.66 8.73 0.0746 0.001 0.0025 0.0148
18/08/16 12.3 0.64 8.77 8.85 0.0783 <0.0010 <0.0020 0.0062
01/09/16 12.8 0.65 9.08 9.16 0.0747 <0.0010 <0.0020 0.0069
E11a 05/07/16 12.3 0.66 8.65 8.73 0.0827 <0.0010 0.0024 0.0087
06/07/16 12.6 0.66 8.87 8.96 0.0864 <0.0010 0.0031 0.0085
13/07/16 12.3 0.66 8.77 8.86 0.0858 <0.0010 0.0033 0.0074
18/07/16 12.2 0.65 8.77 8.85 0.0793 <0.0010 0.002 0.003
25/07/16 12.1 0.64 8.63 8.71 0.0724 <0.0010 0.002 0.0057
02/08/16 12.3 0.66 8.88 8.95 0.0704 <0.0010 <0.0020 0.0057
10/08/16 12.5 0.67 8.85 8.91 0.0619 <0.0010 <0.0020 0.0022
17/08/16 12.1 0.63 8.79 8.85 0.0667 <0.0010 <0.0020 <0.0020
23/08/16 12.2 0.68 8.67 8.74 0.0667 <0.0010 <0.0020 0.0024
30/08/16 12.9 0.67 9.13 9.2 0.0686 <0.0010 <0.0020 0.0037
06/09/16 12.8 0.67 9.1 9.17 0.0705 <0.0010 0.002 0.0027
13/09/16 12.8 0.7 9.01 9.1 0.0915 <0.0010 <0.0020 0.004
19/09/16 12.9 0.65 9.28 9.38 0.0971 0.001 <0.0020 0.0046
27/09/16 12.3 0.62 8.97 9.03 0.0604 0.0012 0.0037 0.0044
E19 06/07/16 12.3 0.64 8.85 8.95 0.0945 <0.0010 0.0042 0.0075
13/07/16 12.3 0.66 8.75 8.83 0.0825 <0.0010 0.0034 0.0068
18/07/16 12.5 0.66 8.97 9.06 0.086 <0.0010 0.0023 0.0034
25/07/16 12.1 0.64 8.57 8.65 0.0737 <0.0010 0.0056 0.0046
02/08/16 12.5 0.66 8.97 9.04 0.072 <0.0010 <0.0020 0.0039
10/08/16 13.3 0.71 9.43 9.5 0.0647 <0.0010 <0.0020 0.0023
Printed Date: 19/10/2016
1-Jul-2016 30-Sep-2016
Monitoring data report for:
Effluent Water Quality Site
This report covers the period from: to:
Mount Polley
Mining CorporationIMPERIAL METALS CORPORATION
Mount Polley
Mining CorporationIMPERIAL METALS CORPORATION
Su
lph
ate
(m
g/L
)
To
tal N
itro
ge
n (
mg
/L)
Dis
so
lved
Org
an
ic C
a
(mg
/L)
To
tal A
lum
inu
m (
mg
/L)
An
tim
on
y (
Sb
)-T
ota
l
(mg
/L)
Ars
en
ic (
As)-
To
tal
(mg
/L)
Bari
um
(B
a)-
To
tal
(mg
/L)
Bery
lliu
m (
Be)-
To
tal
(mg
/L)
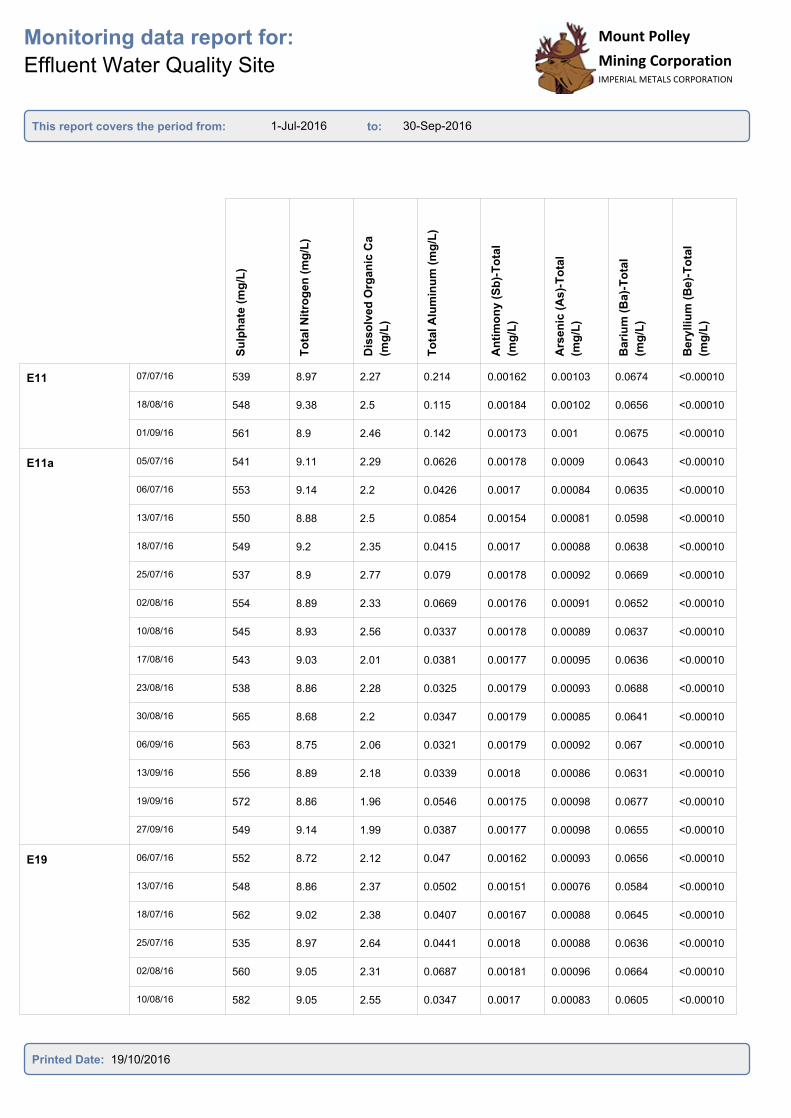
E11 07/07/16 539 8.97 2.27 0.214 0.00162 0.00103 0.0674 <0.00010
18/08/16 548 9.38 2.5 0.115 0.00184 0.00102 0.0656 <0.00010
01/09/16 561 8.9 2.46 0.142 0.00173 0.001 0.0675 <0.00010
E11a 05/07/16 541 9.11 2.29 0.0626 0.00178 0.0009 0.0643 <0.00010
06/07/16 553 9.14 2.2 0.0426 0.0017 0.00084 0.0635 <0.00010
13/07/16 550 8.88 2.5 0.0854 0.00154 0.00081 0.0598 <0.00010
18/07/16 549 9.2 2.35 0.0415 0.0017 0.00088 0.0638 <0.00010
25/07/16 537 8.9 2.77 0.079 0.00178 0.00092 0.0669 <0.00010
02/08/16 554 8.89 2.33 0.0669 0.00176 0.00091 0.0652 <0.00010
10/08/16 545 8.93 2.56 0.0337 0.00178 0.00089 0.0637 <0.00010
17/08/16 543 9.03 2.01 0.0381 0.00177 0.00095 0.0636 <0.00010
23/08/16 538 8.86 2.28 0.0325 0.00179 0.00093 0.0688 <0.00010
30/08/16 565 8.68 2.2 0.0347 0.00179 0.00085 0.0641 <0.00010
06/09/16 563 8.75 2.06 0.0321 0.00179 0.00092 0.067 <0.00010
13/09/16 556 8.89 2.18 0.0339 0.0018 0.00086 0.0631 <0.00010
19/09/16 572 8.86 1.96 0.0546 0.00175 0.00098 0.0677 <0.00010
27/09/16 549 9.14 1.99 0.0387 0.00177 0.00098 0.0655 <0.00010
E19 06/07/16 552 8.72 2.12 0.047 0.00162 0.00093 0.0656 <0.00010
13/07/16 548 8.86 2.37 0.0502 0.00151 0.00076 0.0584 <0.00010
18/07/16 562 9.02 2.38 0.0407 0.00167 0.00088 0.0645 <0.00010
25/07/16 535 8.97 2.64 0.0441 0.0018 0.00088 0.0636 <0.00010
02/08/16 560 9.05 2.31 0.0687 0.00181 0.00096 0.0664 <0.00010
10/08/16 582 9.05 2.55 0.0347 0.0017 0.00083 0.0605 <0.00010
Printed Date: 19/10/2016
1-Jul-2016 30-Sep-2016
Monitoring data report for:
Effluent Water Quality Site
This report covers the period from: to:
Mount Polley
Mining CorporationIMPERIAL METALS CORPORATION
Mount Polley
Mining CorporationIMPERIAL METALS CORPORATION
Bis
mu
th (
Bi)
-To
tal
(mg
/L)
Bo
ron
(B
)-T
ota
l (m
g/L
)
To
tal C
ad
miu
m (
mg
/L)
Calc
ium
(C
a)-
To
tal
(mg
/L)
Ch
rom
ium
(C
r)-T
ota
l
(mg
/L)
Co
balt
(C
o)-
To
tal
(mg
/L)
To
tal C
op
per
(mg
/L)
To
tal Ir
on
(m
g/L
)
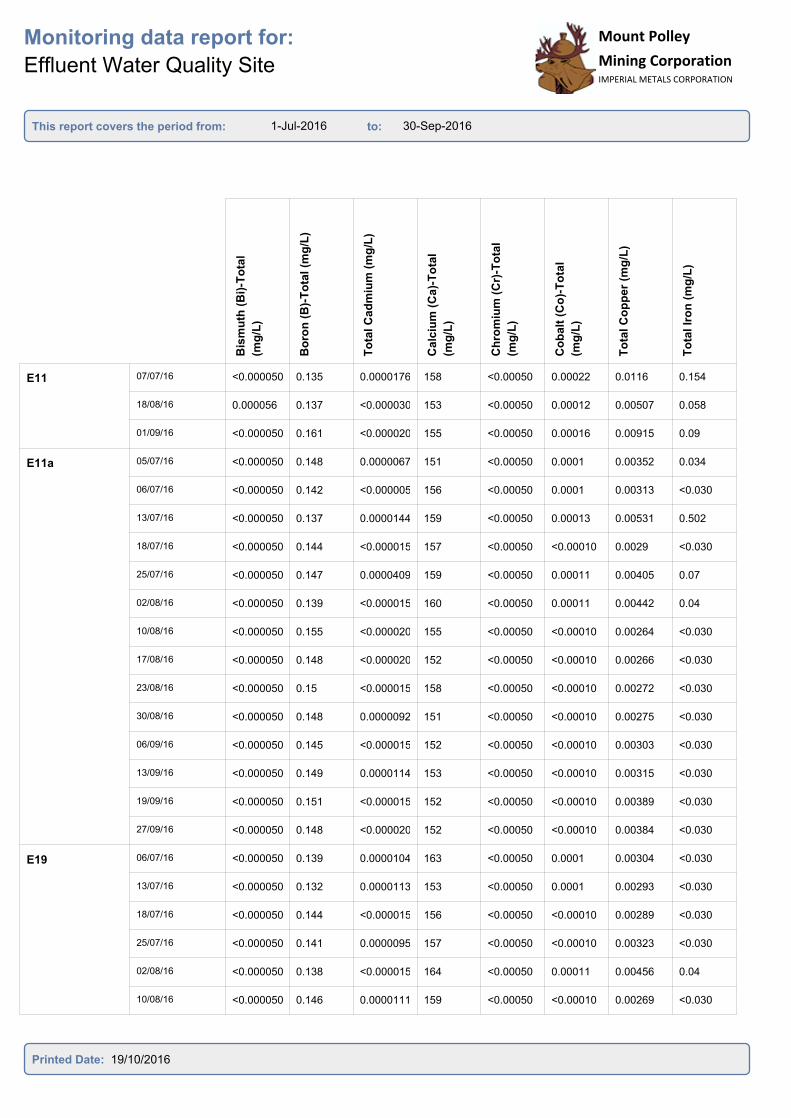
E11 07/07/16 <0.000050 0.135 0.0000176 158 <0.00050 0.00022 0.0116 0.154
18/08/16 0.000056 0.137 <0.000030 153 <0.00050 0.00012 0.00507 0.058
01/09/16 <0.000050 0.161 <0.000020 155 <0.00050 0.00016 0.00915 0.09
E11a 05/07/16 <0.000050 0.148 0.0000067 151 <0.00050 0.0001 0.00352 0.034
06/07/16 <0.000050 0.142 <0.000005 156 <0.00050 0.0001 0.00313 <0.030
13/07/16 <0.000050 0.137 0.0000144 159 <0.00050 0.00013 0.00531 0.502
18/07/16 <0.000050 0.144 <0.000015 157 <0.00050 <0.00010 0.0029 <0.030
25/07/16 <0.000050 0.147 0.0000409 159 <0.00050 0.00011 0.00405 0.07
02/08/16 <0.000050 0.139 <0.000015 160 <0.00050 0.00011 0.00442 0.04
10/08/16 <0.000050 0.155 <0.000020 155 <0.00050 <0.00010 0.00264 <0.030
17/08/16 <0.000050 0.148 <0.000020 152 <0.00050 <0.00010 0.00266 <0.030
23/08/16 <0.000050 0.15 <0.000015 158 <0.00050 <0.00010 0.00272 <0.030
30/08/16 <0.000050 0.148 0.0000092 151 <0.00050 <0.00010 0.00275 <0.030
06/09/16 <0.000050 0.145 <0.000015 152 <0.00050 <0.00010 0.00303 <0.030
13/09/16 <0.000050 0.149 0.0000114 153 <0.00050 <0.00010 0.00315 <0.030
19/09/16 <0.000050 0.151 <0.000015 152 <0.00050 <0.00010 0.00389 <0.030
27/09/16 <0.000050 0.148 <0.000020 152 <0.00050 <0.00010 0.00384 <0.030
E19 06/07/16 <0.000050 0.139 0.0000104 163 <0.00050 0.0001 0.00304 <0.030
13/07/16 <0.000050 0.132 0.0000113 153 <0.00050 0.0001 0.00293 <0.030
18/07/16 <0.000050 0.144 <0.000015 156 <0.00050 <0.00010 0.00289 <0.030
25/07/16 <0.000050 0.141 0.0000095 157 <0.00050 <0.00010 0.00323 <0.030
02/08/16 <0.000050 0.138 <0.000015 164 <0.00050 0.00011 0.00456 0.04
10/08/16 <0.000050 0.146 0.0000111 159 <0.00050 <0.00010 0.00269 <0.030
Printed Date: 19/10/2016

1-Jul-2016 30-Sep-2016
Monitoring data report for:
Effluent Water Quality Site
This report covers the period from: to:
Mount Polley
Mining CorporationIMPERIAL METALS CORPORATION
Mount Polley
Mining CorporationIMPERIAL METALS CORPORATION
To
tal L
ea
d (
mg
/L)
Lit
hiu
m (
Li)
-To
tal
(mg
/L)
Mag
nes
ium
(M
g)-
To
tal
(mg
/L)
To
tal M
an
ga
nese
(mg
/L)
Merc
ury
(H
g)-
To
tal
(mg
/L)
To
tal M
oly
bd
en
um
(mg
/L)
Nic
ke
l (N
i)-T
ota
l (m
g/L
)
Po
tas
siu
m (
K)-
To
tal
(mg
/L)
E11 07/07/16 0.000078 0.0158 31 0.0361 0.164 0.00073 16
18/08/16 <0.000050 0.0167 29 0.0243 0.171 0.00078 17.8
01/09/16 <0.000050 0.0163 28.6 0.0311 0.176 0.00099 18.2
E11a 05/07/16 0.000082 0.0174 30.3 0.0311 0.177 0.00067 17.6
06/07/16 0.00007 0.0176 30.6 0.0279 0.161 0.00067 16.9
13/07/16 0.000305 0.0164 29.9 0.0305 0.174 <0.00050 16.3
18/07/16 <0.000050 0.017 30.5 0.0221 0.175 0.00061 17.3
25/07/16 0.000082 0.0183 30.2 0.022 0.178 0.00063 17.5
02/08/16 0.000064 0.0167 31.6 0.0208 0.171 0.0007 17
10/08/16 <0.000050 0.0168 29.7 0.0165 0.173 0.00055 17.3
17/08/16 <0.000050 0.0171 29.8 0.0155 0.167 0.00068 17.9
23/08/16 <0.000050 0.0154 31.6 0.0174 0.181 0.00059 18.4
30/08/16 <0.000050 0.0168 27 0.0199 0.178 0.00054 16.3
06/09/16 <0.000050 0.0168 31 0.0257 0.176 0.0006 17.5
13/09/16 <0.000050 0.0167 28.4 0.0266 0.176 0.00058 17.2
19/09/16 <0.000050 0.0171 33.5 0.025 0.188 0.00066 17.7
27/09/16 <0.000050 0.0161 30.5 0.021 0.18 0.00102 16.1
E19 06/07/16 <0.000050 0.0174 30.9 0.0285 0.179 0.00068 16.9
13/07/16 <0.000050 0.0161 28.8 0.0256 0.163 <0.00050 16.1
18/07/16 <0.000050 0.0167 30.5 0.0214 0.171 0.00058 17.3
25/07/16 <0.000050 0.0171 30.1 0.0191 0.175 0.00062 16.8
02/08/16 <0.000050 0.0162 32.4 0.0198 0.174 0.00088 17.5
10/08/16 <0.000050 0.0177 30.8 0.015 0.172 0.00054 16.5
Printed Date: 19/10/2016
1-Jul-2016 30-Sep-2016
Monitoring data report for:
Effluent Water Quality Site
This report covers the period from: to:
Mount Polley
Mining CorporationIMPERIAL METALS CORPORATION
Mount Polley
Mining CorporationIMPERIAL METALS CORPORATION
To
tal S
ele
niu
m (
mg
/L)
Silic
on
(S
i)-T
ota
l (m
g/L
)
Silve
r (A
g)-
To
tal (m
g/L
)
So
diu
m (
Na)-
To
tal
(mg
/L)
Str
on
tiu
m (
Sr)
-To
tal
(mg
/L)
Th
alliu
m (
Tl)
-To
tal
(mg
/L)
Tin
(S
n)-
To
tal (m
g/L
)
Tit
an
ium
(T
i)-T
ota
l
(mg
/L)
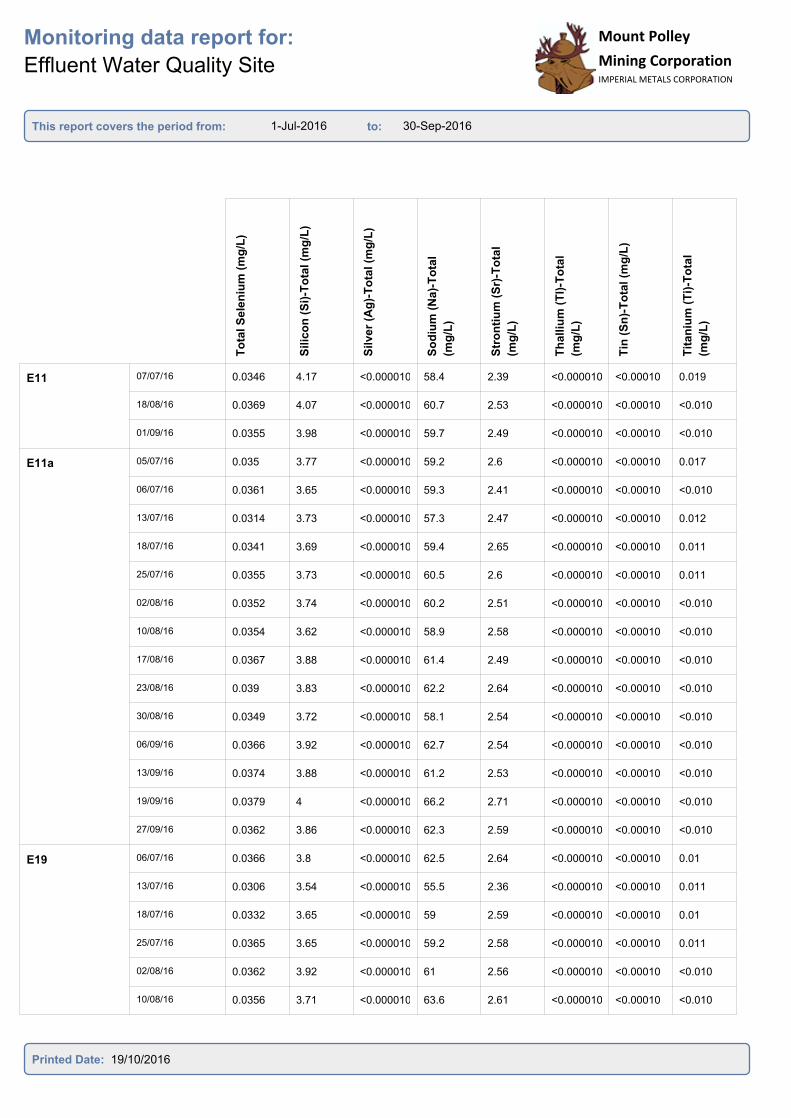
E11 07/07/16 0.0346 4.17 <0.000010 58.4 2.39 <0.000010 <0.00010 0.019
18/08/16 0.0369 4.07 <0.000010 60.7 2.53 <0.000010 <0.00010 <0.010
01/09/16 0.0355 3.98 <0.000010 59.7 2.49 <0.000010 <0.00010 <0.010
E11a 05/07/16 0.035 3.77 <0.000010 59.2 2.6 <0.000010 <0.00010 0.017
06/07/16 0.0361 3.65 <0.000010 59.3 2.41 <0.000010 <0.00010 <0.010
13/07/16 0.0314 3.73 <0.000010 57.3 2.47 <0.000010 <0.00010 0.012
18/07/16 0.0341 3.69 <0.000010 59.4 2.65 <0.000010 <0.00010 0.011
25/07/16 0.0355 3.73 <0.000010 60.5 2.6 <0.000010 <0.00010 0.011
02/08/16 0.0352 3.74 <0.000010 60.2 2.51 <0.000010 <0.00010 <0.010
10/08/16 0.0354 3.62 <0.000010 58.9 2.58 <0.000010 <0.00010 <0.010
17/08/16 0.0367 3.88 <0.000010 61.4 2.49 <0.000010 <0.00010 <0.010
23/08/16 0.039 3.83 <0.000010 62.2 2.64 <0.000010 <0.00010 <0.010
30/08/16 0.0349 3.72 <0.000010 58.1 2.54 <0.000010 <0.00010 <0.010
06/09/16 0.0366 3.92 <0.000010 62.7 2.54 <0.000010 <0.00010 <0.010
13/09/16 0.0374 3.88 <0.000010 61.2 2.53 <0.000010 <0.00010 <0.010
19/09/16 0.0379 4 <0.000010 66.2 2.71 <0.000010 <0.00010 <0.010
27/09/16 0.0362 3.86 <0.000010 62.3 2.59 <0.000010 <0.00010 <0.010
E19 06/07/16 0.0366 3.8 <0.000010 62.5 2.64 <0.000010 <0.00010 0.01
13/07/16 0.0306 3.54 <0.000010 55.5 2.36 <0.000010 <0.00010 0.011
18/07/16 0.0332 3.65 <0.000010 59 2.59 <0.000010 <0.00010 0.01
25/07/16 0.0365 3.65 <0.000010 59.2 2.58 <0.000010 <0.00010 0.011
02/08/16 0.0362 3.92 <0.000010 61 2.56 <0.000010 <0.00010 <0.010
10/08/16 0.0356 3.71 <0.000010 63.6 2.61 <0.000010 <0.00010 <0.010
Printed Date: 19/10/2016

1-Jul-2016 30-Sep-2016
Monitoring data report for:
Effluent Water Quality Site
This report covers the period from: to:
Mount Polley
Mining CorporationIMPERIAL METALS CORPORATION
Mount Polley
Mining CorporationIMPERIAL METALS CORPORATION
Ura
niu
m (
U)-
To
tal
(mg
/L)
Van
ad
ium
(V
)-T
ota
l
(mg
/L)
Zin
c (
Zn
)-T
ota
l (m
g/L
)
Dis
s-A
lum
inu
m (
Al)
(mg
/L)
Dis
s-A
nti
mo
ny
(S
b)
(mg
/L)
Dis
s-A
rsen
ic (
As
)
(mg
/L)
Dis
s-B
ari
um
(B
a)
(mg
/L)
Dis
s-B
ery
lliu
m (
Be)
(mg
/L)
E11 07/07/16 0.00119 0.00188 <0.0030 0.0238 0.00168 0.00087 0.0637 <0.00010
18/08/16 0.00122 0.00128 0.0033 0.0236 0.00176 0.00084 0.0648 <0.00010
01/09/16 0.00121 0.0014 <0.0030 0.0257 0.00172 0.00088 0.0699 <0.00010
E11a 05/07/16 0.00118 0.00102 <0.0030 0.0252 0.00175 0.00081 0.064 <0.00010
06/07/16 0.00116 0.00108 <0.0030 0.0256 0.00175 0.00085 0.0642 <0.00010
13/07/16 0.00119 0.00124 <0.0030 0.0263 0.00146 0.00072 0.0576 <0.00010
18/07/16 0.00117 0.00106 <0.0030 0.0254 0.00165 0.00082 0.0644 <0.00010
25/07/16 0.00123 0.00118 <0.0030 0.0252 0.00175 0.00082 0.0642 <0.00010
02/08/16 0.00122 0.00118 <0.0030 0.0263 0.00174 0.00086 0.0655 <0.00010
10/08/16 0.00121 0.00095 <0.0030 0.0248 0.00176 0.00087 0.0678 <0.00010
17/08/16 0.00122 0.00109 <0.0030 0.0272 0.0017 0.00093 0.0659 <0.00010
23/08/16 0.00123 0.00107 <0.0030 0.0221 0.00174 0.00084 0.0686 <0.00010
30/08/16 0.00125 0.00094 <0.0030 0.0238 0.00173 0.00083 0.0642 <0.00010
06/09/16 0.00127 0.00108 <0.0030 0.028 0.00177 0.00089 0.0672 <0.00010
13/09/16 0.00123 0.00104 <0.0030 0.0238 0.00179 0.00089 0.0651 <0.00010
19/09/16 0.0012 0.00115 <0.0030 0.0241 0.00162 0.00091 0.0662 <0.00010
27/09/16 0.00125 0.00115 <0.0030 0.022 0.00174 0.00092 0.0684 <0.00010
E19 06/07/16 0.0011 0.0011 <0.0030 0.028 0.00157 0.00086 0.0649 <0.00010
13/07/16 0.00112 0.00098 <0.0030 0.0265 0.0015 0.00075 0.0582 <0.00010
18/07/16 0.00117 0.00105 <0.0030 0.0252 0.00163 0.00083 0.0644 <0.00010
25/07/16 0.00121 0.00105 <0.0030 0.0241 0.00175 0.00084 0.0633 <0.00010
02/08/16 0.00123 0.00119 0.0167 0.0256 0.00176 0.00088 0.0659 <0.00010
10/08/16 0.00128 0.00106 <0.0030 0.0248 0.00169 0.00081 0.0602 <0.00010
Printed Date: 19/10/2016

1-Jul-2016 30-Sep-2016
Monitoring data report for:
Effluent Water Quality Site
This report covers the period from: to:
Mount Polley
Mining CorporationIMPERIAL METALS CORPORATION
Mount Polley
Mining CorporationIMPERIAL METALS CORPORATION
Dis
s-B
ism
uth
(B
i)
(mg
/L)
Dis
s-B
oro
n (
B)
(mg
/L)
Dis
s-C
ad
miu
m (
Cd
)
(mg
/L)
Dis
s-C
alc
ium
(C
a)
(mg
/L)
Dis
s-C
hro
miu
m (
Cr)
(mg
/L)
Dis
s-C
ob
alt
(C
o)
(mg
/L)
Dis
s-C
op
pe
r (C
u)
(mg
/L)
Dis
s-I
ron
(F
e)
(mg
/L)
E11 07/07/16 <0.000050 0.14 0.0000131 153 <0.00050 <0.00010 0.00243 <0.030
18/08/16 <0.000050 0.167 0.0000125 164 <0.00050 <0.00010 0.00189 <0.030
01/09/16 <0.000050 0.152 <0.000020 160 <0.00050 <0.00010 0.00272 <0.030
E11a 05/07/16 <0.000050 0.139 0.0000131 154 <0.00050 <0.00010 0.00158 <0.030
06/07/16 <0.000050 0.138 <0.000005 158 <0.00050 <0.00010 0.00175 <0.030
13/07/16 <0.000050 0.122 <0.000005 156 <0.00050 <0.00010 0.00187 <0.030
18/07/16 <0.000050 0.134 <0.000015 155 <0.00050 <0.00010 0.00189 <0.030
25/07/16 <0.000050 0.134 0.0000107 156 <0.00050 <0.00010 0.00203 <0.030
02/08/16 <0.000050 0.132 <0.000020 163 <0.00050 <0.00010 0.0023 <0.030
10/08/16 <0.000050 0.137 <0.000020 160 <0.00050 <0.00010 0.00219 <0.030
17/08/16 <0.000050 0.143 <0.000020 153 <0.00050 <0.00010 0.00214 <0.030
23/08/16 <0.000050 0.133 <0.000015 151 <0.00050 <0.00010 0.00219 <0.030
30/08/16 <0.000050 0.139 0.0000099 148 <0.00050 <0.00010 0.00216 <0.030
06/09/16 <0.000050 0.136 <0.000015 149 <0.00050 <0.00010 0.00239 <0.030
13/09/16 <0.000050 0.14 0.0000152 150 <0.00050 <0.00010 0.00236 <0.030
19/09/16 <0.000050 0.138 <0.000015 147 <0.00050 <0.00010 0.00245 <0.030
27/09/16 <0.000050 0.141 <0.000020 154 <0.00050 <0.00010 0.00264 <0.030
E19 06/07/16 <0.000050 0.128 0.0000094 160 <0.00050 <0.00010 0.0017 <0.030
13/07/16 <0.000050 0.123 0.0000105 154 <0.00050 <0.00010 0.00183 <0.030
18/07/16 <0.000050 0.134 <0.000015 157 <0.00050 <0.00010 0.00215 <0.030
25/07/16 <0.000050 0.133 0.0000153 155 <0.00050 <0.00010 0.00198 <0.030
02/08/16 <0.000050 0.131 <0.000015 163 <0.00050 <0.00010 0.00217 <0.030
10/08/16 <0.000050 0.133 0.000011 163 <0.00050 <0.00010 0.00202 <0.030
Printed Date: 19/10/2016
1-Jul-2016 30-Sep-2016
Monitoring data report for:
Effluent Water Quality Site
This report covers the period from: to:
Mount Polley
Mining CorporationIMPERIAL METALS CORPORATION
Mount Polley
Mining CorporationIMPERIAL METALS CORPORATION
Dis
s-L
ead
(P
b)
(mg
/L)
Dis
s-L
ith
ium
(L
i) (
mg
/L)
Dis
s-M
ag
nesiu
m (
Mg
)
(mg
/L)
Dis
s-M
an
gan
ese
(M
n)
(mg
/L)
Dis
s-M
oly
bd
en
um
(M
o)
(mg
/L)
Dis
s-N
ickel (N
i) (
mg
/L)
Dis
s-P
ota
ssiu
m (
K)
(mg
/L)
Dis
s-S
ele
niu
m (
mg
/L)
E11 07/07/16 <0.000050 0.0157 29.7 0.0122 0.167 0.00051 15.8 0.0337
18/08/16 <0.000050 0.0177 30.3 0.0092 0.188 0.00053 17.2 0.0368
01/09/16 <0.000050 0.017 30.2 0.0239 0.173 0.00078 19.6 0.0332
E11a 05/07/16 <0.000050 0.017 30.9 0.0217 0.169 0.00063 17.4 0.0358
06/07/16 0.000061 0.0176 30.7 0.0165 0.165 0.00058 17.2 0.0365
13/07/16 0.000109 0.0162 28.9 0.0171 0.157 <0.00050 16 0.0297
18/07/16 <0.000050 0.0164 30.2 0.0143 0.167 0.00052 17.3 0.0326
25/07/16 0.000073 0.017 29.7 0.0149 0.164 0.00059 16.6 0.0366
02/08/16 0.000067 0.0167 32.2 0.0151 0.158 0.00066 17.4 0.036
10/08/16 0.000059 0.0141 30.7 0.0126 0.172 0.00054 17.5 0.0388
17/08/16 0.000092 0.0177 30 0.0116 0.162 0.00064 18.3 0.0376
23/08/16 <0.000050 0.0141 30.1 0.0138 0.167 0.0005 17.8 0.0386
30/08/16 <0.000050 0.0167 26.9 0.0175 0.166 <0.00050 16.4 0.0348
06/09/16 <0.000050 0.0164 30.4 0.0206 0.164 0.00059 17.4 0.0369
13/09/16 0.000053 0.016 28.6 0.0205 0.168 0.00053 17.4 0.0389
19/09/16 <0.000050 0.0166 32.2 0.0189 0.182 0.00057 16.5 0.0374
27/09/16 <0.000050 0.0158 30 0.0135 0.174 0.00069 16 0.0337
E19 06/07/16 <0.000050 0.0167 30.7 0.0164 0.171 0.00061 16.4 0.0347
13/07/16 <0.000050 0.0165 28.7 0.0172 0.158 <0.00050 16.2 0.0314
18/07/16 <0.000050 0.0161 30.2 0.0139 0.167 0.00051 17.1 0.0323
25/07/16 <0.000050 0.0164 29.3 0.0135 0.167 0.00057 16.1 0.0365
02/08/16 <0.000050 0.017 32.2 0.0138 0.157 0.00063 17.6 0.0351
10/08/16 <0.000050 0.0169 30.8 0.0105 0.163 0.00057 15.9 0.0323
Printed Date: 19/10/2016
1-Jul-2016 30-Sep-2016
Monitoring data report for:
Effluent Water Quality Site
This report covers the period from: to:
Mount Polley
Mining CorporationIMPERIAL METALS CORPORATION
Mount Polley
Mining CorporationIMPERIAL METALS CORPORATION
Dis
s-S
ilic
on
(S
i) (
mg
/L)
Dis
s-S
ilv
er
(Ag
) (m
g/L
)
Dis
s-S
od
ium
(N
a)
(mg
/L)
Dis
s-S
tro
nti
um
(S
r)
(mg
/L)
Dis
s-T
halliu
m (
Tl)
(mg
/L)
Dis
s-T
in (
Sn
) (m
g/L
)
Dis
s-T
itan
ium
(T
i)
(mg
/L)
Dis
s-U
ran
ium
(U
)
(mg
/L)
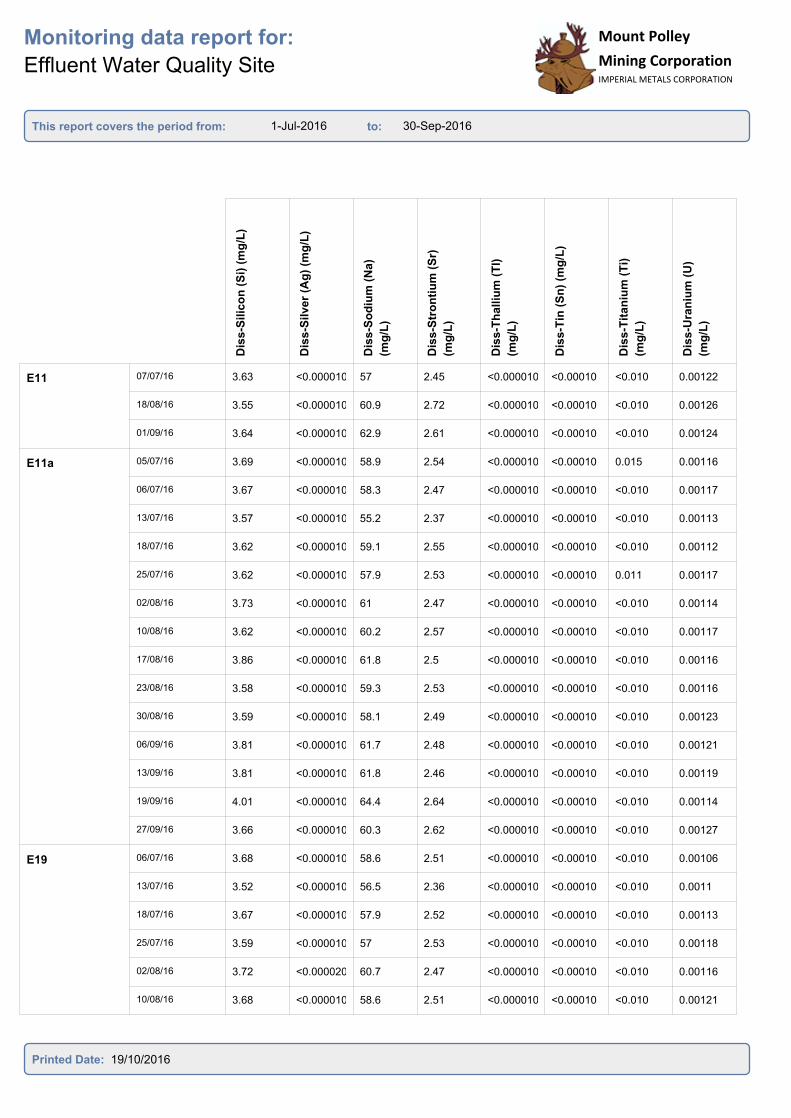
E11 07/07/16 3.63 <0.000010 57 2.45 <0.000010 <0.00010 <0.010 0.00122
18/08/16 3.55 <0.000010 60.9 2.72 <0.000010 <0.00010 <0.010 0.00126
01/09/16 3.64 <0.000010 62.9 2.61 <0.000010 <0.00010 <0.010 0.00124
E11a 05/07/16 3.69 <0.000010 58.9 2.54 <0.000010 <0.00010 0.015 0.00116
06/07/16 3.67 <0.000010 58.3 2.47 <0.000010 <0.00010 <0.010 0.00117
13/07/16 3.57 <0.000010 55.2 2.37 <0.000010 <0.00010 <0.010 0.00113
18/07/16 3.62 <0.000010 59.1 2.55 <0.000010 <0.00010 <0.010 0.00112
25/07/16 3.62 <0.000010 57.9 2.53 <0.000010 <0.00010 0.011 0.00117
02/08/16 3.73 <0.000010 61 2.47 <0.000010 <0.00010 <0.010 0.00114
10/08/16 3.62 <0.000010 60.2 2.57 <0.000010 <0.00010 <0.010 0.00117
17/08/16 3.86 <0.000010 61.8 2.5 <0.000010 <0.00010 <0.010 0.00116
23/08/16 3.58 <0.000010 59.3 2.53 <0.000010 <0.00010 <0.010 0.00116
30/08/16 3.59 <0.000010 58.1 2.49 <0.000010 <0.00010 <0.010 0.00123
06/09/16 3.81 <0.000010 61.7 2.48 <0.000010 <0.00010 <0.010 0.00121
13/09/16 3.81 <0.000010 61.8 2.46 <0.000010 <0.00010 <0.010 0.00119
19/09/16 4.01 <0.000010 64.4 2.64 <0.000010 <0.00010 <0.010 0.00114
27/09/16 3.66 <0.000010 60.3 2.62 <0.000010 <0.00010 <0.010 0.00127
E19 06/07/16 3.68 <0.000010 58.6 2.51 <0.000010 <0.00010 <0.010 0.00106
13/07/16 3.52 <0.000010 56.5 2.36 <0.000010 <0.00010 <0.010 0.0011
18/07/16 3.67 <0.000010 57.9 2.52 <0.000010 <0.00010 <0.010 0.00113
25/07/16 3.59 <0.000010 57 2.53 <0.000010 <0.00010 <0.010 0.00118
02/08/16 3.72 <0.000020 60.7 2.47 <0.000010 <0.00010 <0.010 0.00116
10/08/16 3.68 <0.000010 58.6 2.51 <0.000010 <0.00010 <0.010 0.00121
Printed Date: 19/10/2016
1-Jul-2016 30-Sep-2016
Monitoring data report for:
Effluent Water Quality Site
This report covers the period from: to:
Mount Polley
Mining CorporationIMPERIAL METALS CORPORATION
Mount Polley
Mining CorporationIMPERIAL METALS CORPORATION
Dis
s-V
an
ad
ium
(V
)
(mg
/L)
Dis
s-Z
inc (
Zn
) (m
g/L
)
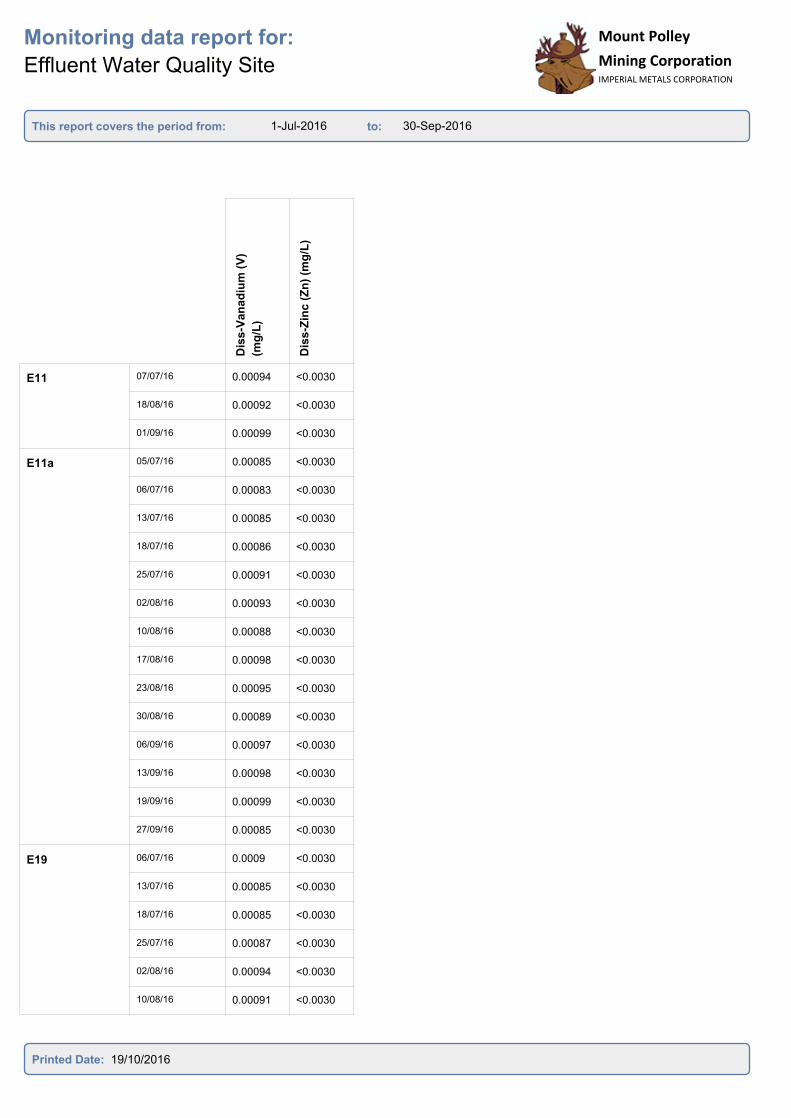
E11 07/07/16 0.00094 <0.0030
18/08/16 0.00092 <0.0030
01/09/16 0.00099 <0.0030
E11a 05/07/16 0.00085 <0.0030
06/07/16 0.00083 <0.0030
13/07/16 0.00085 <0.0030
18/07/16 0.00086 <0.0030
25/07/16 0.00091 <0.0030
02/08/16 0.00093 <0.0030
10/08/16 0.00088 <0.0030
17/08/16 0.00098 <0.0030
23/08/16 0.00095 <0.0030
30/08/16 0.00089 <0.0030
06/09/16 0.00097 <0.0030
13/09/16 0.00098 <0.0030
19/09/16 0.00099 <0.0030
27/09/16 0.00085 <0.0030
E19 06/07/16 0.0009 <0.0030
13/07/16 0.00085 <0.0030
18/07/16 0.00085 <0.0030
25/07/16 0.00087 <0.0030
02/08/16 0.00094 <0.0030
10/08/16 0.00091 <0.0030
Printed Date: 19/10/2016

1-Jul-2016 30-Sep-2016
Monitoring data report for:
Effluent Water Quality Site
This report covers the period from: to:
Mount Polley
Mining CorporationIMPERIAL METALS CORPORATION
Co
nd
ucti
vit
y (
µs/c
m)
Hard
ne
ss (
mg
/L)
pH
(p
H)
TD
S (
mg
/L)
TS
S (
mg
/L)
NT
U (
ntu
)
Alk
alin
ity
(C
aC
O3)
(mg
/L)
Am
mo
nia
(a
s N
) (m
g/L
)
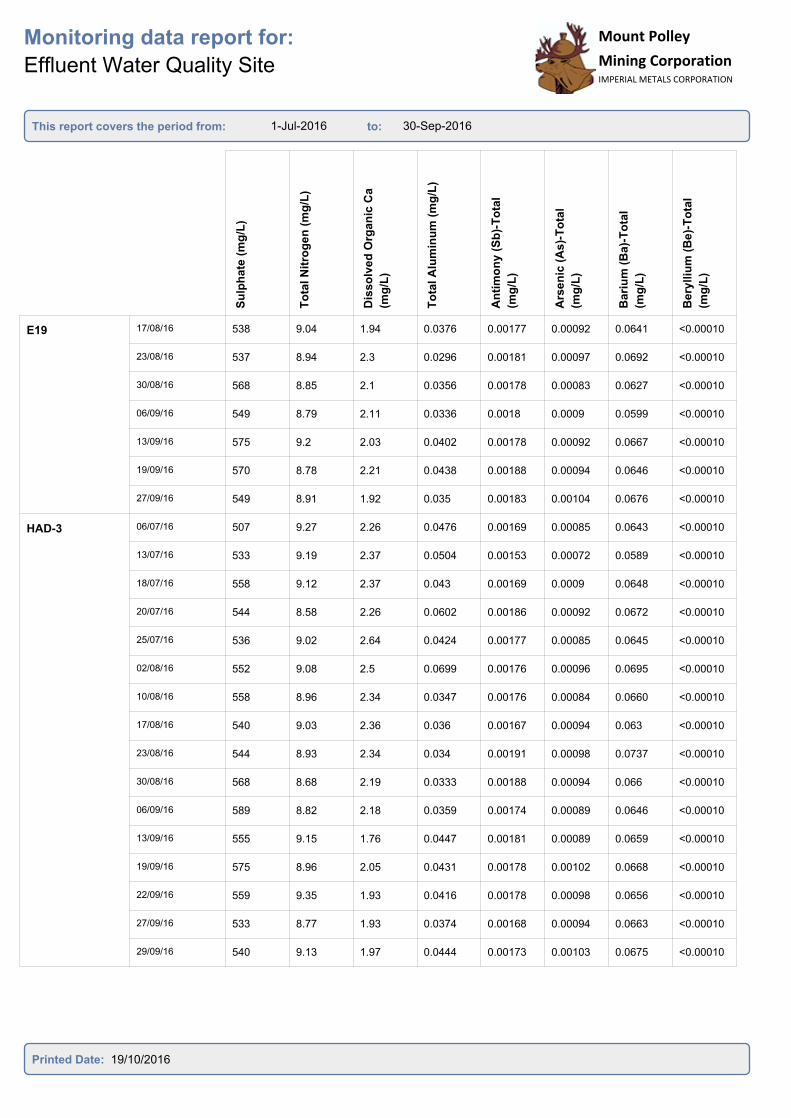
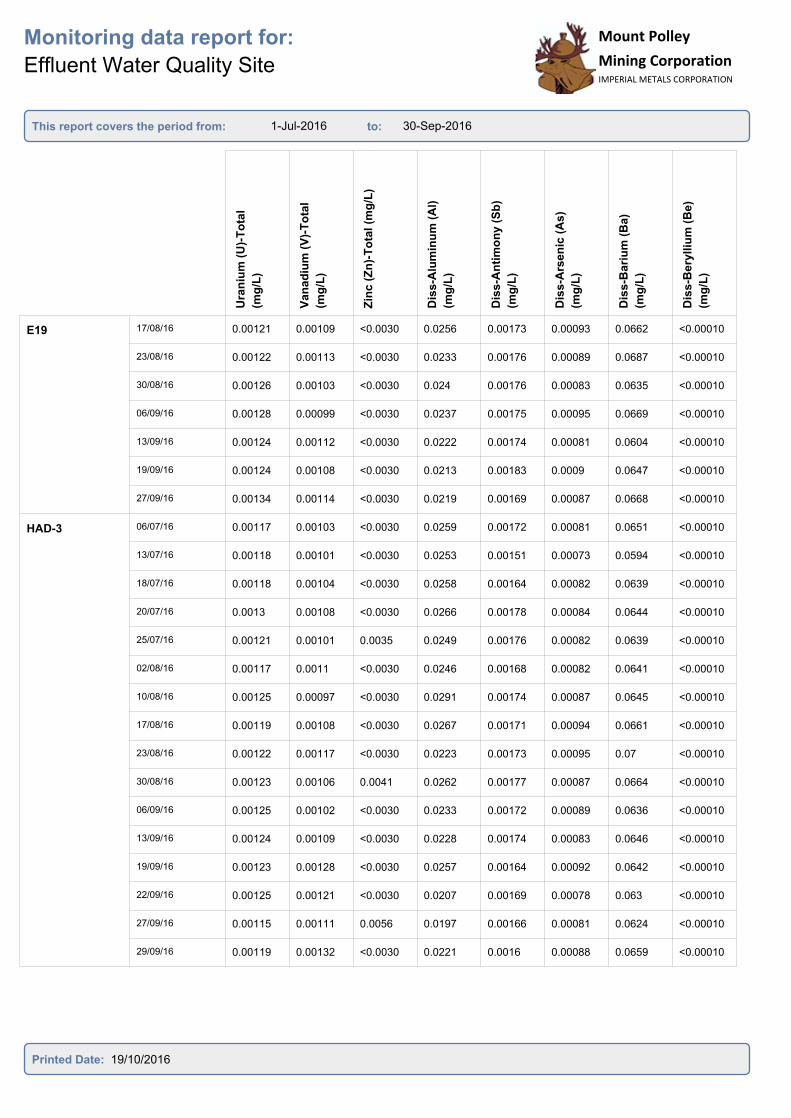
E19 17/08/16 1200 507 7.9 938 <1.0 0.24 55.1 0.113
23/08/16 1200 503 7.91 968 <1.0 0.24 53.5 0.119
30/08/16 1190 470 7.91 933 <1.0 0.29 52.8 0.142
06/09/16 1180 495 7.93 933 <1.0 0.3 50.5 0.136
13/09/16 1210 480 7.86 919 <1.0 0.3 52.7 0.11
19/09/16 1140 485 7.72 917 <1.0 0.45 51.7 0.0976
27/09/16 1130 501 7.88 919 <1.0 0.36 52.4 0.0572
HAD-3 06/07/16 1200 531 7.89 904 1.3 0.73 47.7 0.122
13/07/16 1170 499 8.01 874 1.1 0.67 48.4 0.119
18/07/16 1200 504 7.91 900 <1.0 0.51 51.4 0.117
20/07/16 1200 513 7.85 902 <1.0 0.68 49.4 0.111
25/07/16 1200 518 7.81 919 <1.0 0.46 51.2 0.11
02/08/16 1190 528 7.53 899 1.1 0.88 51.7 0.115
10/08/16 1200 529 7.88 948 1.5 0.29 50.0 0.112
17/08/16 1200 513 7.85 895 <1.0 0.25 54.2 0.109
23/08/16 1200 505 7.85 962 <1.0 0.27 52.2 0.117
30/08/16 1200 482 7.9 956 <1.0 0.26 51.9 0.141
06/09/16 1170 489 7.89 942 <1.0 0.29 51.3 0.136
13/09/16 1180 484 7.85 931 <1.0 0.33 52.2 0.108
19/09/16 1180 500 7.78 925 <1.0 0.63 50.9 0.0955
22/09/16 1170 484 7.79 942 <1.0 0.43 51.7 0.0795
27/09/16 1160 505 7.8 898 <1.0 0.44 50 0.0639
29/09/16 1200 507 7.79 902 <1.0 0.48 70.4 0.0489
Printed Date: 19/10/2016
1-Jul-2016 30-Sep-2016
Monitoring data report for:
Effluent Water Quality Site
This report covers the period from: to:
Mount Polley
Mining CorporationIMPERIAL METALS CORPORATION
Mount Polley
Mining CorporationIMPERIAL METALS CORPORATION
Ch
lori
de (
mg
/L)
Flo
rid
e (
mg
/L)
Nit
rate
(N
) (m
g/L
)
Nit
rate
an
d N
itri
te
(mg
/L)
Nit
rite
(N
) (m
g/L
)
Dis
s-O
rth
op
ho
sp
hate
(mg
/L)
Dis
s-P
ho
sp
ho
rus
(mg
/L)
To
tal P
ho
sp
ho
rus
(mg
/L)
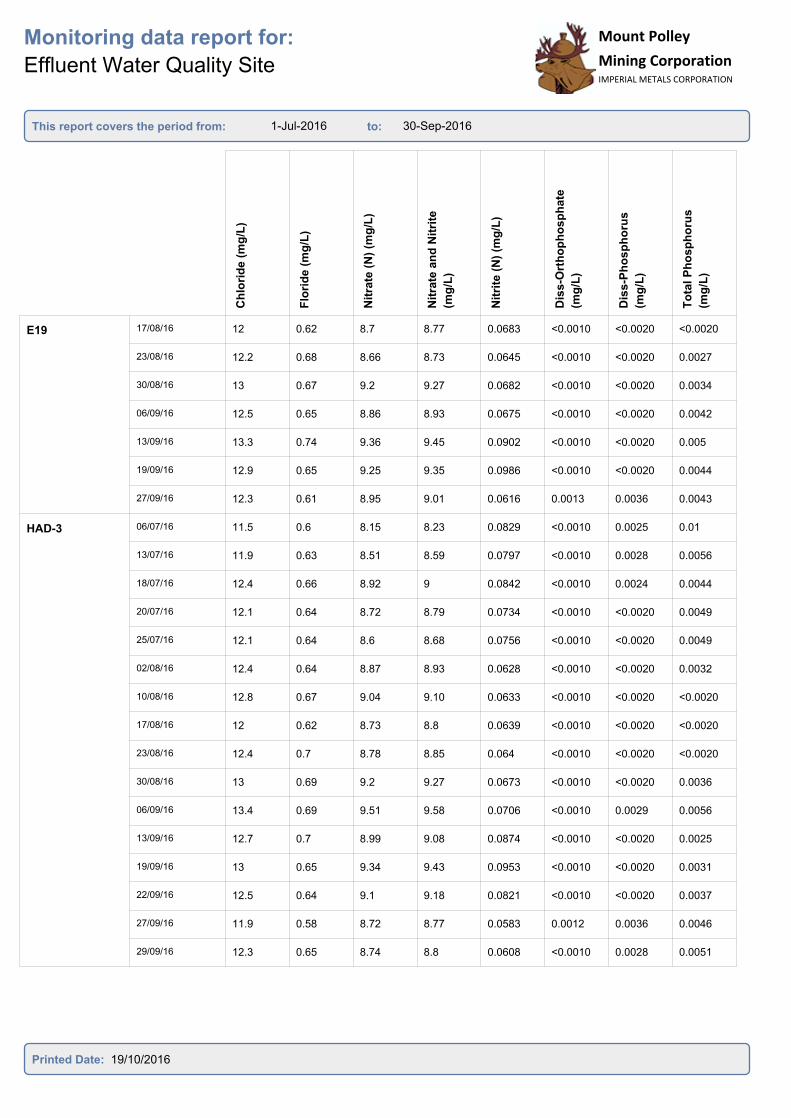
E19 17/08/16 12 0.62 8.7 8.77 0.0683 <0.0010 <0.0020 <0.0020
23/08/16 12.2 0.68 8.66 8.73 0.0645 <0.0010 <0.0020 0.0027
30/08/16 13 0.67 9.2 9.27 0.0682 <0.0010 <0.0020 0.0034
06/09/16 12.5 0.65 8.86 8.93 0.0675 <0.0010 <0.0020 0.0042
13/09/16 13.3 0.74 9.36 9.45 0.0902 <0.0010 <0.0020 0.005
19/09/16 12.9 0.65 9.25 9.35 0.0986 <0.0010 <0.0020 0.0044
27/09/16 12.3 0.61 8.95 9.01 0.0616 0.0013 0.0036 0.0043
HAD-3 06/07/16 11.5 0.6 8.15 8.23 0.0829 <0.0010 0.0025 0.01
13/07/16 11.9 0.63 8.51 8.59 0.0797 <0.0010 0.0028 0.0056
18/07/16 12.4 0.66 8.92 9 0.0842 <0.0010 0.0024 0.0044
20/07/16 12.1 0.64 8.72 8.79 0.0734 <0.0010 <0.0020 0.0049
25/07/16 12.1 0.64 8.6 8.68 0.0756 <0.0010 <0.0020 0.0049
02/08/16 12.4 0.64 8.87 8.93 0.0628 <0.0010 <0.0020 0.0032
10/08/16 12.8 0.67 9.04 9.10 0.0633 <0.0010 <0.0020 <0.0020
17/08/16 12 0.62 8.73 8.8 0.0639 <0.0010 <0.0020 <0.0020
23/08/16 12.4 0.7 8.78 8.85 0.064 <0.0010 <0.0020 <0.0020
30/08/16 13 0.69 9.2 9.27 0.0673 <0.0010 <0.0020 0.0036
06/09/16 13.4 0.69 9.51 9.58 0.0706 <0.0010 0.0029 0.0056
13/09/16 12.7 0.7 8.99 9.08 0.0874 <0.0010 <0.0020 0.0025
19/09/16 13 0.65 9.34 9.43 0.0953 <0.0010 <0.0020 0.0031
22/09/16 12.5 0.64 9.1 9.18 0.0821 <0.0010 <0.0020 0.0037
27/09/16 11.9 0.58 8.72 8.77 0.0583 0.0012 0.0036 0.0046
29/09/16 12.3 0.65 8.74 8.8 0.0608 <0.0010 0.0028 0.0051
Printed Date: 19/10/2016
1-Jul-2016 30-Sep-2016
Monitoring data report for:
Effluent Water Quality Site
This report covers the period from: to:
Mount Polley
Mining CorporationIMPERIAL METALS CORPORATION
Mount Polley
Mining CorporationIMPERIAL METALS CORPORATION
Su
lph
ate
(m
g/L
)
To
tal N
itro
ge
n (
mg
/L)
Dis
so
lved
Org
an
ic C
a
(mg
/L)
To
tal A
lum
inu
m (
mg
/L)
An
tim
on
y (
Sb
)-T
ota
l
(mg
/L)
Ars
en
ic (
As)-
To
tal
(mg
/L)
Bari
um
(B
a)-
To
tal
(mg
/L)
Bery
lliu
m (
Be
)-T
ota
l
(mg
/L)
E19 17/08/16 538 9.04 1.94 0.0376 0.00177 0.00092 0.0641 <0.00010
23/08/16 537 8.94 2.3 0.0296 0.00181 0.00097 0.0692 <0.00010
30/08/16 568 8.85 2.1 0.0356 0.00178 0.00083 0.0627 <0.00010
06/09/16 549 8.79 2.11 0.0336 0.0018 0.0009 0.0599 <0.00010
13/09/16 575 9.2 2.03 0.0402 0.00178 0.00092 0.0667 <0.00010
19/09/16 570 8.78 2.21 0.0438 0.00188 0.00094 0.0646 <0.00010
27/09/16 549 8.91 1.92 0.035 0.00183 0.00104 0.0676 <0.00010
HAD-3 06/07/16 507 9.27 2.26 0.0476 0.00169 0.00085 0.0643 <0.00010
13/07/16 533 9.19 2.37 0.0504 0.00153 0.00072 0.0589 <0.00010
18/07/16 558 9.12 2.37 0.043 0.00169 0.0009 0.0648 <0.00010
20/07/16 544 8.58 2.26 0.0602 0.00186 0.00092 0.0672 <0.00010
25/07/16 536 9.02 2.64 0.0424 0.00177 0.00085 0.0645 <0.00010
02/08/16 552 9.08 2.5 0.0699 0.00176 0.00096 0.0695 <0.00010
10/08/16 558 8.96 2.34 0.0347 0.00176 0.00084 0.0660 <0.00010
17/08/16 540 9.03 2.36 0.036 0.00167 0.00094 0.063 <0.00010
23/08/16 544 8.93 2.34 0.034 0.00191 0.00098 0.0737 <0.00010
30/08/16 568 8.68 2.19 0.0333 0.00188 0.00094 0.066 <0.00010
06/09/16 589 8.82 2.18 0.0359 0.00174 0.00089 0.0646 <0.00010
13/09/16 555 9.15 1.76 0.0447 0.00181 0.00089 0.0659 <0.00010
19/09/16 575 8.96 2.05 0.0431 0.00178 0.00102 0.0668 <0.00010
22/09/16 559 9.35 1.93 0.0416 0.00178 0.00098 0.0656 <0.00010
27/09/16 533 8.77 1.93 0.0374 0.00168 0.00094 0.0663 <0.00010
29/09/16 540 9.13 1.97 0.0444 0.00173 0.00103 0.0675 <0.00010
Printed Date: 19/10/2016
1-Jul-2016 30-Sep-2016
Monitoring data report for:
Effluent Water Quality Site
This report covers the period from: to:
Mount Polley
Mining CorporationIMPERIAL METALS CORPORATION
Mount Polley
Mining CorporationIMPERIAL METALS CORPORATION
Bis
mu
th (
Bi)
-To
tal
(mg
/L)
Bo
ron
(B
)-T
ota
l (m
g/L
)
To
tal C
ad
miu
m (
mg
/L)
Calc
ium
(C
a)-
To
tal
(mg
/L)
Ch
rom
ium
(C
r)-T
ota
l
(mg
/L)
Co
balt
(C
o)-
To
tal
(mg
/L)
To
tal C
op
per
(mg
/L)
To
tal Ir
on
(m
g/L
)
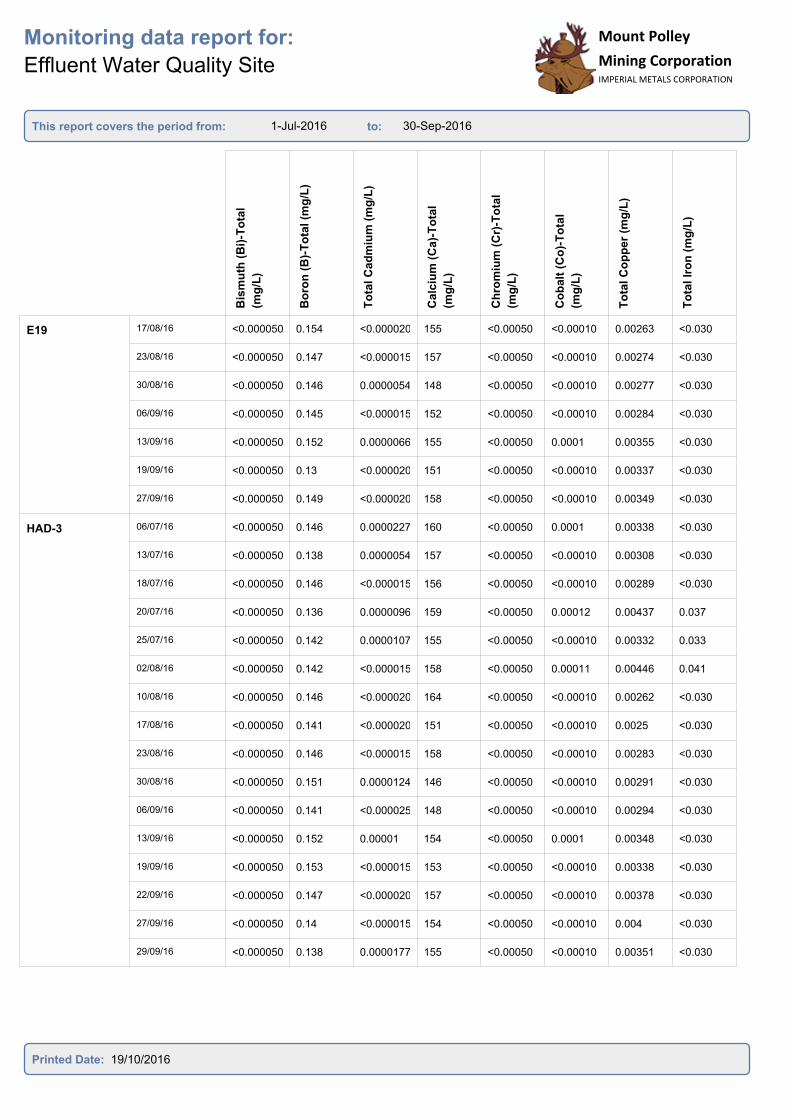
E19 17/08/16 <0.000050 0.154 <0.000020 155 <0.00050 <0.00010 0.00263 <0.030
23/08/16 <0.000050 0.147 <0.000015 157 <0.00050 <0.00010 0.00274 <0.030
30/08/16 <0.000050 0.146 0.0000054 148 <0.00050 <0.00010 0.00277 <0.030
06/09/16 <0.000050 0.145 <0.000015 152 <0.00050 <0.00010 0.00284 <0.030
13/09/16 <0.000050 0.152 0.0000066 155 <0.00050 0.0001 0.00355 <0.030
19/09/16 <0.000050 0.13 <0.000020 151 <0.00050 <0.00010 0.00337 <0.030
27/09/16 <0.000050 0.149 <0.000020 158 <0.00050 <0.00010 0.00349 <0.030
HAD-3 06/07/16 <0.000050 0.146 0.0000227 160 <0.00050 0.0001 0.00338 <0.030
13/07/16 <0.000050 0.138 0.0000054 157 <0.00050 <0.00010 0.00308 <0.030
18/07/16 <0.000050 0.146 <0.000015 156 <0.00050 <0.00010 0.00289 <0.030
20/07/16 <0.000050 0.136 0.0000096 159 <0.00050 0.00012 0.00437 0.037
25/07/16 <0.000050 0.142 0.0000107 155 <0.00050 <0.00010 0.00332 0.033
02/08/16 <0.000050 0.142 <0.000015 158 <0.00050 0.00011 0.00446 0.041
10/08/16 <0.000050 0.146 <0.000020 164 <0.00050 <0.00010 0.00262 <0.030
17/08/16 <0.000050 0.141 <0.000020 151 <0.00050 <0.00010 0.0025 <0.030
23/08/16 <0.000050 0.146 <0.000015 158 <0.00050 <0.00010 0.00283 <0.030
30/08/16 <0.000050 0.151 0.0000124 146 <0.00050 <0.00010 0.00291 <0.030
06/09/16 <0.000050 0.141 <0.000025 148 <0.00050 <0.00010 0.00294 <0.030
13/09/16 <0.000050 0.152 0.00001 154 <0.00050 0.0001 0.00348 <0.030
19/09/16 <0.000050 0.153 <0.000015 153 <0.00050 <0.00010 0.00338 <0.030
22/09/16 <0.000050 0.147 <0.000020 157 <0.00050 <0.00010 0.00378 <0.030
27/09/16 <0.000050 0.14 <0.000015 154 <0.00050 <0.00010 0.004 <0.030
29/09/16 <0.000050 0.138 0.0000177 155 <0.00050 <0.00010 0.00351 <0.030
Printed Date: 19/10/2016
1-Jul-2016 30-Sep-2016
Monitoring data report for:
Effluent Water Quality Site
This report covers the period from: to:
Mount Polley
Mining CorporationIMPERIAL METALS CORPORATION
Mount Polley
Mining CorporationIMPERIAL METALS CORPORATION
To
tal L
ea
d (
mg
/L)
Lit
hiu
m (
Li)
-To
tal
(mg
/L)
Mag
ne
siu
m (
Mg
)-T
ota
l
(mg
/L)
To
tal M
an
ga
nese
(mg
/L)
Merc
ury
(H
g)-
To
tal
(mg
/L)
To
tal M
oly
bd
en
um
(mg
/L)
Nic
ke
l (N
i)-T
ota
l (m
g/L
)
Po
tas
siu
m (
K)-
To
tal
(mg
/L)
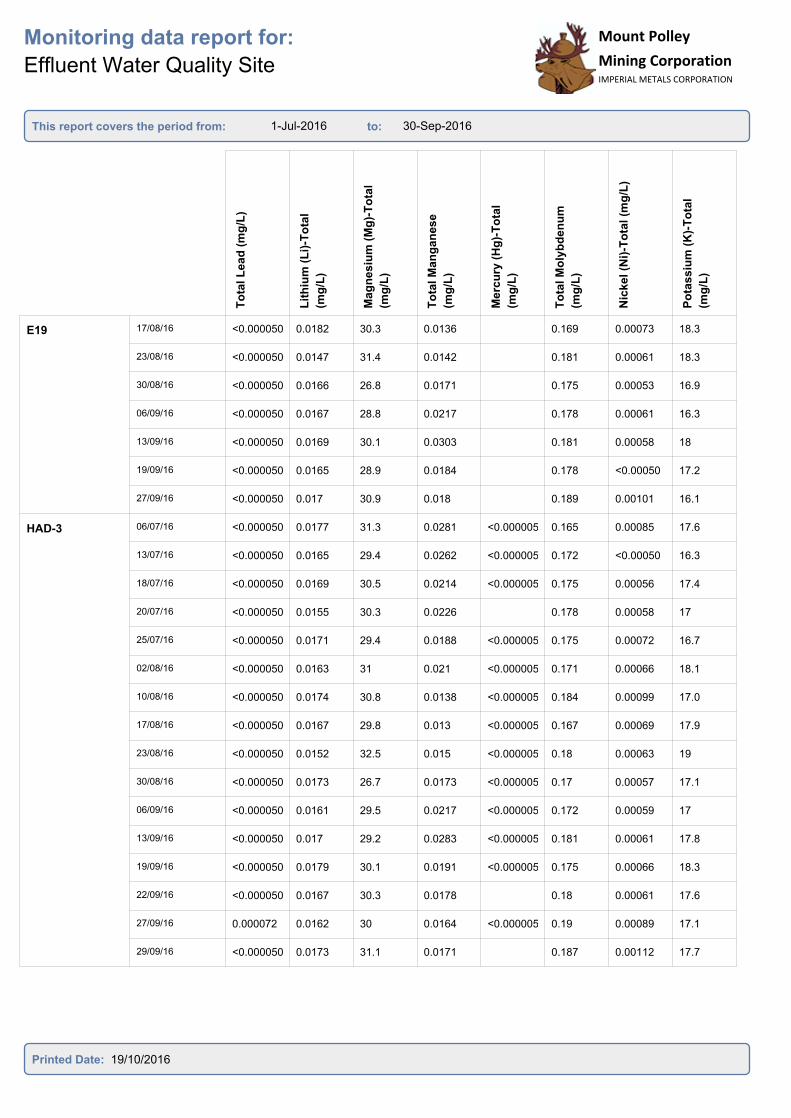
E19 17/08/16 <0.000050 0.0182 30.3 0.0136 0.169 0.00073 18.3
23/08/16 <0.000050 0.0147 31.4 0.0142 0.181 0.00061 18.3
30/08/16 <0.000050 0.0166 26.8 0.0171 0.175 0.00053 16.9
06/09/16 <0.000050 0.0167 28.8 0.0217 0.178 0.00061 16.3
13/09/16 <0.000050 0.0169 30.1 0.0303 0.181 0.00058 18
19/09/16 <0.000050 0.0165 28.9 0.0184 0.178 <0.00050 17.2
27/09/16 <0.000050 0.017 30.9 0.018 0.189 0.00101 16.1
HAD-3 06/07/16 <0.000050 0.0177 31.3 0.0281 <0.000005 0.165 0.00085 17.6
13/07/16 <0.000050 0.0165 29.4 0.0262 <0.000005 0.172 <0.00050 16.3
18/07/16 <0.000050 0.0169 30.5 0.0214 <0.000005 0.175 0.00056 17.4
20/07/16 <0.000050 0.0155 30.3 0.0226 0.178 0.00058 17
25/07/16 <0.000050 0.0171 29.4 0.0188 <0.000005 0.175 0.00072 16.7
02/08/16 <0.000050 0.0163 31 0.021 <0.000005 0.171 0.00066 18.1
10/08/16 <0.000050 0.0174 30.8 0.0138 <0.000005 0.184 0.00099 17.0
17/08/16 <0.000050 0.0167 29.8 0.013 <0.000005 0.167 0.00069 17.9
23/08/16 <0.000050 0.0152 32.5 0.015 <0.000005 0.18 0.00063 19
30/08/16 <0.000050 0.0173 26.7 0.0173 <0.000005 0.17 0.00057 17.1
06/09/16 <0.000050 0.0161 29.5 0.0217 <0.000005 0.172 0.00059 17
13/09/16 <0.000050 0.017 29.2 0.0283 <0.000005 0.181 0.00061 17.8
19/09/16 <0.000050 0.0179 30.1 0.0191 <0.000005 0.175 0.00066 18.3
22/09/16 <0.000050 0.0167 30.3 0.0178 0.18 0.00061 17.6
27/09/16 0.000072 0.0162 30 0.0164 <0.000005 0.19 0.00089 17.1
29/09/16 <0.000050 0.0173 31.1 0.0171 0.187 0.00112 17.7
Printed Date: 19/10/2016
1-Jul-2016 30-Sep-2016
Monitoring data report for:
Effluent Water Quality Site
This report covers the period from: to:
Mount Polley
Mining CorporationIMPERIAL METALS CORPORATION
Mount Polley
Mining CorporationIMPERIAL METALS CORPORATION
To
tal S
ele
niu
m (
mg
/L)
Silic
on
(S
i)-T
ota
l (m
g/L
)
Silve
r (A
g)-
To
tal (m
g/L
)
So
diu
m (
Na)-
To
tal
(mg
/L)
Str
on
tiu
m (
Sr)
-To
tal
(mg
/L)
Th
alliu
m (
Tl)
-To
tal
(mg
/L)
Tin
(S
n)-
To
tal (m
g/L
)
Tit
an
ium
(T
i)-T
ota
l
(mg
/L)
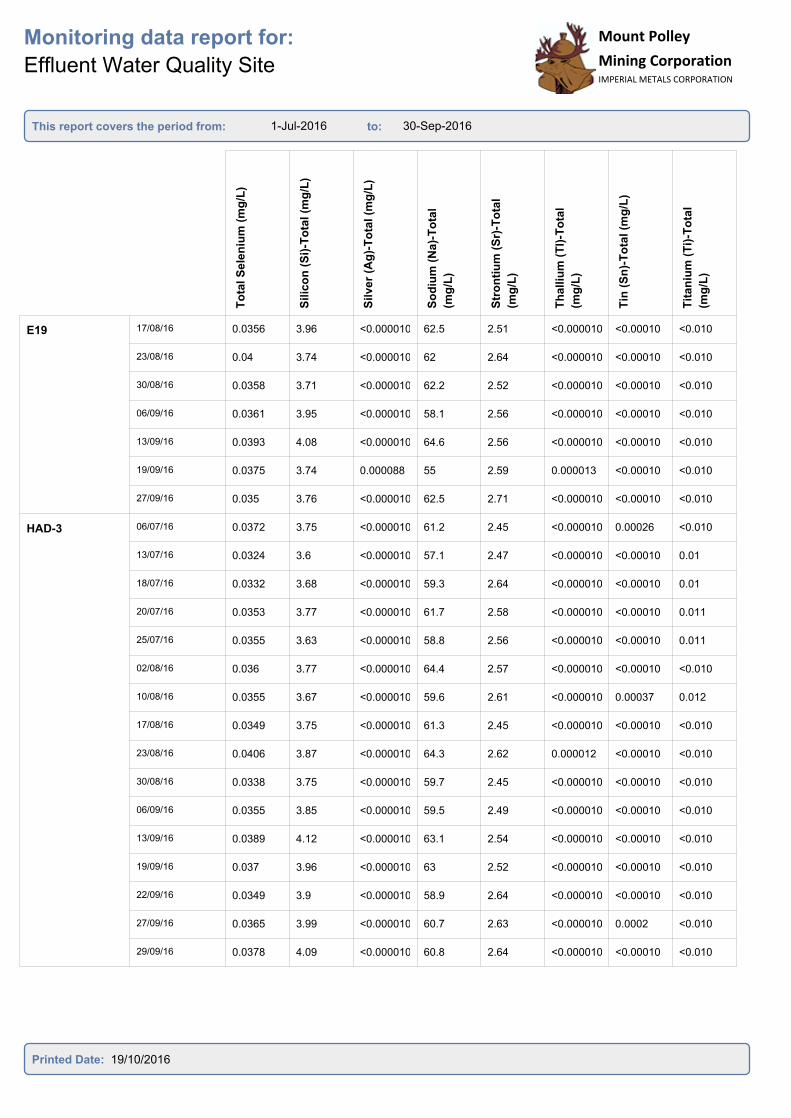
E19 17/08/16 0.0356 3.96 <0.000010 62.5 2.51 <0.000010 <0.00010 <0.010
23/08/16 0.04 3.74 <0.000010 62 2.64 <0.000010 <0.00010 <0.010
30/08/16 0.0358 3.71 <0.000010 62.2 2.52 <0.000010 <0.00010 <0.010
06/09/16 0.0361 3.95 <0.000010 58.1 2.56 <0.000010 <0.00010 <0.010
13/09/16 0.0393 4.08 <0.000010 64.6 2.56 <0.000010 <0.00010 <0.010
19/09/16 0.0375 3.74 0.000088 55 2.59 0.000013 <0.00010 <0.010
27/09/16 0.035 3.76 <0.000010 62.5 2.71 <0.000010 <0.00010 <0.010
HAD-3 06/07/16 0.0372 3.75 <0.000010 61.2 2.45 <0.000010 0.00026 <0.010
13/07/16 0.0324 3.6 <0.000010 57.1 2.47 <0.000010 <0.00010 0.01
18/07/16 0.0332 3.68 <0.000010 59.3 2.64 <0.000010 <0.00010 0.01
20/07/16 0.0353 3.77 <0.000010 61.7 2.58 <0.000010 <0.00010 0.011
25/07/16 0.0355 3.63 <0.000010 58.8 2.56 <0.000010 <0.00010 0.011
02/08/16 0.036 3.77 <0.000010 64.4 2.57 <0.000010 <0.00010 <0.010
10/08/16 0.0355 3.67 <0.000010 59.6 2.61 <0.000010 0.00037 0.012
17/08/16 0.0349 3.75 <0.000010 61.3 2.45 <0.000010 <0.00010 <0.010
23/08/16 0.0406 3.87 <0.000010 64.3 2.62 0.000012 <0.00010 <0.010
30/08/16 0.0338 3.75 <0.000010 59.7 2.45 <0.000010 <0.00010 <0.010
06/09/16 0.0355 3.85 <0.000010 59.5 2.49 <0.000010 <0.00010 <0.010
13/09/16 0.0389 4.12 <0.000010 63.1 2.54 <0.000010 <0.00010 <0.010
19/09/16 0.037 3.96 <0.000010 63 2.52 <0.000010 <0.00010 <0.010
22/09/16 0.0349 3.9 <0.000010 58.9 2.64 <0.000010 <0.00010 <0.010
27/09/16 0.0365 3.99 <0.000010 60.7 2.63 <0.000010 0.0002 <0.010
29/09/16 0.0378 4.09 <0.000010 60.8 2.64 <0.000010 <0.00010 <0.010
Printed Date: 19/10/2016
1-Jul-2016 30-Sep-2016
Monitoring data report for:
Effluent Water Quality Site
This report covers the period from: to:
Mount Polley
Mining CorporationIMPERIAL METALS CORPORATION
Mount Polley
Mining CorporationIMPERIAL METALS CORPORATION
Ura
niu
m (
U)-
To
tal
(mg
/L)
Van
ad
ium
(V
)-T
ota
l
(mg
/L)
Zin
c (
Zn
)-T
ota
l (m
g/L
)
Dis
s-A
lum
inu
m (
Al)
(mg
/L)
Dis
s-A
nti
mo
ny
(S
b)
(mg
/L)
Dis
s-A
rsen
ic (
As
)
(mg
/L)
Dis
s-B
ari
um
(B
a)
(mg
/L)
Dis
s-B
ery
lliu
m (
Be)
(mg
/L)
E19 17/08/16 0.00121 0.00109 <0.0030 0.0256 0.00173 0.00093 0.0662 <0.00010
23/08/16 0.00122 0.00113 <0.0030 0.0233 0.00176 0.00089 0.0687 <0.00010
30/08/16 0.00126 0.00103 <0.0030 0.024 0.00176 0.00083 0.0635 <0.00010
06/09/16 0.00128 0.00099 <0.0030 0.0237 0.00175 0.00095 0.0669 <0.00010
13/09/16 0.00124 0.00112 <0.0030 0.0222 0.00174 0.00081 0.0604 <0.00010
19/09/16 0.00124 0.00108 <0.0030 0.0213 0.00183 0.0009 0.0647 <0.00010
27/09/16 0.00134 0.00114 <0.0030 0.0219 0.00169 0.00087 0.0668 <0.00010
HAD-3 06/07/16 0.00117 0.00103 <0.0030 0.0259 0.00172 0.00081 0.0651 <0.00010
13/07/16 0.00118 0.00101 <0.0030 0.0253 0.00151 0.00073 0.0594 <0.00010
18/07/16 0.00118 0.00104 <0.0030 0.0258 0.00164 0.00082 0.0639 <0.00010
20/07/16 0.0013 0.00108 <0.0030 0.0266 0.00178 0.00084 0.0644 <0.00010
25/07/16 0.00121 0.00101 0.0035 0.0249 0.00176 0.00082 0.0639 <0.00010
02/08/16 0.00117 0.0011 <0.0030 0.0246 0.00168 0.00082 0.0641 <0.00010
10/08/16 0.00125 0.00097 <0.0030 0.0291 0.00174 0.00087 0.0645 <0.00010
17/08/16 0.00119 0.00108 <0.0030 0.0267 0.00171 0.00094 0.0661 <0.00010
23/08/16 0.00122 0.00117 <0.0030 0.0223 0.00173 0.00095 0.07 <0.00010
30/08/16 0.00123 0.00106 0.0041 0.0262 0.00177 0.00087 0.0664 <0.00010
06/09/16 0.00125 0.00102 <0.0030 0.0233 0.00172 0.00089 0.0636 <0.00010
13/09/16 0.00124 0.00109 <0.0030 0.0228 0.00174 0.00083 0.0646 <0.00010
19/09/16 0.00123 0.00128 <0.0030 0.0257 0.00164 0.00092 0.0642 <0.00010
22/09/16 0.00125 0.00121 <0.0030 0.0207 0.00169 0.00078 0.063 <0.00010
27/09/16 0.00115 0.00111 0.0056 0.0197 0.00166 0.00081 0.0624 <0.00010
29/09/16 0.00119 0.00132 <0.0030 0.0221 0.0016 0.00088 0.0659 <0.00010
Printed Date: 19/10/2016
1-Jul-2016 30-Sep-2016
Monitoring data report for:
Effluent Water Quality Site
This report covers the period from: to:
Mount Polley
Mining CorporationIMPERIAL METALS CORPORATION
Mount Polley
Mining CorporationIMPERIAL METALS CORPORATION
Dis
s-B
ism
uth
(B
i)
(mg
/L)
Dis
s-B
oro
n (
B)
(mg
/L)
Dis
s-C
ad
miu
m (
Cd
)
(mg
/L)
Dis
s-C
alc
ium
(C
a)
(mg
/L)
Dis
s-C
hro
miu
m (
Cr)
(mg
/L)
Dis
s-C
ob
alt
(C
o)
(mg
/L)
Dis
s-C
op
pe
r (C
u)
(mg
/L)
Dis
s-I
ron
(F
e)
(mg
/L)
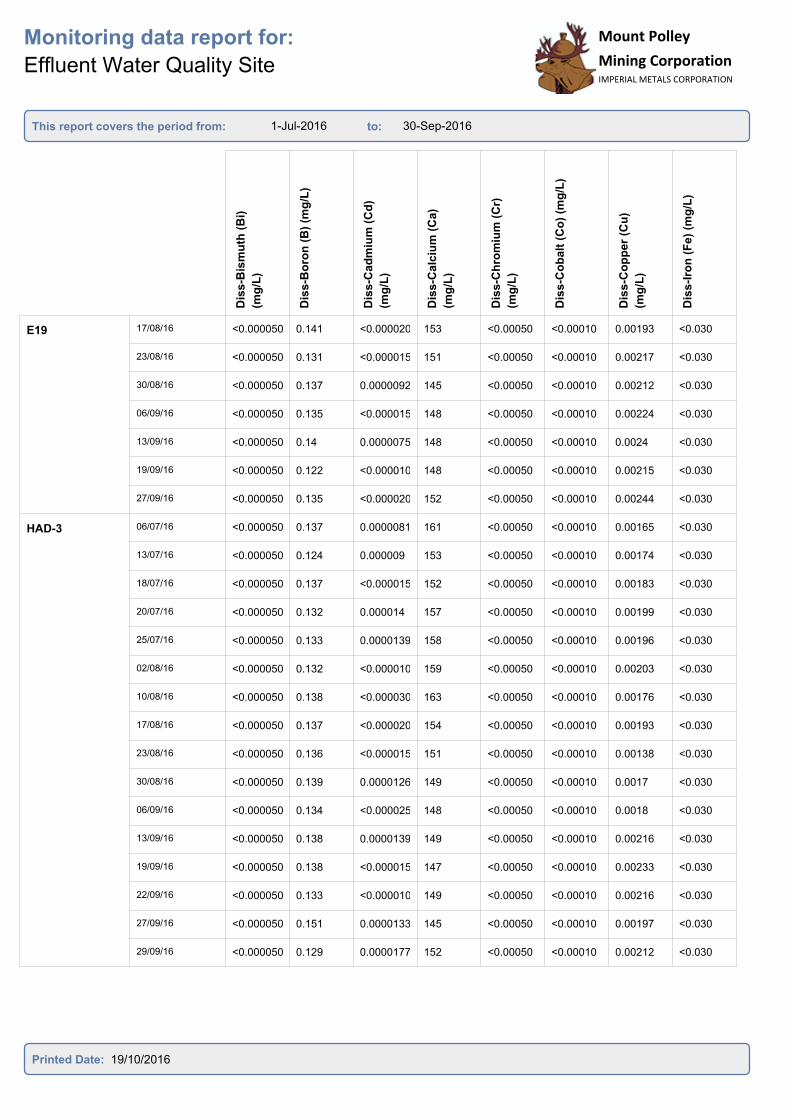
E19 17/08/16 <0.000050 0.141 <0.000020 153 <0.00050 <0.00010 0.00193 <0.030
23/08/16 <0.000050 0.131 <0.000015 151 <0.00050 <0.00010 0.00217 <0.030
30/08/16 <0.000050 0.137 0.0000092 145 <0.00050 <0.00010 0.00212 <0.030
06/09/16 <0.000050 0.135 <0.000015 148 <0.00050 <0.00010 0.00224 <0.030
13/09/16 <0.000050 0.14 0.0000075 148 <0.00050 <0.00010 0.0024 <0.030
19/09/16 <0.000050 0.122 <0.000010 148 <0.00050 <0.00010 0.00215 <0.030
27/09/16 <0.000050 0.135 <0.000020 152 <0.00050 <0.00010 0.00244 <0.030
HAD-3 06/07/16 <0.000050 0.137 0.0000081 161 <0.00050 <0.00010 0.00165 <0.030
13/07/16 <0.000050 0.124 0.000009 153 <0.00050 <0.00010 0.00174 <0.030
18/07/16 <0.000050 0.137 <0.000015 152 <0.00050 <0.00010 0.00183 <0.030
20/07/16 <0.000050 0.132 0.000014 157 <0.00050 <0.00010 0.00199 <0.030
25/07/16 <0.000050 0.133 0.0000139 158 <0.00050 <0.00010 0.00196 <0.030
02/08/16 <0.000050 0.132 <0.000010 159 <0.00050 <0.00010 0.00203 <0.030
10/08/16 <0.000050 0.138 <0.000030 163 <0.00050 <0.00010 0.00176 <0.030
17/08/16 <0.000050 0.137 <0.000020 154 <0.00050 <0.00010 0.00193 <0.030
23/08/16 <0.000050 0.136 <0.000015 151 <0.00050 <0.00010 0.00138 <0.030
30/08/16 <0.000050 0.139 0.0000126 149 <0.00050 <0.00010 0.0017 <0.030
06/09/16 <0.000050 0.134 <0.000025 148 <0.00050 <0.00010 0.0018 <0.030
13/09/16 <0.000050 0.138 0.0000139 149 <0.00050 <0.00010 0.00216 <0.030
19/09/16 <0.000050 0.138 <0.000015 147 <0.00050 <0.00010 0.00233 <0.030
22/09/16 <0.000050 0.133 <0.000010 149 <0.00050 <0.00010 0.00216 <0.030
27/09/16 <0.000050 0.151 0.0000133 145 <0.00050 <0.00010 0.00197 <0.030
29/09/16 <0.000050 0.129 0.0000177 152 <0.00050 <0.00010 0.00212 <0.030
Printed Date: 19/10/2016

1-Jul-2016 30-Sep-2016
Monitoring data report for:
Effluent Water Quality Site
This report covers the period from: to:
Mount Polley
Mining CorporationIMPERIAL METALS CORPORATION
Mount Polley
Mining CorporationIMPERIAL METALS CORPORATION
Dis
s-L
ead
(P
b)
(mg
/L)
Dis
s-L
ith
ium
(L
i) (
mg
/L)
Dis
s-M
ag
nesiu
m (
Mg
)
(mg
/L)
Dis
s-M
an
gan
ese
(M
n)
(mg
/L)
Dis
s-M
oly
bd
en
um
(M
o)
(mg
/L)
Dis
s-N
ickel (N
i) (
mg
/L)
Dis
s-P
ota
ssiu
m (
K)
(mg
/L)
Dis
s-S
ele
niu
m (
mg
/L)
E19 17/08/16 <0.000050 0.0179 30.3 0.00886 0.161 0.00062 18.5 0.037
23/08/16 <0.000050 0.0137 30.6 0.011 0.168 0.00052 17.8 0.0396
30/08/16 <0.000050 0.0166 26.2 0.0142 0.168 <0.00050 16.6 0.0357
06/09/16 <0.000050 0.016 30.5 0.0171 0.164 0.00057 17.4 0.0378
13/09/16 <0.000050 0.016 26.8 0.015 0.167 <0.00050 16.1 0.0368
19/09/16 <0.000050 0.016 27.9 0.0132 0.169 <0.00050 16.8 0.0373
27/09/16 <0.000050 0.0159 29.7 0.0083 0.177 0.00063 15.6 0.0346
HAD-3 06/07/16 <0.000050 0.0175 31.1 0.0165 0.163 0.00063 17 0.0361
13/07/16 <0.000050 0.0163 28.5 0.0173 0.16 <0.00050 15.5 0.032
18/07/16 <0.000050 0.0163 30.1 0.0141 0.164 0.00055 17 0.0325
20/07/16 <0.000050 0.0152 29.6 0.0145 0.167 0.00052 16.7 0.0334
25/07/16 <0.000050 0.0167 29.8 0.0144 0.164 0.00063 16.6 0.0377
02/08/16 <0.000050 0.0156 31.7 0.0145 0.16 0.0006 17.2 0.0361
10/08/16 <0.000050 0.0170 29.7 0.00887 0.182 0.00060 16.6 0.0355
17/08/16 <0.000050 0.0173 30.9 0.00909 0.162 0.0006 18.3 0.0373
23/08/16 <0.000050 0.0151 31.1 <0.00010 0.171 0.00053 18.3 0.039
30/08/16 <0.000050 0.0169 26.8 0.00428 0.169 <0.00050 16.6 0.0327
06/09/16 <0.000050 0.0159 29.1 0.0093 0.17 0.00053 16.8 0.035
13/09/16 <0.000050 0.0162 27.3 0.0153 0.169 0.00054 16.7 0.0375
19/09/16 <0.000050 0.0169 32.3 0.0153 0.182 0.00059 17.3 0.0371
22/09/16 <0.000050 0.0175 27.1 0.00807 0.175 <0.00050 16.3 0.033
27/09/16 <0.000050 0.0148 28 0.00406 0.175 <0.00050 15.6 0.0311
29/09/16 <0.000050 0.0169 31.1 0.0106 0.181 0.00112 18 0.0346
Printed Date: 19/10/2016

1-Jul-2016 30-Sep-2016
Monitoring data report for:
Effluent Water Quality Site
This report covers the period from: to:
Mount Polley
Mining CorporationIMPERIAL METALS CORPORATION
Mount Polley
Mining CorporationIMPERIAL METALS CORPORATION
Dis
s-S
ilic
on
(S
i) (
mg
/L)
Dis
s-S
ilv
er
(Ag
) (m
g/L
)
Dis
s-S
od
ium
(N
a)
(mg
/L)
Dis
s-S
tro
nti
um
(S
r)
(mg
/L)
Dis
s-T
halliu
m (
Tl)
(mg
/L)
Dis
s-T
in (
Sn
) (m
g/L
)
Dis
s-T
itan
ium
(T
i)
(mg
/L)
Dis
s-U
ran
ium
(U
)
(mg
/L)
E19 17/08/16 3.88 <0.000010 61.9 2.48 <0.000010 <0.00010 <0.010 0.00117
23/08/16 3.6 <0.000010 60.3 2.55 <0.000010 <0.00010 <0.010 0.00116
30/08/16 3.63 <0.000010 59.5 2.52 <0.000010 <0.00010 <0.010 0.00121
06/09/16 3.89 <0.000010 61.4 2.46 <0.000010 <0.00010 <0.010 0.0012
13/09/16 3.63 <0.000010 58.1 2.43 <0.000010 <0.00010 <0.010 0.00118
19/09/16 3.53 <0.000010 53.6 2.54 <0.000010 <0.00010 <0.010 0.00119
27/09/16 3.81 <0.000010 60.4 2.59 <0.000010 <0.00010 <0.010 0.00128
HAD-3 06/07/16 3.77 <0.000010 57.8 2.48 <0.000010 <0.00010 <0.010 0.00117
13/07/16 3.5 <0.000010 53.9 2.37 <0.000010 <0.00010 <0.010 0.00113
18/07/16 3.57 <0.000010 57.3 2.49 <0.000010 <0.00010 <0.010 0.00113
20/07/16 3.64 <0.000010 59.7 2.53 <0.000010 <0.00010 <0.010 0.00126
25/07/16 3.65 <0.000010 57.7 2.54 <0.000010 <0.00010 0.011 0.00117
02/08/16 3.65 <0.000010 60.4 2.51 <0.000010 <0.00010 <0.010 0.00114
10/08/16 3.59 <0.000010 58.0 2.62 <0.000010 <0.00010 0.012 0.00124
17/08/16 3.84 <0.000010 63 2.5 <0.000010 <0.00010 <0.010 0.00117
23/08/16 3.67 <0.000010 62.2 2.53 <0.000010 <0.00010 <0.010 0.00117
30/08/16 3.67 <0.000010 58 2.5 <0.000010 <0.00010 <0.010 0.00122
06/09/16 3.78 <0.000010 59.2 2.49 <0.000010 <0.00010 <0.010 0.00123
13/09/16 3.78 <0.000010 59 2.44 <0.000010 <0.00010 <0.010 0.00116
19/09/16 3.88 <0.000010 65.2 2.63 <0.000010 <0.00010 <0.010 0.00114
22/09/16 3.53 <0.000010 53.8 2.55 <0.000010 <0.00010 <0.010 0.00122
27/09/16 3.73 <0.000010 56.4 2.45 <0.000010 <0.00010 <0.010 0.00125
29/09/16 3.8 <0.000010 60.7 2.61 <0.000010 <0.00010 <0.010 0.00117
Printed Date: 19/10/2016

1-Jul-2016 30-Sep-2016
Monitoring data report for:
Effluent Water Quality Site
This report covers the period from: to:
Mount Polley
Mining CorporationIMPERIAL METALS CORPORATION
Mount Polley
Mining CorporationIMPERIAL METALS CORPORATION
Dis
s-V
an
ad
ium
(V
)
(mg
/L)
Dis
s-Z
inc (
Zn
) (m
g/L
)
E19 17/08/16 0.00094 <0.0030
23/08/16 0.00092 <0.0030
30/08/16 0.00095 <0.0030
06/09/16 0.00097 <0.0030
13/09/16 0.00091 <0.0030
19/09/16 0.0009 <0.0030
27/09/16 0.00086 <0.0030
HAD-3 06/07/16 0.00084 <0.0030
13/07/16 0.00084 <0.0030
18/07/16 0.00081 <0.0030
20/07/16 0.00091 <0.0030
25/07/16 0.00086 0.0033
02/08/16 0.00093 <0.0030
10/08/16 0.00088 <0.0030
17/08/16 0.00096 <0.0030
23/08/16 0.00093 <0.0030
30/08/16 0.00089 <0.0030
06/09/16 0.00092 <0.0030
13/09/16 0.00097 <0.0030
19/09/16 0.001 <0.0030
22/09/16 0.00081 <0.0030
27/09/16 0.00072 <0.0030
29/09/16 0.00085 <0.0030
Printed Date: 19/10/2016

1-Jul-2016 30-Sep-2016
Monitoring data report for:
Hazeltine Creek
This report covers the period from: to:
Mount Polley
Mining CorporationIMPERIAL METALS CORPORATION
Co
nd
ucti
vit
y (
µs/c
m)
Hard
nes
s (
mg
/L)
pH
(p
H)
TD
S (
mg
/L)
TS
S (
mg
/L)
NT
U (
ntu
)
Alk
alin
ity
(C
aC
O3)
(mg
/L)
Am
mo
nia
(a
s N
) (m
g/L
)
HAC-05a 06/07/16 985 429 8.07 734 6.9 4.08 65.3 0.0813
02/08/16 1120 501 8.06 849 1.8 0.81 58.7 0.0757
06/09/16 1130 459 7.88 889 15.9 9.81 57.3 0.107
HAC-08 06/07/16 958 421 8.1 698 12 3.61 71.4 0.0326
02/08/16 1010 437 8.09 744 7.3 1.58 70.5 0.0221
06/09/16 1020 414 8.05 783 8.7 1.8 71 0.0479
HAC-10 06/07/16 275 133 8.16 193 1.2 0.98 94.1 <0.0050
02/08/16 272 129 8.31 185 7 3.33 93.9 0.0123
06/09/16 274 121 8.23 197 1.6 1.35 97.2 <0.0050
HAC-12 06/07/16 950 417 8.03 723 4.2 3.03 76.5 0.0342
13/07/16 1010 436 7.98 761 20.6 14.8 80.6 0.0447
18/07/16 940 404 8.09 680 5.4 4.92 79.8 0.02
25/07/16 930 396 8.02 690 5 4.05 81 0.0135
02/08/16 900 382 8.04 650 <1.0 0.98 79.2 0.0134
10/08/16 928 399 8.07 690 3.3 2.03 81.3 0.0136
17/08/16 958 401 8.03 658 2.8 1.95 81.8 0.0188
23/08/16 914 381 8.08 710 2.6 1.44 82.8 0.0259
30/08/16 948 376 8.06 687 1.1 0.82 79.1 0.0397
06/09/16 886 364 7.92 676 3.1 1.36 78 0.0398
13/09/16 1060 427 8.03 808 2.1 1.54 75.3 0.0381
19/09/16 925 392 8.02 737 24.4 30.3 88.9 0.0328
27/09/16 914 405 8.1 687 4.2 2.7 85.7 0.0113
HAC-13 - HAC
U/S
06/07/16 325 155 8.22 224 18.3 19.7 103 0.0054
Printed Date: 19/10/2016
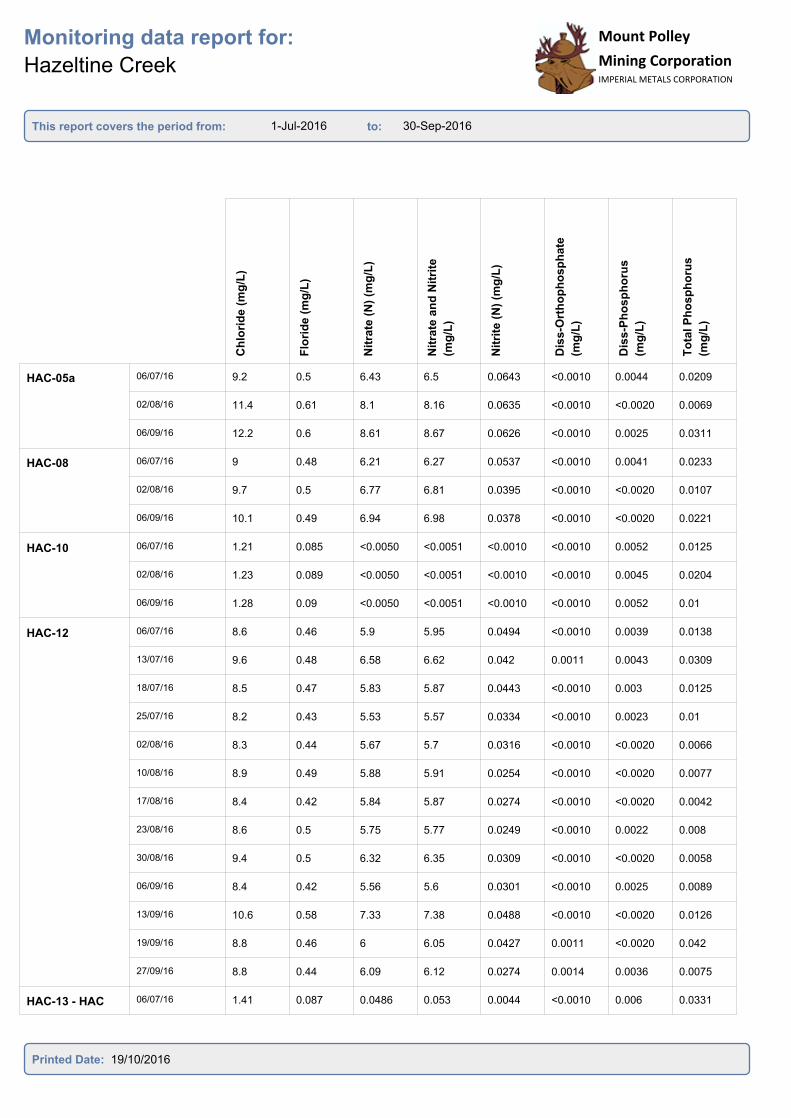
1-Jul-2016 30-Sep-2016
Monitoring data report for:
Hazeltine Creek
This report covers the period from: to:
Mount Polley
Mining CorporationIMPERIAL METALS CORPORATION
Mount Polley
Mining CorporationIMPERIAL METALS CORPORATION
Ch
lori
de (
mg
/L)
Flo
rid
e (
mg
/L)
Nit
rate
(N
) (m
g/L
)
Nit
rate
an
d N
itri
te
(mg
/L)
Nit
rite
(N
) (m
g/L
)
Dis
s-O
rth
op
ho
sp
hate
(mg
/L)
Dis
s-P
ho
sp
ho
rus
(mg
/L)
To
tal P
ho
sp
ho
rus
(mg
/L)
HAC-05a 06/07/16 9.2 0.5 6.43 6.5 0.0643 <0.0010 0.0044 0.0209
02/08/16 11.4 0.61 8.1 8.16 0.0635 <0.0010 <0.0020 0.0069
06/09/16 12.2 0.6 8.61 8.67 0.0626 <0.0010 0.0025 0.0311
HAC-08 06/07/16 9 0.48 6.21 6.27 0.0537 <0.0010 0.0041 0.0233
02/08/16 9.7 0.5 6.77 6.81 0.0395 <0.0010 <0.0020 0.0107
06/09/16 10.1 0.49 6.94 6.98 0.0378 <0.0010 <0.0020 0.0221
HAC-10 06/07/16 1.21 0.085 <0.0050 <0.0051 <0.0010 <0.0010 0.0052 0.0125
02/08/16 1.23 0.089 <0.0050 <0.0051 <0.0010 <0.0010 0.0045 0.0204
06/09/16 1.28 0.09 <0.0050 <0.0051 <0.0010 <0.0010 0.0052 0.01
HAC-12 06/07/16 8.6 0.46 5.9 5.95 0.0494 <0.0010 0.0039 0.0138
13/07/16 9.6 0.48 6.58 6.62 0.042 0.0011 0.0043 0.0309
18/07/16 8.5 0.47 5.83 5.87 0.0443 <0.0010 0.003 0.0125
25/07/16 8.2 0.43 5.53 5.57 0.0334 <0.0010 0.0023 0.01
02/08/16 8.3 0.44 5.67 5.7 0.0316 <0.0010 <0.0020 0.0066
10/08/16 8.9 0.49 5.88 5.91 0.0254 <0.0010 <0.0020 0.0077
17/08/16 8.4 0.42 5.84 5.87 0.0274 <0.0010 <0.0020 0.0042
23/08/16 8.6 0.5 5.75 5.77 0.0249 <0.0010 0.0022 0.008
30/08/16 9.4 0.5 6.32 6.35 0.0309 <0.0010 <0.0020 0.0058
06/09/16 8.4 0.42 5.56 5.6 0.0301 <0.0010 0.0025 0.0089
13/09/16 10.6 0.58 7.33 7.38 0.0488 <0.0010 <0.0020 0.0126
19/09/16 8.8 0.46 6 6.05 0.0427 0.0011 <0.0020 0.042
27/09/16 8.8 0.44 6.09 6.12 0.0274 0.0014 0.0036 0.0075
HAC-13 - HAC
U/S
06/07/16 1.41 0.087 0.0486 0.053 0.0044 <0.0010 0.006 0.0331
Printed Date: 19/10/2016
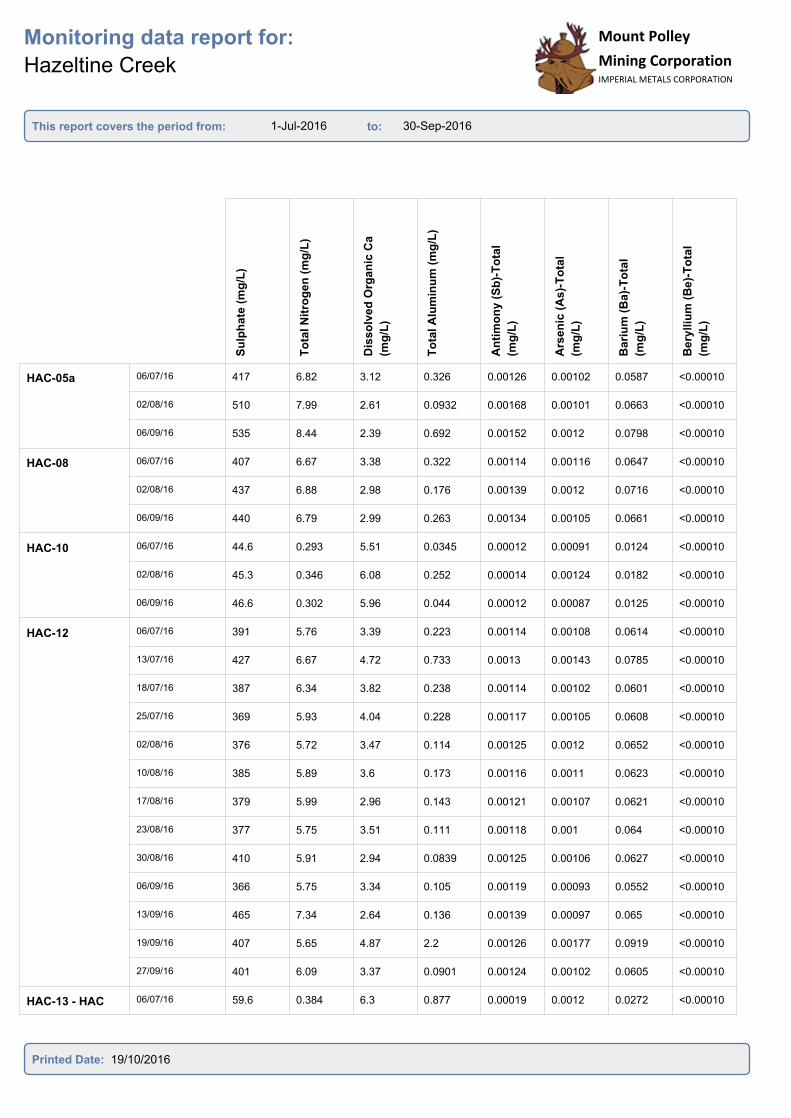
1-Jul-2016 30-Sep-2016
Monitoring data report for:
Hazeltine Creek
This report covers the period from: to:
Mount Polley
Mining CorporationIMPERIAL METALS CORPORATION
Mount Polley
Mining CorporationIMPERIAL METALS CORPORATION
Su
lph
ate
(m
g/L
)
To
tal N
itro
ge
n (
mg
/L)
Dis
so
lved
Org
an
ic C
a
(mg
/L)
To
tal A
lum
inu
m (
mg
/L)
An
tim
on
y (
Sb
)-T
ota
l
(mg
/L)
Ars
en
ic (
As)-
To
tal
(mg
/L)
Bari
um
(B
a)-
To
tal
(mg
/L)
Bery
lliu
m (
Be)-
To
tal
(mg
/L)
HAC-05a 06/07/16 417 6.82 3.12 0.326 0.00126 0.00102 0.0587 <0.00010
02/08/16 510 7.99 2.61 0.0932 0.00168 0.00101 0.0663 <0.00010
06/09/16 535 8.44 2.39 0.692 0.00152 0.0012 0.0798 <0.00010
HAC-08 06/07/16 407 6.67 3.38 0.322 0.00114 0.00116 0.0647 <0.00010
02/08/16 437 6.88 2.98 0.176 0.00139 0.0012 0.0716 <0.00010
06/09/16 440 6.79 2.99 0.263 0.00134 0.00105 0.0661 <0.00010
HAC-10 06/07/16 44.6 0.293 5.51 0.0345 0.00012 0.00091 0.0124 <0.00010
02/08/16 45.3 0.346 6.08 0.252 0.00014 0.00124 0.0182 <0.00010
06/09/16 46.6 0.302 5.96 0.044 0.00012 0.00087 0.0125 <0.00010
HAC-12 06/07/16 391 5.76 3.39 0.223 0.00114 0.00108 0.0614 <0.00010
13/07/16 427 6.67 4.72 0.733 0.0013 0.00143 0.0785 <0.00010
18/07/16 387 6.34 3.82 0.238 0.00114 0.00102 0.0601 <0.00010
25/07/16 369 5.93 4.04 0.228 0.00117 0.00105 0.0608 <0.00010
02/08/16 376 5.72 3.47 0.114 0.00125 0.0012 0.0652 <0.00010
10/08/16 385 5.89 3.6 0.173 0.00116 0.0011 0.0623 <0.00010
17/08/16 379 5.99 2.96 0.143 0.00121 0.00107 0.0621 <0.00010
23/08/16 377 5.75 3.51 0.111 0.00118 0.001 0.064 <0.00010
30/08/16 410 5.91 2.94 0.0839 0.00125 0.00106 0.0627 <0.00010
06/09/16 366 5.75 3.34 0.105 0.00119 0.00093 0.0552 <0.00010
13/09/16 465 7.34 2.64 0.136 0.00139 0.00097 0.065 <0.00010
19/09/16 407 5.65 4.87 2.2 0.00126 0.00177 0.0919 <0.00010
27/09/16 401 6.09 3.37 0.0901 0.00124 0.00102 0.0605 <0.00010
HAC-13 - HAC
U/S
06/07/16 59.6 0.384 6.3 0.877 0.00019 0.0012 0.0272 <0.00010
Printed Date: 19/10/2016
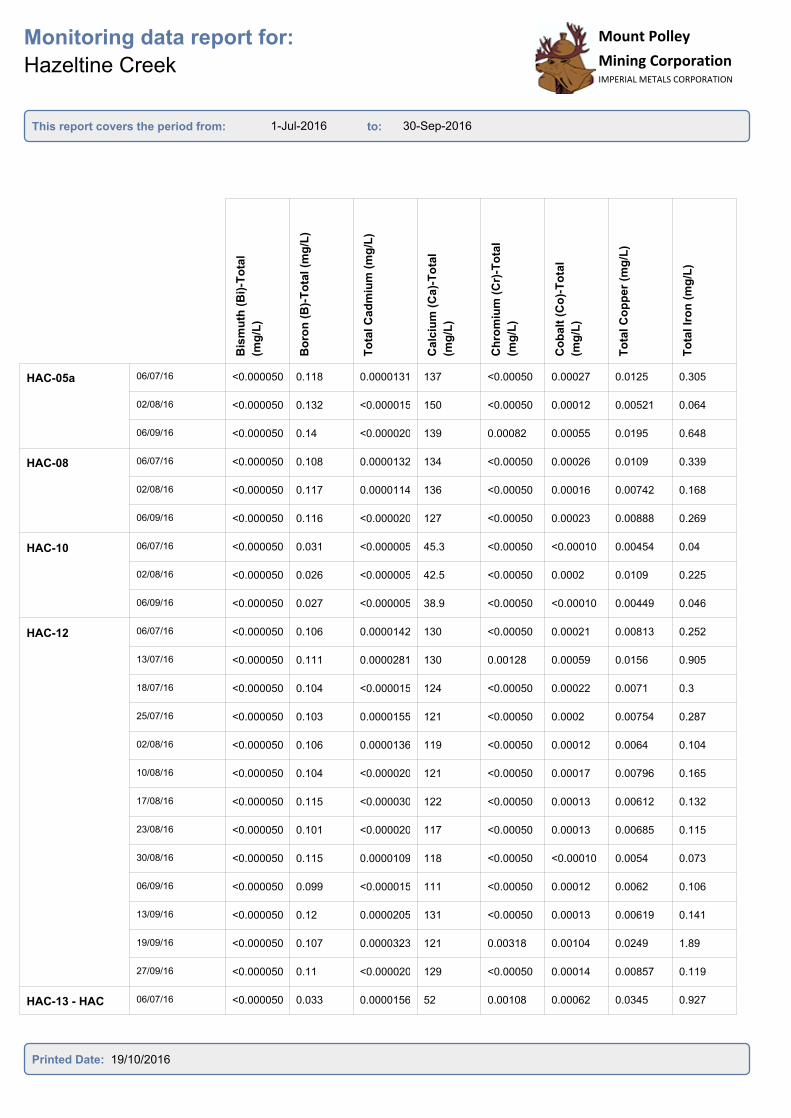
1-Jul-2016 30-Sep-2016
Monitoring data report for:
Hazeltine Creek
This report covers the period from: to:
Mount Polley
Mining CorporationIMPERIAL METALS CORPORATION
Mount Polley
Mining CorporationIMPERIAL METALS CORPORATION
Bis
mu
th (
Bi)
-To
tal
(mg
/L)
Bo
ron
(B
)-T
ota
l (m
g/L
)
To
tal C
ad
miu
m (
mg
/L)
Calc
ium
(C
a)-
To
tal
(mg
/L)
Ch
rom
ium
(C
r)-T
ota
l
(mg
/L)
Co
balt
(C
o)-
To
tal
(mg
/L)
To
tal C
op
per
(mg
/L)
To
tal Ir
on
(m
g/L
)
HAC-05a 06/07/16 <0.000050 0.118 0.0000131 137 <0.00050 0.00027 0.0125 0.305
02/08/16 <0.000050 0.132 <0.000015 150 <0.00050 0.00012 0.00521 0.064
06/09/16 <0.000050 0.14 <0.000020 139 0.00082 0.00055 0.0195 0.648
HAC-08 06/07/16 <0.000050 0.108 0.0000132 134 <0.00050 0.00026 0.0109 0.339
02/08/16 <0.000050 0.117 0.0000114 136 <0.00050 0.00016 0.00742 0.168
06/09/16 <0.000050 0.116 <0.000020 127 <0.00050 0.00023 0.00888 0.269
HAC-10 06/07/16 <0.000050 0.031 <0.000005 45.3 <0.00050 <0.00010 0.00454 0.04
02/08/16 <0.000050 0.026 <0.000005 42.5 <0.00050 0.0002 0.0109 0.225
06/09/16 <0.000050 0.027 <0.000005 38.9 <0.00050 <0.00010 0.00449 0.046
HAC-12 06/07/16 <0.000050 0.106 0.0000142 130 <0.00050 0.00021 0.00813 0.252
13/07/16 <0.000050 0.111 0.0000281 130 0.00128 0.00059 0.0156 0.905
18/07/16 <0.000050 0.104 <0.000015 124 <0.00050 0.00022 0.0071 0.3
25/07/16 <0.000050 0.103 0.0000155 121 <0.00050 0.0002 0.00754 0.287
02/08/16 <0.000050 0.106 0.0000136 119 <0.00050 0.00012 0.0064 0.104
10/08/16 <0.000050 0.104 <0.000020 121 <0.00050 0.00017 0.00796 0.165
17/08/16 <0.000050 0.115 <0.000030 122 <0.00050 0.00013 0.00612 0.132
23/08/16 <0.000050 0.101 <0.000020 117 <0.00050 0.00013 0.00685 0.115
30/08/16 <0.000050 0.115 0.0000109 118 <0.00050 <0.00010 0.0054 0.073
06/09/16 <0.000050 0.099 <0.000015 111 <0.00050 0.00012 0.0062 0.106
13/09/16 <0.000050 0.12 0.0000205 131 <0.00050 0.00013 0.00619 0.141
19/09/16 <0.000050 0.107 0.0000323 121 0.00318 0.00104 0.0249 1.89
27/09/16 <0.000050 0.11 <0.000020 129 <0.00050 0.00014 0.00857 0.119
HAC-13 - HAC
U/S
06/07/16 <0.000050 0.033 0.0000156 52 0.00108 0.00062 0.0345 0.927
Printed Date: 19/10/2016
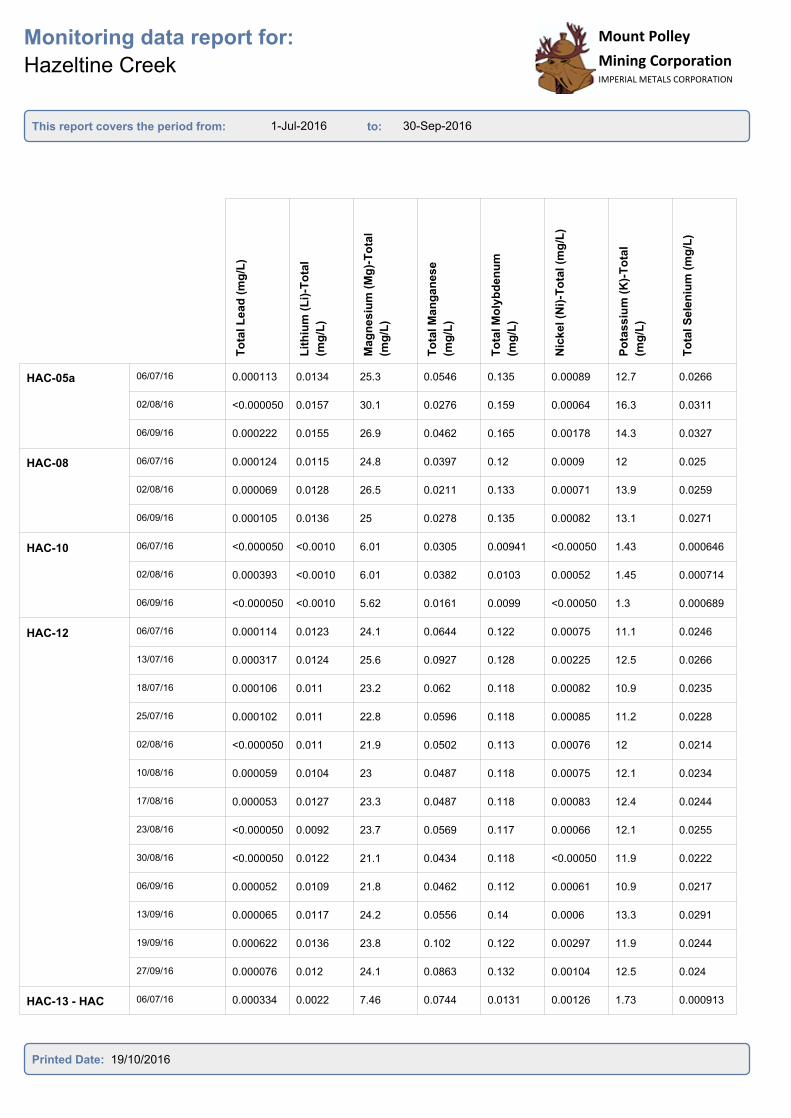
1-Jul-2016 30-Sep-2016
Monitoring data report for:
Hazeltine Creek
This report covers the period from: to:
Mount Polley
Mining CorporationIMPERIAL METALS CORPORATION
Mount Polley
Mining CorporationIMPERIAL METALS CORPORATION
To
tal L
ea
d (
mg
/L)
Lit
hiu
m (
Li)
-To
tal
(mg
/L)
Mag
nes
ium
(M
g)-
To
tal
(mg
/L)
To
tal M
an
ga
nese
(mg
/L)
To
tal M
oly
bd
en
um
(mg
/L)
Nic
ke
l (N
i)-T
ota
l (m
g/L
)
Po
tas
siu
m (
K)-
To
tal
(mg
/L)
To
tal S
ele
niu
m (
mg
/L)
HAC-05a 06/07/16 0.000113 0.0134 25.3 0.0546 0.135 0.00089 12.7 0.0266
02/08/16 <0.000050 0.0157 30.1 0.0276 0.159 0.00064 16.3 0.0311
06/09/16 0.000222 0.0155 26.9 0.0462 0.165 0.00178 14.3 0.0327
HAC-08 06/07/16 0.000124 0.0115 24.8 0.0397 0.12 0.0009 12 0.025
02/08/16 0.000069 0.0128 26.5 0.0211 0.133 0.00071 13.9 0.0259
06/09/16 0.000105 0.0136 25 0.0278 0.135 0.00082 13.1 0.0271
HAC-10 06/07/16 <0.000050 <0.0010 6.01 0.0305 0.00941 <0.00050 1.43 0.000646
02/08/16 0.000393 <0.0010 6.01 0.0382 0.0103 0.00052 1.45 0.000714
06/09/16 <0.000050 <0.0010 5.62 0.0161 0.0099 <0.00050 1.3 0.000689
HAC-12 06/07/16 0.000114 0.0123 24.1 0.0644 0.122 0.00075 11.1 0.0246
13/07/16 0.000317 0.0124 25.6 0.0927 0.128 0.00225 12.5 0.0266
18/07/16 0.000106 0.011 23.2 0.062 0.118 0.00082 10.9 0.0235
25/07/16 0.000102 0.011 22.8 0.0596 0.118 0.00085 11.2 0.0228
02/08/16 <0.000050 0.011 21.9 0.0502 0.113 0.00076 12 0.0214
10/08/16 0.000059 0.0104 23 0.0487 0.118 0.00075 12.1 0.0234
17/08/16 0.000053 0.0127 23.3 0.0487 0.118 0.00083 12.4 0.0244
23/08/16 <0.000050 0.0092 23.7 0.0569 0.117 0.00066 12.1 0.0255
30/08/16 <0.000050 0.0122 21.1 0.0434 0.118 <0.00050 11.9 0.0222
06/09/16 0.000052 0.0109 21.8 0.0462 0.112 0.00061 10.9 0.0217
13/09/16 0.000065 0.0117 24.2 0.0556 0.14 0.0006 13.3 0.0291
19/09/16 0.000622 0.0136 23.8 0.102 0.122 0.00297 11.9 0.0244
27/09/16 0.000076 0.012 24.1 0.0863 0.132 0.00104 12.5 0.024
HAC-13 - HAC
U/S
06/07/16 0.000334 0.0022 7.46 0.0744 0.0131 0.00126 1.73 0.000913
Printed Date: 19/10/2016
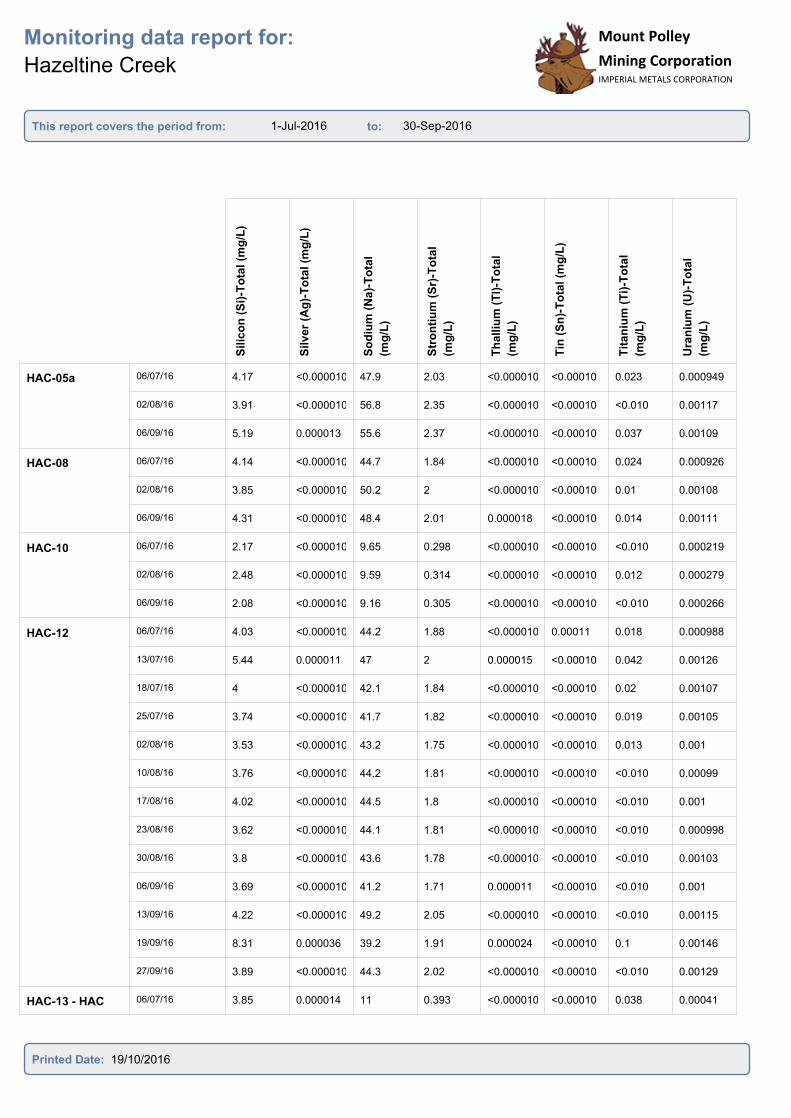
1-Jul-2016 30-Sep-2016
Monitoring data report for:
Hazeltine Creek
This report covers the period from: to:
Mount Polley
Mining CorporationIMPERIAL METALS CORPORATION
Mount Polley
Mining CorporationIMPERIAL METALS CORPORATION
Silic
on
(S
i)-T
ota
l (m
g/L
)
Silve
r (A
g)-
To
tal (m
g/L
)
So
diu
m (
Na)-
To
tal
(mg
/L)
Str
on
tiu
m (
Sr)
-To
tal
(mg
/L)
Th
alliu
m (
Tl)
-To
tal
(mg
/L)
Tin
(S
n)-
To
tal (m
g/L
)
Tit
an
ium
(T
i)-T
ota
l
(mg
/L)
Ura
niu
m (
U)-
To
tal
(mg
/L)
HAC-05a 06/07/16 4.17 <0.000010 47.9 2.03 <0.000010 <0.00010 0.023 0.000949
02/08/16 3.91 <0.000010 56.8 2.35 <0.000010 <0.00010 <0.010 0.00117
06/09/16 5.19 0.000013 55.6 2.37 <0.000010 <0.00010 0.037 0.00109
HAC-08 06/07/16 4.14 <0.000010 44.7 1.84 <0.000010 <0.00010 0.024 0.000926
02/08/16 3.85 <0.000010 50.2 2 <0.000010 <0.00010 0.01 0.00108
06/09/16 4.31 <0.000010 48.4 2.01 0.000018 <0.00010 0.014 0.00111
HAC-10 06/07/16 2.17 <0.000010 9.65 0.298 <0.000010 <0.00010 <0.010 0.000219
02/08/16 2.48 <0.000010 9.59 0.314 <0.000010 <0.00010 0.012 0.000279
06/09/16 2.08 <0.000010 9.16 0.305 <0.000010 <0.00010 <0.010 0.000266
HAC-12 06/07/16 4.03 <0.000010 44.2 1.88 <0.000010 0.00011 0.018 0.000988
13/07/16 5.44 0.000011 47 2 0.000015 <0.00010 0.042 0.00126
18/07/16 4 <0.000010 42.1 1.84 <0.000010 <0.00010 0.02 0.00107
25/07/16 3.74 <0.000010 41.7 1.82 <0.000010 <0.00010 0.019 0.00105
02/08/16 3.53 <0.000010 43.2 1.75 <0.000010 <0.00010 0.013 0.001
10/08/16 3.76 <0.000010 44.2 1.81 <0.000010 <0.00010 <0.010 0.00099
17/08/16 4.02 <0.000010 44.5 1.8 <0.000010 <0.00010 <0.010 0.001
23/08/16 3.62 <0.000010 44.1 1.81 <0.000010 <0.00010 <0.010 0.000998
30/08/16 3.8 <0.000010 43.6 1.78 <0.000010 <0.00010 <0.010 0.00103
06/09/16 3.69 <0.000010 41.2 1.71 0.000011 <0.00010 <0.010 0.001
13/09/16 4.22 <0.000010 49.2 2.05 <0.000010 <0.00010 <0.010 0.00115
19/09/16 8.31 0.000036 39.2 1.91 0.000024 <0.00010 0.1 0.00146
27/09/16 3.89 <0.000010 44.3 2.02 <0.000010 <0.00010 <0.010 0.00129
HAC-13 - HAC
U/S
06/07/16 3.85 0.000014 11 0.393 <0.000010 <0.00010 0.038 0.00041
Printed Date: 19/10/2016
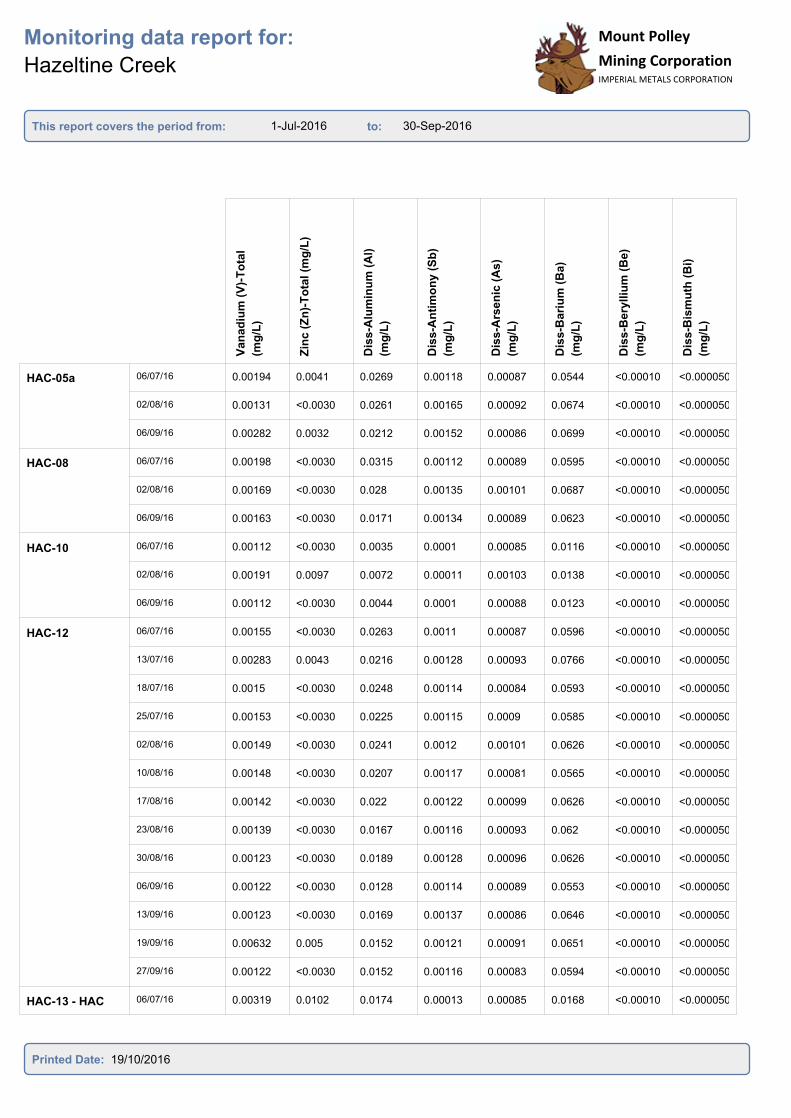
1-Jul-2016 30-Sep-2016
Monitoring data report for:
Hazeltine Creek
This report covers the period from: to:
Mount Polley
Mining CorporationIMPERIAL METALS CORPORATION
Mount Polley
Mining CorporationIMPERIAL METALS CORPORATION
Van
ad
ium
(V
)-T
ota
l
(mg
/L)
Zin
c (
Zn
)-T
ota
l (m
g/L
)
Dis
s-A
lum
inu
m (
Al)
(mg
/L)
Dis
s-A
nti
mo
ny
(S
b)
(mg
/L)
Dis
s-A
rsen
ic (
As
)
(mg
/L)
Dis
s-B
ari
um
(B
a)
(mg
/L)
Dis
s-B
ery
lliu
m (
Be)
(mg
/L)
Dis
s-B
ism
uth
(B
i)
(mg
/L)
HAC-05a 06/07/16 0.00194 0.0041 0.0269 0.00118 0.00087 0.0544 <0.00010 <0.000050
02/08/16 0.00131 <0.0030 0.0261 0.00165 0.00092 0.0674 <0.00010 <0.000050
06/09/16 0.00282 0.0032 0.0212 0.00152 0.00086 0.0699 <0.00010 <0.000050
HAC-08 06/07/16 0.00198 <0.0030 0.0315 0.00112 0.00089 0.0595 <0.00010 <0.000050
02/08/16 0.00169 <0.0030 0.028 0.00135 0.00101 0.0687 <0.00010 <0.000050
06/09/16 0.00163 <0.0030 0.0171 0.00134 0.00089 0.0623 <0.00010 <0.000050
HAC-10 06/07/16 0.00112 <0.0030 0.0035 0.0001 0.00085 0.0116 <0.00010 <0.000050
02/08/16 0.00191 0.0097 0.0072 0.00011 0.00103 0.0138 <0.00010 <0.000050
06/09/16 0.00112 <0.0030 0.0044 0.0001 0.00088 0.0123 <0.00010 <0.000050
HAC-12 06/07/16 0.00155 <0.0030 0.0263 0.0011 0.00087 0.0596 <0.00010 <0.000050
13/07/16 0.00283 0.0043 0.0216 0.00128 0.00093 0.0766 <0.00010 <0.000050
18/07/16 0.0015 <0.0030 0.0248 0.00114 0.00084 0.0593 <0.00010 <0.000050
25/07/16 0.00153 <0.0030 0.0225 0.00115 0.0009 0.0585 <0.00010 <0.000050
02/08/16 0.00149 <0.0030 0.0241 0.0012 0.00101 0.0626 <0.00010 <0.000050
10/08/16 0.00148 <0.0030 0.0207 0.00117 0.00081 0.0565 <0.00010 <0.000050
17/08/16 0.00142 <0.0030 0.022 0.00122 0.00099 0.0626 <0.00010 <0.000050
23/08/16 0.00139 <0.0030 0.0167 0.00116 0.00093 0.062 <0.00010 <0.000050
30/08/16 0.00123 <0.0030 0.0189 0.00128 0.00096 0.0626 <0.00010 <0.000050
06/09/16 0.00122 <0.0030 0.0128 0.00114 0.00089 0.0553 <0.00010 <0.000050
13/09/16 0.00123 <0.0030 0.0169 0.00137 0.00086 0.0646 <0.00010 <0.000050
19/09/16 0.00632 0.005 0.0152 0.00121 0.00091 0.0651 <0.00010 <0.000050
27/09/16 0.00122 <0.0030 0.0152 0.00116 0.00083 0.0594 <0.00010 <0.000050
HAC-13 - HAC
U/S
06/07/16 0.00319 0.0102 0.0174 0.00013 0.00085 0.0168 <0.00010 <0.000050
Printed Date: 19/10/2016
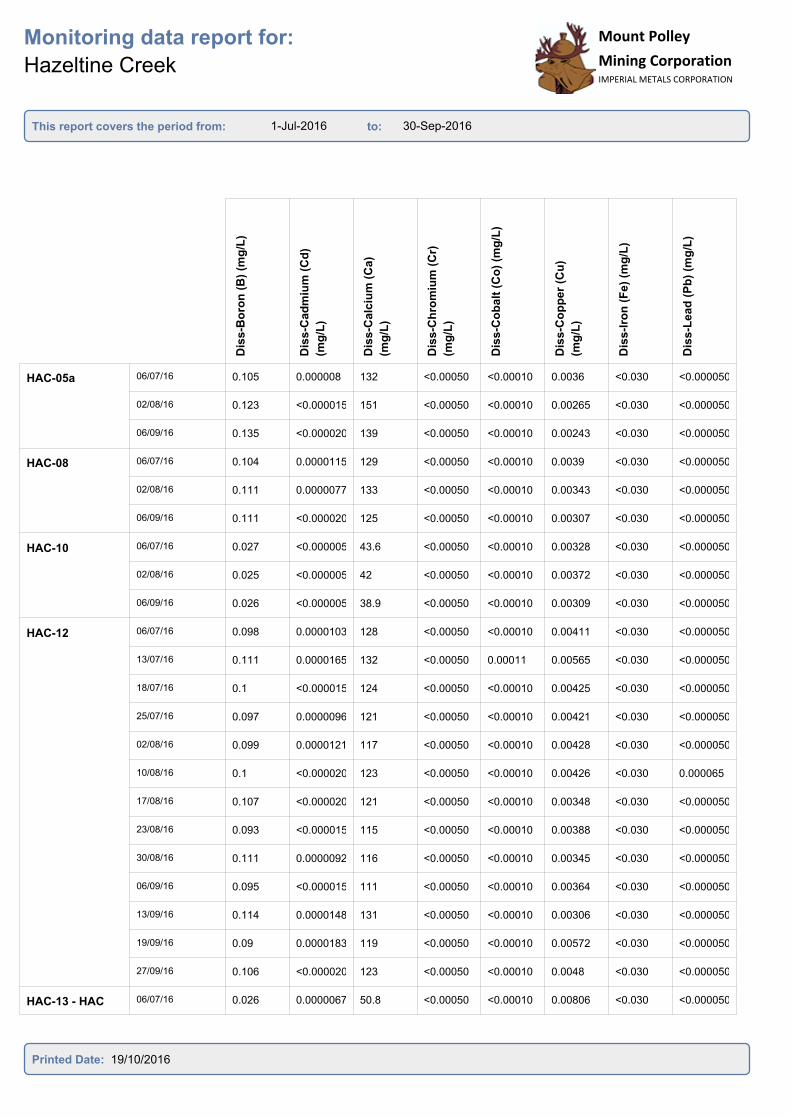
1-Jul-2016 30-Sep-2016
Monitoring data report for:
Hazeltine Creek
This report covers the period from: to:
Mount Polley
Mining CorporationIMPERIAL METALS CORPORATION
Mount Polley
Mining CorporationIMPERIAL METALS CORPORATION
Dis
s-B
oro
n (
B)
(mg
/L)
Dis
s-C
ad
miu
m (
Cd
)
(mg
/L)
Dis
s-C
alc
ium
(C
a)
(mg
/L)
Dis
s-C
hro
miu
m (
Cr)
(mg
/L)
Dis
s-C
ob
alt
(C
o)
(mg
/L)
Dis
s-C
op
pe
r (C
u)
(mg
/L)
Dis
s-I
ron
(F
e)
(mg
/L)
Dis
s-L
ead
(P
b)
(mg
/L)
HAC-05a 06/07/16 0.105 0.000008 132 <0.00050 <0.00010 0.0036 <0.030 <0.000050
02/08/16 0.123 <0.000015 151 <0.00050 <0.00010 0.00265 <0.030 <0.000050
06/09/16 0.135 <0.000020 139 <0.00050 <0.00010 0.00243 <0.030 <0.000050
HAC-08 06/07/16 0.104 0.0000115 129 <0.00050 <0.00010 0.0039 <0.030 <0.000050
02/08/16 0.111 0.0000077 133 <0.00050 <0.00010 0.00343 <0.030 <0.000050
06/09/16 0.111 <0.000020 125 <0.00050 <0.00010 0.00307 <0.030 <0.000050
HAC-10 06/07/16 0.027 <0.000005 43.6 <0.00050 <0.00010 0.00328 <0.030 <0.000050
02/08/16 0.025 <0.000005 42 <0.00050 <0.00010 0.00372 <0.030 <0.000050
06/09/16 0.026 <0.000005 38.9 <0.00050 <0.00010 0.00309 <0.030 <0.000050
HAC-12 06/07/16 0.098 0.0000103 128 <0.00050 <0.00010 0.00411 <0.030 <0.000050
13/07/16 0.111 0.0000165 132 <0.00050 0.00011 0.00565 <0.030 <0.000050
18/07/16 0.1 <0.000015 124 <0.00050 <0.00010 0.00425 <0.030 <0.000050
25/07/16 0.097 0.0000096 121 <0.00050 <0.00010 0.00421 <0.030 <0.000050
02/08/16 0.099 0.0000121 117 <0.00050 <0.00010 0.00428 <0.030 <0.000050
10/08/16 0.1 <0.000020 123 <0.00050 <0.00010 0.00426 <0.030 0.000065
17/08/16 0.107 <0.000020 121 <0.00050 <0.00010 0.00348 <0.030 <0.000050
23/08/16 0.093 <0.000015 115 <0.00050 <0.00010 0.00388 <0.030 <0.000050
30/08/16 0.111 0.0000092 116 <0.00050 <0.00010 0.00345 <0.030 <0.000050
06/09/16 0.095 <0.000015 111 <0.00050 <0.00010 0.00364 <0.030 <0.000050
13/09/16 0.114 0.0000148 131 <0.00050 <0.00010 0.00306 <0.030 <0.000050
19/09/16 0.09 0.0000183 119 <0.00050 <0.00010 0.00572 <0.030 <0.000050
27/09/16 0.106 <0.000020 123 <0.00050 <0.00010 0.0048 <0.030 <0.000050
HAC-13 - HAC
U/S
06/07/16 0.026 0.0000067 50.8 <0.00050 <0.00010 0.00806 <0.030 <0.000050
Printed Date: 19/10/2016
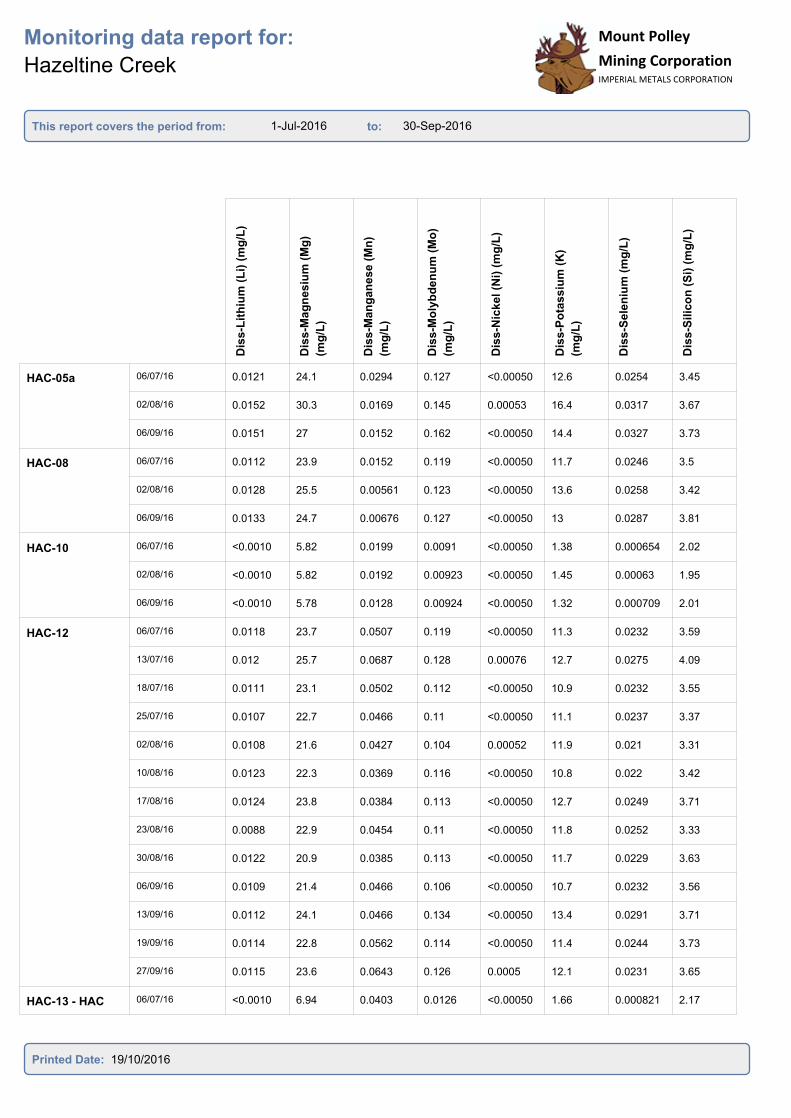
1-Jul-2016 30-Sep-2016
Monitoring data report for:
Hazeltine Creek
This report covers the period from: to:
Mount Polley
Mining CorporationIMPERIAL METALS CORPORATION
Mount Polley
Mining CorporationIMPERIAL METALS CORPORATION
Dis
s-L
ith
ium
(L
i) (
mg
/L)
Dis
s-M
ag
nesiu
m (
Mg
)
(mg
/L)
Dis
s-M
an
gan
ese
(M
n)
(mg
/L)
Dis
s-M
oly
bd
en
um
(M
o)
(mg
/L)
Dis
s-N
ickel (N
i) (
mg
/L)
Dis
s-P
ota
ssiu
m (
K)
(mg
/L)
Dis
s-S
ele
niu
m (
mg
/L)
Dis
s-S
ilic
on
(S
i) (
mg
/L)
HAC-05a 06/07/16 0.0121 24.1 0.0294 0.127 <0.00050 12.6 0.0254 3.45
02/08/16 0.0152 30.3 0.0169 0.145 0.00053 16.4 0.0317 3.67
06/09/16 0.0151 27 0.0152 0.162 <0.00050 14.4 0.0327 3.73
HAC-08 06/07/16 0.0112 23.9 0.0152 0.119 <0.00050 11.7 0.0246 3.5
02/08/16 0.0128 25.5 0.00561 0.123 <0.00050 13.6 0.0258 3.42
06/09/16 0.0133 24.7 0.00676 0.127 <0.00050 13 0.0287 3.81
HAC-10 06/07/16 <0.0010 5.82 0.0199 0.0091 <0.00050 1.38 0.000654 2.02
02/08/16 <0.0010 5.82 0.0192 0.00923 <0.00050 1.45 0.00063 1.95
06/09/16 <0.0010 5.78 0.0128 0.00924 <0.00050 1.32 0.000709 2.01
HAC-12 06/07/16 0.0118 23.7 0.0507 0.119 <0.00050 11.3 0.0232 3.59
13/07/16 0.012 25.7 0.0687 0.128 0.00076 12.7 0.0275 4.09
18/07/16 0.0111 23.1 0.0502 0.112 <0.00050 10.9 0.0232 3.55
25/07/16 0.0107 22.7 0.0466 0.11 <0.00050 11.1 0.0237 3.37
02/08/16 0.0108 21.6 0.0427 0.104 0.00052 11.9 0.021 3.31
10/08/16 0.0123 22.3 0.0369 0.116 <0.00050 10.8 0.022 3.42
17/08/16 0.0124 23.8 0.0384 0.113 <0.00050 12.7 0.0249 3.71
23/08/16 0.0088 22.9 0.0454 0.11 <0.00050 11.8 0.0252 3.33
30/08/16 0.0122 20.9 0.0385 0.113 <0.00050 11.7 0.0229 3.63
06/09/16 0.0109 21.4 0.0466 0.106 <0.00050 10.7 0.0232 3.56
13/09/16 0.0112 24.1 0.0466 0.134 <0.00050 13.4 0.0291 3.71
19/09/16 0.0114 22.8 0.0562 0.114 <0.00050 11.4 0.0244 3.73
27/09/16 0.0115 23.6 0.0643 0.126 0.0005 12.1 0.0231 3.65
HAC-13 - HAC
U/S
06/07/16 <0.0010 6.94 0.0403 0.0126 <0.00050 1.66 0.000821 2.17
Printed Date: 19/10/2016
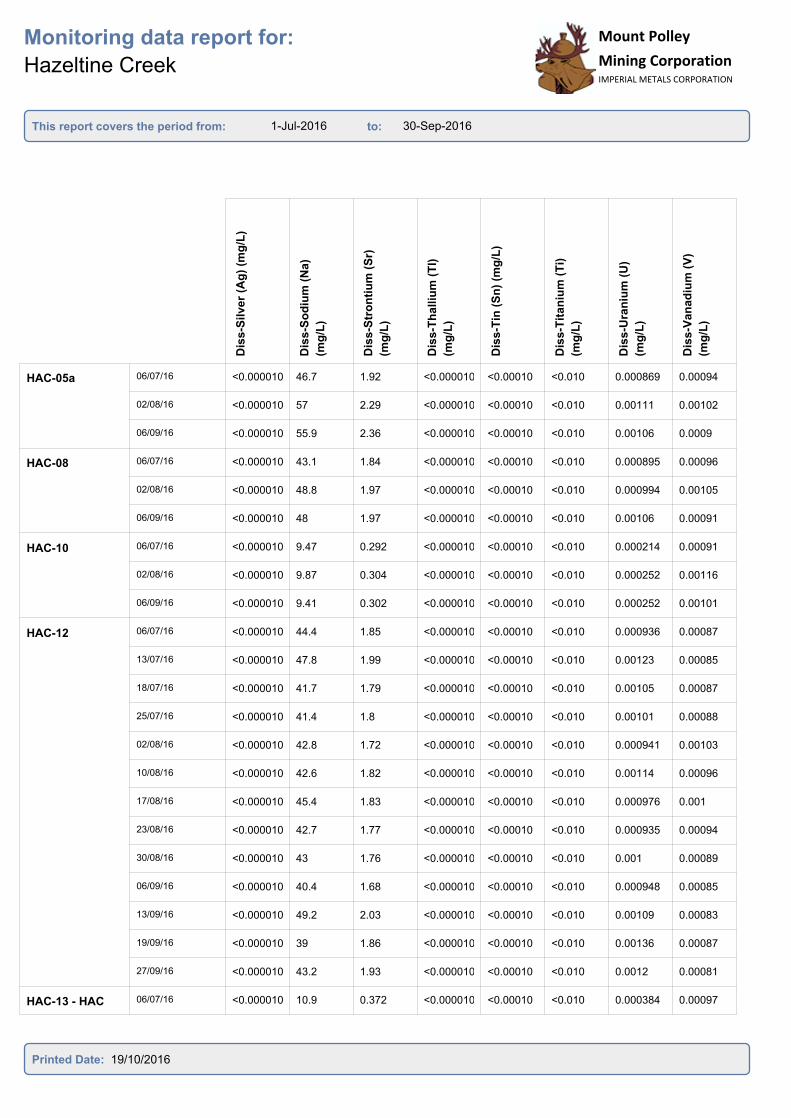
1-Jul-2016 30-Sep-2016
Monitoring data report for:
Hazeltine Creek
This report covers the period from: to:
Mount Polley
Mining CorporationIMPERIAL METALS CORPORATION
Mount Polley
Mining CorporationIMPERIAL METALS CORPORATION
Dis
s-S
ilv
er
(Ag
) (m
g/L
)
Dis
s-S
od
ium
(N
a)
(mg
/L)
Dis
s-S
tro
nti
um
(S
r)
(mg
/L)
Dis
s-T
halliu
m (
Tl)
(mg
/L)
Dis
s-T
in (
Sn
) (m
g/L
)
Dis
s-T
itan
ium
(T
i)
(mg
/L)
Dis
s-U
ran
ium
(U
)
(mg
/L)
Dis
s-V
an
ad
ium
(V
)
(mg
/L)
HAC-05a 06/07/16 <0.000010 46.7 1.92 <0.000010 <0.00010 <0.010 0.000869 0.00094
02/08/16 <0.000010 57 2.29 <0.000010 <0.00010 <0.010 0.00111 0.00102
06/09/16 <0.000010 55.9 2.36 <0.000010 <0.00010 <0.010 0.00106 0.0009
HAC-08 06/07/16 <0.000010 43.1 1.84 <0.000010 <0.00010 <0.010 0.000895 0.00096
02/08/16 <0.000010 48.8 1.97 <0.000010 <0.00010 <0.010 0.000994 0.00105
06/09/16 <0.000010 48 1.97 <0.000010 <0.00010 <0.010 0.00106 0.00091
HAC-10 06/07/16 <0.000010 9.47 0.292 <0.000010 <0.00010 <0.010 0.000214 0.00091
02/08/16 <0.000010 9.87 0.304 <0.000010 <0.00010 <0.010 0.000252 0.00116
06/09/16 <0.000010 9.41 0.302 <0.000010 <0.00010 <0.010 0.000252 0.00101
HAC-12 06/07/16 <0.000010 44.4 1.85 <0.000010 <0.00010 <0.010 0.000936 0.00087
13/07/16 <0.000010 47.8 1.99 <0.000010 <0.00010 <0.010 0.00123 0.00085
18/07/16 <0.000010 41.7 1.79 <0.000010 <0.00010 <0.010 0.00105 0.00087
25/07/16 <0.000010 41.4 1.8 <0.000010 <0.00010 <0.010 0.00101 0.00088
02/08/16 <0.000010 42.8 1.72 <0.000010 <0.00010 <0.010 0.000941 0.00103
10/08/16 <0.000010 42.6 1.82 <0.000010 <0.00010 <0.010 0.00114 0.00096
17/08/16 <0.000010 45.4 1.83 <0.000010 <0.00010 <0.010 0.000976 0.001
23/08/16 <0.000010 42.7 1.77 <0.000010 <0.00010 <0.010 0.000935 0.00094
30/08/16 <0.000010 43 1.76 <0.000010 <0.00010 <0.010 0.001 0.00089
06/09/16 <0.000010 40.4 1.68 <0.000010 <0.00010 <0.010 0.000948 0.00085
13/09/16 <0.000010 49.2 2.03 <0.000010 <0.00010 <0.010 0.00109 0.00083
19/09/16 <0.000010 39 1.86 <0.000010 <0.00010 <0.010 0.00136 0.00087
27/09/16 <0.000010 43.2 1.93 <0.000010 <0.00010 <0.010 0.0012 0.00081
HAC-13 - HAC
U/S
06/07/16 <0.000010 10.9 0.372 <0.000010 <0.00010 <0.010 0.000384 0.00097
Printed Date: 19/10/2016
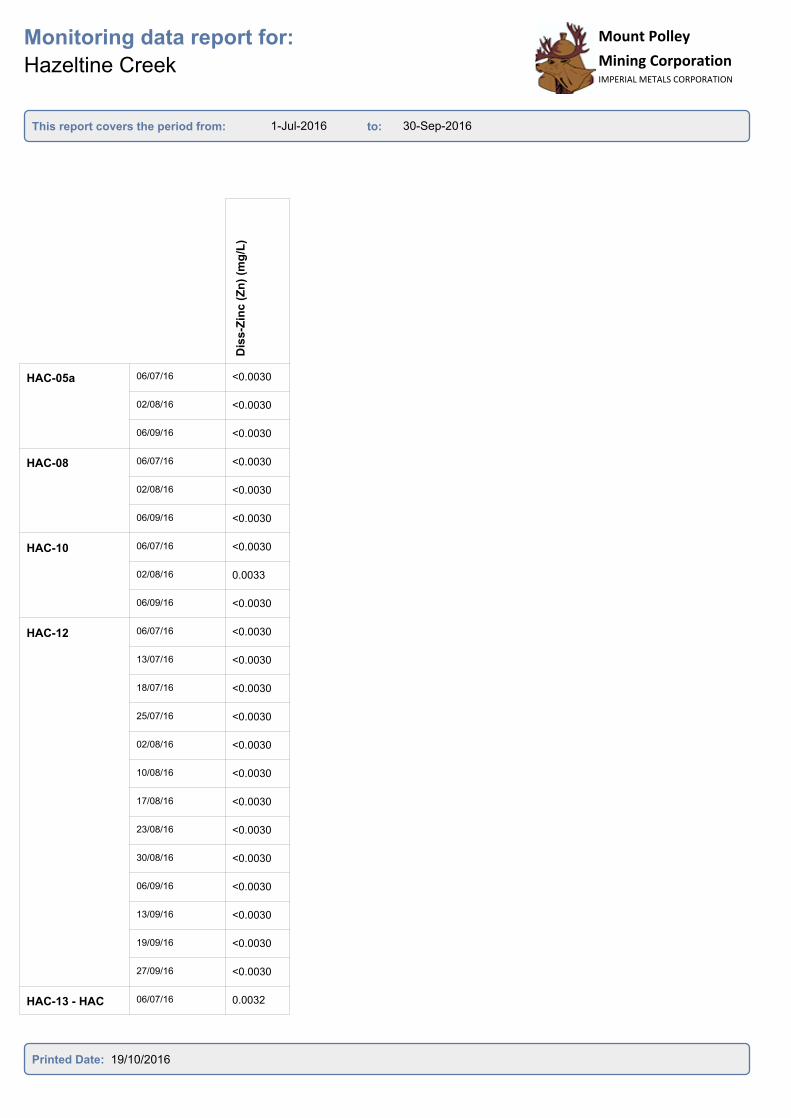
1-Jul-2016 30-Sep-2016
Monitoring data report for:
Hazeltine Creek
This report covers the period from: to:
Mount Polley
Mining CorporationIMPERIAL METALS CORPORATION
Mount Polley
Mining CorporationIMPERIAL METALS CORPORATION
Dis
s-Z
inc (
Zn
) (m
g/L
)
HAC-05a 06/07/16 <0.0030
02/08/16 <0.0030
06/09/16 <0.0030
HAC-08 06/07/16 <0.0030
02/08/16 <0.0030
06/09/16 <0.0030
HAC-10 06/07/16 <0.0030
02/08/16 0.0033
06/09/16 <0.0030
HAC-12 06/07/16 <0.0030
13/07/16 <0.0030
18/07/16 <0.0030
25/07/16 <0.0030
02/08/16 <0.0030
10/08/16 <0.0030
17/08/16 <0.0030
23/08/16 <0.0030
30/08/16 <0.0030
06/09/16 <0.0030
13/09/16 <0.0030
19/09/16 <0.0030
27/09/16 <0.0030
HAC-13 - HAC
U/S
06/07/16 0.0032
Printed Date: 19/10/2016
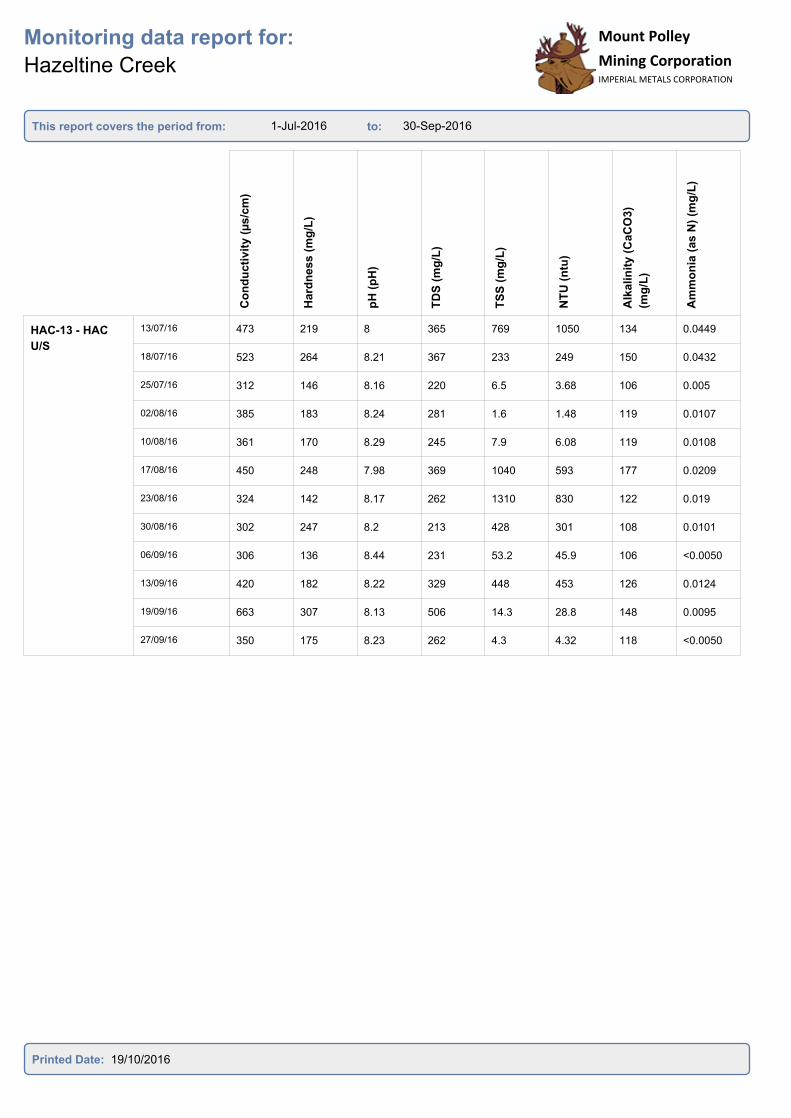
1-Jul-2016 30-Sep-2016
Monitoring data report for:
Hazeltine Creek
This report covers the period from: to:
Mount Polley
Mining CorporationIMPERIAL METALS CORPORATION
Co
nd
ucti
vit
y (
µs/c
m)
Hard
ne
ss (
mg
/L)
pH
(p
H)
TD
S (
mg
/L)
TS
S (
mg
/L)
NT
U (
ntu
)
Alk
alin
ity
(C
aC
O3)
(mg
/L)
Am
mo
nia
(a
s N
) (m
g/L
)
HAC-13 - HAC
U/S
13/07/16 473 219 8 365 769 1050 134 0.0449
18/07/16 523 264 8.21 367 233 249 150 0.0432
25/07/16 312 146 8.16 220 6.5 3.68 106 0.005
02/08/16 385 183 8.24 281 1.6 1.48 119 0.0107
10/08/16 361 170 8.29 245 7.9 6.08 119 0.0108
17/08/16 450 248 7.98 369 1040 593 177 0.0209
23/08/16 324 142 8.17 262 1310 830 122 0.019
30/08/16 302 247 8.2 213 428 301 108 0.0101
06/09/16 306 136 8.44 231 53.2 45.9 106 <0.0050
13/09/16 420 182 8.22 329 448 453 126 0.0124
19/09/16 663 307 8.13 506 14.3 28.8 148 0.0095
27/09/16 350 175 8.23 262 4.3 4.32 118 <0.0050
Printed Date: 19/10/2016
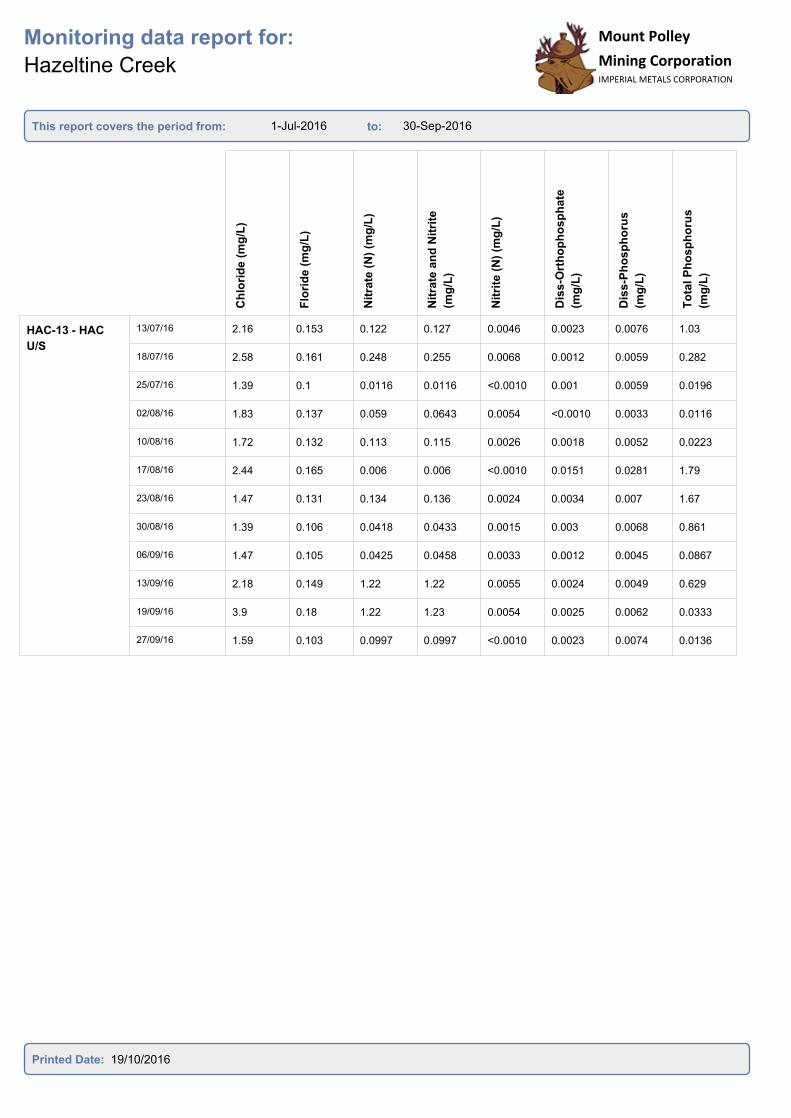
1-Jul-2016 30-Sep-2016
Monitoring data report for:
Hazeltine Creek
This report covers the period from: to:
Mount Polley
Mining CorporationIMPERIAL METALS CORPORATION
Mount Polley
Mining CorporationIMPERIAL METALS CORPORATION
Ch
lori
de (
mg
/L)
Flo
rid
e (
mg
/L)
Nit
rate
(N
) (m
g/L
)
Nit
rate
an
d N
itri
te
(mg
/L)
Nit
rite
(N
) (m
g/L
)
Dis
s-O
rth
op
ho
sp
hate
(mg
/L)
Dis
s-P
ho
sp
ho
rus
(mg
/L)
To
tal P
ho
sp
ho
rus
(mg
/L)
HAC-13 - HAC
U/S
13/07/16 2.16 0.153 0.122 0.127 0.0046 0.0023 0.0076 1.03
18/07/16 2.58 0.161 0.248 0.255 0.0068 0.0012 0.0059 0.282
25/07/16 1.39 0.1 0.0116 0.0116 <0.0010 0.001 0.0059 0.0196
02/08/16 1.83 0.137 0.059 0.0643 0.0054 <0.0010 0.0033 0.0116
10/08/16 1.72 0.132 0.113 0.115 0.0026 0.0018 0.0052 0.0223
17/08/16 2.44 0.165 0.006 0.006 <0.0010 0.0151 0.0281 1.79
23/08/16 1.47 0.131 0.134 0.136 0.0024 0.0034 0.007 1.67
30/08/16 1.39 0.106 0.0418 0.0433 0.0015 0.003 0.0068 0.861
06/09/16 1.47 0.105 0.0425 0.0458 0.0033 0.0012 0.0045 0.0867
13/09/16 2.18 0.149 1.22 1.22 0.0055 0.0024 0.0049 0.629
19/09/16 3.9 0.18 1.22 1.23 0.0054 0.0025 0.0062 0.0333
27/09/16 1.59 0.103 0.0997 0.0997 <0.0010 0.0023 0.0074 0.0136
Printed Date: 19/10/2016

1-Jul-2016 30-Sep-2016
Monitoring data report for:
Hazeltine Creek
This report covers the period from: to:
Mount Polley
Mining CorporationIMPERIAL METALS CORPORATION
Mount Polley
Mining CorporationIMPERIAL METALS CORPORATION
Su
lph
ate
(m
g/L
)
To
tal N
itro
ge
n (
mg
/L)
Dis
so
lved
Org
an
ic C
a
(mg
/L)
To
tal A
lum
inu
m (
mg
/L)
An
tim
on
y (
Sb
)-T
ota
l
(mg
/L)
Ars
en
ic (
As)-
To
tal
(mg
/L)
Bari
um
(B
a)-
To
tal
(mg
/L)
Bery
lliu
m (
Be
)-T
ota
l
(mg
/L)
HAC-13 - HAC
U/S
13/07/16 113 0.466 9.4 32.8 0.0006 0.0155 0.498 0.00098
18/07/16 127 0.897 9.26 9.74 0.00037 0.00531 0.209 0.0003
25/07/16 55.6 0.331 8.13 0.262 0.00016 0.00099 0.0223 <0.00010
02/08/16 78.7 0.383 6.99 0.0864 0.00023 0.00101 0.028 <0.00010
10/08/16 75.7 0.397 6.63 0.438 0.0004 0.00123 0.0413 <0.00010
17/08/16 75.5 0.659 13.1 28.3 0.00056 0.0146 0.522 0.0009
23/08/16 60.1 0.666 6.26 32 0.00055 0.014 0.659 0.00101
30/08/16 54.5 0.487 5.61 22.5 0.00041 0.00822 0.421 0.00055
06/09/16 59.1 0.29 5.59 2.18 0.00027 0.00156 0.0913 <0.00010
13/09/16 96.2 1.66 6.14 19.6 0.00061 0.00847 0.341 0.00057
19/09/16 225 1.45 11.3 1.41 0.00044 0.00154 0.0857 <0.00010
27/09/16 74.9 0.396 6.49 0.194 0.00022 0.00081 0.0336 <0.00010
Printed Date: 19/10/2016

1-Jul-2016 30-Sep-2016
Monitoring data report for:
Hazeltine Creek
This report covers the period from: to:
Mount Polley
Mining CorporationIMPERIAL METALS CORPORATION
Mount Polley
Mining CorporationIMPERIAL METALS CORPORATION
Bis
mu
th (
Bi)
-To
tal
(mg
/L)
Bo
ron
(B
)-T
ota
l (m
g/L
)
To
tal C
ad
miu
m (
mg
/L)
Calc
ium
(C
a)-
To
tal
(mg
/L)
Ch
rom
ium
(C
r)-T
ota
l
(mg
/L)
Co
balt
(C
o)-
To
tal
(mg
/L)
To
tal C
op
per
(mg
/L)
To
tal Ir
on
(m
g/L
)
HAC-13 - HAC
U/S
13/07/16 0.00016 0.044 0.000319 91 0.0432 0.0238 0.958 37.5
18/07/16 <0.000050 0.04 0.0000998 83.4 0.00908 0.00694 0.307 8.88
25/07/16 <0.000050 0.029 <0.000005 47.8 <0.00050 0.00024 0.0172 0.265
02/08/16 <0.000050 0.034 0.000006 59.3 <0.00050 0.0001 0.0178 0.086
10/08/16 <0.000050 0.035 0.0000126 55.2 0.00052 0.00036 0.0289 0.39
17/08/16 0.000105 0.042 0.000246 82.7 0.0384 0.0223 0.707 28.4
23/08/16 <0.00010 0.038 0.000301 75.6 0.0835 0.0322 0.788 35
30/08/16 0.000051 0.03 0.000147 54 0.0418 0.0195 0.41 21.3
06/09/16 <0.000050 0.03 0.0000187 43 0.00524 0.00205 0.0524 2.22
13/09/16 0.000091 0.042 0.000163 71.6 0.0305 0.0144 0.452 20.4
19/09/16 <0.000050 0.051 0.0000483 105 0.00146 0.0011 0.0809 1.31
27/09/16 <0.000050 0.032 0.0000143 52.7 <0.00050 0.00017 0.0199 0.21
Printed Date: 19/10/2016
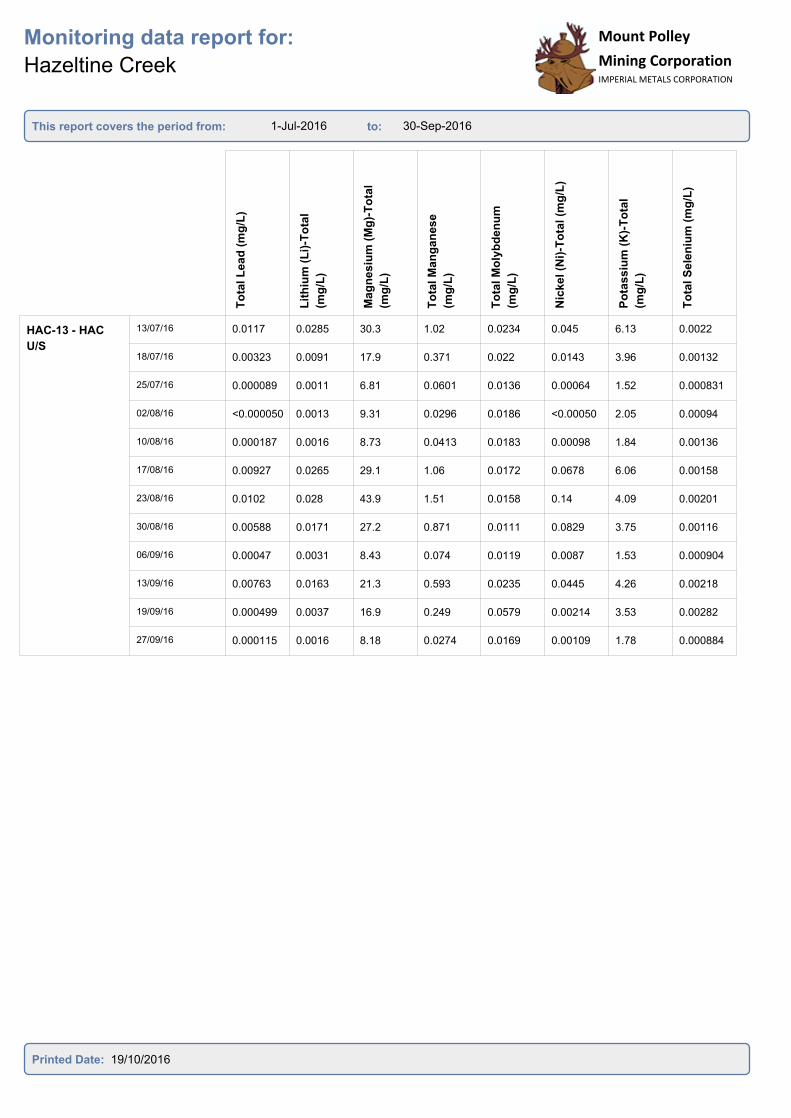
1-Jul-2016 30-Sep-2016
Monitoring data report for:
Hazeltine Creek
This report covers the period from: to:
Mount Polley
Mining CorporationIMPERIAL METALS CORPORATION
Mount Polley
Mining CorporationIMPERIAL METALS CORPORATION
To
tal L
ea
d (
mg
/L)
Lit
hiu
m (
Li)
-To
tal
(mg
/L)
Mag
ne
siu
m (
Mg
)-T
ota
l
(mg
/L)
To
tal M
an
ga
nese
(mg
/L)
To
tal M
oly
bd
en
um
(mg
/L)
Nic
ke
l (N
i)-T
ota
l (m
g/L
)
Po
tas
siu
m (
K)-
To
tal
(mg
/L)
To
tal S
ele
niu
m (
mg
/L)
HAC-13 - HAC
U/S
13/07/16 0.0117 0.0285 30.3 1.02 0.0234 0.045 6.13 0.0022
18/07/16 0.00323 0.0091 17.9 0.371 0.022 0.0143 3.96 0.00132
25/07/16 0.000089 0.0011 6.81 0.0601 0.0136 0.00064 1.52 0.000831
02/08/16 <0.000050 0.0013 9.31 0.0296 0.0186 <0.00050 2.05 0.00094
10/08/16 0.000187 0.0016 8.73 0.0413 0.0183 0.00098 1.84 0.00136
17/08/16 0.00927 0.0265 29.1 1.06 0.0172 0.0678 6.06 0.00158
23/08/16 0.0102 0.028 43.9 1.51 0.0158 0.14 4.09 0.00201
30/08/16 0.00588 0.0171 27.2 0.871 0.0111 0.0829 3.75 0.00116
06/09/16 0.00047 0.0031 8.43 0.074 0.0119 0.0087 1.53 0.000904
13/09/16 0.00763 0.0163 21.3 0.593 0.0235 0.0445 4.26 0.00218
19/09/16 0.000499 0.0037 16.9 0.249 0.0579 0.00214 3.53 0.00282
27/09/16 0.000115 0.0016 8.18 0.0274 0.0169 0.00109 1.78 0.000884
Printed Date: 19/10/2016
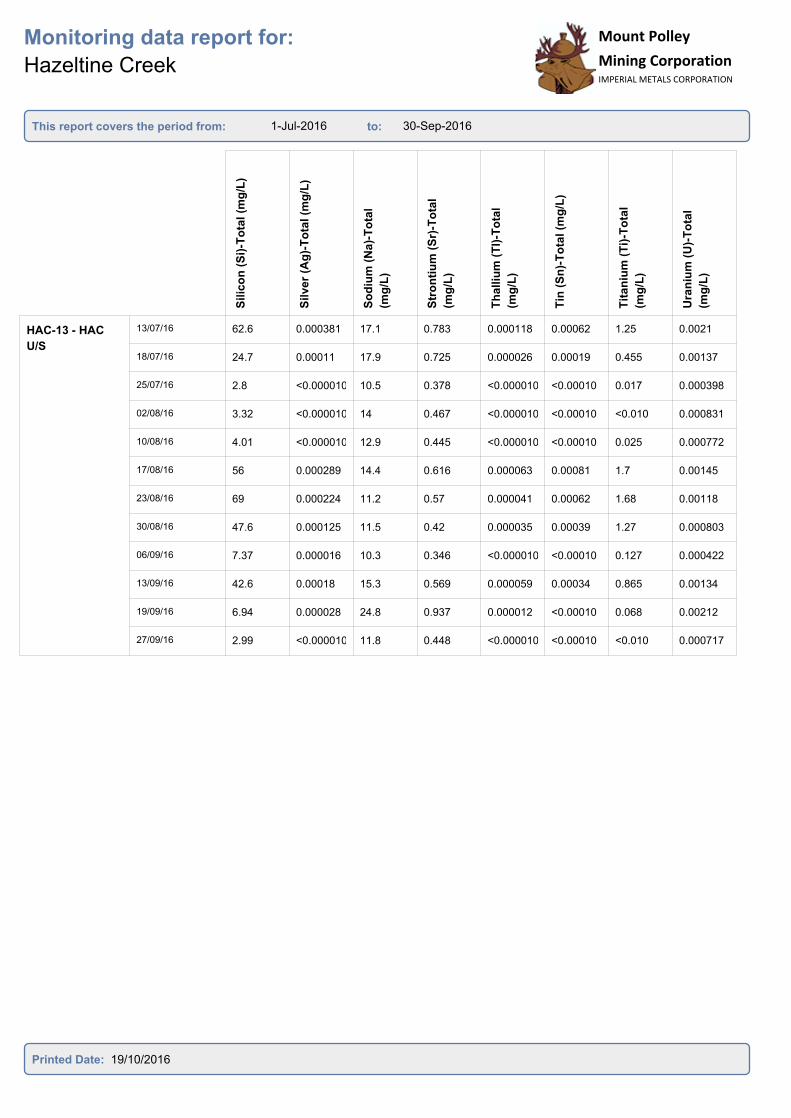
1-Jul-2016 30-Sep-2016
Monitoring data report for:
Hazeltine Creek
This report covers the period from: to:
Mount Polley
Mining CorporationIMPERIAL METALS CORPORATION
Mount Polley
Mining CorporationIMPERIAL METALS CORPORATION
Silic
on
(S
i)-T
ota
l (m
g/L
)
Silve
r (A
g)-
To
tal (m
g/L
)
So
diu
m (
Na)-
To
tal
(mg
/L)
Str
on
tiu
m (
Sr)
-To
tal
(mg
/L)
Th
alliu
m (
Tl)
-To
tal
(mg
/L)
Tin
(S
n)-
To
tal (m
g/L
)
Tit
an
ium
(T
i)-T
ota
l
(mg
/L)
Ura
niu
m (
U)-
To
tal
(mg
/L)
HAC-13 - HAC
U/S
13/07/16 62.6 0.000381 17.1 0.783 0.000118 0.00062 1.25 0.0021
18/07/16 24.7 0.00011 17.9 0.725 0.000026 0.00019 0.455 0.00137
25/07/16 2.8 <0.000010 10.5 0.378 <0.000010 <0.00010 0.017 0.000398
02/08/16 3.32 <0.000010 14 0.467 <0.000010 <0.00010 <0.010 0.000831
10/08/16 4.01 <0.000010 12.9 0.445 <0.000010 <0.00010 0.025 0.000772
17/08/16 56 0.000289 14.4 0.616 0.000063 0.00081 1.7 0.00145
23/08/16 69 0.000224 11.2 0.57 0.000041 0.00062 1.68 0.00118
30/08/16 47.6 0.000125 11.5 0.42 0.000035 0.00039 1.27 0.000803
06/09/16 7.37 0.000016 10.3 0.346 <0.000010 <0.00010 0.127 0.000422
13/09/16 42.6 0.00018 15.3 0.569 0.000059 0.00034 0.865 0.00134
19/09/16 6.94 0.000028 24.8 0.937 0.000012 <0.00010 0.068 0.00212
27/09/16 2.99 <0.000010 11.8 0.448 <0.000010 <0.00010 <0.010 0.000717
Printed Date: 19/10/2016
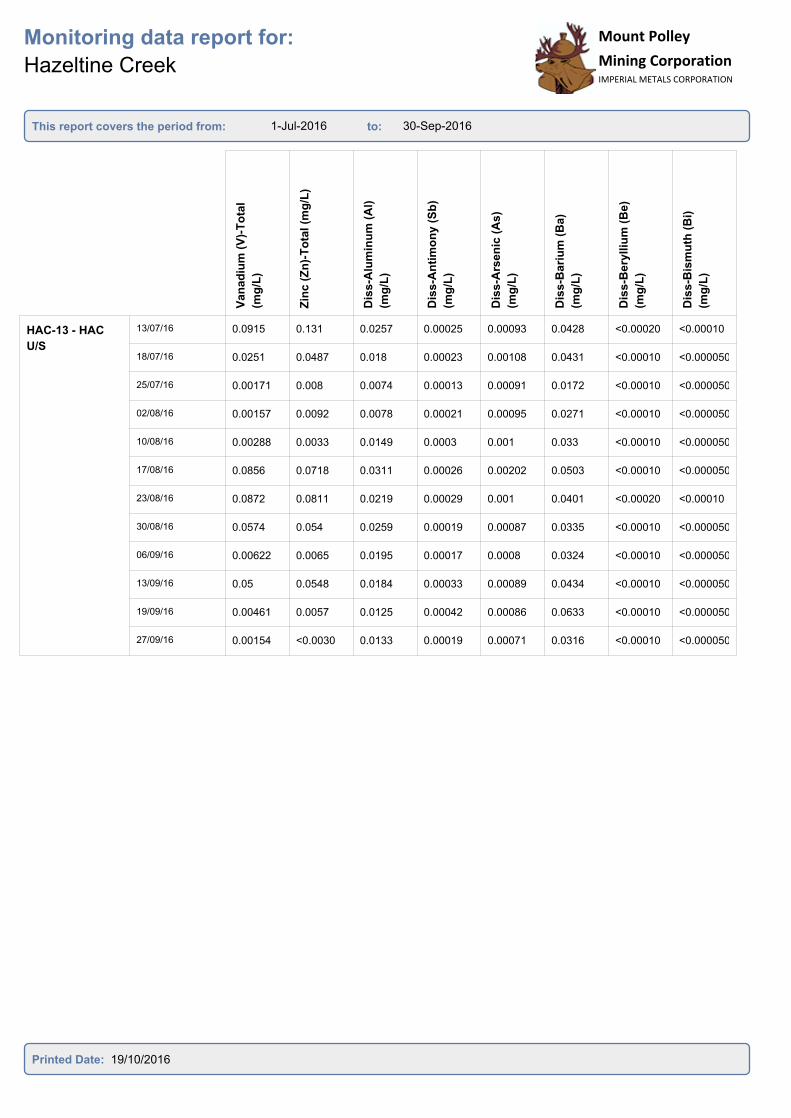
1-Jul-2016 30-Sep-2016
Monitoring data report for:
Hazeltine Creek
This report covers the period from: to:
Mount Polley
Mining CorporationIMPERIAL METALS CORPORATION
Mount Polley
Mining CorporationIMPERIAL METALS CORPORATION
Van
ad
ium
(V
)-T
ota
l
(mg
/L)
Zin
c (
Zn
)-T
ota
l (m
g/L
)
Dis
s-A
lum
inu
m (
Al)
(mg
/L)
Dis
s-A
nti
mo
ny
(S
b)
(mg
/L)
Dis
s-A
rsen
ic (
As
)
(mg
/L)
Dis
s-B
ari
um
(B
a)
(mg
/L)
Dis
s-B
ery
lliu
m (
Be)
(mg
/L)
Dis
s-B
ism
uth
(B
i)
(mg
/L)
HAC-13 - HAC
U/S
13/07/16 0.0915 0.131 0.0257 0.00025 0.00093 0.0428 <0.00020 <0.00010
18/07/16 0.0251 0.0487 0.018 0.00023 0.00108 0.0431 <0.00010 <0.000050
25/07/16 0.00171 0.008 0.0074 0.00013 0.00091 0.0172 <0.00010 <0.000050
02/08/16 0.00157 0.0092 0.0078 0.00021 0.00095 0.0271 <0.00010 <0.000050
10/08/16 0.00288 0.0033 0.0149 0.0003 0.001 0.033 <0.00010 <0.000050
17/08/16 0.0856 0.0718 0.0311 0.00026 0.00202 0.0503 <0.00010 <0.000050
23/08/16 0.0872 0.0811 0.0219 0.00029 0.001 0.0401 <0.00020 <0.00010
30/08/16 0.0574 0.054 0.0259 0.00019 0.00087 0.0335 <0.00010 <0.000050
06/09/16 0.00622 0.0065 0.0195 0.00017 0.0008 0.0324 <0.00010 <0.000050
13/09/16 0.05 0.0548 0.0184 0.00033 0.00089 0.0434 <0.00010 <0.000050
19/09/16 0.00461 0.0057 0.0125 0.00042 0.00086 0.0633 <0.00010 <0.000050
27/09/16 0.00154 <0.0030 0.0133 0.00019 0.00071 0.0316 <0.00010 <0.000050
Printed Date: 19/10/2016
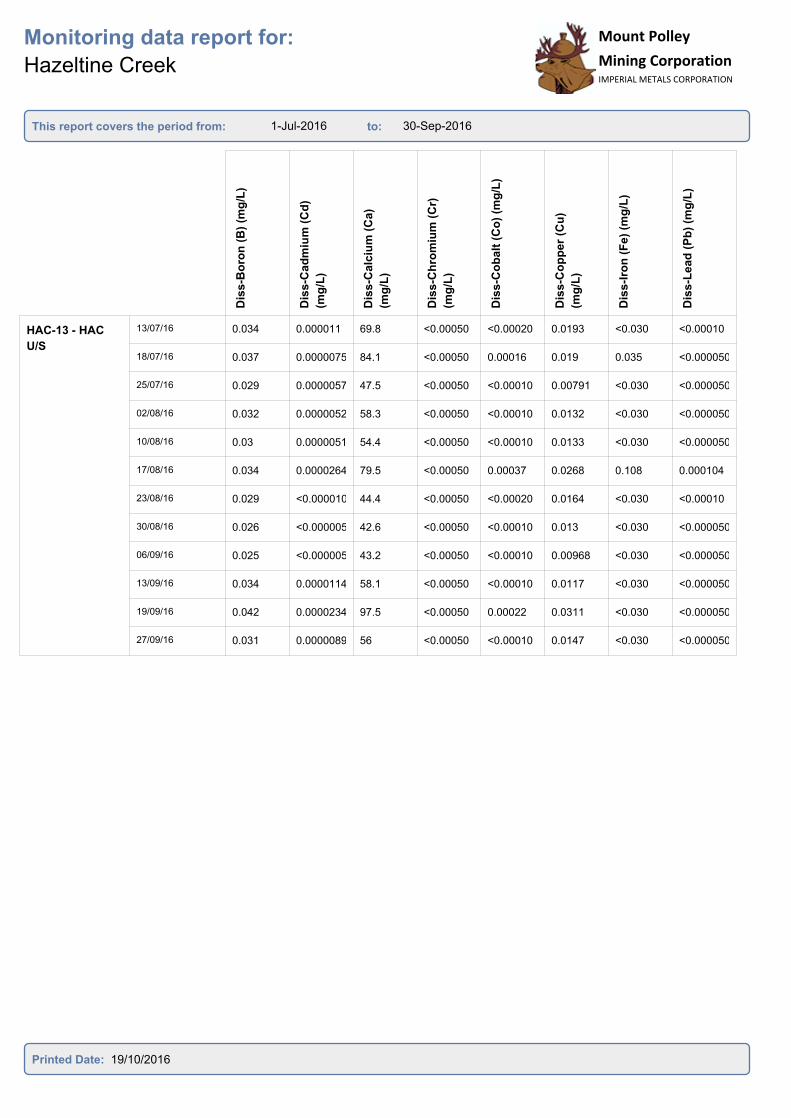
1-Jul-2016 30-Sep-2016
Monitoring data report for:
Hazeltine Creek
This report covers the period from: to:
Mount Polley
Mining CorporationIMPERIAL METALS CORPORATION
Mount Polley
Mining CorporationIMPERIAL METALS CORPORATION
Dis
s-B
oro
n (
B)
(mg
/L)
Dis
s-C
ad
miu
m (
Cd
)
(mg
/L)
Dis
s-C
alc
ium
(C
a)
(mg
/L)
Dis
s-C
hro
miu
m (
Cr)
(mg
/L)
Dis
s-C
ob
alt
(C
o)
(mg
/L)
Dis
s-C
op
pe
r (C
u)
(mg
/L)
Dis
s-I
ron
(F
e)
(mg
/L)
Dis
s-L
ead
(P
b)
(mg
/L)
HAC-13 - HAC
U/S
13/07/16 0.034 0.000011 69.8 <0.00050 <0.00020 0.0193 <0.030 <0.00010
18/07/16 0.037 0.0000075 84.1 <0.00050 0.00016 0.019 0.035 <0.000050
25/07/16 0.029 0.0000057 47.5 <0.00050 <0.00010 0.00791 <0.030 <0.000050
02/08/16 0.032 0.0000052 58.3 <0.00050 <0.00010 0.0132 <0.030 <0.000050
10/08/16 0.03 0.0000051 54.4 <0.00050 <0.00010 0.0133 <0.030 <0.000050
17/08/16 0.034 0.0000264 79.5 <0.00050 0.00037 0.0268 0.108 0.000104
23/08/16 0.029 <0.000010 44.4 <0.00050 <0.00020 0.0164 <0.030 <0.00010
30/08/16 0.026 <0.000005 42.6 <0.00050 <0.00010 0.013 <0.030 <0.000050
06/09/16 0.025 <0.000005 43.2 <0.00050 <0.00010 0.00968 <0.030 <0.000050
13/09/16 0.034 0.0000114 58.1 <0.00050 <0.00010 0.0117 <0.030 <0.000050
19/09/16 0.042 0.0000234 97.5 <0.00050 0.00022 0.0311 <0.030 <0.000050
27/09/16 0.031 0.0000089 56 <0.00050 <0.00010 0.0147 <0.030 <0.000050
Printed Date: 19/10/2016
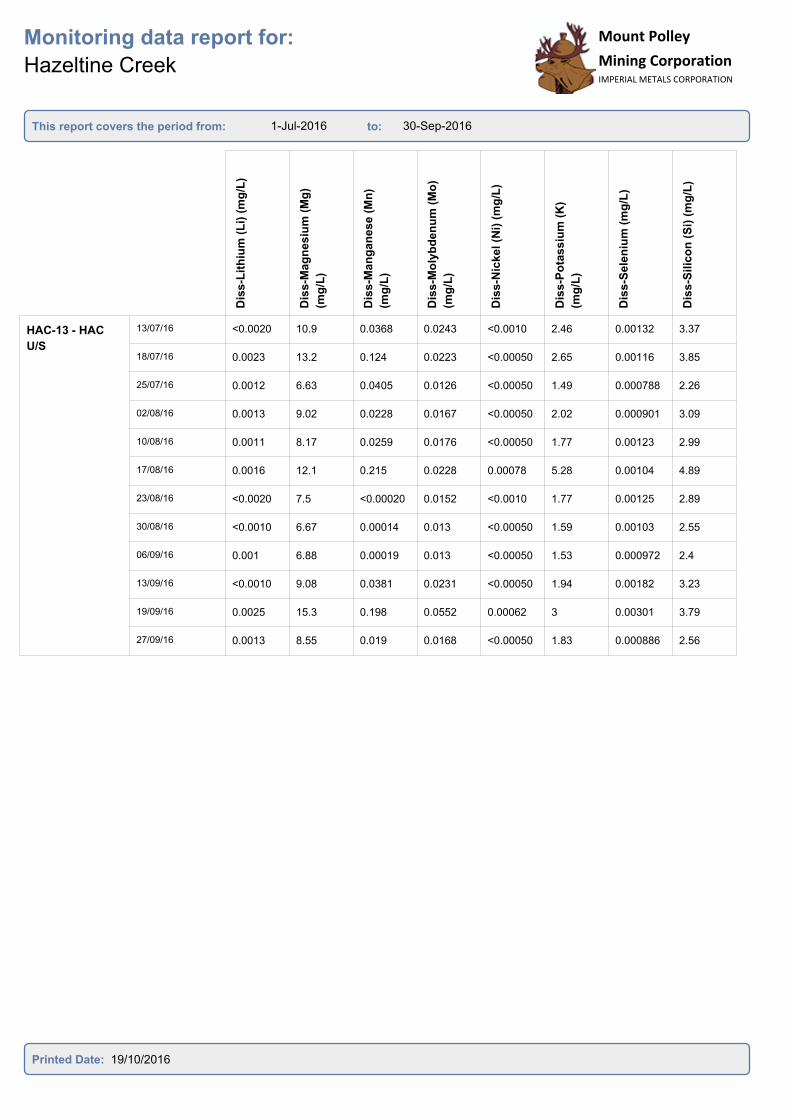
1-Jul-2016 30-Sep-2016
Monitoring data report for:
Hazeltine Creek
This report covers the period from: to:
Mount Polley
Mining CorporationIMPERIAL METALS CORPORATION
Mount Polley
Mining CorporationIMPERIAL METALS CORPORATION
Dis
s-L
ith
ium
(L
i) (
mg
/L)
Dis
s-M
ag
nesiu
m (
Mg
)
(mg
/L)
Dis
s-M
an
gan
ese
(M
n)
(mg
/L)
Dis
s-M
oly
bd
en
um
(M
o)
(mg
/L)
Dis
s-N
ickel (N
i) (
mg
/L)
Dis
s-P
ota
ssiu
m (
K)
(mg
/L)
Dis
s-S
ele
niu
m (
mg
/L)
Dis
s-S
ilic
on
(S
i) (
mg
/L)
HAC-13 - HAC
U/S
13/07/16 <0.0020 10.9 0.0368 0.0243 <0.0010 2.46 0.00132 3.37
18/07/16 0.0023 13.2 0.124 0.0223 <0.00050 2.65 0.00116 3.85
25/07/16 0.0012 6.63 0.0405 0.0126 <0.00050 1.49 0.000788 2.26
02/08/16 0.0013 9.02 0.0228 0.0167 <0.00050 2.02 0.000901 3.09
10/08/16 0.0011 8.17 0.0259 0.0176 <0.00050 1.77 0.00123 2.99
17/08/16 0.0016 12.1 0.215 0.0228 0.00078 5.28 0.00104 4.89
23/08/16 <0.0020 7.5 <0.00020 0.0152 <0.0010 1.77 0.00125 2.89
30/08/16 <0.0010 6.67 0.00014 0.013 <0.00050 1.59 0.00103 2.55
06/09/16 0.001 6.88 0.00019 0.013 <0.00050 1.53 0.000972 2.4
13/09/16 <0.0010 9.08 0.0381 0.0231 <0.00050 1.94 0.00182 3.23
19/09/16 0.0025 15.3 0.198 0.0552 0.00062 3 0.00301 3.79
27/09/16 0.0013 8.55 0.019 0.0168 <0.00050 1.83 0.000886 2.56
Printed Date: 19/10/2016
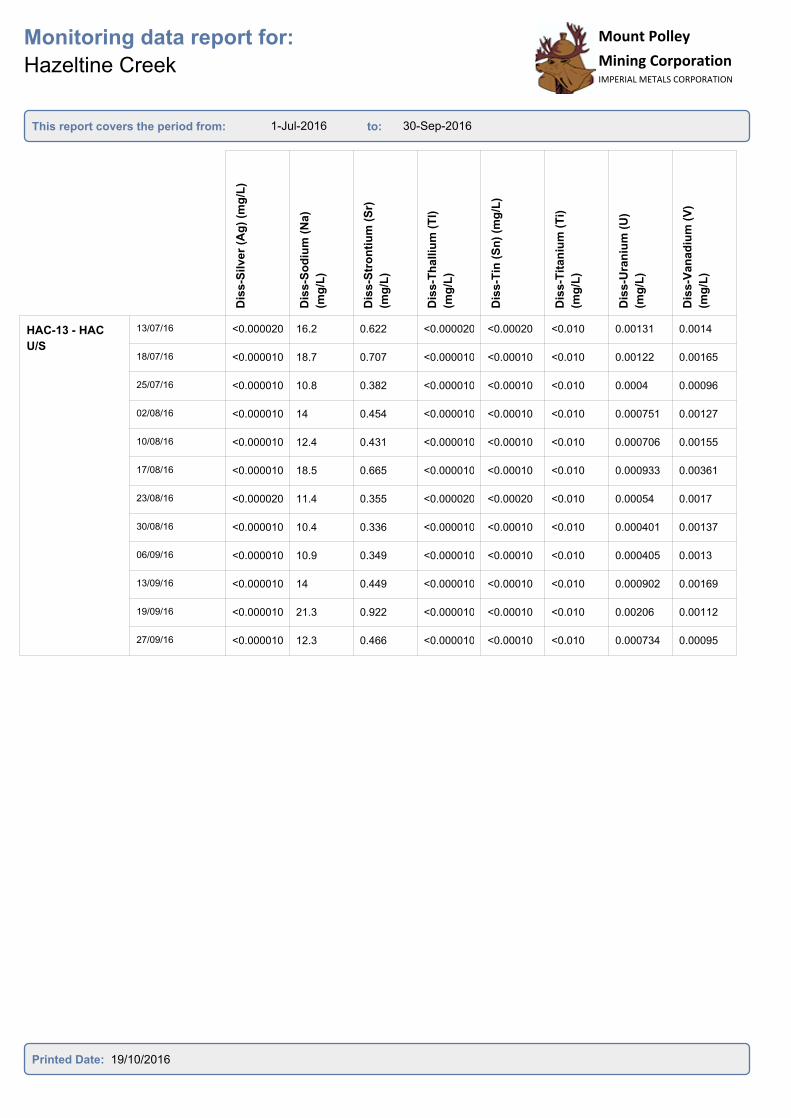
1-Jul-2016 30-Sep-2016
Monitoring data report for:
Hazeltine Creek
This report covers the period from: to:
Mount Polley
Mining CorporationIMPERIAL METALS CORPORATION
Mount Polley
Mining CorporationIMPERIAL METALS CORPORATION
Dis
s-S
ilv
er
(Ag
) (m
g/L
)
Dis
s-S
od
ium
(N
a)
(mg
/L)
Dis
s-S
tro
nti
um
(S
r)
(mg
/L)
Dis
s-T
halliu
m (
Tl)
(mg
/L)
Dis
s-T
in (
Sn
) (m
g/L
)
Dis
s-T
itan
ium
(T
i)
(mg
/L)
Dis
s-U
ran
ium
(U
)
(mg
/L)
Dis
s-V
an
ad
ium
(V
)
(mg
/L)
HAC-13 - HAC
U/S
13/07/16 <0.000020 16.2 0.622 <0.000020 <0.00020 <0.010 0.00131 0.0014
18/07/16 <0.000010 18.7 0.707 <0.000010 <0.00010 <0.010 0.00122 0.00165
25/07/16 <0.000010 10.8 0.382 <0.000010 <0.00010 <0.010 0.0004 0.00096
02/08/16 <0.000010 14 0.454 <0.000010 <0.00010 <0.010 0.000751 0.00127
10/08/16 <0.000010 12.4 0.431 <0.000010 <0.00010 <0.010 0.000706 0.00155
17/08/16 <0.000010 18.5 0.665 <0.000010 <0.00010 <0.010 0.000933 0.00361
23/08/16 <0.000020 11.4 0.355 <0.000020 <0.00020 <0.010 0.00054 0.0017
30/08/16 <0.000010 10.4 0.336 <0.000010 <0.00010 <0.010 0.000401 0.00137
06/09/16 <0.000010 10.9 0.349 <0.000010 <0.00010 <0.010 0.000405 0.0013
13/09/16 <0.000010 14 0.449 <0.000010 <0.00010 <0.010 0.000902 0.00169
19/09/16 <0.000010 21.3 0.922 <0.000010 <0.00010 <0.010 0.00206 0.00112
27/09/16 <0.000010 12.3 0.466 <0.000010 <0.00010 <0.010 0.000734 0.00095
Printed Date: 19/10/2016
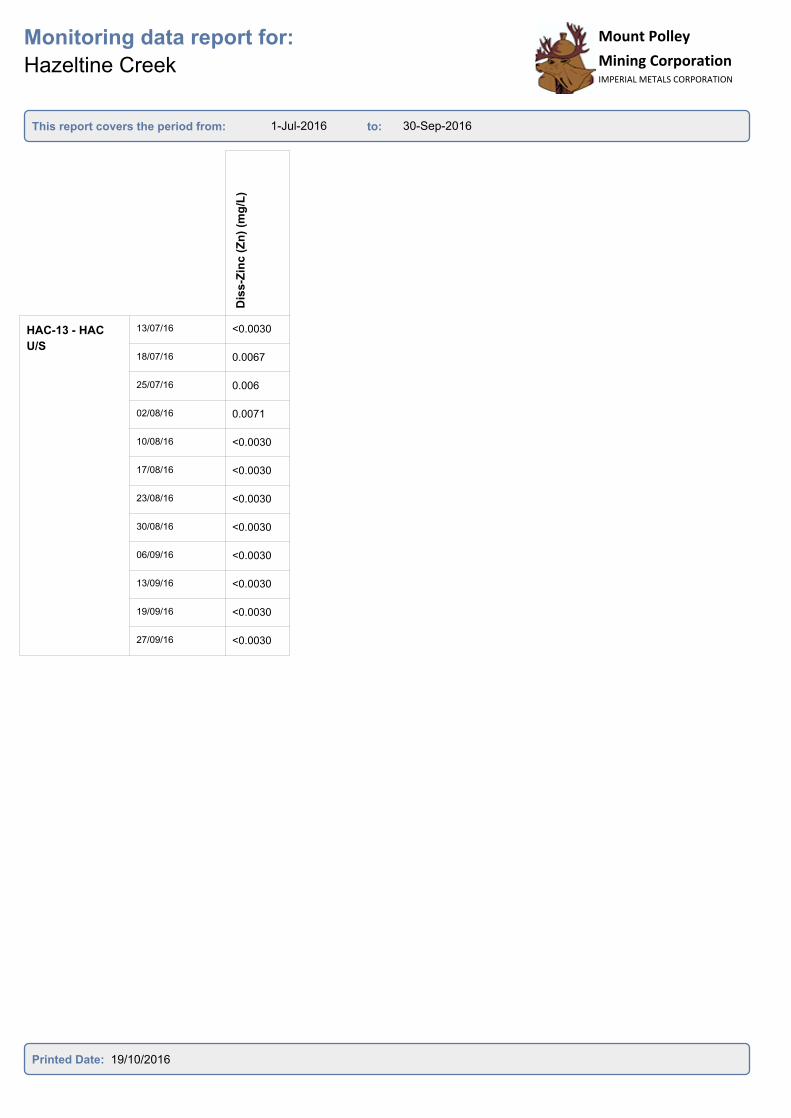
1-Jul-2016 30-Sep-2016
Monitoring data report for:
Hazeltine Creek
This report covers the period from: to:
Mount Polley
Mining CorporationIMPERIAL METALS CORPORATION
Mount Polley
Mining CorporationIMPERIAL METALS CORPORATION
Dis
s-Z
inc (
Zn
) (m
g/L
)
HAC-13 - HAC
U/S
13/07/16 <0.0030
18/07/16 0.0067
25/07/16 0.006
02/08/16 0.0071
10/08/16 <0.0030
17/08/16 <0.0030
23/08/16 <0.0030
30/08/16 <0.0030
06/09/16 <0.0030
13/09/16 <0.0030
19/09/16 <0.0030
27/09/16 <0.0030
Printed Date: 19/10/2016
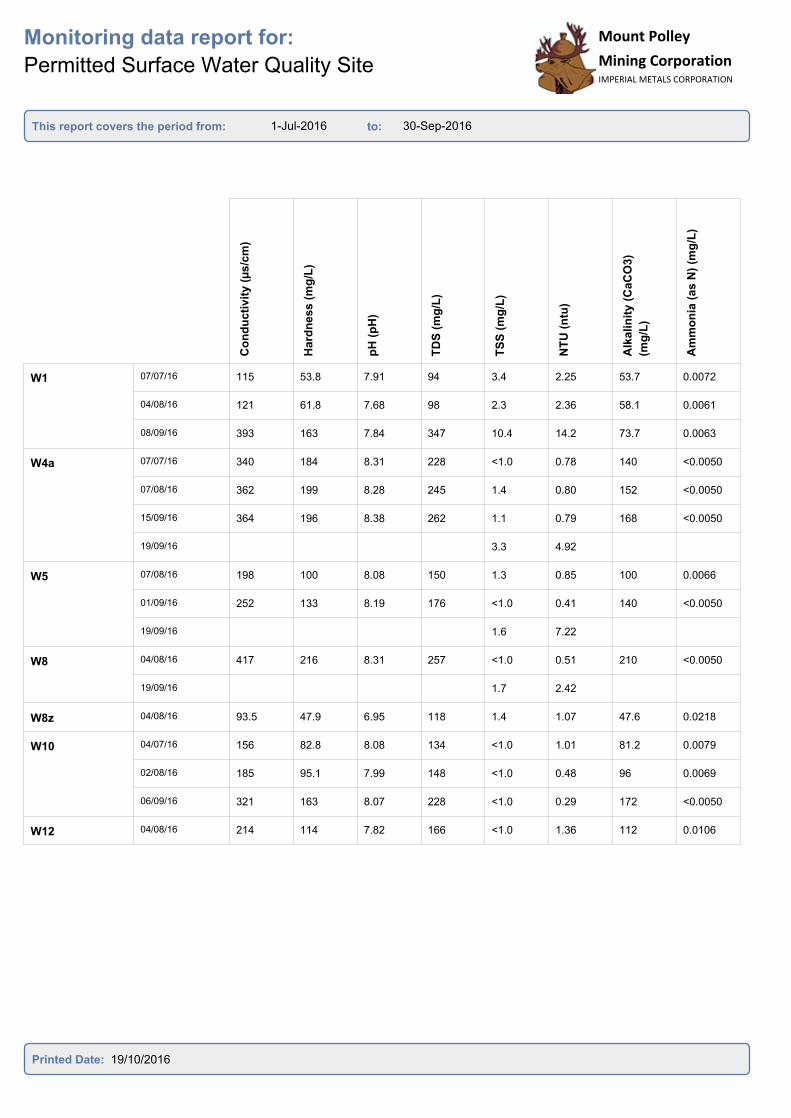
1-Jul-2016 30-Sep-2016
Monitoring data report for:
Permitted Surface Water Quality Site
This report covers the period from: to:
Mount Polley
Mining CorporationIMPERIAL METALS CORPORATION
Co
nd
ucti
vit
y (
µs/c
m)
Hard
nes
s (
mg
/L)
pH
(p
H)
TD
S (
mg
/L)
TS
S (
mg
/L)
NT
U (
ntu
)
Alk
alin
ity
(C
aC
O3)
(mg
/L)
Am
mo
nia
(a
s N
) (m
g/L
)
W1 07/07/16 115 53.8 7.91 94 3.4 2.25 53.7 0.0072
04/08/16 121 61.8 7.68 98 2.3 2.36 58.1 0.0061
08/09/16 393 163 7.84 347 10.4 14.2 73.7 0.0063
W4a 07/07/16 340 184 8.31 228 <1.0 0.78 140 <0.0050
07/08/16 362 199 8.28 245 1.4 0.80 152 <0.0050
15/09/16 364 196 8.38 262 1.1 0.79 168 <0.0050
19/09/16 3.3 4.92
W5 07/08/16 198 100 8.08 150 1.3 0.85 100 0.0066
01/09/16 252 133 8.19 176 <1.0 0.41 140 <0.0050
19/09/16 1.6 7.22
W8 04/08/16 417 216 8.31 257 <1.0 0.51 210 <0.0050
19/09/16 1.7 2.42
W8z 04/08/16 93.5 47.9 6.95 118 1.4 1.07 47.6 0.0218
W10 04/07/16 156 82.8 8.08 134 <1.0 1.01 81.2 0.0079
02/08/16 185 95.1 7.99 148 <1.0 0.48 96 0.0069
06/09/16 321 163 8.07 228 <1.0 0.29 172 <0.0050
W12 04/08/16 214 114 7.82 166 <1.0 1.36 112 0.0106
Printed Date: 19/10/2016

1-Jul-2016 30-Sep-2016
Monitoring data report for:
Permitted Surface Water Quality Site
This report covers the period from: to:
Mount Polley
Mining CorporationIMPERIAL METALS CORPORATION
Mount Polley
Mining CorporationIMPERIAL METALS CORPORATION
Ch
lori
de (
mg
/L)
Flo
rid
e (
mg
/L)
Nit
rate
(N
) (m
g/L
)
Nit
rate
an
d N
itri
te
(mg
/L)
Nit
rite
(N
) (m
g/L
)
Dis
s-O
rth
op
ho
sp
hate
(mg
/L)
Dis
s-P
ho
sp
ho
rus
(mg
/L)
To
tal P
ho
sp
ho
rus
(mg
/L)
W1 07/07/16 0.91 0.056 0.0132 0.0144 0.0012 0.0032 0.0071 0.0135
04/08/16 0.99 0.060 0.0252 0.0252 <0.0010 0.0034 0.0077 0.0179
08/09/16 73.9 0.051 0.0143 0.0143 <0.0010 0.0034 0.0084 0.0329
W4a 07/07/16 <0.50 0.075 0.0537 0.0537 <0.0010 0.0121 0.0119 0.0158
07/08/16 0.57 0.076 0.0388 0.0388 <0.0010 0.0102 0.0116 0.0137
15/09/16 0.52 0.082 0.0273 0.0273 <0.0010 0.0141 0.0136 0.0194
19/09/16
W5 07/08/16 <0.50 0.088 0.0243 0.0243 <0.0010 0.0070 0.0143 0.0165
01/09/16 <0.50 0.103 0.0228 0.0228 <0.0010 0.0081 0.012 0.0153
19/09/16
W8 04/08/16 7.97 0.130 0.0392 0.0392 <0.0010 0.0171 0.0249 0.0224
19/09/16
W8z 04/08/16 <0.50 0.034 0.0070 0.0070 <0.0010 0.0030 0.0152 0.0135
W10 04/07/16 <0.50 0.057 0.0187 0.0187 <0.0010 0.0038 0.0118 0.0143
02/08/16 <0.50 0.062 0.0172 0.0172 <0.0010 0.0035 0.0087 0.0105
06/09/16 1.34 0.098 0.0086 0.0086 <0.0010 0.0019 0.0048 0.006
W12 04/08/16 <0.50 0.077 0.0070 0.0070 <0.0010 0.0029 0.0081 0.0148
Printed Date: 19/10/2016

1-Jul-2016 30-Sep-2016
Monitoring data report for:
Permitted Surface Water Quality Site
This report covers the period from: to:
Mount Polley
Mining CorporationIMPERIAL METALS CORPORATION
Mount Polley
Mining CorporationIMPERIAL METALS CORPORATION
Su
lph
ate
(m
g/L
)
To
tal N
itro
ge
n (
mg
/L)
Dis
so
lved
Org
an
ic C
a
(mg
/L)
To
tal A
lum
inu
m (
mg
/L)
An
tim
on
y (
Sb
)-T
ota
l
(mg
/L)
Ars
en
ic (
As)-
To
tal
(mg
/L)
Bari
um
(B
a)-
To
tal
(mg
/L)
Bery
lliu
m (
Be)-
To
tal
(mg
/L)
W1 07/07/16 4.54 0.38 8.96 0.175 <0.00010 0.00048 0.0158 <0.00010
04/08/16 3.84 0.327 8.55 0.126 <0.00010 0.00057 0.0160 <0.00010
08/09/16 7.63 0.302 7.53 0.728 <0.00010 0.00076 0.0483 <0.00010
W4a 07/07/16 42.8 0.129 3.41 0.0641 <0.00010 0.00032 0.0204 <0.00010
07/08/16 41.9 0.106 3.03 0.0402 <0.00010 0.00030 0.0209 <0.00010
15/09/16 38.7 0.071 3.48 0.0547 <0.00010 0.00032 0.0223 <0.00010
19/09/16
W5 07/08/16 3.22 0.353 11.1 0.0430 <0.00010 0.00045 0.0196 <0.00010
01/09/16 3.86 0.226 7.99 0.0245 <0.00010 0.0004 0.0208 <0.00010
19/09/16
W8 04/08/16 10.4 0.186 5.39 0.0206 <0.00010 0.00139 0.0110 <0.00010
19/09/16
W8z 04/08/16 <0.30 0.725 23.6 0.234 0.00011 0.00051 0.0116 <0.00010
W10 04/07/16 1.71 0.641 19.2 0.0657 <0.00010 0.00111 0.0137 <0.00010
02/08/16 2.56 0.57 18.2 0.0368 <0.00010 0.00136 0.0144 <0.00010
06/09/16 9.71 0.241 7.76 0.0132 <0.00010 0.00227 0.0279 <0.00010
W12 04/08/16 4.24 0.456 13.7 0.0331 <0.00010 0.00055 0.0130 <0.00010
Printed Date: 19/10/2016
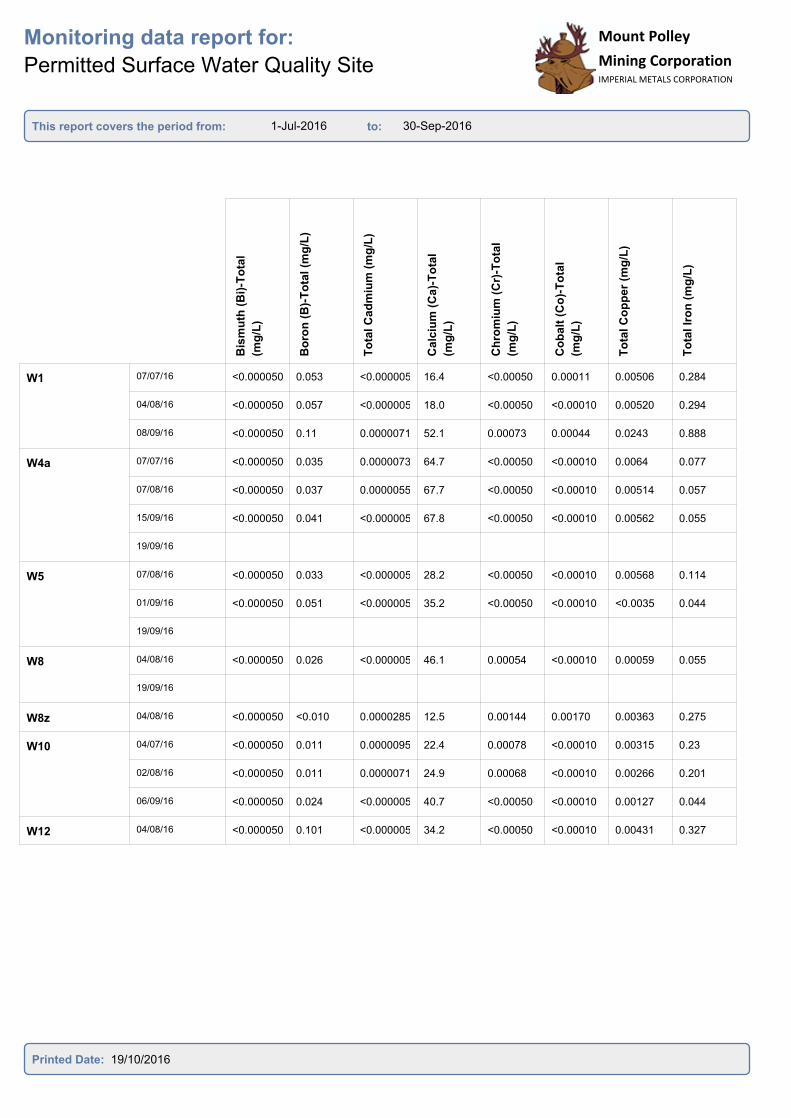
1-Jul-2016 30-Sep-2016
Monitoring data report for:
Permitted Surface Water Quality Site
This report covers the period from: to:
Mount Polley
Mining CorporationIMPERIAL METALS CORPORATION
Mount Polley
Mining CorporationIMPERIAL METALS CORPORATION
Bis
mu
th (
Bi)
-To
tal
(mg
/L)
Bo
ron
(B
)-T
ota
l (m
g/L
)
To
tal C
ad
miu
m (
mg
/L)
Calc
ium
(C
a)-
To
tal
(mg
/L)
Ch
rom
ium
(C
r)-T
ota
l
(mg
/L)
Co
balt
(C
o)-
To
tal
(mg
/L)
To
tal C
op
per
(mg
/L)
To
tal Ir
on
(m
g/L
)
W1 07/07/16 <0.000050 0.053 <0.000005 16.4 <0.00050 0.00011 0.00506 0.284
04/08/16 <0.000050 0.057 <0.000005 18.0 <0.00050 <0.00010 0.00520 0.294
08/09/16 <0.000050 0.11 0.0000071 52.1 0.00073 0.00044 0.0243 0.888
W4a 07/07/16 <0.000050 0.035 0.0000073 64.7 <0.00050 <0.00010 0.0064 0.077
07/08/16 <0.000050 0.037 0.0000055 67.7 <0.00050 <0.00010 0.00514 0.057
15/09/16 <0.000050 0.041 <0.000005 67.8 <0.00050 <0.00010 0.00562 0.055
19/09/16
W5 07/08/16 <0.000050 0.033 <0.000005 28.2 <0.00050 <0.00010 0.00568 0.114
01/09/16 <0.000050 0.051 <0.000005 35.2 <0.00050 <0.00010 <0.0035 0.044
19/09/16
W8 04/08/16 <0.000050 0.026 <0.000005 46.1 0.00054 <0.00010 0.00059 0.055
19/09/16
W8z 04/08/16 <0.000050 <0.010 0.0000285 12.5 0.00144 0.00170 0.00363 0.275
W10 04/07/16 <0.000050 0.011 0.0000095 22.4 0.00078 <0.00010 0.00315 0.23
02/08/16 <0.000050 0.011 0.0000071 24.9 0.00068 <0.00010 0.00266 0.201
06/09/16 <0.000050 0.024 <0.000005 40.7 <0.00050 <0.00010 0.00127 0.044
W12 04/08/16 <0.000050 0.101 <0.000005 34.2 <0.00050 <0.00010 0.00431 0.327
Printed Date: 19/10/2016
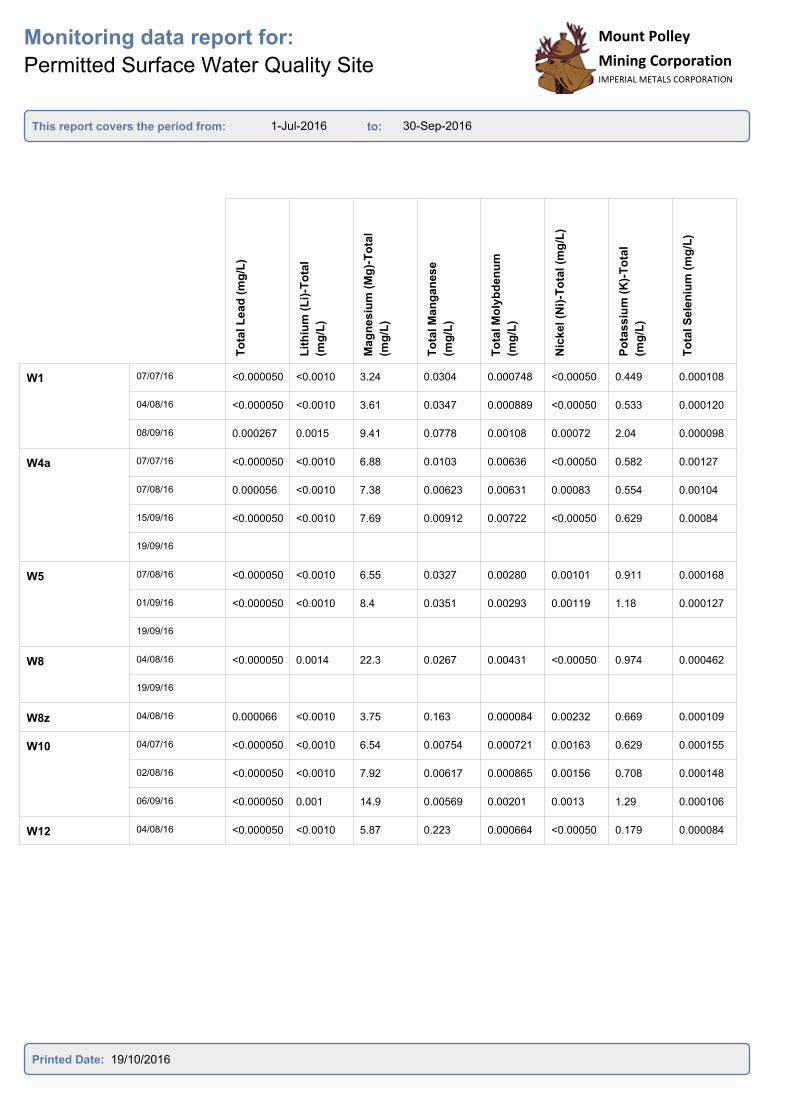
1-Jul-2016 30-Sep-2016
Monitoring data report for:
Permitted Surface Water Quality Site
This report covers the period from: to:
Mount Polley
Mining CorporationIMPERIAL METALS CORPORATION
Mount Polley
Mining CorporationIMPERIAL METALS CORPORATION
To
tal L
ea
d (
mg
/L)
Lit
hiu
m (
Li)
-To
tal
(mg
/L)
Mag
nes
ium
(M
g)-
To
tal
(mg
/L)
To
tal M
an
ga
nese
(mg
/L)
To
tal M
oly
bd
en
um
(mg
/L)
Nic
ke
l (N
i)-T
ota
l (m
g/L
)
Po
tas
siu
m (
K)-
To
tal
(mg
/L)
To
tal S
ele
niu
m (
mg
/L)
W1 07/07/16 <0.000050 <0.0010 3.24 0.0304 0.000748 <0.00050 0.449 0.000108
04/08/16 <0.000050 <0.0010 3.61 0.0347 0.000889 <0.00050 0.533 0.000120
08/09/16 0.000267 0.0015 9.41 0.0778 0.00108 0.00072 2.04 0.000098
W4a 07/07/16 <0.000050 <0.0010 6.88 0.0103 0.00636 <0.00050 0.582 0.00127
07/08/16 0.000056 <0.0010 7.38 0.00623 0.00631 0.00083 0.554 0.00104
15/09/16 <0.000050 <0.0010 7.69 0.00912 0.00722 <0.00050 0.629 0.00084
19/09/16
W5 07/08/16 <0.000050 <0.0010 6.55 0.0327 0.00280 0.00101 0.911 0.000168
01/09/16 <0.000050 <0.0010 8.4 0.0351 0.00293 0.00119 1.18 0.000127
19/09/16
W8 04/08/16 <0.000050 0.0014 22.3 0.0267 0.00431 <0.00050 0.974 0.000462
19/09/16
W8z 04/08/16 0.000066 <0.0010 3.75 0.163 0.000084 0.00232 0.669 0.000109
W10 04/07/16 <0.000050 <0.0010 6.54 0.00754 0.000721 0.00163 0.629 0.000155
02/08/16 <0.000050 <0.0010 7.92 0.00617 0.000865 0.00156 0.708 0.000148
06/09/16 <0.000050 0.001 14.9 0.00569 0.00201 0.0013 1.29 0.000106
W12 04/08/16 <0.000050 <0.0010 5.87 0.223 0.000664 <0.00050 0.179 0.000084
Printed Date: 19/10/2016

1-Jul-2016 30-Sep-2016
Monitoring data report for:
Permitted Surface Water Quality Site
This report covers the period from: to:
Mount Polley
Mining CorporationIMPERIAL METALS CORPORATION
Mount Polley
Mining CorporationIMPERIAL METALS CORPORATION
Silic
on
(S
i)-T
ota
l (m
g/L
)
Silve
r (A
g)-
To
tal (m
g/L
)
So
diu
m (
Na)-
To
tal
(mg
/L)
Str
on
tiu
m (
Sr)
-To
tal
(mg
/L)
Th
alliu
m (
Tl)
-To
tal
(mg
/L)
Tin
(S
n)-
To
tal (m
g/L
)
Tit
an
ium
(T
i)-T
ota
l
(mg
/L)
Ura
niu
m (
U)-
To
tal
(mg
/L)
W1 07/07/16 2.94 <0.000010 2.81 0.131 <0.000010 <0.00010 <0.010 0.000047
04/08/16 2.84 <0.000010 2.96 0.130 <0.000010 <0.00010 <0.010 0.000058
08/09/16 5.63 <0.000010 7.37 0.544 <0.000010 <0.00010 0.029 0.000092
W4a 07/07/16 7.06 <0.000010 3.2 0.255 <0.000010 <0.00010 <0.010 0.000246
07/08/16 7.43 <0.000010 3.30 0.279 <0.000010 <0.00010 <0.010 0.000283
15/09/16 7.13 <0.000010 3.73 0.302 <0.000010 <0.00010 <0.010 0.000311
19/09/16
W5 07/08/16 6.71 <0.000010 5.29 0.248 <0.000010 <0.00010 <0.010 0.000190
01/09/16 6.83 <0.000010 7.08 0.293 <0.000010 <0.00010 <0.010 0.00032
19/09/16
W8 04/08/16 8.64 <0.000010 9.30 0.413 <0.000010 <0.00010 <0.010 0.000893
19/09/16
W8z 04/08/16 5.49 0.000041 3.37 0.158 0.000014 <0.00010 <0.010 0.000086
W10 04/07/16 4.45 <0.000010 3.6 0.148 <0.000010 <0.00010 <0.010 0.000095
02/08/16 4.67 <0.000010 4.52 0.17 <0.000010 <0.00010 <0.010 0.000123
06/09/16 4.81 <0.000010 9.74 0.318 <0.000010 <0.00010 <0.010 0.000309
W12 04/08/16 6.68 <0.000010 5.10 0.167 <0.000010 <0.00010 <0.010 0.000044
Printed Date: 19/10/2016
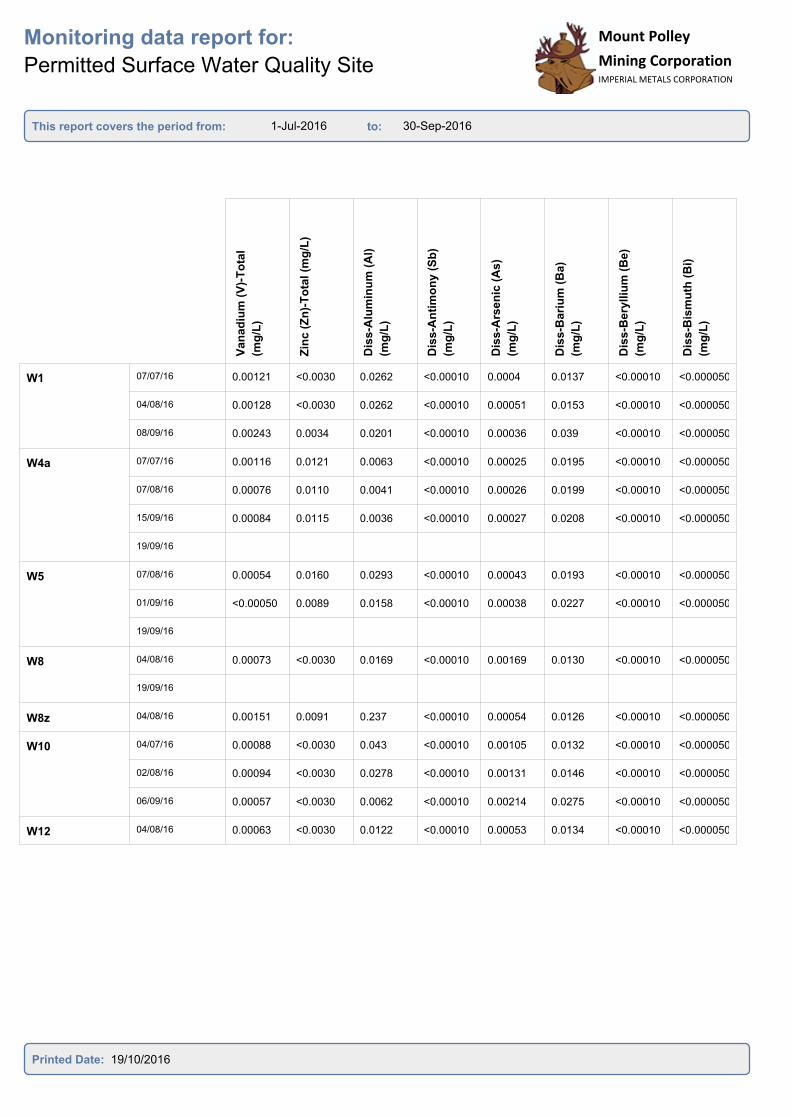
1-Jul-2016 30-Sep-2016
Monitoring data report for:
Permitted Surface Water Quality Site
This report covers the period from: to:
Mount Polley
Mining CorporationIMPERIAL METALS CORPORATION
Mount Polley
Mining CorporationIMPERIAL METALS CORPORATION
Van
ad
ium
(V
)-T
ota
l
(mg
/L)
Zin
c (
Zn
)-T
ota
l (m
g/L
)
Dis
s-A
lum
inu
m (
Al)
(mg
/L)
Dis
s-A
nti
mo
ny
(S
b)
(mg
/L)
Dis
s-A
rsen
ic (
As
)
(mg
/L)
Dis
s-B
ari
um
(B
a)
(mg
/L)
Dis
s-B
ery
lliu
m (
Be)
(mg
/L)
Dis
s-B
ism
uth
(B
i)
(mg
/L)
W1 07/07/16 0.00121 <0.0030 0.0262 <0.00010 0.0004 0.0137 <0.00010 <0.000050
04/08/16 0.00128 <0.0030 0.0262 <0.00010 0.00051 0.0153 <0.00010 <0.000050
08/09/16 0.00243 0.0034 0.0201 <0.00010 0.00036 0.039 <0.00010 <0.000050
W4a 07/07/16 0.00116 0.0121 0.0063 <0.00010 0.00025 0.0195 <0.00010 <0.000050
07/08/16 0.00076 0.0110 0.0041 <0.00010 0.00026 0.0199 <0.00010 <0.000050
15/09/16 0.00084 0.0115 0.0036 <0.00010 0.00027 0.0208 <0.00010 <0.000050
19/09/16
W5 07/08/16 0.00054 0.0160 0.0293 <0.00010 0.00043 0.0193 <0.00010 <0.000050
01/09/16 <0.00050 0.0089 0.0158 <0.00010 0.00038 0.0227 <0.00010 <0.000050
19/09/16
W8 04/08/16 0.00073 <0.0030 0.0169 <0.00010 0.00169 0.0130 <0.00010 <0.000050
19/09/16
W8z 04/08/16 0.00151 0.0091 0.237 <0.00010 0.00054 0.0126 <0.00010 <0.000050
W10 04/07/16 0.00088 <0.0030 0.043 <0.00010 0.00105 0.0132 <0.00010 <0.000050
02/08/16 0.00094 <0.0030 0.0278 <0.00010 0.00131 0.0146 <0.00010 <0.000050
06/09/16 0.00057 <0.0030 0.0062 <0.00010 0.00214 0.0275 <0.00010 <0.000050
W12 04/08/16 0.00063 <0.0030 0.0122 <0.00010 0.00053 0.0134 <0.00010 <0.000050
Printed Date: 19/10/2016
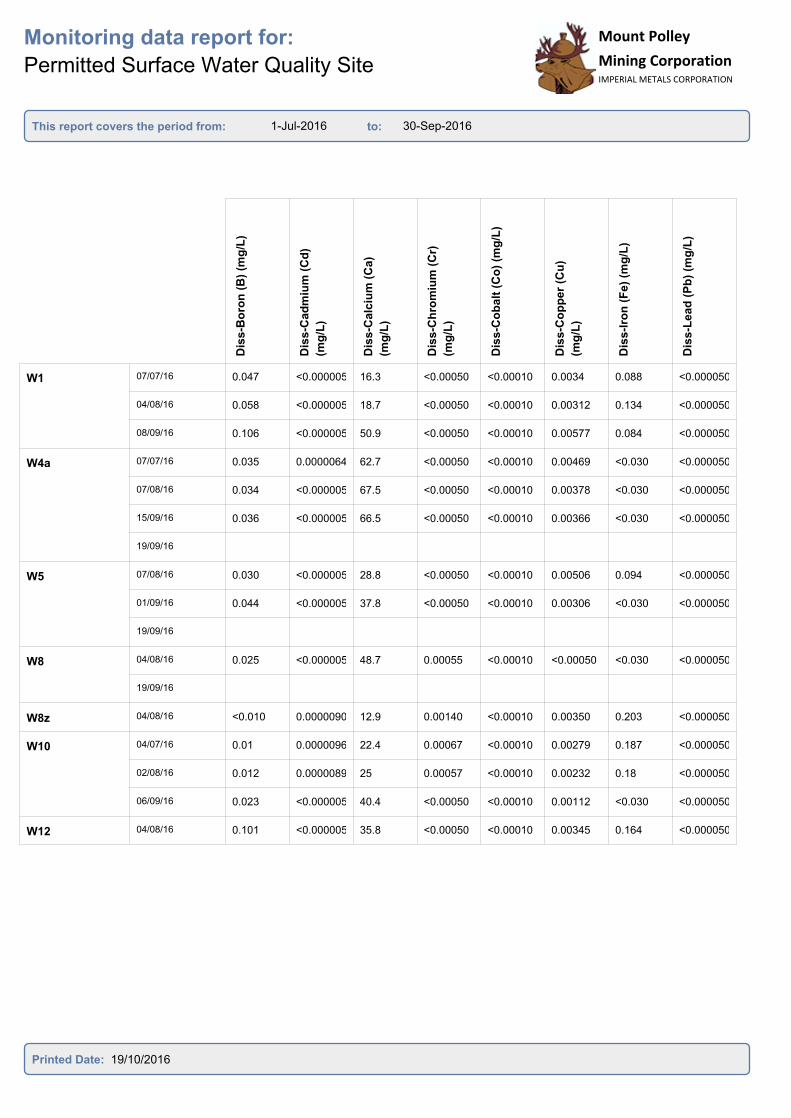
1-Jul-2016 30-Sep-2016
Monitoring data report for:
Permitted Surface Water Quality Site
This report covers the period from: to:
Mount Polley
Mining CorporationIMPERIAL METALS CORPORATION
Mount Polley
Mining CorporationIMPERIAL METALS CORPORATION
Dis
s-B
oro
n (
B)
(mg
/L)
Dis
s-C
ad
miu
m (
Cd
)
(mg
/L)
Dis
s-C
alc
ium
(C
a)
(mg
/L)
Dis
s-C
hro
miu
m (
Cr)
(mg
/L)
Dis
s-C
ob
alt
(C
o)
(mg
/L)
Dis
s-C
op
pe
r (C
u)
(mg
/L)
Dis
s-I
ron
(F
e)
(mg
/L)
Dis
s-L
ead
(P
b)
(mg
/L)
W1 07/07/16 0.047 <0.000005 16.3 <0.00050 <0.00010 0.0034 0.088 <0.000050
04/08/16 0.058 <0.000005 18.7 <0.00050 <0.00010 0.00312 0.134 <0.000050
08/09/16 0.106 <0.000005 50.9 <0.00050 <0.00010 0.00577 0.084 <0.000050
W4a 07/07/16 0.035 0.0000064 62.7 <0.00050 <0.00010 0.00469 <0.030 <0.000050
07/08/16 0.034 <0.000005 67.5 <0.00050 <0.00010 0.00378 <0.030 <0.000050
15/09/16 0.036 <0.000005 66.5 <0.00050 <0.00010 0.00366 <0.030 <0.000050
19/09/16
W5 07/08/16 0.030 <0.000005 28.8 <0.00050 <0.00010 0.00506 0.094 <0.000050
01/09/16 0.044 <0.000005 37.8 <0.00050 <0.00010 0.00306 <0.030 <0.000050
19/09/16
W8 04/08/16 0.025 <0.000005 48.7 0.00055 <0.00010 <0.00050 <0.030 <0.000050
19/09/16
W8z 04/08/16 <0.010 0.0000090 12.9 0.00140 <0.00010 0.00350 0.203 <0.000050
W10 04/07/16 0.01 0.0000096 22.4 0.00067 <0.00010 0.00279 0.187 <0.000050
02/08/16 0.012 0.0000089 25 0.00057 <0.00010 0.00232 0.18 <0.000050
06/09/16 0.023 <0.000005 40.4 <0.00050 <0.00010 0.00112 <0.030 <0.000050
W12 04/08/16 0.101 <0.000005 35.8 <0.00050 <0.00010 0.00345 0.164 <0.000050
Printed Date: 19/10/2016

1-Jul-2016 30-Sep-2016
Monitoring data report for:
Permitted Surface Water Quality Site
This report covers the period from: to:
Mount Polley
Mining CorporationIMPERIAL METALS CORPORATION
Mount Polley
Mining CorporationIMPERIAL METALS CORPORATION
Dis
s-L
ith
ium
(L
i) (
mg
/L)
Dis
s-M
ag
nesiu
m (
Mg
)
(mg
/L)
Dis
s-M
an
gan
ese
(M
n)
(mg
/L)
Dis
s-M
oly
bd
en
um
(M
o)
(mg
/L)
Dis
s-N
ickel (N
i) (
mg
/L)
Dis
s-P
ota
ssiu
m (
K)
(mg
/L)
Dis
s-S
ele
niu
m (
mg
/L)
Dis
s-S
ilic
on
(S
i) (
mg
/L)
W1 07/07/16 <0.0010 3.18 0.00208 0.000718 <0.00050 0.424 0.000086 2.65
04/08/16 <0.0010 3.66 0.0139 0.000938 <0.00050 0.554 0.000098 2.65
08/09/16 <0.0010 8.79 0.00863 0.00102 <0.00050 1.85 0.000071 4.26
W4a 07/07/16 <0.0010 6.57 0.00514 0.00633 <0.00050 0.564 0.00132 6.72
07/08/16 <0.0010 7.37 0.00168 0.00576 <0.00050 0.524 0.00109 7.44
15/09/16 <0.0010 7.2 0.00425 0.00681 <0.00050 0.591 0.000773 6.55
19/09/16
W5 07/08/16 <0.0010 6.80 0.0275 0.00206 0.00074 0.903 0.000163 6.92
01/09/16 <0.0010 9.26 0.0302 0.00272 0.00066 1.32 0.000138 6.89
19/09/16
W8 04/08/16 0.0016 23.0 0.0195 0.00420 <0.00050 1.10 0.000457 8.68
19/09/16
W8z 04/08/16 <0.0010 3.80 0.00544 0.000067 0.00245 0.762 0.000123 5.50
W10 04/07/16 <0.0010 6.54 0.00466 0.000686 0.00151 0.626 0.000152 4.41
02/08/16 <0.0010 7.92 0.00478 0.000835 0.00145 0.731 0.000136 4.64
06/09/16 0.001 15.1 0.00312 0.00195 0.00083 1.31 0.000108 4.98
W12 04/08/16 <0.0010 5.93 0.150 0.000658 <0.00050 0.217 0.000076 6.62
Printed Date: 19/10/2016
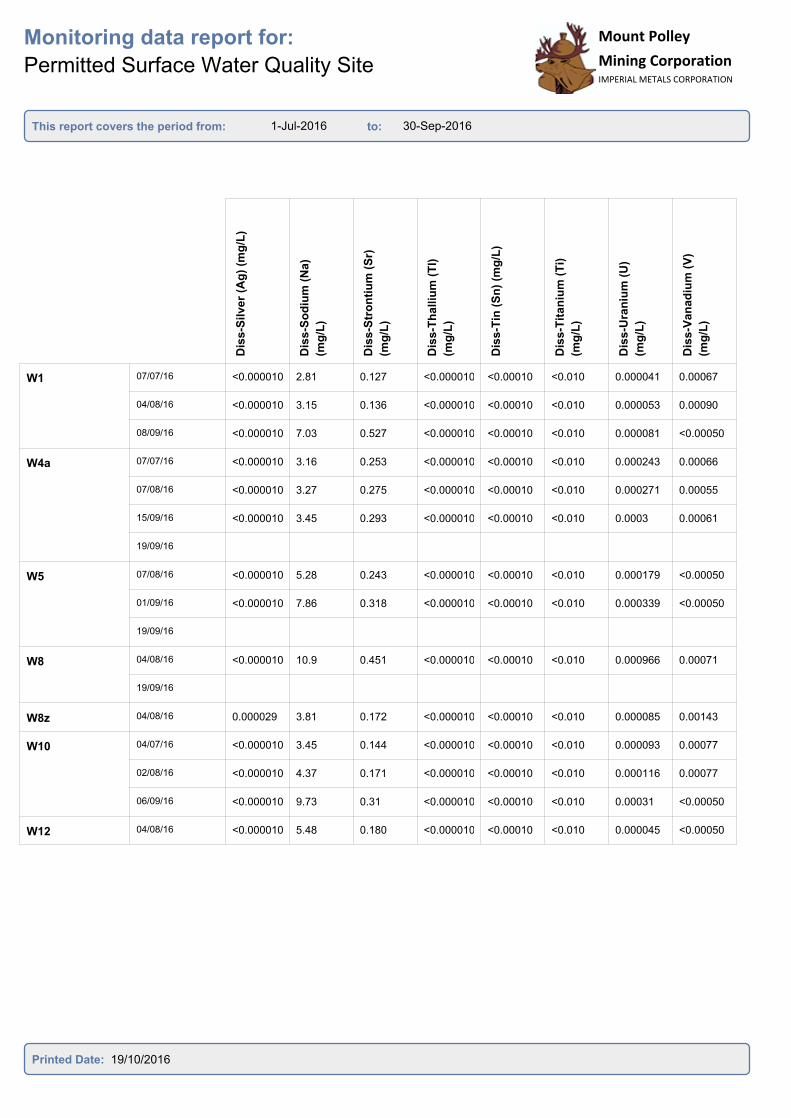
1-Jul-2016 30-Sep-2016
Monitoring data report for:
Permitted Surface Water Quality Site
This report covers the period from: to:
Mount Polley
Mining CorporationIMPERIAL METALS CORPORATION
Mount Polley
Mining CorporationIMPERIAL METALS CORPORATION
Dis
s-S
ilv
er
(Ag
) (m
g/L
)
Dis
s-S
od
ium
(N
a)
(mg
/L)
Dis
s-S
tro
nti
um
(S
r)
(mg
/L)
Dis
s-T
halliu
m (
Tl)
(mg
/L)
Dis
s-T
in (
Sn
) (m
g/L
)
Dis
s-T
itan
ium
(T
i)
(mg
/L)
Dis
s-U
ran
ium
(U
)
(mg
/L)
Dis
s-V
an
ad
ium
(V
)
(mg
/L)
W1 07/07/16 <0.000010 2.81 0.127 <0.000010 <0.00010 <0.010 0.000041 0.00067
04/08/16 <0.000010 3.15 0.136 <0.000010 <0.00010 <0.010 0.000053 0.00090
08/09/16 <0.000010 7.03 0.527 <0.000010 <0.00010 <0.010 0.000081 <0.00050
W4a 07/07/16 <0.000010 3.16 0.253 <0.000010 <0.00010 <0.010 0.000243 0.00066
07/08/16 <0.000010 3.27 0.275 <0.000010 <0.00010 <0.010 0.000271 0.00055
15/09/16 <0.000010 3.45 0.293 <0.000010 <0.00010 <0.010 0.0003 0.00061
19/09/16
W5 07/08/16 <0.000010 5.28 0.243 <0.000010 <0.00010 <0.010 0.000179 <0.00050
01/09/16 <0.000010 7.86 0.318 <0.000010 <0.00010 <0.010 0.000339 <0.00050
19/09/16
W8 04/08/16 <0.000010 10.9 0.451 <0.000010 <0.00010 <0.010 0.000966 0.00071
19/09/16
W8z 04/08/16 0.000029 3.81 0.172 <0.000010 <0.00010 <0.010 0.000085 0.00143
W10 04/07/16 <0.000010 3.45 0.144 <0.000010 <0.00010 <0.010 0.000093 0.00077
02/08/16 <0.000010 4.37 0.171 <0.000010 <0.00010 <0.010 0.000116 0.00077
06/09/16 <0.000010 9.73 0.31 <0.000010 <0.00010 <0.010 0.00031 <0.00050
W12 04/08/16 <0.000010 5.48 0.180 <0.000010 <0.00010 <0.010 0.000045 <0.00050
Printed Date: 19/10/2016
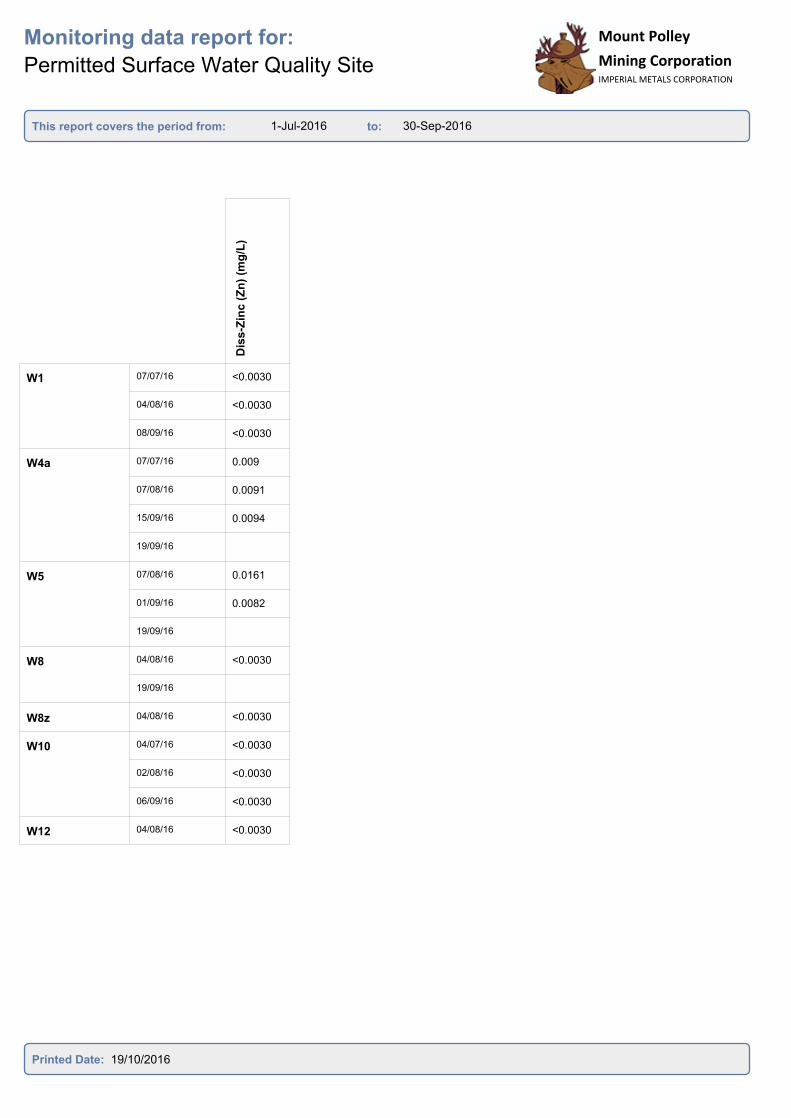
1-Jul-2016 30-Sep-2016
Monitoring data report for:
Permitted Surface Water Quality Site
This report covers the period from: to:
Mount Polley
Mining CorporationIMPERIAL METALS CORPORATION
Mount Polley
Mining CorporationIMPERIAL METALS CORPORATION
Dis
s-Z
inc (
Zn
) (m
g/L
)
W1 07/07/16 <0.0030
04/08/16 <0.0030
08/09/16 <0.0030
W4a 07/07/16 0.009
07/08/16 0.0091
15/09/16 0.0094
19/09/16
W5 07/08/16 0.0161
01/09/16 0.0082
19/09/16
W8 04/08/16 <0.0030
19/09/16
W8z 04/08/16 <0.0030
W10 04/07/16 <0.0030
02/08/16 <0.0030
06/09/16 <0.0030
W12 04/08/16 <0.0030
Printed Date: 19/10/2016
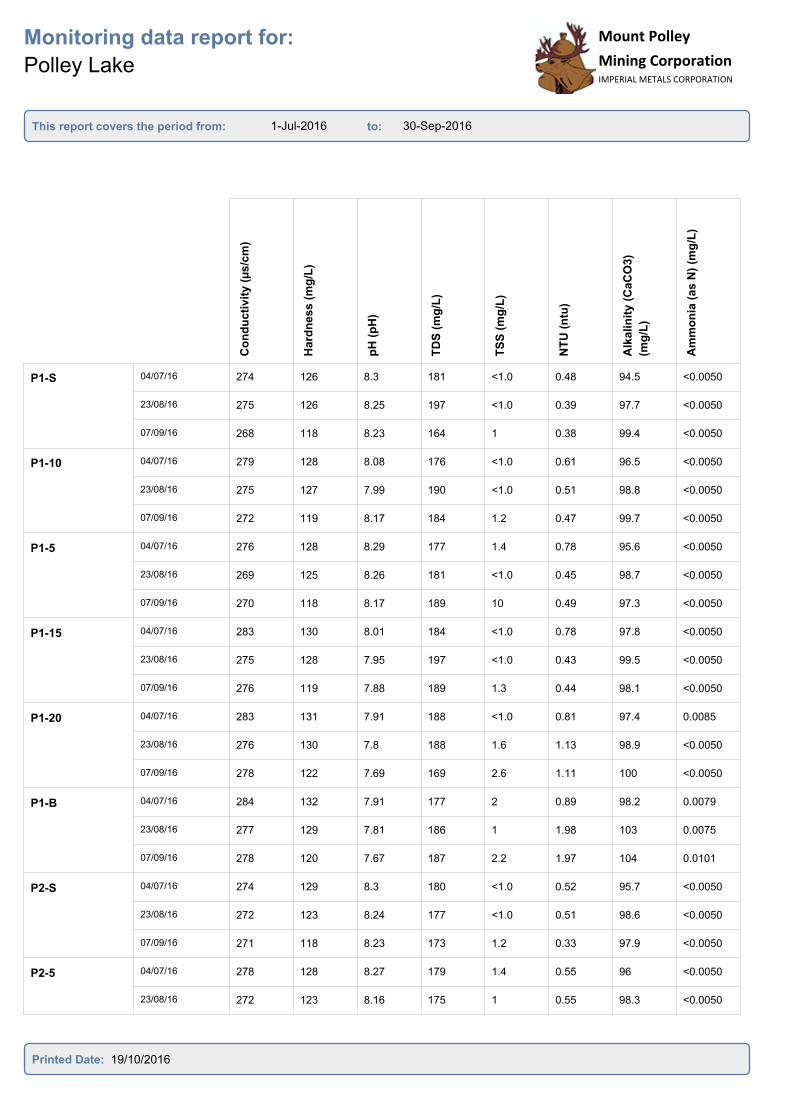
1-Jul-2016 30-Sep-2016
Monitoring data report for:
Polley Lake
This report covers the period from: to:
Mount Polley
Mining CorporationIMPERIAL METALS CORPORATION
Co
nd
ucti
vit
y (
µs/c
m)
Hard
nes
s (
mg
/L)
pH
(p
H)
TD
S (
mg
/L)
TS
S (
mg
/L)
NT
U (
ntu
)
Alk
alin
ity
(C
aC
O3)
(mg
/L)
Am
mo
nia
(a
s N
) (m
g/L
)
P1-S 04/07/16 274 126 8.3 181 <1.0 0.48 94.5 <0.0050
23/08/16 275 126 8.25 197 <1.0 0.39 97.7 <0.0050
07/09/16 268 118 8.23 164 1 0.38 99.4 <0.0050
P1-10 04/07/16 279 128 8.08 176 <1.0 0.61 96.5 <0.0050
23/08/16 275 127 7.99 190 <1.0 0.51 98.8 <0.0050
07/09/16 272 119 8.17 184 1.2 0.47 99.7 <0.0050
P1-5 04/07/16 276 128 8.29 177 1.4 0.78 95.6 <0.0050
23/08/16 269 125 8.26 181 <1.0 0.45 98.7 <0.0050
07/09/16 270 118 8.17 189 10 0.49 97.3 <0.0050
P1-15 04/07/16 283 130 8.01 184 <1.0 0.78 97.8 <0.0050
23/08/16 275 128 7.95 197 <1.0 0.43 99.5 <0.0050
07/09/16 276 119 7.88 189 1.3 0.44 98.1 <0.0050
P1-20 04/07/16 283 131 7.91 188 <1.0 0.81 97.4 0.0085
23/08/16 276 130 7.8 188 1.6 1.13 98.9 <0.0050
07/09/16 278 122 7.69 169 2.6 1.11 100 <0.0050
P1-B 04/07/16 284 132 7.91 177 2 0.89 98.2 0.0079
23/08/16 277 129 7.81 186 1 1.98 103 0.0075
07/09/16 278 120 7.67 187 2.2 1.97 104 0.0101
P2-S 04/07/16 274 129 8.3 180 <1.0 0.52 95.7 <0.0050
23/08/16 272 123 8.24 177 <1.0 0.51 98.6 <0.0050
07/09/16 271 118 8.23 173 1.2 0.33 97.9 <0.0050
P2-5 04/07/16 278 128 8.27 179 1.4 0.55 96 <0.0050
23/08/16 272 123 8.16 175 1 0.55 98.3 <0.0050
Printed Date: 19/10/2016
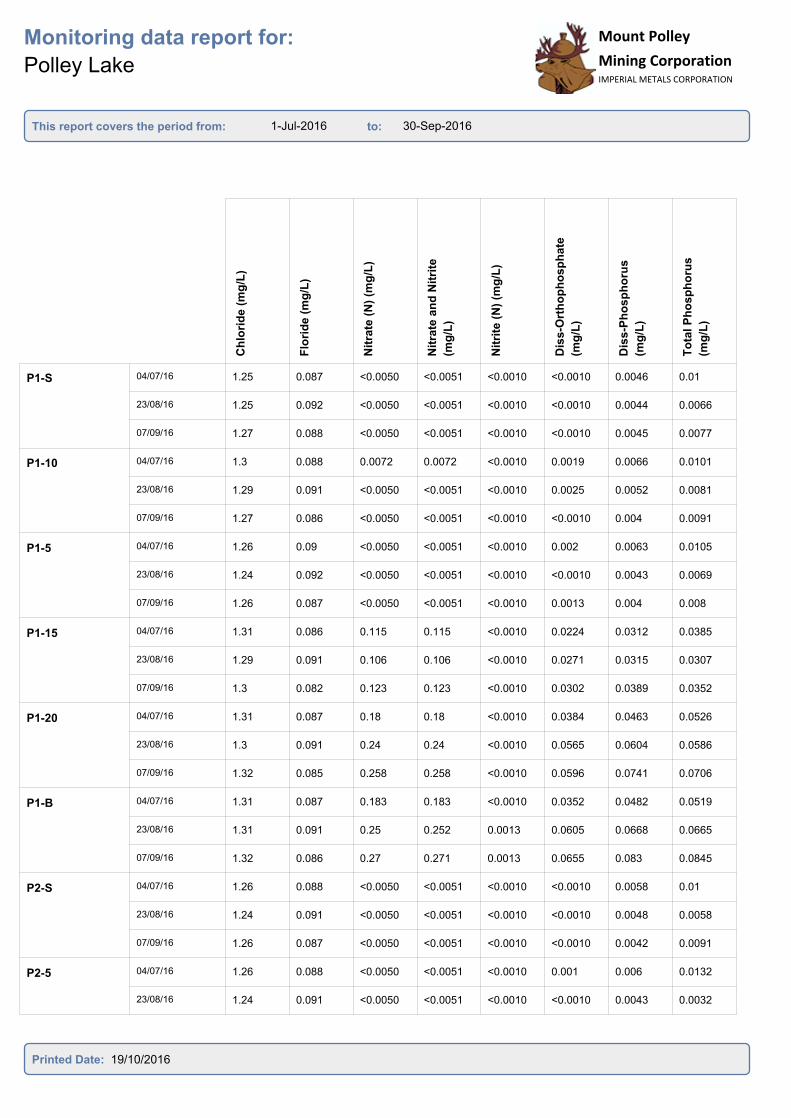
1-Jul-2016 30-Sep-2016
Monitoring data report for:
Polley Lake
This report covers the period from: to:
Mount Polley
Mining CorporationIMPERIAL METALS CORPORATION
Mount Polley
Mining CorporationIMPERIAL METALS CORPORATION
Ch
lori
de (
mg
/L)
Flo
rid
e (
mg
/L)
Nit
rate
(N
) (m
g/L
)
Nit
rate
an
d N
itri
te
(mg
/L)
Nit
rite
(N
) (m
g/L
)
Dis
s-O
rth
op
ho
sp
hate
(mg
/L)
Dis
s-P
ho
sp
ho
rus
(mg
/L)
To
tal P
ho
sp
ho
rus
(mg
/L)
P1-S 04/07/16 1.25 0.087 <0.0050 <0.0051 <0.0010 <0.0010 0.0046 0.01
23/08/16 1.25 0.092 <0.0050 <0.0051 <0.0010 <0.0010 0.0044 0.0066
07/09/16 1.27 0.088 <0.0050 <0.0051 <0.0010 <0.0010 0.0045 0.0077
P1-10 04/07/16 1.3 0.088 0.0072 0.0072 <0.0010 0.0019 0.0066 0.0101
23/08/16 1.29 0.091 <0.0050 <0.0051 <0.0010 0.0025 0.0052 0.0081
07/09/16 1.27 0.086 <0.0050 <0.0051 <0.0010 <0.0010 0.004 0.0091
P1-5 04/07/16 1.26 0.09 <0.0050 <0.0051 <0.0010 0.002 0.0063 0.0105
23/08/16 1.24 0.092 <0.0050 <0.0051 <0.0010 <0.0010 0.0043 0.0069
07/09/16 1.26 0.087 <0.0050 <0.0051 <0.0010 0.0013 0.004 0.008
P1-15 04/07/16 1.31 0.086 0.115 0.115 <0.0010 0.0224 0.0312 0.0385
23/08/16 1.29 0.091 0.106 0.106 <0.0010 0.0271 0.0315 0.0307
07/09/16 1.3 0.082 0.123 0.123 <0.0010 0.0302 0.0389 0.0352
P1-20 04/07/16 1.31 0.087 0.18 0.18 <0.0010 0.0384 0.0463 0.0526
23/08/16 1.3 0.091 0.24 0.24 <0.0010 0.0565 0.0604 0.0586
07/09/16 1.32 0.085 0.258 0.258 <0.0010 0.0596 0.0741 0.0706
P1-B 04/07/16 1.31 0.087 0.183 0.183 <0.0010 0.0352 0.0482 0.0519
23/08/16 1.31 0.091 0.25 0.252 0.0013 0.0605 0.0668 0.0665
07/09/16 1.32 0.086 0.27 0.271 0.0013 0.0655 0.083 0.0845
P2-S 04/07/16 1.26 0.088 <0.0050 <0.0051 <0.0010 <0.0010 0.0058 0.01
23/08/16 1.24 0.091 <0.0050 <0.0051 <0.0010 <0.0010 0.0048 0.0058
07/09/16 1.26 0.087 <0.0050 <0.0051 <0.0010 <0.0010 0.0042 0.0091
P2-5 04/07/16 1.26 0.088 <0.0050 <0.0051 <0.0010 0.001 0.006 0.0132
23/08/16 1.24 0.091 <0.0050 <0.0051 <0.0010 <0.0010 0.0043 0.0032
Printed Date: 19/10/2016
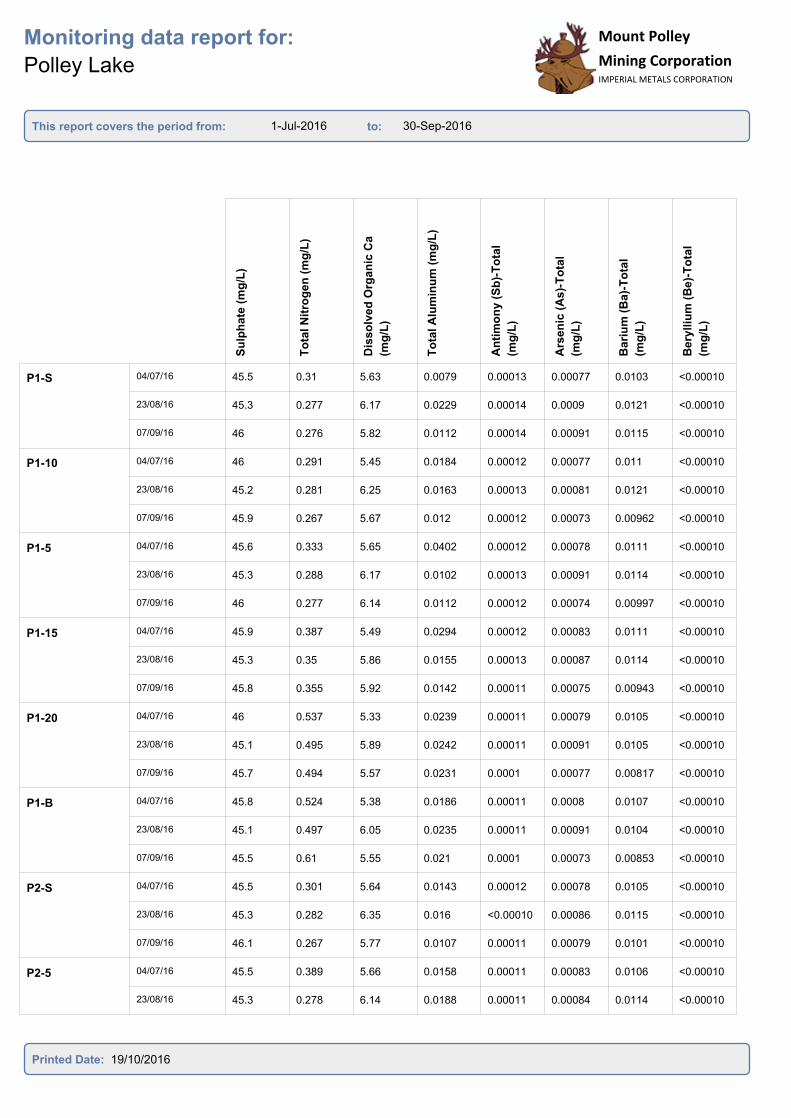
1-Jul-2016 30-Sep-2016
Monitoring data report for:
Polley Lake
This report covers the period from: to:
Mount Polley
Mining CorporationIMPERIAL METALS CORPORATION
Mount Polley
Mining CorporationIMPERIAL METALS CORPORATION
Su
lph
ate
(m
g/L
)
To
tal N
itro
ge
n (
mg
/L)
Dis
so
lved
Org
an
ic C
a
(mg
/L)
To
tal A
lum
inu
m (
mg
/L)
An
tim
on
y (
Sb
)-T
ota
l
(mg
/L)
Ars
en
ic (
As)-
To
tal
(mg
/L)
Bari
um
(B
a)-
To
tal
(mg
/L)
Bery
lliu
m (
Be)-
To
tal
(mg
/L)
P1-S 04/07/16 45.5 0.31 5.63 0.0079 0.00013 0.00077 0.0103 <0.00010
23/08/16 45.3 0.277 6.17 0.0229 0.00014 0.0009 0.0121 <0.00010
07/09/16 46 0.276 5.82 0.0112 0.00014 0.00091 0.0115 <0.00010
P1-10 04/07/16 46 0.291 5.45 0.0184 0.00012 0.00077 0.011 <0.00010
23/08/16 45.2 0.281 6.25 0.0163 0.00013 0.00081 0.0121 <0.00010
07/09/16 45.9 0.267 5.67 0.012 0.00012 0.00073 0.00962 <0.00010
P1-5 04/07/16 45.6 0.333 5.65 0.0402 0.00012 0.00078 0.0111 <0.00010
23/08/16 45.3 0.288 6.17 0.0102 0.00013 0.00091 0.0114 <0.00010
07/09/16 46 0.277 6.14 0.0112 0.00012 0.00074 0.00997 <0.00010
P1-15 04/07/16 45.9 0.387 5.49 0.0294 0.00012 0.00083 0.0111 <0.00010
23/08/16 45.3 0.35 5.86 0.0155 0.00013 0.00087 0.0114 <0.00010
07/09/16 45.8 0.355 5.92 0.0142 0.00011 0.00075 0.00943 <0.00010
P1-20 04/07/16 46 0.537 5.33 0.0239 0.00011 0.00079 0.0105 <0.00010
23/08/16 45.1 0.495 5.89 0.0242 0.00011 0.00091 0.0105 <0.00010
07/09/16 45.7 0.494 5.57 0.0231 0.0001 0.00077 0.00817 <0.00010
P1-B 04/07/16 45.8 0.524 5.38 0.0186 0.00011 0.0008 0.0107 <0.00010
23/08/16 45.1 0.497 6.05 0.0235 0.00011 0.00091 0.0104 <0.00010
07/09/16 45.5 0.61 5.55 0.021 0.0001 0.00073 0.00853 <0.00010
P2-S 04/07/16 45.5 0.301 5.64 0.0143 0.00012 0.00078 0.0105 <0.00010
23/08/16 45.3 0.282 6.35 0.016 <0.00010 0.00086 0.0115 <0.00010
07/09/16 46.1 0.267 5.77 0.0107 0.00011 0.00079 0.0101 <0.00010
P2-5 04/07/16 45.5 0.389 5.66 0.0158 0.00011 0.00083 0.0106 <0.00010
23/08/16 45.3 0.278 6.14 0.0188 0.00011 0.00084 0.0114 <0.00010
Printed Date: 19/10/2016
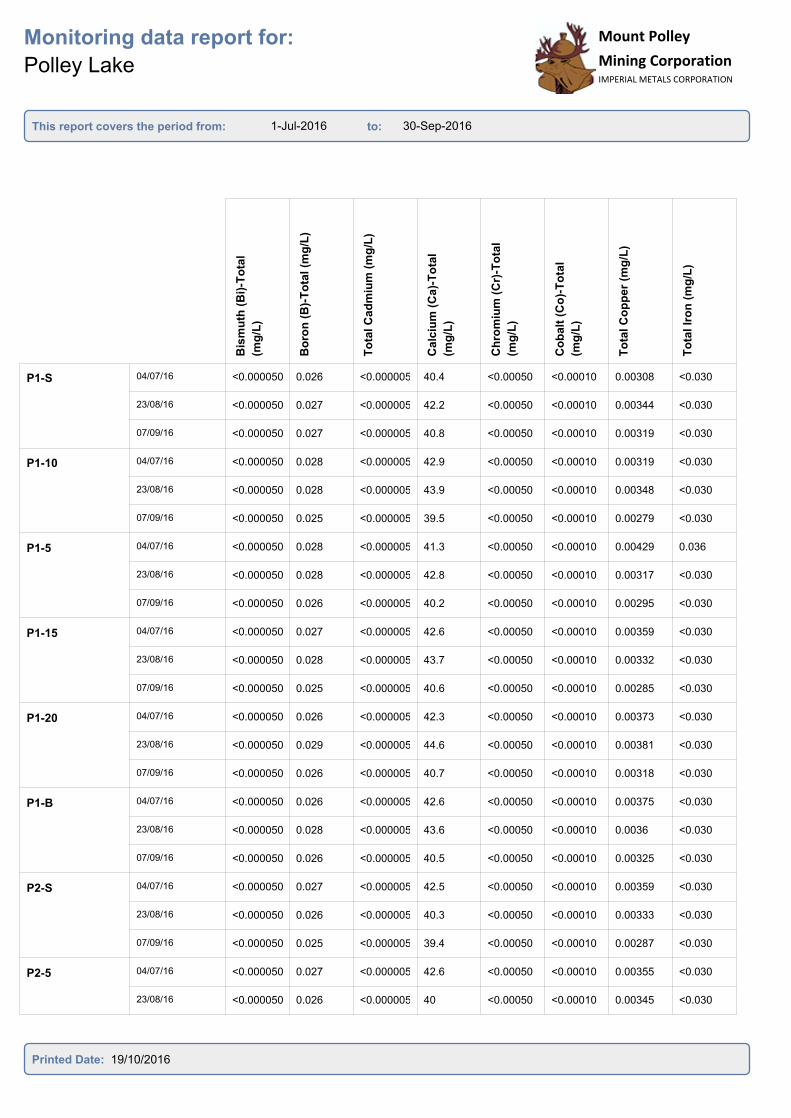
1-Jul-2016 30-Sep-2016
Monitoring data report for:
Polley Lake
This report covers the period from: to:
Mount Polley
Mining CorporationIMPERIAL METALS CORPORATION
Mount Polley
Mining CorporationIMPERIAL METALS CORPORATION
Bis
mu
th (
Bi)
-To
tal
(mg
/L)
Bo
ron
(B
)-T
ota
l (m
g/L
)
To
tal C
ad
miu
m (
mg
/L)
Calc
ium
(C
a)-
To
tal
(mg
/L)
Ch
rom
ium
(C
r)-T
ota
l
(mg
/L)
Co
balt
(C
o)-
To
tal
(mg
/L)
To
tal C
op
per
(mg
/L)
To
tal Ir
on
(m
g/L
)
P1-S 04/07/16 <0.000050 0.026 <0.000005 40.4 <0.00050 <0.00010 0.00308 <0.030
23/08/16 <0.000050 0.027 <0.000005 42.2 <0.00050 <0.00010 0.00344 <0.030
07/09/16 <0.000050 0.027 <0.000005 40.8 <0.00050 <0.00010 0.00319 <0.030
P1-10 04/07/16 <0.000050 0.028 <0.000005 42.9 <0.00050 <0.00010 0.00319 <0.030
23/08/16 <0.000050 0.028 <0.000005 43.9 <0.00050 <0.00010 0.00348 <0.030
07/09/16 <0.000050 0.025 <0.000005 39.5 <0.00050 <0.00010 0.00279 <0.030
P1-5 04/07/16 <0.000050 0.028 <0.000005 41.3 <0.00050 <0.00010 0.00429 0.036
23/08/16 <0.000050 0.028 <0.000005 42.8 <0.00050 <0.00010 0.00317 <0.030
07/09/16 <0.000050 0.026 <0.000005 40.2 <0.00050 <0.00010 0.00295 <0.030
P1-15 04/07/16 <0.000050 0.027 <0.000005 42.6 <0.00050 <0.00010 0.00359 <0.030
23/08/16 <0.000050 0.028 <0.000005 43.7 <0.00050 <0.00010 0.00332 <0.030
07/09/16 <0.000050 0.025 <0.000005 40.6 <0.00050 <0.00010 0.00285 <0.030
P1-20 04/07/16 <0.000050 0.026 <0.000005 42.3 <0.00050 <0.00010 0.00373 <0.030
23/08/16 <0.000050 0.029 <0.000005 44.6 <0.00050 <0.00010 0.00381 <0.030
07/09/16 <0.000050 0.026 <0.000005 40.7 <0.00050 <0.00010 0.00318 <0.030
P1-B 04/07/16 <0.000050 0.026 <0.000005 42.6 <0.00050 <0.00010 0.00375 <0.030
23/08/16 <0.000050 0.028 <0.000005 43.6 <0.00050 <0.00010 0.0036 <0.030
07/09/16 <0.000050 0.026 <0.000005 40.5 <0.00050 <0.00010 0.00325 <0.030
P2-S 04/07/16 <0.000050 0.027 <0.000005 42.5 <0.00050 <0.00010 0.00359 <0.030
23/08/16 <0.000050 0.026 <0.000005 40.3 <0.00050 <0.00010 0.00333 <0.030
07/09/16 <0.000050 0.025 <0.000005 39.4 <0.00050 <0.00010 0.00287 <0.030
P2-5 04/07/16 <0.000050 0.027 <0.000005 42.6 <0.00050 <0.00010 0.00355 <0.030
23/08/16 <0.000050 0.026 <0.000005 40 <0.00050 <0.00010 0.00345 <0.030
Printed Date: 19/10/2016
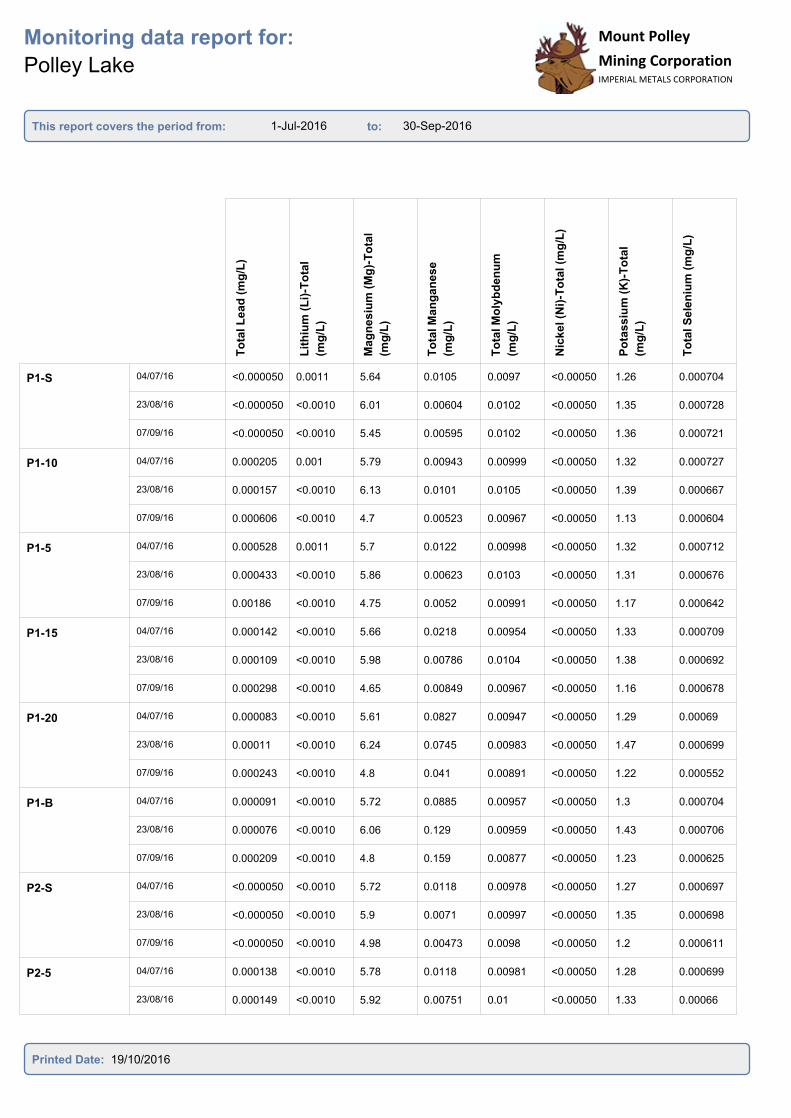
1-Jul-2016 30-Sep-2016
Monitoring data report for:
Polley Lake
This report covers the period from: to:
Mount Polley
Mining CorporationIMPERIAL METALS CORPORATION
Mount Polley
Mining CorporationIMPERIAL METALS CORPORATION
To
tal L
ea
d (
mg
/L)
Lit
hiu
m (
Li)
-To
tal
(mg
/L)
Mag
nes
ium
(M
g)-
To
tal
(mg
/L)
To
tal M
an
ga
nese
(mg
/L)
To
tal M
oly
bd
en
um
(mg
/L)
Nic
ke
l (N
i)-T
ota
l (m
g/L
)
Po
tas
siu
m (
K)-
To
tal
(mg
/L)
To
tal S
ele
niu
m (
mg
/L)
P1-S 04/07/16 <0.000050 0.0011 5.64 0.0105 0.0097 <0.00050 1.26 0.000704
23/08/16 <0.000050 <0.0010 6.01 0.00604 0.0102 <0.00050 1.35 0.000728
07/09/16 <0.000050 <0.0010 5.45 0.00595 0.0102 <0.00050 1.36 0.000721
P1-10 04/07/16 0.000205 0.001 5.79 0.00943 0.00999 <0.00050 1.32 0.000727
23/08/16 0.000157 <0.0010 6.13 0.0101 0.0105 <0.00050 1.39 0.000667
07/09/16 0.000606 <0.0010 4.7 0.00523 0.00967 <0.00050 1.13 0.000604
P1-5 04/07/16 0.000528 0.0011 5.7 0.0122 0.00998 <0.00050 1.32 0.000712
23/08/16 0.000433 <0.0010 5.86 0.00623 0.0103 <0.00050 1.31 0.000676
07/09/16 0.00186 <0.0010 4.75 0.0052 0.00991 <0.00050 1.17 0.000642
P1-15 04/07/16 0.000142 <0.0010 5.66 0.0218 0.00954 <0.00050 1.33 0.000709
23/08/16 0.000109 <0.0010 5.98 0.00786 0.0104 <0.00050 1.38 0.000692
07/09/16 0.000298 <0.0010 4.65 0.00849 0.00967 <0.00050 1.16 0.000678
P1-20 04/07/16 0.000083 <0.0010 5.61 0.0827 0.00947 <0.00050 1.29 0.00069
23/08/16 0.00011 <0.0010 6.24 0.0745 0.00983 <0.00050 1.47 0.000699
07/09/16 0.000243 <0.0010 4.8 0.041 0.00891 <0.00050 1.22 0.000552
P1-B 04/07/16 0.000091 <0.0010 5.72 0.0885 0.00957 <0.00050 1.3 0.000704
23/08/16 0.000076 <0.0010 6.06 0.129 0.00959 <0.00050 1.43 0.000706
07/09/16 0.000209 <0.0010 4.8 0.159 0.00877 <0.00050 1.23 0.000625
P2-S 04/07/16 <0.000050 <0.0010 5.72 0.0118 0.00978 <0.00050 1.27 0.000697
23/08/16 <0.000050 <0.0010 5.9 0.0071 0.00997 <0.00050 1.35 0.000698
07/09/16 <0.000050 <0.0010 4.98 0.00473 0.0098 <0.00050 1.2 0.000611
P2-5 04/07/16 0.000138 <0.0010 5.78 0.0118 0.00981 <0.00050 1.28 0.000699
23/08/16 0.000149 <0.0010 5.92 0.00751 0.01 <0.00050 1.33 0.00066
Printed Date: 19/10/2016

1-Jul-2016 30-Sep-2016
Monitoring data report for:
Polley Lake
This report covers the period from: to:
Mount Polley
Mining CorporationIMPERIAL METALS CORPORATION
Mount Polley
Mining CorporationIMPERIAL METALS CORPORATION
Silic
on
(S
i)-T
ota
l (m
g/L
)
Silve
r (A
g)-
To
tal (m
g/L
)
So
diu
m (
Na)-
To
tal
(mg
/L)
Str
on
tiu
m (
Sr)
-To
tal
(mg
/L)
Th
alliu
m (
Tl)
-To
tal
(mg
/L)
Tin
(S
n)-
To
tal (m
g/L
)
Tit
an
ium
(T
i)-T
ota
l
(mg
/L)
Ura
niu
m (
U)-
To
tal
(mg
/L)
P1-S 04/07/16 2.15 <0.000010 9.14 0.3 <0.000010 <0.00010 <0.010 0.000256
23/08/16 2.24 <0.000010 9.78 0.323 <0.000010 <0.00010 <0.010 0.000267
07/09/16 2.3 <0.000010 9.57 0.316 <0.000010 <0.00010 <0.010 0.000261
P1-10 04/07/16 2.67 <0.000010 9.38 0.31 <0.000010 <0.00010 <0.010 0.000268
23/08/16 2.8 <0.000010 10 0.331 <0.000010 <0.00010 <0.010 0.000279
07/09/16 2.03 <0.000010 8 0.299 <0.000010 <0.00010 <0.010 0.000254
P1-5 04/07/16 2.24 <0.000010 9.48 0.309 <0.000010 <0.00010 <0.010 0.000258
23/08/16 2.17 <0.000010 9.63 0.326 <0.000010 <0.00010 <0.010 0.000268
07/09/16 2.06 <0.000010 8.14 0.305 <0.000010 <0.00010 <0.010 0.000256
P1-15 04/07/16 3.01 <0.000010 9.45 0.305 <0.000010 <0.00010 <0.010 0.000268
23/08/16 3.05 <0.000010 9.82 0.331 <0.000010 <0.00010 <0.010 0.000276
07/09/16 2.81 <0.000010 8.03 0.305 <0.000010 <0.00010 <0.010 0.000261
P1-20 04/07/16 3.16 <0.000010 9.35 0.305 <0.000010 <0.00010 <0.010 0.000262
23/08/16 3.57 <0.000010 10.2 0.338 <0.000010 <0.00010 <0.010 0.000273
07/09/16 3.24 <0.000010 8.3 0.308 <0.000010 <0.00010 <0.010 0.000248
P1-B 04/07/16 3.24 <0.000010 9.38 0.312 <0.000010 <0.00010 <0.010 0.000265
23/08/16 3.58 <0.000010 9.94 0.332 <0.000010 <0.00010 <0.010 0.000261
07/09/16 3.3 <0.000010 8.3 0.304 <0.000010 <0.00010 <0.010 0.000242
P2-S 04/07/16 2.2 <0.000010 9.39 0.303 <0.000010 <0.00010 <0.010 0.000258
23/08/16 2.12 <0.000010 9.29 0.318 <0.000010 <0.00010 <0.010 0.000259
07/09/16 1.96 <0.000010 8.46 0.301 <0.000010 <0.00010 <0.010 0.000253
P2-5 04/07/16 2.24 <0.000010 9.45 0.31 <0.000010 <0.00010 <0.010 0.000263
23/08/16 2.13 <0.000010 9.27 0.319 <0.000010 <0.00010 <0.010 0.000253
Printed Date: 19/10/2016
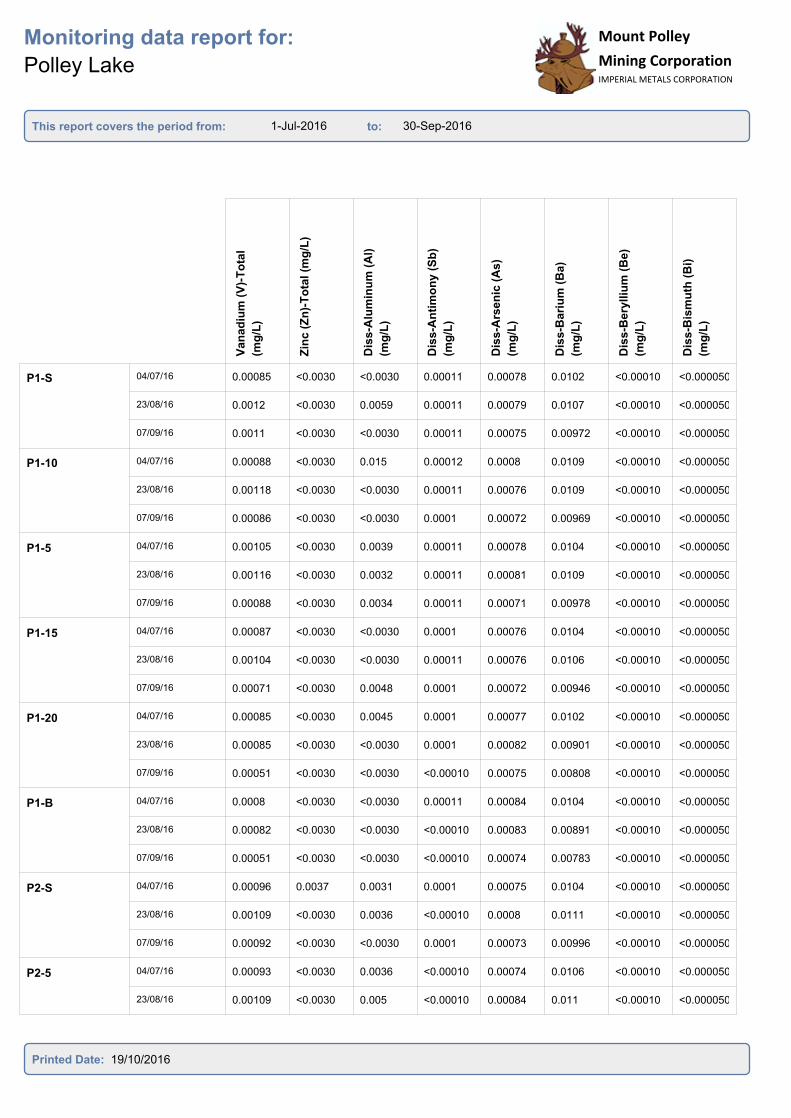
1-Jul-2016 30-Sep-2016
Monitoring data report for:
Polley Lake
This report covers the period from: to:
Mount Polley
Mining CorporationIMPERIAL METALS CORPORATION
Mount Polley
Mining CorporationIMPERIAL METALS CORPORATION
Van
ad
ium
(V
)-T
ota
l
(mg
/L)
Zin
c (
Zn
)-T
ota
l (m
g/L
)
Dis
s-A
lum
inu
m (
Al)
(mg
/L)
Dis
s-A
nti
mo
ny
(S
b)
(mg
/L)
Dis
s-A
rsen
ic (
As
)
(mg
/L)
Dis
s-B
ari
um
(B
a)
(mg
/L)
Dis
s-B
ery
lliu
m (
Be)
(mg
/L)
Dis
s-B
ism
uth
(B
i)
(mg
/L)
P1-S 04/07/16 0.00085 <0.0030 <0.0030 0.00011 0.00078 0.0102 <0.00010 <0.000050
23/08/16 0.0012 <0.0030 0.0059 0.00011 0.00079 0.0107 <0.00010 <0.000050
07/09/16 0.0011 <0.0030 <0.0030 0.00011 0.00075 0.00972 <0.00010 <0.000050
P1-10 04/07/16 0.00088 <0.0030 0.015 0.00012 0.0008 0.0109 <0.00010 <0.000050
23/08/16 0.00118 <0.0030 <0.0030 0.00011 0.00076 0.0109 <0.00010 <0.000050
07/09/16 0.00086 <0.0030 <0.0030 0.0001 0.00072 0.00969 <0.00010 <0.000050
P1-5 04/07/16 0.00105 <0.0030 0.0039 0.00011 0.00078 0.0104 <0.00010 <0.000050
23/08/16 0.00116 <0.0030 0.0032 0.00011 0.00081 0.0109 <0.00010 <0.000050
07/09/16 0.00088 <0.0030 0.0034 0.00011 0.00071 0.00978 <0.00010 <0.000050
P1-15 04/07/16 0.00087 <0.0030 <0.0030 0.0001 0.00076 0.0104 <0.00010 <0.000050
23/08/16 0.00104 <0.0030 <0.0030 0.00011 0.00076 0.0106 <0.00010 <0.000050
07/09/16 0.00071 <0.0030 0.0048 0.0001 0.00072 0.00946 <0.00010 <0.000050
P1-20 04/07/16 0.00085 <0.0030 0.0045 0.0001 0.00077 0.0102 <0.00010 <0.000050
23/08/16 0.00085 <0.0030 <0.0030 0.0001 0.00082 0.00901 <0.00010 <0.000050
07/09/16 0.00051 <0.0030 <0.0030 <0.00010 0.00075 0.00808 <0.00010 <0.000050
P1-B 04/07/16 0.0008 <0.0030 <0.0030 0.00011 0.00084 0.0104 <0.00010 <0.000050
23/08/16 0.00082 <0.0030 <0.0030 <0.00010 0.00083 0.00891 <0.00010 <0.000050
07/09/16 0.00051 <0.0030 <0.0030 <0.00010 0.00074 0.00783 <0.00010 <0.000050
P2-S 04/07/16 0.00096 0.0037 0.0031 0.0001 0.00075 0.0104 <0.00010 <0.000050
23/08/16 0.00109 <0.0030 0.0036 <0.00010 0.0008 0.0111 <0.00010 <0.000050
07/09/16 0.00092 <0.0030 <0.0030 0.0001 0.00073 0.00996 <0.00010 <0.000050
P2-5 04/07/16 0.00093 <0.0030 0.0036 <0.00010 0.00074 0.0106 <0.00010 <0.000050
23/08/16 0.00109 <0.0030 0.005 <0.00010 0.00084 0.011 <0.00010 <0.000050
Printed Date: 19/10/2016

1-Jul-2016 30-Sep-2016
Monitoring data report for:
Polley Lake
This report covers the period from: to:
Mount Polley
Mining CorporationIMPERIAL METALS CORPORATION
Mount Polley
Mining CorporationIMPERIAL METALS CORPORATION
Dis
s-B
oro
n (
B)
(mg
/L)
Dis
s-C
ad
miu
m (
Cd
)
(mg
/L)
Dis
s-C
alc
ium
(C
a)
(mg
/L)
Dis
s-C
hro
miu
m (
Cr)
(mg
/L)
Dis
s-C
ob
alt
(C
o)
(mg
/L)
Dis
s-C
op
pe
r (C
u)
(mg
/L)
Dis
s-I
ron
(F
e)
(mg
/L)
Dis
s-L
ead
(P
b)
(mg
/L)
P1-S 04/07/16 0.026 <0.000005 41 <0.00050 <0.00010 0.00283 <0.030 <0.000050
23/08/16 0.026 <0.000005 41.2 <0.00050 <0.00010 0.00277 <0.030 <0.000050
07/09/16 0.024 <0.000005 39.5 <0.00050 <0.00010 0.0024 <0.030 <0.000050
P1-10 04/07/16 0.027 <0.000005 42.2 <0.00050 <0.00010 0.00333 <0.030 0.000416
23/08/16 0.026 <0.000005 41.7 <0.00050 <0.00010 0.00292 <0.030 0.000274
07/09/16 0.024 <0.000005 39.7 <0.00050 <0.00010 0.00258 <0.030 0.000723
P1-5 04/07/16 0.026 <0.000005 41.9 <0.00050 <0.00010 0.00317 <0.030 0.000655
23/08/16 0.026 <0.000005 40.8 <0.00050 <0.00010 0.00297 <0.030 0.00064
07/09/16 0.024 <0.000005 39.7 <0.00050 <0.00010 0.00265 <0.030 0.00135
P1-15 04/07/16 0.025 <0.000005 42.6 <0.00050 <0.00010 0.00306 <0.030 0.000213
23/08/16 0.026 <0.000005 42 <0.00050 <0.00010 0.00291 <0.030 0.000192
07/09/16 0.024 <0.000005 39.8 <0.00050 <0.00010 0.0026 <0.030 0.000542
P1-20 04/07/16 0.025 <0.000005 42.9 <0.00050 <0.00010 0.00333 <0.030 0.000222
23/08/16 0.026 <0.000005 42.5 <0.00050 <0.00010 0.00296 <0.030 0.000174
07/09/16 0.025 <0.000005 40.6 <0.00050 <0.00010 0.00268 <0.030 0.000371
P1-B 04/07/16 0.026 <0.000005 43.3 <0.00050 <0.00010 0.0033 <0.030 0.000163
23/08/16 0.026 <0.000005 42.4 <0.00050 <0.00010 0.00284 <0.030 0.000129
07/09/16 0.024 <0.000005 40.1 <0.00050 <0.00010 0.00262 <0.030 0.000277
P2-S 04/07/16 0.025 <0.000005 42.2 <0.00050 <0.00010 0.0029 <0.030 <0.000050
23/08/16 0.025 <0.000005 39.8 <0.00050 <0.00010 0.0028 <0.030 <0.000050
07/09/16 0.024 <0.000005 39.1 <0.00050 <0.00010 0.00247 <0.030 <0.000050
P2-5 04/07/16 0.025 <0.000005 41.9 <0.00050 <0.00010 0.00304 <0.030 0.000258
23/08/16 0.025 <0.000005 39.7 <0.00050 <0.00010 0.00306 <0.030 0.00023
Printed Date: 19/10/2016

1-Jul-2016 30-Sep-2016
Monitoring data report for:
Polley Lake
This report covers the period from: to:
Mount Polley
Mining CorporationIMPERIAL METALS CORPORATION
Mount Polley
Mining CorporationIMPERIAL METALS CORPORATION
Dis
s-L
ith
ium
(L
i) (
mg
/L)
Dis
s-M
ag
nesiu
m (
Mg
)
(mg
/L)
Dis
s-M
an
gan
ese
(M
n)
(mg
/L)
Dis
s-M
oly
bd
en
um
(M
o)
(mg
/L)
Dis
s-N
ickel (N
i) (
mg
/L)
Dis
s-P
ota
ssiu
m (
K)
(mg
/L)
Dis
s-S
ele
niu
m (
mg
/L)
Dis
s-S
ilic
on
(S
i) (
mg
/L)
P1-S 04/07/16 <0.0010 5.69 0.00722 0.00942 <0.00050 1.25 0.000668 2.16
23/08/16 <0.0010 5.7 0.00239 0.00944 <0.00050 1.26 0.000659 2.17
07/09/16 <0.0010 4.74 0.00211 0.00909 <0.00050 1.16 0.000606 1.98
P1-10 04/07/16 <0.0010 5.63 0.00416 0.00911 <0.00050 1.3 0.000661 2.58
23/08/16 <0.0010 5.58 0.00404 0.00927 <0.00050 1.26 0.000693 2.71
07/09/16 <0.0010 4.73 0.00207 0.00927 <0.00050 1.16 0.000673 2.03
P1-5 04/07/16 <0.0010 5.73 0.00747 0.00948 <0.00050 1.27 0.000691 2.17
23/08/16 <0.0010 5.65 0.00318 0.0091 <0.00050 1.24 0.000675 2.08
07/09/16 <0.0010 4.73 0.00201 0.00936 <0.00050 1.15 0.000613 2.01
P1-15 04/07/16 <0.0010 5.66 0.0121 0.0094 <0.00050 1.26 0.000701 2.95
23/08/16 <0.0010 5.68 0.00089 0.00937 <0.00050 1.29 0.00075 3
07/09/16 <0.0010 4.69 0.00081 0.00901 <0.00050 1.17 0.000606 2.74
P1-20 04/07/16 <0.0010 5.7 0.0598 0.00934 <0.00050 1.28 0.000671 3.18
23/08/16 <0.0010 5.73 0.00064 0.00883 <0.00050 1.33 0.000611 3.35
07/09/16 <0.0010 4.94 0.0003 0.00843 <0.00050 1.27 0.000607 3.15
P1-B 04/07/16 <0.0010 5.76 0.0576 0.00928 <0.00050 1.31 0.000739 3.2
23/08/16 <0.0010 5.75 0.00343 0.00861 <0.00050 1.34 0.000578 3.42
07/09/16 <0.0010 4.95 0.0189 0.00804 <0.00050 1.27 0.000664 3.21
P2-S 04/07/16 <0.0010 5.65 0.00654 0.00911 <0.00050 1.28 0.000706 2.15
23/08/16 <0.0010 5.88 0.00282 0.00972 <0.00050 1.34 0.000675 2.07
07/09/16 <0.0010 4.91 0.00161 0.00922 <0.00050 1.18 0.000673 1.97
P2-5 04/07/16 <0.0010 5.68 0.00691 0.00914 <0.00050 1.23 0.000652 2.16
23/08/16 <0.0010 5.84 0.00287 0.00969 <0.00050 1.33 0.000628 2.09
Printed Date: 19/10/2016
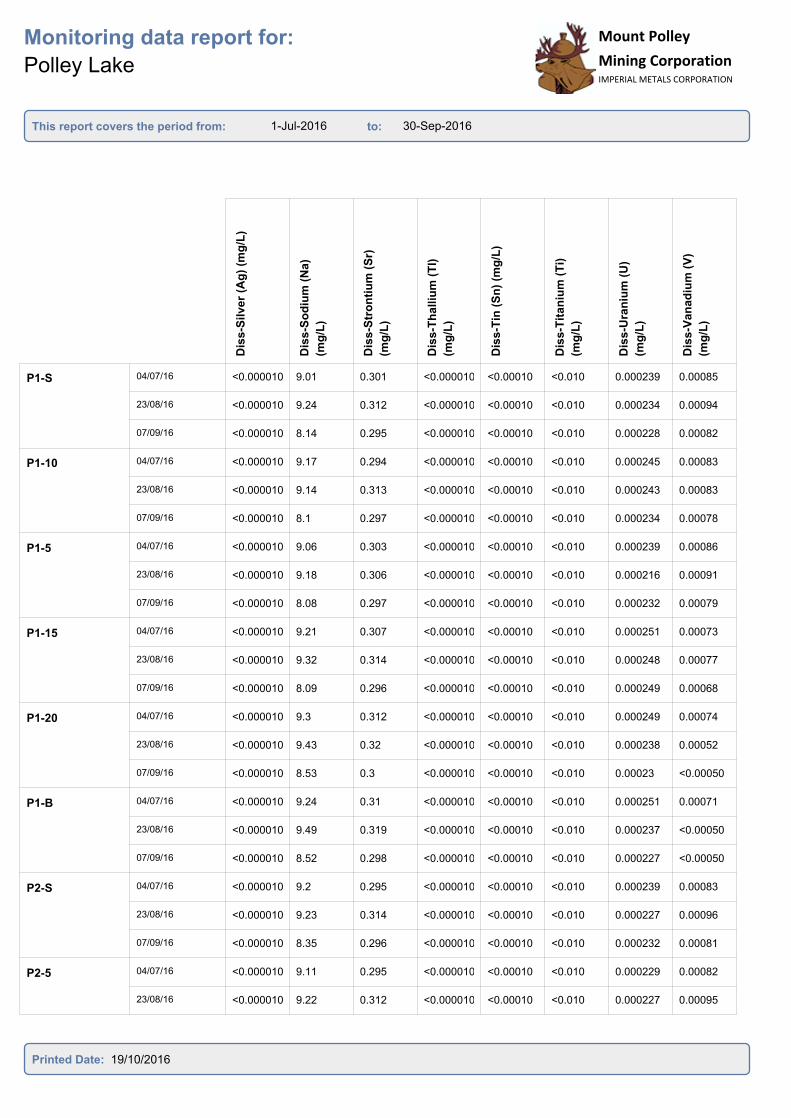
1-Jul-2016 30-Sep-2016
Monitoring data report for:
Polley Lake
This report covers the period from: to:
Mount Polley
Mining CorporationIMPERIAL METALS CORPORATION
Mount Polley
Mining CorporationIMPERIAL METALS CORPORATION
Dis
s-S
ilv
er
(Ag
) (m
g/L
)
Dis
s-S
od
ium
(N
a)
(mg
/L)
Dis
s-S
tro
nti
um
(S
r)
(mg
/L)
Dis
s-T
halliu
m (
Tl)
(mg
/L)
Dis
s-T
in (
Sn
) (m
g/L
)
Dis
s-T
itan
ium
(T
i)
(mg
/L)
Dis
s-U
ran
ium
(U
)
(mg
/L)
Dis
s-V
an
ad
ium
(V
)
(mg
/L)
P1-S 04/07/16 <0.000010 9.01 0.301 <0.000010 <0.00010 <0.010 0.000239 0.00085
23/08/16 <0.000010 9.24 0.312 <0.000010 <0.00010 <0.010 0.000234 0.00094
07/09/16 <0.000010 8.14 0.295 <0.000010 <0.00010 <0.010 0.000228 0.00082
P1-10 04/07/16 <0.000010 9.17 0.294 <0.000010 <0.00010 <0.010 0.000245 0.00083
23/08/16 <0.000010 9.14 0.313 <0.000010 <0.00010 <0.010 0.000243 0.00083
07/09/16 <0.000010 8.1 0.297 <0.000010 <0.00010 <0.010 0.000234 0.00078
P1-5 04/07/16 <0.000010 9.06 0.303 <0.000010 <0.00010 <0.010 0.000239 0.00086
23/08/16 <0.000010 9.18 0.306 <0.000010 <0.00010 <0.010 0.000216 0.00091
07/09/16 <0.000010 8.08 0.297 <0.000010 <0.00010 <0.010 0.000232 0.00079
P1-15 04/07/16 <0.000010 9.21 0.307 <0.000010 <0.00010 <0.010 0.000251 0.00073
23/08/16 <0.000010 9.32 0.314 <0.000010 <0.00010 <0.010 0.000248 0.00077
07/09/16 <0.000010 8.09 0.296 <0.000010 <0.00010 <0.010 0.000249 0.00068
P1-20 04/07/16 <0.000010 9.3 0.312 <0.000010 <0.00010 <0.010 0.000249 0.00074
23/08/16 <0.000010 9.43 0.32 <0.000010 <0.00010 <0.010 0.000238 0.00052
07/09/16 <0.000010 8.53 0.3 <0.000010 <0.00010 <0.010 0.00023 <0.00050
P1-B 04/07/16 <0.000010 9.24 0.31 <0.000010 <0.00010 <0.010 0.000251 0.00071
23/08/16 <0.000010 9.49 0.319 <0.000010 <0.00010 <0.010 0.000237 <0.00050
07/09/16 <0.000010 8.52 0.298 <0.000010 <0.00010 <0.010 0.000227 <0.00050
P2-S 04/07/16 <0.000010 9.2 0.295 <0.000010 <0.00010 <0.010 0.000239 0.00083
23/08/16 <0.000010 9.23 0.314 <0.000010 <0.00010 <0.010 0.000227 0.00096
07/09/16 <0.000010 8.35 0.296 <0.000010 <0.00010 <0.010 0.000232 0.00081
P2-5 04/07/16 <0.000010 9.11 0.295 <0.000010 <0.00010 <0.010 0.000229 0.00082
23/08/16 <0.000010 9.22 0.312 <0.000010 <0.00010 <0.010 0.000227 0.00095
Printed Date: 19/10/2016
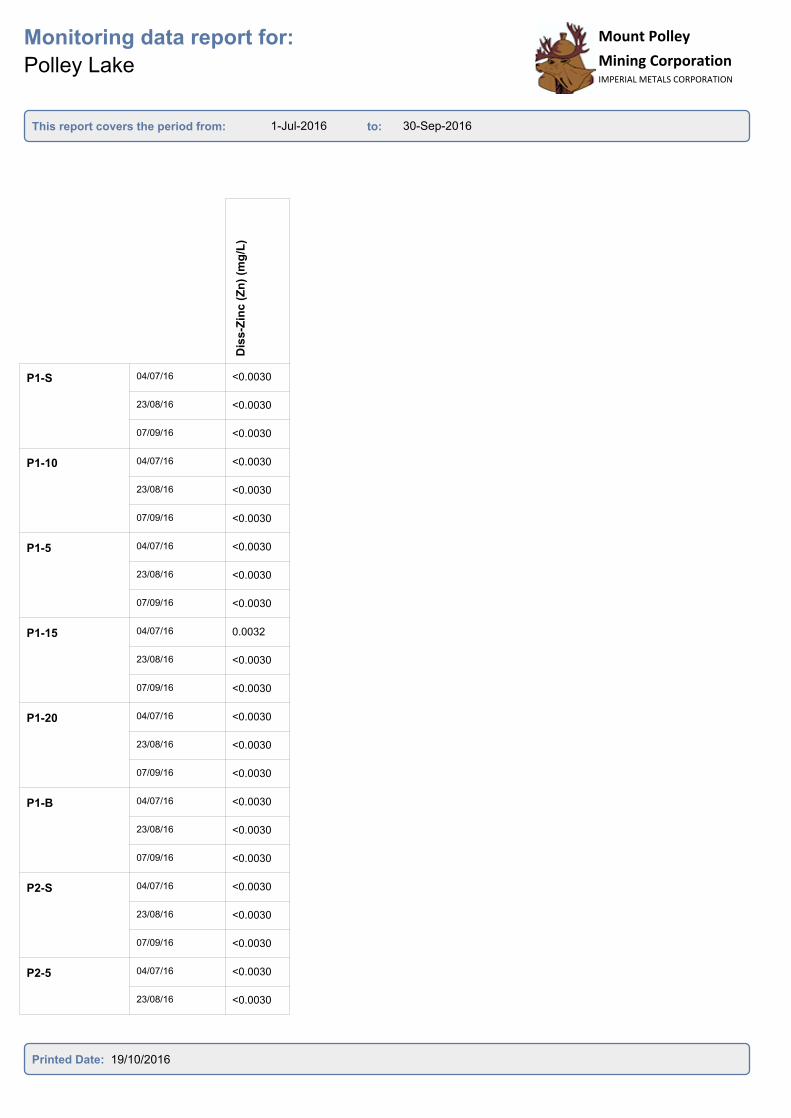
1-Jul-2016 30-Sep-2016
Monitoring data report for:
Polley Lake
This report covers the period from: to:
Mount Polley
Mining CorporationIMPERIAL METALS CORPORATION
Mount Polley
Mining CorporationIMPERIAL METALS CORPORATION
Dis
s-Z
inc (
Zn
) (m
g/L
)
P1-S 04/07/16 <0.0030
23/08/16 <0.0030
07/09/16 <0.0030
P1-10 04/07/16 <0.0030
23/08/16 <0.0030
07/09/16 <0.0030
P1-5 04/07/16 <0.0030
23/08/16 <0.0030
07/09/16 <0.0030
P1-15 04/07/16 0.0032
23/08/16 <0.0030
07/09/16 <0.0030
P1-20 04/07/16 <0.0030
23/08/16 <0.0030
07/09/16 <0.0030
P1-B 04/07/16 <0.0030
23/08/16 <0.0030
07/09/16 <0.0030
P2-S 04/07/16 <0.0030
23/08/16 <0.0030
07/09/16 <0.0030
P2-5 04/07/16 <0.0030
23/08/16 <0.0030
Printed Date: 19/10/2016
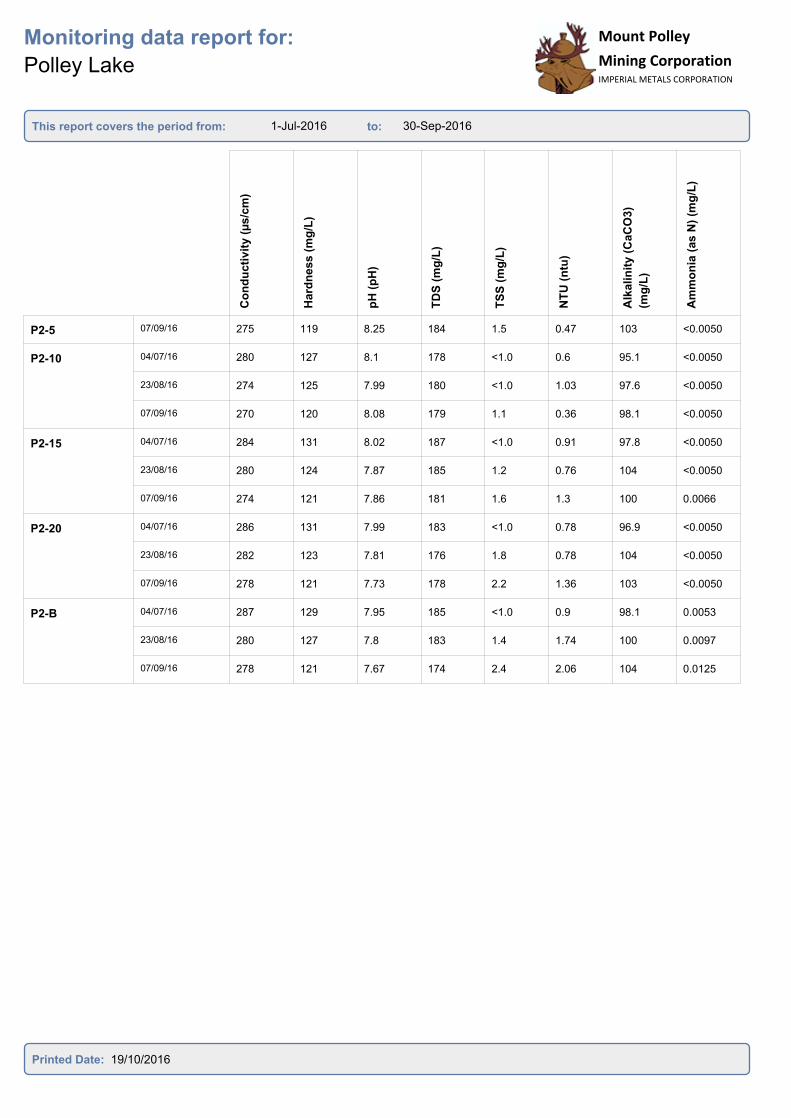
1-Jul-2016 30-Sep-2016
Monitoring data report for:
Polley Lake
This report covers the period from: to:
Mount Polley
Mining CorporationIMPERIAL METALS CORPORATION
Co
nd
ucti
vit
y (
µs/c
m)
Hard
ne
ss (
mg
/L)
pH
(p
H)
TD
S (
mg
/L)
TS
S (
mg
/L)
NT
U (
ntu
)
Alk
alin
ity
(C
aC
O3)
(mg
/L)
Am
mo
nia
(a
s N
) (m
g/L
)
P2-5 07/09/16 275 119 8.25 184 1.5 0.47 103 <0.0050
P2-10 04/07/16 280 127 8.1 178 <1.0 0.6 95.1 <0.0050
23/08/16 274 125 7.99 180 <1.0 1.03 97.6 <0.0050
07/09/16 270 120 8.08 179 1.1 0.36 98.1 <0.0050
P2-15 04/07/16 284 131 8.02 187 <1.0 0.91 97.8 <0.0050
23/08/16 280 124 7.87 185 1.2 0.76 104 <0.0050
07/09/16 274 121 7.86 181 1.6 1.3 100 0.0066
P2-20 04/07/16 286 131 7.99 183 <1.0 0.78 96.9 <0.0050
23/08/16 282 123 7.81 176 1.8 0.78 104 <0.0050
07/09/16 278 121 7.73 178 2.2 1.36 103 <0.0050
P2-B 04/07/16 287 129 7.95 185 <1.0 0.9 98.1 0.0053
23/08/16 280 127 7.8 183 1.4 1.74 100 0.0097
07/09/16 278 121 7.67 174 2.4 2.06 104 0.0125
Printed Date: 19/10/2016
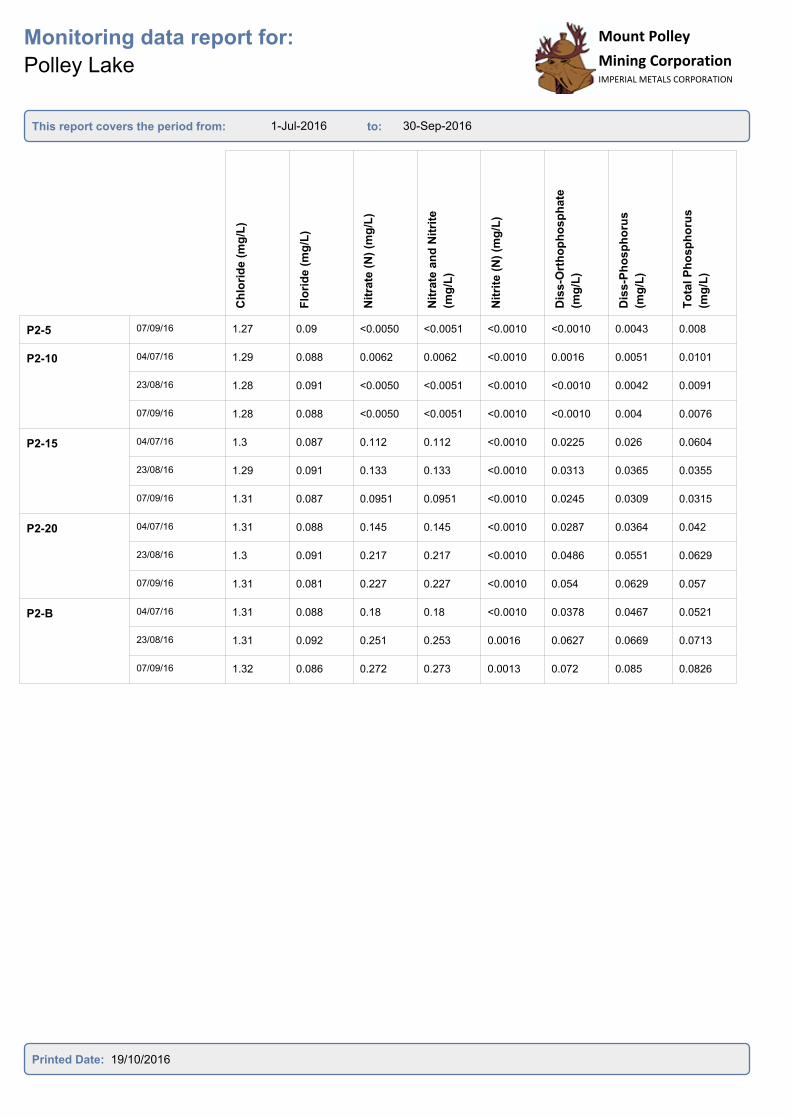
1-Jul-2016 30-Sep-2016
Monitoring data report for:
Polley Lake
This report covers the period from: to:
Mount Polley
Mining CorporationIMPERIAL METALS CORPORATION
Mount Polley
Mining CorporationIMPERIAL METALS CORPORATION
Ch
lori
de (
mg
/L)
Flo
rid
e (
mg
/L)
Nit
rate
(N
) (m
g/L
)
Nit
rate
an
d N
itri
te
(mg
/L)
Nit
rite
(N
) (m
g/L
)
Dis
s-O
rth
op
ho
sp
hate
(mg
/L)
Dis
s-P
ho
sp
ho
rus
(mg
/L)
To
tal P
ho
sp
ho
rus
(mg
/L)
P2-5 07/09/16 1.27 0.09 <0.0050 <0.0051 <0.0010 <0.0010 0.0043 0.008
P2-10 04/07/16 1.29 0.088 0.0062 0.0062 <0.0010 0.0016 0.0051 0.0101
23/08/16 1.28 0.091 <0.0050 <0.0051 <0.0010 <0.0010 0.0042 0.0091
07/09/16 1.28 0.088 <0.0050 <0.0051 <0.0010 <0.0010 0.004 0.0076
P2-15 04/07/16 1.3 0.087 0.112 0.112 <0.0010 0.0225 0.026 0.0604
23/08/16 1.29 0.091 0.133 0.133 <0.0010 0.0313 0.0365 0.0355
07/09/16 1.31 0.087 0.0951 0.0951 <0.0010 0.0245 0.0309 0.0315
P2-20 04/07/16 1.31 0.088 0.145 0.145 <0.0010 0.0287 0.0364 0.042
23/08/16 1.3 0.091 0.217 0.217 <0.0010 0.0486 0.0551 0.0629
07/09/16 1.31 0.081 0.227 0.227 <0.0010 0.054 0.0629 0.057
P2-B 04/07/16 1.31 0.088 0.18 0.18 <0.0010 0.0378 0.0467 0.0521
23/08/16 1.31 0.092 0.251 0.253 0.0016 0.0627 0.0669 0.0713
07/09/16 1.32 0.086 0.272 0.273 0.0013 0.072 0.085 0.0826
Printed Date: 19/10/2016
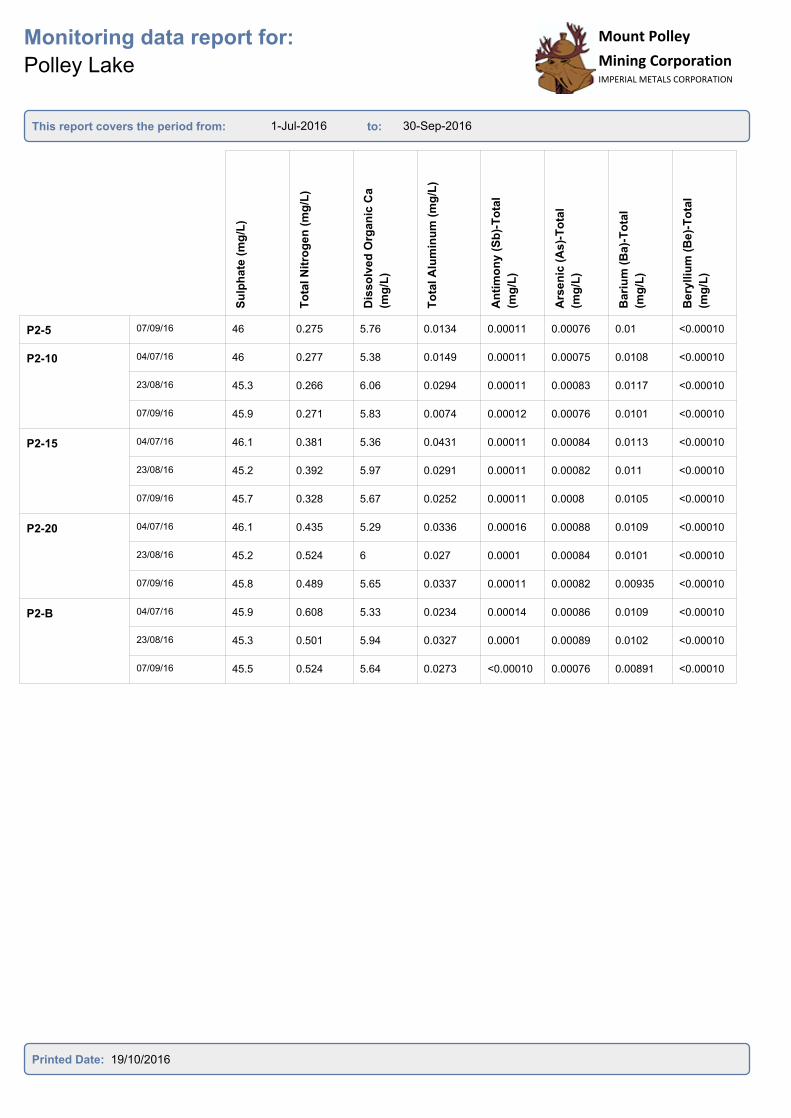
1-Jul-2016 30-Sep-2016
Monitoring data report for:
Polley Lake
This report covers the period from: to:
Mount Polley
Mining CorporationIMPERIAL METALS CORPORATION
Mount Polley
Mining CorporationIMPERIAL METALS CORPORATION
Su
lph
ate
(m
g/L
)
To
tal N
itro
ge
n (
mg
/L)
Dis
so
lved
Org
an
ic C
a
(mg
/L)
To
tal A
lum
inu
m (
mg
/L)
An
tim
on
y (
Sb
)-T
ota
l
(mg
/L)
Ars
en
ic (
As)-
To
tal
(mg
/L)
Bari
um
(B
a)-
To
tal
(mg
/L)
Bery
lliu
m (
Be
)-T
ota
l
(mg
/L)
P2-5 07/09/16 46 0.275 5.76 0.0134 0.00011 0.00076 0.01 <0.00010
P2-10 04/07/16 46 0.277 5.38 0.0149 0.00011 0.00075 0.0108 <0.00010
23/08/16 45.3 0.266 6.06 0.0294 0.00011 0.00083 0.0117 <0.00010
07/09/16 45.9 0.271 5.83 0.0074 0.00012 0.00076 0.0101 <0.00010
P2-15 04/07/16 46.1 0.381 5.36 0.0431 0.00011 0.00084 0.0113 <0.00010
23/08/16 45.2 0.392 5.97 0.0291 0.00011 0.00082 0.011 <0.00010
07/09/16 45.7 0.328 5.67 0.0252 0.00011 0.0008 0.0105 <0.00010
P2-20 04/07/16 46.1 0.435 5.29 0.0336 0.00016 0.00088 0.0109 <0.00010
23/08/16 45.2 0.524 6 0.027 0.0001 0.00084 0.0101 <0.00010
07/09/16 45.8 0.489 5.65 0.0337 0.00011 0.00082 0.00935 <0.00010
P2-B 04/07/16 45.9 0.608 5.33 0.0234 0.00014 0.00086 0.0109 <0.00010
23/08/16 45.3 0.501 5.94 0.0327 0.0001 0.00089 0.0102 <0.00010
07/09/16 45.5 0.524 5.64 0.0273 <0.00010 0.00076 0.00891 <0.00010
Printed Date: 19/10/2016
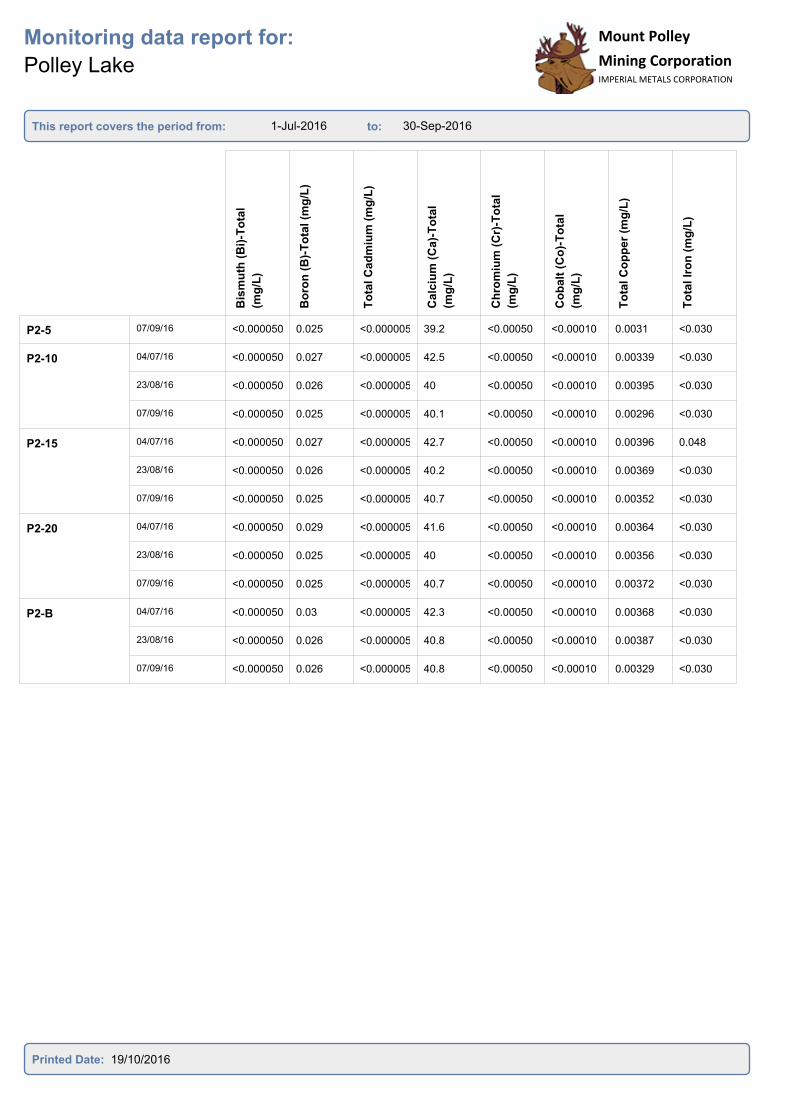
1-Jul-2016 30-Sep-2016
Monitoring data report for:
Polley Lake
This report covers the period from: to:
Mount Polley
Mining CorporationIMPERIAL METALS CORPORATION
Mount Polley
Mining CorporationIMPERIAL METALS CORPORATION
Bis
mu
th (
Bi)
-To
tal
(mg
/L)
Bo
ron
(B
)-T
ota
l (m
g/L
)
To
tal C
ad
miu
m (
mg
/L)
Calc
ium
(C
a)-
To
tal
(mg
/L)
Ch
rom
ium
(C
r)-T
ota
l
(mg
/L)
Co
balt
(C
o)-
To
tal
(mg
/L)
To
tal C
op
per
(mg
/L)
To
tal Ir
on
(m
g/L
)
P2-5 07/09/16 <0.000050 0.025 <0.000005 39.2 <0.00050 <0.00010 0.0031 <0.030
P2-10 04/07/16 <0.000050 0.027 <0.000005 42.5 <0.00050 <0.00010 0.00339 <0.030
23/08/16 <0.000050 0.026 <0.000005 40 <0.00050 <0.00010 0.00395 <0.030
07/09/16 <0.000050 0.025 <0.000005 40.1 <0.00050 <0.00010 0.00296 <0.030
P2-15 04/07/16 <0.000050 0.027 <0.000005 42.7 <0.00050 <0.00010 0.00396 0.048
23/08/16 <0.000050 0.026 <0.000005 40.2 <0.00050 <0.00010 0.00369 <0.030
07/09/16 <0.000050 0.025 <0.000005 40.7 <0.00050 <0.00010 0.00352 <0.030
P2-20 04/07/16 <0.000050 0.029 <0.000005 41.6 <0.00050 <0.00010 0.00364 <0.030
23/08/16 <0.000050 0.025 <0.000005 40 <0.00050 <0.00010 0.00356 <0.030
07/09/16 <0.000050 0.025 <0.000005 40.7 <0.00050 <0.00010 0.00372 <0.030
P2-B 04/07/16 <0.000050 0.03 <0.000005 42.3 <0.00050 <0.00010 0.00368 <0.030
23/08/16 <0.000050 0.026 <0.000005 40.8 <0.00050 <0.00010 0.00387 <0.030
07/09/16 <0.000050 0.026 <0.000005 40.8 <0.00050 <0.00010 0.00329 <0.030
Printed Date: 19/10/2016
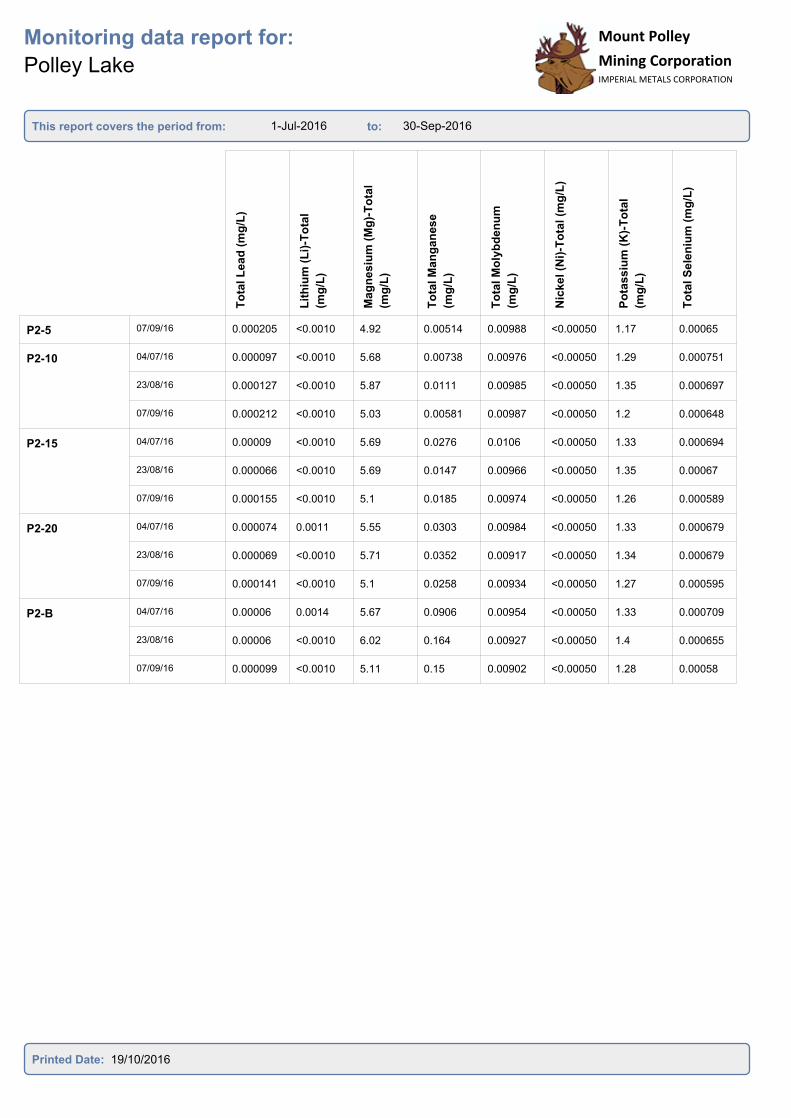
1-Jul-2016 30-Sep-2016
Monitoring data report for:
Polley Lake
This report covers the period from: to:
Mount Polley
Mining CorporationIMPERIAL METALS CORPORATION
Mount Polley
Mining CorporationIMPERIAL METALS CORPORATION
To
tal L
ea
d (
mg
/L)
Lit
hiu
m (
Li)
-To
tal
(mg
/L)
Mag
ne
siu
m (
Mg
)-T
ota
l
(mg
/L)
To
tal M
an
ga
nese
(mg
/L)
To
tal M
oly
bd
en
um
(mg
/L)
Nic
ke
l (N
i)-T
ota
l (m
g/L
)
Po
tas
siu
m (
K)-
To
tal
(mg
/L)
To
tal S
ele
niu
m (
mg
/L)
P2-5 07/09/16 0.000205 <0.0010 4.92 0.00514 0.00988 <0.00050 1.17 0.00065
P2-10 04/07/16 0.000097 <0.0010 5.68 0.00738 0.00976 <0.00050 1.29 0.000751
23/08/16 0.000127 <0.0010 5.87 0.0111 0.00985 <0.00050 1.35 0.000697
07/09/16 0.000212 <0.0010 5.03 0.00581 0.00987 <0.00050 1.2 0.000648
P2-15 04/07/16 0.00009 <0.0010 5.69 0.0276 0.0106 <0.00050 1.33 0.000694
23/08/16 0.000066 <0.0010 5.69 0.0147 0.00966 <0.00050 1.35 0.00067
07/09/16 0.000155 <0.0010 5.1 0.0185 0.00974 <0.00050 1.26 0.000589
P2-20 04/07/16 0.000074 0.0011 5.55 0.0303 0.00984 <0.00050 1.33 0.000679
23/08/16 0.000069 <0.0010 5.71 0.0352 0.00917 <0.00050 1.34 0.000679
07/09/16 0.000141 <0.0010 5.1 0.0258 0.00934 <0.00050 1.27 0.000595
P2-B 04/07/16 0.00006 0.0014 5.67 0.0906 0.00954 <0.00050 1.33 0.000709
23/08/16 0.00006 <0.0010 6.02 0.164 0.00927 <0.00050 1.4 0.000655
07/09/16 0.000099 <0.0010 5.11 0.15 0.00902 <0.00050 1.28 0.00058
Printed Date: 19/10/2016

1-Jul-2016 30-Sep-2016
Monitoring data report for:
Polley Lake
This report covers the period from: to:
Mount Polley
Mining CorporationIMPERIAL METALS CORPORATION
Mount Polley
Mining CorporationIMPERIAL METALS CORPORATION
Silic
on
(S
i)-T
ota
l (m
g/L
)
Silve
r (A
g)-
To
tal (m
g/L
)
So
diu
m (
Na)-
To
tal
(mg
/L)
Str
on
tiu
m (
Sr)
-To
tal
(mg
/L)
Th
alliu
m (
Tl)
-To
tal
(mg
/L)
Tin
(S
n)-
To
tal (m
g/L
)
Tit
an
ium
(T
i)-T
ota
l
(mg
/L)
Ura
niu
m (
U)-
To
tal
(mg
/L)
P2-5 07/09/16 1.95 <0.000010 8.28 0.3 <0.000010 <0.00010 <0.010 0.000252
P2-10 04/07/16 2.59 <0.000010 9.46 0.306 <0.000010 <0.00010 <0.010 0.000265
23/08/16 2.54 <0.000010 9.16 0.318 <0.000010 <0.00010 <0.010 0.000258
07/09/16 2.11 <0.000010 8.49 0.302 <0.000010 <0.00010 <0.010 0.000255
P2-15 04/07/16 3.04 <0.000010 9.23 0.316 <0.000010 <0.00010 <0.010 0.000284
23/08/16 3.07 <0.000010 8.97 0.318 <0.000010 <0.00010 <0.010 0.000259
07/09/16 2.86 <0.000010 8.7 0.309 <0.000010 <0.00010 <0.010 0.00026
P2-20 04/07/16 3.02 <0.000010 9.7 0.315 <0.000010 <0.00010 <0.010 0.000256
23/08/16 3.23 <0.000010 9.04 0.318 <0.000010 <0.00010 <0.010 0.000244
07/09/16 3.16 <0.000010 8.74 0.311 <0.000010 <0.00010 <0.010 0.000255
P2-B 04/07/16 3.19 <0.000010 9.66 0.31 <0.000010 <0.00010 <0.010 0.000246
23/08/16 3.38 <0.000010 9.45 0.323 <0.000010 <0.00010 <0.010 0.000248
07/09/16 3.36 <0.000010 8.74 0.311 <0.000010 <0.00010 <0.010 0.000252
Printed Date: 19/10/2016
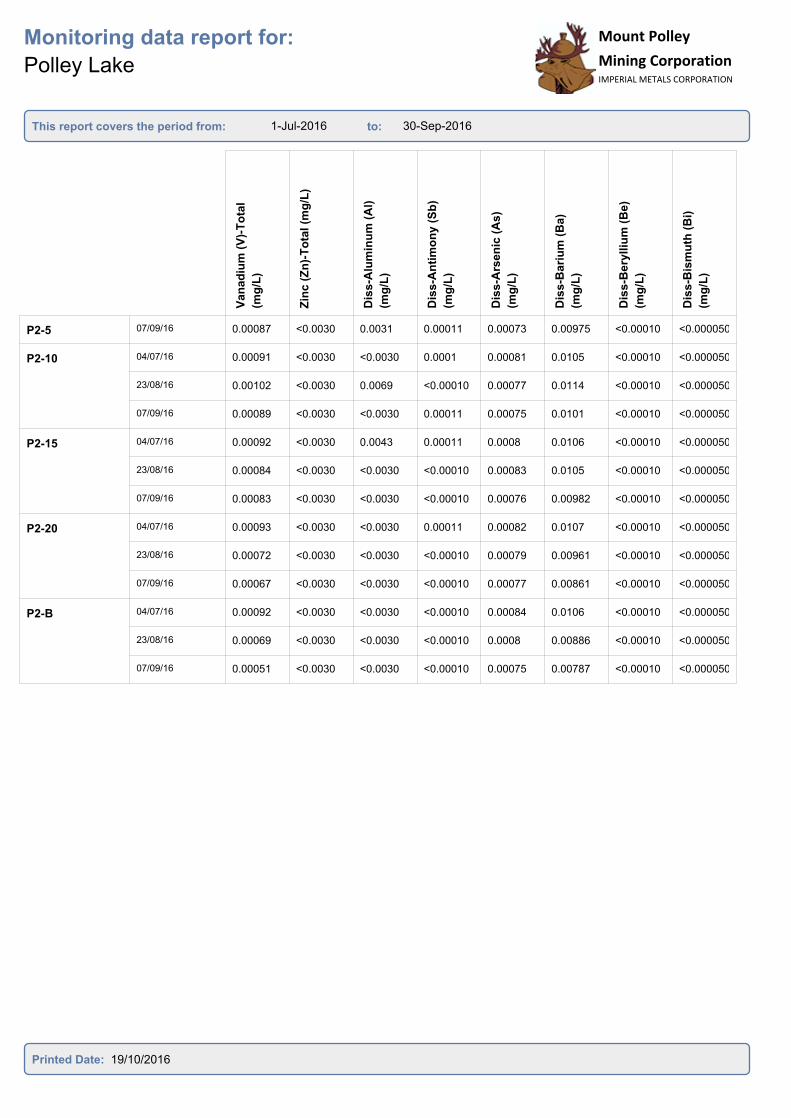
1-Jul-2016 30-Sep-2016
Monitoring data report for:
Polley Lake
This report covers the period from: to:
Mount Polley
Mining CorporationIMPERIAL METALS CORPORATION
Mount Polley
Mining CorporationIMPERIAL METALS CORPORATION
Van
ad
ium
(V
)-T
ota
l
(mg
/L)
Zin
c (
Zn
)-T
ota
l (m
g/L
)
Dis
s-A
lum
inu
m (
Al)
(mg
/L)
Dis
s-A
nti
mo
ny
(S
b)
(mg
/L)
Dis
s-A
rsen
ic (
As
)
(mg
/L)
Dis
s-B
ari
um
(B
a)
(mg
/L)
Dis
s-B
ery
lliu
m (
Be)
(mg
/L)
Dis
s-B
ism
uth
(B
i)
(mg
/L)
P2-5 07/09/16 0.00087 <0.0030 0.0031 0.00011 0.00073 0.00975 <0.00010 <0.000050
P2-10 04/07/16 0.00091 <0.0030 <0.0030 0.0001 0.00081 0.0105 <0.00010 <0.000050
23/08/16 0.00102 <0.0030 0.0069 <0.00010 0.00077 0.0114 <0.00010 <0.000050
07/09/16 0.00089 <0.0030 <0.0030 0.00011 0.00075 0.0101 <0.00010 <0.000050
P2-15 04/07/16 0.00092 <0.0030 0.0043 0.00011 0.0008 0.0106 <0.00010 <0.000050
23/08/16 0.00084 <0.0030 <0.0030 <0.00010 0.00083 0.0105 <0.00010 <0.000050
07/09/16 0.00083 <0.0030 <0.0030 <0.00010 0.00076 0.00982 <0.00010 <0.000050
P2-20 04/07/16 0.00093 <0.0030 <0.0030 0.00011 0.00082 0.0107 <0.00010 <0.000050
23/08/16 0.00072 <0.0030 <0.0030 <0.00010 0.00079 0.00961 <0.00010 <0.000050
07/09/16 0.00067 <0.0030 <0.0030 <0.00010 0.00077 0.00861 <0.00010 <0.000050
P2-B 04/07/16 0.00092 <0.0030 <0.0030 <0.00010 0.00084 0.0106 <0.00010 <0.000050
23/08/16 0.00069 <0.0030 <0.0030 <0.00010 0.0008 0.00886 <0.00010 <0.000050
07/09/16 0.00051 <0.0030 <0.0030 <0.00010 0.00075 0.00787 <0.00010 <0.000050
Printed Date: 19/10/2016
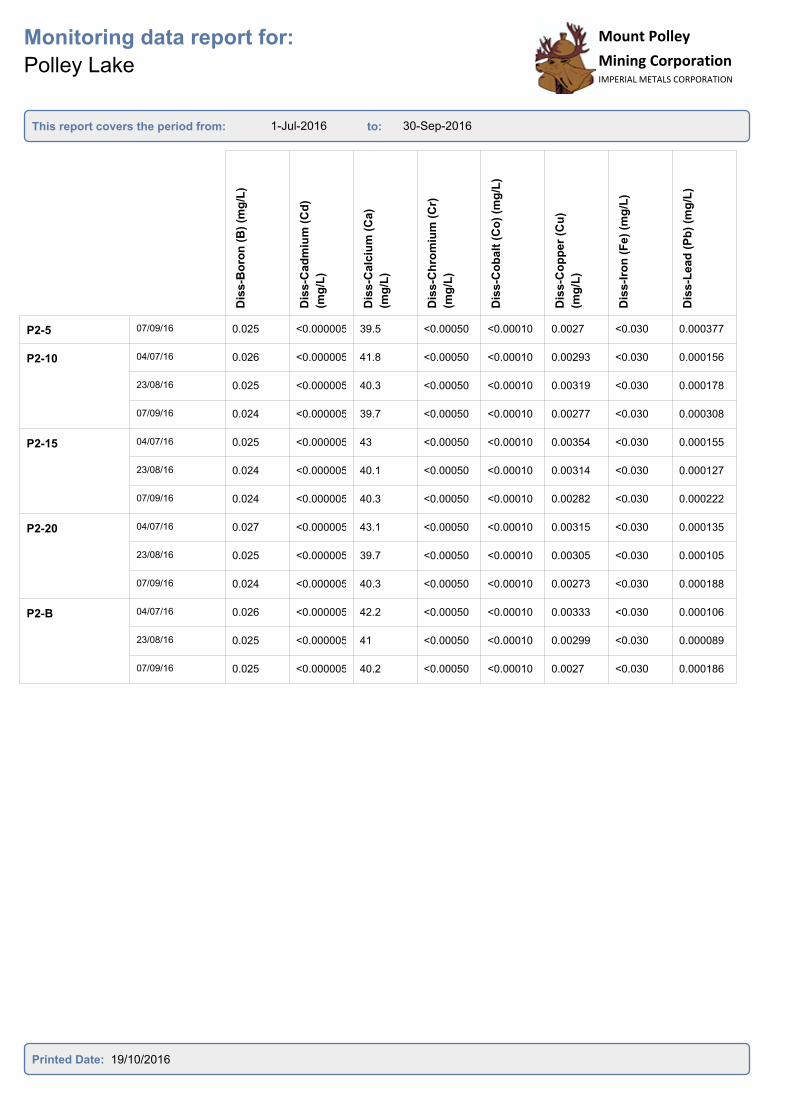
1-Jul-2016 30-Sep-2016
Monitoring data report for:
Polley Lake
This report covers the period from: to:
Mount Polley
Mining CorporationIMPERIAL METALS CORPORATION
Mount Polley
Mining CorporationIMPERIAL METALS CORPORATION
Dis
s-B
oro
n (
B)
(mg
/L)
Dis
s-C
ad
miu
m (
Cd
)
(mg
/L)
Dis
s-C
alc
ium
(C
a)
(mg
/L)
Dis
s-C
hro
miu
m (
Cr)
(mg
/L)
Dis
s-C
ob
alt
(C
o)
(mg
/L)
Dis
s-C
op
pe
r (C
u)
(mg
/L)
Dis
s-I
ron
(F
e)
(mg
/L)
Dis
s-L
ead
(P
b)
(mg
/L)
P2-5 07/09/16 0.025 <0.000005 39.5 <0.00050 <0.00010 0.0027 <0.030 0.000377
P2-10 04/07/16 0.026 <0.000005 41.8 <0.00050 <0.00010 0.00293 <0.030 0.000156
23/08/16 0.025 <0.000005 40.3 <0.00050 <0.00010 0.00319 <0.030 0.000178
07/09/16 0.024 <0.000005 39.7 <0.00050 <0.00010 0.00277 <0.030 0.000308
P2-15 04/07/16 0.025 <0.000005 43 <0.00050 <0.00010 0.00354 <0.030 0.000155
23/08/16 0.024 <0.000005 40.1 <0.00050 <0.00010 0.00314 <0.030 0.000127
07/09/16 0.024 <0.000005 40.3 <0.00050 <0.00010 0.00282 <0.030 0.000222
P2-20 04/07/16 0.027 <0.000005 43.1 <0.00050 <0.00010 0.00315 <0.030 0.000135
23/08/16 0.025 <0.000005 39.7 <0.00050 <0.00010 0.00305 <0.030 0.000105
07/09/16 0.024 <0.000005 40.3 <0.00050 <0.00010 0.00273 <0.030 0.000188
P2-B 04/07/16 0.026 <0.000005 42.2 <0.00050 <0.00010 0.00333 <0.030 0.000106
23/08/16 0.025 <0.000005 41 <0.00050 <0.00010 0.00299 <0.030 0.000089
07/09/16 0.025 <0.000005 40.2 <0.00050 <0.00010 0.0027 <0.030 0.000186
Printed Date: 19/10/2016
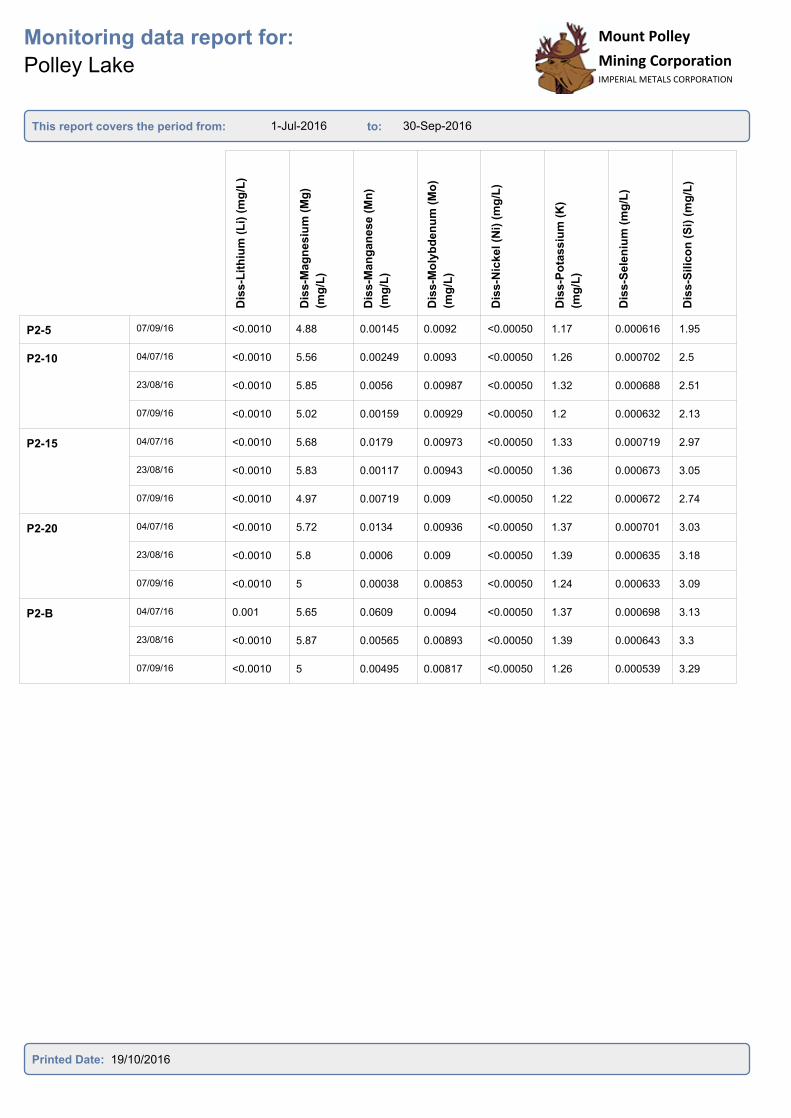
1-Jul-2016 30-Sep-2016
Monitoring data report for:
Polley Lake
This report covers the period from: to:
Mount Polley
Mining CorporationIMPERIAL METALS CORPORATION
Mount Polley
Mining CorporationIMPERIAL METALS CORPORATION
Dis
s-L
ith
ium
(L
i) (
mg
/L)
Dis
s-M
ag
nesiu
m (
Mg
)
(mg
/L)
Dis
s-M
an
gan
ese
(M
n)
(mg
/L)
Dis
s-M
oly
bd
en
um
(M
o)
(mg
/L)
Dis
s-N
ickel (N
i) (
mg
/L)
Dis
s-P
ota
ssiu
m (
K)
(mg
/L)
Dis
s-S
ele
niu
m (
mg
/L)
Dis
s-S
ilic
on
(S
i) (
mg
/L)
P2-5 07/09/16 <0.0010 4.88 0.00145 0.0092 <0.00050 1.17 0.000616 1.95
P2-10 04/07/16 <0.0010 5.56 0.00249 0.0093 <0.00050 1.26 0.000702 2.5
23/08/16 <0.0010 5.85 0.0056 0.00987 <0.00050 1.32 0.000688 2.51
07/09/16 <0.0010 5.02 0.00159 0.00929 <0.00050 1.2 0.000632 2.13
P2-15 04/07/16 <0.0010 5.68 0.0179 0.00973 <0.00050 1.33 0.000719 2.97
23/08/16 <0.0010 5.83 0.00117 0.00943 <0.00050 1.36 0.000673 3.05
07/09/16 <0.0010 4.97 0.00719 0.009 <0.00050 1.22 0.000672 2.74
P2-20 04/07/16 <0.0010 5.72 0.0134 0.00936 <0.00050 1.37 0.000701 3.03
23/08/16 <0.0010 5.8 0.0006 0.009 <0.00050 1.39 0.000635 3.18
07/09/16 <0.0010 5 0.00038 0.00853 <0.00050 1.24 0.000633 3.09
P2-B 04/07/16 0.001 5.65 0.0609 0.0094 <0.00050 1.37 0.000698 3.13
23/08/16 <0.0010 5.87 0.00565 0.00893 <0.00050 1.39 0.000643 3.3
07/09/16 <0.0010 5 0.00495 0.00817 <0.00050 1.26 0.000539 3.29
Printed Date: 19/10/2016
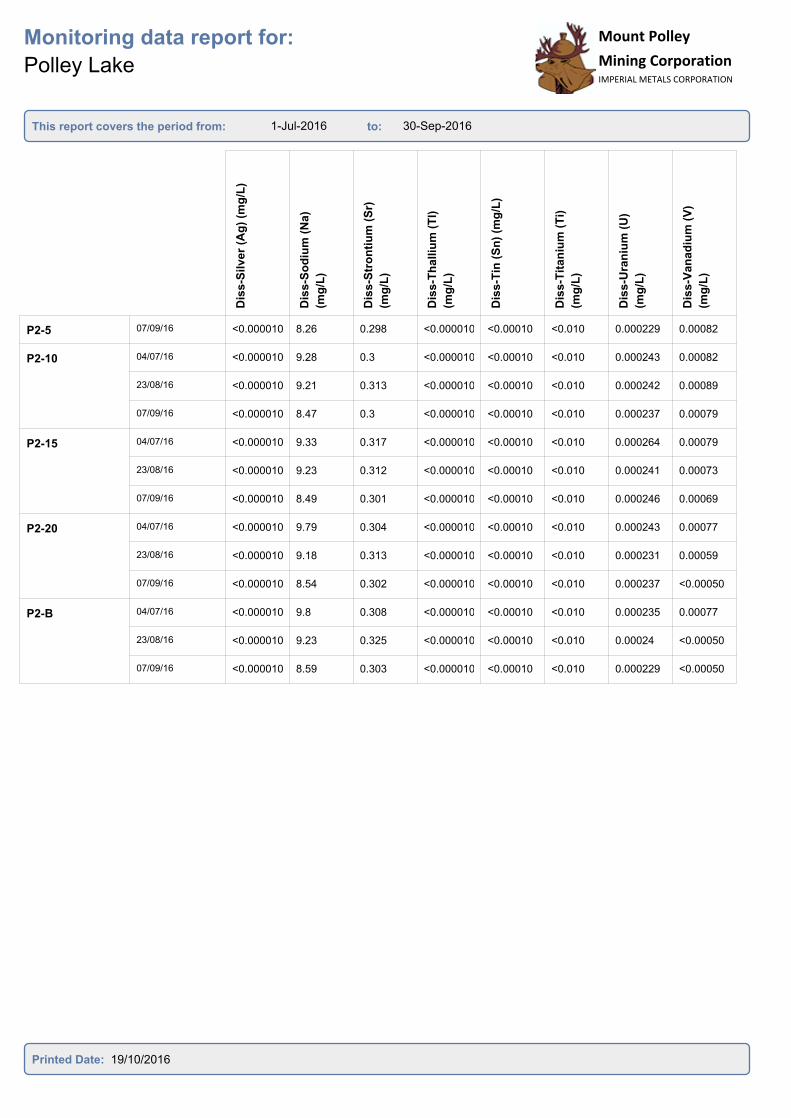
1-Jul-2016 30-Sep-2016
Monitoring data report for:
Polley Lake
This report covers the period from: to:
Mount Polley
Mining CorporationIMPERIAL METALS CORPORATION
Mount Polley
Mining CorporationIMPERIAL METALS CORPORATION
Dis
s-S
ilv
er
(Ag
) (m
g/L
)
Dis
s-S
od
ium
(N
a)
(mg
/L)
Dis
s-S
tro
nti
um
(S
r)
(mg
/L)
Dis
s-T
halliu
m (
Tl)
(mg
/L)
Dis
s-T
in (
Sn
) (m
g/L
)
Dis
s-T
itan
ium
(T
i)
(mg
/L)
Dis
s-U
ran
ium
(U
)
(mg
/L)
Dis
s-V
an
ad
ium
(V
)
(mg
/L)
P2-5 07/09/16 <0.000010 8.26 0.298 <0.000010 <0.00010 <0.010 0.000229 0.00082
P2-10 04/07/16 <0.000010 9.28 0.3 <0.000010 <0.00010 <0.010 0.000243 0.00082
23/08/16 <0.000010 9.21 0.313 <0.000010 <0.00010 <0.010 0.000242 0.00089
07/09/16 <0.000010 8.47 0.3 <0.000010 <0.00010 <0.010 0.000237 0.00079
P2-15 04/07/16 <0.000010 9.33 0.317 <0.000010 <0.00010 <0.010 0.000264 0.00079
23/08/16 <0.000010 9.23 0.312 <0.000010 <0.00010 <0.010 0.000241 0.00073
07/09/16 <0.000010 8.49 0.301 <0.000010 <0.00010 <0.010 0.000246 0.00069
P2-20 04/07/16 <0.000010 9.79 0.304 <0.000010 <0.00010 <0.010 0.000243 0.00077
23/08/16 <0.000010 9.18 0.313 <0.000010 <0.00010 <0.010 0.000231 0.00059
07/09/16 <0.000010 8.54 0.302 <0.000010 <0.00010 <0.010 0.000237 <0.00050
P2-B 04/07/16 <0.000010 9.8 0.308 <0.000010 <0.00010 <0.010 0.000235 0.00077
23/08/16 <0.000010 9.23 0.325 <0.000010 <0.00010 <0.010 0.00024 <0.00050
07/09/16 <0.000010 8.59 0.303 <0.000010 <0.00010 <0.010 0.000229 <0.00050
Printed Date: 19/10/2016
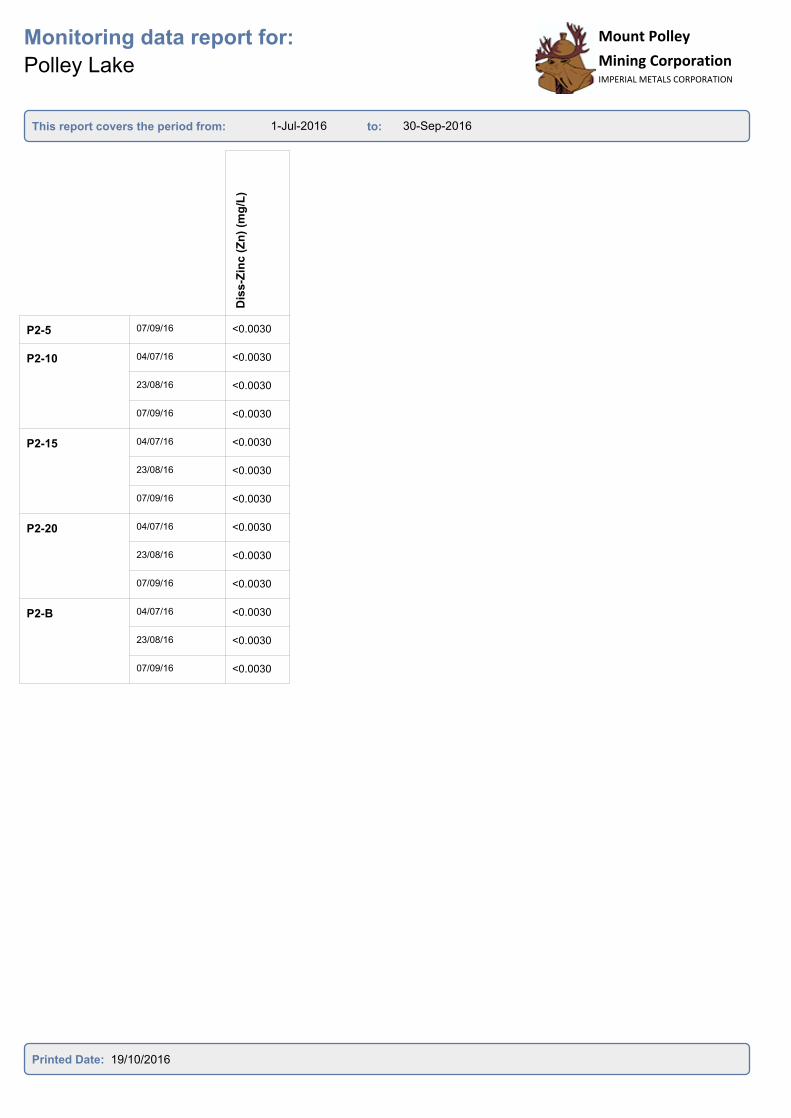
1-Jul-2016 30-Sep-2016
Monitoring data report for:
Polley Lake
This report covers the period from: to:
Mount Polley
Mining CorporationIMPERIAL METALS CORPORATION
Mount Polley
Mining CorporationIMPERIAL METALS CORPORATION
Dis
s-Z
inc (
Zn
) (m
g/L
)
P2-5 07/09/16 <0.0030
P2-10 04/07/16 <0.0030
23/08/16 <0.0030
07/09/16 <0.0030
P2-15 04/07/16 <0.0030
23/08/16 <0.0030
07/09/16 <0.0030
P2-20 04/07/16 <0.0030
23/08/16 <0.0030
07/09/16 <0.0030
P2-B 04/07/16 <0.0030
23/08/16 <0.0030
07/09/16 <0.0030
Printed Date: 19/10/2016

1-Jul-2016 30-Sep-2016
Monitoring data report for:
Quesnel Lake
This report covers the period from: to:
Mount Polley
Mining CorporationIMPERIAL METALS CORPORATION
Co
nd
ucti
vit
y (
µs/c
m)
Hard
nes
s (
mg
/L)
pH
(p
H)
TD
S (
mg
/L)
TS
S (
mg
/L)
NT
U (
ntu
)
Alk
alin
ity
(C
aC
O3)
(mg
/L)
Am
mo
nia
(a
s N
) (m
g/L
)
QUL-120a-0m 20/07/16 96.2 47.3 7.77 84 <1.0 0.27 43.7 <0.0050
24/08/16 105 49.8 7.83 81 <1.0 0.27 47.7 <0.0050
QUL-120a-120
m
24/08/16 108 52.9 7.79 81 <1.0 0.16 50.7 <0.0050
QUL-120a-140
m
24/08/16 108 52.9 7.79 81 <1.0 0.14 50.5 <0.0050
QUL-120a-40m 24/08/16 106 53.1 7.79 82 <1.0 0.24 50.3 <0.0050
QUL-120a-80m 24/08/16 107 53.2 7.78 78 <1.0 0.15 50 <0.0050
QUL-18-0m 20/07/16 98.2 47.5 7.78 76 <1.0 0.35 46.1 <0.0050
15/08/16 100 49.5 7.88 61 <1.0 0.23 48.5 <0.0050
12/09/16 103 48.4 7.9 79 <1.0 0.23 48.9 <0.0050
QUL-18-100m 20/07/16 112 54.8 7.73 84 <1.0 0.43 49.4 <0.0050
15/08/16 115 55.1 7.86 83 <1.0 0.3 53.6 <0.0050
12/09/16 112 53.4 7.87 90 <1.0 0.34 51.7 <0.0050
QUL-18-20m 20/07/16 108 51.7 7.79 76 <1.0 0.19 47 <0.0050
15/08/16 106 51 7.84 69 <1.0 0.25 51.1 <0.0050
12/09/16 109 50.9 7.85 81 <1.0 0.26 49.9 <0.0050
QUL-18-50m 20/07/16 110 54.4 7.76 84 <1.0 0.25 48.7 <0.0050
15/08/16 119 56.1 7.85 71 <1.0 0.23 53.1 <0.0050
12/09/16 113 53.4 7.86 85 <1.0 0.27 51.2 <0.0050
QUL-2a-0m 20/07/16 97.1 46.9 7.74 76 <1.0 0.36 44.9 <0.0050
15/08/16 100 50.2 7.85 56 <1.0 0.21 48.4 <0.0050
12/09/16 104 49.6 7.86 73 <1.0 0.35 48.8 <0.0050
QUL-2a-20m 20/07/16 106 51.5 7.73 77 <1.0 0.36 48.8 <0.0050
15/08/16 106 52.9 7.83 66 <1.0 0.22 51 <0.0050
Printed Date: 19/10/2016

1-Jul-2016 30-Sep-2016
Monitoring data report for:
Quesnel Lake
This report covers the period from: to:
Mount Polley
Mining CorporationIMPERIAL METALS CORPORATION
Mount Polley
Mining CorporationIMPERIAL METALS CORPORATION
Ch
lori
de (
mg
/L)
Flo
rid
e (
mg
/L)
Nit
rate
(N
) (m
g/L
)
Nit
rate
an
d N
itri
te
(mg
/L)
Nit
rite
(N
) (m
g/L
)
Dis
s-O
rth
op
ho
sp
hate
(mg
/L)
Dis
s-P
ho
sp
ho
rus
(mg
/L)
To
tal P
ho
sp
ho
rus
(mg
/L)
QUL-120a-0m 20/07/16 <0.50 0.032 0.0451 0.0451 <0.0010 <0.0010 <0.0020 <0.0020
24/08/16 <0.50 0.034 0.0587 0.0587 <0.0010 <0.0010 <0.0020 <0.0020
QUL-120a-120
m
24/08/16 <0.50 0.036 0.144 0.144 <0.0010 <0.0010 <0.0020 <0.0020
QUL-120a-140
m
24/08/16 <0.50 0.036 0.146 0.146 <0.0010 <0.0010 <0.0020 <0.0020
QUL-120a-40m 24/08/16 <0.50 0.036 0.143 0.143 <0.0010 <0.0010 <0.0020 <0.0020
QUL-120a-80m 24/08/16 <0.50 0.035 0.143 0.143 <0.0010 <0.0010 <0.0020 <0.0020
QUL-18-0m 20/07/16 <0.50 0.032 0.0453 0.0453 <0.0010 <0.0010 <0.0020 0.0036
15/08/16 <0.50 0.031 0.0422 0.0422 <0.0010 <0.0010 <0.0020 <0.0020
12/09/16 <0.50 0.035 0.0539 0.0539 <0.0010 <0.0010 <0.0020 0.0062
QUL-18-100m 20/07/16 <0.50 0.035 0.153 0.153 <0.0010 <0.0010 <0.0020 0.0024
15/08/16 <0.50 0.035 0.155 0.155 <0.0010 <0.0010 <0.0020 <0.0020
12/09/16 <0.50 0.036 0.166 0.166 <0.0010 <0.0010 <0.0020 0.0025
QUL-18-20m 20/07/16 <0.50 0.033 0.123 0.123 <0.0010 <0.0010 <0.0020 0.0028
15/08/16 <0.50 0.033 0.121 0.121 <0.0010 <0.0010 <0.0020 <0.0020
12/09/16 <0.50 0.037 0.148 0.148 <0.0010 <0.0010 <0.0020 0.0032
QUL-18-50m 20/07/16 <0.50 0.035 0.148 0.148 <0.0010 <0.0010 <0.0020 0.0025
15/08/16 <0.50 0.037 0.19 0.19 <0.0010 0.001 <0.0020 <0.0020
12/09/16 <0.50 0.037 0.172 0.172 <0.0010 <0.0010 <0.0020 0.0038
QUL-2a-0m 20/07/16 <0.50 0.032 0.0367 0.0367 <0.0010 <0.0010 <0.0020 0.003
15/08/16 <0.50 0.031 0.042 0.042 <0.0010 <0.0010 <0.0020 <0.0020
12/09/16 <0.50 0.035 0.0556 0.0556 <0.0010 <0.0010 <0.0020 0.0033
QUL-2a-20m 20/07/16 <0.50 0.034 0.127 0.127 <0.0010 <0.0010 <0.0020 0.0037
15/08/16 <0.50 0.033 0.13 0.13 <0.0010 <0.0010 <0.0020 <0.0020
Printed Date: 19/10/2016
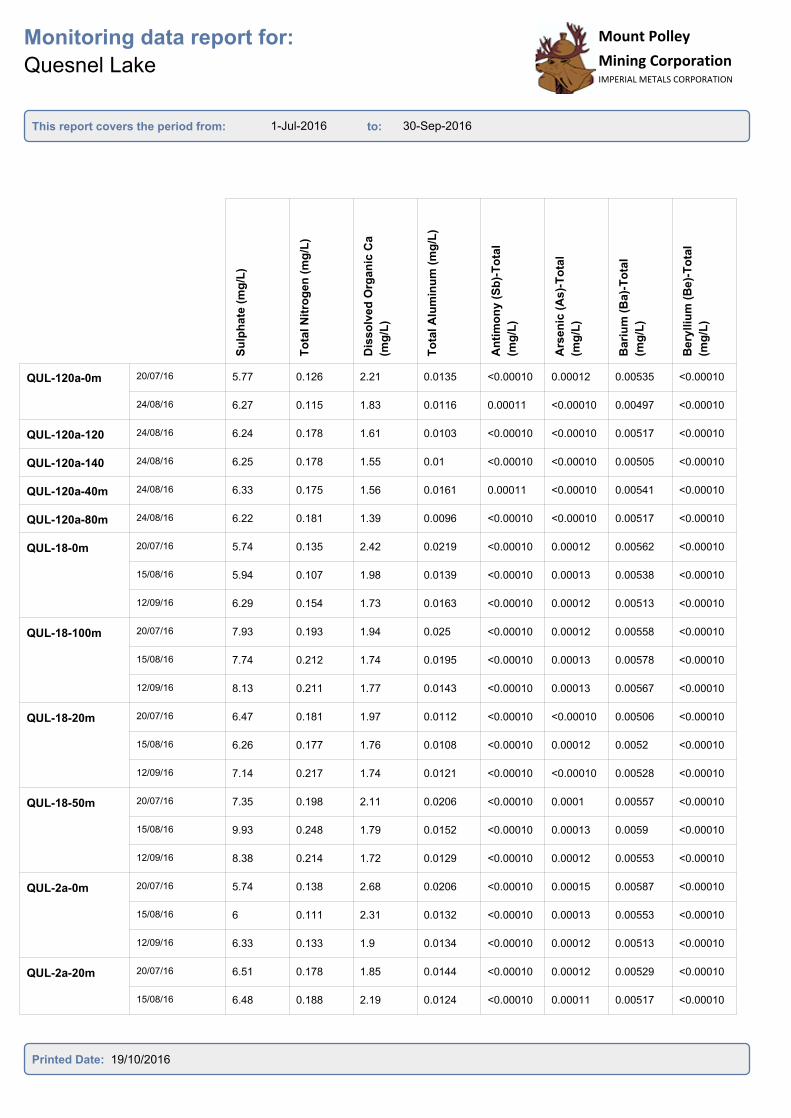
1-Jul-2016 30-Sep-2016
Monitoring data report for:
Quesnel Lake
This report covers the period from: to:
Mount Polley
Mining CorporationIMPERIAL METALS CORPORATION
Mount Polley
Mining CorporationIMPERIAL METALS CORPORATION
Su
lph
ate
(m
g/L
)
To
tal N
itro
ge
n (
mg
/L)
Dis
so
lved
Org
an
ic C
a
(mg
/L)
To
tal A
lum
inu
m (
mg
/L)
An
tim
on
y (
Sb
)-T
ota
l
(mg
/L)
Ars
en
ic (
As)-
To
tal
(mg
/L)
Bari
um
(B
a)-
To
tal
(mg
/L)
Bery
lliu
m (
Be)-
To
tal
(mg
/L)
QUL-120a-0m 20/07/16 5.77 0.126 2.21 0.0135 <0.00010 0.00012 0.00535 <0.00010
24/08/16 6.27 0.115 1.83 0.0116 0.00011 <0.00010 0.00497 <0.00010
QUL-120a-120
m
24/08/16 6.24 0.178 1.61 0.0103 <0.00010 <0.00010 0.00517 <0.00010
QUL-120a-140
m
24/08/16 6.25 0.178 1.55 0.01 <0.00010 <0.00010 0.00505 <0.00010
QUL-120a-40m 24/08/16 6.33 0.175 1.56 0.0161 0.00011 <0.00010 0.00541 <0.00010
QUL-120a-80m 24/08/16 6.22 0.181 1.39 0.0096 <0.00010 <0.00010 0.00517 <0.00010
QUL-18-0m 20/07/16 5.74 0.135 2.42 0.0219 <0.00010 0.00012 0.00562 <0.00010
15/08/16 5.94 0.107 1.98 0.0139 <0.00010 0.00013 0.00538 <0.00010
12/09/16 6.29 0.154 1.73 0.0163 <0.00010 0.00012 0.00513 <0.00010
QUL-18-100m 20/07/16 7.93 0.193 1.94 0.025 <0.00010 0.00012 0.00558 <0.00010
15/08/16 7.74 0.212 1.74 0.0195 <0.00010 0.00013 0.00578 <0.00010
12/09/16 8.13 0.211 1.77 0.0143 <0.00010 0.00013 0.00567 <0.00010
QUL-18-20m 20/07/16 6.47 0.181 1.97 0.0112 <0.00010 <0.00010 0.00506 <0.00010
15/08/16 6.26 0.177 1.76 0.0108 <0.00010 0.00012 0.0052 <0.00010
12/09/16 7.14 0.217 1.74 0.0121 <0.00010 <0.00010 0.00528 <0.00010
QUL-18-50m 20/07/16 7.35 0.198 2.11 0.0206 <0.00010 0.0001 0.00557 <0.00010
15/08/16 9.93 0.248 1.79 0.0152 <0.00010 0.00013 0.0059 <0.00010
12/09/16 8.38 0.214 1.72 0.0129 <0.00010 0.00012 0.00553 <0.00010
QUL-2a-0m 20/07/16 5.74 0.138 2.68 0.0206 <0.00010 0.00015 0.00587 <0.00010
15/08/16 6 0.111 2.31 0.0132 <0.00010 0.00013 0.00553 <0.00010
12/09/16 6.33 0.133 1.9 0.0134 <0.00010 0.00012 0.00513 <0.00010
QUL-2a-20m 20/07/16 6.51 0.178 1.85 0.0144 <0.00010 0.00012 0.00529 <0.00010
15/08/16 6.48 0.188 2.19 0.0124 <0.00010 0.00011 0.00517 <0.00010
Printed Date: 19/10/2016

1-Jul-2016 30-Sep-2016
Monitoring data report for:
Quesnel Lake
This report covers the period from: to:
Mount Polley
Mining CorporationIMPERIAL METALS CORPORATION
Mount Polley
Mining CorporationIMPERIAL METALS CORPORATION
Bis
mu
th (
Bi)
-To
tal
(mg
/L)
Bo
ron
(B
)-T
ota
l (m
g/L
)
To
tal C
ad
miu
m (
mg
/L)
Calc
ium
(C
a)-
To
tal
(mg
/L)
Ch
rom
ium
(C
r)-T
ota
l
(mg
/L)
Co
balt
(C
o)-
To
tal
(mg
/L)
To
tal C
op
per
(mg
/L)
To
tal Ir
on
(m
g/L
)
QUL-120a-0m 20/07/16 <0.000050 <0.010 <0.000005 15.6 <0.00050 <0.00010 0.00056 <0.030
24/08/16 <0.000050 <0.010 <0.000005 17.7 <0.00050 <0.00010 0.00054 <0.030
QUL-120a-120
m
24/08/16 <0.000050 <0.010 <0.000005 18.7 <0.00050 <0.00010 0.00085 <0.030
QUL-120a-140
m
24/08/16 <0.000050 <0.010 <0.000005 17.9 <0.00050 <0.00010 0.00093 <0.030
QUL-120a-40m 24/08/16 <0.000050 <0.010 <0.000005 18.4 <0.00050 <0.00010 0.001 <0.030
QUL-120a-80m 24/08/16 <0.000050 <0.010 <0.000005 18.2 <0.00050 <0.00010 0.00099 <0.030
QUL-18-0m 20/07/16 <0.000050 <0.010 <0.000005 16.3 <0.00050 <0.00010 0.00109 0.035
15/08/16 <0.000050 <0.010 <0.000005 17.2 <0.00050 <0.00010 0.00093 <0.030
12/09/16 <0.000050 <0.010 <0.000005 17.1 <0.00050 <0.00010 0.00081 <0.030
QUL-18-100m 20/07/16 <0.000050 <0.010 <0.000005 18.6 <0.00050 <0.00010 0.00134 <0.030
15/08/16 <0.000050 <0.010 <0.000005 18.5 <0.00050 <0.00010 0.00126 <0.030
12/09/16 <0.000050 <0.010 <0.000005 18.9 <0.00050 <0.00010 0.00127 <0.030
QUL-18-20m 20/07/16 <0.000050 <0.010 <0.000005 17.5 <0.00050 <0.00010 0.00086 <0.030
15/08/16 <0.000050 <0.010 <0.000005 17 <0.00050 <0.00010 0.00071 <0.030
12/09/16 <0.000050 <0.010 <0.000005 18.3 <0.00050 <0.00010 0.00087 <0.030
QUL-18-50m 20/07/16 <0.000050 <0.010 <0.000005 18.6 <0.00050 <0.00010 0.00095 <0.030
15/08/16 <0.000050 <0.010 <0.000005 18.8 <0.00050 <0.00010 0.00104 <0.030
12/09/16 <0.000050 <0.010 <0.000005 18 <0.00050 <0.00010 0.00116 <0.030
QUL-2a-0m 20/07/16 <0.000050 <0.010 <0.000005 15.8 <0.00050 <0.00010 0.00067 0.038
15/08/16 <0.000050 <0.010 <0.000005 16.9 <0.00050 <0.00010 0.00077 <0.030
12/09/16 <0.000050 <0.010 <0.000005 17.2 <0.00050 <0.00010 0.00062 <0.030
QUL-2a-20m 20/07/16 <0.000050 <0.010 <0.000005 17.7 <0.00050 <0.00010 0.00063 <0.030
15/08/16 <0.000050 <0.010 <0.000005 18 <0.00050 <0.00010 0.00074 <0.030
Printed Date: 19/10/2016
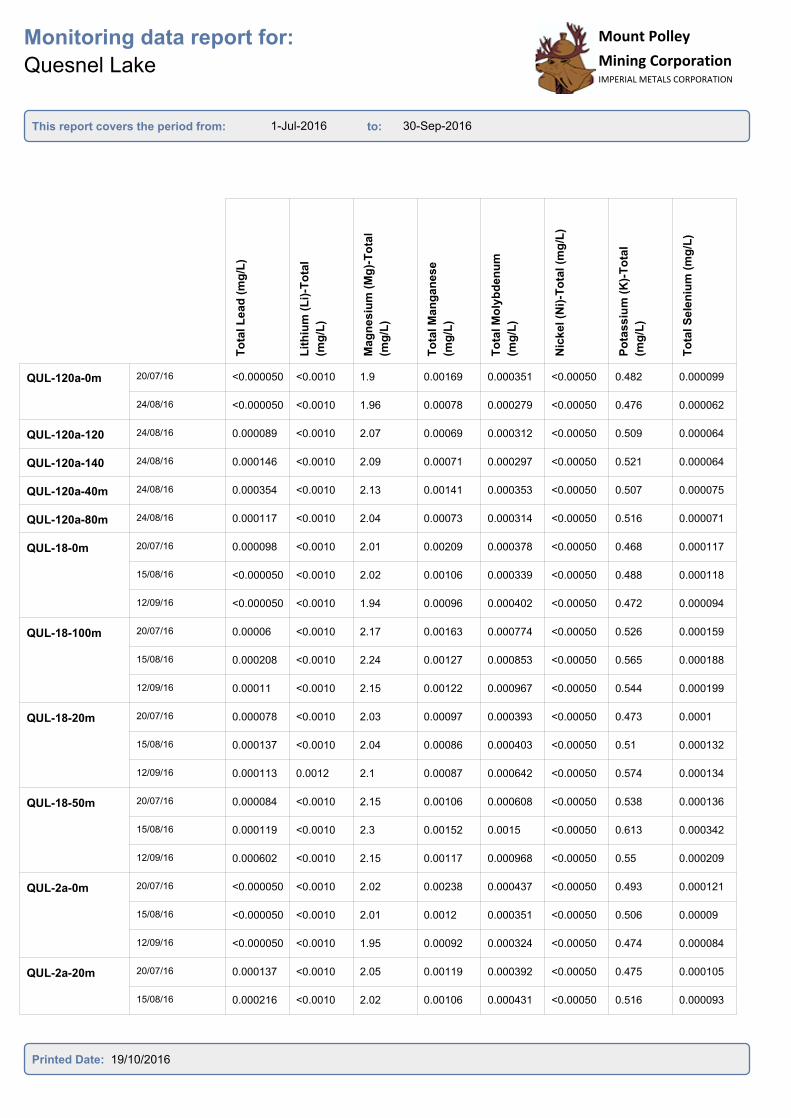
1-Jul-2016 30-Sep-2016
Monitoring data report for:
Quesnel Lake
This report covers the period from: to:
Mount Polley
Mining CorporationIMPERIAL METALS CORPORATION
Mount Polley
Mining CorporationIMPERIAL METALS CORPORATION
To
tal L
ea
d (
mg
/L)
Lit
hiu
m (
Li)
-To
tal
(mg
/L)
Mag
nes
ium
(M
g)-
To
tal
(mg
/L)
To
tal M
an
ga
nese
(mg
/L)
To
tal M
oly
bd
en
um
(mg
/L)
Nic
ke
l (N
i)-T
ota
l (m
g/L
)
Po
tas
siu
m (
K)-
To
tal
(mg
/L)
To
tal S
ele
niu
m (
mg
/L)
QUL-120a-0m 20/07/16 <0.000050 <0.0010 1.9 0.00169 0.000351 <0.00050 0.482 0.000099
24/08/16 <0.000050 <0.0010 1.96 0.00078 0.000279 <0.00050 0.476 0.000062
QUL-120a-120
m
24/08/16 0.000089 <0.0010 2.07 0.00069 0.000312 <0.00050 0.509 0.000064
QUL-120a-140
m
24/08/16 0.000146 <0.0010 2.09 0.00071 0.000297 <0.00050 0.521 0.000064
QUL-120a-40m 24/08/16 0.000354 <0.0010 2.13 0.00141 0.000353 <0.00050 0.507 0.000075
QUL-120a-80m 24/08/16 0.000117 <0.0010 2.04 0.00073 0.000314 <0.00050 0.516 0.000071
QUL-18-0m 20/07/16 0.000098 <0.0010 2.01 0.00209 0.000378 <0.00050 0.468 0.000117
15/08/16 <0.000050 <0.0010 2.02 0.00106 0.000339 <0.00050 0.488 0.000118
12/09/16 <0.000050 <0.0010 1.94 0.00096 0.000402 <0.00050 0.472 0.000094
QUL-18-100m 20/07/16 0.00006 <0.0010 2.17 0.00163 0.000774 <0.00050 0.526 0.000159
15/08/16 0.000208 <0.0010 2.24 0.00127 0.000853 <0.00050 0.565 0.000188
12/09/16 0.00011 <0.0010 2.15 0.00122 0.000967 <0.00050 0.544 0.000199
QUL-18-20m 20/07/16 0.000078 <0.0010 2.03 0.00097 0.000393 <0.00050 0.473 0.0001
15/08/16 0.000137 <0.0010 2.04 0.00086 0.000403 <0.00050 0.51 0.000132
12/09/16 0.000113 0.0012 2.1 0.00087 0.000642 <0.00050 0.574 0.000134
QUL-18-50m 20/07/16 0.000084 <0.0010 2.15 0.00106 0.000608 <0.00050 0.538 0.000136
15/08/16 0.000119 <0.0010 2.3 0.00152 0.0015 <0.00050 0.613 0.000342
12/09/16 0.000602 <0.0010 2.15 0.00117 0.000968 <0.00050 0.55 0.000209
QUL-2a-0m 20/07/16 <0.000050 <0.0010 2.02 0.00238 0.000437 <0.00050 0.493 0.000121
15/08/16 <0.000050 <0.0010 2.01 0.0012 0.000351 <0.00050 0.506 0.00009
12/09/16 <0.000050 <0.0010 1.95 0.00092 0.000324 <0.00050 0.474 0.000084
QUL-2a-20m 20/07/16 0.000137 <0.0010 2.05 0.00119 0.000392 <0.00050 0.475 0.000105
15/08/16 0.000216 <0.0010 2.02 0.00106 0.000431 <0.00050 0.516 0.000093
Printed Date: 19/10/2016
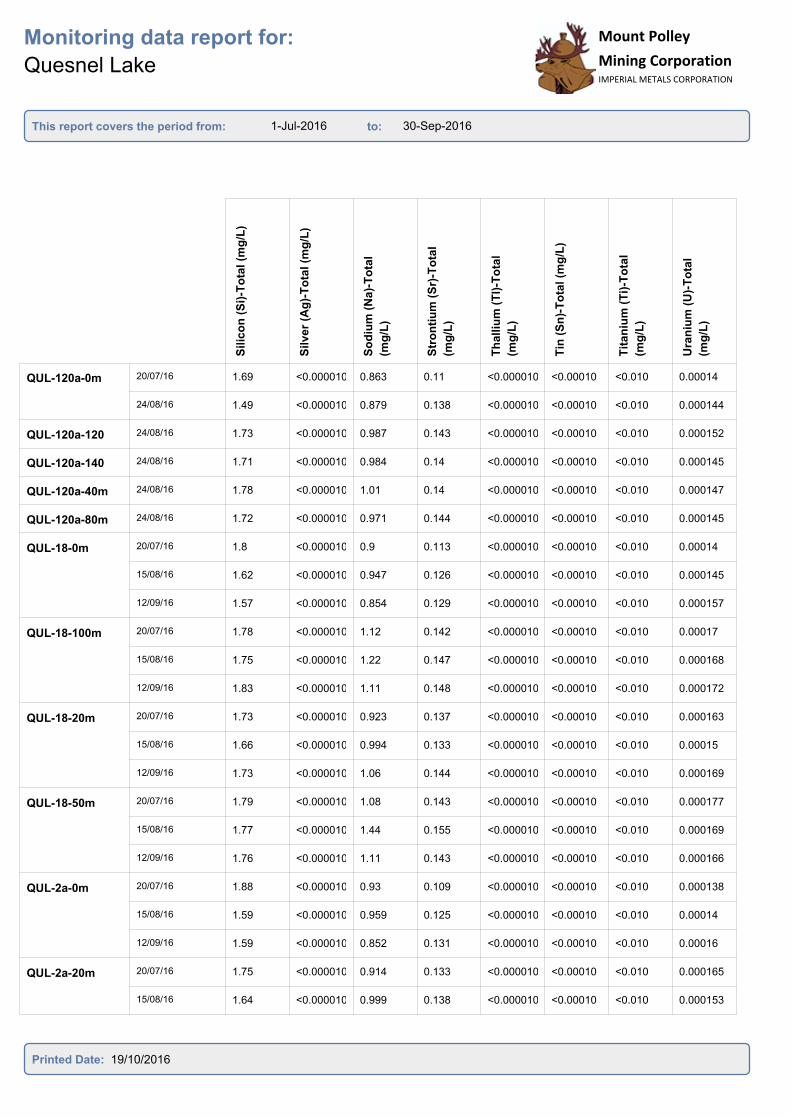
1-Jul-2016 30-Sep-2016
Monitoring data report for:
Quesnel Lake
This report covers the period from: to:
Mount Polley
Mining CorporationIMPERIAL METALS CORPORATION
Mount Polley
Mining CorporationIMPERIAL METALS CORPORATION
Silic
on
(S
i)-T
ota
l (m
g/L
)
Silve
r (A
g)-
To
tal (m
g/L
)
So
diu
m (
Na)-
To
tal
(mg
/L)
Str
on
tiu
m (
Sr)
-To
tal
(mg
/L)
Th
alliu
m (
Tl)
-To
tal
(mg
/L)
Tin
(S
n)-
To
tal (m
g/L
)
Tit
an
ium
(T
i)-T
ota
l
(mg
/L)
Ura
niu
m (
U)-
To
tal
(mg
/L)
QUL-120a-0m 20/07/16 1.69 <0.000010 0.863 0.11 <0.000010 <0.00010 <0.010 0.00014
24/08/16 1.49 <0.000010 0.879 0.138 <0.000010 <0.00010 <0.010 0.000144
QUL-120a-120
m
24/08/16 1.73 <0.000010 0.987 0.143 <0.000010 <0.00010 <0.010 0.000152
QUL-120a-140
m
24/08/16 1.71 <0.000010 0.984 0.14 <0.000010 <0.00010 <0.010 0.000145
QUL-120a-40m 24/08/16 1.78 <0.000010 1.01 0.14 <0.000010 <0.00010 <0.010 0.000147
QUL-120a-80m 24/08/16 1.72 <0.000010 0.971 0.144 <0.000010 <0.00010 <0.010 0.000145
QUL-18-0m 20/07/16 1.8 <0.000010 0.9 0.113 <0.000010 <0.00010 <0.010 0.00014
15/08/16 1.62 <0.000010 0.947 0.126 <0.000010 <0.00010 <0.010 0.000145
12/09/16 1.57 <0.000010 0.854 0.129 <0.000010 <0.00010 <0.010 0.000157
QUL-18-100m 20/07/16 1.78 <0.000010 1.12 0.142 <0.000010 <0.00010 <0.010 0.00017
15/08/16 1.75 <0.000010 1.22 0.147 <0.000010 <0.00010 <0.010 0.000168
12/09/16 1.83 <0.000010 1.11 0.148 <0.000010 <0.00010 <0.010 0.000172
QUL-18-20m 20/07/16 1.73 <0.000010 0.923 0.137 <0.000010 <0.00010 <0.010 0.000163
15/08/16 1.66 <0.000010 0.994 0.133 <0.000010 <0.00010 <0.010 0.00015
12/09/16 1.73 <0.000010 1.06 0.144 <0.000010 <0.00010 <0.010 0.000169
QUL-18-50m 20/07/16 1.79 <0.000010 1.08 0.143 <0.000010 <0.00010 <0.010 0.000177
15/08/16 1.77 <0.000010 1.44 0.155 <0.000010 <0.00010 <0.010 0.000169
12/09/16 1.76 <0.000010 1.11 0.143 <0.000010 <0.00010 <0.010 0.000166
QUL-2a-0m 20/07/16 1.88 <0.000010 0.93 0.109 <0.000010 <0.00010 <0.010 0.000138
15/08/16 1.59 <0.000010 0.959 0.125 <0.000010 <0.00010 <0.010 0.00014
12/09/16 1.59 <0.000010 0.852 0.131 <0.000010 <0.00010 <0.010 0.00016
QUL-2a-20m 20/07/16 1.75 <0.000010 0.914 0.133 <0.000010 <0.00010 <0.010 0.000165
15/08/16 1.64 <0.000010 0.999 0.138 <0.000010 <0.00010 <0.010 0.000153
Printed Date: 19/10/2016
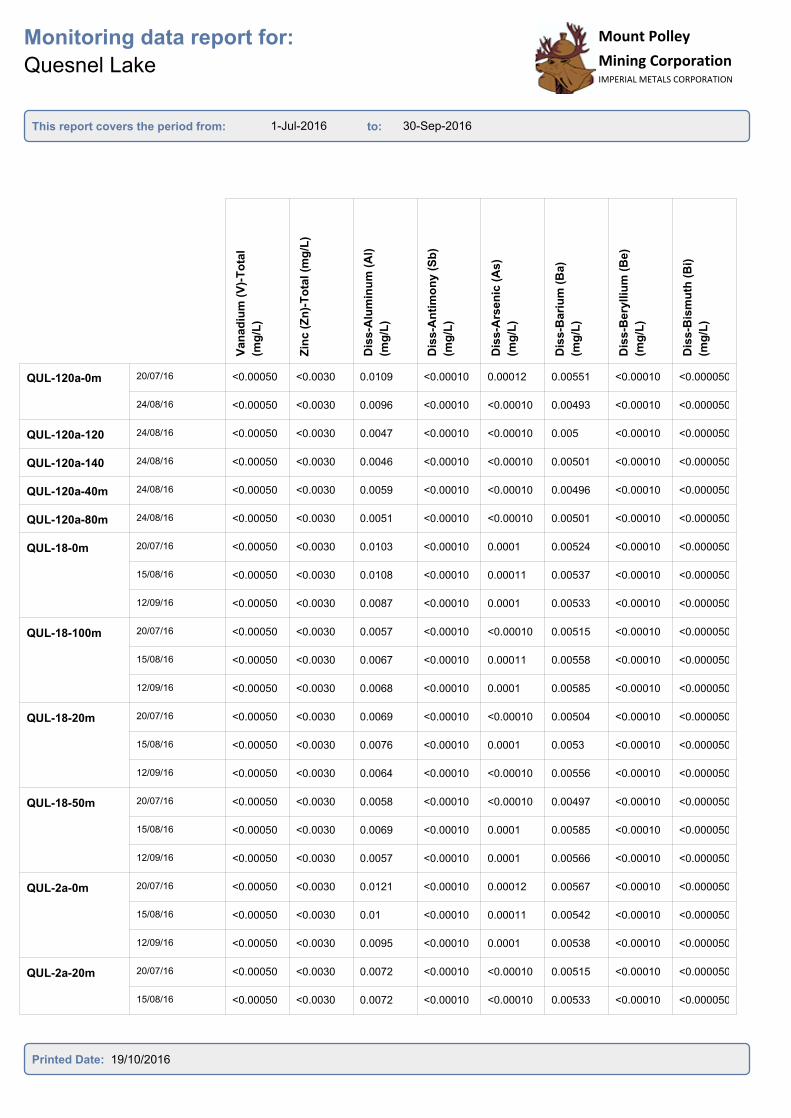
1-Jul-2016 30-Sep-2016
Monitoring data report for:
Quesnel Lake
This report covers the period from: to:
Mount Polley
Mining CorporationIMPERIAL METALS CORPORATION
Mount Polley
Mining CorporationIMPERIAL METALS CORPORATION
Van
ad
ium
(V
)-T
ota
l
(mg
/L)
Zin
c (
Zn
)-T
ota
l (m
g/L
)
Dis
s-A
lum
inu
m (
Al)
(mg
/L)
Dis
s-A
nti
mo
ny
(S
b)
(mg
/L)
Dis
s-A
rsen
ic (
As
)
(mg
/L)
Dis
s-B
ari
um
(B
a)
(mg
/L)
Dis
s-B
ery
lliu
m (
Be)
(mg
/L)
Dis
s-B
ism
uth
(B
i)
(mg
/L)
QUL-120a-0m 20/07/16 <0.00050 <0.0030 0.0109 <0.00010 0.00012 0.00551 <0.00010 <0.000050
24/08/16 <0.00050 <0.0030 0.0096 <0.00010 <0.00010 0.00493 <0.00010 <0.000050
QUL-120a-120
m
24/08/16 <0.00050 <0.0030 0.0047 <0.00010 <0.00010 0.005 <0.00010 <0.000050
QUL-120a-140
m
24/08/16 <0.00050 <0.0030 0.0046 <0.00010 <0.00010 0.00501 <0.00010 <0.000050
QUL-120a-40m 24/08/16 <0.00050 <0.0030 0.0059 <0.00010 <0.00010 0.00496 <0.00010 <0.000050
QUL-120a-80m 24/08/16 <0.00050 <0.0030 0.0051 <0.00010 <0.00010 0.00501 <0.00010 <0.000050
QUL-18-0m 20/07/16 <0.00050 <0.0030 0.0103 <0.00010 0.0001 0.00524 <0.00010 <0.000050
15/08/16 <0.00050 <0.0030 0.0108 <0.00010 0.00011 0.00537 <0.00010 <0.000050
12/09/16 <0.00050 <0.0030 0.0087 <0.00010 0.0001 0.00533 <0.00010 <0.000050
QUL-18-100m 20/07/16 <0.00050 <0.0030 0.0057 <0.00010 <0.00010 0.00515 <0.00010 <0.000050
15/08/16 <0.00050 <0.0030 0.0067 <0.00010 0.00011 0.00558 <0.00010 <0.000050
12/09/16 <0.00050 <0.0030 0.0068 <0.00010 0.0001 0.00585 <0.00010 <0.000050
QUL-18-20m 20/07/16 <0.00050 <0.0030 0.0069 <0.00010 <0.00010 0.00504 <0.00010 <0.000050
15/08/16 <0.00050 <0.0030 0.0076 <0.00010 0.0001 0.0053 <0.00010 <0.000050
12/09/16 <0.00050 <0.0030 0.0064 <0.00010 <0.00010 0.00556 <0.00010 <0.000050
QUL-18-50m 20/07/16 <0.00050 <0.0030 0.0058 <0.00010 <0.00010 0.00497 <0.00010 <0.000050
15/08/16 <0.00050 <0.0030 0.0069 <0.00010 0.0001 0.00585 <0.00010 <0.000050
12/09/16 <0.00050 <0.0030 0.0057 <0.00010 0.0001 0.00566 <0.00010 <0.000050
QUL-2a-0m 20/07/16 <0.00050 <0.0030 0.0121 <0.00010 0.00012 0.00567 <0.00010 <0.000050
15/08/16 <0.00050 <0.0030 0.01 <0.00010 0.00011 0.00542 <0.00010 <0.000050
12/09/16 <0.00050 <0.0030 0.0095 <0.00010 0.0001 0.00538 <0.00010 <0.000050
QUL-2a-20m 20/07/16 <0.00050 <0.0030 0.0072 <0.00010 <0.00010 0.00515 <0.00010 <0.000050
15/08/16 <0.00050 <0.0030 0.0072 <0.00010 <0.00010 0.00533 <0.00010 <0.000050
Printed Date: 19/10/2016
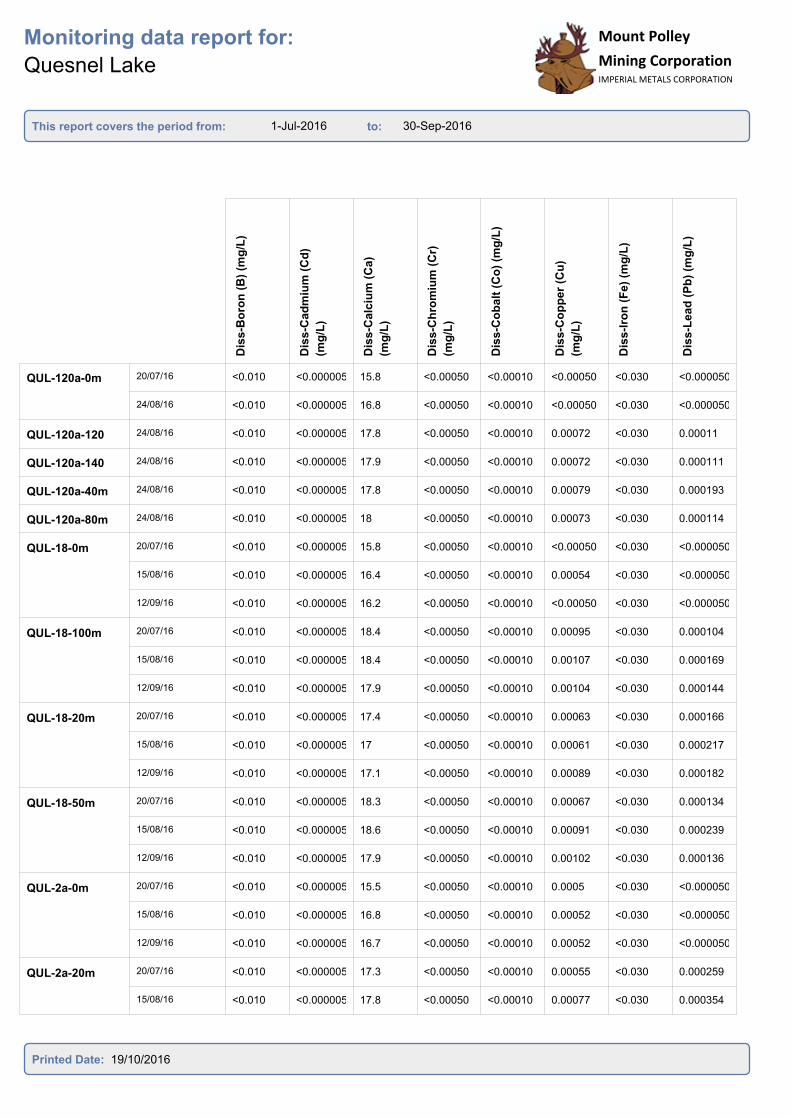
1-Jul-2016 30-Sep-2016
Monitoring data report for:
Quesnel Lake
This report covers the period from: to:
Mount Polley
Mining CorporationIMPERIAL METALS CORPORATION
Mount Polley
Mining CorporationIMPERIAL METALS CORPORATION
Dis
s-B
oro
n (
B)
(mg
/L)
Dis
s-C
ad
miu
m (
Cd
)
(mg
/L)
Dis
s-C
alc
ium
(C
a)
(mg
/L)
Dis
s-C
hro
miu
m (
Cr)
(mg
/L)
Dis
s-C
ob
alt
(C
o)
(mg
/L)
Dis
s-C
op
pe
r (C
u)
(mg
/L)
Dis
s-I
ron
(F
e)
(mg
/L)
Dis
s-L
ead
(P
b)
(mg
/L)
QUL-120a-0m 20/07/16 <0.010 <0.000005 15.8 <0.00050 <0.00010 <0.00050 <0.030 <0.000050
24/08/16 <0.010 <0.000005 16.8 <0.00050 <0.00010 <0.00050 <0.030 <0.000050
QUL-120a-120
m
24/08/16 <0.010 <0.000005 17.8 <0.00050 <0.00010 0.00072 <0.030 0.00011
QUL-120a-140
m
24/08/16 <0.010 <0.000005 17.9 <0.00050 <0.00010 0.00072 <0.030 0.000111
QUL-120a-40m 24/08/16 <0.010 <0.000005 17.8 <0.00050 <0.00010 0.00079 <0.030 0.000193
QUL-120a-80m 24/08/16 <0.010 <0.000005 18 <0.00050 <0.00010 0.00073 <0.030 0.000114
QUL-18-0m 20/07/16 <0.010 <0.000005 15.8 <0.00050 <0.00010 <0.00050 <0.030 <0.000050
15/08/16 <0.010 <0.000005 16.4 <0.00050 <0.00010 0.00054 <0.030 <0.000050
12/09/16 <0.010 <0.000005 16.2 <0.00050 <0.00010 <0.00050 <0.030 <0.000050
QUL-18-100m 20/07/16 <0.010 <0.000005 18.4 <0.00050 <0.00010 0.00095 <0.030 0.000104
15/08/16 <0.010 <0.000005 18.4 <0.00050 <0.00010 0.00107 <0.030 0.000169
12/09/16 <0.010 <0.000005 17.9 <0.00050 <0.00010 0.00104 <0.030 0.000144
QUL-18-20m 20/07/16 <0.010 <0.000005 17.4 <0.00050 <0.00010 0.00063 <0.030 0.000166
15/08/16 <0.010 <0.000005 17 <0.00050 <0.00010 0.00061 <0.030 0.000217
12/09/16 <0.010 <0.000005 17.1 <0.00050 <0.00010 0.00089 <0.030 0.000182
QUL-18-50m 20/07/16 <0.010 <0.000005 18.3 <0.00050 <0.00010 0.00067 <0.030 0.000134
15/08/16 <0.010 <0.000005 18.6 <0.00050 <0.00010 0.00091 <0.030 0.000239
12/09/16 <0.010 <0.000005 17.9 <0.00050 <0.00010 0.00102 <0.030 0.000136
QUL-2a-0m 20/07/16 <0.010 <0.000005 15.5 <0.00050 <0.00010 0.0005 <0.030 <0.000050
15/08/16 <0.010 <0.000005 16.8 <0.00050 <0.00010 0.00052 <0.030 <0.000050
12/09/16 <0.010 <0.000005 16.7 <0.00050 <0.00010 0.00052 <0.030 <0.000050
QUL-2a-20m 20/07/16 <0.010 <0.000005 17.3 <0.00050 <0.00010 0.00055 <0.030 0.000259
15/08/16 <0.010 <0.000005 17.8 <0.00050 <0.00010 0.00077 <0.030 0.000354
Printed Date: 19/10/2016
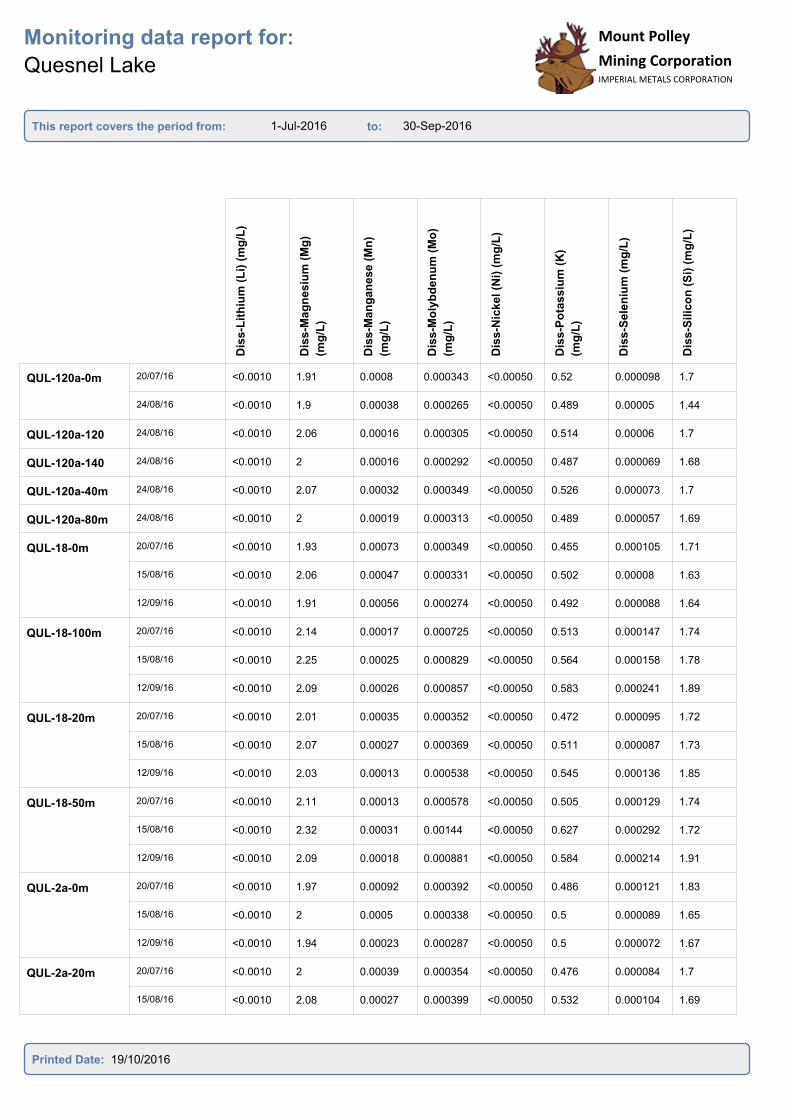
1-Jul-2016 30-Sep-2016
Monitoring data report for:
Quesnel Lake
This report covers the period from: to:
Mount Polley
Mining CorporationIMPERIAL METALS CORPORATION
Mount Polley
Mining CorporationIMPERIAL METALS CORPORATION
Dis
s-L
ith
ium
(L
i) (
mg
/L)
Dis
s-M
ag
nesiu
m (
Mg
)
(mg
/L)
Dis
s-M
an
gan
ese
(M
n)
(mg
/L)
Dis
s-M
oly
bd
en
um
(M
o)
(mg
/L)
Dis
s-N
ickel (N
i) (
mg
/L)
Dis
s-P
ota
ssiu
m (
K)
(mg
/L)
Dis
s-S
ele
niu
m (
mg
/L)
Dis
s-S
ilic
on
(S
i) (
mg
/L)
QUL-120a-0m 20/07/16 <0.0010 1.91 0.0008 0.000343 <0.00050 0.52 0.000098 1.7
24/08/16 <0.0010 1.9 0.00038 0.000265 <0.00050 0.489 0.00005 1.44
QUL-120a-120
m
24/08/16 <0.0010 2.06 0.00016 0.000305 <0.00050 0.514 0.00006 1.7
QUL-120a-140
m
24/08/16 <0.0010 2 0.00016 0.000292 <0.00050 0.487 0.000069 1.68
QUL-120a-40m 24/08/16 <0.0010 2.07 0.00032 0.000349 <0.00050 0.526 0.000073 1.7
QUL-120a-80m 24/08/16 <0.0010 2 0.00019 0.000313 <0.00050 0.489 0.000057 1.69
QUL-18-0m 20/07/16 <0.0010 1.93 0.00073 0.000349 <0.00050 0.455 0.000105 1.71
15/08/16 <0.0010 2.06 0.00047 0.000331 <0.00050 0.502 0.00008 1.63
12/09/16 <0.0010 1.91 0.00056 0.000274 <0.00050 0.492 0.000088 1.64
QUL-18-100m 20/07/16 <0.0010 2.14 0.00017 0.000725 <0.00050 0.513 0.000147 1.74
15/08/16 <0.0010 2.25 0.00025 0.000829 <0.00050 0.564 0.000158 1.78
12/09/16 <0.0010 2.09 0.00026 0.000857 <0.00050 0.583 0.000241 1.89
QUL-18-20m 20/07/16 <0.0010 2.01 0.00035 0.000352 <0.00050 0.472 0.000095 1.72
15/08/16 <0.0010 2.07 0.00027 0.000369 <0.00050 0.511 0.000087 1.73
12/09/16 <0.0010 2.03 0.00013 0.000538 <0.00050 0.545 0.000136 1.85
QUL-18-50m 20/07/16 <0.0010 2.11 0.00013 0.000578 <0.00050 0.505 0.000129 1.74
15/08/16 <0.0010 2.32 0.00031 0.00144 <0.00050 0.627 0.000292 1.72
12/09/16 <0.0010 2.09 0.00018 0.000881 <0.00050 0.584 0.000214 1.91
QUL-2a-0m 20/07/16 <0.0010 1.97 0.00092 0.000392 <0.00050 0.486 0.000121 1.83
15/08/16 <0.0010 2 0.0005 0.000338 <0.00050 0.5 0.000089 1.65
12/09/16 <0.0010 1.94 0.00023 0.000287 <0.00050 0.5 0.000072 1.67
QUL-2a-20m 20/07/16 <0.0010 2 0.00039 0.000354 <0.00050 0.476 0.000084 1.7
15/08/16 <0.0010 2.08 0.00027 0.000399 <0.00050 0.532 0.000104 1.69
Printed Date: 19/10/2016
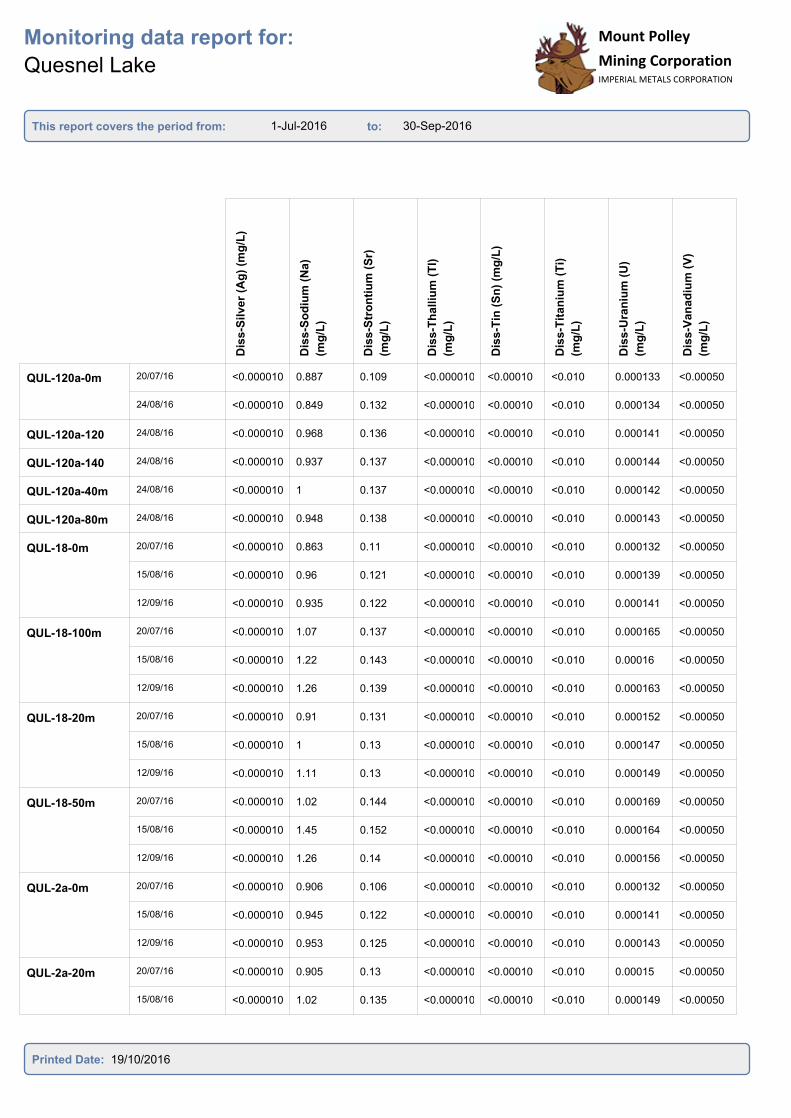
1-Jul-2016 30-Sep-2016
Monitoring data report for:
Quesnel Lake
This report covers the period from: to:
Mount Polley
Mining CorporationIMPERIAL METALS CORPORATION
Mount Polley
Mining CorporationIMPERIAL METALS CORPORATION
Dis
s-S
ilv
er
(Ag
) (m
g/L
)
Dis
s-S
od
ium
(N
a)
(mg
/L)
Dis
s-S
tro
nti
um
(S
r)
(mg
/L)
Dis
s-T
halliu
m (
Tl)
(mg
/L)
Dis
s-T
in (
Sn
) (m
g/L
)
Dis
s-T
itan
ium
(T
i)
(mg
/L)
Dis
s-U
ran
ium
(U
)
(mg
/L)
Dis
s-V
an
ad
ium
(V
)
(mg
/L)
QUL-120a-0m 20/07/16 <0.000010 0.887 0.109 <0.000010 <0.00010 <0.010 0.000133 <0.00050
24/08/16 <0.000010 0.849 0.132 <0.000010 <0.00010 <0.010 0.000134 <0.00050
QUL-120a-120
m
24/08/16 <0.000010 0.968 0.136 <0.000010 <0.00010 <0.010 0.000141 <0.00050
QUL-120a-140
m
24/08/16 <0.000010 0.937 0.137 <0.000010 <0.00010 <0.010 0.000144 <0.00050
QUL-120a-40m 24/08/16 <0.000010 1 0.137 <0.000010 <0.00010 <0.010 0.000142 <0.00050
QUL-120a-80m 24/08/16 <0.000010 0.948 0.138 <0.000010 <0.00010 <0.010 0.000143 <0.00050
QUL-18-0m 20/07/16 <0.000010 0.863 0.11 <0.000010 <0.00010 <0.010 0.000132 <0.00050
15/08/16 <0.000010 0.96 0.121 <0.000010 <0.00010 <0.010 0.000139 <0.00050
12/09/16 <0.000010 0.935 0.122 <0.000010 <0.00010 <0.010 0.000141 <0.00050
QUL-18-100m 20/07/16 <0.000010 1.07 0.137 <0.000010 <0.00010 <0.010 0.000165 <0.00050
15/08/16 <0.000010 1.22 0.143 <0.000010 <0.00010 <0.010 0.00016 <0.00050
12/09/16 <0.000010 1.26 0.139 <0.000010 <0.00010 <0.010 0.000163 <0.00050
QUL-18-20m 20/07/16 <0.000010 0.91 0.131 <0.000010 <0.00010 <0.010 0.000152 <0.00050
15/08/16 <0.000010 1 0.13 <0.000010 <0.00010 <0.010 0.000147 <0.00050
12/09/16 <0.000010 1.11 0.13 <0.000010 <0.00010 <0.010 0.000149 <0.00050
QUL-18-50m 20/07/16 <0.000010 1.02 0.144 <0.000010 <0.00010 <0.010 0.000169 <0.00050
15/08/16 <0.000010 1.45 0.152 <0.000010 <0.00010 <0.010 0.000164 <0.00050
12/09/16 <0.000010 1.26 0.14 <0.000010 <0.00010 <0.010 0.000156 <0.00050
QUL-2a-0m 20/07/16 <0.000010 0.906 0.106 <0.000010 <0.00010 <0.010 0.000132 <0.00050
15/08/16 <0.000010 0.945 0.122 <0.000010 <0.00010 <0.010 0.000141 <0.00050
12/09/16 <0.000010 0.953 0.125 <0.000010 <0.00010 <0.010 0.000143 <0.00050
QUL-2a-20m 20/07/16 <0.000010 0.905 0.13 <0.000010 <0.00010 <0.010 0.00015 <0.00050
15/08/16 <0.000010 1.02 0.135 <0.000010 <0.00010 <0.010 0.000149 <0.00050
Printed Date: 19/10/2016

1-Jul-2016 30-Sep-2016
Monitoring data report for:
Quesnel Lake
This report covers the period from: to:
Mount Polley
Mining CorporationIMPERIAL METALS CORPORATION
Mount Polley
Mining CorporationIMPERIAL METALS CORPORATION
Dis
s-Z
inc (
Zn
) (m
g/L
)
QUL-120a-0m 20/07/16 <0.0030
24/08/16 <0.0030
QUL-120a-120
m
24/08/16 <0.0030
QUL-120a-140
m
24/08/16 <0.0030
QUL-120a-40m 24/08/16 <0.0030
QUL-120a-80m 24/08/16 <0.0030
QUL-18-0m 20/07/16 <0.0030
15/08/16 <0.0030
12/09/16 <0.0030
QUL-18-100m 20/07/16 <0.0030
15/08/16 <0.0030
12/09/16 <0.0030
QUL-18-20m 20/07/16 <0.0030
15/08/16 <0.0030
12/09/16 <0.0030
QUL-18-50m 20/07/16 <0.0030
15/08/16 <0.0030
12/09/16 <0.0030
QUL-2a-0m 20/07/16 <0.0030
15/08/16 <0.0030
12/09/16 <0.0030
QUL-2a-20m 20/07/16 <0.0030
15/08/16 <0.0030
Printed Date: 19/10/2016
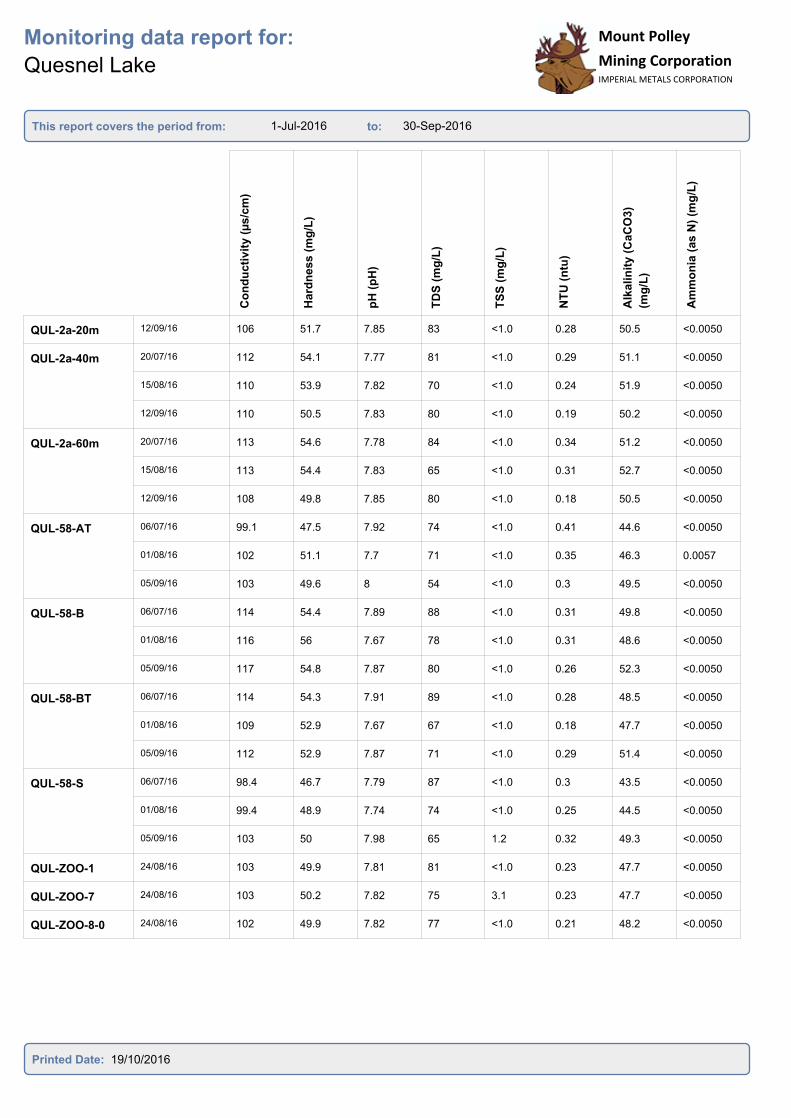
1-Jul-2016 30-Sep-2016
Monitoring data report for:
Quesnel Lake
This report covers the period from: to:
Mount Polley
Mining CorporationIMPERIAL METALS CORPORATION
Co
nd
ucti
vit
y (
µs/c
m)
Hard
ne
ss (
mg
/L)
pH
(p
H)
TD
S (
mg
/L)
TS
S (
mg
/L)
NT
U (
ntu
)
Alk
alin
ity
(C
aC
O3)
(mg
/L)
Am
mo
nia
(a
s N
) (m
g/L
)
QUL-2a-20m 12/09/16 106 51.7 7.85 83 <1.0 0.28 50.5 <0.0050
QUL-2a-40m 20/07/16 112 54.1 7.77 81 <1.0 0.29 51.1 <0.0050
15/08/16 110 53.9 7.82 70 <1.0 0.24 51.9 <0.0050
12/09/16 110 50.5 7.83 80 <1.0 0.19 50.2 <0.0050
QUL-2a-60m 20/07/16 113 54.6 7.78 84 <1.0 0.34 51.2 <0.0050
15/08/16 113 54.4 7.83 65 <1.0 0.31 52.7 <0.0050
12/09/16 108 49.8 7.85 80 <1.0 0.18 50.5 <0.0050
QUL-58-AT 06/07/16 99.1 47.5 7.92 74 <1.0 0.41 44.6 <0.0050
01/08/16 102 51.1 7.7 71 <1.0 0.35 46.3 0.0057
05/09/16 103 49.6 8 54 <1.0 0.3 49.5 <0.0050
QUL-58-B 06/07/16 114 54.4 7.89 88 <1.0 0.31 49.8 <0.0050
01/08/16 116 56 7.67 78 <1.0 0.31 48.6 <0.0050
05/09/16 117 54.8 7.87 80 <1.0 0.26 52.3 <0.0050
QUL-58-BT 06/07/16 114 54.3 7.91 89 <1.0 0.28 48.5 <0.0050
01/08/16 109 52.9 7.67 67 <1.0 0.18 47.7 <0.0050
05/09/16 112 52.9 7.87 71 <1.0 0.29 51.4 <0.0050
QUL-58-S 06/07/16 98.4 46.7 7.79 87 <1.0 0.3 43.5 <0.0050
01/08/16 99.4 48.9 7.74 74 <1.0 0.25 44.5 <0.0050
05/09/16 103 50 7.98 65 1.2 0.32 49.3 <0.0050
QUL-ZOO-1 24/08/16 103 49.9 7.81 81 <1.0 0.23 47.7 <0.0050
QUL-ZOO-7 24/08/16 103 50.2 7.82 75 3.1 0.23 47.7 <0.0050
QUL-ZOO-8-0
m
24/08/16 102 49.9 7.82 77 <1.0 0.21 48.2 <0.0050
Printed Date: 19/10/2016
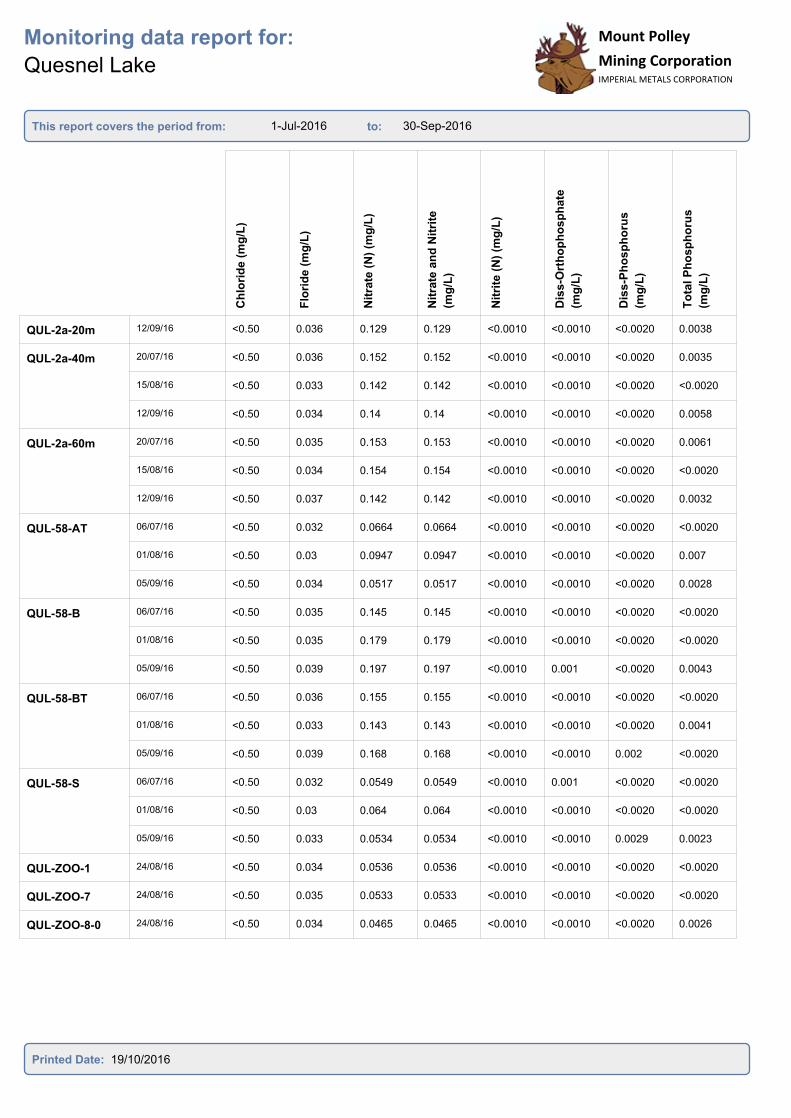
1-Jul-2016 30-Sep-2016
Monitoring data report for:
Quesnel Lake
This report covers the period from: to:
Mount Polley
Mining CorporationIMPERIAL METALS CORPORATION
Mount Polley
Mining CorporationIMPERIAL METALS CORPORATION
Ch
lori
de (
mg
/L)
Flo
rid
e (
mg
/L)
Nit
rate
(N
) (m
g/L
)
Nit
rate
an
d N
itri
te
(mg
/L)
Nit
rite
(N
) (m
g/L
)
Dis
s-O
rth
op
ho
sp
hate
(mg
/L)
Dis
s-P
ho
sp
ho
rus
(mg
/L)
To
tal P
ho
sp
ho
rus
(mg
/L)
QUL-2a-20m 12/09/16 <0.50 0.036 0.129 0.129 <0.0010 <0.0010 <0.0020 0.0038
QUL-2a-40m 20/07/16 <0.50 0.036 0.152 0.152 <0.0010 <0.0010 <0.0020 0.0035
15/08/16 <0.50 0.033 0.142 0.142 <0.0010 <0.0010 <0.0020 <0.0020
12/09/16 <0.50 0.034 0.14 0.14 <0.0010 <0.0010 <0.0020 0.0058
QUL-2a-60m 20/07/16 <0.50 0.035 0.153 0.153 <0.0010 <0.0010 <0.0020 0.0061
15/08/16 <0.50 0.034 0.154 0.154 <0.0010 <0.0010 <0.0020 <0.0020
12/09/16 <0.50 0.037 0.142 0.142 <0.0010 <0.0010 <0.0020 0.0032
QUL-58-AT 06/07/16 <0.50 0.032 0.0664 0.0664 <0.0010 <0.0010 <0.0020 <0.0020
01/08/16 <0.50 0.03 0.0947 0.0947 <0.0010 <0.0010 <0.0020 0.007
05/09/16 <0.50 0.034 0.0517 0.0517 <0.0010 <0.0010 <0.0020 0.0028
QUL-58-B 06/07/16 <0.50 0.035 0.145 0.145 <0.0010 <0.0010 <0.0020 <0.0020
01/08/16 <0.50 0.035 0.179 0.179 <0.0010 <0.0010 <0.0020 <0.0020
05/09/16 <0.50 0.039 0.197 0.197 <0.0010 0.001 <0.0020 0.0043
QUL-58-BT 06/07/16 <0.50 0.036 0.155 0.155 <0.0010 <0.0010 <0.0020 <0.0020
01/08/16 <0.50 0.033 0.143 0.143 <0.0010 <0.0010 <0.0020 0.0041
05/09/16 <0.50 0.039 0.168 0.168 <0.0010 <0.0010 0.002 <0.0020
QUL-58-S 06/07/16 <0.50 0.032 0.0549 0.0549 <0.0010 0.001 <0.0020 <0.0020
01/08/16 <0.50 0.03 0.064 0.064 <0.0010 <0.0010 <0.0020 <0.0020
05/09/16 <0.50 0.033 0.0534 0.0534 <0.0010 <0.0010 0.0029 0.0023
QUL-ZOO-1 24/08/16 <0.50 0.034 0.0536 0.0536 <0.0010 <0.0010 <0.0020 <0.0020
QUL-ZOO-7 24/08/16 <0.50 0.035 0.0533 0.0533 <0.0010 <0.0010 <0.0020 <0.0020
QUL-ZOO-8-0
m
24/08/16 <0.50 0.034 0.0465 0.0465 <0.0010 <0.0010 <0.0020 0.0026
Printed Date: 19/10/2016
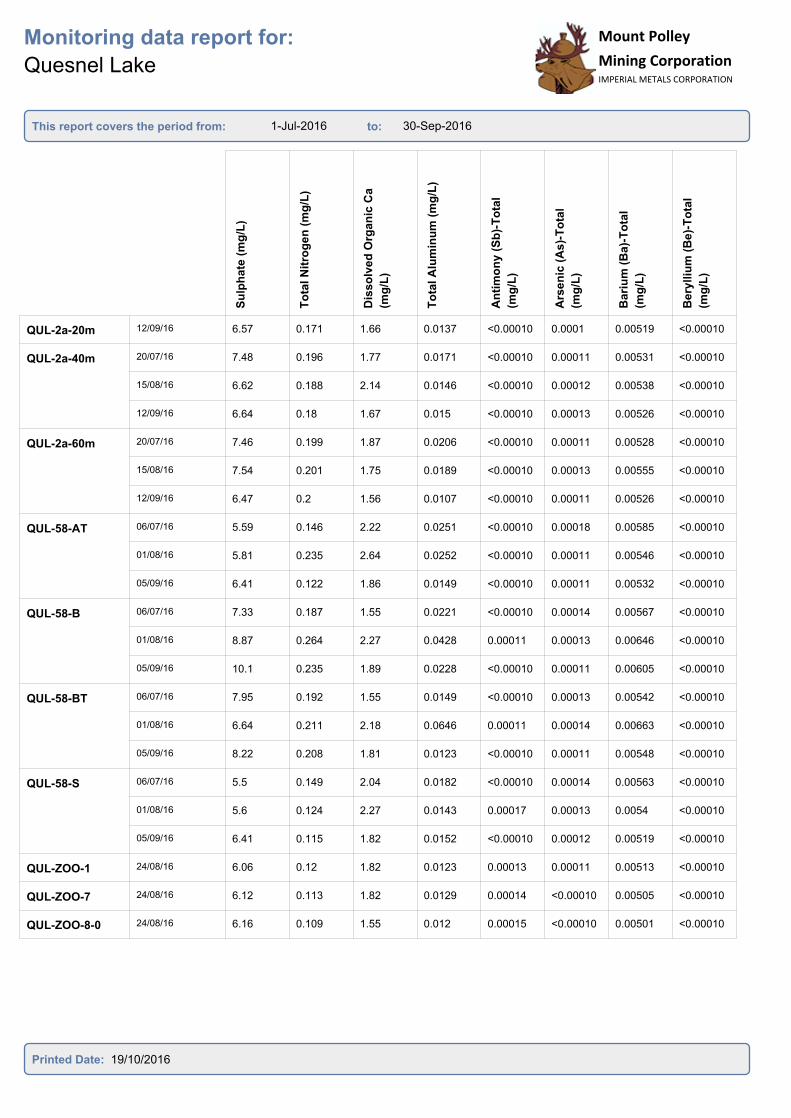
1-Jul-2016 30-Sep-2016
Monitoring data report for:
Quesnel Lake
This report covers the period from: to:
Mount Polley
Mining CorporationIMPERIAL METALS CORPORATION
Mount Polley
Mining CorporationIMPERIAL METALS CORPORATION
Su
lph
ate
(m
g/L
)
To
tal N
itro
ge
n (
mg
/L)
Dis
so
lved
Org
an
ic C
a
(mg
/L)
To
tal A
lum
inu
m (
mg
/L)
An
tim
on
y (
Sb
)-T
ota
l
(mg
/L)
Ars
en
ic (
As)-
To
tal
(mg
/L)
Bari
um
(B
a)-
To
tal
(mg
/L)
Bery
lliu
m (
Be
)-T
ota
l
(mg
/L)
QUL-2a-20m 12/09/16 6.57 0.171 1.66 0.0137 <0.00010 0.0001 0.00519 <0.00010
QUL-2a-40m 20/07/16 7.48 0.196 1.77 0.0171 <0.00010 0.00011 0.00531 <0.00010
15/08/16 6.62 0.188 2.14 0.0146 <0.00010 0.00012 0.00538 <0.00010
12/09/16 6.64 0.18 1.67 0.015 <0.00010 0.00013 0.00526 <0.00010
QUL-2a-60m 20/07/16 7.46 0.199 1.87 0.0206 <0.00010 0.00011 0.00528 <0.00010
15/08/16 7.54 0.201 1.75 0.0189 <0.00010 0.00013 0.00555 <0.00010
12/09/16 6.47 0.2 1.56 0.0107 <0.00010 0.00011 0.00526 <0.00010
QUL-58-AT 06/07/16 5.59 0.146 2.22 0.0251 <0.00010 0.00018 0.00585 <0.00010
01/08/16 5.81 0.235 2.64 0.0252 <0.00010 0.00011 0.00546 <0.00010
05/09/16 6.41 0.122 1.86 0.0149 <0.00010 0.00011 0.00532 <0.00010
QUL-58-B 06/07/16 7.33 0.187 1.55 0.0221 <0.00010 0.00014 0.00567 <0.00010
01/08/16 8.87 0.264 2.27 0.0428 0.00011 0.00013 0.00646 <0.00010
05/09/16 10.1 0.235 1.89 0.0228 <0.00010 0.00011 0.00605 <0.00010
QUL-58-BT 06/07/16 7.95 0.192 1.55 0.0149 <0.00010 0.00013 0.00542 <0.00010
01/08/16 6.64 0.211 2.18 0.0646 0.00011 0.00014 0.00663 <0.00010
05/09/16 8.22 0.208 1.81 0.0123 <0.00010 0.00011 0.00548 <0.00010
QUL-58-S 06/07/16 5.5 0.149 2.04 0.0182 <0.00010 0.00014 0.00563 <0.00010
01/08/16 5.6 0.124 2.27 0.0143 0.00017 0.00013 0.0054 <0.00010
05/09/16 6.41 0.115 1.82 0.0152 <0.00010 0.00012 0.00519 <0.00010
QUL-ZOO-1 24/08/16 6.06 0.12 1.82 0.0123 0.00013 0.00011 0.00513 <0.00010
QUL-ZOO-7 24/08/16 6.12 0.113 1.82 0.0129 0.00014 <0.00010 0.00505 <0.00010
QUL-ZOO-8-0
m
24/08/16 6.16 0.109 1.55 0.012 0.00015 <0.00010 0.00501 <0.00010
Printed Date: 19/10/2016

1-Jul-2016 30-Sep-2016
Monitoring data report for:
Quesnel Lake
This report covers the period from: to:
Mount Polley
Mining CorporationIMPERIAL METALS CORPORATION
Mount Polley
Mining CorporationIMPERIAL METALS CORPORATION
Bis
mu
th (
Bi)
-To
tal
(mg
/L)
Bo
ron
(B
)-T
ota
l (m
g/L
)
To
tal C
ad
miu
m (
mg
/L)
Calc
ium
(C
a)-
To
tal
(mg
/L)
Ch
rom
ium
(C
r)-T
ota
l
(mg
/L)
Co
balt
(C
o)-
To
tal
(mg
/L)
To
tal C
op
per
(mg
/L)
To
tal Ir
on
(m
g/L
)
QUL-2a-20m 12/09/16 <0.000050 <0.010 <0.000005 17.6 <0.00050 <0.00010 0.00075 <0.030
QUL-2a-40m 20/07/16 <0.000050 <0.010 <0.000005 18.2 <0.00050 <0.00010 0.00086 <0.030
15/08/16 <0.000050 <0.010 <0.000005 18 <0.00050 <0.00010 0.00089 <0.030
12/09/16 <0.000050 <0.010 <0.000005 17.9 <0.00050 <0.00010 0.00106 <0.030
QUL-2a-60m 20/07/16 <0.000050 <0.010 <0.000005 18.3 <0.00050 <0.00010 0.00108 <0.030
15/08/16 <0.000050 <0.010 <0.000005 18.3 <0.00050 <0.00010 0.00106 <0.030
12/09/16 <0.000050 <0.010 <0.000005 17.9 <0.00050 <0.00010 0.00086 <0.030
QUL-58-AT 06/07/16 <0.000050 <0.010 <0.000005 16.2 <0.00050 <0.00010 0.00099 <0.030
01/08/16 <0.000050 <0.010 <0.000005 16.9 <0.00050 <0.00010 0.0018 <0.030
05/09/16 <0.000050 <0.010 <0.000005 17 <0.00050 <0.00010 0.00064 <0.030
QUL-58-B 06/07/16 <0.000050 <0.010 <0.000005 18.3 <0.00050 <0.00010 0.00137 <0.030
01/08/16 <0.000050 <0.010 0.000005 19 <0.00050 <0.00010 0.00284 0.035
05/09/16 <0.000050 <0.010 <0.000005 18.4 <0.00050 <0.00010 0.00143 <0.030
QUL-58-BT 06/07/16 <0.000050 <0.010 <0.000005 18 <0.00050 <0.00010 0.00095 <0.030
01/08/16 <0.000050 <0.010 0.0000066 18 <0.00050 <0.00010 0.00552 0.063
05/09/16 <0.000050 <0.010 <0.000005 17.6 <0.00050 <0.00010 0.00081 <0.030
QUL-58-S 06/07/16 <0.000050 <0.010 <0.000005 15.6 <0.00050 <0.00010 0.00072 <0.030
01/08/16 <0.000050 <0.010 <0.000005 16.8 <0.00050 <0.00010 0.0008 <0.030
05/09/16 <0.000050 <0.010 <0.000005 16.9 <0.00050 <0.00010 0.00076 <0.030
QUL-ZOO-1 24/08/16 <0.000050 <0.010 <0.000005 17.3 <0.00050 <0.00010 0.00061 <0.030
QUL-ZOO-7 24/08/16 <0.000050 <0.010 <0.000005 17 <0.00050 <0.00010 0.00053 <0.030
QUL-ZOO-8-0
m
24/08/16 <0.000050 <0.010 <0.000005 17.1 <0.00050 <0.00010 0.00051 <0.030
Printed Date: 19/10/2016

1-Jul-2016 30-Sep-2016
Monitoring data report for:
Quesnel Lake
This report covers the period from: to:
Mount Polley
Mining CorporationIMPERIAL METALS CORPORATION
Mount Polley
Mining CorporationIMPERIAL METALS CORPORATION
To
tal L
ea
d (
mg
/L)
Lit
hiu
m (
Li)
-To
tal
(mg
/L)
Mag
ne
siu
m (
Mg
)-T
ota
l
(mg
/L)
To
tal M
an
ga
nese
(mg
/L)
To
tal M
oly
bd
en
um
(mg
/L)
Nic
ke
l (N
i)-T
ota
l (m
g/L
)
Po
tas
siu
m (
K)-
To
tal
(mg
/L)
To
tal S
ele
niu
m (
mg
/L)
QUL-2a-20m 12/09/16 0.000315 <0.0010 1.93 0.00121 0.000388 <0.00050 0.489 0.000108
QUL-2a-40m 20/07/16 0.000088 <0.0010 2.11 0.00132 0.000637 <0.00050 0.492 0.000125
15/08/16 0.000174 <0.0010 2.12 0.00128 0.000447 <0.00050 0.527 0.000114
12/09/16 0.000202 <0.0010 2.04 0.00129 0.000408 <0.00050 0.502 0.000112
QUL-2a-60m 20/07/16 0.000095 <0.0010 2.13 0.00145 0.000645 <0.00050 0.487 0.000163
15/08/16 0.000104 <0.0010 2.19 0.00143 0.000762 0.00074 0.552 0.000182
12/09/16 0.000164 <0.0010 2.02 0.00124 0.000339 <0.00050 0.493 0.000107
QUL-58-AT 06/07/16 0.000133 <0.0010 2.02 0.00247 0.000367 0.00059 0.541 0.000107
01/08/16 0.000724 0.0012 1.89 0.00162 0.000338 <0.00050 0.491 0.000095
05/09/16 0.000077 0.0011 1.94 0.00112 0.00031 <0.00050 0.479 0.00011
QUL-58-B 06/07/16 0.000101 0.0014 2.13 0.00117 0.00072 0.00055 0.561 0.000168
01/08/16 0.000319 0.0013 2.25 0.00203 0.00133 <0.00050 0.586 0.000264
05/09/16 0.000155 0.0011 2.23 0.00171 0.00149 <0.00050 0.604 0.000342
QUL-58-BT 06/07/16 0.0001 0.0012 2.13 0.00139 0.00085 <0.00050 0.564 0.000179
01/08/16 0.000445 0.0012 2.09 0.00252 0.000597 <0.00050 0.537 0.000122
05/09/16 <0.000050 0.001 2.11 0.00096 0.000901 <0.00050 0.548 0.000201
QUL-58-S 06/07/16 <0.000050 0.001 1.94 0.00195 0.000356 0.0006 0.536 0.000105
01/08/16 <0.000050 0.0012 1.94 0.0012 0.000339 <0.00050 0.477 0.000104
05/09/16 <0.000050 0.0011 1.9 0.00126 0.000313 <0.00050 0.465 0.000086
QUL-ZOO-1 24/08/16 <0.000050 <0.0010 1.98 0.00095 0.000315 <0.00050 0.483 0.000079
QUL-ZOO-7 24/08/16 <0.000050 <0.0010 1.98 0.00103 0.000304 <0.00050 0.509 0.000065
QUL-ZOO-8-0
m
24/08/16 <0.000050 <0.0010 1.94 0.00072 0.000291 <0.00050 0.466 0.000077
Printed Date: 19/10/2016
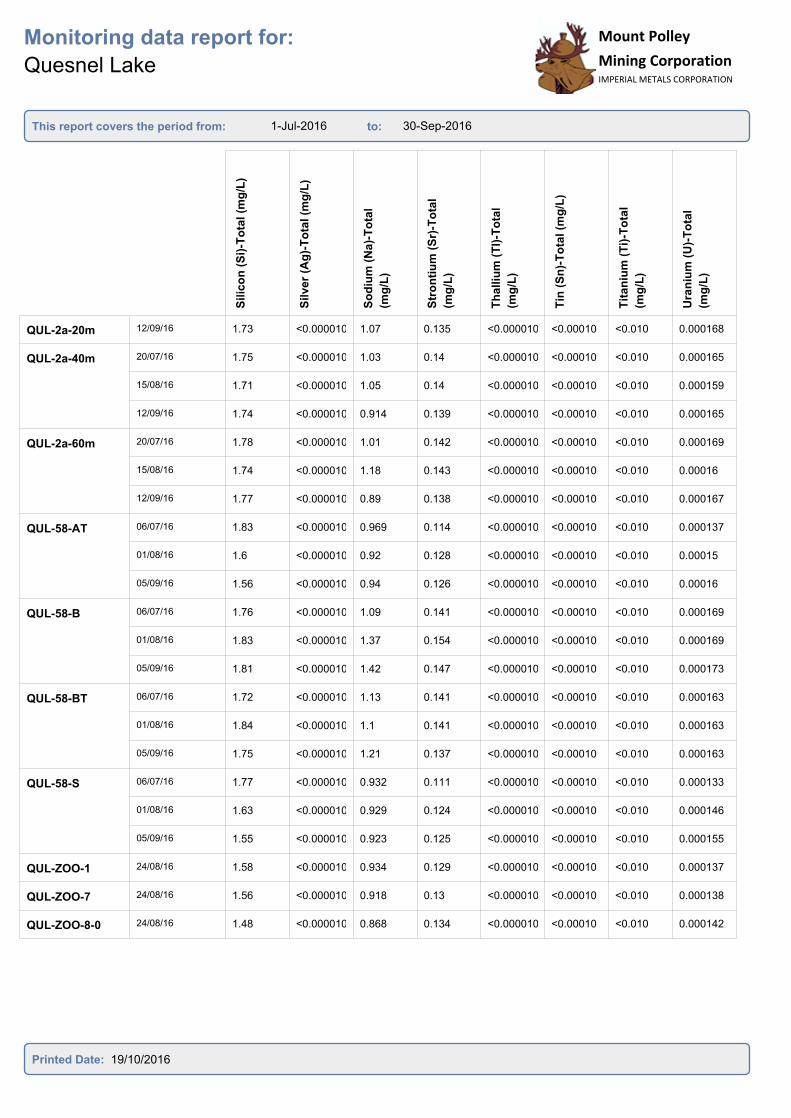
1-Jul-2016 30-Sep-2016
Monitoring data report for:
Quesnel Lake
This report covers the period from: to:
Mount Polley
Mining CorporationIMPERIAL METALS CORPORATION
Mount Polley
Mining CorporationIMPERIAL METALS CORPORATION
Silic
on
(S
i)-T
ota
l (m
g/L
)
Silve
r (A
g)-
To
tal (m
g/L
)
So
diu
m (
Na)-
To
tal
(mg
/L)
Str
on
tiu
m (
Sr)
-To
tal
(mg
/L)
Th
alliu
m (
Tl)
-To
tal
(mg
/L)
Tin
(S
n)-
To
tal (m
g/L
)
Tit
an
ium
(T
i)-T
ota
l
(mg
/L)
Ura
niu
m (
U)-
To
tal
(mg
/L)
QUL-2a-20m 12/09/16 1.73 <0.000010 1.07 0.135 <0.000010 <0.00010 <0.010 0.000168
QUL-2a-40m 20/07/16 1.75 <0.000010 1.03 0.14 <0.000010 <0.00010 <0.010 0.000165
15/08/16 1.71 <0.000010 1.05 0.14 <0.000010 <0.00010 <0.010 0.000159
12/09/16 1.74 <0.000010 0.914 0.139 <0.000010 <0.00010 <0.010 0.000165
QUL-2a-60m 20/07/16 1.78 <0.000010 1.01 0.142 <0.000010 <0.00010 <0.010 0.000169
15/08/16 1.74 <0.000010 1.18 0.143 <0.000010 <0.00010 <0.010 0.00016
12/09/16 1.77 <0.000010 0.89 0.138 <0.000010 <0.00010 <0.010 0.000167
QUL-58-AT 06/07/16 1.83 <0.000010 0.969 0.114 <0.000010 <0.00010 <0.010 0.000137
01/08/16 1.6 <0.000010 0.92 0.128 <0.000010 <0.00010 <0.010 0.00015
05/09/16 1.56 <0.000010 0.94 0.126 <0.000010 <0.00010 <0.010 0.00016
QUL-58-B 06/07/16 1.76 <0.000010 1.09 0.141 <0.000010 <0.00010 <0.010 0.000169
01/08/16 1.83 <0.000010 1.37 0.154 <0.000010 <0.00010 <0.010 0.000169
05/09/16 1.81 <0.000010 1.42 0.147 <0.000010 <0.00010 <0.010 0.000173
QUL-58-BT 06/07/16 1.72 <0.000010 1.13 0.141 <0.000010 <0.00010 <0.010 0.000163
01/08/16 1.84 <0.000010 1.1 0.141 <0.000010 <0.00010 <0.010 0.000163
05/09/16 1.75 <0.000010 1.21 0.137 <0.000010 <0.00010 <0.010 0.000163
QUL-58-S 06/07/16 1.77 <0.000010 0.932 0.111 <0.000010 <0.00010 <0.010 0.000133
01/08/16 1.63 <0.000010 0.929 0.124 <0.000010 <0.00010 <0.010 0.000146
05/09/16 1.55 <0.000010 0.923 0.125 <0.000010 <0.00010 <0.010 0.000155
QUL-ZOO-1 24/08/16 1.58 <0.000010 0.934 0.129 <0.000010 <0.00010 <0.010 0.000137
QUL-ZOO-7 24/08/16 1.56 <0.000010 0.918 0.13 <0.000010 <0.00010 <0.010 0.000138
QUL-ZOO-8-0
m
24/08/16 1.48 <0.000010 0.868 0.134 <0.000010 <0.00010 <0.010 0.000142
Printed Date: 19/10/2016

1-Jul-2016 30-Sep-2016
Monitoring data report for:
Quesnel Lake
This report covers the period from: to:
Mount Polley
Mining CorporationIMPERIAL METALS CORPORATION
Mount Polley
Mining CorporationIMPERIAL METALS CORPORATION
Van
ad
ium
(V
)-T
ota
l
(mg
/L)
Zin
c (
Zn
)-T
ota
l (m
g/L
)
Dis
s-A
lum
inu
m (
Al)
(mg
/L)
Dis
s-A
nti
mo
ny
(S
b)
(mg
/L)
Dis
s-A
rsen
ic (
As
)
(mg
/L)
Dis
s-B
ari
um
(B
a)
(mg
/L)
Dis
s-B
ery
lliu
m (
Be)
(mg
/L)
Dis
s-B
ism
uth
(B
i)
(mg
/L)
QUL-2a-20m 12/09/16 <0.00050 <0.0030 0.006 <0.00010 0.00011 0.00531 <0.00010 <0.000050
QUL-2a-40m 20/07/16 <0.00050 <0.0030 0.0091 <0.00010 <0.00010 0.00542 <0.00010 <0.000050
15/08/16 <0.00050 <0.0030 0.0057 <0.00010 0.00011 0.00533 <0.00010 <0.000050
12/09/16 <0.00050 <0.0030 0.0057 <0.00010 <0.00010 0.00536 <0.00010 <0.000050
QUL-2a-60m 20/07/16 <0.00050 <0.0030 0.0062 <0.00010 <0.00010 0.00517 <0.00010 <0.000050
15/08/16 <0.00050 <0.0030 0.0065 <0.00010 <0.00010 0.00538 <0.00010 <0.000050
12/09/16 <0.00050 <0.0030 0.0052 <0.00010 0.00011 0.00527 <0.00010 <0.000050
QUL-58-AT 06/07/16 <0.00050 <0.0030 0.0148 <0.00010 0.00012 0.00562 <0.00010 <0.000050
01/08/16 <0.00050 0.003 0.0145 <0.00010 <0.00010 0.00579 <0.00010 <0.000050
05/09/16 <0.00050 <0.0030 0.0086 <0.00010 <0.00010 0.0051 <0.00010 <0.000050
QUL-58-B 06/07/16 <0.00050 <0.0030 0.0064 <0.00010 0.00011 0.00534 <0.00010 <0.000050
01/08/16 <0.00050 <0.0030 0.0133 <0.00010 0.0001 0.00598 <0.00010 <0.000050
05/09/16 <0.00050 <0.0030 0.0056 <0.00010 <0.00010 0.00573 <0.00010 <0.000050
QUL-58-BT 06/07/16 <0.00050 <0.0030 0.0067 <0.00010 0.0001 0.00539 <0.00010 <0.000050
01/08/16 <0.00050 0.0039 0.0105 <0.00010 <0.00010 0.0055 <0.00010 <0.000050
05/09/16 <0.00050 <0.0030 0.0059 <0.00010 0.0001 0.00547 <0.00010 <0.000050
QUL-58-S 06/07/16 <0.00050 <0.0030 0.0119 <0.00010 0.00012 0.00553 <0.00010 <0.000050
01/08/16 <0.00050 <0.0030 0.0112 <0.00010 <0.00010 0.00526 <0.00010 <0.000050
05/09/16 <0.00050 <0.0030 0.0084 <0.00010 <0.00010 0.0051 <0.00010 <0.000050
QUL-ZOO-1 24/08/16 <0.00050 <0.0030 0.0086 <0.00010 <0.00010 0.00522 <0.00010 <0.000050
QUL-ZOO-7 24/08/16 <0.00050 <0.0030 0.009 <0.00010 <0.00010 0.00517 <0.00010 <0.000050
QUL-ZOO-8-0
m
24/08/16 <0.00050 <0.0030 0.009 <0.00010 <0.00010 0.00485 <0.00010 <0.000050
Printed Date: 19/10/2016
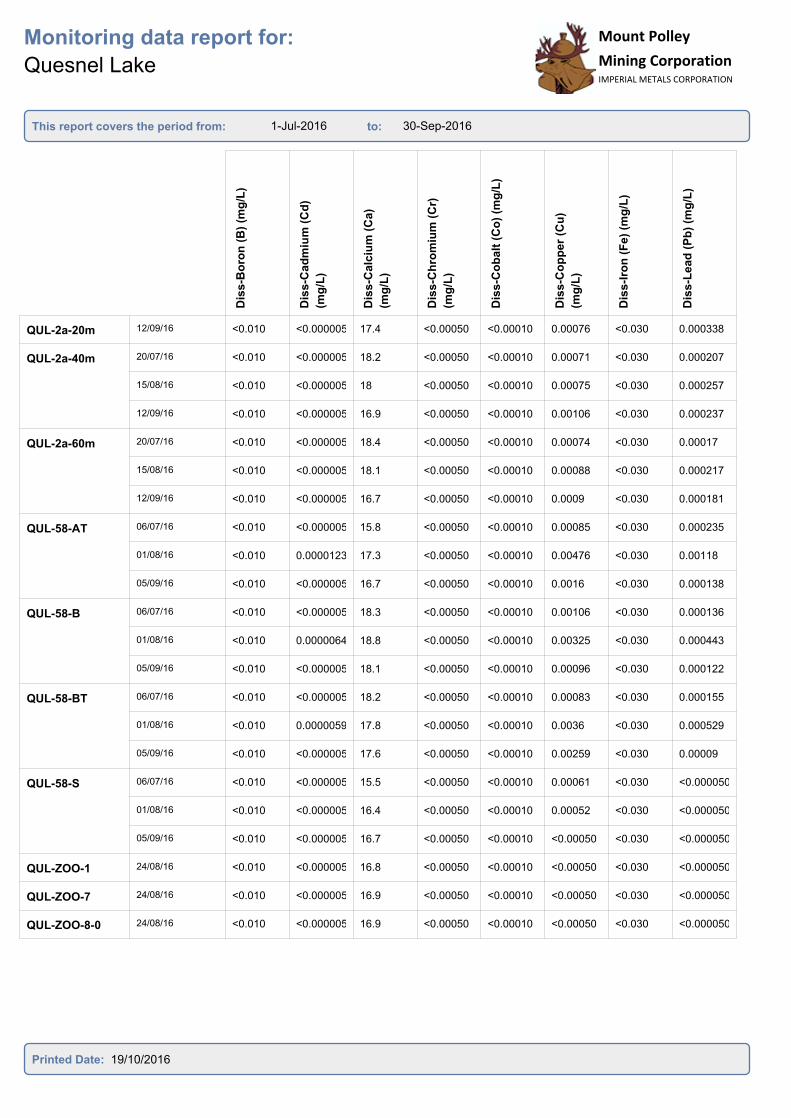
1-Jul-2016 30-Sep-2016
Monitoring data report for:
Quesnel Lake
This report covers the period from: to:
Mount Polley
Mining CorporationIMPERIAL METALS CORPORATION
Mount Polley
Mining CorporationIMPERIAL METALS CORPORATION
Dis
s-B
oro
n (
B)
(mg
/L)
Dis
s-C
ad
miu
m (
Cd
)
(mg
/L)
Dis
s-C
alc
ium
(C
a)
(mg
/L)
Dis
s-C
hro
miu
m (
Cr)
(mg
/L)
Dis
s-C
ob
alt
(C
o)
(mg
/L)
Dis
s-C
op
pe
r (C
u)
(mg
/L)
Dis
s-I
ron
(F
e)
(mg
/L)
Dis
s-L
ead
(P
b)
(mg
/L)
QUL-2a-20m 12/09/16 <0.010 <0.000005 17.4 <0.00050 <0.00010 0.00076 <0.030 0.000338
QUL-2a-40m 20/07/16 <0.010 <0.000005 18.2 <0.00050 <0.00010 0.00071 <0.030 0.000207
15/08/16 <0.010 <0.000005 18 <0.00050 <0.00010 0.00075 <0.030 0.000257
12/09/16 <0.010 <0.000005 16.9 <0.00050 <0.00010 0.00106 <0.030 0.000237
QUL-2a-60m 20/07/16 <0.010 <0.000005 18.4 <0.00050 <0.00010 0.00074 <0.030 0.00017
15/08/16 <0.010 <0.000005 18.1 <0.00050 <0.00010 0.00088 <0.030 0.000217
12/09/16 <0.010 <0.000005 16.7 <0.00050 <0.00010 0.0009 <0.030 0.000181
QUL-58-AT 06/07/16 <0.010 <0.000005 15.8 <0.00050 <0.00010 0.00085 <0.030 0.000235
01/08/16 <0.010 0.0000123 17.3 <0.00050 <0.00010 0.00476 <0.030 0.00118
05/09/16 <0.010 <0.000005 16.7 <0.00050 <0.00010 0.0016 <0.030 0.000138
QUL-58-B 06/07/16 <0.010 <0.000005 18.3 <0.00050 <0.00010 0.00106 <0.030 0.000136
01/08/16 <0.010 0.0000064 18.8 <0.00050 <0.00010 0.00325 <0.030 0.000443
05/09/16 <0.010 <0.000005 18.1 <0.00050 <0.00010 0.00096 <0.030 0.000122
QUL-58-BT 06/07/16 <0.010 <0.000005 18.2 <0.00050 <0.00010 0.00083 <0.030 0.000155
01/08/16 <0.010 0.0000059 17.8 <0.00050 <0.00010 0.0036 <0.030 0.000529
05/09/16 <0.010 <0.000005 17.6 <0.00050 <0.00010 0.00259 <0.030 0.00009
QUL-58-S 06/07/16 <0.010 <0.000005 15.5 <0.00050 <0.00010 0.00061 <0.030 <0.000050
01/08/16 <0.010 <0.000005 16.4 <0.00050 <0.00010 0.00052 <0.030 <0.000050
05/09/16 <0.010 <0.000005 16.7 <0.00050 <0.00010 <0.00050 <0.030 <0.000050
QUL-ZOO-1 24/08/16 <0.010 <0.000005 16.8 <0.00050 <0.00010 <0.00050 <0.030 <0.000050
QUL-ZOO-7 24/08/16 <0.010 <0.000005 16.9 <0.00050 <0.00010 <0.00050 <0.030 <0.000050
QUL-ZOO-8-0
m
24/08/16 <0.010 <0.000005 16.9 <0.00050 <0.00010 <0.00050 <0.030 <0.000050
Printed Date: 19/10/2016
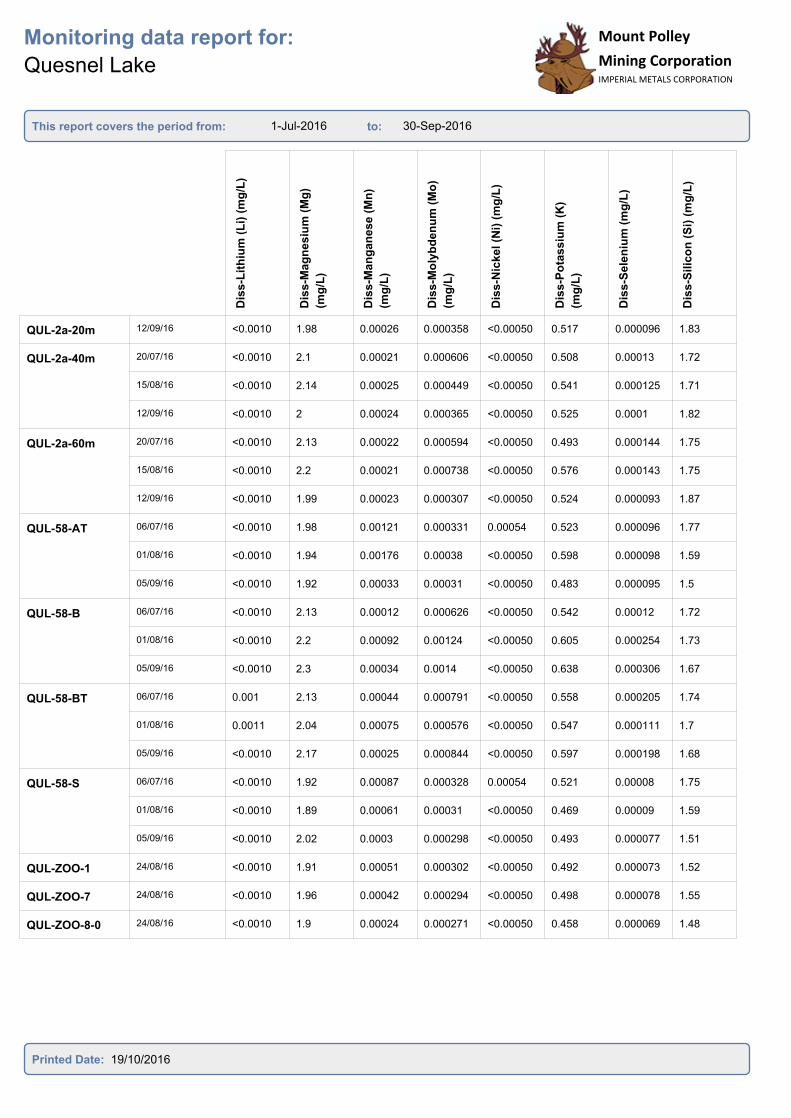
1-Jul-2016 30-Sep-2016
Monitoring data report for:
Quesnel Lake
This report covers the period from: to:
Mount Polley
Mining CorporationIMPERIAL METALS CORPORATION
Mount Polley
Mining CorporationIMPERIAL METALS CORPORATION
Dis
s-L
ith
ium
(L
i) (
mg
/L)
Dis
s-M
ag
nesiu
m (
Mg
)
(mg
/L)
Dis
s-M
an
gan
ese
(M
n)
(mg
/L)
Dis
s-M
oly
bd
en
um
(M
o)
(mg
/L)
Dis
s-N
ickel (N
i) (
mg
/L)
Dis
s-P
ota
ssiu
m (
K)
(mg
/L)
Dis
s-S
ele
niu
m (
mg
/L)
Dis
s-S
ilic
on
(S
i) (
mg
/L)
QUL-2a-20m 12/09/16 <0.0010 1.98 0.00026 0.000358 <0.00050 0.517 0.000096 1.83
QUL-2a-40m 20/07/16 <0.0010 2.1 0.00021 0.000606 <0.00050 0.508 0.00013 1.72
15/08/16 <0.0010 2.14 0.00025 0.000449 <0.00050 0.541 0.000125 1.71
12/09/16 <0.0010 2 0.00024 0.000365 <0.00050 0.525 0.0001 1.82
QUL-2a-60m 20/07/16 <0.0010 2.13 0.00022 0.000594 <0.00050 0.493 0.000144 1.75
15/08/16 <0.0010 2.2 0.00021 0.000738 <0.00050 0.576 0.000143 1.75
12/09/16 <0.0010 1.99 0.00023 0.000307 <0.00050 0.524 0.000093 1.87
QUL-58-AT 06/07/16 <0.0010 1.98 0.00121 0.000331 0.00054 0.523 0.000096 1.77
01/08/16 <0.0010 1.94 0.00176 0.00038 <0.00050 0.598 0.000098 1.59
05/09/16 <0.0010 1.92 0.00033 0.00031 <0.00050 0.483 0.000095 1.5
QUL-58-B 06/07/16 <0.0010 2.13 0.00012 0.000626 <0.00050 0.542 0.00012 1.72
01/08/16 <0.0010 2.2 0.00092 0.00124 <0.00050 0.605 0.000254 1.73
05/09/16 <0.0010 2.3 0.00034 0.0014 <0.00050 0.638 0.000306 1.67
QUL-58-BT 06/07/16 0.001 2.13 0.00044 0.000791 <0.00050 0.558 0.000205 1.74
01/08/16 0.0011 2.04 0.00075 0.000576 <0.00050 0.547 0.000111 1.7
05/09/16 <0.0010 2.17 0.00025 0.000844 <0.00050 0.597 0.000198 1.68
QUL-58-S 06/07/16 <0.0010 1.92 0.00087 0.000328 0.00054 0.521 0.00008 1.75
01/08/16 <0.0010 1.89 0.00061 0.00031 <0.00050 0.469 0.00009 1.59
05/09/16 <0.0010 2.02 0.0003 0.000298 <0.00050 0.493 0.000077 1.51
QUL-ZOO-1 24/08/16 <0.0010 1.91 0.00051 0.000302 <0.00050 0.492 0.000073 1.52
QUL-ZOO-7 24/08/16 <0.0010 1.96 0.00042 0.000294 <0.00050 0.498 0.000078 1.55
QUL-ZOO-8-0
m
24/08/16 <0.0010 1.9 0.00024 0.000271 <0.00050 0.458 0.000069 1.48
Printed Date: 19/10/2016

1-Jul-2016 30-Sep-2016
Monitoring data report for:
Quesnel Lake
This report covers the period from: to:
Mount Polley
Mining CorporationIMPERIAL METALS CORPORATION
Mount Polley
Mining CorporationIMPERIAL METALS CORPORATION
Dis
s-S
ilv
er
(Ag
) (m
g/L
)
Dis
s-S
od
ium
(N
a)
(mg
/L)
Dis
s-S
tro
nti
um
(S
r)
(mg
/L)
Dis
s-T
halliu
m (
Tl)
(mg
/L)
Dis
s-T
in (
Sn
) (m
g/L
)
Dis
s-T
itan
ium
(T
i)
(mg
/L)
Dis
s-U
ran
ium
(U
)
(mg
/L)
Dis
s-V
an
ad
ium
(V
)
(mg
/L)
QUL-2a-20m 12/09/16 <0.000010 1.02 0.132 <0.000010 <0.00010 <0.010 0.000151 <0.00050
QUL-2a-40m 20/07/16 <0.000010 1.03 0.14 <0.000010 <0.00010 <0.010 0.000165 <0.00050
15/08/16 <0.000010 1.05 0.139 <0.000010 <0.00010 <0.010 0.000157 <0.00050
12/09/16 <0.000010 1.04 0.129 <0.000010 <0.00010 <0.010 0.00015 <0.00050
QUL-2a-60m 20/07/16 <0.000010 1.02 0.139 <0.000010 <0.00010 <0.010 0.000161 <0.00050
15/08/16 <0.000010 1.17 0.142 <0.000010 <0.00010 <0.010 0.000158 <0.00050
12/09/16 <0.000010 1.02 0.127 <0.000010 <0.00010 <0.010 0.000147 <0.00050
QUL-58-AT 06/07/16 <0.000010 0.956 0.111 <0.000010 <0.00010 <0.010 0.000129 <0.00050
01/08/16 <0.000010 1.01 0.127 <0.000010 <0.00010 <0.010 0.000147 <0.00050
05/09/16 <0.000010 0.864 0.128 <0.000010 <0.00010 <0.010 0.000141 <0.00050
QUL-58-B 06/07/16 <0.000010 1.06 0.138 <0.000010 <0.00010 <0.010 0.000147 <0.00050
01/08/16 <0.000010 1.38 0.143 <0.000010 <0.00010 <0.010 0.000164 <0.00050
05/09/16 <0.000010 1.31 0.149 <0.000010 <0.00010 <0.010 0.000155 <0.00050
QUL-58-BT 06/07/16 <0.000010 1.13 0.14 <0.000010 <0.00010 <0.010 0.000161 <0.00050
01/08/16 <0.000010 1.1 0.137 <0.000010 <0.00010 <0.010 0.000157 <0.00050
05/09/16 <0.000010 1.12 0.14 <0.000010 <0.00010 <0.010 0.000149 <0.00050
QUL-58-S 06/07/16 <0.000010 0.909 0.109 <0.000010 <0.00010 <0.010 0.000127 <0.00050
01/08/16 <0.000010 0.911 0.121 <0.000010 <0.00010 <0.010 0.000141 <0.00050
05/09/16 <0.000010 0.9 0.128 <0.000010 <0.00010 <0.010 0.000141 <0.00050
QUL-ZOO-1 24/08/16 <0.000010 0.864 0.128 <0.000010 <0.00010 <0.010 0.000131 <0.00050
QUL-ZOO-7 24/08/16 <0.000010 0.9 0.129 <0.000010 <0.00010 <0.010 0.000129 <0.00050
QUL-ZOO-8-0
m
24/08/16 <0.000010 0.85 0.129 <0.000010 <0.00010 <0.010 0.000134 <0.00050
Printed Date: 19/10/2016
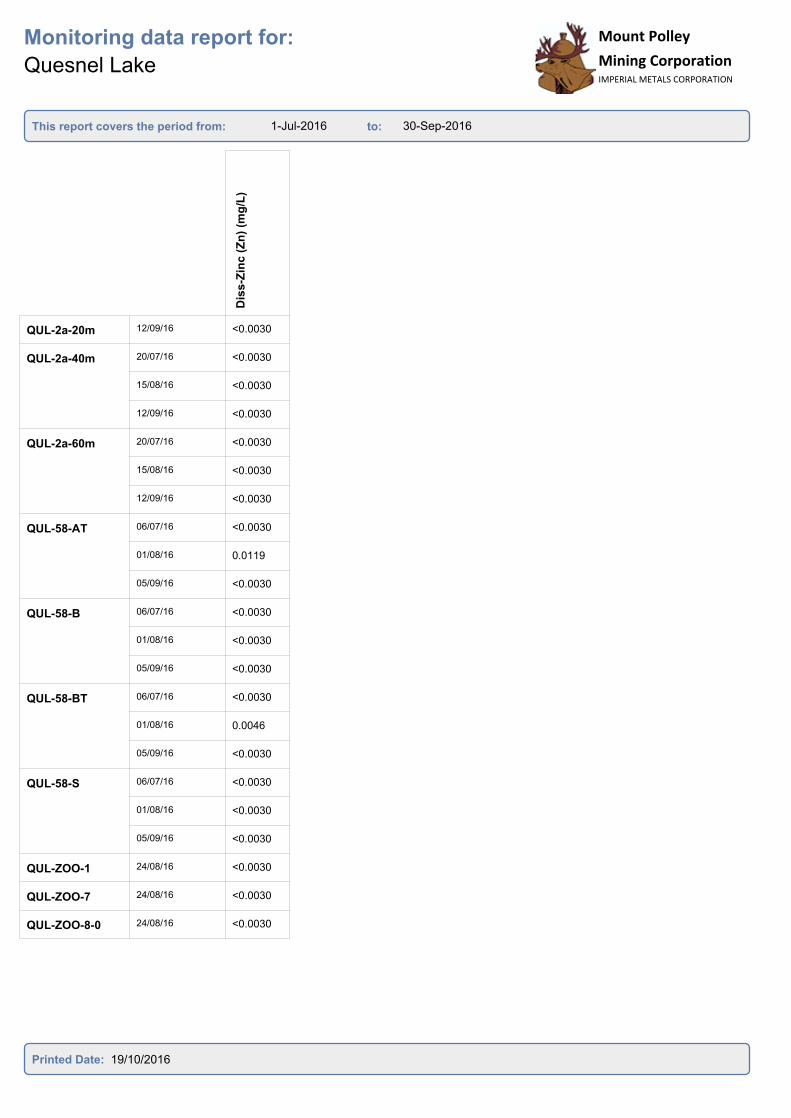
1-Jul-2016 30-Sep-2016
Monitoring data report for:
Quesnel Lake
This report covers the period from: to:
Mount Polley
Mining CorporationIMPERIAL METALS CORPORATION
Mount Polley
Mining CorporationIMPERIAL METALS CORPORATION
Dis
s-Z
inc (
Zn
) (m
g/L
)
QUL-2a-20m 12/09/16 <0.0030
QUL-2a-40m 20/07/16 <0.0030
15/08/16 <0.0030
12/09/16 <0.0030
QUL-2a-60m 20/07/16 <0.0030
15/08/16 <0.0030
12/09/16 <0.0030
QUL-58-AT 06/07/16 <0.0030
01/08/16 0.0119
05/09/16 <0.0030
QUL-58-B 06/07/16 <0.0030
01/08/16 <0.0030
05/09/16 <0.0030
QUL-58-BT 06/07/16 <0.0030
01/08/16 0.0046
05/09/16 <0.0030
QUL-58-S 06/07/16 <0.0030
01/08/16 <0.0030
05/09/16 <0.0030
QUL-ZOO-1 24/08/16 <0.0030
QUL-ZOO-7 24/08/16 <0.0030
QUL-ZOO-8-0
m
24/08/16 <0.0030
Printed Date: 19/10/2016

1-Jul-2016 30-Sep-2016
Monitoring data report for:
Quesnel River
This report covers the period from: to:
Mount Polley
Mining CorporationIMPERIAL METALS CORPORATION
Co
nd
ucti
vit
y (
µs/c
m)
Hard
nes
s (
mg
/L)
pH
(p
H)
TD
S (
mg
/L)
TS
S (
mg
/L)
NT
U (
ntu
)
Alk
alin
ity
(C
aC
O3)
(mg
/L)
Am
mo
nia
(a
s N
) (m
g/L
)
QUR-11 11/07/16 100 46.7 7.71 101 <1.0 0.54 44.4 <0.0050
11/08/16 102 47.9 7.86 69 <1.0 0.5 48.7 <0.0050
08/09/16 102 51.2 7.9 71 <1.0 0.25 48.5 <0.0050
Printed Date: 19/10/2016

1-Jul-2016 30-Sep-2016
Monitoring data report for:
Quesnel River
This report covers the period from: to:
Mount Polley
Mining CorporationIMPERIAL METALS CORPORATION
Mount Polley
Mining CorporationIMPERIAL METALS CORPORATION
Ch
lori
de (
mg
/L)
Flo
rid
e (
mg
/L)
Nit
rate
(N
) (m
g/L
)
Nit
rate
an
d N
itri
te
(mg
/L)
Nit
rite
(N
) (m
g/L
)
Dis
s-O
rth
op
ho
sp
hate
(mg
/L)
Dis
s-P
ho
sp
ho
rus
(mg
/L)
To
tal P
ho
sp
ho
rus
(mg
/L)
QUR-11 11/07/16 <0.50 0.032 0.0583 0.0583 <0.0010 <0.0010 <0.0020 0.0038
11/08/16 <0.50 0.034 0.0569 0.0569 <0.0010 <0.0010 <0.0020 0.0026
08/09/16 <0.50 0.03 0.0532 0.0532 <0.0010 <0.0010 <0.0020 0.0029
Printed Date: 19/10/2016
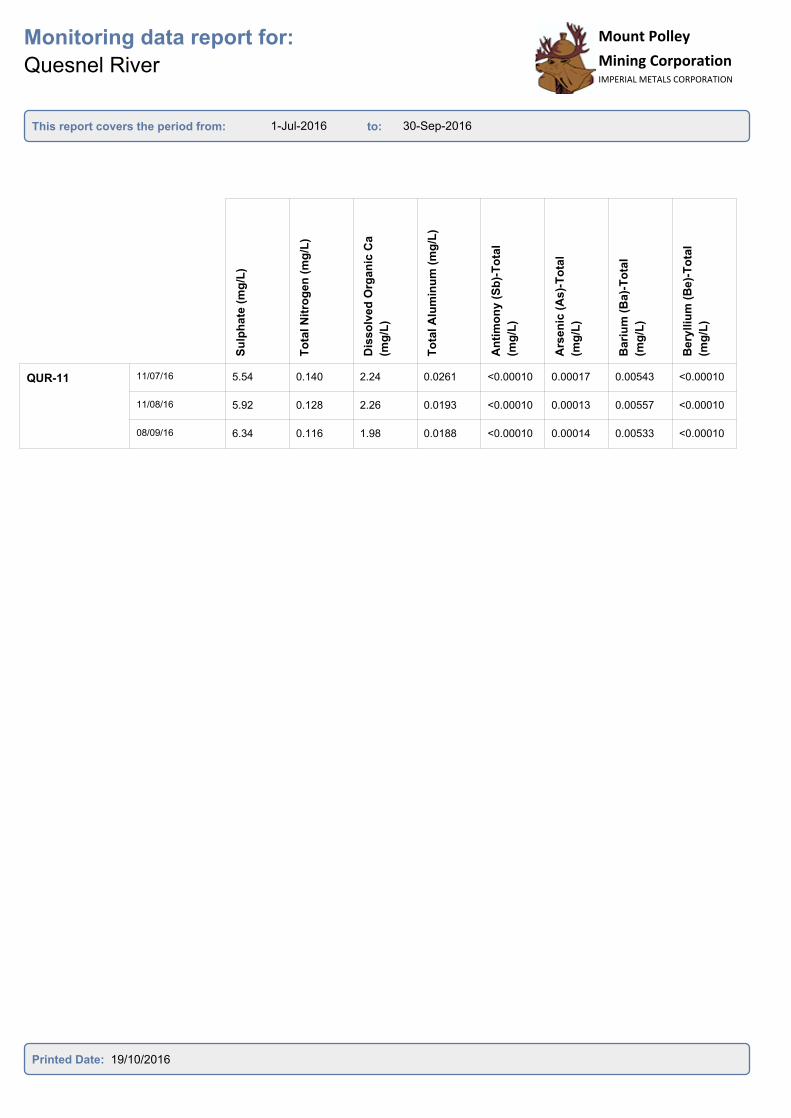
1-Jul-2016 30-Sep-2016
Monitoring data report for:
Quesnel River
This report covers the period from: to:
Mount Polley
Mining CorporationIMPERIAL METALS CORPORATION
Mount Polley
Mining CorporationIMPERIAL METALS CORPORATION
Su
lph
ate
(m
g/L
)
To
tal N
itro
ge
n (
mg
/L)
Dis
so
lved
Org
an
ic C
a
(mg
/L)
To
tal A
lum
inu
m (
mg
/L)
An
tim
on
y (
Sb
)-T
ota
l
(mg
/L)
Ars
en
ic (
As)-
To
tal
(mg
/L)
Bari
um
(B
a)-
To
tal
(mg
/L)
Bery
lliu
m (
Be)-
To
tal
(mg
/L)
QUR-11 11/07/16 5.54 0.140 2.24 0.0261 <0.00010 0.00017 0.00543 <0.00010
11/08/16 5.92 0.128 2.26 0.0193 <0.00010 0.00013 0.00557 <0.00010
08/09/16 6.34 0.116 1.98 0.0188 <0.00010 0.00014 0.00533 <0.00010
Printed Date: 19/10/2016
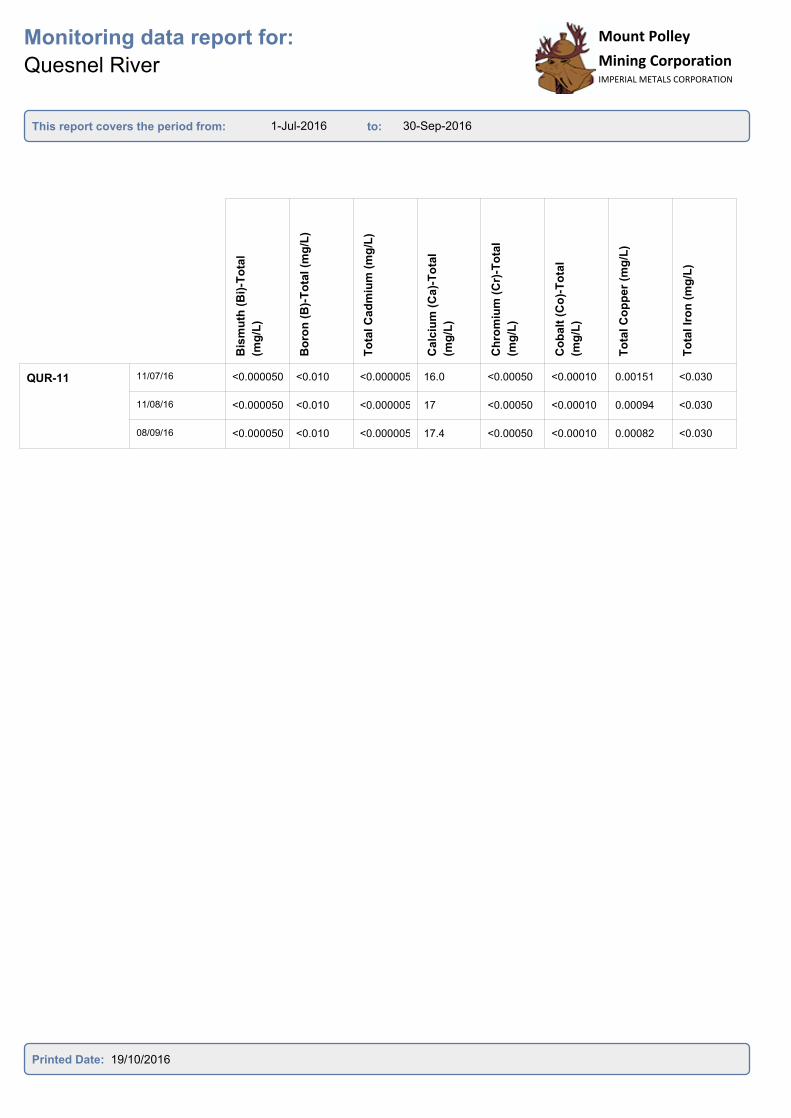
1-Jul-2016 30-Sep-2016
Monitoring data report for:
Quesnel River
This report covers the period from: to:
Mount Polley
Mining CorporationIMPERIAL METALS CORPORATION
Mount Polley
Mining CorporationIMPERIAL METALS CORPORATION
Bis
mu
th (
Bi)
-To
tal
(mg
/L)
Bo
ron
(B
)-T
ota
l (m
g/L
)
To
tal C
ad
miu
m (
mg
/L)
Calc
ium
(C
a)-
To
tal
(mg
/L)
Ch
rom
ium
(C
r)-T
ota
l
(mg
/L)
Co
balt
(C
o)-
To
tal
(mg
/L)
To
tal C
op
per
(mg
/L)
To
tal Ir
on
(m
g/L
)
QUR-11 11/07/16 <0.000050 <0.010 <0.000005 16.0 <0.00050 <0.00010 0.00151 <0.030
11/08/16 <0.000050 <0.010 <0.000005 17 <0.00050 <0.00010 0.00094 <0.030
08/09/16 <0.000050 <0.010 <0.000005 17.4 <0.00050 <0.00010 0.00082 <0.030
Printed Date: 19/10/2016

1-Jul-2016 30-Sep-2016
Monitoring data report for:
Quesnel River
This report covers the period from: to:
Mount Polley
Mining CorporationIMPERIAL METALS CORPORATION
Mount Polley
Mining CorporationIMPERIAL METALS CORPORATION
To
tal L
ea
d (
mg
/L)
Lit
hiu
m (
Li)
-To
tal
(mg
/L)
Mag
nes
ium
(M
g)-
To
tal
(mg
/L)
To
tal M
an
ga
nese
(mg
/L)
To
tal M
oly
bd
en
um
(mg
/L)
Nic
ke
l (N
i)-T
ota
l (m
g/L
)
Po
tas
siu
m (
K)-
To
tal
(mg
/L)
To
tal S
ele
niu
m (
mg
/L)
QUR-11 11/07/16 0.000703 0.0012 1.94 0.00211 0.000389 <0.00050 0.474 0.000124
11/08/16 0.000563 0.0012 1.83 0.00142 0.000323 <0.00050 0.495 0.000104
08/09/16 0.000674 <0.0010 2.02 0.00118 0.000336 <0.00050 0.489 0.000084
Printed Date: 19/10/2016
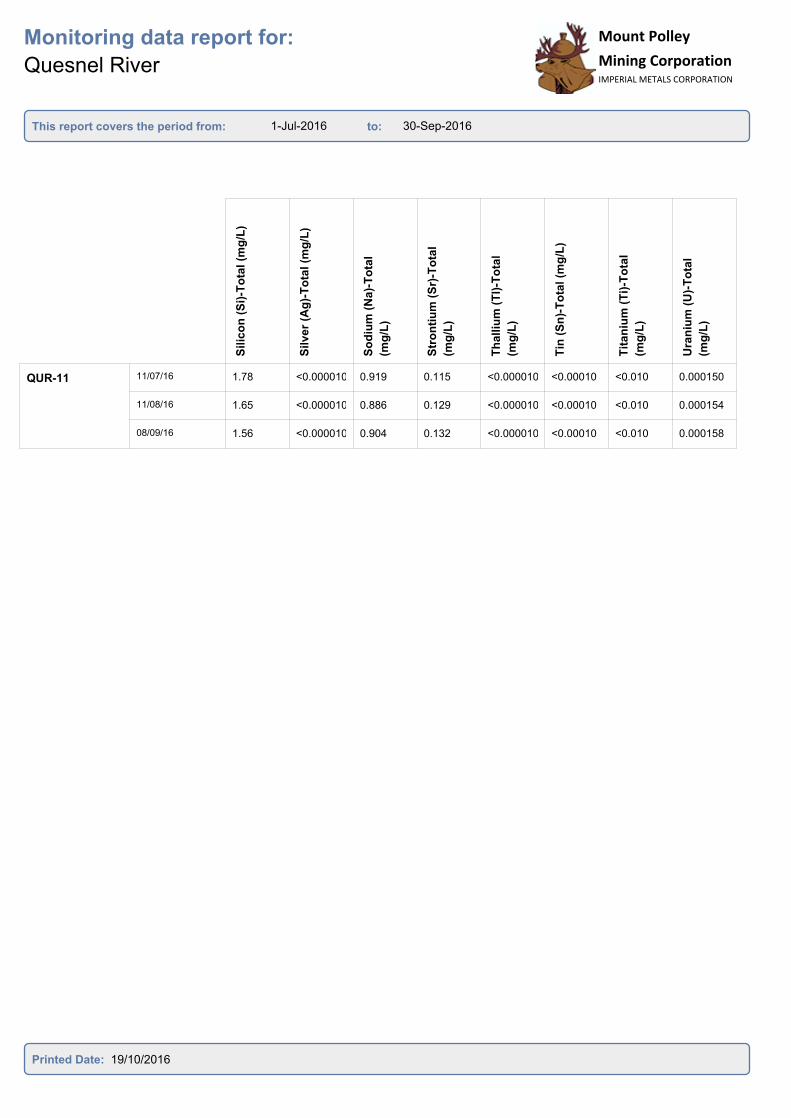
1-Jul-2016 30-Sep-2016
Monitoring data report for:
Quesnel River
This report covers the period from: to:
Mount Polley
Mining CorporationIMPERIAL METALS CORPORATION
Mount Polley
Mining CorporationIMPERIAL METALS CORPORATION
Silic
on
(S
i)-T
ota
l (m
g/L
)
Silve
r (A
g)-
To
tal (m
g/L
)
So
diu
m (
Na)-
To
tal
(mg
/L)
Str
on
tiu
m (
Sr)
-To
tal
(mg
/L)
Th
alliu
m (
Tl)
-To
tal
(mg
/L)
Tin
(S
n)-
To
tal (m
g/L
)
Tit
an
ium
(T
i)-T
ota
l
(mg
/L)
Ura
niu
m (
U)-
To
tal
(mg
/L)
QUR-11 11/07/16 1.78 <0.000010 0.919 0.115 <0.000010 <0.00010 <0.010 0.000150
11/08/16 1.65 <0.000010 0.886 0.129 <0.000010 <0.00010 <0.010 0.000154
08/09/16 1.56 <0.000010 0.904 0.132 <0.000010 <0.00010 <0.010 0.000158
Printed Date: 19/10/2016
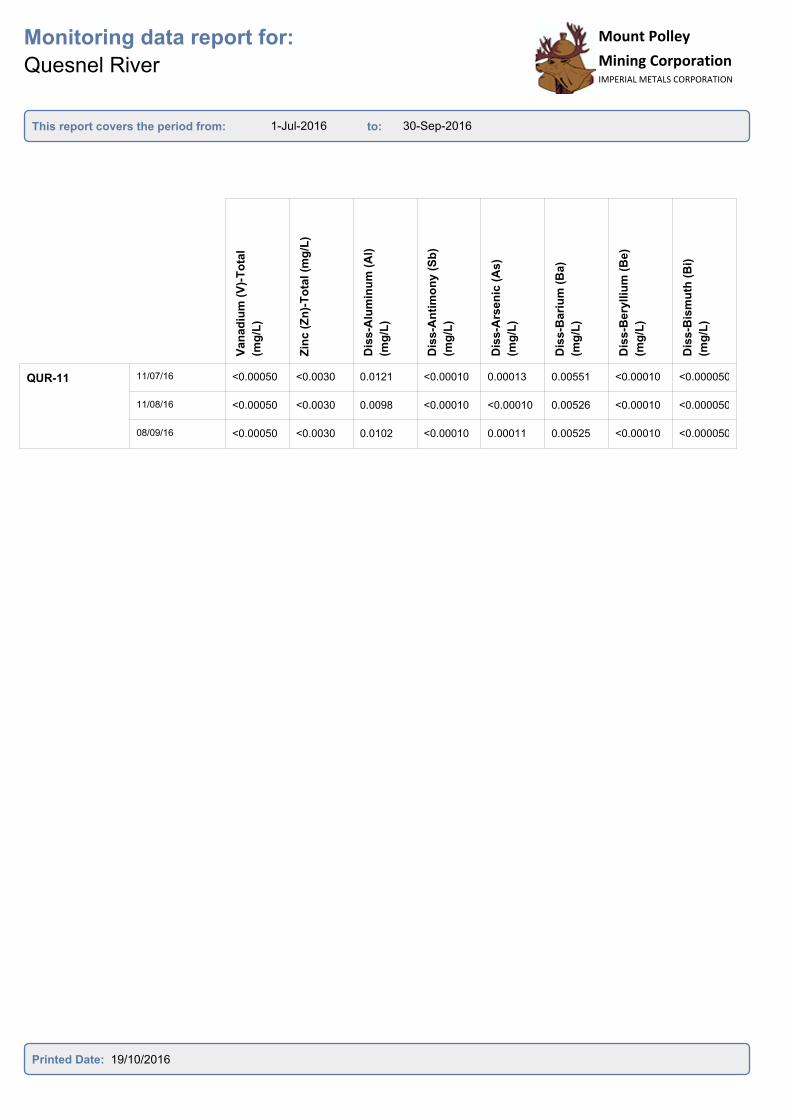
1-Jul-2016 30-Sep-2016
Monitoring data report for:
Quesnel River
This report covers the period from: to:
Mount Polley
Mining CorporationIMPERIAL METALS CORPORATION
Mount Polley
Mining CorporationIMPERIAL METALS CORPORATION
Van
ad
ium
(V
)-T
ota
l
(mg
/L)
Zin
c (
Zn
)-T
ota
l (m
g/L
)
Dis
s-A
lum
inu
m (
Al)
(mg
/L)
Dis
s-A
nti
mo
ny
(S
b)
(mg
/L)
Dis
s-A
rsen
ic (
As
)
(mg
/L)
Dis
s-B
ari
um
(B
a)
(mg
/L)
Dis
s-B
ery
lliu
m (
Be)
(mg
/L)
Dis
s-B
ism
uth
(B
i)
(mg
/L)
QUR-11 11/07/16 <0.00050 <0.0030 0.0121 <0.00010 0.00013 0.00551 <0.00010 <0.000050
11/08/16 <0.00050 <0.0030 0.0098 <0.00010 <0.00010 0.00526 <0.00010 <0.000050
08/09/16 <0.00050 <0.0030 0.0102 <0.00010 0.00011 0.00525 <0.00010 <0.000050
Printed Date: 19/10/2016
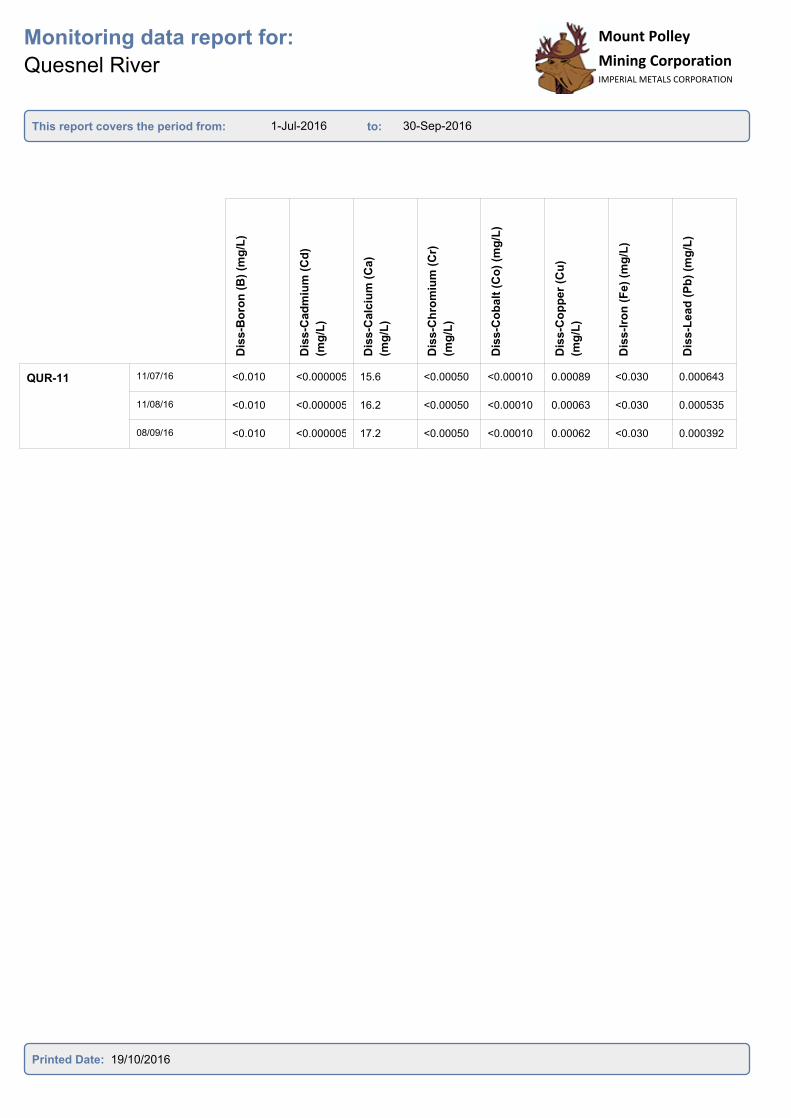
1-Jul-2016 30-Sep-2016
Monitoring data report for:
Quesnel River
This report covers the period from: to:
Mount Polley
Mining CorporationIMPERIAL METALS CORPORATION
Mount Polley
Mining CorporationIMPERIAL METALS CORPORATION
Dis
s-B
oro
n (
B)
(mg
/L)
Dis
s-C
ad
miu
m (
Cd
)
(mg
/L)
Dis
s-C
alc
ium
(C
a)
(mg
/L)
Dis
s-C
hro
miu
m (
Cr)
(mg
/L)
Dis
s-C
ob
alt
(C
o)
(mg
/L)
Dis
s-C
op
pe
r (C
u)
(mg
/L)
Dis
s-I
ron
(F
e)
(mg
/L)
Dis
s-L
ead
(P
b)
(mg
/L)
QUR-11 11/07/16 <0.010 <0.000005 15.6 <0.00050 <0.00010 0.00089 <0.030 0.000643
11/08/16 <0.010 <0.000005 16.2 <0.00050 <0.00010 0.00063 <0.030 0.000535
08/09/16 <0.010 <0.000005 17.2 <0.00050 <0.00010 0.00062 <0.030 0.000392
Printed Date: 19/10/2016
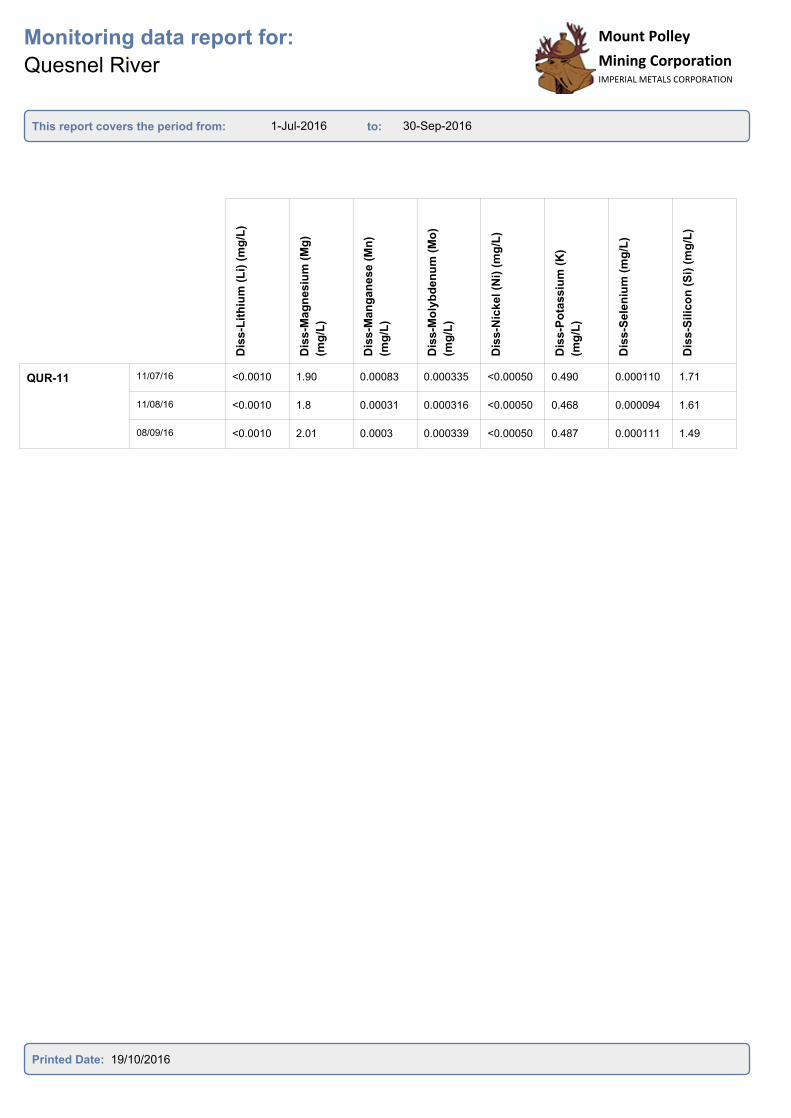
1-Jul-2016 30-Sep-2016
Monitoring data report for:
Quesnel River
This report covers the period from: to:
Mount Polley
Mining CorporationIMPERIAL METALS CORPORATION
Mount Polley
Mining CorporationIMPERIAL METALS CORPORATION
Dis
s-L
ith
ium
(L
i) (
mg
/L)
Dis
s-M
ag
nesiu
m (
Mg
)
(mg
/L)
Dis
s-M
an
gan
ese
(M
n)
(mg
/L)
Dis
s-M
oly
bd
en
um
(M
o)
(mg
/L)
Dis
s-N
ickel (N
i) (
mg
/L)
Dis
s-P
ota
ssiu
m (
K)
(mg
/L)
Dis
s-S
ele
niu
m (
mg
/L)
Dis
s-S
ilic
on
(S
i) (
mg
/L)
QUR-11 11/07/16 <0.0010 1.90 0.00083 0.000335 <0.00050 0.490 0.000110 1.71
11/08/16 <0.0010 1.8 0.00031 0.000316 <0.00050 0.468 0.000094 1.61
08/09/16 <0.0010 2.01 0.0003 0.000339 <0.00050 0.487 0.000111 1.49
Printed Date: 19/10/2016

1-Jul-2016 30-Sep-2016
Monitoring data report for:
Quesnel River
This report covers the period from: to:
Mount Polley
Mining CorporationIMPERIAL METALS CORPORATION
Mount Polley
Mining CorporationIMPERIAL METALS CORPORATION
Dis
s-S
ilv
er
(Ag
) (m
g/L
)
Dis
s-S
od
ium
(N
a)
(mg
/L)
Dis
s-S
tro
nti
um
(S
r)
(mg
/L)
Dis
s-T
halliu
m (
Tl)
(mg
/L)
Dis
s-T
in (
Sn
) (m
g/L
)
Dis
s-T
itan
ium
(T
i)
(mg
/L)
Dis
s-U
ran
ium
(U
)
(mg
/L)
Dis
s-V
an
ad
ium
(V
)
(mg
/L)
QUR-11 11/07/16 <0.000010 0.889 0.112 <0.000010 <0.00010 <0.010 0.000130 <0.00050
11/08/16 <0.000010 0.859 0.124 <0.000010 <0.00010 <0.010 0.000143 <0.00050
08/09/16 <0.000010 0.9 0.128 <0.000010 <0.00010 <0.010 0.00015 <0.00050
Printed Date: 19/10/2016
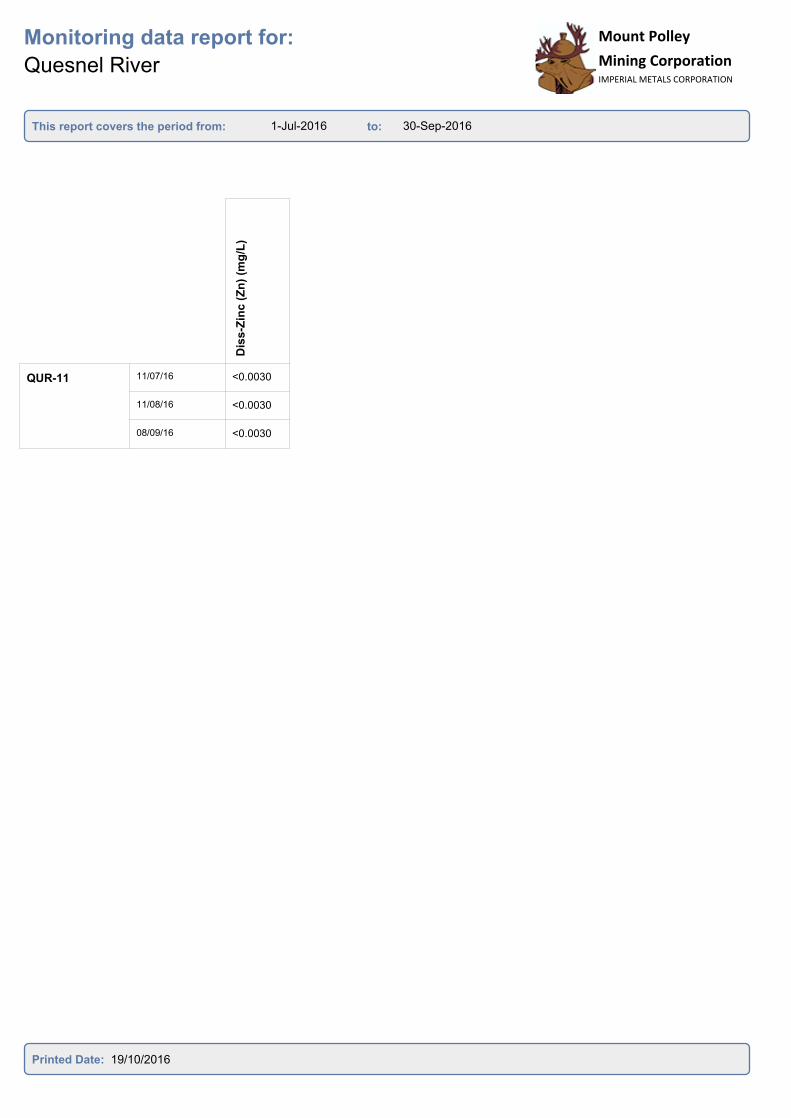
1-Jul-2016 30-Sep-2016
Monitoring data report for:
Quesnel River
This report covers the period from: to:
Mount Polley
Mining CorporationIMPERIAL METALS CORPORATION
Mount Polley
Mining CorporationIMPERIAL METALS CORPORATION
Dis
s-Z
inc (
Zn
) (m
g/L
)
QUR-11 11/07/16 <0.0030
11/08/16 <0.0030
08/09/16 <0.0030
Printed Date: 19/10/2016

Mount Polley Mining Corporation Permit 11678 – Third Quarter 2016 Report
Appendix 2
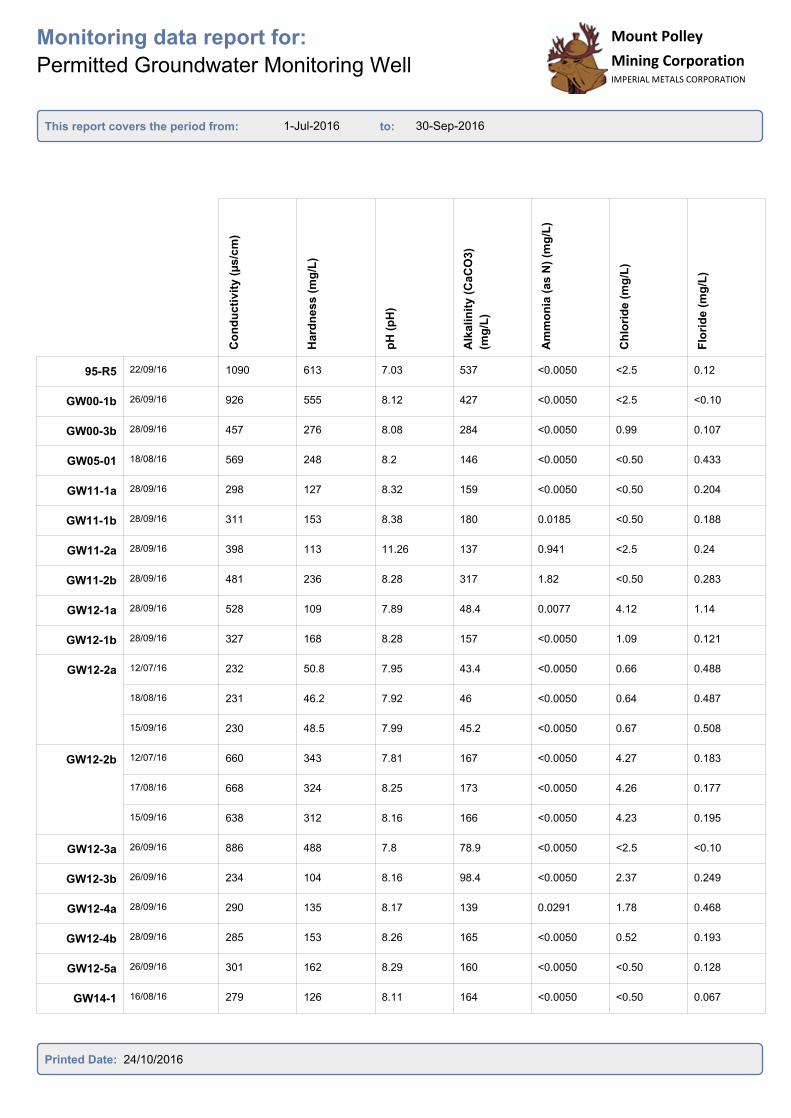
1-Jul-2016 30-Sep-2016
Monitoring data report for:
Permitted Groundwater Monitoring Well
This report covers the period from: to:
Mount Polley
Mining CorporationIMPERIAL METALS CORPORATION
Co
nd
ucti
vit
y (
µs/c
m)
Hard
ne
ss (
mg
/L)
pH
(p
H)
Alk
alin
ity
(C
aC
O3)
(mg
/L)
Am
mo
nia
(a
s N
) (m
g/L
)
Ch
lori
de (
mg
/L)
Flo
rid
e (
mg
/L)
95-R5 22/09/16 1090 613 7.03 537 <0.0050 <2.5 0.12
GW00-1b 26/09/16 926 555 8.12 427 <0.0050 <2.5 <0.10
GW00-3b 28/09/16 457 276 8.08 284 <0.0050 0.99 0.107
GW05-01 18/08/16 569 248 8.2 146 <0.0050 <0.50 0.433
GW11-1a 28/09/16 298 127 8.32 159 <0.0050 <0.50 0.204
GW11-1b 28/09/16 311 153 8.38 180 0.0185 <0.50 0.188
GW11-2a 28/09/16 398 113 11.26 137 0.941 <2.5 0.24
GW11-2b 28/09/16 481 236 8.28 317 1.82 <0.50 0.283
GW12-1a 28/09/16 528 109 7.89 48.4 0.0077 4.12 1.14
GW12-1b 28/09/16 327 168 8.28 157 <0.0050 1.09 0.121
GW12-2a 12/07/16 232 50.8 7.95 43.4 <0.0050 0.66 0.488
18/08/16 231 46.2 7.92 46 <0.0050 0.64 0.487
15/09/16 230 48.5 7.99 45.2 <0.0050 0.67 0.508
GW12-2b 12/07/16 660 343 7.81 167 <0.0050 4.27 0.183
17/08/16 668 324 8.25 173 <0.0050 4.26 0.177
15/09/16 638 312 8.16 166 <0.0050 4.23 0.195
GW12-3a 26/09/16 886 488 7.8 78.9 <0.0050 <2.5 <0.10
GW12-3b 26/09/16 234 104 8.16 98.4 <0.0050 2.37 0.249
GW12-4a 28/09/16 290 135 8.17 139 0.0291 1.78 0.468
GW12-4b 28/09/16 285 153 8.26 165 <0.0050 0.52 0.193
GW12-5a 26/09/16 301 162 8.29 160 <0.0050 <0.50 0.128
GW14-1 16/08/16 279 126 8.11 164 <0.0050 <0.50 0.067
Printed Date: 24/10/2016
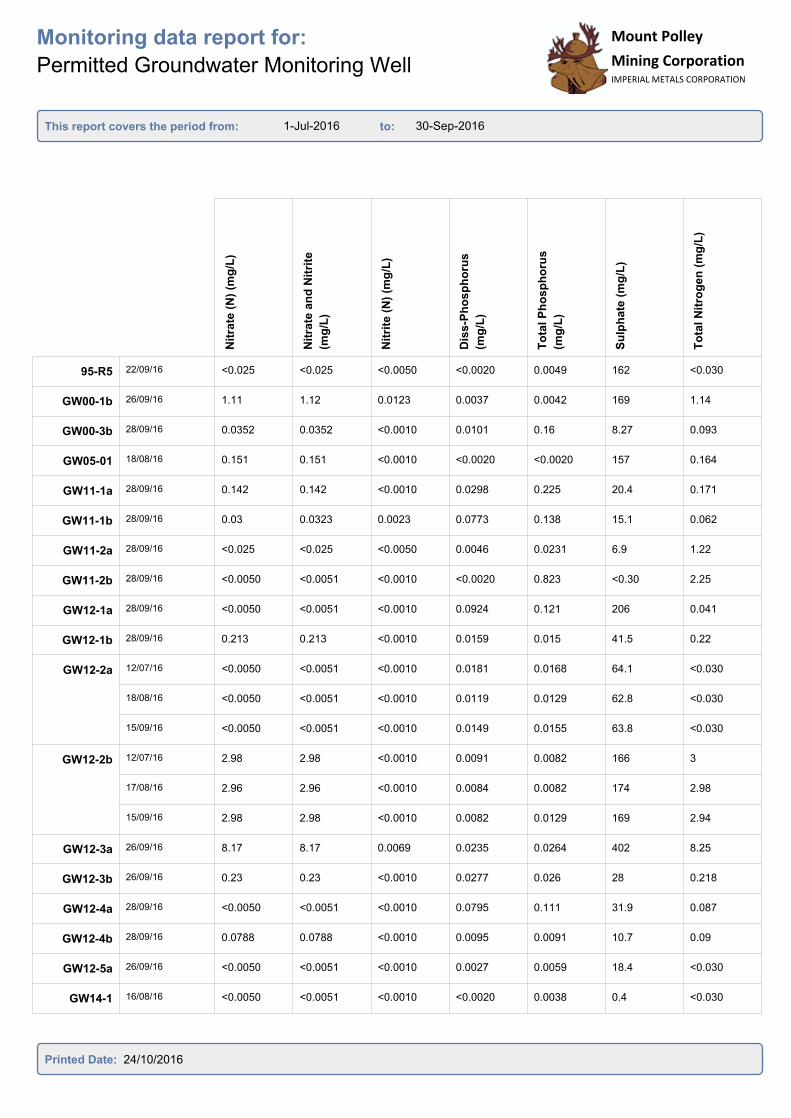
1-Jul-2016 30-Sep-2016
Monitoring data report for:
Permitted Groundwater Monitoring Well
This report covers the period from: to:
Mount Polley
Mining CorporationIMPERIAL METALS CORPORATION
Mount Polley
Mining CorporationIMPERIAL METALS CORPORATION
Nit
rate
(N
) (m
g/L
)
Nit
rate
an
d N
itri
te
(mg
/L)
Nit
rite
(N
) (m
g/L
)
Dis
s-P
ho
sp
ho
rus
(mg
/L)
To
tal P
ho
sp
ho
rus
(mg
/L)
Su
lph
ate
(m
g/L
)
To
tal N
itro
ge
n (
mg
/L)
95-R5 22/09/16 <0.025 <0.025 <0.0050 <0.0020 0.0049 162 <0.030
GW00-1b 26/09/16 1.11 1.12 0.0123 0.0037 0.0042 169 1.14
GW00-3b 28/09/16 0.0352 0.0352 <0.0010 0.0101 0.16 8.27 0.093
GW05-01 18/08/16 0.151 0.151 <0.0010 <0.0020 <0.0020 157 0.164
GW11-1a 28/09/16 0.142 0.142 <0.0010 0.0298 0.225 20.4 0.171
GW11-1b 28/09/16 0.03 0.0323 0.0023 0.0773 0.138 15.1 0.062
GW11-2a 28/09/16 <0.025 <0.025 <0.0050 0.0046 0.0231 6.9 1.22
GW11-2b 28/09/16 <0.0050 <0.0051 <0.0010 <0.0020 0.823 <0.30 2.25
GW12-1a 28/09/16 <0.0050 <0.0051 <0.0010 0.0924 0.121 206 0.041
GW12-1b 28/09/16 0.213 0.213 <0.0010 0.0159 0.015 41.5 0.22
GW12-2a 12/07/16 <0.0050 <0.0051 <0.0010 0.0181 0.0168 64.1 <0.030
18/08/16 <0.0050 <0.0051 <0.0010 0.0119 0.0129 62.8 <0.030
15/09/16 <0.0050 <0.0051 <0.0010 0.0149 0.0155 63.8 <0.030
GW12-2b 12/07/16 2.98 2.98 <0.0010 0.0091 0.0082 166 3
17/08/16 2.96 2.96 <0.0010 0.0084 0.0082 174 2.98
15/09/16 2.98 2.98 <0.0010 0.0082 0.0129 169 2.94
GW12-3a 26/09/16 8.17 8.17 0.0069 0.0235 0.0264 402 8.25
GW12-3b 26/09/16 0.23 0.23 <0.0010 0.0277 0.026 28 0.218
GW12-4a 28/09/16 <0.0050 <0.0051 <0.0010 0.0795 0.111 31.9 0.087
GW12-4b 28/09/16 0.0788 0.0788 <0.0010 0.0095 0.0091 10.7 0.09
GW12-5a 26/09/16 <0.0050 <0.0051 <0.0010 0.0027 0.0059 18.4 <0.030
GW14-1 16/08/16 <0.0050 <0.0051 <0.0010 <0.0020 0.0038 0.4 <0.030
Printed Date: 24/10/2016
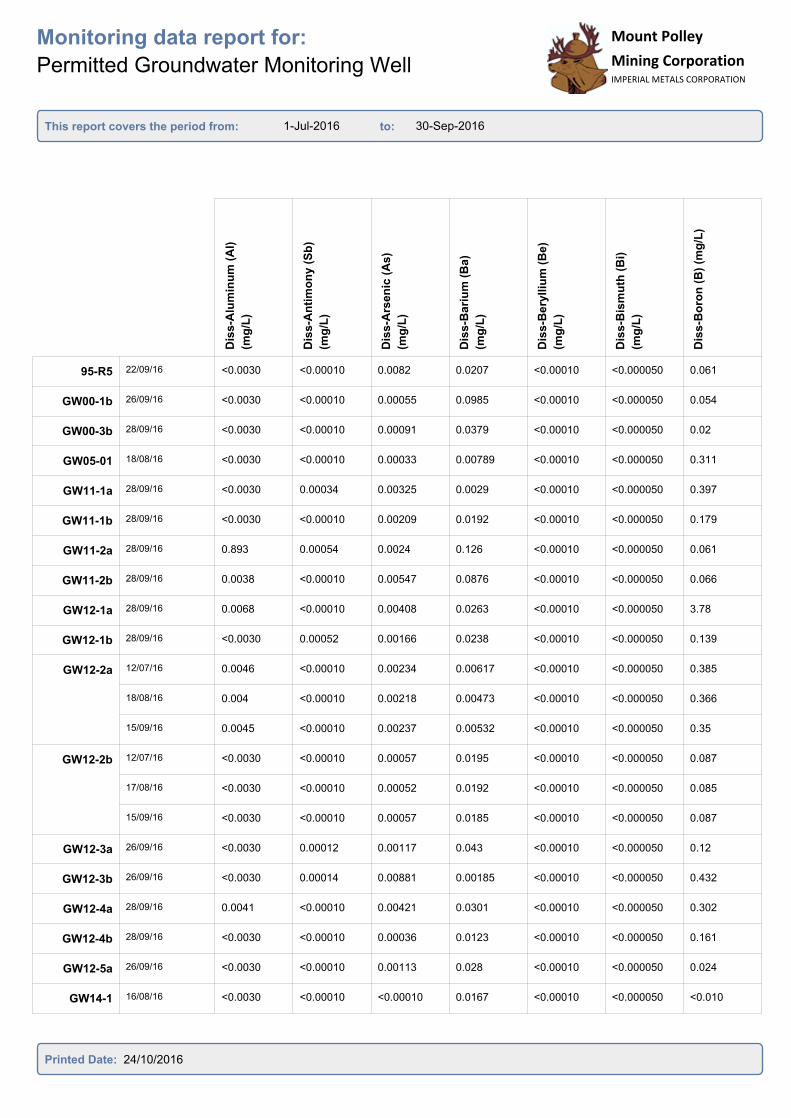
1-Jul-2016 30-Sep-2016
Monitoring data report for:
Permitted Groundwater Monitoring Well
This report covers the period from: to:
Mount Polley
Mining CorporationIMPERIAL METALS CORPORATION
Mount Polley
Mining CorporationIMPERIAL METALS CORPORATION
Dis
s-A
lum
inu
m (
Al)
(mg
/L)
Dis
s-A
nti
mo
ny
(S
b)
(mg
/L)
Dis
s-A
rsen
ic (
As
)
(mg
/L)
Dis
s-B
ari
um
(B
a)
(mg
/L)
Dis
s-B
ery
lliu
m (
Be)
(mg
/L)
Dis
s-B
ism
uth
(B
i)
(mg
/L)
Dis
s-B
oro
n (
B)
(mg
/L)
95-R5 22/09/16 <0.0030 <0.00010 0.0082 0.0207 <0.00010 <0.000050 0.061
GW00-1b 26/09/16 <0.0030 <0.00010 0.00055 0.0985 <0.00010 <0.000050 0.054
GW00-3b 28/09/16 <0.0030 <0.00010 0.00091 0.0379 <0.00010 <0.000050 0.02
GW05-01 18/08/16 <0.0030 <0.00010 0.00033 0.00789 <0.00010 <0.000050 0.311
GW11-1a 28/09/16 <0.0030 0.00034 0.00325 0.0029 <0.00010 <0.000050 0.397
GW11-1b 28/09/16 <0.0030 <0.00010 0.00209 0.0192 <0.00010 <0.000050 0.179
GW11-2a 28/09/16 0.893 0.00054 0.0024 0.126 <0.00010 <0.000050 0.061
GW11-2b 28/09/16 0.0038 <0.00010 0.00547 0.0876 <0.00010 <0.000050 0.066
GW12-1a 28/09/16 0.0068 <0.00010 0.00408 0.0263 <0.00010 <0.000050 3.78
GW12-1b 28/09/16 <0.0030 0.00052 0.00166 0.0238 <0.00010 <0.000050 0.139
GW12-2a 12/07/16 0.0046 <0.00010 0.00234 0.00617 <0.00010 <0.000050 0.385
18/08/16 0.004 <0.00010 0.00218 0.00473 <0.00010 <0.000050 0.366
15/09/16 0.0045 <0.00010 0.00237 0.00532 <0.00010 <0.000050 0.35
GW12-2b 12/07/16 <0.0030 <0.00010 0.00057 0.0195 <0.00010 <0.000050 0.087
17/08/16 <0.0030 <0.00010 0.00052 0.0192 <0.00010 <0.000050 0.085
15/09/16 <0.0030 <0.00010 0.00057 0.0185 <0.00010 <0.000050 0.087
GW12-3a 26/09/16 <0.0030 0.00012 0.00117 0.043 <0.00010 <0.000050 0.12
GW12-3b 26/09/16 <0.0030 0.00014 0.00881 0.00185 <0.00010 <0.000050 0.432
GW12-4a 28/09/16 0.0041 <0.00010 0.00421 0.0301 <0.00010 <0.000050 0.302
GW12-4b 28/09/16 <0.0030 <0.00010 0.00036 0.0123 <0.00010 <0.000050 0.161
GW12-5a 26/09/16 <0.0030 <0.00010 0.00113 0.028 <0.00010 <0.000050 0.024
GW14-1 16/08/16 <0.0030 <0.00010 <0.00010 0.0167 <0.00010 <0.000050 <0.010
Printed Date: 24/10/2016
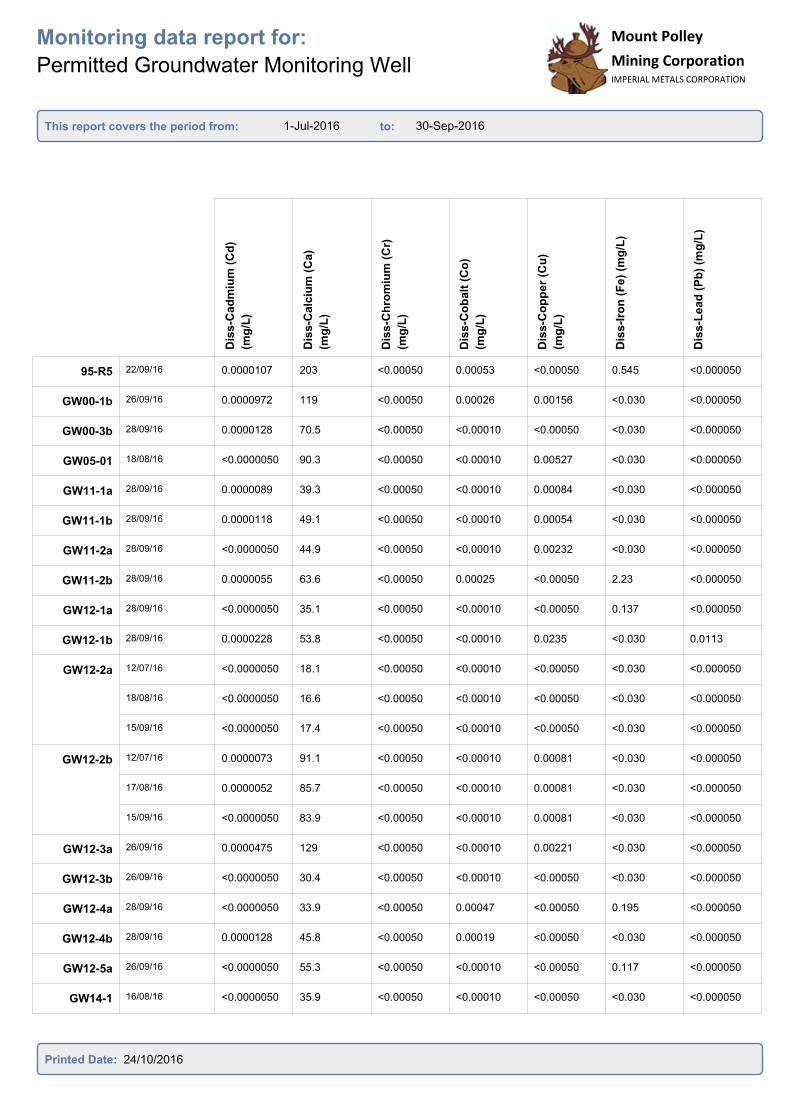
1-Jul-2016 30-Sep-2016
Monitoring data report for:
Permitted Groundwater Monitoring Well
This report covers the period from: to:
Mount Polley
Mining CorporationIMPERIAL METALS CORPORATION
Mount Polley
Mining CorporationIMPERIAL METALS CORPORATION
Dis
s-C
ad
miu
m (
Cd
)
(mg
/L)
Dis
s-C
alc
ium
(C
a)
(mg
/L)
Dis
s-C
hro
miu
m (
Cr)
(mg
/L)
Dis
s-C
ob
alt
(C
o)
(mg
/L)
Dis
s-C
op
pe
r (C
u)
(mg
/L)
Dis
s-I
ron
(F
e)
(mg
/L)
Dis
s-L
ead
(P
b)
(mg
/L)
95-R5 22/09/16 0.0000107 203 <0.00050 0.00053 <0.00050 0.545 <0.000050
GW00-1b 26/09/16 0.0000972 119 <0.00050 0.00026 0.00156 <0.030 <0.000050
GW00-3b 28/09/16 0.0000128 70.5 <0.00050 <0.00010 <0.00050 <0.030 <0.000050
GW05-01 18/08/16 <0.0000050 90.3 <0.00050 <0.00010 0.00527 <0.030 <0.000050
GW11-1a 28/09/16 0.0000089 39.3 <0.00050 <0.00010 0.00084 <0.030 <0.000050
GW11-1b 28/09/16 0.0000118 49.1 <0.00050 <0.00010 0.00054 <0.030 <0.000050
GW11-2a 28/09/16 <0.0000050 44.9 <0.00050 <0.00010 0.00232 <0.030 <0.000050
GW11-2b 28/09/16 0.0000055 63.6 <0.00050 0.00025 <0.00050 2.23 <0.000050
GW12-1a 28/09/16 <0.0000050 35.1 <0.00050 <0.00010 <0.00050 0.137 <0.000050
GW12-1b 28/09/16 0.0000228 53.8 <0.00050 <0.00010 0.0235 <0.030 0.0113
GW12-2a 12/07/16 <0.0000050 18.1 <0.00050 <0.00010 <0.00050 <0.030 <0.000050
18/08/16 <0.0000050 16.6 <0.00050 <0.00010 <0.00050 <0.030 <0.000050
15/09/16 <0.0000050 17.4 <0.00050 <0.00010 <0.00050 <0.030 <0.000050
GW12-2b 12/07/16 0.0000073 91.1 <0.00050 <0.00010 0.00081 <0.030 <0.000050
17/08/16 0.0000052 85.7 <0.00050 <0.00010 0.00081 <0.030 <0.000050
15/09/16 <0.0000050 83.9 <0.00050 <0.00010 0.00081 <0.030 <0.000050
GW12-3a 26/09/16 0.0000475 129 <0.00050 <0.00010 0.00221 <0.030 <0.000050
GW12-3b 26/09/16 <0.0000050 30.4 <0.00050 <0.00010 <0.00050 <0.030 <0.000050
GW12-4a 28/09/16 <0.0000050 33.9 <0.00050 0.00047 <0.00050 0.195 <0.000050
GW12-4b 28/09/16 0.0000128 45.8 <0.00050 0.00019 <0.00050 <0.030 <0.000050
GW12-5a 26/09/16 <0.0000050 55.3 <0.00050 <0.00010 <0.00050 0.117 <0.000050
GW14-1 16/08/16 <0.0000050 35.9 <0.00050 <0.00010 <0.00050 <0.030 <0.000050
Printed Date: 24/10/2016
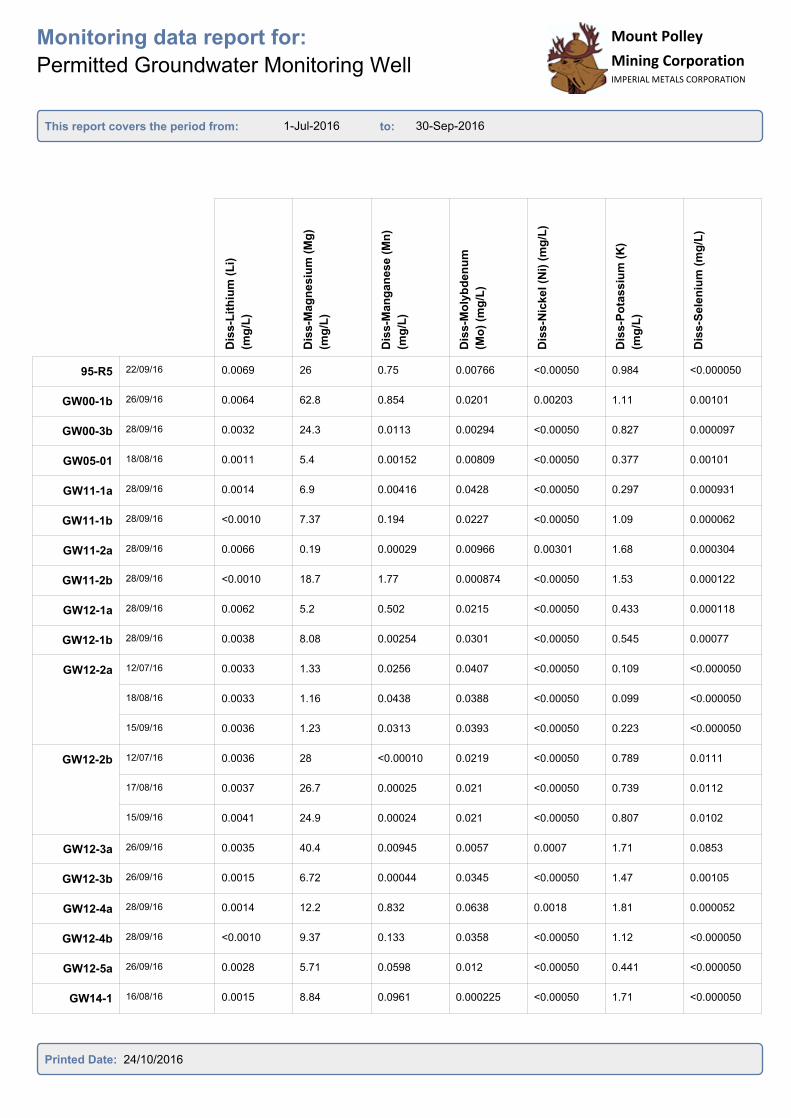
1-Jul-2016 30-Sep-2016
Monitoring data report for:
Permitted Groundwater Monitoring Well
This report covers the period from: to:
Mount Polley
Mining CorporationIMPERIAL METALS CORPORATION
Mount Polley
Mining CorporationIMPERIAL METALS CORPORATION
Dis
s-L
ith
ium
(L
i)
(mg
/L)
Dis
s-M
ag
nesiu
m (
Mg
)
(mg
/L)
Dis
s-M
an
gan
ese
(M
n)
(mg
/L)
Dis
s-M
oly
bd
en
um
(Mo
) (m
g/L
)
Dis
s-N
ickel (N
i) (
mg
/L)
Dis
s-P
ota
ssiu
m (
K)
(mg
/L)
Dis
s-S
ele
niu
m (
mg
/L)
95-R5 22/09/16 0.0069 26 0.75 0.00766 <0.00050 0.984 <0.000050
GW00-1b 26/09/16 0.0064 62.8 0.854 0.0201 0.00203 1.11 0.00101
GW00-3b 28/09/16 0.0032 24.3 0.0113 0.00294 <0.00050 0.827 0.000097
GW05-01 18/08/16 0.0011 5.4 0.00152 0.00809 <0.00050 0.377 0.00101
GW11-1a 28/09/16 0.0014 6.9 0.00416 0.0428 <0.00050 0.297 0.000931
GW11-1b 28/09/16 <0.0010 7.37 0.194 0.0227 <0.00050 1.09 0.000062
GW11-2a 28/09/16 0.0066 0.19 0.00029 0.00966 0.00301 1.68 0.000304
GW11-2b 28/09/16 <0.0010 18.7 1.77 0.000874 <0.00050 1.53 0.000122
GW12-1a 28/09/16 0.0062 5.2 0.502 0.0215 <0.00050 0.433 0.000118
GW12-1b 28/09/16 0.0038 8.08 0.00254 0.0301 <0.00050 0.545 0.00077
GW12-2a 12/07/16 0.0033 1.33 0.0256 0.0407 <0.00050 0.109 <0.000050
18/08/16 0.0033 1.16 0.0438 0.0388 <0.00050 0.099 <0.000050
15/09/16 0.0036 1.23 0.0313 0.0393 <0.00050 0.223 <0.000050
GW12-2b 12/07/16 0.0036 28 <0.00010 0.0219 <0.00050 0.789 0.0111
17/08/16 0.0037 26.7 0.00025 0.021 <0.00050 0.739 0.0112
15/09/16 0.0041 24.9 0.00024 0.021 <0.00050 0.807 0.0102
GW12-3a 26/09/16 0.0035 40.4 0.00945 0.0057 0.0007 1.71 0.0853
GW12-3b 26/09/16 0.0015 6.72 0.00044 0.0345 <0.00050 1.47 0.00105
GW12-4a 28/09/16 0.0014 12.2 0.832 0.0638 0.0018 1.81 0.000052
GW12-4b 28/09/16 <0.0010 9.37 0.133 0.0358 <0.00050 1.12 <0.000050
GW12-5a 26/09/16 0.0028 5.71 0.0598 0.012 <0.00050 0.441 <0.000050
GW14-1 16/08/16 0.0015 8.84 0.0961 0.000225 <0.00050 1.71 <0.000050
Printed Date: 24/10/2016
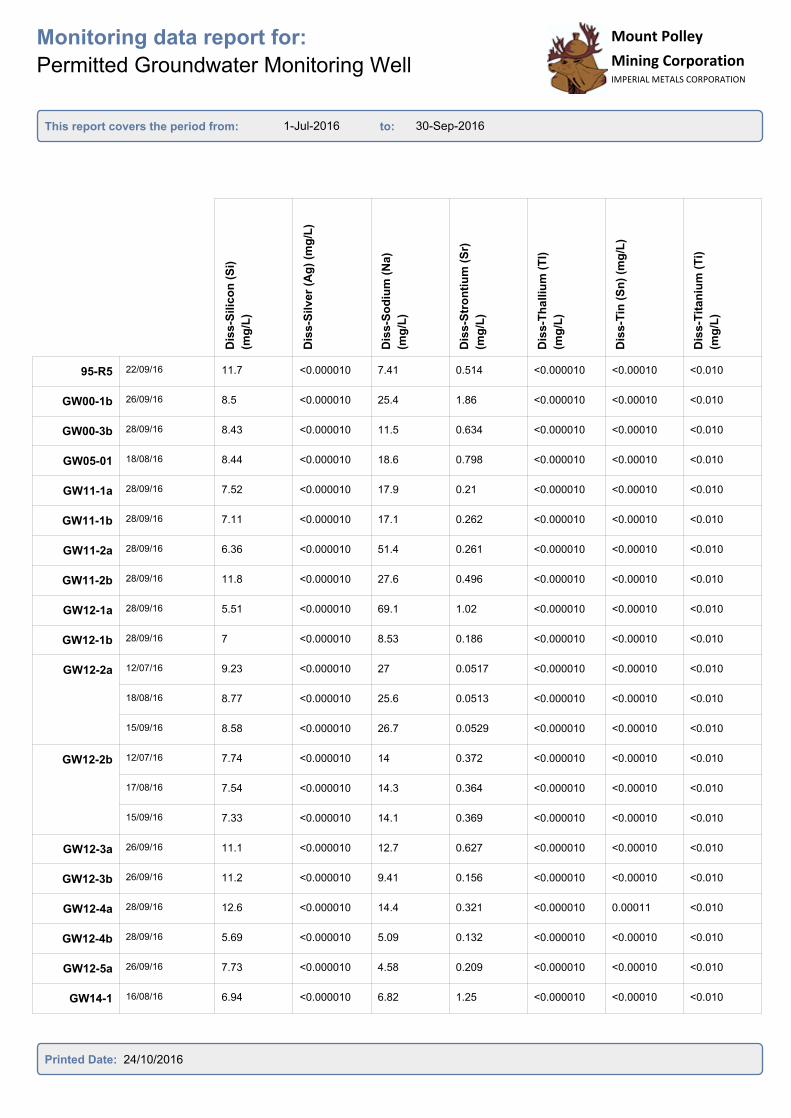
1-Jul-2016 30-Sep-2016
Monitoring data report for:
Permitted Groundwater Monitoring Well
This report covers the period from: to:
Mount Polley
Mining CorporationIMPERIAL METALS CORPORATION
Mount Polley
Mining CorporationIMPERIAL METALS CORPORATION
Dis
s-S
ilic
on
(S
i)
(mg
/L)
Dis
s-S
ilv
er
(Ag
) (m
g/L
)
Dis
s-S
od
ium
(N
a)
(mg
/L)
Dis
s-S
tro
nti
um
(S
r)
(mg
/L)
Dis
s-T
halliu
m (
Tl)
(mg
/L)
Dis
s-T
in (
Sn
) (m
g/L
)
Dis
s-T
itan
ium
(T
i)
(mg
/L)
95-R5 22/09/16 11.7 <0.000010 7.41 0.514 <0.000010 <0.00010 <0.010
GW00-1b 26/09/16 8.5 <0.000010 25.4 1.86 <0.000010 <0.00010 <0.010
GW00-3b 28/09/16 8.43 <0.000010 11.5 0.634 <0.000010 <0.00010 <0.010
GW05-01 18/08/16 8.44 <0.000010 18.6 0.798 <0.000010 <0.00010 <0.010
GW11-1a 28/09/16 7.52 <0.000010 17.9 0.21 <0.000010 <0.00010 <0.010
GW11-1b 28/09/16 7.11 <0.000010 17.1 0.262 <0.000010 <0.00010 <0.010
GW11-2a 28/09/16 6.36 <0.000010 51.4 0.261 <0.000010 <0.00010 <0.010
GW11-2b 28/09/16 11.8 <0.000010 27.6 0.496 <0.000010 <0.00010 <0.010
GW12-1a 28/09/16 5.51 <0.000010 69.1 1.02 <0.000010 <0.00010 <0.010
GW12-1b 28/09/16 7 <0.000010 8.53 0.186 <0.000010 <0.00010 <0.010
GW12-2a 12/07/16 9.23 <0.000010 27 0.0517 <0.000010 <0.00010 <0.010
18/08/16 8.77 <0.000010 25.6 0.0513 <0.000010 <0.00010 <0.010
15/09/16 8.58 <0.000010 26.7 0.0529 <0.000010 <0.00010 <0.010
GW12-2b 12/07/16 7.74 <0.000010 14 0.372 <0.000010 <0.00010 <0.010
17/08/16 7.54 <0.000010 14.3 0.364 <0.000010 <0.00010 <0.010
15/09/16 7.33 <0.000010 14.1 0.369 <0.000010 <0.00010 <0.010
GW12-3a 26/09/16 11.1 <0.000010 12.7 0.627 <0.000010 <0.00010 <0.010
GW12-3b 26/09/16 11.2 <0.000010 9.41 0.156 <0.000010 <0.00010 <0.010
GW12-4a 28/09/16 12.6 <0.000010 14.4 0.321 <0.000010 0.00011 <0.010
GW12-4b 28/09/16 5.69 <0.000010 5.09 0.132 <0.000010 <0.00010 <0.010
GW12-5a 26/09/16 7.73 <0.000010 4.58 0.209 <0.000010 <0.00010 <0.010
GW14-1 16/08/16 6.94 <0.000010 6.82 1.25 <0.000010 <0.00010 <0.010
Printed Date: 24/10/2016
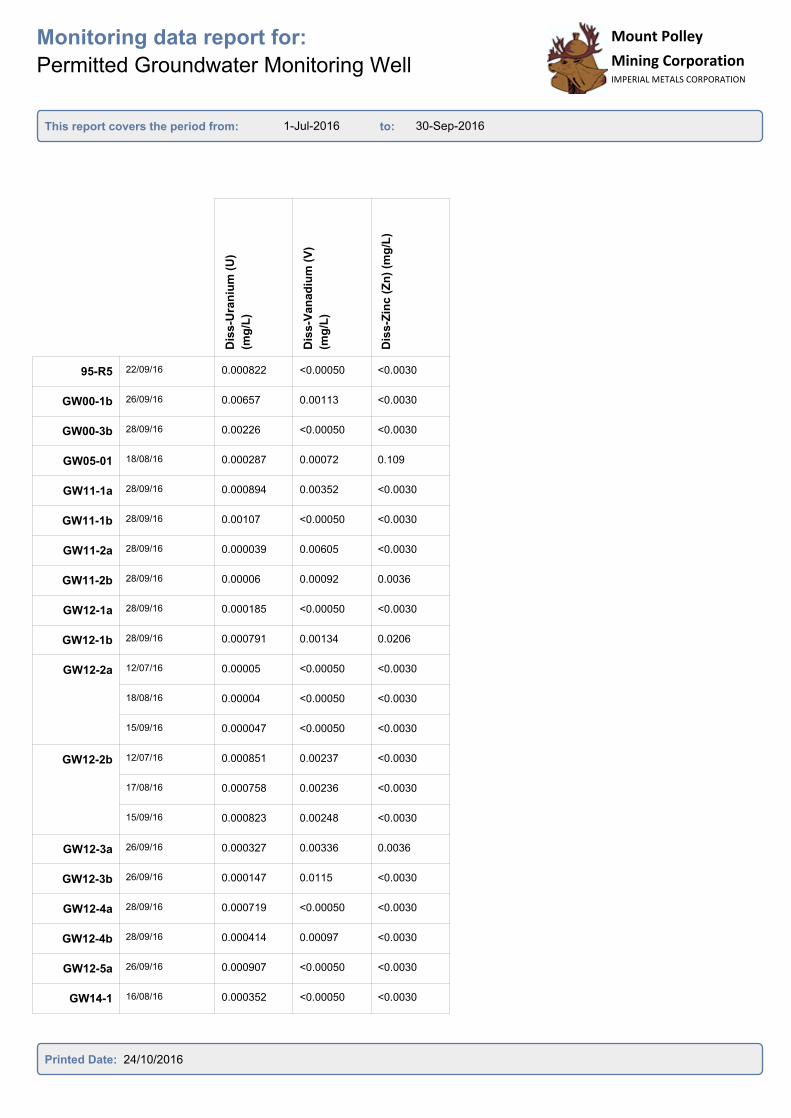
1-Jul-2016 30-Sep-2016
Monitoring data report for:
Permitted Groundwater Monitoring Well
This report covers the period from: to:
Mount Polley
Mining CorporationIMPERIAL METALS CORPORATION
Mount Polley
Mining CorporationIMPERIAL METALS CORPORATION
Dis
s-U
ran
ium
(U
)
(mg
/L)
Dis
s-V
an
ad
ium
(V
)
(mg
/L)
Dis
s-Z
inc (
Zn
) (m
g/L
)95-R5 22/09/16 0.000822 <0.00050 <0.0030
GW00-1b 26/09/16 0.00657 0.00113 <0.0030
GW00-3b 28/09/16 0.00226 <0.00050 <0.0030
GW05-01 18/08/16 0.000287 0.00072 0.109
GW11-1a 28/09/16 0.000894 0.00352 <0.0030
GW11-1b 28/09/16 0.00107 <0.00050 <0.0030
GW11-2a 28/09/16 0.000039 0.00605 <0.0030
GW11-2b 28/09/16 0.00006 0.00092 0.0036
GW12-1a 28/09/16 0.000185 <0.00050 <0.0030
GW12-1b 28/09/16 0.000791 0.00134 0.0206
GW12-2a 12/07/16 0.00005 <0.00050 <0.0030
18/08/16 0.00004 <0.00050 <0.0030
15/09/16 0.000047 <0.00050 <0.0030
GW12-2b 12/07/16 0.000851 0.00237 <0.0030
17/08/16 0.000758 0.00236 <0.0030
15/09/16 0.000823 0.00248 <0.0030
GW12-3a 26/09/16 0.000327 0.00336 0.0036
GW12-3b 26/09/16 0.000147 0.0115 <0.0030
GW12-4a 28/09/16 0.000719 <0.00050 <0.0030
GW12-4b 28/09/16 0.000414 0.00097 <0.0030
GW12-5a 26/09/16 0.000907 <0.00050 <0.0030
GW14-1 16/08/16 0.000352 <0.00050 <0.0030
Printed Date: 24/10/2016
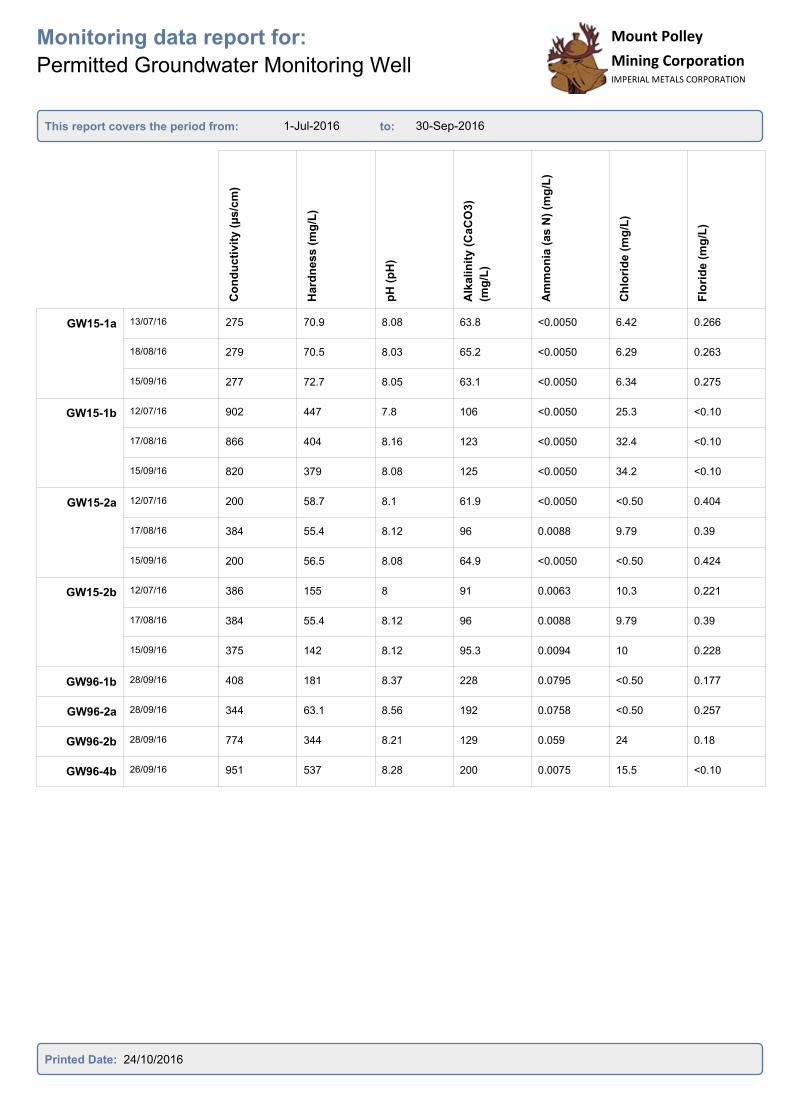
1-Jul-2016 30-Sep-2016
Monitoring data report for:
Permitted Groundwater Monitoring Well
This report covers the period from: to:
Mount Polley
Mining CorporationIMPERIAL METALS CORPORATION
Co
nd
ucti
vit
y (
µs/c
m)
Hard
ne
ss (
mg
/L)
pH
(p
H)
Alk
alin
ity
(C
aC
O3)
(mg
/L)
Am
mo
nia
(a
s N
) (m
g/L
)
Ch
lori
de (
mg
/L)
Flo
rid
e (
mg
/L)
GW15-1a 13/07/16 275 70.9 8.08 63.8 <0.0050 6.42 0.266
18/08/16 279 70.5 8.03 65.2 <0.0050 6.29 0.263
15/09/16 277 72.7 8.05 63.1 <0.0050 6.34 0.275
GW15-1b 12/07/16 902 447 7.8 106 <0.0050 25.3 <0.10
17/08/16 866 404 8.16 123 <0.0050 32.4 <0.10
15/09/16 820 379 8.08 125 <0.0050 34.2 <0.10
GW15-2a 12/07/16 200 58.7 8.1 61.9 <0.0050 <0.50 0.404
17/08/16 384 55.4 8.12 96 0.0088 9.79 0.39
15/09/16 200 56.5 8.08 64.9 <0.0050 <0.50 0.424
GW15-2b 12/07/16 386 155 8 91 0.0063 10.3 0.221
17/08/16 384 55.4 8.12 96 0.0088 9.79 0.39
15/09/16 375 142 8.12 95.3 0.0094 10 0.228
GW96-1b 28/09/16 408 181 8.37 228 0.0795 <0.50 0.177
GW96-2a 28/09/16 344 63.1 8.56 192 0.0758 <0.50 0.257
GW96-2b 28/09/16 774 344 8.21 129 0.059 24 0.18
GW96-4b 26/09/16 951 537 8.28 200 0.0075 15.5 <0.10
Printed Date: 24/10/2016
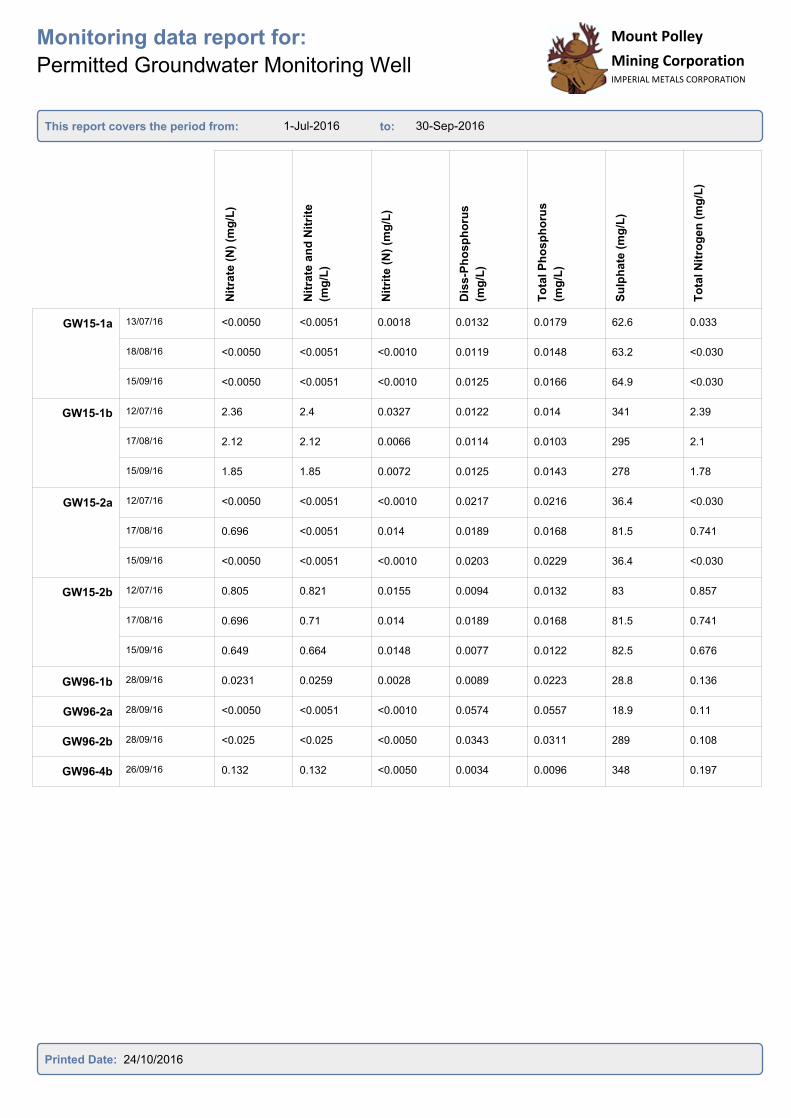
1-Jul-2016 30-Sep-2016
Monitoring data report for:
Permitted Groundwater Monitoring Well
This report covers the period from: to:
Mount Polley
Mining CorporationIMPERIAL METALS CORPORATION
Mount Polley
Mining CorporationIMPERIAL METALS CORPORATION
Nit
rate
(N
) (m
g/L
)
Nit
rate
an
d N
itri
te
(mg
/L)
Nit
rite
(N
) (m
g/L
)
Dis
s-P
ho
sp
ho
rus
(mg
/L)
To
tal P
ho
sp
ho
rus
(mg
/L)
Su
lph
ate
(m
g/L
)
To
tal N
itro
ge
n (
mg
/L)
GW15-1a 13/07/16 <0.0050 <0.0051 0.0018 0.0132 0.0179 62.6 0.033
18/08/16 <0.0050 <0.0051 <0.0010 0.0119 0.0148 63.2 <0.030
15/09/16 <0.0050 <0.0051 <0.0010 0.0125 0.0166 64.9 <0.030
GW15-1b 12/07/16 2.36 2.4 0.0327 0.0122 0.014 341 2.39
17/08/16 2.12 2.12 0.0066 0.0114 0.0103 295 2.1
15/09/16 1.85 1.85 0.0072 0.0125 0.0143 278 1.78
GW15-2a 12/07/16 <0.0050 <0.0051 <0.0010 0.0217 0.0216 36.4 <0.030
17/08/16 0.696 <0.0051 0.014 0.0189 0.0168 81.5 0.741
15/09/16 <0.0050 <0.0051 <0.0010 0.0203 0.0229 36.4 <0.030
GW15-2b 12/07/16 0.805 0.821 0.0155 0.0094 0.0132 83 0.857
17/08/16 0.696 0.71 0.014 0.0189 0.0168 81.5 0.741
15/09/16 0.649 0.664 0.0148 0.0077 0.0122 82.5 0.676
GW96-1b 28/09/16 0.0231 0.0259 0.0028 0.0089 0.0223 28.8 0.136
GW96-2a 28/09/16 <0.0050 <0.0051 <0.0010 0.0574 0.0557 18.9 0.11
GW96-2b 28/09/16 <0.025 <0.025 <0.0050 0.0343 0.0311 289 0.108
GW96-4b 26/09/16 0.132 0.132 <0.0050 0.0034 0.0096 348 0.197
Printed Date: 24/10/2016
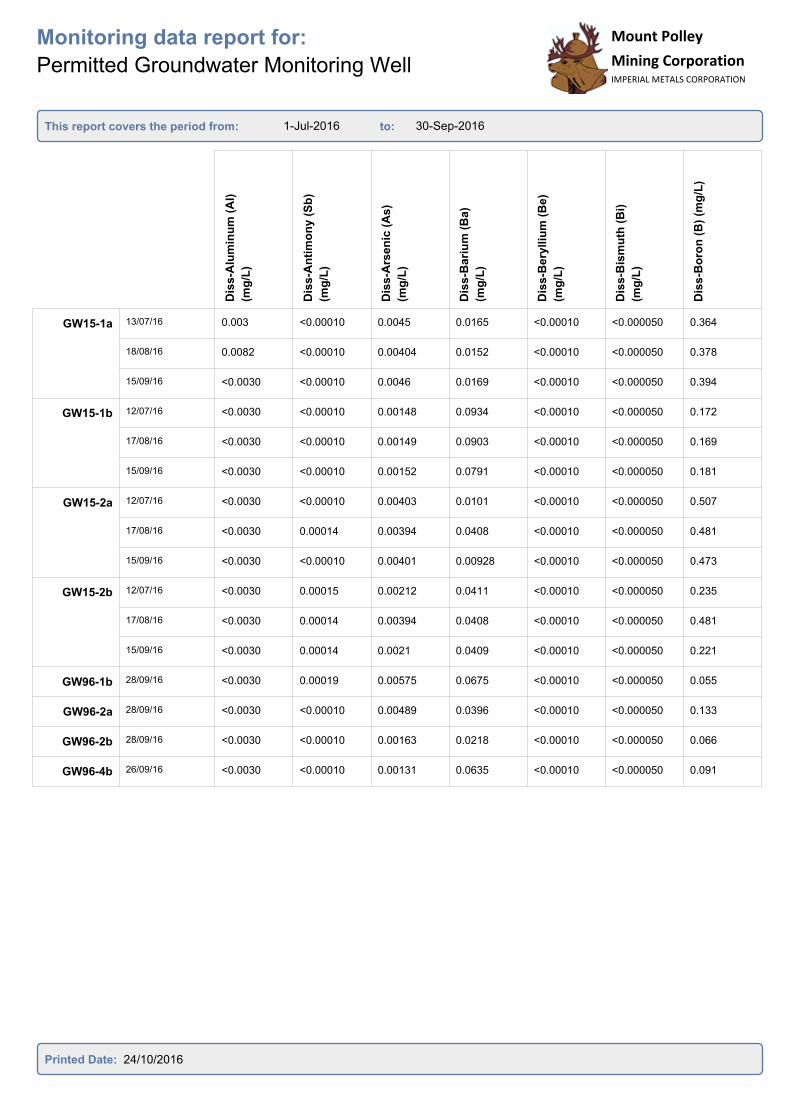
1-Jul-2016 30-Sep-2016
Monitoring data report for:
Permitted Groundwater Monitoring Well
This report covers the period from: to:
Mount Polley
Mining CorporationIMPERIAL METALS CORPORATION
Mount Polley
Mining CorporationIMPERIAL METALS CORPORATION
Dis
s-A
lum
inu
m (
Al)
(mg
/L)
Dis
s-A
nti
mo
ny
(S
b)
(mg
/L)
Dis
s-A
rsen
ic (
As
)
(mg
/L)
Dis
s-B
ari
um
(B
a)
(mg
/L)
Dis
s-B
ery
lliu
m (
Be)
(mg
/L)
Dis
s-B
ism
uth
(B
i)
(mg
/L)
Dis
s-B
oro
n (
B)
(mg
/L)
GW15-1a 13/07/16 0.003 <0.00010 0.0045 0.0165 <0.00010 <0.000050 0.364
18/08/16 0.0082 <0.00010 0.00404 0.0152 <0.00010 <0.000050 0.378
15/09/16 <0.0030 <0.00010 0.0046 0.0169 <0.00010 <0.000050 0.394
GW15-1b 12/07/16 <0.0030 <0.00010 0.00148 0.0934 <0.00010 <0.000050 0.172
17/08/16 <0.0030 <0.00010 0.00149 0.0903 <0.00010 <0.000050 0.169
15/09/16 <0.0030 <0.00010 0.00152 0.0791 <0.00010 <0.000050 0.181
GW15-2a 12/07/16 <0.0030 <0.00010 0.00403 0.0101 <0.00010 <0.000050 0.507
17/08/16 <0.0030 0.00014 0.00394 0.0408 <0.00010 <0.000050 0.481
15/09/16 <0.0030 <0.00010 0.00401 0.00928 <0.00010 <0.000050 0.473
GW15-2b 12/07/16 <0.0030 0.00015 0.00212 0.0411 <0.00010 <0.000050 0.235
17/08/16 <0.0030 0.00014 0.00394 0.0408 <0.00010 <0.000050 0.481
15/09/16 <0.0030 0.00014 0.0021 0.0409 <0.00010 <0.000050 0.221
GW96-1b 28/09/16 <0.0030 0.00019 0.00575 0.0675 <0.00010 <0.000050 0.055
GW96-2a 28/09/16 <0.0030 <0.00010 0.00489 0.0396 <0.00010 <0.000050 0.133
GW96-2b 28/09/16 <0.0030 <0.00010 0.00163 0.0218 <0.00010 <0.000050 0.066
GW96-4b 26/09/16 <0.0030 <0.00010 0.00131 0.0635 <0.00010 <0.000050 0.091
Printed Date: 24/10/2016
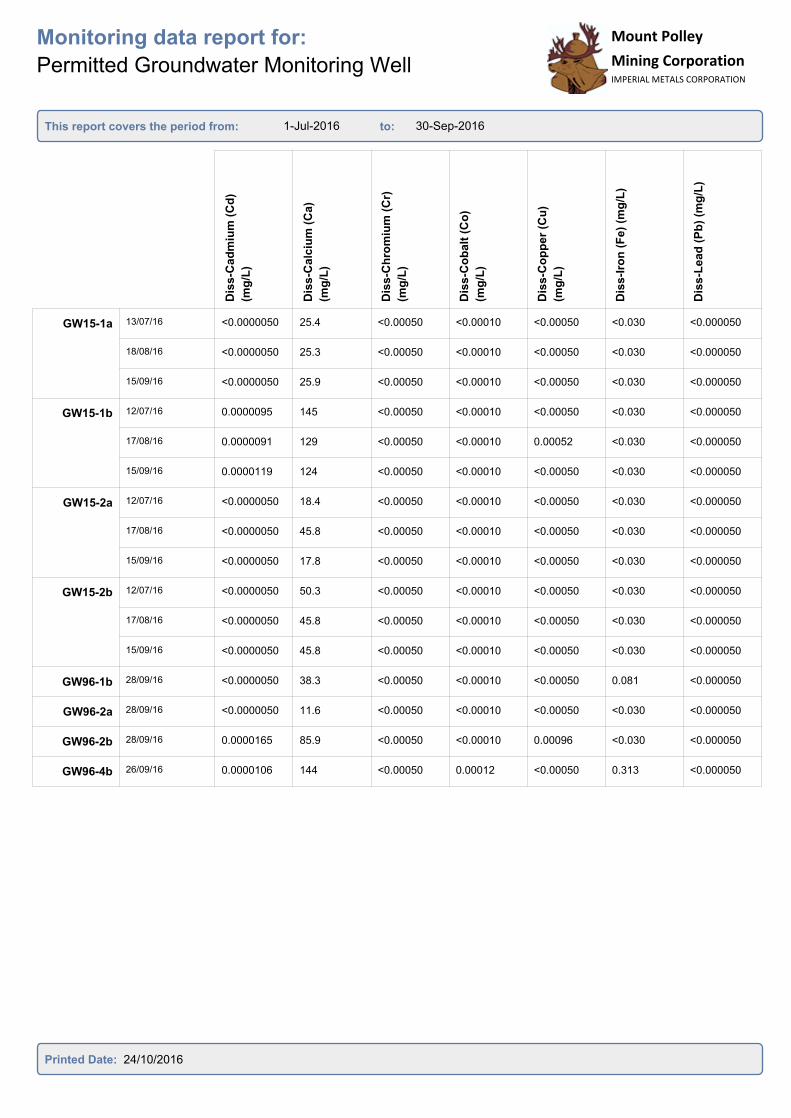
1-Jul-2016 30-Sep-2016
Monitoring data report for:
Permitted Groundwater Monitoring Well
This report covers the period from: to:
Mount Polley
Mining CorporationIMPERIAL METALS CORPORATION
Mount Polley
Mining CorporationIMPERIAL METALS CORPORATION
Dis
s-C
ad
miu
m (
Cd
)
(mg
/L)
Dis
s-C
alc
ium
(C
a)
(mg
/L)
Dis
s-C
hro
miu
m (
Cr)
(mg
/L)
Dis
s-C
ob
alt
(C
o)
(mg
/L)
Dis
s-C
op
pe
r (C
u)
(mg
/L)
Dis
s-I
ron
(F
e)
(mg
/L)
Dis
s-L
ead
(P
b)
(mg
/L)
GW15-1a 13/07/16 <0.0000050 25.4 <0.00050 <0.00010 <0.00050 <0.030 <0.000050
18/08/16 <0.0000050 25.3 <0.00050 <0.00010 <0.00050 <0.030 <0.000050
15/09/16 <0.0000050 25.9 <0.00050 <0.00010 <0.00050 <0.030 <0.000050
GW15-1b 12/07/16 0.0000095 145 <0.00050 <0.00010 <0.00050 <0.030 <0.000050
17/08/16 0.0000091 129 <0.00050 <0.00010 0.00052 <0.030 <0.000050
15/09/16 0.0000119 124 <0.00050 <0.00010 <0.00050 <0.030 <0.000050
GW15-2a 12/07/16 <0.0000050 18.4 <0.00050 <0.00010 <0.00050 <0.030 <0.000050
17/08/16 <0.0000050 45.8 <0.00050 <0.00010 <0.00050 <0.030 <0.000050
15/09/16 <0.0000050 17.8 <0.00050 <0.00010 <0.00050 <0.030 <0.000050
GW15-2b 12/07/16 <0.0000050 50.3 <0.00050 <0.00010 <0.00050 <0.030 <0.000050
17/08/16 <0.0000050 45.8 <0.00050 <0.00010 <0.00050 <0.030 <0.000050
15/09/16 <0.0000050 45.8 <0.00050 <0.00010 <0.00050 <0.030 <0.000050
GW96-1b 28/09/16 <0.0000050 38.3 <0.00050 <0.00010 <0.00050 0.081 <0.000050
GW96-2a 28/09/16 <0.0000050 11.6 <0.00050 <0.00010 <0.00050 <0.030 <0.000050
GW96-2b 28/09/16 0.0000165 85.9 <0.00050 <0.00010 0.00096 <0.030 <0.000050
GW96-4b 26/09/16 0.0000106 144 <0.00050 0.00012 <0.00050 0.313 <0.000050
Printed Date: 24/10/2016
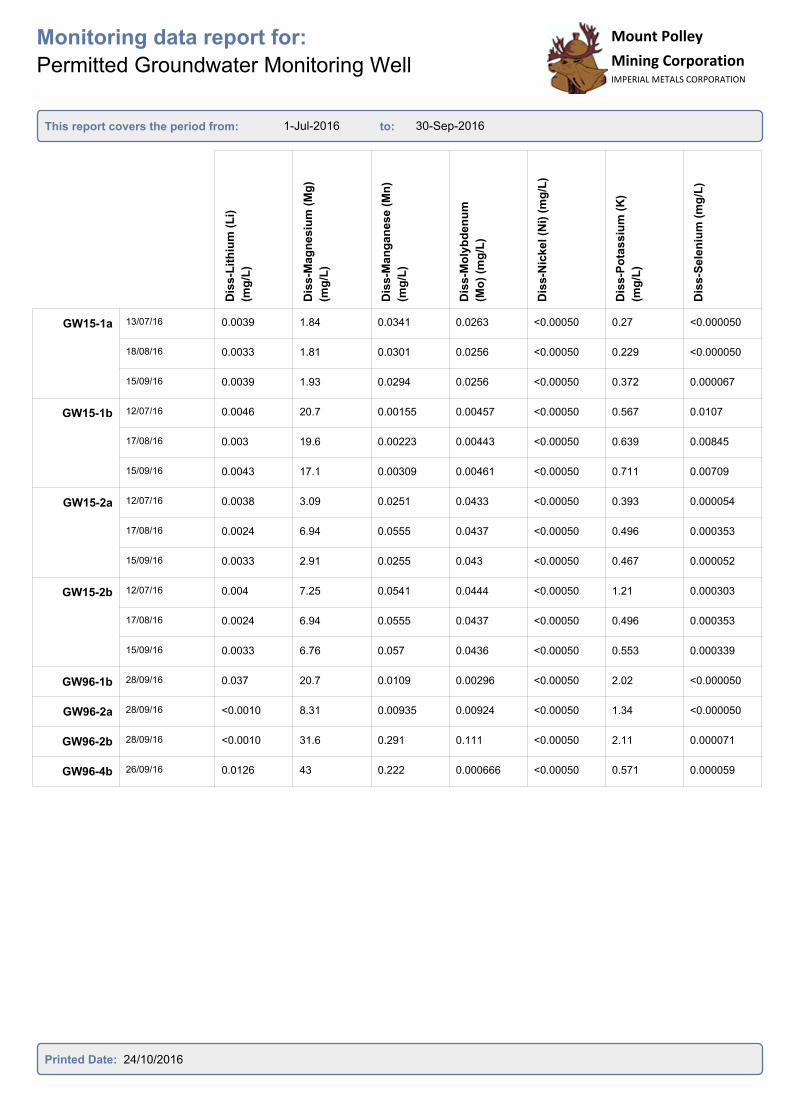
1-Jul-2016 30-Sep-2016
Monitoring data report for:
Permitted Groundwater Monitoring Well
This report covers the period from: to:
Mount Polley
Mining CorporationIMPERIAL METALS CORPORATION
Mount Polley
Mining CorporationIMPERIAL METALS CORPORATION
Dis
s-L
ith
ium
(L
i)
(mg
/L)
Dis
s-M
ag
nesiu
m (
Mg
)
(mg
/L)
Dis
s-M
an
gan
ese
(M
n)
(mg
/L)
Dis
s-M
oly
bd
en
um
(Mo
) (m
g/L
)
Dis
s-N
ickel (N
i) (
mg
/L)
Dis
s-P
ota
ssiu
m (
K)
(mg
/L)
Dis
s-S
ele
niu
m (
mg
/L)
GW15-1a 13/07/16 0.0039 1.84 0.0341 0.0263 <0.00050 0.27 <0.000050
18/08/16 0.0033 1.81 0.0301 0.0256 <0.00050 0.229 <0.000050
15/09/16 0.0039 1.93 0.0294 0.0256 <0.00050 0.372 0.000067
GW15-1b 12/07/16 0.0046 20.7 0.00155 0.00457 <0.00050 0.567 0.0107
17/08/16 0.003 19.6 0.00223 0.00443 <0.00050 0.639 0.00845
15/09/16 0.0043 17.1 0.00309 0.00461 <0.00050 0.711 0.00709
GW15-2a 12/07/16 0.0038 3.09 0.0251 0.0433 <0.00050 0.393 0.000054
17/08/16 0.0024 6.94 0.0555 0.0437 <0.00050 0.496 0.000353
15/09/16 0.0033 2.91 0.0255 0.043 <0.00050 0.467 0.000052
GW15-2b 12/07/16 0.004 7.25 0.0541 0.0444 <0.00050 1.21 0.000303
17/08/16 0.0024 6.94 0.0555 0.0437 <0.00050 0.496 0.000353
15/09/16 0.0033 6.76 0.057 0.0436 <0.00050 0.553 0.000339
GW96-1b 28/09/16 0.037 20.7 0.0109 0.00296 <0.00050 2.02 <0.000050
GW96-2a 28/09/16 <0.0010 8.31 0.00935 0.00924 <0.00050 1.34 <0.000050
GW96-2b 28/09/16 <0.0010 31.6 0.291 0.111 <0.00050 2.11 0.000071
GW96-4b 26/09/16 0.0126 43 0.222 0.000666 <0.00050 0.571 0.000059
Printed Date: 24/10/2016

1-Jul-2016 30-Sep-2016
Monitoring data report for:
Permitted Groundwater Monitoring Well
This report covers the period from: to:
Mount Polley
Mining CorporationIMPERIAL METALS CORPORATION
Mount Polley
Mining CorporationIMPERIAL METALS CORPORATION
Dis
s-S
ilic
on
(S
i)
(mg
/L)
Dis
s-S
ilv
er
(Ag
) (m
g/L
)
Dis
s-S
od
ium
(N
a)
(mg
/L)
Dis
s-S
tro
nti
um
(S
r)
(mg
/L)
Dis
s-T
halliu
m (
Tl)
(mg
/L)
Dis
s-T
in (
Sn
) (m
g/L
)
Dis
s-T
itan
ium
(T
i)
(mg
/L)
GW15-1a 13/07/16 8.76 <0.000010 24.2 0.133 <0.000010 <0.00010 <0.010
18/08/16 9.22 <0.000010 25.8 0.134 <0.000010 <0.00010 <0.010
15/09/16 9.23 <0.000010 26.9 0.135 <0.000010 <0.00010 <0.010
GW15-1b 12/07/16 8.22 <0.000010 24.6 0.406 <0.000010 <0.00010 <0.010
17/08/16 8.18 <0.000010 25.6 0.367 <0.000010 <0.00010 <0.010
15/09/16 7.84 <0.000010 24 0.359 <0.000010 <0.00010 <0.010
GW15-2a 12/07/16 8.5 <0.000010 18.5 0.0391 <0.000010 <0.00010 <0.010
17/08/16 8.43 <0.000010 19.9 0.162 <0.000010 <0.00010 <0.010
15/09/16 8.14 <0.000010 18.3 0.0384 <0.000010 <0.00010 <0.010
GW15-2b 12/07/16 6.93 <0.000010 19.8 0.167 <0.000010 <0.00010 <0.010
17/08/16 8.43 <0.000010 19.9 0.162 <0.000010 <0.00010 <0.010
15/09/16 6.64 <0.000010 20 0.166 <0.000010 <0.00010 <0.010
GW96-1b 28/09/16 3.15 <0.000010 25 0.382 <0.000010 <0.00010 <0.010
GW96-2a 28/09/16 4.89 <0.000010 62.7 0.334 <0.000010 <0.00010 <0.010
GW96-2b 28/09/16 7.77 <0.000010 42.7 0.69 <0.000010 <0.00010 <0.010
GW96-4b 26/09/16 11.1 <0.000010 23 2.41 <0.000010 <0.00010 <0.010
Printed Date: 24/10/2016
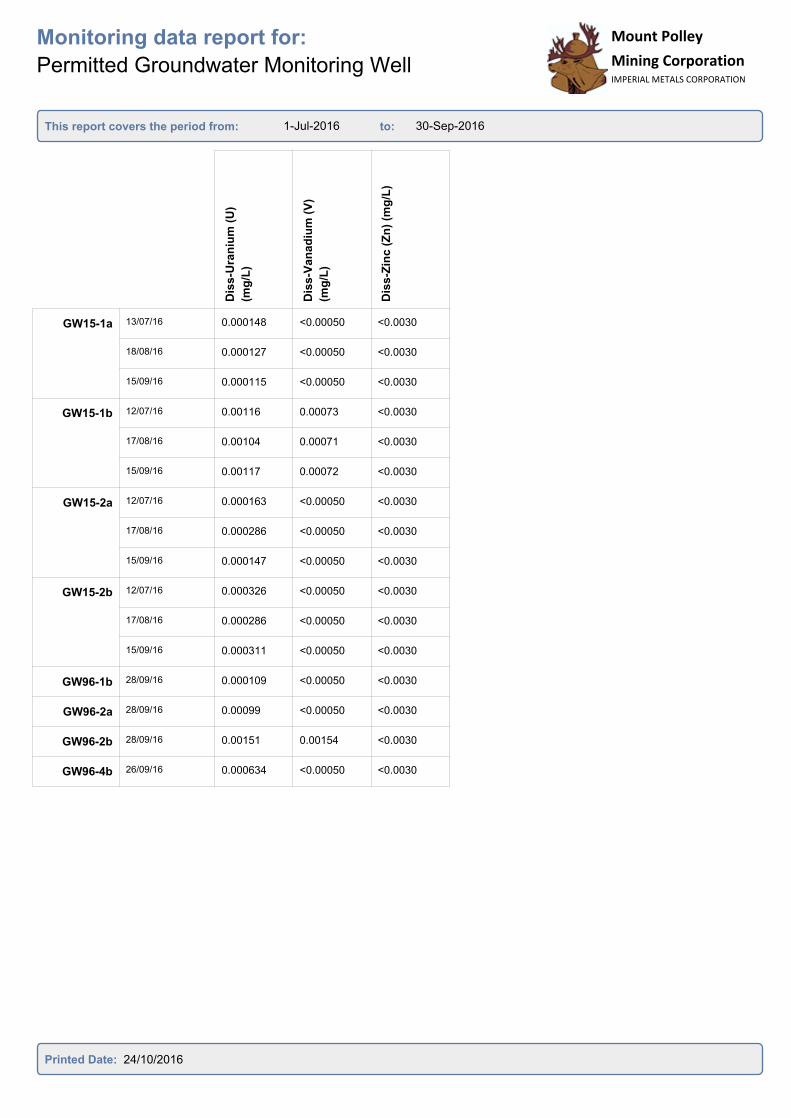
1-Jul-2016 30-Sep-2016
Monitoring data report for:
Permitted Groundwater Monitoring Well
This report covers the period from: to:
Mount Polley
Mining CorporationIMPERIAL METALS CORPORATION
Mount Polley
Mining CorporationIMPERIAL METALS CORPORATION
Dis
s-U
ran
ium
(U
)
(mg
/L)
Dis
s-V
an
ad
ium
(V
)
(mg
/L)
Dis
s-Z
inc (
Zn
) (m
g/L
)
GW15-1a 13/07/16 0.000148 <0.00050 <0.0030
18/08/16 0.000127 <0.00050 <0.0030
15/09/16 0.000115 <0.00050 <0.0030
GW15-1b 12/07/16 0.00116 0.00073 <0.0030
17/08/16 0.00104 0.00071 <0.0030
15/09/16 0.00117 0.00072 <0.0030
GW15-2a 12/07/16 0.000163 <0.00050 <0.0030
17/08/16 0.000286 <0.00050 <0.0030
15/09/16 0.000147 <0.00050 <0.0030
GW15-2b 12/07/16 0.000326 <0.00050 <0.0030
17/08/16 0.000286 <0.00050 <0.0030
15/09/16 0.000311 <0.00050 <0.0030
GW96-1b 28/09/16 0.000109 <0.00050 <0.0030
GW96-2a 28/09/16 0.00099 <0.00050 <0.0030
GW96-2b 28/09/16 0.00151 0.00154 <0.0030
GW96-4b 26/09/16 0.000634 <0.00050 <0.0030
Printed Date: 24/10/2016

Mount Polley Mining Corporation Permit 11678 – Third Quarter 2016 Report
Appendix 3
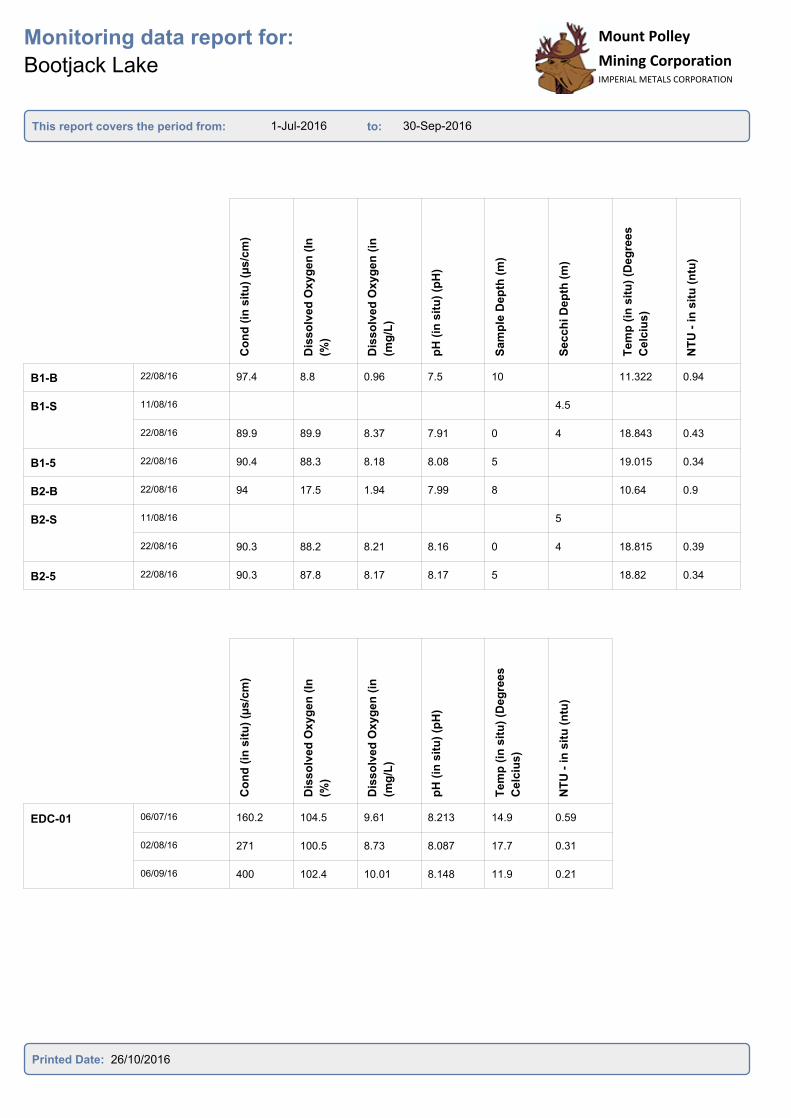
1-Jul-2016 30-Sep-2016
Monitoring data report for:
Bootjack Lake
This report covers the period from: to:
Mount Polley
Mining CorporationIMPERIAL METALS CORPORATION
Co
nd
(in
sit
u)
(µs
/cm
)
Dis
so
lved
Oxy
ge
n (
In
(%)
Dis
so
lved
Oxy
ge
n (
in
(mg
/L)
pH
(in
sit
u)
(pH
)
Sam
ple
De
pth
(m
)
Secc
hi D
ep
th (
m)
Tem
p (
in s
itu
) (D
eg
rees
Celc
ius
)
NT
U -
in
sit
u (
ntu
)
B1-B 22/08/16 97.4 8.8 0.96 7.5 10 11.322 0.94
B1-S 11/08/16 4.5
22/08/16 89.9 89.9 8.37 7.91 0 4 18.843 0.43
B1-5 22/08/16 90.4 88.3 8.18 8.08 5 19.015 0.34
B2-B 22/08/16 94 17.5 1.94 7.99 8 10.64 0.9
B2-S 11/08/16 5
22/08/16 90.3 88.2 8.21 8.16 0 4 18.815 0.39
B2-5 22/08/16 90.3 87.8 8.17 8.17 5 18.82 0.34
Co
nd
(in
sit
u)
(µs/c
m)
Dis
so
lved
Oxyg
en
(In
(%)
Dis
so
lved
Oxyg
en
(in
(mg
/L)
pH
(in
sit
u)
(pH
)
Tem
p (
in s
itu
) (D
eg
rees
Celc
ius)
NT
U -
in
sit
u (
ntu
)
EDC-01 06/07/16 160.2 104.5 9.61 8.213 14.9 0.59
02/08/16 271 100.5 8.73 8.087 17.7 0.31
06/09/16 400 102.4 10.01 8.148 11.9 0.21
Printed Date: 26/10/2016

1-Jul-2016 30-Sep-2016
Monitoring data report for:
Effluent Water Quality Site
This report covers the period from: to:
Mount Polley
Mining CorporationIMPERIAL METALS CORPORATION
Co
nd
(in
sit
u)
(µs
/cm
)
Dis
so
lved
Oxy
ge
n (
In
(%)
Dis
so
lved
Oxy
ge
n (
in
(mg
/L)
pH
(in
sit
u)
(pH
)
Tem
p (
in s
itu
) (D
eg
rees
Celc
ius
)
NT
U -
in
sit
u (
ntu
)
E11 07/07/16 1135 7.9 16.7 1.98
18/08/16 1232 8.1 18.5 2.43
01/09/16 1232 8.101 16 2.45
E11a 06/07/16 1221 8.262 15.6 0.74
13/07/16 1213 8.155 16.4 0.7
18/07/16 1177 8.089 17.8 0.55
25/07/16 1202 8.212 17.2 0.71
02/08/16 1229 8.217 17.6 0.7
10/08/16 1225 8.084 19.2 0.22
17/08/16 1237 8.098 18.7 0.3
23/08/16 1240 8.255 17.1 0.09
30/08/16 1236 8.144 14.8 0.47
06/09/16 1180 104.9 9.08 8.078 17 0.14
13/09/16 1226 8.062 14.1 0.35
27/09/16 1227 7.894 14.1 0.2
E19 06/07/16 1216 8.237 16.3 0.62
13/07/16 12.5 8.26 16.8 0.91
25/07/16 1206 8.154 18 0.53
02/08/16 1224 8.196 18.2 0.79
10/08/16 1225 8.139 19.1 0.53
17/08/16 1238 8.098 19.3 0.17
23/08/16 1239 8.164 17.4 1.98
30/08/16 1220 8.217 16.8 1.43
Printed Date: 26/10/2016
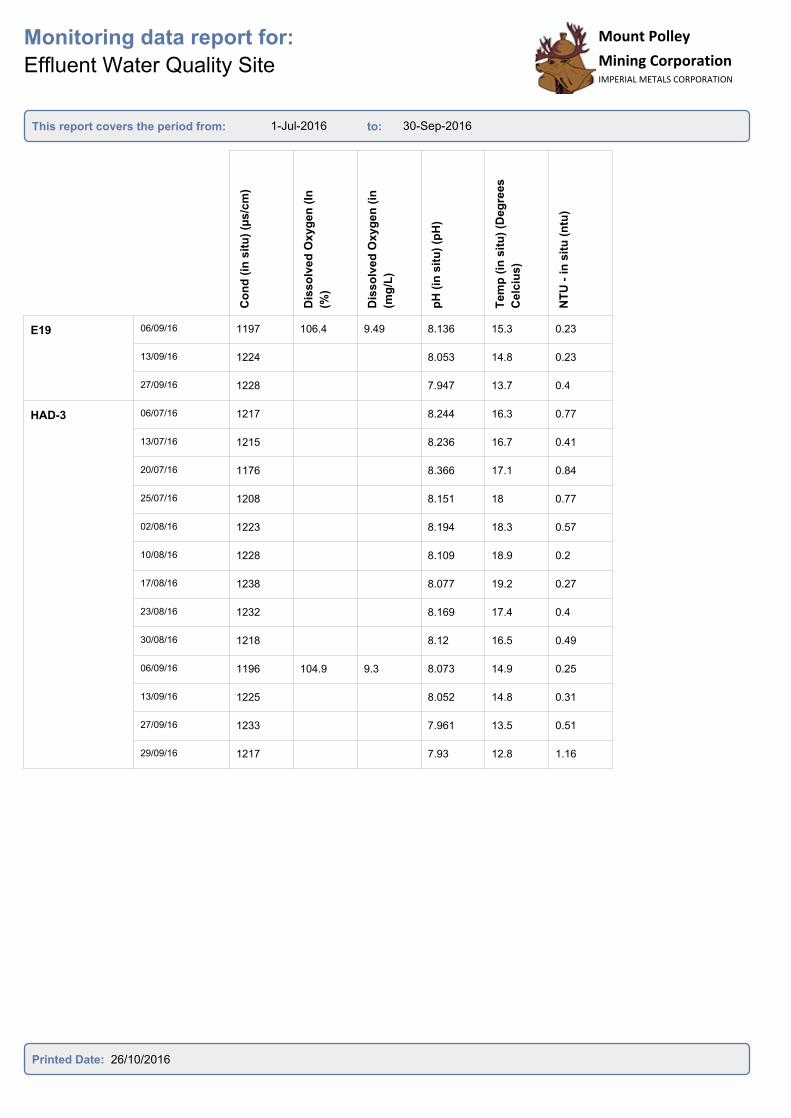
1-Jul-2016 30-Sep-2016
Monitoring data report for:
Effluent Water Quality Site
This report covers the period from: to:
Mount Polley
Mining CorporationIMPERIAL METALS CORPORATION
Co
nd
(in
sit
u)
(µs
/cm
)
Dis
so
lved
Oxy
ge
n (
In
(%)
Dis
so
lved
Oxy
ge
n (
in
(mg
/L)
pH
(in
sit
u)
(pH
)
Tem
p (
in s
itu
) (D
eg
rees
Celc
ius)
NT
U -
in
sit
u (
ntu
)
E19 06/09/16 1197 106.4 9.49 8.136 15.3 0.23
13/09/16 1224 8.053 14.8 0.23
27/09/16 1228 7.947 13.7 0.4
HAD-3 06/07/16 1217 8.244 16.3 0.77
13/07/16 1215 8.236 16.7 0.41
20/07/16 1176 8.366 17.1 0.84
25/07/16 1208 8.151 18 0.77
02/08/16 1223 8.194 18.3 0.57
10/08/16 1228 8.109 18.9 0.2
17/08/16 1238 8.077 19.2 0.27
23/08/16 1232 8.169 17.4 0.4
30/08/16 1218 8.12 16.5 0.49
06/09/16 1196 104.9 9.3 8.073 14.9 0.25
13/09/16 1225 8.052 14.8 0.31
27/09/16 1233 7.961 13.5 0.51
29/09/16 1217 7.93 12.8 1.16
Printed Date: 26/10/2016

1-Jul-2016 30-Sep-2016
Monitoring data report for:
Hazeltine Creek
This report covers the period from: to:
Mount Polley
Mining CorporationIMPERIAL METALS CORPORATION
Co
nd
(in
sit
u)
(µs
/cm
)
Dis
so
lved
Oxy
ge
n (
In
(%)
Dis
so
lved
Oxy
ge
n (
in
(mg
/L)
pH
(in
sit
u)
(pH
)
Tem
p (
in s
itu
) (D
eg
rees
Celc
ius
)
NT
U -
in
sit
u (
ntu
)
HAC-05a 06/07/16 989 106.9 9.08 8.318 17.8 4.59
13/07/16 1104 8.166 17.2 13.4
25/07/16 957 8.369 19.1 1.83
02/08/16 1151 109.7 9.14 8.327 18.8 0.86
10/08/16 1115 8.39 20 13.75
17/08/16 1134 8.264 20.1 58.2
23/08/16 1148 8.396 18.3 4.41
30/08/16 1133 8.272 17.1 5.34
06/09/16 1148 105.9 9.48 8.155 15.1 15.54
13/09/16 1149 8.25 15.8 14.3
27/09/16 1173 8.111 13.1 3.98
HAC-08 06/07/16 981 102.3 8.53 8.321 19.7 4.32
02/08/16 1032 101.5 8.58 8.275 19.2 1.92
06/09/16 1016 101.8 9.57 8.145 13.8 1.71
HAC-10 06/07/16 284 100.1 8.61 8.287 17.4 0.77
13/07/16 284 8.185 18.4 1.1
18/07/16 273 8.392 19.5 1.38
25/07/16 282 8.204 19.2 1.42
02/08/16 278 117.9 9.45 8.56 20.9 3.94
10/08/16 285 8.215 19.5 1.09
17/08/16 286 8.332 21.4
23/08/16 283 8.387 20 0.79
30/08/16 284 8.378 16.7 2.48
Printed Date: 26/10/2016
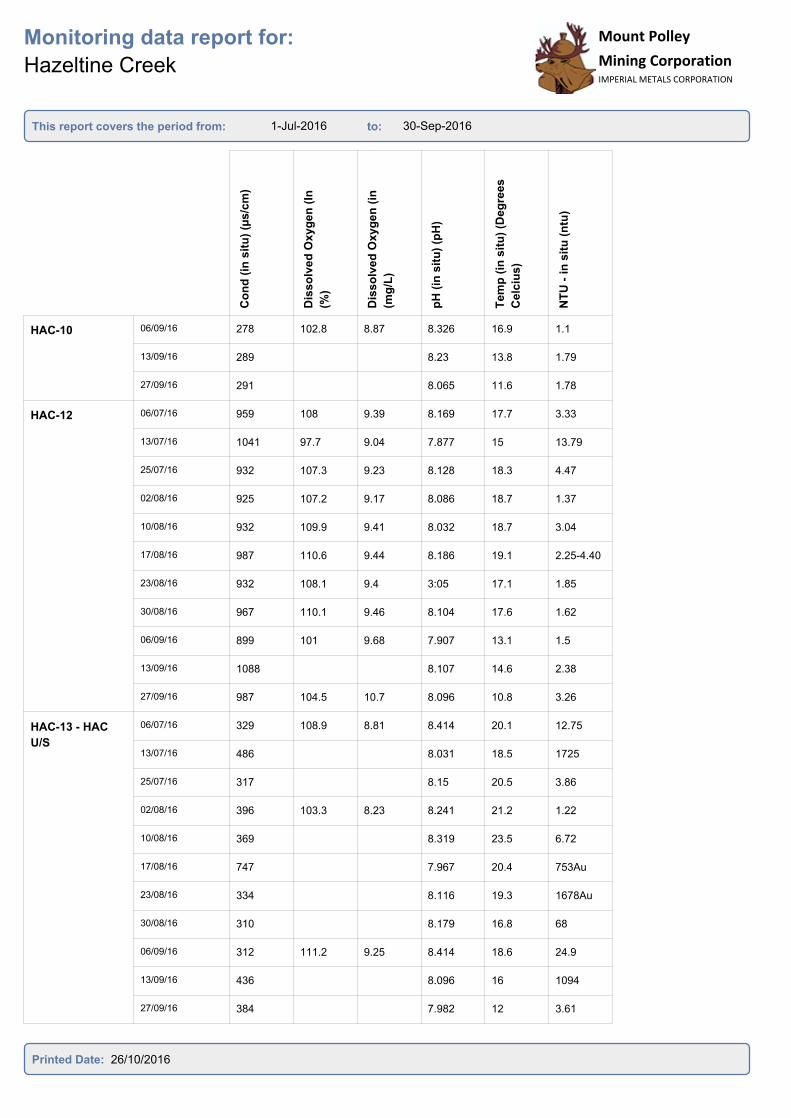
1-Jul-2016 30-Sep-2016
Monitoring data report for:
Hazeltine Creek
This report covers the period from: to:
Mount Polley
Mining CorporationIMPERIAL METALS CORPORATION
Co
nd
(in
sit
u)
(µs
/cm
)
Dis
so
lved
Oxy
ge
n (
In
(%)
Dis
so
lved
Oxy
ge
n (
in
(mg
/L)
pH
(in
sit
u)
(pH
)
Tem
p (
in s
itu
) (D
eg
rees
Celc
ius)
NT
U -
in
sit
u (
ntu
)
HAC-10 06/09/16 278 102.8 8.87 8.326 16.9 1.1
13/09/16 289 8.23 13.8 1.79
27/09/16 291 8.065 11.6 1.78
HAC-12 06/07/16 959 108 9.39 8.169 17.7 3.33
13/07/16 1041 97.7 9.04 7.877 15 13.79
25/07/16 932 107.3 9.23 8.128 18.3 4.47
02/08/16 925 107.2 9.17 8.086 18.7 1.37
10/08/16 932 109.9 9.41 8.032 18.7 3.04
17/08/16 987 110.6 9.44 8.186 19.1 2.25-4.40
23/08/16 932 108.1 9.4 3:05 17.1 1.85
30/08/16 967 110.1 9.46 8.104 17.6 1.62
06/09/16 899 101 9.68 7.907 13.1 1.5
13/09/16 1088 8.107 14.6 2.38
27/09/16 987 104.5 10.7 8.096 10.8 3.26
HAC-13 - HAC
U/S
06/07/16 329 108.9 8.81 8.414 20.1 12.75
13/07/16 486 8.031 18.5 1725
25/07/16 317 8.15 20.5 3.86
02/08/16 396 103.3 8.23 8.241 21.2 1.22
10/08/16 369 8.319 23.5 6.72
17/08/16 747 7.967 20.4 753Au
23/08/16 334 8.116 19.3 1678Au
30/08/16 310 8.179 16.8 68
06/09/16 312 111.2 9.25 8.414 18.6 24.9
13/09/16 436 8.096 16 1094
27/09/16 384 7.982 12 3.61
Printed Date: 26/10/2016

1-Jul-2016 30-Sep-2016
Monitoring data report for:
Permitted Surface Water Quality Site
This report covers the period from: to:
Mount Polley
Mining CorporationIMPERIAL METALS CORPORATION
Co
nd
(in
sit
u)
(µs
/cm
)
Dis
so
lved
Oxy
ge
n (
In
(%)
Dis
so
lved
Oxy
ge
n (
in
(mg
/L)
pH
(in
sit
u)
(pH
)
Tem
p (
in s
itu
) (D
eg
rees
Celc
ius
)
NT
U -
in
sit
u (
ntu
)
W1 07/07/16 116 7.68 14.1 1.7
04/08/16 121.9 7.782 15.7 2.38
08/09/16 400 7.787 9.4 12.64
W10 04/07/16 158.1 8.048 12.2 0.414
02/08/16 189.3 100.5 9.61 8.105 13.2 0.18
06/09/16 330 8.048 9.2 0.15
W12 14/07/16 166 7.6 12.8 0.86
26/07/16 196 7.677 17.1 0.87
04/08/16 221 7.37 17.7 1.96
06/08/16 218 7.385 15.7 0.81
21/08/16 267 7.532 14.2 1.07
31/08/16 234 7.677 15.1 1.31
16/09/16 212 7.868 9.5 0.64
W20 Creek 16/08/16 365 7.705 14.2 2.81
W4a 07/07/16 330 8.3 12.1 0.73
07/08/16 375 8.368 10.3 0.49
18/08/16 380 8.356 10.5 0.69
15/09/16 375 8.385 9.2 0.51
19/09/16 420 8.062 7.9 4.4
27/09/16 368 8.241 8.5 0.77
W5 05/07/16 107 8.1 10.4 4.87
13/07/16 103 8 11.9 5.12
07/08/16 201 8.047 12.9 0.54
Printed Date: 26/10/2016

1-Jul-2016 30-Sep-2016
Monitoring data report for:
Permitted Surface Water Quality Site
This report covers the period from: to:
Mount Polley
Mining CorporationIMPERIAL METALS CORPORATION
Co
nd
(in
sit
u)
(µs
/cm
)
Dis
so
lved
Oxy
ge
n (
In
(%)
Dis
so
lved
Oxy
ge
n (
in
(mg
/L)
pH
(in
sit
u)
(pH
)
Tem
p (
in s
itu
) (D
eg
rees
Celc
ius)
NT
U -
in
sit
u (
ntu
)
W5 01/09/16 263 7.872 11.1 0.4
19/09/16 105.2 7.598 8.3 6.48
27/09/16 123.2 7.589 7.1 2.58
W8 04/08/16 423 8.243 11.7 0.28
19/09/16 201 7.753 8.4 1.79
27/09/16 240 7.861 7.4 0.93
W8z 04/08/16 96.8 6.515 11.7 0.57
Printed Date: 26/10/2016

1-Jul-2016 30-Sep-2016
Monitoring data report for:
Polley Lake
This report covers the period from: to:
Mount Polley
Mining CorporationIMPERIAL METALS CORPORATION
Co
nd
(in
sit
u)
(µs
/cm
)
Dis
so
lved
Oxy
ge
n (
In
(%)
Dis
so
lved
Oxy
ge
n (
in
(mg
/L)
pH
(in
sit
u)
(pH
)
Sam
ple
De
pth
(m
)
Secc
hi D
ep
th (
m)
Tem
p (
in s
itu
) (D
eg
rees
Celc
ius
)
NT
U -
in
sit
u (
ntu
)
P1-B 04/07/16 268.9 46.9 5.89 7.51 28 5.616 0.22
23/08/16 268.9 27.2 3.4 7.26 26 5.796 0.87
07/09/16 269.3 20.7 2.58 7.27 28 5.835 1.34
P1-S 04/07/16 261.9 94.9 8.86 8.45 0 7.6 18.661 0
23/08/16 263.4 88.8 8.29 8.23 0 7.75 18.697 0.05
07/09/16 263.6 86.3 8.49 8.32 0 7.5 16.122 0.16
P1-10 04/07/16 266.7 71 8.33 7.99 10 8.291 0.03
23/08/16 282.2 63.4 7.21 8.01 10 9.668 0.19
07/09/16 266.8 58.6 6.34 7.95 10 11.782 0.19
P1-15 04/07/16 266.7 62.3 7.64 7.741 15 6.556 0.18
23/08/16 266 55.8 6.71 7.59 15 7.316 0.19
07/09/16 267.5 43.1 5.23 7.51 15 7.032 0.56
P1-20 04/07/16 268.8 50.1 6.29 7.59 20 5.655 0.21
23/08/16 268.5 33.2 4.15 7.39 20 5.883 0.62
07/09/16 269 24.5 3.06 7.35 20 5.867 0.86
P1-5 04/07/16 262 94.6 8.84 8.42 5 18.599 0
23/08/16 263.4 88.4 8.25 8.24 5 18.679 0.05
07/09/16 263.5 85.8 8.44 8.32 5 16.132 0.14
P2-B 04/07/16 268.7 48.1 6.03 7.57 27 5.653 0.21
23/08/16 268.9 27 3.38 7.33 27 5.781 0.98
07/09/16 269.2 20.9 2.61 7.34 27 5.844 1.67
P2-S 04/07/16 261.6 94.7 8.87 8.47 0 7 18.49 0
23/08/16 262.9 92.2 8.59 8.3 0 7.9 18.761 0.19
Printed Date: 26/10/2016

1-Jul-2016 30-Sep-2016
Monitoring data report for:
Polley Lake
This report covers the period from: to:
Mount Polley
Mining CorporationIMPERIAL METALS CORPORATION
Co
nd
(in
sit
u)
(µs
/cm
)
Dis
so
lved
Oxy
ge
n (
In
(%)
Dis
so
lved
Oxy
ge
n (
in
(mg
/L)
pH
(in
sit
u)
(pH
)
Sam
ple
Dep
th (
m)
Sec
ch
i D
ep
th (
m)
Tem
p (
in s
itu
) (D
eg
rees
Celc
ius)
NT
U -
in
sit
u (
ntu
)
P2-S 07/09/16 267.1 87.6 8.6 8.37 0 8.6 16.266 0.09
P2-10 04/07/16 271.1 74.9 8.46 8.136 10 9.927 0
23/08/16 280.2 69.5 7.41 8.14 10 12.357 0.3
07/09/16 266.4 64.2 6.65 8.02 10 13.735 0.1
P2-15 04/07/16 266.8 66.1 8.02 7.87 15 6.995 0.27
23/08/16 267.1 52.3 6.32 7.68 15 7.163 0.41
07/09/16 268.3 47.5 5.7 7.63 15 7.436 1.49
P2-20 04/07/16 268 55.4 6.92 7.7 20 5.828 0.16
23/08/16 267.9 40.3 5.01 7.48 20 6.03 0.48
07/09/16 268.3 33.1 4.1 7.47 20 6.079 0.88
P2-5 04/07/16 269.9 92.1 8.86 8.47 5 16.93 0
23/08/16 263.4 88.9 8.3 8.31 5 18.656 0.19
07/09/16 263.5 86.7 8.52 8.37 5 16.192 0.1
Printed Date: 26/10/2016
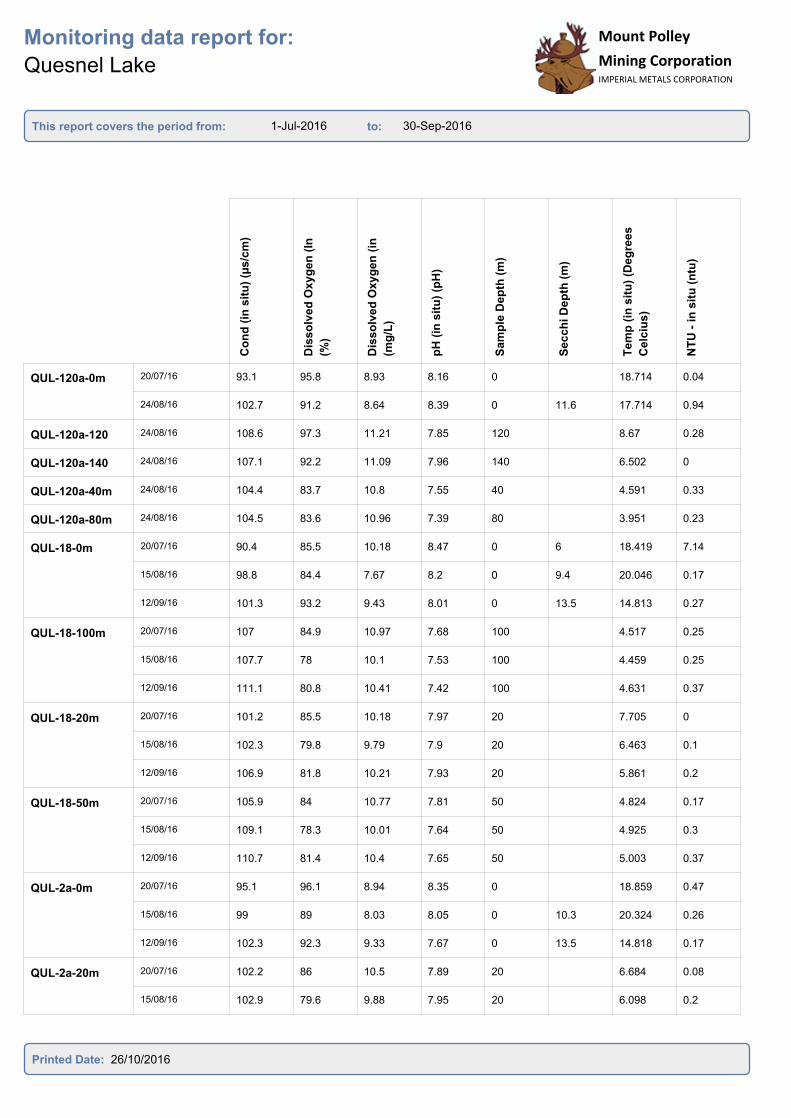
1-Jul-2016 30-Sep-2016
Monitoring data report for:
Quesnel Lake
This report covers the period from: to:
Mount Polley
Mining CorporationIMPERIAL METALS CORPORATION
Co
nd
(in
sit
u)
(µs
/cm
)
Dis
so
lved
Oxy
ge
n (
In
(%)
Dis
so
lved
Oxy
ge
n (
in
(mg
/L)
pH
(in
sit
u)
(pH
)
Sam
ple
De
pth
(m
)
Secc
hi D
ep
th (
m)
Tem
p (
in s
itu
) (D
eg
rees
Celc
ius
)
NT
U -
in
sit
u (
ntu
)
QUL-120a-0m 20/07/16 93.1 95.8 8.93 8.16 0 18.714 0.04
24/08/16 102.7 91.2 8.64 8.39 0 11.6 17.714 0.94
QUL-120a-120
m
24/08/16 108.6 97.3 11.21 7.85 120 8.67 0.28
QUL-120a-140
m
24/08/16 107.1 92.2 11.09 7.96 140 6.502 0
QUL-120a-40m 24/08/16 104.4 83.7 10.8 7.55 40 4.591 0.33
QUL-120a-80m 24/08/16 104.5 83.6 10.96 7.39 80 3.951 0.23
QUL-18-0m 20/07/16 90.4 85.5 10.18 8.47 0 6 18.419 7.14
15/08/16 98.8 84.4 7.67 8.2 0 9.4 20.046 0.17
12/09/16 101.3 93.2 9.43 8.01 0 13.5 14.813 0.27
QUL-18-100m 20/07/16 107 84.9 10.97 7.68 100 4.517 0.25
15/08/16 107.7 78 10.1 7.53 100 4.459 0.25
12/09/16 111.1 80.8 10.41 7.42 100 4.631 0.37
QUL-18-20m 20/07/16 101.2 85.5 10.18 7.97 20 7.705 0
15/08/16 102.3 79.8 9.79 7.9 20 6.463 0.1
12/09/16 106.9 81.8 10.21 7.93 20 5.861 0.2
QUL-18-50m 20/07/16 105.9 84 10.77 7.81 50 4.824 0.17
15/08/16 109.1 78.3 10.01 7.64 50 4.925 0.3
12/09/16 110.7 81.4 10.4 7.65 50 5.003 0.37
QUL-2a-0m 20/07/16 95.1 96.1 8.94 8.35 0 18.859 0.47
15/08/16 99 89 8.03 8.05 0 10.3 20.324 0.26
12/09/16 102.3 92.3 9.33 7.67 0 13.5 14.818 0.17
QUL-2a-20m 20/07/16 102.2 86 10.5 7.89 20 6.684 0.08
15/08/16 102.9 79.6 9.88 7.95 20 6.098 0.2
Printed Date: 26/10/2016
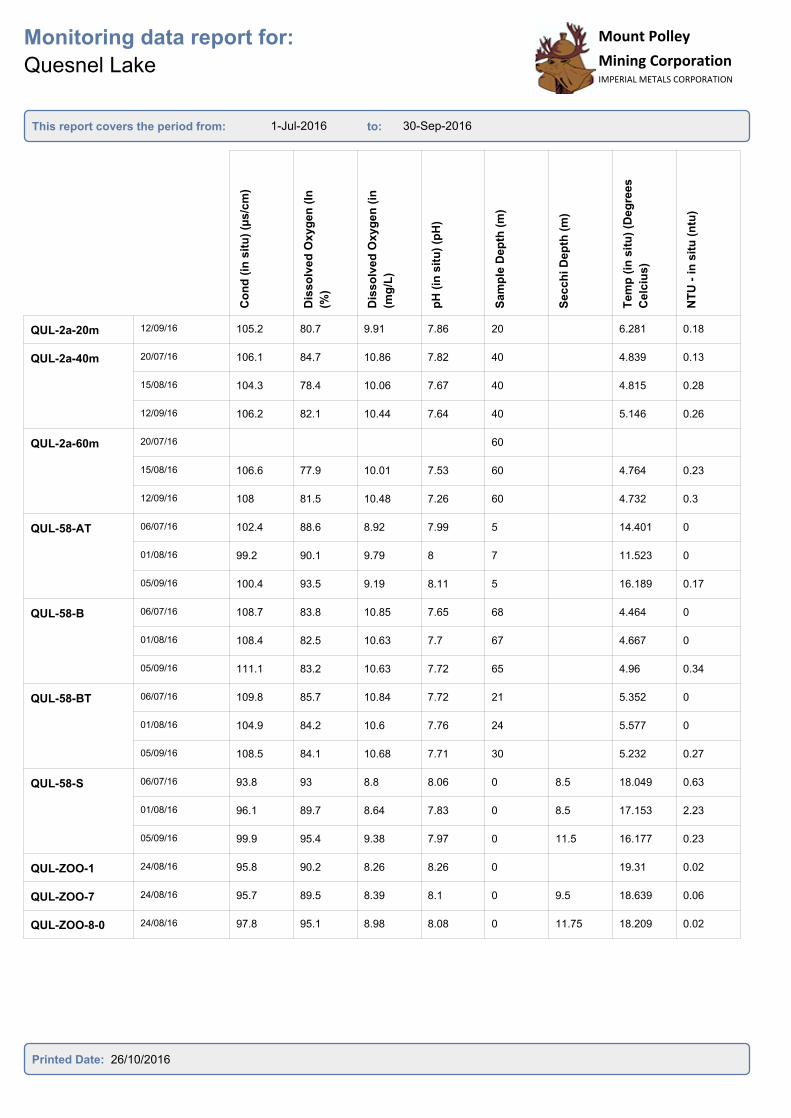
1-Jul-2016 30-Sep-2016
Monitoring data report for:
Quesnel Lake
This report covers the period from: to:
Mount Polley
Mining CorporationIMPERIAL METALS CORPORATION
Co
nd
(in
sit
u)
(µs
/cm
)
Dis
so
lved
Oxy
ge
n (
In
(%)
Dis
so
lved
Oxy
ge
n (
in
(mg
/L)
pH
(in
sit
u)
(pH
)
Sam
ple
Dep
th (
m)
Sec
ch
i D
ep
th (
m)
Tem
p (
in s
itu
) (D
eg
rees
Celc
ius)
NT
U -
in
sit
u (
ntu
)
QUL-2a-20m 12/09/16 105.2 80.7 9.91 7.86 20 6.281 0.18
QUL-2a-40m 20/07/16 106.1 84.7 10.86 7.82 40 4.839 0.13
15/08/16 104.3 78.4 10.06 7.67 40 4.815 0.28
12/09/16 106.2 82.1 10.44 7.64 40 5.146 0.26
QUL-2a-60m 20/07/16 60
15/08/16 106.6 77.9 10.01 7.53 60 4.764 0.23
12/09/16 108 81.5 10.48 7.26 60 4.732 0.3
QUL-58-AT 06/07/16 102.4 88.6 8.92 7.99 5 14.401 0
01/08/16 99.2 90.1 9.79 8 7 11.523 0
05/09/16 100.4 93.5 9.19 8.11 5 16.189 0.17
QUL-58-B 06/07/16 108.7 83.8 10.85 7.65 68 4.464 0
01/08/16 108.4 82.5 10.63 7.7 67 4.667 0
05/09/16 111.1 83.2 10.63 7.72 65 4.96 0.34
QUL-58-BT 06/07/16 109.8 85.7 10.84 7.72 21 5.352 0
01/08/16 104.9 84.2 10.6 7.76 24 5.577 0
05/09/16 108.5 84.1 10.68 7.71 30 5.232 0.27
QUL-58-S 06/07/16 93.8 93 8.8 8.06 0 8.5 18.049 0.63
01/08/16 96.1 89.7 8.64 7.83 0 8.5 17.153 2.23
05/09/16 99.9 95.4 9.38 7.97 0 11.5 16.177 0.23
QUL-ZOO-1 24/08/16 95.8 90.2 8.26 8.26 0 19.31 0.02
QUL-ZOO-7 24/08/16 95.7 89.5 8.39 8.1 0 9.5 18.639 0.06
QUL-ZOO-8-0
m
24/08/16 97.8 95.1 8.98 8.08 0 11.75 18.209 0.02
Printed Date: 26/10/2016
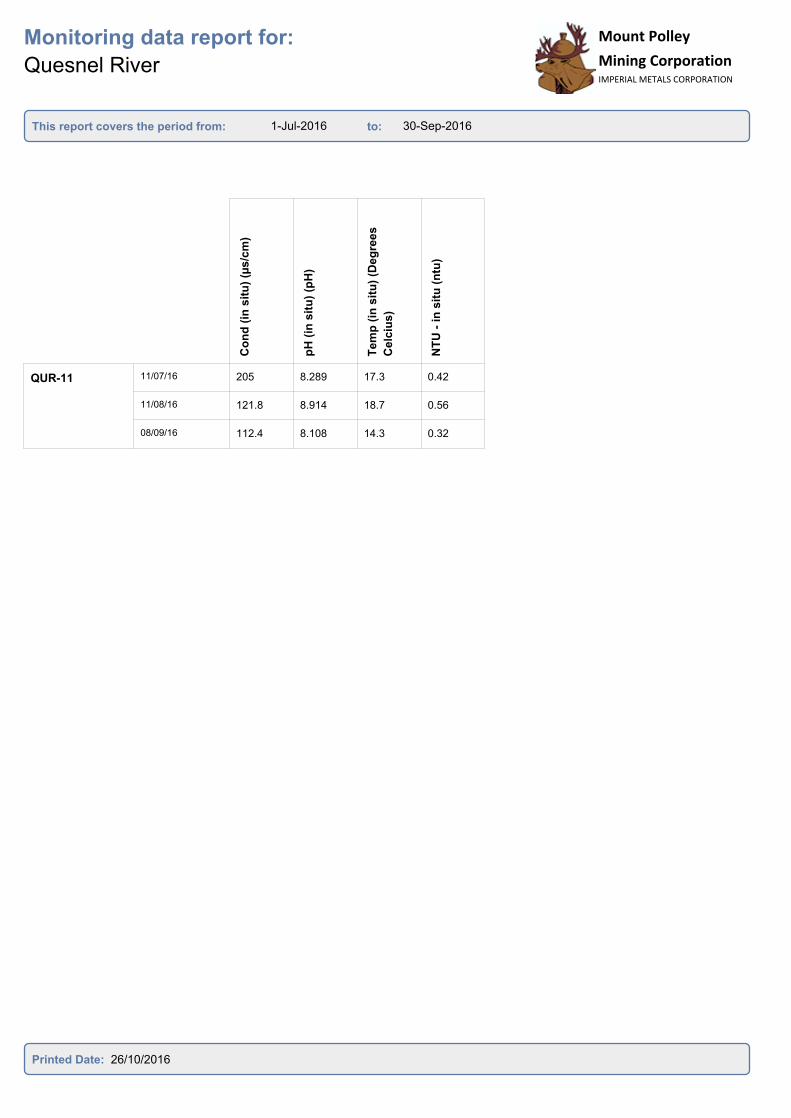
1-Jul-2016 30-Sep-2016
Monitoring data report for:
Quesnel River
This report covers the period from: to:
Mount Polley
Mining CorporationIMPERIAL METALS CORPORATION
Co
nd
(in
sit
u)
(µs
/cm
)
pH
(in
sit
u)
(pH
)
Tem
p (
in s
itu
) (D
eg
rees
Celc
ius
)
NT
U -
in
sit
u (
ntu
)
QUR-11 11/07/16 205 8.289 17.3 0.42
11/08/16 121.8 8.914 18.7 0.56
08/09/16 112.4 8.108 14.3 0.32
Printed Date: 26/10/2016

Mount Polley Mining Corporation Permit 11678 – Third Quarter 2016 Report
Appendix 4

1-Jul-2016 30-Sep-2016
Monitoring data report for:
Permitted Hydrology Sites
This report covers the period from: to:
Mount Polley
Mining CorporationIMPERIAL METALS CORPORATION
Q (
m3/s
)
Sta
ff G
au
ge
(m
)
H1 Up HAC
Hydrology
13/07/16 0.3157 0.489
21/07/16 0.4073 0.516
05/08/16 0.2819 0.488
11/08/16 0.49 0.568
23/08/16 0.491
11/09/16 0.3293 0.494
17/09/16 0.186 0.242
H2 Low
HAC
Hydrology
04/07/16 0.4335 0.486
21/07/16 0.407 0.49
05/08/16 0.3337 0.46
19/08/16 0.3373 0.452
02/09/16 0.3108 0.458
16/09/16 0.3281 0.46
H3 Low
EDC
Hydrology
13/07/16 0.6422 0.631
21/07/16 0.5692 0.603
10/08/16 0.0326 0.397
14/08/16 0.0153 0.376
02/09/16 0.0121 0.359
Printed Date: 24/10/2016

1-Jul-2016 30-Sep-2016
Monitoring data report for:
Permitted Surface Water Quality Site
This report covers the period from: to:
Mount Polley
Mining CorporationIMPERIAL METALS CORPORATION
Q (
m3/s
)
Sta
ff G
au
ge
(m
)
W1b -
Morehead
Creek
14/07/16 0.855 0.228
28/07/16 0.0681 0.202
04/08/16 0.171
06/08/16 0.0333 0.162
21/08/16 0.0142 0.123
31/08/16 0.0039
16/09/16 0.0031 0.086
W4a 07/07/16 0.00154
21/07/16 0.00171
07/08/16 0.00085
18/08/16 0.00061
15/09/16 0.00063
W5 05/07/16 0.131
13/07/16 0.009 0.126
26/07/16 0.08
07/08/16 0.054
W12 14/07/16 0.0747 0.72
26/07/16 0.0112 0.662
04/08/16 0.635
06/08/16 0.0059 0.64
21/08/16 0.019 0.626
31/08/16 0.0017
Printed Date: 24/10/2016
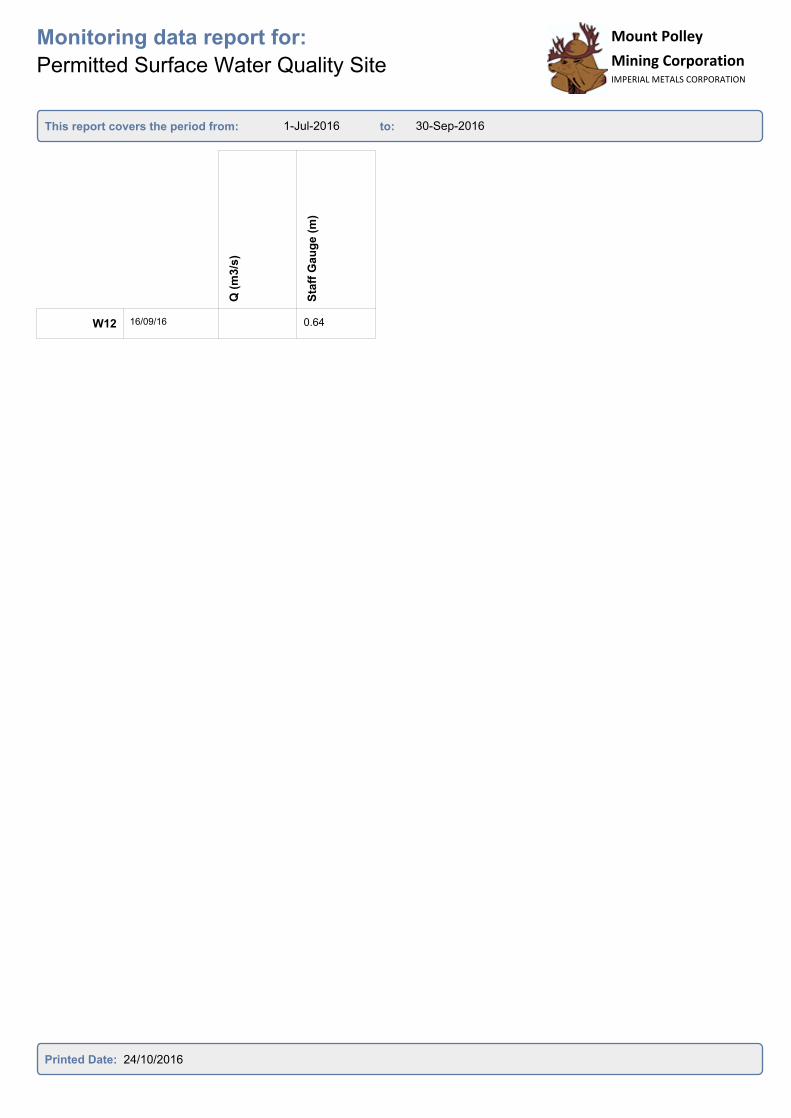
1-Jul-2016 30-Sep-2016
Monitoring data report for:
Permitted Surface Water Quality Site
This report covers the period from: to:
Mount Polley
Mining CorporationIMPERIAL METALS CORPORATION
Q (
m3/s
)
Sta
ff G
au
ge
(m
)W12 16/09/16 0.64
Printed Date: 24/10/2016

Mount Polley Mining Corporation Permit 11678 – Third Quarter 2016 Report
Appendix 5
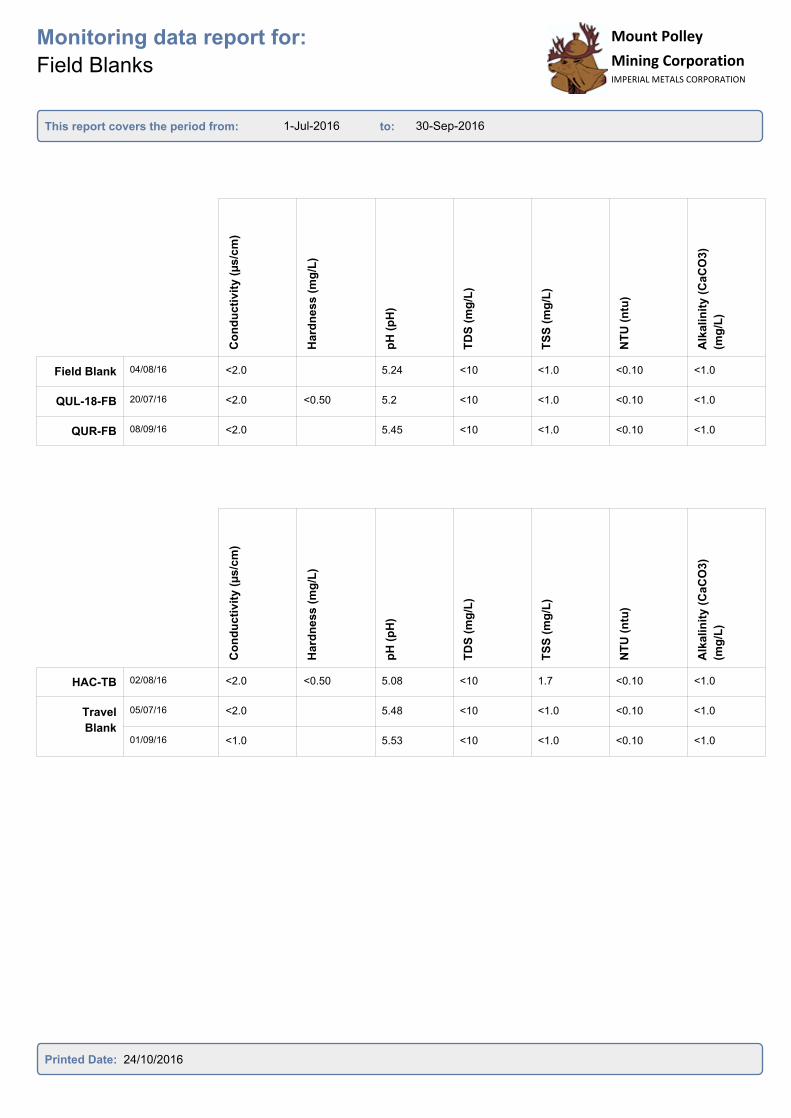
1-Jul-2016 30-Sep-2016
Monitoring data report for:
Field Blanks
This report covers the period from: to:
Mount Polley
Mining CorporationIMPERIAL METALS CORPORATION
Co
nd
ucti
vit
y (
µs/c
m)
Hard
ne
ss (
mg
/L)
pH
(p
H)
TD
S (
mg
/L)
TS
S (
mg
/L)
NT
U (
ntu
)
Alk
alin
ity
(C
aC
O3)
(mg
/L)
Field Blank 04/08/16 <2.0 5.24 <10 <1.0 <0.10 <1.0
QUL-18-FB 20/07/16 <2.0 <0.50 5.2 <10 <1.0 <0.10 <1.0
QUR-FB 08/09/16 <2.0 5.45 <10 <1.0 <0.10 <1.0
Co
nd
ucti
vit
y (
µs/c
m)
Hard
ness (
mg
/L)
pH
(p
H)
TD
S (
mg
/L)
TS
S (
mg
/L)
NT
U (
ntu
)
Alk
alin
ity (
CaC
O3)
(mg
/L)
HAC-TB 02/08/16 <2.0 <0.50 5.08 <10 1.7 <0.10 <1.0
Travel
Blank
05/07/16 <2.0 5.48 <10 <1.0 <0.10 <1.0
01/09/16 <1.0 5.53 <10 <1.0 <0.10 <1.0
Printed Date: 24/10/2016

1-Jul-2016 30-Sep-2016
Monitoring data report for:
Field Blanks
This report covers the period from: to:
Mount Polley
Mining CorporationIMPERIAL METALS CORPORATION
Mount Polley
Mining CorporationIMPERIAL METALS CORPORATION
Am
mo
nia
(a
s N
) (m
g/L
)
Ch
lori
de (
mg
/L)
Flo
rid
e (
mg
/L)
Nit
rate
(N
) (m
g/L
)
Nit
rate
an
d N
itri
te
(mg
/L)
Nit
rite
(N
) (m
g/L
)
Dis
s-O
rth
op
ho
sp
hate
(mg
/L)
Field Blank 04/08/16 <0.0050 <0.50 <0.020 <0.0050 <0.0051 <0.0010 <0.0010
QUL-18-FB 20/07/16 <0.0050 <0.50 <0.020 <0.0050 <0.0051 <0.0010 <0.0010
QUR-FB 08/09/16 <0.0050 <0.50 <0.020 <0.0050 <0.0051 <0.0010 <0.0010
Am
mo
nia
(as N
) (m
g/L
)
Ch
lori
de (
mg
/L)
Flo
rid
e (
mg
/L)
Nit
rate
(N
) (m
g/L
)
Nit
rate
an
d N
itri
te
(mg
/L)
Nit
rite
(N
) (m
g/L
)
Dis
s-O
rth
op
ho
sp
hate
(mg
/L)
HAC-TB 02/08/16 <0.0050 <0.50 <0.020 <0.0050 <0.0051 <0.0010 <0.0010
Travel
Blank
05/07/16 0.0059 <0.50 <0.020 <0.0050 <0.0051 <0.0010 <0.0010
01/09/16 <0.0050 <0.50 <0.020 <0.0050 <0.0051 <0.0010 <0.0010
Printed Date: 24/10/2016

1-Jul-2016 30-Sep-2016
Monitoring data report for:
Field Blanks
This report covers the period from: to:
Mount Polley
Mining CorporationIMPERIAL METALS CORPORATION
Mount Polley
Mining CorporationIMPERIAL METALS CORPORATION
Dis
s-P
ho
sp
ho
rus
(mg
/L)
To
tal P
ho
sp
ho
rus
(mg
/L)
Su
lph
ate
(m
g/L
)
To
tal N
itro
ge
n (
mg
/L)
Dis
so
lved
Org
an
ic C
a
(mg
/L)
To
tal A
lum
inu
m (
mg
/L)
An
tim
on
y (
Sb
)-T
ota
l
(mg
/L)
Field Blank 04/08/16 <0.0020 <0.0020 <0.30 <0.030 <0.50 <0.0030 <0.00010
QUL-18-FB 20/07/16 <0.0020 0.0024 <0.30 <0.030 <0.50 <0.0030 <0.00010
QUR-FB 08/09/16 <0.0020 <0.0020 <0.30 <0.030 <0.50 <0.0030 <0.00010
Dis
s-P
ho
sp
ho
rus
(mg
/L)
To
tal P
ho
sp
ho
rus
(mg
/L)
Su
lph
ate
(m
g/L
)
To
tal N
itro
gen
(m
g/L
)
To
tal A
lum
inu
m (
mg
/L)
An
tim
on
y (
Sb
)-T
ota
l
(mg
/L)
Ars
en
ic (
As)-
To
tal
(mg
/L)
HAC-TB 02/08/16 <0.0020 <0.0020 <0.30 <0.030 <0.0030 <0.00010 <0.00010
Travel
Blank
05/07/16 <0.0020 <0.0020 <0.30 <0.030 <0.0030 <0.00010 <0.00010
01/09/16 <0.0020 <0.0020 <0.30 <0.030 <0.0030 <0.00010 <0.00010
Printed Date: 24/10/2016

1-Jul-2016 30-Sep-2016
Monitoring data report for:
Field Blanks
This report covers the period from: to:
Mount Polley
Mining CorporationIMPERIAL METALS CORPORATION
Mount Polley
Mining CorporationIMPERIAL METALS CORPORATION
Ars
en
ic (
As)-
To
tal
(mg
/L)
Bari
um
(B
a)-
To
tal
(mg
/L)
Bery
lliu
m (
Be
)-T
ota
l
(mg
/L)
Bis
mu
th (
Bi)
-To
tal
(mg
/L)
Bo
ron
(B
)-T
ota
l (m
g/L
)
To
tal C
ad
miu
m (
mg
/L)
Calc
ium
(C
a)-
To
tal
(mg
/L)
Field Blank 04/08/16 <0.00010 <0.000050 <0.00010 <0.000050 <0.010 <0.0000050 <0.050
QUL-18-FB 20/07/16 <0.00010 <0.000050 <0.00010 <0.000050 <0.010 <0.0000050 <0.050
QUR-FB 08/09/16 <0.00010 <0.000050 <0.00010 <0.000050 <0.010 <0.0000050 <0.050
Bari
um
(B
a)-
To
tal
(mg
/L)
Bery
lliu
m (
Be)-
To
tal
(mg
/L)
Bis
mu
th (
Bi)
-To
tal
(mg
/L)
Bo
ron
(B
)-T
ota
l (m
g/L
)
To
tal C
ad
miu
m (
mg
/L)
Calc
ium
(C
a)-
To
tal
(mg
/L)
Ch
rom
ium
(C
r)-T
ota
l
(mg
/L)
HAC-TB 02/08/16 <0.000050 <0.00010 <0.000050 <0.010 <0.0000050 <0.050 <0.00050
Travel
Blank
05/07/16 <0.000050 <0.00010 <0.000050 <0.010 <0.0000050 <0.050 <0.00050
01/09/16 <0.000050 <0.00010 <0.000050 <0.010 <0.0000050 <0.050 <0.00050
Printed Date: 24/10/2016
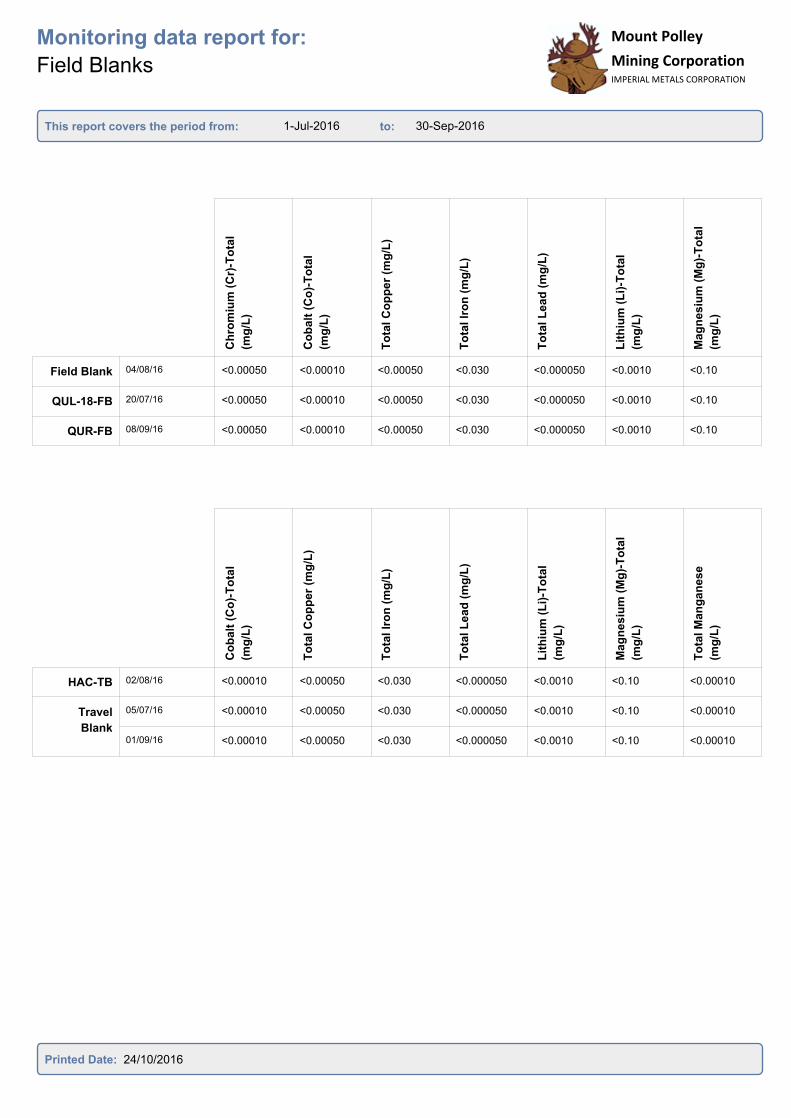
1-Jul-2016 30-Sep-2016
Monitoring data report for:
Field Blanks
This report covers the period from: to:
Mount Polley
Mining CorporationIMPERIAL METALS CORPORATION
Mount Polley
Mining CorporationIMPERIAL METALS CORPORATION
Ch
rom
ium
(C
r)-T
ota
l
(mg
/L)
Co
balt
(C
o)-
To
tal
(mg
/L)
To
tal C
op
per
(mg
/L)
To
tal Ir
on
(m
g/L
)
To
tal L
ea
d (
mg
/L)
Lit
hiu
m (
Li)
-To
tal
(mg
/L)
Mag
ne
siu
m (
Mg
)-T
ota
l
(mg
/L)
Field Blank 04/08/16 <0.00050 <0.00010 <0.00050 <0.030 <0.000050 <0.0010 <0.10
QUL-18-FB 20/07/16 <0.00050 <0.00010 <0.00050 <0.030 <0.000050 <0.0010 <0.10
QUR-FB 08/09/16 <0.00050 <0.00010 <0.00050 <0.030 <0.000050 <0.0010 <0.10
Co
balt
(C
o)-
To
tal
(mg
/L)
To
tal C
op
per
(mg
/L)
To
tal Ir
on
(m
g/L
)
To
tal L
ead
(m
g/L
)
Lit
hiu
m (
Li)
-To
tal
(mg
/L)
Mag
nesiu
m (
Mg
)-T
ota
l
(mg
/L)
To
tal M
an
gan
ese
(mg
/L)
HAC-TB 02/08/16 <0.00010 <0.00050 <0.030 <0.000050 <0.0010 <0.10 <0.00010
Travel
Blank
05/07/16 <0.00010 <0.00050 <0.030 <0.000050 <0.0010 <0.10 <0.00010
01/09/16 <0.00010 <0.00050 <0.030 <0.000050 <0.0010 <0.10 <0.00010
Printed Date: 24/10/2016

1-Jul-2016 30-Sep-2016
Monitoring data report for:
Field Blanks
This report covers the period from: to:
Mount Polley
Mining CorporationIMPERIAL METALS CORPORATION
Mount Polley
Mining CorporationIMPERIAL METALS CORPORATION
To
tal M
an
ga
nese
(mg
/L)
To
tal M
oly
bd
en
um
(mg
/L)
Nic
ke
l (N
i)-T
ota
l
(mg
/L)
Po
tas
siu
m (
K)-
To
tal
(mg
/L)
To
tal S
ele
niu
m (
mg
/L)
Silic
on
(S
i)-T
ota
l
(mg
/L)
Silve
r (A
g)-
To
tal
(mg
/L)
Field Blank 04/08/16 <0.00010 <0.000050 <0.00050 <0.050 <0.000050 <0.050 <0.000010
QUL-18-FB 20/07/16 <0.00010 <0.000050 <0.00050 <0.050 <0.000050 <0.050 <0.000010
QUR-FB 08/09/16 <0.00010 <0.000050 <0.00050 <0.050 <0.000050 <0.050 <0.000010
To
tal M
oly
bd
en
um
(mg
/L)
Nic
kel (N
i)-T
ota
l
(mg
/L)
Po
tassiu
m (
K)-
To
tal
(mg
/L)
To
tal S
ele
niu
m (
mg
/L)
Silic
on
(S
i)-T
ota
l
(mg
/L)
Silver
(Ag
)-T
ota
l
(mg
/L)
So
diu
m (
Na)-
To
tal
(mg
/L)
HAC-TB 02/08/16 <0.000050 <0.00050 <0.050 <0.000050 <0.050 <0.000010 <0.050
Travel
Blank
05/07/16 <0.000050 <0.00050 <0.050 <0.000050 <0.050 <0.000010 <0.050
01/09/16 <0.000050 <0.00050 <0.050 <0.000050 <0.050 <0.000010 <0.050
Printed Date: 24/10/2016
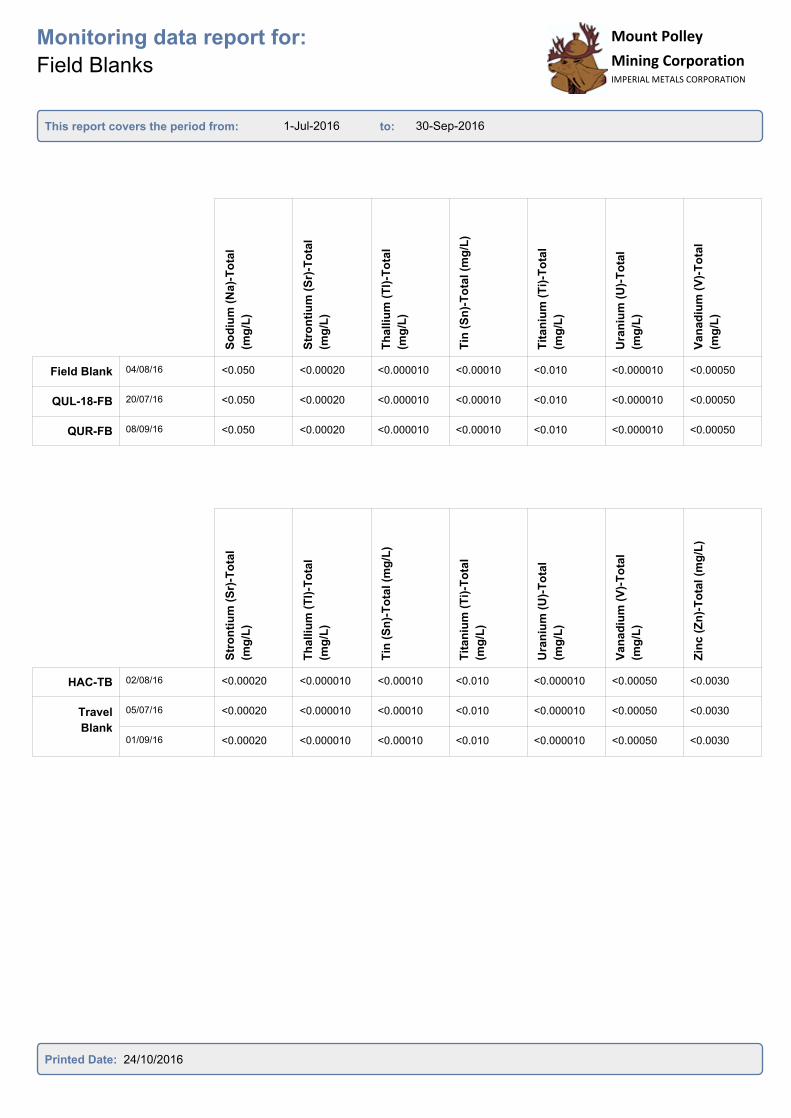
1-Jul-2016 30-Sep-2016
Monitoring data report for:
Field Blanks
This report covers the period from: to:
Mount Polley
Mining CorporationIMPERIAL METALS CORPORATION
Mount Polley
Mining CorporationIMPERIAL METALS CORPORATION
So
diu
m (
Na)-
To
tal
(mg
/L)
Str
on
tiu
m (
Sr)
-To
tal
(mg
/L)
Th
alliu
m (
Tl)
-To
tal
(mg
/L)
Tin
(S
n)-
To
tal (m
g/L
)
Tit
an
ium
(T
i)-T
ota
l
(mg
/L)
Ura
niu
m (
U)-
To
tal
(mg
/L)
Van
ad
ium
(V
)-T
ota
l
(mg
/L)
Field Blank 04/08/16 <0.050 <0.00020 <0.000010 <0.00010 <0.010 <0.000010 <0.00050
QUL-18-FB 20/07/16 <0.050 <0.00020 <0.000010 <0.00010 <0.010 <0.000010 <0.00050
QUR-FB 08/09/16 <0.050 <0.00020 <0.000010 <0.00010 <0.010 <0.000010 <0.00050
Str
on
tiu
m (
Sr)
-To
tal
(mg
/L)
Th
alliu
m (
Tl)
-To
tal
(mg
/L)
Tin
(S
n)-
To
tal (m
g/L
)
Tit
an
ium
(T
i)-T
ota
l
(mg
/L)
Ura
niu
m (
U)-
To
tal
(mg
/L)
Van
ad
ium
(V
)-T
ota
l
(mg
/L)
Zin
c (
Zn
)-T
ota
l (m
g/L
)
HAC-TB 02/08/16 <0.00020 <0.000010 <0.00010 <0.010 <0.000010 <0.00050 <0.0030
Travel
Blank
05/07/16 <0.00020 <0.000010 <0.00010 <0.010 <0.000010 <0.00050 <0.0030
01/09/16 <0.00020 <0.000010 <0.00010 <0.010 <0.000010 <0.00050 <0.0030
Printed Date: 24/10/2016

1-Jul-2016 30-Sep-2016
Monitoring data report for:
Field Blanks
This report covers the period from: to:
Mount Polley
Mining CorporationIMPERIAL METALS CORPORATION
Mount Polley
Mining CorporationIMPERIAL METALS CORPORATION
Zin
c (
Zn
)-T
ota
l (m
g/L
)
Field Blank 04/08/16 <0.0030
QUL-18-FB 20/07/16 <0.0030
QUR-FB 08/09/16 <0.0030
Printed Date: 24/10/2016

Mount Polley Mining Corporation Permit 11678 – Third Quarter 2016 Report
Appendix 6
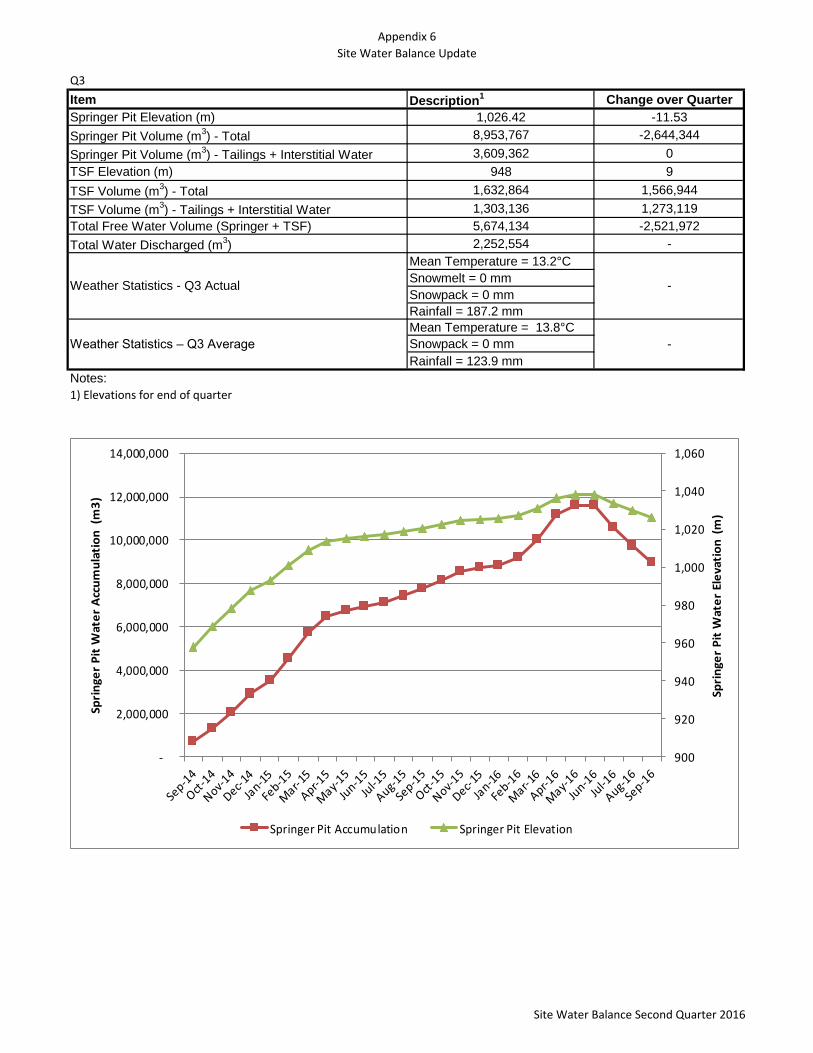
Appendix 6
Site Water Balance Update
Q3
Item Description1 Change over Quarter
Springer Pit Elevation (m) 1,026.42 -11.53
Springer Pit Volume (m3) - Total 8,953,767 -2,644,344
Springer Pit Volume (m3) - Tailings + Interstitial Water 3,609,362 0
TSF Elevation (m) 948 9
TSF Volume (m3) - Total 1,632,864 1,566,944
TSF Volume (m3) - Tailings + Interstitial Water 1,303,136 1,273,119
Total Free Water Volume (Springer + TSF) 5,674,134 -2,521,972
Total Water Discharged (m3) 2,252,554 -
Mean Temperature = 13.2°C
Snowmelt = 0 mm
Snowpack = 0 mm
Rainfall = 187.2 mm
Mean Temperature = 13.8°C
Snowpack = 0 mm
Rainfall = 123.9 mm
Notes:
1) Elevations for end of quarter
Weather Statistics - Q3 Actual -
Weather Statistics – Q3 Average -
900
920
940
960
980
1,000
1,020
1,040
1,060
-
2,000,000
4,000,000
6,000,000
8,000,000
10,000,000
12,000,000
14,000,000
Spri
nge
r P
it W
ate
r El
eva
tio
n (
m)
Spri
nge
r P
it W
ate
r A
ccu
mu
lati
on
(m
3)
Springer Pit Accumulation Springer Pit Elevation
Site Water Balance Second Quarter 2016
Related Documents