MOUNT POLLEY MINING CORPORATION MOUNT POLLEY MINE TAILINGS STORAGE FACILITY STAGE 10 RAISE DESIGN REPORT FINAL PROJECT NO.: 1197001.4.2 DISTRIBUTION: DATE: July 25, 2014 MPMC: 7 copies DOCUMENT NO.: 1197001.14.002 BGC: 3 copies

Welcome message from author
This document is posted to help you gain knowledge. Please leave a comment to let me know what you think about it! Share it to your friends and learn new things together.
Transcript
MOUNT POLLEY MINING CORPORATION
MOUNT POLLEY MINE
TAILINGS STORAGE FACILITY STAGE 10 RAISE DESIGN REPORT
FINAL
PROJECT NO.: 1197001.4.2 DISTRIBUTION: DATE: July 25, 2014 MPMC: 7 copies DOCUMENT NO.: 1197001.14.002 BGC: 3 copies
Suite 800 - 1045 Howe Street Vancouver, BC Canada V6Z 2A9 Telephone (604) 684-5900 Fax (604) 684-5909
July 25, 2014 Project No.: 1197001.4.2
Luke Moger, Project Engineer, Mining Operations Mount Polley Mining Corporation Likely, B.C., V0L 1N0
Dear Mr. Moger,
Re: Tailings Storage Facility Stage 10 Raise Design Report
Please find, attached, a digital version of the above referenced report, dated July 25, 2014. Signed and sealed paper copies will be sent the first week of August.
Should you have any questions or comments, please do not hesitate to contact us at the number listed above.
Yours sincerely,
BGC ENGINEERING INC. per:
Daryl Dufault, P.Eng. Senior Geotechnical Engineer
Mount Polley Mining Corporation, Mount Polley Mine July 25, 2014 Tailings Storage Facility Stage 10 Raise Design Report – FINAL Project No.: 1197001.4.2
N:\BGC\Projects\1197 Mt Polley 2013\2014\Stage 10 - 972.5m Crest\Stage 10 Interim Raise Design Report\MPMC TSF Stage 10 Design Report_July 25 Final.docx Page i
BGC ENGINEERING INC.
EXECUTIVE SUMMARY
This report, and the appended drawings, provides a design for the raise of the three embankments comprising the Mount Polley tailings storage facility (TSF) to crest El. 972.5 m, which represents the Stage 10 configuration of the TSF.
As of issuance of this report, the permitted crest elevation for the TSF, per B.C. Ministry of Energy and Mines (MEM) Permit No. M-200, is El. 970 m. Ongoing raising beyond the Stage 10 crest El. 972.5 m will be required to accommodate tailings storage requirements for the currently projected remaining life of mine (LOM). The next phase of design will be undertaken in the second half of 2014 to provide for the next several years’ crest raising, with a design report submission to be completed in January 2015.
Stage 10 construction of the embankments will be carried out in two phases:
1. Raising of the crest (Zones U, S, F, T and C) to El. 972.5 m will be undertaken in the summer and early fall of 2014, and will commence immediately upon completion of the Stage 9a raise to El. 970 m.
2. Raising of the buttress (Zone C) along the downstream slope of the Main and Perimeter embankments.
The Stage 10 crest raising will precede the downstream slope buttress raising, to take advantage of summer weather conditions for till core construction. For the Stage 10 crest raising, addition of fill prior to fill placement against the downstream slope of the dam is acceptable as the factors of safety were checked for the El. 972.5 m crest without buttress raising, and were found to be adequate although below target factor of safety criteria in some instances. Based on Mount Polley Mining Corporation’s (MPMC’s) plans for placement of rockfill to extend the downstream shell of the embankments, factor of safety design criteria are expected to be achieved or exceeded along the entire length of the dam, prior to commencement of crest raising above El. 972.5 m in the spring of 2015.
Commencing with the construction of the raise to El. 972.5 m, BGC Engineering Inc. will assume the role of Engineer-of-Record.
Work carried out in support of the Stage 10 raise included:
Review and update of design and operating criteria Evaluation of water management scenarios and tailings storage requirements, to
determine the Stage 10 crest elevation Review of current instrumentation coverage, and recommendations for additional
instrumentation installation (and associated geotechnical drilling and testing), to expand coverage to accommodate future dam raising and extensions, and to provide additional geotechnical information in support of the next phase of design
Evaluation of the shear strength of glaciolacustrine foundation soils that largely govern the stability of the dams
Mount Polley Mining Corporation, Mount Polley Mine July 25, 2014 Tailings Storage Facility Stage 10 Raise Design Report – FINAL Project No.: 1197001.4.2
N:\BGC\Projects\1197 Mt Polley 2013\2014\Stage 10 - 972.5m Crest\Stage 10 Interim Raise Design Report\MPMC TSF Stage 10 Design Report_July 25 Final.docx Page ii
BGC ENGINEERING INC.
Limit equilibrium stability analyses to: a. Determine the factor of safety for the El. 972.5 m crest elevation for
representative embankment sections b. Determine the required configuration of downstream shell buttress construction
to achieve factor of safety design criteria, and provide guidance for MPMC’s plans for downstream shell construction prior to raising past El. 972.5 m.
c. Provide updated threshold elevations for foundation piezometers linked to the factors of safety for the analyzed representative sections.
Recommendations arising out of the work documented herein are as listed below.
1. Annual stage raise crest elevations to be constructed in a given year should be based on projected tailings, water storage, and flood storage/freeboard requirements as of the end of September of the year following. This is the basis for the target crest El. 972.5 m for 2014.
2. Based on the Canadian Dam Association (CDA) dam safety guidelines (CDA, 2007), the TSF is assigned a “significant” consequence classification. However, recommended earthquake and inflow design flood (IDF) criteria are more stringent than required by a “significant” consequence classification, in line with evolving CDA (2013) guidance for tailings dams. Updated earthquake and IDF criteria are recommended herein.
3. Wide, above-water tailings beaches separating the embankments from the reclaim water pond constitutes a fundamental structural element of the dam, and should be established at the earliest possible date, and maintained thereafter. MPMC is in the process of implementing a water treatment system that will facilitate this, as summarized in Section 4.2.
4. No dam break and inundation study, as described in the CDA (2007) dam safety guidelines, has yet been carried out for the Mount Polley TSF. There is no permanent population at risk between the TSF and Quesnel Lake. Earthquake and IDF design criteria recommended for the TSF are consistent with “very high” and “extreme” consequence classifications under the CDA (2007) guidelines, so it is unclear if there is any benefit to undertaking such a study for the Mount Polley TSF. This should be reviewed between MPMC and the B.C. MEM.
5. The ratio of the Zone S till core width to the hydraulic head will, for portions of the core, be lower than the typically accepted ratio of 0.25, a criterion developed for water-retaining dams. This will be mitigated by:
a. Establishing and maintaining wide above-water beaches separating the dam from the water pond, which also represents the closure configuration for the TSF.
b. Design of the downstream shell to provide sufficient lateral restraint such that deformations of the core, and the downstream filter sequence, are tolerable.
Mount Polley Mining Corporation, Mount Polley Mine July 25, 2014 Tailings Storage Facility Stage 10 Raise Design Report – FINAL Project No.: 1197001.4.2
N:\BGC\Projects\1197 Mt Polley 2013\2014\Stage 10 - 972.5m Crest\Stage 10 Interim Raise Design Report\MPMC TSF Stage 10 Design Report_July 25 Final.docx Page iii
BGC ENGINEERING INC.
6. Additional instrumentation is recommended (see Section 5.5) for installation in 2014, comprising six piezometer boreholes (with two to three vibrating wire piezometer tips per hole), and six inclinometer boreholes. The information yielded by these boreholes (see Section 5.6) will allow refinement of the geologic model for the TSF area, needed for support of future design phases, and to assist in interpretation of instrumentation data.
7. Updated threshold levels for the foundation piezometers should be established and incorporated into the monitoring program, based on the stability analyses results provided in Section 6.9.6. Established inclinometer threshold limits, as outlined in Section 5.4.3, remain appropriate.
8. Stability analyses for the dams considered a worst case scenario with residual shear strength assumed for the glaciolacustrine foundation unit, in which case a minimum factor of safety of 1.1 is assumed. There is no evidence, neither from site investigations nor inclinometer monitoring, that the operative shear strength is residual, but this approach is consistent with application of the observational method for a dam with a potentially brittle foundation.
9. Extension of the downstream shell of the dam requires relocation of existing infrastructure, including the Main Embankment seepage recovery pond. MPMC should initiate plans and schedules for such relocations for completion in 2015. In particular, the portion of the Main Embankment at the seepage recovery pond cannot attain factor of safety criteria until that pond has been relocated and the downstream buttress has encroached upon its current location.
10. As MPMC proceeds with Zone C downstream shell placement over the next year, priority should be placed on completion of that portion of the downstream buttress required to achieve factor of safety criteria, as outlined in Table 6-3.
11. The earthquake stability of the dam at crest El. 972.5 m was evaluated using pseudo-static analysis. While sufficient for the immediate term, the next phase of design should include post-earthquake and seismic deformation analyses, which represent the appropriate means of evaluating the seismic stability of the dams. Given the thin Zone S till core and filter/transition sequence, seismic deformation analyses may govern the ultimate design configurations for the dams, based on downstream shell configurations sufficient to limit such predicted deformations to levels that do not disrupt the continuity of the core and filter zones.
12. Field density testing and index property data should be collected on Zone U tailings, to support evaluations of the upstream stability of the centerline stage raises as part of the next phase of design, as discussed in Section 6.9.5.
13. Modifications to the gradation specifications for Zones F and T are recommended as outlined in Sections 7.3.4 and 7.3.5 respectively. Otherwise, the design for crest raising and the zone sequence remains the same as per previous designs, and is illustrated on the appended drawings, along with the technical specifications for the Stage 10 raise.
Mount Polley Mining Corporation, Mount Polley Mine July 25, 2014 Tailings Storage Facility Stage 10 Raise Design Report – FINAL Project No.: 1197001.4.2
N:\BGC\Projects\1197 Mt Polley 2013\2014\Stage 10 - 972.5m Crest\Stage 10 Interim Raise Design Report\MPMC TSF Stage 10 Design Report_July 25 Final.docx Page iv
BGC ENGINEERING INC.
TABLE OF CONTENTS
EXECUTIVE SUMMARY ........................................................................................................ i TABLE OF CONTENTS ........................................................................................................ iv LIST OF TABLES ................................................................................................................. vi LIST OF FIGURES............................................................................................................... vii LIST OF APPENDICES ...................................................................................................... viii LIST OF DRAWINGS.......................................................................................................... viii LIMITATIONS ........................................................................................................................ x 1.0 INTRODUCTION .......................................................................................................... 1 2.0 BACKGROUND............................................................................................................ 2
2.1. Project Overview ..................................................................................................... 2 2.2. Tailings Management Operations .......................................................................... 4 2.3. Process Water Reclaim ........................................................................................... 5 2.4. Seepage Collection Ponds ..................................................................................... 5 2.5. Project History ......................................................................................................... 6
2.5.1. TSF Construction .................................................................................................. 6 2.5.2. Transition of Engineer of Record ........................................................................... 7
2.6. Key References ........................................................................................................ 7 3.0 DESIGN & OPERATING CRITERIA ............................................................................ 9
3.1. CDA Consequence Classification .......................................................................... 9 3.2. Tailings Storage Capacity ..................................................................................... 11 3.3. Inflow Design Flood and Freeboard Criteria ....................................................... 11 3.4. Seismic Design Criteria ........................................................................................ 12 3.5. Ratio of Core Width to Hydraulic Head ............................................................... 14
3.5.1. General ................................................................................................................ 14 3.5.2. Criteria Developed for Water Dams .................................................................... 14 3.5.3. Core Width to Head Ratio for Mount Polley Tailings Dams ................................. 16 3.5.4. Approach for Mount Polley TSF .......................................................................... 17
3.6. Above Water Tailings Beach ................................................................................ 18 3.7. Dam Stability .......................................................................................................... 20
3.7.1. General ................................................................................................................ 20 3.7.2. Static Stability – Expected Conditions ................................................................. 20 3.7.3. Static Stability – Contingency Conditions ............................................................ 20 3.7.4. Earthquake Loading Conditions .......................................................................... 21
4.0 STAGE 10 CREST ELEVATION REQUIREMENT .................................................... 22 4.1. General ................................................................................................................... 22 4.2. Water Balance Considerations ............................................................................. 22 4.3. Timing Basis for Target Crest Elevations for Annual Stage Raising................ 23 4.4. TSF Operating Pond Scenarios ............................................................................ 24 4.5. Design Submissions Timing for Raising Above El. 972.5 m ............................. 24
Mount Polley Mining Corporation, Mount Polley Mine July 25, 2014 Tailings Storage Facility Stage 10 Raise Design Report – FINAL Project No.: 1197001.4.2
N:\BGC\Projects\1197 Mt Polley 2013\2014\Stage 10 - 972.5m Crest\Stage 10 Interim Raise Design Report\MPMC TSF Stage 10 Design Report_July 25 Final.docx Page v
BGC ENGINEERING INC.
5.0 INSTRUMENTATION REVIEW .................................................................................. 26 5.1. General ................................................................................................................... 26 5.2. Piezometers ........................................................................................................... 26
5.2.1. General ................................................................................................................ 26 5.2.2. Summary of Piezometric Performance and Trends to Date ................................ 26
5.2.2.1. Tailings Piezometers ................................................................................. 26 5.2.2.2. Zone S Till Core Piezometers.................................................................... 27 5.2.2.3. Foundation Piezometers ........................................................................... 27 5.2.2.4. Filter and Drain Piezometers ..................................................................... 28
5.3. Inclinometers ......................................................................................................... 28 5.3.1. General ................................................................................................................ 28 5.3.2. Trends Observed to Date .................................................................................... 28
5.4. Review of Instrumentation Threshold Criteria & Contingencies ...................... 30 5.4.1. General ................................................................................................................ 30 5.4.2. Piezometer Threshold Criteria ............................................................................. 30 5.4.3. Inclinometer Threshold Criteria ........................................................................... 31 5.4.4. Capacity for Contingency Buttress Construction ................................................. 32
5.5. Review of Current Instrumentation Coverage .................................................... 33 5.5.1. General ................................................................................................................ 33 5.5.2. Instrumentation Benches ..................................................................................... 33 5.5.3. Piezometers ........................................................................................................ 33 5.5.4. Inclinometers ....................................................................................................... 34
5.6. Scope for Additional Drilling, Sampling, and Laboratory Testing .................... 35 6.0 STABILITY ANALYSES ............................................................................................. 37
6.1. General ................................................................................................................... 37 6.2. Geometry and Cross Sections ............................................................................. 37 6.3. Analysis Assumptions .......................................................................................... 38 6.4. Foundation Conditions ......................................................................................... 40 6.5. Shear Strength Parameters .................................................................................. 41
6.5.1. General ................................................................................................................ 41 6.5.2. Tailings Shear Strength ....................................................................................... 42 6.5.3. Zone S Till Core Shear Strength ......................................................................... 42 6.5.4. Zone C Rockfill Shell Shear Strength .................................................................. 43 6.5.5. Foundation Till Shear Strength ............................................................................ 43 6.5.6. Glaciolacustrine Foundation Unit Shear Strength ............................................... 44
6.5.6.1. General ...................................................................................................... 44 6.5.6.2. Peak Shear Strength ................................................................................. 44 6.5.6.3. Residual Shear Strength ........................................................................... 45
6.6. Pore Pressure Conditions .................................................................................... 48 6.7. Potential Slip Surfaces Considered ..................................................................... 48 6.8. Model Analysis Software ...................................................................................... 49 6.9. Results .................................................................................................................... 49
Mount Polley Mining Corporation, Mount Polley Mine July 25, 2014 Tailings Storage Facility Stage 10 Raise Design Report – FINAL Project No.: 1197001.4.2
N:\BGC\Projects\1197 Mt Polley 2013\2014\Stage 10 - 972.5m Crest\Stage 10 Interim Raise Design Report\MPMC TSF Stage 10 Design Report_July 25 Final.docx Page vi
BGC ENGINEERING INC.
6.9.1. General ................................................................................................................ 49 6.9.2. Static Stability for Stage 10 Crest El. 972.5 m .................................................... 49 6.9.3. Stage 10 Crest El. 972.5 m vs. Currently Permitted El. 970 m ........................... 51 6.9.4. Pseudo-Static Stability for Crest El. 972.5 m ...................................................... 52 6.9.5. Upstream Stability of Stage 10 Crest El.972.5 m ................................................ 52 6.9.6. Analyses for Foundation Piezometer Threshold Levels ...................................... 54 6.9.7. Stability with Extended Downstream Shell (El. 978 m) ....................................... 54
7.0 STAGE 10 RAISE DESIGN ........................................................................................ 56 7.1. General ................................................................................................................... 56 7.2. Foundation Preparation ........................................................................................ 56 7.3. Embankment Zones Construction ....................................................................... 57
7.3.1. General ................................................................................................................ 57 7.3.2. Zone U – Upstream Shell .................................................................................... 57 7.3.3. Zone S – Till Core ............................................................................................... 58 7.3.4. Zone F – Filter ..................................................................................................... 58 7.3.5. Zone T – Transition ............................................................................................. 61 7.3.6. Zone C – Rockfill ................................................................................................. 62
8.0 SUMMARY AND RECOMMENDATIONS .................................................................. 63 9.0 CLOSURE .................................................................................................................. 66 REFERENCES ..................................................................................................................... 67
LIST OF TABLES
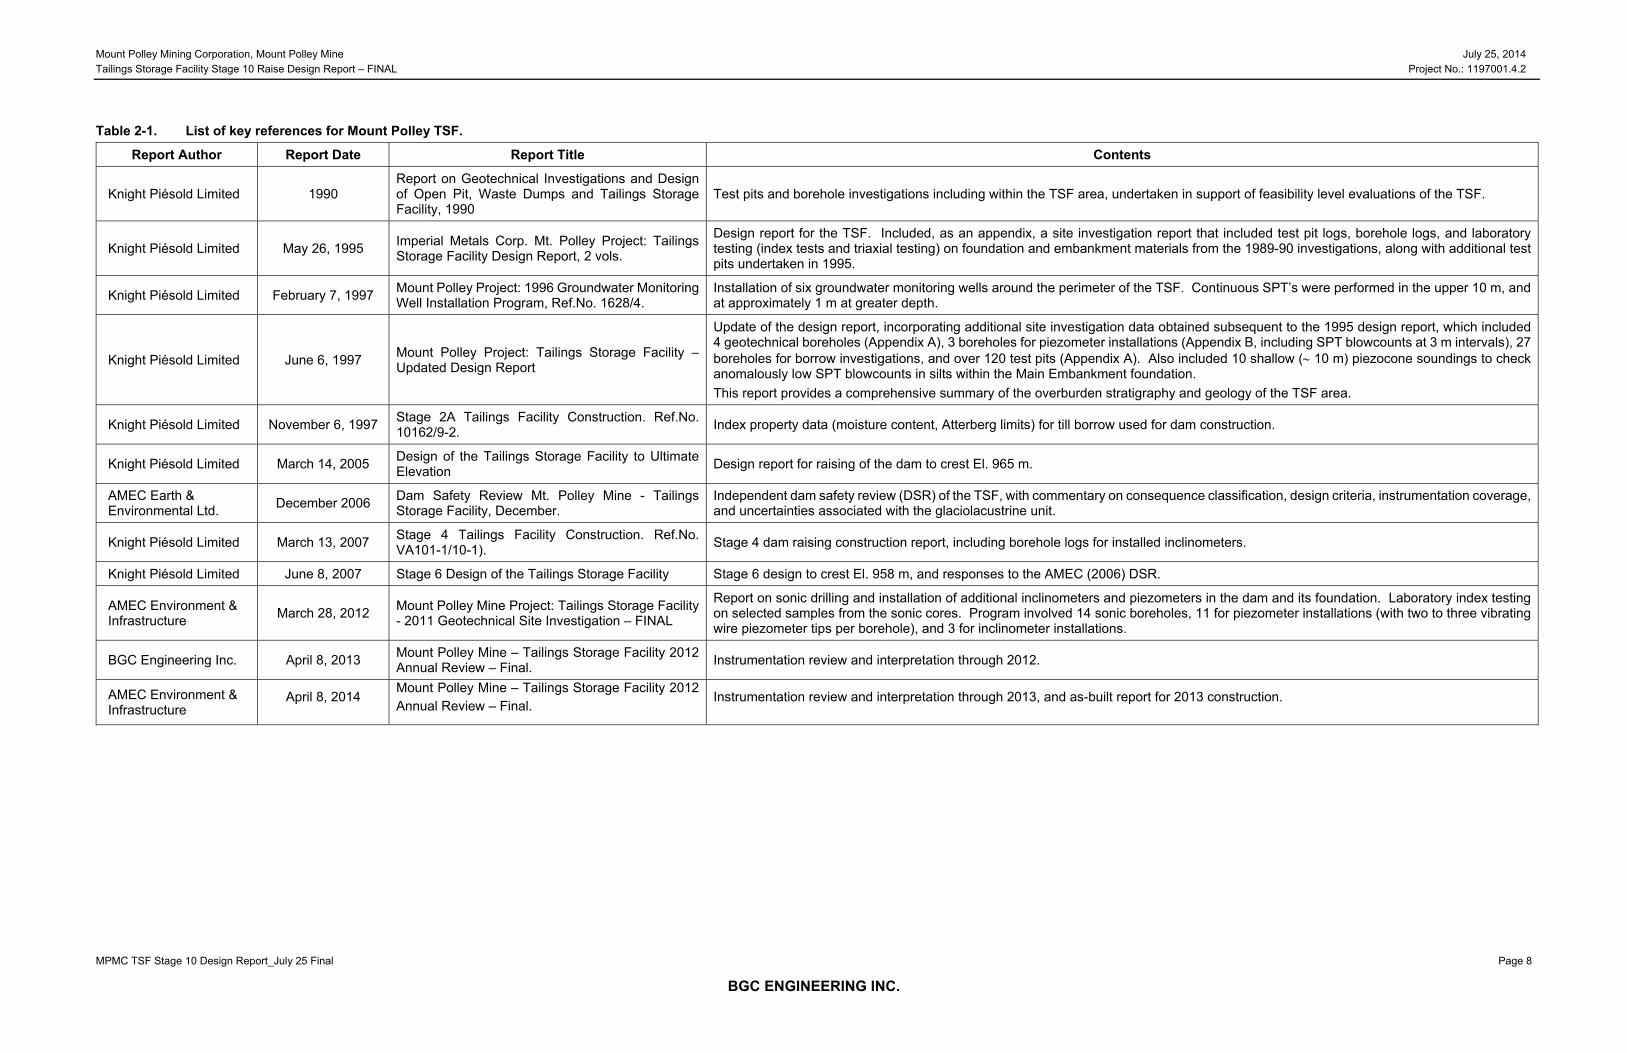
Table 2-1. List of key references for Mount Polley TSF. ..................................................... 8
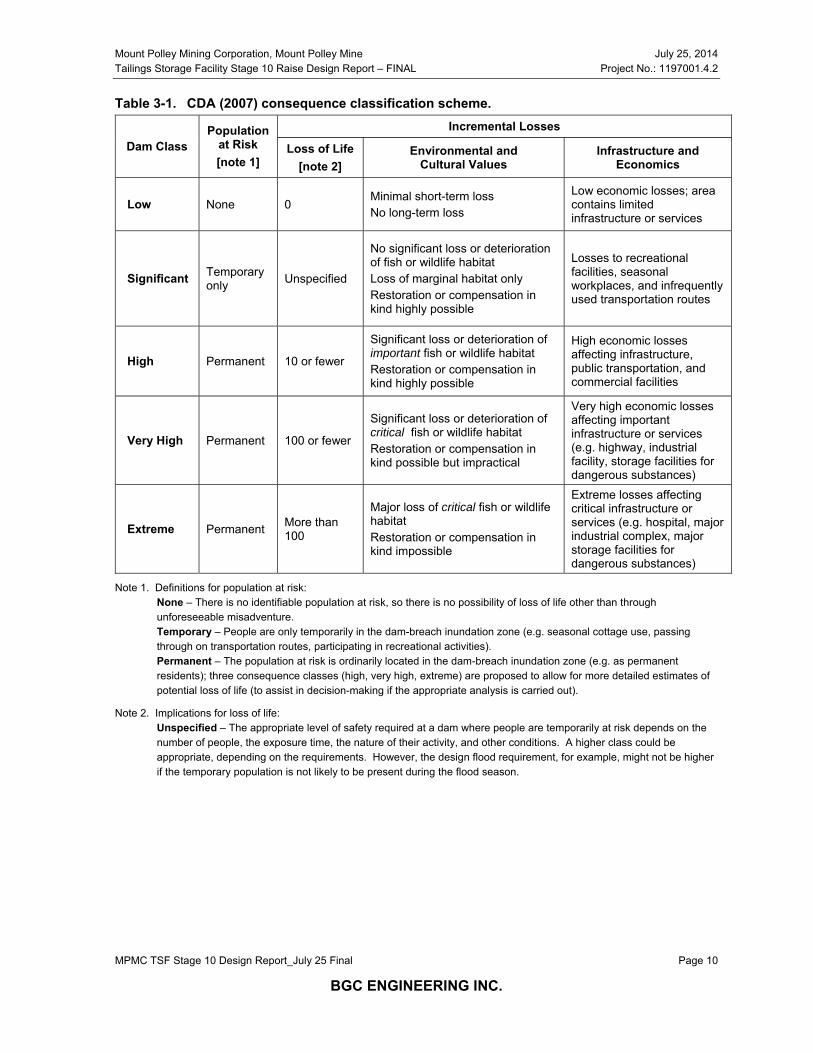
Table 3-1. CDA (2007) consequence classification scheme. ........................................... 10
Table 3-2. IDF and freeboard criteria. ............................................................................... 11
Table 3-3. Seismic design criteria from CDA (2007) and CDA (2013). ............................ 13
Table 3-4. Recommended seismic design criteria for Mount Polley TSF. ........................ 13
Table 3-5. Slope stability factor of safety criteria (CDA, 2007). ........................................ 20
Table 5-1. Inclinometer data summary. ............................................................................ 29
Table 5-2. Basis of threshold levels for foundation piezometers. ..................................... 31
Table 5-3. Inclinometers threshold levels (AMEC, 2012b). .............................................. 31
Table 5-4. Inclinometers threshold levels and corresponding actions (AMEC, 2012b). ............................................................................................................ 32
Table 5-5. Recommended additional foundation piezometer installations. ...................... 34
Table 5-6. Recommended additional inclinometer installations. ....................................... 35
Table 6-1. Stability analysis material parameters. ............................................................ 41
Mount Polley Mining Corporation, Mount Polley Mine July 25, 2014 Tailings Storage Facility Stage 10 Raise Design Report – FINAL Project No.: 1197001.4.2
N:\BGC\Projects\1197 Mt Polley 2013\2014\Stage 10 - 972.5m Crest\Stage 10 Interim Raise Design Report\MPMC TSF Stage 10 Design Report_July 25 Final.docx Page vii
BGC ENGINEERING INC.
Table 6-2. Stage 10 crest El. 972.5 m stability analysis results. ....................................... 50
Table 6-3. Minimum downstream buttress configuration for crest El. 972.5 m. ................ 50
Table 6-4. FoS comparisons for crest El. 970 m and 972.5 m with no buttress addition. ........................................................................................................... 51
Table 6-5. Static and pseudo-static FOS results for crest El. 972.5 m. ............................ 52
Table 6-6. Summary of upstream stability analyses. ........................................................ 53
Table 6-7. Analyses for Stage 10 foundation piezometer threshold levels. ...................... 54
Table 6-8. Summary of analyses for crest raise to El. 978 m. .......................................... 55
Table 7-1. Zone F design and Sherard et al. filter design criteria. .................................... 60
Table 7-2. Recommended Zone F gradation specification. .............................................. 61
Table 7-3. Recommended Zone T gradation specification. .............................................. 62
LIST OF FIGURES
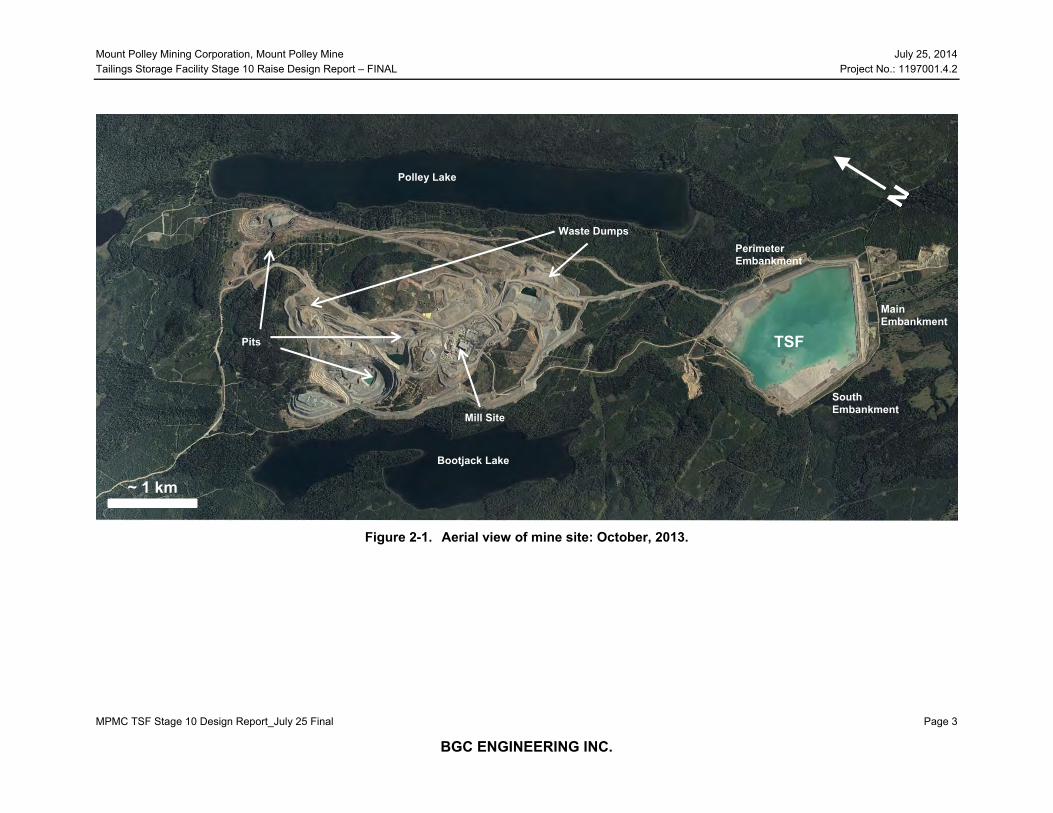
Figure 2-1. Aerial view of mine site: October, 2013. ............................................................ 3
Figure 2-2. TSF plan, showing tailings discharge locations, and areas of hydraulic fill placement cells for Zone U construction in 2013. ......................................... 5
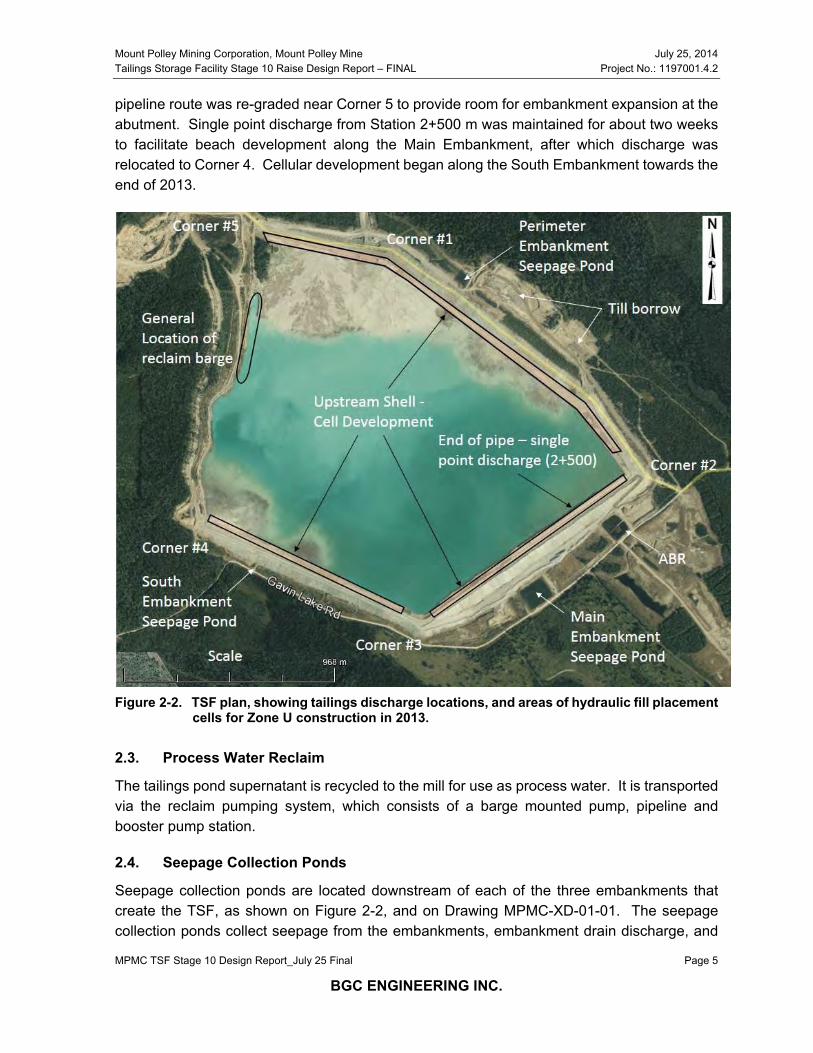
Figure 2-3. TSF Dam Crest Raising History. ....................................................................... 6
Figure 3-1. Drainages downstream of the Mount Polley TSF – all draining to Quesnel Lake. The town of Likely is approximately 13 km to the north of where the creeks enter Quesnel Lake. Blue lines represent drainages. .......................................................................................................... 9
Figure 3-2. Seismic hazard calculation results for the Mount Polley mine site (Lat. N52.512, Long. W121.598). Peak horizontal ground accelerations are for bedrock outcrops. ....................................................................................... 14
Figure 3-3. Dam section showing location of minimum core width. ................................... 16
Figure 3-4. Core width to hydraulic head ratio versus TSF pond level at core El. 951 m. ..................................................................................................................... 17
Figure 3-5. TSF aerial views: 2007 and 2013. ................................................................... 19
Figure 6-1. Modelled cross section locations. .................................................................... 39
Figure 6-2. Shear strength relationship used for Zone C rockfill based on average rockfill quality per Leps (1970). ........................................................................ 43
Figure 6-3. Atterberg limits test results: glaciolacustrine unit samples from AMEC 2011 sonic drilling program (AMEC, 2012b). ................................................... 46

Mount Polley Mining Corporation, Mount Polley Mine July 25, 2014 Tailings Storage Facility Stage 10 Raise Design Report – FINAL Project No.: 1197001.4.2
N:\BGC\Projects\1197 Mt Polley 2013\2014\Stage 10 - 972.5m Crest\Stage 10 Interim Raise Design Report\MPMC TSF Stage 10 Design Report_July 25 Final.docx Page viii
BGC ENGINEERING INC.
Figure 6-4. Gradation test results from AMEC 2011 sonic drilling program. ...................... 47
Figure 6-5. Relationship between Drained Residual Friction Angle and Liquid Limit (Stark and Eid, 1994). ...................................................................................... 48
LIST OF APPENDICES
APPENDIX A STABILITY ANALYSIS FIGURES
LIST OF DRAWINGS
MPMC-XD-00-01 STAGE 10 CREST EL. 972.5 m RAISE DESIGN – LIST OF DRAWINGS MPMC-XD-01-01 STAGE 10 CREST EL. 972.5 m TSF PLAN MPMC-XD-02-01 STAGE 10 SOUTH EMBANKMENT CREST EL. 972.5m PLAN
MPMC-XD-02-02 STAGE 10 SOUTH EMBANKMENT AND MAIN EMBANKMENT CREST EL. 972.5 m PLAN
MPMC-XD-02-03 STAGE 10 MAIN EMBANKMENT CREST EL. 972.5m PLAN MPMC-XD-02-04 STAGE 10 MAIN EMBANKMENT AND PERIMETER EMBANKMENT CREST EL.
972.5m PLAN MPMC-XD-02-05 STAGE 10 PERIMETER EMBANKMENT CREST EL. 972.5m PLAN – SHEET 1 MPMC-XD-02-06 STAGE 10 PERIMETER EMBANKMENT CREST EL. 972.5m PLAN – SHEET 2 MPMC-XD-03-01 STAGE 10 MAIN EMBANKMENT CREST EL. 972.5 m SECTION A (STA 2+060) MPMC-XD-03-02 STAGE 10 PERIMETER EMBANKMENT CREST EL. 972.5 m SECTION D
(STA 3+990) MPMC-XD-03-03 STAGE 10 PERIMETER EMBANKMENT CREST EL. 972.5 m SECTION J
(STA 3+260) MPMC-XD-03-04 STAGE 10 SOUTH EMBANKMENT CREST EL. 972.5 m SECTION F (STA 0+720) MPMC-XD-04-01 STAGE 10 2014 RAISE CREST EL. 972.5 m – TYPICAL ABUTMENT DETAIL MPMC-XD-05-01 STAGE 10 2014 RAISE CREST EL. 972.5 m – NOTES & SPECIFICATIONS MPMC-XD-05-02 STAGE 10 2014 RAISE CREST EL. 972.5 m – NOTES & SPECIFICATIONS FOR
VERTICAL FILTER CONSTRUCTION MPMC-XD-06-01 STAGE 10 CREST EL. 972.5 m TSF – INSTRUMENTATION PLAN MPMC-XD-06-02 STAGE 10 SOUTH EMBANKMENT CREST EL. 972.5 m – INSTRUMENTATION
PLAN MPMC-XD-06-03 STAGE 10 SOUTH EMBANKMENT AND MAIN EMBANKMENT CREST EL.
972.5 m – INSTRUMENTATION PLAN MPMC-XD-06-04 STAGE 10 MAIN EMBANKMENT CREST EL. 972.5 m – INSTRUMENTATION
PLAN MPMC-XD-06-05 STAGE 10 MAIN EMBANKMENT AND PERIMETER EMBANKMENT CREST EL.
972.5 m – INSTRUMENTATION PLAN

Mount Polley Mining Corporation, Mount Polley Mine July 25, 2014 Tailings Storage Facility Stage 10 Raise Design Report – FINAL Project No.: 1197001.4.2
N:\BGC\Projects\1197 Mt Polley 2013\2014\Stage 10 - 972.5m Crest\Stage 10 Interim Raise Design Report\MPMC TSF Stage 10 Design Report_July 25 Final.docx Page ix
BGC ENGINEERING INC.
MPMC-XD-06-06 STAGE 10 PERIMETER EMBANKMENT CREST EL. 972.5 m –INSTRUMENTATION PLAN – SHEET 1
MPMC-XD-06-07 STAGE 10 PERIMETER EMBANKMENT CREST EL. 972.5 m –INSTRUMENTATION PLAN – SHEET 2
Mount Polley Mining Corporation, Mount Polley Mine July 25, 2014 Tailings Storage Facility Stage 10 Raise Design Report – FINAL Project No.: 1197001.4.2
N:\BGC\Projects\1197 Mt Polley 2013\2014\Stage 10 - 972.5m Crest\Stage 10 Interim Raise Design Report\MPMC TSF Stage 10 Design Report_July 25 Final.docx Page x
BGC ENGINEERING INC.
LIMITATIONS
BGC Engineering Inc. (BGC) prepared this document for the account of Mount Polley Mining Corporation (MPMC). The material in it reflects the judgment of BGC staff in light of the information available to BGC at the time of document preparation. Any use which a third party makes of this document or any reliance on decisions to be based on it is the responsibility of such third parties. BGC accepts no responsibility for damages, if any, suffered by any third party as a result of decisions made or actions based on this document.
As a mutual protection to our client, the public, and ourselves, all documents and drawings are submitted for the confidential information of our client for a specific project. Authorization for any use and/or publication of this document or any data, statements, conclusions or abstracts from or regarding our documents and drawings, through any form of print or electronic media, including without limitation, posting or reproduction of same on any website, is reserved pending BGC’s written approval. If this document is issued in an electronic format, an original paper copy is on file at BGC and that copy is the primary reference with precedence over any electronic copy of the document, or any extracts from our documents published by others.
Mount Polley Mining Corporation, Mount Polley Mine July 25, 2014 Tailings Storage Facility Stage 10 Raise Design Report – FINAL Project No.: 1197001.4.2
MPMC TSF Stage 10 Design Report_July 25 Final Page 1
BGC ENGINEERING INC.
1.0 INTRODUCTION
Mount Polley Mining Corporation (MPMC) owns and operates the Mount Polley open pit copper mine near Likely, B.C. The Mount Polley Mine (MPM) tailings storage facility (TSF) embankment is currently permitted, under B.C. Ministry of Energy and Mines (MEM) Permit No. M-200, to be raised to a crest elevation of El. 970 m. The Stage 9a crest raise to the permitted crest elevation of 970 m was designed by AMEC Environment and Infrastructure (AMEC), with construction commencing in the spring of 2014. BGC Engineering Inc. (BGC) has been retained to provide design for ongoing crest raising above El. 970 m to meet continuing tailings and waste storage capacity requirements.
This report covers the design and construction specifications, and supporting stability analyses, for the Stage 10 crest raise to El. 972.5 m, the crest elevation deemed necessary to provide sufficient tailings and water storage capacity through to the fall of 2015, by which time the Stage 11 crest raise would be complete or near complete. The Stage 10 crest raise to El. 972.5 m raise will be undertaken in the second half of the 2014 construction season, immediately upon completion to El. 970 m.
An updated design report for the Mount Polley TSF will be prepared by BGC for raising above El. 972.5 m and will be submitted in early 2015.
This report is organized as follows:
Section 2 – provides an overview of the project, and background information pertinent to the design and construction of the Stage 10 raise.
Section 3 – presents the design and operating criteria forming the basis for the design of the crest raise to El. 972.5 m. This includes a review of previous criteria and recommended updates in line with the Canadian Dam Association guidelines (CDA, 2007), and the draft CDA Bulletin on Mining Dams (CDA, 2013).
Section 4 – provides the basis for selection of El. 972.5 m as the target crest elevation for the Stage 10 raise, and the basis for selection of annual crest raise target elevations going forward to 2015 and beyond.
Section 5 – presents a brief review of piezometer and inclinometer data to date within the dam, pertinent to piezometric and shear strength conditions for the stability analyses. Recommendations for expansion of the instrumentation coverage are also provided.
Section 6 – presents the limit equilibrium stability analyses for the Stage 10 dam crest El. 972.5 m. This section also provides a review of the shear strength conditions used for the various embankment zones and foundation units.
Section 7 – presents the design for the raise of the dam to El. 972.5 m. Construction drawings, which include the technical specifications, are appended to the report.
Section 8 – provides a summary and recommendations.
Mount Polley Mining Corporation, Mount Polley Mine July 25, 2014 Tailings Storage Facility Stage 10 Raise Design Report – FINAL Project No.: 1197001.4.2
MPMC TSF Stage 10 Design Report_July 25 Final Page 2
BGC ENGINEERING INC.
2.0 BACKGROUND
2.1. Project Overview
The Mount Polley Mine is a copper and gold mine owned by Imperial Metals Corporation and operated by MPMC. The site is located 56 km northeast of Williams Lake, British Columbia. MPM began production in 1997 and operated until October 2001, when operations were suspended for economic reasons. In March 2005, the mine restarted production and has been in continuous operation since. Ore is crushed and processed by selective flotation to produce a copper-gold concentrate. The mill throughput rate is approximately 21,800 tonnes per day (approximately 8.0 million tonnes per year).
An overview of the mine site is shown on Figure 2-1. The mine is located between Polley Lake and Bootjack Lake. The TSF is located about 3 km southeast of the mill. The TSF is comprised of one overall embankment that was approximately 4.8 km in length at the end of 2013. The embankment is subdivided into three (3) sections; referred to as the Main Embankment, Perimeter Embankment and South Embankment (see Figure 2-1). Heights vary along the embankment and are approximately 55 m, 37 m, and 29 m for the Main, Perimeter and South Embankments respectively. The TSF is shown in plan on Drawing MPMC-XD-01-01.
The overall embankment has incorporated a staged expansion design utilizing a modified centerline (partial upstream) construction methodology through Stage 8 and transitioned to centreline construction with the initiation of Stage 8a in late 2012. The latest expansion was completed in November 2013, and entailed a 3.5 m embankment raise to a crest elevation of about 967 m. The 2013 construction is documented by AMEC (2014). The dam section comprises a compacted till starter dam, above which the till core zone (Zone S) was raised, until Stage 8a, via a partial upstream shift (i.e. modified centerline) for each annual raise. Downstream of the core is a graded filter zone (Zone F), and a transition rockfill zone (Zone T), providing for a filter sequence between Zone S and Zone C (downstream shell of rockfill, sourced from non-potentially acid generating mine waste rock). Upstream support for the annual raises of the till core is provided by Zone U (select fill, comprising tailings sand and waste rock). Sections showing the zonation of the embankments are shown on Drawings MPMC-XD-03-01 through MPMC-XD-03-04.
Mount Polley Mining Corporation, Mount Polley Mine July 25, 2014 Tailings Storage Facility Stage 10 Raise Design Report – FINAL Project No.: 1197001.4.2
MPMC TSF Stage 10 Design Report_July 25 Final Page 3
BGC ENGINEERING INC.
Figure 2-1. Aerial view of mine site: October, 2013.
TSF
Mill Site
Pits
Waste Dumps
Polley Lake
Bootjack Lake
~ 1 km
Perimeter Embankment
Main Embankment
South Embankment
Mount Polley Mining Corporation, Mount Polley Mine July 25, 2014 Tailings Storage Facility Stage 10 Raise Design Report – FINAL Project No.: 1197001.4.2
MPMC TSF Stage 10 Design Report_July 25 Final Page 4
BGC ENGINEERING INC.
A system of foundation drains underlies the downstream shell of the dam, and is installed within the base of the tailings deposit, and immediately to the upstream of the till core. Drainage systems are installed upstream and downstream of the till core:
Upstream Drainage System – The design objective of the upstream drainage system is to lower the phreatic surface within the tailings in proximity to the dam, increasing embankment stability and seepage control, and facilitating consolidation of the upstream tailings to provide sufficient support for the modified centerline (slight upstream) raising geometry of the till core. The upstream drainage system comprises: Basin groundwater drains upstream of the Main Embankment. These drains extend
below the Main Embankment, which discharge into the drain monitoring sump immediately upstream of the Main Embankment seepage collection pond.
Upstream toe drains constructed at El. 931 m. These drains extend below the Main Embankment at both abutments, and conducted seepage in pipes to the aforementioned drain monitoring sump.
Upstream toe drains were also constructed within the Perimeter Embankment and the South Embankment portions of the dam.
Flow reporting to the upstream drainage system is channeled via pipes below the till core of the dam to the downstream seepage monitoring sumps and the Main Embankment seepage collection pond sump.
The upstream drainage system is redundant with the shift to centerline raise geometry, and should be decommissioned prior to closure. Design for such decommissioning is to be provided in the next phase of design for the TSF.
Downstream Drainage System – The downstream drainage system comprises a series of longitudinal perforated drain pipes to conduct collected seepage flow to the monitoring sumps and the collection ponds. The function of the drains is to reduce seepage pressures associated with upward hydraulic gradients within the foundation soils below the dam, on the downstream side of the till core. This system was intended to function during start up conditions with water impounded behind the starter dam, but no tailings deposit to limit seepage into the foundation. With an extensive tailings deposit now established to limit seepage gradients, the downstream drainage system is now largely redundant.
2.2. Tailings Management Operations
Tailings are transported from the mill to the impoundment via an approximately 7 km long HDPE pipeline. The pipeline design flow is 20,000 tpd at about 35% solids by dry weight. Tailings are discharged into the impoundment via single points from various locations, and into hydraulic fill cells adjacent to the dam to form the upstream Zone U shell (see Section 7.3.2).
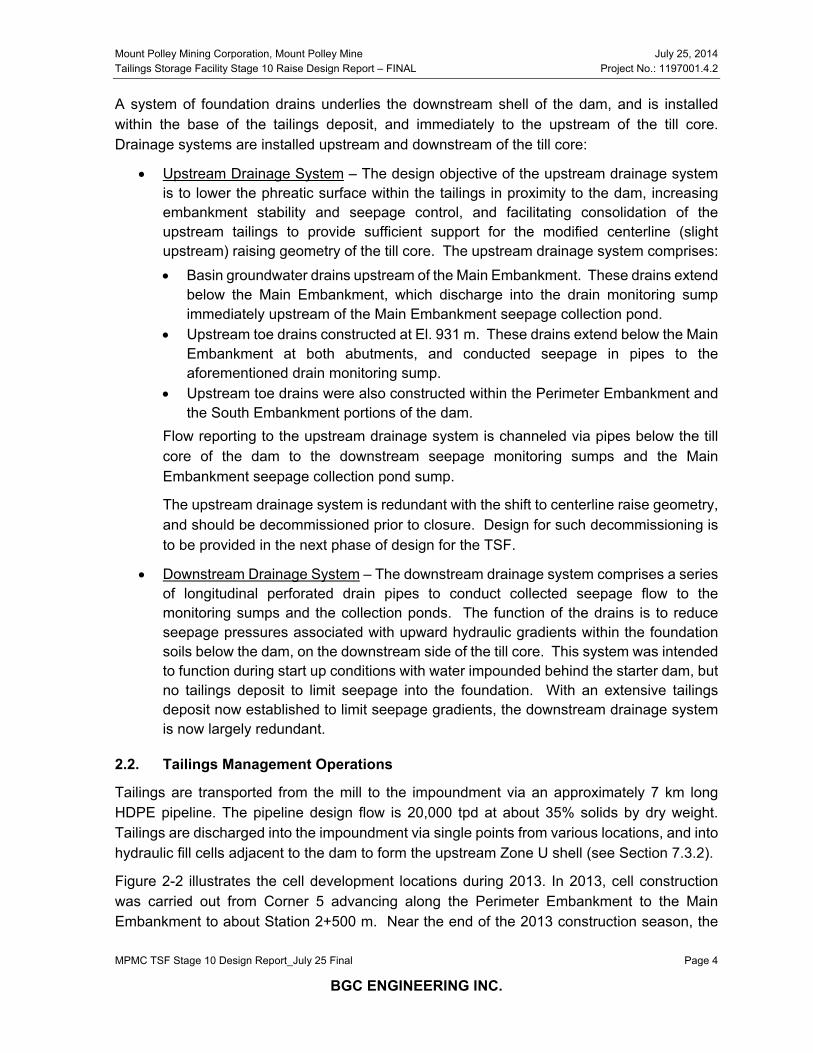
Figure 2-2 illustrates the cell development locations during 2013. In 2013, cell construction was carried out from Corner 5 advancing along the Perimeter Embankment to the Main Embankment to about Station 2+500 m. Near the end of the 2013 construction season, the
Mount Polley Mining Corporation, Mount Polley Mine July 25, 2014 Tailings Storage Facility Stage 10 Raise Design Report – FINAL Project No.: 1197001.4.2
MPMC TSF Stage 10 Design Report_July 25 Final Page 5
BGC ENGINEERING INC.
pipeline route was re-graded near Corner 5 to provide room for embankment expansion at the abutment. Single point discharge from Station 2+500 m was maintained for about two weeks to facilitate beach development along the Main Embankment, after which discharge was relocated to Corner 4. Cellular development began along the South Embankment towards the end of 2013.
Figure 2-2. TSF plan, showing tailings discharge locations, and areas of hydraulic fill placement
cells for Zone U construction in 2013.
2.3. Process Water Reclaim
The tailings pond supernatant is recycled to the mill for use as process water. It is transported via the reclaim pumping system, which consists of a barge mounted pump, pipeline and booster pump station.
2.4. Seepage Collection Ponds
Seepage collection ponds are located downstream of each of the three embankments that create the TSF, as shown on Figure 2-2, and on Drawing MPMC-XD-01-01. The seepage collection ponds collect seepage from the embankments, embankment drain discharge, and
Mount Polley Mining Corporation, Mount Polley Mine July 25, 2014 Tailings Storage Facility Stage 10 Raise Design Report – FINAL Project No.: 1197001.4.2
MPMC TSF Stage 10 Design Report_July 25 Final Page 6
BGC ENGINEERING INC.
runoff from the embankment and reporting catchments. Construction records and discussions with MPMC personnel indicate that the ponds were excavated into glacial till of low hydraulic conductivity. Water reporting to the collection ponds is pumped back to the TSF. MPMC samples and analyzes the seepage for water quality on a regular basis.
2.5. Project History
2.5.1. TSF Construction
The starter dam for the TSF embankment was constructed in 1996 to a crest elevation of 927.0 m. The starter dam was a homogeneous embankment constructed out of compacted till. Beyond the starter dam, the TSF embankment comprised compacted till as well as filter and rockfill zones. The embankment was raised in subsequent years as shown in Figure 2-3.
Figure 2-3. TSF Dam Crest Raising History.
Construction of the Stage 9a dam raise of 3.0 m, from an approximate starting El. 967.0 m to final El. 970.0 m, was started at the end of April 2014. The dam is currently permitted to a maximum crest elevation of 970 m. Immediately upon completion to El. 970 m, crest raising will continue in 2014 to a Stage 10 target crest elevation of 972.5 m. The Stage 10 crest raise is expected to provide sufficient tailings, water storage, and flood storage freeboard until the end of September, 2015, as discussed further in Section 3.1.
Year (end of)
Dam
Cre
st E
leva
tion
(m)
1996
1997
1998
1999
2000
2001
2002
2003
2004
2005
2006
2007
2008
2009
2010
2011
2012
2013
2014
920
925
930
935
940
945
950
955
960
965
970
975
980
Target crest elevation for 2014 construction season is 972.5 m.
Starter dam crest El. 927 m
Mount Polley Mining Corporation, Mount Polley Mine July 25, 2014 Tailings Storage Facility Stage 10 Raise Design Report – FINAL Project No.: 1197001.4.2
MPMC TSF Stage 10 Design Report_July 25 Final Page 7
BGC ENGINEERING INC.
2.5.2. Transition of Engineer of Record
The design and construction monitoring of the TSF embankments from mine start up to early 2011 had been completed under the direction of Knight Piésold Limited (KP). AMEC assumed the role of Engineer of Record for the TSF embankment as of 28 January 2011. AMEC will maintain Engineer of Record responsitbilites through the completion of the Stage 9a raise to El. 970 m. Todd Martin, P.Eng., of BGC will assume Engineer-of-Record duties as construction proceeds above El. 970 m.
2.6. Key References
Table 2-1 lists key references pertinent to geotechnical site characterization, design, analysis, and instrumentation/performance of the TSF.
Mount Polley Mining Corporation, Mount Polley Mine July 25, 2014 Tailings Storage Facility Stage 10 Raise Design Report – FINAL Project No.: 1197001.4.2
MPMC TSF Stage 10 Design Report_July 25 Final Page 8
BGC ENGINEERING INC.
Table 2-1. List of key references for Mount Polley TSF.
Report Author Report Date Report Title Contents
Knight Piésold Limited 1990 Report on Geotechnical Investigations and Design of Open Pit, Waste Dumps and Tailings Storage Facility, 1990
Test pits and borehole investigations including within the TSF area, undertaken in support of feasibility level evaluations of the TSF.
Knight Piésold Limited May 26, 1995 Imperial Metals Corp. Mt. Polley Project: Tailings Storage Facility Design Report, 2 vols.
Design report for the TSF. Included, as an appendix, a site investigation report that included test pit logs, borehole logs, and laboratory testing (index tests and triaxial testing) on foundation and embankment materials from the 1989-90 investigations, along with additional test pits undertaken in 1995.
Knight Piésold Limited February 7, 1997 Mount Polley Project: 1996 Groundwater Monitoring Well Installation Program, Ref.No. 1628/4.
Installation of six groundwater monitoring wells around the perimeter of the TSF. Continuous SPT’s were performed in the upper 10 m, and at approximately 1 m at greater depth.
Knight Piésold Limited June 6, 1997 Mount Polley Project: Tailings Storage Facility – Updated Design Report
Update of the design report, incorporating additional site investigation data obtained subsequent to the 1995 design report, which included 4 geotechnical boreholes (Appendix A), 3 boreholes for piezometer installations (Appendix B, including SPT blowcounts at 3 m intervals), 27 boreholes for borrow investigations, and over 120 test pits (Appendix A). Also included 10 shallow ( 10 m) piezocone soundings to check anomalously low SPT blowcounts in silts within the Main Embankment foundation. This report provides a comprehensive summary of the overburden stratigraphy and geology of the TSF area.
Knight Piésold Limited November 6, 1997 Stage 2A Tailings Facility Construction. Ref.No. 10162/9-2. Index property data (moisture content, Atterberg limits) for till borrow used for dam construction.
Knight Piésold Limited March 14, 2005 Design of the Tailings Storage Facility to Ultimate Elevation Design report for raising of the dam to crest El. 965 m.
AMEC Earth & Environmental Ltd. December 2006 Dam Safety Review Mt. Polley Mine - Tailings
Storage Facility, December. Independent dam safety review (DSR) of the TSF, with commentary on consequence classification, design criteria, instrumentation coverage, and uncertainties associated with the glaciolacustrine unit.
Knight Piésold Limited March 13, 2007 Stage 4 Tailings Facility Construction. Ref.No. VA101-1/10-1). Stage 4 dam raising construction report, including borehole logs for installed inclinometers.
Knight Piésold Limited June 8, 2007 Stage 6 Design of the Tailings Storage Facility Stage 6 design to crest El. 958 m, and responses to the AMEC (2006) DSR.
AMEC Environment & Infrastructure March 28, 2012 Mount Polley Mine Project: Tailings Storage Facility
- 2011 Geotechnical Site Investigation – FINAL
Report on sonic drilling and installation of additional inclinometers and piezometers in the dam and its foundation. Laboratory index testing on selected samples from the sonic cores. Program involved 14 sonic boreholes, 11 for piezometer installations (with two to three vibrating wire piezometer tips per borehole), and 3 for inclinometer installations.
BGC Engineering Inc. April 8, 2013 Mount Polley Mine – Tailings Storage Facility 2012 Annual Review – Final. Instrumentation review and interpretation through 2012.
AMEC Environment & Infrastructure
April 8, 2014 Mount Polley Mine – Tailings Storage Facility 2012 Annual Review – Final.
Instrumentation review and interpretation through 2013, and as-built report for 2013 construction.
Mount Polley Mining Corporation, Mount Polley Mine July 25, 2014 Tailings Storage Facility Stage 10 Raise Design Report – FINAL Project No.: 1197001.4.2
MPMC TSF Stage 10 Design Report_July 25 Final Page 9
BGC ENGINEERING INC.
3.0 DESIGN & OPERATING CRITERIA
3.1. CDA Consequence Classification
A formal dam safety review (DSR) was conducted in 2006 (AMEC 2006). MPMC has scheduled the next DSR for 2015, subsequent to the submitted of the design for the next phase of raising.
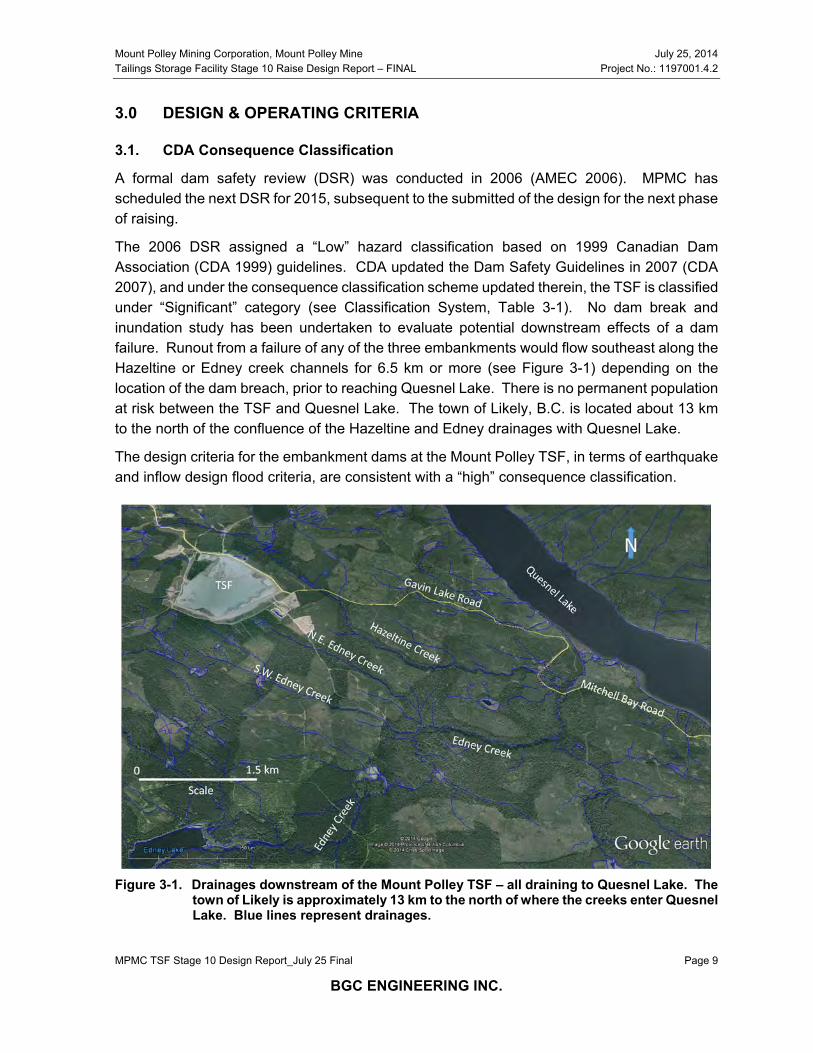
The 2006 DSR assigned a “Low” hazard classification based on 1999 Canadian Dam Association (CDA 1999) guidelines. CDA updated the Dam Safety Guidelines in 2007 (CDA 2007), and under the consequence classification scheme updated therein, the TSF is classified under “Significant” category (see Classification System, Table 3-1). No dam break and inundation study has been undertaken to evaluate potential downstream effects of a dam failure. Runout from a failure of any of the three embankments would flow southeast along the Hazeltine or Edney creek channels for 6.5 km or more (see Figure 3-1) depending on the location of the dam breach, prior to reaching Quesnel Lake. There is no permanent population at risk between the TSF and Quesnel Lake. The town of Likely, B.C. is located about 13 km to the north of the confluence of the Hazeltine and Edney drainages with Quesnel Lake.
The design criteria for the embankment dams at the Mount Polley TSF, in terms of earthquake and inflow design flood criteria, are consistent with a “high” consequence classification.
Figure 3-1. Drainages downstream of the Mount Polley TSF – all draining to Quesnel Lake. The
town of Likely is approximately 13 km to the north of where the creeks enter Quesnel Lake. Blue lines represent drainages.
Mount Polley Mining Corporation, Mount Polley Mine July 25, 2014 Tailings Storage Facility Stage 10 Raise Design Report – FINAL Project No.: 1197001.4.2
MPMC TSF Stage 10 Design Report_July 25 Final Page 10
BGC ENGINEERING INC.
Table 3-1. CDA (2007) consequence classification scheme.
Dam Class Population
at Risk [note 1]
Incremental Losses
Loss of Life [note 2]
Environmental and Cultural Values
Infrastructure and Economics
Low None 0 Minimal short-term loss No long-term loss
Low economic losses; area contains limited infrastructure or services
Significant Temporary only Unspecified
No significant loss or deterioration of fish or wildlife habitat Loss of marginal habitat only Restoration or compensation in kind highly possible
Losses to recreational facilities, seasonal workplaces, and infrequently used transportation routes
High Permanent 10 or fewer
Significant loss or deterioration of important fish or wildlife habitat Restoration or compensation in kind highly possible
High economic losses affecting infrastructure, public transportation, and commercial facilities
Very High Permanent 100 or fewer
Significant loss or deterioration of critical fish or wildlife habitat Restoration or compensation in kind possible but impractical
Very high economic losses affecting important infrastructure or services (e.g. highway, industrial facility, storage facilities for dangerous substances)
Extreme Permanent More than 100
Major loss of critical fish or wildlife habitat Restoration or compensation in kind impossible
Extreme losses affecting critical infrastructure or services (e.g. hospital, major industrial complex, major storage facilities for dangerous substances)
Note 1. Definitions for population at risk: None – There is no identifiable population at risk, so there is no possibility of loss of life other than through unforeseeable misadventure. Temporary – People are only temporarily in the dam-breach inundation zone (e.g. seasonal cottage use, passing through on transportation routes, participating in recreational activities). Permanent – The population at risk is ordinarily located in the dam-breach inundation zone (e.g. as permanent residents); three consequence classes (high, very high, extreme) are proposed to allow for more detailed estimates of potential loss of life (to assist in decision-making if the appropriate analysis is carried out).
Note 2. Implications for loss of life: Unspecified – The appropriate level of safety required at a dam where people are temporarily at risk depends on the number of people, the exposure time, the nature of their activity, and other conditions. A higher class could be appropriate, depending on the requirements. However, the design flood requirement, for example, might not be higher if the temporary population is not likely to be present during the flood season.
Mount Polley Mining Corporation, Mount Polley Mine July 25, 2014 Tailings Storage Facility Stage 10 Raise Design Report – FINAL Project No.: 1197001.4.2
MPMC TSF Stage 10 Design Report_July 25 Final Page 11
BGC ENGINEERING INC.
3.2. Tailings Storage Capacity
Tailings storage capacity requirements for the El. 972.5 m raise are based on the following, as provided by MPMC:
Mill throughput rate (assume equal to tailings production) – 21,918 tonnes/day (8 million tonnes per year)
Assumed average in place dry density – 1.4 tonnes/m3 As discussed in Section 4.3, the Stage 10 target crest elevation of 972.5 m is to provide sufficient tailings, water, and flood storage/freeboard capacity to the end of September 2015, by which time the Stage 11 crest raise would be complete, or near complete.
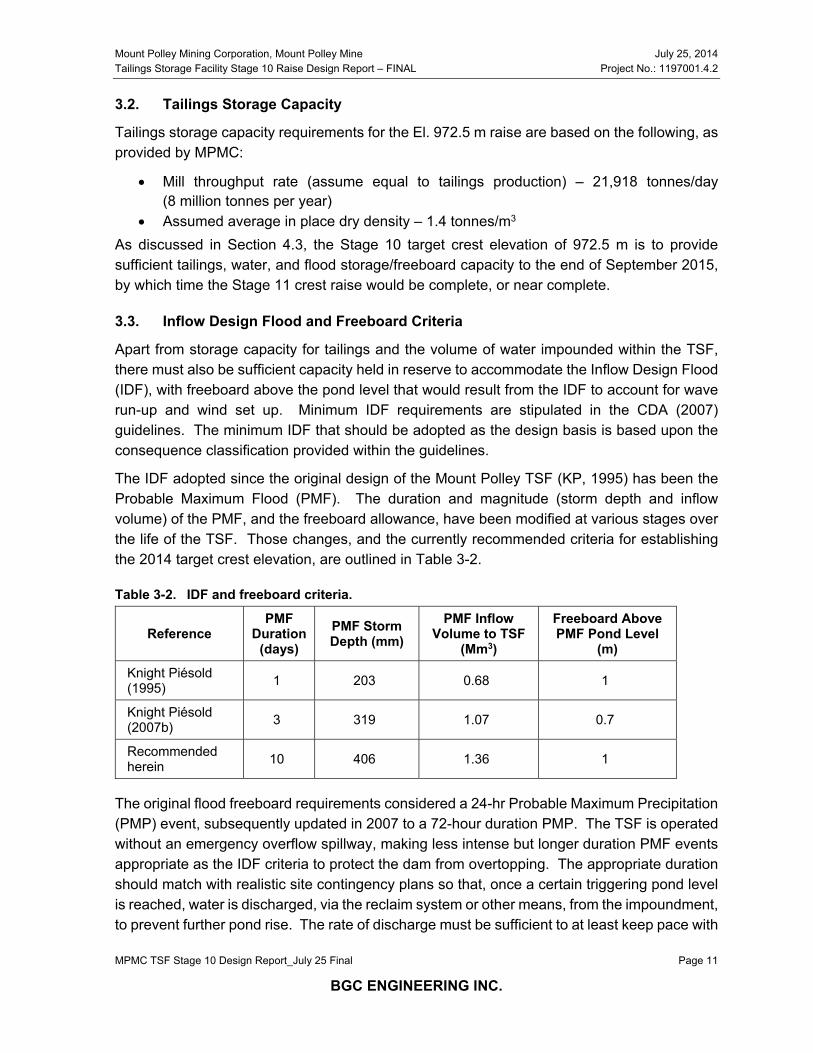
3.3. Inflow Design Flood and Freeboard Criteria
Apart from storage capacity for tailings and the volume of water impounded within the TSF, there must also be sufficient capacity held in reserve to accommodate the Inflow Design Flood (IDF), with freeboard above the pond level that would result from the IDF to account for wave run-up and wind set up. Minimum IDF requirements are stipulated in the CDA (2007) guidelines. The minimum IDF that should be adopted as the design basis is based upon the consequence classification provided within the guidelines.
The IDF adopted since the original design of the Mount Polley TSF (KP, 1995) has been the Probable Maximum Flood (PMF). The duration and magnitude (storm depth and inflow volume) of the PMF, and the freeboard allowance, have been modified at various stages over the life of the TSF. Those changes, and the currently recommended criteria for establishing the 2014 target crest elevation, are outlined in Table 3-2.
Table 3-2. IDF and freeboard criteria.
Reference PMF
Duration (days)
PMF Storm Depth (mm)
PMF Inflow Volume to TSF
(Mm3)
Freeboard Above PMF Pond Level
(m) Knight Piésold (1995) 1 203 0.68 1
Knight Piésold (2007b) 3 319 1.07 0.7
Recommended herein 10 406 1.36 1
The original flood freeboard requirements considered a 24-hr Probable Maximum Precipitation (PMP) event, subsequently updated in 2007 to a 72-hour duration PMP. The TSF is operated without an emergency overflow spillway, making less intense but longer duration PMF events appropriate as the IDF criteria to protect the dam from overtopping. The appropriate duration should match with realistic site contingency plans so that, once a certain triggering pond level is reached, water is discharged, via the reclaim system or other means, from the impoundment, to prevent further pond rise. The rate of discharge must be sufficient to at least keep pace with
Mount Polley Mining Corporation, Mount Polley Mine July 25, 2014 Tailings Storage Facility Stage 10 Raise Design Report – FINAL Project No.: 1197001.4.2
MPMC TSF Stage 10 Design Report_July 25 Final Page 12
BGC ENGINEERING INC.
ongoing inflows from longer duration PMF events, so that overtopping is prevented and freeboard is maintained. MPMC indicates the maximum rate at which water can be pumped out of the TSF is currently 10,000 gpm (54,410 m3/day).
For the time being, a 10-day duration PMF is judged suitable as the basis for establishing the target 2014 crest raise elevation. The 1 m of freeboard to account for wave run-up and wind set-up is judged conservative, which is appropriate until the PMF and freeboard criteria can be fully reviewed and updated as part of the next phase of design, to be submitted in early 2015. For that phase, inflow hydrographs for long duration PMF’s should be developed, and the PMF selected on the basis of the daily pump out rate exceeding the daily inflow rate at the tail end of the hydrograph.
3.4. Seismic Design Criteria
CDA (2007) recommends minimum seismic design criteria based on the consequence classification. Based on the consequence classification of “significant” (see Table 3-1), CDA (2007) recommends adoption of an earthquake design ground motion (EDGM) corresponding to an annual exceedance probability (AEP) of 1 in 1,000.
KP (1995) adopted the following in terms of earthquake design criteria:
Operating Basis Earthquake (OBE), applicable for the operating phase of the TSF – 1 in 475 year return period event, with the EDGM being a peak horizontal ground acceleration (PGA) of 0.037g.
Maximum Design Earthquake (MDE), applicable for closure, which was assumed to be 50% of the Maximum Credible Earthquake (MCE), with an assumed 1 in 2,500 year return period. The EDGM for this event was a PAG = 0.065g.
KP (2007b), in a design update for the TSF, the same return periods for the OBE and MDE were retained, but the EDGM values were increased to 0.07g and 0.096g, respectively.
Evolving practice for tailings dams design is leading towards adoption of more stringent seismic design criteria than outlined above from previous designs for the Mount Polley TSF. That evolution includes consideration of the long closure phase of tailings dams, which is discussed in CDA (2013), which recommends EDGM criteria for the long term closure phase as outlined in Table 3-3.
Mount Polley Mining Corporation, Mount Polley Mine July 25, 2014 Tailings Storage Facility Stage 10 Raise Design Report – FINAL Project No.: 1197001.4.2
MPMC TSF Stage 10 Design Report_July 25 Final Page 13
BGC ENGINEERING INC.
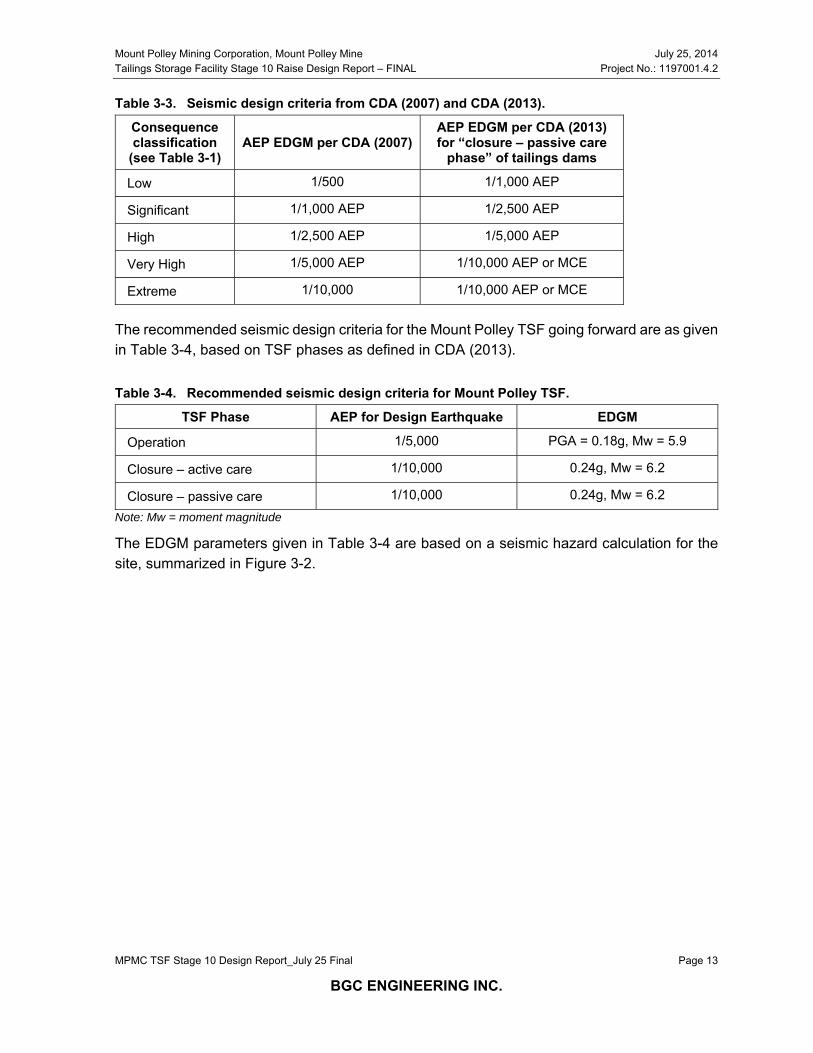
Table 3-3. Seismic design criteria from CDA (2007) and CDA (2013).
Consequence classification
(see Table 3-1) AEP EDGM per CDA (2007)
AEP EDGM per CDA (2013) for “closure – passive care
phase” of tailings dams
Low 1/500 1/1,000 AEP
Significant 1/1,000 AEP 1/2,500 AEP
High 1/2,500 AEP 1/5,000 AEP
Very High 1/5,000 AEP 1/10,000 AEP or MCE
Extreme 1/10,000 1/10,000 AEP or MCE
The recommended seismic design criteria for the Mount Polley TSF going forward are as given in Table 3-4, based on TSF phases as defined in CDA (2013).
Table 3-4. Recommended seismic design criteria for Mount Polley TSF.
TSF Phase AEP for Design Earthquake EDGM
Operation 1/5,000 PGA = 0.18g, Mw = 5.9
Closure – active care 1/10,000 0.24g, Mw = 6.2
Closure – passive care 1/10,000 0.24g, Mw = 6.2 Note: Mw = moment magnitude
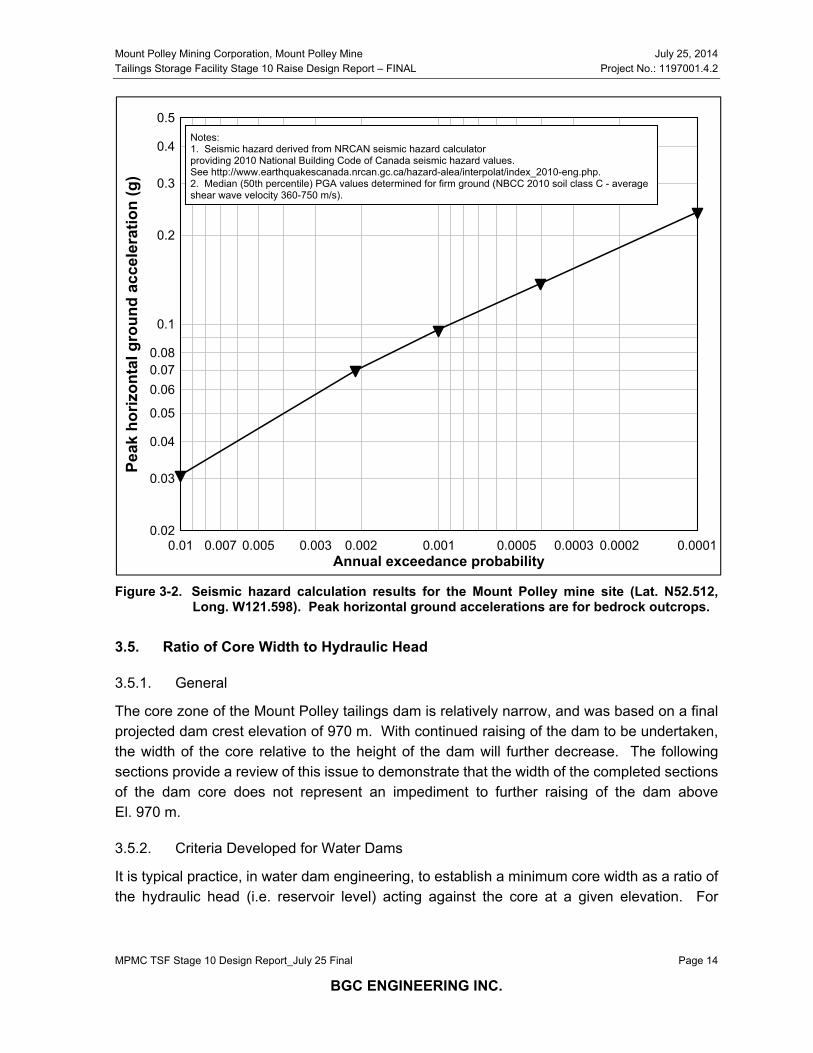
The EDGM parameters given in Table 3-4 are based on a seismic hazard calculation for the site, summarized in Figure 3-2.
Mount Polley Mining Corporation, Mount Polley Mine July 25, 2014 Tailings Storage Facility Stage 10 Raise Design Report – FINAL Project No.: 1197001.4.2
MPMC TSF Stage 10 Design Report_July 25 Final Page 14
BGC ENGINEERING INC.
Figure 3-2. Seismic hazard calculation results for the Mount Polley mine site (Lat. N52.512,
Long. W121.598). Peak horizontal ground accelerations are for bedrock outcrops.
3.5. Ratio of Core Width to Hydraulic Head
3.5.1. General
The core zone of the Mount Polley tailings dam is relatively narrow, and was based on a final projected dam crest elevation of 970 m. With continued raising of the dam to be undertaken, the width of the core relative to the height of the dam will further decrease. The following sections provide a review of this issue to demonstrate that the width of the completed sections of the dam core does not represent an impediment to further raising of the dam above El. 970 m.
3.5.2. Criteria Developed for Water Dams
It is typical practice, in water dam engineering, to establish a minimum core width as a ratio of the hydraulic head (i.e. reservoir level) acting against the core at a given elevation. For
Annual exceedance probability
Peak
hor
izon
tal g
roun
d ac
cele
ratio
n (g
)
0.00010.00020.00030.00050.0010.0020.0030.0050.0070.010.02
0.03
0.04
0.05
0.060.070.08
0.1
0.2
0.3
0.4
0.5Notes:1. Seismic hazard derived from NRCAN seismic hazard calculatorproviding 2010 National Building Code of Canada seismic hazard values.See http://www.earthquakescanada.nrcan.gc.ca/hazard-alea/interpolat/index_2010-eng.php.2. Median (50th percentile) PGA values determined for firm ground (NBCC 2010 soil class C - averageshear wave velocity 360-750 m/s).
Mount Polley Mining Corporation, Mount Polley Mine July 25, 2014 Tailings Storage Facility Stage 10 Raise Design Report – FINAL Project No.: 1197001.4.2
MPMC TSF Stage 10 Design Report_July 25 Final Page 15
BGC ENGINEERING INC.
example, the US Army Corps of Engineers (2004) states the following on the subject of the width of low permeability core zones for embankment dams:
Embankment zoning should provide an adequate impervious zone, transition zones between the core and the shells, seepage control and stability.
The core width for a central impervious core-type embankment should be established using seepage and piping considerations, types of material available for the core and shells, the filter design, and seismic considerations. In general, the width of the core at the base or cutoff should be equal to or greater than 25 percent of the difference between the maximum reservoir and minimum tailwater elevations.
This core width to head ratio criterion is also cited by Jansen et al. (1988), who state “a commonly used rule specifies that the base width of the core should be at least 25% of the maximum difference between reservoir and tailwater elevations”. Jansen et al. do allow that “however, thinner cores have been successful where appropriate materials were selected”.
A discussion by Sherard and Dunnigan (1985) illustrates that the core width to hydraulic head ratio has been and continues to be a matter of debate within the embankment dam engineering profession, Sherard and Dunnigan stating:
The width of the earth core in a dam with rockfill or gravel shells is generally chosen arbitrarily on the basis of precedent, commonly in the range between 30 and 60% of the head. There are some well known examples of completely successful dams with thinner cores; for example, at the 80 m high Nantahala Dam, completed in 1939, in Tennessee, with sloping earth core, rockfill shells and an excellent downstream filter of sand, the width of the core was about 11% of the head. In the 45 years since the construction of Nantahala Dam there have not been many dams built with cores thinner than about 25% of the head.
In the last few years thinner cores have been used at a few dams with good filters. The Svartevann Dam in Norway, completed in 1976, is a rockfill dam about 130 m high….The core width was made about 18% of the dam height.
These experiences clearly show that as long as the water seeping through the earth core material discharges into an adequate filter, there is no practical limit on the tolerable hydraulic gradient that can be safety imposed on the impervious earth core. Therefore, it is reasonable in the future to contemplate making earth cores in dams much thinner than the minimum widths used in current practice.
The experience cited above does not differentiate between sloping and vertical cores (i.e., the case for the Mount Polley TSF). There is greater potential for arching, stress transfer, and hydraulic fracture with vertical than sloping cores.
Mount Polley Mining Corporation, Mount Polley Mine July 25, 2014 Tailings Storage Facility Stage 10 Raise Design Report – FINAL Project No.: 1197001.4.2
MPMC TSF Stage 10 Design Report_July 25 Final Page 16
BGC ENGINEERING INC.
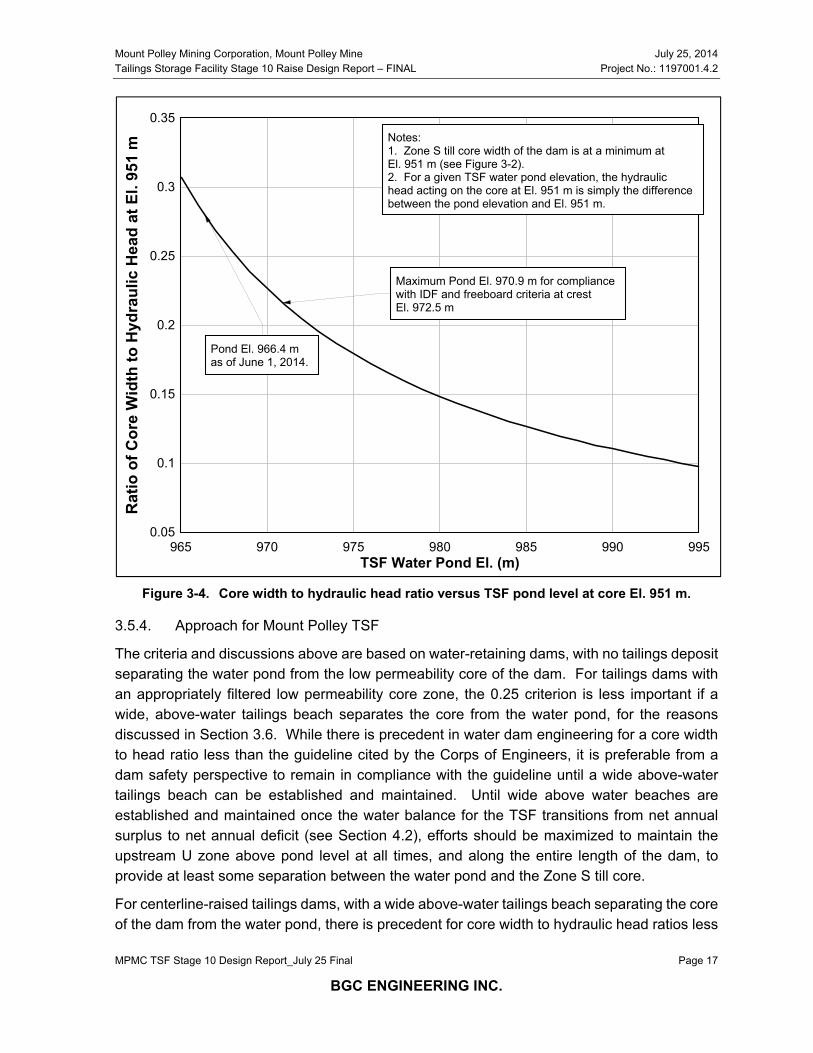
3.5.3. Core Width to Head Ratio for Mount Polley Tailings Dams
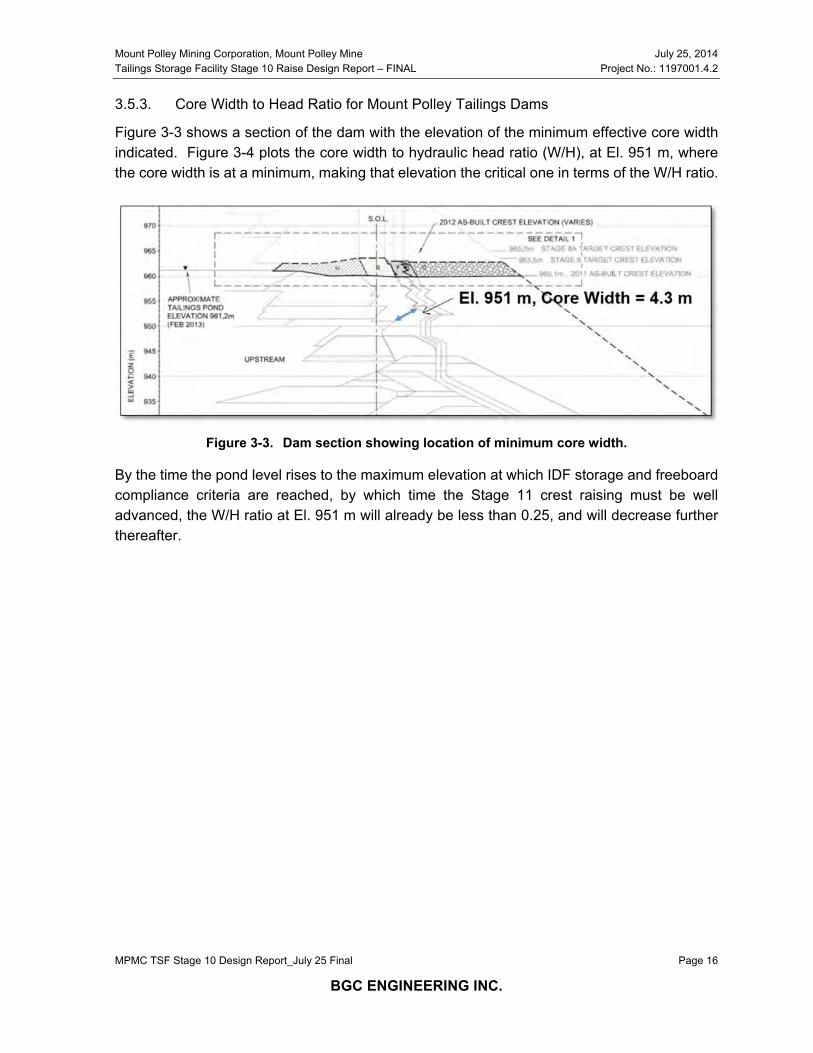
Figure 3-3 shows a section of the dam with the elevation of the minimum effective core width indicated. Figure 3-4 plots the core width to hydraulic head ratio (W/H), at El. 951 m, where the core width is at a minimum, making that elevation the critical one in terms of the W/H ratio.
Figure 3-3. Dam section showing location of minimum core width.
By the time the pond level rises to the maximum elevation at which IDF storage and freeboard compliance criteria are reached, by which time the Stage 11 crest raising must be well advanced, the W/H ratio at El. 951 m will already be less than 0.25, and will decrease further thereafter.
Mount Polley Mining Corporation, Mount Polley Mine July 25, 2014 Tailings Storage Facility Stage 10 Raise Design Report – FINAL Project No.: 1197001.4.2
MPMC TSF Stage 10 Design Report_July 25 Final Page 17
BGC ENGINEERING INC.
Figure 3-4. Core width to hydraulic head ratio versus TSF pond level at core El. 951 m.
3.5.4. Approach for Mount Polley TSF
The criteria and discussions above are based on water-retaining dams, with no tailings deposit separating the water pond from the low permeability core of the dam. For tailings dams with an appropriately filtered low permeability core zone, the 0.25 criterion is less important if a wide, above-water tailings beach separates the core from the water pond, for the reasons discussed in Section 3.6. While there is precedent in water dam engineering for a core width to head ratio less than the guideline cited by the Corps of Engineers, it is preferable from a dam safety perspective to remain in compliance with the guideline until a wide above-water tailings beach can be established and maintained. Until wide above water beaches are established and maintained once the water balance for the TSF transitions from net annual surplus to net annual deficit (see Section 4.2), efforts should be maximized to maintain the upstream U zone above pond level at all times, and along the entire length of the dam, to provide at least some separation between the water pond and the Zone S till core.
For centerline-raised tailings dams, with a wide above-water tailings beach separating the core of the dam from the water pond, there is precedent for core width to hydraulic head ratios less
TSF Water Pond El. (m)
Rat
io o
f Cor
e W
idth
to H
ydra
ulic
Hea
d at
El.
951
m
965 970 975 980 985 990 9950.05
0.1
0.15
0.2
0.25
0.3
0.35Notes:1. Zone S till core width of the dam is at a minimum atEl. 951 m (see Figure 3-2).2. For a given TSF water pond elevation, the hydraulichead acting on the core at El. 951 m is simply the differencebetween the pond elevation and El. 951 m.
Pond El. 966.4 mas of June 1, 2014.
Maximum Pond El. 970.9 m for compliancewith IDF and freeboard criteria at crestEl. 972.5 m
Mount Polley Mining Corporation, Mount Polley Mine July 25, 2014 Tailings Storage Facility Stage 10 Raise Design Report – FINAL Project No.: 1197001.4.2
MPMC TSF Stage 10 Design Report_July 25 Final Page 18
BGC ENGINEERING INC.
than the minimum 0.25 developed for conventional water dams. One example is the L-L tailings dam at the Highland Valley Copper Mine (Singh et al., 2008, 2014). For this dam, the core width to head ratio as of 2013 was about 0.15, and with continued raising to the permitted design crest, will eventually reduce to about 0.11.
As indicated in Figure 3-4, the W/H ratio for the Mount Polley TSF is not projected to approach the ratio applicable for the L-L Dam (0.15) until the pond reaches about El. 980 m. By that time, the width of the above-water tailings beach (see Section 3.6) is expected to be substantially greater than current conditions (see discussion of TSF water balance issues in Section 4.2). Once wide beaches are achieved and maintained, the governing factor in terms of the core W/H ratio will therefore be the continuity of the filter sequence downstream of it, which in turn will be governed by the potential deformation that the dam could experience during a design earthquake event (see Section 3.4). The design approach for continued raising of the Mount Polley TSF in terms of core width will be as follows:
A core width of at least 5 m will be maintained, which would result in a W/H ratio at El. 970 m of 0.25 for a TSF pond elevation of 990 m.
If seismic deformation analyses indicate significant potential movements of the dam above El. 970 m, the core and/or downstream filter sequence may be required to be widened.
Below El. 970 m, seismic deformation analyses will be used to estimate potential deformations of the core and the downstream filter sequence, and to guide the design of a downstream rockfill shell of sufficient width and slope to restrain predicted deformations to tolerable levels given the width of the core and filter zones.
Seismic deformation analyses will be undertaken as part of the next phase of dam raise design above crest El. 972.5 m.
3.6. Above Water Tailings Beach
An above water tailings beach, separating the dams from the TSF operating pond, represents a fundamental structural element of the dams. Such a feature achieves the following key functions:
Support for ongoing centerline raising of the dam Reduction of seepage from the TSF Reduction of hydraulic seepage gradients, of particular importance given the low W/H
ratio for the core of the dams Reduction of pore pressures in the foundation soils underlying the dams Greatly restricts the supply of water to propagate a hydraulic fracture that could develop
in a narrow core zone Limits the rate at which water can flow through any defects (e.g. cracks) in the core Where tailings are directly against the upstream side of the core, they could potential
function as a crack-stopper.
Mount Polley Mining Corporation, Mount Polley Mine July 25, 2014 Tailings Storage Facility Stage 10 Raise Design Report – FINAL Project No.: 1197001.4.2
MPMC TSF Stage 10 Design Report_July 25 Final Page 19
BGC ENGINEERING INC.
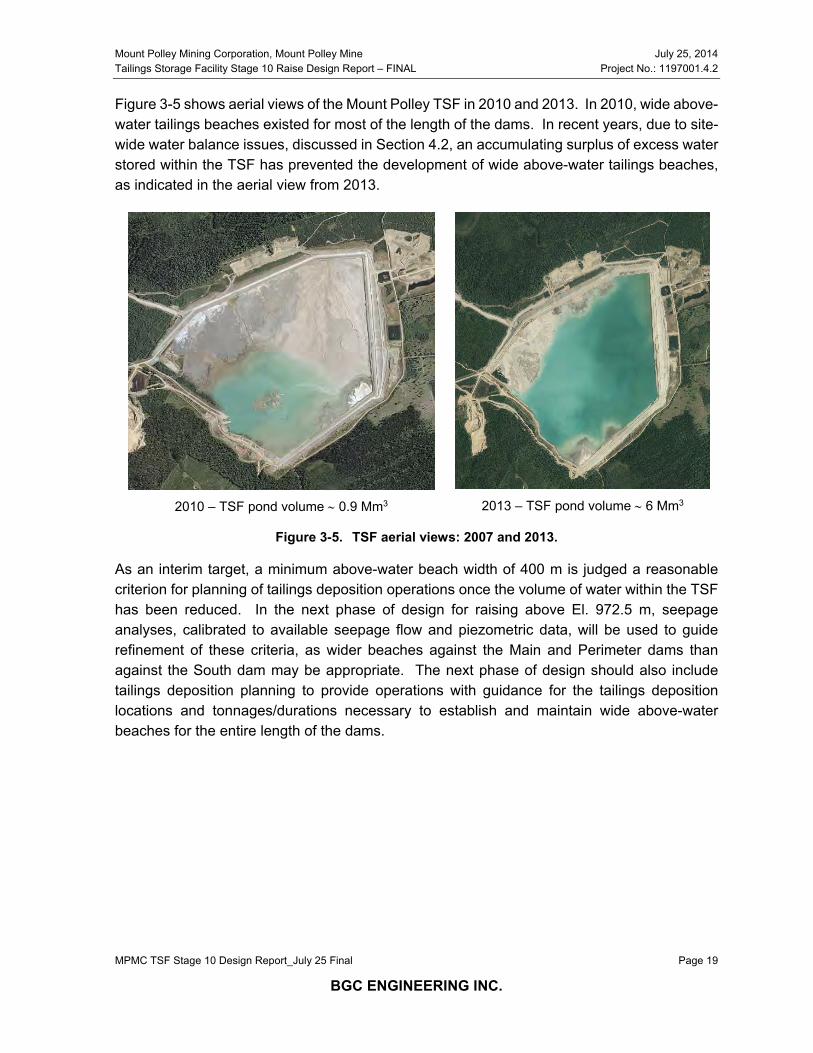
Figure 3-5 shows aerial views of the Mount Polley TSF in 2010 and 2013. In 2010, wide above-water tailings beaches existed for most of the length of the dams. In recent years, due to site-wide water balance issues, discussed in Section 4.2, an accumulating surplus of excess water stored within the TSF has prevented the development of wide above-water tailings beaches, as indicated in the aerial view from 2013.
2010 – TSF pond volume 0.9 Mm3 2013 – TSF pond volume 6 Mm3
Figure 3-5. TSF aerial views: 2007 and 2013.
As an interim target, a minimum above-water beach width of 400 m is judged a reasonable criterion for planning of tailings deposition operations once the volume of water within the TSF has been reduced. In the next phase of design for raising above El. 972.5 m, seepage analyses, calibrated to available seepage flow and piezometric data, will be used to guide refinement of these criteria, as wider beaches against the Main and Perimeter dams than against the South dam may be appropriate. The next phase of design should also include tailings deposition planning to provide operations with guidance for the tailings deposition locations and tonnages/durations necessary to establish and maintain wide above-water beaches for the entire length of the dams.
Mount Polley Mining Corporation, Mount Polley Mine July 25, 2014 Tailings Storage Facility Stage 10 Raise Design Report – FINAL Project No.: 1197001.4.2
MPMC TSF Stage 10 Design Report_July 25 Final Page 20
BGC ENGINEERING INC.
3.7. Dam Stability
3.7.1. General
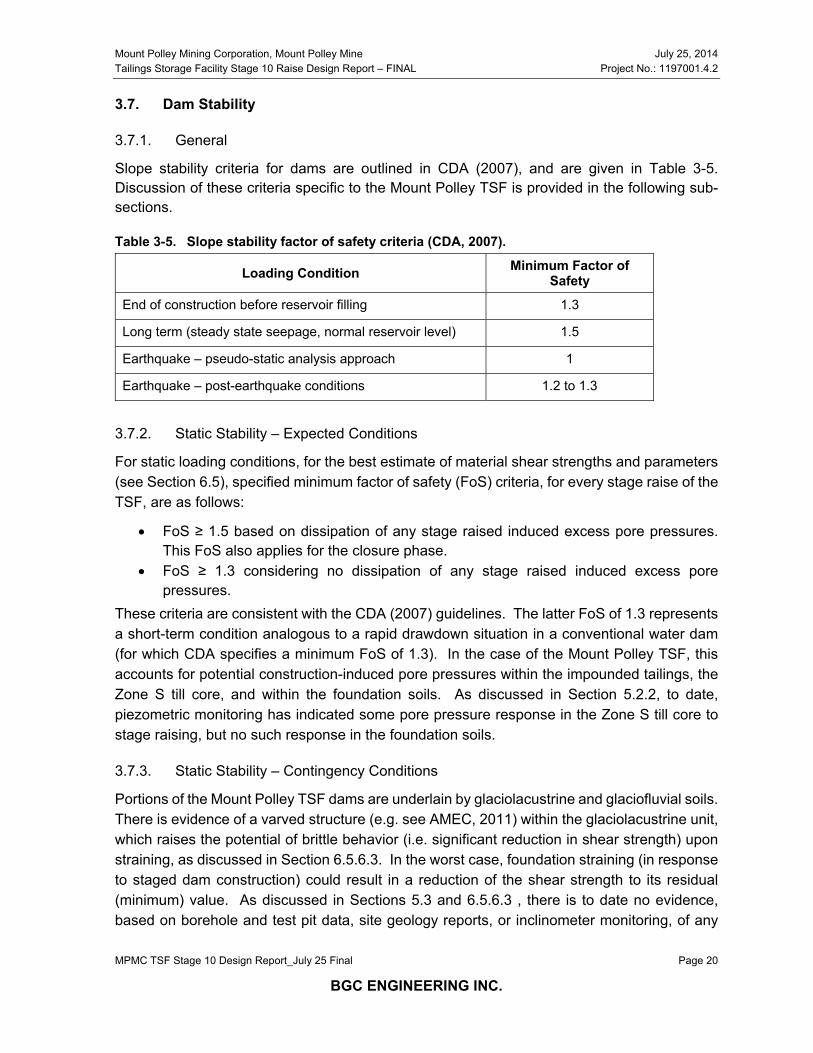
Slope stability criteria for dams are outlined in CDA (2007), and are given in Table 3-5. Discussion of these criteria specific to the Mount Polley TSF is provided in the following sub-sections.
Table 3-5. Slope stability factor of safety criteria (CDA, 2007).
Loading Condition Minimum Factor of Safety
End of construction before reservoir filling 1.3
Long term (steady state seepage, normal reservoir level) 1.5
Earthquake – pseudo-static analysis approach 1
Earthquake – post-earthquake conditions 1.2 to 1.3
3.7.2. Static Stability – Expected Conditions
For static loading conditions, for the best estimate of material shear strengths and parameters (see Section 6.5), specified minimum factor of safety (FoS) criteria, for every stage raise of the TSF, are as follows:
FoS ≥ 1.5 based on dissipation of any stage raised induced excess pore pressures. This FoS also applies for the closure phase.
FoS ≥ 1.3 considering no dissipation of any stage raised induced excess pore pressures.
These criteria are consistent with the CDA (2007) guidelines. The latter FoS of 1.3 represents a short-term condition analogous to a rapid drawdown situation in a conventional water dam (for which CDA specifies a minimum FoS of 1.3). In the case of the Mount Polley TSF, this accounts for potential construction-induced pore pressures within the impounded tailings, the Zone S till core, and within the foundation soils. As discussed in Section 5.2.2, to date, piezometric monitoring has indicated some pore pressure response in the Zone S till core to stage raising, but no such response in the foundation soils.
3.7.3. Static Stability – Contingency Conditions
Portions of the Mount Polley TSF dams are underlain by glaciolacustrine and glaciofluvial soils. There is evidence of a varved structure (e.g. see AMEC, 2011) within the glaciolacustrine unit, which raises the potential of brittle behavior (i.e. significant reduction in shear strength) upon straining, as discussed in Section 6.5.6.3. In the worst case, foundation straining (in response to staged dam construction) could result in a reduction of the shear strength to its residual (minimum) value. As discussed in Sections 5.3 and 6.5.6.3 , there is to date no evidence, based on borehole and test pit data, site geology reports, or inclinometer monitoring, of any
Mount Polley Mining Corporation, Mount Polley Mine July 25, 2014 Tailings Storage Facility Stage 10 Raise Design Report – FINAL Project No.: 1197001.4.2
MPMC TSF Stage 10 Design Report_July 25 Final Page 21
BGC ENGINEERING INC.
such degradation in foundation shear strength. Nonetheless, in keeping with the tenets of the observational approach (Peck, 1969), it is necessary to incorporate designs and/or viable plans of action to “deal with every unfavourable situation that might be disclosed by the observations”. In the case of a reduction of shear strength from peak to residual in potentially brittle soils within the foundation, there is likely to be insufficient time available to recognize and respond to such a condition. Accordingly, as a contingency measure, the following FoS criterion is applied for the staged raising of the Mount Polley TSF:
FoS ≥ 1.1 based on a reasonable worst case scenario for residual shear strength within the glaciolacustrine foundation soils.
A similar contingency design approach has been taken for the L-L Dam at the Highland Valley Copper mine in central B.C. (Singh et al., 2008). A portion of that dam is founded on sedimentary bedrock which, if sufficiently strained, could experience a significant reduction in shear strength. As per the approach proposed herein for the Mount Polley TSF, the design of the portion of the L-L Dam underlain by sedimentary bedrock is based on a minimum FoS of 1.1 considering residual shear strength conditions, and a minimum FoS of 1.5 based on the best estimate of operative shear strength conditions.
It is important to note that the residual strength case is not the design basis – it is the basis for contingency planning consistent with the observational method. If ongoing monitoring and investigations indicate that the operative shear strength of the glaciolacustrine unit, where present, is significantly lower than currently estimated, then the FoS ≥ 1.5 criterion would apply for that lower shear strength.
3.7.4. Earthquake Loading Conditions
Limit equilibrium stability criteria under earthquake loading conditions are as given in Table 3-5.
Mount Polley Mining Corporation, Mount Polley Mine July 25, 2014 Tailings Storage Facility Stage 10 Raise Design Report – FINAL Project No.: 1197001.4.2
MPMC TSF Stage 10 Design Report_July 25 Final Page 22
BGC ENGINEERING INC.
4.0 STAGE 10 CREST ELEVATION REQUIREMENT
4.1. General
The Stage 9a crest raise to the currently permitted El. 970 m configuration will not provide sufficient tailings, water, and flood storage/freeboard capacity through the summer of 2015. This section presents the basis for the selection of El. 972.5 m as the target crest elevation for the Stage 10 raise.
4.2. Water Balance Considerations
The TSF until recent years was typically operated with a pond volume sufficiently small as to allow development and maintenance of above-water tailings beaches along significant portions of the dam perimeter. However, in recent years, two changes have increased the amount of mine-impacted water which must be stored in the TSF:
Expansion of the mine footprint has increased the catchment area yielding mine-affected water that must be contained
Loss of water storage capacity in open pits due to ongoing expansion of the mining operation.
In recent years, the TSF has been operating with a significant annual water balance surplus, with the result that the volume of water stored within the TSF has increased on a year over year basis. MPMC has a permit to discharge up to 1.4 Mm3 of water per year to Hazeltine Creek, but has generally been unable to discharge more than about 10% of this amount owing to water quality constraining allowable discharge volumes. As of the end of May 2014, following what is understood to have been an abnormally high snowpack runoff and a significant multi-day rainfall event, the pond volume was estimated to be between 8 and 9 Mm3. This is significantly more water than is required to maintain a viable process water reclaim pond – in 2010, for example, the estimated volume of water in the TSF was only about 900,000 m3.
The ongoing accumulation of a water surplus within the TSF causes the following challenges:
For a given dam crest elevation, tailings storage capacity is displaced by water storage. Wide, above-water, tailings beaches that separate the dam from the reclaim water
pond, a fundamental component of the dam design as discussed in Section 3.6, can be neither established nor maintained.
The conceptual closure configuration for the TSF incorporates reclaimed (covered and vegetated), wide, above-water beaches against the dam from abutment to abutment, and a minimal water pond with an overflow spillway for pond level control. TSF pond volume that increases year over year is incompatible with operating to achieve that closure configuration.
The dam crest raising schedule has to be accelerated. The volume of water stored in the TSF is controlled by hydrologic conditions beyond MPMC’s control. The ability of MPMC to store water in open pits, a previous practice, is at odds with
Mount Polley Mining Corporation, Mount Polley Mine July 25, 2014 Tailings Storage Facility Stage 10 Raise Design Report – FINAL Project No.: 1197001.4.2
MPMC TSF Stage 10 Design Report_July 25 Final Page 23
BGC ENGINEERING INC.
current mine plans and on-going pit development. These circumstances have increased the potential for flood storage and freeboard requirements to be infringed upon as a result of larger than anticipated water accumulation within the TSF. To resolve this and the issues noted above, MPMC is advancing the permitting and design for the construction of a reverse osmosis water treatment plant (WTP), capable of treating and discharging up to 3 Mm3 per year on a year-round basis. MPMC anticipates commissioning of the WTP, and initiation of discharge to Polley Lake, in October 2014.
MPMC has developed a site-wide water balance model that can be used to predict the site wide surplus or deficit for average, wet, and dry year scenarios. The model accounts for the expanded mine footprint of recent years and for the flows captured by recently constructed runoff and seepage collection ditches. The model also allows MPMC to project TSF pond volume changes for various water treatment and discharge scenarios. MPMC has used the model to project various water management scenarios for the coming year, prior to the 2015 dam crest raise, in order to determine the appropriate target crest elevation for the TSF dams for the 2014 construction season, as presented in Section 4.3. The target crest elevation is also driven by the IDF and freeboard criteria, as presented in Section 3.3.
4.3. Timing Basis for Target Crest Elevations for Annual Stage Raising
Previous dam crest raise elevations for the TSF have generally been designed to accommodate tailings and water storage through June of the following year, based on the assumption of minimal pond rise through the spring and summer months, and the ability to raise the dam crest prior to IDF and freeboard criteria being compromised. However, construction of the till core is seasonally dependent and only feasible typically from May to October, resulting in a threat if wet spring conditions are encountered that accelerate pond level rise and/or inhibit the rate at which the crest can be raised.
More common practice for annual stage raising of tailings dams is to construct to crest elevations that are projected to provide sufficient tailings storage, operating pond water storage, and IDF and freeboard requirements to the end of the construction season of the year following. This more conservative approach is particularly prudent for TSFs operated as zero-discharge facilities, or where discharge capacity is limited relative to potential inflows in wetter than average years. Should the target crest elevation not be reached at the end of a construction season, this allows for the dam to be raised to the target elevation during the following construction season and reduces the risk of running afoul of flood and freeboard compliance which could, in the extreme, necessitate a shut-down of milling and tailings discharge to the TSF, until crest raising restores compliance. The proposed Stage 10 crest elevation, representing the final target crest elevation for the 2014 construction season, is therefore based on the expected tailings production and operating pond volume as of the end of September 2015.
Mount Polley Mining Corporation, Mount Polley Mine July 25, 2014 Tailings Storage Facility Stage 10 Raise Design Report – FINAL Project No.: 1197001.4.2
MPMC TSF Stage 10 Design Report_July 25 Final Page 24
BGC ENGINEERING INC.
4.4. TSF Operating Pond Scenarios
The TSF pond elevation was El. 966.4 m as of June 3, 2014. Three scenarios were considered, along with the current pond elevation, in developing the target crest elevation for the Stage 10 raise:
1. Run-off from average (1 in 2-year) hydrologic conditions with no water treatment and discharge (required 2014 crest El. 972.5 m).
2. Run-off from 1 in 200-year wet hydrologic conditions with water treatment and discharge beginning in January 2015 (required 2014 crest El. 972.5 m), three months later than currently anticipated by MPMC.
3. Run-off from 1 in 200-year wet hydrologic conditions with water treatment and discharge beginning in July 2015 (required 2014 crest El. 973.5 m), nine months later than currently anticipated.
Scenario 1 represents the most probable hydrologic conditions (an average year) but the most conservative assumption in terms of water treatment and discharge (none). Scenarios 2 and 3 represent conservative hydrologic conditions combined with varying WTP and discharge start dates, both of which are later than the currently anticipated start date in October 2014.
It is recommended that the Stage 10 target crest elevation be set at 972.5 m. Scenario 3, combining a wet year with a substantial delay in WTP commissioning and water discharge, is judged overly conservative. However, should Scenario 3 occur, the dam at crest El. 972.5 m would be out of compliance in May 2015. This could be tolerated on a short term basis as dam raising could begin shortly thereafter. Moreover, monitoring of snowpack conditions could give some prior warning of an unusually large spring 2015 snowmelt runoff, and contingencies provided to divert runoff into open pits to avoid or at least reduce freeboard compliance issues for the TSF.
4.5. Design Submissions Timing for Raising Above El. 972.5 m
The currently permitted mine plan runs to 2016. MPMC is reviewing and updating the mine plan and as of issuance of this report, the mine life is projected to 2025. Extension of the mine life to 2025 would result in a projected final average tailings elevation (assuming flat deposition – neglecting beach slopes) in the TSF of 990 m.
An updated TSF design report for regulatory submittals will be completed in early 2015. That design report will provide for a crest elevation sufficient to accommodate crest raising through 2018, and tailings storage capacity through to the fall of 2019. The 2015 design report update will not provide a design for the full extent of the projected mine life because there is a need to confirm water management scenarios for the TSF, which are integral to the dam design in the following respects:
Tailings beach development Width of core and filter zones

Mount Polley Mining Corporation, Mount Polley Mine July 25, 2014 Tailings Storage Facility Stage 10 Raise Design Report – FINAL Project No.: 1197001.4.2
MPMC TSF Stage 10 Design Report_July 25 Final Page 25
BGC ENGINEERING INC.
Potential effects of seismic liquefaction of tailings beach and upstream instability Crest raising schedule and final target crest elevation
The intent therefore is to provide an interim dam configuration in the 2015 design report update. The design of the dam to its projected closure configuration will be completed once the water balance is better clarified, the efficacy of the WTP at its design throughput rate is confirmed, and the rate of decrease of the surplus pond volume, and coincident widening of the above water tailings beaches, can be incorporated into the design.
Mount Polley Mining Corporation, Mount Polley Mine July 25, 2014 Tailings Storage Facility Stage 10 Raise Design Report – FINAL Project No.: 1197001.4.2
MPMC TSF Stage 10 Design Report_July 25 Final Page 26
BGC ENGINEERING INC.
5.0 INSTRUMENTATION REVIEW
5.1. General
Instrumentation installed to monitor the performance of the TSF dams includes:
Vibrating wire piezometers installed within the tailings Vibrating wire piezometers installed within the dam and its foundation Inclinometers installed through the downstream shell and foundation of the dam.
Presentation and interpretation of the instrumentation data is provided in the annual review reports, the two most recent being BGC (2013) and AMEC (2014). A plan of operational piezometers and inclinometers is shown on Drawing MPMC-XD-06-01.
This section of the report provides:
A brief review of instrumentation data pertinent to the stability analysis assumptions and parameters presented in Section 6.0
Review of established threshold criteria for piezometers and inclinometers A review of the adequacy of instrumentation coverage, and recommendations for
additional installations given the continued extension and raising of the dams Recommended field and laboratory data to be obtained during additional
instrumentation installation to support designs for raising of the dams above El. 972.5 m.
5.2. Piezometers
5.2.1. General
AMEC (2014) indicates there to be 77 functional piezometers within the TSF, installed within the following dam zones and foundation units:
Till and glaciolacustrine foundation soils Zone S till core (including the starter dam which was a homogeneous compacted till
embankment) Zone F filter and blanket drain at the base of the downstream shell of the dams Zone U and tailings, upstream of the Zone S till core.
5.2.2. Summary of Piezometric Performance and Trends to Date
5.2.2.1. Tailings Piezometers
Pore pressures in the tailings indicate downward seepage gradients (i.e., sub-hydrostatic conditions), attributable to the upstream drains. The piezometers upstream of the till core do indicate a rising trend, driven by the rising pond level in the TSF. The data indicates that the assumption of a hydrostatic pore pressure distribution within the tailings, with the phreatic surface at the tailings surface to be conservative for the purpose of limit equilibrium stability analyses.
Mount Polley Mining Corporation, Mount Polley Mine July 25, 2014 Tailings Storage Facility Stage 10 Raise Design Report – FINAL Project No.: 1197001.4.2
MPMC TSF Stage 10 Design Report_July 25 Final Page 27
BGC ENGINEERING INC.
5.2.2.2. Zone S Till Core Piezometers
Piezometers located within the raised section of the Zone S till core consistently indicate pore pressures lower than the TSF pond level, except for one on Plane F, near the upstream edge of the core. Piezometers in the starter dam embankment portion of Zone S generally indicate piezometric heads below the top of Zone S at the piezometer tip location. As a result, assumption of a piezometric line at pond level extending across the Zone S core, and then following the downstream limit of Zone S, overstates pore pressures within Zone S, and is therefore conservative for use in stability analyses.
Time-history plots for the Zone S piezometers indicate the following overall temporal trends:
Pore pressures in the raised section of the till core are rising more slowly than the rate of rise of the TSF water pond
Most of the Zone S piezometers show some response to dam crest/shell raising, with subsequent dissipation once construction ceases, but the temporary pore pressure increases are minor and represent piezometric heads that remain below the piezometric line assumed for the stability analyses, discussed in Section 6.6.
5.2.2.3. Foundation Piezometers
Foundation piezometers are for the most part installed to the downstream of the main slope of the dams, and were for the most part installed as part of the 2011 drilling and instrumentation campaign (AMEC, 2012b). In that program, two to three vibrating wire piezometers were installed per borehole, in order to discern vertical hydraulic gradients at those locations. In general, the foundation piezometers installed in 2011 indicate:
Piezometric heads at or below original ground surface Variable vertical gradients, raising from strong downward gradients to very slight
upward gradients below the Main Embankment, hydrostatic gradients for the South Embankment, and consistently downward gradients for the Perimeter Embankment.
Only at Piezometer Plane K, at Sta. 2+460 m (Main Embankment) are foundation pore pressures significantly artesian (by about 8 to 12 m) relative to original ground elevation.
There is a scarcity of foundation piezometer coverage within the foundation to the upstream of the starter dam toe, with the result that foundation pore pressures there must be inferred. Most of the piezometers installed below the starter dam are now inoperative, although three such foundation piezometers remain operational below the Main Embankment. All three of these piezometers indicate piezometric heads within the lower half of the overlying starter dam embankment, a maximum of about 5 m above the original ground elevation at the piezometer tip location. The data yielded by these three piezometers (one at Sta. 2+240 m, and two at Sta. 1+850 m) are significant in the following respects:
The time history plots for these piezometers show minimal to no response to the rising level of the TSF water pond, the rise of the tailings deposit, and the staged raising of the dam above them.
Mount Polley Mining Corporation, Mount Polley Mine July 25, 2014 Tailings Storage Facility Stage 10 Raise Design Report – FINAL Project No.: 1197001.4.2
MPMC TSF Stage 10 Design Report_July 25 Final Page 28
BGC ENGINEERING INC.
Minimal horizontal seepage gradients (less than 6%) exist between these foundation piezometers and those installed in 2011 further downstream, suggesting that foundation seepage (at the two sections where data exists), which is directly proportional to the seepage gradient, is modest.
Representation of the foundation piezometric surface below the starter dam, using the same piezometric line discussed above and in Section 6.6 for the Zone S till core, is conservative for the purposes of stability analyses.
5.2.2.4. Filter and Drain Piezometers
Piezometers installed within the chimney filter and the basal drainage blanket generally indicate zero to minimal pore pressures (piezometric head of up to 3 m in some instances within the drainage blanket), indicating these zones are functioning adequately in terms of their drainage capacity.
5.3. Inclinometers
5.3.1. General
Nine inclinometer casings are installed at the toe of the dams (see Drawing MPMC-XD-06-01), as follows:
Three installations along the toe of the Perimeter Embankment Six installations along the toe of the Main Embankment.
All of the inclinometer casings are seated into bedrock to provide a fixed base reference point.
No inclinometers are installed as of yet along the South Embankment owing to the lack of significant glaciolacustrine soils indicated by drilling to date in that area.
5.3.2. Trends Observed to Date
Inclinometer trends observed to date, based on data plots provided in AMEC (2014), are summarized in Table 5-1. The focus of the inclinometer monitoring is identification of zones of discrete lateral movement within the glaciolacustrine unit. Discrete shearing within the glaciolacustrine soils is critical to detect as such movement could eventually result in reduction of operative shear strength to a residual shear strength condition. The portions of the inclinometers raised through the rockfill shell of the dam are affected by construction activity, so data above the dam fill to foundation contact is of minimal significance. Examination of the inclinometer data is therefore of significant interest in evaluation of appropriate shear strength parameters to assign to the glaciolacustrine unit for the purposes of stability analyses.

Mount Polley Mining Corporation, Mount Polley Mine July 25, 2014 Tailings Storage Facility Stage 10 Raise Design Report – FINAL Project No.: 1197001.4.2
MPMC TSF Stage 10 Design Report_July 25 Final Page 29
BGC ENGINEERING INC.
Table 5-1. Inclinometer data summary.
Inclinom. No. Station
Zones of discrete shear in
foundation?
Cumulative downstream
displacement (mm)
Displacement rate (mm/year) in the
glaciolacustrine unit Other comments
SI11-01 1+850 m None None Essentially zero
SI01-02 1+930 m Yes, concentrated between El. 903 m and 906 m
About 20 mm between El. 903-906 m, representing 0.7% shear strain.
7 mm/year in 2013 Acceleration in 2013 in apparent response to fill placement on the buttress at the inclinometer location
SI06-01 1+960 m No Essentially none Essentially zero Located downstream of SI01-02, indicating movement at SI01-02 is localized.
SI06-02 2+080 m No Essentially none Essentially zero Located adjacent to the Main Embankment seepage pond.
SI06-03 2+185 m
Yes, in glaciolacustrine between El. 903 m and 904 m
About 8 mm, representing 0.8% shear strain.
5 mm/year for 2013 Acceleration in 2013 in apparent response to fill placement on the buttress at the inclinometer location
SI11-02 2+460 m None None Essentially zero
SI12-02 3+270 m None None Essentially zero
SI12-01 3+910 m No Essentially none Essentially zero
SI11-04 3+910 m None Unclear Essentially zero
Pattern is of compression of the inclinometer casing, possibly due to settlement. No net downstream displacement indicated. Replacement installed in 2012 (SI12-02).
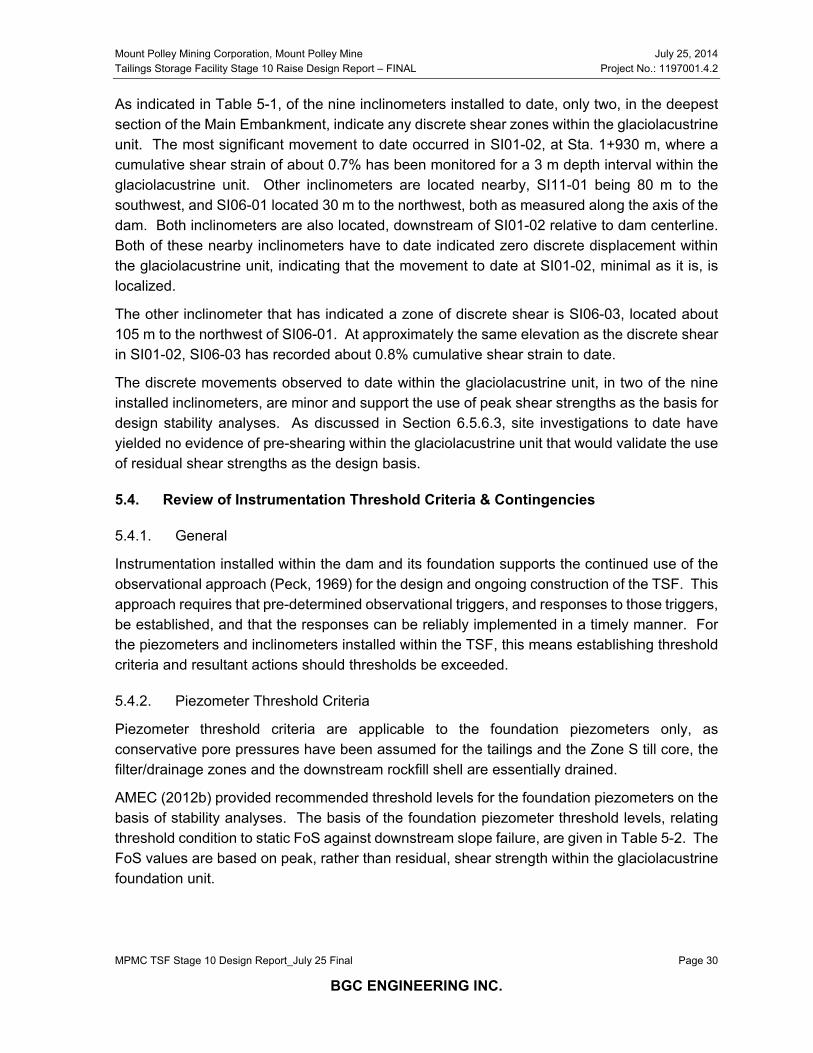
Mount Polley Mining Corporation, Mount Polley Mine July 25, 2014 Tailings Storage Facility Stage 10 Raise Design Report – FINAL Project No.: 1197001.4.2
MPMC TSF Stage 10 Design Report_July 25 Final Page 30
BGC ENGINEERING INC.
As indicated in Table 5-1, of the nine inclinometers installed to date, only two, in the deepest section of the Main Embankment, indicate any discrete shear zones within the glaciolacustrine unit. The most significant movement to date occurred in SI01-02, at Sta. 1+930 m, where a cumulative shear strain of about 0.7% has been monitored for a 3 m depth interval within the glaciolacustrine unit. Other inclinometers are located nearby, SI11-01 being 80 m to the southwest, and SI06-01 located 30 m to the northwest, both as measured along the axis of the dam. Both inclinometers are also located, downstream of SI01-02 relative to dam centerline. Both of these nearby inclinometers have to date indicated zero discrete displacement within the glaciolacustrine unit, indicating that the movement to date at SI01-02, minimal as it is, is localized.
The other inclinometer that has indicated a zone of discrete shear is SI06-03, located about 105 m to the northwest of SI06-01. At approximately the same elevation as the discrete shear in SI01-02, SI06-03 has recorded about 0.8% cumulative shear strain to date.
The discrete movements observed to date within the glaciolacustrine unit, in two of the nine installed inclinometers, are minor and support the use of peak shear strengths as the basis for design stability analyses. As discussed in Section 6.5.6.3, site investigations to date have yielded no evidence of pre-shearing within the glaciolacustrine unit that would validate the use of residual shear strengths as the design basis.
5.4. Review of Instrumentation Threshold Criteria & Contingencies
5.4.1. General
Instrumentation installed within the dam and its foundation supports the continued use of the observational approach (Peck, 1969) for the design and ongoing construction of the TSF. This approach requires that pre-determined observational triggers, and responses to those triggers, be established, and that the responses can be reliably implemented in a timely manner. For the piezometers and inclinometers installed within the TSF, this means establishing threshold criteria and resultant actions should thresholds be exceeded.
5.4.2. Piezometer Threshold Criteria
Piezometer threshold criteria are applicable to the foundation piezometers only, as conservative pore pressures have been assumed for the tailings and the Zone S till core, the filter/drainage zones and the downstream rockfill shell are essentially drained.
AMEC (2012b) provided recommended threshold levels for the foundation piezometers on the basis of stability analyses. The basis of the foundation piezometer threshold levels, relating threshold condition to static FoS against downstream slope failure, are given in Table 5-2. The FoS values are based on peak, rather than residual, shear strength within the glaciolacustrine foundation unit.
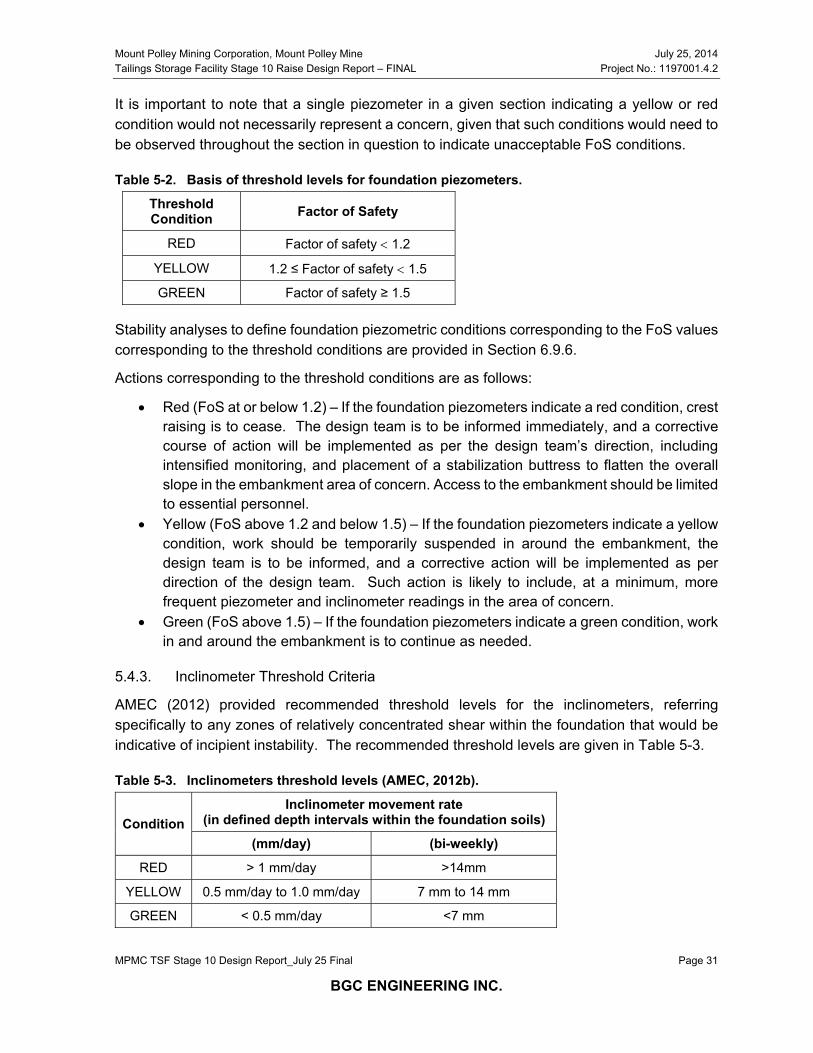
Mount Polley Mining Corporation, Mount Polley Mine July 25, 2014 Tailings Storage Facility Stage 10 Raise Design Report – FINAL Project No.: 1197001.4.2
MPMC TSF Stage 10 Design Report_July 25 Final Page 31
BGC ENGINEERING INC.
It is important to note that a single piezometer in a given section indicating a yellow or red condition would not necessarily represent a concern, given that such conditions would need to be observed throughout the section in question to indicate unacceptable FoS conditions.
Table 5-2. Basis of threshold levels for foundation piezometers.
Threshold Condition Factor of Safety
RED Factor of safety 1.2
YELLOW 1.2 ≤ Factor of safety 1.5
GREEN Factor of safety ≥ 1.5
Stability analyses to define foundation piezometric conditions corresponding to the FoS values corresponding to the threshold conditions are provided in Section 6.9.6.
Actions corresponding to the threshold conditions are as follows:
Red (FoS at or below 1.2) – If the foundation piezometers indicate a red condition, crest raising is to cease. The design team is to be informed immediately, and a corrective course of action will be implemented as per the design team’s direction, including intensified monitoring, and placement of a stabilization buttress to flatten the overall slope in the embankment area of concern. Access to the embankment should be limited to essential personnel.
Yellow (FoS above 1.2 and below 1.5) – If the foundation piezometers indicate a yellow condition, work should be temporarily suspended in around the embankment, the design team is to be informed, and a corrective action will be implemented as per direction of the design team. Such action is likely to include, at a minimum, more frequent piezometer and inclinometer readings in the area of concern.
Green (FoS above 1.5) – If the foundation piezometers indicate a green condition, work in and around the embankment is to continue as needed.
5.4.3. Inclinometer Threshold Criteria
AMEC (2012) provided recommended threshold levels for the inclinometers, referring specifically to any zones of relatively concentrated shear within the foundation that would be indicative of incipient instability. The recommended threshold levels are given in Table 5-3.
Table 5-3. Inclinometers threshold levels (AMEC, 2012b).
Condition Inclinometer movement rate
(in defined depth intervals within the foundation soils)
(mm/day) (bi-weekly)
RED > 1 mm/day >14mm
YELLOW 0.5 mm/day to 1.0 mm/day 7 mm to 14 mm
GREEN < 0.5 mm/day <7 mm
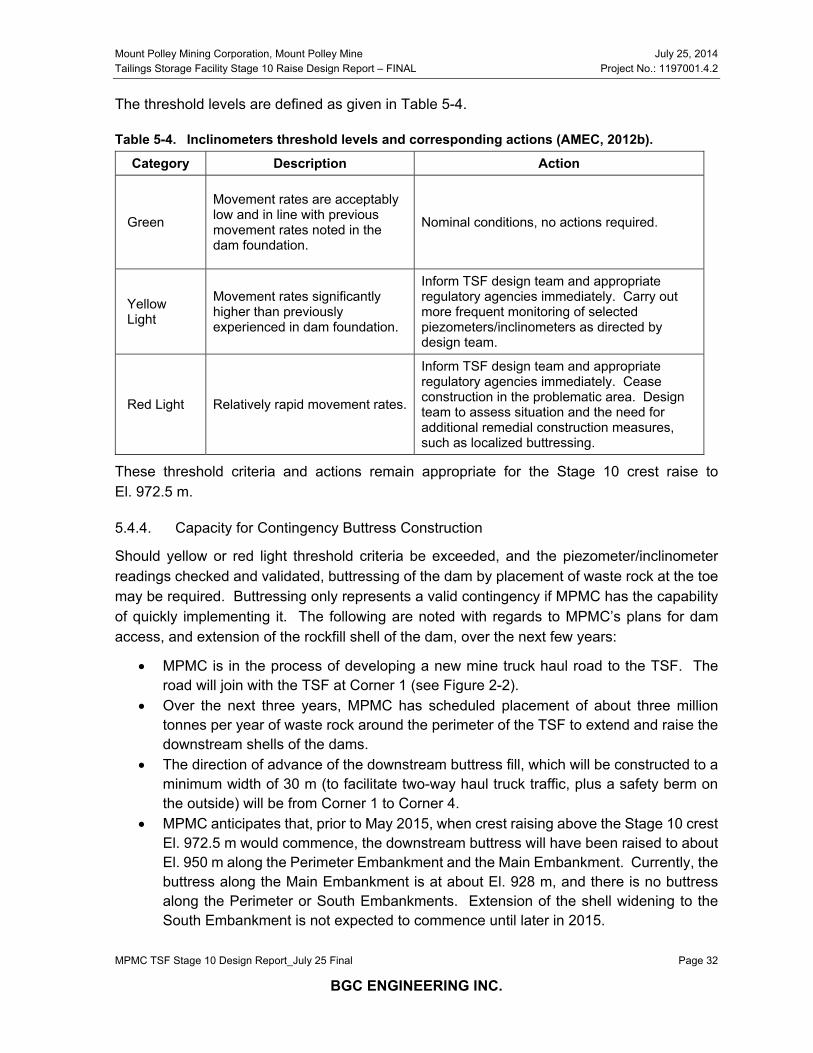
Mount Polley Mining Corporation, Mount Polley Mine July 25, 2014 Tailings Storage Facility Stage 10 Raise Design Report – FINAL Project No.: 1197001.4.2
MPMC TSF Stage 10 Design Report_July 25 Final Page 32
BGC ENGINEERING INC.
The threshold levels are defined as given in Table 5-4.
Table 5-4. Inclinometers threshold levels and corresponding actions (AMEC, 2012b).
Category Description Action
Green
Movement rates are acceptably low and in line with previous movement rates noted in the dam foundation.
Nominal conditions, no actions required.
Yellow Light
Movement rates significantly higher than previously experienced in dam foundation.
Inform TSF design team and appropriate regulatory agencies immediately. Carry out more frequent monitoring of selected piezometers/inclinometers as directed by design team.
Red Light Relatively rapid movement rates.
Inform TSF design team and appropriate regulatory agencies immediately. Cease construction in the problematic area. Design team to assess situation and the need for additional remedial construction measures, such as localized buttressing.
These threshold criteria and actions remain appropriate for the Stage 10 crest raise to El. 972.5 m.
5.4.4. Capacity for Contingency Buttress Construction
Should yellow or red light threshold criteria be exceeded, and the piezometer/inclinometer readings checked and validated, buttressing of the dam by placement of waste rock at the toe may be required. Buttressing only represents a valid contingency if MPMC has the capability of quickly implementing it. The following are noted with regards to MPMC’s plans for dam access, and extension of the rockfill shell of the dam, over the next few years:
MPMC is in the process of developing a new mine truck haul road to the TSF. The road will join with the TSF at Corner 1 (see Figure 2-2).
Over the next three years, MPMC has scheduled placement of about three million tonnes per year of waste rock around the perimeter of the TSF to extend and raise the downstream shells of the dams.
The direction of advance of the downstream buttress fill, which will be constructed to a minimum width of 30 m (to facilitate two-way haul truck traffic, plus a safety berm on the outside) will be from Corner 1 to Corner 4.
MPMC anticipates that, prior to May 2015, when crest raising above the Stage 10 crest El. 972.5 m would commence, the downstream buttress will have been raised to about El. 950 m along the Perimeter Embankment and the Main Embankment. Currently, the buttress along the Main Embankment is at about El. 928 m, and there is no buttress along the Perimeter or South Embankments. Extension of the shell widening to the South Embankment is not expected to commence until later in 2015.
Mount Polley Mining Corporation, Mount Polley Mine July 25, 2014 Tailings Storage Facility Stage 10 Raise Design Report – FINAL Project No.: 1197001.4.2
MPMC TSF Stage 10 Design Report_July 25 Final Page 33
BGC ENGINEERING INC.
Given these plans, MPMC will be in a position to quickly deliver waste rock to any area of the Perimeter and Main Embankments if instrumentation data indicates there to be a need for rapid buttressing. Moreover, the shell extension will result in significant increases in the factors of safety for the Perimeter and Main Embankments over those reported in Section 6.0. The design for the sequencing of Zone C placement for shell extension and widening will be provided in the updated design to be submitted in early 2015.
5.5. Review of Current Instrumentation Coverage
5.5.1. General
As the dams continue to be extended and raised, additional instrumentation installations will be required. Moreover, geotechnical information obtained from instrumentation drilling will further refine the geologic model forming the basis for the design of the TSF. The following sections outline specific recommendations for additional drilling and instrumentation installation for execution in 2014, in support of the next design phase for the TSF, and general requirements for further expansion of instrumentation coverage in 2015 and beyond.
5.5.2. Instrumentation Benches
Ongoing dam design and raising must incorporate benches within the downstream shell of the dam for accessing and protecting inclinometers. Based on the locations of existing instrumentation within the Main Embankment, horizontal benches at least 15 m in width will be allowed for, as the dam is raised, at the following offsets relative to the dam setting out line (SOL):
Bench 1 – offset 70 m to 85 m downstream of SOL Bench 2 – offset 115 m to 130 m downstream of SOL Bench 3 – offset 160 m to 175 m downstream of SOL
Instrumentation access benches that segment the overall slope of the dam are likely to prove beneficial during reclamation activities on the dam slope at closure.
5.5.3. Piezometers
Piezometric coverage within the impounded tailings, upstream Zone U, Zone S till core, and the filter and drainage blanket zones is judged adequate at the present time. The need for any further piezometers upstream of the till core will be evaluated as part of the next phase of design. No further piezometers are contemplated for installation within the narrow Zone S core raise section going forward, as any drilling within the core, or extension of leads from embankment piezometers placed within the core during raising, could create defects within the core and preferential seepage pathways.
As the dam continues to be raised and expanded, additional piezometric coverage within the foundation soils, and in particular the glaciolacustrine/glaciofluvial soils, will be required. Piezometers cannot be installed through the downstream portion of the starter dam into the
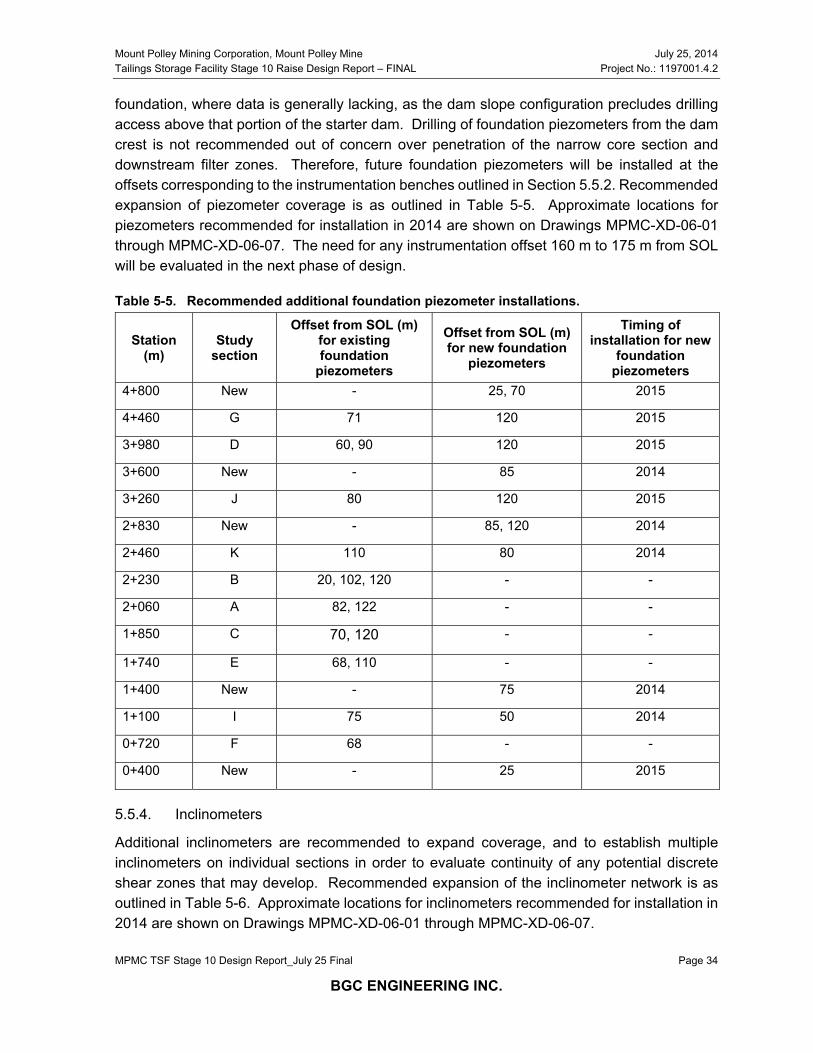
Mount Polley Mining Corporation, Mount Polley Mine July 25, 2014 Tailings Storage Facility Stage 10 Raise Design Report – FINAL Project No.: 1197001.4.2
MPMC TSF Stage 10 Design Report_July 25 Final Page 34
BGC ENGINEERING INC.
foundation, where data is generally lacking, as the dam slope configuration precludes drilling access above that portion of the starter dam. Drilling of foundation piezometers from the dam crest is not recommended out of concern over penetration of the narrow core section and downstream filter zones. Therefore, future foundation piezometers will be installed at the offsets corresponding to the instrumentation benches outlined in Section 5.5.2. Recommended expansion of piezometer coverage is as outlined in Table 5-5. Approximate locations for piezometers recommended for installation in 2014 are shown on Drawings MPMC-XD-06-01 through MPMC-XD-06-07. The need for any instrumentation offset 160 m to 175 m from SOL will be evaluated in the next phase of design.
Table 5-5. Recommended additional foundation piezometer installations.
Station (m)
Study section
Offset from SOL (m) for existing foundation
piezometers
Offset from SOL (m) for new foundation
piezometers
Timing of installation for new
foundation piezometers
4+800 New - 25, 70 2015
4+460 G 71 120 2015
3+980 D 60, 90 120 2015
3+600 New - 85 2014
3+260 J 80 120 2015
2+830 New - 85, 120 2014
2+460 K 110 80 2014
2+230 B 20, 102, 120 - -
2+060 A 82, 122 - -
1+850 C 70, 120 - -
1+740 E 68, 110 - -
1+400 New - 75 2014
1+100 I 75 50 2014
0+720 F 68 - -
0+400 New - 25 2015
5.5.4. Inclinometers
Additional inclinometers are recommended to expand coverage, and to establish multiple inclinometers on individual sections in order to evaluate continuity of any potential discrete shear zones that may develop. Recommended expansion of the inclinometer network is as outlined in Table 5-6. Approximate locations for inclinometers recommended for installation in 2014 are shown on Drawings MPMC-XD-06-01 through MPMC-XD-06-07.
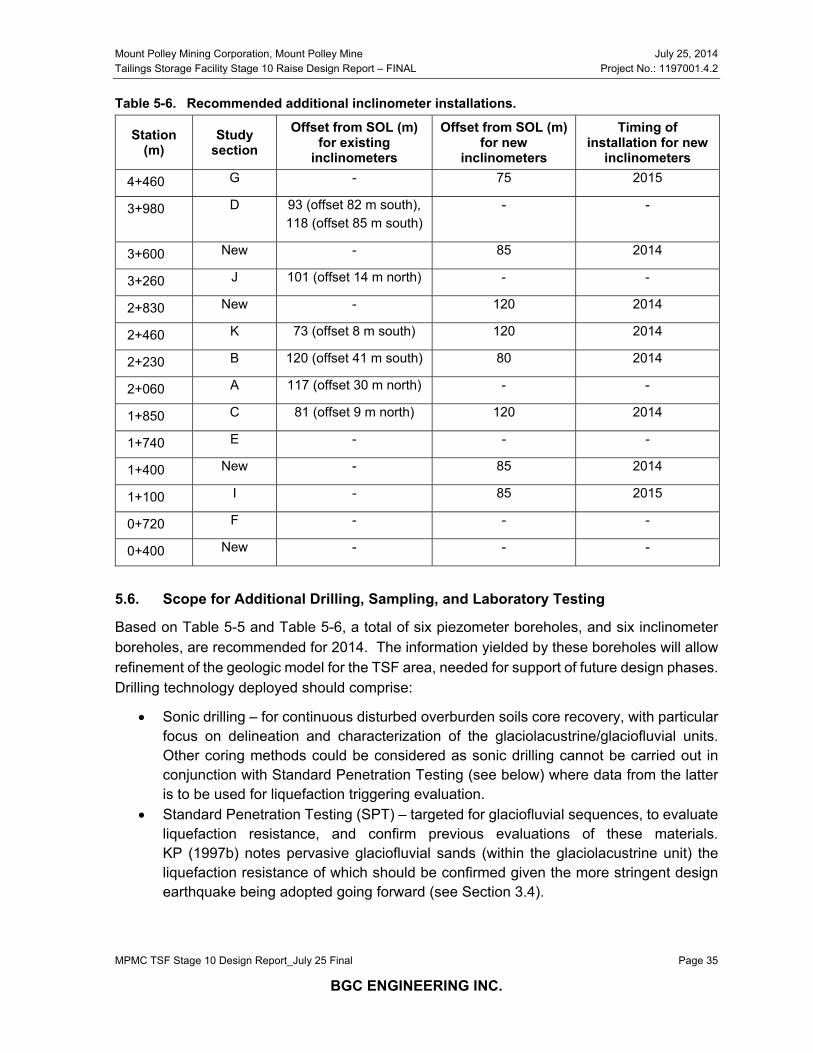
Mount Polley Mining Corporation, Mount Polley Mine July 25, 2014 Tailings Storage Facility Stage 10 Raise Design Report – FINAL Project No.: 1197001.4.2
MPMC TSF Stage 10 Design Report_July 25 Final Page 35
BGC ENGINEERING INC.
Table 5-6. Recommended additional inclinometer installations.
Station (m)
Study section
Offset from SOL (m) for existing
inclinometers
Offset from SOL (m) for new
inclinometers
Timing of installation for new
inclinometers 4+460 G - 75 2015
3+980 D 93 (offset 82 m south), 118 (offset 85 m south)
- -
3+600 New - 85 2014
3+260 J 101 (offset 14 m north) - -
2+830 New - 120 2014
2+460 K 73 (offset 8 m south) 120 2014
2+230 B 120 (offset 41 m south) 80 2014
2+060 A 117 (offset 30 m north) - -
1+850 C 81 (offset 9 m north) 120 2014
1+740 E - - -
1+400 New - 85 2014
1+100 I - 85 2015
0+720 F - - -
0+400 New - - -
5.6. Scope for Additional Drilling, Sampling, and Laboratory Testing
Based on Table 5-5 and Table 5-6, a total of six piezometer boreholes, and six inclinometer boreholes, are recommended for 2014. The information yielded by these boreholes will allow refinement of the geologic model for the TSF area, needed for support of future design phases. Drilling technology deployed should comprise:
Sonic drilling – for continuous disturbed overburden soils core recovery, with particular focus on delineation and characterization of the glaciolacustrine/glaciofluvial units. Other coring methods could be considered as sonic drilling cannot be carried out in conjunction with Standard Penetration Testing (see below) where data from the latter is to be used for liquefaction triggering evaluation.
Standard Penetration Testing (SPT) – targeted for glaciofluvial sequences, to evaluate liquefaction resistance, and confirm previous evaluations of these materials. KP (1997b) notes pervasive glaciofluvial sands (within the glaciolacustrine unit) the liquefaction resistance of which should be confirmed given the more stringent design earthquake being adopted going forward (see Section 3.4).

Mount Polley Mining Corporation, Mount Polley Mine July 25, 2014 Tailings Storage Facility Stage 10 Raise Design Report – FINAL Project No.: 1197001.4.2
MPMC TSF Stage 10 Design Report_July 25 Final Page 36
BGC ENGINEERING INC.
Shear wave velocity profiling will also be required to evaluate the seismic response of the foundation soils.
Selected samples will be subjected to index property testing. No higher end (e.g. triaxial) testing is contemplated at this time. Direct simple shear testing of glaciolacustrine samples may be undertaken if samples that are predominantly clay are retrieved.
Mount Polley Mining Corporation, Mount Polley Mine July 25, 2014 Tailings Storage Facility Stage 10 Raise Design Report – FINAL Project No.: 1197001.4.2
MPMC TSF Stage 10 Design Report_July 25 Final Page 37
BGC ENGINEERING INC.
6.0 STABILITY ANALYSES
6.1. General
Stability analyses carried out in support of the Stage 10 crest raise are presented in the following sub-sections. The analyses carried out were as follows:
The downstream stability of the TSF dams was assessed for the currently permitted crest elevation of 970 m, and the Stage 10 crest elevation of 972.5 m. The stability analyses considered both peak and residual shear strength conditions within the glaciolacustrine unit.
The upstream stability of the Stage 10 crest raise was also evaluated, for the end-of-construction case, prior to the subsequent rise of the tailings deposit that effectively buttresses the stage raise.
Analyses were carried out to establish threshold piezometric heads for the foundation piezometers, as discussed in Section 5.4.2.
Stability analyses for downstream stability were also carried out for dam crest El. 978 m, which was assumed to represent the maximum elevation of the core that can be achieved without extension of the Zone C rockfill shell. These analyses provide some guidance for the configuration and sequencing of downstream buttress construction, in progress in 2014 and discussed in Section 5.4.4.
6.2. Geometry and Cross Sections
Six representative dam and foundation sections were selected for analysis as shown on Figure 6-1, and summarized as follows:
South Embankment Station 0+720 m (cross section F): This location was selected as it extends through
the South Embankment seepage recovery pond, an in terms of height, and foundation conditions, is generally representative of the South Embankment.
Main Embankment Station 1+900 m: Selected as it represents similar geometry and foundation
conditions to Section A at Sta. 2+060 m, but without the constraint of the Main Embankment seepage recovery pond, which will not be relocated until after the Stage 10 raise to El. 972.5 m is complete.
Station 2+060 m (cross section A): This is the maximum (highest) portion of the Main Embankment, and is adjacent to the Main Embankment seepage recovery pond.
Station 2+430 m: Selected to provide an eastern cross section along the Main Embankment alignment, account for the foundation stratigraphy for the northwestern portion of the Main Embankment, and to account for artesian foundation pore pressures monitored in piezometer study Section K.
Mount Polley Mining Corporation, Mount Polley Mine July 25, 2014 Tailings Storage Facility Stage 10 Raise Design Report – FINAL Project No.: 1197001.4.2
MPMC TSF Stage 10 Design Report_July 25 Final Page 38
BGC ENGINEERING INC.
Perimeter Embankment Station 3+500 m: Selected due to the excavated till borrow pit where the excavation
could affect stability for slip surfaces extending that far downstream. Station 3+990 m (cross section D): This section extends through the Perimeter
Embankment seepage recovery pond, which will not be relocated until 2015 at the earliest.
The stability analysis sections are shown in Appendix A.
The internal dam geometry for cross sections A, D, and F are based on the geometry presented in the 2013 AMEC as-built drawings (AMEC, 2014). Where no as-built cross section was available (cross sections at Stations 1+900 m, 2+430 m and 3+500 m), internal dam geometry was interpreted based on the nearest available as-built section. At these locations, the surface representing the base of the dam was inferred based on local topography and geotechnical site investigation data (per reports listed in Table 2-1).
6.3. Analysis Assumptions
The foundation stratigraphy was developed based on stratigraphic sections prepared by KP (1997b) and by AMEC (2012b) as discussed in Section 6.4. Further discussion of the strength parameters applied to each unit is provided in Section 6.5.
The analyses incorporated the following assumptions and simplifications:
Downstream rockfill (Zone C) slopes were 1.3H: 1V (per existing slopes on the dam). Details of zone contacts within the dam (i.e. between core and filters) were locally
simplified, as these are non-relevant to limit equilibrium analyses of the overall dam. Upstream fill was modeled as tailings for the purposes of stability analysis (assigning
the upstream fill the same properties as the tailings simplifies the model design and is a slightly conservative assumption).
Filters were not discretely modelled, but rather were incorporated into the Zone C downstream shell.
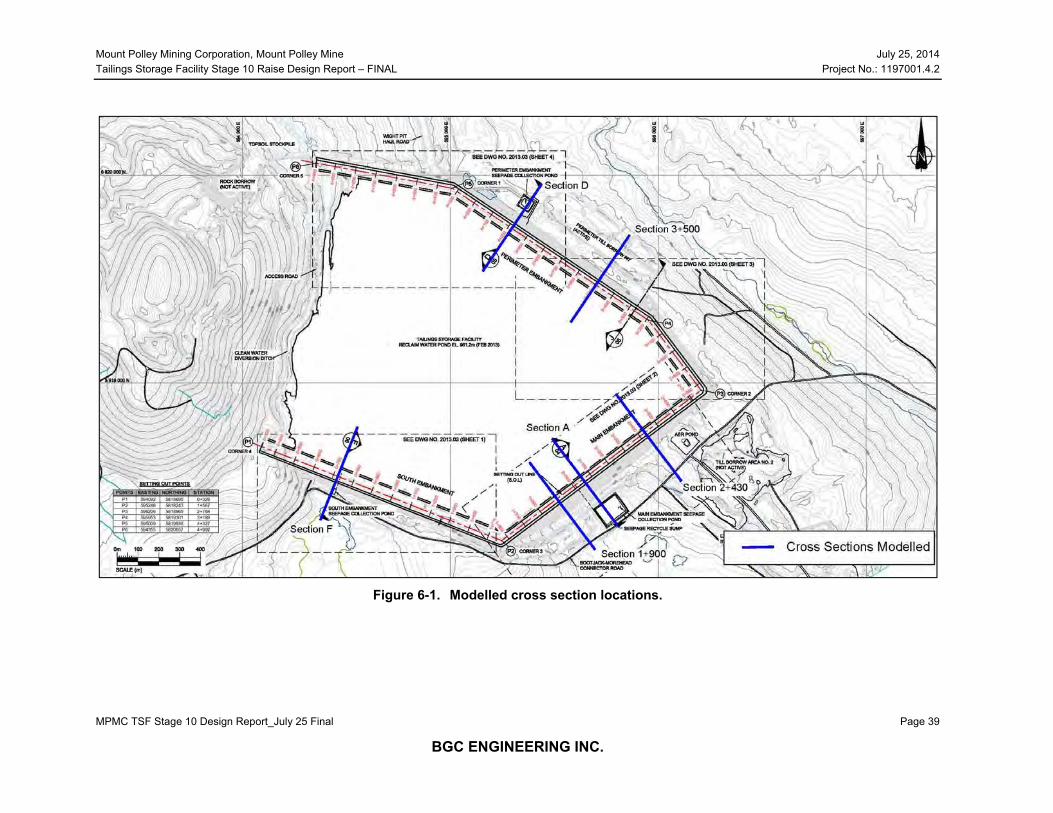
Mount Polley Mining Corporation, Mount Polley Mine July 25, 2014 Tailings Storage Facility Stage 10 Raise Design Report – FINAL Project No.: 1197001.4.2
MPMC TSF Stage 10 Design Report_July 25 Final Page 39
BGC ENGINEERING INC.
Figure 6-1. Modelled cross section locations.
Mount Polley Mining Corporation, Mount Polley Mine July 25, 2014 Tailings Storage Facility Stage 10 Raise Design Report – FINAL Project No.: 1197001.4.2
MPMC TSF Stage 10 Design Report_July 25 Final Page 40
BGC ENGINEERING INC.
6.4. Foundation Conditions
Subsurface conditions for each modelled cross section were developed based on interpretation of results from nearby boreholes (AMEC, 2012a) and stratigraphic sections developed previously by KP (1997b), which identified and described three main overburden units as follows:
1. Ablation till – slightly weathered, low permeability, well-graded clay, silt, sand, gravel and cobbles with fines of low to intermediate plasticity (CL-CI). The unit was described as firm to stiff for the upper 0.5 m to 1 m, and very stiff below. The thickness of the ablation till ranges from 2 m to 6 m. The unit is underlain (except along the South Embankment) by;
2. Glaciolacustrine/glaciofluvial units – highly over-consolidated, stiff to hard laminated silt, with some clay, interbedded with lesser fine grained glaciofluvial sands and silts. Predominantly interbeded layers of silt with either clay or fine sand, with a continuous fine silty sand unit below the ablation till between about Sta. 1+650 m to 2+100 m. This unit is underlain by;
3. Basal till – very dense, 10 m to 20 m in thickness, well graded clay, silt, sand, gravel and cobbles, with the fines classifying as clay of low to intermediate plasticity (CL-CI).
This general stratigraphic model is consistent with that described by McAndless (2006).
Details of the assumed foundation conditions for analysis are provided below for each modeled cross section:
Cross Section A, Sta. 2+060 m: Subsurface conditions are based on the interpretation from boreholes VW11-05 and VW11-06. The dam foundation was interpreted to consist of a 10 m thick glaciolacustrine layer increasing in thickness and depth beyond the toe of the downstream shell. Underlying the glaciolacustrine layer is a 15 m thick layer of till, underlain by bedrock. A seepage recovery pond is currently located at the toe of cross section A. It was assumed that this pond would be removed and not limit the placement of downstream shell for the modeled crest El. 978 m.
Cross Section D, Sta. 3+990 m: Subsurface conditions are based on SI11-04 and VW11-10. For the purposes of modeling, the foundation stratigraphy was simplified into three layers: glacial till (El. 932 m – 915 m), glaciolacustrine (El. 915.0 m – 905.0 m) and glacial till (El. 905.0 m – 888.6 m). Bedrock was found below an El. of 888.6 m.
Cross Section F, Sta. 0+720 m: Subsurface conditions are based on VW11-01, which encountered a 5 m deposit of glacial till atop bedrock.
Cross Section Sta. 3+500 m: Subsurface conditions are based on the closest borehole to the cross section, VW11-09, which shows a 37 m thick glacial till deposit over bedrock.
Cross Section K, Sta. 2+430 m: The subsurface conditions are based on VW11-08 and SI11-02. These boreholes show 7 m of glacial till overlying approximately 35 m of glaciolacustrine/glaciofluvial deposits, underlain by a 2 m layer of glacial till on bedrock.
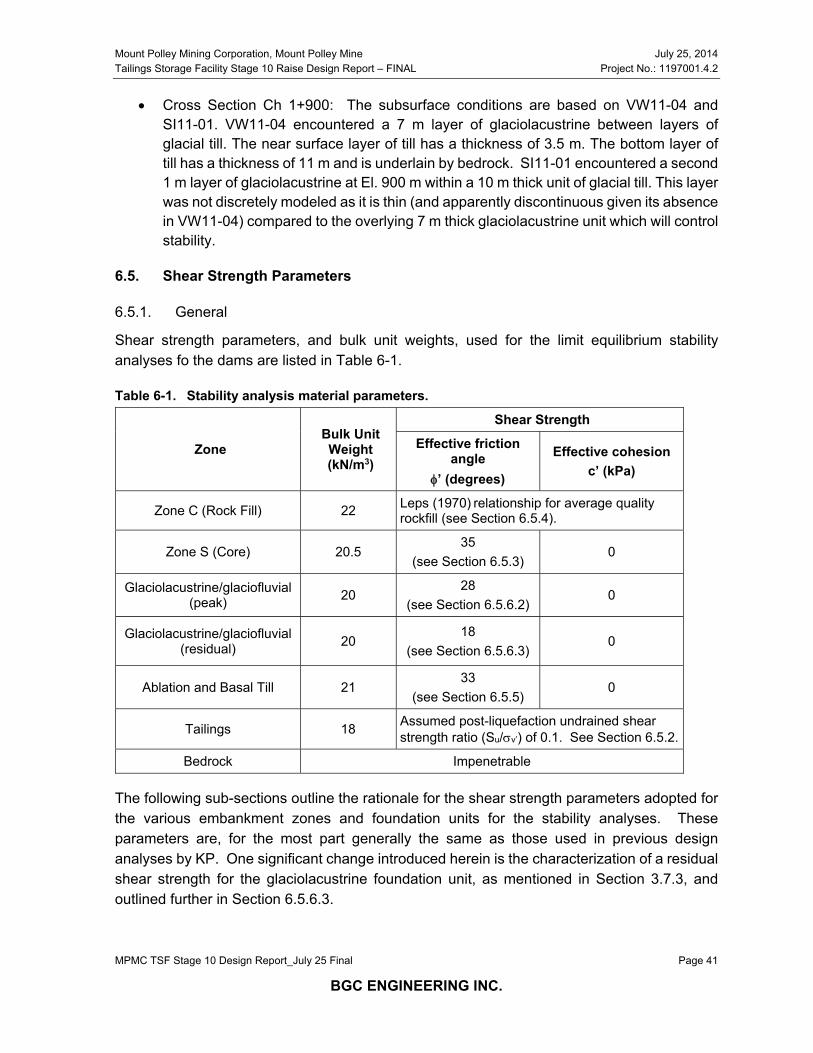
Mount Polley Mining Corporation, Mount Polley Mine July 25, 2014 Tailings Storage Facility Stage 10 Raise Design Report – FINAL Project No.: 1197001.4.2
MPMC TSF Stage 10 Design Report_July 25 Final Page 41
BGC ENGINEERING INC.
Cross Section Ch 1+900: The subsurface conditions are based on VW11-04 and SI11-01. VW11-04 encountered a 7 m layer of glaciolacustrine between layers of glacial till. The near surface layer of till has a thickness of 3.5 m. The bottom layer of till has a thickness of 11 m and is underlain by bedrock. SI11-01 encountered a second 1 m layer of glaciolacustrine at El. 900 m within a 10 m thick unit of glacial till. This layer was not discretely modeled as it is thin (and apparently discontinuous given its absence in VW11-04) compared to the overlying 7 m thick glaciolacustrine unit which will control stability.
6.5. Shear Strength Parameters
6.5.1. General
Shear strength parameters, and bulk unit weights, used for the limit equilibrium stability analyses fo the dams are listed in Table 6-1.
Table 6-1. Stability analysis material parameters.
Zone Bulk Unit Weight (kN/m3)
Shear Strength
Effective friction angle
’ (degrees)
Effective cohesion c’ (kPa)
Zone C (Rock Fill) 22 Leps (1970) relationship for average quality rockfill (see Section 6.5.4).
Zone S (Core) 20.5 35
(see Section 6.5.3) 0
Glaciolacustrine/glaciofluvial (peak) 20
28 (see Section 6.5.6.2)
0
Glaciolacustrine/glaciofluvial (residual) 20
18 (see Section 6.5.6.3)
0
Ablation and Basal Till 21 33
(see Section 6.5.5) 0
Tailings 18 Assumed post-liquefaction undrained shear strength ratio (Su/v’) of 0.1. See Section 6.5.2.
Bedrock Impenetrable
The following sub-sections outline the rationale for the shear strength parameters adopted for the various embankment zones and foundation units for the stability analyses. These parameters are, for the most part generally the same as those used in previous design analyses by KP. One significant change introduced herein is the characterization of a residual shear strength for the glaciolacustrine foundation unit, as mentioned in Section 3.7.3, and outlined further in Section 6.5.6.3.
Mount Polley Mining Corporation, Mount Polley Mine July 25, 2014 Tailings Storage Facility Stage 10 Raise Design Report – FINAL Project No.: 1197001.4.2
MPMC TSF Stage 10 Design Report_July 25 Final Page 42
BGC ENGINEERING INC.
Geotechnical site investigations, material shear strength assumptions, and previous stability analyses are reported in the following KP reports:
Knight Piésold Limited,1995. Imperial Metals Corp. Mt. Polley Project: Tailings Storage Facility Design Report, 2 vols., May 26.
Knight Piésold Limited,1997b. Mount Polley Mining Corporation Mout Polley Project: Tailings Storage Facility – Updated Design Report”, June 6.
Knight Piésold Limited, 2005. Design of the Tailings Storage Facility to Ultimate Elevation. March 14.
Knight Piésold Limited, 2007b. Stage 6 Design of the Tailings Storage Facility. June 18.
Stability analysis was also reported by AMEC (2012a) in the following report:
AMEC Environment and Infrastructure 2012a. Mount Polley Mines Tailings Storage Facility – 2012 Stage 8 Expansion – Stability Analyses, February 14.
6.5.2. Tailings Shear Strength
In previous analyses undertaken by KP, both drained and undrained (including post-liquefied undrained) shear strengths have been considered for the impounded tailings, as follows:
Drained shear strength: ’ = 30 (KP, 1995) Undrained shear strength: 10-55 kPa for “partially consolidated tailings” (KP, 1995),
and Su/v’ = 0.3 for “coarse tailings” (KP, 2005) Post-liquefaction undrained shear strength: Su/v’ = 0.1 for “post-liquefaction tailings”
(KP, 2005) Given the near-centerline geometry of the dam, the shear strength of the impounded tailings is of minimal significance for stability analyses for downstream failure in any case. It is therefore reasonable to assume, for stability analysis purposes, a conservative condition of post-liquefaction shear strength for the full depth of the tailings. There is no geotechnical sounding information (e.g. piezocone data) from the impounded tailings, but a post-liquefaction Su/v’ = 0.1 is reasonable based on case record data provided by Olson and Stark (2002) and has been used for the analyses reported herein.
While of little importance for downstream slope stability analyses, the shear strength of the tailings governs upstream stability of the centerline stage raises of the dam. The shear strength of Zone U, which provides upstream support for the Zone S till core, also affects the upstream stability until the tailing deposit has risen to fully buttress the Zone U slope.
6.5.3. Zone S Till Core Shear Strength
The Zone S core is comprised of basal till compacted to a minimum of 95% of the maximum dry density as determined from the standard Proctor test (ASTM D698). KP (1995) reported on isotropically consolidated, undrained (CIU) triaxial compression testing on compacted till core samples. Those tests yielded c’ = 0, and ’ = 35. Those same parameters have been used in all of the KP stability analyses since the initial design report (KP, 1995). These values
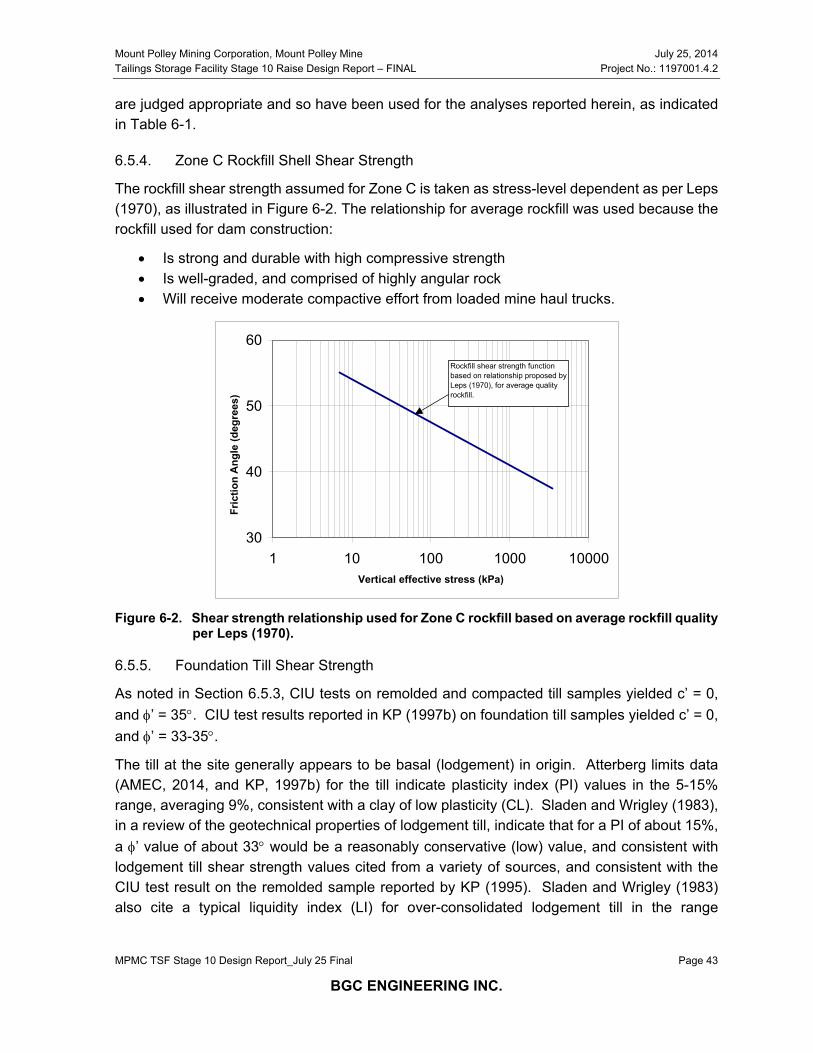
Mount Polley Mining Corporation, Mount Polley Mine July 25, 2014 Tailings Storage Facility Stage 10 Raise Design Report – FINAL Project No.: 1197001.4.2
MPMC TSF Stage 10 Design Report_July 25 Final Page 43
BGC ENGINEERING INC.
are judged appropriate and so have been used for the analyses reported herein, as indicated in Table 6-1.
6.5.4. Zone C Rockfill Shell Shear Strength
The rockfill shear strength assumed for Zone C is taken as stress-level dependent as per Leps (1970), as illustrated in Figure 6-2. The relationship for average rockfill was used because the rockfill used for dam construction:
Is strong and durable with high compressive strength Is well-graded, and comprised of highly angular rock Will receive moderate compactive effort from loaded mine haul trucks.
Figure 6-2. Shear strength relationship used for Zone C rockfill based on average rockfill quality
per Leps (1970).
6.5.5. Foundation Till Shear Strength
As noted in Section 6.5.3, CIU tests on remolded and compacted till samples yielded c’ = 0, and ’ = 35. CIU test results reported in KP (1997b) on foundation till samples yielded c’ = 0, and ’ = 33-35.
The till at the site generally appears to be basal (lodgement) in origin. Atterberg limits data (AMEC, 2014, and KP, 1997b) for the till indicate plasticity index (PI) values in the 5-15% range, averaging 9%, consistent with a clay of low plasticity (CL). Sladen and Wrigley (1983), in a review of the geotechnical properties of lodgement till, indicate that for a PI of about 15%, a ’ value of about 33 would be a reasonably conservative (low) value, and consistent with lodgement till shear strength values cited from a variety of sources, and consistent with the CIU test result on the remolded sample reported by KP (1995). Sladen and Wrigley (1983) also cite a typical liquidity index (LI) for over-consolidated lodgement till in the range
30
40
50
60
1 10 100 1000 10000Vertical effective stress (kPa)
Fric
tion
Ang
le (d
egre
es)
Rockfill shear strength function based on relationship proposed by Leps (1970), for average quality rockfill.
Mount Polley Mining Corporation, Mount Polley Mine July 25, 2014 Tailings Storage Facility Stage 10 Raise Design Report – FINAL Project No.: 1197001.4.2
MPMC TSF Stage 10 Design Report_July 25 Final Page 44
BGC ENGINEERING INC.
of -0.1 to -0.35. KP (2007b) reports LI values in the range of -1.97 to 0.10, with an average of -0.43, generally consistent with the range given by Sladen and Wrigley for lodgement till.
KP (1995) assigned the foundation till a ’ value of 33 for stability analysis purposes.
For the analyses updated in 2005, KP (2005) assigned shear strengths for foundation till as follows:
Loose to dense till: c’ = 0, ’ = 26. This unit was modeled in KP’s stability analyses as the top 2 m of the till underlying the dams.
Basal till: c’ = 0, ’ = 33.
The strength for the upper till of ’ = 26 is considered unrealistically low, particularly once any surficial weathered/ablation till is proof-rolled prior to fill placement, and subsequently consolidated under the dam loading. Moreover, the upper till has moisture contents typically 2-3% above optimum (KP, 1995) as derived from the Modified Proctor compaction test (ASTM D1557), which is typical of basal till. The need to dozer-rip the till in the borrow area downstream of the Perimeter Embankment (see Figure 2-1) is also suggestive of density comparable to basal till. For the stability analyses reported herein, as indicated in Table 6-1, the parameters used for the till foundation are c’ = 0, and ’ = 33.
6.5.6. Glaciolacustrine Foundation Unit Shear Strength
6.5.6.1. General
Interbedded within the till underlying the dams are glaciolacustrine and glaciofluvial sediments. Based on a review of previous site investigation information and a sonic drilling campaign undertaken in 2011 specifically to better characterize the glaciolacustrine and glaciofluvial foundation units, AMEC (2012b) concluded the following:
The glaciolacustrine unit generally is varved to massive, with predominantly silt and clayey silt of low plasticity, interbedded with more granular glaciofluvial deposits.
The units are over-consolidated, having been described in various investigations as “firm” to “very stiff”, and “dense” to “very dense”.
Where clay is present within the unit, Atterberg limits tests indicate the material to classify as a silt of low plasticity (ML) to a clay of intermediate plasticity (CI).
There is no evidence of pre-shearing (i.e. slickenside features within clay varves that would indicate a low operative shear strength – see Section 6.5.6.3).
Inclinometer displacements monitored to date (see Section 5.3) within the glaciolacustrine unit have been minimal and are of no concern.
6.5.6.2. Peak Shear Strength
KP (1995) reported CIU tests on a remolded and compacted sample of the glaciolacustrine unit that yielded c’ = 0, ’ = 33. The sample tested was described by KP (1995) as “silt and fine-grained sand”, comprising 40% sand, 46% silt and 14% clay sizes (by dry weight).
Mount Polley Mining Corporation, Mount Polley Mine July 25, 2014 Tailings Storage Facility Stage 10 Raise Design Report – FINAL Project No.: 1197001.4.2
MPMC TSF Stage 10 Design Report_July 25 Final Page 45
BGC ENGINEERING INC.
AMEC (2012a) adopted c’ = 0, and ’ = 28° to represent the operative shear strength of the glaciolacustrine unit, and this is judged reasonable as the basis for the stability analyses presented herein. However, the potential for strain-induced loss of strength must be considered for a design based on the observational approach (Peck, 1969), and this is addressed below.
6.5.6.3. Residual Shear Strength
In the presence of glaciolacustrine soils, common concerns in terms of embankment stability are:
Potential pre-shearing in clayey varves (due to glacial drag, or post-glacial land sliding) that could lead to a very low (residual) operative shear strength parallel to bedding
Sufficient foundation straining induced by embankment loading that reduces shear strength in such materials from peak to or near residual.
The TSF instrumentation includes inclinometers, extending through the foundation overburden soils and seated into bedrock. Monitoring of the inclinometers to date has indicated no significant movements that would be consistent with either of the concerns listed above. AMEC (2012b) undertook a sonic drilling program in the foundation of the dam, for installation of additional instrumentation, and to obtain an improved characterization of the glaciolacustrine soils in the foundation. That program similarly did not yield any evidence of the two concerns listed above.
Despite these findings, the application of the observational approach to ongoing dam raising requires a conservative approach including:
The possibility of lower operative shear strengths in the glaciolacustrine foundation unit than currently assumed
A contingency for a stabilizing buttress berm, triggered by established threshold criteria (amount/rate of inclinometer movement) be provided for.
Accordingly, the analyses for the interim dam raising accounted for residual shear strength conditions within the glaciolacustrine foundation units. The residual strength was estimated on the basis of index property data (derived from the AMEC 2011 site investigation program) and the empirical approach described by Stark and Eid (1994), which builds upon approaches outlined by Skempton (1985) and Lupini et al. (1981).
Atterberg Limits results for the glaciolacustrine samples obtained during site investigation programs (including sonic drilling) are presented in Figure 6-3 (AMEC, 2012b). Note that GLU in this figure refers to the glaciolacustrine unit.
All results, with the exception of one (a sample from drill hole Sl11-02), have a liquid limit less than 50%, and classify as clay of low plasticity (CL) to clay of intermediate plasticity (CI). Gradation analyses of glaciolacustrine samples obtained from that same site investigation indicated clay fractions (see Figure 6-4) in the range of 20% to 35%.
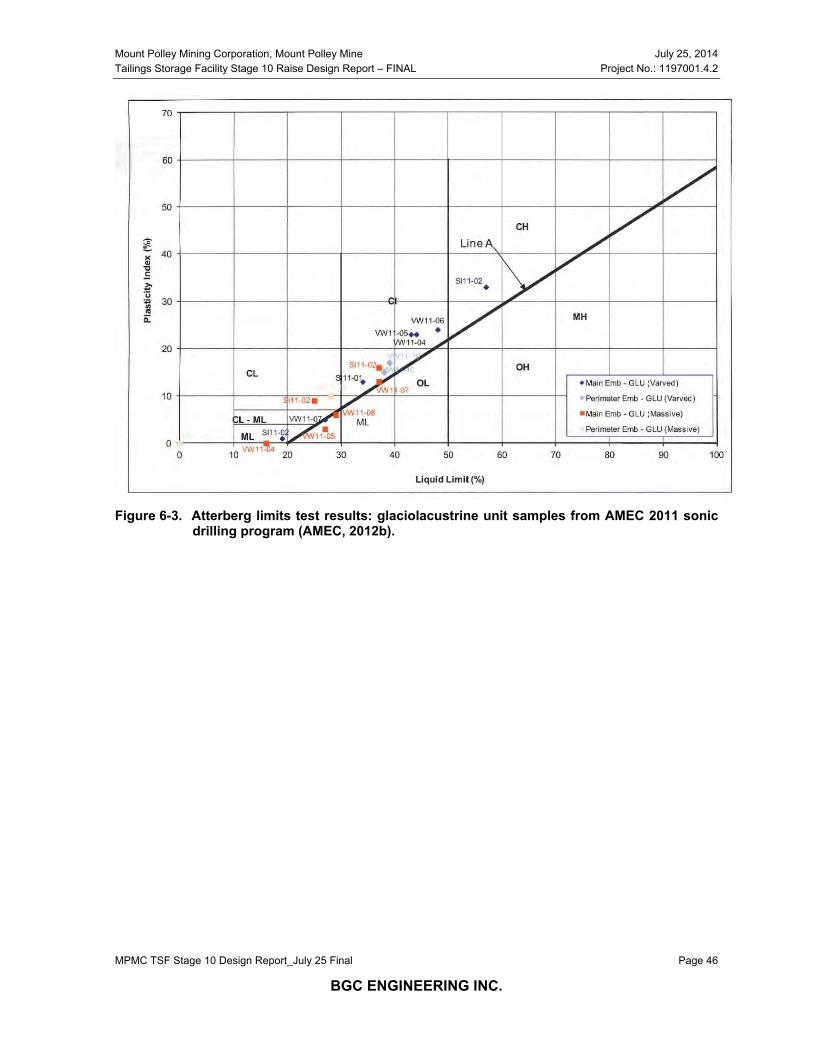
Mount Polley Mining Corporation, Mount Polley Mine July 25, 2014 Tailings Storage Facility Stage 10 Raise Design Report – FINAL Project No.: 1197001.4.2
MPMC TSF Stage 10 Design Report_July 25 Final Page 46
BGC ENGINEERING INC.
Figure 6-3. Atterberg limits test results: glaciolacustrine unit samples from AMEC 2011 sonic
drilling program (AMEC, 2012b).
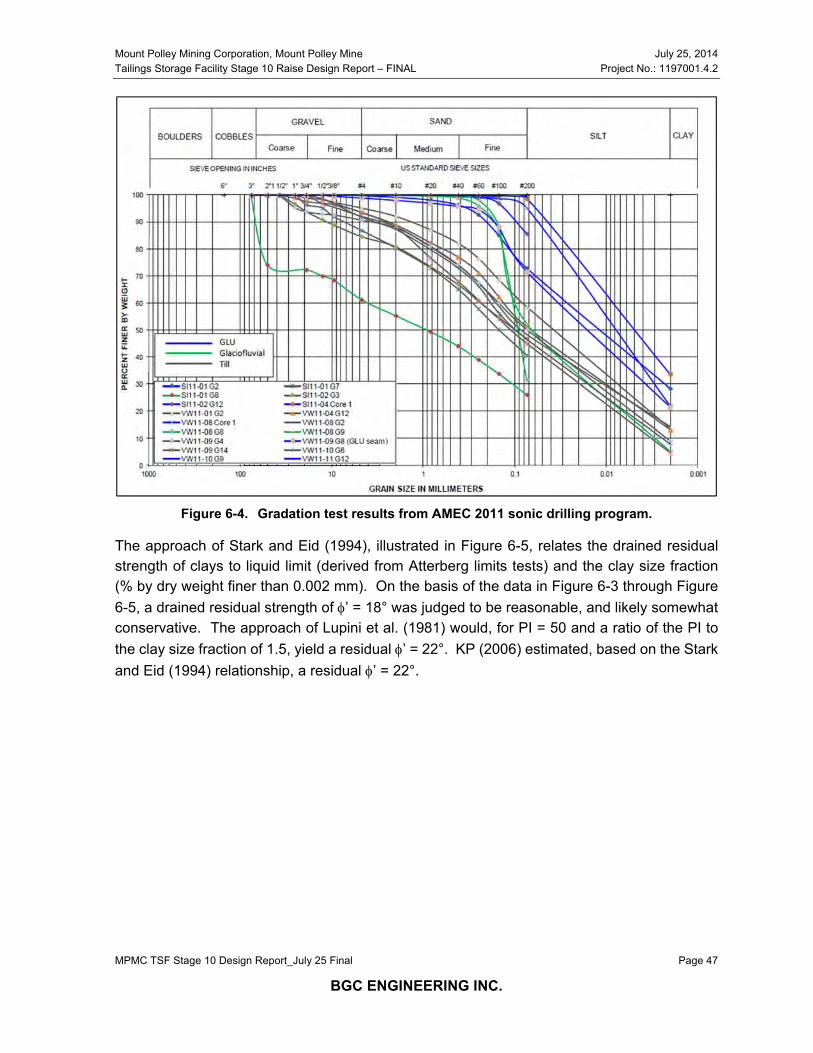
Mount Polley Mining Corporation, Mount Polley Mine July 25, 2014 Tailings Storage Facility Stage 10 Raise Design Report – FINAL Project No.: 1197001.4.2
MPMC TSF Stage 10 Design Report_July 25 Final Page 47
BGC ENGINEERING INC.
Figure 6-4. Gradation test results from AMEC 2011 sonic drilling program.
The approach of Stark and Eid (1994), illustrated in Figure 6-5, relates the drained residual strength of clays to liquid limit (derived from Atterberg limits tests) and the clay size fraction (% by dry weight finer than 0.002 mm). On the basis of the data in Figure 6-3 through Figure 6-5, a drained residual strength of ’ = 18° was judged to be reasonable, and likely somewhat conservative. The approach of Lupini et al. (1981) would, for PI = 50 and a ratio of the PI to the clay size fraction of 1.5, yield a residual ’ = 22°. KP (2006) estimated, based on the Stark and Eid (1994) relationship, a residual ’ = 22°.
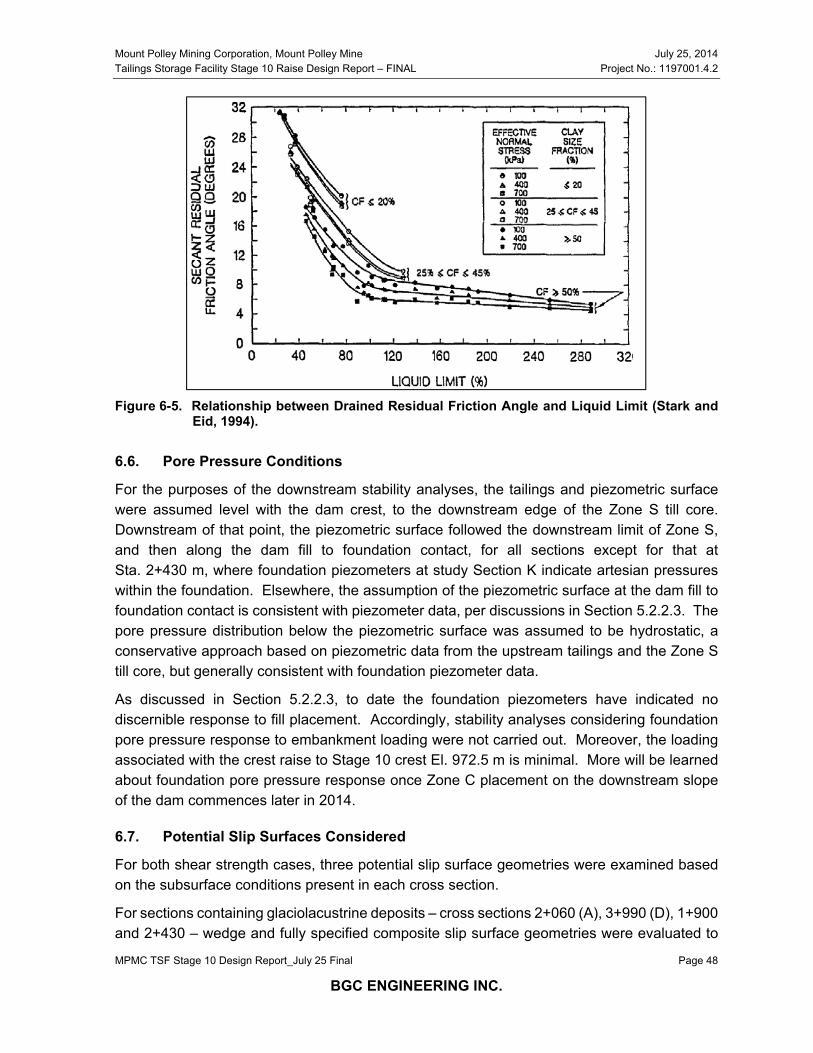
Mount Polley Mining Corporation, Mount Polley Mine July 25, 2014 Tailings Storage Facility Stage 10 Raise Design Report – FINAL Project No.: 1197001.4.2
MPMC TSF Stage 10 Design Report_July 25 Final Page 48
BGC ENGINEERING INC.
Figure 6-5. Relationship between Drained Residual Friction Angle and Liquid Limit (Stark and
Eid, 1994).
6.6. Pore Pressure Conditions
For the purposes of the downstream stability analyses, the tailings and piezometric surface were assumed level with the dam crest, to the downstream edge of the Zone S till core. Downstream of that point, the piezometric surface followed the downstream limit of Zone S, and then along the dam fill to foundation contact, for all sections except for that at Sta. 2+430 m, where foundation piezometers at study Section K indicate artesian pressures within the foundation. Elsewhere, the assumption of the piezometric surface at the dam fill to foundation contact is consistent with piezometer data, per discussions in Section 5.2.2.3. The pore pressure distribution below the piezometric surface was assumed to be hydrostatic, a conservative approach based on piezometric data from the upstream tailings and the Zone S till core, but generally consistent with foundation piezometer data.
As discussed in Section 5.2.2.3, to date the foundation piezometers have indicated no discernible response to fill placement. Accordingly, stability analyses considering foundation pore pressure response to embankment loading were not carried out. Moreover, the loading associated with the crest raise to Stage 10 crest El. 972.5 m is minimal. More will be learned about foundation pore pressure response once Zone C placement on the downstream slope of the dam commences later in 2014.
6.7. Potential Slip Surfaces Considered
For both shear strength cases, three potential slip surface geometries were examined based on the subsurface conditions present in each cross section.
For sections containing glaciolacustrine deposits – cross sections 2+060 (A), 3+990 (D), 1+900 and 2+430 – wedge and fully specified composite slip surface geometries were evaluated to
Mount Polley Mining Corporation, Mount Polley Mine July 25, 2014 Tailings Storage Facility Stage 10 Raise Design Report – FINAL Project No.: 1197001.4.2
MPMC TSF Stage 10 Design Report_July 25 Final Page 49
BGC ENGINEERING INC.
model a horizontal shear plane within the glaciolacustrine deposit (which would be the most likely situation given that any horizontal and continuous clayey varves would represent the critical residual strength stability condition).
For the analyses assuming a residual shear strength condition in the glaciolacustrine unit, the slip surfaces were assumed to be predominantly horizontal within that unit, on the basis that residual strength would only be mobilized along continuous clay varves within the unit. For the portion of the slip surfaces within the glaciolacustrine unit inclined to the horizontal (i.e., shearing in either triaxial compression or triaxial extension), peak strength was assigned. These assumptions therefore allowed for the modeling of shear strength anisotropy within the glaciolacustrine unit under the residual shear strength scenarios.
For the sections not containing glaciolacustrine deposits, cross sections 0+720 (F) and 3+500, circular slip surfaces were assumed, as the shear strength of the till foundation would be isotropic.
6.8. Model Analysis Software
The limit equilibrium stability software, Slope/W computer (GeoSlope, 2007), was used for analysis utilizing the Morgenstern-Price method of slices solution, solving for both force and moment equilibrium, an approach consistent with previous stability analyses of the dam.
6.9. Results
6.9.1. General
Stability analysis was performed for each of the six cross sections at the currently permitted dam crest elevation of 970m, Stage 10 crest elevation of 972.5 m and at a dam crest elevation of 978 m; the maximum core elevation attainable without widening the downstream shell. The critical slip surfaces for each section and shear strength case are presented in Figures A.1 through A.11 in Appendix A for the analyses for crest El. 972.5 m.
6.9.2. Static Stability for Stage 10 Crest El. 972.5 m
The FoS for the critical slip surface for peak and glaciolacustrine residual shear strength cases at crest El. 972.5 m for each section are summarized in Table 6-2. The results indicate that raising of the toe buttress against the existing dam is required to achieve FoS criteria along a portion of the Perimeter Embankment, and along the Main Embankment. On the basis of the stability analysis results, the toe buttress should be constructed/raised as outlined in Table 6-3.
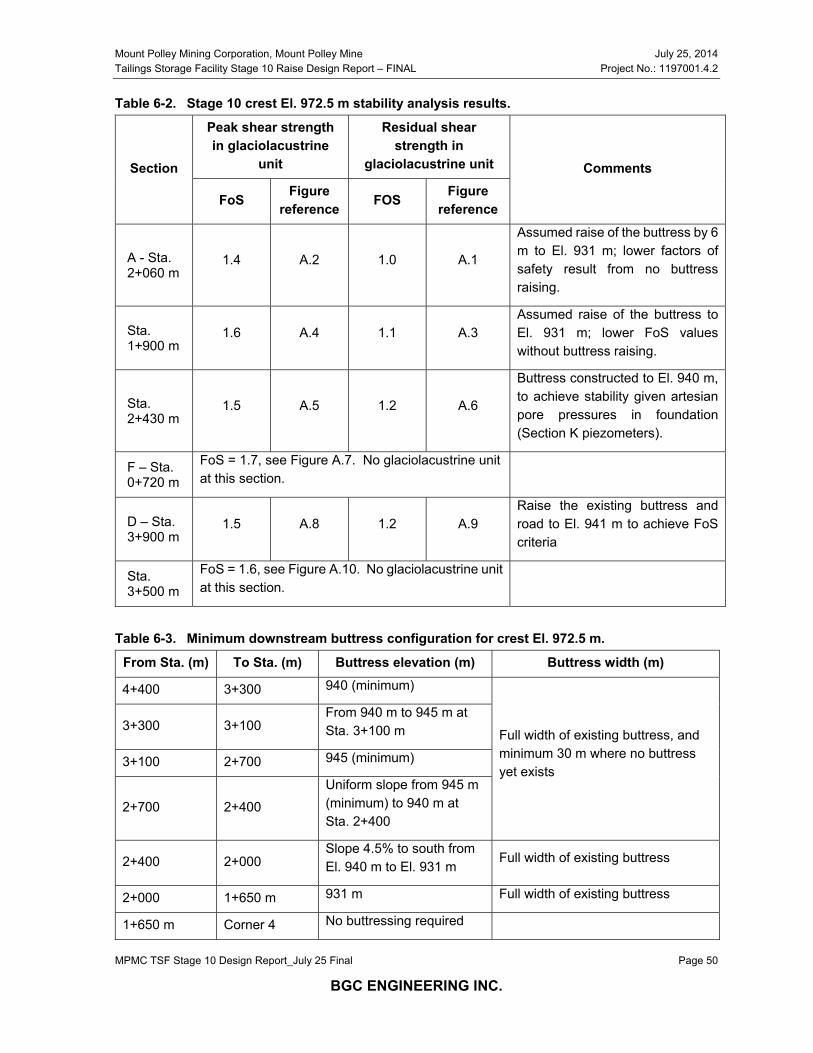
Mount Polley Mining Corporation, Mount Polley Mine July 25, 2014 Tailings Storage Facility Stage 10 Raise Design Report – FINAL Project No.: 1197001.4.2
MPMC TSF Stage 10 Design Report_July 25 Final Page 50
BGC ENGINEERING INC.
Table 6-2. Stage 10 crest El. 972.5 m stability analysis results.
Section
Peak shear strength in glaciolacustrine
unit
Residual shear strength in
glaciolacustrine unit Comments
FoS Figure reference FOS Figure
reference
A - Sta. 2+060 m
1.4 A.2 1.0 A.1
Assumed raise of the buttress by 6 m to El. 931 m; lower factors of safety result from no buttress raising.
Sta. 1+900 m
1.6 A.4 1.1 A.3 Assumed raise of the buttress to El. 931 m; lower FoS values without buttress raising.
Sta. 2+430 m
1.5 A.5 1.2 A.6
Buttress constructed to El. 940 m, to achieve stability given artesian pore pressures in foundation (Section K piezometers).
F – Sta. 0+720 m
FoS = 1.7, see Figure A.7. No glaciolacustrine unit at this section.
D – Sta. 3+900 m
1.5 A.8 1.2 A.9 Raise the existing buttress and road to El. 941 m to achieve FoS criteria
Sta. 3+500 m
FoS = 1.6, see Figure A.10. No glaciolacustrine unit at this section.
Table 6-3. Minimum downstream buttress configuration for crest El. 972.5 m.
From Sta. (m) To Sta. (m) Buttress elevation (m) Buttress width (m)
4+400 3+300 940 (minimum)
Full width of existing buttress, and minimum 30 m where no buttress yet exists
3+300 3+100 From 940 m to 945 m at Sta. 3+100 m
3+100 2+700 945 (minimum)
2+700 2+400 Uniform slope from 945 m (minimum) to 940 m at Sta. 2+400
2+400 2+000 Slope 4.5% to south from El. 940 m to El. 931 m
Full width of existing buttress
2+000 1+650 m 931 m Full width of existing buttress
1+650 m Corner 4 No buttressing required
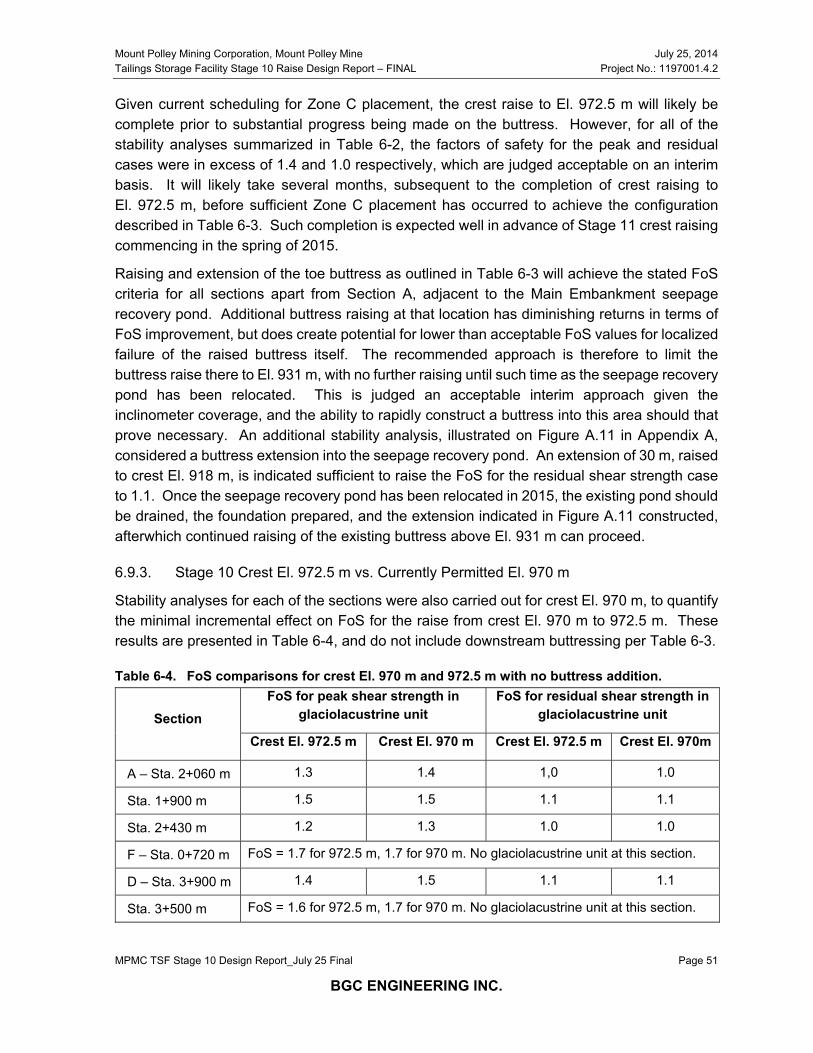
Mount Polley Mining Corporation, Mount Polley Mine July 25, 2014 Tailings Storage Facility Stage 10 Raise Design Report – FINAL Project No.: 1197001.4.2
MPMC TSF Stage 10 Design Report_July 25 Final Page 51
BGC ENGINEERING INC.
Given current scheduling for Zone C placement, the crest raise to El. 972.5 m will likely be complete prior to substantial progress being made on the buttress. However, for all of the stability analyses summarized in Table 6-2, the factors of safety for the peak and residual cases were in excess of 1.4 and 1.0 respectively, which are judged acceptable on an interim basis. It will likely take several months, subsequent to the completion of crest raising to El. 972.5 m, before sufficient Zone C placement has occurred to achieve the configuration described in Table 6-3. Such completion is expected well in advance of Stage 11 crest raising commencing in the spring of 2015.
Raising and extension of the toe buttress as outlined in Table 6-3 will achieve the stated FoS criteria for all sections apart from Section A, adjacent to the Main Embankment seepage recovery pond. Additional buttress raising at that location has diminishing returns in terms of FoS improvement, but does create potential for lower than acceptable FoS values for localized failure of the raised buttress itself. The recommended approach is therefore to limit the buttress raise there to El. 931 m, with no further raising until such time as the seepage recovery pond has been relocated. This is judged an acceptable interim approach given the inclinometer coverage, and the ability to rapidly construct a buttress into this area should that prove necessary. An additional stability analysis, illustrated on Figure A.11 in Appendix A, considered a buttress extension into the seepage recovery pond. An extension of 30 m, raised to crest El. 918 m, is indicated sufficient to raise the FoS for the residual shear strength case to 1.1. Once the seepage recovery pond has been relocated in 2015, the existing pond should be drained, the foundation prepared, and the extension indicated in Figure A.11 constructed, afterwhich continued raising of the existing buttress above El. 931 m can proceed.
6.9.3. Stage 10 Crest El. 972.5 m vs. Currently Permitted El. 970 m
Stability analyses for each of the sections were also carried out for crest El. 970 m, to quantify the minimal incremental effect on FoS for the raise from crest El. 970 m to 972.5 m. These results are presented in Table 6-4, and do not include downstream buttressing per Table 6-3.
Table 6-4. FoS comparisons for crest El. 970 m and 972.5 m with no buttress addition.
Section FoS for peak shear strength in
glaciolacustrine unit FoS for residual shear strength in
glaciolacustrine unit
Crest El. 972.5 m Crest El. 970 m Crest El. 972.5 m Crest El. 970m
A – Sta. 2+060 m 1.3 1.4 1,0 1.0
Sta. 1+900 m 1.5 1.5 1.1 1.1
Sta. 2+430 m 1.2 1.3 1.0 1.0
F – Sta. 0+720 m FoS = 1.7 for 972.5 m, 1.7 for 970 m. No glaciolacustrine unit at this section.
D – Sta. 3+900 m 1.4 1.5 1.1 1.1
Sta. 3+500 m FoS = 1.6 for 972.5 m, 1.7 for 970 m. No glaciolacustrine unit at this section.
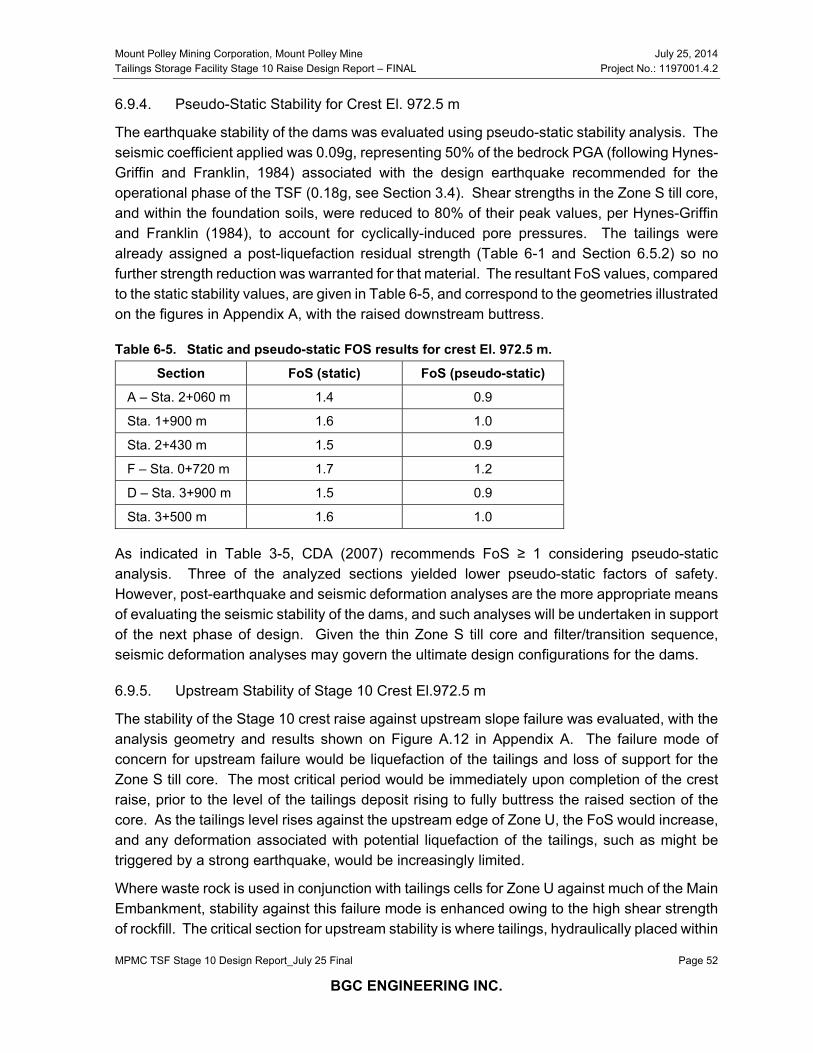
Mount Polley Mining Corporation, Mount Polley Mine July 25, 2014 Tailings Storage Facility Stage 10 Raise Design Report – FINAL Project No.: 1197001.4.2
MPMC TSF Stage 10 Design Report_July 25 Final Page 52
BGC ENGINEERING INC.
6.9.4. Pseudo-Static Stability for Crest El. 972.5 m
The earthquake stability of the dams was evaluated using pseudo-static stability analysis. The seismic coefficient applied was 0.09g, representing 50% of the bedrock PGA (following Hynes-Griffin and Franklin, 1984) associated with the design earthquake recommended for the operational phase of the TSF (0.18g, see Section 3.4). Shear strengths in the Zone S till core, and within the foundation soils, were reduced to 80% of their peak values, per Hynes-Griffin and Franklin (1984), to account for cyclically-induced pore pressures. The tailings were already assigned a post-liquefaction residual strength (Table 6-1 and Section 6.5.2) so no further strength reduction was warranted for that material. The resultant FoS values, compared to the static stability values, are given in Table 6-5, and correspond to the geometries illustrated on the figures in Appendix A, with the raised downstream buttress.
Table 6-5. Static and pseudo-static FOS results for crest El. 972.5 m.
Section FoS (static) FoS (pseudo-static)
A – Sta. 2+060 m 1.4 0.9
Sta. 1+900 m 1.6 1.0
Sta. 2+430 m 1.5 0.9
F – Sta. 0+720 m 1.7 1.2
D – Sta. 3+900 m 1.5 0.9
Sta. 3+500 m 1.6 1.0
As indicated in Table 3-5, CDA (2007) recommends FoS ≥ 1 considering pseudo-static analysis. Three of the analyzed sections yielded lower pseudo-static factors of safety. However, post-earthquake and seismic deformation analyses are the more appropriate means of evaluating the seismic stability of the dams, and such analyses will be undertaken in support of the next phase of design. Given the thin Zone S till core and filter/transition sequence, seismic deformation analyses may govern the ultimate design configurations for the dams.
6.9.5. Upstream Stability of Stage 10 Crest El.972.5 m
The stability of the Stage 10 crest raise against upstream slope failure was evaluated, with the analysis geometry and results shown on Figure A.12 in Appendix A. The failure mode of concern for upstream failure would be liquefaction of the tailings and loss of support for the Zone S till core. The most critical period would be immediately upon completion of the crest raise, prior to the level of the tailings deposit rising to fully buttress the raised section of the core. As the tailings level rises against the upstream edge of Zone U, the FoS would increase, and any deformation associated with potential liquefaction of the tailings, such as might be triggered by a strong earthquake, would be increasingly limited.
Where waste rock is used in conjunction with tailings cells for Zone U against much of the Main Embankment, stability against this failure mode is enhanced owing to the high shear strength of rockfill. The critical section for upstream stability is where tailings, hydraulically placed within
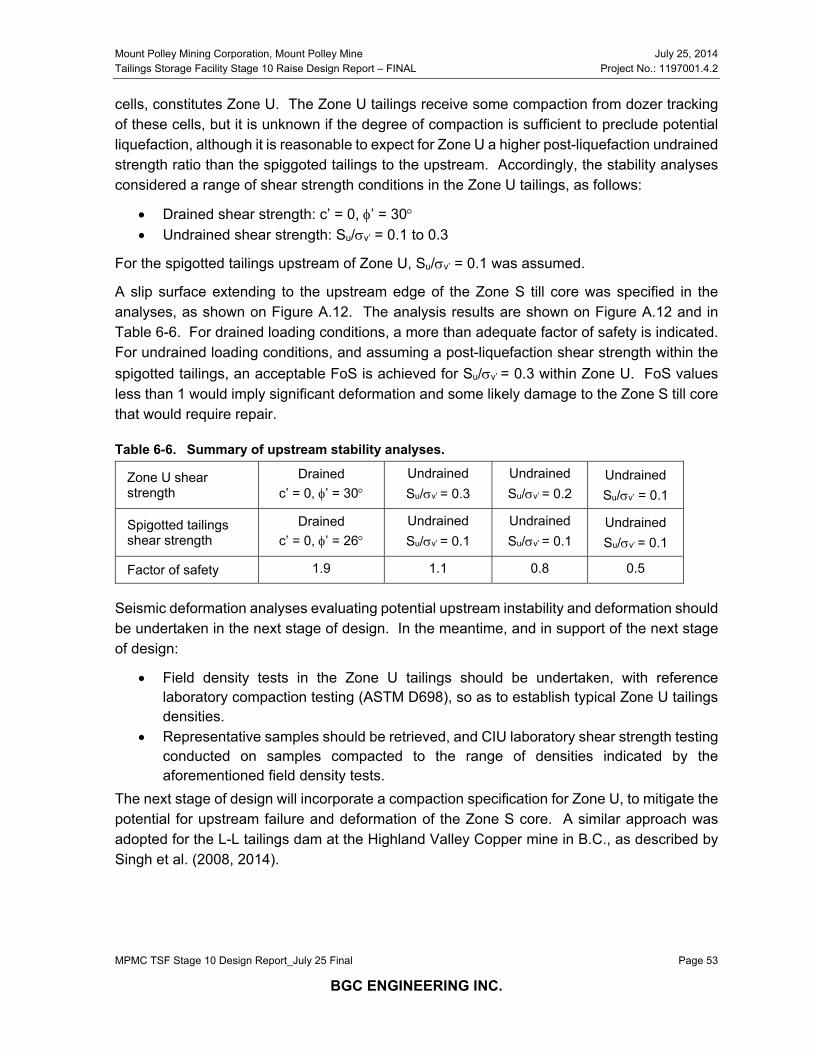
Mount Polley Mining Corporation, Mount Polley Mine July 25, 2014 Tailings Storage Facility Stage 10 Raise Design Report – FINAL Project No.: 1197001.4.2
MPMC TSF Stage 10 Design Report_July 25 Final Page 53
BGC ENGINEERING INC.
cells, constitutes Zone U. The Zone U tailings receive some compaction from dozer tracking of these cells, but it is unknown if the degree of compaction is sufficient to preclude potential liquefaction, although it is reasonable to expect for Zone U a higher post-liquefaction undrained strength ratio than the spiggoted tailings to the upstream. Accordingly, the stability analyses considered a range of shear strength conditions in the Zone U tailings, as follows:
Drained shear strength: c’ = 0, ’ = 30 Undrained shear strength: Su/v’ = 0.1 to 0.3
For the spigotted tailings upstream of Zone U, Su/v’ = 0.1 was assumed.
A slip surface extending to the upstream edge of the Zone S till core was specified in the analyses, as shown on Figure A.12. The analysis results are shown on Figure A.12 and in Table 6-6. For drained loading conditions, a more than adequate factor of safety is indicated. For undrained loading conditions, and assuming a post-liquefaction shear strength within the spigotted tailings, an acceptable FoS is achieved for Su/v’ = 0.3 within Zone U. FoS values less than 1 would imply significant deformation and some likely damage to the Zone S till core that would require repair.
Table 6-6. Summary of upstream stability analyses.
Zone U shear strength
Drained c’ = 0, ’ = 30
Undrained Su/v’ = 0.3
Undrained Su/v’ = 0.2
Undrained Su/v’ = 0.1
Spigotted tailings shear strength
Drained c’ = 0, ’ = 26
Undrained Su/v’ = 0.1
Undrained Su/v’ = 0.1
Undrained Su/v’ = 0.1
Factor of safety 1.9 1.1 0.8 0.5
Seismic deformation analyses evaluating potential upstream instability and deformation should be undertaken in the next stage of design. In the meantime, and in support of the next stage of design:
Field density tests in the Zone U tailings should be undertaken, with reference laboratory compaction testing (ASTM D698), so as to establish typical Zone U tailings densities.
Representative samples should be retrieved, and CIU laboratory shear strength testing conducted on samples compacted to the range of densities indicated by the aforementioned field density tests.
The next stage of design will incorporate a compaction specification for Zone U, to mitigate the potential for upstream failure and deformation of the Zone S core. A similar approach was adopted for the L-L tailings dam at the Highland Valley Copper mine in B.C., as described by Singh et al. (2008, 2014).
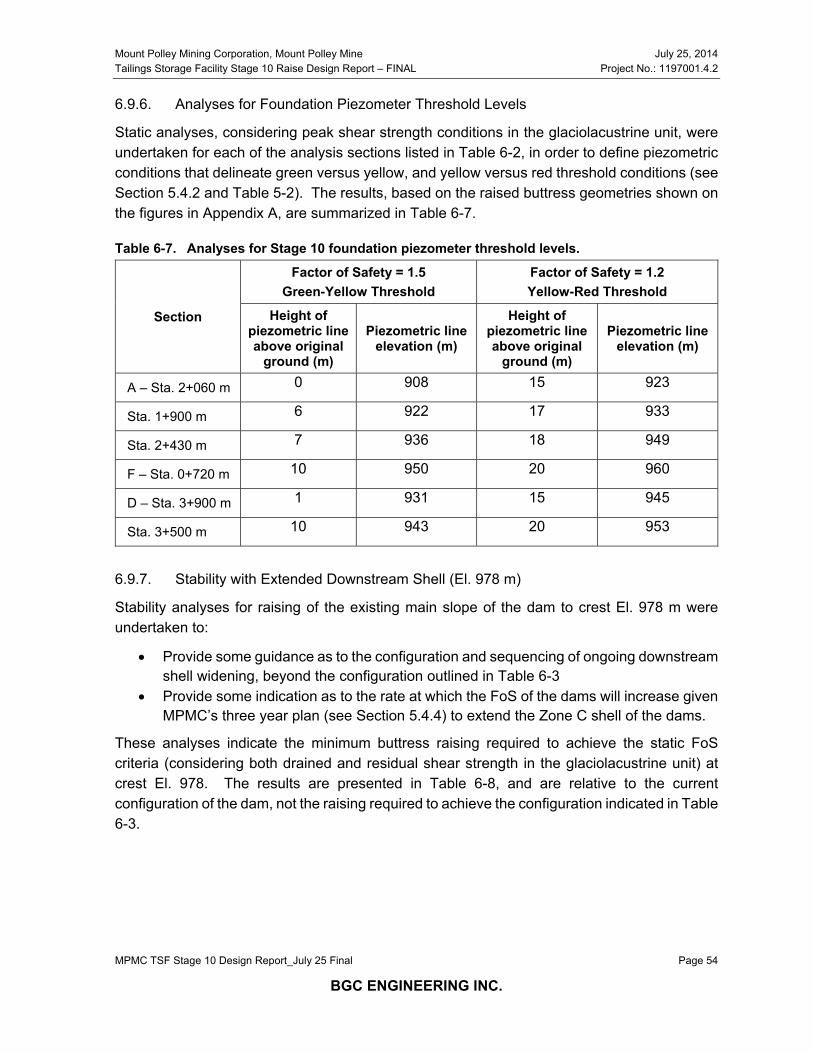
Mount Polley Mining Corporation, Mount Polley Mine July 25, 2014 Tailings Storage Facility Stage 10 Raise Design Report – FINAL Project No.: 1197001.4.2
MPMC TSF Stage 10 Design Report_July 25 Final Page 54
BGC ENGINEERING INC.
6.9.6. Analyses for Foundation Piezometer Threshold Levels
Static analyses, considering peak shear strength conditions in the glaciolacustrine unit, were undertaken for each of the analysis sections listed in Table 6-2, in order to define piezometric conditions that delineate green versus yellow, and yellow versus red threshold conditions (see Section 5.4.2 and Table 5-2). The results, based on the raised buttress geometries shown on the figures in Appendix A, are summarized in Table 6-7.
Table 6-7. Analyses for Stage 10 foundation piezometer threshold levels.
Section
Factor of Safety = 1.5 Green-Yellow Threshold
Factor of Safety = 1.2 Yellow-Red Threshold
Height of piezometric line above original
ground (m)
Piezometric line elevation (m)
Height of piezometric line above original
ground (m)
Piezometric line elevation (m)
A – Sta. 2+060 m 0 908 15 923
Sta. 1+900 m 6 922 17 933
Sta. 2+430 m 7 936 18 949
F – Sta. 0+720 m 10 950 20 960
D – Sta. 3+900 m 1 931 15 945
Sta. 3+500 m 10 943 20 953
6.9.7. Stability with Extended Downstream Shell (El. 978 m)
Stability analyses for raising of the existing main slope of the dam to crest El. 978 m were undertaken to:
Provide some guidance as to the configuration and sequencing of ongoing downstream shell widening, beyond the configuration outlined in Table 6-3
Provide some indication as to the rate at which the FoS of the dams will increase given MPMC’s three year plan (see Section 5.4.4) to extend the Zone C shell of the dams.
These analyses indicate the minimum buttress raising required to achieve the static FoS criteria (considering both drained and residual shear strength in the glaciolacustrine unit) at crest El. 978. The results are presented in Table 6-8, and are relative to the current configuration of the dam, not the raising required to achieve the configuration indicated in Table 6-3.
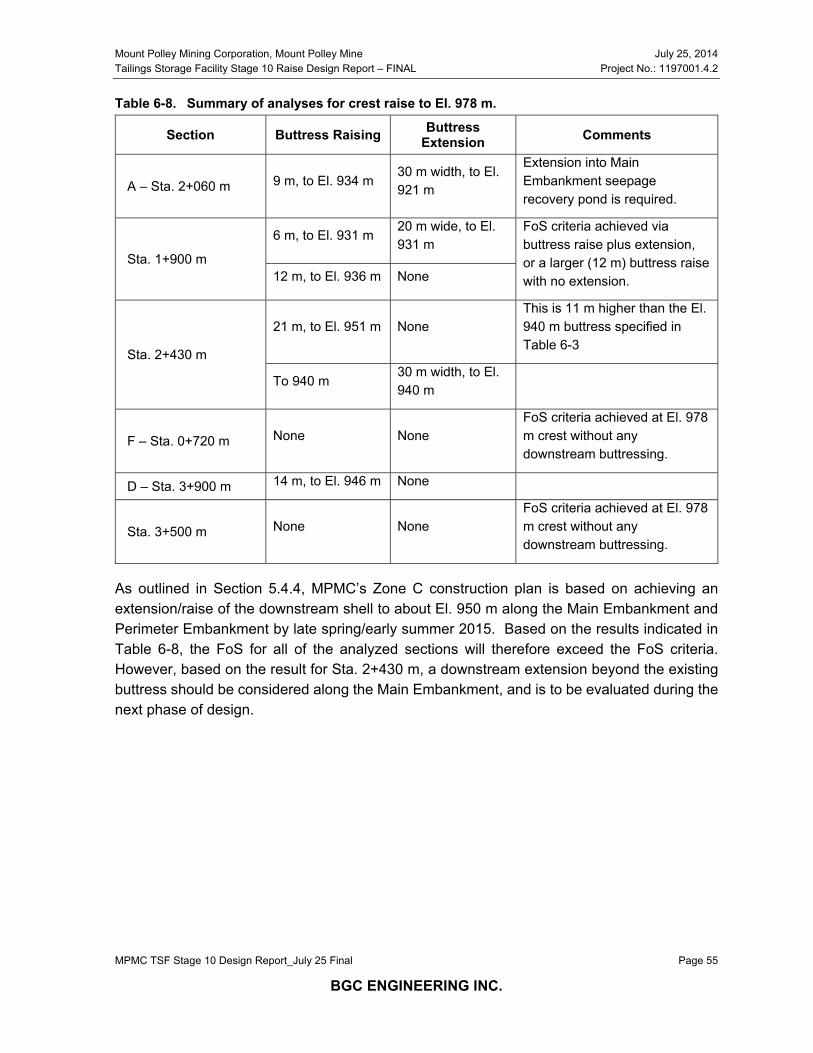
Mount Polley Mining Corporation, Mount Polley Mine July 25, 2014 Tailings Storage Facility Stage 10 Raise Design Report – FINAL Project No.: 1197001.4.2
MPMC TSF Stage 10 Design Report_July 25 Final Page 55
BGC ENGINEERING INC.
Table 6-8. Summary of analyses for crest raise to El. 978 m.
Section Buttress Raising Buttress Extension Comments
A – Sta. 2+060 m 9 m, to El. 934 m 30 m width, to El. 921 m
Extension into Main Embankment seepage recovery pond is required.
Sta. 1+900 m
6 m, to El. 931 m 20 m wide, to El. 931 m
FoS criteria achieved via buttress raise plus extension, or a larger (12 m) buttress raise with no extension. 12 m, to El. 936 m None
Sta. 2+430 m
21 m, to El. 951 m None This is 11 m higher than the El. 940 m buttress specified in Table 6-3
To 940 m 30 m width, to El. 940 m
F – Sta. 0+720 m None None FoS criteria achieved at El. 978 m crest without any downstream buttressing.
D – Sta. 3+900 m 14 m, to El. 946 m None
Sta. 3+500 m None None FoS criteria achieved at El. 978 m crest without any downstream buttressing.
As outlined in Section 5.4.4, MPMC’s Zone C construction plan is based on achieving an extension/raise of the downstream shell to about El. 950 m along the Main Embankment and Perimeter Embankment by late spring/early summer 2015. Based on the results indicated in Table 6-8, the FoS for all of the analyzed sections will therefore exceed the FoS criteria. However, based on the result for Sta. 2+430 m, a downstream extension beyond the existing buttress should be considered along the Main Embankment, and is to be evaluated during the next phase of design.
Mount Polley Mining Corporation, Mount Polley Mine July 25, 2014 Tailings Storage Facility Stage 10 Raise Design Report – FINAL Project No.: 1197001.4.2
MPMC TSF Stage 10 Design Report_July 25 Final Page 56
BGC ENGINEERING INC.
7.0 STAGE 10 RAISE DESIGN
7.1. General
The Stage 10 construction of the TSF embankments will comprise:
Crest raising from El. 970 m (Stage 9a) to El. 972.5 m (Stage 10), in the summer/fall of 2014
Raising/extension of the downstream shell buttress, against the Perimeter Embankment and the Main Embankment, to be complete prior to commencement of the Stage 11 crest in the spring of 2015.
The Stage 10 design is illustrated on the drawings appended to this report, and is described in the following sub-sections. The design remains essentially the same as per previous design reports (see Table 2-1), and is not reiterated herein. The reader is referred to those previous design reports for in-depth discussion of the various design features. The key design change relative to the design as presented in the previous KP design reports is dam raising via centerline geometry (BGC, 2013), rather than the modified centerline (partial upstream) raising previously undertaken.
7.2. Foundation Preparation
Foundation preparation for the 2014 dam construction along the abutment extensions, and in an areas where the downstream shell is extended, is to comprise the following:
All topsoil, organic material, soft or loose soils, and other deleterious materials are to be removed from the foundation area.
The exposed foundation subgrade is to consist of till, or bedrock, and is to be approved by a representative of BGC.
If foundation stripping exposes glaciolacustrine/glaciofluvial soils, the excavation is to be inspected by BGC for direction on further excavation.
The abutment subgrade is to be proof-rolled with a smooth drum vibratory compactor.
Additional foundation preparation requirements apply for the Zone S till core to abutment contacts. These requirements are as follows, and as outlined on Drawing MPMC-XD-04-01:
The cutoff trench is to extend a minimum of 0.5 m into undisturbed, low hydraulic conductivity till, where till is in excess of 1 m thick as determined by test pits conducted outside the Zone S limits.
Where till is less than 1 m in thickness, the cutoff trench is to extend to sound bedrock. The cutoff trench is to be a minimum 2 m wide at its base. Where bedrock is
encountered, BGC may, depending on observed conditions direct that overburden be removed for the full 5 m width of Zone S.
The cutoff trench is to have sideslopes no steeper than 1H:1V.
If bedrock is encountered in the dam foundation cutoff trench, special considerations exist and special bedrock treatment measures may be required. Guidelines and procedures for dealing
Mount Polley Mining Corporation, Mount Polley Mine July 25, 2014 Tailings Storage Facility Stage 10 Raise Design Report – FINAL Project No.: 1197001.4.2
MPMC TSF Stage 10 Design Report_July 25 Final Page 57
BGC ENGINEERING INC.
with bedrock exposed in the cutoff trenches are indicated on Drawings MPMC-XD-04-01 and MPMC-XD-05-01.
The abutment areas are to be inspected and the need for a compacted till blanket extending upstream of the Zone S core limits to be assessed.
7.3. Embankment Zones Construction
7.3.1. General
Sections illustrating the crest raising to El. 972.5 m are shown on Drawings MPMC-XD-03-01 through MPMC-XD-03-04. The design of the raising/extension of the minimum downstream Zone C buttress (see Table 6-3) to be constructed prior to Stage 11 crest raising above El. 972.5 m, in 2015, is shown on Drawings MPMC-XD-02-02 through MPMC-XD-02-06 and MPMC-XD-03-01 through MPMC-XD-03-03.
Material and placement specifications for the various embankment zones are shown on Drawing MPMC-XD-05-01, which also indicates on-site and off-site quality control (QC) testing requirements for the embankment fills. Drawing MPMC-XD-05-02 illustrates the sequencing for raising of adjacent zones at the crest of the dam.
7.3.2. Zone U – Upstream Shell
The function of Zone U is to provide interim upstream structural support for the Zone S till core raising. Once the tailings deposit rises to the level of Zone U, that function becomes redundant, as the crest is supported by the gently sloping tailings beach. Zone U also accommodates the tailings discharge pipeline.
Zone U of the Mount Polley TSF typically consists of total tailings, placed within hydraulic fill cells, around the Perimeter Embankment, Main Embankment, and the South Embankment. The cells are to be constructed by confining the discharged tailings with berms (berms developed from previously placed tailings). The confining berms are to include a culvert to decant the water and fine materials to the TSF. The coarse tailings sand that settles out into the cells is to be reworked with a dozer to achieve proper distribution within the cells, provide compaction and to expedite the excess water drainage. This construction method has been used and proved effective in previous TSF embankment raises.
Waste rock is used for construction of Zone U along the Main Embankment when limitations in hydraulic tailings discharge due to head losses in the tailings delivery line are encountered. Waste rock is also used if tailings placement is behind schedule due to flooding of cells or construction delays. Where waste rock is used, it must be well graded and free of boulders larger than 0.5 m in diameter. A new TSF access/haul road is under development to Corner 1, and MPMC intends to relocate the tailings delivery line along the new road, the grade of which has been designed to provide sufficient head to delivery tailings all along the Main Embankment. This will allow use of tailings for Zone U for the Main Embankment raising from 2015 onward.
Mount Polley Mining Corporation, Mount Polley Mine July 25, 2014 Tailings Storage Facility Stage 10 Raise Design Report – FINAL Project No.: 1197001.4.2
MPMC TSF Stage 10 Design Report_July 25 Final Page 58
BGC ENGINEERING INC.
There are no compaction specifications for Zone U, although there is incidental compaction achieved via dozer traffic within the tailings cells, and truck traffic where waste rock is used.
7.3.3. Zone S – Till Core
The primary means of seepage reduction for the TSF is provided by Zone S, constructed of compacted low hydraulic conductivity till fill. The tailings deposit represents a secondary means of seepage reduction from the TSF, along with the seepage reduction blanket constructed in the early phases of TSF construction.
The glacial till borrow materials approved for Zone S are to be:
Well graded, organic-free, mineral soils Having moisture contents within 2% of optimum (as defined by the standard Proctor
compaction test – ASTM D698) for compaction Conforming to the specified gradation envelope provided on Drawing MPMC-XD-05-
01, with a minimum fines content (percent by dry weight finer than 0.074 mm) of 20%.
Prior to placement of glacial till within Zone S, the previous lift or prepared abutment is to be scarified to promote bonding between successive lifts. Moisture conditioning may be required for areas of the scarified surface that have dried out.
Zone S fill is to be spread in loose lift thicknesses no more than 0.3 m thick lifts (prior to compaction), and compacted by a 10-ton vibratory smooth drum compactor. Zone S fill is to be compacted to a minimum of 95% compaction of the maximum dry density as determined by ASTM D698.
QC testing for Zone S is as outlined on Drawing MPMC-XD-05-01, and will include:
Standard Proctor laboratory compaction tests (ASTM D698) In-situ field density tests via nuclear densometer (ASTM D6780) Moisture content determinations (ASTM D2216) Gradation analyses (D422) Atterberg limits testing (ASTM D4318)
7.3.4. Zone F – Filter
The function of Zone F is to provide the downstream filter for the Zone S till core. Zone F should satisfy filter criteria generally accepted for broadly graded till cores [i.e. Sherard et al., 1984a, 1984b, and 1989 , also cited in CDA (2007)]. The specified gradation envelope that has been used for this Zone through Stage 9a is compared against those criteria in

Mount Polley Mining Corporation, Mount Polley Mine July 25, 2014 Tailings Storage Facility Stage 10 Raise Design Report – FINAL Project No.: 1197001.4.2
MPMC TSF Stage 10 Design Report_July 25 Final Page 59
BGC ENGINEERING INC.
Table 7-1.
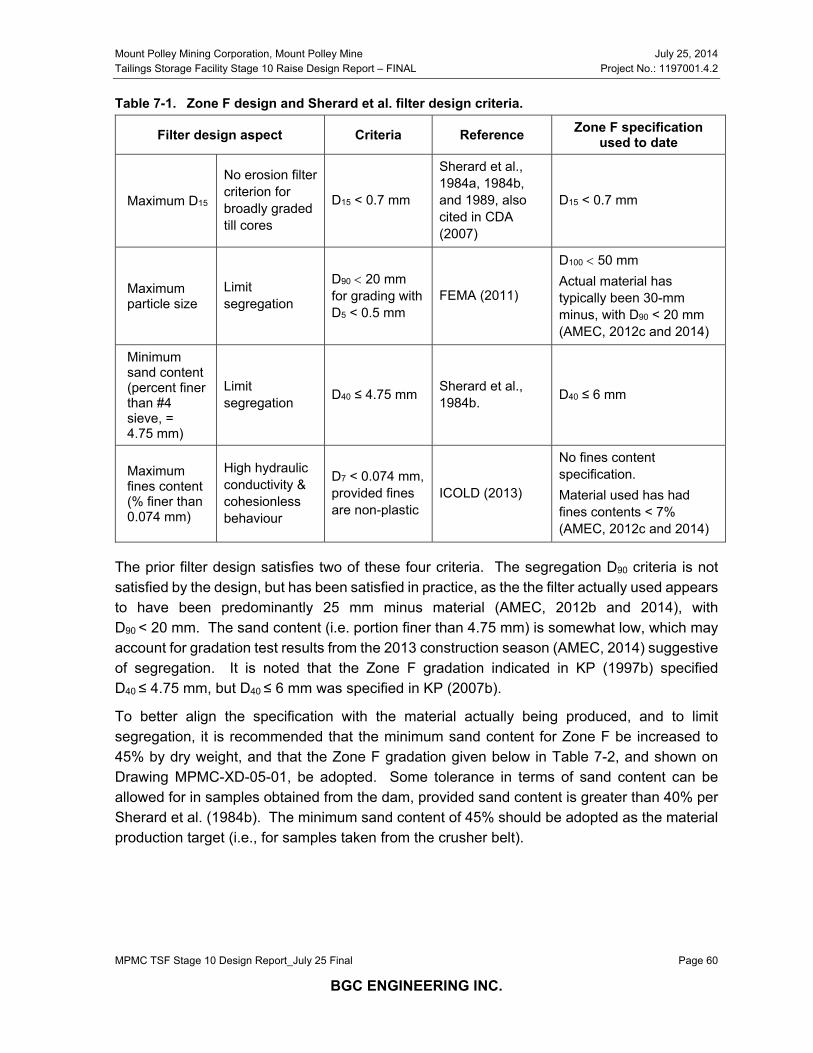
Mount Polley Mining Corporation, Mount Polley Mine July 25, 2014 Tailings Storage Facility Stage 10 Raise Design Report – FINAL Project No.: 1197001.4.2
MPMC TSF Stage 10 Design Report_July 25 Final Page 60
BGC ENGINEERING INC.
Table 7-1. Zone F design and Sherard et al. filter design criteria.
Filter design aspect Criteria Reference Zone F specification used to date
Maximum D15
No erosion filter criterion for broadly graded till cores
D15 < 0.7 mm
Sherard et al., 1984a, 1984b, and 1989, also cited in CDA (2007)
D15 < 0.7 mm
Maximum particle size
Limit segregation
D90 20 mm for grading with D5 < 0.5 mm
FEMA (2011)
D100 50 mm Actual material has typically been 30-mm minus, with D90 < 20 mm (AMEC, 2012c and 2014)
Minimum sand content (percent finer than #4 sieve, = 4.75 mm)
Limit segregation D40 ≤ 4.75 mm Sherard et al.,
1984b. D40 ≤ 6 mm
Maximum fines content (% finer than 0.074 mm)
High hydraulic conductivity & cohesionless behaviour
D7 < 0.074 mm, provided fines are non-plastic
ICOLD (2013)
No fines content specification. Material used has had fines contents < 7% (AMEC, 2012c and 2014)
The prior filter design satisfies two of these four criteria. The segregation D90 criteria is not satisfied by the design, but has been satisfied in practice, as the the filter actually used appears to have been predominantly 25 mm minus material (AMEC, 2012b and 2014), with D90 < 20 mm. The sand content (i.e. portion finer than 4.75 mm) is somewhat low, which may account for gradation test results from the 2013 construction season (AMEC, 2014) suggestive of segregation. It is noted that the Zone F gradation indicated in KP (1997b) specified D40 ≤ 4.75 mm, but D40 ≤ 6 mm was specified in KP (2007b).
To better align the specification with the material actually being produced, and to limit segregation, it is recommended that the minimum sand content for Zone F be increased to 45% by dry weight, and that the Zone F gradation given below in Table 7-2, and shown on Drawing MPMC-XD-05-01, be adopted. Some tolerance in terms of sand content can be allowed for in samples obtained from the dam, provided sand content is greater than 40% per Sherard et al. (1984b). The minimum sand content of 45% should be adopted as the material production target (i.e., for samples taken from the crusher belt).
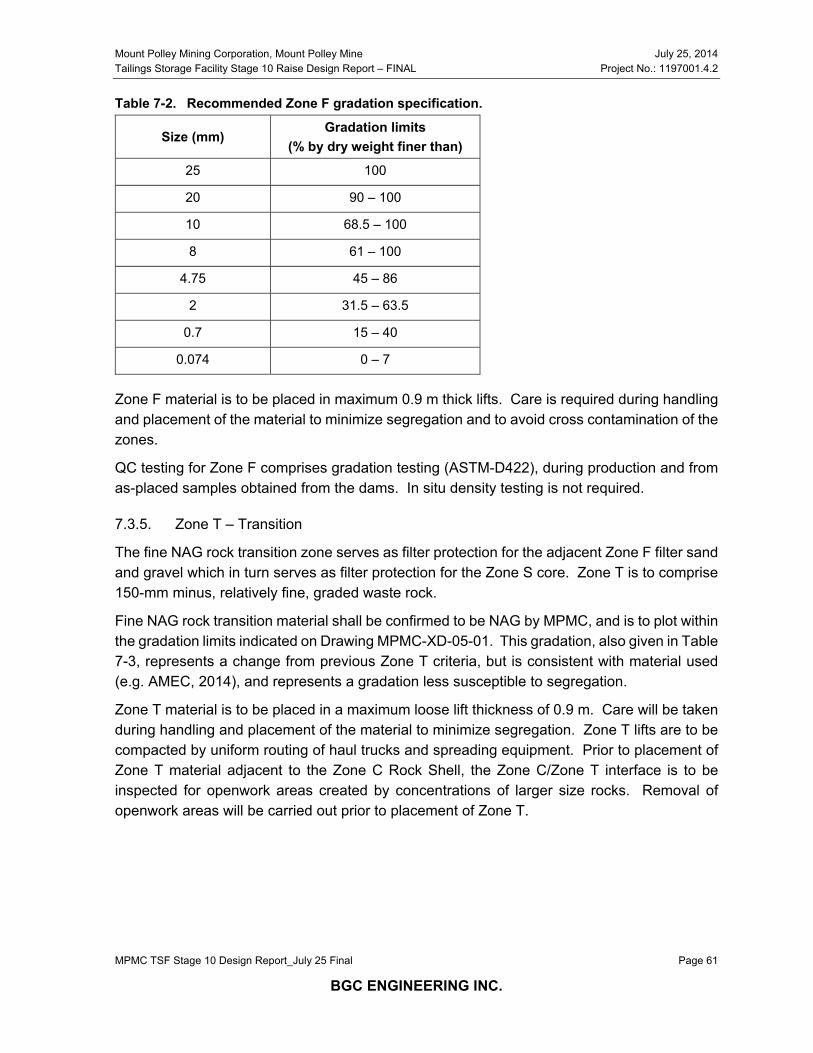
Mount Polley Mining Corporation, Mount Polley Mine July 25, 2014 Tailings Storage Facility Stage 10 Raise Design Report – FINAL Project No.: 1197001.4.2
MPMC TSF Stage 10 Design Report_July 25 Final Page 61
BGC ENGINEERING INC.
Table 7-2. Recommended Zone F gradation specification.
Size (mm) Gradation limits
(% by dry weight finer than)
25 100
20 90 – 100
10 68.5 – 100
8 61 – 100
4.75 45 – 86
2 31.5 – 63.5
0.7 15 – 40
0.074 0 – 7
Zone F material is to be placed in maximum 0.9 m thick lifts. Care is required during handling and placement of the material to minimize segregation and to avoid cross contamination of the zones.
QC testing for Zone F comprises gradation testing (ASTM-D422), during production and from as-placed samples obtained from the dams. In situ density testing is not required.
7.3.5. Zone T – Transition
The fine NAG rock transition zone serves as filter protection for the adjacent Zone F filter sand and gravel which in turn serves as filter protection for the Zone S core. Zone T is to comprise 150-mm minus, relatively fine, graded waste rock.
Fine NAG rock transition material shall be confirmed to be NAG by MPMC, and is to plot within the gradation limits indicated on Drawing MPMC-XD-05-01. This gradation, also given in Table 7-3, represents a change from previous Zone T criteria, but is consistent with material used (e.g. AMEC, 2014), and represents a gradation less susceptible to segregation.
Zone T material is to be placed in a maximum loose lift thickness of 0.9 m. Care will be taken during handling and placement of the material to minimize segregation. Zone T lifts are to be compacted by uniform routing of haul trucks and spreading equipment. Prior to placement of Zone T material adjacent to the Zone C Rock Shell, the Zone C/Zone T interface is to be inspected for openwork areas created by concentrations of larger size rocks. Removal of openwork areas will be carried out prior to placement of Zone T.
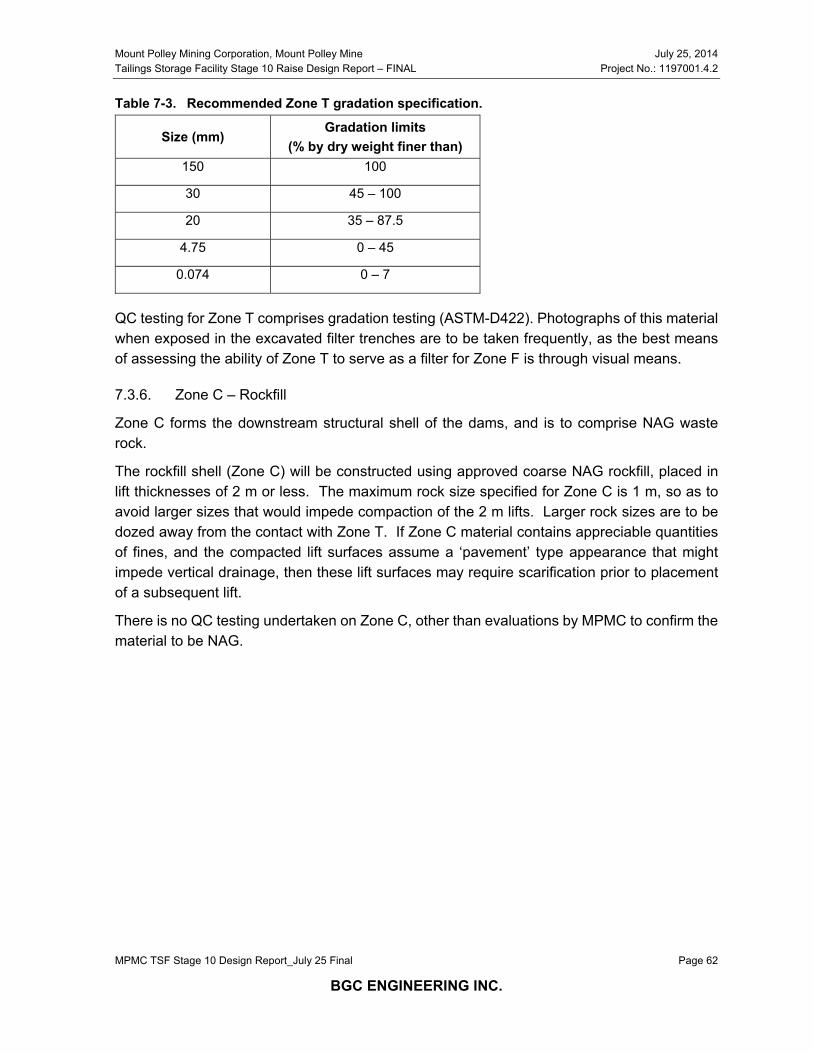
Mount Polley Mining Corporation, Mount Polley Mine July 25, 2014 Tailings Storage Facility Stage 10 Raise Design Report – FINAL Project No.: 1197001.4.2
MPMC TSF Stage 10 Design Report_July 25 Final Page 62
BGC ENGINEERING INC.
Table 7-3. Recommended Zone T gradation specification.
Size (mm) Gradation limits
(% by dry weight finer than) 150 100
30 45 – 100
20 35 – 87.5
4.75 0 – 45
0.074 0 – 7
QC testing for Zone T comprises gradation testing (ASTM-D422). Photographs of this material when exposed in the excavated filter trenches are to be taken frequently, as the best means of assessing the ability of Zone T to serve as a filter for Zone F is through visual means.
7.3.6. Zone C – Rockfill
Zone C forms the downstream structural shell of the dams, and is to comprise NAG waste rock.
The rockfill shell (Zone C) will be constructed using approved coarse NAG rockfill, placed in lift thicknesses of 2 m or less. The maximum rock size specified for Zone C is 1 m, so as to avoid larger sizes that would impede compaction of the 2 m lifts. Larger rock sizes are to be dozed away from the contact with Zone T. If Zone C material contains appreciable quantities of fines, and the compacted lift surfaces assume a ‘pavement’ type appearance that might impede vertical drainage, then these lift surfaces may require scarification prior to placement of a subsequent lift.
There is no QC testing undertaken on Zone C, other than evaluations by MPMC to confirm the material to be NAG.
Mount Polley Mining Corporation, Mount Polley Mine July 25, 2014 Tailings Storage Facility Stage 10 Raise Design Report – FINAL Project No.: 1197001.4.2
MPMC TSF Stage 10 Design Report_July 25 Final Page 63
BGC ENGINEERING INC.
8.0 SUMMARY AND RECOMMENDATIONS
This report, and the appended drawings, provides a design for the raise of the three embankments comprising the Mount Polley TSF to crest El. 972.5 m, which represents the Stage 10 configuration of the TSF.
As of issuance of this report, the permitted crest elevation for the TSF, per B.C. MEM Permit No. M-200, is El. 970 m. Ongoing raising beyond the Stage 10 crest El. 972.5 m will be required to accommodate tailings storage requirements for the currently projected remaining life of mine (LOM). The next phase of design will be undertaken in the second half of 2014 to provide for the next several years’ crest raising, with a design report submission to be completed in January 2015.
Stage 10 construction of the embankments will be carried out in two phases:
1. Raising of the crest (Zones U, S, F, T and C) to El. 972.5 m will be undertaken in the summer and early fall of 2014, and will commence immediately upon completion of the Stage 9a raise to El. 970 m.
2. Raising of the buttress (Zone C) along the downstream slope of the Main and Perimeter embankments.
The Stage 10 crest raising will precede the downstream slope buttress raising, to take advantage of summer weather conditions for till core construction. For the Stage 10 crest raising, addition of fill prior to fill placement against the downstream slope of the dam is acceptable as the FoS values were evaluated for the El. 972.5 m crest without buttress raising, and were found to be adequate although below target factor of safety criteria in some instances. Based on MPMC’s plans for placement of rockfill to extend the downstream shell of the embankments, FoS design criteria are expected to be achieved or exceeded along the entire length of the dam prior to commencement of crest raising above El. 972.5 m in the spring of 2015.
Commencing with the construction of the raise to El. 972.5 m, BGC will assume the role of Engineer-of-Record.
Work carried out in support of the Stage 10 raise included:
Review and update of design and operating criteria Evaluation of water management scenarios and tailings storage requirements, to
determine the Stage 10 crest elevation Review of current instrumentation coverage, and recommendations for additional
instrumentation installation (and associated geotechnical drilling and testing), to expand coverage to accommodate future dam raising and extensions, and to provide additional geotechnical information in support of the next phase of design
Evaluation of the shear strength of glaciolacustrine foundation soils that largely govern the stability of the dams
Mount Polley Mining Corporation, Mount Polley Mine July 25, 2014 Tailings Storage Facility Stage 10 Raise Design Report – FINAL Project No.: 1197001.4.2
MPMC TSF Stage 10 Design Report_July 25 Final Page 64
BGC ENGINEERING INC.
Limit equilibrium stability analyses to: Determine the FoS for the El. 972.5 m crest elevation for representative
embankment sections Determine the required configuration of downstream shell buttress construction to
achieve FoS design criteria, and provide guidance for MPMC’s plans for downstream shell construction over the next year
Provide updated threshold elevations for foundation piezometers linked to the FoS for the analyzed representative sections.
Recommendations arising out of the work documented herein are as listed below.
1. Annual stage raise crest elevations to be constructed in a given year should be based on projected tailings, water storage, and flood storage/freeboard requirements as of the end of September of the year following. This is the basis for the target crest El. 972.5 m for 2014.
2. Based on the Canadian Dam Association (CDA) dam safety guidelines (CDA, 2007), the TSF is assigned a “significant” consequence classification. However, recommended earthquake and inflow design flood (IDF) criteria are more stringent than required by a “significant” consequence classification, in line with evolving CDA (2013) guidance for tailings dams. Updated earthquake and IDF criteria are recommended herein.
3. Wide, above-water tailings beaches separating the embankments from the reclaim water pond constitutes a fundamental structural element of the dam, and should be established at the earliest possible date, and maintained thereafter. MPMC is in the process of implementing a water treatment system that will facilitate this, as summarized in Section 4.2.
4. No dam break and inundation study, as described in the CDA (2007) dam safety guidelines, has yet been carried out for the Mount Polley TSF. There is no permanent population at risk between the TSF and Quesnel Lake. Earthquake and IDF design criteria recommended for the TSF are consistent with “very high” and “extreme” consequence classifications under the CDA (2007) guidelines, so it is unclear if there is any benefit to undertaking such a study for the Mount Polley TSF. This should be reviewed between MPMC and the B.C. MEM.
5. The ratio of the Zone S till core width to the hydraulic head will, for portions of the core, be lower than the typically accepted ratio of 0.25, a criterion developed for water-retaining dams. This will be mitigated by:
a. Establishing and maintaining wide above-water beaches separating the dam from the water pond, which also represents the closure configuration for the TSF.
b. Design of the downstream shell to provide sufficient lateral restraint such that deformations of the core, and the downstream filter sequence, are tolerable.
6. Additional instrumentation is recommended (see Section 5.5) for installation in 2014, comprising six piezometer boreholes (with two to three vibrating wire piezometer tips
Mount Polley Mining Corporation, Mount Polley Mine July 25, 2014 Tailings Storage Facility Stage 10 Raise Design Report – FINAL Project No.: 1197001.4.2
MPMC TSF Stage 10 Design Report_July 25 Final Page 65
BGC ENGINEERING INC.
per hole), and six inclinometer boreholes. The information yielded by these boreholes (see Section 5.6) will allow refinement of the geologic model for the TSF area, needed for support of future design phases, and to assist in interpretation of instrumentation data.
7. Updated threshold levels for the foundation piezometers should be established and incorporated into the monitoring program, based on the stability analyses results provided in Section 6.9.6. Established inclinometer threshold limits, as outlined in Section 5.4.3, remain appropriate.
8. Stability analyses for the dams considered a worst case scenario with residual shear strength assumed for the glaciolacustrine foundation unit, in which case a minimum FoS of 1.1 is assumed. There is no evidence, neither from site investigations nor inclinometer monitoring, that the operative shear strength is residual, but this approach is consistent with application of the observational method for a dam with a potentially brittle foundation.
9. Extension of the downstream shell of the dam requires relocation of existing infrastructure, including the Main Embankment seepage recovery pond. MPMC should initiate plans and schedules for such relocations for completion in 2015. In particular, the portion of the Main Embankment at the seepage recovery pond cannot attain FoS criteria until that pond has been relocated and the downstream buttress has encroached upon its current location.
10. As MPMC proceeds with Zone C downstream shell placement over the next year, priority should be placed on completion of that portion of the downstream buttress required to achieve FoS criteria, as outlined in Table 6-3.
11. The earthquake stability of the dam at crest El. 972.5 m was evaluated using pseudo-static analysis. While sufficient for the immediate term, the next phase of design should include post-earthquake and seismic deformation analyses, which represent the appropriate means of evaluating the seismic stability of the dams. Given the thin Zone S till core and filter/transition sequence, seismic deformation analyses may govern the ultimate design configurations for the dams, based on downstream shell configurations sufficient to limit such predicted deformations to levels that do not disrupt the continuity of the core and filter zones.
12. Field density testing and index property data should be collected on Zone U tailings, to support evaluations of the upstream stability of the centerline stage raises as part of the next phase of design, as discussed in Section 6.9.5.
13. Modifications to the gradation specifications for Zones F and T are recommended as outlined in Sections 7.3.4 and 7.3.5 respectively. Otherwise, the design for crest raising and the zone sequence remains the same as per previous designs, and is illustrated on the appended drawings, along with the technical specifications for the Stage 10 raise.
Mount Polley Mining Corporation, Mount Polley Mine July 25, 2014 Tailings Storage Facility Stage 10 Raise Design Report – FINAL Project No.: 1197001.4.2
MPMC TSF Stage 10 Design Report_July 25 Final.docx Page 66
BGC ENGINEERING INC.
9.0 CLOSURE
We trust the above satisfies your requirements at this time. Should you have any questions or comments, please do not hesitate to contact us.
Yours sincerely,
BGC ENGINEERING INC. per:
Todd E. Martin, P.Eng., P.Geo. Daryl Dufault, P.Eng.Senior Geotechnical Engineer Senior Geotechnical Engineer
Reviewed by:
Bill Burton, P.Eng. Senior Geotechnical Engineer
DD/bb/sjk
Mount Polley Mining Corporation, Mount Polley Mine July 25, 2014 Tailings Storage Facility Stage 10 Raise Design Report – FINAL Project No.: 1197001.4.2
MPMC TSF Stage 10 Design Report_July 25 Final Page 67
BGC ENGINEERING INC.
REFERENCES
AMEC Earth & Environmental Ltd. 2006. Dam Safety Review Mt. Polley Mine - Tailings Storage Facility, December.
AMEC Environment and Infrastructure 2012a. Mount Polley Mines Tailings Storage Facility – 2012 Stage 8 Expansion – Stability Analyses, February 14.
AMEC Environment & Infrastructure, 2012b. Mount Polley Mine Project: Tailings Storage Facility 2011 Geotechnical Site Investigation – Final, March 28.
AMEC Environment & Infrastructure, 2012c. Mount Polley Mine Tailings Storage Facility 2011 Construction: As-Built Report and Annual Review. March 30.
AMEC Environment & Infrastructure, 2014. Mount Polley Mine Tailings Storage Facility Stage 9: 2013 As-Built and Annual Review Report. March 12.
BGC Engineering Inc. 2013. Mount Polley Mine – Tailings Storage Facility 2012 Annual Review – Final. April 8.
Canadian Dam Association 2007. Dam Safety Guidelines.
Canadian Dam Association 2013. Technical Bulletin – Draft – Mining Dams: Application of 2007 Dam Safety Guidelines to Mining Dams.
Federal Emergency Management Administration (FEMA) 2011. Filters for Embankment Dams – Best Practices for Design and Construction. October.
Hynes-Griffin, M. E., and Franklin, A. G. 1984. Rationalizing the seismic coefficient method. Rep. No. GL-84–13, U.S. Army Engineers Waterways Experiment Station, Vicksburg, Miss.
International Commission on Large Dams (ICOLD), 2013. Technical Bulletin 1XX, Volume 1: Internal Erosion Processes and Engineering Assessment. January 22.
Jansen, R.B., Kramer, R.W., Lowe, J. and Poulos, S.J. 1988. Earthfill Design and Analysis, Chapter 9 of Advanced Dam Engineering – For Design, Construction and Rehabilitation, R.B. Jansen ed.
Knight Piésold Limited,1995. Imperial Metals Corp. Mt. Polley Project: Tailings Storage Facility Design Report, 2 vols., May 26.
Knight Piésold Limited,1997a Mount Polley Project: 1996 Groundwater Monitoring Well Installation Program, Ref.No. 1628/4, February
Knight Piésold Limited,1997b. Mount Polley Mining Corporation Mout Polley Project: Tailings Storage Facility – Updated Design Report, June 6.
Knight Piésold Limited,1997c. Stage 2A Tailings Facility Construction. Ref.No. 10162/9-2. November 6.
Mount Polley Mining Corporation, Mount Polley Mine July 25, 2014 Tailings Storage Facility Stage 10 Raise Design Report – FINAL Project No.: 1197001.4.2
MPMC TSF Stage 10 Design Report_July 25 Final Page 68
BGC ENGINEERING INC.
Knight Piésold Limited, 2005. Design of the Tailings Storage Facility to Ultimate Elevation. March 14, 2005.
Knight Piésold Limited 2007a. Stage 4 Tailings Facility Construction. Ref.No. VA101-1/10-1). March 13.
Knight Piésold Limited, 2007b. Stage 6 Design of the Tailings Storage Facility. June 18, 2007.
Leps, T.M., 1970. Review of Shearing Strength of Rockfill. ASCE Journal of the Soil Mech. and Found. Eng. Div., SM4. July 1970. pp. 1159-1170.
Lupini, J. F., Skinner, A. E., and Vaughan, P. R. 1981. The drained residual strength of cohesive soils. Geotechnique, 31(2), pp. 181-213.
McAndless, P. 2006. Surficial Geology of the Mount Polley Property: Summary of 2005 Exploration Work. Available on-line at http://aris.empr.gov.bc.ca/ArisReports/28270.PDF.
Olson, S.M. and Stark T.D. 2002. Liquefied strength ratio from liquefaction flow failure case histories, Canadian Geotechnical Journal, Vol. 39, pp. 629-647.
Peck, R.B. 1969. Advantages and Limitations of the Observational Method in Applied Soil Mechanics. 9th Rankine Lecture, Geotechnique 19(2), pp. 171-187.
Singh, N.K., Martison, T., West, C. and Fleming, C. 2008. Three Year Construction Plan for Ultimate Configuration of Highland Valley Copper Tailings Storage Facility. CDA 2009 Annual conference, Whistler, B.C., October 3-8.
Singh, N., Plewes, H.D., Birch, S. and Fleming, C. 2014. Design and Site Investigations for the L-L Cyclone Sand Dam. USSD Workshop - Seismic Design of Tailings Dams, San Francisco, April 10.
Sherard, J.L., Dunnigan, L.P. and Talbot, J.R. 1984a. Basic Properties of Sand and Gravel Filters. Journal of Geotech. Eng., ASCE, Vol. 110(GT6), June, pp. 684-700.
Sherard, J.L., Dunnigan, L.P. and Talbot, J.R. 1984b. Filters for Silts and Clays. Journal of Geotech. Eng., ASCE, Vol. 110(GT6), June, pp. 701-718.
Sherard, J.L., and Dunnigan, L.P. 1985. Filters and Leakage Control in Embankment Dams, Proceedings, Symposium on Seepage and Leakage from Dams and Impoundments, R.L. Volpe and W.E. Kelly, eds., ASCE, pp. 1-30.
Sherard, J.L. and Dunnigan, L.P. 1989. Critical Filters for Impervious Soils. Journal of Geotechnical Engineering, ASCE, Vol. 115(GT7), July, pp. 927-947.
Skempton, A. W. 1985. Residual strength of clays in landslides, folded strata and the laboratory. Geotechnique, 35(1), pp. 3-18.
Sladen, J.A. and Wrigley, W. 1983. A review of the geotechnical properties of lodgement till. Chapter 8, Glacial Geology - An Introduction for Engineers and Earth Scientists, Nyles, N. Ed.
Mount Polley Mining Corporation, Mount Polley Mine July 25, 2014 Tailings Storage Facility Stage 10 Raise Design Report – FINAL Project No.: 1197001.4.2
MPMC TSF Stage 10 Design Report_July 25 Final Page 69
BGC ENGINEERING INC.
Stark, T.D., and Eid, H.T., 1994. Drained Residual Strength of Cohesive Soils, ASCE Journal of Geotechnical Engineering, Vol. 120, No. 5, pp. 856-871
U.S. Army Corps of Engineers 2004. General Design and Construction Considerations for Earth and Rock-Fill Dams. EM 1110-2-2300, July 30. Available on-line at http://www.publications.usace.army.mil/Portals/76/Publications/EngineerManuals/EM_1110-2-2300.pdf.

Mount Polley Mining Corporation, Mount Polley Mine July 25, 2014 Tailings Storage Facility Stage 10 Raise Design Report – FINAL Project No.: 1197001.4.2
MPMC TSF Stage 10 Design Report_July 25 Final
BGC ENGINEERING INC.
APPENDIX A STABILITY ANALYSIS FIGURES
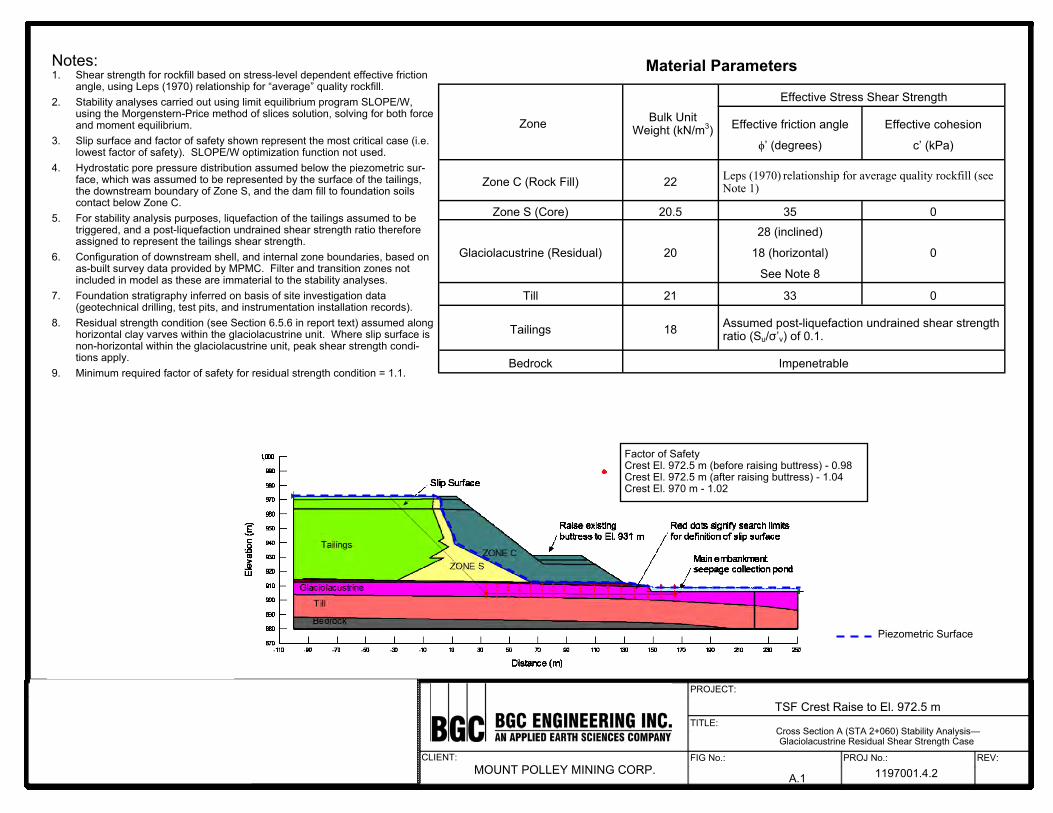
CLIENT:
TITLE:
PROJECT:
FIG No.: PROJ No.: REV: MOUNT POLLEY MINING CORP.
TSF Crest Raise to El. 972.5 m
1197001.4.2 A.1
Cross Section A (STA 2+060) Stability Analysis— Glaciolacustrine Residual Shear Strength Case
Notes: 1. Shear strength for rockfill based on stress-level dependent effective friction
angle, using Leps (1970) relationship for “average” quality rockfill. 2. Stability analyses carried out using limit equilibrium program SLOPE/W,
using the Morgenstern-Price method of slices solution, solving for both force and moment equilibrium.
3. Slip surface and factor of safety shown represent the most critical case (i.e. lowest factor of safety). SLOPE/W optimization function not used.
4. Hydrostatic pore pressure distribution assumed below the piezometric sur-face, which was assumed to be represented by the surface of the tailings, the downstream boundary of Zone S, and the dam fill to foundation soils contact below Zone C.
5. For stability analysis purposes, liquefaction of the tailings assumed to be triggered, and a post-liquefaction undrained shear strength ratio therefore assigned to represent the tailings shear strength.
6. Configuration of downstream shell, and internal zone boundaries, based on as-built survey data provided by MPMC. Filter and transition zones not included in model as these are immaterial to the stability analyses.
7. Foundation stratigraphy inferred on basis of site investigation data (geotechnical drilling, test pits, and instrumentation installation records).
8. Residual strength condition (see Section 6.5.6 in report text) assumed along horizontal clay varves within the glaciolacustrine unit. Where slip surface is non-horizontal within the glaciolacustrine unit, peak shear strength condi-tions apply.
9. Minimum required factor of safety for residual strength condition = 1.1.
Material Parameters
Zone Bulk Unit Weight (kN/m3)
Effective Stress Shear Strength
Effective friction angle
ϕ’ (degrees)
Effective cohesion
c’ (kPa)
Zone C (Rock Fill) 22 Leps (1970) relationship for average quality rockfill (see Note 1)
Zone S (Core) 20.5 35 0
Glaciolacustrine (Residual) 20
28 (inclined)
18 (horizontal)
See Note 8
0
Till 21 33 0
Tailings 18 Assumed post-liquefaction undrained shear strength ratio (Su/σ’v) of 0.1.
Bedrock Impenetrable
Piezometric Surface
Factor of Safety Crest El. 972.5 m (before raising buttress) - 0.98 Crest El. 972.5 m (after raising buttress) - 1.04 Crest El. 970 m - 1.02
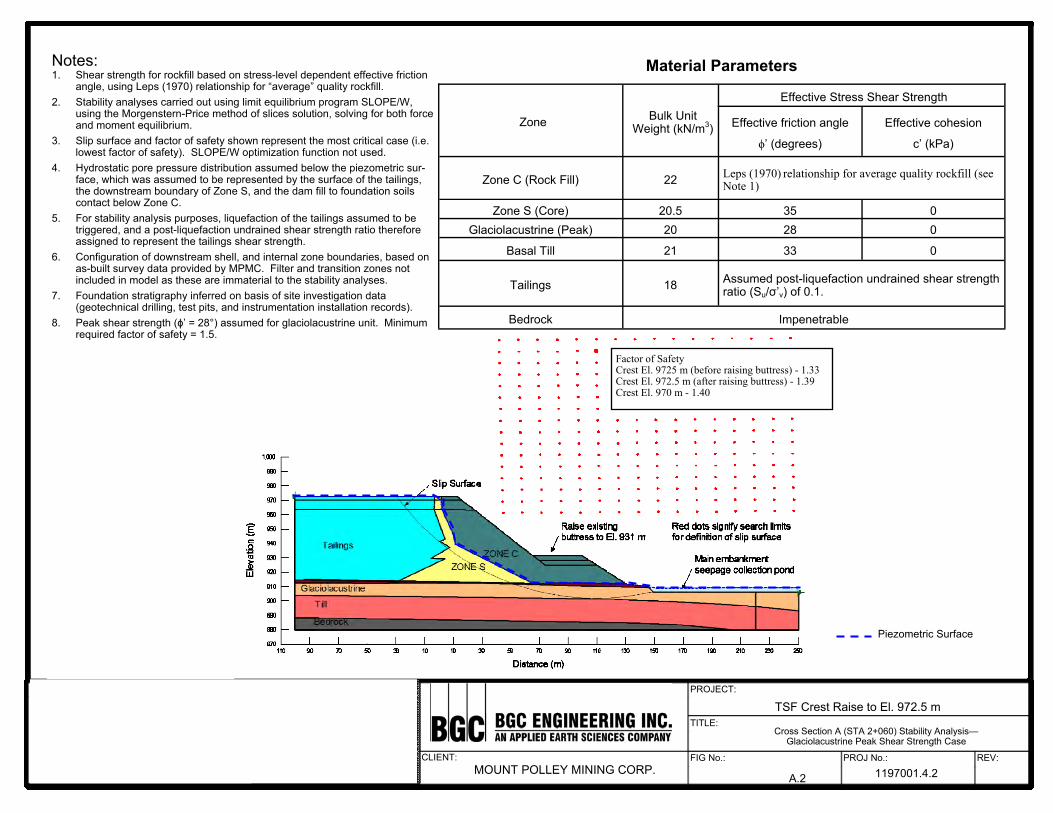
CLIENT:
TITLE:
PROJECT:
FIG No.: PROJ No.: REV: MOUNT POLLEY MINING CORP.
TSF Crest Raise to El. 972.5 m
1197001.4.2 A.2
Cross Section A (STA 2+060) Stability Analysis— Glaciolacustrine Peak Shear Strength Case
Material Parameters Notes: 1. Shear strength for rockfill based on stress-level dependent effective friction
angle, using Leps (1970) relationship for “average” quality rockfill. 2. Stability analyses carried out using limit equilibrium program SLOPE/W,
using the Morgenstern-Price method of slices solution, solving for both force and moment equilibrium.
3. Slip surface and factor of safety shown represent the most critical case (i.e. lowest factor of safety). SLOPE/W optimization function not used.
4. Hydrostatic pore pressure distribution assumed below the piezometric sur-face, which was assumed to be represented by the surface of the tailings, the downstream boundary of Zone S, and the dam fill to foundation soils contact below Zone C.
5. For stability analysis purposes, liquefaction of the tailings assumed to be triggered, and a post-liquefaction undrained shear strength ratio therefore assigned to represent the tailings shear strength.
6. Configuration of downstream shell, and internal zone boundaries, based on as-built survey data provided by MPMC. Filter and transition zones not included in model as these are immaterial to the stability analyses.
7. Foundation stratigraphy inferred on basis of site investigation data (geotechnical drilling, test pits, and instrumentation installation records).
8. Peak shear strength (ϕ’ = 28°) assumed for glaciolacustrine unit. Minimum required factor of safety = 1.5.
Zone Bulk Unit Weight (kN/m3)
Effective Stress Shear Strength
Effective friction angle
ϕ’ (degrees)
Effective cohesion
c’ (kPa)
Zone C (Rock Fill) 22 Leps (1970) relationship for average quality rockfill (see Note 1)
Zone S (Core) 20.5 35 0 Glaciolacustrine (Peak) 20 28 0
Basal Till 21 33 0
Tailings 18 Assumed post-liquefaction undrained shear strength ratio (Su/σ’v) of 0.1.
Bedrock Impenetrable
Factor of Safety Crest El. 9725 m (before raising buttress) - 1.33 Crest El. 972.5 m (after raising buttress) - 1.39 Crest El. 970 m - 1.40
Piezometric Surface
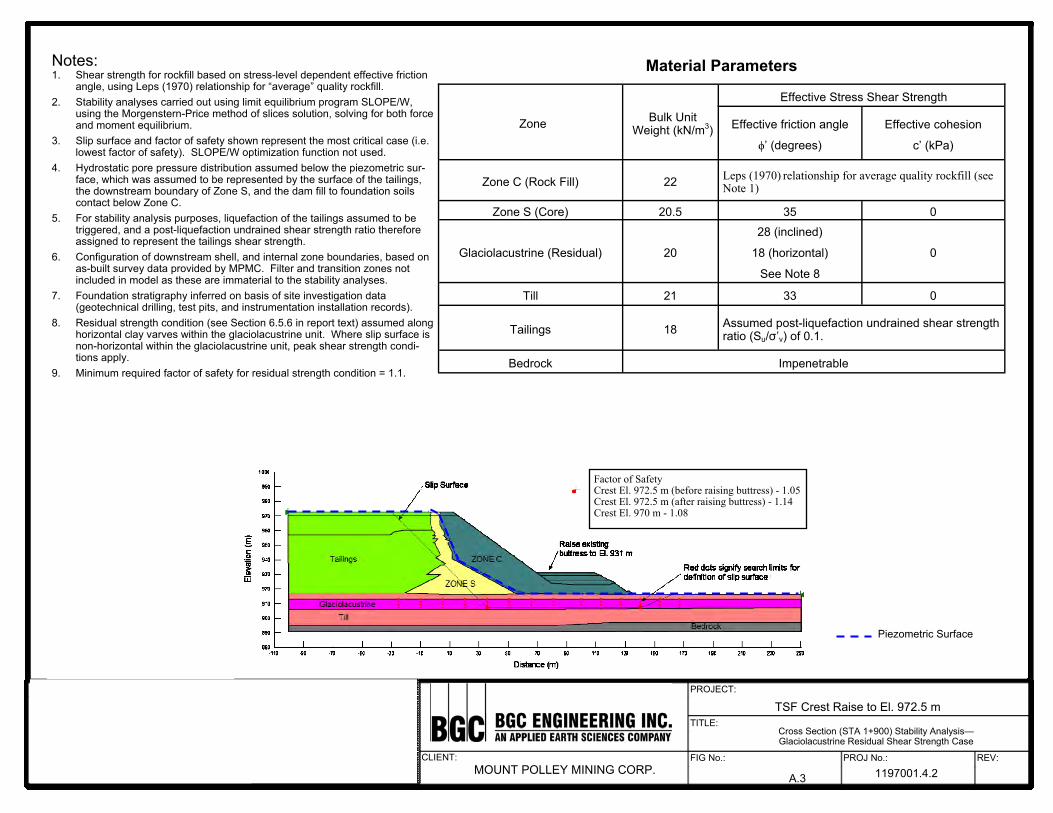
CLIENT:
TITLE:
PROJECT:
FIG No.: PROJ No.: REV: MOUNT POLLEY MINING CORP.
TSF Crest Raise to El. 972.5 m
1197001.4.2 A.3
Cross Section (STA 1+900) Stability Analysis— Glaciolacustrine Residual Shear Strength Case
Zone Bulk Unit Weight (kN/m3)
Effective Stress Shear Strength
Effective friction angle
ϕ’ (degrees)
Effective cohesion
c’ (kPa)
Zone C (Rock Fill) 22 Leps (1970) relationship for average quality rockfill (see Note 1)
Zone S (Core) 20.5 35 0
Glaciolacustrine (Residual) 20
28 (inclined)
18 (horizontal)
See Note 8
0
Till 21 33 0
Tailings 18 Assumed post-liquefaction undrained shear strength ratio (Su/σ’v) of 0.1.
Bedrock Impenetrable
Piezometric Surface
Notes: 1. Shear strength for rockfill based on stress-level dependent effective friction
angle, using Leps (1970) relationship for “average” quality rockfill. 2. Stability analyses carried out using limit equilibrium program SLOPE/W,
using the Morgenstern-Price method of slices solution, solving for both force and moment equilibrium.
3. Slip surface and factor of safety shown represent the most critical case (i.e. lowest factor of safety). SLOPE/W optimization function not used.
4. Hydrostatic pore pressure distribution assumed below the piezometric sur-face, which was assumed to be represented by the surface of the tailings, the downstream boundary of Zone S, and the dam fill to foundation soils contact below Zone C.
5. For stability analysis purposes, liquefaction of the tailings assumed to be triggered, and a post-liquefaction undrained shear strength ratio therefore assigned to represent the tailings shear strength.
6. Configuration of downstream shell, and internal zone boundaries, based on as-built survey data provided by MPMC. Filter and transition zones not included in model as these are immaterial to the stability analyses.
7. Foundation stratigraphy inferred on basis of site investigation data (geotechnical drilling, test pits, and instrumentation installation records).
8. Residual strength condition (see Section 6.5.6 in report text) assumed along horizontal clay varves within the glaciolacustrine unit. Where slip surface is non-horizontal within the glaciolacustrine unit, peak shear strength condi-tions apply.
9. Minimum required factor of safety for residual strength condition = 1.1.
Material Parameters
Factor of Safety Crest El. 972.5 m (before raising buttress) - 1.05 Crest El. 972.5 m (after raising buttress) - 1.14 Crest El. 970 m - 1.08
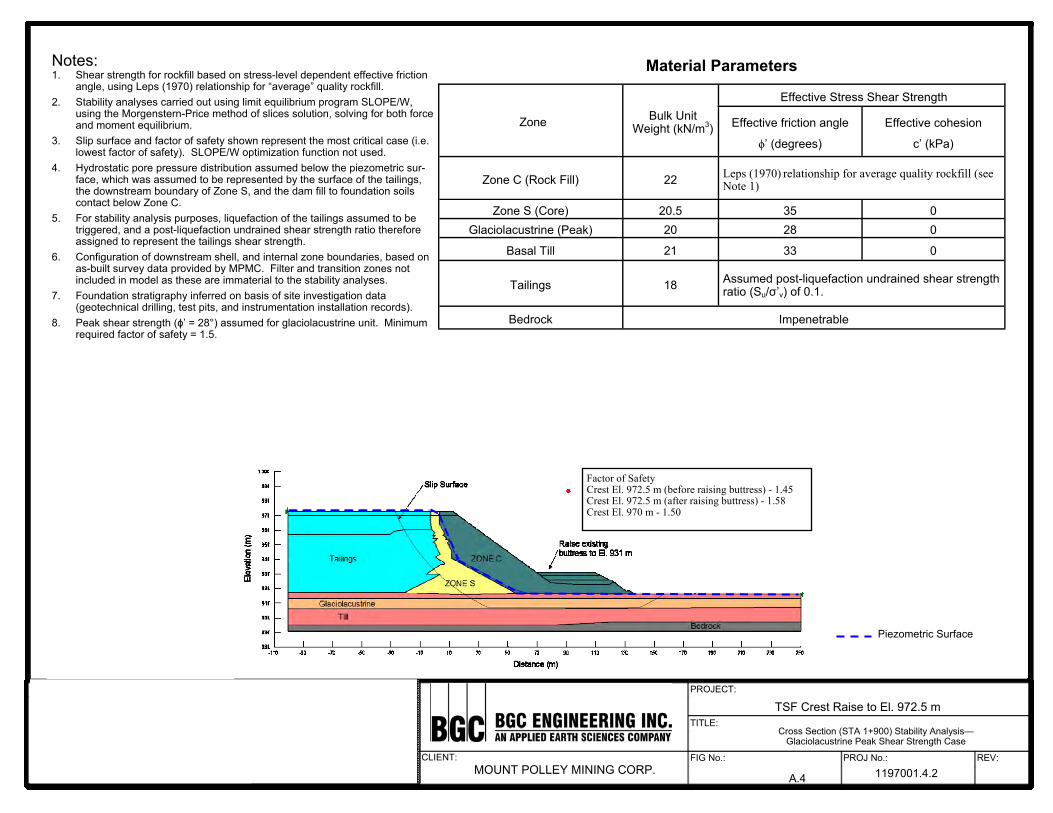
CLIENT:
TITLE:
PROJECT:
FIG No.: PROJ No.: REV: MOUNT POLLEY MINING CORP.
TSF Crest Raise to El. 972.5 m
1197001.4.2 A.4
Cross Section (STA 1+900) Stability Analysis— Glaciolacustrine Peak Shear Strength Case
Zone Bulk Unit Weight (kN/m3)
Effective Stress Shear Strength
Effective friction angle
ϕ’ (degrees)
Effective cohesion
c’ (kPa)
Zone C (Rock Fill) 22 Leps (1970) relationship for average quality rockfill (see Note 1)
Zone S (Core) 20.5 35 0 Glaciolacustrine (Peak) 20 28 0
Basal Till 21 33 0
Tailings 18 Assumed post-liquefaction undrained shear strength ratio (Su/σ’v) of 0.1.
Bedrock Impenetrable
Factor of Safety Crest El. 972.5 m (before raising buttress) - 1.45 Crest El. 972.5 m (after raising buttress) - 1.58 Crest El. 970 m - 1.50
Piezometric Surface
Material Parameters Notes: 1. Shear strength for rockfill based on stress-level dependent effective friction
angle, using Leps (1970) relationship for “average” quality rockfill. 2. Stability analyses carried out using limit equilibrium program SLOPE/W,
using the Morgenstern-Price method of slices solution, solving for both force and moment equilibrium.
3. Slip surface and factor of safety shown represent the most critical case (i.e. lowest factor of safety). SLOPE/W optimization function not used.
4. Hydrostatic pore pressure distribution assumed below the piezometric sur-face, which was assumed to be represented by the surface of the tailings, the downstream boundary of Zone S, and the dam fill to foundation soils contact below Zone C.
5. For stability analysis purposes, liquefaction of the tailings assumed to be triggered, and a post-liquefaction undrained shear strength ratio therefore assigned to represent the tailings shear strength.
6. Configuration of downstream shell, and internal zone boundaries, based on as-built survey data provided by MPMC. Filter and transition zones not included in model as these are immaterial to the stability analyses.
7. Foundation stratigraphy inferred on basis of site investigation data (geotechnical drilling, test pits, and instrumentation installation records).
8. Peak shear strength (ϕ’ = 28°) assumed for glaciolacustrine unit. Minimum required factor of safety = 1.5.
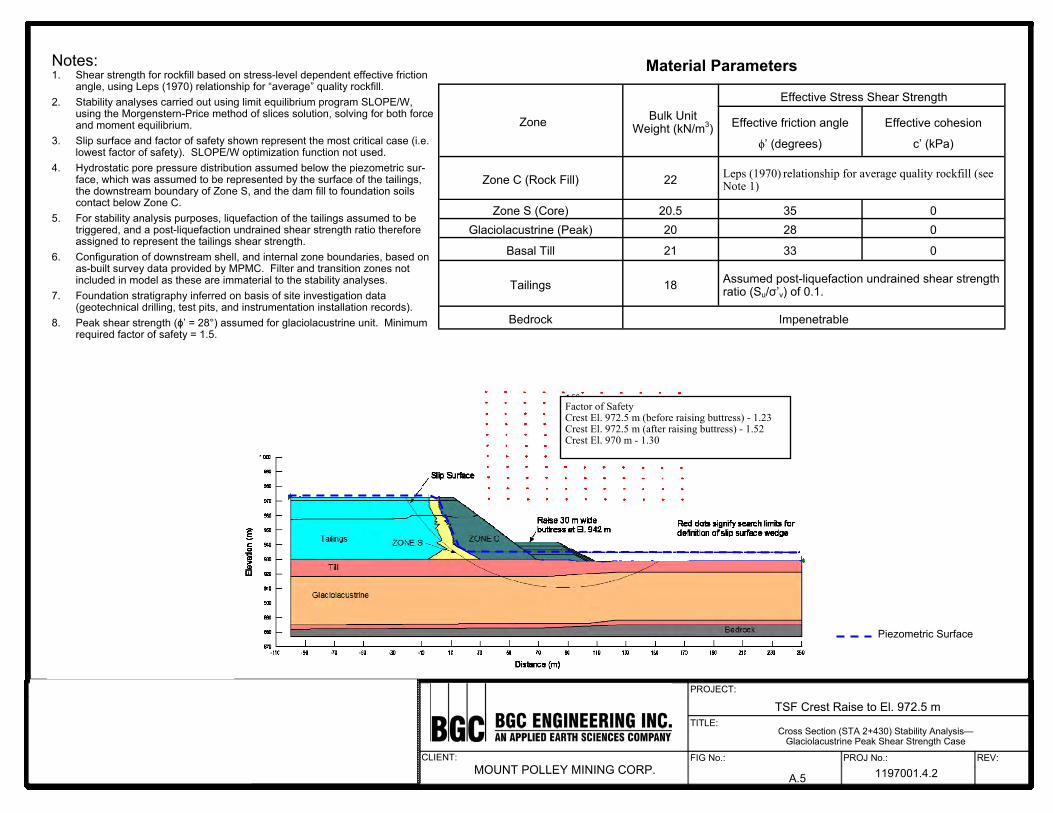
CLIENT:
TITLE:
PROJECT:
FIG No.: PROJ No.: REV: MOUNT POLLEY MINING CORP.
TSF Crest Raise to El. 972.5 m
1197001.4.2 A.5
Cross Section (STA 2+430) Stability Analysis— Glaciolacustrine Peak Shear Strength Case
Zone Bulk Unit Weight (kN/m3)
Effective Stress Shear Strength
Effective friction angle
ϕ’ (degrees)
Effective cohesion
c’ (kPa)
Zone C (Rock Fill) 22 Leps (1970) relationship for average quality rockfill (see Note 1)
Zone S (Core) 20.5 35 0 Glaciolacustrine (Peak) 20 28 0
Basal Till 21 33 0
Tailings 18 Assumed post-liquefaction undrained shear strength ratio (Su/σ’v) of 0.1.
Bedrock Impenetrable
Factor of Safety Crest El. 972.5 m (before raising buttress) - 1.23 Crest El. 972.5 m (after raising buttress) - 1.52 Crest El. 970 m - 1.30
Piezometric Surface
Material Parameters Notes: 1. Shear strength for rockfill based on stress-level dependent effective friction
angle, using Leps (1970) relationship for “average” quality rockfill. 2. Stability analyses carried out using limit equilibrium program SLOPE/W,
using the Morgenstern-Price method of slices solution, solving for both force and moment equilibrium.
3. Slip surface and factor of safety shown represent the most critical case (i.e. lowest factor of safety). SLOPE/W optimization function not used.
4. Hydrostatic pore pressure distribution assumed below the piezometric sur-face, which was assumed to be represented by the surface of the tailings, the downstream boundary of Zone S, and the dam fill to foundation soils contact below Zone C.
5. For stability analysis purposes, liquefaction of the tailings assumed to be triggered, and a post-liquefaction undrained shear strength ratio therefore assigned to represent the tailings shear strength.
6. Configuration of downstream shell, and internal zone boundaries, based on as-built survey data provided by MPMC. Filter and transition zones not included in model as these are immaterial to the stability analyses.
7. Foundation stratigraphy inferred on basis of site investigation data (geotechnical drilling, test pits, and instrumentation installation records).
8. Peak shear strength (ϕ’ = 28°) assumed for glaciolacustrine unit. Minimum required factor of safety = 1.5.
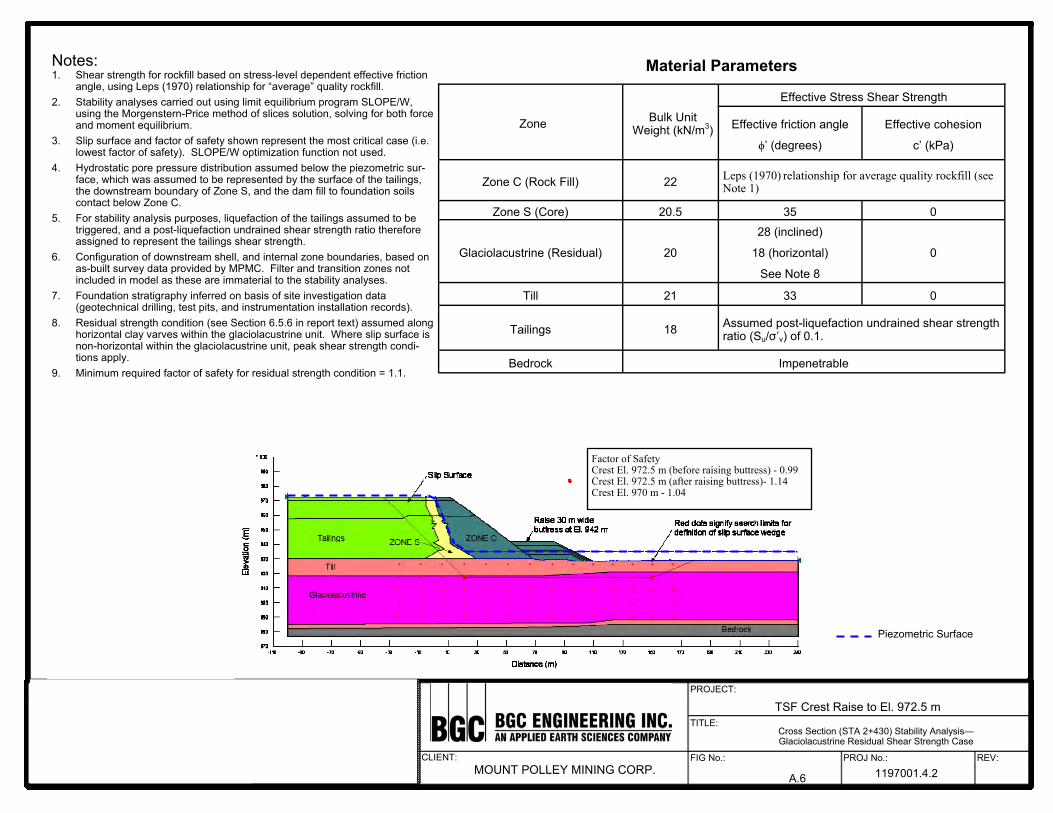
CLIENT:
TITLE:
PROJECT:
FIG No.: PROJ No.: REV: MOUNT POLLEY MINING CORP.
TSF Crest Raise to El. 972.5 m
1197001.4.2 A.6
Cross Section (STA 2+430) Stability Analysis— Glaciolacustrine Residual Shear Strength Case
Zone Bulk Unit Weight (kN/m3)
Effective Stress Shear Strength
Effective friction angle
ϕ’ (degrees)
Effective cohesion
c’ (kPa)
Zone C (Rock Fill) 22 Leps (1970) relationship for average quality rockfill (see Note 1)
Zone S (Core) 20.5 35 0
Glaciolacustrine (Residual) 20
28 (inclined)
18 (horizontal)
See Note 8
0
Till 21 33 0
Tailings 18 Assumed post-liquefaction undrained shear strength ratio (Su/σ’v) of 0.1.
Bedrock Impenetrable
Factor of Safety Crest El. 972.5 m (before raising buttress) - 0.99 Crest El. 972.5 m (after raising buttress)- 1.14 Crest El. 970 m - 1.04
Piezometric Surface
Notes: 1. Shear strength for rockfill based on stress-level dependent effective friction
angle, using Leps (1970) relationship for “average” quality rockfill. 2. Stability analyses carried out using limit equilibrium program SLOPE/W,
using the Morgenstern-Price method of slices solution, solving for both force and moment equilibrium.
3. Slip surface and factor of safety shown represent the most critical case (i.e. lowest factor of safety). SLOPE/W optimization function not used.
4. Hydrostatic pore pressure distribution assumed below the piezometric sur-face, which was assumed to be represented by the surface of the tailings, the downstream boundary of Zone S, and the dam fill to foundation soils contact below Zone C.
5. For stability analysis purposes, liquefaction of the tailings assumed to be triggered, and a post-liquefaction undrained shear strength ratio therefore assigned to represent the tailings shear strength.
6. Configuration of downstream shell, and internal zone boundaries, based on as-built survey data provided by MPMC. Filter and transition zones not included in model as these are immaterial to the stability analyses.
7. Foundation stratigraphy inferred on basis of site investigation data (geotechnical drilling, test pits, and instrumentation installation records).
8. Residual strength condition (see Section 6.5.6 in report text) assumed along horizontal clay varves within the glaciolacustrine unit. Where slip surface is non-horizontal within the glaciolacustrine unit, peak shear strength condi-tions apply.
9. Minimum required factor of safety for residual strength condition = 1.1.
Material Parameters
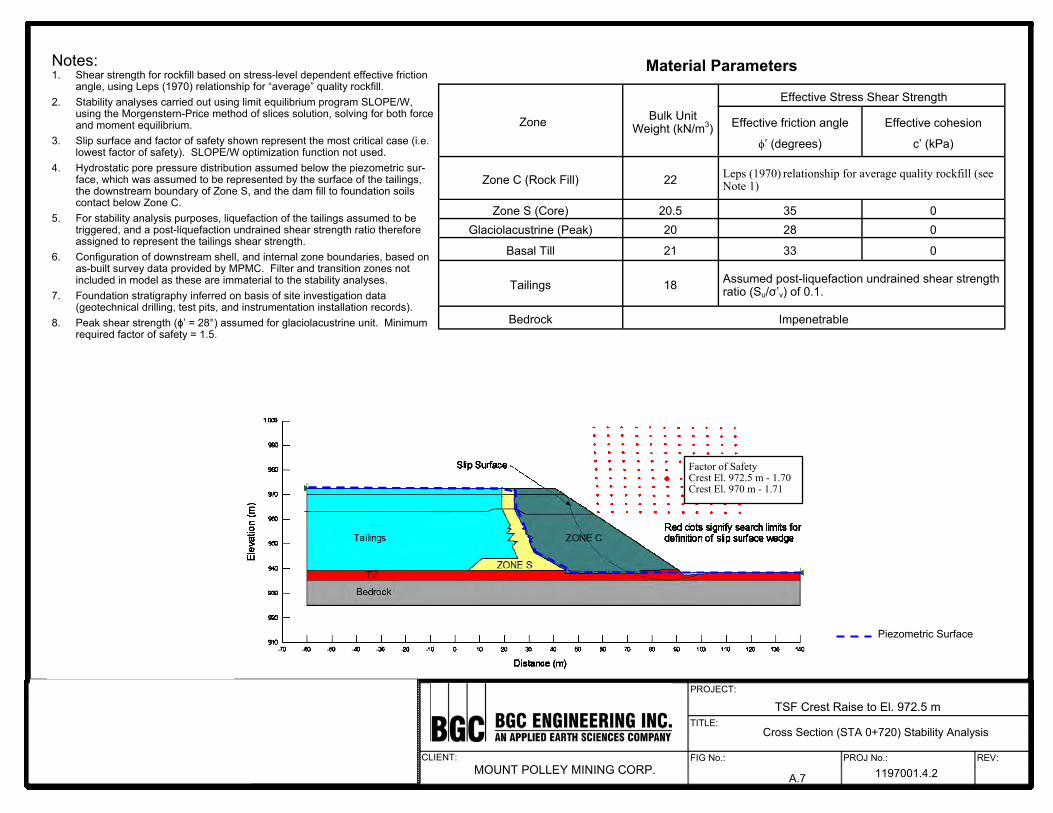
CLIENT:
TITLE:
PROJECT:
FIG No.: PROJ No.: REV: MOUNT POLLEY MINING CORP.
TSF Crest Raise to El. 972.5 m
1197001.4.2 A.7
Cross Section (STA 0+720) Stability Analysis
Zone Bulk Unit Weight (kN/m3)
Effective Stress Shear Strength
Effective friction angle
ϕ’ (degrees)
Effective cohesion
c’ (kPa)
Zone C (Rock Fill) 22 Leps (1970) relationship for average quality rockfill (see Note 1)
Zone S (Core) 20.5 35 0 Glaciolacustrine (Peak) 20 28 0
Basal Till 21 33 0
Tailings 18 Assumed post-liquefaction undrained shear strength ratio (Su/σ’v) of 0.1.
Bedrock Impenetrable
Factor of Safety Crest El. 972.5 m - 1.70 Crest El. 970 m - 1.71
Piezometric Surface
Material Parameters Notes: 1. Shear strength for rockfill based on stress-level dependent effective friction
angle, using Leps (1970) relationship for “average” quality rockfill. 2. Stability analyses carried out using limit equilibrium program SLOPE/W,
using the Morgenstern-Price method of slices solution, solving for both force and moment equilibrium.
3. Slip surface and factor of safety shown represent the most critical case (i.e. lowest factor of safety). SLOPE/W optimization function not used.
4. Hydrostatic pore pressure distribution assumed below the piezometric sur-face, which was assumed to be represented by the surface of the tailings, the downstream boundary of Zone S, and the dam fill to foundation soils contact below Zone C.
5. For stability analysis purposes, liquefaction of the tailings assumed to be triggered, and a post-liquefaction undrained shear strength ratio therefore assigned to represent the tailings shear strength.
6. Configuration of downstream shell, and internal zone boundaries, based on as-built survey data provided by MPMC. Filter and transition zones not included in model as these are immaterial to the stability analyses.
7. Foundation stratigraphy inferred on basis of site investigation data (geotechnical drilling, test pits, and instrumentation installation records).
8. Peak shear strength (ϕ’ = 28°) assumed for glaciolacustrine unit. Minimum required factor of safety = 1.5.
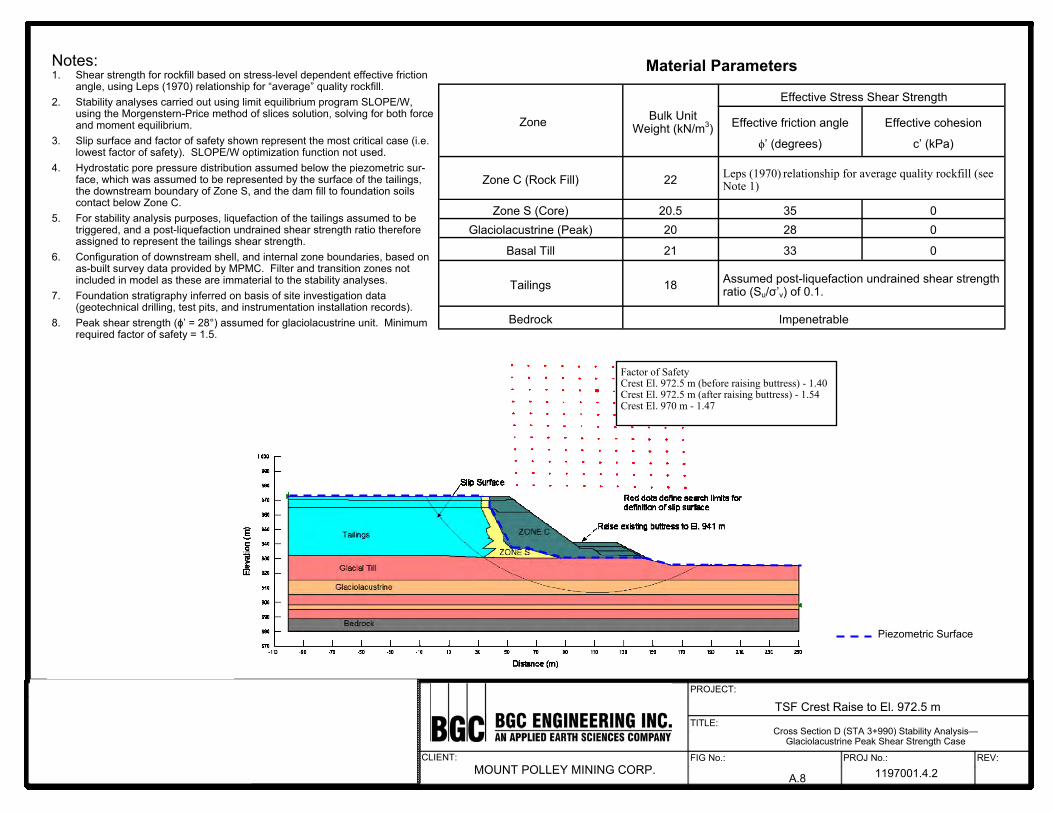
CLIENT:
TITLE:
PROJECT:
FIG No.: PROJ No.: REV: MOUNT POLLEY MINING CORP.
TSF Crest Raise to El. 972.5 m
1197001.4.2 A.8
Cross Section D (STA 3+990) Stability Analysis— Glaciolacustrine Peak Shear Strength Case
Zone Bulk Unit Weight (kN/m3)
Effective Stress Shear Strength
Effective friction angle
ϕ’ (degrees)
Effective cohesion
c’ (kPa)
Zone C (Rock Fill) 22 Leps (1970) relationship for average quality rockfill (see Note 1)
Zone S (Core) 20.5 35 0 Glaciolacustrine (Peak) 20 28 0
Basal Till 21 33 0
Tailings 18 Assumed post-liquefaction undrained shear strength ratio (Su/σ’v) of 0.1.
Bedrock Impenetrable
Piezometric Surface
Material Parameters Notes: 1. Shear strength for rockfill based on stress-level dependent effective friction
angle, using Leps (1970) relationship for “average” quality rockfill. 2. Stability analyses carried out using limit equilibrium program SLOPE/W,
using the Morgenstern-Price method of slices solution, solving for both force and moment equilibrium.
3. Slip surface and factor of safety shown represent the most critical case (i.e. lowest factor of safety). SLOPE/W optimization function not used.
4. Hydrostatic pore pressure distribution assumed below the piezometric sur-face, which was assumed to be represented by the surface of the tailings, the downstream boundary of Zone S, and the dam fill to foundation soils contact below Zone C.
5. For stability analysis purposes, liquefaction of the tailings assumed to be triggered, and a post-liquefaction undrained shear strength ratio therefore assigned to represent the tailings shear strength.
6. Configuration of downstream shell, and internal zone boundaries, based on as-built survey data provided by MPMC. Filter and transition zones not included in model as these are immaterial to the stability analyses.
7. Foundation stratigraphy inferred on basis of site investigation data (geotechnical drilling, test pits, and instrumentation installation records).
8. Peak shear strength (ϕ’ = 28°) assumed for glaciolacustrine unit. Minimum required factor of safety = 1.5.
Factor of Safety Crest El. 972.5 m (before raising buttress) - 1.40 Crest El. 972.5 m (after raising buttress) - 1.54 Crest El. 970 m - 1.47
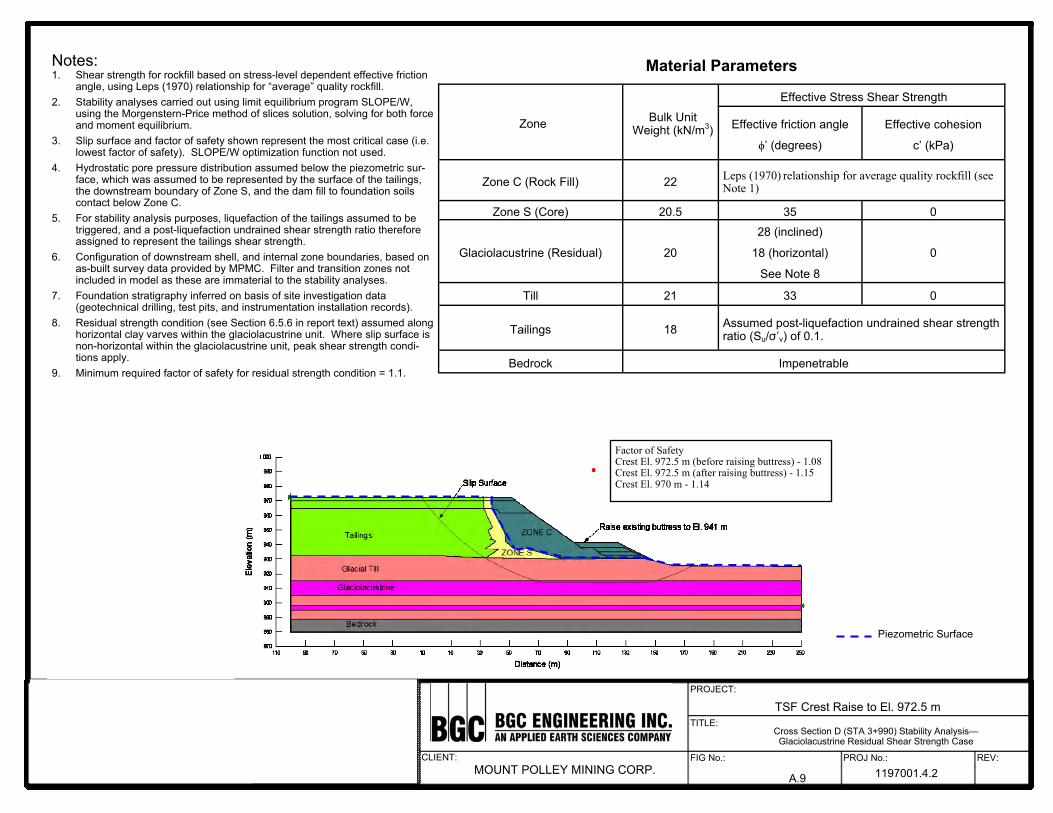
CLIENT:
TITLE:
PROJECT:
FIG No.: PROJ No.: REV: MOUNT POLLEY MINING CORP.
TSF Crest Raise to El. 972.5 m
1197001.4.2 A.9
Cross Section D (STA 3+990) Stability Analysis— Glaciolacustrine Residual Shear Strength Case
Zone Bulk Unit Weight (kN/m3)
Effective Stress Shear Strength
Effective friction angle
ϕ’ (degrees)
Effective cohesion
c’ (kPa)
Zone C (Rock Fill) 22 Leps (1970) relationship for average quality rockfill (see Note 1)
Zone S (Core) 20.5 35 0
Glaciolacustrine (Residual) 20
28 (inclined)
18 (horizontal)
See Note 8
0
Till 21 33 0
Tailings 18 Assumed post-liquefaction undrained shear strength ratio (Su/σ’v) of 0.1.
Bedrock Impenetrable
Factor of Safety Crest El. 972.5 m (before raising buttress) - 1.08 Crest El. 972.5 m (after raising buttress) - 1.15 Crest El. 970 m - 1.14
Piezometric Surface
Notes: 1. Shear strength for rockfill based on stress-level dependent effective friction
angle, using Leps (1970) relationship for “average” quality rockfill. 2. Stability analyses carried out using limit equilibrium program SLOPE/W,
using the Morgenstern-Price method of slices solution, solving for both force and moment equilibrium.
3. Slip surface and factor of safety shown represent the most critical case (i.e. lowest factor of safety). SLOPE/W optimization function not used.
4. Hydrostatic pore pressure distribution assumed below the piezometric sur-face, which was assumed to be represented by the surface of the tailings, the downstream boundary of Zone S, and the dam fill to foundation soils contact below Zone C.
5. For stability analysis purposes, liquefaction of the tailings assumed to be triggered, and a post-liquefaction undrained shear strength ratio therefore assigned to represent the tailings shear strength.
6. Configuration of downstream shell, and internal zone boundaries, based on as-built survey data provided by MPMC. Filter and transition zones not included in model as these are immaterial to the stability analyses.
7. Foundation stratigraphy inferred on basis of site investigation data (geotechnical drilling, test pits, and instrumentation installation records).
8. Residual strength condition (see Section 6.5.6 in report text) assumed along horizontal clay varves within the glaciolacustrine unit. Where slip surface is non-horizontal within the glaciolacustrine unit, peak shear strength condi-tions apply.
9. Minimum required factor of safety for residual strength condition = 1.1.
Material Parameters
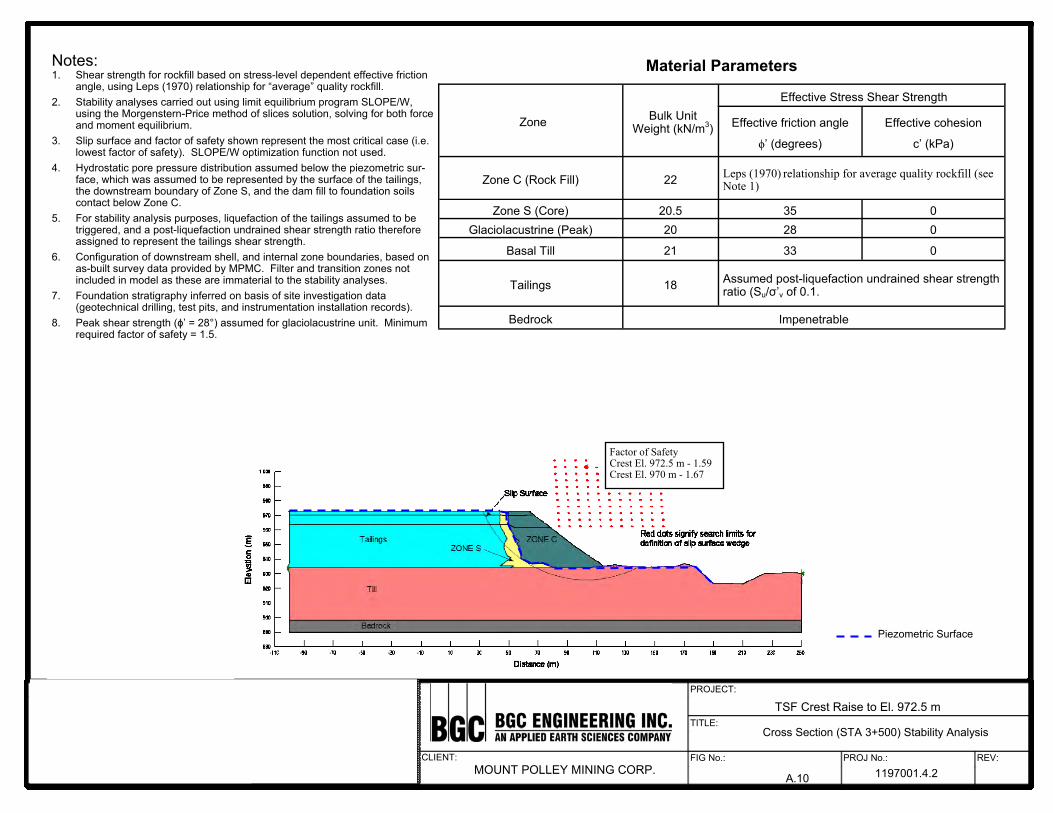
CLIENT:
TITLE:
PROJECT:
FIG No.: PROJ No.: REV: MOUNT POLLEY MINING CORP.
TSF Crest Raise to El. 972.5 m
1197001.4.2 A.10
Cross Section (STA 3+500) Stability Analysis
Zone Bulk Unit Weight (kN/m3)
Effective Stress Shear Strength
Effective friction angle
ϕ’ (degrees)
Effective cohesion
c’ (kPa)
Zone C (Rock Fill) 22 Leps (1970) relationship for average quality rockfill (see Note 1)
Zone S (Core) 20.5 35 0 Glaciolacustrine (Peak) 20 28 0
Basal Till 21 33 0
Tailings 18 Assumed post-liquefaction undrained shear strength ratio (Su/σ’v of 0.1.
Bedrock Impenetrable
Factor of Safety Crest El. 972.5 m - 1.59 Crest El. 970 m - 1.67
Piezometric Surface
Material Parameters Notes: 1. Shear strength for rockfill based on stress-level dependent effective friction
angle, using Leps (1970) relationship for “average” quality rockfill. 2. Stability analyses carried out using limit equilibrium program SLOPE/W,
using the Morgenstern-Price method of slices solution, solving for both force and moment equilibrium.
3. Slip surface and factor of safety shown represent the most critical case (i.e. lowest factor of safety). SLOPE/W optimization function not used.
4. Hydrostatic pore pressure distribution assumed below the piezometric sur-face, which was assumed to be represented by the surface of the tailings, the downstream boundary of Zone S, and the dam fill to foundation soils contact below Zone C.
5. For stability analysis purposes, liquefaction of the tailings assumed to be triggered, and a post-liquefaction undrained shear strength ratio therefore assigned to represent the tailings shear strength.
6. Configuration of downstream shell, and internal zone boundaries, based on as-built survey data provided by MPMC. Filter and transition zones not included in model as these are immaterial to the stability analyses.
7. Foundation stratigraphy inferred on basis of site investigation data (geotechnical drilling, test pits, and instrumentation installation records).
8. Peak shear strength (ϕ’ = 28°) assumed for glaciolacustrine unit. Minimum required factor of safety = 1.5.
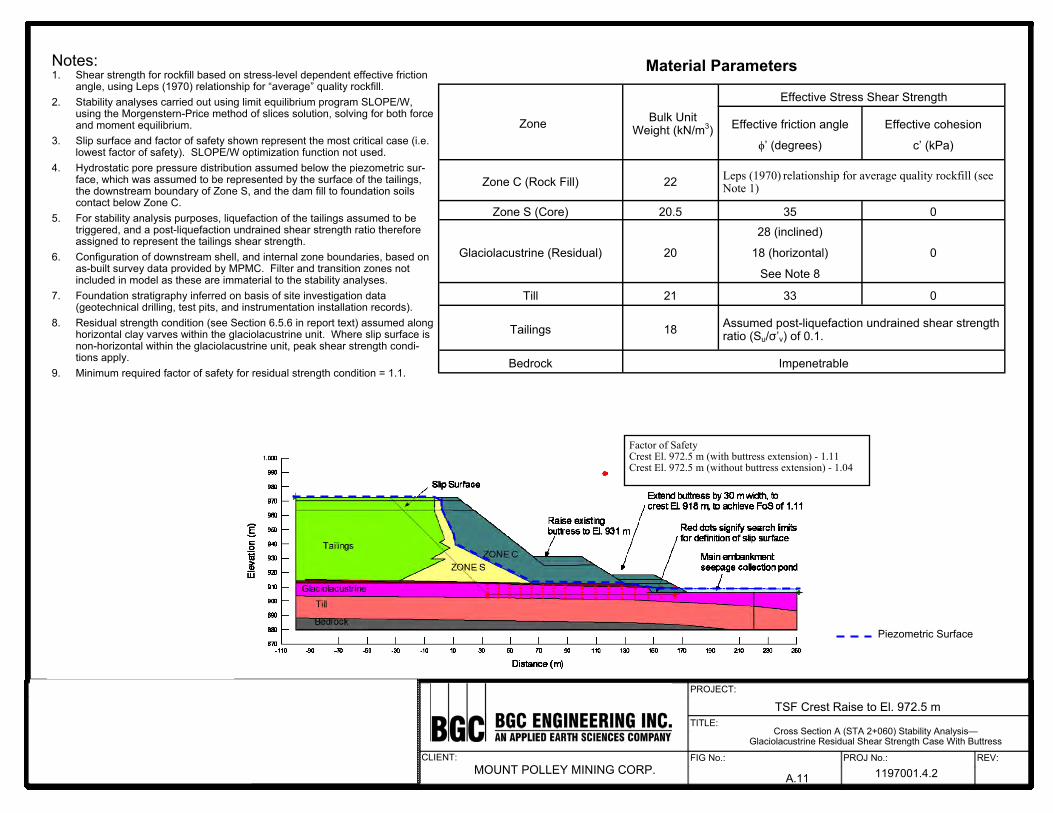
CLIENT:
TITLE:
PROJECT:
FIG No.: PROJ No.: REV: MOUNT POLLEY MINING CORP.
TSF Crest Raise to El. 972.5 m
1197001.4.2 A.11
Cross Section A (STA 2+060) Stability Analysis— Glaciolacustrine Residual Shear Strength Case With Buttress
Zone Bulk Unit Weight (kN/m3)
Effective Stress Shear Strength
Effective friction angle
ϕ’ (degrees)
Effective cohesion
c’ (kPa)
Zone C (Rock Fill) 22 Leps (1970) relationship for average quality rockfill (see Note 1)
Zone S (Core) 20.5 35 0
Glaciolacustrine (Residual) 20
28 (inclined)
18 (horizontal)
See Note 8
0
Till 21 33 0
Tailings 18 Assumed post-liquefaction undrained shear strength ratio (Su/σ’v) of 0.1.
Bedrock Impenetrable
Factor of Safety Crest El. 972.5 m (with buttress extension) - 1.11 Crest El. 972.5 m (without buttress extension) - 1.04
Piezometric Surface
Notes: 1. Shear strength for rockfill based on stress-level dependent effective friction
angle, using Leps (1970) relationship for “average” quality rockfill. 2. Stability analyses carried out using limit equilibrium program SLOPE/W,
using the Morgenstern-Price method of slices solution, solving for both force and moment equilibrium.
3. Slip surface and factor of safety shown represent the most critical case (i.e. lowest factor of safety). SLOPE/W optimization function not used.
4. Hydrostatic pore pressure distribution assumed below the piezometric sur-face, which was assumed to be represented by the surface of the tailings, the downstream boundary of Zone S, and the dam fill to foundation soils contact below Zone C.
5. For stability analysis purposes, liquefaction of the tailings assumed to be triggered, and a post-liquefaction undrained shear strength ratio therefore assigned to represent the tailings shear strength.
6. Configuration of downstream shell, and internal zone boundaries, based on as-built survey data provided by MPMC. Filter and transition zones not included in model as these are immaterial to the stability analyses.
7. Foundation stratigraphy inferred on basis of site investigation data (geotechnical drilling, test pits, and instrumentation installation records).
8. Residual strength condition (see Section 6.5.6 in report text) assumed along horizontal clay varves within the glaciolacustrine unit. Where slip surface is non-horizontal within the glaciolacustrine unit, peak shear strength condi-tions apply.
9. Minimum required factor of safety for residual strength condition = 1.1.
Material Parameters
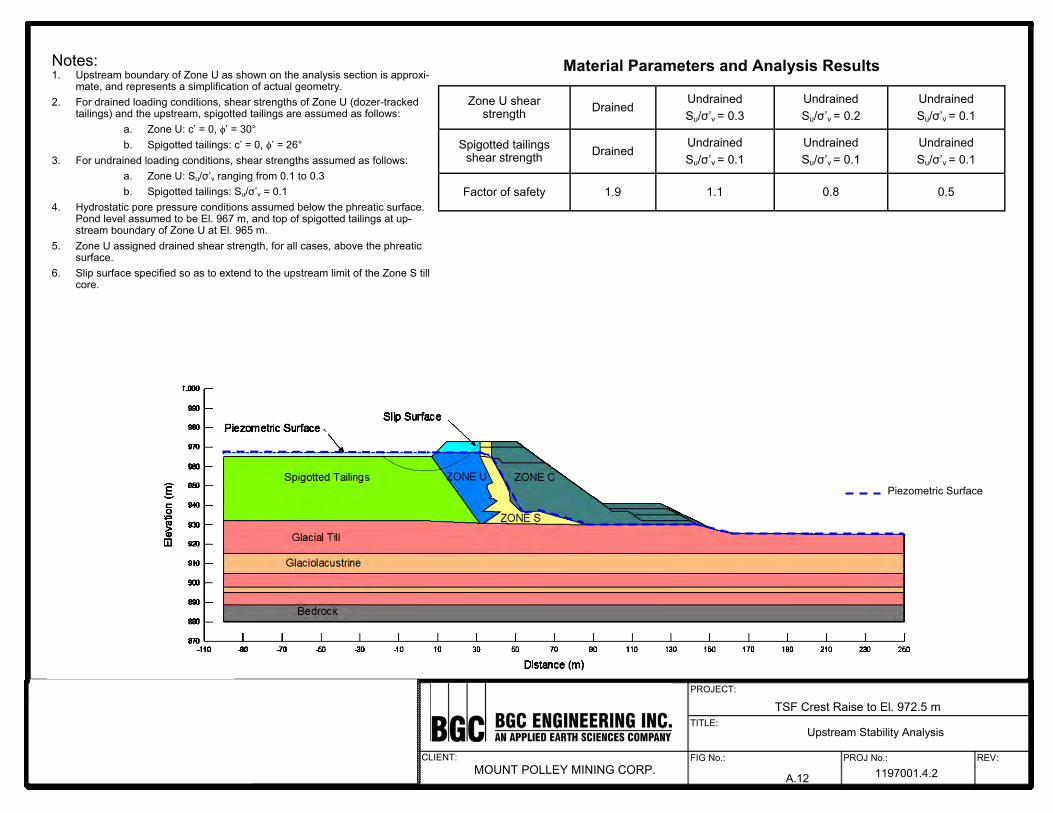
CLIENT:
TITLE:
PROJECT:
FIG No.: PROJ No.: REV: MOUNT POLLEY MINING CORP.
TSF Crest Raise to El. 972.5 m
1197001.4.2
Notes: 1. Upstream boundary of Zone U as shown on the analysis section is approxi-
mate, and represents a simplification of actual geometry. 2. For drained loading conditions, shear strengths of Zone U (dozer-tracked
tailings) and the upstream, spigotted tailings are assumed as follows: a. Zone U: c’ = 0, ϕ’ = 30° b. Spigotted tailings: c’ = 0, ϕ’ = 26°
3. For undrained loading conditions, shear strengths assumed as follows: a. Zone U: Su/σ’v ranging from 0.1 to 0.3 b. Spigotted tailings: Su/σ’v = 0.1
4. Hydrostatic pore pressure conditions assumed below the phreatic surface. Pond level assumed to be El. 967 m, and top of spigotted tailings at up-stream boundary of Zone U at El. 965 m.
5. Zone U assigned drained shear strength, for all cases, above the phreatic surface.
6. Slip surface specified so as to extend to the upstream limit of the Zone S till core.
Zone U shear strength Drained
Undrained Su/σ’v = 0.3
Undrained Su/σ’v = 0.2
Undrained Su/σ’v = 0.1
Spigotted tailings shear strength Drained
Undrained Su/σ’v = 0.1
Undrained Su/σ’v = 0.1
Undrained Su/σ’v = 0.1
Factor of safety 1.9 1.1 0.8 0.5
Piezometric Surface
A.12
Upstream Stability Analysis
Material Parameters and Analysis Results

Mount Polley Mining Corporation, Mount Polley Mine July 25, 2014 Tailings Storage Facility Stage 10 Raise Design Report – FINAL Project No.: 1197001.4.2
MPMC TSF Stage 10 Design Report_July 25 Final
BGC ENGINEERING INC.
DRAWINGS
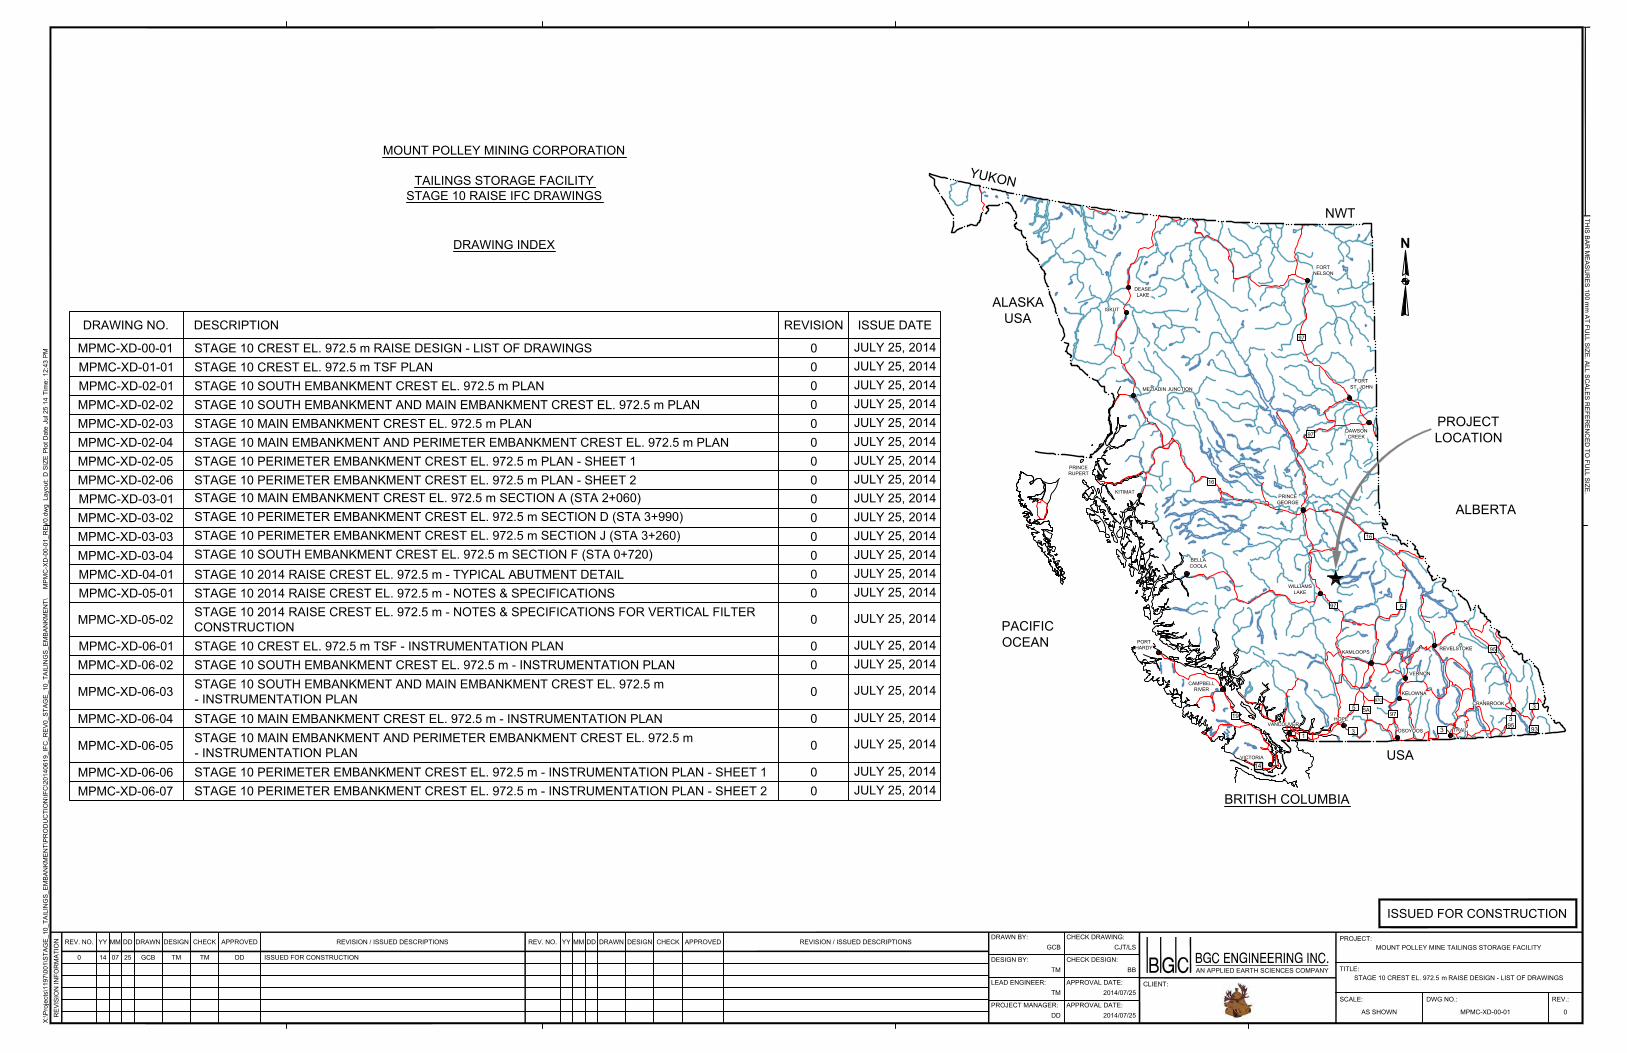
FORTST. JOHN
DAWSONCREEK
FORTNELSON
DEASELAKE
PRINCEGEORGE
PRINCERUPERT
BELLACOOLA
WILLIAMSLAKE
PORTHARDY
ALASKAUSA
KITIMAT
CAMPBELLRIVER
BRITISH COLUMBIA
PROJECTLOCATION
ISKUT
MEZIADIN JUNCTION
YUKON
NWT
ALBERTA
PACIFICOCEAN
VICTORIA
VANCOUVERHOPE
KAMLOOPSREVELSTOKE
CRANBROOK
TRAIL
USA
OSOYOOS
KELOWNA
VERNON
19
14
1
5
3
5A
97C
97
3
395
3
97 5
95
16
16
97
97
93
SCALE:
DRAWN BY:
REV.:
X:\P
roje
cts\
1197
\001
\STA
GE_
10_T
AILI
NG
S_EM
BAN
KMEN
T\PR
OD
UC
TIO
N\IF
C\2
0140
619_
IFC
_REV
0_ST
AGE_
10_T
AILI
NG
S_EM
BAN
KMEN
T\M
PMC
-XD
-00-
01_R
EV0.
dwg
Lay
out:
D S
IZE
Plo
t Dat
e Ju
l 25
14 T
ime:
12:
43 P
M
REV. NO. YY DRAWN DESIGN CHECK APPROVED REVISION / ISSUED DESCRIPTIONSCHECK DRAWING:
DWG NO.:
DESIGN BY: CHECK DESIGN:
LEAD ENGINEER: APPROVAL DATE:
PROJECT MANAGER: APPROVAL DATE:
REV. NO. DRAWN DESIGN CHECK REVISION / ISSUED DESCRIPTIONS
REV
ISIO
N IN
FOR
MAT
ION MM DD YY MM DD
THIS BAR
MEASU
RES 100 m
m AT FU
LL SIZE. ALL SCALES R
EFEREN
CED
TO FU
LL SIZE.
PROJECT:
TITLE:
CLIENT:
AN APPLIED EARTH SCIENCES COMPANY
APPROVEDGCB
0MPMC-XD-00-01AS SHOWN
STAGE 10 CREST EL. 972.5 M RAISE DESIGN - LIST OF DRAWINGS
MOUNT POLLEY MINE TAILINGS STORAGE FACILITY0 07 GCB TM TM DD ISSUED FOR CONSTRUCTION
CJT/LS
TM BB
TM 2014/07/25
DD 2014/07/25
14 25
####
MOUNT POLLEY MINING CORPORATION
TAILINGS STORAGE FACILITYSTAGE 10 RAISE IFC DRAWINGS
DRAWING INDEX
DRAWING NO. DESCRIPTION REVISION ISSUE DATE
MPMC-XD-00-01 STAGE 10 CREST EL. 972.5 m RAISE DESIGN - LIST OF DRAWINGS 0 JULY 25, 2014MPMC-XD-01-01 0STAGE 10 CREST EL. 972.5 m TSF PLAN
0MPMC-XD-02-010MPMC-XD-02-020MPMC-XD-02-030MPMC-XD-02-040
MPMC-XD-03-010
MPMC-XD-03-020
MPMC-XD-03-030
MPMC-XD-03-040
MPMC-XD-04-010
MPMC-XD-05-010
MPMC-XD-05-02
0
MPMC-XD-06-01
0
MPMC-XD-06-020
MPMC-XD-06-03
0
MPMC-XD-06-04
0
MPMC-XD-06-05
0
N
STAGE 10 SOUTH EMBANKMENT AND MAIN EMBANKMENT CREST EL. 972.5 m PLANSTAGE 10 MAIN EMBANKMENT CREST EL. 972.5 m PLANSTAGE 10 MAIN EMBANKMENT AND PERIMETER EMBANKMENT CREST EL. 972.5 m PLANSTAGE 10 PERIMETER EMBANKMENT CREST EL. 972.5 m PLAN - SHEET 1
STAGE 10 MAIN EMBANKMENT CREST EL. 972.5 m SECTION A (STA 2+060)STAGE 10 PERIMETER EMBANKMENT CREST EL. 972.5 m SECTION D (STA 3+990)STAGE 10 PERIMETER EMBANKMENT CREST EL. 972.5 m SECTION J (STA 3+260)STAGE 10 SOUTH EMBANKMENT CREST EL. 972.5 m SECTION F (STA 0+720)
STAGE 10 2014 RAISE CREST EL. 972.5 m - NOTES & SPECIFICATIONSSTAGE 10 2014 RAISE CREST EL. 972.5 m - NOTES & SPECIFICATIONS FOR VERTICAL FILTERCONSTRUCTIONSTAGE 10 CREST EL. 972.5 m TSF - INSTRUMENTATION PLAN
ISSUED FOR CONSTRUCTION
STAGE 10 SOUTH EMBANKMENT CREST EL. 972.5 m - INSTRUMENTATION PLAN
STAGE 10 MAIN EMBANKMENT CREST EL. 972.5 m - INSTRUMENTATION PLANSTAGE 10 MAIN EMBANKMENT AND PERIMETER EMBANKMENT CREST EL. 972.5 m- INSTRUMENTATION PLANSTAGE 10 PERIMETER EMBANKMENT CREST EL. 972.5 m - INSTRUMENTATION PLAN - SHEET 1
STAGE 10 2014 RAISE CREST EL. 972.5 m - TYPICAL ABUTMENT DETAIL
MPMC-XD-02-05
MPMC-XD-06-06MPMC-XD-06-07
0
0
STAGE 10 SOUTH EMBANKMENT CREST EL. 972.5 m PLAN
STAGE 10 PERIMETER EMBANKMENT CREST EL. 972.5 m PLAN - SHEET 2
STAGE 10 SOUTH EMBANKMENT AND MAIN EMBANKMENT CREST EL. 972.5 m- INSTRUMENTATION PLAN
MPMC-XD-02-06
STAGE 10 PERIMETER EMBANKMENT CREST EL. 972.5 m - INSTRUMENTATION PLAN - SHEET 2 0
m
JULY 25, 2014JULY 25, 2014JULY 25, 2014JULY 25, 2014JULY 25, 2014JULY 25, 2014JULY 25, 2014JULY 25, 2014JULY 25, 2014JULY 25, 2014JULY 25, 2014JULY 25, 2014JULY 25, 2014
JULY 25, 2014
JULY 25, 2014JULY 25, 2014
JULY 25, 2014
JULY 25, 2014
JULY 25, 2014
JULY 25, 2014JULY 25, 2014
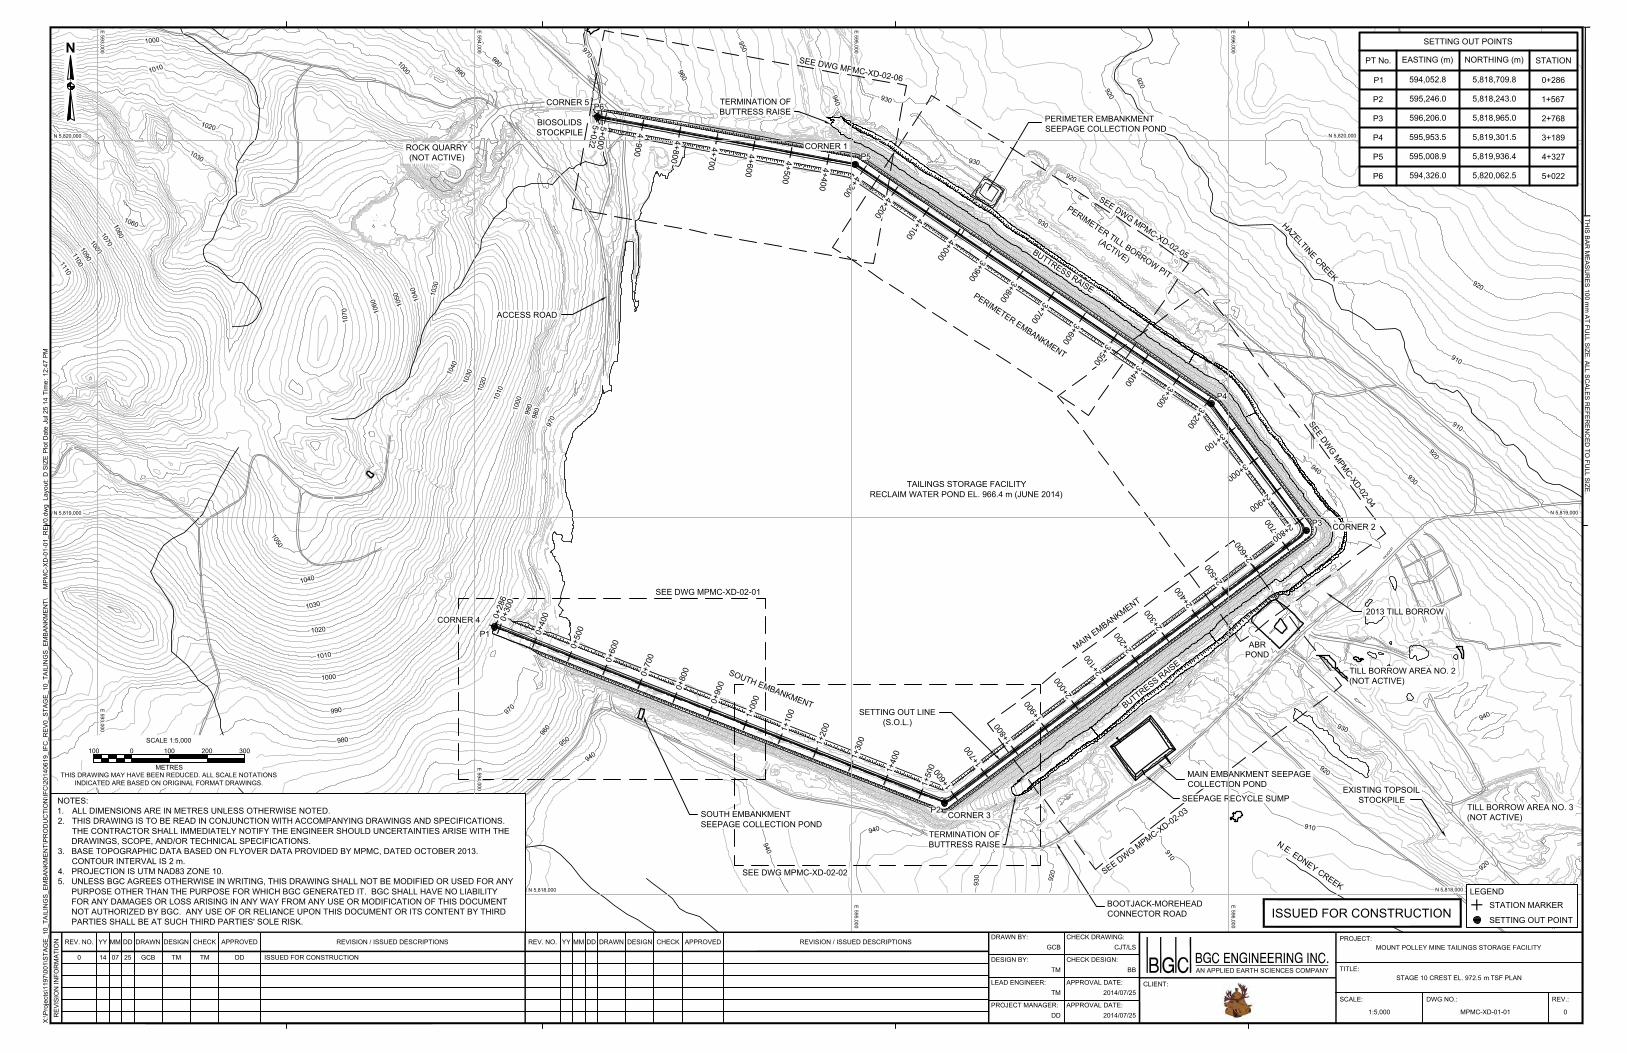
TAILINGS STORAGE FACILITYRECLAIM WATER POND EL. 966.4 m (JUNE 2014)
CORNER 2
CORNER 3
CORNER 5
CORNER 1
BOOTJACK-MOREHEADCONNECTOR ROAD
N.E. EDNEY CREEK
PERIMETER EMBANKMENT
SETTING OUT LINE(S.O.L.)
PERIMETER EMBANKMENTSEEPAGE COLLECTION POND
ACCESS ROAD
ROCK QUARRY(NOT ACTIVE)
BIOSOLIDSSTOCKPILE
PERIMETER TILL BORROW PIT
(ACTIVE)
TILL BORROW AREA NO. 2(NOT ACTIVE)
TILL BORROW AREA NO. 3(NOT ACTIVE)
EXISTING TOPSOILSTOCKPILE
P1
P2
P3
P4
P5
P6
SEE DWG MPMC-XD-02-01
SEE DWG MPMC-XD-02-02
MAIN EMBANKMENT SEEPAGECOLLECTION POND
SEEPAGE RECYCLE SUMP
SOUTH EMBANKMENT
MAIN EMBANKMENT
ABRPOND
SEE DWG MPMC-XD-02-03
SEE DWG MPMC-XD-02-04
SOUTH EMBANKMENTSEEPAGE COLLECTION POND
SEE DWG MPMC-XD-02-05
SEE DWG MPMC-XD-02-06
2013 TILL BORROW
HAZELTINE CREEK
BUTTRESS RAISE
BUTTRESS RAISE
TERMINATION OFBUTTRESS RAISE
TERMINATION OFBUTTRESS RAISE
5+022
0+28
60+
300
0+40
0
0+50
0
0+60
0
0+70
0
0+80
0
0+90
0
1+00
0
1+10
0
1+20
0
1+30
0
1+40
0
1+50
0
1+60
0
1+70
0
1+80
0
1+90
0
2+00
0
2+10
0
2+20
0
2+30
0
2+40
0
2+50
0
2+60
0
2+70
0 2+800
2+900
3+000
3+100
3+200
3+300
3+400
3+500
3+600
3+700
3+800
3+900
4+000
4+100
4+200
4+300
4+400
4+500
4+600
4+700
4+800
4+900
5+000
CORNER 4
N
NOTES:1. ALL DIMENSIONS ARE IN METRES UNLESS OTHERWISE NOTED.2. THIS DRAWING IS TO BE READ IN CONJUNCTION WITH ACCOMPANYING DRAWINGS AND SPECIFICATIONS.
THE CONTRACTOR SHALL IMMEDIATELY NOTIFY THE ENGINEER SHOULD UNCERTAINTIES ARISE WITH THEDRAWINGS, SCOPE, AND/OR TECHNICAL SPECIFICATIONS.
3. BASE TOPOGRAPHIC DATA BASED ON FLYOVER DATA PROVIDED BY MPMC, DATED OCTOBER 2013.CONTOUR INTERVAL IS 2 m.
4. PROJECTION IS UTM NAD83 ZONE 10.5. UNLESS BGC AGREES OTHERWISE IN WRITING, THIS DRAWING SHALL NOT BE MODIFIED OR USED FOR ANY
PURPOSE OTHER THAN THE PURPOSE FOR WHICH BGC GENERATED IT. BGC SHALL HAVE NO LIABILITYFOR ANY DAMAGES OR LOSS ARISING IN ANY WAY FROM ANY USE OR MODIFICATION OF THIS DOCUMENTNOT AUTHORIZED BY BGC. ANY USE OF OR RELIANCE UPON THIS DOCUMENT OR ITS CONTENT BY THIRDPARTIES SHALL BE AT SUCH THIRD PARTIES' SOLE RISK.
E 593,000E 593,000
E 594,000E 594,000
E 595,000E 595,000
E 596,000E 596,000
N 5,818,000 N 5,818,000
N 5,819,000 N 5,819,000
N 5,820,000 N 5,820,000
THIS DRAWING MAY HAVE BEEN REDUCED. ALL SCALE NOTATIONSINDICATED ARE BASED ON ORIGINAL FORMAT DRAWINGS.
0 200100SCALE 1:5,000
METRES
100 300
SCALE:
DRAWN BY:
REV.:
X:\P
roje
cts\
1197
\001
\STA
GE_
10_T
AILI
NG
S_EM
BAN
KMEN
T\PR
OD
UC
TIO
N\IF
C\2
0140
619_
IFC
_REV
0_ST
AGE_
10_T
AILI
NG
S_EM
BAN
KMEN
T\M
PMC
-XD
-01-
01_R
EV0.
dwg
Lay
out:
D S
IZE
Plo
t Dat
e Ju
l 25
14 T
ime:
12:
47 P
M
REV. NO. YY DRAWN DESIGN CHECK APPROVED REVISION / ISSUED DESCRIPTIONSCHECK DRAWING:
DWG NO.:
DESIGN BY: CHECK DESIGN:
LEAD ENGINEER: APPROVAL DATE:
PROJECT MANAGER: APPROVAL DATE:
REV. NO. DRAWN DESIGN CHECK REVISION / ISSUED DESCRIPTIONS
REV
ISIO
N IN
FOR
MAT
ION MM DD YY MM DD
THIS BAR
MEASU
RES 100 m
m AT FU
LL SIZE. ALL SCALES R
EFEREN
CED
TO FU
LL SIZE.
PROJECT:
TITLE:
CLIENT:
AN APPLIED EARTH SCIENCES COMPANY
APPROVEDGCB
0MPMC-XD-01-011:5,000
STAGE 10 CREST EL. 972.5 M TSF PLAN
MOUNT POLLEY MINE TAILINGS STORAGE FACILITY0 07 GCB TM TM DD ISSUED FOR CONSTRUCTION
CJT/LS
TM BB
TM 2014/07/25
DD 2014/07/25
14 25
####
SETTING OUT POINTS
PT No.
P1
P2
P3
P4
P5
P6
EASTING (m)
594,052.8
595,246.0
596,206.0
595,953.5
595,008.9
594,326.0
NORTHING (m)
5,818,709.8
5,818,243.0
5,818,965.0
5,819,301.5
5,819,936.4
5,820,062.5
STATION
0+286
1+567
2+768
3+189
4+327
5+022
ISSUED FOR CONSTRUCTION
LEGENDSTATION MARKER
SETTING OUT POINT
m
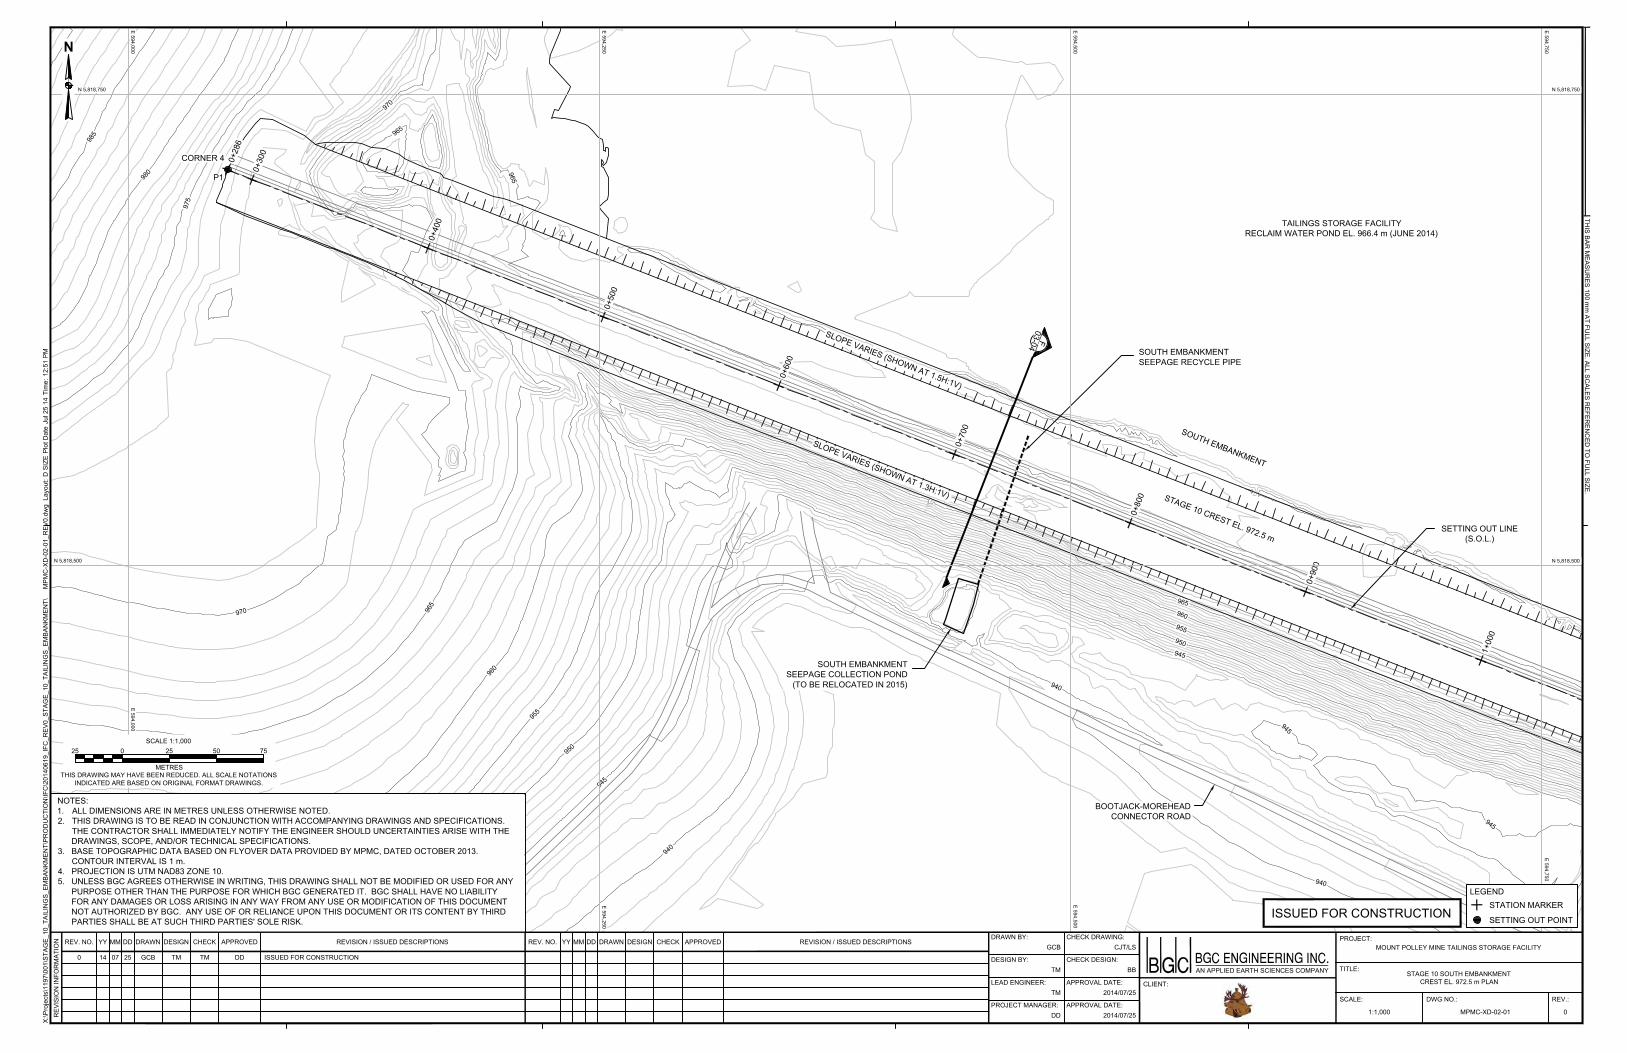
TAILINGS STORAGE FACILITYRECLAIM WATER POND EL. 966.4 m (JUNE 2014)
CORNER 4
BOOTJACK-MOREHEADCONNECTOR ROAD
SOUTH EMBANKMENT
SOUTH EMBANKMENTSEEPAGE COLLECTION POND
(TO BE RELOCATED IN 2015)
SETTING OUT LINE(S.O.L.)
0+28
6
0+30
0
0+40
0
0+50
0
0+60
0
0+70
0
0+80
0
0+90
0
1+00
0
STAGE 10 CREST EL. 972.5 m
SOUTH EMBANKMENTSEEPAGE RECYCLE PIPE
P1
--03-04 F
N
NOTES:1. ALL DIMENSIONS ARE IN METRES UNLESS OTHERWISE NOTED.2. THIS DRAWING IS TO BE READ IN CONJUNCTION WITH ACCOMPANYING DRAWINGS AND SPECIFICATIONS.
THE CONTRACTOR SHALL IMMEDIATELY NOTIFY THE ENGINEER SHOULD UNCERTAINTIES ARISE WITH THEDRAWINGS, SCOPE, AND/OR TECHNICAL SPECIFICATIONS.
3. BASE TOPOGRAPHIC DATA BASED ON FLYOVER DATA PROVIDED BY MPMC, DATED OCTOBER 2013.CONTOUR INTERVAL IS 1 m.
4. PROJECTION IS UTM NAD83 ZONE 10.5. UNLESS BGC AGREES OTHERWISE IN WRITING, THIS DRAWING SHALL NOT BE MODIFIED OR USED FOR ANY
PURPOSE OTHER THAN THE PURPOSE FOR WHICH BGC GENERATED IT. BGC SHALL HAVE NO LIABILITYFOR ANY DAMAGES OR LOSS ARISING IN ANY WAY FROM ANY USE OR MODIFICATION OF THIS DOCUMENTNOT AUTHORIZED BY BGC. ANY USE OF OR RELIANCE UPON THIS DOCUMENT OR ITS CONTENT BY THIRDPARTIES SHALL BE AT SUCH THIRD PARTIES' SOLE RISK.
SCALE:
DRAWN BY:
REV.:
X:\P
roje
cts\
1197
\001
\STA
GE_
10_T
AILI
NG
S_EM
BAN
KMEN
T\PR
OD
UC
TIO
N\IF
C\2
0140
619_
IFC
_REV
0_ST
AGE_
10_T
AILI
NG
S_EM
BAN
KMEN
T\M
PMC
-XD
-02-
01_R
EV0.
dwg
Lay
out:
D S
IZE
Plo
t Dat
e Ju
l 25
14 T
ime:
12:
51 P
M
REV. NO. YY DRAWN DESIGN CHECK APPROVED REVISION / ISSUED DESCRIPTIONSCHECK DRAWING:
DWG NO.:
DESIGN BY: CHECK DESIGN:
LEAD ENGINEER: APPROVAL DATE:
PROJECT MANAGER: APPROVAL DATE:
REV. NO. DRAWN DESIGN CHECK REVISION / ISSUED DESCRIPTIONS
REV
ISIO
N IN
FOR
MAT
ION MM DD YY MM DD
THIS BAR
MEASU
RES 100 m
m AT FU
LL SIZE. ALL SCALES R
EFEREN
CED
TO FU
LL SIZE.
PROJECT:
TITLE:
CLIENT:
AN APPLIED EARTH SCIENCES COMPANY
APPROVEDGCB
0MPMC-XD-02-011:1,000
STAGE 10 SOUTH EMBANKMENTCREST EL. 972.5 M PLAN
MOUNT POLLEY MINE TAILINGS STORAGE FACILITY0 07 GCB TM TM DD ISSUED FOR CONSTRUCTION
CJT/LS
TM BB
TM 2014/07/25
DD 2014/07/25
14 25
####
THIS DRAWING MAY HAVE BEEN REDUCED. ALL SCALE NOTATIONSINDICATED ARE BASED ON ORIGINAL FORMAT DRAWINGS.
0 755025SCALE 1:1,000
METRES
25
ISSUED FOR CONSTRUCTION
E 594,000E 594,000
E 594,250E 594,250
E 594,500E 594,500
E 594,750E 594,750
N 5,818,500 N 5,818,500
N 5,818,750 N 5,818,750
m
LEGENDSTATION MARKER
SETTING OUT POINT
SLOPE VARIES (SHOWN AT 1.5H:1V)
SLOPE VARIES (SHOWN AT 1.3H:1V)
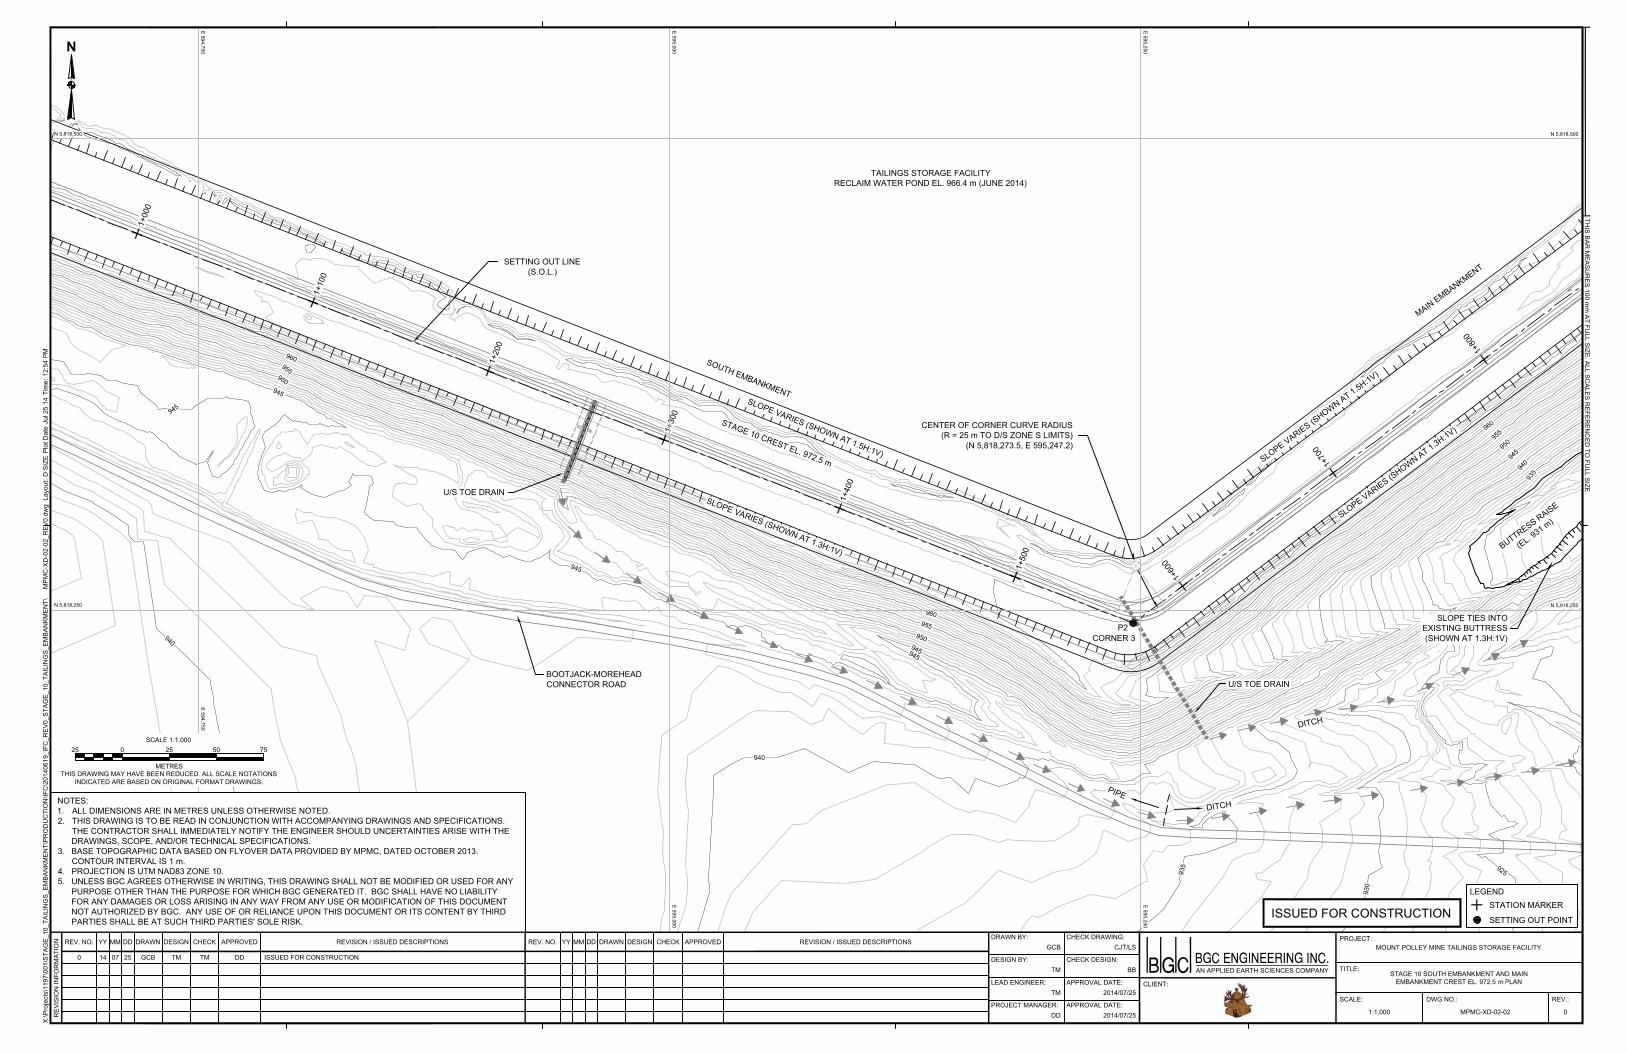
TAILINGS STORAGE FACILITYRECLAIM WATER POND EL. 966.4 m (JUNE 2014)
CORNER 3
BOOTJACK-MOREHEADCONNECTOR ROAD
SOUTH EMBANKMENT
MAIN EMBANKMENTSETTING OUT LINE
(S.O.L.)
1+00
0
1+10
0
1+20
0
1+30
0
1+40
0
1+50
0
1+60
0
1+70
0
1+80
0
STAGE 10 CREST EL. 972.5 m
U/S TOE DRAIN
CENTER OF CORNER CURVE RADIUS(R = 25 m TO D/S ZONE S LIMITS)
(N 5,818,273.5, E 595,247.2)
U/S TOE DRAIN
P2
DITCH
BUTTRESS RAISE
(EL. 931 m)
N
NOTES:1. ALL DIMENSIONS ARE IN METRES UNLESS OTHERWISE NOTED.2. THIS DRAWING IS TO BE READ IN CONJUNCTION WITH ACCOMPANYING DRAWINGS AND SPECIFICATIONS.
THE CONTRACTOR SHALL IMMEDIATELY NOTIFY THE ENGINEER SHOULD UNCERTAINTIES ARISE WITH THEDRAWINGS, SCOPE, AND/OR TECHNICAL SPECIFICATIONS.
3. BASE TOPOGRAPHIC DATA BASED ON FLYOVER DATA PROVIDED BY MPMC, DATED OCTOBER 2013.CONTOUR INTERVAL IS 1 m.
4. PROJECTION IS UTM NAD83 ZONE 10.5. UNLESS BGC AGREES OTHERWISE IN WRITING, THIS DRAWING SHALL NOT BE MODIFIED OR USED FOR ANY
PURPOSE OTHER THAN THE PURPOSE FOR WHICH BGC GENERATED IT. BGC SHALL HAVE NO LIABILITYFOR ANY DAMAGES OR LOSS ARISING IN ANY WAY FROM ANY USE OR MODIFICATION OF THIS DOCUMENTNOT AUTHORIZED BY BGC. ANY USE OF OR RELIANCE UPON THIS DOCUMENT OR ITS CONTENT BY THIRDPARTIES SHALL BE AT SUCH THIRD PARTIES' SOLE RISK.
SCALE:
DRAWN BY:
REV.:
X:\P
roje
cts\
1197
\001
\STA
GE_
10_T
AILI
NG
S_EM
BAN
KMEN
T\PR
OD
UC
TIO
N\IF
C\2
0140
619_
IFC
_REV
0_ST
AGE_
10_T
AILI
NG
S_EM
BAN
KMEN
T\M
PMC
-XD
-02-
02_R
EV0.
dwg
Lay
out:
D S
IZE
Plo
t Dat
e Ju
l 25
14 T
ime:
12:
54 P
M
REV. NO. YY DRAWN DESIGN CHECK APPROVED REVISION / ISSUED DESCRIPTIONSCHECK DRAWING:
DWG NO.:
DESIGN BY: CHECK DESIGN:
LEAD ENGINEER: APPROVAL DATE:
PROJECT MANAGER: APPROVAL DATE:
REV. NO. DRAWN DESIGN CHECK REVISION / ISSUED DESCRIPTIONS
REV
ISIO
N IN
FOR
MAT
ION MM DD YY MM DD
THIS BAR
MEASU
RES 100 m
m AT FU
LL SIZE. ALL SCALES R
EFEREN
CED
TO FU
LL SIZE.
PROJECT:
TITLE:
CLIENT:
AN APPLIED EARTH SCIENCES COMPANY
APPROVEDGCB
0MPMC-XD-02-021:1,000
STAGE 10 SOUTH EMBANKMENT AND MAINEMBANKMENT CREST EL. 972.5 M PLAN
MOUNT POLLEY MINE TAILINGS STORAGE FACILITY0 07 GCB TM TM DD ISSUED FOR CONSTRUCTION
CJT/LS
TM BB
TM 2014/07/25
DD 2014/07/25
14 25
####
THIS DRAWING MAY HAVE BEEN REDUCED. ALL SCALE NOTATIONSINDICATED ARE BASED ON ORIGINAL FORMAT DRAWINGS.
0 755025SCALE 1:1,000
METRES
25
ISSUED FOR CONSTRUCTION
E 594,750E 594,750
E 595,000E 595,000
E 595,250E 595,250
N 5,818,250 N 5,818,250
N 5,818,500 N 5,818,500
m
SLOPE VARIES (SHOWN AT 1.5H:1V)
LEGENDSTATION MARKER
SETTING OUT POINT
SLOPE VARIES (SHOWN AT 1.3H:1V)
SLOPE VARIES (SHOWN AT 1.5H:1V)
SLOPE VARIES (SHOWN AT 1.3H:1V)
SLOPE TIES INTOEXISTING BUTTRESS(SHOWN AT 1.3H:1V)
DITCH
PIPE
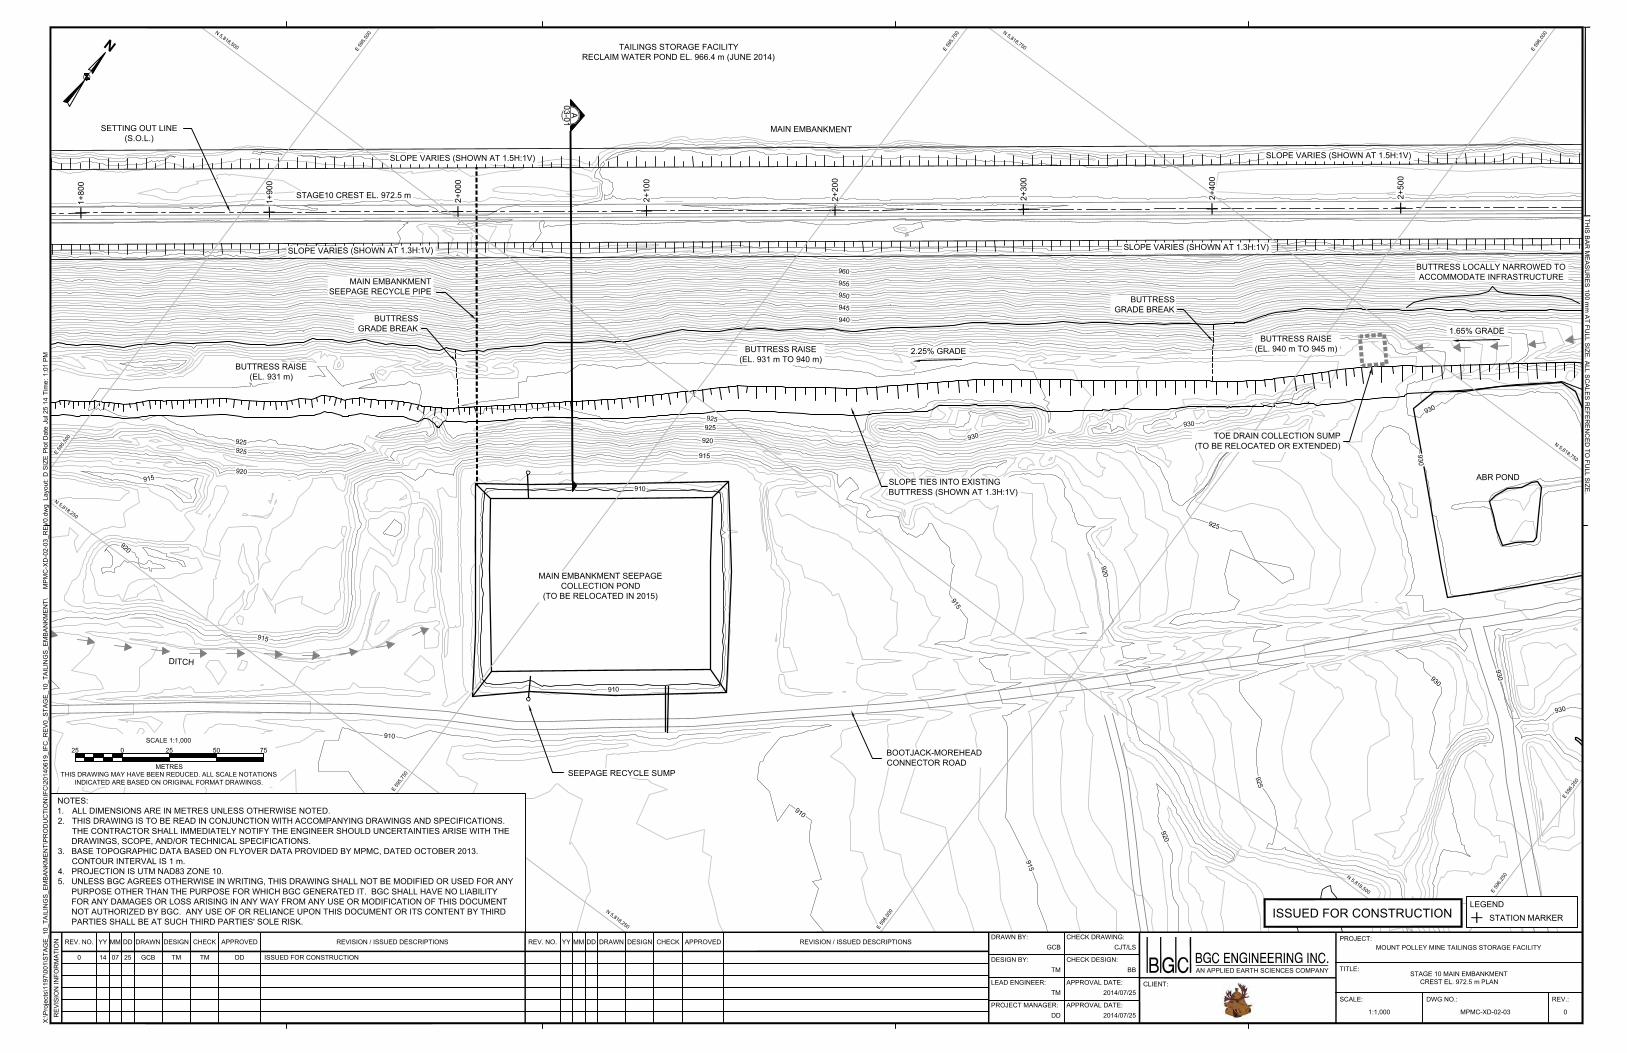
1+80
0
1+90
0
2+00
0
2+10
0
2+20
0
2+30
0
2+40
0
2+50
0
--03-01
A
TAILINGS STORAGE FACILITYRECLAIM WATER POND EL. 966.4 m (JUNE 2014)
BOOTJACK-MOREHEADCONNECTOR ROAD
MAIN EMBANKMENT SEEPAGECOLLECTION POND
(TO BE RELOCATED IN 2015)
MAIN EMBANKMENTSETTING OUT LINE(S.O.L.)
SEEPAGE RECYCLE SUMP
MAIN EMBANKMENTSEEPAGE RECYCLE PIPE
STAGE10 CREST EL. 972.5 m
ABR POND
THIS DRAWING MAY HAVE BEEN REDUCED. ALL SCALE NOTATIONSINDICATED ARE BASED ON ORIGINAL FORMAT DRAWINGS.
0 755025SCALE 1:1,000
METRES
25
SCALE:
DRAWN BY:
REV.:
X:\P
roje
cts\
1197
\001
\STA
GE_
10_T
AILI
NG
S_EM
BAN
KMEN
T\PR
OD
UC
TIO
N\IF
C\2
0140
619_
IFC
_REV
0_ST
AGE_
10_T
AILI
NG
S_EM
BAN
KMEN
T\M
PMC
-XD
-02-
03_R
EV0.
dwg
Lay
out:
D S
IZE
Plo
t Dat
e Ju
l 25
14 T
ime:
1:0
1 PM
REV. NO. YY DRAWN DESIGN CHECK APPROVED REVISION / ISSUED DESCRIPTIONSCHECK DRAWING:
DWG NO.:
DESIGN BY: CHECK DESIGN:
LEAD ENGINEER: APPROVAL DATE:
PROJECT MANAGER: APPROVAL DATE:
REV. NO. DRAWN DESIGN CHECK REVISION / ISSUED DESCRIPTIONS
REV
ISIO
N IN
FOR
MAT
ION MM DD YY MM DD
THIS BAR
MEASU
RES 100 m
m AT FU
LL SIZE. ALL SCALES R
EFEREN
CED
TO FU
LL SIZE.
PROJECT:
TITLE:
CLIENT:
AN APPLIED EARTH SCIENCES COMPANY
APPROVEDGCB
0MPMC-XD-02-031:1,000
STAGE 10 MAIN EMBANKMENTCREST EL. 972.5 M PLAN
MOUNT POLLEY MINE TAILINGS STORAGE FACILITY0 07 GCB TM TM DD ISSUED FOR CONSTRUCTION
CJT/LS
TM BB
TM 2014/07/25
DD 2014/07/25
14 25
####
ISSUED FOR CONSTRUCTION
NOTES:1. ALL DIMENSIONS ARE IN METRES UNLESS OTHERWISE NOTED.2. THIS DRAWING IS TO BE READ IN CONJUNCTION WITH ACCOMPANYING DRAWINGS AND SPECIFICATIONS.
THE CONTRACTOR SHALL IMMEDIATELY NOTIFY THE ENGINEER SHOULD UNCERTAINTIES ARISE WITH THEDRAWINGS, SCOPE, AND/OR TECHNICAL SPECIFICATIONS.
3. BASE TOPOGRAPHIC DATA BASED ON FLYOVER DATA PROVIDED BY MPMC, DATED OCTOBER 2013.CONTOUR INTERVAL IS 1 m.
4. PROJECTION IS UTM NAD83 ZONE 10.5. UNLESS BGC AGREES OTHERWISE IN WRITING, THIS DRAWING SHALL NOT BE MODIFIED OR USED FOR ANY
PURPOSE OTHER THAN THE PURPOSE FOR WHICH BGC GENERATED IT. BGC SHALL HAVE NO LIABILITYFOR ANY DAMAGES OR LOSS ARISING IN ANY WAY FROM ANY USE OR MODIFICATION OF THIS DOCUMENTNOT AUTHORIZED BY BGC. ANY USE OF OR RELIANCE UPON THIS DOCUMENT OR ITS CONTENT BY THIRDPARTIES SHALL BE AT SUCH THIRD PARTIES' SOLE RISK.
E 59
5,500
E 59
5,500
E 59
5,750
E 59
5,750
E 59
6,000
E 59
6,000
E 59
6,250
E 59
6,250
N 5,818,250
N 5,818,250
N 5,818,500
N 5,818,500
N 5,818,750
N 5,818,750
m
BUTTRESS RAISE(EL. 931 m)
BUTTRESS RAISE(EL. 931 m TO 940 m)
2.25% GRADEBUTTRESS RAISE
(EL. 940 m TO 945 m)
1.65% GRADE
SLOPE TIES INTO EXISTINGBUTTRESS (SHOWN AT 1.3H:1V)
BUTTRESSGRADE BREAK
BUTTRESSGRADE BREAK
LEGENDSTATION MARKER
SLOPE VARIES (SHOWN AT 1.5H:1V)
SLOPE VARIES (SHOWN AT 1.3H:1V)
SLOPE VARIES (SHOWN AT 1.5H:1V)
SLOPE VARIES (SHOWN AT 1.3H:1V)
TOE DRAIN COLLECTION SUMP(TO BE RELOCATED OR EXTENDED)
DITCH
BUTTRESS LOCALLY NARROWED TOACCOMMODATE INFRASTRUCTURE
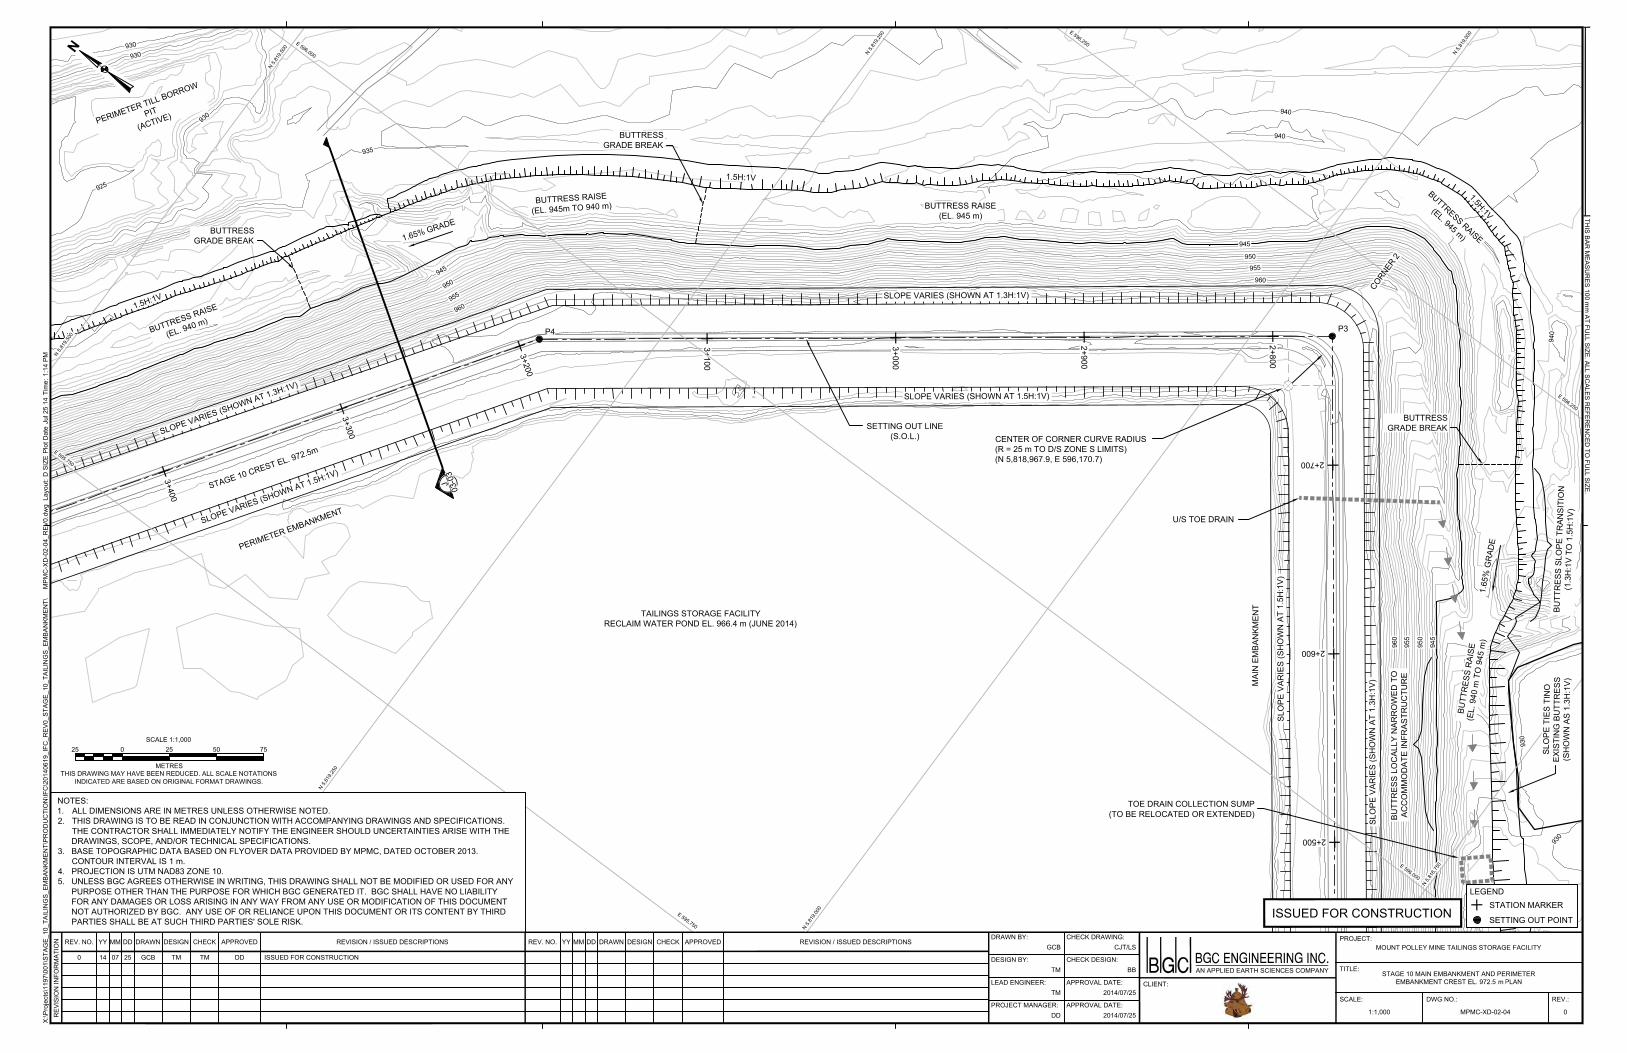
CORNER 2
2+500
2+600
2+700
2+800
2+900
3+000
3+100
3+200
3+300
3+400
P3P4
- -03
-03
J
TAILINGS STORAGE FACILITYRECLAIM WATER POND EL. 966.4 m (JUNE 2014)
MAI
N E
MBA
NKM
ENT
PERIMETER EMBANKMENT
PERIMETER TILL BORROW
PIT
(ACTIVE)
U/S TOE DRAIN
CENTER OF CORNER CURVE RADIUS(R = 25 m TO D/S ZONE S LIMITS)(N 5,818,967.9, E 596,170.7)
SETTING OUT LINE(S.O.L.)
STAGE 10 CREST EL. 972.5m
THIS DRAWING MAY HAVE BEEN REDUCED. ALL SCALE NOTATIONSINDICATED ARE BASED ON ORIGINAL FORMAT DRAWINGS.
0 755025SCALE 1:1,000
METRES
25
SCALE:
DRAWN BY:
REV.:
X:\P
roje
cts\
1197
\001
\STA
GE_
10_T
AILI
NG
S_EM
BAN
KMEN
T\PR
OD
UC
TIO
N\IF
C\2
0140
619_
IFC
_REV
0_ST
AGE_
10_T
AILI
NG
S_EM
BAN
KMEN
T\M
PMC
-XD
-02-
04_R
EV0.
dwg
Lay
out:
D S
IZE
Plo
t Dat
e Ju
l 25
14 T
ime:
1:1
4 PM
REV. NO. YY DRAWN DESIGN CHECK APPROVED REVISION / ISSUED DESCRIPTIONSCHECK DRAWING:
DWG NO.:
DESIGN BY: CHECK DESIGN:
LEAD ENGINEER: APPROVAL DATE:
PROJECT MANAGER: APPROVAL DATE:
REV. NO. DRAWN DESIGN CHECK REVISION / ISSUED DESCRIPTIONS
REV
ISIO
N IN
FOR
MAT
ION MM DD YY MM DD
THIS BAR
MEASU
RES 100 m
m AT FU
LL SIZE. ALL SCALES R
EFEREN
CED
TO FU
LL SIZE.
PROJECT:
TITLE:
CLIENT:
AN APPLIED EARTH SCIENCES COMPANY
APPROVEDGCB
0MPMC-XD-02-041:1,000
STAGE 10 MAIN EMBANKMENT AND PERIMETEREMBANKMENT CREST EL. 972.5 M PLAN
MOUNT POLLEY MINE TAILINGS STORAGE FACILITY0 07 GCB TM TM DD ISSUED FOR CONSTRUCTION
CJT/LS
TM BB
TM 2014/07/25
DD 2014/07/25
14 25
####
ISSUED FOR CONSTRUCTION
NOTES:1. ALL DIMENSIONS ARE IN METRES UNLESS OTHERWISE NOTED.2. THIS DRAWING IS TO BE READ IN CONJUNCTION WITH ACCOMPANYING DRAWINGS AND SPECIFICATIONS.
THE CONTRACTOR SHALL IMMEDIATELY NOTIFY THE ENGINEER SHOULD UNCERTAINTIES ARISE WITH THEDRAWINGS, SCOPE, AND/OR TECHNICAL SPECIFICATIONS.
3. BASE TOPOGRAPHIC DATA BASED ON FLYOVER DATA PROVIDED BY MPMC, DATED OCTOBER 2013.CONTOUR INTERVAL IS 1 m.
4. PROJECTION IS UTM NAD83 ZONE 10.5. UNLESS BGC AGREES OTHERWISE IN WRITING, THIS DRAWING SHALL NOT BE MODIFIED OR USED FOR ANY
PURPOSE OTHER THAN THE PURPOSE FOR WHICH BGC GENERATED IT. BGC SHALL HAVE NO LIABILITYFOR ANY DAMAGES OR LOSS ARISING IN ANY WAY FROM ANY USE OR MODIFICATION OF THIS DOCUMENTNOT AUTHORIZED BY BGC. ANY USE OF OR RELIANCE UPON THIS DOCUMENT OR ITS CONTENT BY THIRDPARTIES SHALL BE AT SUCH THIRD PARTIES' SOLE RISK.
E 595,750
E 595,750
E 596,000
E 596,000
E 596,250
E 596,250
N 5,81
8,750
N 5,81
9,000
N 5,81
9,000
N 5,81
9,250
N 5,81
9,250
N 5,81
9,500
N 5,81
9,500
m
BUTT
RES
S R
AISE
(EL.
940
m T
O 9
45 m
)1.
65%
GR
ADE
BUTTRESS RAISE
(EL. 945 m)
BUTTRESS RAISE(EL. 945 m)
BUTTRESS RAISE
(EL. 945m TO 940 m)
1.65% GRADE
BUTTRESS RAISE
(EL. 940 m)
SLO
PE T
IES
TIN
OEX
ISTI
NG
BU
TTR
ESS
(SH
OW
N A
S 1.
3H:1
V)
1.5H:1V
1.5H:1V
1.5H:1V
BUTTRESSGRADE BREAK
BUTTRESSGRADE BREAK
BUTTRESSGRADE BREAK
SLOPE VARIES (SHOWN AT 1.3H:1V)
LEGENDSTATION MARKER
SETTING OUT POINT
BUTT
RES
S SL
OPE
TR
ANSI
TIO
N(1
.3H
:1V
TO 1
.5H
:1V)
SLOPE VARIES (SHOWN AT 1.5H:1V)
SLOPE VARIES (SHOWN AT 1.3H:1V)
SLOPE VARIES (SHOWN AT 1.5H:1V)
SLO
PE V
ARIE
S (S
HO
WN
AT
1.3H
:1V)
SLO
PE V
ARIE
S (S
HO
WN
AT
1.5H
:1V)
TOE DRAIN COLLECTION SUMP(TO BE RELOCATED OR EXTENDED) BU
TTR
ESS
LOC
ALLY
NAR
RO
WED
TO
ACC
OM
MO
DAT
E IN
FRAS
TRU
CTU
RE
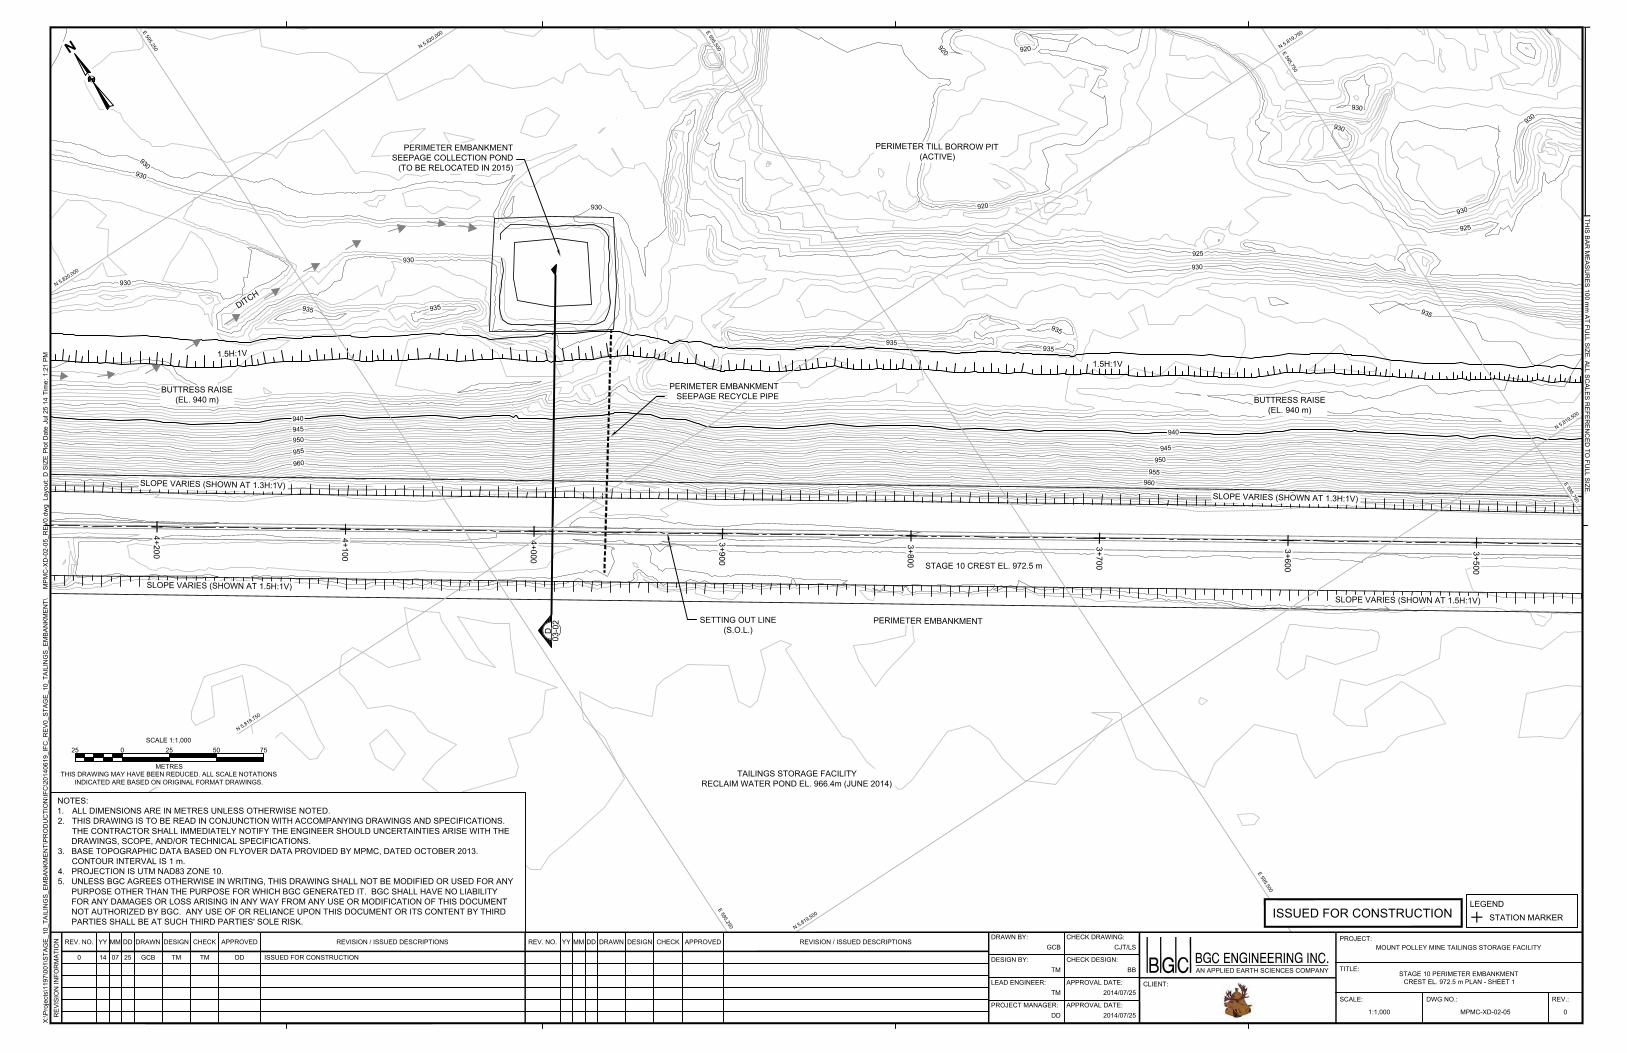
3+500
3+600
3+700
3+800
3+900
4+000
4+100
4+200
- -03
-02
D
TAILINGS STORAGE FACILITYRECLAIM WATER POND EL. 966.4m (JUNE 2014)
PERIMETER EMBANKMENT
PERIMETER EMBANKMENTSEEPAGE COLLECTION POND
(TO BE RELOCATED IN 2015)
PERIMETER TILL BORROW PIT(ACTIVE)
SETTING OUT LINE(S.O.L.)
STAGE 10 CREST EL. 972.5 m
PERIMETER EMBANKMENTSEEPAGE RECYCLE PIPE
SCALE:
DRAWN BY:
REV.:
X:\P
roje
cts\
1197
\001
\STA
GE_
10_T
AILI
NG
S_EM
BAN
KMEN
T\PR
OD
UC
TIO
N\IF
C\2
0140
619_
IFC
_REV
0_ST
AGE_
10_T
AILI
NG
S_EM
BAN
KMEN
T\M
PMC
-XD
-02-
05_R
EV0.
dwg
Lay
out:
D S
IZE
Plo
t Dat
e Ju
l 25
14 T
ime:
1:2
1 PM
REV. NO. YY DRAWN DESIGN CHECK APPROVED REVISION / ISSUED DESCRIPTIONSCHECK DRAWING:
DWG NO.:
DESIGN BY: CHECK DESIGN:
LEAD ENGINEER: APPROVAL DATE:
PROJECT MANAGER: APPROVAL DATE:
REV. NO. DRAWN DESIGN CHECK REVISION / ISSUED DESCRIPTIONS
REV
ISIO
N IN
FOR
MAT
ION MM DD YY MM DD
THIS BAR
MEASU
RES 100 m
m AT FU
LL SIZE. ALL SCALES R
EFEREN
CED
TO FU
LL SIZE.
PROJECT:
TITLE:
CLIENT:
AN APPLIED EARTH SCIENCES COMPANY
APPROVEDGCB
0MPMC-XD-02-051:1,000
STAGE 10 PERIMETER EMBANKMENTCREST EL. 972.5 M PLAN - SHEET 1
MOUNT POLLEY MINE TAILINGS STORAGE FACILITY0 07 GCB TM TM DD ISSUED FOR CONSTRUCTION
CJT/LS
TM BB
TM 2014/07/25
DD 2014/07/25
14 25
####
ISSUED FOR CONSTRUCTION
NOTES:1. ALL DIMENSIONS ARE IN METRES UNLESS OTHERWISE NOTED.2. THIS DRAWING IS TO BE READ IN CONJUNCTION WITH ACCOMPANYING DRAWINGS AND SPECIFICATIONS.
THE CONTRACTOR SHALL IMMEDIATELY NOTIFY THE ENGINEER SHOULD UNCERTAINTIES ARISE WITH THEDRAWINGS, SCOPE, AND/OR TECHNICAL SPECIFICATIONS.
3. BASE TOPOGRAPHIC DATA BASED ON FLYOVER DATA PROVIDED BY MPMC, DATED OCTOBER 2013.CONTOUR INTERVAL IS 1 m.
4. PROJECTION IS UTM NAD83 ZONE 10.5. UNLESS BGC AGREES OTHERWISE IN WRITING, THIS DRAWING SHALL NOT BE MODIFIED OR USED FOR ANY
PURPOSE OTHER THAN THE PURPOSE FOR WHICH BGC GENERATED IT. BGC SHALL HAVE NO LIABILITYFOR ANY DAMAGES OR LOSS ARISING IN ANY WAY FROM ANY USE OR MODIFICATION OF THIS DOCUMENTNOT AUTHORIZED BY BGC. ANY USE OF OR RELIANCE UPON THIS DOCUMENT OR ITS CONTENT BY THIRDPARTIES SHALL BE AT SUCH THIRD PARTIES' SOLE RISK.
E 595,250
E 595,250
E 595,500
E 595,500
E 595,750
E 595,750
N 5,819,500
N 5,819,500
N 5,819,750
N 5,819,750
N 5,820,000
N 5,820,000
THIS DRAWING MAY HAVE BEEN REDUCED. ALL SCALE NOTATIONSINDICATED ARE BASED ON ORIGINAL FORMAT DRAWINGS.
0 755025SCALE 1:1,000
METRES
25
m
BUTTRESS RAISE(EL. 940 m)
1.5H:1V1.5H:1V
BUTTRESS RAISE(EL. 940 m)
LEGENDSTATION MARKER
SLOPE VARIES (SHOWN AT 1.3H:1V)
SLOPE VARIES (SHOWN AT 1.5H:1V)
SLOPE VARIES (SHOWN AT 1.3H:1V)
SLOPE VARIES (SHOWN AT 1.5H:1V)
DITCH
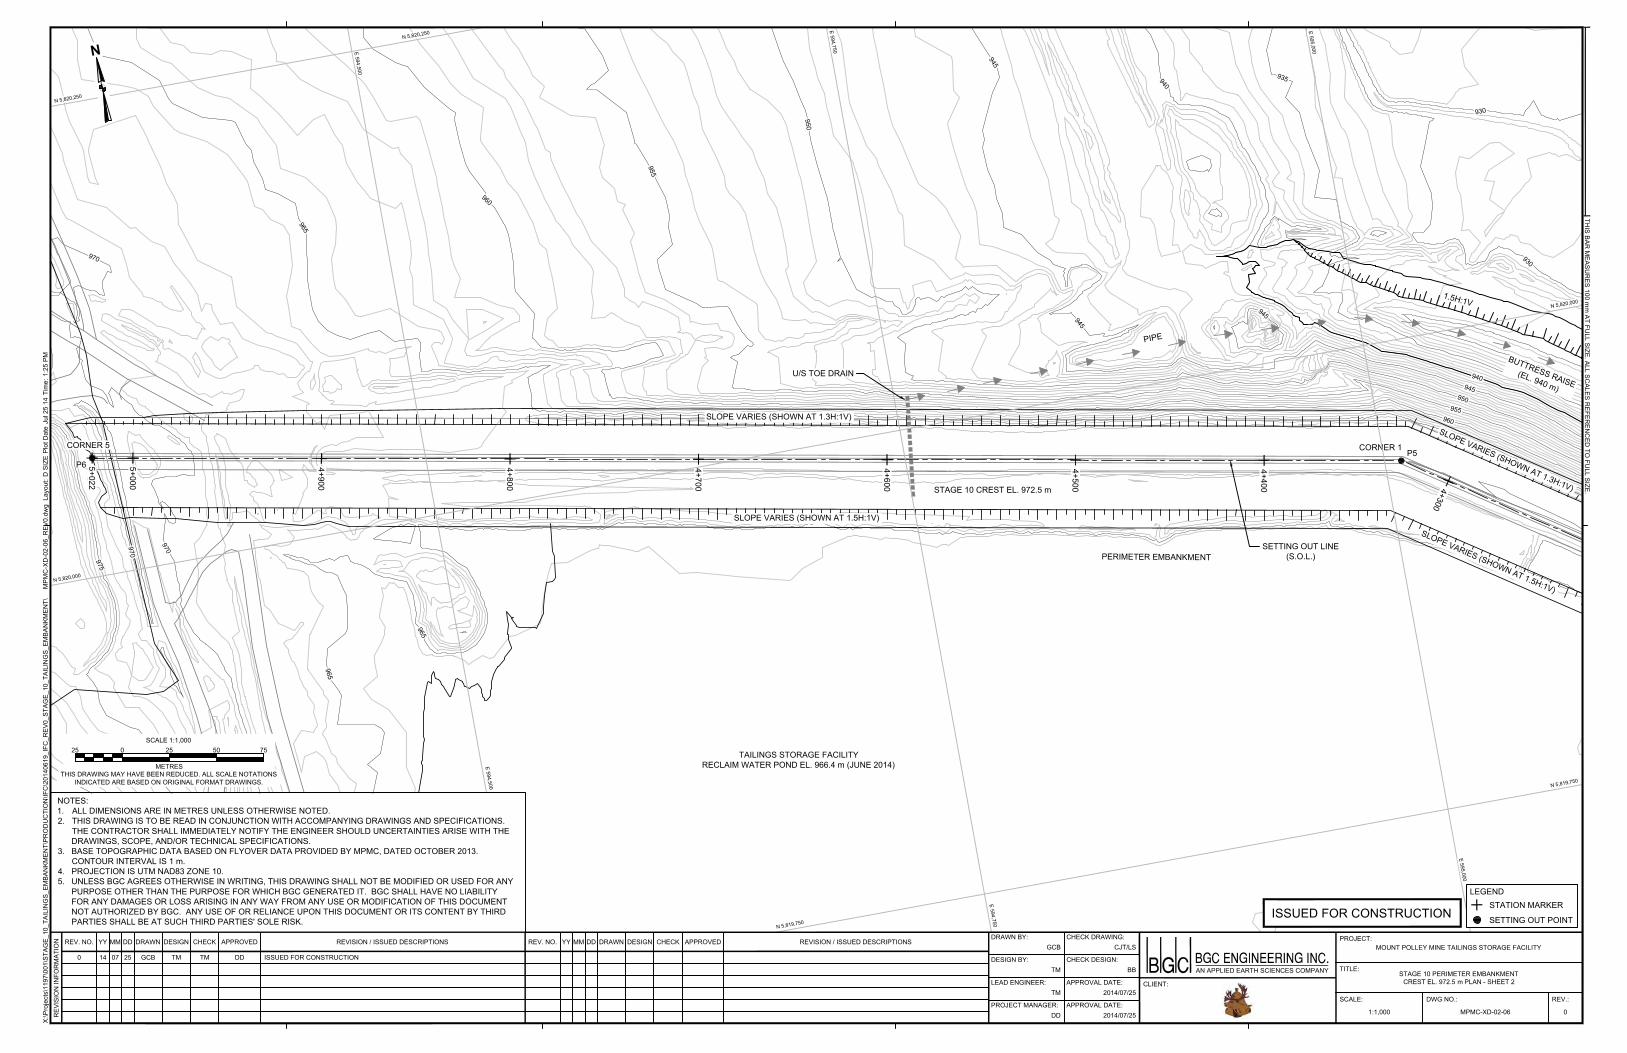
4+300
4+400
4+500
4+600
4+700
4+800
4+900
5+000
5+022
P5P6
CORNER 1
U/S TOE DRAIN
TAILINGS STORAGE FACILITYRECLAIM WATER POND EL. 966.4 m (JUNE 2014)
PERIMETER EMBANKMENTSETTING OUT LINE
(S.O.L.)
STAGE 10 CREST EL. 972.5 m
SCALE:
DRAWN BY:
REV.:
X:\P
roje
cts\
1197
\001
\STA
GE_
10_T
AILI
NG
S_EM
BAN
KMEN
T\PR
OD
UC
TIO
N\IF
C\2
0140
619_
IFC
_REV
0_ST
AGE_
10_T
AILI
NG
S_EM
BAN
KMEN
T\M
PMC
-XD
-02-
06_R
EV0.
dwg
Lay
out:
D S
IZE
Plo
t Dat
e Ju
l 25
14 T
ime:
1:2
5 PM
REV. NO. YY DRAWN DESIGN CHECK APPROVED REVISION / ISSUED DESCRIPTIONSCHECK DRAWING:
DWG NO.:
DESIGN BY: CHECK DESIGN:
LEAD ENGINEER: APPROVAL DATE:
PROJECT MANAGER: APPROVAL DATE:
REV. NO. DRAWN DESIGN CHECK REVISION / ISSUED DESCRIPTIONS
REV
ISIO
N IN
FOR
MAT
ION MM DD YY MM DD
THIS BAR
MEASU
RES 100 m
m AT FU
LL SIZE. ALL SCALES R
EFEREN
CED
TO FU
LL SIZE.
PROJECT:
TITLE:
CLIENT:
AN APPLIED EARTH SCIENCES COMPANY
APPROVEDGCB
0MPMC-XD-02-061:1,000
STAGE 10 PERIMETER EMBANKMENTCREST EL. 972.5 M PLAN - SHEET 2
MOUNT POLLEY MINE TAILINGS STORAGE FACILITY0 07 GCB TM TM DD ISSUED FOR CONSTRUCTION
CJT/LS
TM BB
TM 2014/07/25
DD 2014/07/25
14 25
####
ISSUED FOR CONSTRUCTION
NOTES:1. ALL DIMENSIONS ARE IN METRES UNLESS OTHERWISE NOTED.2. THIS DRAWING IS TO BE READ IN CONJUNCTION WITH ACCOMPANYING DRAWINGS AND SPECIFICATIONS.
THE CONTRACTOR SHALL IMMEDIATELY NOTIFY THE ENGINEER SHOULD UNCERTAINTIES ARISE WITH THEDRAWINGS, SCOPE, AND/OR TECHNICAL SPECIFICATIONS.
3. BASE TOPOGRAPHIC DATA BASED ON FLYOVER DATA PROVIDED BY MPMC, DATED OCTOBER 2013.CONTOUR INTERVAL IS 1 m.
4. PROJECTION IS UTM NAD83 ZONE 10.5. UNLESS BGC AGREES OTHERWISE IN WRITING, THIS DRAWING SHALL NOT BE MODIFIED OR USED FOR ANY
PURPOSE OTHER THAN THE PURPOSE FOR WHICH BGC GENERATED IT. BGC SHALL HAVE NO LIABILITYFOR ANY DAMAGES OR LOSS ARISING IN ANY WAY FROM ANY USE OR MODIFICATION OF THIS DOCUMENTNOT AUTHORIZED BY BGC. ANY USE OF OR RELIANCE UPON THIS DOCUMENT OR ITS CONTENT BY THIRDPARTIES SHALL BE AT SUCH THIRD PARTIES' SOLE RISK.
THIS DRAWING MAY HAVE BEEN REDUCED. ALL SCALE NOTATIONSINDICATED ARE BASED ON ORIGINAL FORMAT DRAWINGS.
0 755025SCALE 1:1,000
METRES
25
E 594,500
E 594,500
E 594,750
E 594,750
E 595,000
E 595,000
N 5,819,750
N 5,819,750
N 5,820,000
N 5,820,000
N 5,820,250
N 5,820,250
m
CORNER 5
BUTTRESS RAISE(EL. 940 m)
1.5H:1V
LEGENDSTATION MARKER
SETTING OUT POINT
SLOPE VARIES (SHOWN AT 1.5H:1V)
SLOPE VARIES (SHOWN AT 1.3H:1V)
SLOPE VARIES (SHOWN AT 1.5H:1V)
SLOPE VARIES (SHOWN AT 1.3H:1V)
PIPE
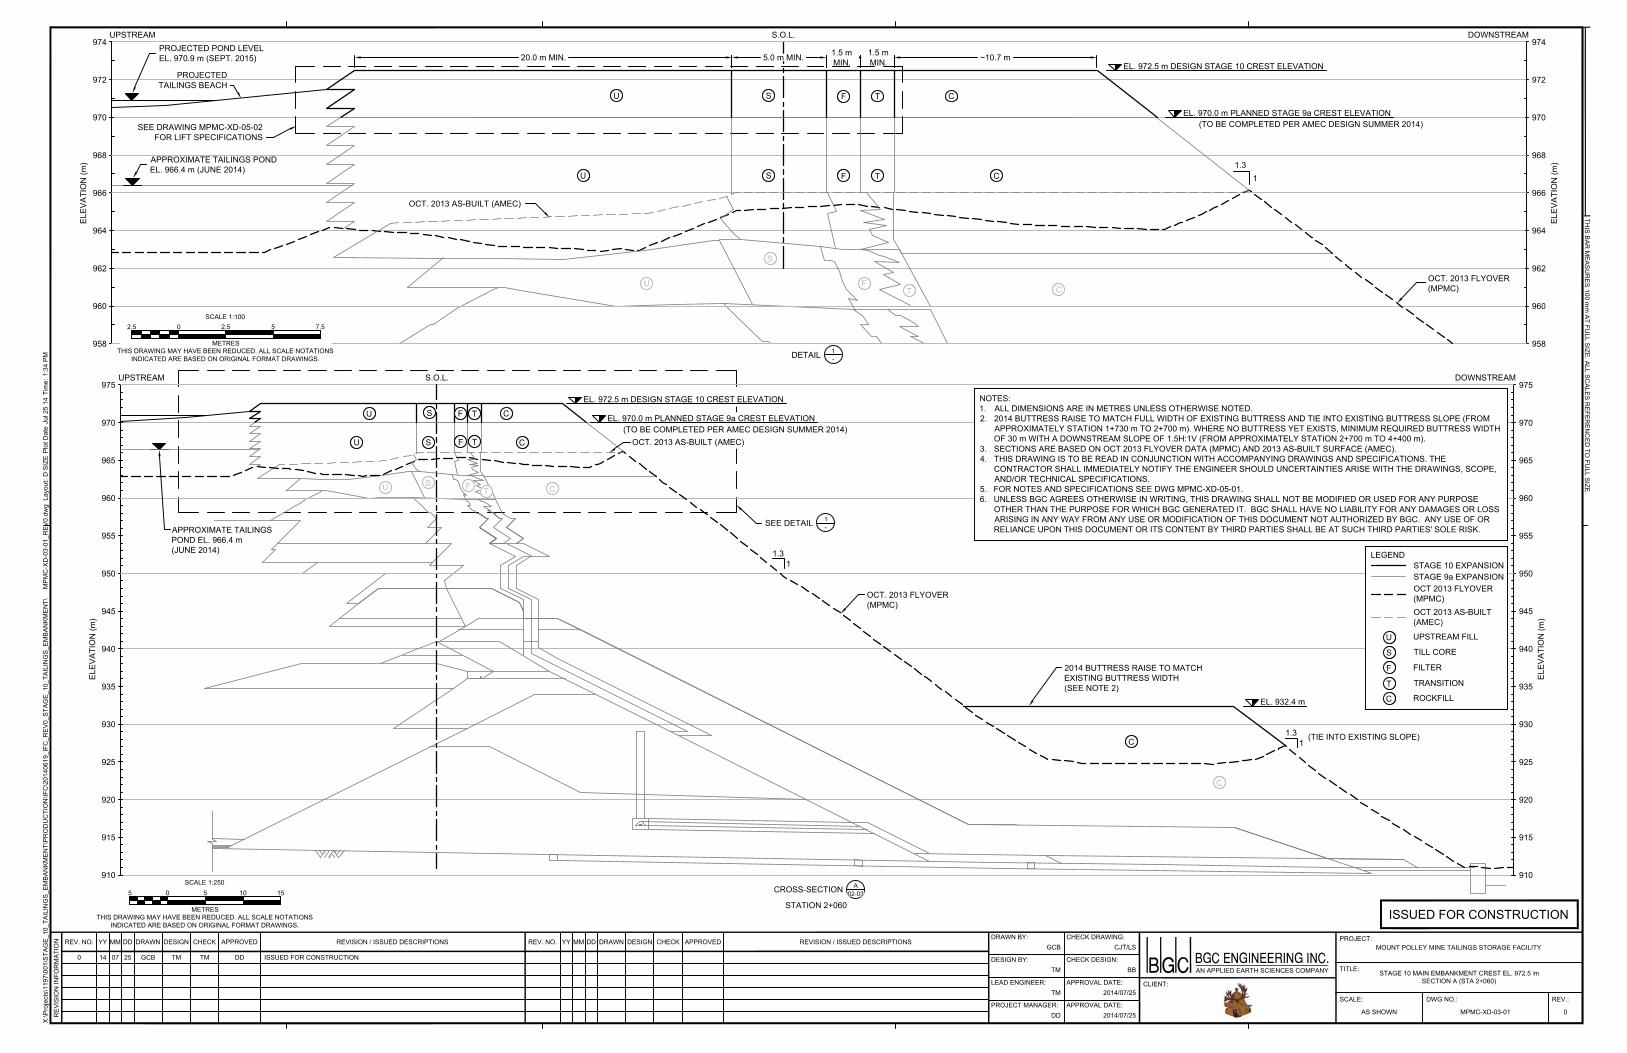
910
915
920
925
930
935
940
945
950
955
960
965
970
975
ELEV
ATIO
N (m
)
910
915
920
925
930
935
940
945
950
955
960
965
970
975
ELEV
ATIO
N (m
)
APPROXIMATE TAILINGSPOND EL. 966.4 m(JUNE 2014)
UPSTREAM DOWNSTREAM
2014 BUTTRESS RAISE TO MATCHEXISTING BUTTRESS WIDTH(SEE NOTE 2)
OCT. 2013 FLYOVER(MPMC)
S.O.L.
EL. 932.4 m
U S F T C
C
T
F
S
U UPSTREAM FILL
TILL CORE
FILTER
TRANSITION
ROCKFILL
OCT 2013 AS-BUILT(AMEC)
OCT 2013 FLYOVER(MPMC)
STAGE 9a EXPANSION
LEGEND1.31
U S F CT
CTFSU
STAGE 10 EXPANSION
C
C1.3
1
EL. 970.0 m PLANNED STAGE 9a CREST ELEVATION
EL. 972.5 m DESIGN STAGE 10 CREST ELEVATION
OCT. 2013 AS-BUILT (AMEC)
UPSTREAM
958
960
962
964
966
968
970
972
DOWNSTREAM
ELEV
ATIO
N (m
)
958
960
962
964
966
968
970
972
ELEV
ATIO
N (m
)
S.O.L.
EL. 970.0 m PLANNED STAGE 9a CREST ELEVATION
1.31
APPROXIMATE TAILINGS PONDEL. 966.4 m (JUNE 2014)
5.0 m MIN. 1.5 mMIN.
1.5 mMIN. ~10.7 m20.0 m MIN.
U S F T C
U
S
FT C
974 974
EL. 972.5 m DESIGN STAGE 10 CREST ELEVATION
U S F T C
OCT. 2013 FLYOVER(MPMC)
SEE DRAWING MPMC-XD-05-02FOR LIFT SPECIFICATIONS
OCT. 2013 AS-BUILT (AMEC)
PROJECTED POND LEVELEL. 970.9 m (SEPT. 2015)
ISSUED FOR CONSTRUCTION
SCALE:
DRAWN BY:
REV.:
X:\P
roje
cts\
1197
\001
\STA
GE_
10_T
AILI
NG
S_EM
BAN
KMEN
T\PR
OD
UC
TIO
N\IF
C\2
0140
619_
IFC
_REV
0_ST
AGE_
10_T
AILI
NG
S_EM
BAN
KMEN
T\M
PMC
-XD
-03-
01_R
EV0.
dwg
Lay
out:
D S
IZE
Plo
t Dat
e Ju
l 25
14 T
ime:
1:3
4 PM
REV. NO. YY DRAWN DESIGN CHECK APPROVED REVISION / ISSUED DESCRIPTIONSCHECK DRAWING:
DWG NO.:
DESIGN BY: CHECK DESIGN:
LEAD ENGINEER: APPROVAL DATE:
PROJECT MANAGER: APPROVAL DATE:
REV. NO. DRAWN DESIGN CHECK REVISION / ISSUED DESCRIPTIONS
REV
ISIO
N IN
FOR
MAT
ION MM DD YY MM DD
THIS BAR
MEASU
RES 100 m
m AT FU
LL SIZE. ALL SCALES R
EFEREN
CED
TO FU
LL SIZE.
PROJECT:
TITLE:
CLIENT:
AN APPLIED EARTH SCIENCES COMPANY
APPROVEDGCB
0MPMC-XD-03-01AS SHOWN
STAGE 10 MAIN EMBANKMENT CREST EL. 972.5 MSECTION A (STA 2+060)
MOUNT POLLEY MINE TAILINGS STORAGE FACILITY0 07 GCB TM TM DD ISSUED FOR CONSTRUCTION
CJT/LS
TM BB
TM 2014/07/25
DD 2014/07/25
14 25
####
NOTES:1. ALL DIMENSIONS ARE IN METRES UNLESS OTHERWISE NOTED.2. 2014 BUTTRESS RAISE TO MATCH FULL WIDTH OF EXISTING BUTTRESS AND TIE INTO EXISTING BUTTRESS SLOPE (FROM
APPROXIMATELY STATION 1+730 m TO 2+700 m). WHERE NO BUTTRESS YET EXISTS, MINIMUM REQUIRED BUTTRESS WIDTHOF 30 m WITH A DOWNSTREAM SLOPE OF 1.5H:1V (FROM APPROXIMATELY STATION 2+700 m TO 4+400 m).
3. SECTIONS ARE BASED ON OCT 2013 FLYOVER DATA (MPMC) AND 2013 AS-BUILT SURFACE (AMEC).4. THIS DRAWING IS TO BE READ IN CONJUNCTION WITH ACCOMPANYING DRAWINGS AND SPECIFICATIONS. THE
CONTRACTOR SHALL IMMEDIATELY NOTIFY THE ENGINEER SHOULD UNCERTAINTIES ARISE WITH THE DRAWINGS, SCOPE,AND/OR TECHNICAL SPECIFICATIONS.
5. FOR NOTES AND SPECIFICATIONS SEE DWG MPMC-XD-05-01.6. UNLESS BGC AGREES OTHERWISE IN WRITING, THIS DRAWING SHALL NOT BE MODIFIED OR USED FOR ANY PURPOSE
OTHER THAN THE PURPOSE FOR WHICH BGC GENERATED IT. BGC SHALL HAVE NO LIABILITY FOR ANY DAMAGES OR LOSSARISING IN ANY WAY FROM ANY USE OR MODIFICATION OF THIS DOCUMENT NOT AUTHORIZED BY BGC. ANY USE OF ORRELIANCE UPON THIS DOCUMENT OR ITS CONTENT BY THIRD PARTIES SHALL BE AT SUCH THIRD PARTIES' SOLE RISK.
CROSS-SECTION A02-03
DETAIL 1-
THIS DRAWING MAY HAVE BEEN REDUCED. ALL SCALE NOTATIONSINDICATED ARE BASED ON ORIGINAL FORMAT DRAWINGS.
0 105SCALE 1:250
METRES
5 15
THIS DRAWING MAY HAVE BEEN REDUCED. ALL SCALE NOTATIONSINDICATED ARE BASED ON ORIGINAL FORMAT DRAWINGS.
0
METRES
7.552.5SCALE 1:100
2.5
SEE DETAIL 1-
STATION 2+060
(TIE INTO EXISTING SLOPE)
(TO BE COMPLETED PER AMEC DESIGN SUMMER 2014)
m
(TO BE COMPLETED PER AMEC DESIGN SUMMER 2014)
PROJECTEDTAILINGS BEACH
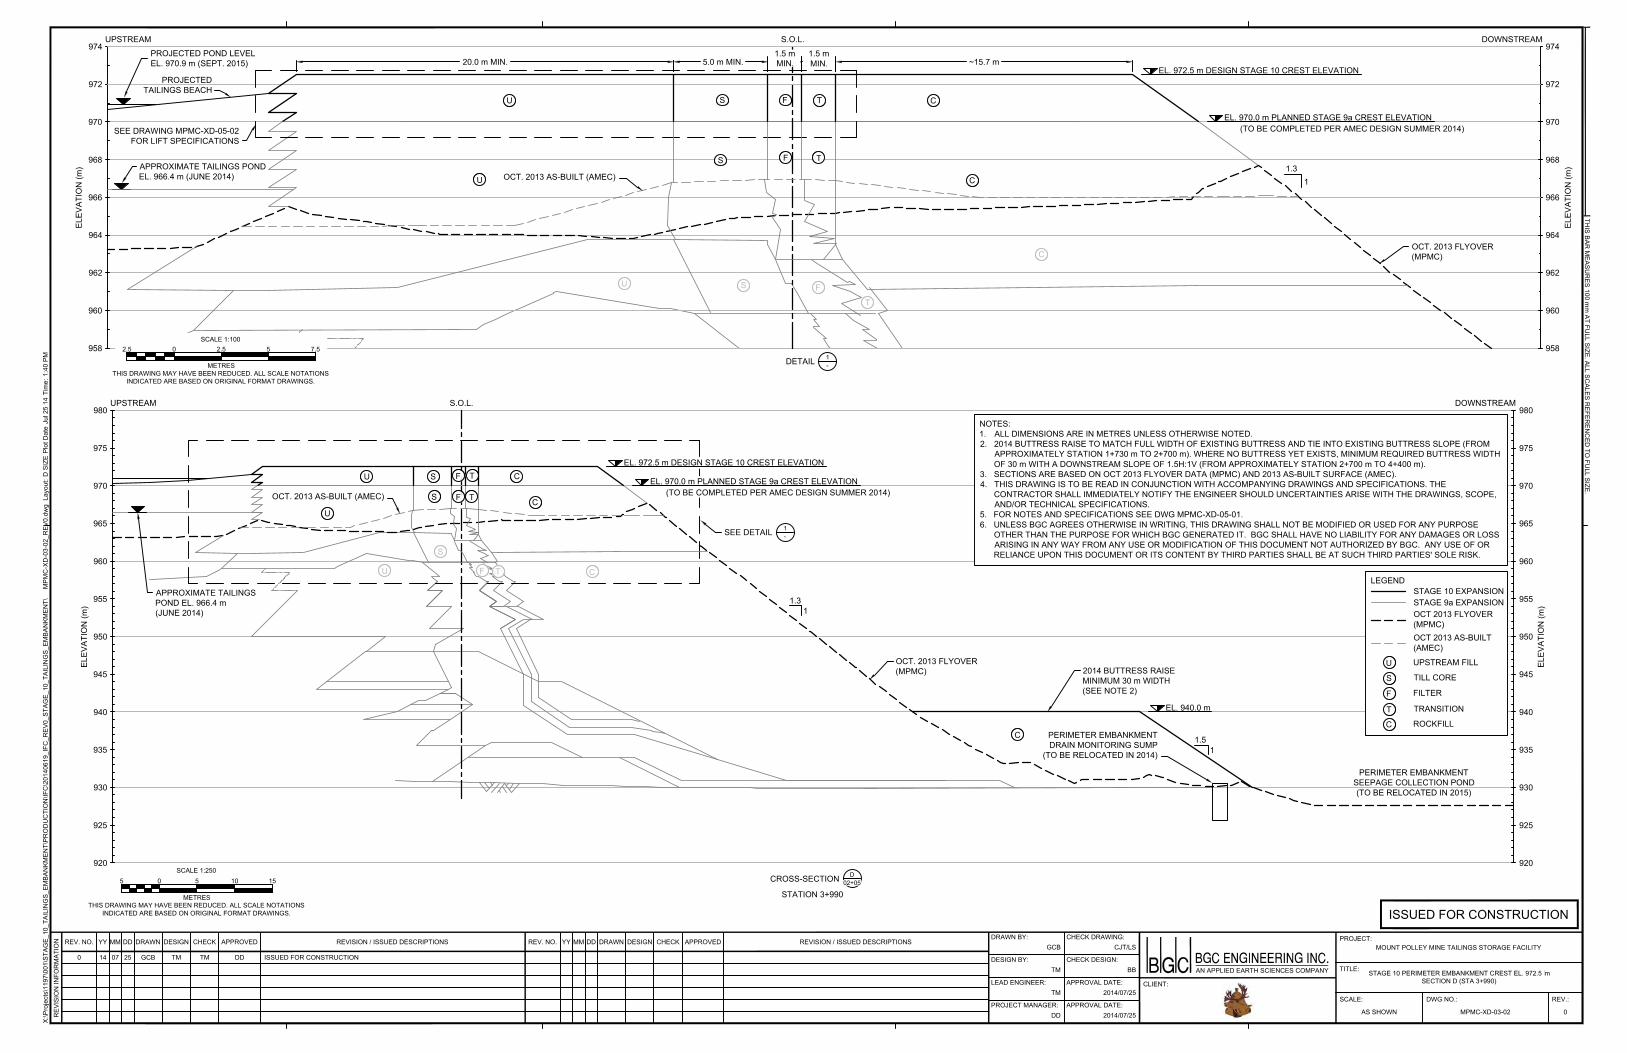
920
925
930
935
940
945
950
955
960
965
970
975
ELEV
ATIO
N (m
)
980DOWNSTREAM
920
925
930
935
940
945
950
955
960
965
970
975
ELEV
ATIO
N (m
)
980UPSTREAM S.O.L.
1.31
OCT. 2013 FLYOVER(MPMC)
APPROXIMATE TAILINGSPOND EL. 966.4 m(JUNE 2014)
U
S T C
PERIMETER EMBANKMENTDRAIN MONITORING SUMP
(TO BE RELOCATED IN 2014)
PERIMETER EMBANKMENTSEEPAGE COLLECTION POND(TO BE RELOCATED IN 2015)
U
S
C
SU CT
2014 BUTTRESS RAISEMINIMUM 30 m WIDTH(SEE NOTE 2)
C
EL. 940.0 m
1.51
EL. 972.5 m DESIGN STAGE 10 CREST ELEVATION
EL. 970.0 m PLANNED STAGE 9a CREST ELEVATION
TF
F
F
C
T
F
S
U UPSTREAM FILL
TILL CORE
FILTER
TRANSITION
ROCKFILL
LEGEND
OCT. 2013 AS-BUILT (AMEC)
OCT 2013 AS-BUILT(AMEC)
OCT 2013 FLYOVER(MPMC)
STAGE 9a EXPANSIONSTAGE 10 EXPANSION
DOWNSTREAM
958
960
962
964
966
968
970
972
ELEV
ATIO
N (m
)
UPSTREAM
958
960
962
964
966
968
970
972EL
EVAT
ION
(m)
U
S
C
U S
C
EL. 970.0 m PLANNED STAGE 9a CREST ELEVATION
1.31
5.0 m MIN.1.5 mMIN.
1.5 mMIN. ~15.7 m20.0 m MIN.
S.O.L.974 974
U S C
EL. 972.5 m DESIGN STAGE 10 CREST ELEVATION
OCT. 2013 FLYOVER(MPMC)
APPROXIMATE TAILINGS PONDEL. 966.4 m (JUNE 2014)
F
T
F T
TF
OCT. 2013 AS-BUILT (AMEC)
SEE DRAWING MPMC-XD-05-02FOR LIFT SPECIFICATIONS
PROJECTED POND LEVELEL. 970.9 m (SEPT. 2015)
PROJECTEDTAILINGS BEACH
ISSUED FOR CONSTRUCTION
SCALE:
DRAWN BY:
REV.:
X:\P
roje
cts\
1197
\001
\STA
GE_
10_T
AILI
NG
S_EM
BAN
KMEN
T\PR
OD
UC
TIO
N\IF
C\2
0140
619_
IFC
_REV
0_ST
AGE_
10_T
AILI
NG
S_EM
BAN
KMEN
T\M
PMC
-XD
-03-
02_R
EV0.
dwg
Lay
out:
D S
IZE
Plo
t Dat
e Ju
l 25
14 T
ime:
1:4
0 PM
REV. NO. YY DRAWN DESIGN CHECK APPROVED REVISION / ISSUED DESCRIPTIONSCHECK DRAWING:
DWG NO.:
DESIGN BY: CHECK DESIGN:
LEAD ENGINEER: APPROVAL DATE:
PROJECT MANAGER: APPROVAL DATE:
REV. NO. DRAWN DESIGN CHECK REVISION / ISSUED DESCRIPTIONS
REV
ISIO
N IN
FOR
MAT
ION MM DD YY MM DD
THIS BAR
MEASU
RES 100 m
m AT FU
LL SIZE. ALL SCALES R
EFEREN
CED
TO FU
LL SIZE.
PROJECT:
TITLE:
CLIENT:
AN APPLIED EARTH SCIENCES COMPANY
APPROVEDGCB
0MPMC-XD-03-02AS SHOWN
STAGE 10 PERIMETER EMBANKMENT CREST EL. 972.5 MSECTION D (STA 3+990)
MOUNT POLLEY MINE TAILINGS STORAGE FACILITY0 07 GCB TM TM DD ISSUED FOR CONSTRUCTION
CJT/LS
TM BB
TM 2014/07/25
DD 2014/07/25
14 25
####
CROSS-SECTION D02+05
DETAIL 1-
THIS DRAWING MAY HAVE BEEN REDUCED. ALL SCALE NOTATIONSINDICATED ARE BASED ON ORIGINAL FORMAT DRAWINGS.
0 105SCALE 1:250
METRES
5 15
THIS DRAWING MAY HAVE BEEN REDUCED. ALL SCALE NOTATIONSINDICATED ARE BASED ON ORIGINAL FORMAT DRAWINGS.
0
METRES
7.552.5SCALE 1:100
2.5
SEE DETAIL 1-
STATION 3+990
m
(TO BE COMPLETED PER AMEC DESIGN SUMMER 2014)
(TO BE COMPLETED PER AMEC DESIGN SUMMER 2014)
NOTES:1. ALL DIMENSIONS ARE IN METRES UNLESS OTHERWISE NOTED.2. 2014 BUTTRESS RAISE TO MATCH FULL WIDTH OF EXISTING BUTTRESS AND TIE INTO EXISTING BUTTRESS SLOPE (FROM
APPROXIMATELY STATION 1+730 m TO 2+700 m). WHERE NO BUTTRESS YET EXISTS, MINIMUM REQUIRED BUTTRESS WIDTHOF 30 m WITH A DOWNSTREAM SLOPE OF 1.5H:1V (FROM APPROXIMATELY STATION 2+700 m TO 4+400 m).
3. SECTIONS ARE BASED ON OCT 2013 FLYOVER DATA (MPMC) AND 2013 AS-BUILT SURFACE (AMEC).4. THIS DRAWING IS TO BE READ IN CONJUNCTION WITH ACCOMPANYING DRAWINGS AND SPECIFICATIONS. THE
CONTRACTOR SHALL IMMEDIATELY NOTIFY THE ENGINEER SHOULD UNCERTAINTIES ARISE WITH THE DRAWINGS, SCOPE,AND/OR TECHNICAL SPECIFICATIONS.
5. FOR NOTES AND SPECIFICATIONS SEE DWG MPMC-XD-05-01.6. UNLESS BGC AGREES OTHERWISE IN WRITING, THIS DRAWING SHALL NOT BE MODIFIED OR USED FOR ANY PURPOSE
OTHER THAN THE PURPOSE FOR WHICH BGC GENERATED IT. BGC SHALL HAVE NO LIABILITY FOR ANY DAMAGES OR LOSSARISING IN ANY WAY FROM ANY USE OR MODIFICATION OF THIS DOCUMENT NOT AUTHORIZED BY BGC. ANY USE OF ORRELIANCE UPON THIS DOCUMENT OR ITS CONTENT BY THIRD PARTIES SHALL BE AT SUCH THIRD PARTIES' SOLE RISK.
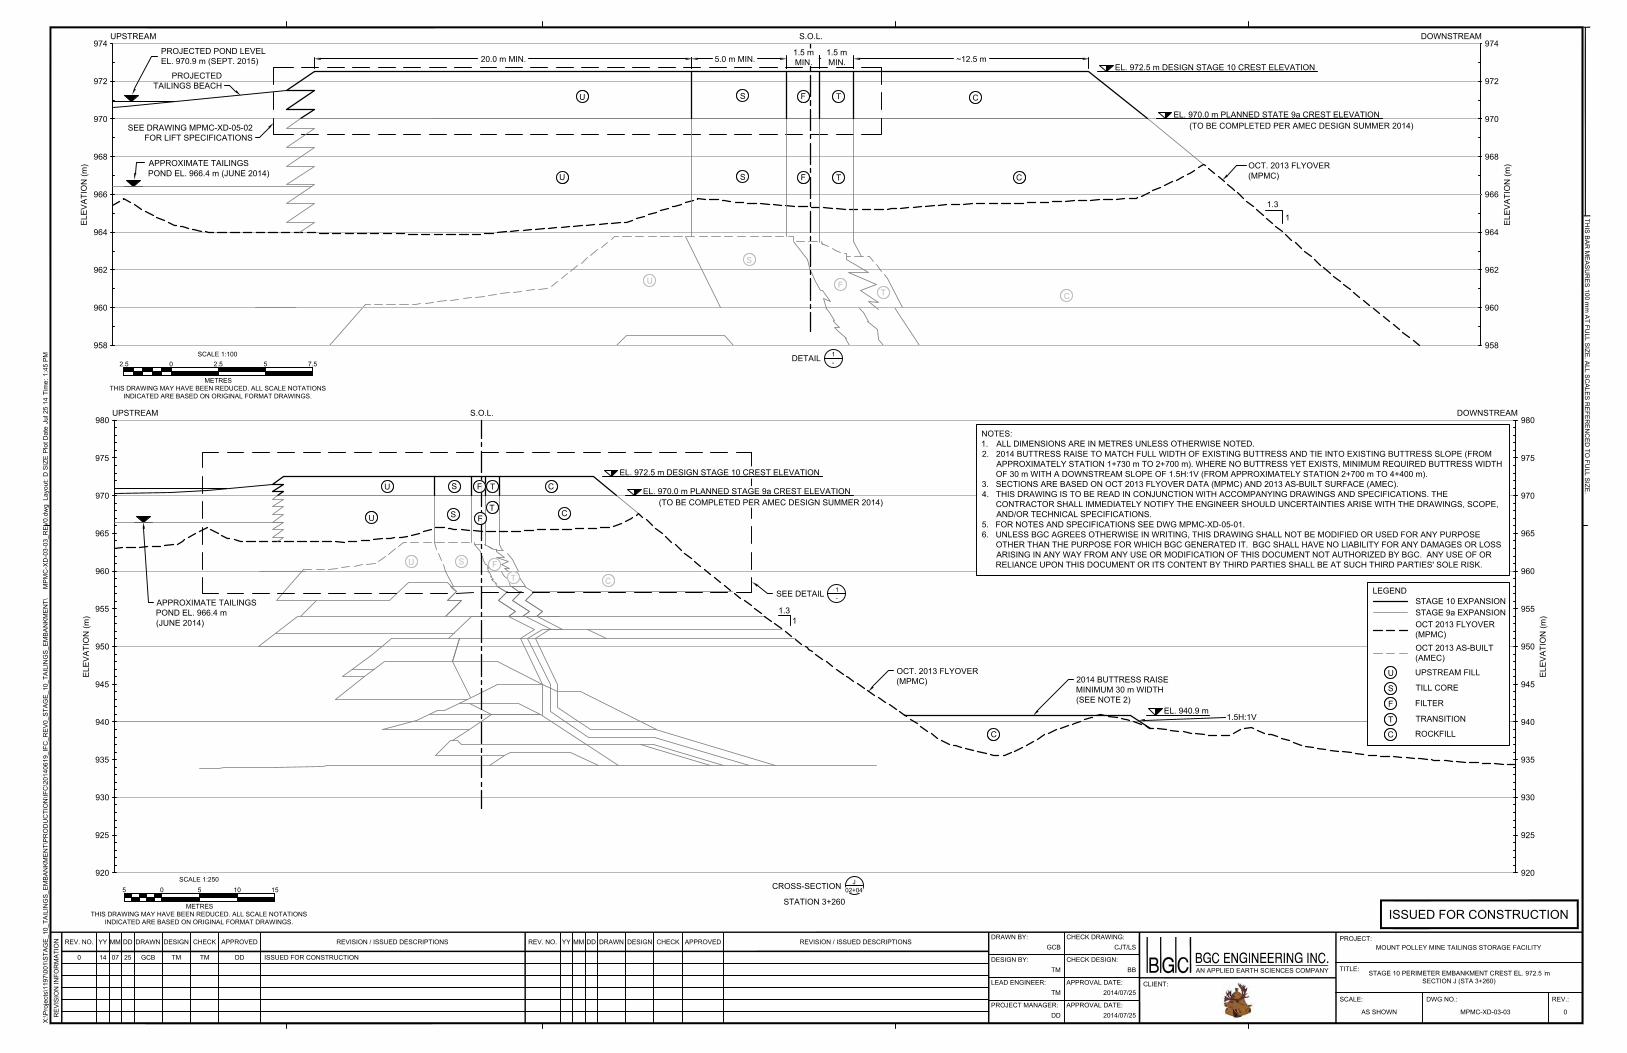
920
925
930
935
940
945
950
955
960
965
970
975
ELEV
ATIO
N (m
)
980DOWNSTREAM
920
925
930
935
940
945
950
955
960
965
970
975
ELEV
ATIO
N (m
)
980UPSTREAM
U S FT C
U S FT C
1.31
OCT. 2013 FLYOVER(MPMC)
APPROXIMATE TAILINGSPOND EL. 966.4 m(JUNE 2014)
S.O.L.
CS F TU
2014 BUTTRESS RAISEMINIMUM 30 m WIDTH(SEE NOTE 2)
EL. 940.9 m
C
EL. 972.5 m DESIGN STAGE 10 CREST ELEVATION
EL. 970.0 m PLANNED STAGE 9a CREST ELEVATION
1.5H:1V
C
T
F
S
U UPSTREAM FILL
TILL CORE
FILTER
TRANSITION
ROCKFILL
LEGEND
OCT 2013 AS-BUILT(AMEC)
OCT 2013 FLYOVER(MPMC)
STAGE 9a EXPANSIONSTAGE 10 EXPANSION
DOWNSTREAM
958
960
962
964
966
968
970
972
ELEV
ATIO
N (m
)
958
960
962
964
966
968
970
972EL
EVAT
ION
(m)
U S F T C
U
S
FT C
1.31
APPROXIMATE TAILINGSPOND EL. 966.4 m (JUNE 2014)
S.O.L.
EL. 970.0 m PLANNED STATE 9a CREST ELEVATION
5.0 m MIN.1.5 mMIN.
1.5 mMIN. ~12.5 m20.0 m MIN.
974974UPSTREAM
EL. 972.5 m DESIGN STAGE 10 CREST ELEVATION
CU S F T
OCT. 2013 FLYOVER(MPMC)
SEE DRAWING MPMC-XD-05-02FOR LIFT SPECIFICATIONS
PROJECTED POND LEVELEL. 970.9 m (SEPT. 2015)
PROJECTEDTAILINGS BEACH
ISSUED FOR CONSTRUCTION
SCALE:
DRAWN BY:
REV.:
X:\P
roje
cts\
1197
\001
\STA
GE_
10_T
AILI
NG
S_EM
BAN
KMEN
T\PR
OD
UC
TIO
N\IF
C\2
0140
619_
IFC
_REV
0_ST
AGE_
10_T
AILI
NG
S_EM
BAN
KMEN
T\M
PMC
-XD
-03-
03_R
EV0.
dwg
Lay
out:
D S
IZE
Plo
t Dat
e Ju
l 25
14 T
ime:
1:4
5 PM
REV. NO. YY DRAWN DESIGN CHECK APPROVED REVISION / ISSUED DESCRIPTIONSCHECK DRAWING:
DWG NO.:
DESIGN BY: CHECK DESIGN:
LEAD ENGINEER: APPROVAL DATE:
PROJECT MANAGER: APPROVAL DATE:
REV. NO. DRAWN DESIGN CHECK REVISION / ISSUED DESCRIPTIONS
REV
ISIO
N IN
FOR
MAT
ION MM DD YY MM DD
THIS BAR
MEASU
RES 100 m
m AT FU
LL SIZE. ALL SCALES R
EFEREN
CED
TO FU
LL SIZE.
PROJECT:
TITLE:
CLIENT:
AN APPLIED EARTH SCIENCES COMPANY
APPROVEDGCB
0MPMC-XD-03-03AS SHOWN
STAGE 10 PERIMETER EMBANKMENT CREST EL. 972.5 MSECTION J (STA 3+260)
MOUNT POLLEY MINE TAILINGS STORAGE FACILITY0 07 GCB TM TM DD ISSUED FOR CONSTRUCTION
CJT/LS
TM BB
TM 2014/07/25
DD 2014/07/25
14 25
####
CROSS-SECTION J02+04
DETAIL 1-
THIS DRAWING MAY HAVE BEEN REDUCED. ALL SCALE NOTATIONSINDICATED ARE BASED ON ORIGINAL FORMAT DRAWINGS.
0 105SCALE 1:250
METRES
5 15
THIS DRAWING MAY HAVE BEEN REDUCED. ALL SCALE NOTATIONSINDICATED ARE BASED ON ORIGINAL FORMAT DRAWINGS.
0
METRES
7.552.5SCALE 1:100
2.5
SEE DETAIL 1-
STATION 3+260
m
(TO BE COMPLETED PER AMEC DESIGN SUMMER 2014)
(TO BE COMPLETED PER AMEC DESIGN SUMMER 2014)
NOTES:1. ALL DIMENSIONS ARE IN METRES UNLESS OTHERWISE NOTED.2. 2014 BUTTRESS RAISE TO MATCH FULL WIDTH OF EXISTING BUTTRESS AND TIE INTO EXISTING BUTTRESS SLOPE (FROM
APPROXIMATELY STATION 1+730 m TO 2+700 m). WHERE NO BUTTRESS YET EXISTS, MINIMUM REQUIRED BUTTRESS WIDTHOF 30 m WITH A DOWNSTREAM SLOPE OF 1.5H:1V (FROM APPROXIMATELY STATION 2+700 m TO 4+400 m).
3. SECTIONS ARE BASED ON OCT 2013 FLYOVER DATA (MPMC) AND 2013 AS-BUILT SURFACE (AMEC).4. THIS DRAWING IS TO BE READ IN CONJUNCTION WITH ACCOMPANYING DRAWINGS AND SPECIFICATIONS. THE
CONTRACTOR SHALL IMMEDIATELY NOTIFY THE ENGINEER SHOULD UNCERTAINTIES ARISE WITH THE DRAWINGS, SCOPE,AND/OR TECHNICAL SPECIFICATIONS.
5. FOR NOTES AND SPECIFICATIONS SEE DWG MPMC-XD-05-01.6. UNLESS BGC AGREES OTHERWISE IN WRITING, THIS DRAWING SHALL NOT BE MODIFIED OR USED FOR ANY PURPOSE
OTHER THAN THE PURPOSE FOR WHICH BGC GENERATED IT. BGC SHALL HAVE NO LIABILITY FOR ANY DAMAGES OR LOSSARISING IN ANY WAY FROM ANY USE OR MODIFICATION OF THIS DOCUMENT NOT AUTHORIZED BY BGC. ANY USE OF ORRELIANCE UPON THIS DOCUMENT OR ITS CONTENT BY THIRD PARTIES SHALL BE AT SUCH THIRD PARTIES' SOLE RISK.
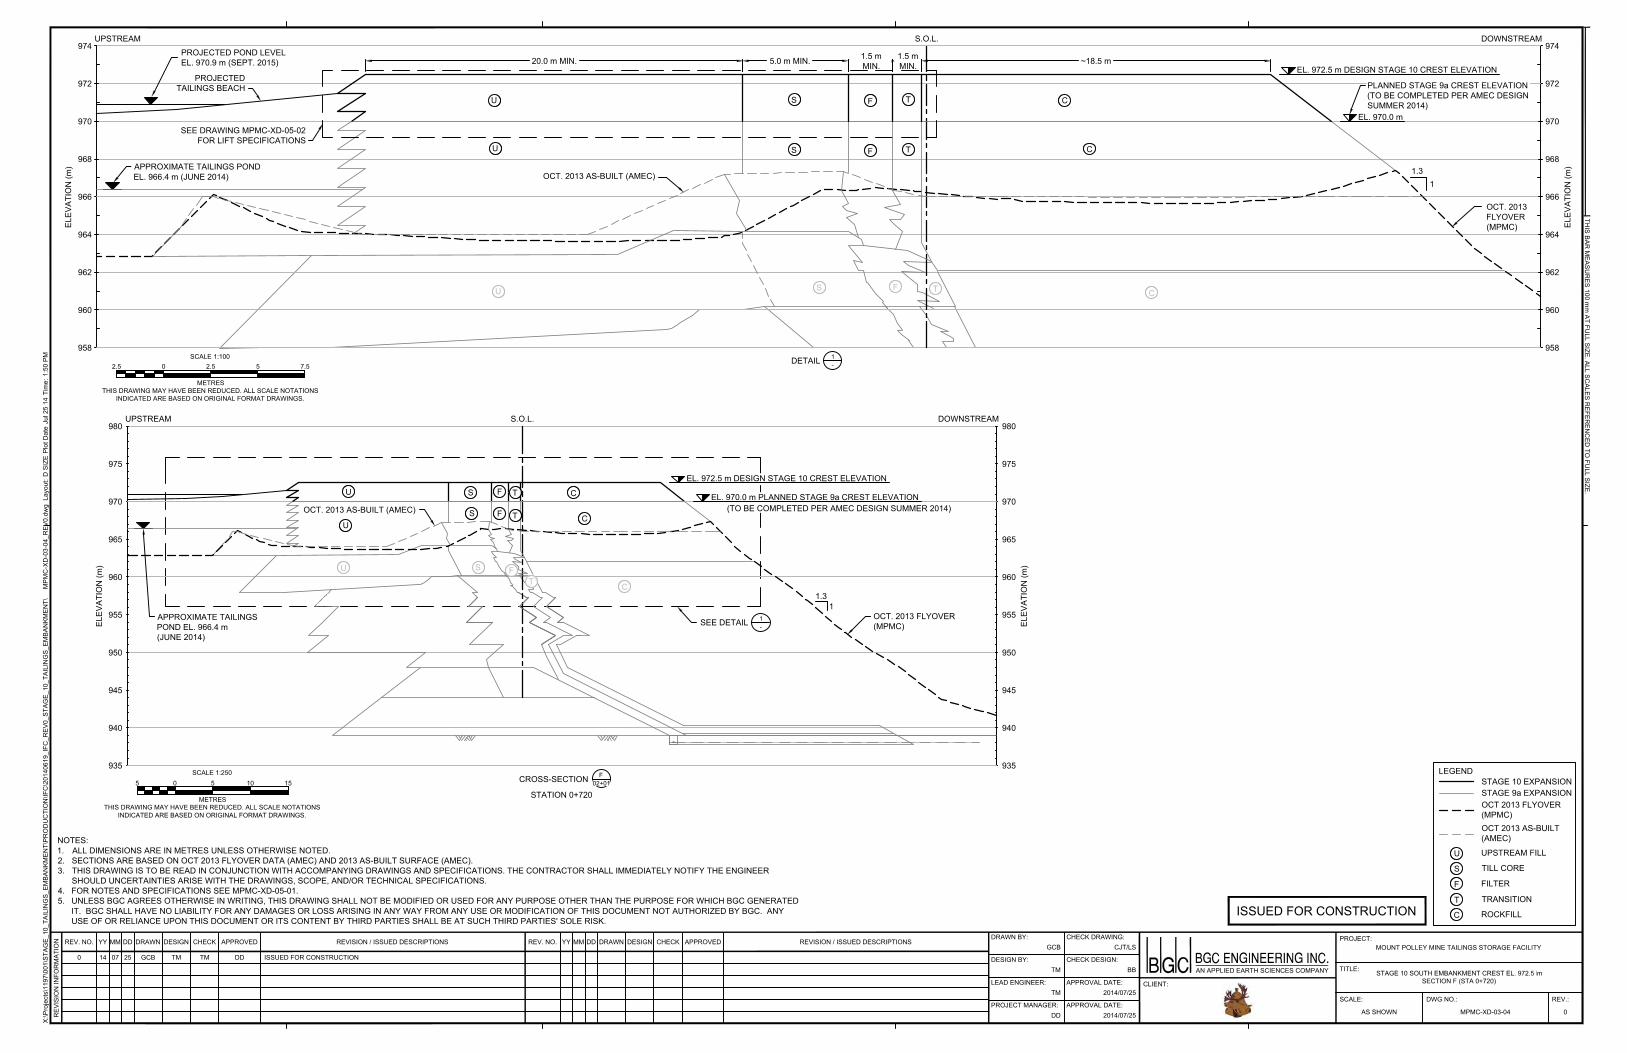
935
940
945
950
955
960
965
970
975
ELEV
ATIO
N (m
)
980UPSTREAM
935
940
945
950
955
960
965
970
975
ELEV
ATIO
N (m
)
980DOWNSTREAM
1.31
OCT. 2013 FLYOVER(MPMC)
S.O.L.
APPROXIMATE TAILINGSPOND EL. 966.4 m(JUNE 2014)
US F T C
U S FT C
CU S F T EL. 970.0 m PLANNED STAGE 9a CREST ELEVATION
EL. 972.5 m DESIGN STAGE 10 CREST ELEVATION
C
T
F
S
U UPSTREAM FILL
TILL CORE
FILTER
TRANSITION
ROCKFILL
LEGEND
OCT. 2013 AS-BUILT (AMEC)
OCT 2013 AS-BUILT(AMEC)
OCT 2013 FLYOVER(MPMC)
STAGE 9a EXPANSIONSTAGE 10 EXPANSION
S.O.L. DOWNSTREAM
958
960
962
964
966
968
970
972
ELEV
ATIO
N (m
)
UPSTREAM
958
960
962
964
966
968
970
972
ELEV
ATIO
N (m
) 1.31
EL. 970.0 m
PLANNED STAGE 9a CREST ELEVATION
5.0 m MIN. 1.5 mMIN.
1.5 mMIN. ~18.5 m20.0 m MIN.
U S F T C
U S F T C
974974
U S F T C
EL. 972.5 m DESIGN STAGE 10 CREST ELEVATION
OCT. 2013FLYOVER(MPMC)
OCT. 2013 AS-BUILT (AMEC)APPROXIMATE TAILINGS PONDEL. 966.4 m (JUNE 2014)
SEE DRAWING MPMC-XD-05-02FOR LIFT SPECIFICATIONS
PROJECTED POND LEVELEL. 970.9 m (SEPT. 2015)
PROJECTEDTAILINGS BEACH
ISSUED FOR CONSTRUCTION
SCALE:
DRAWN BY:
REV.:
X:\P
roje
cts\
1197
\001
\STA
GE_
10_T
AILI
NG
S_EM
BAN
KMEN
T\PR
OD
UC
TIO
N\IF
C\2
0140
619_
IFC
_REV
0_ST
AGE_
10_T
AILI
NG
S_EM
BAN
KMEN
T\M
PMC
-XD
-03-
04_R
EV0.
dwg
Lay
out:
D S
IZE
Plo
t Dat
e Ju
l 25
14 T
ime:
1:5
0 PM
REV. NO. YY DRAWN DESIGN CHECK APPROVED REVISION / ISSUED DESCRIPTIONSCHECK DRAWING:
DWG NO.:
DESIGN BY: CHECK DESIGN:
LEAD ENGINEER: APPROVAL DATE:
PROJECT MANAGER: APPROVAL DATE:
REV. NO. DRAWN DESIGN CHECK REVISION / ISSUED DESCRIPTIONS
REV
ISIO
N IN
FOR
MAT
ION MM DD YY MM DD
THIS BAR
MEASU
RES 100 m
m AT FU
LL SIZE. ALL SCALES R
EFEREN
CED
TO FU
LL SIZE.
PROJECT:
TITLE:
CLIENT:
AN APPLIED EARTH SCIENCES COMPANY
APPROVEDGCB
0MPMC-XD-03-04AS SHOWN
STAGE 10 SOUTH EMBANKMENT CREST EL. 972.5 MSECTION F (STA 0+720)
MOUNT POLLEY MINE TAILINGS STORAGE FACILITY0 07 GCB TM TM DD ISSUED FOR CONSTRUCTION
CJT/LS
TM BB
TM 2014/07/25
DD 2014/07/25
14 25
####
NOTES:1. ALL DIMENSIONS ARE IN METRES UNLESS OTHERWISE NOTED.2. SECTIONS ARE BASED ON OCT 2013 FLYOVER DATA (AMEC) AND 2013 AS-BUILT SURFACE (AMEC).3. THIS DRAWING IS TO BE READ IN CONJUNCTION WITH ACCOMPANYING DRAWINGS AND SPECIFICATIONS. THE CONTRACTOR SHALL IMMEDIATELY NOTIFY THE ENGINEER
SHOULD UNCERTAINTIES ARISE WITH THE DRAWINGS, SCOPE, AND/OR TECHNICAL SPECIFICATIONS.4. FOR NOTES AND SPECIFICATIONS SEE MPMC-XD-05-01.5. UNLESS BGC AGREES OTHERWISE IN WRITING, THIS DRAWING SHALL NOT BE MODIFIED OR USED FOR ANY PURPOSE OTHER THAN THE PURPOSE FOR WHICH BGC GENERATED
IT. BGC SHALL HAVE NO LIABILITY FOR ANY DAMAGES OR LOSS ARISING IN ANY WAY FROM ANY USE OR MODIFICATION OF THIS DOCUMENT NOT AUTHORIZED BY BGC. ANYUSE OF OR RELIANCE UPON THIS DOCUMENT OR ITS CONTENT BY THIRD PARTIES SHALL BE AT SUCH THIRD PARTIES' SOLE RISK.
CROSS-SECTION F02+01
DETAIL 1-
THIS DRAWING MAY HAVE BEEN REDUCED. ALL SCALE NOTATIONSINDICATED ARE BASED ON ORIGINAL FORMAT DRAWINGS.
0 105SCALE 1:250
METRES
5 15
THIS DRAWING MAY HAVE BEEN REDUCED. ALL SCALE NOTATIONSINDICATED ARE BASED ON ORIGINAL FORMAT DRAWINGS.
0
METRES
7.552.5SCALE 1:100
2.5
SEE DETAIL 1-
STATION 0+720
m
(TO BE COMPLETED PER AMEC DESIGNSUMMER 2014)
(TO BE COMPLETED PER AMEC DESIGN SUMMER 2014)
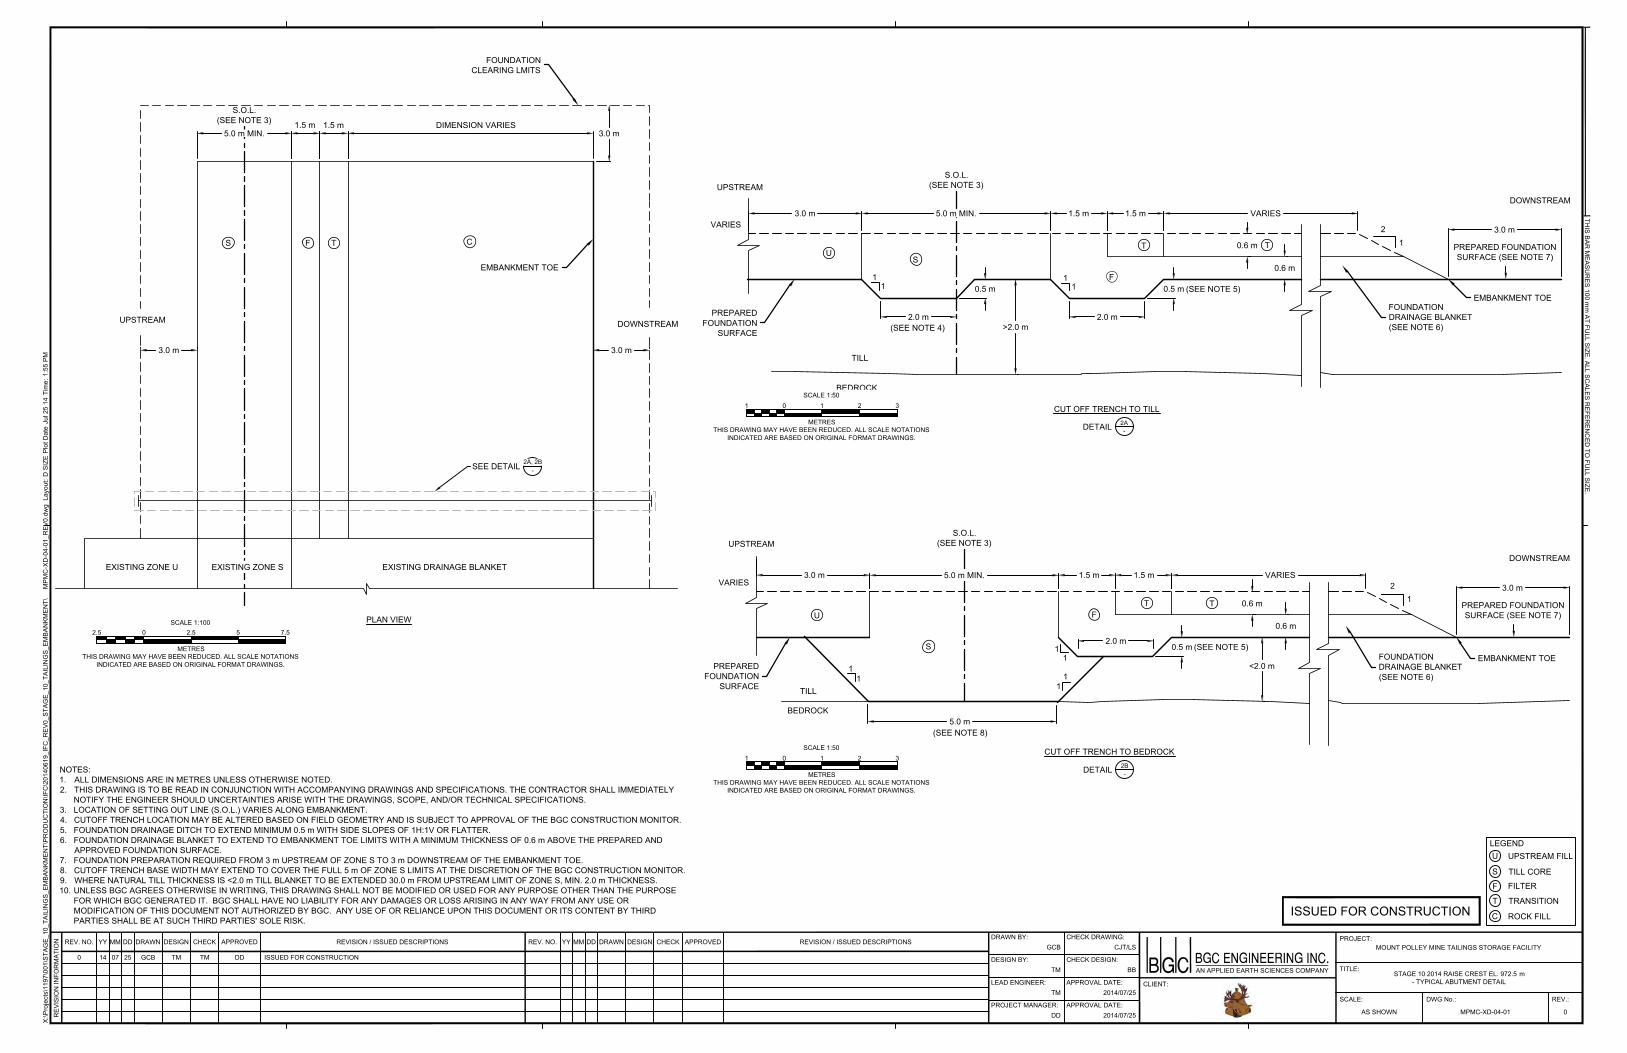
CUT OFF TRENCH TO BEDROCK
1.5 m 1.5 m VARIES3.0 m
12
<2.0 m
2.0 m
0.6 m
11
3.0 m
DOWNSTREAM
UPSTREAM
5.0 m(SEE NOTE 8)
11
U
S
FT T
PREPAREDFOUNDATION
SURFACE TILL
BEDROCK
EMBANKMENT TOEFOUNDATIONDRAINAGE BLANKET(SEE NOTE 6)
0.6 m
DETAIL 2B-
5.0 m MIN.
S.O.L.(SEE NOTE 3)
VARIES
(SEE NOTE 5)0.5 m1
1
PREPARED FOUNDATIONSURFACE (SEE NOTE 7)
EXISTING DRAINAGE BLANKETEXISTING ZONE U
3.0 m3.0 m
PLAN VIEW
1.5 m 1.5 m
DOWNSTREAMUPSTREAM
FS T C
EMBANKMENT TOE
FOUNDATIONCLEARING LMITS
EXISTING ZONE S
S.O.L.(SEE NOTE 3) DIMENSION VARIES
3.0 m5.0 m MIN.
CUT OFF TRENCH TO TILL
1.5 m 1.5 m5.0 m MIN. VARIES3.0 m
12
>2.0 m2.0 m
0.6 m1
1
DOWNSTREAMUPSTREAM
2.0 m(SEE NOTE 4)
US
F
T T
PREPAREDFOUNDATION
SURFACE
(SEE NOTE 5)
BEDROCK
TILL
FOUNDATIONDRAINAGE BLANKET(SEE NOTE 6)
EMBANKMENT TOE0.5 m
DETAIL 2A-
0.6 m
S.O.L.(SEE NOTE 3)
VARIES
PREPARED FOUNDATIONSURFACE (SEE NOTE 7)
0.5 m1
1
3.0 m
X:\P
roje
cts\
1197
\001
\STA
GE_
10_T
AILI
NG
S_EM
BAN
KMEN
T\PR
OD
UC
TIO
N\IF
C\2
0140
619_
IFC
_REV
0_ST
AGE_
10_T
AILI
NG
S_EM
BAN
KMEN
T\M
PMC
-XD
-04-
01_R
EV0.
dwg
Lay
out:
D S
IZE
Plo
t Dat
e Ju
l 25
14 T
ime:
1:5
5 PM
THIS BAR
MEASU
RES 100 m
m AT FU
LL SIZE. ALL SCALES R
EFEREN
CED
TO FU
LL SIZE.
SCALE:
DRAWN BY:
REV.:
REV. NO. YY DRAWN DESIGN CHECK APPROVED REVISION / ISSUED DESCRIPTIONSCHECK DRAWING:
DWG No.:
DESIGN BY: CHECK DESIGN:
LEAD ENGINEER: APPROVAL DATE:
PROJECT MANAGER: APPROVAL DATE:
REV. NO. DRAWN DESIGN CHECK REVISION / ISSUED DESCRIPTIONS
REV
ISIO
N IN
FOR
MAT
ION MM DD YY MM DD PROJECT:
TITLE:
CLIENT:
AN APPLIED EARTH SCIENCES COMPANY
APPROVEDMOUNT POLLEY MINE TAILINGS STORAGE FACILITY
STAGE 10 2014 RAISE CREST EL. 972.5 M- TYPICAL ABUTMENT DETAIL
MPMC-XD-04-01 0AS SHOWN
####
GCB CJT/LS
TM BB
TM 2014/07/25
DD 2014/07/25
0 14 07 25 GCB TM TM DD ISSUED FOR CONSTRUCTION
NOTES:1. ALL DIMENSIONS ARE IN METRES UNLESS OTHERWISE NOTED.2. THIS DRAWING IS TO BE READ IN CONJUNCTION WITH ACCOMPANYING DRAWINGS AND SPECIFICATIONS. THE CONTRACTOR SHALL IMMEDIATELY
NOTIFY THE ENGINEER SHOULD UNCERTAINTIES ARISE WITH THE DRAWINGS, SCOPE, AND/OR TECHNICAL SPECIFICATIONS.3. LOCATION OF SETTING OUT LINE (S.O.L.) VARIES ALONG EMBANKMENT.4. CUTOFF TRENCH LOCATION MAY BE ALTERED BASED ON FIELD GEOMETRY AND IS SUBJECT TO APPROVAL OF THE BGC CONSTRUCTION MONITOR.5. FOUNDATION DRAINAGE DITCH TO EXTEND MINIMUM 0.5 m WITH SIDE SLOPES OF 1H:1V OR FLATTER.6. FOUNDATION DRAINAGE BLANKET TO EXTEND TO EMBANKMENT TOE LIMITS WITH A MINIMUM THICKNESS OF 0.6 m ABOVE THE PREPARED AND
APPROVED FOUNDATION SURFACE.7. FOUNDATION PREPARATION REQUIRED FROM 3 m UPSTREAM OF ZONE S TO 3 m DOWNSTREAM OF THE EMBANKMENT TOE.8. CUTOFF TRENCH BASE WIDTH MAY EXTEND TO COVER THE FULL 5 m OF ZONE S LIMITS AT THE DISCRETION OF THE BGC CONSTRUCTION MONITOR.9. WHERE NATURAL TILL THICKNESS IS <2.0 m TILL BLANKET TO BE EXTENDED 30.0 m FROM UPSTREAM LIMIT OF ZONE S, MIN. 2.0 m THICKNESS.10. UNLESS BGC AGREES OTHERWISE IN WRITING, THIS DRAWING SHALL NOT BE MODIFIED OR USED FOR ANY PURPOSE OTHER THAN THE PURPOSE
FOR WHICH BGC GENERATED IT. BGC SHALL HAVE NO LIABILITY FOR ANY DAMAGES OR LOSS ARISING IN ANY WAY FROM ANY USE ORMODIFICATION OF THIS DOCUMENT NOT AUTHORIZED BY BGC. ANY USE OF OR RELIANCE UPON THIS DOCUMENT OR ITS CONTENT BY THIRDPARTIES SHALL BE AT SUCH THIRD PARTIES' SOLE RISK.
U
S
F
T
C
UPSTREAM FILL
TILL CORE
FILTER
TRANSITION
ROCK FILL
LEGEND
0
METRES
7.552.5SCALE 1:100
2.5
THIS DRAWING MAY HAVE BEEN REDUCED. ALL SCALE NOTATIONSINDICATED ARE BASED ON ORIGINAL FORMAT DRAWINGS.
0 21SCALE 1:50
METRES
1 3
THIS DRAWING MAY HAVE BEEN REDUCED. ALL SCALE NOTATIONSINDICATED ARE BASED ON ORIGINAL FORMAT DRAWINGS.
0 21SCALE 1:50
METRES
1 3
THIS DRAWING MAY HAVE BEEN REDUCED. ALL SCALE NOTATIONSINDICATED ARE BASED ON ORIGINAL FORMAT DRAWINGS.
SEE DETAIL 2A, 2B-
ISSUED FOR CONSTRUCTION
m
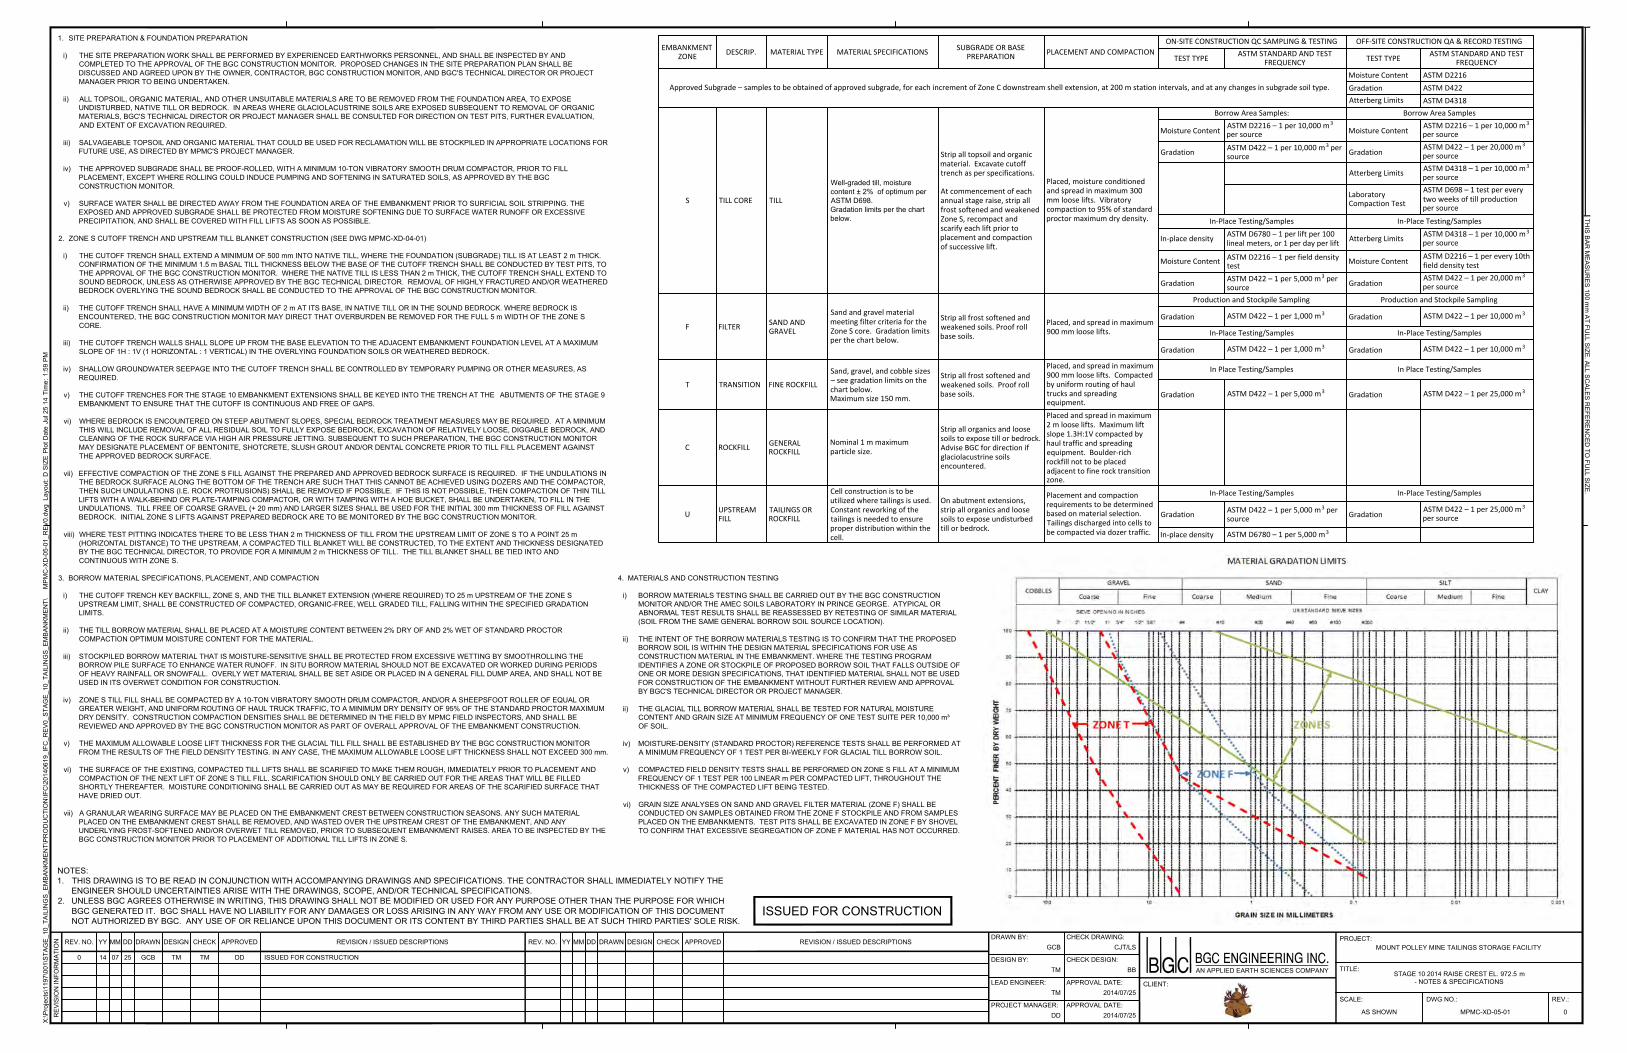
ISSUED FOR CONSTRUCTION
SCALE:
DRAWN BY:
REV.:
X:\P
roje
cts\
1197
\001
\STA
GE_
10_T
AILI
NG
S_EM
BAN
KMEN
T\PR
OD
UC
TIO
N\IF
C\2
0140
619_
IFC
_REV
0_ST
AGE_
10_T
AILI
NG
S_EM
BAN
KMEN
T\M
PMC
-XD
-05-
01_R
EV0.
dwg
Lay
out:
D S
IZE
Plo
t Dat
e Ju
l 25
14 T
ime:
1:5
9 PM
REV. NO. YY DRAWN DESIGN CHECK APPROVED REVISION / ISSUED DESCRIPTIONSCHECK DRAWING:
DWG NO.:
DESIGN BY: CHECK DESIGN:
LEAD ENGINEER: APPROVAL DATE:
PROJECT MANAGER: APPROVAL DATE:
REV. NO. DRAWN DESIGN CHECK REVISION / ISSUED DESCRIPTIONS
REV
ISIO
N IN
FOR
MAT
ION MM DD YY MM DD
THIS BAR
MEASU
RES 100 m
m AT FU
LL SIZE. ALL SCALES R
EFEREN
CED
TO FU
LL SIZE.
PROJECT:
TITLE:
CLIENT:
AN APPLIED EARTH SCIENCES COMPANY
APPROVEDGCB
0MPMC-XD-05-01AS SHOWN
STAGE 10 2014 RAISE CREST EL. 972.5 M- NOTES & SPECIFICATIONS
MOUNT POLLEY MINE TAILINGS STORAGE FACILITY0 07 GCB TM TM DD ISSUED FOR CONSTRUCTION
CJT/LS
TM BB
TM 2014/07/25
DD 2014/07/25
14 25
####
NOTES:1. THIS DRAWING IS TO BE READ IN CONJUNCTION WITH ACCOMPANYING DRAWINGS AND SPECIFICATIONS. THE CONTRACTOR SHALL IMMEDIATELY NOTIFY THE
ENGINEER SHOULD UNCERTAINTIES ARISE WITH THE DRAWINGS, SCOPE, AND/OR TECHNICAL SPECIFICATIONS.2. UNLESS BGC AGREES OTHERWISE IN WRITING, THIS DRAWING SHALL NOT BE MODIFIED OR USED FOR ANY PURPOSE OTHER THAN THE PURPOSE FOR WHICH
BGC GENERATED IT. BGC SHALL HAVE NO LIABILITY FOR ANY DAMAGES OR LOSS ARISING IN ANY WAY FROM ANY USE OR MODIFICATION OF THIS DOCUMENTNOT AUTHORIZED BY BGC. ANY USE OF OR RELIANCE UPON THIS DOCUMENT OR ITS CONTENT BY THIRD PARTIES SHALL BE AT SUCH THIRD PARTIES' SOLE RISK.
1. SITE PREPARATION & FOUNDATION PREPARATION
i) THE SITE PREPARATION WORK SHALL BE PERFORMED BY EXPERIENCED EARTHWORKS PERSONNEL, AND SHALL BE INSPECTED BY ANDCOMPLETED TO THE APPROVAL OF THE BGC CONSTRUCTION MONITOR. PROPOSED CHANGES IN THE SITE PREPARATION PLAN SHALL BEDISCUSSED AND AGREED UPON BY THE OWNER, CONTRACTOR, BGC CONSTRUCTION MONITOR, AND BGC'S TECHNICAL DIRECTOR OR PROJECTMANAGER PRIOR TO BEING UNDERTAKEN.
ii) ALL TOPSOIL, ORGANIC MATERIAL, AND OTHER UNSUITABLE MATERIALS ARE TO BE REMOVED FROM THE FOUNDATION AREA, TO EXPOSEUNDISTURBED, NATIVE TILL OR BEDROCK. IN AREAS WHERE GLACIOLACUSTRINE SOILS ARE EXPOSED SUBSEQUENT TO REMOVAL OF ORGANICMATERIALS, BGC'S TECHNICAL DIRECTOR OR PROJECT MANAGER SHALL BE CONSULTED FOR DIRECTION ON TEST PITS, FURTHER EVALUATION,AND EXTENT OF EXCAVATION REQUIRED.
iii) SALVAGEABLE TOPSOIL AND ORGANIC MATERIAL THAT COULD BE USED FOR RECLAMATION WILL BE STOCKPILED IN APPROPRIATE LOCATIONS FORFUTURE USE, AS DIRECTED BY MPMC'S PROJECT MANAGER.
iv) THE APPROVED SUBGRADE SHALL BE PROOF-ROLLED, WITH A MINIMUM 10-TON VIBRATORY SMOOTH DRUM COMPACTOR, PRIOR TO FILLPLACEMENT, EXCEPT WHERE ROLLING COULD INDUCE PUMPING AND SOFTENING IN SATURATED SOILS, AS APPROVED BY THE BGCCONSTRUCTION MONITOR.
v) SURFACE WATER SHALL BE DIRECTED AWAY FROM THE FOUNDATION AREA OF THE EMBANKMENT PRIOR TO SURFICIAL SOIL STRIPPING. THEEXPOSED AND APPROVED SUBGRADE SHALL BE PROTECTED FROM MOISTURE SOFTENING DUE TO SURFACE WATER RUNOFF OR EXCESSIVEPRECIPITATION, AND SHALL BE COVERED WITH FILL LIFTS AS SOON AS POSSIBLE.
2. ZONE S CUTOFF TRENCH AND UPSTREAM TILL BLANKET CONSTRUCTION (SEE DWG MPMC-XD-04-01)
i) THE CUTOFF TRENCH SHALL EXTEND A MINIMUM OF 500 mm INTO NATIVE TILL, WHERE THE FOUNDATION (SUBGRADE) TILL IS AT LEAST 2 m THICK.CONFIRMATION OF THE MINIMUM 1.5 m BASAL TILL THICKNESS BELOW THE BASE OF THE CUTOFF TRENCH SHALL BE CONDUCTED BY TEST PITS, TOTHE APPROVAL OF THE BGC CONSTRUCTION MONITOR. WHERE THE NATIVE TILL IS LESS THAN 2 m THICK, THE CUTOFF TRENCH SHALL EXTEND TOSOUND BEDROCK, UNLESS AS OTHERWISE APPROVED BY THE BGC TECHNICAL DIRECTOR. REMOVAL OF HIGHLY FRACTURED AND/OR WEATHEREDBEDROCK OVERLYING THE SOUND BEDROCK SHALL BE CONDUCTED TO THE APPROVAL OF THE BGC CONSTRUCTION MONITOR.
ii) THE CUTOFF TRENCH SHALL HAVE A MINIMUM WIDTH OF 2 m AT ITS BASE, IN NATIVE TILL OR IN THE SOUND BEDROCK. WHERE BEDROCK ISENCOUNTERED, THE BGC CONSTRUCTION MONITOR MAY DIRECT THAT OVERBURDEN BE REMOVED FOR THE FULL 5 m WIDTH OF THE ZONE SCORE.
iii) THE CUTOFF TRENCH WALLS SHALL SLOPE UP FROM THE BASE ELEVATION TO THE ADJACENT EMBANKMENT FOUNDATION LEVEL AT A MAXIMUMSLOPE OF 1H : 1V (1 HORIZONTAL : 1 VERTICAL) IN THE OVERLYING FOUNDATION SOILS OR WEATHERED BEDROCK.
iv) SHALLOW GROUNDWATER SEEPAGE INTO THE CUTOFF TRENCH SHALL BE CONTROLLED BY TEMPORARY PUMPING OR OTHER MEASURES, ASREQUIRED.
v) THE CUTOFF TRENCHES FOR THE STAGE 10 EMBANKMENT EXTENSIONS SHALL BE KEYED INTO THE TRENCH AT THE ABUTMENTS OF THE STAGE 9EMBANKMENT TO ENSURE THAT THE CUTOFF IS CONTINUOUS AND FREE OF GAPS.
vi) WHERE BEDROCK IS ENCOUNTERED ON STEEP ABUTMENT SLOPES, SPECIAL BEDROCK TREATMENT MEASURES MAY BE REQUIRED. AT A MINIMUMTHIS WILL INCLUDE REMOVAL OF ALL RESIDUAL SOIL TO FULLY EXPOSE BEDROCK, EXCAVATION OF RELATIVELY LOOSE, DIGGABLE BEDROCK, ANDCLEANING OF THE ROCK SURFACE VIA HIGH AIR PRESSURE JETTING. SUBSEQUENT TO SUCH PREPARATION, THE BGC CONSTRUCTION MONITORMAY DESIGNATE PLACEMENT OF BENTONITE, SHOTCRETE, SLUSH GROUT AND/OR DENTAL CONCRETE PRIOR TO TILL FILL PLACEMENT AGAINSTTHE APPROVED BEDROCK SURFACE.
vii) EFFECTIVE COMPACTION OF THE ZONE S FILL AGAINST THE PREPARED AND APPROVED BEDROCK SURFACE IS REQUIRED. IF THE UNDULATIONS INTHE BEDROCK SURFACE ALONG THE BOTTOM OF THE TRENCH ARE SUCH THAT THIS CANNOT BE ACHIEVED USING DOZERS AND THE COMPACTOR,THEN SUCH UNDULATIONS (I.E. ROCK PROTRUSIONS) SHALL BE REMOVED IF POSSIBLE. IF THIS IS NOT POSSIBLE, THEN COMPACTION OF THIN TILLLIFTS WITH A WALK-BEHIND OR PLATE-TAMPING COMPACTOR, OR WITH TAMPING WITH A HOE BUCKET, SHALL BE UNDERTAKEN, TO FILL IN THEUNDULATIONS. TILL FREE OF COARSE GRAVEL (+ 20 mm) AND LARGER SIZES SHALL BE USED FOR THE INITIAL 300 mm THICKNESS OF FILL AGAINSTBEDROCK. INITIAL ZONE S LIFTS AGAINST PREPARED BEDROCK ARE TO BE MONITORED BY THE BGC CONSTRUCTION MONITOR.
viii) WHERE TEST PITTING INDICATES THERE TO BE LESS THAN 2 m THICKNESS OF TILL FROM THE UPSTREAM LIMIT OF ZONE S TO A POINT 25 m(HORIZONTAL DISTANCE) TO THE UPSTREAM, A COMPACTED TILL BLANKET WILL BE CONSTRUCTED, TO THE EXTENT AND THICKNESS DESIGNATEDBY THE BGC TECHNICAL DIRECTOR, TO PROVIDE FOR A MINIMUM 2 m THICKNESS OF TILL. THE TILL BLANKET SHALL BE TIED INTO ANDCONTINUOUS WITH ZONE S.
3. BORROW MATERIAL SPECIFICATIONS, PLACEMENT, AND COMPACTION
i) THE CUTOFF TRENCH KEY BACKFILL, ZONE S, AND THE TILL BLANKET EXTENSION (WHERE REQUIRED) TO 25 m UPSTREAM OF THE ZONE SUPSTREAM LIMIT, SHALL BE CONSTRUCTED OF COMPACTED, ORGANIC-FREE, WELL GRADED TILL, FALLING WITHIN THE SPECIFIED GRADATIONLIMITS.
ii) THE TILL BORROW MATERIAL SHALL BE PLACED AT A MOISTURE CONTENT BETWEEN 2% DRY OF AND 2% WET OF STANDARD PROCTORCOMPACTION OPTIMUM MOISTURE CONTENT FOR THE MATERIAL.
iii) STOCKPILED BORROW MATERIAL THAT IS MOISTURE-SENSITIVE SHALL BE PROTECTED FROM EXCESSIVE WETTING BY SMOOTHROLLING THEBORROW PILE SURFACE TO ENHANCE WATER RUNOFF. IN SITU BORROW MATERIAL SHOULD NOT BE EXCAVATED OR WORKED DURING PERIODSOF HEAVY RAINFALL OR SNOWFALL. OVERLY WET MATERIAL SHALL BE SET ASIDE OR PLACED IN A GENERAL FILL DUMP AREA, AND SHALL NOT BEUSED IN ITS OVERWET CONDITION FOR CONSTRUCTION.
iv) ZONE S TILL FILL SHALL BE COMPACTED BY A 10-TON VIBRATORY SMOOTH DRUM COMPACTOR, AND/OR A SHEEPSFOOT ROLLER OF EQUAL ORGREATER WEIGHT, AND UNIFORM ROUTING OF HAUL TRUCK TRAFFIC, TO A MINIMUM DRY DENSITY OF 95% OF THE STANDARD PROCTOR MAXIMUMDRY DENSITY. CONSTRUCTION COMPACTION DENSITIES SHALL BE DETERMINED IN THE FIELD BY MPMC FIELD INSPECTORS, AND SHALL BEREVIEWED AND APPROVED BY THE BGC CONSTRUCTION MONITOR AS PART OF OVERALL APPROVAL OF THE EMBANKMENT CONSTRUCTION.
v) THE MAXIMUM ALLOWABLE LOOSE LIFT THICKNESS FOR THE GLACIAL TILL FILL SHALL BE ESTABLISHED BY THE BGC CONSTRUCTION MONITORFROM THE RESULTS OF THE FIELD DENSITY TESTING. IN ANY CASE, THE MAXIMUM ALLOWABLE LOOSE LIFT THICKNESS SHALL NOT EXCEED 300 mm.
vi) THE SURFACE OF THE EXISTING, COMPACTED TILL LIFTS SHALL BE SCARIFIED TO MAKE THEM ROUGH, IMMEDIATELY PRIOR TO PLACEMENT ANDCOMPACTION OF THE NEXT LIFT OF ZONE S TILL FILL. SCARIFICATION SHOULD ONLY BE CARRIED OUT FOR THE AREAS THAT WILL BE FILLEDSHORTLY THEREAFTER. MOISTURE CONDITIONING SHALL BE CARRIED OUT AS MAY BE REQUIRED FOR AREAS OF THE SCARIFIED SURFACE THATHAVE DRIED OUT.
vii) A GRANULAR WEARING SURFACE MAY BE PLACED ON THE EMBANKMENT CREST BETWEEN CONSTRUCTION SEASONS. ANY SUCH MATERIALPLACED ON THE EMBANKMENT CREST SHALL BE REMOVED, AND WASTED OVER THE UPSTREAM CREST OF THE EMBANKMENT, AND ANYUNDERLYING FROST-SOFTENED AND/OR OVERWET TILL REMOVED, PRIOR TO SUBSEQUENT EMBANKMENT RAISES. AREA TO BE INSPECTED BY THEBGC CONSTRUCTION MONITOR PRIOR TO PLACEMENT OF ADDITIONAL TILL LIFTS IN ZONE S.
4. MATERIALS AND CONSTRUCTION TESTING
i) BORROW MATERIALS TESTING SHALL BE CARRIED OUT BY THE BGC CONSTRUCTIONMONITOR AND/OR THE AMEC SOILS LABORATORY IN PRINCE GEORGE. ATYPICAL ORABNORMAL TEST RESULTS SHALL BE REASSESSED BY RETESTING OF SIMILAR MATERIAL(SOIL FROM THE SAME GENERAL BORROW SOIL SOURCE LOCATION).
ii) THE INTENT OF THE BORROW MATERIALS TESTING IS TO CONFIRM THAT THE PROPOSEDBORROW SOIL IS WITHIN THE DESIGN MATERIAL SPECIFICATIONS FOR USE ASCONSTRUCTION MATERIAL IN THE EMBANKMENT. WHERE THE TESTING PROGRAMIDENTIFIES A ZONE OR STOCKPILE OF PROPOSED BORROW SOIL THAT FALLS OUTSIDE OFONE OR MORE DESIGN SPECIFICATIONS, THAT IDENTIFIED MATERIAL SHALL NOT BE USEDFOR CONSTRUCTION OF THE EMBANKMENT WITHOUT FURTHER REVIEW AND APPROVALBY BGC'S TECHNICAL DIRECTOR OR PROJECT MANAGER.
ii) THE GLACIAL TILL BORROW MATERIAL SHALL BE TESTED FOR NATURAL MOISTURECONTENT AND GRAIN SIZE AT MINIMUM FREQUENCY OF ONE TEST SUITE PER 10,000 m³OF SOIL.
iv) MOISTURE-DENSITY (STANDARD PROCTOR) REFERENCE TESTS SHALL BE PERFORMED ATA MINIMUM FREQUENCY OF 1 TEST PER BI-WEEKLY FOR GLACIAL TILL BORROW SOIL.
v) COMPACTED FIELD DENSITY TESTS SHALL BE PERFORMED ON ZONE S FILL AT A MINIMUMFREQUENCY OF 1 TEST PER 100 LINEAR m PER COMPACTED LIFT, THROUGHOUT THETHICKNESS OF THE COMPACTED LIFT BEING TESTED.
vi) GRAIN SIZE ANALYSES ON SAND AND GRAVEL FILTER MATERIAL (ZONE F) SHALL BECONDUCTED ON SAMPLES OBTAINED FROM THE ZONE F STOCKPILE AND FROM SAMPLESPLACED ON THE EMBANKMENTS. TEST PITS SHALL BE EXCAVATED IN ZONE F BY SHOVELTO CONFIRM THAT EXCESSIVE SEGREGATION OF ZONE F MATERIAL HAS NOT OCCURRED.
EMBANKMENTZONE
DESCRIP. MATERIAL TYPE MATERIAL SPECIFICATIONSSUBGRADE OR BASE
PREPARATIONPLACEMENT AND COMPACTION
ON-SITE CONSTRUCTION QC SAMPLING & TESTING OFF-SITE CONSTRUCTION QA & RECORD TESTING
TEST TYPEASTM STANDARD AND TEST
FREQUENCY TEST TYPEASTM STANDARD AND TEST
FREQUENCY
Approved Subgrade – samples to be obtained of approved subgrade, for each increment of Zone C downstream shell extension, at 200 m station intervals, and at any changes in subgrade soil type.
Moisture Content ASTM D2216
Gradation ASTM D422
Atterberg Limits ASTM D4318
S TILL CORE TILL
Well-graded till, moisturecontent ± 2% of optimum perASTM D698.Gradation limits per the chartbelow.
Strip all topsoil and organicmaterial. Excavate cutofftrench as per specifications.
At commencement of eachannual stage raise, strip allfrost softened and weakenedZone S, recompact andscarify each lift prior toplacement and compactionof successive lift.
Placed, moisture conditionedand spread in maximum 300mm loose lifts. Vibratorycompaction to 95% of standardproctor maximum dry density.
Borrow Area Samples: Borrow Area Samples
Moisture ContentASTM D2216 – 1 per 10,000 m3
per source Moisture ContentASTM D2216 – 1 per 10,000 m3
per source
GradationASTM D422 – 1 per 10,000 m3 persource
GradationASTM D422 – 1 per 20,000 m3
per source
Atterberg LimitsASTM D4318 – 1 per 10,000 m3
per source
LaboratoryCompaction Test
ASTM D698 – 1 test per everytwo weeks of till productionper source
In-Place Testing/Samples In-Place Testing/Samples
In-place densityASTM D6780 – 1 per lift per 100lineal meters, or 1 per day per lift
Atterberg LimitsASTM D4318 – 1 per 10,000 m3
per source
Moisture Content ASTM D2216 – 1 per field densitytest
Moisture ContentASTM D2216 – 1 per every 10thfield density test
GradationASTM D422 – 1 per 5,000 m3 persource
GradationASTM D422 – 1 per 20,000 m3
per source
F FILTERSAND ANDGRAVEL
Sand and gravel materialmeeting filter criteria for theZone S core. Gradation limitsper the chart below.
Strip all frost softened andweakened soils. Proof rollbase soils.
Placed, and spread in maximum900 mm loose lifts.
Production and Stockpile Sampling Production and Stockpile Sampling
Gradation ASTM D422 – 1 per 1,000 m3 Gradation ASTM D422 – 1 per 10,000 m3
In-Place Testing/Samples In-Place Testing/Samples
Gradation ASTM D422 – 1 per 1,000 m3 Gradation ASTM D422 – 1 per 10,000 m3
T TRANSITION FINE ROCKFILL
Sand, gravel, and cobble sizes– see gradation limits on thechart below.Maximum size 150 mm.
Strip all frost softened andweakened soils. Proof rollbase soils.
Placed, and spread in maximum900 mm loose lifts. Compactedby uniform routing of haultrucks and spreadingequipment.
In Place Testing/Samples In Place Testing/Samples
Gradation ASTM D422 – 1 per 5,000 m3 Gradation ASTM D422 – 1 per 25,000 m3
C ROCKFILLGENERALROCKFILL
Nominal 1 m maximumparticle size.
Strip all organics and loosesoils to expose till or bedrock.Advise BGC for direction ifglaciolacustrine soilsencountered.
Placed and spread in maximum2 m loose lifts. Maximum liftslope 1.3H:1V compacted byhaul traffic and spreadingequipment. Boulder-richrockfill not to be placedadjacent to fine rock transitionzone.
UUPSTREAMFILL
TAILINGS ORROCKFILL
Cell construction is to beutilized where tailings is used.Constant reworking of thetailings is needed to ensureproper distribution within thecell.
On abutment extensions,strip all organics and loosesoils to expose undisturbedtill or bedrock.
Placement and compactionrequirements to be determinedbased on material selection.Tailings discharged into cells tobe compacted via dozer traffic.
In-Place Testing/Samples In-Place Testing/Samples
GradationASTM D422 – 1 per 5,000 m3 persource
GradationASTM D422 – 1 per 25,000 m3
per source
In-place density ASTM D6780 – 1 per 5,000 m3
m
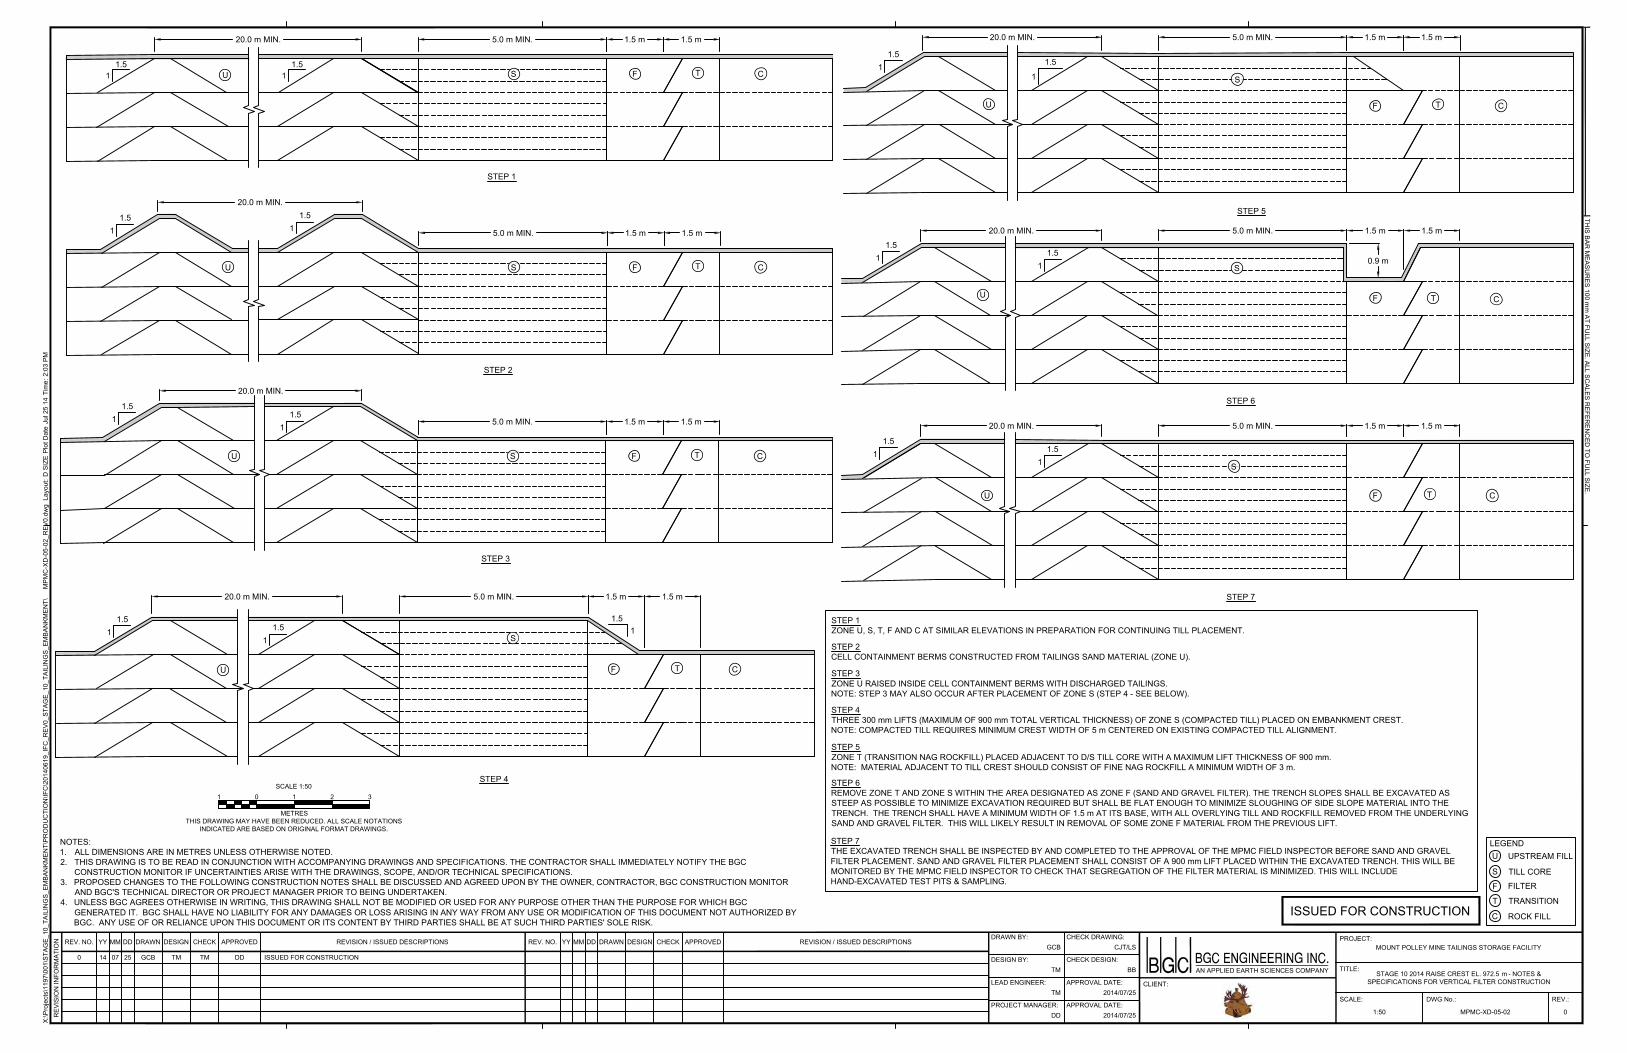
STEP 1
STEP 4
STEP 7
STEP 6
1.51
1.51
STEP 5
1.5
1
5.0 m MIN. 1.5 m 1.5 m
5.0 m MIN. 1.5 m 1.5 m
5.0 m MIN. 1.5 m 1.5 m
5.0 m MIN. 1.5 m 1.5 m
5.0 m MIN. 1.5 m 1.5 m
U S F T C
U
S
F T C
U
S
F T C
U
S
F T C
U
S
F T C
0.9 m1.5
1
STEP 2
SU F CT
STEP 3
U S F T C1.5
1
5.0 m MIN. 1.5 m 1.5 m
5.0 m MIN. 1.5 m1 1.5 m
1.5
1.51
1.51
1.51
1.51
11.5
1.5
1.5
1
1
20.0 m MIN.
20.0 m MIN.
20.0 m MIN.
20.0 m MIN.
20.0 m MIN.20.0 m MIN.
20.0 m MIN.
1.51
1.51
X:\P
roje
cts\
1197
\001
\STA
GE_
10_T
AILI
NG
S_EM
BAN
KMEN
T\PR
OD
UC
TIO
N\IF
C\2
0140
619_
IFC
_REV
0_ST
AGE_
10_T
AILI
NG
S_EM
BAN
KMEN
T\M
PMC
-XD
-05-
02_R
EV0.
dwg
Lay
out:
D S
IZE
Plo
t Dat
e Ju
l 25
14 T
ime:
2:0
3 PM
THIS BAR
MEASU
RES 100 m
m AT FU
LL SIZE. ALL SCALES R
EFEREN
CED
TO FU
LL SIZE.
SCALE:
DRAWN BY:
REV.:
REV. NO. YY DRAWN DESIGN CHECK APPROVED REVISION / ISSUED DESCRIPTIONSCHECK DRAWING:
DWG No.:
DESIGN BY: CHECK DESIGN:
LEAD ENGINEER: APPROVAL DATE:
PROJECT MANAGER: APPROVAL DATE:
REV. NO. DRAWN DESIGN CHECK REVISION / ISSUED DESCRIPTIONS
REV
ISIO
N IN
FOR
MAT
ION MM DD YY MM DD PROJECT:
TITLE:
CLIENT:
AN APPLIED EARTH SCIENCES COMPANY
APPROVEDMOUNT POLLEY MINE TAILINGS STORAGE FACILITY
STAGE 10 2014 RAISE CREST EL. 972.5 M - NOTES &SPECIFICATIONS FOR VERTICAL FILTER CONSTRUCTION
MPMC-XD-05-02 01:50
####
GCB CJT/LS
TM BB
TM 2014/07/25
DD 2014/07/25
0 14 07 25 GCB TM TM DD ISSUED FOR CONSTRUCTION
NOTES:1. ALL DIMENSIONS ARE IN METRES UNLESS OTHERWISE NOTED.2. THIS DRAWING IS TO BE READ IN CONJUNCTION WITH ACCOMPANYING DRAWINGS AND SPECIFICATIONS. THE CONTRACTOR SHALL IMMEDIATELY NOTIFY THE BGC
CONSTRUCTION MONITOR IF UNCERTAINTIES ARISE WITH THE DRAWINGS, SCOPE, AND/OR TECHNICAL SPECIFICATIONS.3. PROPOSED CHANGES TO THE FOLLOWING CONSTRUCTION NOTES SHALL BE DISCUSSED AND AGREED UPON BY THE OWNER, CONTRACTOR, BGC CONSTRUCTION MONITOR
AND BGC'S TECHNICAL DIRECTOR OR PROJECT MANAGER PRIOR TO BEING UNDERTAKEN.4. UNLESS BGC AGREES OTHERWISE IN WRITING, THIS DRAWING SHALL NOT BE MODIFIED OR USED FOR ANY PURPOSE OTHER THAN THE PURPOSE FOR WHICH BGC
GENERATED IT. BGC SHALL HAVE NO LIABILITY FOR ANY DAMAGES OR LOSS ARISING IN ANY WAY FROM ANY USE OR MODIFICATION OF THIS DOCUMENT NOT AUTHORIZED BYBGC. ANY USE OF OR RELIANCE UPON THIS DOCUMENT OR ITS CONTENT BY THIRD PARTIES SHALL BE AT SUCH THIRD PARTIES' SOLE RISK.
U
S
F
T
C
UPSTREAM FILL
TILL CORE
FILTER
TRANSITION
ROCK FILL
LEGEND
STEP 1ZONE U, S, T, F AND C AT SIMILAR ELEVATIONS IN PREPARATION FOR CONTINUING TILL PLACEMENT.
STEP 4THREE 300 mm LIFTS (MAXIMUM OF 900 mm TOTAL VERTICAL THICKNESS) OF ZONE S (COMPACTED TILL) PLACED ON EMBANKMENT CREST.NOTE: COMPACTED TILL REQUIRES MINIMUM CREST WIDTH OF 5 m CENTERED ON EXISTING COMPACTED TILL ALIGNMENT.
STEP 5ZONE T (TRANSITION NAG ROCKFILL) PLACED ADJACENT TO D/S TILL CORE WITH A MAXIMUM LIFT THICKNESS OF 900 mm.NOTE: MATERIAL ADJACENT TO TILL CREST SHOULD CONSIST OF FINE NAG ROCKFILL A MINIMUM WIDTH OF 3 m.
0 21SCALE 1:50
METRES
1 3
THIS DRAWING MAY HAVE BEEN REDUCED. ALL SCALE NOTATIONSINDICATED ARE BASED ON ORIGINAL FORMAT DRAWINGS.
STEP 7THE EXCAVATED TRENCH SHALL BE INSPECTED BY AND COMPLETED TO THE APPROVAL OF THE MPMC FIELD INSPECTOR BEFORE SAND AND GRAVELFILTER PLACEMENT. SAND AND GRAVEL FILTER PLACEMENT SHALL CONSIST OF A 900 mm LIFT PLACED WITHIN THE EXCAVATED TRENCH. THIS WILL BEMONITORED BY THE MPMC FIELD INSPECTOR TO CHECK THAT SEGREGATION OF THE FILTER MATERIAL IS MINIMIZED. THIS WILL INCLUDEHAND-EXCAVATED TEST PITS & SAMPLING.
STEP 6REMOVE ZONE T AND ZONE S WITHIN THE AREA DESIGNATED AS ZONE F (SAND AND GRAVEL FILTER). THE TRENCH SLOPES SHALL BE EXCAVATED ASSTEEP AS POSSIBLE TO MINIMIZE EXCAVATION REQUIRED BUT SHALL BE FLAT ENOUGH TO MINIMIZE SLOUGHING OF SIDE SLOPE MATERIAL INTO THETRENCH. THE TRENCH SHALL HAVE A MINIMUM WIDTH OF 1.5 m AT ITS BASE, WITH ALL OVERLYING TILL AND ROCKFILL REMOVED FROM THE UNDERLYINGSAND AND GRAVEL FILTER. THIS WILL LIKELY RESULT IN REMOVAL OF SOME ZONE F MATERIAL FROM THE PREVIOUS LIFT.
ISSUED FOR CONSTRUCTION
m
STEP 2CELL CONTAINMENT BERMS CONSTRUCTED FROM TAILINGS SAND MATERIAL (ZONE U).
STEP 3ZONE U RAISED INSIDE CELL CONTAINMENT BERMS WITH DISCHARGED TAILINGS.NOTE: STEP 3 MAY ALSO OCCUR AFTER PLACEMENT OF ZONE S (STEP 4 - SEE BELOW).
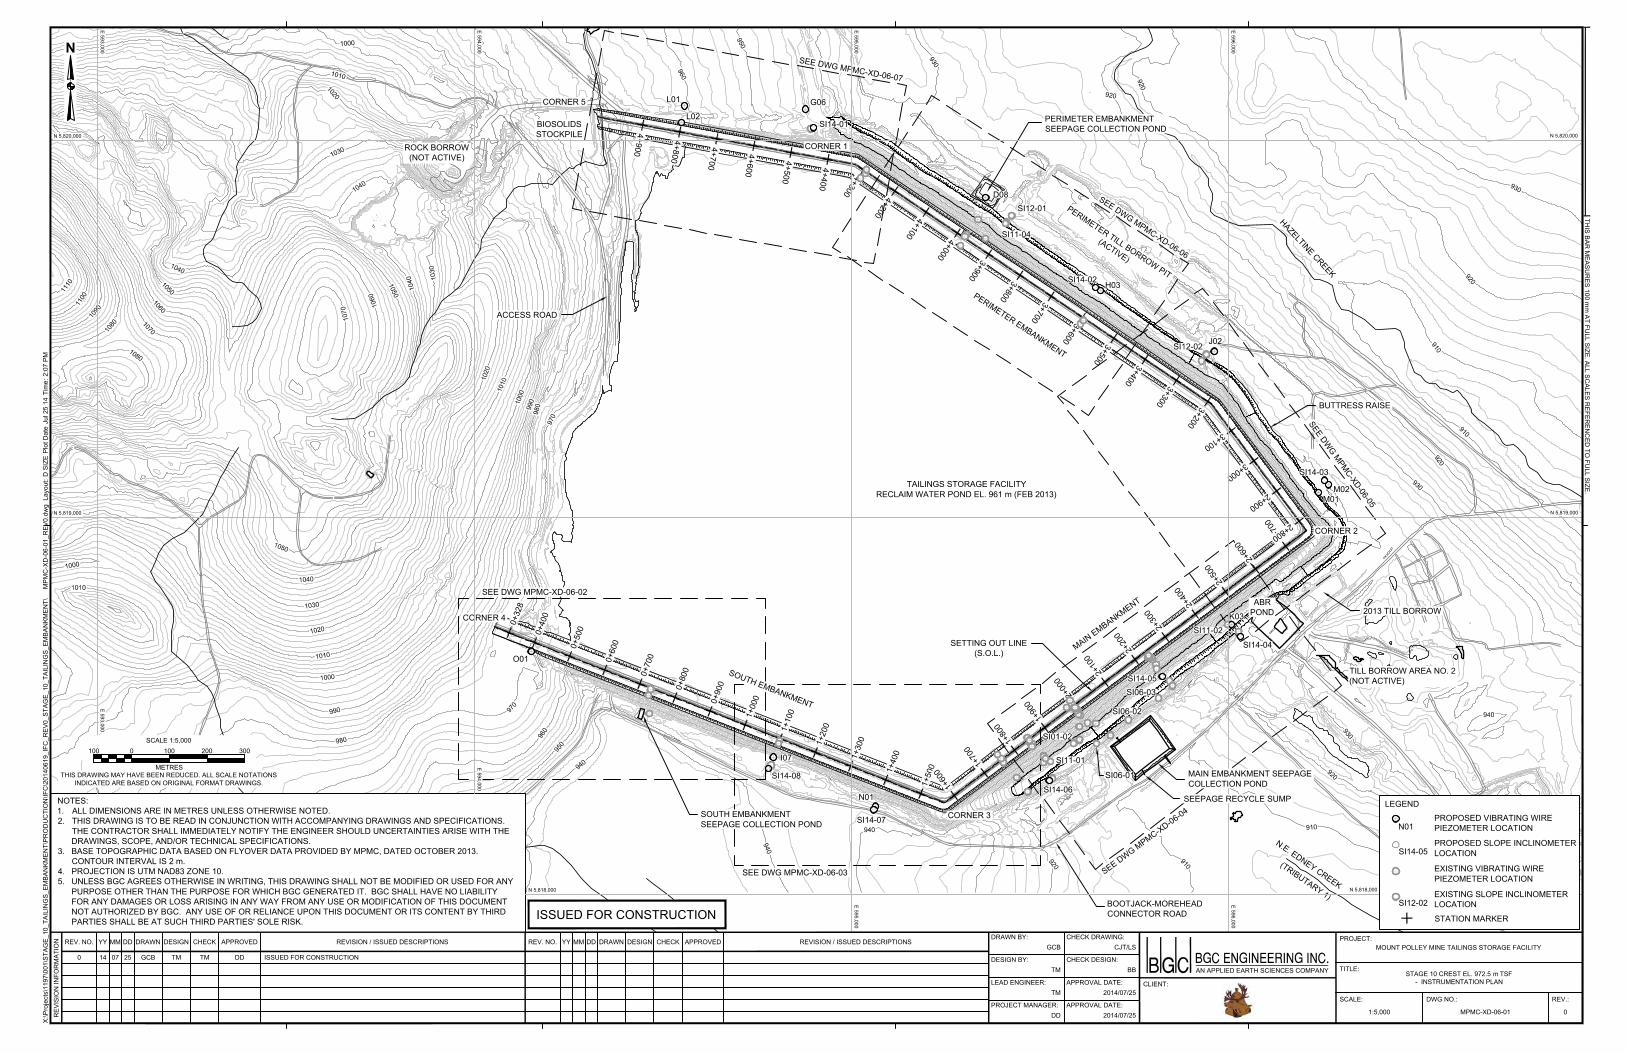
TAILINGS STORAGE FACILITYRECLAIM WATER POND EL. 961 m (FEB 2013)
CORNER 2
CORNER 3
CORNER 4
CORNER 5
CORNER 1
BOOTJACK-MOREHEADCONNECTOR ROAD
N.E. EDNEY CREEK
PERIMETER EMBANKMENT
SETTING OUT LINE(S.O.L.)
PERIMETER EMBANKMENTSEEPAGE COLLECTION POND
ACCESS ROAD
ROCK BORROW(NOT ACTIVE)
BIOSOLIDSSTOCKPILE
PERIMETER TILL BORROW PIT
(ACTIVE)
TILL BORROW AREA NO. 2(NOT ACTIVE)
SEE DWG MPMC-XD-06-02
SEE DWG MPMC-XD-06-03
SOUTH EMBANKMENT
MAIN EMBANKMENT ABRPOND
SEE DWG MPMC-XD-06-04
(TRIBUTARY 1)
0+32
8
0+40
0
0+50
0
0+60
0
0+70
0
0+80
0
0+90
0
1+00
0
1+10
0
1+20
0
1+30
0
1+40
0
1+50
0
1+60
0
1+70
0
1+80
0
1+90
0
2+00
0
2+10
0
2+20
0
2+30
0
2+40
0
2+50
0
2+60
0
2+70
0 2+800
2+900
3+000
3+100
3+200
3+300
3+400
3+500
3+600
3+700
3+800
3+900
4+000
4+100
4+200
4+300
4+400
4+500
4+600
4+700
4+800
4+900
SEE DWG MPMC-XD-06-05
SOUTH EMBANKMENTSEEPAGE COLLECTION POND
SEE DWG MPMC-XD-06-06
SEE DWG MPMC-XD-06-07
SI11-01
SI11-02
SI12-01
O01
I07
N01
K03
M01M02
J02
H03
D08
G06
L02
L01
SI14-07
SI14-05
SI14-03
SI14-02
2013 TILL BORROW
BUTTRESS RAISE
HAZELTINE CREEK
SI14-06
SI14-04
SI11-04
SI14-01
SI14-08
N
NOTES:1. ALL DIMENSIONS ARE IN METRES UNLESS OTHERWISE NOTED.2. THIS DRAWING IS TO BE READ IN CONJUNCTION WITH ACCOMPANYING DRAWINGS AND SPECIFICATIONS.
THE CONTRACTOR SHALL IMMEDIATELY NOTIFY THE ENGINEER SHOULD UNCERTAINTIES ARISE WITH THEDRAWINGS, SCOPE, AND/OR TECHNICAL SPECIFICATIONS.
3. BASE TOPOGRAPHIC DATA BASED ON FLYOVER DATA PROVIDED BY MPMC, DATED OCTOBER 2013.CONTOUR INTERVAL IS 2 m.
4. PROJECTION IS UTM NAD83 ZONE 10.5. UNLESS BGC AGREES OTHERWISE IN WRITING, THIS DRAWING SHALL NOT BE MODIFIED OR USED FOR ANY
PURPOSE OTHER THAN THE PURPOSE FOR WHICH BGC GENERATED IT. BGC SHALL HAVE NO LIABILITYFOR ANY DAMAGES OR LOSS ARISING IN ANY WAY FROM ANY USE OR MODIFICATION OF THIS DOCUMENTNOT AUTHORIZED BY BGC. ANY USE OF OR RELIANCE UPON THIS DOCUMENT OR ITS CONTENT BY THIRDPARTIES SHALL BE AT SUCH THIRD PARTIES' SOLE RISK.
E 593,000E 593,000
E 594,000E 594,000
E 595,000E 595,000
E 596,000E 596,000
N 5,818,000 N 5,818,000
N 5,819,000 N 5,819,000
N 5,820,000 N 5,820,000
THIS DRAWING MAY HAVE BEEN REDUCED. ALL SCALE NOTATIONSINDICATED ARE BASED ON ORIGINAL FORMAT DRAWINGS.
0 200100SCALE 1:5,000
METRES
100 300
SCALE:
DRAWN BY:
REV.:
X:\P
roje
cts\
1197
\001
\STA
GE_
10_T
AILI
NG
S_EM
BAN
KMEN
T\PR
OD
UC
TIO
N\IF
C\2
0140
619_
IFC
_REV
0_ST
AGE_
10_T
AILI
NG
S_EM
BAN
KMEN
T\M
PMC
-XD
-06-
01_R
EV0.
dwg
Lay
out:
D S
IZE
Plo
t Dat
e Ju
l 25
14 T
ime:
2:0
7 PM
REV. NO. YY DRAWN DESIGN CHECK APPROVED REVISION / ISSUED DESCRIPTIONSCHECK DRAWING:
DWG NO.:
DESIGN BY: CHECK DESIGN:
LEAD ENGINEER: APPROVAL DATE:
PROJECT MANAGER: APPROVAL DATE:
REV. NO. DRAWN DESIGN CHECK REVISION / ISSUED DESCRIPTIONS
REV
ISIO
N IN
FOR
MAT
ION MM DD YY MM DD
THIS BAR
MEASU
RES 100 m
m AT FU
LL SIZE. ALL SCALES R
EFEREN
CED
TO FU
LL SIZE.
PROJECT:
TITLE:
CLIENT:
AN APPLIED EARTH SCIENCES COMPANY
APPROVEDGCB
0MPMC-XD-06-011:5,000
STAGE 10 CREST EL. 972.5 M TSF- INSTRUMENTATION PLAN
MOUNT POLLEY MINE TAILINGS STORAGE FACILITY0 07 GCB TM TM DD ISSUED FOR CONSTRUCTION
CJT/LS
TM BB
TM 2014/07/25
DD 2014/07/25
14 25
####
ISSUED FOR CONSTRUCTIONSI12-02
EXISTING VIBRATING WIREPIEZOMETER LOCATION
EXISTING SLOPE INCLINOMETERLOCATION
LEGEND
STATION MARKER
m
PROPOSED VIBRATING WIREPIEZOMETER LOCATION
PROPOSED SLOPE INCLINOMETERLOCATION
N01
SI14-05
MAIN EMBANKMENT SEEPAGECOLLECTION POND
SEEPAGE RECYCLE SUMP
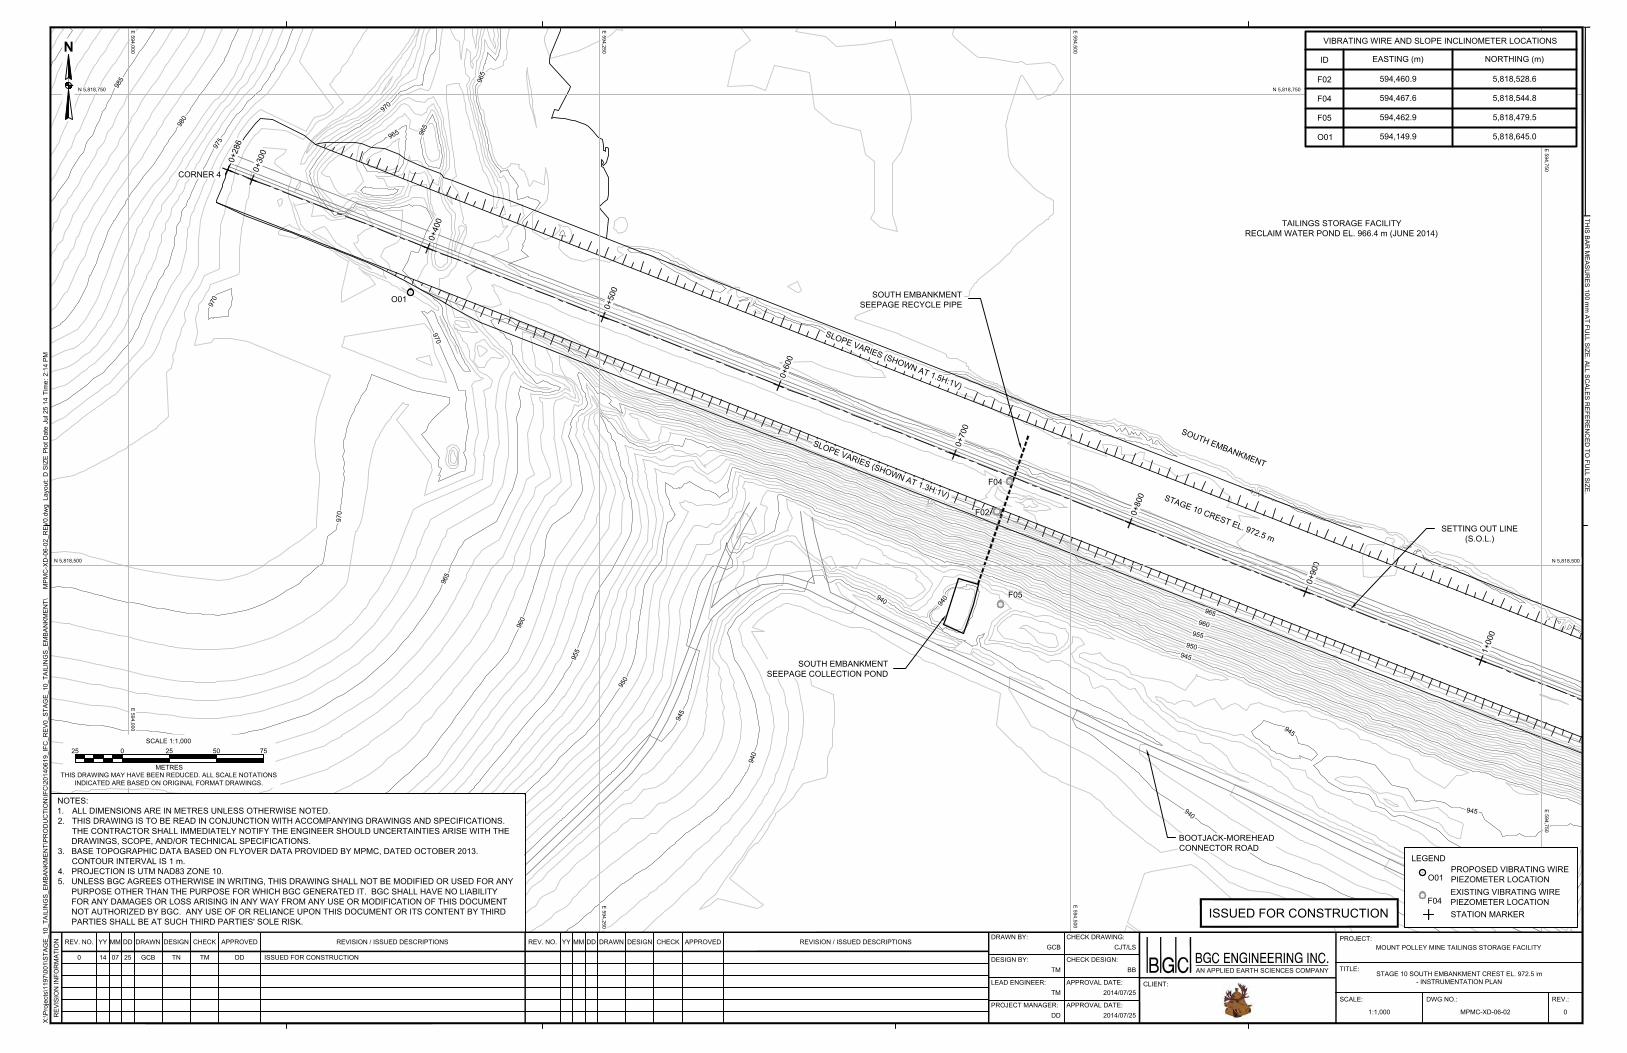
TAILINGS STORAGE FACILITYRECLAIM WATER POND EL. 966.4 m (JUNE 2014)
CORNER 4
BOOTJACK-MOREHEADCONNECTOR ROAD
SOUTH EMBANKMENT
SOUTH EMBANKMENTSEEPAGE COLLECTION POND
SETTING OUT LINE(S.O.L.)
0+28
6
0+30
0
0+40
0
0+50
0
0+60
0
0+70
0
0+80
0
0+90
0
1+00
0
STAGE 10 CREST EL. 972.5 m
O01
F02
F04
F05
SOUTH EMBANKMENTSEEPAGE RECYCLE PIPE
N
NOTES:1. ALL DIMENSIONS ARE IN METRES UNLESS OTHERWISE NOTED.2. THIS DRAWING IS TO BE READ IN CONJUNCTION WITH ACCOMPANYING DRAWINGS AND SPECIFICATIONS.
THE CONTRACTOR SHALL IMMEDIATELY NOTIFY THE ENGINEER SHOULD UNCERTAINTIES ARISE WITH THEDRAWINGS, SCOPE, AND/OR TECHNICAL SPECIFICATIONS.
3. BASE TOPOGRAPHIC DATA BASED ON FLYOVER DATA PROVIDED BY MPMC, DATED OCTOBER 2013.CONTOUR INTERVAL IS 1 m.
4. PROJECTION IS UTM NAD83 ZONE 10.5. UNLESS BGC AGREES OTHERWISE IN WRITING, THIS DRAWING SHALL NOT BE MODIFIED OR USED FOR ANY
PURPOSE OTHER THAN THE PURPOSE FOR WHICH BGC GENERATED IT. BGC SHALL HAVE NO LIABILITYFOR ANY DAMAGES OR LOSS ARISING IN ANY WAY FROM ANY USE OR MODIFICATION OF THIS DOCUMENTNOT AUTHORIZED BY BGC. ANY USE OF OR RELIANCE UPON THIS DOCUMENT OR ITS CONTENT BY THIRDPARTIES SHALL BE AT SUCH THIRD PARTIES' SOLE RISK.
SCALE:
DRAWN BY:
REV.:
X:\P
roje
cts\
1197
\001
\STA
GE_
10_T
AILI
NG
S_EM
BAN
KMEN
T\PR
OD
UC
TIO
N\IF
C\2
0140
619_
IFC
_REV
0_ST
AGE_
10_T
AILI
NG
S_EM
BAN
KMEN
T\M
PMC
-XD
-06-
02_R
EV0.
dwg
Lay
out:
D S
IZE
Plo
t Dat
e Ju
l 25
14 T
ime:
2:1
4 PM
REV. NO. YY DRAWN DESIGN CHECK APPROVED REVISION / ISSUED DESCRIPTIONSCHECK DRAWING:
DWG NO.:
DESIGN BY: CHECK DESIGN:
LEAD ENGINEER: APPROVAL DATE:
PROJECT MANAGER: APPROVAL DATE:
REV. NO. DRAWN DESIGN CHECK REVISION / ISSUED DESCRIPTIONS
REV
ISIO
N IN
FOR
MAT
ION MM DD YY MM DD
THIS BAR
MEASU
RES 100 m
m AT FU
LL SIZE. ALL SCALES R
EFEREN
CED
TO FU
LL SIZE.
PROJECT:
TITLE:
CLIENT:
AN APPLIED EARTH SCIENCES COMPANY
APPROVEDGCB
0MPMC-XD-06-021:1,000
STAGE 10 SOUTH EMBANKMENT CREST EL. 972.5 M- INSTRUMENTATION PLAN
MOUNT POLLEY MINE TAILINGS STORAGE FACILITY0 07 GCB TN TM DD ISSUED FOR CONSTRUCTION
CJT/LS
TM BB
TM 2014/07/25
DD 2014/07/25
14 25
####
THIS DRAWING MAY HAVE BEEN REDUCED. ALL SCALE NOTATIONSINDICATED ARE BASED ON ORIGINAL FORMAT DRAWINGS.
0 755025SCALE 1:1,000
METRES
25
ISSUED FOR CONSTRUCTION
E 594,000E 594,000
E 594,250E 594,250
E 594,500E 594,500
E 594,750E 594,750
N 5,818,500 N 5,818,500
N 5,818,750 N 5,818,750
VIBRATING WIRE AND SLOPE INCLINOMETER LOCATIONS
ID
F02
F04
F05
O01
EASTING (m)
594,460.9
594,467.6
594,462.9
594,149.9
NORTHING (m)
5,818,528.6
5,818,544.8
5,818,479.5
5,818,645.0
F04EXISTING VIBRATING WIREPIEZOMETER LOCATION
LEGENDPROPOSED VIBRATING WIREPIEZOMETER LOCATIONO01
STATION MARKER
m
SLOPE VARIES (SHOWN AT 1.5H:1V)
SLOPE VARIES (SHOWN AT 1.3H:1V)

TAILINGS STORAGE FACILITYRECLAIM WATER POND EL. 966.4 m (JUNE 2014)
CORNER 3
BOOTJACK-MOREHEADCONNECTOR ROAD
SOUTH EMBANKMENT
MAIN EMBANKMENT
SETTING OUT LINE(S.O.L.)
1+00
0
1+10
0
1+20
0
1+30
0
1+40
0
1+50
0
1+60
0
1+70
0
1+80
0
STAGE 10 CREST EL. 972.5 m
U/S TOE DRAIN
CENTER OF CORNER CURVE RADIUS(R = 25 m TO D/S ZONE S LIMITS)
(N 5,818,273.5, E 595,247.2)
U/S TOE DRAIN
I07
N01
SI14-08
SI14-07
BUTTRESS RAISE
(EL. 931 m)
E01
E02
E03
E04E05
I01I02
I05/I06
E06/E07
DITCH
N
NOTES:1. STARRED COORDINATES WERE ESTIMATED FROM PROJECT PLAN MAPS; NO SURVEYED COORDINATES
WERE AVAILABLE.2. ALL DIMENSIONS ARE IN METRES UNLESS OTHERWISE NOTED.3. THIS DRAWING IS TO BE READ IN CONJUNCTION WITH ACCOMPANYING DRAWINGS AND SPECIFICATIONS.
THE CONTRACTOR SHALL IMMEDIATELY NOTIFY THE ENGINEER SHOULD UNCERTAINTIES ARISE WITH THEDRAWINGS, SCOPE, AND/OR TECHNICAL SPECIFICATIONS.
4. BASE TOPOGRAPHIC DATA BASED ON FLYOVER DATA PROVIDED BY MPMC, DATED OCTOBER 2013.CONTOUR INTERVAL IS 1 m.
5. PROJECTION IS UTM NAD83 ZONE 10.6. UNLESS BGC AGREES OTHERWISE IN WRITING, THIS DRAWING SHALL NOT BE MODIFIED OR USED FOR ANY
PURPOSE OTHER THAN THE PURPOSE FOR WHICH BGC GENERATED IT. BGC SHALL HAVE NO LIABILITYFOR ANY DAMAGES OR LOSS ARISING IN ANY WAY FROM ANY USE OR MODIFICATION OF THIS DOCUMENTNOT AUTHORIZED BY BGC. ANY USE OF OR RELIANCE UPON THIS DOCUMENT OR ITS CONTENT BY THIRDPARTIES SHALL BE AT SUCH THIRD PARTIES' SOLE RISK.
SCALE:
DRAWN BY:
REV.:
X:\P
roje
cts\
1197
\001
\STA
GE_
10_T
AILI
NG
S_EM
BAN
KMEN
T\PR
OD
UC
TIO
N\IF
C\2
0140
619_
IFC
_REV
0_ST
AGE_
10_T
AILI
NG
S_EM
BAN
KMEN
T\M
PMC
-XD
-06-
03_R
EV0.
dwg
Lay
out:
D S
IZE
Plo
t Dat
e Ju
l 25
14 T
ime:
2:1
7 PM
REV. NO. YY DRAWN DESIGN CHECK APPROVED REVISION / ISSUED DESCRIPTIONSCHECK DRAWING:
DWG NO.:
DESIGN BY: CHECK DESIGN:
LEAD ENGINEER: APPROVAL DATE:
PROJECT MANAGER: APPROVAL DATE:
REV. NO. DRAWN DESIGN CHECK REVISION / ISSUED DESCRIPTIONS
REV
ISIO
N IN
FOR
MAT
ION MM DD YY MM DD
THIS BAR
MEASU
RES 100 m
m AT FU
LL SIZE. ALL SCALES R
EFEREN
CED
TO FU
LL SIZE.
PROJECT:
TITLE:
CLIENT:
AN APPLIED EARTH SCIENCES COMPANY
APPROVEDGCB
0MPMC-XD-06-031:1,000
STAGE 10 SOUTH EMBANKMENT AND MAIN EMBANKMENTCREST EL. 972.5 M - INSTRUMENTATION PLAN
MOUNT POLLEY MINE TAILINGS STORAGE FACILITY0 07 GCB TM TM DD ISSUED FOR CONSTRUCTION
CJT/LS
TM BB
TM 2014/07/25
DD 2014/07/25
14 25
####
THIS DRAWING MAY HAVE BEEN REDUCED. ALL SCALE NOTATIONSINDICATED ARE BASED ON ORIGINAL FORMAT DRAWINGS.
0 755025SCALE 1:1,000
METRES
25
ISSUED FOR CONSTRUCTION
E 594,750E 594,750
E 595,000E 595,000
E 595,250E 595,250
N 5,818,250 N 5,818,250
N 5,818,500 N 5,818,500
VIBRATING WIRE AND SLOPE INCLINOMETER LOCATIONS(SEE NOTE 1)
ID
E01
E02
E03
E04
E05
E06/E07
I01
I02
I05/I06
I07
N01
SI14-07
SI14-08
EASTING (m)
595,438.0
595,402.1
595,402.0
595,396.1
595,386.7
595,467.1
594,808.4
594,805.8
594,786.1
594,791.7
595,062.9
595,059.3
594,779.9
NORTHING (m)
5,818,310.0
5,818,352.4
5,818,349.1
5,818,360.6
5,818,370.7
5,818,272.0
5,818,408.0
5,818,400.0
5,818,343.0
5,818,364.1
5,818,234.1
5,818,224.8
5,818,334.1
E01EXISTING VIBRATING WIREPIEZOMETER LOCATION
LEGEND
PROPOSED VIBRATING WIREPIEZOMETER LOCATIONPROPOSED SLOPEINCLINOMETER LOCATION
N01
SI14-07
STATION MARKER
m
SLOPE TIES INTO EXISTINGBUTTRESS (SHOWN AT 1.3H:1V)
SLOPE VARIES (SHOWN AT 1.5H:1V)
SLOPE VARIES (SHOWN AT 1.3H:1V)
SLOPE VARIES (SHOWN AT 1.5H:1V)
SLOPE VARIES (SHOWN AT 1.3H:1V)
* *
DITCH
PIPE

1+80
0
1+90
0
2+00
0
2+10
0
2+20
0
2+30
0
2+40
0
2+50
0
SI11-01SI11-02 K03
SI14-06
SI14-05
SI14-04
A01
A02
A03
A04
A05
A06
A07
A08
A09
A10
A11
A12
A13A14
A15
B01
B02B03
B04
B05
B06
B07
B08
C01C02
C03
C04
C05
C06
C07C08
C09
C10
K01/K02B11/B12/B13
A19/A20/A21
A16/A17/A18
C11/C12
TAILINGS STORAGE FACILITYRECLAIM WATER POND EL. 966.4 m (JUNE 2014)
BOOTJACK-MOREHEADCONNECTOR ROAD
MAIN EMBANKMENT SEEPAGECOLLECTION POND
(TO BE RELOCATED IN 2015)
MAIN EMBANKMENTSETTING OUT LINE(S.O.L.)
SEEPAGE RECYCLE SUMP
STAGE 10 CREST EL. 972.5 m
ABR POND
THIS DRAWING MAY HAVE BEEN REDUCED. ALL SCALE NOTATIONSINDICATED ARE BASED ON ORIGINAL FORMAT DRAWINGS.
0 755025SCALE 1:1,000
METRES
25
SCALE:
DRAWN BY:
REV.:
X:\P
roje
cts\
1197
\001
\STA
GE_
10_T
AILI
NG
S_EM
BAN
KMEN
T\PR
OD
UC
TIO
N\IF
C\2
0140
619_
IFC
_REV
0_ST
AGE_
10_T
AILI
NG
S_EM
BAN
KMEN
T\M
PMC
-XD
-06-
04_R
EV0.
dwg
Lay
out:
D S
IZE
Plo
t Dat
e Ju
l 25
14 T
ime:
2:3
5 PM
REV. NO. YY DRAWN DESIGN CHECK APPROVED REVISION / ISSUED DESCRIPTIONSCHECK DRAWING:
DWG NO.:
DESIGN BY: CHECK DESIGN:
LEAD ENGINEER: APPROVAL DATE:
PROJECT MANAGER: APPROVAL DATE:
REV. NO. DRAWN DESIGN CHECK REVISION / ISSUED DESCRIPTIONS
REV
ISIO
N IN
FOR
MAT
ION MM DD YY MM DD
THIS BAR
MEASU
RES 100 m
m AT FU
LL SIZE. ALL SCALES R
EFEREN
CED
TO FU
LL SIZE.
PROJECT:
TITLE:
CLIENT:
AN APPLIED EARTH SCIENCES COMPANY
APPROVEDGCB
0MPMC-XD-06-041:1,000
STAGE 10 MAIN EMBANKMENT CREST EL. 972.5 M- INSTRUMENTATION PLAN
MOUNT POLLEY MINE TAILINGS STORAGE FACILITY0 07 GCB TM TM DD ISSUED FOR CONSTRUCTION
CJT/LS
TM BB
TM 2014/07/25
DD 2014/07/25
14 25
####
ISSUED FOR CONSTRUCTION
NOTES:1. STARRED COORDINATES WERE ESTIMATED FROM PROJECT PLAN MAPS; NO SURVEYED
COORDINATES WERE AVAILABLE.2. ALL DIMENSIONS ARE IN METRES UNLESS OTHERWISE NOTED.3. THIS DRAWING IS TO BE READ IN CONJUNCTION WITH ACCOMPANYING DRAWINGS AND
SPECIFICATIONS. THE CONTRACTOR SHALL IMMEDIATELY NOTIFY THE ENGINEER SHOULDUNCERTAINTIES ARISE WITH THE DRAWINGS, SCOPE, AND/OR TECHNICAL SPECIFICATIONS.
4. BASE TOPOGRAPHIC DATA BASED ON FLYOVER DATA PROVIDED BY MPMC, DATED OCTOBER 2013.CONTOUR INTERVAL IS 1 m.
5. PROJECTION IS UTM NAD83 ZONE 10.6. UNLESS BGC AGREES OTHERWISE IN WRITING, THIS DRAWING SHALL NOT BE MODIFIED OR USED
FOR ANY PURPOSE OTHER THAN THE PURPOSE FOR WHICH BGC GENERATED IT. BGC SHALL HAVENO LIABILITY FOR ANY DAMAGES OR LOSS ARISING IN ANY WAY FROM ANY USE OR MODIFICATIONOF THIS DOCUMENT NOT AUTHORIZED BY BGC. ANY USE OF OR RELIANCE UPON THIS DOCUMENTOR ITS CONTENT BY THIRD PARTIES SHALL BE AT SUCH THIRD PARTIES' SOLE RISK.
E 59
5,500
E 59
5,500
E 59
5,750
E 59
5,750
E 59
6,000
E 59
6,000
E 59
6,250
E 59
6,250
N 5,818,250
N 5,818,250
N 5,818,500
N 5,818,500
N 5,818,750
N 5,818,750
VIBRATING WIRE AND SLOPE INCLINOMETER LOCATIONS(SEE NOTE 1)
ID
A01
A02
A03
A04
A05
A06
A07
A08
EASTING (m)
595,592.0
595,584.0
595,601.0
595,606.0
595,589.0
595,601.0
595,626.0
595,648.0
NORTHING (m)
5,818,492.0
5,818,505.0
5,818,485.0
5,818,475.0
5,818,495.0
5,818,478.0
5,818,455.0
5,818,453.0
VIBRATING WIRE AND SLOPE INCLINOMETER LOCATIONS(SEE NOTE 1)
ID
A09
A10
A11
A12
A13
A14
A15
A16/A17/A18
EASTING (m)
595,626.0
595,597.0
595,627.0
595,579.0
595,594.8
595,592.7
595,569.9
595,604.9
NORTHING (m)
5,818,447.0
5,818,488.0
5,818,446.0
5,818,515.0
5,818,493.6
5,818,495.8
5,818,496.4
5,818,410.0
A01EXISTING VIBRATING WIRE PIEZOMETER LOCATION
LEGENDPROPOSED VIBRATING WIRE PIEZOMETER LOCATION
PROPOSED SLOPE INCLINOMETER LOCATION
SI12-01EXISTING SLOPE INCLINOMETER LOCATION
K03
SI14-05
VIBRATING WIRE AND SLOPE INCLINOMETER LOCATIONS(SEE NOTE 1)
ID
A19/A20/A21
B01
B02
B03
B04
B05
B06
B07
EASTING (m)
595,686.4
595,797.0
595,795.0
595,785.0
595,790.0
595,807.0
595,843.0
595,787.0
NORTHING (m)
5,818,422.5
5,818,623.0
5,818,628.0
5,818,628.0
5,818,628.0
5,818,610.0
5,818,566.0
5,818,633.0
MAIN EMBANKMENTSEEPAGE RECYCLE PIPE
BUTTRESS RAISE(EL. 931 m)
BUTTRESS RAISE(EL. 931 m TO 940 m)
2.25% GRADE
BUTTRESS RAISE(EL. 940 m TO 945 m)
1.65% GRADE
BUTTRESSGRADE BREAK
BUTTRESSGRADE BREAK
SLOPE VARIES (SHOWN AT 1.3H:1V)
VIBRATING WIRE AND SLOPE INCLINOMETER LOCATIONS(SEE NOTE 1)
ID
B08
B11/B12/B13
C01
C02
C03
C04
C05
C06
EASTING (m)
595,809.0
595,850.1
595,474.0
595,480.0
595,472.0
595,509.0
595,478.0
595,509.0
NORTHING (m)
5,818,598.0
5,818,553.5
5,818,401.0
5,818,399.0
5,818,403.0
5,818,368.0
5,818,392.0
5,818,350.0
VIBRATING WIRE AND SLOPE INCLINOMETER LOCATIONS(SEE NOTE 1)
ID
C07
C08
C09
C10
C11/C12
K01/K02
K03
SI01-02
EASTING (m)
595,510.0
595,514.0
595,465.4
595,471.0
595,532.8
596,026.5
596,007.5
595,589.1
NORTHING (m)
5,818,366.0
5,818,360.0
5,818,416.6
5,818,409.0
5,818,308.5
5,818,697.0
5,818,715.7
5,818,401.0
STATION MARKER
m
VIBRATING WIRE AND SLOPE INCLINOMETER LOCATIONS(SEE NOTE 1)
ID
SI06-01
SI06-02
SI06-03
SI11-01
SI11-02
SI14-04
SI14-05
SI14-06
EASTING (m)
595,649.4
595,733.6
595,814.4
595,526.8
595,997.5
596,031.6
595,823.7
595,524.1
NORTHING (m)
5,818,400.0
5,818,463.0
5,818,521.0
5,818,353.0
5,818,716.0
5,818,683.7
5,818,577.5
5,818,302.1
SLOPE VARIES (SHOWN AT 1.5H:1V)
SLOPE VARIES (SHOWN AT 1.3H:1V)
SLOPE VARIES (SHOWN AT 1.5H:1V)
* *
* *
* *
* *
* *
* *
* *
* *
* *
* *
* *
* *
* *
* *
* *
* *
* *
* *
* *
* *
* *
* *
* *
* *
* *
* *
* *
* *
SLOPE TIES INTO EXISTINGBUTTRESS (SHOWN AT 1.3H:1V)
TOE DRAIN COLLECTION SUMP(TO BE RELOCATED OR EXTENDED)
DITCH
BUTTRESS LOCALLY NARROWED TOACCOMMODATE INFRASTRUCTURE
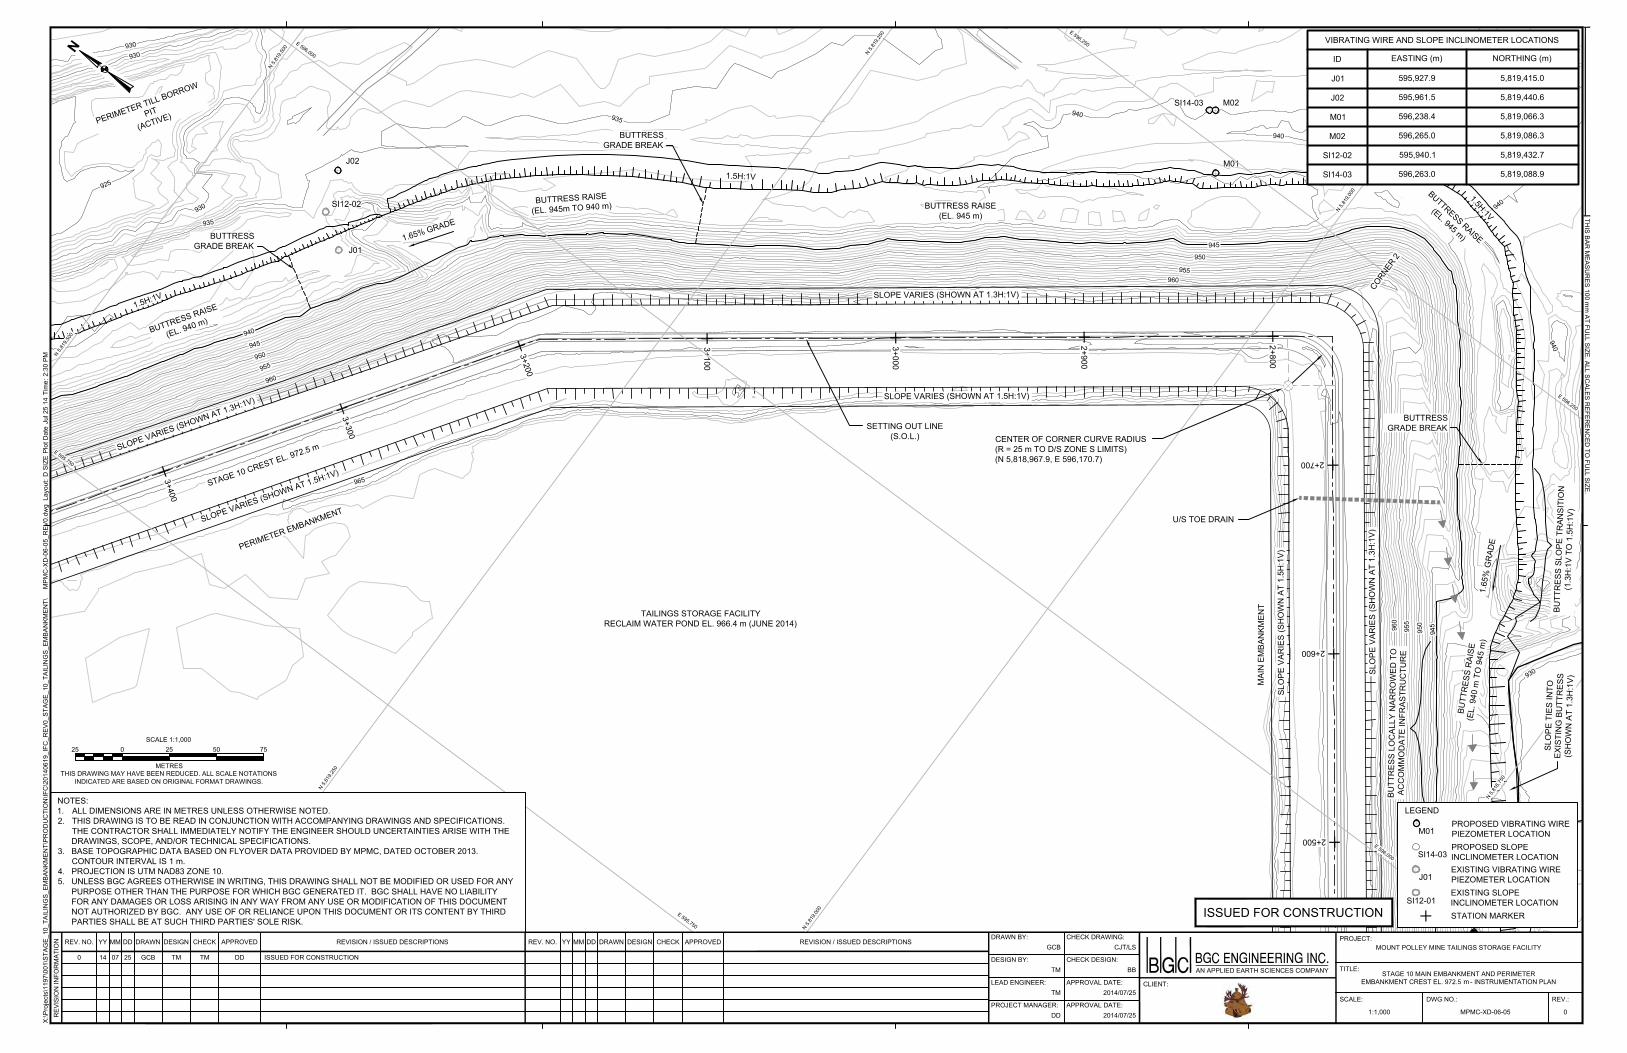
CORNER 2
2+500
2+600
2+700
2+800
2+900
3+000
3+100
3+200
3+300
3+400
M01
M02
J02
SI14-03
J01
TAILINGS STORAGE FACILITYRECLAIM WATER POND EL. 966.4 m (JUNE 2014)
MAI
N E
MBA
NKM
ENT
PERIMETER EMBANKMENT
PERIMETER TILL BORROW
PIT
(ACTIVE)
U/S TOE DRAIN
CENTER OF CORNER CURVE RADIUS(R = 25 m TO D/S ZONE S LIMITS)(N 5,818,967.9, E 596,170.7)
SETTING OUT LINE(S.O.L.)
STAGE 10 CREST EL. 972.5 m
THIS DRAWING MAY HAVE BEEN REDUCED. ALL SCALE NOTATIONSINDICATED ARE BASED ON ORIGINAL FORMAT DRAWINGS.
0 755025SCALE 1:1,000
METRES
25
SCALE:
DRAWN BY:
REV.:
X:\P
roje
cts\
1197
\001
\STA
GE_
10_T
AILI
NG
S_EM
BAN
KMEN
T\PR
OD
UC
TIO
N\IF
C\2
0140
619_
IFC
_REV
0_ST
AGE_
10_T
AILI
NG
S_EM
BAN
KMEN
T\M
PMC
-XD
-06-
05_R
EV0.
dwg
Lay
out:
D S
IZE
Plo
t Dat
e Ju
l 25
14 T
ime:
2:3
0 PM
REV. NO. YY DRAWN DESIGN CHECK APPROVED REVISION / ISSUED DESCRIPTIONSCHECK DRAWING:
DWG NO.:
DESIGN BY: CHECK DESIGN:
LEAD ENGINEER: APPROVAL DATE:
PROJECT MANAGER: APPROVAL DATE:
REV. NO. DRAWN DESIGN CHECK REVISION / ISSUED DESCRIPTIONS
REV
ISIO
N IN
FOR
MAT
ION MM DD YY MM DD
THIS BAR
MEASU
RES 100 m
m AT FU
LL SIZE. ALL SCALES R
EFEREN
CED
TO FU
LL SIZE.
PROJECT:
TITLE:
CLIENT:
AN APPLIED EARTH SCIENCES COMPANY
APPROVEDGCB
0MPMC-XD-06-051:1,000
STAGE 10 MAIN EMBANKMENT AND PERIMETEREMBANKMENT CREST EL. 972.5 M - INSTRUMENTATION PLAN
MOUNT POLLEY MINE TAILINGS STORAGE FACILITY0 07 GCB TM TM DD ISSUED FOR CONSTRUCTION
CJT/LS
TM BB
TM 2014/07/25
DD 2014/07/25
14 25
####
ISSUED FOR CONSTRUCTION
NOTES:1. ALL DIMENSIONS ARE IN METRES UNLESS OTHERWISE NOTED.2. THIS DRAWING IS TO BE READ IN CONJUNCTION WITH ACCOMPANYING DRAWINGS AND SPECIFICATIONS.
THE CONTRACTOR SHALL IMMEDIATELY NOTIFY THE ENGINEER SHOULD UNCERTAINTIES ARISE WITH THEDRAWINGS, SCOPE, AND/OR TECHNICAL SPECIFICATIONS.
3. BASE TOPOGRAPHIC DATA BASED ON FLYOVER DATA PROVIDED BY MPMC, DATED OCTOBER 2013.CONTOUR INTERVAL IS 1 m.
4. PROJECTION IS UTM NAD83 ZONE 10.5. UNLESS BGC AGREES OTHERWISE IN WRITING, THIS DRAWING SHALL NOT BE MODIFIED OR USED FOR ANY
PURPOSE OTHER THAN THE PURPOSE FOR WHICH BGC GENERATED IT. BGC SHALL HAVE NO LIABILITYFOR ANY DAMAGES OR LOSS ARISING IN ANY WAY FROM ANY USE OR MODIFICATION OF THIS DOCUMENTNOT AUTHORIZED BY BGC. ANY USE OF OR RELIANCE UPON THIS DOCUMENT OR ITS CONTENT BY THIRDPARTIES SHALL BE AT SUCH THIRD PARTIES' SOLE RISK.
E 595,750
E 595,750
E 596,000
E 596,000
E 596,250
E 596,250
N 5,81
8,750
N 5,81
9,000
N 5,81
9,000
N 5,81
9,250
N 5,81
9,250
N 5,81
9,500
N 5,81
9,500
VIBRATING WIRE AND SLOPE INCLINOMETER LOCATIONS
ID
J01
J02
M01
M02
SI12-02
SI14-03
EASTING (m)
595,927.9
595,961.5
596,238.4
596,265.0
595,940.1
596,263.0
NORTHING (m)
5,819,415.0
5,819,440.6
5,819,066.3
5,819,086.3
5,819,432.7
5,819,088.9
J01EXISTING VIBRATING WIREPIEZOMETER LOCATION
LEGENDPROPOSED VIBRATING WIREPIEZOMETER LOCATIONPROPOSED SLOPEINCLINOMETER LOCATION
SI12-01EXISTING SLOPEINCLINOMETER LOCATION
M01
SI14-03
BUTT
RES
S R
AISE
(EL.
940
m T
O 9
45 m
)1.
65%
GR
ADE
BUTTRESS RAISE
(EL. 945 m)
BUTTRESS RAISE(EL. 945 m)
BUTTRESS RAISE
(EL. 945m TO 940 m)
1.65% GRADE
BUTTRESS RAISE
(EL. 940 m)
1.5H:1V
1.5H:1V
1.5H:1V
BUTTRESSGRADE BREAK
BUTTRESSGRADE BREAK
BUTTRESSGRADE BREAK
SLO
PE V
ARIE
S (S
HO
WN
AT
1.3H
:1V)
STATION MARKER
SLO
PE T
IES
INTO
EXIS
TIN
G B
UTT
RES
S(S
HO
WN
AT
1.3H
:1V)
BUTT
RES
S SL
OPE
TR
ANSI
TIO
N(1
.3H
:1V
TO 1
.5H
:1V)
m
SLO
PE V
ARIE
S (S
HO
WN
AT
1.5H
:1V)
SLOPE VARIES (SHOWN AT 1.3H:1V)
SLOPE VARIES (SHOWN AT 1.5H:1V)
SLOPE VARIES (SHOWN AT 1.3H:1V)
SLOPE VARIES (SHOWN AT 1.5H:1V)
BUTT
RES
S LO
CAL
LY N
ARR
OW
ED T
OAC
CO
MM
OD
ATE
INFR
ASTR
UC
TUR
E

3+500
3+600
3+700
3+800
3+900
4+000
4+100
4+200
SI11-04
SI12-01
H03
D08
SI14-02
D01
D02
D03
D04
D05 H01
H02
D06/D07
TAILINGS STORAGE FACILITYRECLAIM WATER POND EL. 966.4 m (JUNE 2014)
PERIMETER EMBANKMENT
PERIMETER EMBANKMENTSEEPAGE COLLECTION POND
(TO BE RELOCATED IN 2015)
PERIMETER TILL BORROW PIT(ACTIVE)
SETTING OUT LINE(S.O.L.)
STAGE 10 CREST EL. 972.5 m
PERIMETER EMBANKMENTSEEPAGE RECYCLE PIPE
SCALE:
DRAWN BY:
REV.:
X:\P
roje
cts\
1197
\001
\STA
GE_
10_T
AILI
NG
S_EM
BAN
KMEN
T\PR
OD
UC
TIO
N\IF
C\2
0140
619_
IFC
_REV
0_ST
AGE_
10_T
AILI
NG
S_EM
BAN
KMEN
T\M
PMC
-XD
-06-
06_R
EV0.
dwg
Lay
out:
D S
IZE
Plo
t Dat
e Ju
l 25
14 T
ime:
2:4
1 PM
REV. NO. YY DRAWN DESIGN CHECK APPROVED REVISION / ISSUED DESCRIPTIONSCHECK DRAWING:
DWG NO.:
DESIGN BY: CHECK DESIGN:
LEAD ENGINEER: APPROVAL DATE:
PROJECT MANAGER: APPROVAL DATE:
REV. NO. DRAWN DESIGN CHECK REVISION / ISSUED DESCRIPTIONS
REV
ISIO
N IN
FOR
MAT
ION MM DD YY MM DD
THIS BAR
MEASU
RES 100 m
m AT FU
LL SIZE. ALL SCALES R
EFEREN
CED
TO FU
LL SIZE.
PROJECT:
TITLE:
CLIENT:
AN APPLIED EARTH SCIENCES COMPANY
APPROVEDGCB
0MPMC-XD-06-061:1,000
STAGE 10 PERIMETER EMBANKMENT CREST EL. 972.5 M- INSTRUMENTATION PLAN - SHEET 1
MOUNT POLLEY MINE TAILINGS STORAGE FACILITY0 07 GCB TM TM DD ISSUED FOR CONSTRUCTION
CJT/LS
TM BB
TM 2014/07/25
DD 2014/07/25
14 25
####
ISSUED FOR CONSTRUCTION
NOTES:1. STARRED COORDINATES WERE ESTIMATED FROM PROJECT PLAN MAPS; NO SURVEYED COORDINATES
WERE AVAILABLE.2. ALL DIMENSIONS ARE IN METRES UNLESS OTHERWISE NOTED.3. THIS DRAWING IS TO BE READ IN CONJUNCTION WITH ACCOMPANYING DRAWINGS AND SPECIFICATIONS.
THE CONTRACTOR SHALL IMMEDIATELY NOTIFY THE ENGINEER SHOULD UNCERTAINTIES ARISE WITH THEDRAWINGS, SCOPE, AND/OR TECHNICAL SPECIFICATIONS.
4. BASE TOPOGRAPHIC DATA BASED ON FLYOVER DATA PROVIDED BY MPMC, DATED OCTOBER 2013.CONTOUR INTERVAL IS 1 m.
5. PROJECTION IS UTM NAD83 ZONE 10.6. UNLESS BGC AGREES OTHERWISE IN WRITING, THIS DRAWING SHALL NOT BE MODIFIED OR USED FOR ANY
PURPOSE OTHER THAN THE PURPOSE FOR WHICH BGC GENERATED IT. BGC SHALL HAVE NO LIABILITYFOR ANY DAMAGES OR LOSS ARISING IN ANY WAY FROM ANY USE OR MODIFICATION OF THIS DOCUMENTNOT AUTHORIZED BY BGC. ANY USE OF OR RELIANCE UPON THIS DOCUMENT OR ITS CONTENT BY THIRDPARTIES SHALL BE AT SUCH THIRD PARTIES' SOLE RISK.
E 595,250
E 595,250
E 595,500
E 595,500
E 595,750
E 595,750
N 5,819,500
N 5,819,500
N 5,819,750
N 5,819,750
N 5,820,000
N 5,820,000
THIS DRAWING MAY HAVE BEEN REDUCED. ALL SCALE NOTATIONSINDICATED ARE BASED ON ORIGINAL FORMAT DRAWINGS.
0 755025SCALE 1:1,000
METRES
25
VIBRATING WIRE AND SLOPE INCLINOMETER LOCATIONS(SEE NOTE 1)
ID
D01
D02
D03
D04
D05
D06/D07
D08
H01
H02
H03
SI11-04
SI12-01
SI14-02
EASTING (m)
595,335.0
595,355.0
595,303.7
595,300.3
595,288.1
595,410.3
595,355.7
595,607.5
595,614.1
595,659.8
595,408.4
595,424.3
595,657.1
NORTHING (m)
5,819,790.0
5,819,740.0
5,819,749.1
5,819,744.5
5,819,719.9
5,819,782.5
5,819,847.9
5,819,513.0
5,819,522.9
5,819,601.3
5,819,780.0
5,819,799.4
5,819,603.1
BUTTRESS RAISE(EL. 940 m)
1.5H:1V1.5H:1V
BUTTRESS RAISE(EL. 940 m)
SLOPE VARIES (SHOWN AT 1.3H:1V)
m
SLOPE VARIES (SHOWN AT 1.5H:1V)
SLOPE VARIES (SHOWN AT 1.3H:1V)
SLOPE VARIES (SHOWN AT 1.5H:1V)
* *
* *
D01EXISTING VIBRATING WIREPIEZOMETER LOCATION
LEGENDPROPOSED VIBRATING WIREPIEZOMETER LOCATIONPROPOSED SLOPEINCLINOMETER LOCATION
SI12-01EXISTING SLOPEINCLINOMETER LOCATION
H03
SI14-02
STATION MARKER
DITCH
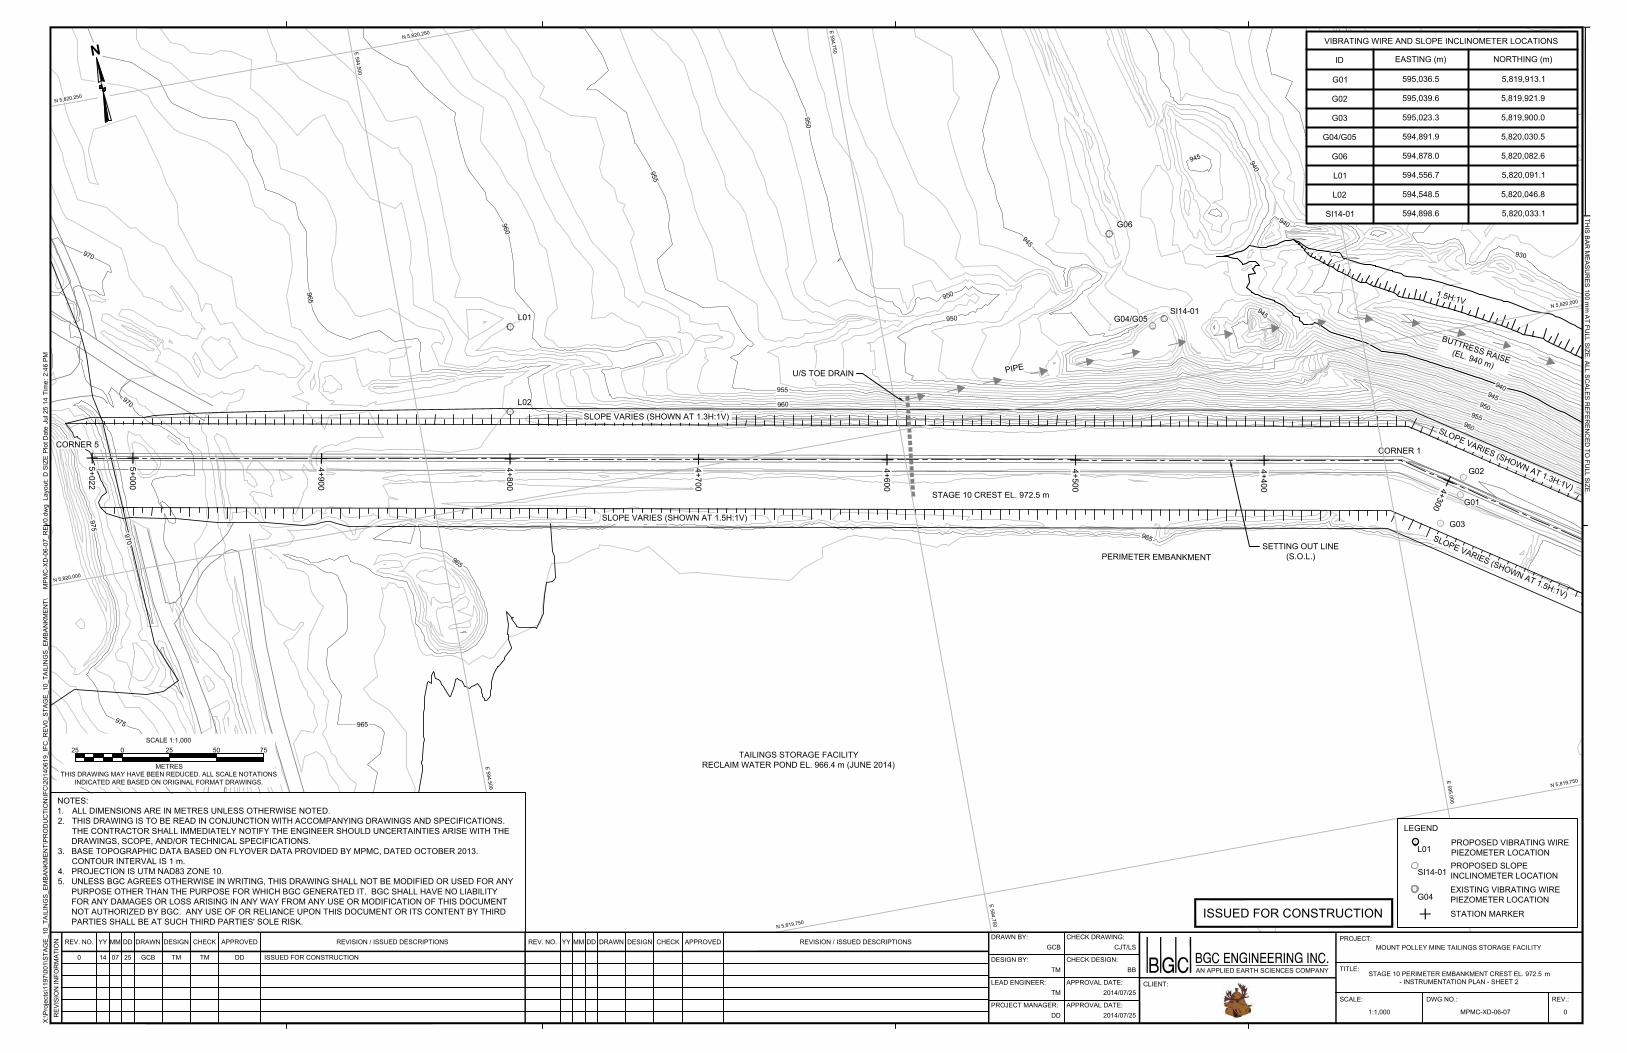
4+300
4+400
4+500
4+600
4+700
4+800
4+900
5+000
5+022
G06
L02
L01SI14-01
G01
G02
G03
G04/G05
CORNER 1
U/S TOE DRAIN
TAILINGS STORAGE FACILITYRECLAIM WATER POND EL. 966.4 m (JUNE 2014)
PERIMETER EMBANKMENTSETTING OUT LINE
(S.O.L.)
STAGE 10 CREST EL. 972.5 m
SCALE:
DRAWN BY:
REV.:
X:\P
roje
cts\
1197
\001
\STA
GE_
10_T
AILI
NG
S_EM
BAN
KMEN
T\PR
OD
UC
TIO
N\IF
C\2
0140
619_
IFC
_REV
0_ST
AGE_
10_T
AILI
NG
S_EM
BAN
KMEN
T\M
PMC
-XD
-06-
07_R
EV0.
dwg
Lay
out:
D S
IZE
Plo
t Dat
e Ju
l 25
14 T
ime:
2:4
6 PM
REV. NO. YY DRAWN DESIGN CHECK APPROVED REVISION / ISSUED DESCRIPTIONSCHECK DRAWING:
DWG NO.:
DESIGN BY: CHECK DESIGN:
LEAD ENGINEER: APPROVAL DATE:
PROJECT MANAGER: APPROVAL DATE:
REV. NO. DRAWN DESIGN CHECK REVISION / ISSUED DESCRIPTIONS
REV
ISIO
N IN
FOR
MAT
ION MM DD YY MM DD
THIS BAR
MEASU
RES 100 m
m AT FU
LL SIZE. ALL SCALES R
EFEREN
CED
TO FU
LL SIZE.
PROJECT:
TITLE:
CLIENT:
AN APPLIED EARTH SCIENCES COMPANY
APPROVEDGCB
0MPMC-XD-06-071:1,000
STAGE 10 PERIMETER EMBANKMENT CREST EL. 972.5 M- INSTRUMENTATION PLAN - SHEET 2
MOUNT POLLEY MINE TAILINGS STORAGE FACILITY0 07 GCB TM TM DD ISSUED FOR CONSTRUCTION
CJT/LS
TM BB
TM 2014/07/25
DD 2014/07/25
14 25
####
ISSUED FOR CONSTRUCTION
NOTES:1. ALL DIMENSIONS ARE IN METRES UNLESS OTHERWISE NOTED.2. THIS DRAWING IS TO BE READ IN CONJUNCTION WITH ACCOMPANYING DRAWINGS AND SPECIFICATIONS.
THE CONTRACTOR SHALL IMMEDIATELY NOTIFY THE ENGINEER SHOULD UNCERTAINTIES ARISE WITH THEDRAWINGS, SCOPE, AND/OR TECHNICAL SPECIFICATIONS.
3. BASE TOPOGRAPHIC DATA BASED ON FLYOVER DATA PROVIDED BY MPMC, DATED OCTOBER 2013.CONTOUR INTERVAL IS 1 m.
4. PROJECTION IS UTM NAD83 ZONE 10.5. UNLESS BGC AGREES OTHERWISE IN WRITING, THIS DRAWING SHALL NOT BE MODIFIED OR USED FOR ANY
PURPOSE OTHER THAN THE PURPOSE FOR WHICH BGC GENERATED IT. BGC SHALL HAVE NO LIABILITYFOR ANY DAMAGES OR LOSS ARISING IN ANY WAY FROM ANY USE OR MODIFICATION OF THIS DOCUMENTNOT AUTHORIZED BY BGC. ANY USE OF OR RELIANCE UPON THIS DOCUMENT OR ITS CONTENT BY THIRDPARTIES SHALL BE AT SUCH THIRD PARTIES' SOLE RISK.
THIS DRAWING MAY HAVE BEEN REDUCED. ALL SCALE NOTATIONSINDICATED ARE BASED ON ORIGINAL FORMAT DRAWINGS.
0 755025SCALE 1:1,000
METRES
25
E 594,500
E 594,500
E 594,750
E 594,750
E 595,000
E 595,000
N 5,819,750
N 5,819,750
N 5,820,000
N 5,820,000
N 5,820,250
N 5,820,250
G04EXISTING VIBRATING WIREPIEZOMETER LOCATION
LEGEND
VIBRATING WIRE AND SLOPE INCLINOMETER LOCATIONS
ID
G01
G02
G03
G04/G05
G06
L01
L02
SI14-01
EASTING (m)
595,036.5
595,039.6
595,023.3
594,891.9
594,878.0
594,556.7
594,548.5
594,898.6
NORTHING (m)
5,819,913.1
5,819,921.9
5,819,900.0
5,820,030.5
5,820,082.6
5,820,091.1
5,820,046.8
5,820,033.1
PROPOSED VIBRATING WIREPIEZOMETER LOCATIONPROPOSED SLOPEINCLINOMETER LOCATION
L01
SI14-01
BUTTRESS RAISE(EL. 940 m)
1.5H:1V
SLOPE VARIES (SHOWN AT 1.3H:1V)
STATION MARKER
CORNER 5
m
SLOPE VARIES (SHOWN AT 1.5H:1V)
SLOPE VARIES (SHOWN AT 1.3H:1V)
SLOPE VARIES (SHOWN AT 1.5H:1V)
PIPE
Related Documents