Morphostructural development of the Eritrean rift flank (southern Red Sea) inferred from apatite fission track analysis Ernesto Abbate Dipartimento Scienze della Terra, Universita ` di Firenze, Firenze, Italy Maria Laura Balestrieri and Giulio Bigazzi CNR, Istituto di Geoscienze e Georisorse, Pisa, Italy Received 20 August 2001; revised 8 May 2002; accepted 30 May 2002; published 23 November 2002. [1] The Red Sea is one of the best exposed young rift basins in the world. Its flanks on both the African and Arabian sides are characterized by basement uplifts parallel to the margins and by active erosion. Through the integration of 37 new apatite fission track (FT) analyses and regional geology, we elucidate the uplift and denudational history of the Eritrean continental margin along the southern Red Sea and, in particular, the development, timing, and past and present morphostructural features of its onshore portion. FT data indicate that at around 20 Ma, the Eritrean margin was affected by a crustal cooling event due to a postrifting accelerated phase of denudation. This cooling has the same age as those already detected on the conjugate Arabian margin (Yemen and Saudi Arabia). FT ages increase from 10–20 to 300–400 Ma with increasing distance and elevation from the coastal areas toward the interior. This trend indicates a diminishing amount of eroded section in the same direction. We use FT and structural data to define the position of the main border fault along the margin where the original scarp was located. We estimate rates of vertical denudation of 190–200 m/Myr at the border fault and of 60–70 m/Myr on the plateau. On the basis of these new data, we argue against an Oligocene tectonic unroofing of the margin through a low-angle detachment assumed by previous authors, but we maintain the essential role of the erosional denudation in the development of present margin morphology. INDEX TERMS: 8109 Tectonophysics: Continental tectonics—extensional (0905); 1035 Geochemistry: Geochronology; 9305 Information Related to Geographic Region: Africa; KEYWORDS: apatite fission tracks, southern Red Sea, thermal histories, denudation rates, landscape evolution, rift escarpment Citation: Abbate, E., M. L. Balestrieri, and G. Bigazzi, Morphostructural development of the Eritrean rift flank (southern Red Sea) inferred from apatite fission track analysis, J. Geophys. Res., 107(B11), 2319, doi:10.1029/2001JB001009, 2002. 1. Introduction [2] The Red Sea is a young ocean basin formed as a result of rifting of the African (Nubian) and Arabian lithospheric plates, and is the northern arm of the Red Sea–Ethiopian Rift – Gulf of Aden triple junction. The continental margins bordering the Red Sea are among the youngest in the world since rifting commenced during the earliest Miocene [Cochran and Martinez, 1988]. They are characterized by large uplifted rift flanks that expose basement, volcanic and sedimentary rocks. The deformational and erosional history of these highs can be used to shed light on factors control- ling the rift architecture and development, and the inter- action among tectonics, erosion and morphostructures at a rift margin. [3] The Eritrean continental margin along the southern Red Sea (Figures 1 and 2) has morphology typical of high- elevation rifted margins [Bohannon et al., 1989] with a steeply rising escarpment separating a coastal area from a high plateau. Since the latter gently declines inland toward the Nubian shield, the resulting feature along the plateau rim is that of an asymmetric marginal upwarp separating the coastal lowlands from the continental interior [Abul-Hag- gag, 1961]. The plateau reaches altitudes of more than 2500 m and is linked to coastal areas through a narrow (c. 50 km) NS trending escarpment. Apatite fission track (FT) data help assess qualitatively the morphological evolution and quan- titatively the amount of denudation through reconstruction of the thermal history of the margin. Cooling of the upper crust on a passive margin can be produced by reestablish- ment of normal conditions after the thermal disturbance produced by rift processes or by postrifting erosion. Gal- lagher et al. [1994] demonstrated that the thermal effect of the rift processes becomes relatively insignificant at a short distance (less than 100 km) from the rift zone. Because the onshore portion of the Eritrean margin is at greater distance from the rift zone, FT data provide reliable constraints on postrifting erosional denudation. [4] For this margin and in general for the western (Nubian) continental margin of the Red Sea from Sudan JOURNAL OF GEOPHYSICAL RESEARCH, VOL. 107, NO. B11, 2319, doi:10.1029/2001JB001009, 2002 Copyright 2002 by the American Geophysical Union. 0148-0227/02/2001JB001009$09.00 ETG 12 - 1

Welcome message from author
This document is posted to help you gain knowledge. Please leave a comment to let me know what you think about it! Share it to your friends and learn new things together.
Transcript

Morphostructural development of the Eritrean rift flank
(southern Red Sea) inferred from apatite fission track analysis
Ernesto AbbateDipartimento Scienze della Terra, Universita di Firenze, Firenze, Italy
Maria Laura Balestrieri and Giulio BigazziCNR, Istituto di Geoscienze e Georisorse, Pisa, Italy
Received 20 August 2001; revised 8 May 2002; accepted 30 May 2002; published 23 November 2002.
[1] The Red Sea is one of the best exposed young rift basins in the world. Its flanks onboth the African and Arabian sides are characterized by basement uplifts parallel to themargins and by active erosion. Through the integration of 37 new apatite fission track (FT)analyses and regional geology, we elucidate the uplift and denudational history of theEritrean continental margin along the southern Red Sea and, in particular, thedevelopment, timing, and past and present morphostructural features of its onshoreportion. FT data indicate that at around 20 Ma, the Eritrean margin was affected by acrustal cooling event due to a postrifting accelerated phase of denudation. This cooling hasthe same age as those already detected on the conjugate Arabian margin (Yemen and SaudiArabia). FT ages increase from 10–20 to 300–400 Ma with increasing distance andelevation from the coastal areas toward the interior. This trend indicates a diminishingamount of eroded section in the same direction. We use FT and structural data to define theposition of the main border fault along the margin where the original scarp was located.We estimate rates of vertical denudation of 190–200 m/Myr at the border fault and of�60–70 m/Myr on the plateau. On the basis of these new data, we argue against anOligocene tectonic unroofing of the margin through a low-angle detachment assumed byprevious authors, but we maintain the essential role of the erosional denudation in thedevelopment of present margin morphology. INDEX TERMS: 8109 Tectonophysics: Continental
tectonics—extensional (0905); 1035 Geochemistry: Geochronology; 9305 Information Related to Geographic
Region: Africa; KEYWORDS: apatite fission tracks, southern Red Sea, thermal histories, denudation rates,
landscape evolution, rift escarpment
Citation: Abbate, E., M. L. Balestrieri, and G. Bigazzi, Morphostructural development of the Eritrean rift flank (southern Red Sea)
inferred from apatite fission track analysis, J. Geophys. Res., 107(B11), 2319, doi:10.1029/2001JB001009, 2002.
1. Introduction
[2] The Red Sea is a young ocean basin formed as a resultof rifting of the African (Nubian) and Arabian lithosphericplates, and is the northern arm of the Red Sea–EthiopianRift–Gulf of Aden triple junction. The continental marginsbordering the Red Sea are among the youngest in the worldsince rifting commenced during the earliest Miocene[Cochran and Martinez, 1988]. They are characterized bylarge uplifted rift flanks that expose basement, volcanic andsedimentary rocks. The deformational and erosional historyof these highs can be used to shed light on factors control-ling the rift architecture and development, and the inter-action among tectonics, erosion and morphostructures at arift margin.[3] The Eritrean continental margin along the southern
Red Sea (Figures 1 and 2) has morphology typical of high-elevation rifted margins [Bohannon et al., 1989] with asteeply rising escarpment separating a coastal area from a
high plateau. Since the latter gently declines inland towardthe Nubian shield, the resulting feature along the plateau rimis that of an asymmetric marginal upwarp separating thecoastal lowlands from the continental interior [Abul-Hag-gag, 1961]. The plateau reaches altitudes of more than 2500m and is linked to coastal areas through a narrow (c. 50 km)NS trending escarpment. Apatite fission track (FT) data helpassess qualitatively the morphological evolution and quan-titatively the amount of denudation through reconstructionof the thermal history of the margin. Cooling of the uppercrust on a passive margin can be produced by reestablish-ment of normal conditions after the thermal disturbanceproduced by rift processes or by postrifting erosion. Gal-lagher et al. [1994] demonstrated that the thermal effect ofthe rift processes becomes relatively insignificant at a shortdistance (less than 100 km) from the rift zone. Because theonshore portion of the Eritrean margin is at greater distancefrom the rift zone, FT data provide reliable constraints onpostrifting erosional denudation.[4] For this margin and in general for the western
(Nubian) continental margin of the Red Sea from Sudan
JOURNAL OF GEOPHYSICAL RESEARCH, VOL. 107, NO. B11, 2319, doi:10.1029/2001JB001009, 2002
Copyright 2002 by the American Geophysical Union.0148-0227/02/2001JB001009$09.00
ETG 12 - 1
to Eritrea, no FT data were available, while they are ratherabundant for the Gulf of Suez and Egypt [Steckler andOmar, 1994; Omar and Steckler, 1995] and the eastern(Arabian) continental margin of the Red Sea [Bohannon etal., 1989; Menzies et al., 1997].[5] The Eritrean margin is a particularly suitable site for
thermochronological studies applied to landscape recon-struction. Along most rifted margins the sedimentary orvolcanic sequences that formed during the latest preriftingstages are typically removed by erosion from the onshoreportions and preserved only in offshore basins. In thesecases it is difficult, or even impossible, to establish timesand rates of rift development through field stratigraphic,structural and geomorphological methods. On the contrary,along the Eritrean margin rocks of the latest prerift stagesare found both on the high plateau and down on thelowlands. These rocks constitute a reference level thatprovides a strong geological control on the denudationalhistory inferred through FT analysis. Because the referencelevel along the escarpment between the plateau and low-lands was removed by erosion, FT data must be used toreconstruct the shape of the margin after crustal rupture.Important elements of this reconstruction are the locationand the amount of displacement of the main border faultbounding the margin rim. The distribution of FT ages acrossthe margin can discriminate between footwall and hanging-wall.[6] Because the presence of major detachments along
low-angle normal faults along the Eritrean margin is stilldebated [Talbot and Ghebreab, 1997; Mohr, 1999], theidentification of the main structures of the Eritrean escarp-ment is crucial in assessing the role of tectonic versuserosional denudation in margin evolution.
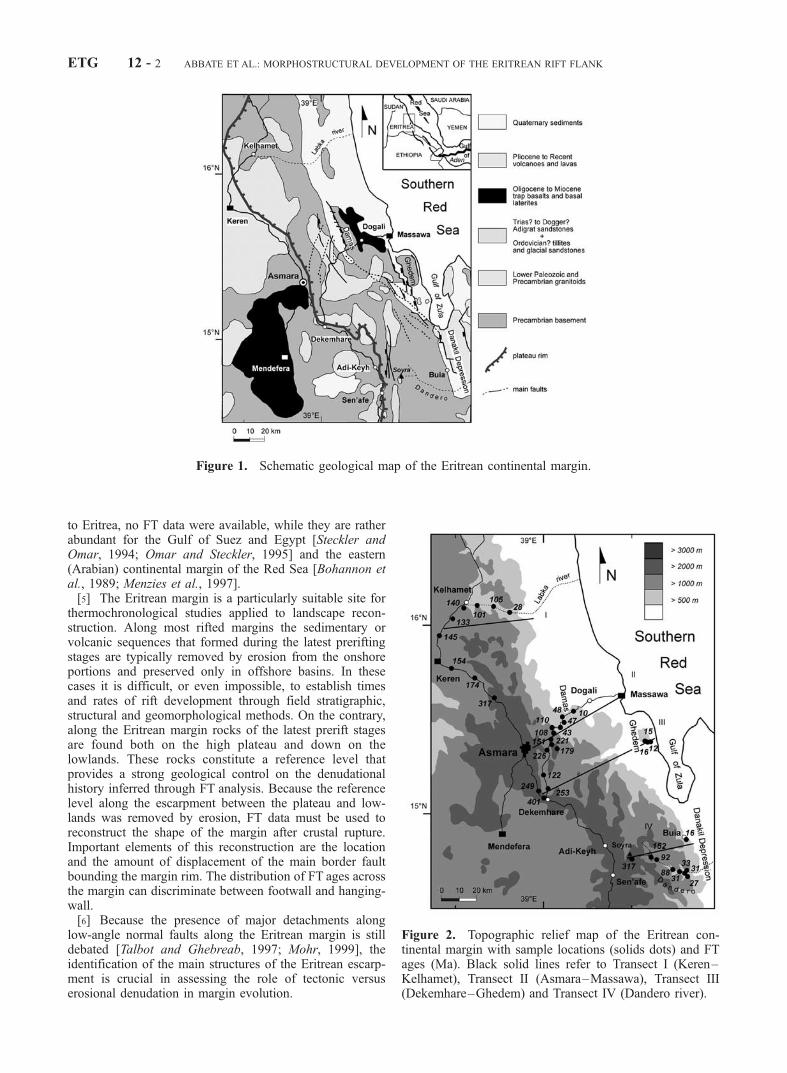
Figure 1. Schematic geological map of the Eritrean continental margin.
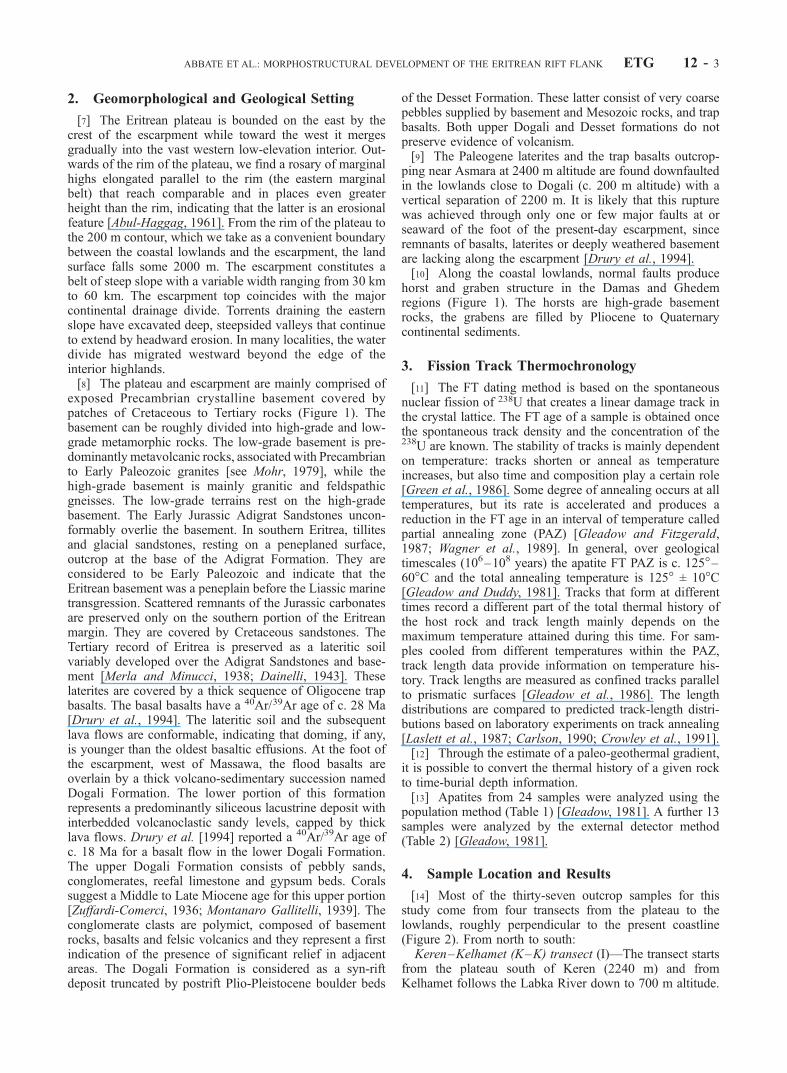
Figure 2. Topographic relief map of the Eritrean con-tinental margin with sample locations (solids dots) and FTages (Ma). Black solid lines refer to Transect I (Keren–Kelhamet), Transect II (Asmara–Massawa), Transect III(Dekemhare–Ghedem) and Transect IV (Dandero river).
ETG 12 - 2 ABBATE ET AL.: MORPHOSTRUCTURAL DEVELOPMENT OF THE ERITREAN RIFT FLANK
2. Geomorphological and Geological Setting
[7] The Eritrean plateau is bounded on the east by thecrest of the escarpment while toward the west it mergesgradually into the vast western low-elevation interior. Out-wards of the rim of the plateau, we find a rosary of marginalhighs elongated parallel to the rim (the eastern marginalbelt) that reach comparable and in places even greaterheight than the rim, indicating that the latter is an erosionalfeature [Abul-Haggag, 1961]. From the rim of the plateau tothe 200 m contour, which we take as a convenient boundarybetween the coastal lowlands and the escarpment, the landsurface falls some 2000 m. The escarpment constitutes abelt of steep slope with a variable width ranging from 30 kmto 60 km. The escarpment top coincides with the majorcontinental drainage divide. Torrents draining the easternslope have excavated deep, steepsided valleys that continueto extend by headward erosion. In many localities, the waterdivide has migrated westward beyond the edge of theinterior highlands.[8] The plateau and escarpment are mainly comprised of
exposed Precambrian crystalline basement covered bypatches of Cretaceous to Tertiary rocks (Figure 1). Thebasement can be roughly divided into high-grade and low-grade metamorphic rocks. The low-grade basement is pre-dominantly metavolcanic rocks, associated with Precambrianto Early Paleozoic granites [see Mohr, 1979], while thehigh-grade basement is mainly granitic and feldspathicgneisses. The low-grade terrains rest on the high-gradebasement. The Early Jurassic Adigrat Sandstones uncon-formably overlie the basement. In southern Eritrea, tillitesand glacial sandstones, resting on a peneplaned surface,outcrop at the base of the Adigrat Formation. They areconsidered to be Early Paleozoic and indicate that theEritrean basement was a peneplain before the Liassic marinetransgression. Scattered remnants of the Jurassic carbonatesare preserved only on the southern portion of the Eritreanmargin. They are covered by Cretaceous sandstones. TheTertiary record of Eritrea is preserved as a lateritic soilvariably developed over the Adigrat Sandstones and base-ment [Merla and Minucci, 1938; Dainelli, 1943]. Theselaterites are covered by a thick sequence of Oligocene trapbasalts. The basal basalts have a 40Ar/39Ar age of c. 28 Ma[Drury et al., 1994]. The lateritic soil and the subsequentlava flows are conformable, indicating that doming, if any,is younger than the oldest basaltic effusions. At the foot ofthe escarpment, west of Massawa, the flood basalts areoverlain by a thick volcano-sedimentary succession namedDogali Formation. The lower portion of this formationrepresents a predominantly siliceous lacustrine deposit withinterbedded volcanoclastic sandy levels, capped by thicklava flows. Drury et al. [1994] reported a 40Ar/39Ar age ofc. 18 Ma for a basalt flow in the lower Dogali Formation.The upper Dogali Formation consists of pebbly sands,conglomerates, reefal limestone and gypsum beds. Coralssuggest a Middle to Late Miocene age for this upper portion[Zuffardi-Comerci, 1936; Montanaro Gallitelli, 1939]. Theconglomerate clasts are polymict, composed of basementrocks, basalts and felsic volcanics and they represent a firstindication of the presence of significant relief in adjacentareas. The Dogali Formation is considered as a syn-riftdeposit truncated by postrift Plio-Pleistocene boulder beds
of the Desset Formation. These latter consist of very coarsepebbles supplied by basement and Mesozoic rocks, and trapbasalts. Both upper Dogali and Desset formations do notpreserve evidence of volcanism.[9] The Paleogene laterites and the trap basalts outcrop-
ping near Asmara at 2400 m altitude are found downfaultedin the lowlands close to Dogali (c. 200 m altitude) with avertical separation of 2200 m. It is likely that this rupturewas achieved through only one or few major faults at orseaward of the foot of the present-day escarpment, sinceremnants of basalts, laterites or deeply weathered basementare lacking along the escarpment [Drury et al., 1994].[10] Along the coastal lowlands, normal faults produce
horst and graben structure in the Damas and Ghedemregions (Figure 1). The horsts are high-grade basementrocks, the grabens are filled by Pliocene to Quaternarycontinental sediments.
3. Fission Track Thermochronology
[11] The FT dating method is based on the spontaneousnuclear fission of 238U that creates a linear damage track inthe crystal lattice. The FT age of a sample is obtained oncethe spontaneous track density and the concentration of the238U are known. The stability of tracks is mainly dependenton temperature: tracks shorten or anneal as temperatureincreases, but also time and composition play a certain role[Green et al., 1986]. Some degree of annealing occurs at alltemperatures, but its rate is accelerated and produces areduction in the FT age in an interval of temperature calledpartial annealing zone (PAZ) [Gleadow and Fitzgerald,1987; Wagner et al., 1989]. In general, over geologicaltimescales (106–108 years) the apatite FT PAZ is c. 125�–60�C and the total annealing temperature is 125� ± 10�C[Gleadow and Duddy, 1981]. Tracks that form at differenttimes record a different part of the total thermal history ofthe host rock and track length mainly depends on themaximum temperature attained during this time. For sam-ples cooled from different temperatures within the PAZ,track length data provide information on temperature his-tory. Track lengths are measured as confined tracks parallelto prismatic surfaces [Gleadow et al., 1986]. The lengthdistributions are compared to predicted track-length distri-butions based on laboratory experiments on track annealing[Laslett et al., 1987; Carlson, 1990; Crowley et al., 1991].[12] Through the estimate of a paleo-geothermal gradient,
it is possible to convert the thermal history of a given rockto time-burial depth information.[13] Apatites from 24 samples were analyzed using the
population method (Table 1) [Gleadow, 1981]. A further 13samples were analyzed by the external detector method(Table 2) [Gleadow, 1981].
4. Sample Location and Results
[14] Most of the thirty-seven outcrop samples for thisstudy come from four transects from the plateau to thelowlands, roughly perpendicular to the present coastline(Figure 2). From north to south:Keren–Kelhamet (K–K) transect (I)—The transect starts
from the plateau south of Keren (2240 m) and fromKelhamet follows the Labka River down to 700 m altitude.
ABBATE ET AL.: MORPHOSTRUCTURAL DEVELOPMENT OF THE ERITREAN RIFT FLANK ETG 12 - 3

Samples come from Pan-African granites intruding the low-grade basement. Apatite FT ages range between 317 ± 19and 28 ± 4 Ma. Mean track lengths range between 15.15 ±0.36 and 11.43 ± 0.22 mm.Asmara–Massawa (A–M) transect (II)—Sampling was
carried out mainly along the Asmara–Massawa road from
1900 m to 300 m in altitude. All samples, except the lowestones, are from Pan-African granites and low-grade base-ment. The lowest sample was collected from granitic gneissof the high-grade Damas basement high. FT ages span 226 ±22 to 10 ± 2 Ma. Mean track lengths range between 14.42 ±0.45 and 11.48 ± 0.21 mm.
Table 1. Apatite Fission Track Analysis Results (Population Method)
Sample T El., mrs � 105
cm�2, (ns)ri � 105
cm�2, (ni) S/I E% Age ± 1s, Ma L, mm SD, mm n
Er 167-1 A–M 300 0.61 (164) 6.00 (964) 250/150 15 10 ± 2 14.42 ± 0.45 0.90 4Er 170-1 A–M 1600 3.42 (3665) 15.70 (1570) 100/100 10 226 ± 22 12.55 ± 0.21 1.96 88E95/5-2 A–M 1885 2.24 (205) 7.33 (131) 52/36 30 179 ± 54 – – –E95/7-2 A–M 1695 5.36 (623) 3.87 (587) 66/86 21 221 ± 47 – – –E95/8-3 D–G 2230 3.78 (300) 1.41 (139) 44/56 18 401 ± 72 12.18 ± 0.15 0.22 2E95/10-3 D–G 2020 6.02 (1028) 3.66 (645) 97/100 23 249 ± 57 9.87 ± 0.39 0.56 2E95/11-3 D–G 1880 6.03 (1061) 3.60 (634) 100/100 14 253 ± 31 11.19 ± 1.20 1.70 5E95/12-3 D–G 1710 1.39 (244) 1.73 (207) 100/68 14 122 ± 117 – – –E95-13-3 A–M 1460 4.19 (738) 4.23 (745) 100/100 10 151 ± 15 11.97 ± 0.21 2.15 100E95-14-3 A–M 1375 12.77 (2247) 18.07 (3180) 100/100 6 108 ± 6 11.48 ± 0.21 2.15 100E95-16-3 A–M 1005 8.99 (1583) 12.43 (2187) 100/100 8 110 ± 9 12.08 ± 0.19 1.89 100E95-17-3 A–M 810 0.20 (108) 0.73 (129) 300/100 27 43 ± 12 13.61 – 1E95-18-3 A–M 610 0.49 (199) 1.60 (282) 230/100 16 47 ± 8 13.23 ± 0.61 1.62 7E95-A-2 A–M 310 1.02 (139) 3.43 (303) 140/100 13 48 ± 6 11.60 ± 0.66 1.76 5E95/19-3 K–K 1310 18.42 (1950) 19.99 (2116) 120/120 7 140 ± 10 12.37 ± 0.18 1.76 100E95/21-3 K–K 965 3.95 (598) 5.99 (1055) 86/100 15 101 ± 15 – – –E95/22-3 K–K 835 10.98 (1933) 15.95 (2808) 100/100 7 105 ± 7 11.72 ± 0.21 1.66 60E95/23-3 K–K 735 0.15 (102) 0.85 (150) 380/100 13 28 ± 4 15.15 ± 0.36 0.87 8E95/24-3 K–K 1415 2.98 (338) 3.14 (423) 100/100 15 145 ± 22 – – –E95/25-3 K–K 1540 4.49 (1408) 5.15 (1453) 200/180 6 133 ± 8 11.43 ± 0.22 2.20 100E95/26-3 K–K 1710 6.74 (1006) 6.69 (1393) 100/100 7 154 ± 11 11.87 ± 0.26 2.14 68E95/27-3 K–K 1805 13.15 (2315) 11.47 (2019) 100/100 7 174 ± 12 12.35 ± 0.23 2.26 100E95/28-3 K–K 2240 34.5 (5468) 16.36 (2595) 90/90 6 317 ± 19 12.48 ± 0.19 1.91 100E95/29-2 D 2950 41.61 (2202) 19.72 (1044) 60/60 9 317 ± 27 12.99 ± 0.22 1.82 70
T: transect; A–M: Asmara–Massawa; D–G: Dekemhare–Ghedem; K–K: Keren–Kelhamet; D: Dandero river; El: elevation; rs (ri): spontaneous(induced) track density; ns (ni): spontaneous (induced) counted tracks; E%: propagation of relative standard errors of the spontaneous and induced trackcounts; S/I: number of analyzed crystals for spontaneous (S) and induced (I) track density determination; L, SD: length and standard deviation of theconfined track length distribution; n: number of measured confined tracks. Samples were dated using the population method. Standard magnetic and heavyliquid separation procedures were applied for apatite separation. Irradiation was performed in the Lazy Susan facility (Cd ratio 6.4 for Au and 48 for Co) ofthe reactor Triga Mark II of the University of Pavia. Neutron fluence: (1) 1.65 � 1015 cm�2; (2) 2.72 � 1015 cm�2; (3) 2.58 � 1015 cm�2 (referred to theSRM 962a NIST, formely NBS, glass standard). Parameters used for age calculation: s = 5.802 � 1022 cm2; l = 1.55125 � 10�10 yr�1, lF = 7.03 � 10�17
yr�1. Two aliquots of apatite (for spontaneous and induced track counting) from each sample were mounted in epoxy resin, polished and etched with 5%HNO3 at 20�C. Track counting was performed using a Leica Orthoplan microscope at 1250� magnification. Lengths were measured with a LeicaMicrovid stage.
Table 2. Apatite Fission Track Analysis Results (External Detector Method)
Sample T El., mrd � 105
cm�2, (nd)rs � 105
cm�2, (ns)ri � 105
cm�2, (ni) ng P(c2), %Central Age± 1s, Ma L, mm SD, mm n
DAN2 D 2120 – – – – – – 12.61 ± 0.89 1.99 5DAN6 D 1100 6.18 (2847) 1.17 (54) 0.82 (38) 10 29 152 ± 35 12.87 ± 0.52 2.24 18DAN7 D 1100 6.18 (2847) 2.28 (57) 2.12 (53) 13 2 92 ± 25 13.87 ± 0.34 2.15 38DAN8 D 1050 – – – – – – 12.47 ± 0.66 3.29 25DAN12 D 860 6.18 (2847) 2.05 (119) 2.55 (148) 17 2 88 ± 15 13.06 ± 0.32 2.70 72DAN14 D 640 6.18 (2847) 0.62 (44) 2.17 (153) 20 47 33 ± 11 – – –DAN15B D 570 6.18 (2847) 0.76 (56) 3.03 (223) 28 95 27 ± 4 13.54 ± 0.45 1.89 18DAN17 D 410 6.18 (2847) 1.14 (45) 3.99 (158) 32 99 31 ± 5 13.36 ± 0.60 1.70 8DAN19 D 350 6.18 (2847) 4.91 (516) 29.4 (3617) 30 6 16 ± 1 13.82 ± 0.19 1.67 78DAN20 D–G 160 6.18 (2847) 0.24 (18) 2.25 (166) 14 41 12 ± 3 13.64 ± 0.42 1.19 8DAN21 D–G 180 6.18 (2847) 2.03 (59) 13.9 (405) 12 34 15 ± 2 11.35 ± 2.14 3.70 3DAN22 D–G 180 6.18 (2847) 1.59 (171) 10.6 (1144) 20 25 16 ± 1 13.72 ± 0.19 1.89 100
T, El., L, SD, n: see Table 1 above; rd, ri: standard and induced track densities measured on mica external detectors; rs: spontaneous track densities oninternal mineral surfaces; nd, ni, and ns: number of tracks on external detectors and on mineral surfaces; ng: number of analyzed grains; ages calculatedusing z = 353 ± 6 (referred to Fish Canyon Tuff and Durango apatite standards [Hurford, 1990] for dosimeter glass SRM 612); n: number of countedmineral grains; P(c2): probability of obtaining c2 value [Galbraith, 1981]. Each apatite sample was mounted in epoxy resin, polished and etched in 5%HNO3 at 20 �C and covered with a mica external detector. Samples were irradiated in the Lazy Susan facility of the Triga Mark II reactor of the Universityof Pavia. Mica external detectors were etched in 40% HF at 40�C. Track counting and length measurement were performed using a Zeiss Axioscopemicroscope at 1250� magnification equipped with a Kinetek stage and a digital tablet.
ETG 12 - 4 ABBATE ET AL.: MORPHOSTRUCTURAL DEVELOPMENT OF THE ERITREAN RIFT FLANK
Dekemhare–Ghedem (D–G) transect (III)—The transectstarts from the plateau near Dekemhare (2230–1710 m) andreaches the high-grade Ghedem high (180–160 m) adjacentto the Gulf of Zula. The intermediate part along theescarpment was not sampled. The highest samples comefrom two Pan-African granites and the lowest ones are fromthe Ghedem gneisses. Samples yielded ages from 401 ± 72Ma to 12 ± 3 Ma. Mean track lengths range between 13.72± 0.19 and 9.87 ± 0.39 mm.Dandero River(D) transect (IV)—We collected samples
from Senafe at the southeastern border of the Eritreanplateau close to the Amba Soira (3018 m), the highestmountain of the region, and along the Dandero River to theDanakil Depression. The highest sample was collected at2950 m on the eastern flank of the Amba Soira from a smallarenaceous remnant identified as Paleozoic [Garland, 1980]unconformably overlying the basement. Toward the coastwe sampled rocks both from the low- and the high-gradebasement. Apatite yielded FT ages from 317 ± 27 Ma to 16± 1 Ma. Mean track lengths range between 13.87 ± 0.34 and12.47 ± 0.66 mm.
5. Discussion
5.1. Interpretation of FT Data and Thermal Modeling
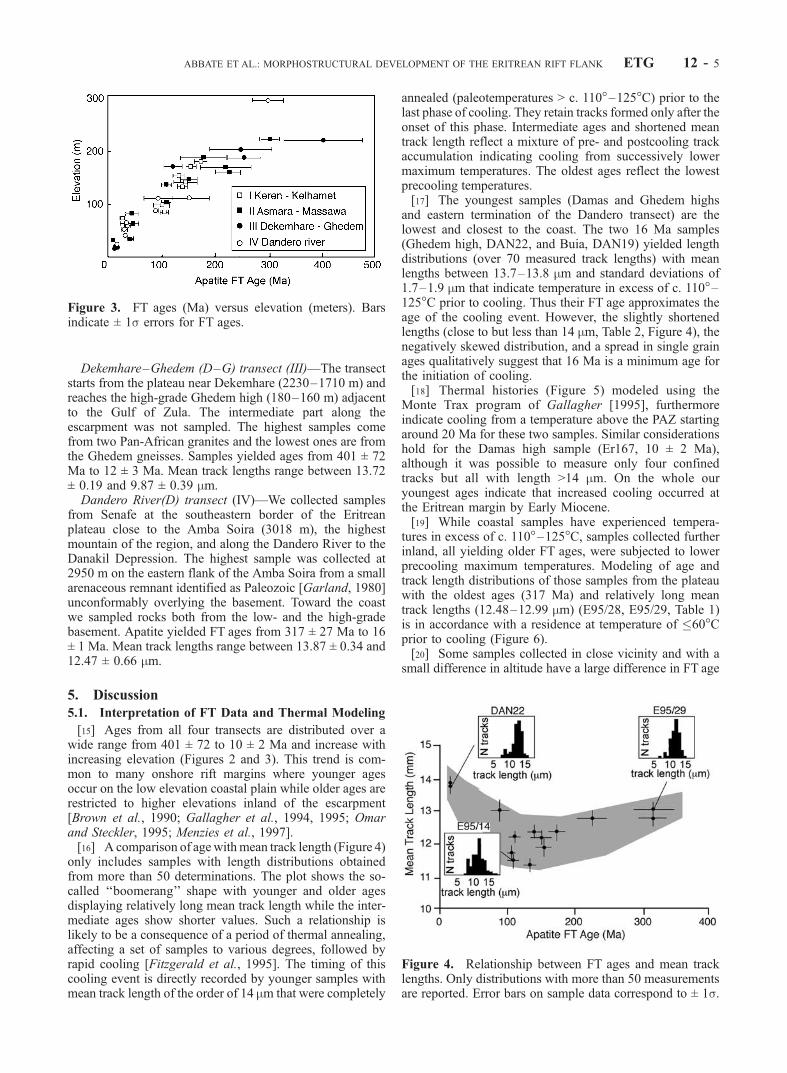
[15] Ages from all four transects are distributed over awide range from 401 ± 72 to 10 ± 2 Ma and increase withincreasing elevation (Figures 2 and 3). This trend is com-mon to many onshore rift margins where younger agesoccur on the low elevation coastal plain while older ages arerestricted to higher elevations inland of the escarpment[Brown et al., 1990; Gallagher et al., 1994, 1995; Omarand Steckler, 1995; Menzies et al., 1997].[16] A comparison of agewithmean track length (Figure 4)
only includes samples with length distributions obtainedfrom more than 50 determinations. The plot shows the so-called ‘‘boomerang’’ shape with younger and older agesdisplaying relatively long mean track length while the inter-mediate ages show shorter values. Such a relationship islikely to be a consequence of a period of thermal annealing,affecting a set of samples to various degrees, followed byrapid cooling [Fitzgerald et al., 1995]. The timing of thiscooling event is directly recorded by younger samples withmean track length of the order of 14 mm that were completely
annealed (paleotemperatures > c. 110�–125�C) prior to thelast phase of cooling. They retain tracks formed only after theonset of this phase. Intermediate ages and shortened meantrack length reflect a mixture of pre- and postcooling trackaccumulation indicating cooling from successively lowermaximum temperatures. The oldest ages reflect the lowestprecooling temperatures.[17] The youngest samples (Damas and Ghedem highs
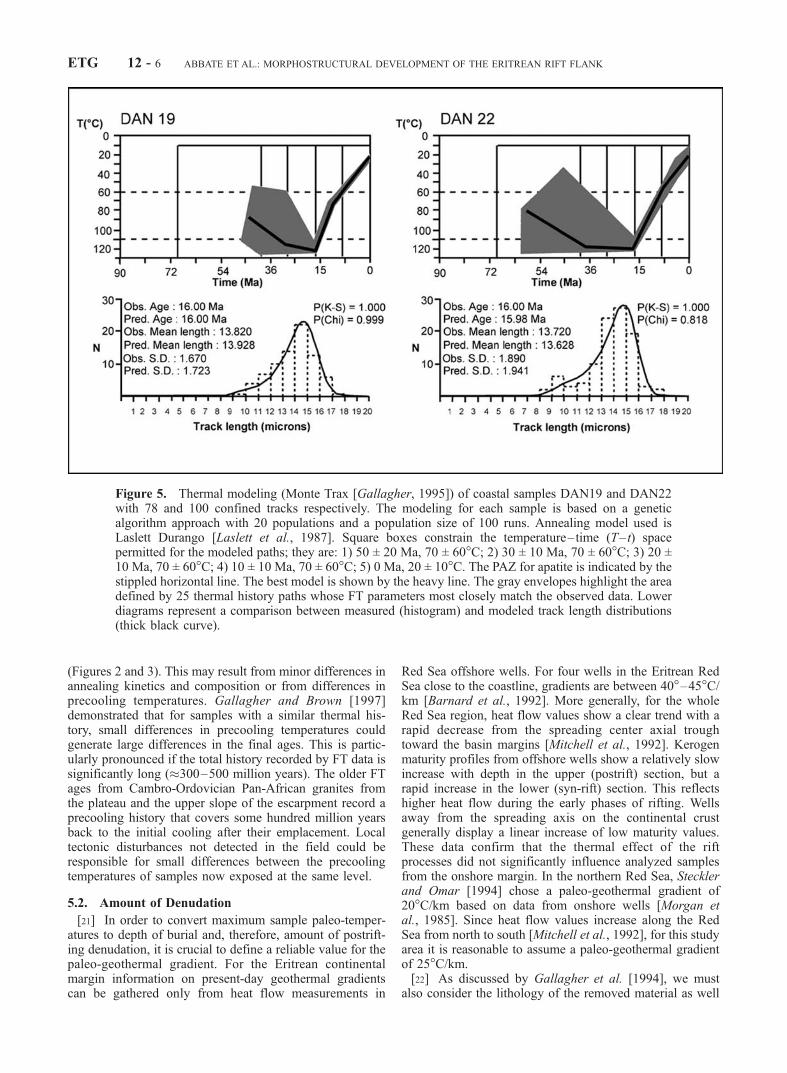
and eastern termination of the Dandero transect) are thelowest and closest to the coast. The two 16 Ma samples(Ghedem high, DAN22, and Buia, DAN19) yielded lengthdistributions (over 70 measured track lengths) with meanlengths between 13.7–13.8 mm and standard deviations of1.7–1.9 mm that indicate temperature in excess of c. 110�–125�C prior to cooling. Thus their FT age approximates theage of the cooling event. However, the slightly shortenedlengths (close to but less than 14 mm, Table 2, Figure 4), thenegatively skewed distribution, and a spread in single grainages qualitatively suggest that 16 Ma is a minimum age forthe initiation of cooling.[18] Thermal histories (Figure 5) modeled using the
Monte Trax program of Gallagher [1995], furthermoreindicate cooling from a temperature above the PAZ startingaround 20 Ma for these two samples. Similar considerationshold for the Damas high sample (Er167, 10 ± 2 Ma),although it was possible to measure only four confinedtracks but all with length >14 mm. On the whole ouryoungest ages indicate that increased cooling occurred atthe Eritrean margin by Early Miocene.[19] While coastal samples have experienced tempera-
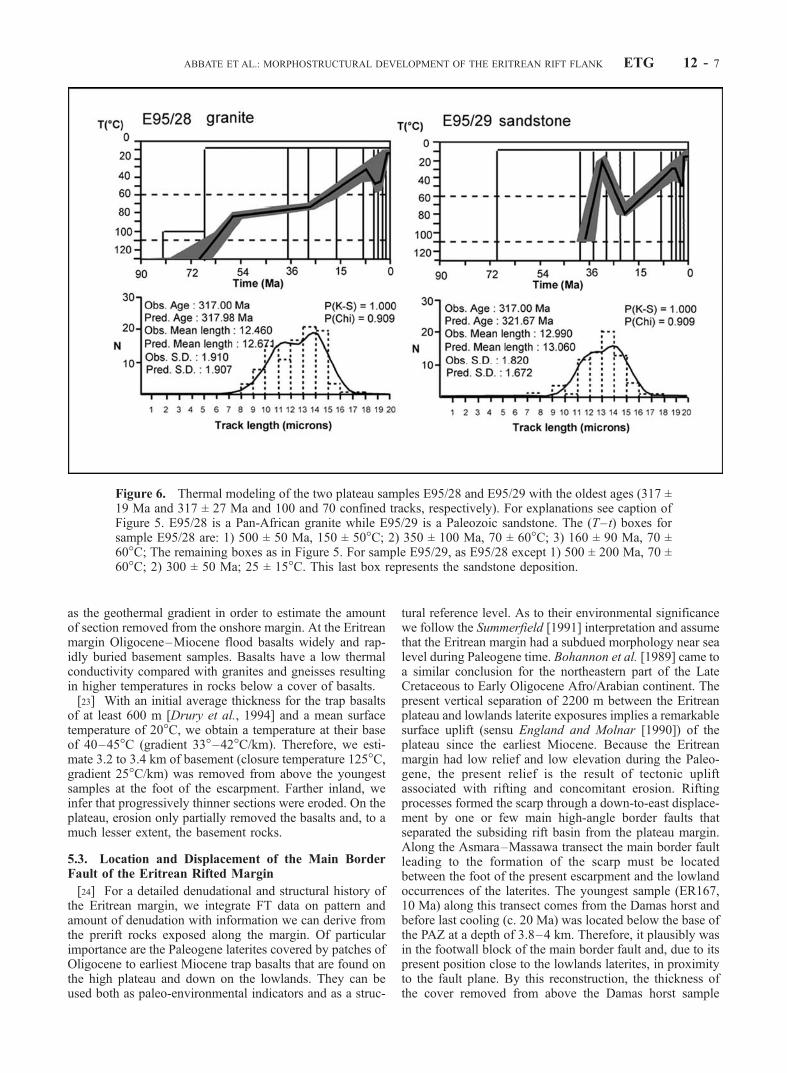
tures in excess of c. 110�–125�C, samples collected furtherinland, all yielding older FT ages, were subjected to lowerprecooling maximum temperatures. Modeling of age andtrack length distributions of those samples from the plateauwith the oldest ages (317 Ma) and relatively long meantrack lengths (12.48–12.99 mm) (E95/28, E95/29, Table 1)is in accordance with a residence at temperature of �60�Cprior to cooling (Figure 6).[20] Some samples collected in close vicinity and with a
small difference in altitude have a large difference in FT age
Figure 3. FT ages (Ma) versus elevation (meters). Barsindicate ± 1s errors for FT ages.
Figure 4. Relationship between FT ages and mean tracklengths. Only distributions with more than 50 measurementsare reported. Error bars on sample data correspond to ± 1s.
ABBATE ET AL.: MORPHOSTRUCTURAL DEVELOPMENT OF THE ERITREAN RIFT FLANK ETG 12 - 5
(Figures 2 and 3). This may result from minor differences inannealing kinetics and composition or from differences inprecooling temperatures. Gallagher and Brown [1997]demonstrated that for samples with a similar thermal his-tory, small differences in precooling temperatures couldgenerate large differences in the final ages. This is partic-ularly pronounced if the total history recorded by FT data issignificantly long (�300–500 million years). The older FTages from Cambro-Ordovician Pan-African granites fromthe plateau and the upper slope of the escarpment record aprecooling history that covers some hundred million yearsback to the initial cooling after their emplacement. Localtectonic disturbances not detected in the field could beresponsible for small differences between the precoolingtemperatures of samples now exposed at the same level.
5.2. Amount of Denudation
[21] In order to convert maximum sample paleo-temper-atures to depth of burial and, therefore, amount of postrift-ing denudation, it is crucial to define a reliable value for thepaleo-geothermal gradient. For the Eritrean continentalmargin information on present-day geothermal gradientscan be gathered only from heat flow measurements in
Red Sea offshore wells. For four wells in the Eritrean RedSea close to the coastline, gradients are between 40�–45�C/km [Barnard et al., 1992]. More generally, for the wholeRed Sea region, heat flow values show a clear trend with arapid decrease from the spreading center axial troughtoward the basin margins [Mitchell et al., 1992]. Kerogenmaturity profiles from offshore wells show a relatively slowincrease with depth in the upper (postrift) section, but arapid increase in the lower (syn-rift) section. This reflectshigher heat flow during the early phases of rifting. Wellsaway from the spreading axis on the continental crustgenerally display a linear increase of low maturity values.These data confirm that the thermal effect of the riftprocesses did not significantly influence analyzed samplesfrom the onshore margin. In the northern Red Sea, Stecklerand Omar [1994] chose a paleo-geothermal gradient of20�C/km based on data from onshore wells [Morgan etal., 1985]. Since heat flow values increase along the RedSea from north to south [Mitchell et al., 1992], for this studyarea it is reasonable to assume a paleo-geothermal gradientof 25�C/km.[22] As discussed by Gallagher et al. [1994], we must
also consider the lithology of the removed material as well
Figure 5. Thermal modeling (Monte Trax [Gallagher, 1995]) of coastal samples DAN19 and DAN22with 78 and 100 confined tracks respectively. The modeling for each sample is based on a geneticalgorithm approach with 20 populations and a population size of 100 runs. Annealing model used isLaslett Durango [Laslett et al., 1987]. Square boxes constrain the temperature–time (T– t) spacepermitted for the modeled paths; they are: 1) 50 ± 20 Ma, 70 ± 60�C; 2) 30 ± 10 Ma, 70 ± 60�C; 3) 20 ±10 Ma, 70 ± 60�C; 4) 10 ± 10 Ma, 70 ± 60�C; 5) 0 Ma, 20 ± 10�C. The PAZ for apatite is indicated by thestippled horizontal line. The best model is shown by the heavy line. The gray envelopes highlight the areadefined by 25 thermal history paths whose FT parameters most closely match the observed data. Lowerdiagrams represent a comparison between measured (histogram) and modeled track length distributions(thick black curve).
ETG 12 - 6 ABBATE ET AL.: MORPHOSTRUCTURAL DEVELOPMENT OF THE ERITREAN RIFT FLANK
as the geothermal gradient in order to estimate the amountof section removed from the onshore margin. At the Eritreanmargin Oligocene–Miocene flood basalts widely and rap-idly buried basement samples. Basalts have a low thermalconductivity compared with granites and gneisses resultingin higher temperatures in rocks below a cover of basalts.[23] With an initial average thickness for the trap basalts
of at least 600 m [Drury et al., 1994] and a mean surfacetemperature of 20�C, we obtain a temperature at their baseof 40–45�C (gradient 33�–42�C/km). Therefore, we esti-mate 3.2 to 3.4 km of basement (closure temperature 125�C,gradient 25�C/km) was removed from above the youngestsamples at the foot of the escarpment. Farther inland, weinfer that progressively thinner sections were eroded. On theplateau, erosion only partially removed the basalts and, to amuch lesser extent, the basement rocks.
5.3. Location and Displacement of the Main BorderFault of the Eritrean Rifted Margin
[24] For a detailed denudational and structural history ofthe Eritrean margin, we integrate FT data on pattern andamount of denudation with information we can derive fromthe prerift rocks exposed along the margin. Of particularimportance are the Paleogene laterites covered by patches ofOligocene to earliest Miocene trap basalts that are found onthe high plateau and down on the lowlands. They can beused both as paleo-environmental indicators and as a struc-
tural reference level. As to their environmental significancewe follow the Summerfield [1991] interpretation and assumethat the Eritrean margin had a subdued morphology near sealevel during Paleogene time. Bohannon et al. [1989] came toa similar conclusion for the northeastern part of the LateCretaceous to Early Oligocene Afro/Arabian continent. Thepresent vertical separation of 2200 m between the Eritreanplateau and lowlands laterite exposures implies a remarkablesurface uplift (sensu England and Molnar [1990]) of theplateau since the earliest Miocene. Because the Eritreanmargin had low relief and low elevation during the Paleo-gene, the present relief is the result of tectonic upliftassociated with rifting and concomitant erosion. Riftingprocesses formed the scarp through a down-to-east displace-ment by one or few main high-angle border faults thatseparated the subsiding rift basin from the plateau margin.Along the Asmara–Massawa transect the main border faultleading to the formation of the scarp must be locatedbetween the foot of the present escarpment and the lowlandoccurrences of the laterites. The youngest sample (ER167,10 Ma) along this transect comes from the Damas horst andbefore last cooling (c. 20 Ma) was located below the base ofthe PAZ at a depth of 3.8–4 km. Therefore, it plausibly wasin the footwall block of the main border fault and, due to itspresent position close to the lowlands laterites, in proximityto the fault plane. By this reconstruction, the thickness ofthe cover removed from above the Damas horst sample
Figure 6. Thermal modeling of the two plateau samples E95/28 and E95/29 with the oldest ages (317 ±19 Ma and 317 ± 27 Ma and 100 and 70 confined tracks, respectively). For explanations see caption ofFigure 5. E95/28 is a Pan-African granite while E95/29 is a Paleozoic sandstone. The (T– t) boxes forsample E95/28 are: 1) 500 ± 50 Ma, 150 ± 50�C; 2) 350 ± 100 Ma, 70 ± 60�C; 3) 160 ± 90 Ma, 70 ±60�C; The remaining boxes as in Figure 5. For sample E95/29, as E95/28 except 1) 500 ± 200 Ma, 70 ±60�C; 2) 300 ± 50 Ma; 25 ± 15�C. This last box represents the sandstone deposition.
ABBATE ET AL.: MORPHOSTRUCTURAL DEVELOPMENT OF THE ERITREAN RIFT FLANK ETG 12 - 7
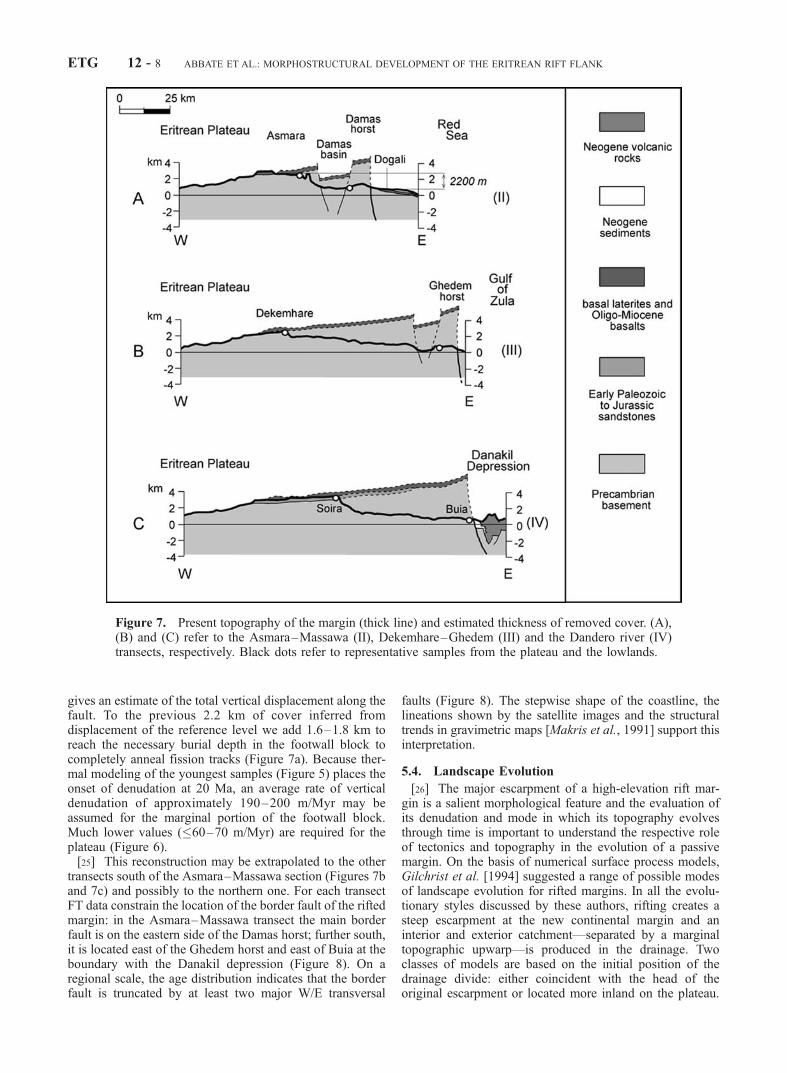
gives an estimate of the total vertical displacement along thefault. To the previous 2.2 km of cover inferred fromdisplacement of the reference level we add 1.6–1.8 km toreach the necessary burial depth in the footwall block tocompletely anneal fission tracks (Figure 7a). Because ther-mal modeling of the youngest samples (Figure 5) places theonset of denudation at 20 Ma, an average rate of verticaldenudation of approximately 190–200 m/Myr may beassumed for the marginal portion of the footwall block.Much lower values (�60–70 m/Myr) are required for theplateau (Figure 6).[25] This reconstruction may be extrapolated to the other
transects south of the Asmara–Massawa section (Figures 7band 7c) and possibly to the northern one. For each transectFT data constrain the location of the border fault of the riftedmargin: in the Asmara–Massawa transect the main borderfault is on the eastern side of the Damas horst; further south,it is located east of the Ghedem horst and east of Buia at theboundary with the Danakil depression (Figure 8). On aregional scale, the age distribution indicates that the borderfault is truncated by at least two major W/E transversal
faults (Figure 8). The stepwise shape of the coastline, thelineations shown by the satellite images and the structuraltrends in gravimetric maps [Makris et al., 1991] support thisinterpretation.
5.4. Landscape Evolution
[26] The major escarpment of a high-elevation rift mar-gin is a salient morphological feature and the evaluation ofits denudation and mode in which its topography evolvesthrough time is important to understand the respective roleof tectonics and topography in the evolution of a passivemargin. On the basis of numerical surface process models,Gilchrist et al. [1994] suggested a range of possible modesof landscape evolution for rifted margins. In all the evolu-tionary styles discussed by these authors, rifting creates asteep escarpment at the new continental margin and aninterior and exterior catchment—separated by a marginaltopographic upwarp—is produced in the drainage. Twoclasses of models are based on the initial position of thedrainage divide: either coincident with the head of theoriginal escarpment or located more inland on the plateau.
Figure 7. Present topography of the margin (thick line) and estimated thickness of removed cover. (A),(B) and (C) refer to the Asmara–Massawa (II), Dekemhare–Ghedem (III) and the Dandero river (IV)transects, respectively. Black dots refer to representative samples from the plateau and the lowlands.
ETG 12 - 8 ABBATE ET AL.: MORPHOSTRUCTURAL DEVELOPMENT OF THE ERITREAN RIFT FLANK

In the first case the escarpment retreats in a semiparallelmanner (‘‘scarp retreat’’ models). In the second (‘‘pinneddivide’’ models) the divide is connected to the rift scarp bya gentle slope inclined toward the scarp and denudation ofthe exterior catchment is enhanced by downwearing thatleads to the formation of a new scarp close to the divide.Both classes of models imply a differential and strongdenudation in the exterior catchment while the interior isonly moderately denuded. In the ‘‘pinned divide’’ class ofmodels, a significant amount of denudation is expectedalso for the interior if the base level of the interiordrainage is lowered during the formation of the initialscarp, giving rise to a new scarp ‘‘pinned’’ on the originaldivide.[27] A possible constraint in choosing between different
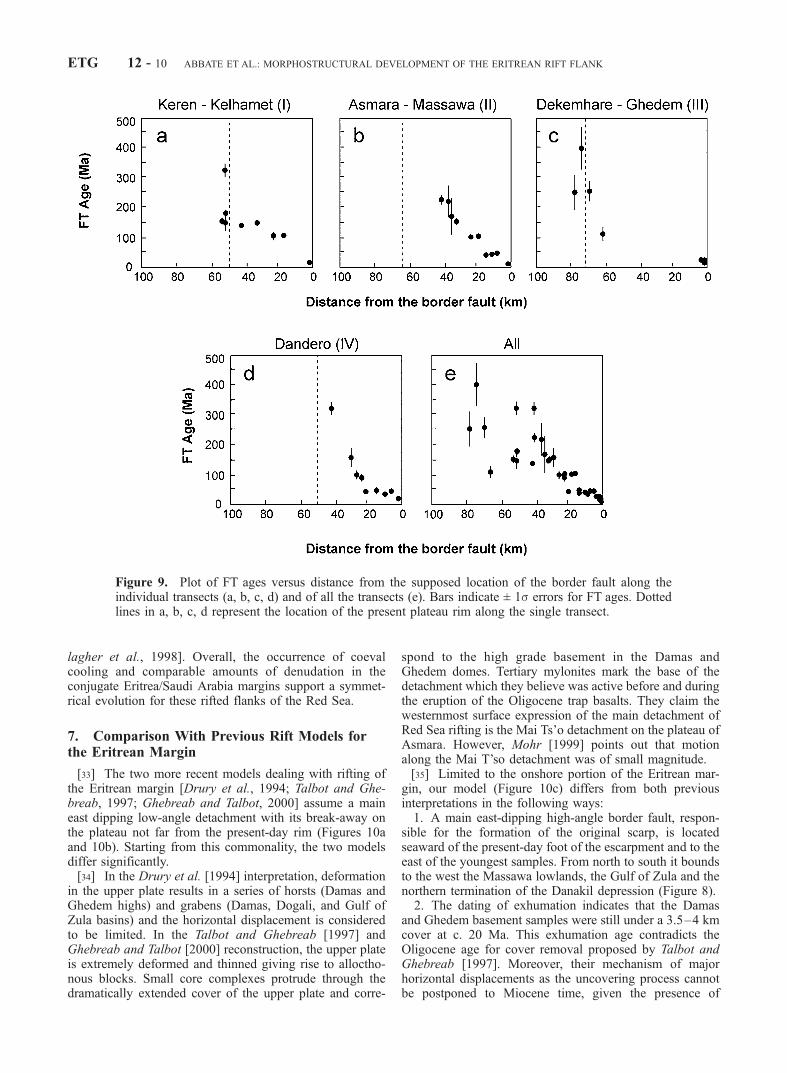
classes of models for landscape evolution is provided bythe spatial trend of FT ages across the present margintopography [Gallagher et al., 1998]. The FT age trendacross the Eritrean margin is shown in the profiles ofFigure 9 as a function of the distance from the supposedlocation of the border fault (i.e., from the initial position ofthe rift scarp). Both in the individual profiles (Figures 9a,9b, 9c, and 9d) and in the composite diagram (Figure 9e),ages show a steep gradient with the distance from theborder fault, with the oldest ages occurring immediatelyinland of the top of the present scarp and decreasing towardthe fault. This trend is consistent with both ‘‘scarp retreat’’and ‘‘pinned divide’’ models and indicates a strong anddifferential denudation of the exterior catchment. If theescarpment evolved by ‘‘scarp retreat’’ it is possible toestimate the retreat rate since Miocene time. The distancebetween the present rim of the escarpment and the border
fault (i.e., initial position of the scarp) varies along themargin. It is at least 35 km along the Asmara–Massawatransect, 65 km along the Dekemhare–Ghedem transectand 45 km along the Dandero transect (Figure 8). Wecalculate retreat rates of 1.7, 3.1, and 2.2 km/Myr fromnorth to south. If the escarpment evolved following a‘‘pinned divide’’ model, the original inland divide mustbe located at or outwards of the rim of the present escarp-ment as the latter coincides with the major divide. In thiscase, the initial scarp was eroded by downwearing, a newscarp formed at the original divide and subsequently startedto shift to its present position by scarp retreat. In this view,the isolated basement peaks, seaward of the present-dayplateau rim at altitudes higher than the rim itself, could beinterpreted as remnants of the apex of the pinned structureof the divide.[28] The few FT data from samples inland of the present-
day top of the scarp suggest a low amount of denudation(Figure 6). This is confirmed by the presence of lateritesand Tertiary volcanic rocks in the interior of the plateau(Figure 1) indicating only few hundred meters of removedcover. This makes less likely the hypothesis of a loweringof the interior drainage base level in the context of a pinneddivide model.
6. Comparison With Other Apatite FissionTrack Studies in the Red Sea Region
[29] In a more regional context including the marginsfacing the Red Sea, a cooling event almost coeval with thatrecorded on the Eritrean margin is proposed in Saudi Arabiaby Bohannon et al. [1989] at 20 Ma and in Yemen byMenzies et al. [1997] around 25–20 Ma. An earlier Oligo-cene cooling event was suggested by Bohannon et al.[1989] and confirmed by Omar and Steckler [1995] forEgypt and south-southwestern Saudi Arabia, but notreported for the Red Sea margin of Yemen [Menzies etal., 1997]. Our data from Eritrea do not show evidence ofthis earlier event, but it cannot be excluded due to thescarcity of measured confined track lengths in samples ofthat age (see Tables 1 and 2).[30] Additional similarities exist between the Eritrean and
the Saudi Arabian margins. In both areas FT ages show thesame trend with young ages on the coastal lowlands and oldones on the plateau [Bohannon et al., 1989; this study].Also the amount of denudation is comparable for the coastalareas of both margins: 2.5–4 km in Saudi Arabia, and 3.5–4 km in Eritrea.[31] There are differences with the Yemen margin where
young ages are found also in a narrow band on the westernpart of the plateau [Menzies et al., 1997]. This impliesdenudation of c. 3 km for this portion of the plateau and,therefore, larger amounts further west on the coast. Animpingement of the Afar plume beneath the Yemen margincould be responsible for these differences.[32] In conclusion, a major phase of accelerated denuda-
tion began in Late Oligocene–Miocene time along bothmargins of the Red Sea during or shortly after rifting withthe maximum amount of denudation occurring along theinitial rift margin and diminishing inland toward the escarp-ment. This pattern of denudation indicates a scarp retreat orpinned divide class of landscape evolutionary model [Gal-
Figure 8. Inferred location of the main border fault (thickline) and its offsets (thin line) along the Eritrean marginfrom FT and regional geology data. A (II), B (III) and C (III)represent cross sections of Figure 7.
ABBATE ET AL.: MORPHOSTRUCTURAL DEVELOPMENT OF THE ERITREAN RIFT FLANK ETG 12 - 9
lagher et al., 1998]. Overall, the occurrence of coevalcooling and comparable amounts of denudation in theconjugate Eritrea/Saudi Arabia margins support a symmet-rical evolution for these rifted flanks of the Red Sea.
7. Comparison With Previous Rift Models forthe Eritrean Margin
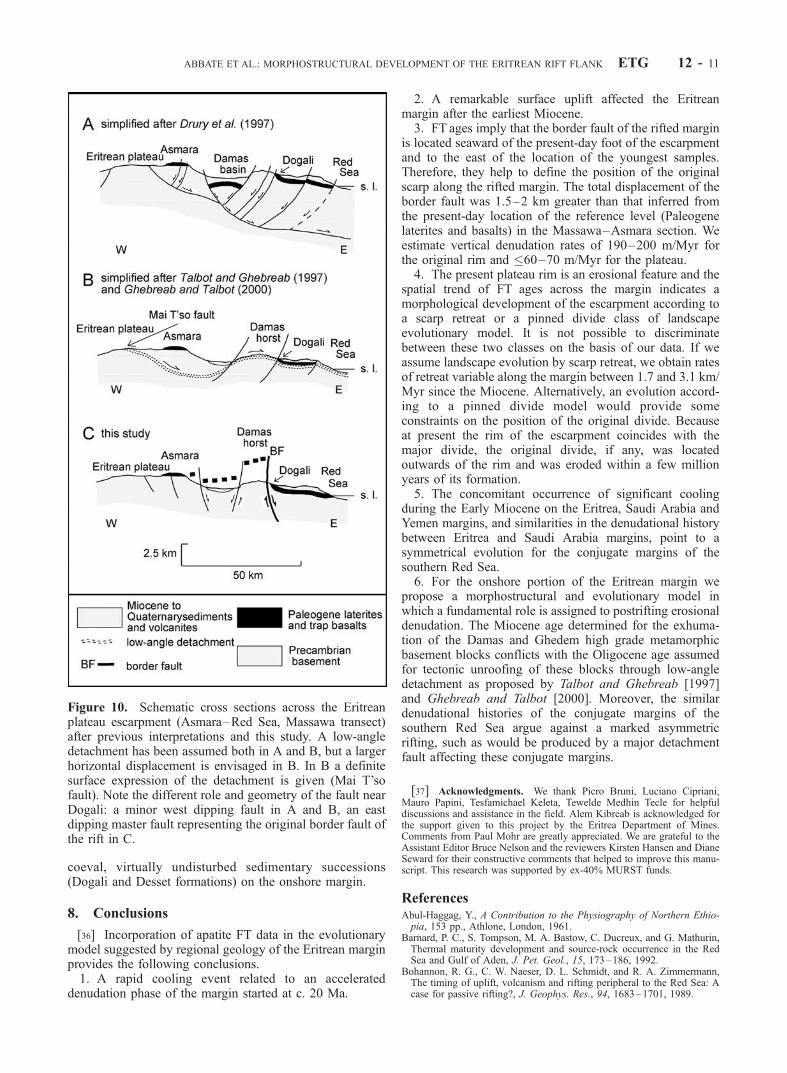
[33] The two more recent models dealing with rifting ofthe Eritrean margin [Drury et al., 1994; Talbot and Ghe-breab, 1997; Ghebreab and Talbot, 2000] assume a maineast dipping low-angle detachment with its break-away onthe plateau not far from the present-day rim (Figures 10aand 10b). Starting from this commonality, the two modelsdiffer significantly.[34] In the Drury et al. [1994] interpretation, deformation
in the upper plate results in a series of horsts (Damas andGhedem highs) and grabens (Damas, Dogali, and Gulf ofZula basins) and the horizontal displacement is consideredto be limited. In the Talbot and Ghebreab [1997] andGhebreab and Talbot [2000] reconstruction, the upper plateis extremely deformed and thinned giving rise to alloctho-nous blocks. Small core complexes protrude through thedramatically extended cover of the upper plate and corre-
spond to the high grade basement in the Damas andGhedem domes. Tertiary mylonites mark the base of thedetachment which they believe was active before and duringthe eruption of the Oligocene trap basalts. They claim thewesternmost surface expression of the main detachment ofRed Sea rifting is the Mai Ts’o detachment on the plateau ofAsmara. However, Mohr [1999] points out that motionalong the Mai T’so detachment was of small magnitude.[35] Limited to the onshore portion of the Eritrean mar-
gin, our model (Figure 10c) differs from both previousinterpretations in the following ways:1. A main east-dipping high-angle border fault, respon-
sible for the formation of the original scarp, is locatedseaward of the present-day foot of the escarpment and to theeast of the youngest samples. From north to south it boundsto the west the Massawa lowlands, the Gulf of Zula and thenorthern termination of the Danakil depression (Figure 8).2. The dating of exhumation indicates that the Damas
and Ghedem basement samples were still under a 3.5–4 kmcover at c. 20 Ma. This exhumation age contradicts theOligocene age for cover removal proposed by Talbot andGhebreab [1997]. Moreover, their mechanism of majorhorizontal displacements as the uncovering process cannotbe postponed to Miocene time, given the presence of
Figure 9. Plot of FT ages versus distance from the supposed location of the border fault along theindividual transects (a, b, c, d) and of all the transects (e). Bars indicate ± 1s errors for FT ages. Dottedlines in a, b, c, d represent the location of the present plateau rim along the single transect.
ETG 12 - 10 ABBATE ET AL.: MORPHOSTRUCTURAL DEVELOPMENT OF THE ERITREAN RIFT FLANK
coeval, virtually undisturbed sedimentary successions(Dogali and Desset formations) on the onshore margin.
8. Conclusions
[36] Incorporation of apatite FT data in the evolutionarymodel suggested by regional geology of the Eritrean marginprovides the following conclusions.1. A rapid cooling event related to an accelerated
denudation phase of the margin started at c. 20 Ma.
2. A remarkable surface uplift affected the Eritreanmargin after the earliest Miocene.3. FT ages imply that the border fault of the rifted margin
is located seaward of the present-day foot of the escarpmentand to the east of the location of the youngest samples.Therefore, they help to define the position of the originalscarp along the rifted margin. The total displacement of theborder fault was 1.5–2 km greater than that inferred fromthe present-day location of the reference level (Paleogenelaterites and basalts) in the Massawa–Asmara section. Weestimate vertical denudation rates of 190–200 m/Myr forthe original rim and �60–70 m/Myr for the plateau.4. The present plateau rim is an erosional feature and the
spatial trend of FT ages across the margin indicates amorphological development of the escarpment according toa scarp retreat or a pinned divide class of landscapeevolutionary model. It is not possible to discriminatebetween these two classes on the basis of our data. If weassume landscape evolution by scarp retreat, we obtain ratesof retreat variable along the margin between 1.7 and 3.1 km/Myr since the Miocene. Alternatively, an evolution accord-ing to a pinned divide model would provide someconstraints on the position of the original divide. Becauseat present the rim of the escarpment coincides with themajor divide, the original divide, if any, was locatedoutwards of the rim and was eroded within a few millionyears of its formation.5. The concomitant occurrence of significant cooling
during the Early Miocene on the Eritrea, Saudi Arabia andYemen margins, and similarities in the denudational historybetween Eritrea and Saudi Arabia margins, point to asymmetrical evolution for the conjugate margins of thesouthern Red Sea.6. For the onshore portion of the Eritrean margin we
propose a morphostructural and evolutionary model inwhich a fundamental role is assigned to postrifting erosionaldenudation. The Miocene age determined for the exhuma-tion of the Damas and Ghedem high grade metamorphicbasement blocks conflicts with the Oligocene age assumedfor tectonic unroofing of these blocks through low-angledetachment as proposed by Talbot and Ghebreab [1997]and Ghebreab and Talbot [2000]. Moreover, the similardenudational histories of the conjugate margins of thesouthern Red Sea argue against a marked asymmetricrifting, such as would be produced by a major detachmentfault affecting these conjugate margins.
[37] Acknowledgments. We thank Picro Bruni, Luciano Cipriani,Mauro Papini, Tesfamichael Keleta, Tewelde Medhin Tecle for helpfuldiscussions and assistance in the field. Alem Kibreab is acknowledged forthe support given to this project by the Eritrea Department of Mines.Comments from Paul Mohr are greatly appreciated. We are grateful to theAssistant Editor Bruce Nelson and the reviewers Kirsten Hansen and DianeSeward for their constructive comments that helped to improve this manu-script. This research was supported by ex-40% MURST funds.
ReferencesAbul-Haggag, Y., A Contribution to the Physiography of Northern Ethio-pia, 153 pp., Athlone, London, 1961.
Barnard, P. C., S. Tompson, M. A. Bastow, C. Ducreux, and G. Mathurin,Thermal maturity development and source-rock occurrence in the RedSea and Gulf of Aden, J. Pet. Geol., 15, 173–186, 1992.
Bohannon, R. G., C. W. Naeser, D. L. Schmidt, and R. A. Zimmermann,The timing of uplift, volcanism and rifting peripheral to the Red Sea: Acase for passive rifting?, J. Geophys. Res., 94, 1683–1701, 1989.
Figure 10. Schematic cross sections across the Eritreanplateau escarpment (Asmara–Red Sea, Massawa transect)after previous interpretations and this study. A low-angledetachment has been assumed both in A and B, but a largerhorizontal displacement is envisaged in B. In B a definitesurface expression of the detachment is given (Mai T’sofault). Note the different role and geometry of the fault nearDogali: a minor west dipping fault in A and B, an eastdipping master fault representing the original border fault ofthe rift in C.
ABBATE ET AL.: MORPHOSTRUCTURAL DEVELOPMENT OF THE ERITREAN RIFT FLANK ETG 12 - 11
Brown, R. W., D. J. Rust, M. A. Summerfield, A. J. W. Gleadow, and M. C.J. De Wit, An early Cretaceous phase of accelerated erosion on the southwestern margin of Africa: Evidence from fission track analysis and theoff-shore sedimentary record, Nucl. Tracks Radiat. Meas., 17, 339–350,1990.
Carlson, W. D., Mechanisms and kinetics of apatite fission track annealing,Am. Mineral., 75, 1120–1139, 1990.
Cochran, J. R., and F. Martinez, Evidence from the northern Red Sea on thetransition from continental to oceanic rifting, Tectonophysics, 153, 25–53, 1988.
Crowley, K. D., M. Cameron, and R. L. Schaefer, Experimental studies ofannealing of etched fission tracks in fluoroapatite, Geochim. Cosmochim.Acta, 55, 1449–1465, 1991.
Dainelli, G., Geologia dell’Africa Orientale, 4 vols., Reale Accademiad’Italia, Rome, 1943.
Drury, S. A., S. P. Kelley, S. M. Berhe, R. E. L. Collier, and M. Abrha,Structures related to Red Sea evolution in northern Eritrea, Tectonics, 13,1371–1380, 1994.
England, P., and P. Molnar, Surface uplift, uplift of rocks, and exhumationof rocks, Geology, 18, 1173–1177, 1990.
Fitzgerald, P. G., R. B. Sorkhabi, T. F. Redfield, and E. Stump, Uplift anddenudation of the central Alaska Range: A case study in the use of apatitefission track thermochronology to determine absolute uplift parameters,J. Geophys. Res., 100, 20,175–20,191, 1995.
Galbraith, R. F., On statistical models for fission track count, Math. Geol.,13, 471–488, 1981.
Gallagher, K., Evolving temperature histories from apatite fission trackdata, Earth. Planet. Sci. Lett., 136, 421–435, 1995.
Gallagher, K., and R. Brown, The onshore record of passive margin evolu-tion, J. Geol. Soc. London, 154, 451–457, 1997.
Gallagher, K., C. J. Hawkesworth, and M. S. M. Mantovani, The denuda-tion history of the onshore continental margin of SE Brasil inferred fromapatite fission track data, J. Geophys. Res., 99, 18,117–18,145, 1994.
Gallagher, K., C. Hawkesworth, and M. Mantovani, Denudation, fissiontrack analysis and the long-term evolution of passive margin topography:Application to the Southeast Brazilian margin, J. South. Am. Earth Sci.,8, 65–77, 1995.
Gallagher, K., R. Brown, and C. Johnson, Fission track analysis and itsapplications to geological problems, Annu. Rev. Earth Planet. Sci., 26,519–572, 1998.
Garland, C. R., Geology of the Adigrat area, in Geological Survey ofEthiopia, Memoir 1, 51 pp., Berhaneana Selam, Addis Ababa, 1980.
Ghebreab, W., and C. J. Talbot, Red Sea extension influenced by Pan-African tectonic grain in eastern Eritrea, J. Struct. Geol., 22, 931–946,2000.
Gilchrist, A. R., H. Kooi, and C. Beaumont, Post-Gondwana geomorphicevolution of southwestern Africa: Implications for the controls on land-scape development from observations and numerical experiments,J. Geophys. Res., 99, 12,211–12,228, 1994.
Gleadow, A. J. W., Fission track dating methods: What are real alterna-tives?, Nucl. Tracks, 5, 3–14, 1981.
Gleadow, A. J. W., and I. R. Duddy, A natural long-term track annealingexperiment for apatite, Nucl. Tracks, 5, 169–174, 1981.
Gleadow, A. J. W., and P. G. Fitzgerald, Uplift history and structure of theTransantarctic Mountains: New evidence from fission track dating ofbasement apatites in the Dry Valleys area, southern Victoria Land, EarthPlanet. Sci. Lett., 82, 1–14, 1987.
Gleadow, A. J. W., I. R. Duddy, P. F. Green, and J. F. Lovering, Confined
track lengths in apatite: A diagnostic tool for thermal history analysis,Contrib. Mineral Petrol., 94, 405–415, 1986.
Green, P. F., I. R. Duddy, A. J. W. Gleadow, P. R. Tingate, and G. M.Laslett, Thermal annealing of fission tracks in apatite, 1, A qualitativedescription, Chem. Geol., 59, 237–253, 1986.
Hurford, A. J., Standardization of fission track dating calibration: Recom-mendation by the Fission Track Working Group of the I.U.G.S. Subcom-mission on Geochronology, Chem. Geol., 80, 171–178, 1990.
Laslett, G. M., P. F. Green, I. R. Duddy, and A. J. W. Gleadow, Thermalannealing of fission tracks in apatite, 2, A quantitative analysis, Chem.Geol., 65, 1–13, 1987.
Makris, J., C. H. Henke, F. Egloff, and T. Akamaluk, The gravity field ofthe Red Sea and East Africa, Tectonophysics, 198, 369–381, 1991.
Menzies, M., K. Gallagher, A. Yelland, and A. J. Hurford, Volcanic andnonvolcanic rifted margins of the Red Sea and Gulf of Aden: Crustalcooling and margin evolution in Yemen, Geochim. Cosmochim. Acta, 61,2511–2527, 1997.
Merla, G., and E. Minucci, Missione geologica del Tigrai, 1, La serie deiTerreni, in Reale Accademia d’Italia, Centro Studi, 362 pp., A.O.I.,Rome, 1938.
Mitchell, D. J. W., R. B. Allen, W. Salama, and A. Abouzakm, Tectonos-tratigraphic framework and hydrocarbon potential of the Red Sea,J. Petrol. Geol., 15, 189–210, 1992.
Mohr, P., Lithology and structure of the Precambrian rocks of Eritrea, inEvolution and Mineralization of the Arabian–Nubian Shield, Bull. Inst.Appl. Geol., vol. 2, edited by S. A. Tahoun, pp. 7–15, King Abdul AzizUniv., Jeddah, 1979.
Mohr, P., The Asmara dike swarm, Eritrean Plateau; physical parameters ofan off-rift olivine dolerite injection zone, Acta Vulcanol., 11, 177–181,1999.
Montanaro Gallitelli, E., Ricerche sull’eta di alcuni depositi insulari e mar-ginali del Mar Rosso, Paleontol. Ital., 39, 215–258, 1939.
Morgan, P., F. K. Boulos, S. F. Hennin, A. A. El-Sheriff, A. A. El-Sayeed,N. Z. Basta, and Y. S. Melek, Heat flow in eastern Egypt: The thermalsignature of a continental breakup, J. Geodyn., 4, 107–131, 1985.
Omar, G. I., and M. S. Steckler, Fission track evidence on the initial riftingof the Red Sea: Two pulses, no propagation, Science, 270, 1341–1344,1995.
Steckler, M. S., and G. I. Omar, Controls on erosional retreat of the upliftedrift flanks of the Gulf of Suez and northern Red Sea, J. Geophys. Res., 99,12,159–12,173, 1994.
Summerfield, M. A., Sub-aerial denudation of passive margins: Regionalelevation versus local relief models, Earth Planet. Sci. Lett., 102, 460–469, 1991.
Talbot, C. J., and W. Ghebreab, Red Sea detachment and basement corecomplexes in Eritrea, Geology, 25, 653–658, 1997.
Wagner, G. A., A. J. W. Gleadow, and P. G. Fitzgerald, The significance ofthe partial annealing zone in apatite fission-track analysis: Projected tracklength measurements and uplift chronology of the Transantarctic Moun-tains, Chem. Geol., 79, 295–305, 1989.
Zuffardi-Comerci, R., Corallari neogenici del Sahel eritreo, Atti R. Accad.Sci. Torino, 71, 1–15, 1936.
�����������������������E. Abbate, Dipartimento Scienze della Terra, Universita di Firenze, Via
La Pira 4, 50121 Firenze, Italy. ([email protected])M. L. Balestrieri and G. Bigazzi, CNR, Istituto di Geoscienze e Geo-
risorse, Via G. Moruzzi 1, 56124 Pisa, Italy.
ETG 12 - 12 ABBATE ET AL.: MORPHOSTRUCTURAL DEVELOPMENT OF THE ERITREAN RIFT FLANK
Related Documents