energies Article Monofacial and Bifacial Micro PV Installation as Element of Energy Transition—The Case of Poland Piotr Olczak 1, * , Malgorzata Olek 2 , Dominika Matuszewska 3 , Artur Dyczko 1 and Tomasz Mania 4 Citation: Olczak, P.; Olek, M.; Matuszewska, D.; Dyczko, A.; Mania, T. Monofacial and Bifacial Micro PV Installation as Element of Energy Transition—The Case of Poland. Energies 2021, 14, 499. https:// doi.org/10.3390/en14020499 Received: 23 November 2020 Accepted: 14 January 2021 Published: 18 January 2021 Publisher’s Note: MDPI stays neutral with regard to jurisdictional claims in published maps and institutional affil- iations. Copyright: © 2021 by the authors. Licensee MDPI, Basel, Switzerland. This article is an open access article distributed under the terms and conditions of the Creative Commons Attribution (CC BY) license (https:// creativecommons.org/licenses/by/ 4.0/). 1 Mineral and Energy Economy Research Institute, Polish Academy of Sciences, 7A Wybickiego St., 31-261 Cracow, Poland; [email protected] 2 Faculty of Environmental and Energy Engineering, Cracow University of Technology, 24 Warszawska, 31-155 Cracow, Poland; [email protected] 3 Faculty of Energy and Fuels, AGH University of Science and Technology, 30 Mickiewicza Ave., 30-059 Cracow, Poland; [email protected] 4 Department of Machines and Technical Systems, Faculty of Mechanical Engineering, UTP University of Science and Technology in Bydgoszcz, Al. prof. S. Kaliskiego 7, 85-796 Bydgoszcz, Poland; [email protected] * Correspondence: [email protected] Abstract: The several government subsidies available in Poland contributed to an increased interest in PV installations. Installed PV capacity increased from 100 MW in 2016 up to 2682.7 MW in July 2020. In 2019 alone, 104,000 microinstallations (up to 50 kWp) were installed in Poland. The paper determines the energy gain and the associated reduction of CO 2 emissions for two types of solar installation located in Poland. The monofacial solar modules with a power of 5.04 kWp (located in Leki) and bifacial solar modules with a power of 6.1 kWp (located in Bydgoszcz). Both installations use mono-crystalline Si-based 1st generation PV cells. With comparable insolation, a bifacial installation produces approx. 10% (for high insolation) to 28% (for low insolation) more energy than a monofacial PV installation. Avoided annual CO 2 emission in relation to the installation capacity ranges from 0.58 to 0.64 Mg/kWp for monofacial and from 0.68 to 0.74 Mg/kWp for bifacial and is on average approx. 16% higher for bifacial installations. Cost-benefit analyses were made. For different electricity prices, the NPV for monofacial and bifacial was determined. Keywords: photovoltaic; monofacial PV; bifacial PV; renewable energy source; CO 2 emission; my electricity; PV; Poland; Mój Pr ˛ ad 1. Introduction Currently, the development of the industry and technology has resulted in increased energy demand. At the same time, society is much more aware of the decreasing fossil fuel resources and other problems caused by burning fossil fuels such as climate change, eutrophication, acid rain, greenhouse gas (GHG), mercury and other pollutant emissions, etc. [1,2]. Poland is one of countries where fossil fuels, mainly coal, is widely used to supply energy [3] and is facing the urgent need for developing a proper solution to deal with problems caused by the energy sector from environmental, technology, and economic points of view [4]. Data from KOBiZE shows that GHG emissions were 413.8 million tons of CO 2eq in Poland in 2017. Comparing to 1990 and 1988, emissions have been reduced by 12.8% and 28.3%, respectively. One of the pillars of decarbonisation of Europe could be solar photovoltaic (PV) power generation [5]. In the European Union (EU), solar PV electricity generation capacity increased from 1.9 GW in 2010 to over 133 GW in 2019. The year 2019 alone brought an increase in new installed capacity by 16.5 GW in EU [6]. At the end of 2019, from the installed PV power capacity both in EU and UK, around 150 TWh of electricity could be generated (which gives around 5.2% of the final electricity demand) [7]. Efficiency of solar PV system depends on the insolation, PV technology, system components Energies 2021, 14, 499. https://doi.org/10.3390/en14020499 https://www.mdpi.com/journal/energies

Welcome message from author
This document is posted to help you gain knowledge. Please leave a comment to let me know what you think about it! Share it to your friends and learn new things together.
Transcript
energies
Article
Monofacial and Bifacial Micro PV Installation as Element ofEnergy Transition—The Case of Poland
Piotr Olczak 1,* , Małgorzata Olek 2, Dominika Matuszewska 3 , Artur Dyczko 1 and Tomasz Mania 4
�����������������
Citation: Olczak, P.; Olek, M.;
Matuszewska, D.; Dyczko, A.; Mania,
T. Monofacial and Bifacial Micro PV
Installation as Element of Energy
Transition—The Case of Poland.
Energies 2021, 14, 499. https://
doi.org/10.3390/en14020499
Received: 23 November 2020
Accepted: 14 January 2021
Published: 18 January 2021
Publisher’s Note: MDPI stays neutral
with regard to jurisdictional claims in
published maps and institutional affil-
iations.
Copyright: © 2021 by the authors.
Licensee MDPI, Basel, Switzerland.
This article is an open access article
distributed under the terms and
conditions of the Creative Commons
Attribution (CC BY) license (https://
creativecommons.org/licenses/by/
4.0/).
1 Mineral and Energy Economy Research Institute, Polish Academy of Sciences, 7A Wybickiego St.,31-261 Cracow, Poland; [email protected]
2 Faculty of Environmental and Energy Engineering, Cracow University of Technology, 24 Warszawska,31-155 Cracow, Poland; [email protected]
3 Faculty of Energy and Fuels, AGH University of Science and Technology, 30 Mickiewicza Ave.,30-059 Cracow, Poland; [email protected]
4 Department of Machines and Technical Systems, Faculty of Mechanical Engineering, UTP University ofScience and Technology in Bydgoszcz, Al. prof. S. Kaliskiego 7, 85-796 Bydgoszcz, Poland;[email protected]
* Correspondence: [email protected]
Abstract: The several government subsidies available in Poland contributed to an increased interestin PV installations. Installed PV capacity increased from 100 MW in 2016 up to 2682.7 MW inJuly 2020. In 2019 alone, 104,000 microinstallations (up to 50 kWp) were installed in Poland. Thepaper determines the energy gain and the associated reduction of CO2 emissions for two typesof solar installation located in Poland. The monofacial solar modules with a power of 5.04 kWp(located in Leki) and bifacial solar modules with a power of 6.1 kWp (located in Bydgoszcz). Bothinstallations use mono-crystalline Si-based 1st generation PV cells. With comparable insolation, abifacial installation produces approx. 10% (for high insolation) to 28% (for low insolation) moreenergy than a monofacial PV installation. Avoided annual CO2 emission in relation to the installationcapacity ranges from 0.58 to 0.64 Mg/kWp for monofacial and from 0.68 to 0.74 Mg/kWp for bifacialand is on average approx. 16% higher for bifacial installations. Cost-benefit analyses were made. Fordifferent electricity prices, the NPV for monofacial and bifacial was determined.
Keywords: photovoltaic; monofacial PV; bifacial PV; renewable energy source; CO2 emission; myelectricity; PV; Poland; Mój Prad
1. Introduction
Currently, the development of the industry and technology has resulted in increasedenergy demand. At the same time, society is much more aware of the decreasing fossilfuel resources and other problems caused by burning fossil fuels such as climate change,eutrophication, acid rain, greenhouse gas (GHG), mercury and other pollutant emissions,etc. [1,2]. Poland is one of countries where fossil fuels, mainly coal, is widely used tosupply energy [3] and is facing the urgent need for developing a proper solution to dealwith problems caused by the energy sector from environmental, technology, and economicpoints of view [4]. Data from KOBiZE shows that GHG emissions were 413.8 million tonsof CO2eq in Poland in 2017. Comparing to 1990 and 1988, emissions have been reducedby 12.8% and 28.3%, respectively. One of the pillars of decarbonisation of Europe couldbe solar photovoltaic (PV) power generation [5]. In the European Union (EU), solar PVelectricity generation capacity increased from 1.9 GW in 2010 to over 133 GW in 2019. Theyear 2019 alone brought an increase in new installed capacity by 16.5 GW in EU [6]. At theend of 2019, from the installed PV power capacity both in EU and UK, around 150 TWh ofelectricity could be generated (which gives around 5.2% of the final electricity demand) [7].Efficiency of solar PV system depends on the insolation, PV technology, system components
Energies 2021, 14, 499. https://doi.org/10.3390/en14020499 https://www.mdpi.com/journal/energies
Energies 2021, 14, 499 2 of 22
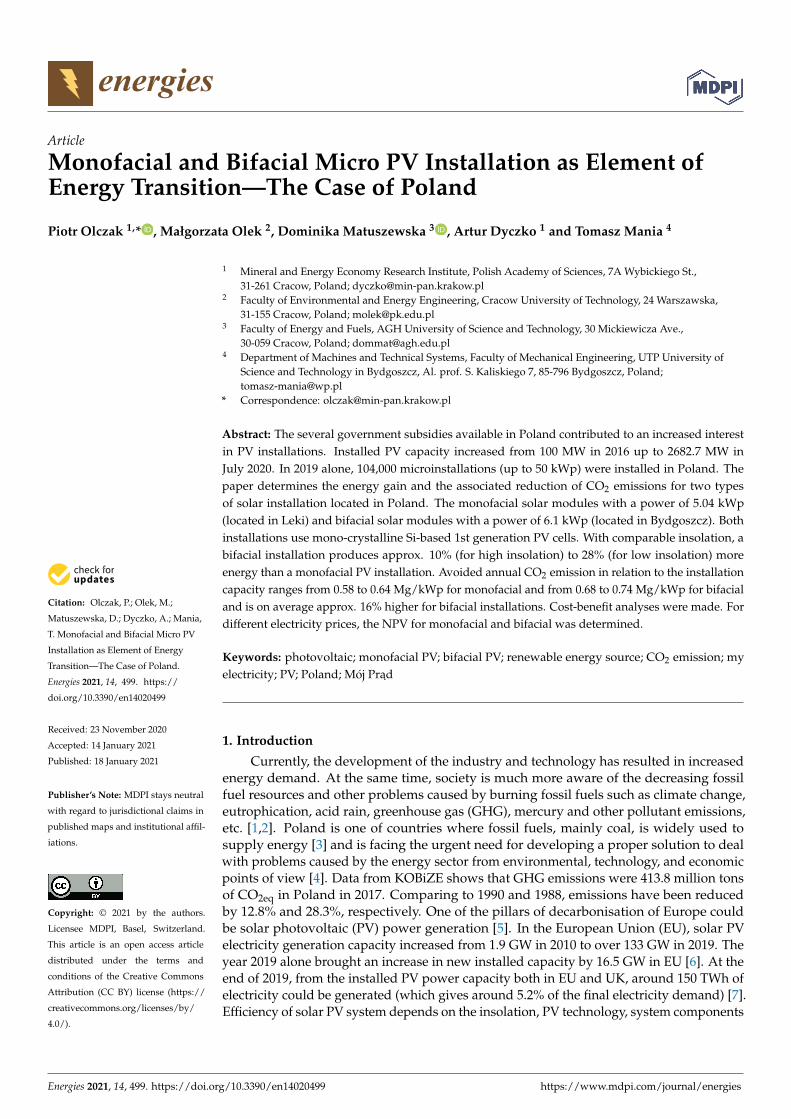
and suitable design. The performance of PV depends on many different environmentalparameters such as irradiance level, temperature, angular losses, partial shading, andsoiling losses [8,9]. Currently, the biggest photovoltaic market in European countries withtemperate climates is observed in Germany, Netherland or Poland [10]. For Poland, theestimated value of insolation during a year is about 1000 kWh/m2 [11–13] (Figure 1). InPoland PV sector is the fastest developed renewable energy source (RES) sector with thehighest power growth over the past three years [14]–from 100 MW/a in 2016 up to almost700 MW/a in 2019 and 2682.7 MW data as of October 1, 2020 [15,16]. It is estimated that by2030, the installed capacity in PV will increase by approximately 5–7 GW, while in 2040-byapprox. 10–16 GW [15,17]. Poland (after Germany, Spain, Netherlands, and France) hasbeen in fifth place in EU in terms of establishing new PV systems capacities.
Energies 2021, 14, x FOR PEER REVIEW 2 of 22
demand) [7]. Efficiency of solar PV system depends on the insolation, PV technology, sys-
tem components and suitable design. The performance of PV depends on many different
environmental parameters such as irradiance level, temperature, angular losses, partial
shading, and soiling losses [8,9]. Currently, the biggest photovoltaic market in European
countries with temperate climates is observed in Germany, Netherland or Poland [10]. For
Poland, the estimated value of insolation during a year is about 1000 kWh/m2 [11–13] (Fig-
ure 1). In Poland PV sector is the fastest developed renewable energy source (RES) sector
with the highest power growth over the past three years [14]–from 100 MW/a in 2016 up
to almost 700 MW/a in 2019 and 2682.7 MW data as of October 1, 2020 [15,16]. It is esti-
mated that by 2030, the installed capacity in PV will increase by approximately 5–7 GW,
while in 2040-by approx. 10–16 GW [15,17]. Poland (after Germany, Spain, Netherlands,
and France) has been in fifth place in EU in terms of establishing new PV systems capaci-
ties.
Figure 1. Yearly horizontal insolation in Poland calculated per province’s capital city. KP prov-
ince—Kuyavian-Pomeranian; M province–Lesser Poland. Source own study based on [18].
Jager-Waldau et al. [7] analyse the role of PV to obtain the long-term strategy of the
European Commission for energy and climate change and set the target of GHG reduction
from 40% to 55% by 2030. Achieving this can make Europe the first climate-neutral conti-
nent by 2050. Depending on the strategic policy scenario, reaching 55% GHG emissions
reduction would be possible if the cumulative PV capacity both in the EU and the UK
surge to 455–605 GW up to 2030.
Taking under consideration ambitious plans of 55% GHG reduction in the EU up to
2030, it has been important to analyse the potential of micro-PV installations for reduction
CO2 emission in Poland. Among the renewable energy technologies available in Poland,
the greatest increase is observed in PV installations, usually microinstallations (especially
up to 10 kWp) [16,19]. The reason for the increase in the number of micro-PV are subsidies
in the form of government programs: “My Electricity” [14], Czyste Powietrze, Energia
Plus, Prosument or Agroenergia (intended for farmers). These programs make it possible
to subsidise the purchase and installation of new PV panels. In addition, the advantage of
microinstallations is that annually from 25 to 30% of energy is consumed on site, and the
rest of the energy can be consumed by neighbouring buildings within one microgrid (low
voltage ≈ 230 V). The off-grid independent PV systems are suitable and attractive for many
Figure 1. Yearly horizontal insolation in Poland calculated per province’s capital city. KP province—Kuyavian-Pomeranian; M province–Lesser Poland. Source own study based on [18].
Jager-Waldau et al. [7] analyse the role of PV to obtain the long-term strategy ofthe European Commission for energy and climate change and set the target of GHGreduction from 40% to 55% by 2030. Achieving this can make Europe the first climate-neutral continent by 2050. Depending on the strategic policy scenario, reaching 55% GHGemissions reduction would be possible if the cumulative PV capacity both in the EU andthe UK surge to 455–605 GW up to 2030.
Taking under consideration ambitious plans of 55% GHG reduction in the EU up to2030, it has been important to analyse the potential of micro-PV installations for reductionCO2 emission in Poland. Among the renewable energy technologies available in Poland,the greatest increase is observed in PV installations, usually microinstallations (especiallyup to 10 kWp) [16,19]. The reason for the increase in the number of micro-PV are subsidiesin the form of government programs: “My Electricity” [14], Czyste Powietrze, EnergiaPlus, Prosument or Agroenergia (intended for farmers). These programs make it possibleto subsidise the purchase and installation of new PV panels. In addition, the advantageof microinstallations is that annually from 25 to 30% of energy is consumed on site, andthe rest of the energy can be consumed by neighbouring buildings within one microgrid(low voltage ≈ 230 V). The off-grid independent PV systems are suitable and attractive formany applications for technical, economical, safety, legal reasons [20,21]. In rural areas the
Energies 2021, 14, 499 3 of 22
microscale installations are preferred due to their simplicity and stand-alone applications,wherein the investment in solar energy is strongly connected with the household incomeand wealth [22].
In contrast, the introduction of the auction support system has contributed to thedevelopment of large solar PV farms (over 1 MW) [23,24]. In addition, the energy priceincreases and PV’ investment cost drops (learning curve [25]), caused the popularization ofthe energy prosumer business model in which company invest in PV installations for itsown needs [26].
In addition, in accordance with the Polish Energy Policy, a user without a PV instal-lation uses electricity from the energy mix [27]. This means that every hour we have adifferent share of sources generating electricity, including residual amounts from RES.When we install renewable energy sources and have, for example, 1 MWh of our ownenergy, the use of energy from the mix decreases, and because renewable energy sourceshave priority, we reduce energy consumption from conventional sources. So 1 MWh ofrenewable energy replaces 1 MWh of nonrenewable energy, and not a mix with the currentshare of renewable energy [17,28], which is related to the reduction of CO2 emissions [29].
Taking under consideration the Polish conditions related to subsidies (grants perkWp [16]) and Prosumer rules, it is not profitable to oversize the installation [30].
In the Prosument program, under which it is possible to settle energy from RESfor microinstallations, a household can receive 80% (prosumer factor PF) for 10 kWpinstallation and 70% for 10 kWp to 50 kWp). For example, for 1 kWh supplied to thegrid, a household can receive 0.8 kWh (up to 10 kWp), or 0.7 kWh (up to 50 kWp). Forinstallations up to 10 kWp, a surplus of over 125% causes overproduction economicallyunprofitable for the household (the energy does not disappear in the grid, but the user getsnothing for surplus) [30,31].
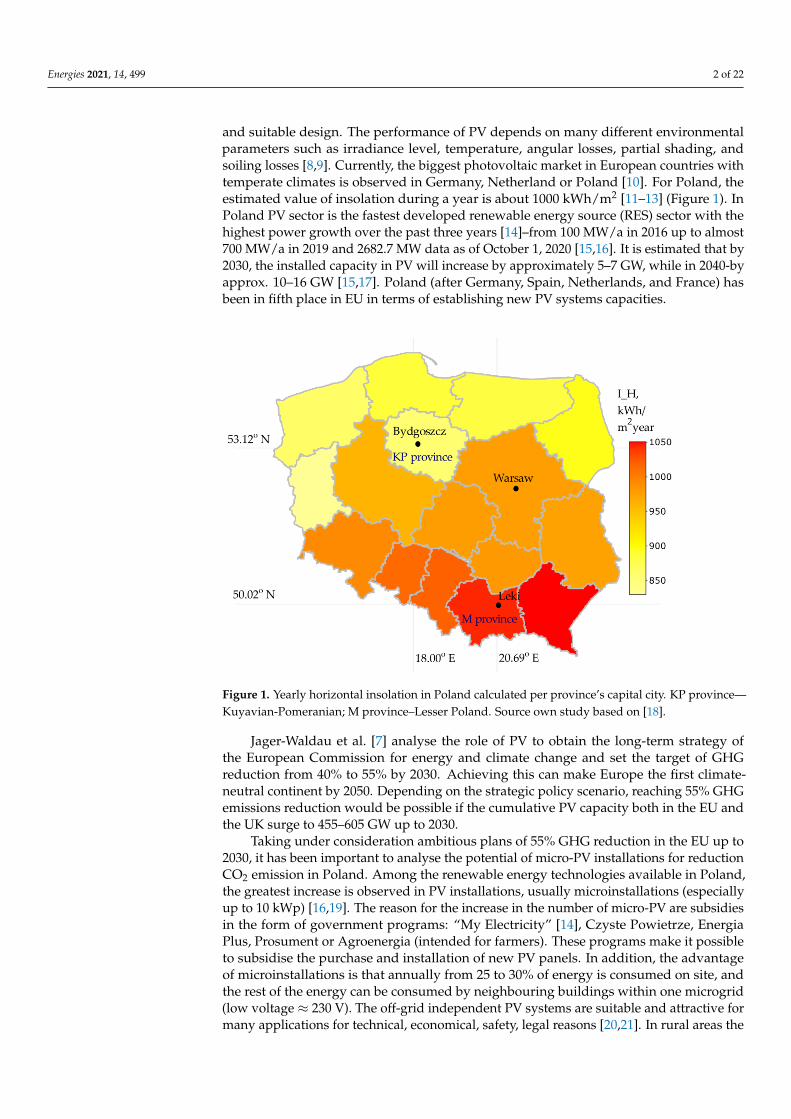
Microinstallation up to 50 kWp do not need a building permit (when the installationheight does not exceed 3 m), therefore the construction process is much more simplified.Microinstallations are typically installed on the roof or on ground/soil, but there is acondition that the ground should be for building purpose not for agriculture one. Thepaper focuses on microphotovoltaic installations located in the Kuyavian-Pomeranian andLesser Poland province (localization-Figure 1). Characteristics of the energy productionis represented by the annual values of energy sent to the grid. The amount of energyconsumed from the grid is also presented [32]. Figures 2 and 3 show the performancecharacteristics for a selected group of installations in the Lesser Poland province.
Energies 2021, 14, x FOR PEER REVIEW 3 of 22
applications for technical, economical, safety, legal reasons [20,21]. In rural areas the mi-
croscale installations are preferred due to their simplicity and stand-alone applications,
wherein the investment in solar energy is strongly connected with the household income
and wealth [22].
In contrast, the introduction of the auction support system has contributed to the
development of large solar PV farms (over 1 MW) [23,24]. In addition, the energy price
increases and PV’ investment cost drops (learning curve [25]), caused the popularization
of the energy prosumer business model in which company invest in PV installations for
its own needs [26].
In addition, in accordance with the Polish Energy Policy, a user without a PV instal-
lation uses electricity from the energy mix [27]. This means that every hour we have a
different share of sources generating electricity, including residual amounts from RES.
When we install renewable energy sources and have, for example, 1 MWh of our own
energy, the use of energy from the mix decreases, and because renewable energy sources
have priority, we reduce energy consumption from conventional sources. So 1 MWh of
renewable energy replaces 1 MWh of nonrenewable energy, and not a mix with the cur-
rent share of renewable energy [17,28], which is related to the reduction of CO2 emissions
[29].
Taking under consideration the Polish conditions related to subsidies (grants per
kWp [16]) and Prosumer rules, it is not profitable to oversize the installation [30].
In the Prosument program, under which it is possible to settle energy from RES for
microinstallations, a household can receive 80% (prosumer factor PF) for 10 kWp installa-
tion and 70% for 10 kWp to 50 kWp). For example, for 1 kWh supplied to the grid, a house-
hold can receive 0.8 kWh (up to 10 kWp), or 0.7 kWh (up to 50 kWp). For installations up
to 10 kWp, a surplus of over 125% causes overproduction economically unprofitable for
the household (the energy does not disappear in the grid, but the user gets nothing for
surplus) [30,31].
Microinstallation up to 50 kWp do not need a building permit (when the installation
height does not exceed 3 m), therefore the construction process is much more simplified.
Microinstallations are typically installed on the roof or on ground/soil, but there is a con-
dition that the ground should be for building purpose not for agriculture one. The paper
focuses on microphotovoltaic installations located in the Kuyavian-Pomeranian and
Lesser Poland province (localization-Figure 1.). Characteristics of the energy production
is represented by the annual values of energy sent to the grid. The amount of energy con-
sumed from the grid is also presented [32]. Figures 2 and 3 show the performance charac-
teristics for a selected group of installations in the Lesser Poland province.
0
50
100
150
200
250
300
0.0
0.2
0.4
0.6
0.8
1.0
1.2
2.95
3.00
3.08
3.58
3.60
3.60
3.78
4.05
4.05
4.13
4.13
4.20
4.27
4.50
4.50
4.68
4.70
4.80
4.95
4.96
5.00
5.04
5.13
5.23
5.50
6.00
6.16
6.60
6.75
6.90
7.00
7.23
8.25
9.72
9.90
9.99 en
erg
y s
ent
to t
he
gri
d/f
rom
th
e g
rid
, %
sen
t to
th
e g
ird
, MW
h/k
Wp
/yea
r
micro-installation PV power in household, kWp
energy sent to the grid/PV power yearly share: sent to the grid/from the grid
Figure 2. Annual values of energy sent to the grid in relation to the installed capacity and the annual share of energy sentto the grid in relation to the consumed, in the Lesser Poland province 1 June 2019–31 May 2020. Source own study basedon [32].
Energies 2021, 14, 499 4 of 22
Energies 2021, 14, x FOR PEER REVIEW 4 of 22
Figure 2. Annual values of energy sent to the grid in relation to the installed capacity and the annual share of energy sent
to the grid in relation to the consumed, in the Lesser Poland province 1 June 2019–31 May 2020. Source own study based
on [32].
Figure 3. Annual values of energy sent to the grid in relation per kWp to insolation and the maximum annual self-con-
sumed (max. self-consumed/insolation) share, in the Lesser Poland province, 1 June 2019–31 May 2020. Source own study
based on [32].
Among installations with a capacity of 2.95 kWp to 10 kWp, 23 out of 36 installations
sent more energy to the grid than they consumed during the year, of which in 13 this share
was greater than 125%. On the other hand, one should bear in mind the ecological effects
and avoided CO2 emissions. The surplus energy is sent to the grid, thus reducing the use
of fossil fuels.
Based on insolation measured in Lesser Poland province (1124 kWh/m2/year [29])
and energy sent to the grid measured (Figure 2) in each installation theoretical maximum
value of self-consumed energy was calculated (Figure 3) The average (for this province)
maximum value of the self-consumed energy share was obtained as 24%. Mean value of
selected PV installation power is 5.18 kWp but for above-mentioned the biggest grants
program “My electricity” mean PV installation power value in 2019 was 5.39 kWp (ob-
tained for 3060 microinstallation [15]). Theoretically, the more production is sent to the
network, the lower the self-consumption rate can be.
A similar analysis was performed for a selected group of installations in the Kuya-
vian-Pomeranian province and shown in Figures 4 and 5.
Figure 4. Annual values of energy sent to the grid in relation to the installed capacity and the annual share of energy sent
to the grid in relation to the consumed, in the Kuyavian-Pomeranian province, 2019. Source: own study based on [32].
0.0
0.2
0.4
0.6
0.8
1.02.
95
3.00
3.08
3.58
3.60
3.60
3.78
4.05
4.05
4.13
4.13
4.20
4.27
4.50
4.50
4.68
4.70
4.80
4.95
4.96
5.00
5.04
5.13
5.23
5.50
6.00
6.16
6.60
6.75
6.90
7.00
7.23
8.25
9.72
9.90
9.99
shar
e
micro-installation PV power in household, kWp
energy sent to the grid/insolation max. self-consumed/insolation
0
50
100
150
200
250
0.0
0.1
0.2
0.3
0.4
0.5
0.6
0.7
0.8
0.9
1.0
2.16
2.16
2.95
2.97
2.97
3.00
3.00
3.00
3.00
3.00
3.00
3.00
3.12
3.18
3.20
3.30
3.60
3.96
4.00
4.13
4.16
4.35
4.48
4.88
4.88
5.00
5.00
5.00
5.04
5.06
5.30
5.40
6.00
6.00
8.10
9.20
9.62
9.72
9.74
9.76
ener
gy
sen
t to
th
e g
rid
/fro
m t
he
gri
d, %
sen
t to
th
e g
ird
, MW
h/k
Wp
/yea
r
micro-installation PV power in household, kWp
energy sent to the grid/PV power yearly share: sent to the grid/from the grid
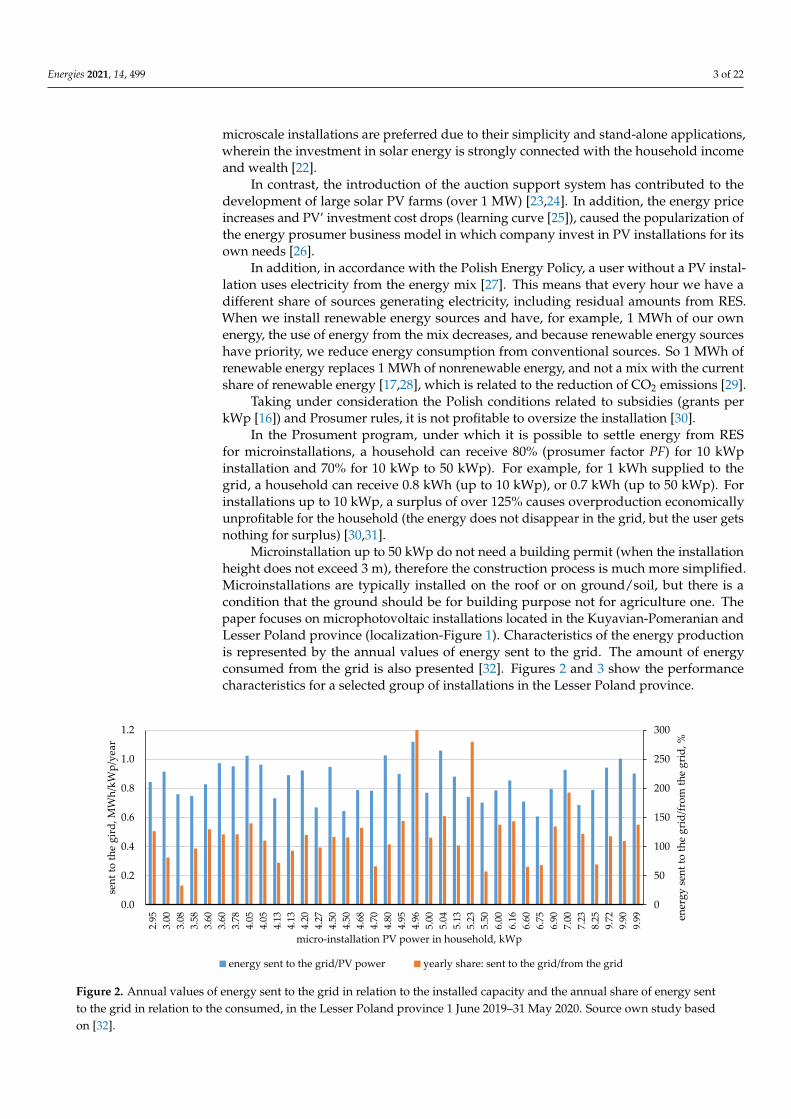
Figure 3. Annual values of energy sent to the grid in relation per kWp to insolation and the maximum annual self-consumed(max. self-consumed/insolation) share, in the Lesser Poland province, 1 June 2019–31 May 2020. Source own study basedon [32].
Among installations with a capacity of 2.95 kWp to 10 kWp, 23 out of 36 installationssent more energy to the grid than they consumed during the year, of which in 13 this sharewas greater than 125%. On the other hand, one should bear in mind the ecological effectsand avoided CO2 emissions. The surplus energy is sent to the grid, thus reducing the useof fossil fuels.
Based on insolation measured in Lesser Poland province (1124 kWh/m2/year [29])and energy sent to the grid measured (Figure 2) in each installation theoretical maximumvalue of self-consumed energy was calculated (Figure 3) The average (for this province)maximum value of the self-consumed energy share was obtained as 24%. Mean value ofselected PV installation power is 5.18 kWp but for above-mentioned the biggest grantsprogram “My electricity” mean PV installation power value in 2019 was 5.39 kWp (obtainedfor 3060 microinstallation [15]). Theoretically, the more production is sent to the network,the lower the self-consumption rate can be.
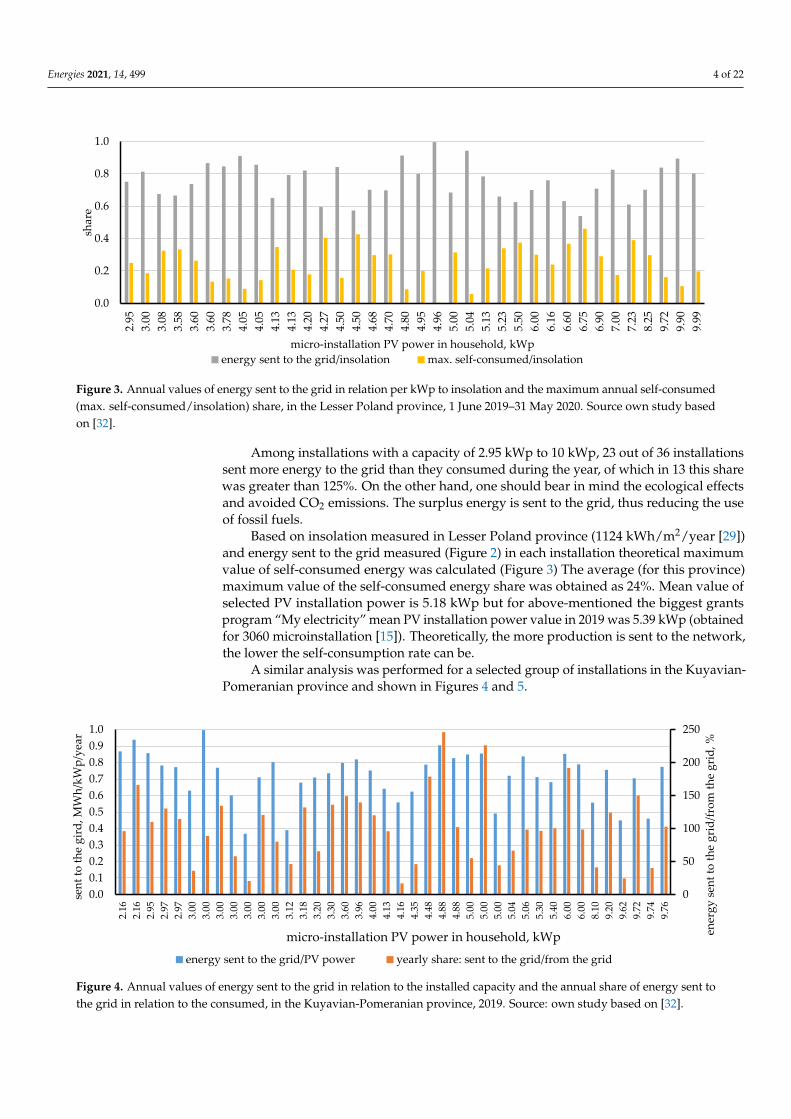
A similar analysis was performed for a selected group of installations in the Kuyavian-Pomeranian province and shown in Figures 4 and 5.
Energies 2021, 14, x FOR PEER REVIEW 4 of 22
Figure 2. Annual values of energy sent to the grid in relation to the installed capacity and the annual share of energy sent
to the grid in relation to the consumed, in the Lesser Poland province 1 June 2019–31 May 2020. Source own study based
on [32].
Figure 3. Annual values of energy sent to the grid in relation per kWp to insolation and the maximum annual self-con-
sumed (max. self-consumed/insolation) share, in the Lesser Poland province, 1 June 2019–31 May 2020. Source own study
based on [32].
Among installations with a capacity of 2.95 kWp to 10 kWp, 23 out of 36 installations
sent more energy to the grid than they consumed during the year, of which in 13 this share
was greater than 125%. On the other hand, one should bear in mind the ecological effects
and avoided CO2 emissions. The surplus energy is sent to the grid, thus reducing the use
of fossil fuels.
Based on insolation measured in Lesser Poland province (1124 kWh/m2/year [29])
and energy sent to the grid measured (Figure 2) in each installation theoretical maximum
value of self-consumed energy was calculated (Figure 3) The average (for this province)
maximum value of the self-consumed energy share was obtained as 24%. Mean value of
selected PV installation power is 5.18 kWp but for above-mentioned the biggest grants
program “My electricity” mean PV installation power value in 2019 was 5.39 kWp (ob-
tained for 3060 microinstallation [15]). Theoretically, the more production is sent to the
network, the lower the self-consumption rate can be.
A similar analysis was performed for a selected group of installations in the Kuya-
vian-Pomeranian province and shown in Figures 4 and 5.
Figure 4. Annual values of energy sent to the grid in relation to the installed capacity and the annual share of energy sent
to the grid in relation to the consumed, in the Kuyavian-Pomeranian province, 2019. Source: own study based on [32].
0.0
0.2
0.4
0.6
0.8
1.0
2.95
3.00
3.08
3.58
3.60
3.60
3.78
4.05
4.05
4.13
4.13
4.20
4.27
4.50
4.50
4.68
4.70
4.80
4.95
4.96
5.00
5.04
5.13
5.23
5.50
6.00
6.16
6.60
6.75
6.90
7.00
7.23
8.25
9.72
9.90
9.99
shar
e
micro-installation PV power in household, kWp
energy sent to the grid/insolation max. self-consumed/insolation
0
50
100
150
200
250
0.0
0.1
0.2
0.3
0.4
0.5
0.6
0.7
0.8
0.9
1.0
2.16
2.16
2.95
2.97
2.97
3.00
3.00
3.00
3.00
3.00
3.00
3.00
3.12
3.18
3.20
3.30
3.60
3.96
4.00
4.13
4.16
4.35
4.48
4.88
4.88
5.00
5.00
5.00
5.04
5.06
5.30
5.40
6.00
6.00
8.10
9.20
9.62
9.72
9.74
9.76
ener
gy
sen
t to
th
e g
rid
/fro
m t
he
gri
d, %
sen
t to
th
e g
ird
, MW
h/k
Wp
/yea
r
micro-installation PV power in household, kWp
energy sent to the grid/PV power yearly share: sent to the grid/from the grid
Figure 4. Annual values of energy sent to the grid in relation to the installed capacity and the annual share of energy sent tothe grid in relation to the consumed, in the Kuyavian-Pomeranian province, 2019. Source: own study based on [32].
Energies 2021, 14, 499 5 of 22Energies 2021, 14, x FOR PEER REVIEW 5 of 22
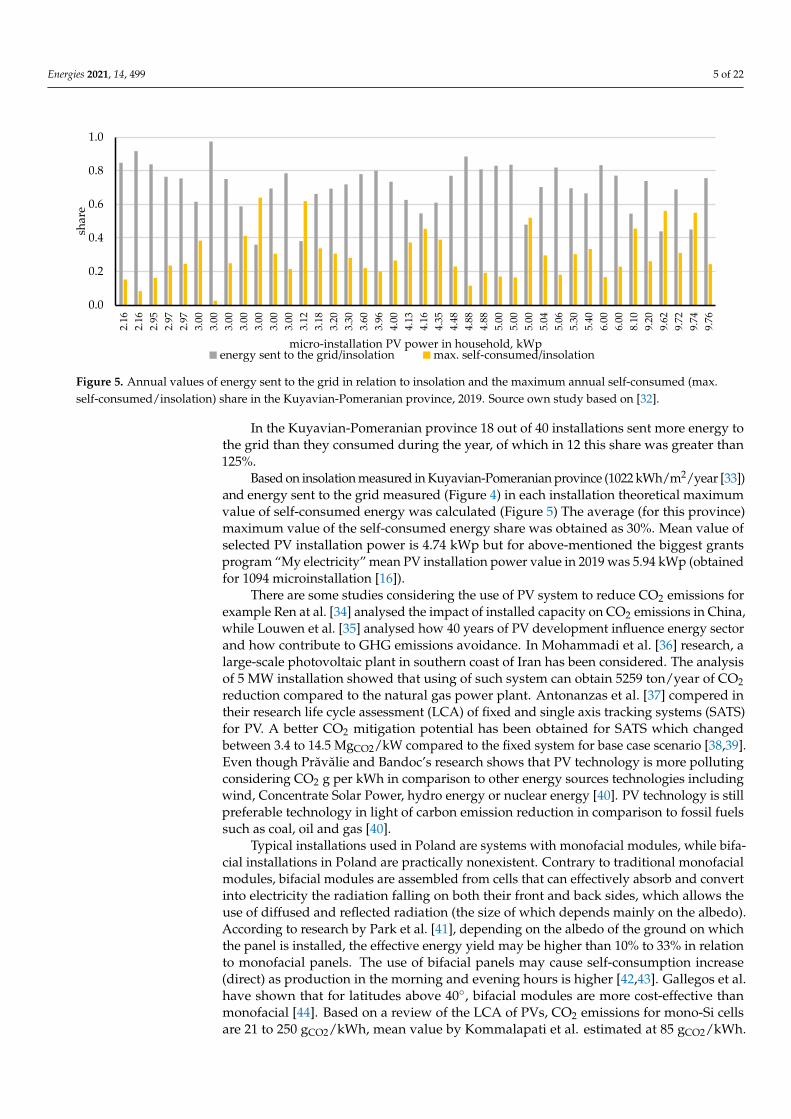
Figure 5. Annual values of energy sent to the grid in relation to insolation and the maximum annual self-consumed (max.
self-consumed/insolation) share in the Kuyavian-Pomeranian province, 2019. Source own study based on [32].
In the Kuyavian-Pomeranian province 18 out of 40 installations sent more energy to the
grid than they consumed during the year, of which in 12 this share was greater than 125%.
Based on insolation measured in Kuyavian-Pomeranian province (1022 kWh/m2/year
[33]) and energy sent to the grid measured (Figure 4) in each installation theoretical max-
imum value of self-consumed energy was calculated (Figure 5) The average (for this prov-
ince) maximum value of the self-consumed energy share was obtained as 30%. Mean
value of selected PV installation power is 4.74 kWp but for above-mentioned the biggest
grants program “My electricity” mean PV installation power value in 2019 was 5.94 kWp
(obtained for 1094 microinstallation [16]).
There are some studies considering the use of PV system to reduce CO2 emissions for
example Ren at al. [34] analysed the impact of installed capacity on CO2 emissions in
China, while Louwen et al. [35] analysed how 40 years of PV development influence en-
ergy sector and how contribute to GHG emissions avoidance. In Mohammadi et al. [36]
research, a large-scale photovoltaic plant in southern coast of Iran has been considered.
The analysis of 5 MW installation showed that using of such system can obtain 5259
ton/year of CO2 reduction compared to the natural gas power plant. Antonanzas et al. [37]
compered in their research life cycle assessment (LCA) of fixed and single axis tracking
systems (SATS) for PV. A better CO2 mitigation potential has been obtained for SATS
which changed between 3.4 to 14.5 MgCO2/kW compared to the fixed system for base case
scenario [38,39]. Even though Prăvălie and Bandoc’s research shows that PV technology
is more polluting considering CO2 g per kWh in comparison to other energy sources tech-
nologies including wind, Concentrate Solar Power, hydro energy or nuclear energy [40].
PV technology is still preferable technology in light of carbon emission reduction in com-
parison to fossil fuels such as coal, oil and gas [40].
Typical installations used in Poland are systems with monofacial modules, while bi-
facial installations in Poland are practically nonexistent. Contrary to traditional monofa-
cial modules, bifacial modules are assembled from cells that can effectively absorb and
convert into electricity the radiation falling on both their front and back sides, which al-
lows the use of diffused and reflected radiation (the size of which depends mainly on the
albedo). According to research by Park et al. [41], depending on the albedo of the ground
on which the panel is installed, the effective energy yield may be higher than 10% to 33%
in relation to monofacial panels. The use of bifacial panels may cause self-consumption
increase (direct) as production in the morning and evening hours is higher [42,43].
Gallegos et al. have shown that for latitudes above 40°, bifacial modules are more cost-
effective than monofacial [44]. Based on a review of the LCA of PVs, CO2 emissions for
mono-Si cells are 21 to 250 gCO2/kWh, mean value by Kommalapati et al. estimated at 85
gCO2/kWh. The large discrepancy in values depend on the energy mix at every step of the
0.0
0.2
0.4
0.6
0.8
1.0
2.16
2.16
2.95
2.97
2.97
3.00
3.00
3.00
3.00
3.00
3.00
3.00
3.12
3.18
3.20
3.30
3.60
3.96
4.00
4.13
4.16
4.35
4.48
4.88
4.88
5.00
5.00
5.00
5.04
5.06
5.30
5.40
6.00
6.00
8.10
9.20
9.62
9.72
9.74
9.76
shar
e
micro-installation PV power in household, kWpenergy sent to the grid/insolation max. self-consumed/insolation
Figure 5. Annual values of energy sent to the grid in relation to insolation and the maximum annual self-consumed (max.self-consumed/insolation) share in the Kuyavian-Pomeranian province, 2019. Source own study based on [32].
In the Kuyavian-Pomeranian province 18 out of 40 installations sent more energy tothe grid than they consumed during the year, of which in 12 this share was greater than125%.
Based on insolation measured in Kuyavian-Pomeranian province (1022 kWh/m2/year [33])and energy sent to the grid measured (Figure 4) in each installation theoretical maximumvalue of self-consumed energy was calculated (Figure 5) The average (for this province)maximum value of the self-consumed energy share was obtained as 30%. Mean value ofselected PV installation power is 4.74 kWp but for above-mentioned the biggest grantsprogram “My electricity” mean PV installation power value in 2019 was 5.94 kWp (obtainedfor 1094 microinstallation [16]).
There are some studies considering the use of PV system to reduce CO2 emissions forexample Ren at al. [34] analysed the impact of installed capacity on CO2 emissions in China,while Louwen et al. [35] analysed how 40 years of PV development influence energy sectorand how contribute to GHG emissions avoidance. In Mohammadi et al. [36] research, alarge-scale photovoltaic plant in southern coast of Iran has been considered. The analysisof 5 MW installation showed that using of such system can obtain 5259 ton/year of CO2reduction compared to the natural gas power plant. Antonanzas et al. [37] compered intheir research life cycle assessment (LCA) of fixed and single axis tracking systems (SATS)for PV. A better CO2 mitigation potential has been obtained for SATS which changedbetween 3.4 to 14.5 MgCO2/kW compared to the fixed system for base case scenario [38,39].Even though Prăvălie and Bandoc’s research shows that PV technology is more pollutingconsidering CO2 g per kWh in comparison to other energy sources technologies includingwind, Concentrate Solar Power, hydro energy or nuclear energy [40]. PV technology is stillpreferable technology in light of carbon emission reduction in comparison to fossil fuelssuch as coal, oil and gas [40].
Typical installations used in Poland are systems with monofacial modules, while bifa-cial installations in Poland are practically nonexistent. Contrary to traditional monofacialmodules, bifacial modules are assembled from cells that can effectively absorb and convertinto electricity the radiation falling on both their front and back sides, which allows theuse of diffused and reflected radiation (the size of which depends mainly on the albedo).According to research by Park et al. [41], depending on the albedo of the ground on whichthe panel is installed, the effective energy yield may be higher than 10% to 33% in relationto monofacial panels. The use of bifacial panels may cause self-consumption increase(direct) as production in the morning and evening hours is higher [42,43]. Gallegos et al.have shown that for latitudes above 40◦, bifacial modules are more cost-effective thanmonofacial [44]. Based on a review of the LCA of PVs, CO2 emissions for mono-Si cellsare 21 to 250 gCO2/kWh, mean value by Kommalapati et al. estimated at 85 gCO2/kWh.
Energies 2021, 14, 499 6 of 22
The large discrepancy in values depend on the energy mix at every step of the supplychain [39]. The cleaner the mix, the cleaner the solar array production. Reich et al. statedthat the intensity of GHG emissions may be zero g CO2-eq/kWh for energy based onrenewable sources and nuclear energy up to 200 gCO2/kWh for energy only from coal [45].The current GHG footprint is around 25 gCO2/kWh for mono-Si PV systems, down from409 gCO2/kWh in 1986 [35]. There are few LCAs for bifacial modules; analysis by Gazbouret al. shows a value of 31 gCO2/kWh [46].
As shown in the paragraph above, the listed programs are not the main driving forcebehind the selection of bifacial PV panels. As shown on the Polish market, there is noresearch on the use of bifacial panels, for which a higher yield in the form of energy (froma limited area) can be achieved, and one of the goals of this work is to show how higherthis yield is. Currently, due to the fact that bifacial PV panels are a newer solution thanmono-facial panels (as well as less frequently used), they are more expensive, however,their popularization should affect their prices and attractiveness of use on global andPolish markets. The novelty of this paper is a comparison of a new solution for Polishclimate conditions with bifacial panels to a traditional monofacial installation. Checking theeconomic (a profitability analysis) and ecological benefits (an assessment of the potential toavoid CO2 emissions) of using solar installations in the implemented co-financing programsfor this type of projects. On the basis of the conducted research, the energy gains of bothinstallations and the amount of CO2 emission reduction were determined. Depending onthe structure of energy generation and the related CO2 emission index, the unit cost of CO2reduction was estimated in the perspective of 20 years.
2. Configurations of Analyzed Monofacial and Bifacial Micro PV
Productivity analyses were carried out for two photovoltaic installations. Classicmonofacial PV located in Lesser Poland with a capacity of 5.04 kWp and bifacial PV locatedin Bydgoszcz with a capacity of 6.1 kWp. Both installations use mono-crystalline Si-based1st generation PV cells. A detailed analysis was carried out for June 2020.
2.1. PV Microinstallation in Leki (Lesser Poland Voivodship)
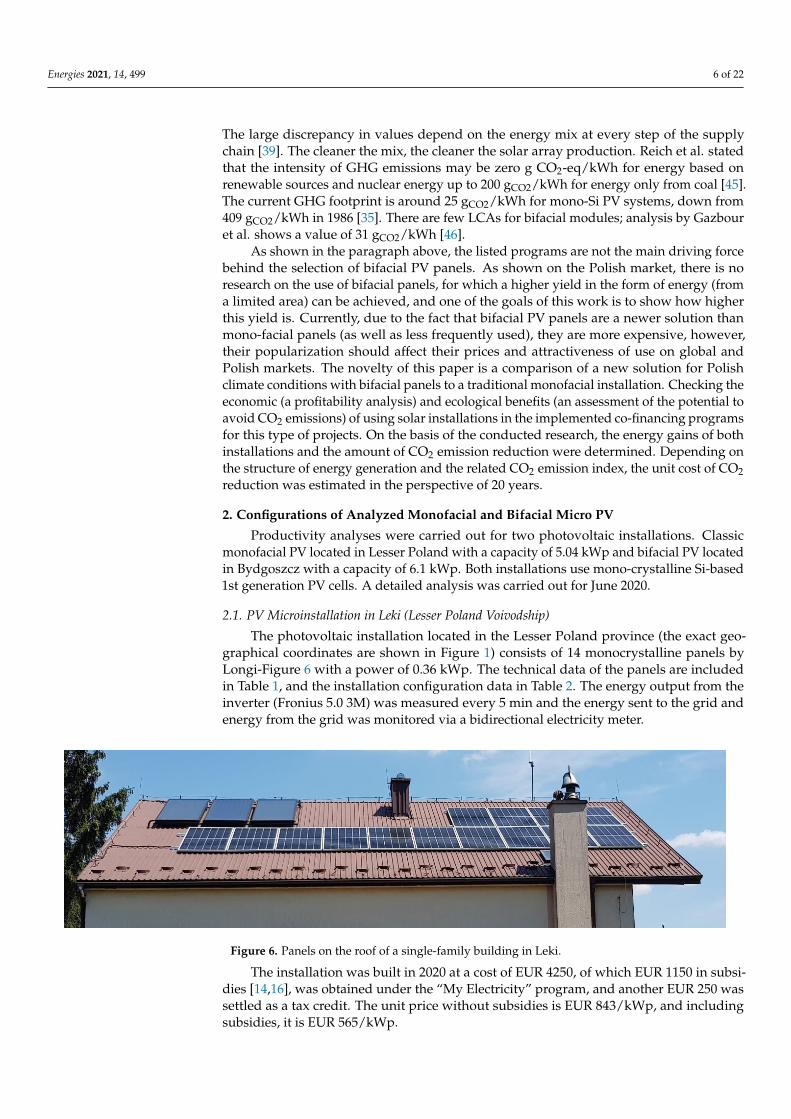
The photovoltaic installation located in the Lesser Poland province (the exact geo-graphical coordinates are shown in Figure 1) consists of 14 monocrystalline panels byLongi-Figure 6 with a power of 0.36 kWp. The technical data of the panels are includedin Table 1, and the installation configuration data in Table 2. The energy output from theinverter (Fronius 5.0 3M) was measured every 5 min and the energy sent to the grid andenergy from the grid was monitored via a bidirectional electricity meter.
Energies 2021, 14, x FOR PEER REVIEW 6 of 22
supply chain [39]. The cleaner the mix, the cleaner the solar array production. Reich et al.
stated that the intensity of GHG emissions may be zero g CO2-eq/kWh for energy based
on renewable sources and nuclear energy up to 200 gCO2/kWh for energy only from coal
[45]. The current GHG footprint is around 25 gCO2/kWh for mono-Si PV systems, down
from 409 gCO2/kWh in 1986 [35]. There are few LCAs for bifacial modules; analysis by Gaz-
bour et al. shows a value of 31 gCO2/kWh [46].
As shown in the paragraph above, the listed programs are not the main driving force
behind the selection of bifacial PV panels. As shown on the Polish market, there is no
research on the use of bifacial panels, for which a higher yield in the form of energy (from
a limited area) can be achieved, and one of the goals of this work is to show how higher
this yield is. Currently, due to the fact that bifacial PV panels are a newer solution than
mono-facial panels (as well as less frequently used), they are more expensive, however,
their popularization should affect their prices and attractiveness of use on global and
Polish markets. The novelty of this paper is a comparison of a new solution for Polish
climate conditions with bifacial panels to a traditional monofacial installation. Checking
the economic (a profitability analysis) and ecological benefits (an assessment of the poten-
tial to avoid CO2 emissions) of using solar installations in the implemented co-financing
programs for this type of projects. On the basis of the conducted research, the energy gains
of both installations and the amount of CO2 emission reduction were determined. De-
pending on the structure of energy generation and the related CO2 emission index, the
unit cost of CO2 reduction was estimated in the perspective of 20 years.
2. Configurations of Analyzed Monofacial and Bifacial Micro PV
Productivity analyses were carried out for two photovoltaic installations. Classic
monofacial PV located in Lesser Poland with a capacity of 5.04 kWp and bifacial PV lo-
cated in Bydgoszcz with a capacity of 6.1 kWp. Both installations use mono-crystalline Si-
based 1st generation PV cells. A detailed analysis was carried out for June 2020.
2.1. PV Microinstallation in Leki (Lesser Poland Voivodship)
The photovoltaic installation located in the Lesser Poland province (the exact geo-
graphical coordinates are shown in Figure 1) consists of 14 monocrystalline panels by
Longi-Figure 6 with a power of 0.36 kWp. The technical data of the panels are included in
Table 1, and the installation configuration data in Table 2. The energy output from the
inverter (Fronius 5.0 3M) was measured every 5 min and the energy sent to the grid and
energy from the grid was monitored via a bidirectional electricity meter.
Figure 6. Panels on the roof of a single-family building in Leki.
The installation was built in 2020 at a cost of EUR 4250, of which EUR 1150 in subsi-
dies [14,16], was obtained under the “My Electricity” program, and another EUR 250 was
settled as a tax credit. The unit price without subsidies is EUR 843/kWp, and including
subsidies, it is EUR 565/kWp.
Figure 6. Panels on the roof of a single-family building in Leki.
The installation was built in 2020 at a cost of EUR 4250, of which EUR 1150 in subsi-dies [14,16], was obtained under the “My Electricity” program, and another EUR 250 wassettled as a tax credit. The unit price without subsidies is EUR 843/kWp, and includingsubsidies, it is EUR 565/kWp.
Energies 2021, 14, 499 7 of 22
In 2018–2019, an analysis of the demand for electricity was carried out for the building(the annual total is about 5600 kWh), detailed results are included in the work by Kryziaet al. [43]. The energy produced in the installation replaces energy from the electricity gridat a price of EUR 0.14/kWh, the surplus energy produced is “virtually stored in the grid”(energy sent to the grid) and can be downloaded by the user again (up to one year) with areduction of 20% (for installation power up to 10 kWp) [47].
Table 1. Characteristics of PV panels. Source: own study based on [48,49].
Parameter Unit Leki Bydgoszcz
Name Longi HPH 360 BIFACIALNominal power kWp 0.36 0.305
Total length m 1.776 1.664Total width m 1.052 0.996
Temperature coefficient of theshort-circuit current %/◦C 0.057 0.029
Temperature coefficient of theopen-circuit voltage %/◦C −0.286 −0.224
Temperature coefficient of the power %/◦C −0.370 −0.279Technology Mono-PERC Bifacial, mono N
Table 2. Installation configuration.
Parameter Unit Leki Bydgoszcz
Number of panels 14 20Tilt angle ◦ 30 45Direction SW SInverter Fronius 5.0–3M 2xSolar Edge SE10k
Power of inverters kW 5 6.1Total PV panel power (PI) kWp 5.04 6.1
2.2. PV microinstallation (Bifacial) in Bydgoszcz (Kujawsko-Pomorskie Province)
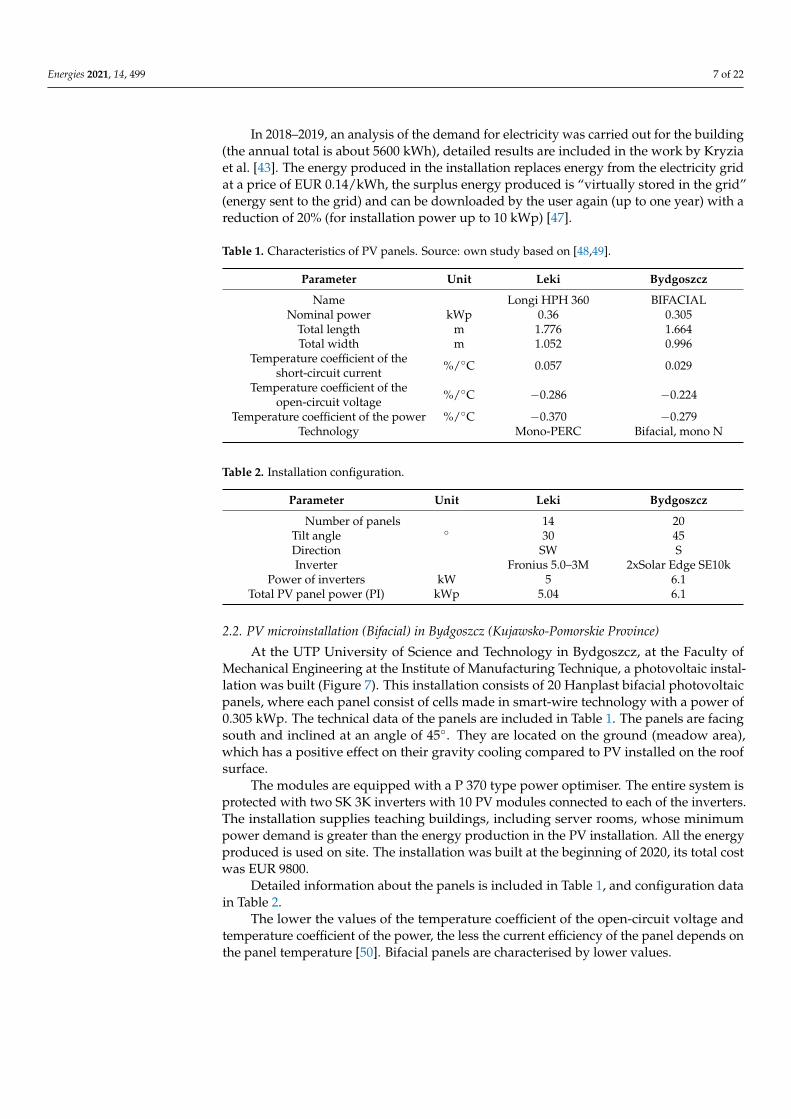
At the UTP University of Science and Technology in Bydgoszcz, at the Faculty ofMechanical Engineering at the Institute of Manufacturing Technique, a photovoltaic instal-lation was built (Figure 7). This installation consists of 20 Hanplast bifacial photovoltaicpanels, where each panel consist of cells made in smart-wire technology with a power of0.305 kWp. The technical data of the panels are included in Table 1. The panels are facingsouth and inclined at an angle of 45◦. They are located on the ground (meadow area),which has a positive effect on their gravity cooling compared to PV installed on the roofsurface.
The modules are equipped with a P 370 type power optimiser. The entire system isprotected with two SK 3K inverters with 10 PV modules connected to each of the inverters.The installation supplies teaching buildings, including server rooms, whose minimumpower demand is greater than the energy production in the PV installation. All the energyproduced is used on site. The installation was built at the beginning of 2020, its total costwas EUR 9800.
Detailed information about the panels is included in Table 1, and configuration datain Table 2.
The lower the values of the temperature coefficient of the open-circuit voltage andtemperature coefficient of the power, the less the current efficiency of the panel depends onthe panel temperature [50]. Bifacial panels are characterised by lower values.
Energies 2021, 14, 499 8 of 22
Energies 2021, 14, x FOR PEER REVIEW 7 of 22
In 2018–2019, an analysis of the demand for electricity was carried out for the build-
ing (the annual total is about 5600 kWh), detailed results are included in the work by
Kryzia et al. [43]. The energy produced in the installation replaces energy from the elec-
tricity grid at a price of EUR 0.14/kWh, the surplus energy produced is “virtually stored
in the grid” (energy sent to the grid) and can be downloaded by the user again (up to one
year) with a reduction of 20% (for installation power up to 10 kWp) [47].
2.2. PV microinstallation (Bifacial) in Bydgoszcz (Kujawsko-Pomorskie Province)
At the UTP University of Science and Technology in Bydgoszcz, at the Faculty of
Mechanical Engineering at the Institute of Manufacturing Technique, a photovoltaic in-
stallation was built (Figure 7). This installation consists of 20 Hanplast bifacial photovol-
taic panels, where each panel consist of cells made in smart-wire technology with a power
of 0.305 kWp. The technical data of the panels are included in Table 1. The panels are
facing south and inclined at an angle of 45°. They are located on the ground (meadow
area), which has a positive effect on their gravity cooling compared to PV installed on the
roof surface.
Figure 7. Setting up 5 × 4 panels on the ground in Bydgoszcz.
The modules are equipped with a P 370 type power optimiser. The entire system is
protected with two SK 3K inverters with 10 PV modules connected to each of the inverters.
The installation supplies teaching buildings, including server rooms, whose minimum
power demand is greater than the energy production in the PV installation. All the energy
produced is used on site. The installation was built at the beginning of 2020, its total cost
was EUR 9800.
Detailed information about the panels is included in Table 1, and configuration data
in Table 2.
Table 1. Characteristics of PV panels. Source: own study based on [48,49].
Parameter Unit Leki Bydgoszcz
Name Longi HPH 360 BIFACIAL
Nominal power kWp 0.36 0.305
Total length m 1.776 1.664
Total width m 1.052 0.996
Temperature coefficient of the short-
circuit current %/°C 0.057 0.029
Temperature coefficient of the open-
circuit voltage %/°C −0.286 −0.224
Figure 7. Setting up 5 × 4 panels on the ground in Bydgoszcz.
3. Methodology of Analyses3.1. Electricity Demand vs. Production
Based on the data on the structure of production and energy consumption in theanalysed buildings, the degree of coverage of the demand by PV systems was determined.Two factors have been identified: self-consumption (SC) and self-sufficiency (SS) indicators.The first could show the amount of energy produced and consumed in the same building(electric installation) with respect to total energy production in installations, at the sameperiod of time. The self-sufficiency coefficient (SS) is the amount of energy producedand consumed in the same building (electric installation) with respect to total energyconsumption in installations, at the same period of time.
SC(τ) = Esc(τ)/Ep(τ) (1)
where:
Esc—energy self-consumed from energy produced in PV installation directly in the building:energy consumption in the building minus energy from the gridEp—energy producedτ—time
SS(τ) = Esc(τ)/Ec(τ) (2)
where:
Ec—energy consumption in the buildingτ—time
3.2. Annual Energy Gains
Based on the measured monthly data on energy production from both installationsand statistical data on insolation on a horizontal surface and for angles characteristic forthe installations under consideration (Figures 8 and 9), the correction factors for multi-yearanalysis were determined. The method used in calculation had been based on [31,51–53].In terms of that the following correction factors were determined: insolation coefficient(IJC), changes in insolation for a given direction and angle of panel installation (IDA), solar
Energies 2021, 14, 499 9 of 22
radiation conversion for the whole year (JSHIA). The following formula for annual energygains (EAG) has been proposed:
EAG =1
I JC·IDA·JSHIA·EMG,
kWhyear
(3)
where:
EAG—Annual energy gains, kWh/yearEMG—Measured monthly energy gains, kWh/monthIJC—Insolation coefficient, kWh/kWh, Equation (4)IDA—Correction for Insolation on the direction and angle, kWh/kWhJSHIA—Converting the insolation from June to the whole year, month/year,
I JC = I_H_June(2020)/
(2020
∑year=2010
(I_H_June(year))/11
)(4)
I_H_June—Horizontal Insolation in June in year, kWh/(m2·month)
IDA(direction/location)
=
{I_TRY_SW30_June f or mono f acial
I_TRY_S45_June f or bi f acial/I_TRY_H_June
(5)
where:
I_TRY_H_June—Insolation for Typical Reference Year–Horizontal Surface, kWh/(m2·month)I_TRY_S45_June—Insolation for Typical Reference Year–south directed surface titled 45◦,kWh/(m2·month)TRY_SW30_June—Insolation for Typical Reference Year–south-west directed surface titled30◦ [18], kWh/(m2·month)
Energies 2021, 14, x FOR PEER REVIEW 9 of 22
IJC—Insolation coefficient, kWh/kWh, Equation (4)
IDA—Correction for Insolation on the direction and angle, kWh/kWh
JSHIA—Converting the insolation from June to the whole year, month/year,
𝐼𝐽𝐶 = 𝐼_𝐻_𝐽𝑢𝑛𝑒(2020)/(∑ (𝐼_𝐻_𝐽𝑢𝑛𝑒(𝑦𝑒𝑎𝑟))2020
𝑦𝑒𝑎𝑟=2010/11) (4)
I_H_June—Horizontal Insolation in June in year, kWh/(m2·month)
𝐼𝐷𝐴(𝑑𝑖𝑟𝑒𝑐𝑡𝑖𝑜𝑛/𝑙𝑜𝑐𝑎𝑡𝑖𝑜𝑛) = {𝐼_𝑇𝑅𝑌_𝑆𝑊30_𝐽𝑢𝑛𝑒 𝑓𝑜𝑟 𝑚𝑜𝑛𝑜𝑓𝑎𝑐𝑖𝑎𝑙
𝐼_𝑇𝑅𝑌_𝑆45_𝐽𝑢𝑛𝑒 𝑓𝑜𝑟 𝑏𝑖𝑓𝑎𝑐𝑖𝑎𝑙/𝐼_𝑇𝑅𝑌_𝐻_𝐽𝑢𝑛𝑒 (5)
where:
I_TRY_H_June—Insolation for Typical Reference Year–Horizontal Surface,
kWh/(m2·month)
I_TRY_S45_June—Insolation for Typical Reference Year–south directed surface titled 45°,
kWh/(m2·month)
TRY_SW30_June—Insolation for Typical Reference Year–south-west directed surface ti-
tled 30° [18], kWh/(m2·month)
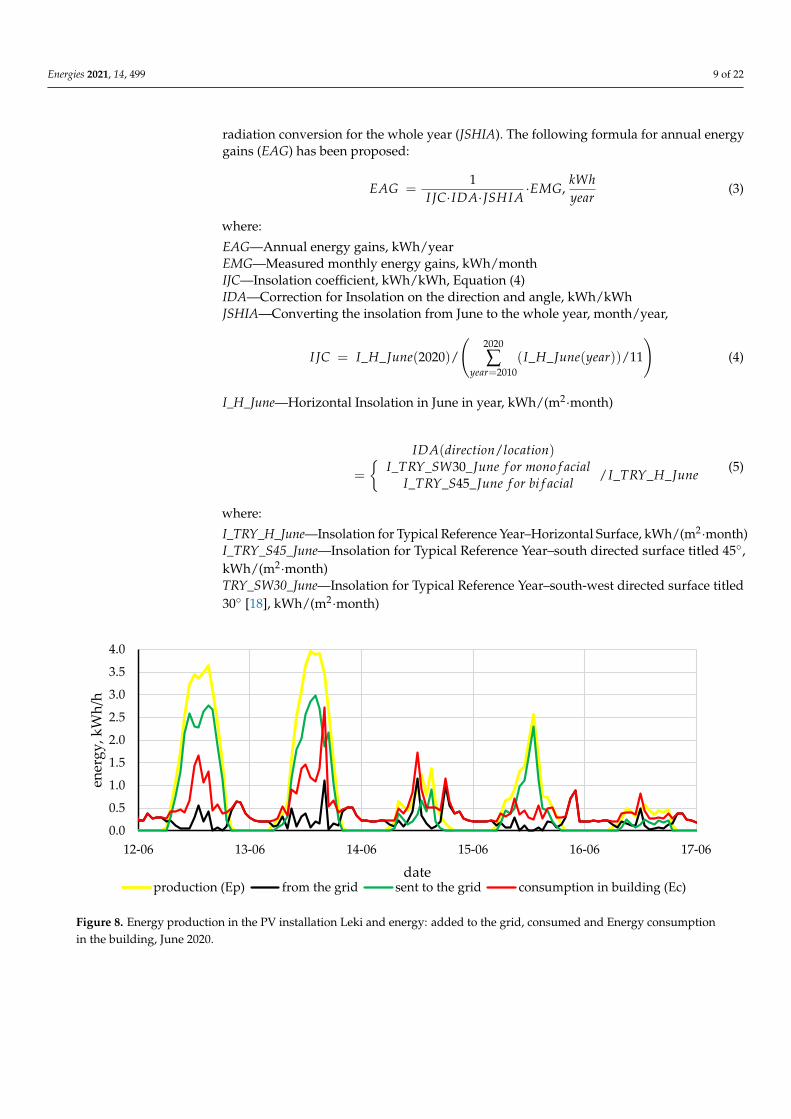
Figure 8. Energy production in the PV installation Leki and energy: added to the grid, consumed and Energy consumption
in the building, June 2020.
Figure 9. Self-consumption coefficient (SC) and self-sufficiency coefficient (SS) for several days of June 2020.
Based on the insolation data from 2010–2020 [33], the representativeness of insolation
data for the analysed June 2020 (JSHI) was determined:
𝐽𝑆𝐻𝐼 = 𝐼_𝐻_𝐽𝑢𝑛𝑒/𝐼_𝐻_𝑌𝑒𝑎𝑟 (6)
where:
0.0
0.5
1.0
1.5
2.0
2.5
3.0
3.5
4.0
12-06 13-06 14-06 15-06 16-06 17-06
ener
gy
, kW
h/h
dateproduction (Ep) from the grid sent to the grid consumption in building (Ec)
0
50
100
12-06 13-06 14-06 15-06 16-06 17-06
SC
, SS
%
date SC SS
Figure 8. Energy production in the PV installation Leki and energy: added to the grid, consumed and Energy consumptionin the building, June 2020.
Energies 2021, 14, 499 10 of 22
Energies 2021, 14, x FOR PEER REVIEW 9 of 22
IJC—Insolation coefficient, kWh/kWh, Equation (4)
IDA—Correction for Insolation on the direction and angle, kWh/kWh
JSHIA—Converting the insolation from June to the whole year, month/year,
𝐼𝐽𝐶 = 𝐼_𝐻_𝐽𝑢𝑛𝑒(2020)/(∑ (𝐼_𝐻_𝐽𝑢𝑛𝑒(𝑦𝑒𝑎𝑟))2020
𝑦𝑒𝑎𝑟=2010/11) (4)
I_H_June—Horizontal Insolation in June in year, kWh/(m2·month)
𝐼𝐷𝐴(𝑑𝑖𝑟𝑒𝑐𝑡𝑖𝑜𝑛/𝑙𝑜𝑐𝑎𝑡𝑖𝑜𝑛) = {𝐼_𝑇𝑅𝑌_𝑆𝑊30_𝐽𝑢𝑛𝑒 𝑓𝑜𝑟 𝑚𝑜𝑛𝑜𝑓𝑎𝑐𝑖𝑎𝑙
𝐼_𝑇𝑅𝑌_𝑆45_𝐽𝑢𝑛𝑒 𝑓𝑜𝑟 𝑏𝑖𝑓𝑎𝑐𝑖𝑎𝑙/𝐼_𝑇𝑅𝑌_𝐻_𝐽𝑢𝑛𝑒 (5)
where:
I_TRY_H_June—Insolation for Typical Reference Year–Horizontal Surface,
kWh/(m2·month)
I_TRY_S45_June—Insolation for Typical Reference Year–south directed surface titled 45°,
kWh/(m2·month)
TRY_SW30_June—Insolation for Typical Reference Year–south-west directed surface ti-
tled 30° [18], kWh/(m2·month)
Figure 8. Energy production in the PV installation Leki and energy: added to the grid, consumed and Energy consumption
in the building, June 2020.
Figure 9. Self-consumption coefficient (SC) and self-sufficiency coefficient (SS) for several days of June 2020.
Based on the insolation data from 2010–2020 [33], the representativeness of insolation
data for the analysed June 2020 (JSHI) was determined:
𝐽𝑆𝐻𝐼 = 𝐼_𝐻_𝐽𝑢𝑛𝑒/𝐼_𝐻_𝑌𝑒𝑎𝑟 (6)
where:
0.0
0.5
1.0
1.5
2.0
2.5
3.0
3.5
4.0
12-06 13-06 14-06 15-06 16-06 17-06
ener
gy
, kW
h/h
dateproduction (Ep) from the grid sent to the grid consumption in building (Ec)
0
50
100
12-06 13-06 14-06 15-06 16-06 17-06
SC
, SS
%
date SC SS
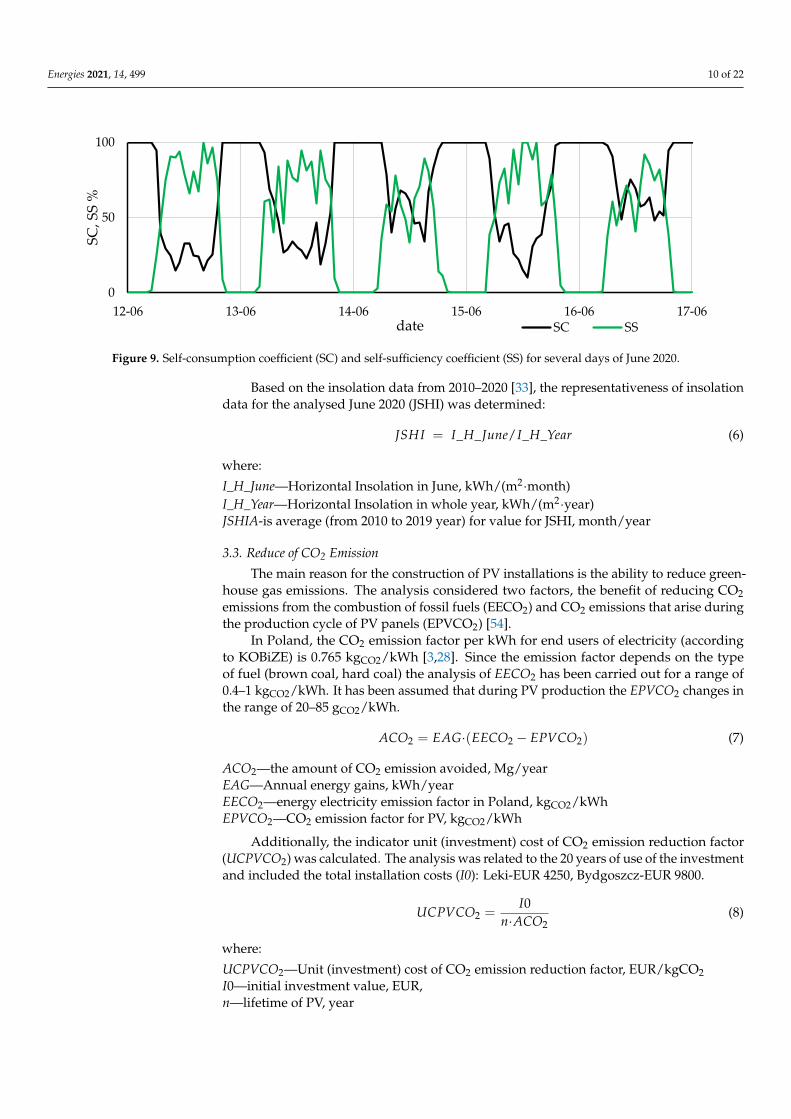
Figure 9. Self-consumption coefficient (SC) and self-sufficiency coefficient (SS) for several days of June 2020.
Based on the insolation data from 2010–2020 [33], the representativeness of insolationdata for the analysed June 2020 (JSHI) was determined:
JSHI = I_H_June/I_H_Year (6)
where:
I_H_June—Horizontal Insolation in June, kWh/(m2·month)I_H_Year—Horizontal Insolation in whole year, kWh/(m2·year)JSHIA-is average (from 2010 to 2019 year) for value for JSHI, month/year
3.3. Reduce of CO2 Emission
The main reason for the construction of PV installations is the ability to reduce green-house gas emissions. The analysis considered two factors, the benefit of reducing CO2emissions from the combustion of fossil fuels (EECO2) and CO2 emissions that arise duringthe production cycle of PV panels (EPVCO2) [54].
In Poland, the CO2 emission factor per kWh for end users of electricity (accordingto KOBiZE) is 0.765 kgCO2/kWh [3,28]. Since the emission factor depends on the typeof fuel (brown coal, hard coal) the analysis of EECO2 has been carried out for a range of0.4–1 kgCO2/kWh. It has been assumed that during PV production the EPVCO2 changes inthe range of 20–85 gCO2/kWh.
ACO2 = EAG·(EECO2 − EPVCO2) (7)
ACO2—the amount of CO2 emission avoided, Mg/yearEAG—Annual energy gains, kWh/yearEECO2—energy electricity emission factor in Poland, kgCO2/kWhEPVCO2—CO2 emission factor for PV, kgCO2/kWh
Additionally, the indicator unit (investment) cost of CO2 emission reduction factor(UCPVCO2) was calculated. The analysis was related to the 20 years of use of the investmentand included the total installation costs (I0): Leki-EUR 4250, Bydgoszcz-EUR 9800.
UCPVCO2 =I0
n·ACO2(8)
where:
UCPVCO2—Unit (investment) cost of CO2 emission reduction factor, EUR/kgCO2I0—initial investment value, EUR,n—lifetime of PV, year
Energies 2021, 14, 499 11 of 22
3.4. Profitability Analyses
The purpose of the economic analysis was to compare the economic results using NetPresent Value (NPV) (Equation (9)).
Moreover, it was assumed:
• Discount rate (r), varies in range from 0 to 0.06 [55],• Electricity price (ElP) from 0.1 to 0.2 EUR/kWh [43,56] (in 2020, ElP = 0.15 EUR/kWh),• Decrease in the PV panels productivity by 0.5% per year
NPV(ElP, r) =
[n
∑t=1
CFt
(1 + r)t
]− I0 (9)
where:
CFt is the cash flow in the year t, EUR (Equation (10)),t—year of the analysis,r—discount rate, %
CFt(ElP) = EAG·SC·ElP + PF·EAG· (1 − SC)·ElP − OC (10)
where:
CFt is the cash flow in the year t, EUR,OC—operating cost, EUR/year,PF—prosumer factor,ElP—electricity price, EUR/kWh,SC—self-consumption, Equation (1)
For the Leki installation, which was covered by the subsidy program, the cost ofreducing CO2 emissions was calculated for the options with and without subsidies. ForBydgoszcz, the analysis was compared to the cost invested in the installation.
Additionally, NPV differences were calculated for different ElP values and for differentr values:
di f f .NPV (ElP, r) = NPV(ElP, r) f or Leki – NPV(ElP, r) f or Bydgoszcz (11)
4. Results and Discussion4.1. Electricity Demand vs. Production
Figure 8 presents the details of the energy production, flow and consumption in thebuilding Leki for selected days with high and low energy production.
For the data presented in Figure 8, self-consumption (SC) and self-sufficiency (SS)indicators were determined.
High production was achieved on the 13 June and it was 32.22 kWh of which 21.98 kWhwere sent to the grid. Consumption on the analysed day was 16.95 kWh, of which 6.71 kWhwere obtained from the grid. For comparison, on June 14th, it was 8.04 kWh of which3.65 kWh were sent to the grid. The consumption on that day was 11.91 kWh, of which7.52 kWh were obtained from the grid.
The SC and SS coefficients were determined for 12–17 June, the obtained results arepresented in Figure 9. Then the SC and SS were determined for all hours of June-Figure 10.
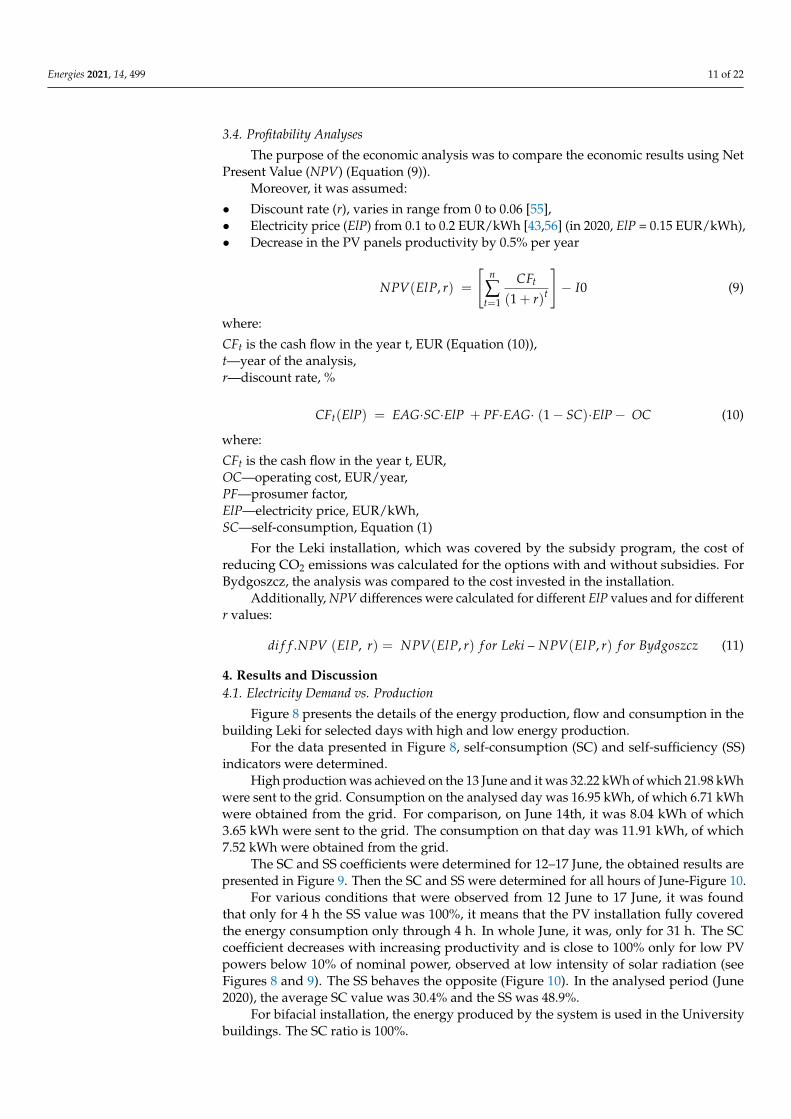
For various conditions that were observed from 12 June to 17 June, it was foundthat only for 4 h the SS value was 100%, it means that the PV installation fully coveredthe energy consumption only through 4 h. In whole June, it was, only for 31 h. The SCcoefficient decreases with increasing productivity and is close to 100% only for low PVpowers below 10% of nominal power, observed at low intensity of solar radiation (seeFigures 8 and 9). The SS behaves the opposite (Figure 10). In the analysed period (June2020), the average SC value was 30.4% and the SS was 48.9%.
For bifacial installation, the energy produced by the system is used in the Universitybuildings. The SC ratio is 100%.
Energies 2021, 14, 499 12 of 22
Energies 2021, 14, x FOR PEER REVIEW 11 of 22
For the Leki installation, which was covered by the subsidy program, the cost of re-
ducing CO2 emissions was calculated for the options with and without subsidies. For Byd-
goszcz, the analysis was compared to the cost invested in the installation.
Additionally, NPV differences were calculated for different ElP values and for differ-
ent r values:
𝑑𝑖𝑓𝑓. 𝑁𝑃𝑉 (𝐸𝑙𝑃, 𝑟) = 𝑁𝑃𝑉(𝐸𝑙𝑃, 𝑟) 𝑓𝑜𝑟 𝐿𝑒𝑘𝑖 – 𝑁𝑃𝑉(𝐸𝑙𝑃, 𝑟) 𝑓𝑜𝑟 𝐵𝑦𝑑𝑔𝑜𝑠𝑧𝑐𝑧 (11)
4. Results and Discussion
4.1. Electricity Demand vs. Production
Figure 8 presents the details of the energy production, flow and consumption in the
building Leki for selected days with high and low energy production.
For the data presented in Figure 8, self-consumption (SC) and self-sufficiency (SS)
indicators were determined.
High production was achieved on the 13 June and it was 32.22 kWh of which 21.98
kWh were sent to the grid. Consumption on the analysed day was 16.95 kWh, of which
6.71 kWh were obtained from the grid. For comparison, on June 14th, it was 8.04 kWh of
which 3.65 kWh were sent to the grid. The consumption on that day was 11.91 kWh, of
which 7.52 kWh were obtained from the grid.
The SC and SS coefficients were determined for 12–17 June, the obtained results are pre-
sented in Figure 9. Then the SC and SS were determined for all hours of June-Figure 10.
Figure 10. Self-consumption coefficient (SC) and self-sufficiency coefficient (SS) as a function of energy production per
hour. June 2020.
For various conditions that were observed from 12 June to 17 June, it was found that
only for 4 h the SS value was 100%, it means that the PV installation fully covered the
energy consumption only through 4 h. In whole June, it was, only for 31 h. The SC coeffi-
cient decreases with increasing productivity and is close to 100% only for low PV powers be-
low 10% of nominal power, observed at low intensity of solar radiation (see Figures 8 and 9).
The SS behaves the opposite (Figure 10). In the analysed period (June 2020), the average
SC value was 30.4% and the SS was 48.9%.
For bifacial installation, the energy produced by the system is used in the University
buildings. The SC ratio is 100%.
4.2. Anually Gain
The amount of energy produced by the Leki installation in the form of daily sums is
presented in Figure 11. The daily production of monofacial PV installation varied from 4
kWh to 32.5 kWh. In total, 583.87 kWh (EMG) was achieved in the period under examina-
tion.
0
20
40
60
80
100
0 0.5 1 1.5 2 2.5 3 3.5 4 4.5
SC
, SS
%
energy production per hour, kWh/hSC
SS
Figure 10. Self-consumption coefficient (SC) and self-sufficiency coefficient (SS) as a function of energy production per hour.June 2020.
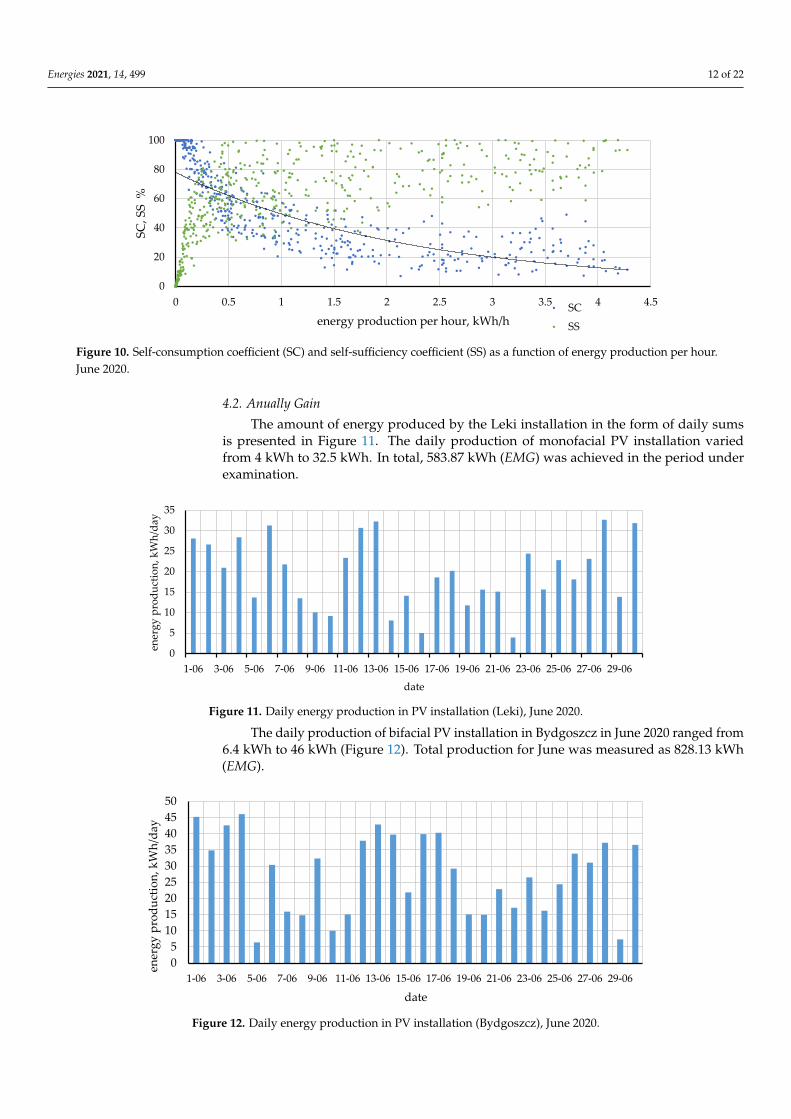
4.2. Anually Gain
The amount of energy produced by the Leki installation in the form of daily sumsis presented in Figure 11. The daily production of monofacial PV installation variedfrom 4 kWh to 32.5 kWh. In total, 583.87 kWh (EMG) was achieved in the period underexamination.
Energies 2021, 14, x FOR PEER REVIEW 12 of 22
Figure 11. Daily energy production in PV installation (Leki), June 2020.
The daily production of bifacial PV installation in Bydgoszcz in June 2020 ranged
from 6.4 kWh to 46 kWh (Figure 12). Total production for June was measured as 828.13
kWh (EMG).
Figure 12. Daily energy production in PV installation (Bydgoszcz), June 2020.
The recorded insolation values for each June in 2010–2020 for both locations are pre-
sented in Figure 13.
0
5
10
15
20
25
30
35
1-06 3-06 5-06 7-06 9-06 11-06 13-06 15-06 17-06 19-06 21-06 23-06 25-06 27-06 29-06
ener
gy
pro
du
ctio
n, k
Wh
/day
date
0
5
10
15
20
25
30
35
40
45
50
1-06 3-06 5-06 7-06 9-06 11-06 13-06 15-06 17-06 19-06 21-06 23-06 25-06 27-06 29-06
ener
gy
pro
du
ctio
n, k
Wh
/day
date
Figure 11. Daily energy production in PV installation (Leki), June 2020.
The daily production of bifacial PV installation in Bydgoszcz in June 2020 ranged from6.4 kWh to 46 kWh (Figure 12). Total production for June was measured as 828.13 kWh(EMG).
Energies 2021, 14, x FOR PEER REVIEW 12 of 22
Figure 11. Daily energy production in PV installation (Leki), June 2020.
The daily production of bifacial PV installation in Bydgoszcz in June 2020 ranged
from 6.4 kWh to 46 kWh (Figure 12). Total production for June was measured as 828.13
kWh (EMG).
Figure 12. Daily energy production in PV installation (Bydgoszcz), June 2020.
The recorded insolation values for each June in 2010–2020 for both locations are pre-
sented in Figure 13.
0
5
10
15
20
25
30
35
1-06 3-06 5-06 7-06 9-06 11-06 13-06 15-06 17-06 19-06 21-06 23-06 25-06 27-06 29-06
ener
gy
pro
du
ctio
n, k
Wh
/day
date
0
5
10
15
20
25
30
35
40
45
50
1-06 3-06 5-06 7-06 9-06 11-06 13-06 15-06 17-06 19-06 21-06 23-06 25-06 27-06 29-06
ener
gy
pro
du
ctio
n, k
Wh
/day
date
Figure 12. Daily energy production in PV installation (Bydgoszcz), June 2020.
Energies 2021, 14, 499 13 of 22
The recorded insolation values for each June in 2010–2020 for both locations arepresented in Figure 13.
Energies 2021, 14, x FOR PEER REVIEW 13 of 22
Figure 13. Comparison of insolation values varied from locations for June in the last 11 years. Source own study based on
[18,33,57].
In 2010–2020, the value of insolation in June for Leki varied from 145
kWh/(m2·month) to 184 kWh/(m2·month), and for Bydgoszcz from 144 kWh/(m2·month)
to 191 kWh/(m2·month). The value of insolation for Leki and Bydgoszcz in June 2020 was
142.45 kWh and 153.63 kWh (see also Figure 15) and was lower than the 11-year average
by 11% and 5%. For further calculations it was assumed that the insolation coefficient IJC
for the installation Leki and Bydgoszcz was 0.89 and 0.95, respectively.
On the basis of NASA Larc data [33], the average share of registered sunlight falling
on the horizontal surface for June was determined for both locations in relation to the
annual amount (TRY_H). The solar representativity for the south (TRY_S45) and south-
west (TRY_SW30) direction was also determined, referring to the percentage of insolation
for June in the year (Typical Reference Year)–Figure 14.
Figure 14. Comparison of the insolation values for both locations for June against the Typical Ref-
erence Year data and different location of the surface. (TRY_H–Typical Reference Year–Horizontal
Surface, TRY_S45-Typical Reference Year–south directed surface titled 45°, TRY_SW30-Typical
Reference Year–south-west directed surface titled 30° [18].
The average share of the registered insolation in June in relation to the annual value
was 15% and 15.9% (Figure 13) and was lower by 0.3 percent point (Leki) and higher by
1.4 percent point (Bydgoszcz) compared to the Typical Reference Year (Figure 11). Taking
10%
12%
14%
16%
18%
20%
0
40
80
120
160
200
2010 2011 2012 2013 2014 2015 2016 2017 2018 2019 2020
JSH
I
J_H
_Ju
ne,
kW
h/(
m2 ·
mo
nth
)
year
Leki (J_H_June) Bydgoszcz (J_H_June) Leki (JSHI) Bydgoszcz (JSHI)
164.4 kWh/m2/month
158.0
161.6124.3
122.9
121.3
12.0%
12.5%
13.0%
13.5%
14.0%
14.5%
15.0%
15.5%
16.0%
TRY_H TRY_S45 TRY_SW30
I_Ju
ne/
I_y
ear
position (slope) of surface
Leki Bydgoszcz
Figure 13. Comparison of insolation values varied from locations for June in the last 11 years. Source own study basedon [18,33,57].
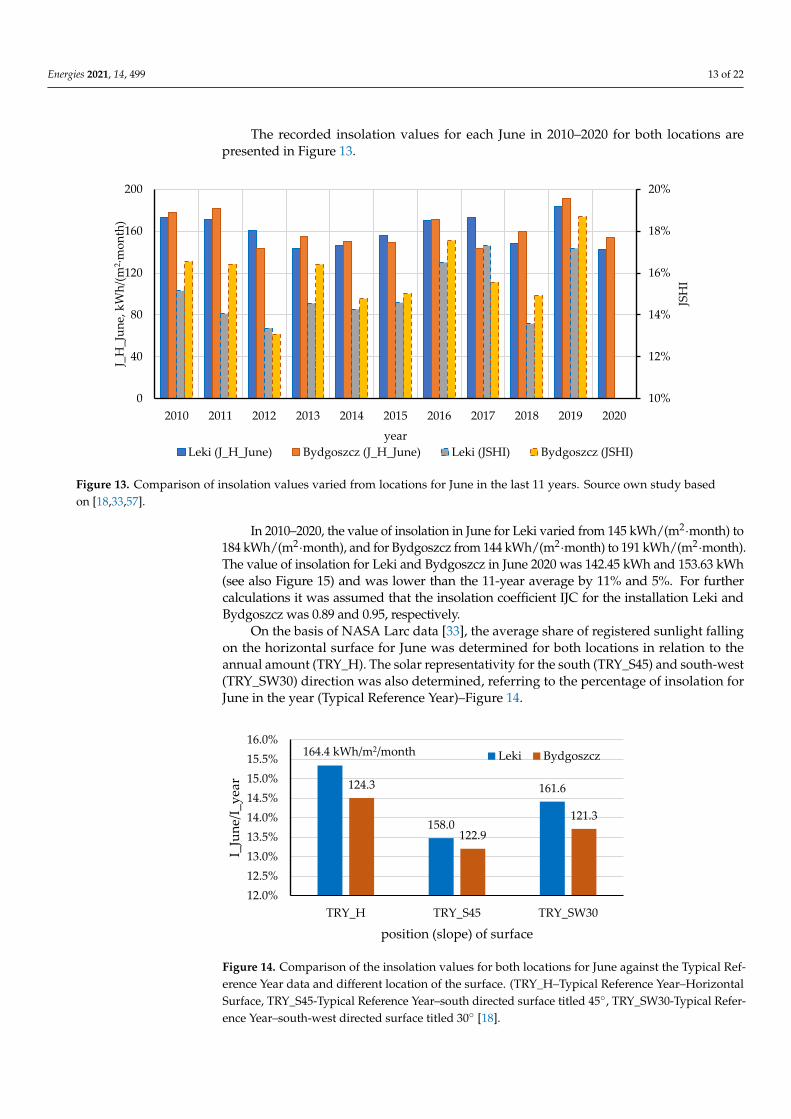
In 2010–2020, the value of insolation in June for Leki varied from 145 kWh/(m2·month) to184 kWh/(m2·month), and for Bydgoszcz from 144 kWh/(m2·month) to 191 kWh/(m2·month).The value of insolation for Leki and Bydgoszcz in June 2020 was 142.45 kWh and 153.63 kWh(see also Figure 15) and was lower than the 11-year average by 11% and 5%. For furthercalculations it was assumed that the insolation coefficient IJC for the installation Leki andBydgoszcz was 0.89 and 0.95, respectively.
On the basis of NASA Larc data [33], the average share of registered sunlight fallingon the horizontal surface for June was determined for both locations in relation to theannual amount (TRY_H). The solar representativity for the south (TRY_S45) and south-west(TRY_SW30) direction was also determined, referring to the percentage of insolation forJune in the year (Typical Reference Year)–Figure 14.
Energies 2021, 14, x FOR PEER REVIEW 13 of 22
Figure 13. Comparison of insolation values varied from locations for June in the last 11 years. Source own study based on
[18,33,57].
In 2010–2020, the value of insolation in June for Leki varied from 145
kWh/(m2·month) to 184 kWh/(m2·month), and for Bydgoszcz from 144 kWh/(m2·month)
to 191 kWh/(m2·month). The value of insolation for Leki and Bydgoszcz in June 2020 was
142.45 kWh and 153.63 kWh (see also Figure 15) and was lower than the 11-year average
by 11% and 5%. For further calculations it was assumed that the insolation coefficient IJC
for the installation Leki and Bydgoszcz was 0.89 and 0.95, respectively.
On the basis of NASA Larc data [33], the average share of registered sunlight falling
on the horizontal surface for June was determined for both locations in relation to the
annual amount (TRY_H). The solar representativity for the south (TRY_S45) and south-
west (TRY_SW30) direction was also determined, referring to the percentage of insolation
for June in the year (Typical Reference Year)–Figure 14.
Figure 14. Comparison of the insolation values for both locations for June against the Typical Ref-
erence Year data and different location of the surface. (TRY_H–Typical Reference Year–Horizontal
Surface, TRY_S45-Typical Reference Year–south directed surface titled 45°, TRY_SW30-Typical
Reference Year–south-west directed surface titled 30° [18].
The average share of the registered insolation in June in relation to the annual value
was 15% and 15.9% (Figure 13) and was lower by 0.3 percent point (Leki) and higher by
1.4 percent point (Bydgoszcz) compared to the Typical Reference Year (Figure 11). Taking
10%
12%
14%
16%
18%
20%
0
40
80
120
160
200
2010 2011 2012 2013 2014 2015 2016 2017 2018 2019 2020
JSH
I
J_H
_Ju
ne,
kW
h/(
m2 ·
mo
nth
)
year
Leki (J_H_June) Bydgoszcz (J_H_June) Leki (JSHI) Bydgoszcz (JSHI)
164.4 kWh/m2/month
158.0
161.6124.3
122.9
121.3
12.0%
12.5%
13.0%
13.5%
14.0%
14.5%
15.0%
15.5%
16.0%
TRY_H TRY_S45 TRY_SW30
I_Ju
ne/
I_y
ear
position (slope) of surface
Leki Bydgoszcz
Figure 14. Comparison of the insolation values for both locations for June against the Typical Ref-erence Year data and different location of the surface. (TRY_H–Typical Reference Year–HorizontalSurface, TRY_S45-Typical Reference Year–south directed surface titled 45◦, TRY_SW30-Typical Refer-ence Year–south-west directed surface titled 30◦ [18].
Energies 2021, 14, 499 14 of 22
The average share of the registered insolation in June in relation to the annual valuewas 15% and 15.9% (Figure 13) and was lower by 0.3 percent point (Leki) and higher by1.4 percent point (Bydgoszcz) compared to the Typical Reference Year (Figure 11). Takinginto account the direction of the panels’ installation, the insolation value for Leki differsby 0.9% compared to the Typical Reference Year-horizontal, while for Bydgoszcz by 1.2%compared to the Typical Reference Year-horizontal. For further calculations it was assumedthat the insolation on the direction and angle coefficient (IDA) for the Leki and Bydgoszczinstallations is 0.991 and 0.988, respectively.
Taking into account the coefficients IJC, IDA, JSHIA (Table 3) for both locations, theannual energy gain (EAG) for Leki and Bydgoszcz was calculated as 4300 kWh, 6091 kWh.
Table 3. Energy production correction factors and annual energy gains.
Parameter Unit Leki Bydgoszcz
Monthly energy gains, EMG kWh 583.87 828.13Insolation coefficient, IJC - 0.89 0.95
Insolation on the direction and angle, IDA - 0.991 0.988Converting the insolation from June to the
whole year, JSHIA - 0.154 0.145
Annual energy gains, EAG kWh 4300 6091Annual energy gains per PI, EAG/PI kWh/kWp 853 999
4.3. Comparison of Solar Energy Production
The value of insolation in June 2020 for both locations is shown in Figure 15 [33].
Energies 2021, 14, x FOR PEER REVIEW 14 of 22
into account the direction of the panels’ installation, the insolation value for Leki differs
by 0.9% compared to the Typical Reference Year-horizontal, while for Bydgoszcz by 1.2%
compared to the Typical Reference Year-horizontal. For further calculations it was as-
sumed that the insolation on the direction and angle coefficient (IDA) for the Leki and
Bydgoszcz installations is 0.991 and 0.988, respectively.
Taking into account the coefficients IJC, IDA, JSHIA (Table 3) for both locations, the
annual energy gain (EAG) for Leki and Bydgoszcz was calculated as 4300 kWh, 6091 kWh.
Table 3. Energy production correction factors and annual energy gains.
Parameter Unit Leki Bydgoszcz
Monthly energy gains, EMG kWh 583.87 828.13
Insolation coefficient, IJC - 0.89 0.95
Insolation on the direction and angle, IDA - 0.991 0.988
Converting the insolation from June to the whole
year, JSHIA - 0.154 0.145
Annual energy gains, EAG kWh 4300 6091
Annual energy gains per PI, EAG/PI kWh/kWp 853 999
4.3. Comparison of Solar Energy Production
The value of insolation in June 2020 for both locations is shown in Figure 15 [33].
Figure 15. Comparison of insolation values for both locations for individual days in June. (References to detail figures are
marked-energy production results for both installations.)
In order to compare the volume of energy production in both installations, two days
were selected (Figure 16) for which high insolation was recorded in both installations,
followed by days with low insolation.
Fig. 16
Fig 17a
Fig 17b
0
1
2
3
4
5
6
7
8
ho
rizo
nta
l in
sola
tio
n I
_H, k
Wh
date (June 2020) Leki Bydgoszcz
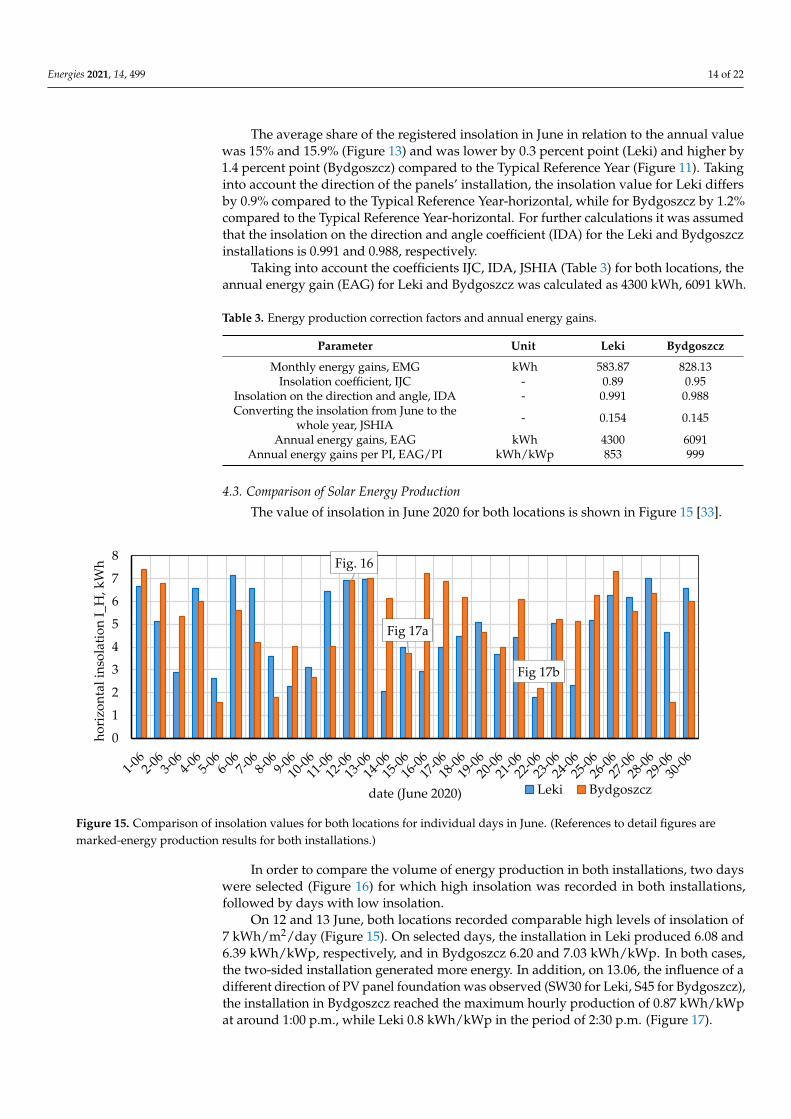
Figure 15. Comparison of insolation values for both locations for individual days in June. (References to detail figures aremarked-energy production results for both installations.)
In order to compare the volume of energy production in both installations, two dayswere selected (Figure 16) for which high insolation was recorded in both installations,followed by days with low insolation.
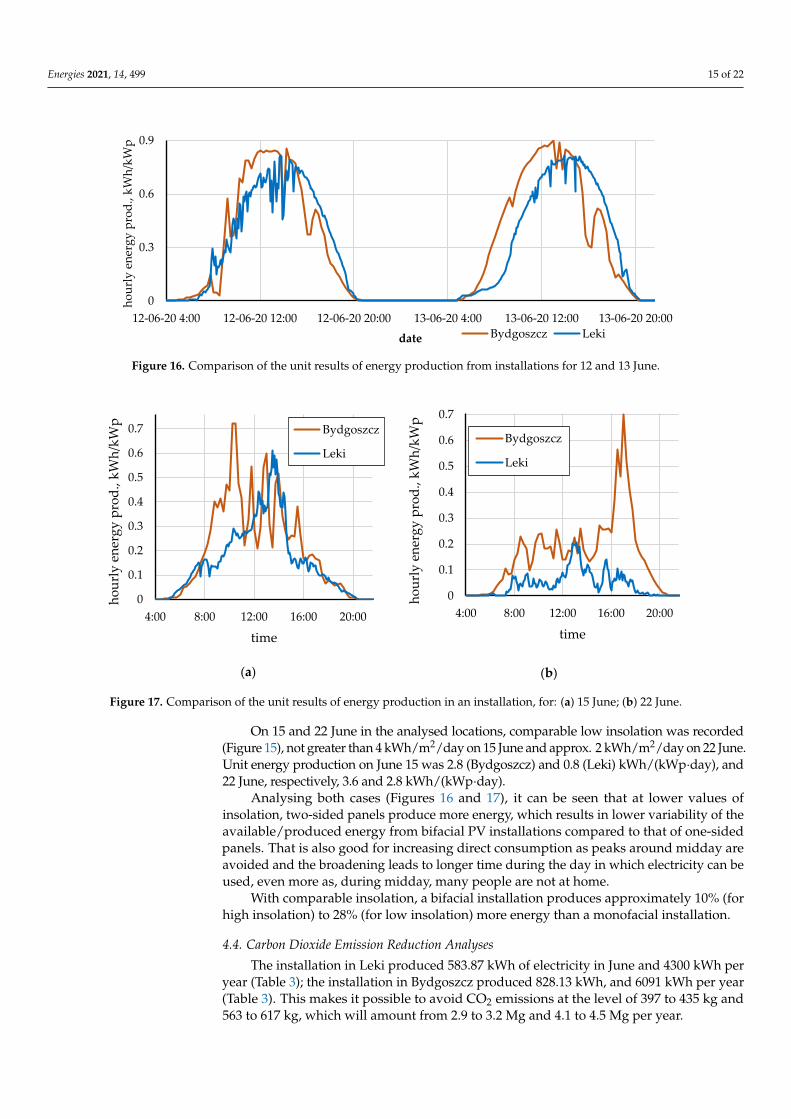
On 12 and 13 June, both locations recorded comparable high levels of insolation of7 kWh/m2/day (Figure 15). On selected days, the installation in Leki produced 6.08 and6.39 kWh/kWp, respectively, and in Bydgoszcz 6.20 and 7.03 kWh/kWp. In both cases,the two-sided installation generated more energy. In addition, on 13.06, the influence of adifferent direction of PV panel foundation was observed (SW30 for Leki, S45 for Bydgoszcz),the installation in Bydgoszcz reached the maximum hourly production of 0.87 kWh/kWpat around 1:00 p.m., while Leki 0.8 kWh/kWp in the period of 2:30 p.m. (Figure 17).
Energies 2021, 14, 499 15 of 22Energies 2021, 14, x FOR PEER REVIEW 15 of 22
Figure 16. Comparison of the unit results of energy production from installations for 12 and 13 June.
On 12 and 13 June, both locations recorded comparable high levels of insolation of 7
kWh/m2/day (Figure 15). On selected days, the installation in Leki produced 6.08 and 6.39
kWh/kWp, respectively, and in Bydgoszcz 6.20 and 7.03 kWh/kWp. In both cases, the two-
sided installation generated more energy. In addition, on 13.06, the influence of a different
direction of PV panel foundation was observed (SW30 for Leki, S45 for Bydgoszcz), the
installation in Bydgoszcz reached the maximum hourly production of 0.87 kWh/kWp at
around 1:00 p.m., while Leki 0.8 kWh/kWp in the period of 2:30 p.m. (Figure 17).
(a)
(b)
Figure 17. Comparison of the unit results of energy production in an installation, for: (a) 15th June; (b) 22th June.
On 15 and 22 June in the analysed locations, comparable low insolation was recorded
(Figure 15), not greater than 4 kWh/m2/day on June 15 and approx. 2 kWh/m2/day on June
22. Unit energy production on June 15 was 2.8 (Bydgoszcz) and 0.8 (Leki) kWh/(kWp·day),
and 22 June, respectively, 3.6 and 2.8 kWh/(kWp·day).
Analysing both cases (Figures 16 and 17), it can be seen that at lower values of inso-
lation, two-sided panels produce more energy, which results in lower variability of the
available/produced energy from bifacial PV installations compared to that of one-sided
panels. That is also good for increasing direct consumption as peaks around midday are
avoided and the broadening leads to longer time during the day in which electricity can
be used, even more as, during midday, many people are not at home.
0
0.3
0.6
0.9
12-06-20 4:00 12-06-20 12:00 12-06-20 20:00 13-06-20 4:00 13-06-20 12:00 13-06-20 20:00
ho
url
y e
ner
gy
pro
d.,
kW
h/k
Wp
date Bydgoszcz Leki
0
0.1
0.2
0.3
0.4
0.5
0.6
0.7
4:00 8:00 12:00 16:00 20:00
ho
url
y e
ner
gy
pro
d.,
kW
h/k
Wp
time
Bydgoszcz
Leki
0
0.1
0.2
0.3
0.4
0.5
0.6
0.7
4:00 8:00 12:00 16:00 20:00
ho
url
y e
ner
gy
pro
d.,
kW
h/k
Wp
time
Bydgoszcz
Leki
Figure 16. Comparison of the unit results of energy production from installations for 12 and 13 June.
Energies 2021, 14, x FOR PEER REVIEW 15 of 22
Figure 16. Comparison of the unit results of energy production from installations for 12 and 13 June.
On 12 and 13 June, both locations recorded comparable high levels of insolation of 7
kWh/m2/day (Figure 15). On selected days, the installation in Leki produced 6.08 and 6.39
kWh/kWp, respectively, and in Bydgoszcz 6.20 and 7.03 kWh/kWp. In both cases, the two-
sided installation generated more energy. In addition, on 13.06, the influence of a different
direction of PV panel foundation was observed (SW30 for Leki, S45 for Bydgoszcz), the
installation in Bydgoszcz reached the maximum hourly production of 0.87 kWh/kWp at
around 1:00 p.m., while Leki 0.8 kWh/kWp in the period of 2:30 p.m. (Figure 17).
(a)
(b)
Figure 17. Comparison of the unit results of energy production in an installation, for: (a) 15th June; (b) 22th June.
On 15 and 22 June in the analysed locations, comparable low insolation was recorded
(Figure 15), not greater than 4 kWh/m2/day on June 15 and approx. 2 kWh/m2/day on June
22. Unit energy production on June 15 was 2.8 (Bydgoszcz) and 0.8 (Leki) kWh/(kWp·day),
and 22 June, respectively, 3.6 and 2.8 kWh/(kWp·day).
Analysing both cases (Figures 16 and 17), it can be seen that at lower values of inso-
lation, two-sided panels produce more energy, which results in lower variability of the
available/produced energy from bifacial PV installations compared to that of one-sided
panels. That is also good for increasing direct consumption as peaks around midday are
avoided and the broadening leads to longer time during the day in which electricity can
be used, even more as, during midday, many people are not at home.
0
0.3
0.6
0.9
12-06-20 4:00 12-06-20 12:00 12-06-20 20:00 13-06-20 4:00 13-06-20 12:00 13-06-20 20:00
ho
url
y e
ner
gy
pro
d.,
kW
h/k
Wp
date Bydgoszcz Leki
0
0.1
0.2
0.3
0.4
0.5
0.6
0.7
4:00 8:00 12:00 16:00 20:00
ho
url
y e
ner
gy
pro
d.,
kW
h/k
Wp
time
Bydgoszcz
Leki
0
0.1
0.2
0.3
0.4
0.5
0.6
0.7
4:00 8:00 12:00 16:00 20:00
ho
url
y e
ner
gy
pro
d.,
kW
h/k
Wp
time
Bydgoszcz
Leki
Figure 17. Comparison of the unit results of energy production in an installation, for: (a) 15 June; (b) 22 June.
On 15 and 22 June in the analysed locations, comparable low insolation was recorded(Figure 15), not greater than 4 kWh/m2/day on 15 June and approx. 2 kWh/m2/day on 22 June.Unit energy production on June 15 was 2.8 (Bydgoszcz) and 0.8 (Leki) kWh/(kWp·day), and22 June, respectively, 3.6 and 2.8 kWh/(kWp·day).
Analysing both cases (Figures 16 and 17), it can be seen that at lower values ofinsolation, two-sided panels produce more energy, which results in lower variability of theavailable/produced energy from bifacial PV installations compared to that of one-sidedpanels. That is also good for increasing direct consumption as peaks around midday areavoided and the broadening leads to longer time during the day in which electricity can beused, even more as, during midday, many people are not at home.
With comparable insolation, a bifacial installation produces approximately 10% (forhigh insolation) to 28% (for low insolation) more energy than a monofacial installation.
4.4. Carbon Dioxide Emission Reduction Analyses
The installation in Leki produced 583.87 kWh of electricity in June and 4300 kWh peryear (Table 3); the installation in Bydgoszcz produced 828.13 kWh, and 6091 kWh per year(Table 3). This makes it possible to avoid CO2 emissions at the level of 397 to 435 kg and563 to 617 kg, which will amount from 2.9 to 3.2 Mg and 4.1 to 4.5 Mg per year.
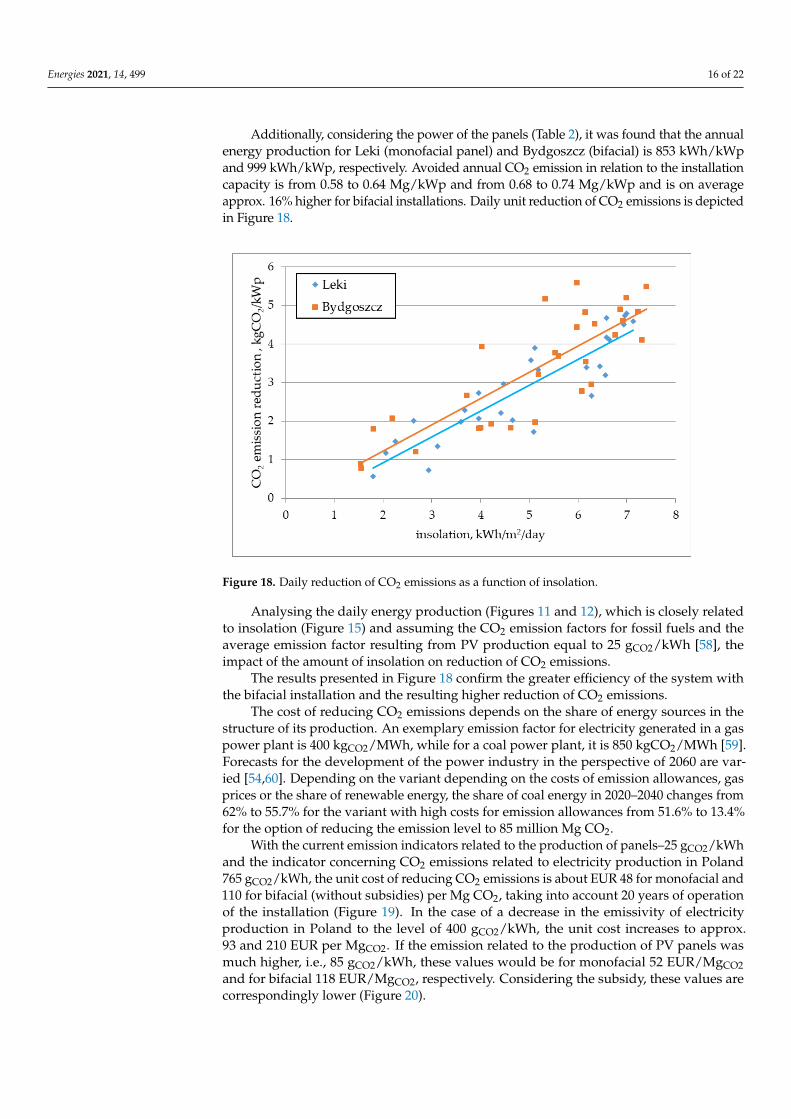
Energies 2021, 14, 499 16 of 22
Additionally, considering the power of the panels (Table 2), it was found that the annualenergy production for Leki (monofacial panel) and Bydgoszcz (bifacial) is 853 kWh/kWpand 999 kWh/kWp, respectively. Avoided annual CO2 emission in relation to the installationcapacity is from 0.58 to 0.64 Mg/kWp and from 0.68 to 0.74 Mg/kWp and is on averageapprox. 16% higher for bifacial installations. Daily unit reduction of CO2 emissions is depictedin Figure 18.
Energies 2021, 14, x FOR PEER REVIEW 16 of 22
With comparable insolation, a bifacial installation produces approximately 10% (for
high insolation) to 28% (for low insolation) more energy than a monofacial installation.
4.4. Carbon Dioxide Emission Reduction Analyses
The installation in Leki produced 583.87 kWh of electricity in June and 4300 kWh per
year (Table 3); the installation in Bydgoszcz produced 828.13 kWh, and 6091 kWh per year
(Table 3). This makes it possible to avoid CO2 emissions at the level of 397 to 435 kg and
563 to 617 kg, which will amount from 2.9 to 3.2 Mg and 4.1 to 4.5 Mg per year.
Additionally, considering the power of the panels (Table 2), it was found that the
annual energy production for Leki (monofacial panel) and Bydgoszcz (bifacial) is 853
kWh/kWp and 999 kWh/kWp, respectively. Avoided annual CO2 emission in relation to
the installation capacity is from 0.58 to 0.64 Mg/kWp and from 0.68 to 0.74 Mg/kWp and
is on average approx. 16% higher for bifacial installations. Daily unit reduction of CO2
emissions is depicted in Figure 18.
Figure 18. Daily reduction of CO2 emissions as a function of insolation.
Analysing the daily energy production (Figures 11 and 12), which is closely related
to insolation (Figure 15) and assuming the CO2 emission factors for fossil fuels and the
average emission factor resulting from PV production equal to 25 gCO2/kWh [58], the im-
pact of the amount of insolation on reduction of CO2 emissions.
The results presented in Figure 18 confirm the greater efficiency of the system with
the bifacial installation and the resulting higher reduction of CO2 emissions.
The cost of reducing CO2 emissions depends on the share of energy sources in the
structure of its production. An exemplary emission factor for electricity generated in a gas
power plant is 400 kgCO2/MWh, while for a coal power plant, it is 850 kgCO2/MWh [59].
Forecasts for the development of the power industry in the perspective of 2060 are varied
[54,60]. Depending on the variant depending on the costs of emission allowances, gas
prices or the share of renewable energy, the share of coal energy in 2020–2040 changes
from 62% to 55.7% for the variant with high costs for emission allowances from 51.6% to
13.4% for the option of reducing the emission level to 85 million Mg CO2.
With the current emission indicators related to the production of panels–25 gCO2/kWh
and the indicator concerning CO2 emissions related to electricity production in Poland 765
gCO2/kWh, the unit cost of reducing CO2 emissions is about EUR 48 for monofacial and 110
for bifacial (without subsidies) per Mg CO2, taking into account 20 years of operation of
the installation (Figure 19). In the case of a decrease in the emissivity of electricity produc-
tion in Poland to the level of 400 gCO2/kWh, the unit cost increases to approx. 93 and 210
EUR per MgCO2. If the emission related to the production of PV panels was much higher,
i.e., 85 gCO2/kWh, these values would be for monofacial 52 EUR/MgCO2 and for bifacial 118
EUR/MgCO2, respectively. Considering the subsidy, these values are correspondingly
lower (Figure 20).
Figure 18. Daily reduction of CO2 emissions as a function of insolation.
Analysing the daily energy production (Figures 11 and 12), which is closely relatedto insolation (Figure 15) and assuming the CO2 emission factors for fossil fuels and theaverage emission factor resulting from PV production equal to 25 gCO2/kWh [58], theimpact of the amount of insolation on reduction of CO2 emissions.
The results presented in Figure 18 confirm the greater efficiency of the system withthe bifacial installation and the resulting higher reduction of CO2 emissions.
The cost of reducing CO2 emissions depends on the share of energy sources in thestructure of its production. An exemplary emission factor for electricity generated in a gaspower plant is 400 kgCO2/MWh, while for a coal power plant, it is 850 kgCO2/MWh [59].Forecasts for the development of the power industry in the perspective of 2060 are var-ied [54,60]. Depending on the variant depending on the costs of emission allowances, gasprices or the share of renewable energy, the share of coal energy in 2020–2040 changes from62% to 55.7% for the variant with high costs for emission allowances from 51.6% to 13.4%for the option of reducing the emission level to 85 million Mg CO2.
With the current emission indicators related to the production of panels–25 gCO2/kWhand the indicator concerning CO2 emissions related to electricity production in Poland765 gCO2/kWh, the unit cost of reducing CO2 emissions is about EUR 48 for monofacial and110 for bifacial (without subsidies) per Mg CO2, taking into account 20 years of operationof the installation (Figure 19). In the case of a decrease in the emissivity of electricityproduction in Poland to the level of 400 gCO2/kWh, the unit cost increases to approx.93 and 210 EUR per MgCO2. If the emission related to the production of PV panels wasmuch higher, i.e., 85 gCO2/kWh, these values would be for monofacial 52 EUR/MgCO2and for bifacial 118 EUR/MgCO2, respectively. Considering the subsidy, these values arecorrespondingly lower (Figure 20).
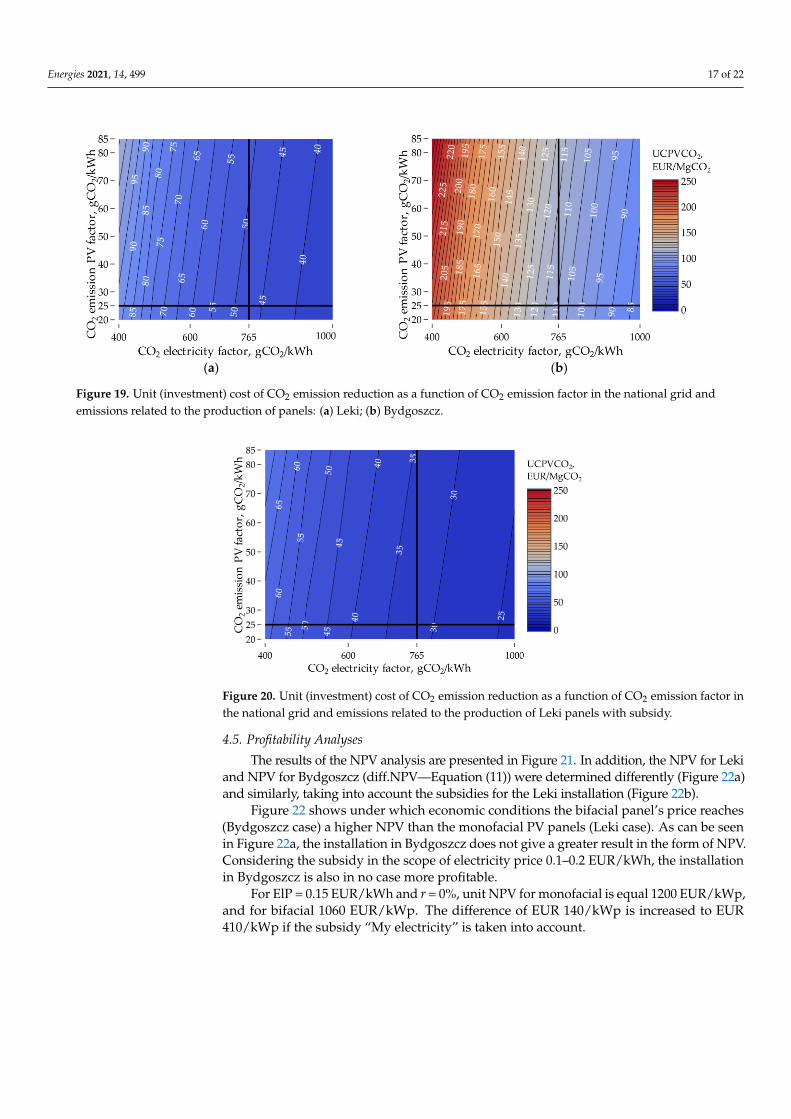
Energies 2021, 14, 499 17 of 22Energies 2021, 14, x FOR PEER REVIEW 17 of 22
(a)
(b)
Figure 19. Unit (investment) cost of CO2 emission reduction as a function of CO2 emission factor in the national grid and
emissions related to the production of panels: (a) Leki; (b) Bydgoszcz.
Figure 20. Unit (investment) cost of CO2 emission reduction as a function of CO2 emission factor in
the national grid and emissions related to the production of Leki panels with subsidy.
4.5. Profitability Analyses
The results of the NPV analysis are presented in Figure 21. In addition, the NPV for Leki
and NPV for Bydgoszcz (diff.NPV—Equation (11)) were determined differently (Figure 22a)
and similarly, taking into account the subsidies for the Leki installation (Figure 22b).
Figure 19. Unit (investment) cost of CO2 emission reduction as a function of CO2 emission factor in the national grid andemissions related to the production of panels: (a) Leki; (b) Bydgoszcz.
Energies 2021, 14, x FOR PEER REVIEW 17 of 22
(a)
(b)
Figure 19. Unit (investment) cost of CO2 emission reduction as a function of CO2 emission factor in the national grid and
emissions related to the production of panels: (a) Leki; (b) Bydgoszcz.
Figure 20. Unit (investment) cost of CO2 emission reduction as a function of CO2 emission factor in
the national grid and emissions related to the production of Leki panels with subsidy.
4.5. Profitability Analyses
The results of the NPV analysis are presented in Figure 21. In addition, the NPV for Leki
and NPV for Bydgoszcz (diff.NPV—Equation (11)) were determined differently (Figure 22a)
and similarly, taking into account the subsidies for the Leki installation (Figure 22b).
Figure 20. Unit (investment) cost of CO2 emission reduction as a function of CO2 emission factor inthe national grid and emissions related to the production of Leki panels with subsidy.
4.5. Profitability Analyses
The results of the NPV analysis are presented in Figure 21. In addition, the NPV for Lekiand NPV for Bydgoszcz (diff.NPV—Equation (11)) were determined differently (Figure 22a)and similarly, taking into account the subsidies for the Leki installation (Figure 22b).
Figure 22 shows under which economic conditions the bifacial panel’s price reaches(Bydgoszcz case) a higher NPV than the monofacial PV panels (Leki case). As can be seenin Figure 22a, the installation in Bydgoszcz does not give a greater result in the form of NPV.Considering the subsidy in the scope of electricity price 0.1–0.2 EUR/kWh, the installationin Bydgoszcz is also in no case more profitable.
For ElP = 0.15 EUR/kWh and r = 0%, unit NPV for monofacial is equal 1200 EUR/kWp,and for bifacial 1060 EUR/kWp. The difference of EUR 140/kWp is increased to EUR410/kWp if the subsidy “My electricity” is taken into account.
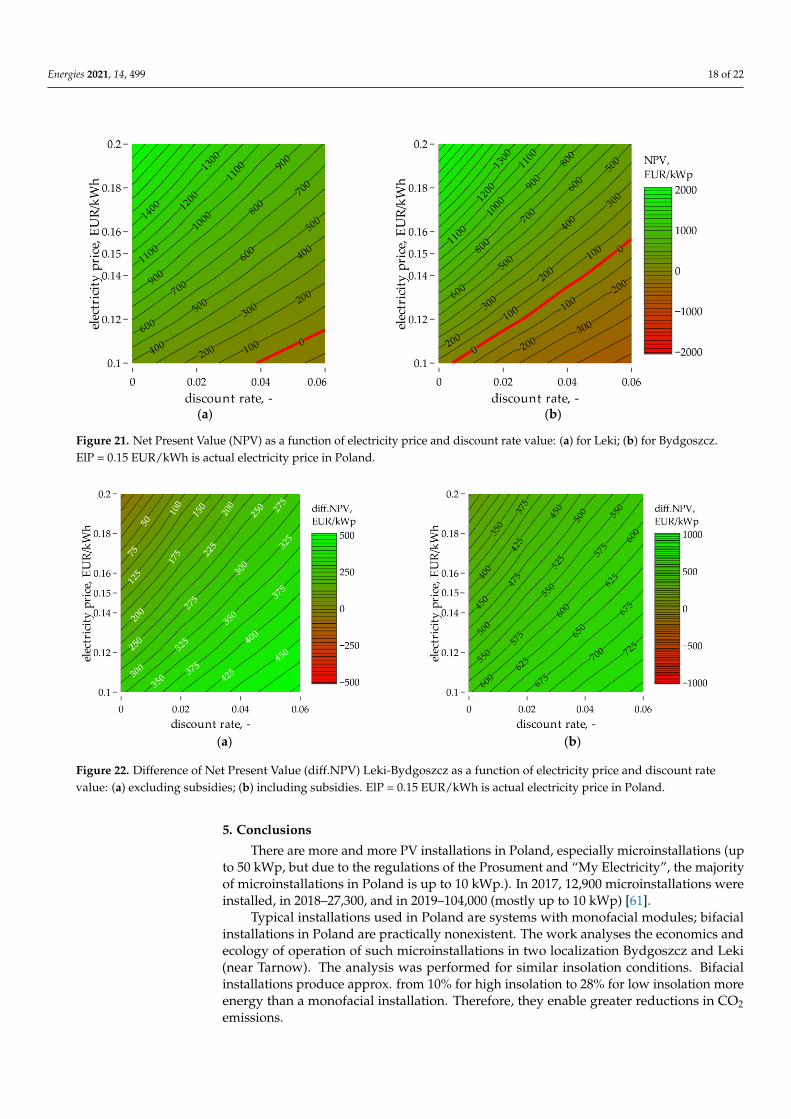
Energies 2021, 14, 499 18 of 22
Energies 2021, 14, x FOR PEER REVIEW 18 of 22
(a)
(b)
Figure 21. Net Present Value (NPV) as a function of electricity price and discount rate value: (a) for Leki; (b) for Bydgoszcz.
ElP = 0.15 EUR/kWh is actual electricity price in Poland.
(a)
(b)
Figure 22. Difference of Net Present Value (diff.NPV) Leki-Bydgoszcz as a function of electricity price and discount rate
value: (a) excluding subsidies; (b) including subsidies. ElP = 0.15 EUR/kWh is actual electricity price in Poland.
Figure 22 shows under which economic conditions the bifacial panel’s price reaches
(Bydgoszcz case) a higher NPV than the monofacial PV panels (Leki case). As can be seen
in Figure 22a, the installation in Bydgoszcz does not give a greater result in the form of
NPV. Considering the subsidy in the scope of electricity price 0.1–0.2 EUR/kWh, the in-
stallation in Bydgoszcz is also in no case more profitable.
For ElP = 0.15 EUR/kWh and r = 0%, unit NPV for monofacial is equal 1200 EUR/kWp,
and for bifacial 1060 EUR/kWp. The difference of EUR 140/kWp is increased to EUR
410/kWp if the subsidy “My electricity” is taken into account.
5. Conclusions
There are more and more PV installations in Poland, especially microinstallations (up
to 50 kWp, but due to the regulations of the Prosument and “My Electricity”, the majority
of microinstallations in Poland is up to 10 kWp.). In 2017, 12,900 microinstallations were
installed, in 2018–27,300, and in 2019–104,000 (mostly up to 10 kWp) [61].
Figure 21. Net Present Value (NPV) as a function of electricity price and discount rate value: (a) for Leki; (b) for Bydgoszcz.ElP = 0.15 EUR/kWh is actual electricity price in Poland.
Energies 2021, 14, x FOR PEER REVIEW 18 of 22
(a)
(b)
Figure 21. Net Present Value (NPV) as a function of electricity price and discount rate value: (a) for Leki; (b) for Bydgoszcz.
ElP = 0.15 EUR/kWh is actual electricity price in Poland.
(a)
(b)
Figure 22. Difference of Net Present Value (diff.NPV) Leki-Bydgoszcz as a function of electricity price and discount rate
value: (a) excluding subsidies; (b) including subsidies. ElP = 0.15 EUR/kWh is actual electricity price in Poland.
Figure 22 shows under which economic conditions the bifacial panel’s price reaches
(Bydgoszcz case) a higher NPV than the monofacial PV panels (Leki case). As can be seen
in Figure 22a, the installation in Bydgoszcz does not give a greater result in the form of
NPV. Considering the subsidy in the scope of electricity price 0.1–0.2 EUR/kWh, the in-
stallation in Bydgoszcz is also in no case more profitable.
For ElP = 0.15 EUR/kWh and r = 0%, unit NPV for monofacial is equal 1200 EUR/kWp,
and for bifacial 1060 EUR/kWp. The difference of EUR 140/kWp is increased to EUR
410/kWp if the subsidy “My electricity” is taken into account.
5. Conclusions
There are more and more PV installations in Poland, especially microinstallations (up
to 50 kWp, but due to the regulations of the Prosument and “My Electricity”, the majority
of microinstallations in Poland is up to 10 kWp.). In 2017, 12,900 microinstallations were
installed, in 2018–27,300, and in 2019–104,000 (mostly up to 10 kWp) [61].
Figure 22. Difference of Net Present Value (diff.NPV) Leki-Bydgoszcz as a function of electricity price and discount ratevalue: (a) excluding subsidies; (b) including subsidies. ElP = 0.15 EUR/kWh is actual electricity price in Poland.
5. Conclusions
There are more and more PV installations in Poland, especially microinstallations (upto 50 kWp, but due to the regulations of the Prosument and “My Electricity”, the majorityof microinstallations in Poland is up to 10 kWp.). In 2017, 12,900 microinstallations wereinstalled, in 2018–27,300, and in 2019–104,000 (mostly up to 10 kWp) [61].
Typical installations used in Poland are systems with monofacial modules; bifacialinstallations in Poland are practically nonexistent. The work analyses the economics andecology of operation of such microinstallations in two localization Bydgoszcz and Leki(near Tarnow). The analysis was performed for similar insolation conditions. Bifacialinstallations produce approx. from 10% for high insolation to 28% for low insolation moreenergy than a monofacial installation. Therefore, they enable greater reductions in CO2emissions.
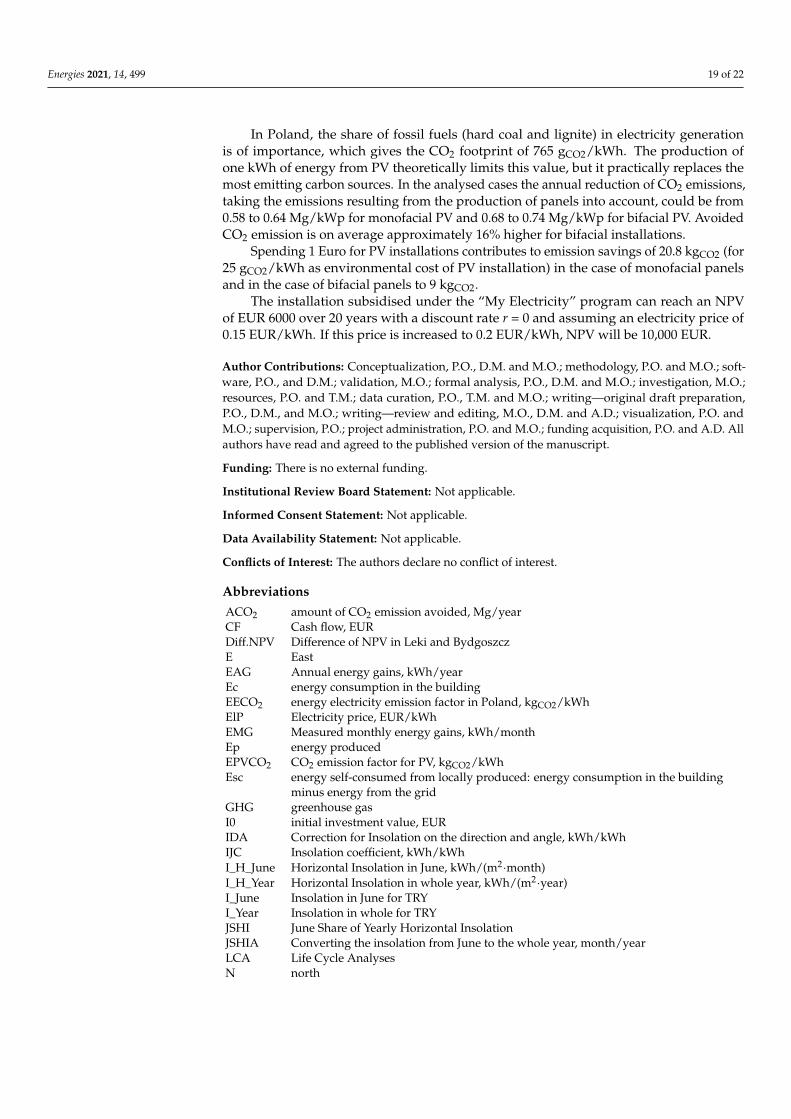
Energies 2021, 14, 499 19 of 22
In Poland, the share of fossil fuels (hard coal and lignite) in electricity generationis of importance, which gives the CO2 footprint of 765 gCO2/kWh. The production ofone kWh of energy from PV theoretically limits this value, but it practically replaces themost emitting carbon sources. In the analysed cases the annual reduction of CO2 emissions,taking the emissions resulting from the production of panels into account, could be from0.58 to 0.64 Mg/kWp for monofacial PV and 0.68 to 0.74 Mg/kWp for bifacial PV. AvoidedCO2 emission is on average approximately 16% higher for bifacial installations.
Spending 1 Euro for PV installations contributes to emission savings of 20.8 kgCO2 (for25 gCO2/kWh as environmental cost of PV installation) in the case of monofacial panelsand in the case of bifacial panels to 9 kgCO2.
The installation subsidised under the “My Electricity” program can reach an NPVof EUR 6000 over 20 years with a discount rate r = 0 and assuming an electricity price of0.15 EUR/kWh. If this price is increased to 0.2 EUR/kWh, NPV will be 10,000 EUR.
Author Contributions: Conceptualization, P.O., D.M. and M.O.; methodology, P.O. and M.O.; soft-ware, P.O., and D.M.; validation, M.O.; formal analysis, P.O., D.M. and M.O.; investigation, M.O.;resources, P.O. and T.M.; data curation, P.O., T.M. and M.O.; writing—original draft preparation,P.O., D.M., and M.O.; writing—review and editing, M.O., D.M. and A.D.; visualization, P.O. andM.O.; supervision, P.O.; project administration, P.O. and M.O.; funding acquisition, P.O. and A.D. Allauthors have read and agreed to the published version of the manuscript.
Funding: There is no external funding.
Institutional Review Board Statement: Not applicable.
Informed Consent Statement: Not applicable.
Data Availability Statement: Not applicable.
Conflicts of Interest: The authors declare no conflict of interest.
AbbreviationsACO2 amount of CO2 emission avoided, Mg/yearCF Cash flow, EURDiff.NPV Difference of NPV in Leki and BydgoszczE EastEAG Annual energy gains, kWh/yearEc energy consumption in the buildingEECO2 energy electricity emission factor in Poland, kgCO2/kWhElP Electricity price, EUR/kWhEMG Measured monthly energy gains, kWh/monthEp energy producedEPVCO2 CO2 emission factor for PV, kgCO2/kWhEsc energy self-consumed from locally produced: energy consumption in the building
minus energy from the gridGHG greenhouse gasI0 initial investment value, EURIDA Correction for Insolation on the direction and angle, kWh/kWhIJC Insolation coefficient, kWh/kWhI_H_June Horizontal Insolation in June, kWh/(m2·month)I_H_Year Horizontal Insolation in whole year, kWh/(m2·year)I_June Insolation in June for TRYI_Year Insolation in whole for TRYJSHI June Share of Yearly Horizontal InsolationJSHIA Converting the insolation from June to the whole year, month/yearLCA Life Cycle AnalysesN north
Energies 2021, 14, 499 20 of 22
n lifetime of PV, yearNPV Net Present Value, EURPI Total PV panel power, kWpPV photovoltaicr discount ratet yearS SouthSATS single axis tracking systemsSC self-consumptionSS self-sufficiencyTRY_H Typical Reference Year–Horizontal SurfaceTRY_S45 Typical Reference Year–south directed surface titled 45◦
TRY_SW30 Typical Reference Year–south-west directed surface titled 30◦
UCPVCO2 Unit (investment) cost of CO2 emission reduction, EUR/kgCO2W Westτ time
References1. Pestana, D.G.; Rodrigues, S.; Morgado-Dias, F. Environmental and economic analysis of solar systems in Madeira, Portugal. Util.
Policy 2018, 55, 31–40. [CrossRef]2. Peng, J.; Lu, L.; Yang, H. Review on life cycle assessment of energy payback and greenhouse gas emission of solar photovoltaic
systems. Renew. Sustain. Energy Rev. 2013, 19, 255–274. [CrossRef]3. National Centre for Emissions Management. CO2, SO2, NOx, CO and Total Dust EMISSION RATIOS FOR ELECTRICITY Based
on the Information Contained in the National Database of Greenhouse Gas Emissions and other Substances for 2018. Availableonline: https://www.kobize.pl/uploads/materialy/materialy_do_pobrania/wskazniki_emisyjnosci/Wskazniki_emisyjnosci_grudzien_2019.pdf (accessed on 7 April 2020).
4. Sampaio, P.G.V.; González, M.O.A. Photovoltaic solar energy: Conceptual framework. Renew. Sustain. Energy Rev. 2017, 74,590–601. [CrossRef]
5. European Commission. A Clean Planet for All. A European Long-Term Strategic Vision for a Prosperous, Modern, Competitive andClimate Neutral Economy; EUR-Lex: Brussels, Belgium, 2018.
6. Jaeger-Waldau, A. PV Status Report 2019; Publications Office of the European Union: Brussels, Belgium, 2019.7. Jäger-Waldau, A.; Kougias, I.; Taylor, N.; Thiel, C. How photovoltaics can contribute to GHG emission reductions of 55% in the
EU by 2030. Renew. Sustain. Energy Rev. 2020, 126, 109836. [CrossRef]8. Micheli, D.; Alessandrini, S.; Radu, R.; Casula, I. Analysis of the outdoor performance and efficiency of two grid connected
photovoltaic systems in northern Italy. Energy Convers. Manag. 2014, 80, 436–445. [CrossRef]9. Phinikarides, A.; Makrides, G.; Zinsser, B.; Schubert, M.; Georghiou, G.E. Analysis of photovoltaic system performance time
series: Seasonality and performance loss. Renew. Energy 2015, 77, 51–63. [CrossRef]10. Zdyb, A.; Gulkowski, S. Performance assessment of four different photovoltaic technologies in Poland. Energies 2020, 13, 196.
[CrossRef]11. Global solar Atlas GHI—Global Horizontal Irradiation. Available online: http://solargis.info/doc/_pics/freemaps/1000px/ghi/
SolarGIS-Solar-map-Europe-en.png (accessed on 12 November 2020).12. Olczak, P.; Matuszewska, D.; Zabagło, J. The Comparison of Solar Energy Gaining Effectiveness between Flat Plate Collectors and
Evacuated Tube Collectors with Heat Pipe: Case Study. Energies 2020, 13, 1829. [CrossRef]13. Chwieduk, D.; Chwieduk, M. Determination of the Energy Performance of a Solar Low Energy House with Regard to Aspects of
Energy Efficiency and Smartness of the House. Energies 2020, 13, 3232. [CrossRef]14. Olczak, P.; Kryzia, D.; Matuszewska, D.; Kuta, M. “My Electricity” Program Effectiveness Supporting the Development of PV
Installation in Poland. Energies 2021, 14, 231. [CrossRef]15. Rynek-Elektryczny W Czerwcu moc Zainstalowana Fotowoltaiki Przekroczyła 2 GW. Available online: https://www.
rynekelektryczny.pl/moc-zainstalowana-fotowoltaiki-w-polsce/ (accessed on 15 July 2020).16. Olczak, P.; Matuszewska, D.; Kryzia, D. ”Mój Prad” as an example of the photovoltaic one off grant program in Poland. Energy
Policy J. 2020, 23, 123–138. [CrossRef]17. Szczerbowski, R.; Kornobis, D. The proposal of an energy mix in the context of changes in Poland’s energy policy. Polityka
Energetyczna 2019, 22, 5–18. [CrossRef]18. Ministry of Development Typical Reference Year. Available online: https://www.gov.pl/web/fundusze-regiony/dane-do-
obliczen-energetycznych-budynkow (accessed on 18 December 2019).19. NFOSiGW Mój Prad. Available online: https://mojprad.gov.pl/wyniki-1-naboru-2019/ (accessed on 7 April 2020).20. Almeshaiei, E.; Al-Habaibeh, A.; Shakmak, B. Rapid evaluation of micro-scale photovoltaic solar energy systems using empirical
methods combined with deep learning neural networks to support systems’ manufacturers. J. Clean. Prod. 2020, 244, 118788.[CrossRef]
Energies 2021, 14, 499 21 of 22
21. Bukowski, M.; Majewski, J.; Sobolewska, A. Macroeconomic Electric Energy Production Efficiency of Photovoltaic Panels inSingle-Family Homes in Poland. Energies 2021, 14, 126. [CrossRef]
22. Guta, D.D. Determinants of household adoption of solar energy technology in rural Ethiopia. J. Clean. Prod. 2018, 204, 193–204.[CrossRef]
23. Komorowska, A.; Kaminski, J. A review of the 2018 Polish capacity market auctions. Energy Policy J. 2019, 22, 75–88. [CrossRef]24. Paska, J.; Surma, T.; Terlikowski, P.; Zagrajek, K. Electricity generation from renewable energy sources in Poland as a part of
commitment to the polish and EU energy policy. Energies 2020, 13, 4261. [CrossRef]25. Elshurafa, A.M.; Albardi, S.R.; Bigerna, S.; Bollino, C.A. Estimating the learning curve of solar PV balance–of–system for over
20 countries: Implications and policy recommendations. J. Clean. Prod. 2018, 196, 122–134. [CrossRef]26. IEO. PV MARKET IN POLAND 2020; IEO: Warsaw, Poland, 2020.27. Szczerbowski, R. Energy security of Poland—Energy mix and energy efficiency. Polityka Energetyczna 2013, 16, 35–47.28. Matuszewska, D.; Kuta, M.; Olczak, P. Techno-Economic Assessment of Mobilized Thermal Energy Storage System Using
Geothermal Source in Polish Conditions. Energies 2020, 13, 3404. [CrossRef]29. Zelazna, A.; Gołebiowska, J.; Zdyb, A.; Pawłowski, A. A hybrid vs. on-grid photovoltaic system: Multicriteria analysis of
environmental, economic, and technical aspects in life cycle perspective. Energies 2020, 13, 3978. [CrossRef]30. Mirowski, T.; Sornek, K. Potential of prosumer power engineering in Poland by example of micro PV installation in private
construction. Energy Policy J. 2015, 18, 73–84.31. Pepłowska, M.; Olczak, P. The tilt angle selecting problem of PV panels taking the energy demand profile into account. Bull.
Miner. Energy Econ. Res. Inst. Pol. Acad. Sci. 2018, 102, 91–100.32. Poland, O. Data of Electricity Distribution System Operators; Data direct from DSO; Unpublished work; 2020.33. NASA Solar Radiation. Available online: https://power.larc.nasa.gov/data-access-viewer/ (accessed on 20 July 2020).34. Ren, F.R.; Tian, Z.; Liu, J.; Shen, Y.T. Analysis of CO2 emission reduction contribution and efficiency of China’s solar photovoltaic
industry: Based on Input-output perspective. Energy 2020, 199, 117493. [CrossRef]35. Louwen, A.; Van Sark, W.G.; Faaij, A.P.C.; Schropp, R.E.I. Re-assessment of net energy production and greenhouse gas emissions
avoidance after 40 years of photovoltaics development. Nat. Commun. 2016, 7, 13728. [CrossRef] [PubMed]36. Mohammadi, K.; Naderi, M.; Saghafifar, M. Economic feasibility of developing grid-connected photovoltaic plants in the southern
coast of Iran. Energy 2018, 156, 17–31. [CrossRef]37. Antonanzas, J.; Arbeloa-Ibero, M.; Quinn, J.C. Comparative life cycle assessment of fixed and single axis tracking systems for
photovoltaics. J. Clean. Prod. 2019, 240, 118016. [CrossRef]38. Frischknecht, R.; Itten, R.; Sinha, P.; de Wild-Scholten, M.; Zhang, J.; Fthenakis, V.; Kim, H.C.; Raugei, M.; Stucki, M. Life Cycle
Inventories and Life Cycle Assessments of Photovoltaic Systems. PVPS Task 12, Report T12-04:2015; IEA: Paris, France, 2015.39. Nugent, D.; Sovacool, B.K. Assessing the lifecycle greenhouse gas emissions from solar PV and wind energy: A critical meta-
survey. Energy Policy 2014, 65, 229–244. [CrossRef]40. Prăvălie, R.; Bandoc, G. Nuclear energy: Between global electricity demand, worldwide decarbonisation imperativeness, and
planetary environmental implications. J. Environ. Manag. 2018, 209, 81–92. [CrossRef]41. Park, H.; Chang, S.; Park, S.; Kim, W.K. Outdoor performance test of bifacial n-type silicon photovoltaic modules. Sustainability
2019, 11, 6234. [CrossRef]42. Mirowski, T.; Pepłowska, M. Simulation Analysis of Electricity Consumption for the Final Consumer with the Use of Smart
Metering. Energy Policy J. 2016, 2, 81–91.43. Kryzia, D.; Kuta, M.; Matuszewska, D.; Olczak, P. Analysis of the potential for gas micro-cogeneration development in Poland
using the Monte Carlo method. Energies 2020, 13, 3140. [CrossRef]44. Rodríguez-Gallegos, C.D.; Bieri, M.; Gandhi, O.; Singh, J.P.; Reindl, T.; Panda, S.K. Monofacial vs bifacial Si-based PV modules:
Which one is more cost-effective? Sol. Energy 2018, 176, 412–438. [CrossRef]45. Reich, N.H.; Alsema, E.A.; Van Sark, W.G.; Turkenburg, W.C.; Sinke, W.C. Greenhouse gas emissions associated with photovoltaic
electricity from crystalline silicon modules under various energy supply options. Prog. Photovolt. Res. Appl. 2011, 19, 603–613.[CrossRef]
46. Gazbour, N.; Razongles, G.; Schaeffer, C.; Charbuillet, C. Photovoltaic power goes green. In Proceedings of the 2016 ElectronicsGoes Green 2016+, EGG 2016, Berlin, Germany, 6–9 September 2016.
47. Olczak, P.; Pepłowska, M. Problematyka doboru wielkosci przydomowych instalacji fotowoltaicznych. In Energetyka Solarna;Foundation for Clean Energy: Poznan, Poland, 2018; pp. 80–90.
48. Hanplast-Energy SW PREMIUM BIFACIAL (HJT). Available online: http://hanplast.energy/uploads/files/GWARANCJEHP/KARTATECHNICZNA-HanplastSWPremiumBifacialHJTEN3053103155-6mmv01.10.2019.pdf (accessed on 18 July 2020).
49. Longi LR4-60HPH 360M. Available online: https://en.longi-solar.com/uploads/attach/20200423/5ea0f91d33235.pdf (accessedon 2 June 2020).
50. Canales, F.A.; Jadwiszczak, P.; Jurasz, J.; Wdowikowski, M.; Ciapała, B.; Kazmierczak, B. The impact of long-term changes in airtemperature on renewable energy in Poland. Sci. Total Environ. 2020, 729, 138965. [CrossRef]
51. Olek, M.; Olczak, P.; Kryzia, D. The sizes of Flat Plate and Evacuated Tube Collectors with Heat Pipe area as a function of theshare of solar system in the heat demand. E3S Web Conf. 2016, 10, 00139. [CrossRef]
Energies 2021, 14, 499 22 of 22
52. Olczak, P.; Kryzia, D.; Pepłowska, M.; Olek, M. Influence of Inclination Angle and its Adjustment Time on Insolation of Collectoror Photovoltaic Panel. Dist. Heat. Vent. 2018, 49, 506–509.
53. Olczak, P.; Kryzia, D.; Augustyn, A.; Olek, M. The economic profitability of the changing size of solar collectors surface in thecase study of the household domestic hot water installation. Bull. Miner. Energy Econ. Res. Inst. Pol. Acad. Sci. 2018, 102, 77–90.
54. Olczak, P.; Olek, M.; Kryzia, D. The ecological impact of using photothermal and photovoltaic installations for DHW preparation.Polityka Energetyczna 2020, 23, 65–74. [CrossRef]
55. Kryzia, D.; Kopacz, M.; Kryzia, K. The Valuation of the Operational Flexibility of the Energy Investment Project Based on aGas-Fired Power Plant. Energies 2020, 13, 1567. [CrossRef]
56. CSO. Energy Consumption in Households in 2018; Central Statistical Office: Warsaw, Poland, 2019.57. Copernicus Climate Change Service (C3S). ERA5: Fifth Generation of ECMWF Atmospheric Reanalyses of the Global Climate.
Copernicus Climate Change Service Climate Data Store (CDS). 2017. Available online: https://cds.climate.copernicus.eu/cdsapp#!/home (accessed on 4 November 2020).
58. Kommalapati, R.; Kadiyala, A.; Shahriar, M.T.; Huque, Z. Review of the life cycle greenhouse gas emissions from differentphotovoltaic and concentrating solar power electricity generation systems. Energies 2017, 10, 350. [CrossRef]
59. PARP. Conversion Guidelines—Greenhouse Gas Emissions. Available online: https://www.parp.gov.pl/storage/grants/documents/105/Wytyczne-dotyczce-konwersji---emisje-gazw-cieplarnianych_20200225.pdf (accessed on 28 July 2020).
60. Kprm Model of the Optimum Energy Mix for Poland until 2060. Available online: https://www.premier.gov.pl/files/files/energymix_das_dost.pdf (accessed on 28 July 2020).
61. Globenergia over 104,000 PV Micro-Installations in 2019! Available online: https://globenergia.pl/ponad-104-tysiace-mikroinstalacji-pv-w-2019-roku-gigantyczny-wzrost-w-fotowoltaice/ (accessed on 24 July 2020).
Related Documents