Sharif University of Technology Microprocessor Arduino UNO Project Monitoring Temperature using LM35 and Arduino UNO Authors: • Sadegh Saberian 92106226 • Armin Vakil 92110419 • Ainaz Hajimoradlou 92106142 • Sara Mahdizade 92106261 Supervisor: Dr. Mehdi Modarressi July 11, 2016

Welcome message from author
This document is posted to help you gain knowledge. Please leave a comment to let me know what you think about it! Share it to your friends and learn new things together.
Transcript

Sharif University of Technology
Microprocessor
Arduino UNO Project
Monitoring Temperature using LM35and Arduino UNO
Authors:
• Sadegh Saberian 92106226
• Armin Vakil 92110419
• Ainaz Hajimoradlou 92106142
• Sara Mahdizade 92106261
Supervisor:Dr. Mehdi Modarressi
July 11, 2016

1 Abstract
In order to monitor temperature, we need three components: a temperature sensor, a micro-controller board and an interface for interactive communication. The temperature sensor willprovide us with an analog voltage signal, which contains the temperature data. But this signalneeds to be converted to a digital value, so that it can be understood by the board and micropro-cessor. Thus there should be an analog to digital conversion. Afterward the digital signal can beused to determine the temperature and be shown and monitored on the interface.
Figure 1: circuit
This procedure can be divided in three parts: circuit building, programming the board, program-ming the interactive graphical user interface (GUI). We will explore each part extensively.
1

2 Circuit Building
We can connect the board, LCD and the temperature sensor using the design below. Here we haveused LM35 sensor for measuring the temperature. This sensor is calibrated directly in Celsius, haslinear +10.0mV
Cscale factor. This sensor is rated for full 55 to +150C range. In this design the
output signal of LM35 is connected to pin A0 of Arduino for analog to digital conversion. Theboard is also connected to a LCD, which is used for showing the time and temperature. The LCD’sdata pins are connected to D4-D7 of the board.
Figure 2: circuit
2

There is a small modification in the implemented circuit than this design which is lack ofpotentiometer. As we know, the third pin of LCD is for adjusting the contrast. Here, by usingthe potentiometer, we can adjust the contrast. However we have provided two ways for setting theLCD contrast without using potentiometer.
• Constant ContrastIn this way we have supplied the VO pin with constant approximately 1V , which is obtainedusing resistor chain. The main drawback of this scheme is that the LCD contrast is no longeradjustable. The resistor chain can be seen in the picture below.
Figure 3: circuit
• Arduino PWMPulse Width Modulation, or PWM, is a technique for getting analog results with digitalmeans. Digital control is used to create a square wave, a signal switched between on and off.This on-off pattern can simulate voltages in between full on (5 Volts) and off (0 Volts) bychanging the portion of the time the signal spends on versus the time that the signal spendsoff. The duration of ”on time” is called the pulse width. To get varying analog values, wechange, or modulate, that pulse width. If we repeat this on-off pattern fast enough, then wewill almost get the desired voltage.
3

Figure 4: PWM
Using this PWM technique we can make the LCD contrast adjustable. We set digital pin 9on board to be OUTPUT and then set the desired voltage, which represent the contrast, tothat pin. But this voltage is carried in high frequencies, which can be seen in the LCD’s pixelsblinking. In order to solve this problem, we can use a Low Pass Filter (LPF) to eliminatethe unwanted frequencies. We build this filter using capacitors and resistors. We have usedR = 470Ω and C = 30µF . Thus the cutoff frequency will be:
fC =1
2πRC≈ 11.29Hz
Figure 5: LCD Contrast
Now we send the PWM-generated signal to this LPF, and connect the output to the VO ofLCD. Now there will be no pixel blinking problem and user can now simply selects the desiredcontrast from GUI.
4

Figure 6: LCD Contrast
Below is a picture of the built circuit.
Figure 7: circuit
5
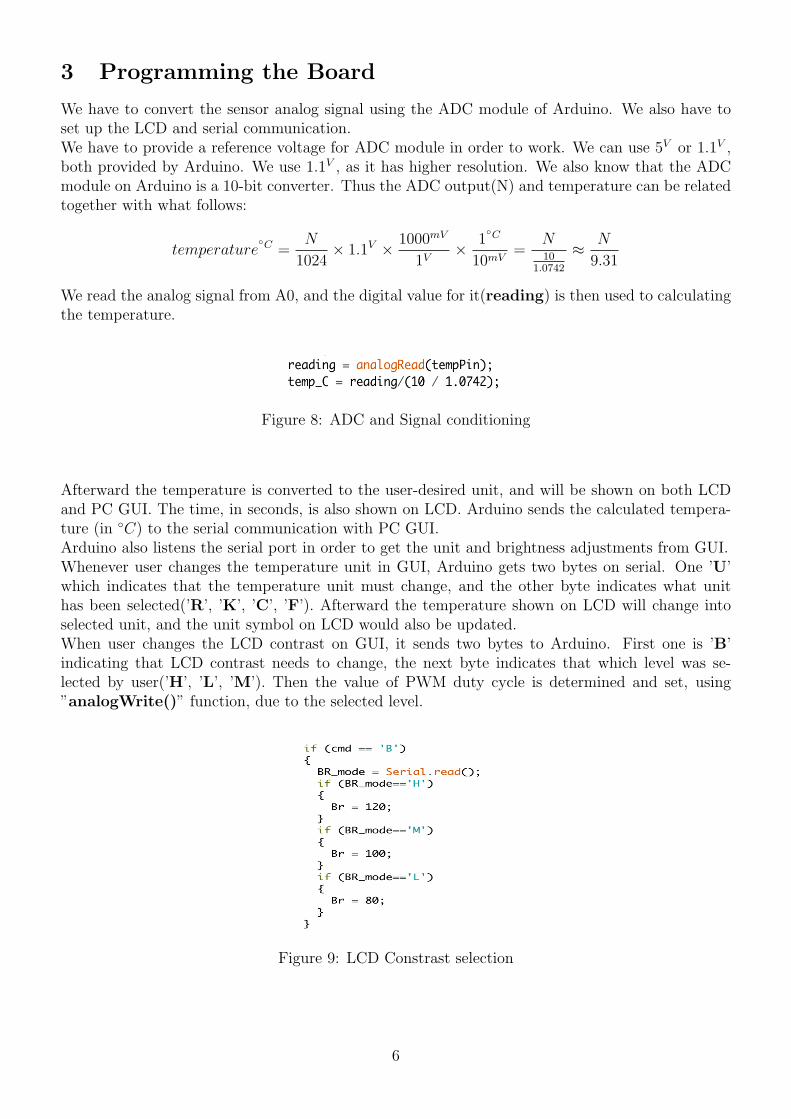
3 Programming the Board
We have to convert the sensor analog signal using the ADC module of Arduino. We also have toset up the LCD and serial communication.We have to provide a reference voltage for ADC module in order to work. We can use 5V or 1.1V ,both provided by Arduino. We use 1.1V , as it has higher resolution. We also know that the ADCmodule on Arduino is a 10-bit converter. Thus the ADC output(N) and temperature can be relatedtogether with what follows:
temperatureC =
N
1024× 1.1V × 1000mV
1V× 1
C
10mV=
N10
1.0742
≈ N
9.31
We read the analog signal from A0, and the digital value for it(reading) is then used to calculatingthe temperature.
Figure 8: ADC and Signal conditioning
Afterward the temperature is converted to the user-desired unit, and will be shown on both LCDand PC GUI. The time, in seconds, is also shown on LCD. Arduino sends the calculated tempera-ture (in C) to the serial communication with PC GUI.Arduino also listens the serial port in order to get the unit and brightness adjustments from GUI.Whenever user changes the temperature unit in GUI, Arduino gets two bytes on serial. One ’U’which indicates that the temperature unit must change, and the other byte indicates what unithas been selected(’R’, ’K’, ’C’, ’F’). Afterward the temperature shown on LCD will change intoselected unit, and the unit symbol on LCD would also be updated.When user changes the LCD contrast on GUI, it sends two bytes to Arduino. First one is ’B’indicating that LCD contrast needs to change, the next byte indicates that which level was se-lected by user(’H’, ’L’, ’M’). Then the value of PWM duty cycle is determined and set, using”analogWrite()” function, due to the selected level.
Figure 9: LCD Constrast selection
6

4 Programming the GUI
We need a graphical user interface (GUI), so that user can easily interact with the system. In orderto implement such GUI, we have used ”Python”. The designed GUI can be seen below.
Figure 10: GUI
As we can see, the are radio buttons for selecting temperature unit. There is also radio buttonsfor selecting the LCD contrast. The user can adjust them by just click on the desired unit orcontrast level. User can set the sensor check time, which determines the amount of time betweentwo temperature updates. The measured temperature and time are shown on GUI.There is also a plot of temperature versus time, which is updated every time the new measuredtemperature is ready. The update ratio for this plot is related to the sensor check time. The valueof check time is the amount of time between two plot updates.
7
Related Documents


![Cooling System Temperature Control Using PIC …...PIC Microcontroller [1] 2) Temperature Sensor (LM35) An analog temperature sensor is pretty easy to explain, its a chip that tells](https://static.cupdf.com/doc/110x72/5e95368bb7469f11cb2a1941/cooling-system-temperature-control-using-pic-pic-microcontroller-1-2-temperature.jpg)