Citation: Feng, Y.; Wang, S.; Zhao, M.; Zhou, L. Monitoring of Land Desertification Changes in Urat Front Banner from 2010 to 2020 Based on Remote Sensing Data. Water 2022, 14, 1777. https://doi.org/10.3390/ w14111777 Academic Editor: Maria Mimikou Received: 4 May 2022 Accepted: 25 May 2022 Published: 1 June 2022 Publisher’s Note: MDPI stays neutral with regard to jurisdictional claims in published maps and institutional affil- iations. Copyright: © 2022 by the authors. Licensee MDPI, Basel, Switzerland. This article is an open access article distributed under the terms and conditions of the Creative Commons Attribution (CC BY) license (https:// creativecommons.org/licenses/by/ 4.0/). water Article Monitoring of Land Desertification Changes in Urat Front Banner from 2010 to 2020 Based on Remote Sensing Data Yuanyuan Feng 1,2,3 , Shihang Wang 1,2,3, *, Mingsong Zhao 1,2,3 and Lingmei Zhou 1,2,3 1 School of Geomatics, Anhui University of Science and Technology, Huainan 232001, China; [email protected] (Y.F.); [email protected] (M.Z.); [email protected] (L.Z.) 2 Key Laboratory of Aviation-Aerospace-Ground Cooperative Monitoring and Early Warning of Coal Mining-Induced Disasters of Anhui Higher Education Institutes, Anhui University of Science and Technology, Huainan 232001, China 3 Coal Industry Engineering Research Center of Mining Area Environmental and Disaster Cooperative Monitoring, Anhui University of Science and Technology, Huainan 232001, China * Correspondence: [email protected] Abstract: Monitoring the spatio-temporal dynamics of desertification is critical for desertification control. Using the Urat front flag as the study area, Landsat remote sensing images between 2010 and 2020 were selected as data sources, along with MOD17A3H as auxiliary data. Additionally, RS and GIS theories and methods were used to establish an Albedo–NDVI feature space based on the normalized difference vegetation index (NDVI) and land surface albedo. The desertification difference index (DDI) was developed to investigate the dynamic change and factors contributing to desertification in the Urat front banner. The results show that: 1 the Albedo–NDVI feature space method is effective and precise at extracting and classifying desertification information, which is beneficial for quantitative analysis and monitoring of desertification; 2 from 2010 to 2020, the spatial distribution of desertification degree in the Urat front banner gradually decreased from south to north; 3 throughout the study period, the area of moderate desertification land increased the most, at an annual rate of 8.2%, while the area of extremely serious desertification land decreased significantly, at an annual rate of 9.2%, indicating that desertification degree improved during the study period; 4 the transformation of desertification types in Urat former banner is mainly from very severe to moderate, from severe to undeserted, and from mild to undeserted, with respective areas of 22.5045 km 2 , 44.0478 km 2 , and 319.2160 km 2 . Over a 10-year period, the desertification restoration areas in the study area ranged from extremely serious desertification to moderate desertification, from serious desertification to non-desertification, and from weak desertification to non-desertification, while the desertification aggravation areas ranged mainly from serious desertification to moderate desertification; 5 NPP dynamic changes in vegetation demonstrated a zonal increase in distribution from west to east, and significant progress was made in desertification control. The change in desertification has accelerated significantly over the last decade. Climate change and irresponsible human activities have exacerbated desertification in the eastern part of the study area. Keywords: urat front flag; desertification; spatio-temporal pattern; driving factor; albedo–ndvi; npp 1. Introduction Desertification is a global ecological problem [1]. China has the world’s largest deserti- fication area, the most affected population, and the most severe wind and sand hazards, with the desertification land area reaching 1533 million km 2 , accounting for 15.9% of the total national land area [2]. Inner Mongolia Autonomous Region is located on China’s northern border, and is the largest and most comprehensive ecological function area in the north of China. It is also one of the provinces with the highest concentrations of deserti- fication and sandy land, as well as the most severe harm, with the majority of the region being in arid, semi-arid, and subtropical arid climate zones. Within the distribution area of Water 2022, 14, 1777. https://doi.org/10.3390/w14111777 https://www.mdpi.com/journal/water

Welcome message from author
This document is posted to help you gain knowledge. Please leave a comment to let me know what you think about it! Share it to your friends and learn new things together.
Transcript

Citation: Feng, Y.; Wang, S.; Zhao, M.;
Zhou, L. Monitoring of Land
Desertification Changes in Urat Front
Banner from 2010 to 2020 Based on
Remote Sensing Data. Water 2022, 14,
1777. https://doi.org/10.3390/
w14111777
Academic Editor: Maria Mimikou
Received: 4 May 2022
Accepted: 25 May 2022
Published: 1 June 2022
Publisher’s Note: MDPI stays neutral
with regard to jurisdictional claims in
published maps and institutional affil-
iations.
Copyright: © 2022 by the authors.
Licensee MDPI, Basel, Switzerland.
This article is an open access article
distributed under the terms and
conditions of the Creative Commons
Attribution (CC BY) license (https://
creativecommons.org/licenses/by/
4.0/).
water
Article
Monitoring of Land Desertification Changes in Urat FrontBanner from 2010 to 2020 Based on Remote Sensing DataYuanyuan Feng 1,2,3, Shihang Wang 1,2,3,*, Mingsong Zhao 1,2,3 and Lingmei Zhou 1,2,3
1 School of Geomatics, Anhui University of Science and Technology, Huainan 232001, China;[email protected] (Y.F.); [email protected] (M.Z.); [email protected] (L.Z.)
2 Key Laboratory of Aviation-Aerospace-Ground Cooperative Monitoring and Early Warning of CoalMining-Induced Disasters of Anhui Higher Education Institutes, Anhui University of Science and Technology,Huainan 232001, China
3 Coal Industry Engineering Research Center of Mining Area Environmental and Disaster CooperativeMonitoring, Anhui University of Science and Technology, Huainan 232001, China
* Correspondence: [email protected]
Abstract: Monitoring the spatio-temporal dynamics of desertification is critical for desertificationcontrol. Using the Urat front flag as the study area, Landsat remote sensing images between 2010and 2020 were selected as data sources, along with MOD17A3H as auxiliary data. Additionally,RS and GIS theories and methods were used to establish an Albedo–NDVI feature space based onthe normalized difference vegetation index (NDVI) and land surface albedo. The desertificationdifference index (DDI) was developed to investigate the dynamic change and factors contributingto desertification in the Urat front banner. The results show that: 1© the Albedo–NDVI featurespace method is effective and precise at extracting and classifying desertification information, whichis beneficial for quantitative analysis and monitoring of desertification; 2© from 2010 to 2020, thespatial distribution of desertification degree in the Urat front banner gradually decreased from southto north; 3© throughout the study period, the area of moderate desertification land increased themost, at an annual rate of 8.2%, while the area of extremely serious desertification land decreasedsignificantly, at an annual rate of 9.2%, indicating that desertification degree improved during thestudy period; 4© the transformation of desertification types in Urat former banner is mainly from verysevere to moderate, from severe to undeserted, and from mild to undeserted, with respective areas of22.5045 km2, 44.0478 km2, and 319.2160 km2. Over a 10-year period, the desertification restorationareas in the study area ranged from extremely serious desertification to moderate desertification, fromserious desertification to non-desertification, and from weak desertification to non-desertification,while the desertification aggravation areas ranged mainly from serious desertification to moderatedesertification; 5© NPP dynamic changes in vegetation demonstrated a zonal increase in distributionfrom west to east, and significant progress was made in desertification control. The change indesertification has accelerated significantly over the last decade. Climate change and irresponsiblehuman activities have exacerbated desertification in the eastern part of the study area.
Keywords: urat front flag; desertification; spatio-temporal pattern; driving factor; albedo–ndvi; npp
1. Introduction
Desertification is a global ecological problem [1]. China has the world’s largest deserti-fication area, the most affected population, and the most severe wind and sand hazards,with the desertification land area reaching 1533 million km2, accounting for 15.9% of thetotal national land area [2]. Inner Mongolia Autonomous Region is located on China’snorthern border, and is the largest and most comprehensive ecological function area in thenorth of China. It is also one of the provinces with the highest concentrations of deserti-fication and sandy land, as well as the most severe harm, with the majority of the regionbeing in arid, semi-arid, and subtropical arid climate zones. Within the distribution area of
Water 2022, 14, 1777. https://doi.org/10.3390/w14111777 https://www.mdpi.com/journal/water
Water 2022, 14, 1777 2 of 18
Badangilin, Tengger, Ulanbu, and Kubuchi’s “four deserts” and Mawusu, Hunshandake,Horqin, and Hulunbeier’s “four sands”, desertification land covers 914 million mu, ac-counting for 23.3% of the national desertification area, the area of sandy land is 612 millionmu, accounting for 23.7% of the national sandy land area, and the ecological environmentis extremely fragile [3–5]. At the moment, as a significant ecological barrier along China’snorthern border, the impact of human activities on the ecological environment has exac-erbated land desertification, severely impeding the healthy and sustainable developmentof human society and the improvement of the ecological environment suitable for humanhabitation [6,7]. As a result, scientifically sound and accurate data on the desertificationstatus can serve as a critical foundation for desertification research and control [8].
Thus far, several researchers have used remote sensing and GIS techniques in theirresearch on desertification [9–11]. F. Basso et al. assessed the environmental sensitivityof the Agri basin in southern Italy at the watershed scale using GIS and remote sensingdata [12]. Jeong et al. examined the change process of the desert transition zone in the Asianregion from 1982 to 2008 and concluded that Asia is more vulnerable to desertificationdisturbances under global or regional warming conditions [13]. Salvati et al. evaluated theextent of land desertification in Italy based on the ESAI framework [14]. Wang Fei et al.and Zhang Jianxiang et al. analyzed the causes of land desertification in the Tarim Basinand Loess Plateau region [15,16]. Xue et al. analyzed the dynamic change characteristicsof wind-eroded desertification areas in northwestern Shanxi using a transfer matrix [17];Chen Fang et al. used MODIS data to monitor the degree of desertification in Mongoliadynamically [18]. In addition, the widely used desertification evaluation indicators incurrent remote sensing monitoring of desertification are vegetation cover, net primaryproductivity, surface albedo, soil texture, crop yield, and water erosion [19–21]. After athorough examination of the causes, development process, and manifestations of deser-tification formation, it was determined that vegetation is the most active and significantinfluencing factor on the surface, as well as the most sensitive to changes in environmentalfactors such as topography, landform, soil, hydrology, and climate, which can be usedas the primary basis for remote sensing monitoring of desertification [22]. For example,Sternberg et al. used NDVI to evaluate the process of land desertification on the Mongolianplateau [23]. Ying et al. used Albedo–NDVI feature space to assess the desertification ofthe Loess Plateau [24]. Lei et al. estimated the vegetation cover using an image elementdichotomous model on the MOD13Q1-NDVI dataset and then examined the status of landdesertification in Kenya [25]. Muzetijiang-Abla et al. analyzed the degree of desertificationand spatial and temporal changes in the Loess Plateau region using GIMMS AVHRR NDVIdata, concluding that the majority of the Loess Plateau is covered by moderate to severedesertification area, with the degree of desertification generally decreasing [26]. Zhu et al.proposed that the different vegetation types have a different maximum light energy utiliza-tion and developed a regional NPP estimation model using the Inner Mongolia vegetationtype as an example. The regional NPP estimation model estimated vegetation net pro-ductivity and analyzed its spatial and temporal distribution characteristics [27]. However,the majority of previous studies used MODIS–NDVI or GIMMS–NDVI models to analyzedesertification by calculating vegetation cover, while a few studies used an Albedo–NDVIfeature space approach for desertification in the Urat front flag. However, the research dataare outdated and unrepresentative. The majority of research focuses on the influencingfactors of desertification, desertification evaluation indexes, and the monitoring and com-parison of desertification degrees in different periods. There are insufficient studies on therapid positioning, identification, and spatial distribution of desert areas formed by the landdegradation process under long time series, as well as the problems of strong subjectivityof research results, difficulty in realization, low precision, and complexity of methods.Desertification appears as a bare land surface in remote sensing images. The enhancementof information and the weakening of vegetation information can be characterized by indexfactors such as surface albedo, surface temperature, surface humidity, vegetation index,and vegetation cover. The normalized vegetation index (NDVI) is a crucial biophysical

Water 2022, 14, 1777 3 of 18
parameter reflecting the state of surface vegetation, whereas the surface albedo is a physicalparameter representing the reflection characteristics of the surface to solar short-waveradiation. As desertification increases, surface vegetation is severely damaged, surfacevegetation cover decreases, biomass drops, and surface roughness increases, which isreflected in remote sensing images by a corresponding decrease in NDVI value and anincrease in surface albedo. Therefore, it is highly representative to research and analyze thedegree of desertification in the region using “Albedo–NDVI” feature space.
The dry climate, scarcity of precipitation, temperate continental arid climate, andexcessive impact of human activities on the ecological environment have resulted in theecological environment of the Urat front flag facing problems with soil salinization, sanding,and pasture degradation, weakening the ecological environment [28,29]. According toprevious desertification research, combining the vegetation index and surface albedo byconstructing an “Albedo–vegetation index (NDVI) feature space” enables more effectiveand convenient quantitative monitoring and research of the spatial and temporal distri-bution and dynamics of desertification [30]. In addition, it can serve as a theoretical basisfor ecological restoration and environmental management in the region. In light of this, toanalyze the spatial and temporal characteristics and evolution patterns of land desertifica-tion in the Urat front flag, this study created the region’s “Albedo–NDVI” feature spacebetween 2010 and 2020 using the ENVI and ArcGIS software platforms. Additionally, usingLandsat remote sensing images as the primary data source, as well as dynamic attitudecalculation [31], transfer matrix analysis [32], and center of gravity shift analysis [33], andin conjunction with MODIS–NDVI data, the CASA model was used to estimate the netprimary productivity of vegetation between 2010 and 2020 [27,34]. To accurately andobjectively evaluate the ecological environment of the study area, this paper analyzes thespatial distribution pattern and the impact of topographic factors on desertification. It alsoprovides a theoretical basis for the ecological environment governance of the Urat frontbanner, and serves as a reference for the ecological environment protection and rationaldevelopment of Hetao oasis and arid and semi-arid areas.
2. Materials and Methods2.1. Overview of the Study Area
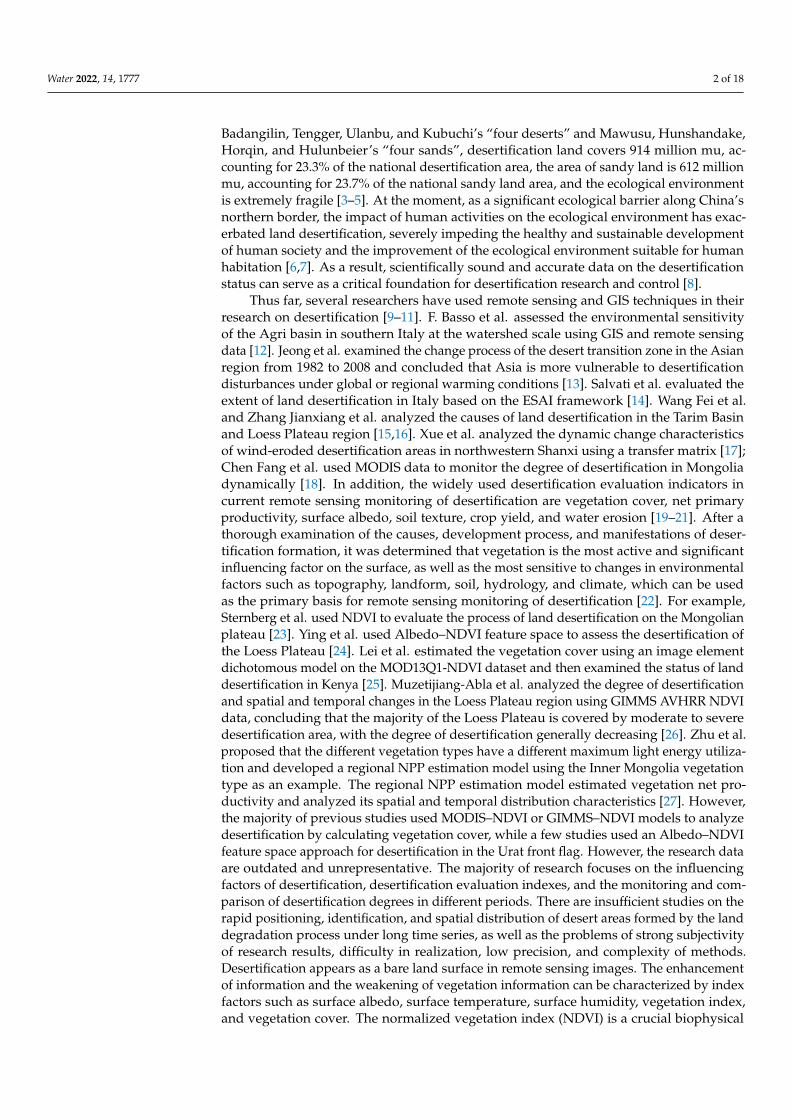
The Urat front banner is located in the eastern part of the Loop Plain, where theadministrative division is under Bayannur City in the Inner Mongolia Autonomous Region.The geographical coordinates are 108◦11′–109◦54′ E and 40◦28′–41◦16′ N. The climate istemperate continental, with an annual average temperature of 6–7 ◦C, annual sunshinehours of 2959.4–3456.7 h, annual evaporation of 2069.3–2365.3 mm, and annual precipitationof 200–250 mm, mostly concentrated in June–September, accounting for 78.9% of the annualprecipitation. The total area of the district is 7476 km2, with the yellow irrigation areacovering 7.47 × 10⁴ hm2, accounting for 54.55% of the arable land area. Specific locationinformation is shown in Figure 1.
Water 2022, 14, 1777 4 of 18Water 2022, 14, x FOR PEER REVIEW 4 of 19
Figure 1. Geographical position map of the Urat front flag.
2.2. Data Source and Its Pre-Processing Landsat images were obtained from the USGS [35], with time periods of 27 August
2010 and 7 September 2020, respectively. The selected time period has low cloud cover, and the image quality meets the research requirements. The remote sensing images were preprocessed using ENVI5.3 software, which took into account radiometric calibration, atmospheric correction, and geometric refinement correction, while keeping the error to less than one image element. Finally, the remote sensing images were stitched and cropped based on the vector boundaries of the Urat front banner, and relevant parameters were inverted on the preprocessed remote sensing images [36,37]. The normalized vegetation index (NDVI) is a biophysical parameter representing the surface vegetation status, whereas surface albedo reflects the physical characteristics of the surface. By combining these two indicators to extract desertification information together and avoiding the use of a single spectral information classification, quantitative dynamic monitoring of desertification can be made more convenient and effective.
The MODIS/Terra MOD17A3H data products [38] provide accurate measurements of terrestrial vegetation growth, including global gross primary productivity (GPP) and annual net primary productivity (NPP). The NPP data were synthesized from 45 periods (8-day synthetic data) at a spatial resolution of 500 m in gC/m2, and were processed using projection change, mosaicking, and cropping to investigate the spatial and temporal variation of NPP in the two years of 2010 and 2020 in the Urat front banner, as well as to conduct the driving factor analysis for this study [39,40]. Negative values, fire point instability values, and background noise are not removed from the monthly products of NPP, but the annual data for 2010 and 2020 provide cloud-free mean lights and exclude transient lights, so the use of MOD17A3 data for these two years to validate only the NPP estimated by the CASA model is sufficient for the experiment.
2.3. Research Method and Process In view of the principle of invertibility, reliability, and practicability of the
desertification degree discriminant index [41], vegetation parameters were selected as the discriminatory index of desertification degree. Additionally, the normalized difference vegetation index (NDVI) and the land surface albedo (Albedo) were obtained, which characterize the biophysical characteristics of surface vegetation state and soil information, respectively. Furthermore, using the MOD17A3 data obtained for the two years of 2010 and 2020, vegetation annual NPP values were calculated using the CASA model to assess desertification genesis.
Figure 1. Geographical position map of the Urat front flag.
2.2. Data Source and Its Pre-Processing
Landsat images were obtained from the USGS [35], with time periods of 27 August2010 and 7 September 2020, respectively. The selected time period has low cloud cover,and the image quality meets the research requirements. The remote sensing images werepreprocessed using ENVI5.3 software, which took into account radiometric calibration,atmospheric correction, and geometric refinement correction, while keeping the error toless than one image element. Finally, the remote sensing images were stitched and croppedbased on the vector boundaries of the Urat front banner, and relevant parameters wereinverted on the preprocessed remote sensing images [36,37]. The normalized vegetationindex (NDVI) is a biophysical parameter representing the surface vegetation status, whereassurface albedo reflects the physical characteristics of the surface. By combining these twoindicators to extract desertification information together and avoiding the use of a singlespectral information classification, quantitative dynamic monitoring of desertification canbe made more convenient and effective.
The MODIS/Terra MOD17A3H data products [38] provide accurate measurementsof terrestrial vegetation growth, including global gross primary productivity (GPP) andannual net primary productivity (NPP). The NPP data were synthesized from 45 periods(8-day synthetic data) at a spatial resolution of 500 m in gC/m2, and were processedusing projection change, mosaicking, and cropping to investigate the spatial and temporalvariation of NPP in the two years of 2010 and 2020 in the Urat front banner, as well asto conduct the driving factor analysis for this study [39,40]. Negative values, fire pointinstability values, and background noise are not removed from the monthly products ofNPP, but the annual data for 2010 and 2020 provide cloud-free mean lights and excludetransient lights, so the use of MOD17A3 data for these two years to validate only the NPPestimated by the CASA model is sufficient for the experiment.
2.3. Research Method and Process
In view of the principle of invertibility, reliability, and practicability of the desertifica-tion degree discriminant index [41], vegetation parameters were selected as the discrimi-natory index of desertification degree. Additionally, the normalized difference vegetationindex (NDVI) and the land surface albedo (Albedo) were obtained, which characterize thebiophysical characteristics of surface vegetation state and soil information, respectively. Fur-thermore, using the MOD17A3 data obtained for the two years of 2010 and 2020, vegetationannual NPP values were calculated using the CASA model to assess desertification genesis.
Water 2022, 14, 1777 5 of 18
2.3.1. Normalized Difference Vegetation Index (NDVI)
The normalized vegetation index (NDVI) was calculated using reflectance values inthe near-infrared and red wavelength bands [42]. Additionally, the NDVI value, N, wasnormalized using the following formula to facilitate subsequent data comparison andfeature space construction.
NDVI = (ρnir − ρred)/(ρnir + ρred) (1)
N = (NDVI−NDVImin)/(NDVImax −NDVImax) (2)
where ρnir denotes the reflectance in the near-infrared band, ρred indicates the reflectancein the red band, and NDVImax and NDVImin represent the maximum and minimum valuesof NDVI.
2.3.2. Land Surface Albedo
The surface albedo was inverted using the inversion model established by Liang [43],and the Albedo value, A, was normalized using the following equation.
Albedo = 0.356× ρblue + 0.130× ρred + 0.373× ρnir+0.085× ρswir1 + 0.072× ρswir2 − 0.0018 (3)
A = (Albedo−Albedomin)/(Albedomax −Albedomax) (4)
where ρblue indicates the reflectance of the blue band, ρred denotes the reflectance of the redband, ρnir represents the reflectance of the near-infrared band, ρswir1 and ρswir2 show thereflectance of two mid-infrared bands, and Albedomax and Albedomin are regarded as themaximum and minimum values of Albedo, respectively.
2.3.3. Albedo–NDVI Feature Space Analysis
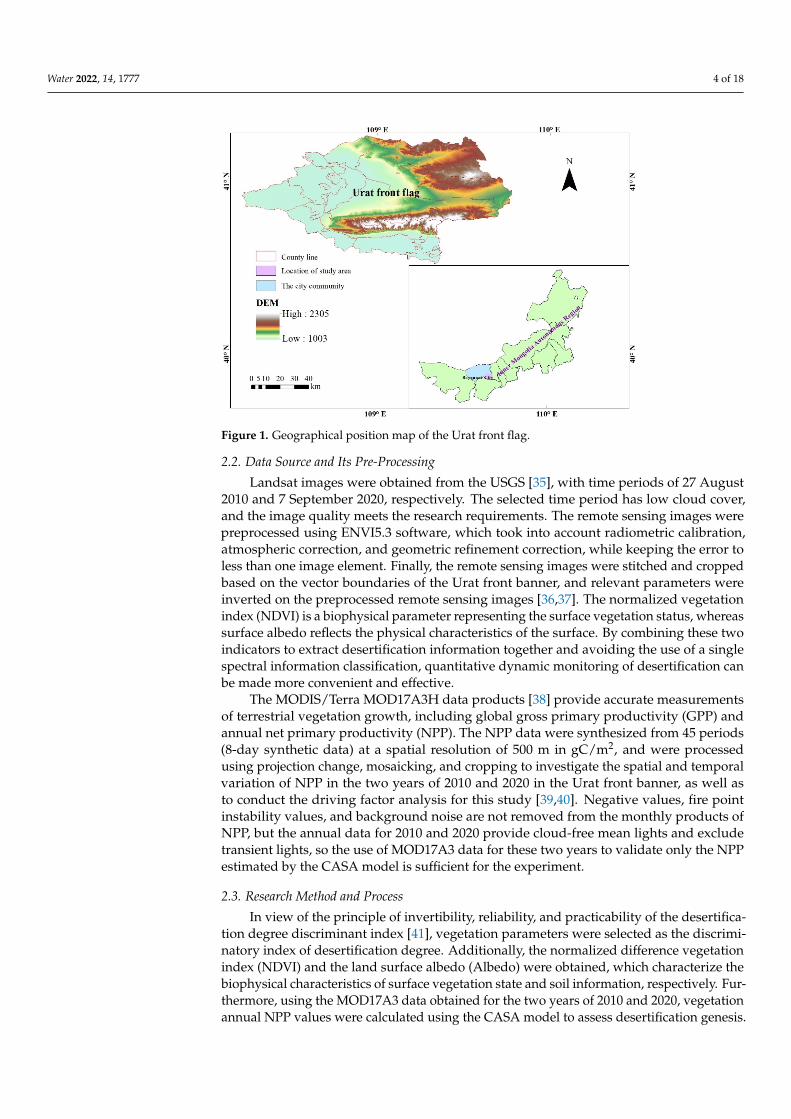
According to the findings of Y. Zeng et al. [30], there is a significant linear negativecorrelation between NDVI and albedo in the one-dimensional feature space, and thedistribution of different surface cover types in the Albedo–NDVI feature space exhibits asignificant divergence pattern, allowing for easy differentiation of various surface covertypes [44,45] (Figure 2).
Water 2022, 14, x FOR PEER REVIEW 5 of 19
2.3.1. Normalized Difference Vegetation Index (NDVI) The normalized vegetation index (NDVI) was calculated using reflectance values in
the near-infrared and red wavelength bands [42]. Additionally, the NDVI value, N, was normalized using the following formula to facilitate subsequent data comparison and feature space construction. NDVI = (𝜌 − 𝜌 )/(𝜌 + 𝜌 ) (1) 𝑁 = (NDVI − NDVI )/(NDVI − NDVI ) (2)
where ρnir denotes the reflectance in the near-infrared band, ρred indicates the reflectance in the red band, and NDVImax and NDVImin represent the maximum and minimum values of NDVI.
2.3.2. Land Surface Albedo The surface albedo was inverted using the inversion model established by Liang [43],
and the Albedo value, A, was normalized using the following equation. Albedo = 0.356 × 𝜌 + 0.130 × 𝜌 + 0.373 × 𝜌 +0.085 × 𝜌 + 0.072 × 𝜌 − 0.0018 (3)
𝐴 = (Albedo − Albedo )/(Albedo − Albedo ) (4)
where ρblue indicates the reflectance of the blue band, ρred denotes the reflectance of the red band, ρnir represents the reflectance of the near-infrared band, ρswir1 and ρswir2 show the reflectance of two mid-infrared bands, and Albedomax and Albedomin are regarded as the maximum and minimum values of Albedo, respectively.
2.3.3. Albedo–NDVI Feature Space Analysis According to the findings of Y. Zeng et al. [30], there is a significant linear negative
correlation between NDVI and albedo in the one-dimensional feature space, and the distribution of different surface cover types in the Albedo–NDVI feature space exhibits a significant divergence pattern, allowing for easy differentiation of various surface cover types [44,45] (Figure 2).
Figure 2. Albedo–NDVI feature space. Note: A is arid bare soil (low NDVI and high Albedo), B is water-rich bare soil (low NDVI and low Albedo), C is high vegetation cover with adequate soil moisture content (high NDVI and low Albedo), and D is high vegetation cover area with low soil moisture content and relatively high albedo (low NDVI and high Albedo).
Figure 2. Albedo–NDVI feature space. Note: A is arid bare soil (low NDVI and high Albedo),B is water-rich bare soil (low NDVI and low Albedo), C is high vegetation cover with adequate soilmoisture content (high NDVI and low Albedo), and D is high vegetation cover area with low soilmoisture content and relatively high albedo (low NDVI and high Albedo).
Water 2022, 14, 1777 6 of 18
Surface albedo is a function of vegetation cover and soil water content in the Albedo–NDVI space. The top boundary AD in Figure 2 represents the high albedo line, reflecting thedrought condition, and the bottom edge BC is the maximum low albedo line, representingthe condition of sufficient surface moisture [30].
The linear regression equation between NDVI and Albedo was constructed as followsbased on their linear negative correlation:
Albedo = k×NDVI + b (5)
where k is determined by the slope of the fitted curve in the feature space.
2.3.4. Desertification Difference Index (DDI)
The degree of desertification is not only a direct indicator of the severity of landdesertification, but also an indirect indicator and measure of the ease with which desertifi-cation land can be restored to its productive and ecosystem functions [46]. The DDI [47] isexpressed as follows in terms of Albedo–NDVI feature space:
DDI = a×NDVI−Albedo (6)
2.3.5. Accuracy Verification of Desertification Classification
This study employs confusion matrix analysis to determine the classification accuracyand reliability, which can indicate not only the total error for each category, but also thecategory misclassification. The error matrix is composed of the number of image elementsclassified into a category and a proportional array containing the high-resolution relativetest truth value for that category [48,49]. The confusion matrix can be used to calculatethe overall accuracy (OA), producer’s accuracy (PA), user’s accuracy (UA), and Kappacoefficient evaluation metrics, which are used to compare various aspects of desertificationrecognition accuracy. The PA is the probability of a sample point being correctly classified,which is a measure of missing error. Additionally, UA quantifies the inclusion error bycomparing the ratio of the correctly classified sample points in each row to the total samplepoints in that row. Theoretically, its formula is expressed as follows:
OA = ∑i=5i=1 Xii/N (7)
PA = Xii/Xi+ (8)
UA = Xii/X+i (9)
Kappa =
[N ∑i=5
i=1 Xii −(
∑i=5i=1 X+i + X+i
)]N2 −∑i=5
i=1 X+i + X+i(10)
where N indicates the total sample count, Xii denotes the sample count in row i and columni, and Xi+, and X+i represent the total sample counts of row i and column i, respectively.
To ensure the accuracy of the results, 100 validation points were distributed uniformlyand randomly throughout the experimental area. The validation points were visuallyinterpreted based on Landsat 8 true color images and Google Earth maps. The result-ing interpretation data were compiled to construct a confusion matrix and solve for theKappa coefficient.
2.3.6. Desertification Land Transfer Matrix Model
The transfer matrix model in ArcGIS 10.5 was used to analyze the temporal dynamicsof different classes of desertification land. The transfer matrix was calculated as [50,51]:
Dij = Sij/ ∑ni=1 ∑n
j=1 Sij (11)
Water 2022, 14, 1777 7 of 18
where i and j denote desertification land grades, Dij represents the transfer degree ofdifferent desertification land grades, Sij indicates the transfer area of different desertificationland grades (km2), and n is regarded as the total amount of desertification land of thesame grade.
2.3.7. Dynamic Change Model of Desertification Land
To further reflect the annual rate of change in the land desertification area, the dynamicattitude, K, is used to quantify the rate of change in desertification [52].
K =u2 − u1
u1× 1
t2 − t1× 100% (12)
where K denotes the dynamic attitude of a desertification land type over the study period(%), u1 represents the initial area (km2), u2 indicates the final area (km2), and t1 and t2indicate the time corresponding to the initial and final areas, respectively.
2.3.8. Center of Gravity Migration Model of Desertification Land
The migration of the spatial center of gravity can be used to characterize the patternof spatial change in a landscape. The principle of population geography’s center of grav-ity [53,54] is used to analyze the direction and distance of desertification land’s center ofgravity migration, as well as the spatial dynamic changes associated with various gradesof desertification land. The coordinates of a given grade of desertification land’s center ofgravity in year t are calculated using the following formula [55,56]:
Xt = ∑ni=t Cti × Xi/ ∑n
i=t Cti (13)
Yt = ∑ni=t Cti ×Yi/ ∑n
i=t Cti (14)
where Xt and Yt represent the latitude and longitude coordinates of the center of gravity,respectively, for the distribution of a certain type of desertification land in year t, Cti denotesthe area (km2) of the ith patch of a certain type of desertification in year t, and Xi and Yiindicate the latitude and longitude coordinates of the center of gravity, respectively, for thedistribution of the ith patch of a certain type of desertification in year t.
V(t2−t1) =
√[xt2 − xt1]
2 + [yt2 − yt1]2
t2 − t1(15)
where V(t2−t1) indicates the migration rate of the center of gravity (m/a) for a certain typeof desertification land in a certain time period, t2 and t1 denote the study termination andinitiation times, respectively, and xt1, yt1, xt2, and yt2 represent the latitude and longitudecoordinates of the center of gravity for the distribution of a certain type of desertificationland in year t1 or t2, respectively [57].
2.3.9. CASA Model
The light energy utilization model to estimate NPP is based on a resource balancingview and is one of the most well-documented inversion models for NPP remote sensing.The Carnegie–Ames–Stanford approach (CASA) model, established by Potter et al. [58], isthe most widely used model for light energy utilization.
NPP(x, t) = APAR(x, t)× ε(x, t) (16)
where x denotes spatial position, t represents time, APAR(x,t) indicates the photosynthet-ically active radiation (gC·m−2·month−1) absorbed by image element x in month t, andε(x,t) is regarded as the actual light energy utilization (gC·MJ−1) of image element x inmonth t.
APAR(x, t) = SOL(x, t)× FPRA(x, t)× 0.5 (17)

Water 2022, 14, 1777 8 of 18
where SOL indicates the total solar radiation (gC·m−2·month−1), FPRA represents theproportion of the incident photosynthetically active radiation absorbed by the vegetationlayer, and the constant 0.5 denotes the ratio of solar radiation utilized by the vegetation tothe total solar radiation [34,59].
3. Results and Analysis3.1. Albedo–NDVI Feature Space Analysis
The ROI function in ENVI was used to randomly select 1600 sample points distributedat various desertification levels across the study area. After normalizing the data of the twoperiods, the NDVI and Albedo values were extracted from the 1600 sample points, and alinear regression equation was constructed between them. The regression equations andlinear correlations in the study area for 2010 and 2020 (Figure 3) were as follows:
Albedo = −0.1505NDVI + 0.3855(
R2 = 0.7004)
(18)
Albedo = −0.098NDVI + 0.2190(
R2 = 0.7033)
(19)
Water 2022, 14, x FOR PEER REVIEW 8 of 19
month t, and ε(x,t) is regarded as the actual light energy utilization (gC·MJ−1) of image element x in month t. APAR(x, t) = SOL(x, t) × FPRA(𝑥, 𝑡) × 0.5 (17)
where SOL indicates the total solar radiation (gC·m−2·month−1), FPRA represents the proportion of the incident photosynthetically active radiation absorbed by the vegetation layer, and the constant 0.5 denotes the ratio of solar radiation utilized by the vegetation to the total solar radiation [34,59].
3. Results and Analysis 3.1. Albedo–NDVI Feature Space Analysis
The ROI function in ENVI was used to randomly select 1600 sample points distributed at various desertification levels across the study area. After normalizing the data of the two periods, the NDVI and Albedo values were extracted from the 1600 sample points, and a linear regression equation was constructed between them. The regression equations and linear correlations in the study area for 2010 and 2020 (Figure 3) were as follows: Albedo = −0.1505NDVI + 0.3855 (𝑅 = 0.7004) (18)Albedo = −0.098NDVI + 0.2190 (𝑅 = 0.7033) (19)
. (a) 2010 (b) 2020
Figure 3. Albedo-NDVI linear regression analysis.
As illustrated in Figure 3, the Albedo–NDVI feature space is trapezoidal, and the R2
coefficients of linear regression equations are all greater than 0.7, and Albedomax is significantly negatively correlated with NDVI. Meanwhile, as the vegetation index gradually increases, its surface albedo decreases, demonstrating a strong linear negative correlation between the vegetation index and surface Albedo.
3.2. DDI Analysis The DDI was estimated for all years using the Albedo–NDVI feature space (Figure 3). To
this end, k values were calculated using a × k =−1, and the final DDI expressions were obtained for the two phases of the Urat front flag data as reported in Equations (17) and (18). DDI = 6.6445 × NDVI − Albedo (20) DDI = 10.2041 × NDVI − Albedo (21)
y = -0.1505x + 0.3855R² = 0.7004
0.10.120.140.160.18
0.20.220.240.260.28
0.30.32
0.5 0.6 0.7 0.8 0.9 1
Alb
edo
NDVI
y = -0.0989x + 0.219R² = 0.7033
0.10.120.140.160.180.2
0.220.240.260.280.3
0.32
0.5 0.6 0.7 0.8 0.9 1
Alb
edo
NDVI
Figure 3. Albedo-NDVI linear regression analysis.
As illustrated in Figure 3, the Albedo–NDVI feature space is trapezoidal, and the R2
coefficients of linear regression equations are all greater than 0.7, and Albedomax is signif-icantly negatively correlated with NDVI. Meanwhile, as the vegetation index graduallyincreases, its surface albedo decreases, demonstrating a strong linear negative correlationbetween the vegetation index and surface Albedo.
3.2. DDI Analysis
The DDI was estimated for all years using the Albedo–NDVI feature space (Figure 3).To this end, k values were calculated using a × k = −1, and the final DDI expressions wereobtained for the two phases of the Urat front flag data as reported in Equations (17) and (18).
DDI2010 = 6.6445×NDVI−Albedo (20)
DDI2020 = 10.2041×NDVI−Albedo (21)
Desertification is characterized using DDI, which is classified into five categories basedon the natural break method, namely extremely serious desertification, serious desertification,moderate desertification, weak desertification, and non-desertification [60,61].
3.3. Accuracy Validation
Classification error analysis using the Albedo–NDVI feature space (Table 1) revealedthat the overall accuracy of both the 2010 and 2020 images was over 95%, with Kappa

Water 2022, 14, 1777 9 of 18
coefficients of 0.96 and 0.93, meeting the requirements for desertification dynamics researchin the region. Among them, the Albedo–NDVI model has high production accuracy formoderate, serious, and extremely serious desertification, implying that underestimation ofthese three desertification levels is minimal. However, the production and user accuracyfor weak desertification is extremely low, indicating a high multimetric error in identifyingweak desertification areas.
Table 1. Error analysis of land desertification information extraction based on Albedo-NDVI feature space.
Year Extremely Serious(%)
Serious(%)
Moderate(%)
Weak(%)
Non-Desertification
(%)KappaCoeffi-cient
OA(%)
PA UA PA UA PA UA PA UA PA UA
2010 97.14 97.29 91.59 97.67 98.08 92.67 98.32 85.18 97.63 99.69 0.96 96.27
2020 99.98 100.00 98.45 98.62 95.57 87.83 82.10 65.73 81.38 99.77 0.93 95.06
The validation results demonstrate that the Albedo–NDVI feature spatial methodis capable of achieving optimal results in both the extraction of desertification land andthe classification of desertification degree with higher accuracy and efficiency than otherwidely used remote sensing methods for desertification monitoring.
3.4. Spatial Distribution Characteristics of Desertification Land
The Urat front flag is a significant environmentally sensitive and ecologically fragilearea in Inner Mongolia due to its dense population distribution and the high level ofdisturbance caused by human activities. To thoroughly investigate the spatial and temporalevolution of desertification in the Urat front flag, it is necessary to examine the area’sdesertification process.
Desertification information was retrieved using the aforementioned methodologiesand indicators in ArcGIS 10.5 software, and finally, the desertification land grade map ofthe study area was generated for two time periods of 2010 and 2020, as shown in Figure 4.
Water 2022, 14, x FOR PEER REVIEW 9 of 19
Desertification is characterized using DDI, which is classified into five categories based on the natural break method, namely extremely serious desertification, serious desertification, moderate desertification, weak desertification, and non-desertification [60,61].
3.3. Accuracy Validation Classification error analysis using the Albedo–NDVI feature space (Table 1) revealed
that the overall accuracy of both the 2010 and 2020 images was over 95%, with Kappa coefficients of 0.96 and 0.93, meeting the requirements for desertification dynamics research in the region. Among them, the Albedo–NDVI model has high production accuracy for moderate, serious, and extremely serious desertification, implying that underestimation of these three desertification levels is minimal. However, the production and user accuracy for weak desertification is extremely low, indicating a high multimetric error in identifying weak desertification areas.
Table 1. Error analysis of land desertification information extraction based on Albedo-NDVI feature space.
Year Extremely
Serious (%)
Serious (%)
Moderate (%)
Weak (%)
Non-Desertificatio
n (%)
Kappa Coefficie
nt
OA (%)
PA UA PA UA PA UA PA UA PA UA 2010 97.14 97.29 91.59 97.67 98.08 92.67 98.32 85.18 97.63 99.69 0.96 96.27 2020 99.98 100.00 98.45 98.62 95.57 87.83 82.10 65.73 81.38 99.77 0.93 95.06
The validation results demonstrate that the Albedo–NDVI feature spatial method is capable of achieving optimal results in both the extraction of desertification land and the classification of desertification degree with higher accuracy and efficiency than other widely used remote sensing methods for desertification monitoring.
3.4. Spatial Distribution Characteristics of Desertification Land The Urat front flag is a significant environmentally sensitive and ecologically fragile
area in Inner Mongolia due to its dense population distribution and the high level of disturbance caused by human activities. To thoroughly investigate the spatial and temporal evolution of desertification in the Urat front flag, it is necessary to examine the area’s desertification process.
Desertification information was retrieved using the aforementioned methodologies and indicators in ArcGIS 10.5 software, and finally, the desertification land grade map of the study area was generated for two time periods of 2010 and 2020, as shown in Figure 4.
(a) 2010 (b) 2020
Figure 4. Spatio-temporal distribution of desertification grade in the Urat front banner based on DDI.
As seen in Figure 4, the spatial distribution of desertification in the Urat front flag10 years from 2010 to 2020 demonstrates a downward trend from south to north. In2010, extremely serious desertification land was primarily distributed in the central andnorthern parts (e.g., Erdenbrag Sumu and Bayannur City Dashetai Ranch), serious deserti-fication land was mainly distributed on the northeast (e.g., Xiaoshetai Town and MinganTown), moderate desertification land gradually expanded from the south to the west,weak desertification land was mainly distributed on the western and southern areas (e.g.,Bayannur City Xin’an Farm, Bayannur City Zhongtan Farm, and surrounding areas), andnon-desertification land was mainly concentrated in the central and western areas (e.g.,

Water 2022, 14, 1777 10 of 18
Bayannur City Uliang Suhai Fishing Ground, Sudulun Town, and Bayannur City SudulunFarm). Comparing 2020 to 2010 reveals that the desertification degree is obviously reduced,primarily as a result of the implementation of the policy of “returning farmland to forestand grass and replacing it with food”, which has increased the vegetation cover in theregion and significantly enhanced the quality of the ecological environment. However,after 10 years of development, the moderate desertification and non-desertification landsin the Urat front flag are expanding, mainly to the southwest and northeast, while a part ofthe non-desertification land in the central area has shifted to very serious desertification.Additionally, the development of weak desertification land is mainly concentrated in thecenter and south, and the changes of extremely serious desertification and serious landhave declined sharply.
3.5. Characteristics of Desertification Land Area Change
The changes in the total area of various types of desertification land reflect the generaldevelopment trend of desertification land in the study area. The statistical results for thearea of various types of desertification land in the study area in the two periods of 2010and 2020 are reported in Table 2.
Table 2. Types and area of desertification land in the Urat front banner, km2.
The Type ofDesertification Land
2010 2020 2010–2020
Area % Area % Annual Rate ofChange (%)
Extremely serious 1236.1077 16.6 95.0265 1.3 −9.2
Serious 2253.2328 30.2 1400.8446 18.8 −3.8
Moderate 1535.6655 20.6 2790.1539 37.4 8.2
Weak 1042.2000 13.9 1471.8825 19.7 4.1
Non-desertification 1395.3690 18.7 1704.9951 22.8 2.2
Sum 7462.5750 100.0 7462.9026 100.0 1.5
The changes in the total area of various types of desertification land reflect the generaldevelopment trend of desertification land in the study area. The statistical results fordifferent types of desertification land areas in the study area in the two periods of 2010and 2020 are reported in Table 2. As can be observed, the land area of the Urat front flagexpanded from 7462.5750 km2 to 7462.9026 km2 between 2010 and 2020, increasing the totalarea by 0.3276 km2. Among these, the areas of extremely serious and serious desertificationland were both reduced to varying degrees, from 16.6% and 30.2% of the total desertificationland, respectively. The area of moderate desertification land increased from 1535.6655 km2
in 2010 to 2790.1539 km2 in 2020, while the area of weak desertification land increasedfrom 13.9% to 19.7%. Additionally, the area of non-desertification land increased from1395.3690 km2 to 1704.9951 km2, with the proportion increasing from 18.7% to 22.8%. Ascan be seen, the desertification land in the study improved overall throughout the 10-yearperiod from 2010 to 2020, with the degree of desertification reversing from serious andextremely serious to moderate and weak, resulting in a spike in moderate desertification.
Between 2010 and 2020, the dynamic attitudes of extremely serious and serious deser-tification areas were −9.2% and −3.8%, respectively, indicating that extremely serious andserious desertification areas decreased by 9.2% and 3.8% per year, respectively, while themoderate, weak, and non-desertification areas increased by 8.2%, 4.1%, and 2.2%, respec-tively. Throughout the study period, the area of moderate desertification land increasedthe most, whereas the area of extremely serious desertification land decreased the most,demonstrating that desertification improved throughout the study period.

Water 2022, 14, 1777 11 of 18
3.6. Characteristics of Desertification Land Transfer Change
The transfer matrix efficiently expresses the interconversion relationship betweendifferent types of land across the two periods of 2010 and 2020, and can be used to inves-tigate the spatial evolution process and characteristics of desertification land. Using themathematical model of transfer matrix, the transfer matrix of desertification land from 2010to 2020 was obtained as reported in Tables 3 and 4 and spatially depicted in Figure 5.
Table 3. Transition matrix of desertification in the Urat front banner from 2010 to 2020, km2.
20102020 Extremely
Serious Serious Moderate Weak Non-Desertification
Total(Reduced)
Extremely serious 27.5886 695.0610 420.8040 46.5273 45.8181 1235.7990
Serious 16.1136 433.18000 1476.2150 220.0040 107.3880 2252.9010
Moderate 22.5045 176.7820 662.2933 470.4828 203.3020 1535.3650
Weak 18.4590 51.3909 141.0400 415.2340 415.8430 1041.9670
Non-desertification 10.3428 44.0478 89.3223 319.2160 932.2280 1395.1570
Total (increased) 95.0085 1400.4620 2789.6750 1471.4640 1704.4790 7461.1880
Table 4. The change in the spatiotemporal pattern of desertification in the study area, km2.
2010–2020 Severe Dete-rioration Deterioration No Change Restoration Obvious
Restoration
Area 2470.524 236.0673 653.1516 1625.8000 1043.8430
Percent (%) 41.0 3.9 10.8 27.0 17.3
Water 2022, 14, x FOR PEER REVIEW 12 of 19
(desertification remained unchanged), restoration (desertification decreased to the adjacent level), and obvious restoration (desertification decreased by two or more levels).
Table 4. The change in the spatiotemporal pattern of desertification in the study area, km2.
2010–2020 Severe
Deterioration Deterioratio
n No Change Restoration Obvious
Restoration Area 2470.524. 236.0673 653.1516 1625.8000 1043.8430
Percent (%) 41.0 3.9 10.8 27.0 17.3
Spatial statistics indicate that between 2010 and 2020, the distribution of areas with varying degrees of desertification in the Urat front flag remained stable. No change areas were sparsely distributed, primarily in the west (e.g., Uliang Suhai Fishery in Bayannur City and Xin’an Farm in Bayannur City) and the south (e.g., Baiyanhua Town). Deterioration and severe deterioration areas were mainly concentrated in the central west (e.g., Xishanzui Farm in Bayannur City and Xin’an Farm in Bayannur City) and south. Restoration and obvious restoration areas were mostly situated in the northern (e.g., Shetai Ranch, Sudulun Town, and Bayannur City) and central (e.g., Erdenbrag Sumu and Ming’an Town) areas. In addition, between 2010 and 2020, the degree of desertification remained stable in certain areas of the Urat front flag and did not change (10.8% of the study area), while the desertification aggravation and the recovery areas accounted for 41% and 44.3% of the total area, respectively. Among them, the desertification restoration area is 199.11 km2 larger than the desertification aggravation area.
Meanwhile, according to the desertification land transfer matrix reported in Table 3, the desertification recovery area in the study area between 2010 and 2020 is primarily derived from the conversion of extremely serious to moderate, serious to non-desertification, and moderate desertification to non-desertification, whereas the desertification aggravation area is primarily derived from the conversion of serious desertification to moderate desertification.
Figure 5. Changes in spatio-temporal patterns of desertification in the study area.
3.7. Spatial Pattern Variation of Desertification Land The dynamic changes in the spatio-temporal distribution of different types of
desertification land between 2010 and 2020 were quantified using the standard deviation ellipse method, and the center of gravity migration model calculation. Equations (10)–(12) were used to determine the migration rates of different levels of desertification land centers of gravity in the Urat front flag from 2010 to 2020, respectively (Table 5).
Figure 5. Changes in spatio-temporal patterns of desertification in the study area.
The area transformed into each type of desertification land in the Urat front flagis 66.9% of the total area of the Urat front flag. Additionally, the amount of transfor-mation into each type of desertification land from high to low is: extremely serious de-sertification > moderate desertification > weak desertification > serious desertification> non-desertification. The transformation of desertification types in the Urat front flagmostly ranges from very serious to moderate, from serious to non-desertification, andfrom weak to non-desertification, covering 22.5045 km2, 44.0478 km2, and 319.2160 km2,respectively. Nearly half of the serious desertification land is transformed into othertypes of land, and the area of other types of land transformed into serious desertifica-tion land is 540.7380 km2, while the area of land converted from other types of land to
Water 2022, 14, 1777 12 of 18
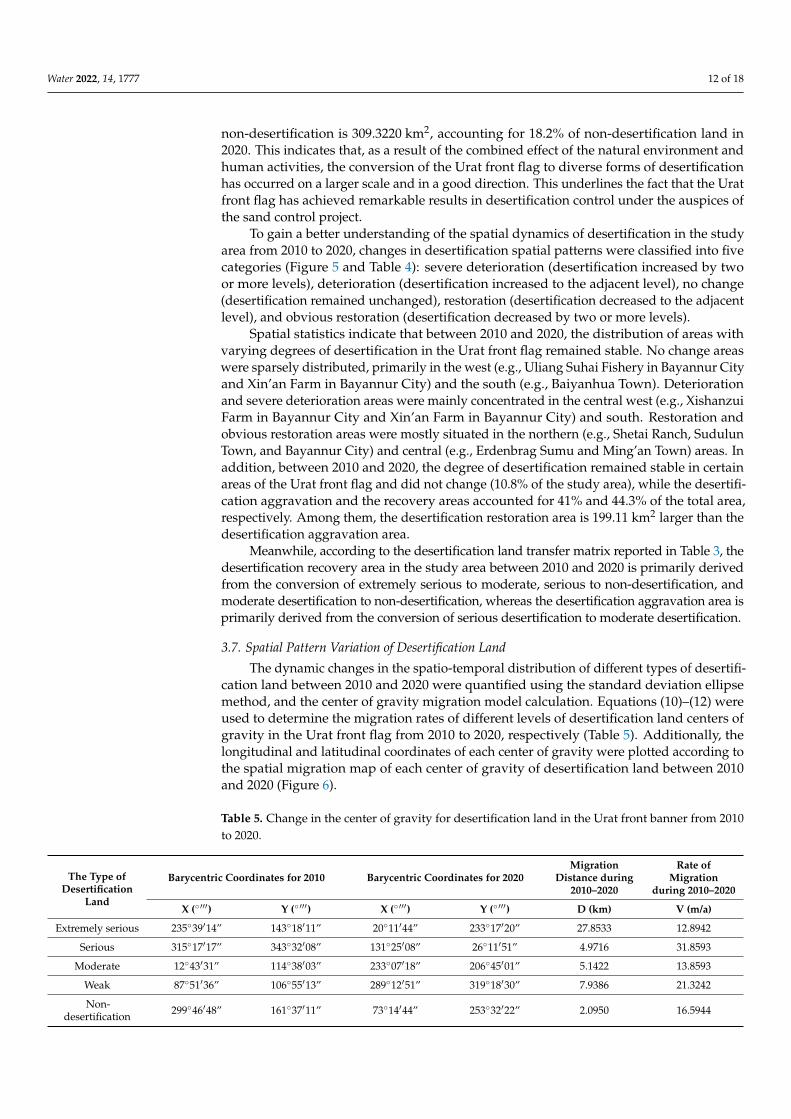
non-desertification is 309.3220 km2, accounting for 18.2% of non-desertification land in2020. This indicates that, as a result of the combined effect of the natural environment andhuman activities, the conversion of the Urat front flag to diverse forms of desertificationhas occurred on a larger scale and in a good direction. This underlines the fact that the Uratfront flag has achieved remarkable results in desertification control under the auspices ofthe sand control project.
To gain a better understanding of the spatial dynamics of desertification in the studyarea from 2010 to 2020, changes in desertification spatial patterns were classified into fivecategories (Figure 5 and Table 4): severe deterioration (desertification increased by twoor more levels), deterioration (desertification increased to the adjacent level), no change(desertification remained unchanged), restoration (desertification decreased to the adjacentlevel), and obvious restoration (desertification decreased by two or more levels).
Spatial statistics indicate that between 2010 and 2020, the distribution of areas withvarying degrees of desertification in the Urat front flag remained stable. No change areaswere sparsely distributed, primarily in the west (e.g., Uliang Suhai Fishery in Bayannur Cityand Xin’an Farm in Bayannur City) and the south (e.g., Baiyanhua Town). Deteriorationand severe deterioration areas were mainly concentrated in the central west (e.g., XishanzuiFarm in Bayannur City and Xin’an Farm in Bayannur City) and south. Restoration andobvious restoration areas were mostly situated in the northern (e.g., Shetai Ranch, SudulunTown, and Bayannur City) and central (e.g., Erdenbrag Sumu and Ming’an Town) areas. Inaddition, between 2010 and 2020, the degree of desertification remained stable in certainareas of the Urat front flag and did not change (10.8% of the study area), while the desertifi-cation aggravation and the recovery areas accounted for 41% and 44.3% of the total area,respectively. Among them, the desertification restoration area is 199.11 km2 larger than thedesertification aggravation area.
Meanwhile, according to the desertification land transfer matrix reported in Table 3, thedesertification recovery area in the study area between 2010 and 2020 is primarily derivedfrom the conversion of extremely serious to moderate, serious to non-desertification, andmoderate desertification to non-desertification, whereas the desertification aggravation area isprimarily derived from the conversion of serious desertification to moderate desertification.
3.7. Spatial Pattern Variation of Desertification Land
The dynamic changes in the spatio-temporal distribution of different types of desertifi-cation land between 2010 and 2020 were quantified using the standard deviation ellipsemethod, and the center of gravity migration model calculation. Equations (10)–(12) wereused to determine the migration rates of different levels of desertification land centers ofgravity in the Urat front flag from 2010 to 2020, respectively (Table 5). Additionally, thelongitudinal and latitudinal coordinates of each center of gravity were plotted according tothe spatial migration map of each center of gravity of desertification land between 2010and 2020 (Figure 6).
Table 5. Change in the center of gravity for desertification land in the Urat front banner from 2010to 2020.
The Type ofDesertification
Land
Barycentric Coordinates for 2010 Barycentric Coordinates for 2020Migration
Distance during2010–2020
Rate ofMigration
during 2010–2020
X (◦′′′) Y (◦′′′) X (◦′′′) Y (◦′′′) D (km) V (m/a)
Extremely serious 235◦39′14” 143◦18′11” 20◦11′44” 233◦17′20” 27.8533 12.8942
Serious 315◦17′17” 343◦32′08” 131◦25′08” 26◦11′51” 4.9716 31.8593
Moderate 12◦43′31” 114◦38′03” 233◦07′18” 206◦45′01” 5.1422 13.8593
Weak 87◦51′36” 106◦55′13” 289◦12′51” 319◦18′30” 7.9386 21.3242
Non-desertification 299◦46′48” 161◦37′11” 73◦14′44” 253◦32′22” 2.0950 16.5944

Water 2022, 14, 1777 13 of 18
Water 2022, 14, x FOR PEER REVIEW 13 of 19
Additionally, the longitudinal and latitudinal coordinates of each center of gravity were plotted according to the spatial migration map of each center of gravity of desertification land between 2010 and 2020 (Figure 6).
Table 5. Change in the center of gravity for desertification land in the Urat front banner from 2010 to 2020.
The Type of Desertification
Land
Barycentric Coordinates for 2010
Barycentric Coordinates for 2020
Migration Distance during
2010–2020
Rate of Migration
during 2010–2020
X (°‴) Y (°‴) X (°‴) Y (°‴) D (km) V (m/a) Extremely
serious 235°39′14″ 143°18′11″ 20°11′44″ 233°17′20″ 27.8533 12.8942
Serious 315°17′17″ 343°32′08″ 131°25′08″ 26°11′51″ 4.9716 31.8593 Moderate 12°43′31″ 114°38′03″ 233°07′18″ 206°45′01″ 5.1422 13.8593
Weak 87°51′36″ 106°55′13″ 289°12′51″ 319°18′30″ 7.9386 21.3242 Non-
desertification 299°46′48″ 161°37′11″ 73°14′44″ 253°32′22″ 2.0950 16.5944
During the period of 2010–2020, the center of gravity of each desertification land has been migrated and altered dramatically. The extremely serious desertification land migrated 27.8533 km from the central southwest direction at a migration rate of 12.8942 m/a, indicating that the repeated and excessive livestock feeding and trampling in the Xin’an farm of Bayannur City and the Wuliang Suhai fishery of Bayannur City destroyed the community structure of forage grasses, reduced their quality, significantly decreased the edible forage grass yield, thinned and shortened the plants, and gradually decreased the coverage, resulting in concentrated patches of bare grass. Serious desertification land migrates 4.9716 km from the central part to the northeast, with a migration rate of 31.8593 m/a, mostly due to the low precipitation in the northeast region, drought, and water shortage. Moderate desertification land migrates 5.1422 km along the central part to the west at a migration rate of 13.8593 m/a, indicating that desertification has developed to the south and northeast of the oasis, at a migration rate of 13.8593 m/a. The main reason is that the soil structure and surface vegetation are destroyed by excessive or indiscriminate reclamation. Non-desertification land has the shortest distance of migration between 2010 and 2020, with only 2.0950 km from the southeast to the northwest, at a migration rate of 16.5944 m/a. Deforestation of land is a result of anthropogenic activities such as deforestation and extensive groundwater extraction.
(a) Extremely serious (b) Serious
Water 2022, 14, x FOR PEER REVIEW 14 of 19
(c) Moderate (d) Weak
(e) Non-desertification
Figure 6. Center of gravity migration of desertification land in the Urat front banner from 2010 to 2020. Note: COG: center of gravity; SDE: standard deviation ellipse.
The spatial migration pattern of the center of gravity for different desertification types in the Urat front flag from 2010 to 2020 is depicted in Figure 6. Extremely serious desertification occurs primarily in the central and northern parts of the study area. Weak and non-desertification land is mostly distributed in the southwestern and northwestern parts of the study area, where it is mixed and intermingled. Serious and moderate desertification are mainly concentrated in the central, northeastern, and southeastern parts of the study area. The reason is that the geographical location and climatic environment of the study area lead to drought, low rainfall, and water shortages. The degree of desertification in the region is dominated by serious, weak, and non-desertification land types. As the spatial distribution patterns of desertification center of gravity and actual desertification land are essentially the same, changes in the centers of gravity of different types of desertification land can accurately reflect the spatial changes in desertification land.
4. Discussion In order to further investigate the drivers of desertification land change from 2010 to
2020, the NPP values in 2010 and 2020 in Urat front flag were estimated using MODIS image data and CASA model and their spatial distribution was analyzed using ArcGIS.
NPP has the most intuitive way to convey the degradation of vegetation productivity and can be distinguished from the other forms of desertification land types. As illustrated in Figure 7a, the annual NPP per unit area in 2010 in the Urat front flag can reach a maximum of 306.3 gC/m2, with an annual average value of 122.2 gC/m2, in which the NPP of the Dashetai Ranch in Bayannur City, Zhongtan Farm in Bayannur City, the southwestern part of Dashetai Town, and some parts of Mingan Town is significantly higher than the NPP of vegetation in the western and central and northeastern regions. This phenomenon indicates that in the central and northern regions of the study area, the
Figure 6. Center of gravity migration of desertification land in the Urat front banner from 2010 to2020. Note: COG: center of gravity; SDE: standard deviation ellipse.
During the period of 2010–2020, the center of gravity of each desertification land hasbeen migrated and altered dramatically. The extremely serious desertification land mi-grated 27.8533 km from the central southwest direction at a migration rate of 12.8942 m/a,indicating that the repeated and excessive livestock feeding and trampling in the Xin’anfarm of Bayannur City and the Wuliang Suhai fishery of Bayannur City destroyed the com-munity structure of forage grasses, reduced their quality, significantly decreased the edibleforage grass yield, thinned and shortened the plants, and gradually decreased the cover-age, resulting in concentrated patches of bare grass. Serious desertification land migrates4.9716 km from the central part to the northeast, with a migration rate of 31.8593 m/a,mostly due to the low precipitation in the northeast region, drought, and water shortage.Moderate desertification land migrates 5.1422 km along the central part to the west at a mi-gration rate of 13.8593 m/a, indicating that desertification has developed to the south andnortheast of the oasis, at a migration rate of 13.8593 m/a. The main reason is that the soilstructure and surface vegetation are destroyed by excessive or indiscriminate reclamation.Non-desertification land has the shortest distance of migration between 2010 and 2020, with

Water 2022, 14, 1777 14 of 18
only 2.0950 km from the southeast to the northwest, at a migration rate of 16.5944 m/a. De-forestation of land is a result of anthropogenic activities such as deforestation and extensivegroundwater extraction.
The spatial migration pattern of the center of gravity for different desertification typesin the Urat front flag from 2010 to 2020 is depicted in Figure 6. Extremely serious deser-tification occurs primarily in the central and northern parts of the study area. Weak andnon-desertification land is mostly distributed in the southwestern and northwestern partsof the study area, where it is mixed and intermingled. Serious and moderate desertificationare mainly concentrated in the central, northeastern, and southeastern parts of the studyarea. The reason is that the geographical location and climatic environment of the studyarea lead to drought, low rainfall, and water shortages. The degree of desertification in theregion is dominated by serious, weak, and non-desertification land types. As the spatialdistribution patterns of desertification center of gravity and actual desertification land areessentially the same, changes in the centers of gravity of different types of desertificationland can accurately reflect the spatial changes in desertification land.
4. Discussion
In order to further investigate the drivers of desertification land change from 2010to 2020, the NPP values in 2010 and 2020 in Urat front flag were estimated using MODISimage data and CASA model and their spatial distribution was analyzed using ArcGIS.
NPP has the most intuitive way to convey the degradation of vegetation productivityand can be distinguished from the other forms of desertification land types. As illustrated inFigure 7a, the annual NPP per unit area in 2010 in the Urat front flag can reach a maximumof 306.3 gC/m2, with an annual average value of 122.2 gC/m2, in which the NPP of theDashetai Ranch in Bayannur City, Zhongtan Farm in Bayannur City, the southwestern partof Dashetai Town, and some parts of Mingan Town is significantly higher than the NPP ofvegetation in the western and central and northeastern regions. This phenomenon indicatesthat in the central and northern regions of the study area, the climate is arid, precipitationis scarce, vegetation is sparse, desertification is severe, and NPP is low. As illustrated inFigure 7b, the variation in NPP in 2020 is relatively obvious. The annual NPP can reach amaximum of 354.5 gC/m2, while the annual average value is 159.5 gC/m2, which exhibitsan increase of 48.2 gC/m2 compared with 2010, and the areas with strong vegetation growthwere mainly concentrated in the southern, north-central, and east-central regions. In theeastern and southern parts of the study area, more farms, pastures, grasslands, forests,and water resources are reorganized, and the vegetation NPP is higher. There are obviousdifferences in spatial distribution over the past 10 years, and the results of desertificationcontrol are remarkable.
Water 2022, 14, x FOR PEER REVIEW 15 of 19
climate is arid, precipitation is scarce, vegetation is sparse, desertification is severe, and NPP is low. As illustrated in Figure 7b, the variation in NPP in 2020 is relatively obvious. The annual NPP can reach a maximum of 354.5 gC/m2, while the annual average value is 159.5 gC/m2, which exhibits an increase of 48.2 gC/m2 compared with 2010, and the areas with strong vegetation growth were mainly concentrated in the southern, north-central, and east-central regions. In the eastern and southern parts of the study area, more farms, pastures, grasslands, forests, and water resources are reorganized, and the vegetation NPP is higher. There are obvious differences in spatial distribution over the past 10 years, and the results of desertification control are remarkable.
(a) 2010 (b) 2020
Figure 7. Spatial distribution of vegetation NPP in Urat front flag.
According to earlier studies, changes in vegetation NPP result from a synergistic impact of human activities and climate change [62–67]. The annual average NPP of vegetation in the Urat front flag from 2010 to 2020 has a distinct spatial differentiation pattern (Figure 7), with an overall growing distribution in a band from west to east, and the differences are related to hydrothermal conditions. The northwestern Bayannur City Xin’an Farm and the north-central Dashetai Town have a higher vegetation NPP due to grassland and woodland planting. The northeastern Xiaoshetai Town and parts of northern Sudulun Town have poor natural conditions and a relatively low vegetation NPP, and the south-central Erdenbrag Sumu is dominated by a stable continental climate with insufficient precipitation, sparse vegetation cover, and low vegetation NPP. The NPP of vegetation is also higher because the southern part is bordered by the Yellow River, with good climatic conditions and sufficient water resources. In summary, climate change is the primary factor influencing vegetation recovery in Urat former banner, while precipitation is the primary climatic factor controlling vegetation growth. Wet climatic conditions and sufficient precipitation are conducive to vegetation growth, and this effect is especially significant in arid and semi-arid areas. The effect of precipitation on vegetation is primarily through affecting vegetation photosynthetic efficiency and plant activity, thereby influencing vegetation organic matter production.
5. Conclusions This paper analyzed the spatial and temporal evolution of land desertification in the
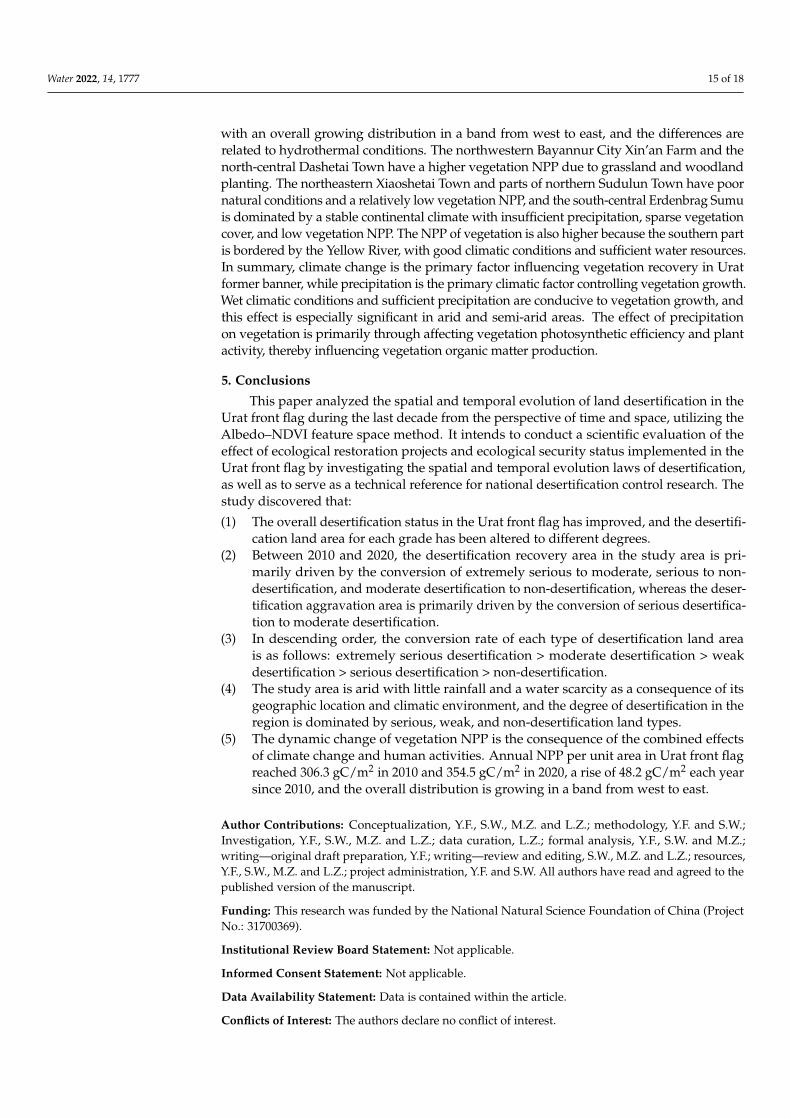
Urat front flag during the last decade from the perspective of time and space, utilizing the Albedo–NDVI feature space method. It intends to conduct a scientific evaluation of the effect of ecological restoration projects and ecological security status implemented in the Urat front flag by investigating the spatial and temporal evolution laws of desertification, as well as to serve as a technical reference for national desertification control research. The study discovered that: (1) The overall desertification status in the Urat front flag has improved, and the
desertification land area for each grade has been altered to different degrees.
Figure 7. Spatial distribution of vegetation NPP in Urat front flag.
According to earlier studies, changes in vegetation NPP result from a synergistic impactof human activities and climate change [62–67]. The annual average NPP of vegetation inthe Urat front flag from 2010 to 2020 has a distinct spatial differentiation pattern (Figure 7),
Water 2022, 14, 1777 15 of 18
with an overall growing distribution in a band from west to east, and the differences arerelated to hydrothermal conditions. The northwestern Bayannur City Xin’an Farm and thenorth-central Dashetai Town have a higher vegetation NPP due to grassland and woodlandplanting. The northeastern Xiaoshetai Town and parts of northern Sudulun Town have poornatural conditions and a relatively low vegetation NPP, and the south-central Erdenbrag Sumuis dominated by a stable continental climate with insufficient precipitation, sparse vegetationcover, and low vegetation NPP. The NPP of vegetation is also higher because the southern partis bordered by the Yellow River, with good climatic conditions and sufficient water resources.In summary, climate change is the primary factor influencing vegetation recovery in Uratformer banner, while precipitation is the primary climatic factor controlling vegetation growth.Wet climatic conditions and sufficient precipitation are conducive to vegetation growth, andthis effect is especially significant in arid and semi-arid areas. The effect of precipitationon vegetation is primarily through affecting vegetation photosynthetic efficiency and plantactivity, thereby influencing vegetation organic matter production.
5. Conclusions
This paper analyzed the spatial and temporal evolution of land desertification in theUrat front flag during the last decade from the perspective of time and space, utilizing theAlbedo–NDVI feature space method. It intends to conduct a scientific evaluation of theeffect of ecological restoration projects and ecological security status implemented in theUrat front flag by investigating the spatial and temporal evolution laws of desertification,as well as to serve as a technical reference for national desertification control research. Thestudy discovered that:
(1) The overall desertification status in the Urat front flag has improved, and the desertifi-cation land area for each grade has been altered to different degrees.
(2) Between 2010 and 2020, the desertification recovery area in the study area is pri-marily driven by the conversion of extremely serious to moderate, serious to non-desertification, and moderate desertification to non-desertification, whereas the deser-tification aggravation area is primarily driven by the conversion of serious desertifica-tion to moderate desertification.
(3) In descending order, the conversion rate of each type of desertification land areais as follows: extremely serious desertification > moderate desertification > weakdesertification > serious desertification > non-desertification.
(4) The study area is arid with little rainfall and a water scarcity as a consequence of itsgeographic location and climatic environment, and the degree of desertification in theregion is dominated by serious, weak, and non-desertification land types.
(5) The dynamic change of vegetation NPP is the consequence of the combined effectsof climate change and human activities. Annual NPP per unit area in Urat front flagreached 306.3 gC/m2 in 2010 and 354.5 gC/m2 in 2020, a rise of 48.2 gC/m2 each yearsince 2010, and the overall distribution is growing in a band from west to east.
Author Contributions: Conceptualization, Y.F., S.W., M.Z. and L.Z.; methodology, Y.F. and S.W.;Investigation, Y.F., S.W., M.Z. and L.Z.; data curation, L.Z.; formal analysis, Y.F., S.W. and M.Z.;writing—original draft preparation, Y.F.; writing—review and editing, S.W., M.Z. and L.Z.; resources,Y.F., S.W., M.Z. and L.Z.; project administration, Y.F. and S.W. All authors have read and agreed to thepublished version of the manuscript.
Funding: This research was funded by the National Natural Science Foundation of China (ProjectNo.: 31700369).
Institutional Review Board Statement: Not applicable.
Informed Consent Statement: Not applicable.
Data Availability Statement: Data is contained within the article.
Conflicts of Interest: The authors declare no conflict of interest.
Water 2022, 14, 1777 16 of 18
References1. Sun, L.; Ou, Y.; Yu, F.; Liang, L. Effect of Film Lined Rice on the Change of Soil Carbon Pool in Repairing Desertification Soil. Soil
Sci. 2022, 7, 70–77. [CrossRef]2. Cheng, L.; Yin, C.; Lu, Q.; Wu, B.; Que, X. Economic analysis of the causes of desertification and irrational human activities. Chin.
J. Agric. Resour. Reg. Plan. 2016, 7, 123–129. [CrossRef]3. Yao, Y. Research on the driving force of desertification and soil and water conservation in inner mongolia. Chin. J. Agric. Resour.
Reg. Plan. 2018, 6, 13–17. [CrossRef]4. Xu, C. Study on Dynamic Change of Desertification in Hulunbeier. Ph.D. Thesis, Jilin University, Changchun, China, 2010;
Volume 80, pp. 1–80.5. Wang, T. The Aeolian Desertification Dynamics and Related Ecological Environment Effect in the Otindag Sandy Land. Ph.D.
Thesis, Beijing Forestry University, Beijing, China, 2020; Volume 68, pp. 1–68. [CrossRef]6. Wang, T.; Liu, S. Regionalization for Regulating Oasification and Desertification in the Arid Regions of China: A program. J.
Desert Res. 2013, 8, 959–966. [CrossRef]7. You, Y.C.; Li, Z.W.; Huang, C.; Zeng, H. Spatial-temporal Evolution Characteristics of Land Desertification in the Zoige Plateau in
1990–2016. J. Ecol. Environ. Sci. 2017, 10, 1671–1680. [CrossRef]8. Guo, Q. Monitoring and Assessment of Desertification from Remote Sensing in the Northern China. Ph.D. Thesis, University of
Chinese Academy of Sciences, Beijing, China, 2018. Volume 129. pp. 1–129.9. Oloukoi, J.; Gbenga, A.-E.; Langyit, D.-G. Desertification risk analysis and assessment in Northern Nigeria. Remote Sens. Appl. Soc.
Environ. 2018, 12, 70–82. [CrossRef]10. Yao, Z.Y.; Wang, T.; Zhu, K.W. Land Desertification Romote Sensing Monitoring in 2000 in Alashan League Inner Mongolia. J.
Arid. Land Resour. Environ. 2008, 5, 47–51.11. Jian, W.; Dao, L.-P. The Remote Sensing Dynamic Monitoring of Land Sandy Desertification in Duolun County. In Proceedings
of the 2011 Fourth International Conference on Intelligent Computation Technology and Automation, Shenzhen, China, 28–29March 2011. [CrossRef]
12. Basso, F.; Bove, E.; Dumontet, S. Evaluating environmental sensitivity at the basin scale through the use of geographic informationsystems and remotely sensed data: An example covering the Agri basin (Southern Italy). Catena 2000, 16, 19–35. [CrossRef]
13. Jeong, S.-J.; Ho, C.-H.; Brown, M.-E.; Brown, J.-S.; Kug, S. Browning in desert boundaries in Asia in recent decades. J. Geophys.Res. Appl. Geogr. 2011, 116, D02103. [CrossRef]
14. Salvati, L.; Bajocco, S. Land sensitivity to desertification across Italy: Past, present, and future. J. Appl. Geogr. 2011, 31, 223–231.[CrossRef]
15. Wang, F.; Wu, Z.; Wang, Y.; Jiao, W.; Chen, Y. Dynamic monitoring of desertification in the Tarim Basin based on RS and GIStechniques. Chin. J. Ecol. 2017, 9, 1029–1037.
16. Zhang, J.X.; Zhang, D.Y.; Liu, W.F.; Hu, A.P.; Wang, D.; Hu, J.Q. ESAI Based Assessment of Desertification Risk in Loess Plateau.Bull. Soil Water Conserv. 2017, 7, 339–344, 353.
17. Xue, Z.J.; Qin, Z.; Cheng, F. Long-term dynamic characterization of aeolian desertification in northwest Shanxi, China. ChinaEnviron. Sci. 2020, 8, 17166–17174.
18. Chen, F.; Liu, H.J.; Liu, S.J.; Ochir, A. MODIS-based Desertification Dynamic Monitoring in Mongolia from 2003–2017. J. NorthwestFor. Univ. 2019, 5, 167–171. [CrossRef]
19. Pang, S.N. Remote Sensing Monitoring of Desertification in Yili and Bozhou Region. Ph.D. Thesis, Xinjiang University, Xinjiang,China, 2009; Volume 73, pp. 1–73.
20. Huo, A.D. Study on Aeolian Desertification Remote Sensing Monitoring System in China Using MODIS Image Data. Ph.D. Thesis,Northwest A&F University, Xianyang, China, 2008; Volume 144; pp. 1–144.
21. Zhao, Y.Y.; Gao, G.L.; Qin, S.G.; Yu, M.H.; Ding, G.D. Desertification detection and the evaluation indicators: A review. J. Arid.Land Resour. Environ. 2019, 7, 81–87.
22. Zhou, D.; Zhao, X.; Hu, H.; Shen, H.; Fang, J. Long-term vegetation changes in the four mega-sandy lands in Inner Mongolia,China. Landsc. Ecol. 2015, 13, 1613–1626. [CrossRef]
23. Sternberg, T.; Tsolmon, R.; Middleton, N.; Thomas, D. Tracking desertification on the Mongolian steppe through NDVI andfield-survey data. Int. J. Digit. Earth 2011, 14, 50–64. [CrossRef]
24. Liu, Y.; Li, Y.; Lu, Y.; Yue, H. Monitoring of Desertification and Drought in Loess Plateau Based on NDVI-albedo Space. RemoteSens. Inf. 2019, 6, 30–35.
25. He, L.; Wang, C.; Bie, Q.; Zhao, C.Y. Monitoring of Desertification Dynamic in Kenya during 2001–2010 Using Mod13Q1 Data. J.Desert Res. 2013, 7, 46–52.
26. Murat, A.; Zhang, X.P.; Chen, L.L. Spatial-temporal distribution of desertification on the Loess Plateau using the GIMMS NDVIdata. Sci. Soil Water Conserv. 2015, 8, 24–31.
27. Zhu, W.Q.; Pan, Y.Z.; Long, Z.H.; Chen, Y.H.; Li, J.; Hu, H.B. Estimating Net Primary Productivity of Terrestrial Vegetation Basedon GIS and RS: A Case Study in Inner Mongolia‚ China. J. Natl. Remote Sens. Bull. 2005, 8, 300–307.
28. Sun, G.J. Study on the evaluation of eco-environmental vulnerability by BP artificial neural network: A case study of WulateCounty. J. Northwest Norm. Univ. (Nat. Sci.) 2005, 5, 105–108, 114.
Water 2022, 14, 1777 17 of 18
29. Sun, G.J.; Liu, P.X.; Sun, T. Driving Forces of Cultivated Land Change in Wulate County:Investigation and prediction. Bull. SoilWater Conserv. 2011, 4, 207–210.
30. Zeng, Y.N.; Xiang, N.P.; Feng, Z.D.; Xu, H. Albedo-NDVI Space and Remote Sensing Synthesis Index Models for DesertificationMonitoring. Sci. Geogr. Sin. 2006, 7, 75–81.
31. Wang, J.; Niu, L.; Jiang, M.Y.; Lu, N. Study on the Coupling Relationship between Land Use and Economic Development and theCorresponding Optimization Path. Int. Conf. Intell. Transp. 2015, 6, 778–783. [CrossRef]
32. Badapalli, P.-K.; Raghu, B.-K.; Rajasekhar, M.; Ramachandra, M. Assessment of Aeolian Desertification Near Vedavathi RiverCannel in Central Part of Andhra Pradesh: Remote Sensing Approach. Remote Sens. Land 2020, 10, 39–49. [CrossRef]
33. Chen, Y.; Hu, M.K.; Fang, Y. Study on the migration of the center of gravity and the coupling coordination of land use degree andeconomic development in Wuhan. Yangtze River Basin Resour. Environ. 2017, 10, 1131–1140.
34. Jiménez, E.-M.; Peñuela-mora, M.-C.; Moreno, F.; Carlos, A.-S. Spatial and temporal variation of forest net primary productivitycomponents on contrasting soils in northwestern Amazon. Ecosphere 2020, 11, e03233. [CrossRef]
35. LAADS DAAC. Available online: http://landsat.usgs.gov/ (accessed on 18 March 2022).36. Bris, A.-L.; Chehata, N. Sensitivity of urban material classification to spatial and spectral configurations from visible to short-wave
infrared. In Proceedings of the 2019 Joint Urban Remote Sensing Event, Vannes, France, 22–24 May 2019. [CrossRef]37. Reza, M.-I.-H.; Abdullah, S.-A. Regional Index of Ecological Integrity: A need for sustainable management of natural resources.
Ecol. Indic. 2011, 9, 220–229. [CrossRef]38. Chinese Academy of Sciences Resource and Environmental Science and Data Center. Available online: https://www.resdc.cn/
(accessed on 18 March 2022).39. Song, D.; Guo, P.; Sheng, H. Spatial Distribution Pattern of MODIS-NDVI and Correlation between NDVI and Meteorology
Factors in Shandong Province in China. Electromagn. Wave Theory 2008, 5, 191–196. [CrossRef]40. Wang, R.; Wan, B.; Guo, Q.; Hu, M.; Zhou, S. Mapping Regional Urban Extent Using NPP-VIIRS DNB and MODIS NDVI Data.
Remote Sens. 2017, 8, 862. [CrossRef]41. Chen, P.Y.; Fedosejevs, G.; Tiscareño-LóPez, M.; Arnold, J.G. Assessment of MODIS-EVI, MODIS-NDVI and VEGETATION-NDVI
Composite Data Using Agricultural Measurements: An Example at Corn Fields in Western Mexico. Environ. Monit. Assess. 2005,13, 69–82. [CrossRef] [PubMed]
42. Zabel, F.; Hank, T.B.; Mauser, W. Improving arable land heterogeneity information in available land cover products for landsurface modelling using MERIS NDVI data. Hydrol. Earth Syst. Sci. 2010, 11, 2073–2084. [CrossRef]
43. Liang, S.; Shuey, C.J.; Russ, A.L. Narrowband to broadband conversions of land surface albedo: II. Validation. Remote Sens.Environ. 2003, 16, 25–41. [CrossRef]
44. Wu, R.; Qi, Y.L.; Er, D. Study on Desertification in Acukeerqin Banner Based on Albedo-NDVI Feature Space, ENVI, GIS andComputer. In Communications, Signal Processing and Systems; Springer: Berlin/Heidelberg, Germany, 2018; Volume 6, pp. 449–455.[CrossRef]
45. Wu, Z.P.; Wang, M.X.; Zhao, X. The changes of desertification from 1990–2011 in Jinghe watershed. J. Arid. Land Resour. Environ.2015, 6, 192–197.
46. Rahman, M.; Szabó, G. Impact of Land Use and Land Cover Changes on Urban Ecosystem Service Value in Dhaka, Bangladesh. J.Land. 2021, 10, 793. [CrossRef]
47. Verstraete, M.-M.; Pinty, B. Designing optimal spectral indexes for remote sensing applications. J. Mag. 1996, 11, 1254–1265.[CrossRef]
48. Qu, J.; Wang, C.; Wang, Z. Coastal line feature extraction method for optic remote sensing images: A threshold-based morpho-logical approach. In Proceedings of the IEEE International Geoscience and Remote Sensing Symposium and 24th CanadianSymposium on Remote Sensing, Toronto, ON, Canada, 24–28 June 2002; Volume 3, pp. 3420–3422. [CrossRef]
49. Chen, J.S.; Han, Y.; Chen, G.; Zhang, J. Land utilization mapping in Guangdong Province based on integration of optical and SARremote sensing data. Shengtaixuebao 2013, 10, 7233–7242. [CrossRef]
50. Liu, D.; Li, B.; Liu, X.; Warrington, D.N. Monitoring land use change at a small watershed scale on the Loess Plateau, China:Applications of landscape metrics, remote sensing and GIS. Environ. Earth Sci. 2011, 10, 2229–2239. [CrossRef]
51. Zhang, F.; Tiyip, T.; Johnson, V.-C. Evaluation of land desertification from 1990 to 2010 and its causes in Ebinur Lake region,Xinjiang China. Environ. Earth Sci. 2014, 14, 5731–5745. [CrossRef]
52. Ouyang, X.; Xu, J.; Li, J.; Wei, X.; Li, Y. Land space optimization of urban-agriculture-ecological functions in the Changsha-Zhuzhou-Xiangtan Urban Agglomeration, China. Land Use Policy 2022, 7, 106–112. [CrossRef]
53. Huang, B.; Hu, X.; Cherubini, F. A benchmark of Europe climate response to land use transitions in regional climate modelsimulations. Earth Space Sci. Open Arh. 2019, 7, 600–606. [CrossRef]
54. Wahyuni, N.; Hasyim, A.; Soemarno, S. Dynamic of the Land Use and Land Cover Change in Banyuwangi Regency from1995–2019. J. Wasian 2021, 11, 121–132. [CrossRef]
55. Okin, G.-S.; Sala, O.-E.; Vivoni, E.-R.; Zhang, J.; Bhattachan, A. The Interactive Role of Wind and Water in Functioning of Drylands:What Does the Future Hold? BioScience 2018, 7, 670–677. [CrossRef]
56. Qi, Y.; Chang, Q.; Jia, K.; Liu, M.; Liu, J.; Chen, T. Temporal-spatial variability of desertification in an agro-pastoral transitionalzone of northern Shaanxi Province, China. Catena 2012, 8, 37–45. [CrossRef]
57. Bhatnagar, A.R. Desertification and Land Degradation Processes. Desertif. Land Degrad. 2022, 37, 75–112. [CrossRef]

Water 2022, 14, 1777 18 of 18
58. Potter, C.S.; Randerson, J.T.; Field, C.B.; Matson, P.A.; Vitousek, P.M.; Mooney, H.A.; Klooster, S.A. Terrestrial ecosystemproduction: A process model based on global satellite and surface data. Glob. Biogeochem. Cycles 1993, 31, 811–841. [CrossRef]
59. Sun, J.-K.; Yue, Y.; Niu, H.-P. Evaluation of NPP using three models compared with MODIS-NPP data over China. PLoS ONE2021, 16, e0252149. [CrossRef]
60. Ma, Z.; Xie, Y.; Jiao, J.; Li, L.; Wang, X. The Construction and Application of an Aledo-NDVI Based Desertification MonitoringModel. Procedia Environ. Sci. 2011, 7, 2029–2035. [CrossRef]
61. Wang, L.; Gan, H.; Zhou, C.; Zhang, H.; Lin, C.; Zhu, Q. Vegetation NPP distribution based on MODIS data and CASA model: Acase study in the Haihe River Basin, China. J. Opt. Microsyst. 2007, 6205X. [CrossRef]
62. Li, F.; Li, X.-R.; Zhang, J.-G.; Li, X.-J.; Su, J.-Q. Vegetation Alteration in Response to Highway Construction in the DesertifiedSteppe Zone of the Tengger Desert, North China. Arid. Land Res. Manag. 2012, 20, 59–78. [CrossRef]
63. Fu, W.-W.; Randerson, J.; Moore, J.-K. Climate change impacts on net primary production (NPP) and export production (EP)regulated by increasing stratification and phytoplankton community structure in CMIP5 models. Biogeosciences 2016, 20, 5151–5170.[CrossRef]
64. Zarei, A.; Chemura, A.; Gleixner, S.; Hoff, H. Evaluating the grassland NPP dynamics in response to climate change in Tanzania.Ecol. Indic. 2021, 125, 107600. [CrossRef]
65. Gao, Q.-Z.; Li, Y.; Wan, Y.-F.; Qin, X.-B.; Jiangcun, W.-Z.; Liu, Y.-H. Dynamics of alpine grassland NPP and its response to climatechange in Northern Tibet. Clim. Chang. 2009, 14, 515–528. [CrossRef]
66. Zhang, G.; Kang, Y.-M.; Han, G.-D.; Sakurai, K. Effect of climate change over the past half century on the distribution, extent andNPP of ecosystems of Inner Mongolia. Glob. Chang. Biol. 2011, 13, 377–389. [CrossRef]
67. Liu, W.-G.; Wei, W.-S.; Liu, Z.-H. NPP Change in Vegetation in Xinjiang under Climate Change. Arid. Land Geogr. 2009, 6, 206–211.[CrossRef]
Related Documents