This article was originally published in a journal published by Elsevier, and the attached copy is provided by Elsevier for the author’s benefit and for the benefit of the author’s institution, for non-commercial research and educational use including without limitation use in instruction at your institution, sending it to specific colleagues that you know, and providing a copy to your institution’s administrator. All other uses, reproduction and distribution, including without limitation commercial reprints, selling or licensing copies or access, or posting on open internet sites, your personal or institution’s website or repository, are prohibited. For exceptions, permission may be sought for such use through Elsevier’s permissions site at: http://www.elsevier.com/locate/permissionusematerial

Welcome message from author
This document is posted to help you gain knowledge. Please leave a comment to let me know what you think about it! Share it to your friends and learn new things together.
Transcript

This article was originally published in a journal published byElsevier, and the attached copy is provided by Elsevier for the
author’s benefit and for the benefit of the author’s institution, fornon-commercial research and educational use including without
limitation use in instruction at your institution, sending it to specificcolleagues that you know, and providing a copy to your institution’s
administrator.
All other uses, reproduction and distribution, including withoutlimitation commercial reprints, selling or licensing copies or access,
or posting on open internet sites, your personal or institution’swebsite or repository, are prohibited. For exceptions, permission
may be sought for such use through Elsevier’s permissions site at:
http://www.elsevier.com/locate/permissionusematerial
Autho
r's
pers
onal
co
py
Molecular and whole animal responses of grass shrimp,Palaemonetes pugio, exposed to chronic hypoxia
Marius Brouwer a,⁎, Nancy J. Brown-Peterson a, Patrick Larkin b, Vishal Patel c,Nancy Denslow c, Steve Manning a, Theodora Hoexum Brouwer a
a Department of Coastal Sciences, The University of Southern Mississippi, 703 East Beach Dr., Ocean Springs, MS 39564, USAb EcoArray Inc., 12085 Research Dr., Alachua, Florida 32615, USA
c Department of Physiological Sciences and Center for Environmental and Human Toxicology, University of Florida,PO Box 110885, Gainesville, FL 32611, USA
Received 28 July 2006; received in revised form 15 September 2006; accepted 20 October 2006
Abstract
Hypoxic conditions in estuaries are one of the major factors responsible for the declines in habitat quality. Previous studies examiningeffects of hypoxia on crustacea have focused on individual/population-level, physiological or molecular responses but have not consideredmore than one type of response in the same study. The objective of this study was to examine responses of grass shrimp, Palaemonetespugio, to moderate (2.5 ppmDO) and severe (1.5 ppmDO) chronic hypoxia at both the molecular and organismal levels. At the molecularlevel we measured hypoxia-induced alterations in gene expression using custom cDNAmacroarrays containing 78 clones from a hypoxia-responsive suppression subtractive hybridization cDNA library. Grass shrimp exposed to moderate hypoxia showminimal changes in geneexpression. The response after short-term (3 d) exposure to severe hypoxia was up-regulation of genes involved in oxygen uptake/transportand energy production, such as hemocyanin andATP synthases. Themajor response by day 7was an increase of transcription of genes in themitochondrial genome (16S rRNA, cytochrome b, cytochrome c oxidase I and III), and up-regulation of genes encoding proteins involvedin iron metabolism. By day 14 a dramatic reversal was seen, with a significant down-regulation of both mitochondrial and Fe-metabolismgenes. Validation of the macroarray results with q-PCR showed similar up- or down-regulation at multiple time points for 9 genes. At theorganismal level, our studies showed condition factor of grass shrimp exposed to severe chronic hypoxia was lower than normoxic controlsduring the first 7 days of the experiment, but there were no differences after that time point, or in grass shrimp exposed tomoderate hypoxia.Surprisingly, chronic hypoxia appeared to enhance grass shrimp reproduction; females exposed tomoderate hypoxia had higher fecunditiesand a greater percentage produced first, second and third broods than normoxic shrimp. The hypoxic shrimp took longer to produce theirfirst brood than the normoxic controls, although starved larvae from hypoxia-exposed mothers lived longer than normoxic control larvae.Shrimp exposed to severe hypoxia also had higher fecundity than normoxic controls, although embryos from hypoxia-exposed motherstook longer to hatch than normoxic control embryos. The gene expression and reproductive results suggest that expression levels of genesencoding proteins involved in oxygen and electron transport, energy, and iron metabolismmay be useful molecular indicators of both shortterm (b7 d) andmoderate (14 d) exposure to severe hypoxia, and that chronic hypoxia may have population-level impacts on grass shrimp.© 2006 Elsevier B.V. All rights reserved.
Keywords: Gene expression; Hemocyanin; Hypoxia; Macroarray; Mitochondrial genes; Reproduction
Journal of Experimental Marine Biology and Ecology 341 (2007) 16–31www.elsevier.com/locate/jembe
⁎ Corresponding author. Tel.: +1 228 872 4294; fax: +1 228 872 4204.E-mail address: [email protected] (M. Brouwer).
0022-0981/$ - see front matter © 2006 Elsevier B.V. All rights reserved.doi:10.1016/j.jembe.2006.10.049
Autho
r's
pers
onal
co
py
1. Introduction
Chronic and intermittent/cyclic hypoxia is of in-creasing concern as related to declines in habitat qualityin coastal and estuarine environments (Diaz and Rosen-berg, 1995; Buzzelli et al., 2002). Hypoxia can lead torapid as well as long-term cellular, physiological andbehavioral changes in a variety of organisms. Becauseof this, detection of short-term “rescue” responses andlong-term adaptive adjustments caused by hypoxic ex-posure is important in environmental research. Labo-ratory experiments have shown that, when possible, fishand crustaceans will avoid or move out of hypoxicconditions (Wannamaker and Rice, 2000; Wu et al.,2002). Physiologically, aquatic invertebrates respond tohypoxia by regulating oxygen transport by increasedcardiac output and hemoglobin/hemocyanin synthesisand expression (Mangum, 1997; Terwilliger, 1998; Paulet al., 2004). At the molecular level, differential geneexpression in fishes reflects the metabolic roles of tis-sues during hypoxia exposure (Gracey et al., 2001; Tonet al., 2002, 2003; van der Meer et al., 2005). Hypoxia-responsive genes and proteins have recently been iden-tified in blue crab, Callinectes sapidus (Brown-Petersonet al., 2005), suggesting molecular indicators showpromise for identifying signs of hypoxia exposure inestuarine crustacea. However, these molecular signalsby themselves do not provide information on the effectsof hypoxia on the individual and its ability to helpmaintain the population. Changes in reproductive para-meters in response to hypoxia have population levelconsequences (Wu, 2002), yet little is known about theeffects of hypoxia on reproductive fitness in estuarineorganisms routinely exposed to low oxygen conditions.Therefore, the aim of our studies was to link molecularindicators to reproductive endpoints. Understanding thepotential relationship between molecular and organis-mal endpoints could reveal new mechanisms of hypoxiatolerance/adaptation and may help predict ecologicallyrelevant consequences of hypoxia.
We used the hypoxia tolerant, estuarine grass shrimp,Palaemonetes pugio, to examine the effects of chronichypoxia on gene expression and reproduction. Thisspecies has been shown to be uniquely physiologicallyadapted to stressful tidal marsh habitats (Welsh, 1975).The use of a commonly occurring resident species inthese studies allows laboratory results to be more easilyrelated and applied to field measurements. In contrast toprevious studies which examined global responses ofhypoxia on gene expression (Gracey et al., 2001; Tonet al., 2002, 2003; van der Meer et al., 2005), we havetaken a directed approach to identify potentially hypoxia
responsive genes through suppression subtractive hy-bridization. We concentrated on those genes coding forproteins in the mitochondrial electron transport chain,ATP synthesis, oxygen transport, carbohydrate metab-olism, protein synthesis/repair/degradation, antioxidantdefense and lipid metabolism that are known to beresponsive to hypoxic stress (Hochachka et al., 1996;Czyzyk-Krzeska, 1997; Hochachka and Lutz, 2001).We found that the selected genes were significantly up-regulated or down-regulated when grass shrimp wereexposed to moderate or severe chronic hypoxia. Further-more, gene expression varied with duration and severityof dissolved oxygen exposure, and hypoxia exposureresulted in marked effects on shrimp egg production andlarval survival.
2. Materials and methods
2.1. Experimental animals, exposure methods andreproduction
Grass shrimp were collected in the vicinity of OceanSprings, Mississippi in Davis Bayou using dip nets.Adult females and males were segregated by sex basedon morphological differences in the first and secondpleopods (Meehean, 1936) and maintained in the labo-ratory at 15 psu and 27±1 °C for 7 to 30 d prior toexperimentation. During acclimation, shrimp were heldin 296 L tanks with static renewal of seawater. Duringacclimation and experimentation periods, grass shrimpwere fed brine shrimp nauplii once daily and commer-cial flake food once daily. During all acclimation andexperimentation periods, shrimp were held in artificialseawater (Fritz Super Salt, Fritz Industries, MesquiteTX) diluted to 15 psu with non-chlorinated well water.
Four separate laboratory experiments were conduc-ted to determine the effects of moderate (2.5 ppm dis-solved oxygen, DO) or severe (1.5 ppm DO) chronichypoxia on gene expression and reproduction in grassshrimp. The exposures were conducted in a modifiedintermittent flow-through system previously described(Manning et al., 1999). The flow through test systemprovided 1 L every 20 min (resulting in 3 completevolume additions/day) to each of the 35 L test aquariausing a separate water delivery partitioner for each of thenormoxic and hypoxic treatments. Oxygen levels werecontrolled by bubbling nitrogen into a holding tankwhich gravity fed to the partitioner used to deliver flow-through hypoxic seawater. A 24 h timer was used toactivate a solenoid valve which controlled nitrogenintroduction into the holding tank at intervals thatmaintained oxygen in the holding tank at a level which
17M. Brouwer et al. / Journal of Experimental Marine Biology and Ecology 341 (2007) 16–31
Autho
r's
pers
onal
co
py
resulted in the desired oxygen concentration whenintroduced into the test aquaria. An additional partitionerprovided flow-through normoxic seawater, and normoxicconditions were maintained by gently bubbling oxygeninto the cells of the water partitioner prior to delivery ofwater to the individual aquaria. In all experiments,oxygen was monitored continuously in one hypoxicflow-through aquaria, and DO, temperature and salinitywere measured in all flow-through aquaria once or twicedaily using a YSI Model 600XLM data sonde.
Grass shrimp were housed individually or in repro-ductive pairs in retention chambers constructed from10 cm Petri dish bottoms with a 15 cm high collar of500 μm nylon mesh and a 10 cm diameter disposablePetri dish lid to prevent escape. The mesh walls of thechamber facilitate flow of water into the chamber.Twenty-five chambers were placed into each of the 35 Lflow-through glass aquaria in a water bath held at 27±1 °C. The exchange of water within the chambers wasassured by fluctuating the water level within the aquaria8 to 10 cm (18.6 to 23.3 L) periodically with a self-starting siphon. This compartmentalization of the testorganisms precluded cannibalism and enabled individ-ual identification and the enumeration of molts of eachtest animal. Retention chambers were maintained at aminimum depth of approximately 7±1 cm and a maxi-mum depth of 10±1 cm.
2.2. Experiments 1, 2 and 3; sampling for gene expression
One moderate (experiment 1) and two severe (expe-riments 2 and 3) hypoxia studies were conducted follo-wing similar protocols to monitor gene expression aswell as reproductive effects of hypoxia. In all experi-ments, 310 shrimp were isolated individually into 12aquaria. Male (2 tanks×25 shrimp) or female (6 tanks×25 shrimp) shrimp were maintained in 8 hypoxic aquaria(2–3 ppm DO, moderate hypoxia or 1.5 ppm DO, severehypoxia). The normoxic shrimp (6–8 ppm DO) werehoused in 1 tank of 35 males and 3 tanks of 25 females.For each experiment, twenty female shrimp (10 nor-moxic, 10 hypoxic) were sampled at three time points(days 3, 7, and 14) during the course of the studies foranalysis of gene expression, for a total of 60 individualshrimp per experiment. An equal number of shrimpwere removed from each 35 L aquarium during eachsampling event to maintain similar densities of shrimp ineach aquarium. At the beginning of each experiment, 10female shrimp were removed from the test populationfor the day 0 assessment. Sample selection was madefrom females at each sampling time that had egg masses,and eggs were removed and counted. Males were not
analyzed for gene expression due to their small size andinsufficient tissue for analysis. Shrimp were anesthetizedin icewater, and the total length (TL,mm) and egg-freewetweight (ww, 0.1 mg) were recorded for each shrimp. Thethorax was removed and stored at −20 °C in RNA later(Ambion, Inc. Austin, TX) for gene expression analysis.
2.3. Experiments 1 and 2; reproductive sampling
At the end of two weeks under hypoxic or normoxicconditions, males and females from the moderate (ex-periment 1) and one severe (experiment 2) hypoxiaexposure were paired into reproductive groups to deter-mine differences in fecundity and survival of the F1generation based on hypoxia exposure. Hypoxic maleswere paired with hypoxic females in 16 individualbreeding chambers under continued hypoxic conditions(moderate or severe). All other mating pairs (hypoxicmales (16)×hypoxic females (16); hypoxic males (16)×normoxic females (16); normoxic males (16)×hypoxicfemales (16) and normoxic males (16)×normoxicfemales (16)) were kept under normoxic DO. Pairswere checked daily for egg production, and sacrificedafter the female was determined gravid for a minimumof 2 days. All eggs from each sacrificed female wereremoved and counted, and 20 viable eggs from eachfemale were incubated individually in sterile seawater in24-well polystyrene culture plates in a stirring incubatorat 27 °C and 60 rpm for 12 d. Culture plates containingembryos were observed daily and percent embryosurvival was determined by successful hatch by day10 post-isolation. The reproductive portion of the expe-riments lasted for 4 weeks. Sacrificed females from thereproductive portion of the study were processed forgene expression analysis as described above. At thetermination of the experiment, all remaining femalesthat had not produced egg masses were sacrificed andprocessed for gene expression analysis.
2.4. Experiment 4; multiple brood reproduction
A fourth experiment to determine the effects of mo-derate hypoxia on reproduction was undertaken to exa-mine the production and condition of multiple broodsproduced by the same female. For this experiment, 100male: female pairs of shrimp were isolated into each of 4moderate hypoxic (2–3 ppm DO) aquaria and 4 nor-moxic (6–8 ppm DO) aquaria for 10 weeks, resulting in25 reproductive pairs/aquaria. During the study, femaleswith egg masses were isolated into hatching chamberswithin their aquaria (5 cm petri dish with a 10 cm collarof 1 mm mesh) 7 to 8 d after first observation of the
18 M. Brouwer et al. / Journal of Experimental Marine Biology and Ecology 341 (2007) 16–31
Autho
r's
pers
onal
co
py
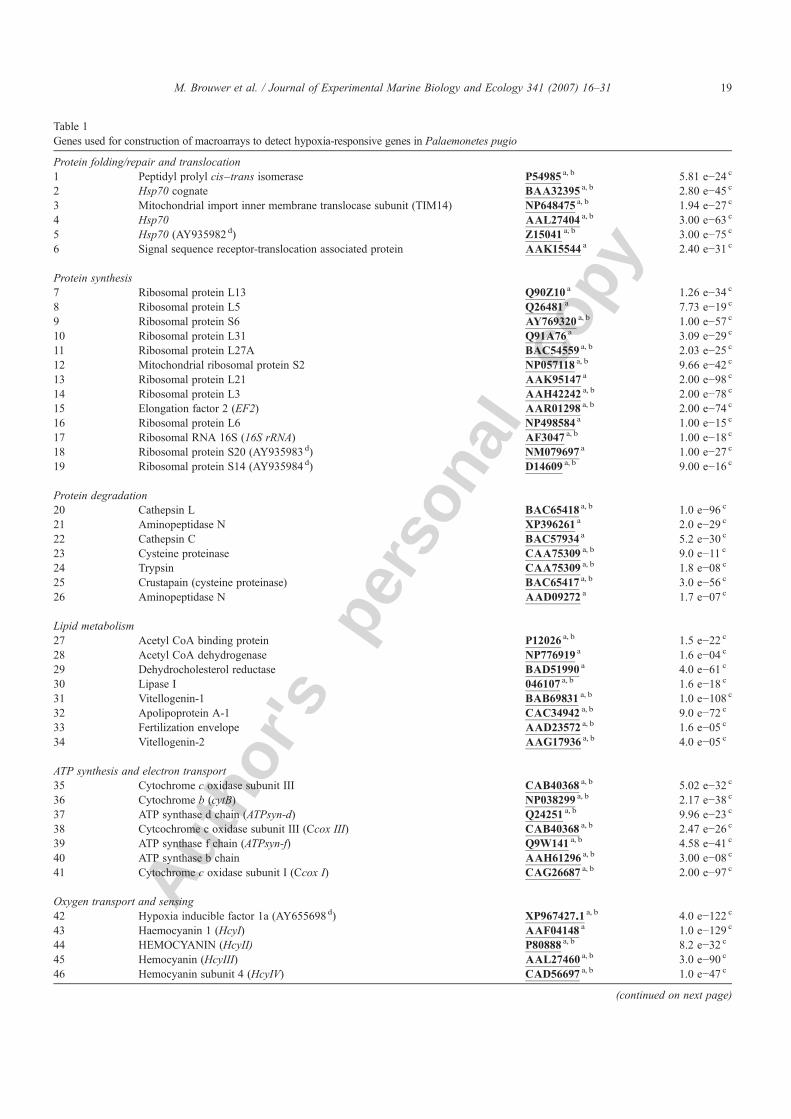
Table 1Genes used for construction of macroarrays to detect hypoxia-responsive genes in Palaemonetes pugio
Protein folding/repair and translocation1 Peptidyl prolyl cis–trans isomerase P54985 a, b 5.81 e−24 c
2 Hsp70 cognate BAA32395 a, b 2.80 e−45 c
3 Mitochondrial import inner membrane translocase subunit (TIM14) NP648475 a, b 1.94 e−27 c
4 Hsp70 AAL27404 a, b 3.00 e−63 c
5 Hsp70 (AY935982 d) Z15041 a, b 3.00 e−75 c
6 Signal sequence receptor-translocation associated protein AAK15544 a 2.40 e−31 c
Protein synthesis7 Ribosomal protein L13 Q90Z10 a 1.26 e−34 c
8 Ribosomal protein L5 Q26481 a 7.73 e−19 c
9 Ribosomal protein S6 AY769320 a, b 1.00 e−57 c
10 Ribosomal protein L31 Q91A76 a 3.09 e−29 c
11 Ribosomal protein L27A BAC54559 a, b 2.03 e−25 c
12 Mitochondrial ribosomal protein S2 NP057118 a, b 9.66 e−42 c
13 Ribosomal protein L21 AAK95147 a 2.00 e−98 c
14 Ribosomal protein L3 AAH42242 a, b 2.00 e−78 c
15 Elongation factor 2 (EF2) AAR01298 a, b 2.00 e−74 c
16 Ribosomal protein L6 NP498584 a 1.00 e−15 c
17 Ribosomal RNA 16S (16S rRNA) AF3047 a, b 1.00 e−18 c
18 Ribosomal protein S20 (AY935983d) NM079697 a 1.00 e−27 c
19 Ribosomal protein S14 (AY935984d) D14609 a, b 9.00 e−16 c
Protein degradation20 Cathepsin L BAC65418 a, b 1.0 e−96 c
21 Aminopeptidase N XP396261 a 2.0 e−29 c
22 Cathepsin C BAC57934 a 5.2 e−30 c
23 Cysteine proteinase CAA75309 a, b 9.0 e−11 c
24 Trypsin CAA75309 a, b 1.8 e−08 c
25 Crustapain (cysteine proteinase) BAC65417 a, b 3.0 e−56 c
26 Aminopeptidase N AAD09272 a 1.7 e−07 c
Lipid metabolism27 Acetyl CoA binding protein P12026 a, b 1.5 e−22 c
28 Acetyl CoA dehydrogenase NP776919 a 1.6 e−04 c
29 Dehydrocholesterol reductase BAD51990 a 4.0 e−61 c
30 Lipase I 046107 a, b 1.6 e−18 c
31 Vitellogenin-1 BAB69831 a, b 1.0 e−108 c
32 Apolipoprotein A-1 CAC34942 a, b 9.0 e−72 c
33 Fertilization envelope AAD23572 a, b 1.6 e−05 c
34 Vitellogenin-2 AAG17936 a, b 4.0 e−05 c
ATP synthesis and electron transport35 Cytochrome c oxidase subunit III CAB40368 a, b 5.02 e−32 c
36 Cytochrome b (cytB) NP038299 a, b 2.17 e−38 c
37 ATP synthase d chain (ATPsyn-d) Q24251 a, b 9.96 e−23 c
38 Cytcochrome c oxidase subunit III (Ccox III) CAB40368 a, b 2.47 e−26 c
39 ATP synthase f chain (ATPsyn-f) Q9W141 a, b 4.58 e−41 c
40 ATP synthase b chain AAH61296 a, b 3.00 e−08 c
41 Cytochrome c oxidase subunit I (Ccox I) CAG26687 a, b 2.00 e−97 c
Oxygen transport and sensing42 Hypoxia inducible factor 1a (AY655698d) XP967427.1 a, b 4.0 e−122 c
43 Haemocyanin 1 (HcyI) AAF04148 a 1.0 e−129 c
44 HEMOCYANIN (HcyII) P80888 a, b 8.2 e−32 c
45 Hemocyanin (HcyIII) AAL27460 a, b 3.0 e−90 c
46 Hemocyanin subunit 4 (HcyIV) CAD56697 a, b 1.0 e−47 c
(continued on next page)
19M. Brouwer et al. / Journal of Experimental Marine Biology and Ecology 341 (2007) 16–31
Autho
r's
pers
onal
co
py
eggs. The hatching chamber was placed in a largerretention chamber of smaller mesh (200 μm) to retainhatched larvae and separate them from the female whenthe offspring hatched. Following hatch, the female wasreturned to the original retention chamber with her mate.This method allowed for assessment of multiple broodsfrom each reproductive pair. All hatched larvae werecounted, and approximately twenty-five larvae fromeach female were isolated into a 200 μm mesh chamberfor survival assessment. Normoxic and hypoxic larvaefrom each female and each brood were kept under
normoxic conditions and monitored twice daily untildeath from starvation. Larvae were not fed duringthis time to determine whether yolk content may havechanged with subsequent broods and to determine ifsurvival differed between normoxic and hypoxic broods.
2.5. Cloning, subtractive hybridization and macroarraysof grass shrimp
Eight genes (Table 1, superscript c), including heatshock protein (Hsp70), mitochondrial and cytosolic
Carbohydrate metabolism
47 Drosophila melanogaster CG1637-PA, isoform A NP727464 a 8.8 e−04 c
48 Amylase I CAB65552 a, b 1.0 e−129 c
49 Alpha-amylase preproprotein AAO72321 a 2.0 e−22 c
50 Acid beta glucosidase P17439 a, b 2.4 e−31 c
51 PEP carboxykinase CAB85964 a, b 1.0 e−108 c
52 Chitinase AAN74647 a, b 2.1 e−21 c
53 Glycogenin-1 P13280 a 2.6 e−12 c
Cell structure/motility and muscle contraction54 Troponin C gamma NP001011651 a, b 3.0 e−60 c
55 Alpha-1-tubulin AAC47522 a 6.0 e−87 c
56 Cellular myosin A71144 a 0 c
57 Fast myosin heavy chain AAA17371 a 3.0 e−40 c
58 Troponin I, fast skeletal muscle P05547 a 1.0 e−13 c
59 Beta-actin (AY935989 d) AY626840 a, b 4.0 e−139 c
Metal binding and anti-oxidant60 Heme binding protein NP956492.1 a, b 4.0 e−11 c
61 Ferritin subunit XP624076 a, b 4.0 e−9 c
62 Cytosolic Mn-superoxide dismutase (cyt-MnSOD) (AY211084 d) DQ073104 a, b 3.0 e−88 c
63 Mitochondrial Mn-superoxide dismutase(mit-MnSOD) (AY935986 d)
AE017283 a, b 4.0 e−142 c
64 Cd metallothionein 1 (CdMT1) (AY935987 d) AAB5227.1 a 5.0 e−18 c
Blood Coagulation and Immune function65 PmAV S78774 a, b 3.9 e−05 c
66 Clottable protein AAF19002 a 3.4 e−37 c
67 Beta-1,3-glucan binding protein AAM21213 a, b 2.0 e−51 c
68 Coagulation factor V and VIII CAC94896 a 2.0 e−17 c
69 Complement C3-S BAA36621 a 2.0 e−55 c
70 Fibrinogen A AAH41754 a 1.2 e−41 c
Miscellaneous functions71 Cutical protein AMP4 P81388 a 3.99 e−10 c
72 Ornithine decarboxylase antizyme P70112 a 2.10 e−12 c
73 H3 histone, family 3B XP235304 a 8.60 e−44 c
74 Fibrillarin NP523817 a 3.00 e−66 c
75 Orn decarboxylase antizyme P55814 a, b 1.80 e−06 c
76 Glutamine repeat protein-1 NP032158 a, b 3.80 e−07 c
Genes are arranged by biological function.a Closest match as identified by BLASTX search.b Significantly up-regulated or down-regulated based on macroarray analysis with all normalization techniques.c e(xpect) values (Karlin and Altschul, 1990).d GenBank nucleotide accession numbers: grass shrimp sequences.
Table 1 (continued )
20 M. Brouwer et al. / Journal of Experimental Marine Biology and Ecology 341 (2007) 16–31
Autho
r's
pers
onal
co
py
manganese superoxide dismutase (mit-MnSOD and cyt-MnSOD), Cd metallothionein (CdMt1), hypoxia induc-ible factor 1α (hif-1α), β-actin and ribosomal proteinsS14 and S20 were cloned and sequenced from grassshrimp thorax tissue containing hepatopancreas usingRT-PCR. An additional 68 potentially hypoxia respon-sive genes (Table 1, superscript a) were identified fromtwo suppression subtractive hybridizations (SSH) per-formed by EcoArray Inc, Alachua, FL. Subtractedlibraries were constructed with poly-A mRNA, con-verted to cDNA, that was isolated from day 0 normoxic(control) and day 3 and 5 moderate hypoxic grassshrimp and with mRNA from day 0 controls and day 3severe hypoxic shrimp. Subtractive hybridizations wereperformed in both directions on these samples in order toobtain up-regulated and down-regulated genes. Subtrac-tive hybridizations were performed using the Clontech(Palo Alto, CA) SSH kit following the manufacturer'srecommendations. The resultant pool of cDNA cloneswere shotgun ligated into pGEM T-Easy cloning vector(Promega, Madison, WI), transformed into DH5α cells,and plated onto Luria-Bertani (LB) agar plates contain-ing ampicillin and oxacillin (100 μg/mL each). Recom-binant colonies were picked from the plates, plasmidswere purified and inserts were sequenced.
The resulting 76 genes produced from cloning andSSH were PCR amplified and then robotically spotted induplicate onto neutral nylon membrane macroarraystogether with various controls, including exogenousArabidopsis “spiking” genes, as previously described(Larkin et al., 2003). Genes were arranged on the mem-brane by functional group (Table 1). Total hepatopan-creatic RNA was extracted from 8–10 grass shrimp pertreatment group using Stat-60 (Tel-Test, Friendswood,TX). Genomic DNA was removed by DNase treatmentand total RNA was transcribed into radiolabeled cDNAand hybridized to the membranes. Background subtrac-tion for each cDNA spot was performed as previouslydescribed by Larkin et al. (2003). The values were thenlog2 transformed and normalized three different ways(to the mean and median intensity of the array data, aswell as α-tubulin). Fold change values, calculated fromthe mean values of normalized hypoxic and normoxicshrimp for each time point were used to determine whichgene transcripts were up-regulated or down-regulated byhypoxia.
To assess consistency of gene signal intensities on themacroarrays, a pooled sample of extracted RNA wasreverse transcribed into labeled cDNA and hybridized to4 separate membranes. Values were log2 transformedand normalized to the median array intensity, and thecoefficient of variation among the 4 membranes was
determined for each gene. Quality of macroarrays wasfurther evaluated by determining correlation coefficientsand slopes of scatter plots of duplicate signal intensitiesfor all macroarray combinations.
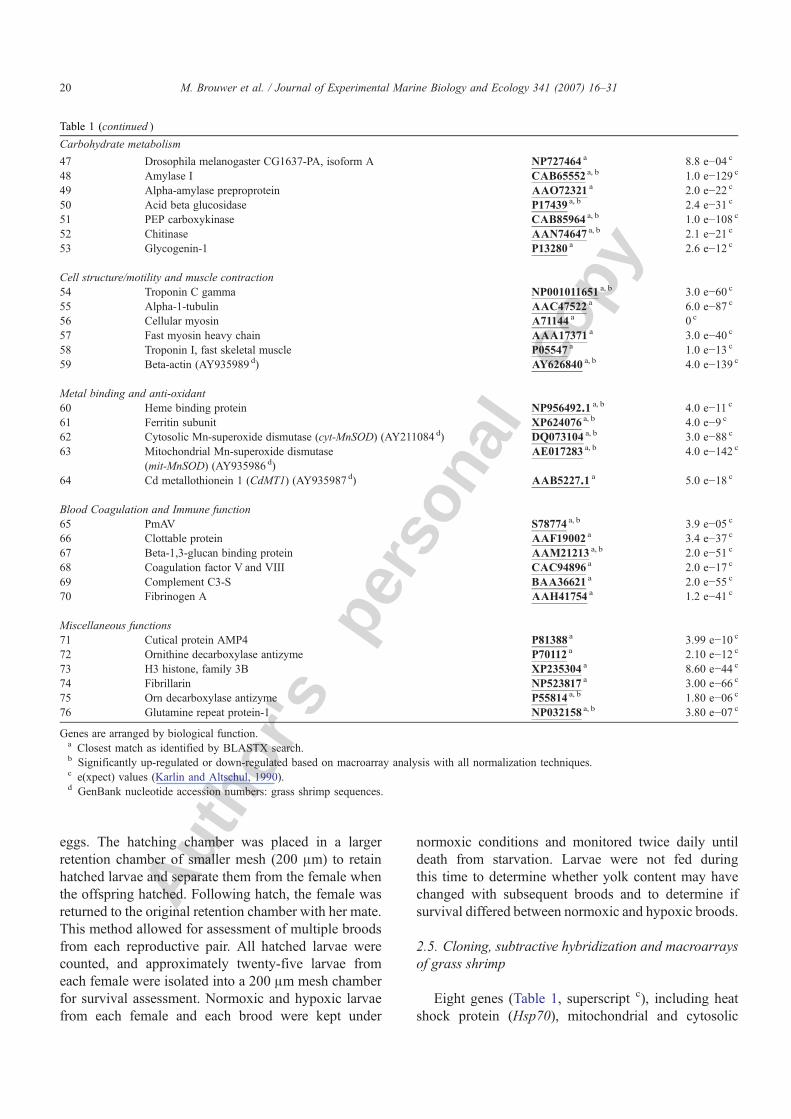
2.6. Real-time PCR
To validate results from the gene arrays, real-timequantitative RT-PCR (q-PCR) was run for genes thatshowed significant up-or down-regulation on the macro-arrays. These included hemocyanin (3 separate subunits),ATP synthase f chain, cytochrome c oxidase (I and III),cytochrome b, 16S rRNA and ferritin. The q-PCR was
Table 2Sequences and percent amplification efficiency of primers used forreal-time PCR validation of macroarrays
Gene Forward primer-5′ Reverse primer-5′ Efficiency
Haemocyanin 1(HcyI)
AAA CCA GTAGAA GAG GGCTTT GCTa andAGG GCT TTGCTC CAC ACACb
AGG ACG GGCAGG GAA TTCa
and TGT CACGAA CTC TTGCTA CTC Cb
94% 92%
ATP Synthase f(ATPsyn-f)
ATG GAC CGAGAC TTT CCCAGA Ta and CGCCGA AGC ATTGGA GGT Gb
AAT TTC CTTCTC CAC CCTCCT Ta and AACTGC CCA TAAGGA GCG AATCb
94%101%
α-tubulin AGA CTG TGCCTT CAT GGTCGA Ta and GCAGGT CCG CTGTTG TTGb
CGA TGA GACGGT TCA AGTTGG Ta and AGTTGG TGT AGGTGG GTC TCb
94% 94%
HEMOCYANIN(HcyII)
GCA GTC ACTGAT GGA GAATAT Gb
GGA TAC GGCGAT CAA GAGGb
98%
Hemocyanin(HcyIII)
ATA CAG TCCCAA TGC TCAATA Cb
AAA CCA GGGTCA CGA GTGb
92%
Cytochromec oxidase I(CcoxI)
CGG AGC GTGAGC AGG AATAGb
CGA AGG CGTGGG CTG TAACb
94%
Cytochromec oxidase III(CcoxIII)
TTG TTG CCACAG GAT TCCATGb
CCA GGC TGCTGC TTC AAAGb
98%
Cytochromeb (CytB)
ACC CTT TTAACG CCA TACATA Cb
CCT TAT TTGTCT GGG ATAGAG Cb
91%
16S rRNA TTG TAA GGGTAG CTG TGTGb
TAC GCT GTTATC CCT AAAGb
96%
Ferritin CGT GGT GGAAGC ATC AATGb
GGT TCA TACTCT TGG TCACTT Cb
103%
Primers designed using aPrimer Express Software or bBIO-RADiCycler iQ Beacon Designer software.
21M. Brouwer et al. / Journal of Experimental Marine Biology and Ecology 341 (2007) 16–31
Autho
r's
pers
onal
co
py
also used to validate the utility of α-tubulin for use innormalizing the array data. Primers for these genes weredesigned using Primer Express software (Applied Bio-systems, Foster City, CA) and BIO-RAD iCycler iQBeacon Designer software. Sequences for these primersare shown in Table 2.
Each primer set was validated for specificity andefficiency by running dissociation and standard curves,respectively. Standard curves included data from aminimum of four serially diluted cDNA samples. Theefficiency of amplification for each primer set is shownin Table 2. The amplification efficiency of 18S rRNA,which was used as a normalizing gene, was 94%.
Different protocols were used for q-PCR validationof the moderate and severe hypoxia treatments. For themoderate hypoxia samples, DNase-treated (DNA-free;Ambion, Inc., Austin, TX) total RNA from hypoxic andcontrol grass shrimp was reverse transcribed to cDNAusing random hexamers and Multiscript reverse tran-scriptase according to the manufacturer's instructions(Applied Biosystems). The q-PCR was performed in25 μl reactions that contained 100 ng shrimp cDNA,12.5 μl SYBR green master mix (Applied BiosystemsP/N 4309155; which included SYBR green, buffer, Taqpolymerase, and dNTPS), and 50 nM each of the for-ward and reverse primers. The PCRs using 18S rRNAprimers were also performed in a 25 μl reaction andcontained 0.5 ng cDNA, 12.5 μl SYBR green mastermix, and 50 nM each of the 18S rRNA forward andreverse primers (Applied Biosystems). For all of thesamples, minus RT controls were run to ensure theremoval of all contaminating genomic DNA.AnAppliedBiosystems 7500 thermocycler was used for the PCRreactions with the following cycle parameters: 1 cycle of50 °C for 2min, 1 cycle of 95 °C for 10min and 40 cyclesof [95 °C for 15 s and 60 °C for 60 s].
For validation of the severe hypoxia samples, DNase-treated (DNA-free, Ambion,) 1 μg total RNA fromhypoxic and control grass shrimp was reverse tran-scribed to cDNA using random hexamers (Ambion) andSuperscript II Reverse Transcriptase according to themanufacturer's instructions (Invitrogen). The cDNAwas diluted 40× with sterile water for q-PCR. q-PCRwas performed in 50 μl reactions that contained 25 μl iQSYBR Green Supermix, (BioRad, cat # 170-8884,which included SYBR Green 1, buffer, iTaq DNApolymerase and d-NTP's), 400 nM each of the forwardand reverse primers and 2 μl of the diluted cDNA.Minus RT controls were run for some samples to ensurethe removal of all contaminating DNA, and in all casesno contaminating DNAwas found. A BIO-RAD I CycleriQ Multi-Color Real Time PCR Detection System was
used for the PCR reactions with the following cycleparameters: 1 cycle of 95 °C for 2 min, 50 cycles of[95 °C for 15 s and 58 °C for 15 s].
Each sample was run in duplicate for both q-PCRprotocols using 5–10 hypoxic or normoxic shrimp. Theaveraged duplicate Ct value (PCR cycle threshold wheretarget amplification is first detected) was normalized tomeasured 18S rRNA Ct values for each sample. 18SrRNAvalues did not fluctuate between treatment groups(data not shown). The comparative Ct (2
−ΔΔCt) methodof analysis was used to determine changes in geneexpression between controls and treated samples (Wongand Medrano, 2005).
2.7. Data analysis
Throughout all experiments, each shrimp in its indi-vidual chamber is considered a replicate for both geneexpression and reproduction (n=10) because maintain-ing hundreds of shrimp in individual experimental unitsat the same DO is practically impossible. Additionally,the flow-through system and high volume of waterexchange in each experimental tank limited interactionthrough chemical cues among shrimp in the same tank,whereas the separation into individual retention cham-bers prevented physical interactions.
A length-weight relationship was calculated for allgrass shrimp sampled (ww=14.84+3.741TL, r2=0.863,pb0.001). The slope of this line was used to calculatecondition factor (K) for each individual (K=ww/TL3.74×100,000; see Murphy and Willis, 1996). There was asignificant relationship between shrimp length and num-ber of eggs (TL=8.39 eggnum — 90.63, r2=0.33,p=0.002). Therefore, the relative fecundity of grassshrimp was calculated by dividing the number of eggs orhatched larvae by the ww of the female (expressed as# eggs/g), and is used in all analyses. Reproductive groupsfrom the moderate and severe hypoxia studies werecombined into 3 groups, based on the DO history of thefemales; females continuously exposed to hypoxia (HH),females continuously exposed to normoxia (NN) andfemales exposed to hypoxia the first 2 weeks of the studybut allowed to mate in normoxia (HN). Differences inrelative fecundity, K, percentage of hatched embryos, anddays to hatch among the 3 treatment groups for the mo-derate and severe hypoxia studies were tested usingANOVA; differences among groups were evaluated withthe Bonferroni post-hoc test. Differences in K, larvalsurvival, interbrood interval, and larval survival betweennormoxic and moderate hypoxic females in the multiplebrood study were tested using student's t-test. Percentagedatawere arcsine square root transformed prior to analysis
22 M. Brouwer et al. / Journal of Experimental Marine Biology and Ecology 341 (2007) 16–31
Autho
r's
pers
onal
co
py
(Sokal and Rohlf, 1995). Data were tested for homoge-neity of variance (Levene's test) and normality ofdistribution (1 sample Kolmogorov–Smirnoff test) andwere log-transformed if necessary to meet these assump-tions. Student's t-test and ANOVAwere performed withSPSS (version 11.5). Data were considered significant ifp≤0.05.
Gene expression data from macroarrays normalized tothe array mean, median, and α-tubulin, and q-PCRdata normalized to 18S rRNA were analyzed with Stu-dent's t-test to determine differences between normoxicand hypoxic grass shrimp for each time point in themoderate and severe hypoxia experiments. Only shrimpcontinuously exposed to normoxia or moderate/severehypoxia were used for these analyses; shrimp from the HNreproductive group were not included in these ana-lyses. Changes in gene expression for both macroarraysand q-PCR were considered significant if p≤0.05. Thegene expression data are plotted as fold change, and thuserror bars for the control and treated samples are not shown.
3. Results
3.1. Grass shrimp survival and condition
Survival of grass shrimp during the moderate hypoxiaexperiment was excellent; only 1 out of 225 females diedduring the course of the 46 d study. Mortality during the14 d exposure period of severe hypoxia was 2.7% forboth hypoxic and normoxic females. During the 4.5 weekreproductive portion of the severe hypoxia study, femalemortality was 22.6% in hypoxia and 10.3% in normoxia;no males died during the course of this study. Femalemortality was higher during the 10 week multiple broodmoderate hypoxia experiment, 32% in normoxia and 15%in hypoxia.
There were no significant differences in length orweight between normoxic and hypoxic grass shrimpduring the 14 d exposure period or subsequent reproduc-tive periods for any of the experiments. There were alsono differences in condition factor between normoxic andhypoxic females for either of the moderate hypoxia stu-dies. However, after 3 and 7 d exposure to severe hypoxia,condition factor of normoxic females was higher than thatof hypoxic females ( p=0.049 and 0.052, respectively).There were no additional significant differences in con-dition factor as the study progressed. This suggests severe,chronic hypoxia may have a short-term effect on grassshrimp condition, but they are able to adjust and com-pensate within 1 week of exposure.
Shrimp in both normoxic and hypoxic exposuresroutinely molted every 5–8 d. However, differences in
molting frequency between normoxic and hypoxicshrimp were not quantified since shrimp held in nor-moxia rapidly consumed their molts (often in b24 h) andwe feel that molting frequency in normoxic shrimp isthus underrepresented in our observations. It is note-worthy, however, that shrimp held in both moderate andsevere hypoxia rarely consumed their molts, whichoften persisted in the cages for 2–3 d.
3.2. Gene expression
Forty-eight of the original 76 potentially hypoxia-responsive genes showed significant up-or down-regula-tion for all 3 normalization methods (mean, median, α-tubulin) for at least one time point (Table 1, superscript d).Data presented here represent these most robust genes,and are displayed using α-tubulin normalization, sincethis gene was determined to be a consistent normalizationgene (see real-time PCR section below).
Tests of variability of gene signal intensities on themacroarrays due to experimental error showed a coef-ficient of variation ≤20% for the robust genes. Com-parisons among the membranes showed slopes of scatterplots of signal intensities of corresponding genes for allsix macroarray combinations ranging from 0.835 to
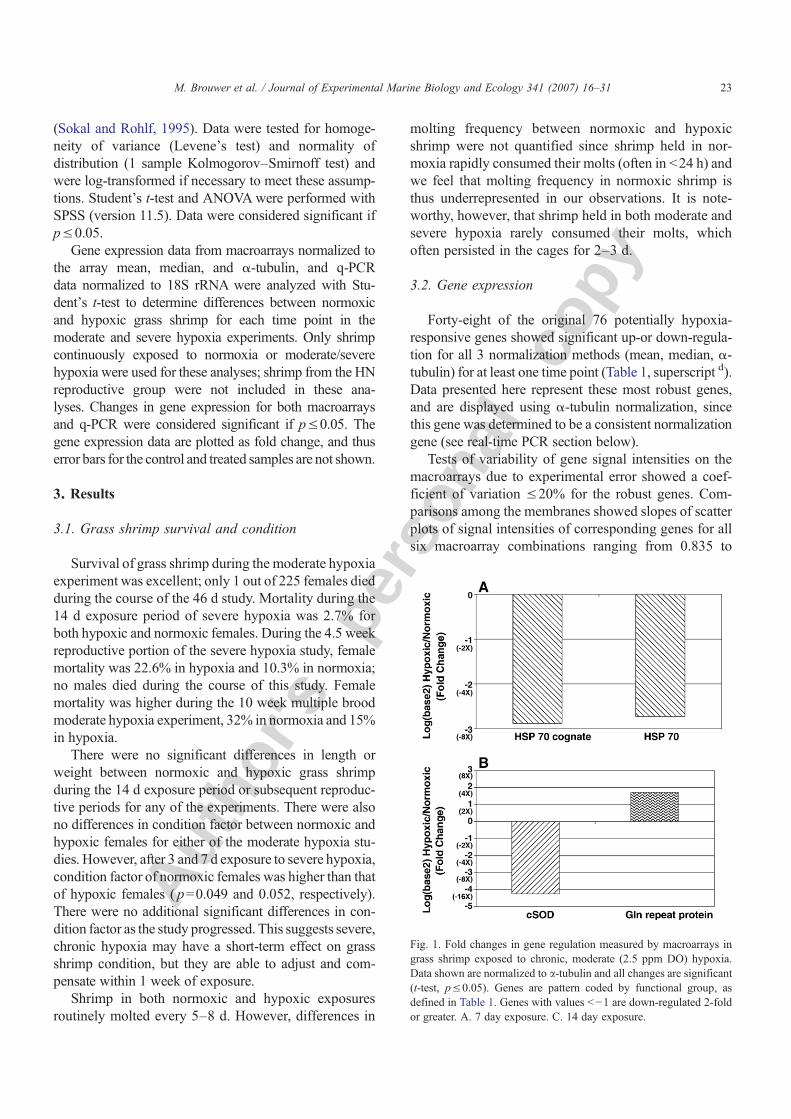
Fig. 1. Fold changes in gene regulation measured by macroarrays ingrass shrimp exposed to chronic, moderate (2.5 ppm DO) hypoxia.Data shown are normalized to a-tubulin and all changes are significant(t-test, p≤0.05). Genes are pattern coded by functional group, asdefined in Table 1. Genes with values b−1 are down-regulated 2-foldor greater. A. 7 day exposure. C. 14 day exposure.
23M. Brouwer et al. / Journal of Experimental Marine Biology and Ecology 341 (2007) 16–31
Autho
r's
pers
onal
co
py
0.955 and r2 values from 0.83 to 0.95 indicating goodconsistency of signal intensity values among membranes.In addition, a plot ofmean intensity for each gene from thenormoxic controls (n=23) of the moderate hypoxia expo-sure experiment against the mean intensity of corres-ponding genes from the controls of the severe hypoxiaexperiment (n=33) had a slope of 0.891 and r2 value of0.792, indicating good consistency of signal intensityvalues among shrimp.
There were no significant changes in gene expressionafter 3 d exposure to moderate, chronic hypoxia. How-ever, after 7 d exposure, there was significant down-regulation of 2HSP70 genes (Fig. 1A). After 14 d exposureto moderate, chronic DO, there was a significant 19-folddecrease in expression of the gene encoding the anti-oxidant enzyme cytosolic Mn Superoxide Dismutase(cSOD), which in crustacea has replaced the more com-monly found cytosolic Cu, Zn Superoxide Dismutase(Brouwer et al., 2003, 1997). Expression of one othergene, which shows weak sequence similarity (E value=3.83−07) with amouse gene encoding for glutamine repeatprotein, is up-regulated (Fig. 1B). It appears in general thatno genes are robust indicators of moderate chronic DOexposure, with the possible exception of cSOD.
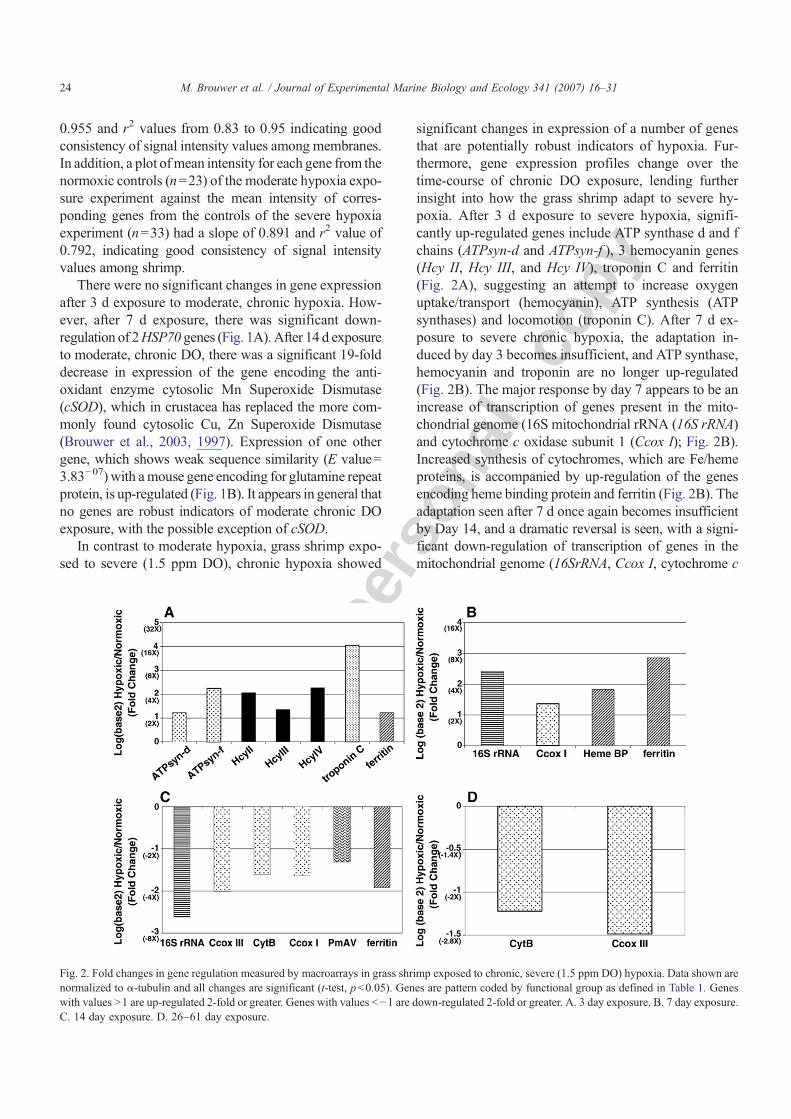
In contrast to moderate hypoxia, grass shrimp expo-sed to severe (1.5 ppm DO), chronic hypoxia showed
significant changes in expression of a number of genesthat are potentially robust indicators of hypoxia. Fur-thermore, gene expression profiles change over thetime-course of chronic DO exposure, lending furtherinsight into how the grass shrimp adapt to severe hy-poxia. After 3 d exposure to severe hypoxia, signifi-cantly up-regulated genes include ATP synthase d and fchains (ATPsyn-d and ATPsyn-f ), 3 hemocyanin genes(Hcy II, Hcy III, and Hcy IV), troponin C and ferritin(Fig. 2A), suggesting an attempt to increase oxygenuptake/transport (hemocyanin), ATP synthesis (ATPsynthases) and locomotion (troponin C). After 7 d ex-posure to severe chronic hypoxia, the adaptation in-duced by day 3 becomes insufficient, and ATP synthase,hemocyanin and troponin are no longer up-regulated(Fig. 2B). The major response by day 7 appears to be anincrease of transcription of genes present in the mito-chondrial genome (16S mitochondrial rRNA (16S rRNA)and cytochrome c oxidase subunit 1 (Ccox I); Fig. 2B).Increased synthesis of cytochromes, which are Fe/hemeproteins, is accompanied by up-regulation of the genesencoding heme binding protein and ferritin (Fig. 2B). Theadaptation seen after 7 d once again becomes insufficientby Day 14, and a dramatic reversal is seen, with a signi-ficant down-regulation of transcription of genes in themitochondrial genome (16SrRNA, Ccox I, cytochrome c
Fig. 2. Fold changes in gene regulation measured by macroarrays in grass shrimp exposed to chronic, severe (1.5 ppm DO) hypoxia. Data shown arenormalized to α-tubulin and all changes are significant (t-test, pb0.05). Genes are pattern coded by functional group as defined in Table 1. Geneswith values N1 are up-regulated 2-fold or greater. Genes with values b−1 are down-regulated 2-fold or greater. A. 3 day exposure. B. 7 day exposure.C. 14 day exposure. D. 26–61 day exposure.
24 M. Brouwer et al. / Journal of Experimental Marine Biology and Ecology 341 (2007) 16–31
Autho
r's
pers
onal
co
py
oxidase III (Ccox III) and cytochrome b (cytB)) as well asferritin (Fig. 2C). Finally,PmAV, a novel gene shown to beimportant in virus resistance in the shrimp Penaeusmonodon, is also down-regulated after 14 d exposure tosevere hypoxia, suggesting a potential for increased sus-ceptibility to disease with chronic severe hypoxia expo-sure. Prolonged 26–61 d exposure to severe hypoxiashows continued down-regulation of mitochondrial pro-teins Ccox III and cytB (Fig. 2D). Thus, mitochondrialgenes such as 16S rRNA, cytB, Ccox I and Ccox III aswell as hemocyanin and Fe-proteins appear to providepromise as indicators of chronic severe hypoxia exposurein grass shrimp.
3.3. Real-time PCR validation
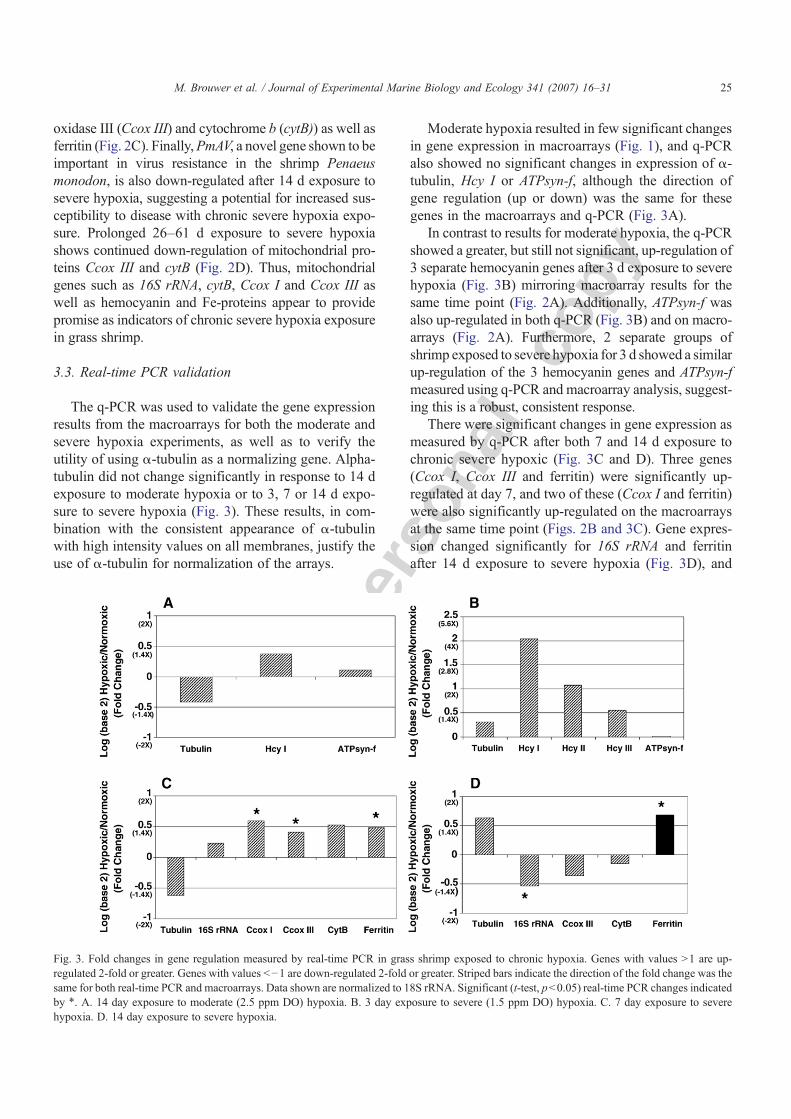
The q-PCR was used to validate the gene expressionresults from the macroarrays for both the moderate andsevere hypoxia experiments, as well as to verify theutility of using α-tubulin as a normalizing gene. Alpha-tubulin did not change significantly in response to 14 dexposure to moderate hypoxia or to 3, 7 or 14 d expo-sure to severe hypoxia (Fig. 3). These results, in com-bination with the consistent appearance of α-tubulinwith high intensity values on all membranes, justify theuse of α-tubulin for normalization of the arrays.
Moderate hypoxia resulted in few significant changesin gene expression in macroarrays (Fig. 1), and q-PCRalso showed no significant changes in expression of α-tubulin, Hcy I or ATPsyn-f, although the direction ofgene regulation (up or down) was the same for thesegenes in the macroarrays and q-PCR (Fig. 3A).
In contrast to results for moderate hypoxia, the q-PCRshowed a greater, but still not significant, up-regulation of3 separate hemocyanin genes after 3 d exposure to severehypoxia (Fig. 3B) mirroring macroarray results for thesame time point (Fig. 2A). Additionally, ATPsyn-f wasalso up-regulated in both q-PCR (Fig. 3B) and on macro-arrays (Fig. 2A). Furthermore, 2 separate groups ofshrimp exposed to severe hypoxia for 3 d showed a similarup-regulation of the 3 hemocyanin genes and ATPsyn-fmeasured using q-PCR and macroarray analysis, suggest-ing this is a robust, consistent response.
There were significant changes in gene expression asmeasured by q-PCR after both 7 and 14 d exposure tochronic severe hypoxic (Fig. 3C and D). Three genes(Ccox I, Ccox III and ferritin) were significantly up-regulated at day 7, and two of these (Ccox I and ferritin)were also significantly up-regulated on the macroarraysat the same time point (Figs. 2B and 3C). Gene expres-sion changed significantly for 16S rRNA and ferritinafter 14 d exposure to severe hypoxia (Fig. 3D), and
Fig. 3. Fold changes in gene regulation measured by real-time PCR in grass shrimp exposed to chronic hypoxia. Genes with values N1 are up-regulated 2-fold or greater. Genes with values b−1 are down-regulated 2-fold or greater. Striped bars indicate the direction of the fold change was thesame for both real-time PCR and macroarrays. Data shown are normalized to 18S rRNA. Significant (t-test, pb0.05) real-time PCR changes indicatedby ⁎. A. 14 day exposure to moderate (2.5 ppm DO) hypoxia. B. 3 day exposure to severe (1.5 ppm DO) hypoxia. C. 7 day exposure to severehypoxia. D. 14 day exposure to severe hypoxia.
25M. Brouwer et al. / Journal of Experimental Marine Biology and Ecology 341 (2007) 16–31
Autho
r's
pers
onal
co
py
both these genes were significantly down-regulated onthe macroarrays (Fig. 2C). There was only one instanceof disagreement among all genes tested using q-PCRand macroarray analysis. Ferritin was up-regulated asmeasured by q-PCR and down-regulated as measuredby macroarrays after 14 d exposure to severe hypoxia.Overall, the similarity in response of 9 genes at multipletime points using both q-PCR and macroarrays validatesthe macroarray gene expression results.
3.4. Reproduction
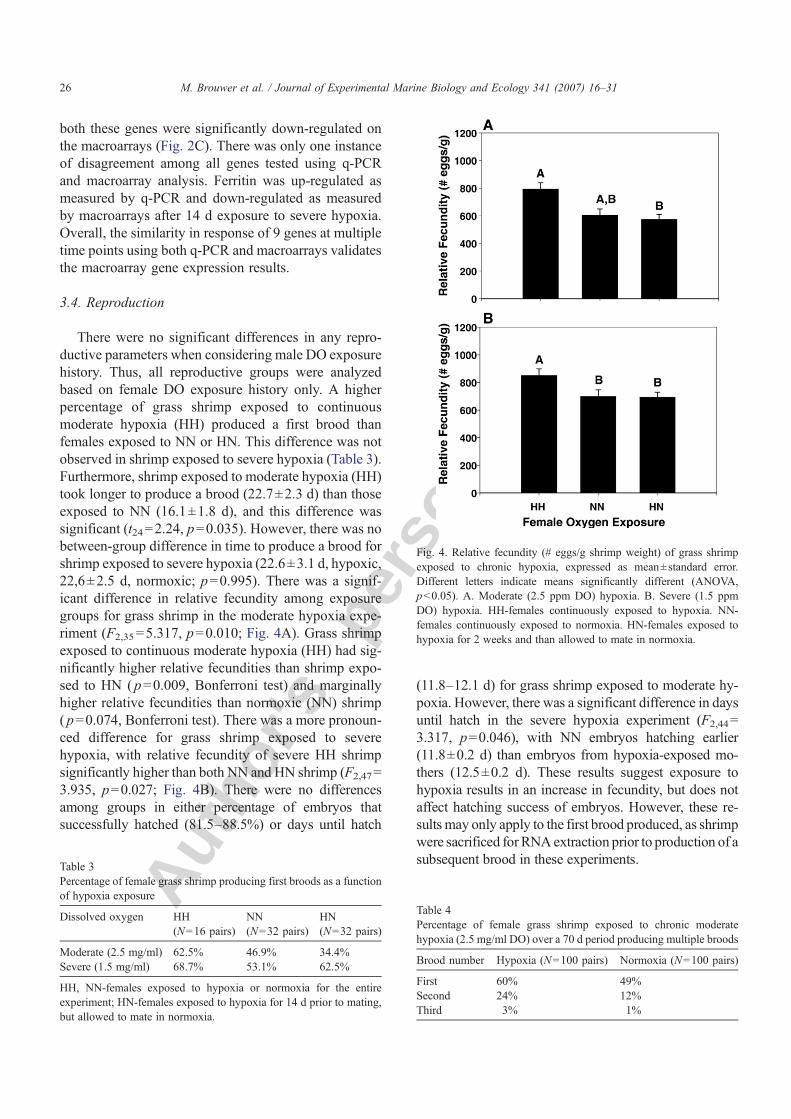
There were no significant differences in any repro-ductive parameters when considering male DO exposurehistory. Thus, all reproductive groups were analyzedbased on female DO exposure history only. A higherpercentage of grass shrimp exposed to continuousmoderate hypoxia (HH) produced a first brood thanfemales exposed to NN or HN. This difference was notobserved in shrimp exposed to severe hypoxia (Table 3).Furthermore, shrimp exposed to moderate hypoxia (HH)took longer to produce a brood (22.7±2.3 d) than thoseexposed to NN (16.1±1.8 d), and this difference wassignificant (t24=2.24, p=0.035). However, there was nobetween-group difference in time to produce a brood forshrimp exposed to severe hypoxia (22.6±3.1 d, hypoxic,22,6±2.5 d, normoxic; p=0.995). There was a signif-icant difference in relative fecundity among exposuregroups for grass shrimp in the moderate hypoxia expe-riment (F2,35=5.317, p=0.010; Fig. 4A). Grass shrimpexposed to continuous moderate hypoxia (HH) had sig-nificantly higher relative fecundities than shrimp expo-sed to HN ( p=0.009, Bonferroni test) and marginallyhigher relative fecundities than normoxic (NN) shrimp( p=0.074, Bonferroni test). There was a more pronoun-ced difference for grass shrimp exposed to severehypoxia, with relative fecundity of severe HH shrimpsignificantly higher than both NN and HN shrimp (F2,47=3.935, p=0.027; Fig. 4B). There were no differencesamong groups in either percentage of embryos thatsuccessfully hatched (81.5–88.5%) or days until hatch
(11.8–12.1 d) for grass shrimp exposed to moderate hy-poxia. However, there was a significant difference in daysuntil hatch in the severe hypoxia experiment (F2,44=3.317, p=0.046), with NN embryos hatching earlier(11.8±0.2 d) than embryos from hypoxia-exposed mo-thers (12.5±0.2 d). These results suggest exposure tohypoxia results in an increase in fecundity, but does notaffect hatching success of embryos. However, these re-sults may only apply to the first brood produced, as shrimpwere sacrificed forRNAextraction prior to production of asubsequent brood in these experiments.
Table 3Percentage of female grass shrimp producing first broods as a functionof hypoxia exposure
Dissolved oxygen HH(N=16 pairs)
NN(N=32 pairs)
HN(N=32 pairs)
Moderate (2.5 mg/ml) 62.5% 46.9% 34.4%Severe (1.5 mg/ml) 68.7% 53.1% 62.5%
HH, NN-females exposed to hypoxia or normoxia for the entireexperiment; HN-females exposed to hypoxia for 14 d prior to mating,but allowed to mate in normoxia.
Fig. 4. Relative fecundity (# eggs/g shrimp weight) of grass shrimpexposed to chronic hypoxia, expressed as mean±standard error.Different letters indicate means significantly different (ANOVA,pb0.05). A. Moderate (2.5 ppm DO) hypoxia. B. Severe (1.5 ppmDO) hypoxia. HH-females continuously exposed to hypoxia. NN-females continuously exposed to normoxia. HN-females exposed tohypoxia for 2 weeks and than allowed to mate in normoxia.
Table 4Percentage of female grass shrimp exposed to chronic moderatehypoxia (2.5 mg/ml DO) over a 70 d period producing multiple broods
Brood number Hypoxia (N=100 pairs) Normoxia (N=100 pairs)
First 60% 49%Second 24% 12%Third 3% 1%
26 M. Brouwer et al. / Journal of Experimental Marine Biology and Ecology 341 (2007) 16–31
Autho
r's
pers
onal
co
py
In the multiple brood experiment, a greater percent-age of females exposed to moderate hypoxia producedfirst, second and third broods than normoxic females(Table 4). Furthermore, the percentage of femalesproducing first broods was similar to the previous expe-riments for HH and NN shrimp (Table 3). There was nosignificant difference in relative fecundity between nor-moxic- and hypoxic-exposed females for either the firstor second brood (Table 5); too few females produced athird brood for meaningful analysis. Hypoxic femalestook a longer time to produce their first brood thannormoxic females (t100.6=−1.938, p=0.055), similar toprevious results for moderate hypoxia exposure, butthere was no significant difference for the second brood( p=0.163; Table 5). Both normoxic and hypoxicfemales produced their second brood in a significantlyshorter time than their first brood (t55=3.75, p=0.003,normoxic; t73=2.82, p=0.009, hypoxic; Table 5). Therewas no difference in the percentage of embryos thathatched or days to hatch between normoxic and hypoxicfemales for either brood. Finally, starved larvae fromhypoxic females survived significantly longer than star-ved larvae from normoxic females for both the first andsecond broods (t100.6=−2.488, p=0.014, first brood;t26=−2.25, p=0.033, second brood; Table 5). Therewere no differences in larval survival between the firstand second broods of an individual female for eithernormoxic or hypoxic larvae ( pN0.24). These resultssuggest that moderate hypoxia impacts the initial abilityof females to produce eggs, but that the number of eggsproduced is not affected. However, it appears thatlarvae from moderate hypoxic females have a greaterenergy store and are able to survive longer withoutfood.
4. Discussion
Our data indicate that changes in gene expression ingrass shrimp hold promise as molecular indicators forexposure to chronic hypoxia. Furthermore, grass shrimpreproduction appears to be affected by chronic hypoxiaexposure, suggesting population-level implications oflong-term hypoxia. Previous studies examining the effectsof hypoxia on crustacea have focused on individual/population-level (Coiro et al., 2000; Wu et al., 2002; Bellet al., 2003a,b; Mistri, 2004; Bell and Eggleston, 2005),physiological (DeFur et al., 1990; Tankersley andWieber,2000; McMahon, 2001) or molecular (Mangum, 1997;Paul et al., 2004; Brown-Peterson et al., 2005) responsesbut have not consideredmore than one type of response inthe same study. Thus, our data provide the opportunity tointegrate various disciplines in examining the responsesof grass shrimp to chronic hypoxia.
Grass shrimp appear to respond differently tomoderatevs. severe chronic hypoxia. Significant changes in geneexpression were not seen until 7 d exposure to chronic,moderate hypoxia. The down-regulation of expression atday 7 of both the constitutive (HSP70 cognate) and thestress-inducible (HSP70) forms of the chaperone proteinHSP70, important in cellular stress defense (Kultz, 2003),was somewhat unexpected. Previous studies on hypoxicresponses in vertebrates and invertebrates have shown up-regulation (Benjamin et al., 1990; Ton et al., 2003; van derMeer et al., 2005; Brown-Peterson et al., 2005) or nochange (Zarate and Bradley, 2003) of heat shock proteinexpression. However, both forms of HSP70 are also in-volved in folding of newly synthesized proteins (Beck-man et al., 1990), and a decrease in protein synthesis inresponse to hypoxia may account for the decrease inexpression of genes involved in protein folding. A similardown-regulation in expression of chaperone proteins suchas chaperonin 10 and heat shock factor binding protein 1was observed in gills of hypoxia-exposed zebrafish (vander Meer et al., 2005). Finally, the observed down-regu-lation of MnSOD in grass shrimp is a typical cellularresponse to hypoxia in both vertebrates (Russel et al.,1995) and invertebrates (Choi et al., 2000; Brown-Peter-son et al., 2005), presumably due to reduced production ofsuperoxide radicals under hypoxic conditions. However,this down-regulation has been previously shown in themitochondrial form of MnSOD, whereas the unusualcytosolic form of MnSOD was down-regulated in grassshrimp.
The changes observed in gene regulation in responseto severe chronic hypoxia lend insight into potentialmechanisms grass shrimp may use to survive hypoxicconditions. There were distinct time-course related
Table 5Reproductive parameters of female grass shrimp in a multiple-brood,chronic moderate hypoxic study
Parameter Hypoxia (2.5 pm DO) Normoxia (8 ppm DO)
Brood 1(N=56)
Brood 2(N=19)
Brood 1(N=48)
Brood 2(N=9)
Relativefecundity(eggs/g)
202±12.9 189±21.3 226±14.3 178±82.8
Interbroodinterval (d)
24.2±1.3 a 17.6±2.0 b 21.1±1.1 13.0±1.9 b
Larvalsurvival (d)
6.3±0.11 a 6.2±0.15 a 5.9±0.09 5.3±0.47
Shrimp were exposed continuously over a 70 d period to hypoxia ornormoxia.a Significant difference (p≤0.05) between treatments within a brood.b Significant difference (p≤0.05) between broods within a treatment.
27M. Brouwer et al. / Journal of Experimental Marine Biology and Ecology 341 (2007) 16–31
Autho
r's
pers
onal
co
py
differences in expression of genes important in ATPsynthesis, oxygen uptake/transport and the mitochon-drial electron transport chain. The initial response aftershort-term (3 d) exposure of grass shrimp to severehypoxia was upregulation of genes involved in oxygenuptake/transport and energy production, such as hemo-cyanin and ATP synthases. This suggests an initialattempt to compensate for reduced availability ofoxygen by increasing the oxygen transport and ATPsynthesis capacity. Similar upregulation of proteinsinvolved in oxygen transport such as myoglobin hasalso been observed in gill tissue of zebrafish exposed tohypoxia (van der Meer et al., 2005).
After 7 d exposure to severe hypoxia, expression ofhemocyanin and ATP synthase genes has returned tonormoxic levels. The major response by day 7 appearsto be an increase of transcription of genes present in themitochondrial genome (16S mitochondrial rRNA, cyto-chrome c oxidase 1 (Ccox 1) and to a lesser extent(pb0.1) cytochrome b), together with upregulation of aputative heme binding protein and the iron storageprotein, ferritin. This apparent link between mitochon-drial electron transport chain and proteins involved iniron metabolism is not unexpected since the mitochon-drion is a dynamo of Fe metabolism, being vital not onlyfor heme (cytochrome) biosynthesis but also for thebiogenesis of [Fe–S] clusters that are present in morethan 10 subunits of enzymes in Complex I, II and III ofthe respiratory chain (Napier et al., 2005; Taketani,2005).
The adaptation observed after 7 days apparentlybecomes insufficient by Day 14, and a dramatic reversalis seen, with a significant downregulation of transcrip-tion of genes in the mitochondrial genome (16S rRNA,cytochrome c oxidase subunits I and III (Ccox I and III)and cytochrome b), similar to results from zebrafishexposed to long-term hypoxia (van der Meer et al.,2005). Both ferritin ( p=0.003) and to a lesser extent theheme binding protein ( p=0.062) are down-regulated aswell.
Mitochondrial genes of the grass shrimp are simul-taneously down-regulated in response to long-termhypoxia. Similarly, mitochondrial (Ccox I and II ) andnuclear encoded (Ccox IV and Vb) subunits of cyto-chrome c oxidase are coordinately down-regulated inmouse and rat cell lines during hypoxia (Vijayasarathyet al., 2003). This suggests control of their transcriptionis coordinately regulated in response to hypoxia, or itmay reflect an overall decrease in mitochondrial bio-genesis with a concomitant reduction in the number ofmitochondrial genome copies. Mitochondrial DNA, mi-tochondrial ribosomal RNA and cytochrome b mRNA
levels each increase with increased oxidative capacity ofmuscle tissue (Williams, 1986). These results indicatethat the expression of mitochondrial genes in mamma-lian striated muscle is proportionate to their copy num-ber, suggesting that amplification of the mitochondrialgenome relative to chromosomal DNA is an importantfeature underlying enhanced expression of mitochon-drial genes in highly oxidative tissue. Thus, downregu-lation of these genes in hypoxic situations could be aresult of decreased need for oxidative metabolism andtherefore reduced copy numbers of mitochondria andmitochondrial genes. Grass shrimp may use this mecha-nism to cope with hypoxic stress, and save energy byreduction of mitochondrial biogenesis.
Finally, down-regulation of PmAV, a gene importantin virus resistance in penaeid shrimp (Luo et al., 2003),suggests the grass shrimp immune system may be com-promised with chronic exposure to severe hypoxia.Burnett and Burnett (2000) suggested hypoxia results ina depression of the generalized innate immune responsein P. pugio and Penaeus vannamei based on measure-ments of circulating hemocytes and survival of shrimpexposed to Vibrio. A similar conclusion was reachedregarding hypoxia exposure in killifish (Boleza et al.,2001). Thus, prolonged hypoxia may have populationconsequences, as individuals that have already down-regulated their aerobic metabolism also have decreasedimmune defenses, which could result in high mortalityof the population.
Data from macroarray and microarray analysis needto be interpreted cautiously (Kothapalli et al., 2002) andvalidation of observed changes with additional mea-surement techniques is desirable. All the genes in thisstudy were identified using SSH, and gene expressionresults on the arrays mirrored the up-or down-regulationseen with SSH. We also used q-PCR to validate ourarray data, and found that 9 genes showing differentialexpression on macroarrays were also differentially ex-pressed with q-PCR. The fold change values, and sig-nificance of these values, between macroarrays and RT-PCR were not always directly comparable, but in all butone instance up-regulation or down-regulation was con-firmed. Quantitative differences between array data andq-PCR results have been reported previously (Ton et al.,2002, 2003; van der Meer et al., 2005; Brown-Petersonet al., 2005), and which of the two methods is moreaccurate is debatable (Allison et al., 2005).
Interestingly, moderate chronic hypoxia resulted inmore dramatic effects on reproduction in grass shrimpthan it did on regulation of our SSH identified hypoxia-responsive genes. Additionally, there was a wider va-riety of reproductive effects related to moderate, rather
28 M. Brouwer et al. / Journal of Experimental Marine Biology and Ecology 341 (2007) 16–31
Autho
r's
pers
onal
co
py
than severe, chronic hypoxia. The surprising results ofincreased fecundity, percentage of ovigerous femalesand larval survival of hypoxia-exposed shrimp cannotbe readily explained by classic life history theories.However, it has been proposed that Daphnia channelmore resources into growth and reproduction early inlife when faced with sub-optimal environmental/habitatconditions (Weber et al., 2003). Possibly, grass shrimpare following a similar strategy when exposed to chronichypoxia.
In various fish species, exposure to hypoxia resultsin a decrease in gonadosomatic index (GSI), an indicatorof reproductive readiness and future fecundity (Wuet al., 2003; Thomas et al., 2006) as well as decreases inactual egg number (Landry et al., 2003). Furthermore,embryonic development, hatching success and survi-vorship decreased with decreasing DO in Floridaflagfish, Jordanella floridae (Hale et al., 2003), andthere was a significant difference in hatching successbetween embryos exposed to normoxia and moderate(2–3 ppm DO) hypoxia. It appears grass shrimp em-bryos are more tolerant of hypoxia than Florida flagfishembryos, as there was no difference in hatching successof grass shrimp in moderate hypoxia in either the singlebrood or the multiple brood experiments. However,embryos of grass shrimp exposed to severe hypoxia tooklonger to hatch than normoxic embryos, although therewas no difference in ultimate hatching success. Thiscontrasts with the Florida flagfish results, where noembryos exposed to severe hypoxia (b1.0 ppm DO)hatched (Hale et al., 2003). Thus, while chronic hypoxiaappears to have some adverse effects on grass shrimpreproduction (longer interbrood interval in moderatehypoxia, longer hatch time in severe hypoxia), thehigher fecundity, greater percentage of ovigerous fe-males and increased larval survival time of hypoxia-exposed grass shrimp indicates an overall strategy ofattempting to maximize reproduction in unfavorableconditions.
Grass shrimp appear to be quite tolerant of moderatehypoxia, based on few significant changes in geneexpression and no differences in condition factor. Severehypoxia appears to have short term effects, based on adecrease in condition factor during the first 7 days ofexposure in combination with upregulation of genes im-portant in oxygen transport and energy metabolism. Ingeneral, grass shrimp appear to adapt well to bothmoderate and severe chronic hypoxia with little long-termmortality and few noticeable physiological effects. In-deed, the reaction to hypoxia appears to be an increase inreproduction for this species, an unexpected result.However, this may be an artifact of the laboratory envi-
ronment, where food was not limiting, there was nopredation threat, andmovements were restricted to a smallarea.
Our results suggest that gene expression may be auseful indicator for measuring both short term (b7 d) andmoderate (7–14 d) exposure to severe chronic hypoxia.Since the genes used in our study were selected for theirresponse to hypoxia, and not for their involvement incontrol of reproduction, the observed changes in geneexpression do not provide insight into the molecularmechanisms through which hypoxia affects reproduction.However, it is in combining the molecular biomarkerswith whole animal responses such as fecundity, inter-brood interval and embryo/larval survival that the datapresented here become most valuable for understandingand predicting population-level effects of hypoxia. Aconceptual model for scaling molecular and reproductivebiomarkers of environmental stressors to the populationlevel was presented by Brouwer et al. (2005). This modelstresses the importance of having both molecular as wellas whole-animal inputs to be able to predict ecologicallyrelevant population effects. Thus, the data presented herecan be used in the development of physiological/sta-tistical, individual-based (IBM) and matrix projectionmodels (Rose et al., 2003) to gain a better understandingof population-level consequences of chronic hypoxia.Chronic hypoxia of 1–3 d duration is not uncommon inmarsh systems where grass shrimp reside during summermonths along both the Gulf of Mexico and the South-eastern United States (see National Estuarine ResearchReserve water quality data, http://cdmo.baruch.sc.edu/data_summary.cfm), suggesting grass shrimp are exposedto these conditions in their natural environments. Fur-thermore, a number of mobile, hypoxia tolerant estuarineorganisms have been shown to remain in hypoxic con-ditions (Pihl et al., 1991; Breitburg et al., 1994), sug-gesting at least some species do not actively avoid suchconditions. Thus, our experimental results are applicableto natural marsh systems. Current research is focused oncyclic hypoxia exposures in the laboratory and grassshrimp captured from hypoxic and normoxic field sites todetermine if the indicators determined from laboratoryexperiments are useful in a field situation. Results fromthese studies will help to further refine development ofmodels, and will continue to demonstrate the importanceof combining molecular and whole animal data within thesame study.
Acknowledgments
We appreciate the technical expertise of B. Carter, T.Li, W. Grater, C. King and M. Peterson for their help
29M. Brouwer et al. / Journal of Experimental Marine Biology and Ecology 341 (2007) 16–31
Autho
r's
pers
onal
co
py
with subtractive library construction, cDNA cloning,sequencing, shrimp sampling and husbandry andstatistical consultation. This research was supported bygrants to M.B. from the US Environmental ProtectionAgency's Science to Achieve Results (STAR) Estuarineand Great Lakes (EaGLe) program through funding tothe Consortium for Estuarine Ecoindicator Research forthe Gulf of Mexico (CEER-GOM; US EPA AgreementR82945801) and from the National Oceanic andAtmospheric Administration (NAO3NOS4260216). Al-though the research described in this article was fundedwholly or in part by the US EPA, it has not beensubjected to the Agency's required peer and policyreview and, therefore, does not necessarily reflect theviews of the Agency and no official endorsement shouldbe inferred. [SS]
References
Allison, D.B., Cui, X., Page, G.P., Sabripour, M., 2005. Microarray dataanalysis: from disarray to consolidation and consensus. Nat. Rev.,Genet. 7, 55–65.
Beckman, R.P., Mizzen, L.A., Welch,W.J., 1990. Interaction of Hsp 70with newly-synthesized proteins: implications for protein foldingand assembly. Science 248, 850–854.
Bell, G.W., Eggleston, D.B., 2005. Species-specific avoidance responseby blue crabs and fish to chronic and episodic hypoxia. Mar. Biol.146, 761–770.
Bell, G.W., Eggleston, D.B., Wolcott, T.G., 2003a. Behavioral responsesof free-ranging blue crabs to episodic hypoxia. I. Movement. Mar.Ecol. Prog. Ser. 259, 215–225.
Bell, G.W., Eggleston, D.B., Wolcott, T.G., 2003b. Behavioralresponses of free-ranging blue crabs to episodic hypoxia. II.Feeding. Mar. Ecol. Prog. Ser. 259, 227–235.
Benjamin, I.J., Kroger, B., Williams, S., 1990. Activiation of the heatshock transcription factor by hypoxia in mammalian cells. Proc.Natl. Acad. Sci. U. S. A. 87, 6263–6267.
Boleza, K.A., Burnett, L.E., Burnett, K.G., 2001. Hypercapnic hypoxiacompromises bactericidal activity of fish anterior kidney cellsagainst opportunistic environmental pathogens. Fish ShellfishImmunol. 11, 593–601.
Breitburg, D.L, Steinberg, N.D., DuBeau, S., Cooksey, C., Houde, E.D.,1994. Effects of low dissolved oxygen on predation on estuarine fishlarvae. Mar. Ecol. Prog. Ser. 104, 235–246.
Brouwer, M., Hoexum Brouwer, T., Grater, W., Enghild, J.,Thogersen, I., 1997. The paradigm that all oxygen-respiringeukaryotes have cytosolic CuZn-superoxide dismutase and thatMn-superoxide dismutase is localized to the mitochondria doesnot apply to a large group of marine arthropods. Biochem. 36,13381–13388.
Brouwer, M., Hoexum Brouwer, T., Grater, W., Brown-Peterson, N.,2003. A novel cytosolic Mn-superoxide dismutase (MnSOD) hasreplaced cytosolic Cu, ZnSOD in crustacea that use copper (hemo-cyanin) for oxygen transport. Biochem. J. 374, 219–228.
Brouwer,M., Brown-Peterson, N.J., Larki, P., Manning, S., Denslow, N.,Rose, K., 2005. Molecular and organismal indicators of chronic andintermittent hypoxia in marine crustacea. In: Bortone, S.A. (Ed.),Estuarine Indicators. CRC Press, Boca Raton, FL, pp. 261–276.
Brown-Peterson, N.J., Larkin, P., Denslow, N., King, C., Manning,C., Brouwer, M., 2005. Molecular indicators of hypoxia inthe blue crab Callinectes sapidus. Mar. Ecol. Prog. Ser. 286,203–215.
Burnett, L.E., Burnett, K.G., 2000. The effects of hypoxia and hyper-campnia on cellular defenses of oysters, shrimp and fish. Comp.Biochem. Physiol., B 126, S20.
Buzzelli, C.P., Luettich,R.A., Powers, S.P., Peterson,C.H.,McNinch, J.E.,Pinckney, J.L., Pearl, H.W., 2002. Estimating the spatial extent ofbottom-water hypoxia and habitat degradation in a shallow estuary.Mar. Ecol. Prog. Ser. 230, 103–112.
Choi, J., Roche, H., Caquet, T., 2000. Effects of physical (hypoxia,hyperoxia) and chemical (potassium dichromate, fenithrothion)stress on antioxidant enzyme activities in Chironomus ripariusMg(Dipteria, Chironomidae) larvae: potential biomarkers. Environ.Toxicol. Chem. 19, 495–500.
Coiro, L.L., Pucher, S.L., Miller, D.C., 2000. Hypoxic effects ongrowth of Palaemonetes vulgaris larvae and other species: usingconstant exposure data to estimate cyclic exposure response.J. Exp. Mar. Biol. Ecol. 247, 243–255.
Czyzyk-Krzeska, M.F., 1997. Molecular aspects of oxygen sensing inphysiological adaptation to hypoxia. Respir. Physiol. 110, 99–111.
DeFur, P.L., Mangum, C.P., Reese, J.E., 1990. Respiratory responsesof the blue crab Callinectes sapidus to long-term hypoxia. Biol.Bull. 178, 46–54.
Diaz, R.J., Rosenberg, R., 1995. Marine benthic hypoxia: a review ofits ecological effects and the behavioural responses of benthicmacrofauna. Oceanogr. Mar. Biol. Annu. Rev. 33, 245–303.
Gracey, A.Y., Troll, J.V., Somero, G.N., 2001. Hypoxia-induced geneexpression profiling in the euryoxic fish Gillichthys mirabilis.Proc. Natl. Acad. Sci. U. S. A. 98, 1993–1998.
Hale, R.E., St. Mary, C.M., Lindstrom, K., 2003. Parental responses tochanges in costs and benefits along an environmental gradient.Environ. Biol. Fisches 67, 107–116.
Hochachka, P.W., Lutz, P.L., 2001. Mechanism, origin and evolutionof anoxia tolerance in animals. Comp. Biochem. Physiol., B 130,435–459.
Hochachka, P.W., Buck, L.T., Doll, C.J., Land, S.C., 1996. Unifyingtheory of hypoxia tolerance; molecular/metabolic defense and rescuemechanisms for surviving oxygen lack. Proc. Natl. Acad. Sci. U. S.A.93, 9493–9498.
Karlin, S., Altschul, S.F., 1990. Methods for assessing the statisticalsignificance of molecular sequence features by using generalscoring schemes. Proc. Natl. Acad. Sci. U. S. A. 87, 2264–2268.
Kothapalli, R., Yoder, S.J., Mane, S., Loughran, T.P., 2002. Microarrayresults: how accurate are they? BMC Bioinformatics 3, 22.
Kultz, D., 2003. Evolution of the cellular stress proteome: from mono-phyletic origin to ubiquitous function. J. Exp. Biol. 206, 3119–3124.
Landry, C.A., Manning, S., Cheek, A.O., 2003. Hypoxia affectsreproduction in Gulf killifish (Fundulus grandis). Integr. Comp.Biol. 43, 812.
Larkin, P., Folmar, L.C., Hemmer, M.J., Poston, A.J., Denslow, N.D.,2003. Expression profiling of estrogenic compounds using asheepshead minnow cDNA macroarry. Environ. Health Perspect.Toxicogenomics 111, 839–846.
Luo, T., Zhang, X., Shao, Z., Xu, X., 2003. PmAV, a novel geneinvolved in virus resistance of shrimp Penaeus monodon. FEBSLett. 551, 53–57.
Mangum, C.P., 1997. Adaptation of the oxygen transport system tohypoxia in the blue crab,Callinectes sapidus. Am. Zool. 37, 604–611.
Manning, C.S., Schesny, A.L., Hawkins, W.E., Barnes, D.H., Barnes,D.S., Walker, W.W., 1999. Exposure methodologies and systems
30 M. Brouwer et al. / Journal of Experimental Marine Biology and Ecology 341 (2007) 16–31
Autho
r's
pers
onal
co
py
for long term chemical carcinogenicity studies with small fishspecies. Toxicol. Methods 9 (3), 201–217.
McMahon, B.R., 2001. Respiratory and circulatory compensation tohypoxia in crustaceans. Respir. Physiol. 128, 349–364.
Meehean, O.L., 1936. Notes on the freshwater shrimp Palaemonetespaludosa (Gibbes). Trans. Am. Microsc. Soc. 55, 433–441.
Mistri, M., 2004. Effects of hypoxia on predator-prey interactionsbetween juvenile Carcinus aestuarii and Musculista senhousia.Mar. Ecol. Prog. Ser. 275, 211–217.
Murphy, B.R., Willis, D.W. (Eds.), 1996. Fisheries Techniques, 2nd ed.American Fisheries Society, Bethesda, Maryland.
Napier, I., Ponka, P., Richardson, D.R., 2005. Iron trafficking in themitochondrion: novel pathways revealed by disease. Blood 105,1867–1874.
Paul, R.J., Zeis, B., Lamkemeyer, T., Seidl, M., Pirow, R., 2004.Control of oxygen transport in the microcrustacean Daphnia:regulation of haemoblobin expression as central mechanism ofadaptation to different oxygen and temperature conditions. ActaPhysiol. Scand. 182, 259–275.
Pihl, L., Baden, S.P., Diaz, R.J., 1991. Effects of periodic hypoxia ondistribution of demersal fish and crustaceans. Mar. Biol. 108,349–360.
Rose, K.A., Murphy, C.A., Diamond, S.L., Fuiman, L.A., Thomas, P.,2003. Using nested models and laboratory data for predictingpopulation effects of contaminants on fish: a step toward a bottom-up approach for establishing causality in field studies. Hum. Ecol.Risk Assess. 9, 231–257.
Russel, W.J., Ho, Y.S., Parish, G., Jackson, R.M., 1995. Effects ofhypoxia on MnSOD expression in mouse lungs. Am. J. Physiol.,Lung Cell. Mol. Physiol. 13, L221–L225.
Sokal, R.R., Rohlf, F.J., 1995.Biometry, 3rd ed.W.H. Freeman,NewYork.Tankersley, R.A., Wieber, M.G., 2000. Physiological responses of
postlarval and juvenile blue crabs Callinetes sapidus to hypoxiaand anoxia. Mar. Ecol. Prog. Ser. 194, 179–191.
Taketani, S., 2005. Acquisition, mobilization and utilization of cellulariron and heme: endless findings and growing evidence of tightregulation. Tohoku J. Exp. Med. 205, 297–318.
Terwilliger, N.B., 1998. Functional adaptations of oxygen-transportproteins. J. Exp. Biol. 201, 1085–1098.
Thomas, P., Rahman, S.Md., Kummer, J.A., Lawson, S., 2006.Reproductive endocrine dysfunction in Atlantic croaker exposed tohypoxia. Mar. Environ. Res. 62, S249–S252.
Ton, C., Stamatiou, D., Dzau, V.J., Liew, C.-C., 2002. Construction ofa zebrafish cDNA microarray: gene expression profiling of thezebrafish during development. Biochem. Biophys. Res. Commun.296, 1134–1142.
Ton, C., Stamatiou, D., Liew, C.-C., 2003. Gene expression profile ofzebrafish exposed to hypoxia during development. Physiol. Geno-mics 13, 97–106.
van der Meer, D.L.M., van den Thillart, G.E.E.J.M., Witte, F., deBakker, M.A.G., Besser, J., Richardson, M.K., Spaink, H.P., Leito,J.T.D., Batowski, C.P., 2005. Gene expresión profiling of the long-term adaptive response to hypoxia in the gills of adult zebrafish.Am. J. Physiol., Regul. Integr. Comp. Physiol. 289, 1512–1519.
Vijayasarathy, C., Damle, S., Prabul, S.K., Otto, C.M., Avadhani, N.G.,2003. Adaptive changes in the expression of nuclear and mito-chondrial encoded subunits of cytochrome c oxidase and thecatalytic activity during hypoxia. Eur. J. Biochem. 270, 871–879.
Wannamaker, C.M., Rice, J.A., 2000. Effects of hypoxia on move-ments and behavior of selected estuarine organisms from thesoutheastern United States. J. Exp. Mar. Biol. Ecol. 249, 145–163.
Weber, A., Vesela, S., Repka, S., 2003. The supposed lack of trade-offamongDaphnia galeata life history traits is explained by increasedadult mortality in Chaoborus conditioned treatments: RecentDevelopments in Fundamental and Applied Plankton Research(Guest Editors: R. Van Donk, M. Boersman and P. Spaak). Hydro-biologia 491, 273–287.
Welsh, B.L., 1975. The role of grass shrimp, Palaemonetes pugio, in atidal marsh ecosystem. Ecology 56, 513–530.
Williams, R.S., 1986. Mitochondrial gene expression in mammalianstriated muscle. Evidence that variation in gene dosage is the majorregulatory event. J. Biol. Chem. 261, 12390–12394.
Wong, M.L., Medrano, J.F., 2005. Real-time PCR for mRNAquantitation. BioTechniques 39, 1–11.
Wu, R.S.S., 2002. Hypoxia: from molecular responses to ecosystemresponses. Mar. Pollut. Bull. 45, 35–45.
Wu, R.S.S., Lam, P.K.S.,Wan, K.L., 2002. Tolerance to, and avoidanceof, hypoxia by the penaeid shrimp (Metapenaeus ensis). Environ.Pollut. 118, 351–355.
Wu, R.S.S., Zhou, D.S., Randall, D.L., Woo, N.Y.S., Lam, P.K.S.,2003. Aquatic hypoxia is an endocrine disruptor and impairs fishreproduction. Environ. Sci. Technol. 37, 1137–1141.
Zarate, J., Bradley, T.M., 2003. Heat shock proteins are not sensitiveindicators of hatchery stress in salmon. Aquaculture 223, 175–187.
31M. Brouwer et al. / Journal of Experimental Marine Biology and Ecology 341 (2007) 16–31
Related Documents