MECHANICAL PROPERTIES OF MATERIALS Manufacturing materials IE251 Dr M. Eissa

Welcome message from author
This document is posted to help you gain knowledge. Please leave a comment to let me know what you think about it! Share it to your friends and learn new things together.
Transcript
MECHANICAL PROPERTIES OF MATERIALS
Manufacturing materials IE251 Dr M. Eissa
Manufacturing Materials
MECHANICAL PROPERTIES OF MATERIALS
1. Stress-Strain Relationships (Slide 4)
2. Tensile Test (Slide 7)
3. Compression Test (Slide 36)
Manufacturing Materials
Mechanical Properties in Design and Manufacturing
Mechanical properties determine a material’s behavior when subjected to mechanical stresses Properties include elastic modulus, ductility,
hardness, and various measures of strength Dilemma: mechanical properties desirable to the
designer, such as high strength, usually make manufacturing more difficult
The manufacturing engineer should appreciate the design viewpoint
And the designer should be aware of the manufacturing viewpoint
Strain- Stress Relationship
Manufacturing Materials
Stress-Strain Relationships
Three types of static stresses to which materials can be subjected:
1. Tensile - tend to stretch the material 2. Compressive - tend to squeeze it 3. Shear - tend to cause adjacent portions of
material to slide against each other
Stress-strain curve - basic relationship that describes mechanical properties for all three types
Manufacturing Materials
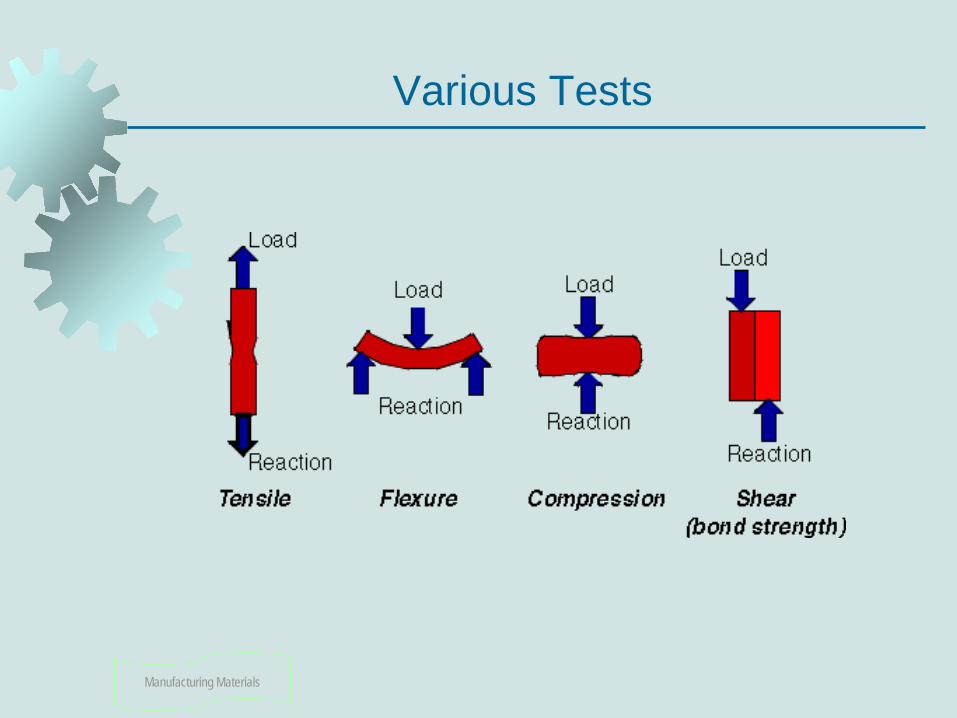
Various Tests
Manufacturing Materials
Tensile Test
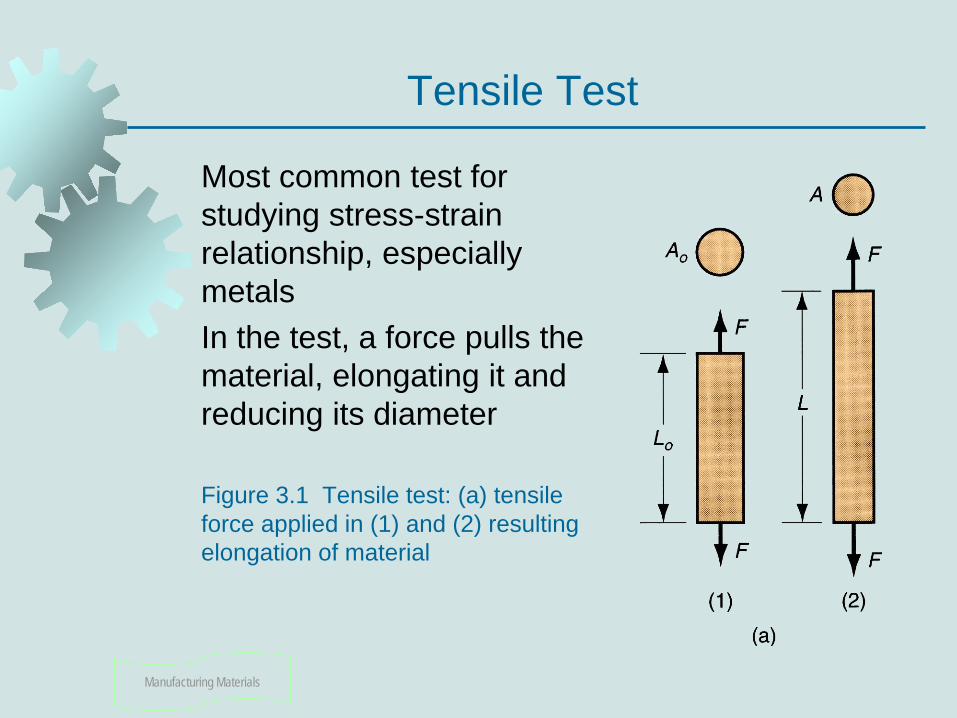
Most common test for studying stress-strain relationship, especially metals In the test, a force pulls the material, elongating it and reducing its diameter Figure 3.1 Tensile test: (a) tensile force applied in (1) and (2) resulting elongation of material
Manufacturing Materials
Tensile Test Specimen
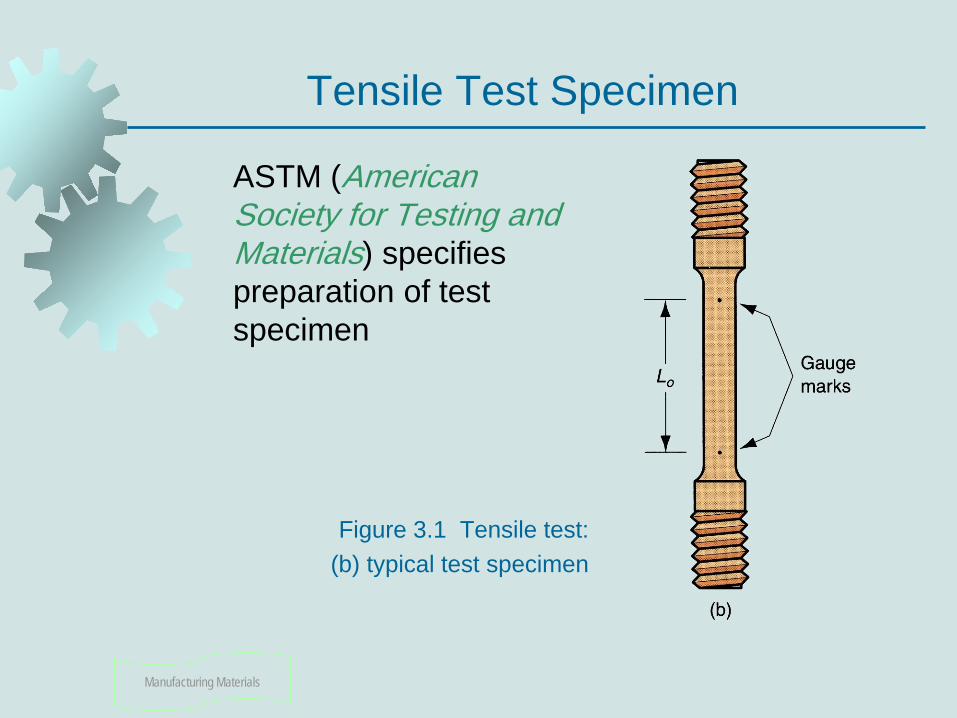
ASTM (American Society for Testing and Materials) specifies preparation of test specimen
Figure 3.1 Tensile test: (b) typical test specimen
Manufacturing Materials
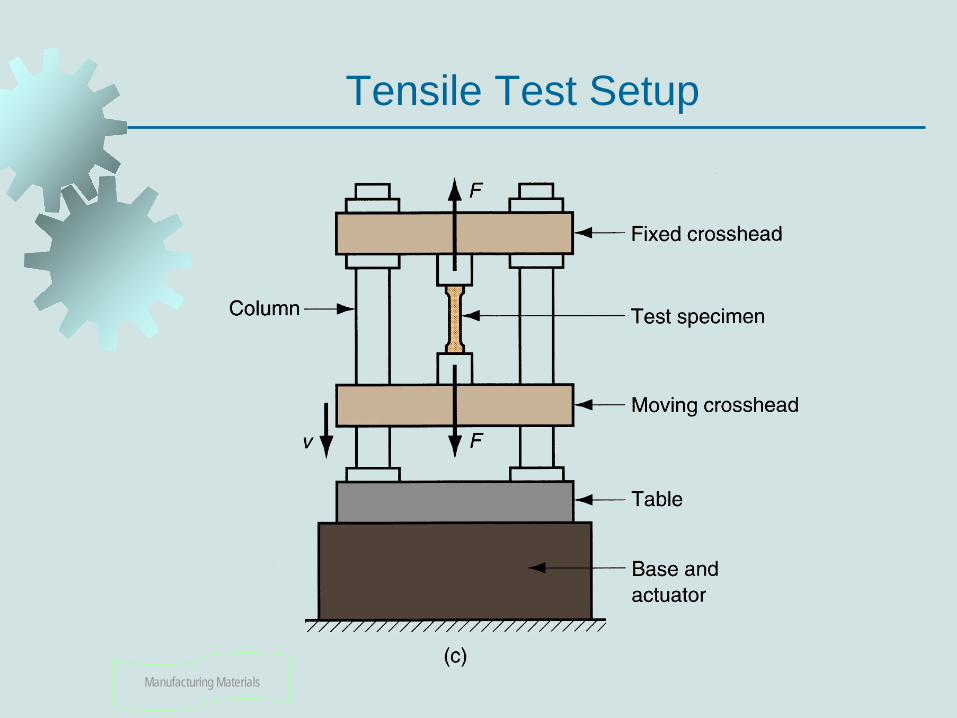
Tensile Test Setup
Manufacturing Materials
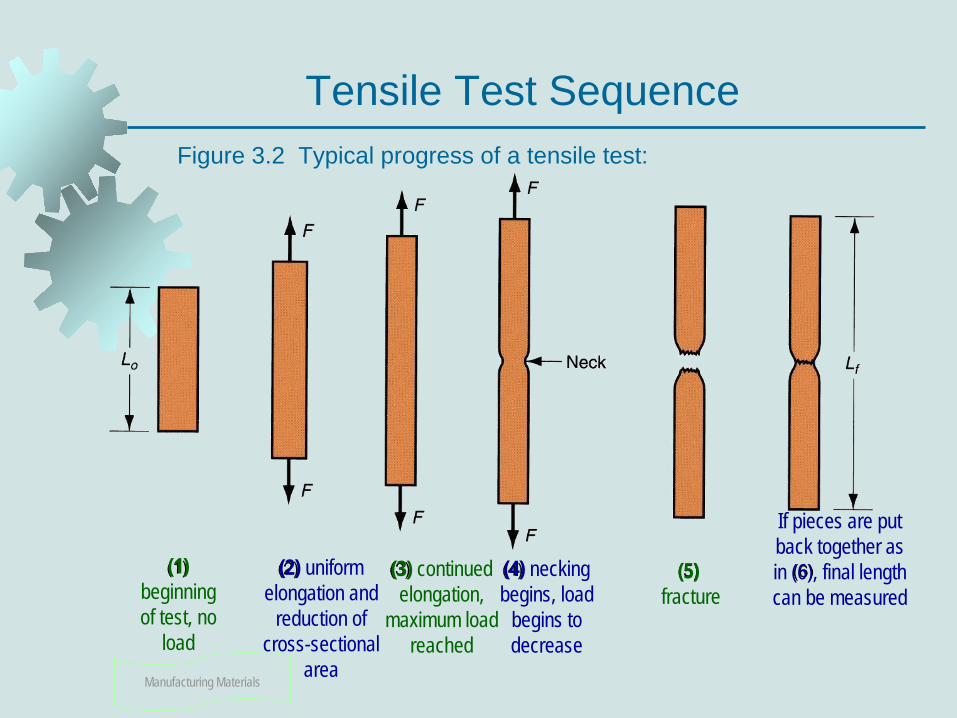
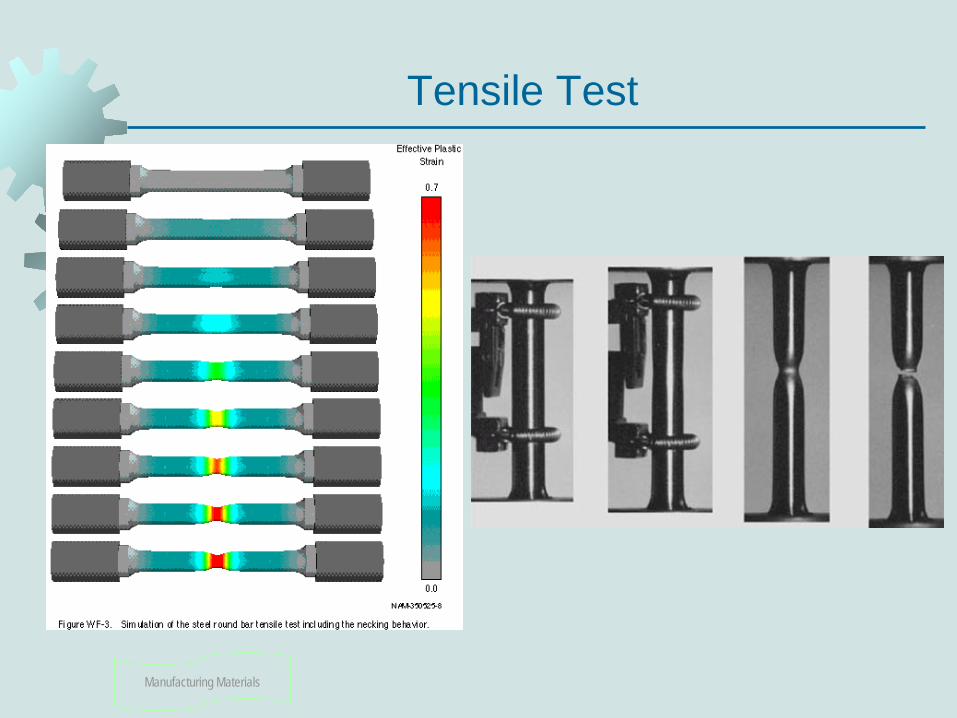
Tensile Test Sequence Figure 3.2 Typical progress of a tensile test:
(1) beginning of test, no
load
(2) uniform elongation and
reduction of cross-sectional
area
(3) continued elongation,
maximum load reached
(4) necking begins, load
begins to decrease
(5) fracture
If pieces are put back together as in (6), final length can be measured
Manufacturing Materials
Tensile Test
Manufacturing Materials
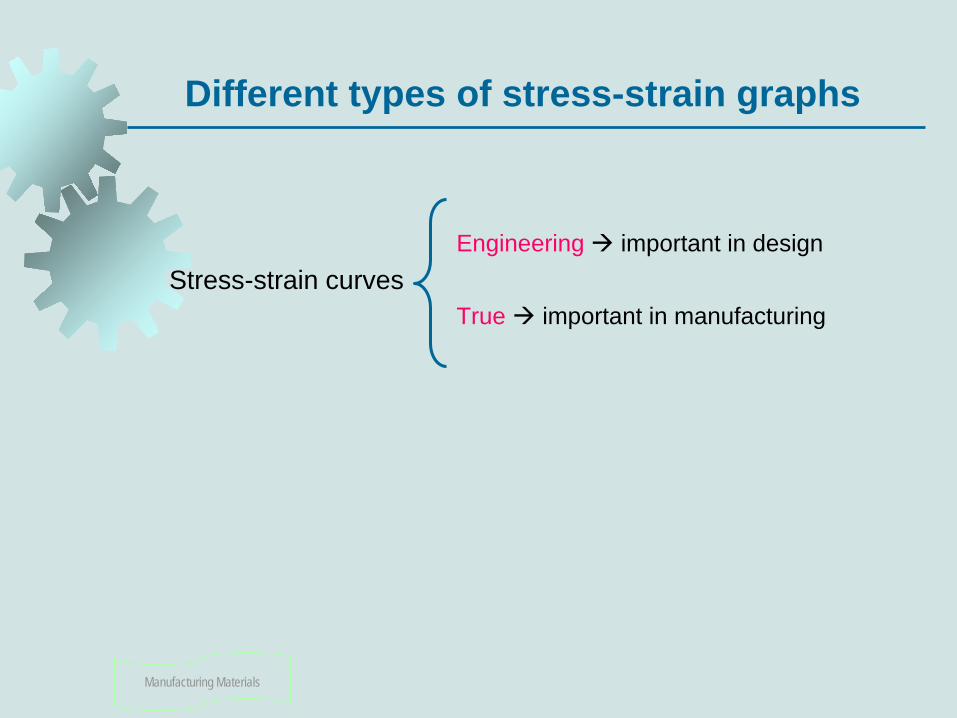
Different types of stress-strain graphs
Engineering important in design Stress-strain curves True important in manufacturing

Manufacturing Materials
Engineering Stress
Defined as force divided by original area:
oe A
F=σ
where σe = engineering stress (MPa) or Pa or psi, F = applied force (N) or lb, and Ao = original area of test specimen (mm2 or m2 or in2) (Remember: N/ m2 = Pa, N/ mm2 = MPa, lb/ in2 = psi, klb/ in2 = kips/ in2)
Manufacturing Materials
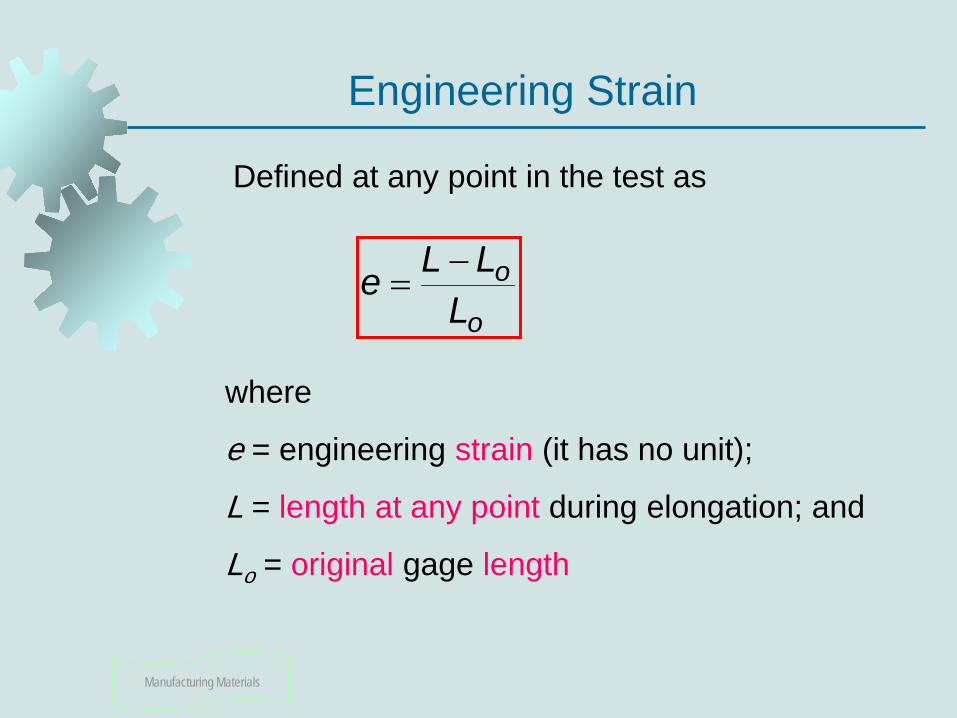
Engineering Strain
Defined at any point in the test as
where
e = engineering strain (it has no unit);
L = length at any point during elongation; and
Lo = original gage length
o
oL
LLe −=
Manufacturing Materials
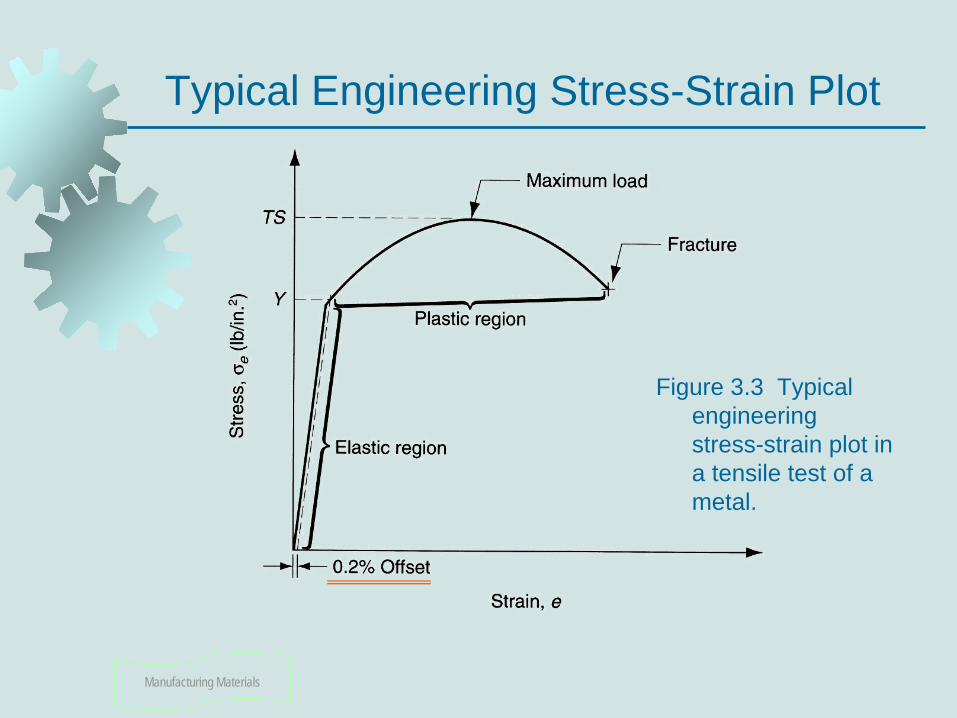
Typical Engineering Stress-Strain Plot
Figure 3.3 Typical engineering stress-strain plot in a tensile test of a metal.
Manufacturing Materials
Two Regions of Stress-Strain Curve
The two regions indicate two distinct forms of behavior:
1. Elastic region – prior to yielding of the
material 2. Plastic region – after yielding of the material
Manufacturing Materials
Elastic Region in Stress-Strain Curve
Relationship between stress and strain is linear
Material returns to its original length when stress is removed
Hooke's Law: σe = E e where E = modulus of elasticity, σe = stress, e=strain
E is a measure of the inherent stiffness of a material
Its value differs for different materials
Manufacturing Materials
Yield Point in Stress-Strain Curve
As stress increases, a point in the linear relationship is finally reached when the material begins to yield Yield point Y can be identified by the
change in slope at the upper end of the linear region
Y = a strength property
Other names for yield point = yield strength, yield stress, and elastic limit
Manufacturing Materials
Plastic Region in Stress-Strain Curve
Yield point marks the beginning of plastic deformation
The stress-strain relationship is no longer guided by Hooke's Law (non-linear relationship)
As load is increased beyond Y, elongation proceeds at a much faster rate than before, causing the slope of the curve to change dramatically
Manufacturing Materials
Tensile Strength in Stress-Strain Curve
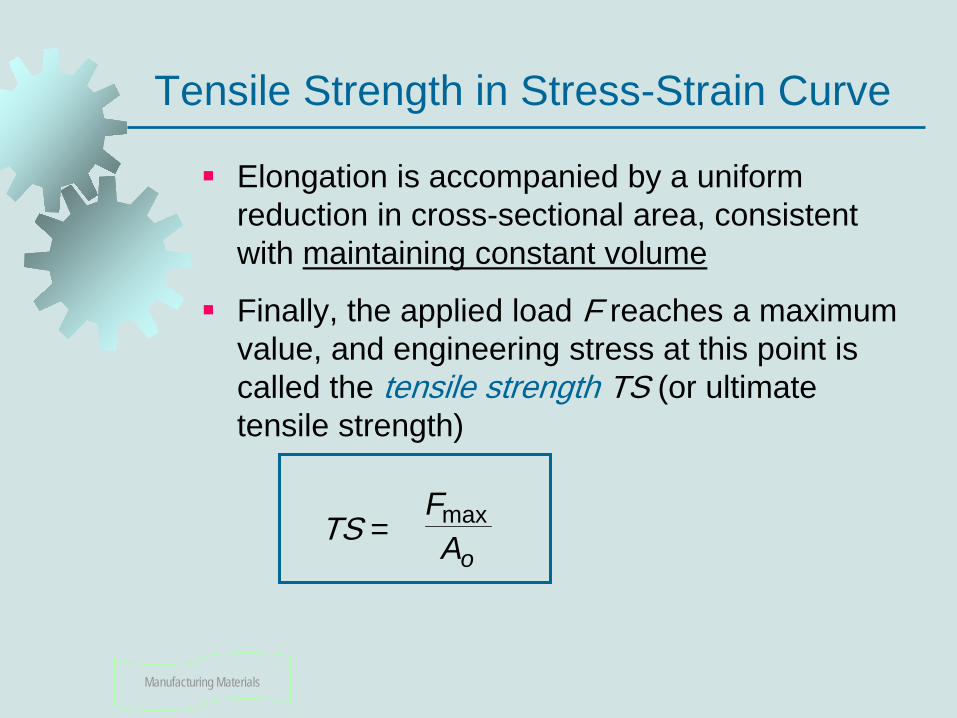
Elongation is accompanied by a uniform reduction in cross-sectional area, consistent with maintaining constant volume
Finally, the applied load F reaches a maximum value, and engineering stress at this point is called the tensile strength TS (or ultimate tensile strength)
TS =
oAFmax
Manufacturing Materials
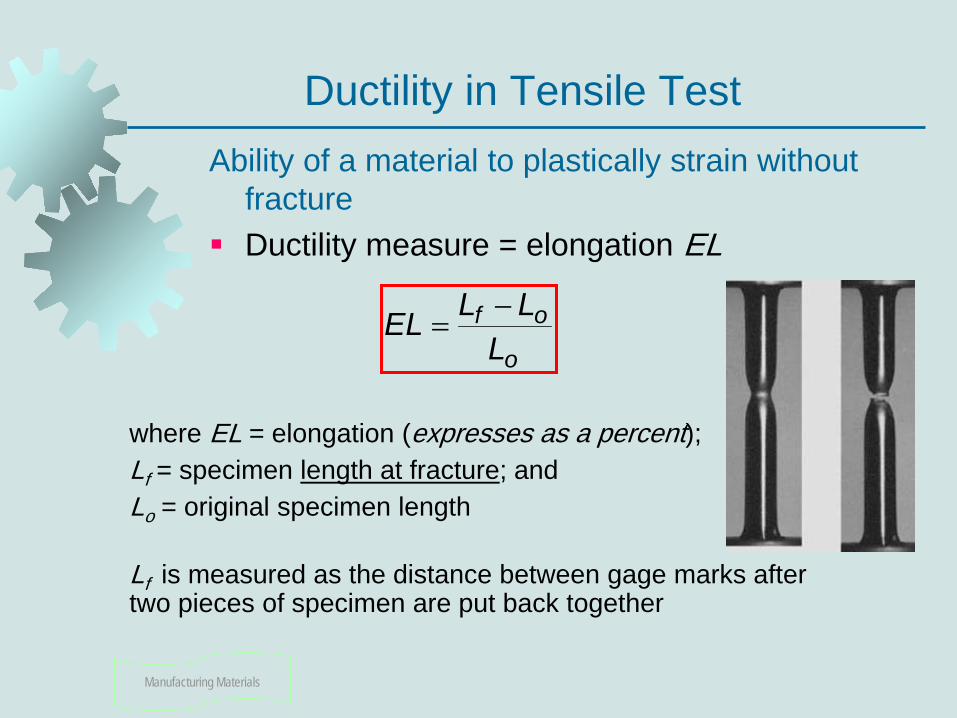
Ductility in Tensile Test Ability of a material to plastically strain without
fracture Ductility measure = elongation EL
where EL = elongation (expresses as a percent); Lf = specimen length at fracture; and Lo = original specimen length
Lf is measured as the distance between gage marks after two pieces of specimen are put back together
o
ofL
LLEL −=
Manufacturing Materials
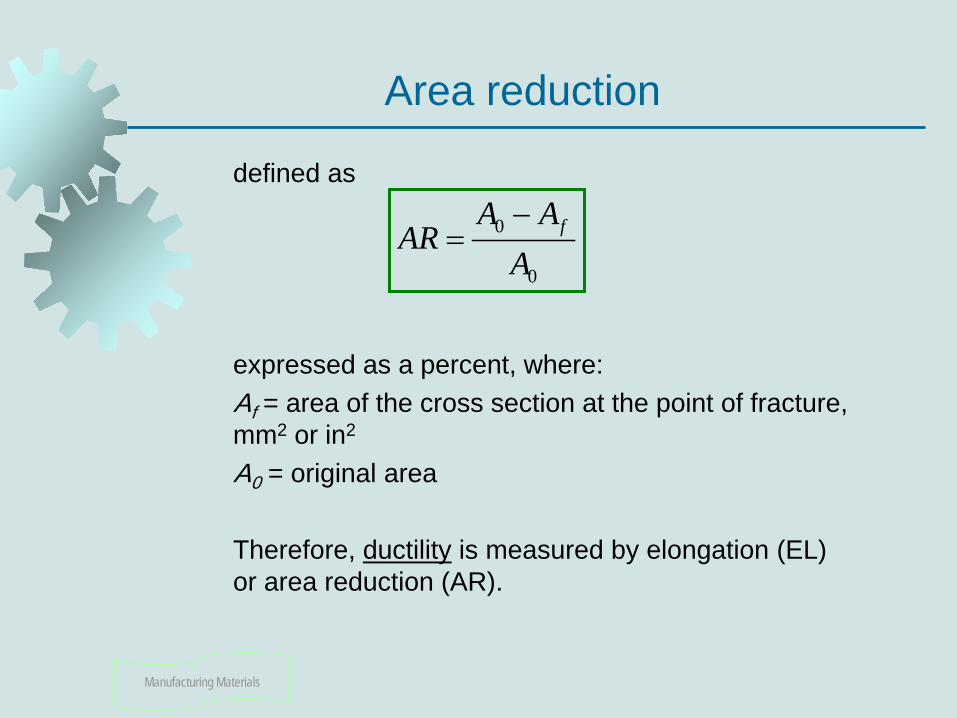
Area reduction
defined as expressed as a percent, where: Af = area of the cross section at the point of fracture, mm2 or in2
A0 = original area Therefore, ductility is measured by elongation (EL) or area reduction (AR).
0
0
fA AAR
A−
=
Manufacturing Materials
Which material has the highest modulus of elasticity?
Which material has the highest tensile
strength? Which material has the highest
elongational rate?
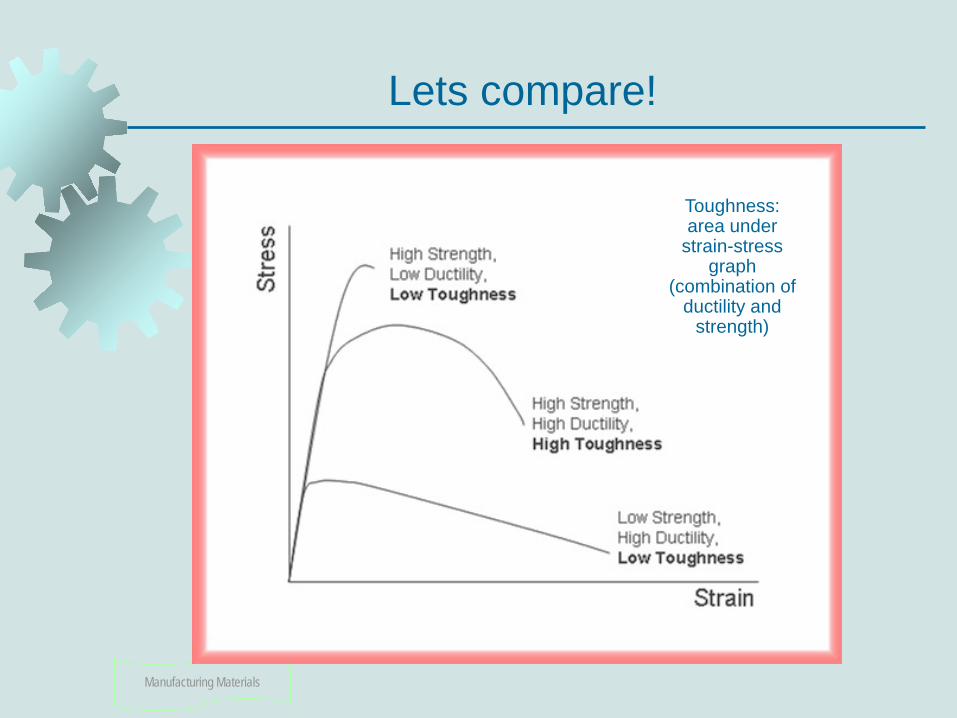
Lets compare!
Manufacturing Materials
Lets compare!
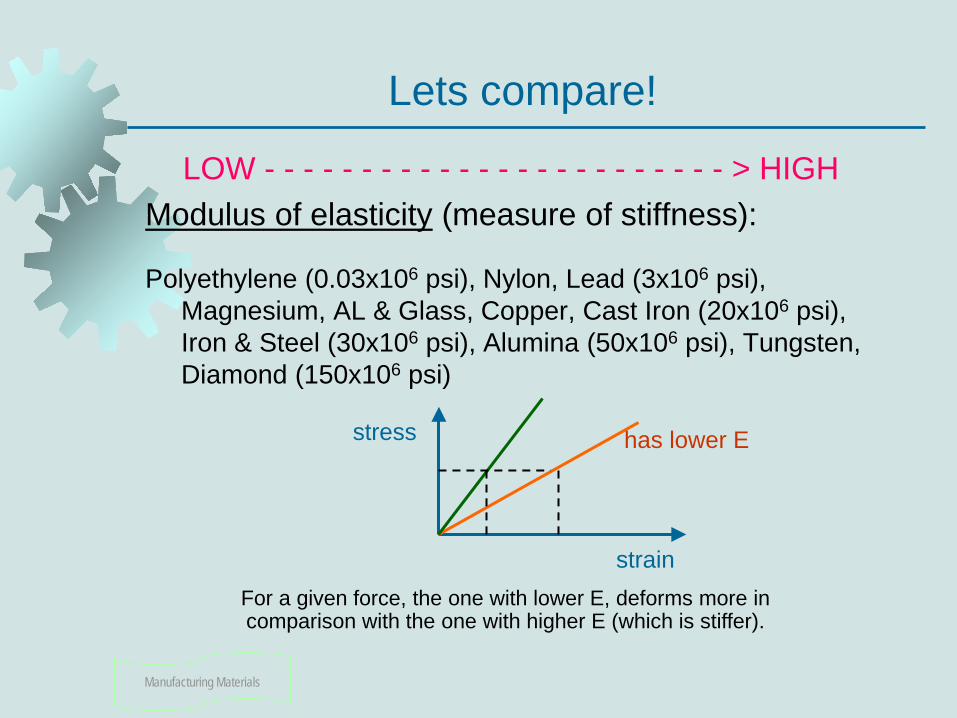
LOW - - - - - - - - - - - - - - - - - - - - - - - - > HIGH Modulus of elasticity (measure of stiffness):
Polyethylene (0.03x10⁶ psi), Nylon, Lead (3x10⁶ psi), Magnesium, AL & Glass, Copper, Cast Iron (20x106 psi), Iron & Steel (30x106 psi), Alumina (50x106 psi), Tungsten, Diamond (150x106 psi)
strain
stress has lower E
For a given force, the one with lower E, deforms more in comparison with the one with higher E (which is stiffer).
Manufacturing Materials
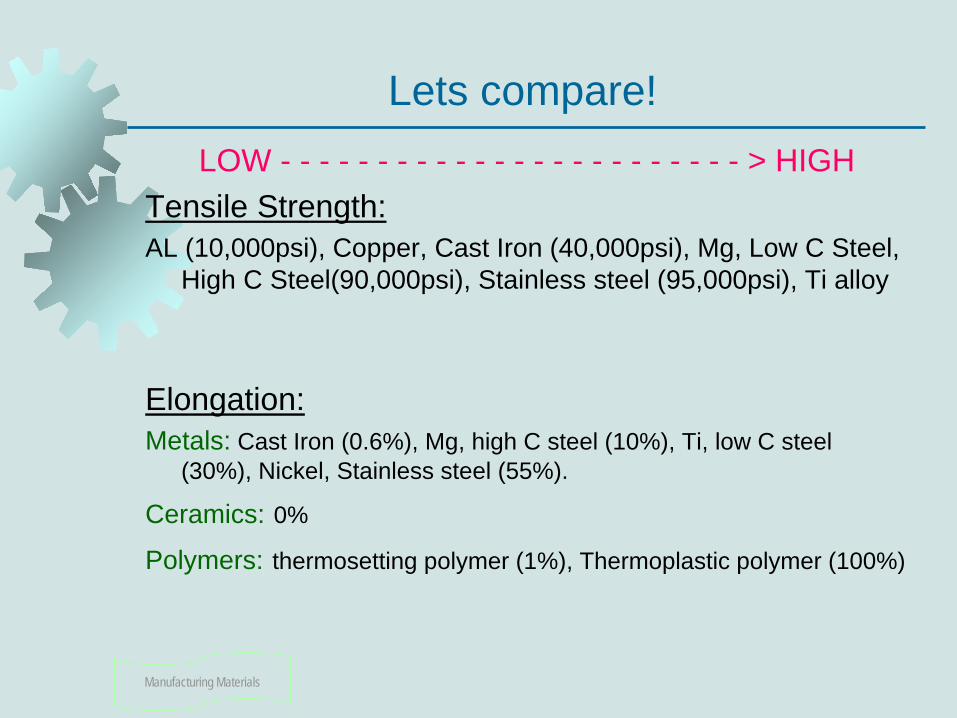
Lets compare! LOW - - - - - - - - - - - - - - - - - - - - - - - - > HIGH
Tensile Strength: AL (10,000psi), Copper, Cast Iron (40,000psi), Mg, Low C Steel,
High C Steel(90,000psi), Stainless steel (95,000psi), Ti alloy
Elongation: Metals: Cast Iron (0.6%), Mg, high C steel (10%), Ti, low C steel
(30%), Nickel, Stainless steel (55%).
Ceramics: 0%
Polymers: thermosetting polymer (1%), Thermoplastic polymer (100%)
Manufacturing Materials
True Stress
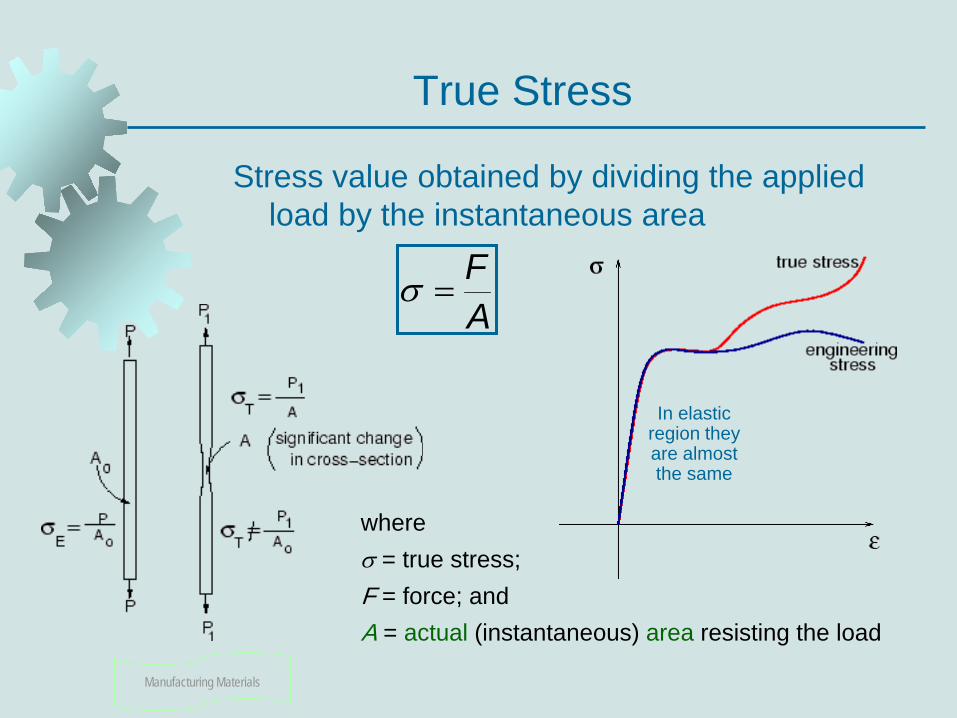
Stress value obtained by dividing the applied load by the instantaneous area
where σ = true stress; F = force; and A = actual (instantaneous) area resisting the load
AF
=σ
In elastic region they are almost the same
Manufacturing Materials
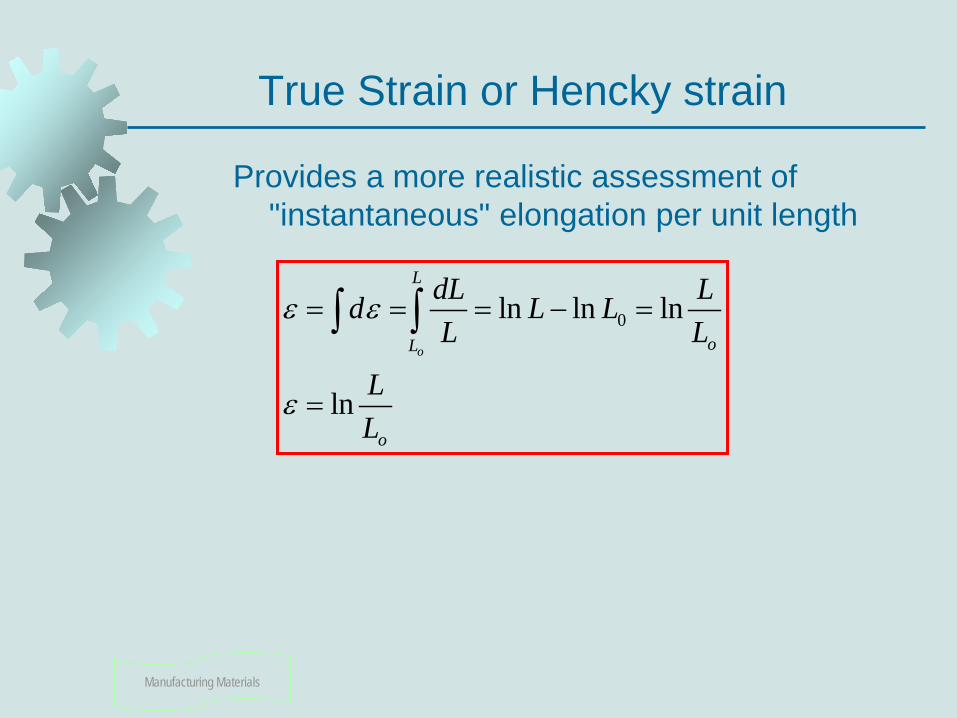
True Strain or Hencky strain
Provides a more realistic assessment of "instantaneous" elongation per unit length
0ln ln ln
ln
o
L
oL
o
dL Ld L LL L
LL
ε ε
ε
= = = − =
=
∫ ∫
Manufacturing Materials
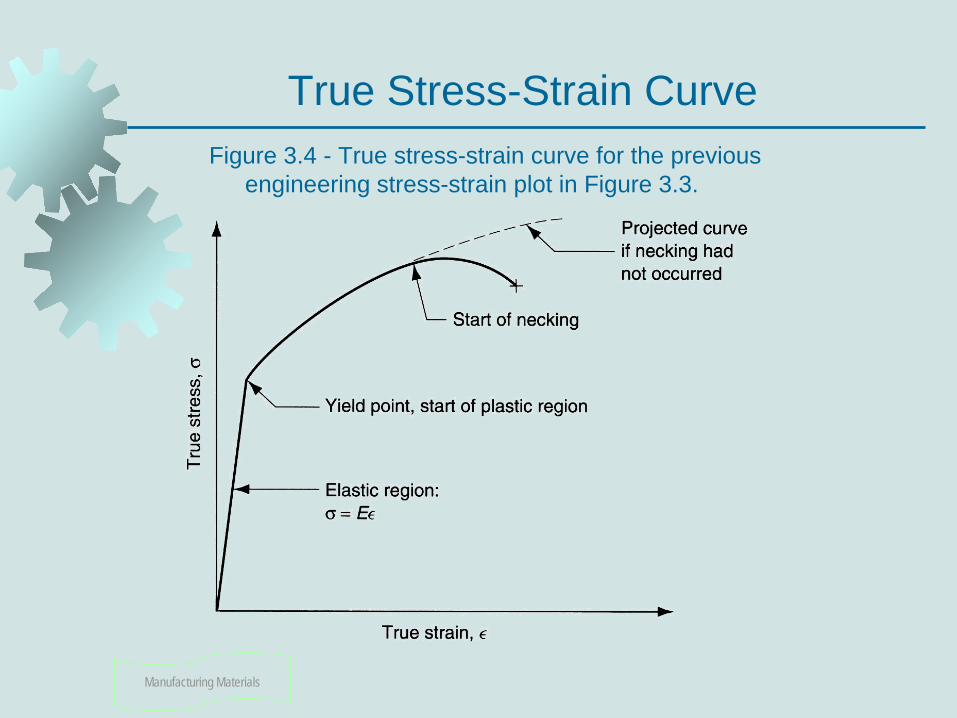
True Stress-Strain Curve Figure 3.4 - True stress-strain curve for the previous
engineering stress-strain plot in Figure 3.3.
Manufacturing Materials
Strain Hardening in Stress-Strain Curve
Note that true stress increases continuously in the plastic region until necking In the engineering stress-strain curve, the
significance of this was lost because stress was based on an incorrect area value
It means that the metal is becoming stronger as strain increases This is the property called strain hardening
Manufacturing Materials
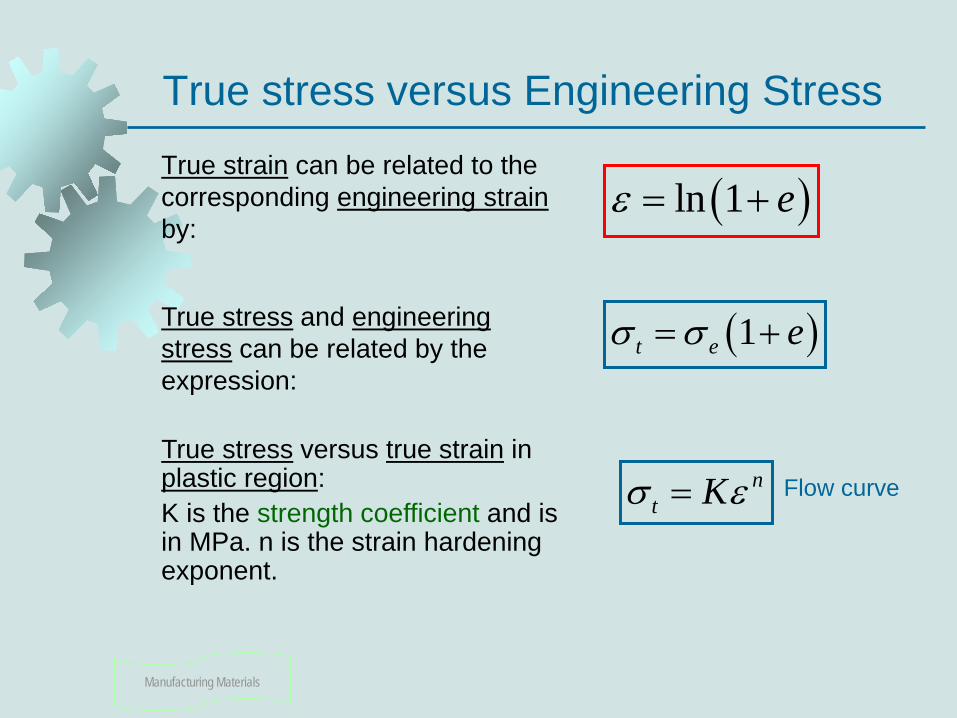
True stress versus Engineering Stress True strain can be related to the corresponding engineering strain by:
( )ln 1 eε = +
( )1t e eσ σ= +True stress and engineering stress can be related by the expression:
nt Kσ ε= Flow curve
True stress versus true strain in plastic region: K is the strength coefficient and is in MPa. n is the strain hardening exponent.

Manufacturing Materials
Flow Curve True stress-strain curve a straight line in a log-log plot:
nKεσ =( )( )
ln ln
ln ln ln
ln ln lnthis is similar to:
n
n
K
K
K n
Y b nX
σ ε
σ ε
σ ε
=
= +
= +
= +
Figure 3.5 True stress-strain curve plotted on log-log scale.
if =1, thenK
εσ =
Manufacturing Materials
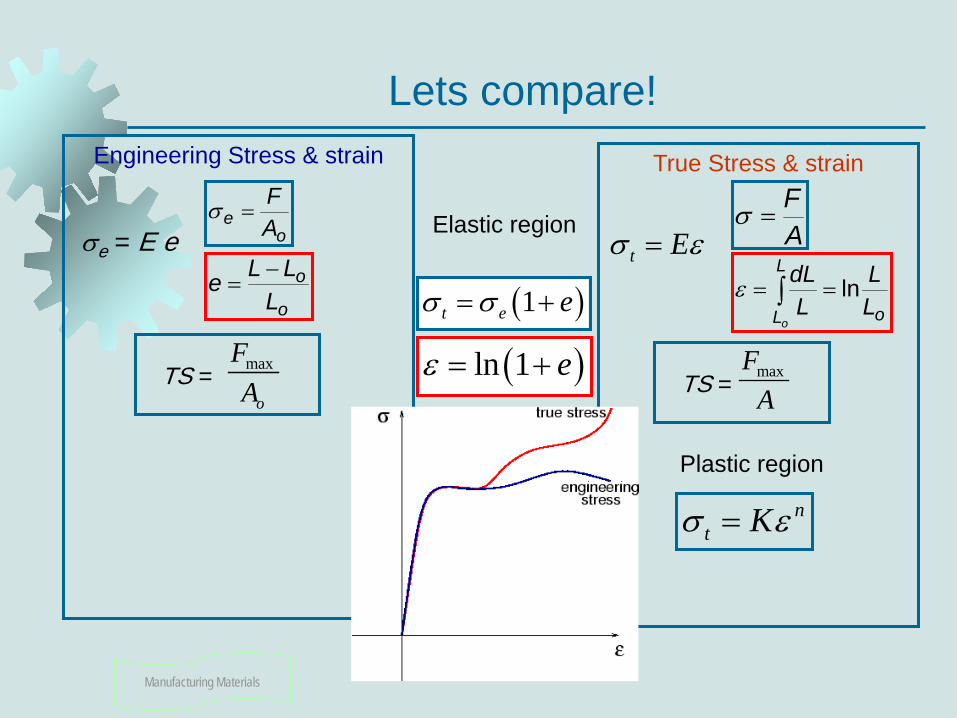
True Stress & strain
Engineering Stress & strain
Lets compare!
oe A
F=σ
o
oL
LLe −=
σe = E e
max
o
FATS =
AF
=σ
o
L
L LL
LdL
o
ln== ∫εt Eσ ε=
maxFATS =
nt Kσ ε=
( )ln 1 eε = +
( )1t e eσ σ= +
Elastic region
Plastic region
Manufacturing Materials
Lets compare!
Toughness: area under
strain-stress graph
(combination of ductility and
strength)
Manufacturing Materials
Categories of Stress-Strain Relationship
Perfectly elastic Elastic and perfectly plastic Elastic and strain hardening
Manufacturing Materials
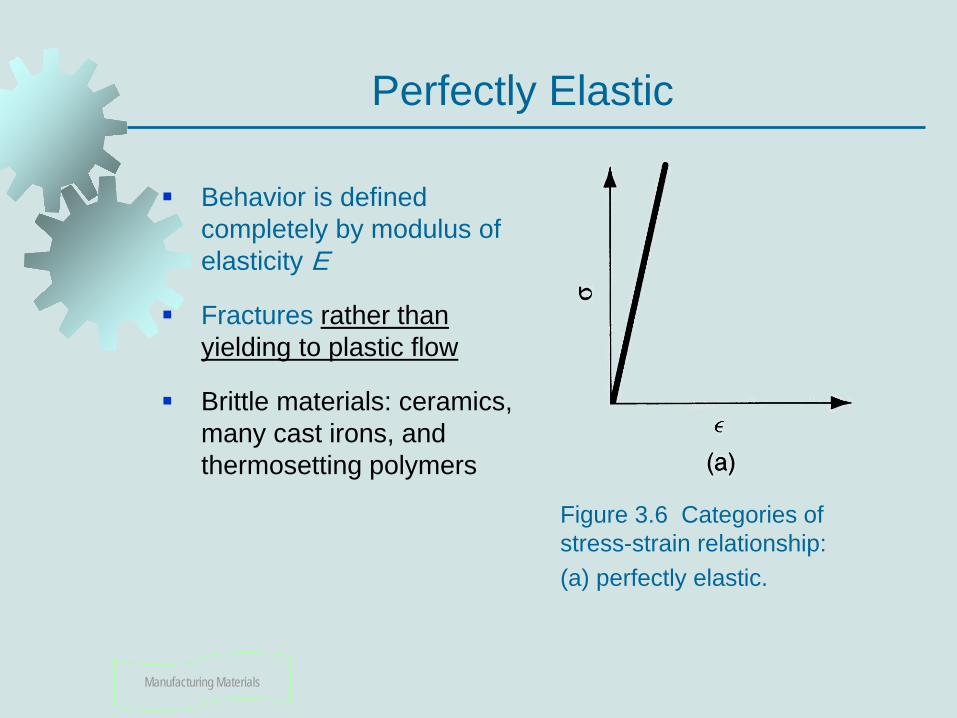
Perfectly Elastic
Behavior is defined completely by modulus of elasticity E
Fractures rather than yielding to plastic flow
Brittle materials: ceramics, many cast irons, and thermosetting polymers
Figure 3.6 Categories of stress-strain relationship: (a) perfectly elastic.
Manufacturing Materials
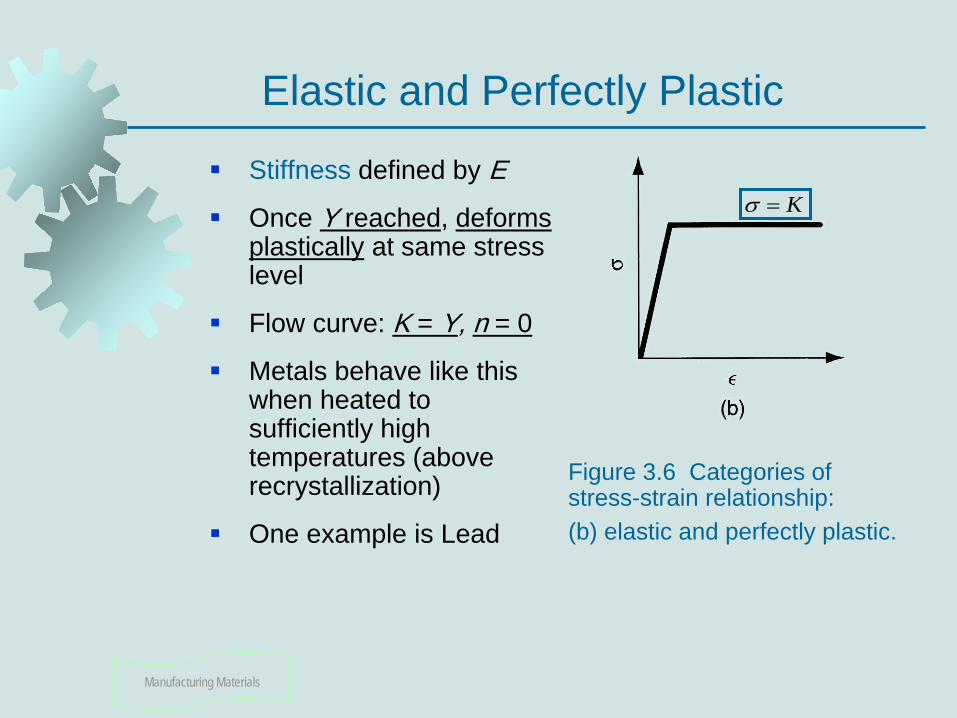
Elastic and Perfectly Plastic
Stiffness defined by E
Once Y reached, deforms plastically at same stress level
Flow curve: K = Y, n = 0
Metals behave like this when heated to sufficiently high temperatures (above recrystallization)
One example is Lead
Figure 3.6 Categories of stress-strain relationship: (b) elastic and perfectly plastic.
Kσ =
Manufacturing Materials
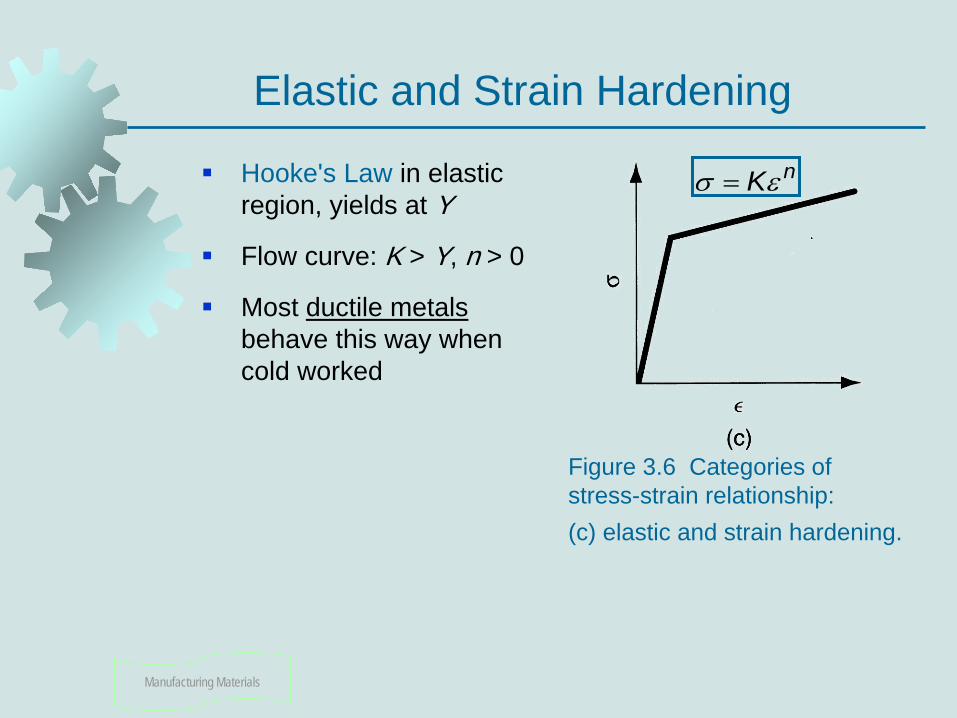
Elastic and Strain Hardening
Hooke's Law in elastic region, yields at Y
Flow curve: K > Y, n > 0
Most ductile metals behave this way when cold worked
Figure 3.6 Categories of stress-strain relationship: (c) elastic and strain hardening.
nKεσ =
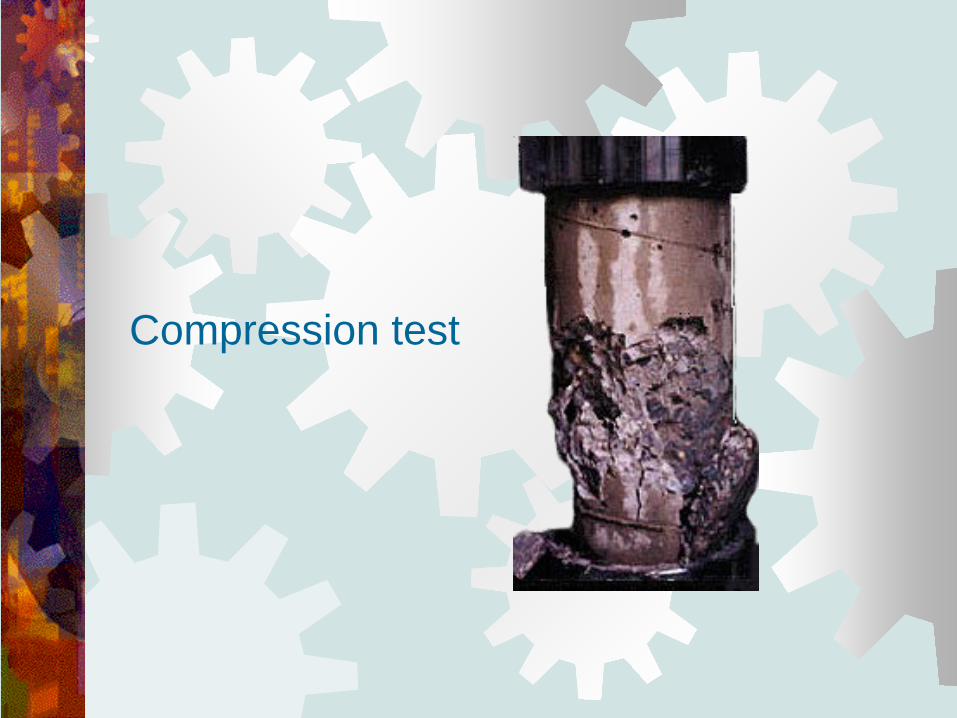
Compression test
Manufacturing Materials
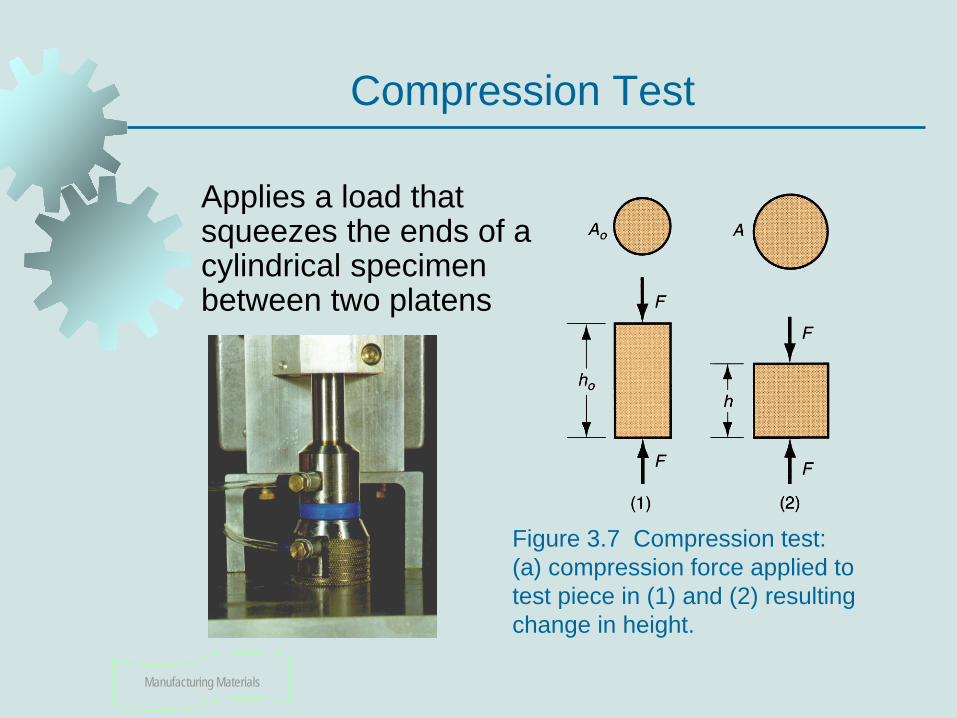
Compression Test
Applies a load that squeezes the ends of a cylindrical specimen between two platens
Figure 3.7 Compression test: (a) compression force applied to test piece in (1) and (2) resulting change in height.
Manufacturing Materials
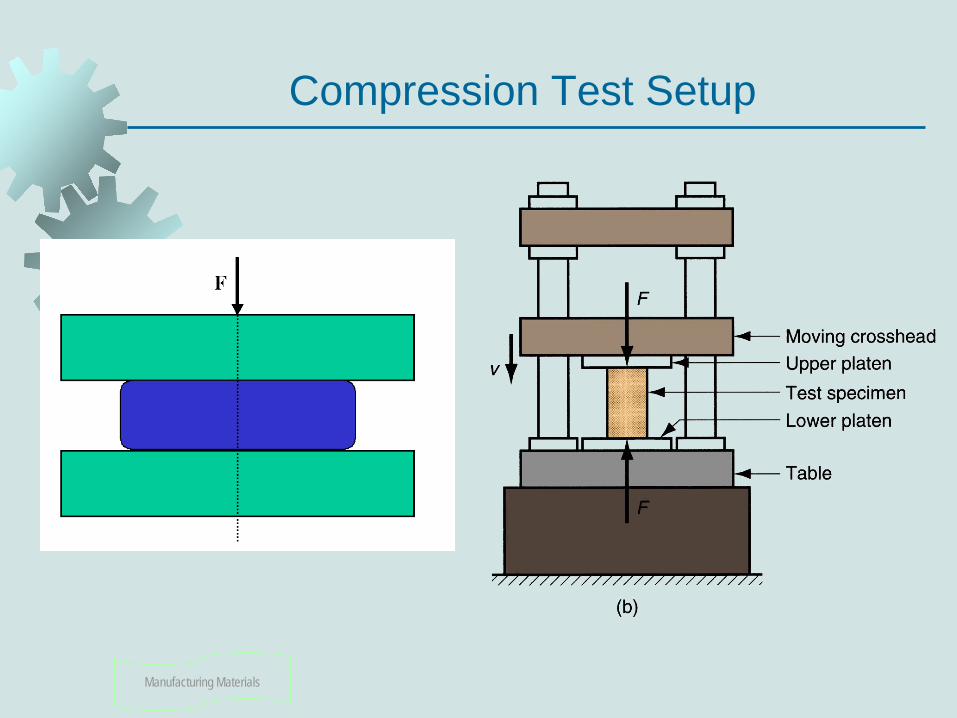
Compression Test Setup
Manufacturing Materials
Engineering Stress in Compression
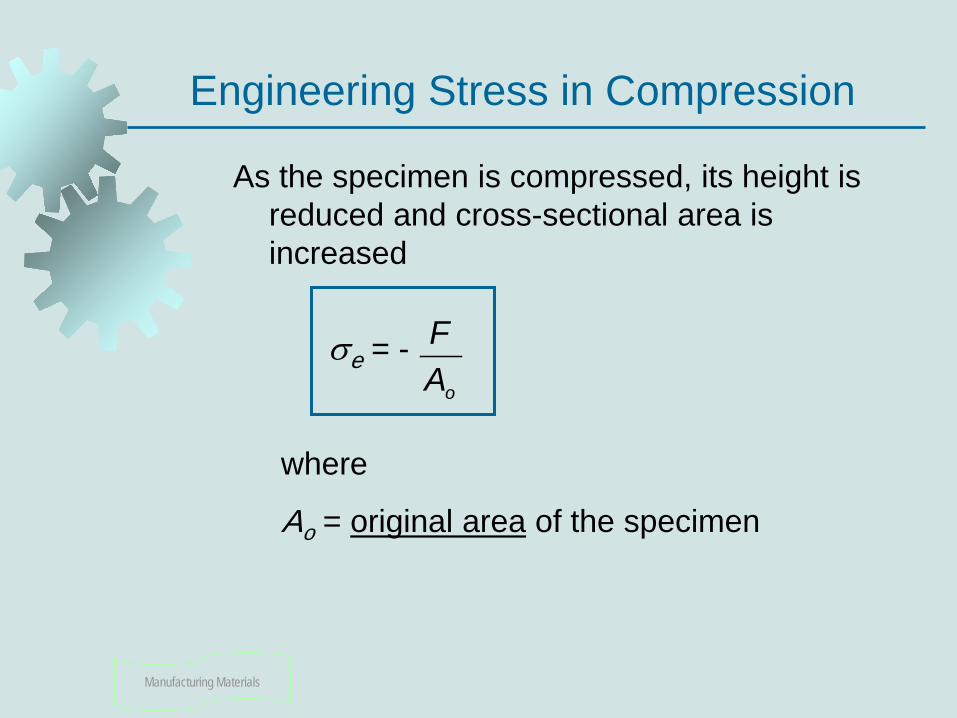
As the specimen is compressed, its height is reduced and cross-sectional area is increased
σe = -
where
Ao = original area of the specimen
oAF
Manufacturing Materials
Engineering Strain in Compression
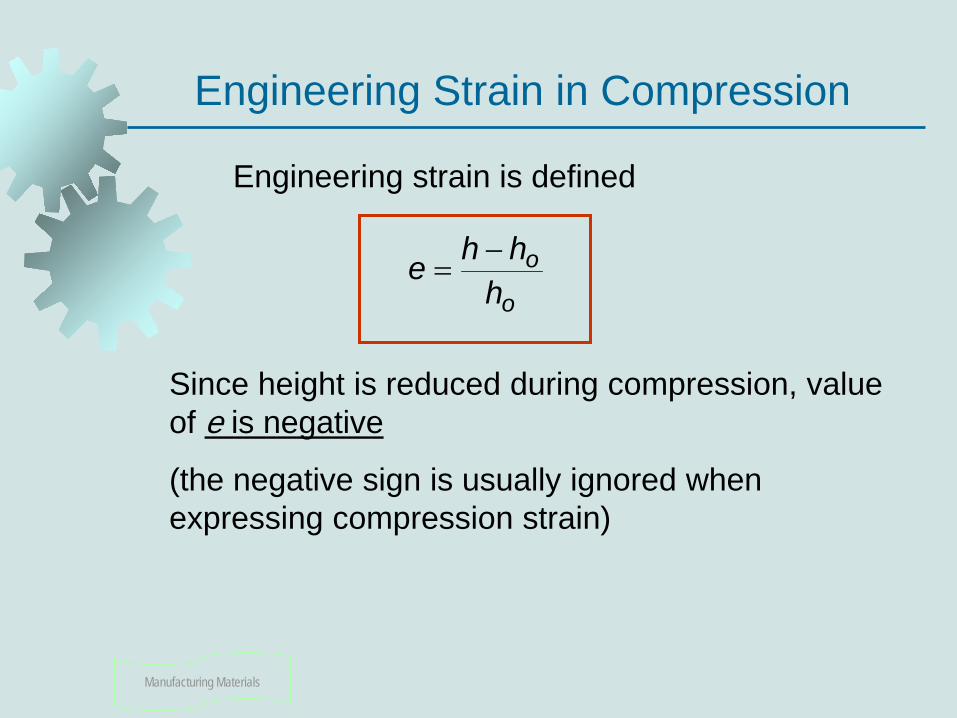
Engineering strain is defined
Since height is reduced during compression, value of e is negative
(the negative sign is usually ignored when expressing compression strain)
o
oh
hhe −=
Manufacturing Materials
Stress-Strain Curve in Compression
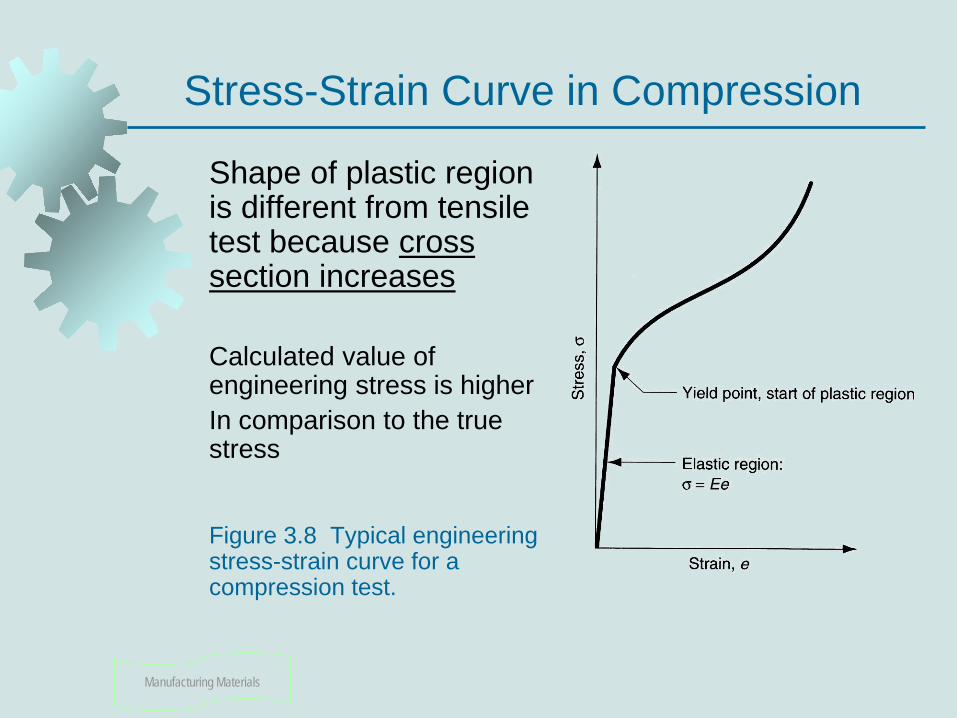
Shape of plastic region is different from tensile test because cross section increases Calculated value of engineering stress is higher In comparison to the true stress
Figure 3.8 Typical engineering stress-strain curve for a compression test.
Manufacturing Materials
Tensile Test vs. Compression Test
Although differences exist between engineering stress-strain curves in tension and compression, the true stress-strain relationships are nearly identical
Since tensile test results are more common, flow curve values (K and n) from tensile test data can be applied to compression operations
When using tensile K and n data for compression, ignore necking, which is a phenomenon peculiar to straining induced by tensile stresses
Barreling and edge fracture happen
Related Documents