Sci.Int.(Lahore),26(4),1707-1718,2014 ISSN 1013-5316; CODEN: SINTE 8 1707 MEASURING PERFORMANCE OF SMES IN PAKISTAN USING PLS-SEM:EVALUATING MBNQA CRITERIA AS TQM FRAMEWORK a,b S. M. Irfan, b Daisy Mung Hung Kee, a R.W. Qureshi, c Rashid Hussain a COMSATS Institute of Information Technology, Lahore, Pakistan b University Sains Malaysia, c Leading Edge Human Capital Management Solutions, Inc, Canada [email protected] ABSTRACT: The purpose of this study is to empirically investigate the impact of TQM framework based on MBNQA criteria on operational and organizational performance of manufacturing SMEs of Pakistan. TQM practices are hypothesized as a platform to enhance both operational and organizational performance of SMEs in Pakistan. This study is twofold, first of all it is investigated that TQM practices helps to increase primary performance measures expressed in terms of operational performance and secondly it is investigated that how an effectively implemented TQM system contributes in increasing organizational performance of SMEs. This study uses PLS-SEM method to check the casual relationship between TQM practices, operational and organizational performance. Sample data was collected from four major cities of Pakistan and these cities are considered to be the hub of SMEs in Pakistan. Results of this study indicates that adoption of TQM practices helps to strengthen the internal processes and increase primary performance of SMEs expressed as operational performance and a effectively implemented TQM has strong influence in increasing organizational performance. This study is helpful for the mangers who intend to achieve organizational and business excellence both at local and international level. Keywords: Total Quality Management, MBNQA, Small and Medium Enterprises, Pakistan, Organizational Performance 1. INTRODUCTION Small and medium-sized enterprises (SMEs) of a country play a vital role for the national economic growth, a key contributor in the national GDP, and a source of employment generation for human capital of the country.In emerging nations more than half of the employment is generated by SMEs and are the major contributor in the national economic development[67]. Economic development of both developed and developing countries is solely depending on the SMEs success[14] and now economic system of many countries is anchored by highly productive SMEs business[34]. As compared to large companies SMEs with a very small capital are generating employment, meeting product quality, innovations, and contributing in the national economic development. However, to deliver quality products at lowest costs and to compete at local and international level SMEs are at different stage of quality movement in Pakistan. Quality has been recognized as the vital success driver and to meet the export requirements at international level majority of the SMEs in Pakistan have implemented ISO-9000-2008 series of standards as a first step towards total quality management. The concept of TQM has been developed as a result of intense global competition which was first developed at Japanese manufacturing industry and later on successfully adapted by the US manufacturing companies. Later, TQM got recognition in Europe and other developed countries whereas, developing countries of Asia, specifically Pakistan is late adopter of TQM. Now, TQM has been widely accepted quality management strategy to increase quality and boost organizational performance both for both large and small organization in developed and developing countries.Dahlgaard-Park, Chen [18] concludedthat TQM is the first comprehensive management approach which embraces both Western and Eastern ways of thinking and covers three major and broad areas of management, human resource management (HRM), strategic management, and operations management. TQM is an integration of quality tools, techniques, and quality management practices; addressing HRM, strategic management, and operations management and thus TQM can be best understand as ‘a management of innovation’, if not a ‘management revolution’ [17]. It is evident from literature, TQM practices, critical success factors (CSFs) of TQM quality management practices, statistical quality tools and techniques, principles of ISO 9000-2008 series of standards, and quality awards criteria are considered as TQM implementation framework to increase productivity at all levels in the organization. Since 1990’s quality award models has been frequently used in many organizations as a TQM implementation framework [9] and are also considered as operational models for TQM [16, 68]. Plethora of qualitative and quantitative studies had been conducted and showed a positive relationship among TQM implementation and organizational performance [1, 2, 4, 8, 29, 47, 57, 70].Numerous authors made an attempt on the applicability of TQM practices in the manufacturing and services and its impact on organizational performance of SMEs in developing countries [6, 22, 36, 43, 54, 57, 63, 69]. There are about 3.2 million SMEs operating in Pakistan and contributing more than 30% of national GDP, earns 35% export earnings, 78% of non-agriculture employment, and majority of the SMEs are with less than 99 people[4]. About 99% of the SMEs units have employed less than 99 people and this sector is badly affected due to insufficient

Welcome message from author
This document is posted to help you gain knowledge. Please leave a comment to let me know what you think about it! Share it to your friends and learn new things together.
Transcript
Sci.Int.(Lahore),26(4),1707-1718,2014 ISSN 1013-5316; CODEN: SINTE 8 1707
MEASURING PERFORMANCE OF SMES IN PAKISTAN USING PLS-SEM:EVALUATING MBNQA CRITERIA AS TQM
FRAMEWORK a,b
S. M. Irfan,bDaisy Mung Hung Kee,
aR.W. Qureshi,
cRashid Hussain
aCOMSATS Institute of Information Technology, Lahore, Pakistan
bUniversity Sains Malaysia,
cLeading Edge Human Capital Management Solutions, Inc, Canada
ABSTRACT: The purpose of this study is to empirically investigate the impact of TQM framework based
on MBNQA criteria on operational and organizational performance of manufacturing SMEs of Pakistan.
TQM practices are hypothesized as a platform to enhance both operational and organizational
performance of SMEs in Pakistan. This study is twofold, first of all it is investigated that TQM practices
helps to increase primary performance measures expressed in terms of operational performance and
secondly it is investigated that how an effectively implemented TQM system contributes in increasing
organizational performance of SMEs. This study uses PLS-SEM method to check the casual relationship
between TQM practices, operational and organizational performance. Sample data was collected from four
major cities of Pakistan and these cities are considered to be the hub of SMEs in Pakistan. Results of this
study indicates that adoption of TQM practices helps to strengthen the internal processes and increase
primary performance of SMEs expressed as operational performance and a effectively implemented TQM
has strong influence in increasing organizational performance. This study is helpful for the mangers who
intend to achieve organizational and business excellence both at local and international level.
Keywords: Total Quality Management, MBNQA, Small and Medium Enterprises, Pakistan,
Organizational Performance
1. INTRODUCTION Small and medium-sized enterprises (SMEs) of a country
play a vital role for the national economic growth, a key
contributor in the national GDP, and a source of
employment generation for human capital of the country.In
emerging nations more than half of the employment is
generated by SMEs and are the major contributor in the
national economic development[67]. Economic development
of both developed and developing countries is solely
depending on the SMEs success[14] and now economic
system of many countries is anchored by highly productive
SMEs business[34]. As compared to large companies SMEs
with a very small capital are generating employment,
meeting product quality, innovations, and contributing in the
national economic development. However, to deliver quality
products at lowest costs and to compete at local and
international level SMEs are at different stage of quality
movement in Pakistan. Quality has been recognized as the
vital success driver and to meet the export requirements at
international level majority of the SMEs in Pakistan have
implemented ISO-9000-2008 series of standards as a first
step towards total quality management.
The concept of TQM has been developed as a result of
intense global competition which was first developed at
Japanese manufacturing industry and later on successfully
adapted by the US manufacturing companies. Later, TQM
got recognition in Europe and other developed countries
whereas, developing countries of Asia, specifically Pakistan
is late adopter of TQM. Now, TQM has been widely
accepted quality management strategy to increase quality
and boost organizational performance both for both large
and small organization in developed and developing
countries.Dahlgaard-Park, Chen [18] concludedthat TQM is
the first comprehensive management approach which
embraces both Western and Eastern ways of thinking and
covers three major and broad areas of management, human
resource management (HRM), strategic management, and
operations management. TQM is an integration of quality
tools, techniques, and quality management practices;
addressing HRM, strategic management, and operations
management and thus TQM can be best understand as ‘a
management of innovation’, if not a ‘management
revolution’ [17].
It is evident from literature, TQM practices, critical success
factors (CSFs) of TQM quality management practices,
statistical quality tools and techniques, principles of ISO
9000-2008 series of standards, and quality awards criteria
are considered as TQM implementation framework to
increase productivity at all levels in the organization. Since
1990’s quality award models has been frequently used in
many organizations as a TQM implementation framework
[9] and are also considered as operational models for TQM
[16, 68].
Plethora of qualitative and quantitative studies had been
conducted and showed a positive relationship among TQM
implementation and organizational performance [1, 2, 4, 8,
29, 47, 57, 70].Numerous authors made an attempt on the
applicability of TQM practices in the manufacturing and
services and its impact on organizational performance of
SMEs in developing countries [6, 22, 36, 43, 54, 57, 63, 69].
There are about 3.2 million SMEs operating in Pakistan and
contributing more than 30% of national GDP, earns 35%
export earnings, 78% of non-agriculture employment, and
majority of the SMEs are with less than 99 people[4]. About
99% of the SMEs units have employed less than 99 people
and this sector is badly affected due to insufficient
1708 ISSN 1013-5316; CODEN: SINTE 8 Sci.Int.(Lahore),26(4),1707-1718,2014
managerial skills of its human resource development [4].
Majority of the SMEs has in place a minimal quality
standards and thus there is a need to develop an
understanding among the SMEs about the importance of
quality management [38].Government has established Small
and Medium Enterprises Development Authority (SMEDA)
in 1998 to improve the performance of SMEs and beside this
numerous international agencies; Asian Development Bank,
United Nation Development Program, International Labour
Organization, are also contributing in the development of
SMEs in Pakistan [7].
Pakistan is considered to be a late adapter of TQM, and in
2010, National productivity organization of Pakistan
introduce Prime Minister Quality Award (PMQA) based on
MBNQA. Only limited studies has been conducted on TQM
in Pakistan and there is a lack of systematic empirical
research work regarding TQM adoption and its impact on
SMEs performance in emerging economies such as Pakistan.
Another reason is that Pakistan is among the late adapter of
TQM. This study propose an operational TQM and
performance framework consisting of six TQM core
elements based on MBNQA criteria that includes:
leadership, strategic planning, customer focus, information
analysis and system, process management, and people
management. Moreover, this study adds to current body of
knowledge by providing new empirical findings and data by
examining the relationship among core TQM practices and
organizational performance expressed by operational and
quality performance of SMEs in Pakistan. Findings of this
study help the SMEs managers’ about the increased
importance of TQM and how it will be benefited to penetrate
in the international market to increase exports and gain
sustainable competitive advantage at local and international
level.
Based on the previous literature on TQM adoption in SMEs,
purpose of this study is twofold:
1. To evaluate the impact of TQM practices on
primary performance measures expressed as operational
performance which ensures the effectiveness of TQM
implementation.
2. To examine how effective implementation of TQM
helps to increase organizational performance.
Remaining part of this paper starts with a comprehensive
review of literature, hypothesis development, followed by
research methodology and finally results, discussions,
conclusions, and managerial implications.
2. LITERATURE REVIEW Since 1981, a rich spectrum of work on TQM has been made
but still there is no consensus about the definition of quality
or definition of TQM [22]. Definitions on quality in
literature provides us insights that there is no global
definition for quality but the existed definitions may be
appropriate in different circumstances [56]. The term
‘quality’ advocates different things to different people
because defining quality is considered as a first step in
almost all type of quality improvement initiatives and also
provide a vision and mission to contribute in quality
improvement efforts for organization [31]. In spite of all this
debate the existing definitions on quality addresses the core
concepts of quality advocated by quality gurus like;
“conformance to specifications [13]”, “fitness for use [37]”,
“meeting and exceeding customer expectation [21]”.
Similarly same confusion is with the definition of TQM and
there is no consensus among the scholars about the
definition of TQM and there is no universal list of TQM
practices, but core concept and core practices are included in
almost all the studies. Core TQM practices that address the
teachings of quality gurus includes; management
commitment, training and development, employee
involvement and empowerment, process management,
system and process improvement, leadership role. Today,
TQM is a philosophy that aims to change organizational
culture from passive and defensive culture to proactive and
open culture and the core principles must address, customer
satisfaction, continuous improvement, and employees
involvement at all levels of the organization [19].
Saraph, Benson [60] are the first who presented eight TQM
practices; role of management leadership and quality policy,
role of quality department, training, product or service
design, supplier quality management, process management,
quality data and reporting, employee relations. They are
considered as a major contributor for the development of this
field and laid the foundation of empirical research in this
field. After this a vast amount of literature has been evolved
to examine the relationship among TQM practices and
performance linkages. Besides this, various studies on TQM
has been undertaken and many researchers have developed
instruments and empirically tested the impact of TQM
practices on different performance measures[like; 2, 3, 5, 25,
26, 42, 44].Besides this, Institutions such as MBNQA,
EFQM, and Deming Prize has also developed instruments to
address management approaches, techniques, issues, and
empirical investigations has been conducted to further
enlighten these issues [22].
Initially TQM has been successfully implemented
in large manufacturing companies, and later it start
penetrating in various service sectors, and SMEs as a
strategy to increase efficiency, effectiveness of process and
system, and performance at all levels in the organization.
Yusof and Aspinwall [69] has conducted a study to analyze
the level of TQM practices adopted by SMEs of Malaysia.
This study includes; leadership, measurement and feedback,
quality improvement tools and techniques, supplier quality,
continuous improvement, human resource development,
resources, education and training, culture and work
environment, and system and processes. Rahman [55]
analyzed that leadership, employee empowerment and
involvement, training and development, strategy and
planning, customer management, and information and
analysis are critical for the successful implementation of
TQM in Australian SMEs. Empirical results of this study
shows that there is a significant association among TQM
practices and business outcomes expressed in terms of
profitability, increased number of customers, and revenue. It
is also observed that human resource and leadership role are
critical for business success but little attention has been
given to the other TQM factors.
Sci.Int.(Lahore),26(4),1707-1718,2014 ISSN 1013-5316; CODEN: SINTE 8 1709
Sohail and Hoong [63] examined the relationship among
TQM practices (top management commitment , customer
involvement and satisfaction, employee training and
development, process management, quality measurement
and benchmarking, strategy and planning) and
organizational performance with and without ISO-9000
certified Malaysian SMEs. Authors of this study analyzed
that TQM practices have significant impact on ISO-9000
certified SMEs performance. Demirbag, Tatoglu [22] also
analyze the impact of TQM practices on Turkish SMEs
performance and result indicates that TQM practices has
strong association with non-financial performance and weak
relationship with financial performance. Salaheldin [57] has
analyzed the impact of TQM practices on operational and
organizational performance in 297 industrial SMEs of Qatar.
Author has grouped the TQM practices in tactical, strategic,
and operational factors and has observed positive impact on
operational and organizational performance. Author further
analyzed that strategic factors (leadership, top management
support, continuous improvement, benchmarking,
organizational culture and quality goals and policy) are
critical for successful implementation of TQM in Qatari
manufacturing SMEs.
Valmohammadi [67] examine that TQM practices;
leadership, communication and quality information system,
customer focus, supplier management, process management,
employee management, and quality tools and techniques has
significant relationship with organizational performance of
the Iranian manufacturing SMEs. Author, further
investigated that leadership plays a significant role in
increasing organizational performance and SMEs to find
obstacles by fully utilizing the TQM practices namely;
supplier management and tools and techniques.
Kureshi, Faheem Qureshi [38] and Kureshi, Mann [39]
conducted a study to check the current level of TQM
practices in service sector SMEs of Pakistan. A total 19
quality management practices was selected using Delphi
research and a significant gap is reported among the SMEs
entrepreneurs about the knowledge of TQM practices.
Results of this study also show that there is strong usage of
customer relation management practices (employee
suggestion scheme, customer survey, quality management
systems) while low usage of statistical and supplier
development practices.
However, manager perceived that these techniques are
helpful in increasing performance and there is strong
correlation between TQM practices specifically, six sigma
and 5S. Malik, Iqbal [43] identified that; top management
commitment, benchmarking, supplier relationship, and
customer focus are critical for TQM implementation in
Pakistani SMEs and has significant impact on performance
of SMEs and further investigated that TQM practices has
better impact on performance of ISO-9000 certified SMEs
than non ISO-9000 certified SMEs.
Likewise the definition of quality and TQM there is also no
consensus about the systematic, comprehensive, or
universally accepted framework that put TQM in practice [9,
69]. First TQM framework was based on the teachings of
quality gurus such as Deming, Crosby, Juran as discussed by
[20]. Second framework was based on the TQM practices or
critical success factors of TQM advocated by [like; 2, 26, 46,
47, 60], third TQM framework was based on
standardization , i.e. ISO 9000 series of standards and fourth
TQM framework was based on quality awards and
performance measurement models like Malcolm Baldrige
National Quality Award (MBNQA), Deming Prize Award
and the European Quality Award (EFQM).
Based on TQM literature, authors of the present study
adapted MBNQA criteria as a set of TQM practices for
SMEs in Pakistan to measure its impact on organizational
performancebased on manger perceptions. Firstly, the major
reason for selecting MBNQA framework is that it has not
yet been tested in Pakistan and Prime Minster Quality award
was established in Pakistan in 2010 and it is based MBNQA
criteria. MBNQA framework addresses the major domain of
quality management principles advocated and envisioned by
the quality gurus as discussed by [16, 20]. Secondly,
MBNQA is well accepted model and has been empirically
verified by numerous authors around the globe [52, 58, 66]
in all major manufacturing, services and also in SMEs.
Thirdly, it also includes the ‘soft’ and ‘hard’ aspects of TQM
which includes human resource focus, customer focus, and
leadership and management focus for quality initiatives and
improvement whereas, hard aspects are explained through
strategic planning, information analysis and process
management [68] and these constructs includes the
applications of organizational design and statistics [40].
3. RESEARCH HYPOTHESIS DEVELOPMENT In order to investigate the relationship among TQM
practices, operational and organizational performance, the
criteria to measure the operational and organizational
performance have to establish to provide outcome measures
for the research hypothesis
Organizational performance is considered to be a complex
phenomenon but today it is considered as the most vibrant
research area. Empirical studies conducted on TQM and
performance linkage provides a wide range of performance
measures [23]. These performance measures includes;
financial and non-financial measures, operational
performance, quality performance, innovation performance,
employees performance, customer satisfaction, operating
performance, market performance, overall business
performance. Organizational performance is difficult and
complex construct but performance measurement is critical
for the effective management [57]. Performance may be
defined as the degree to which an operation fulfill the
performance objectives both primary (meeting internal
customer needs and wants) and secondary performance
measure (meeting external customer desires) [62].
Numerous studies has been conducted on TQM to measure
the impact of TQM practices on organizational performance
[48, 50, 58], quality performance [2, 25, 41, 52, 53],
innovation and R&D [51, 52, 64] and operational
performance [15, 30, 45, 47, 57, 66].
1710 ISSN 1013-5316; CODEN: SINTE 8 Sci.Int.(Lahore),26(4),1707-1718,2014
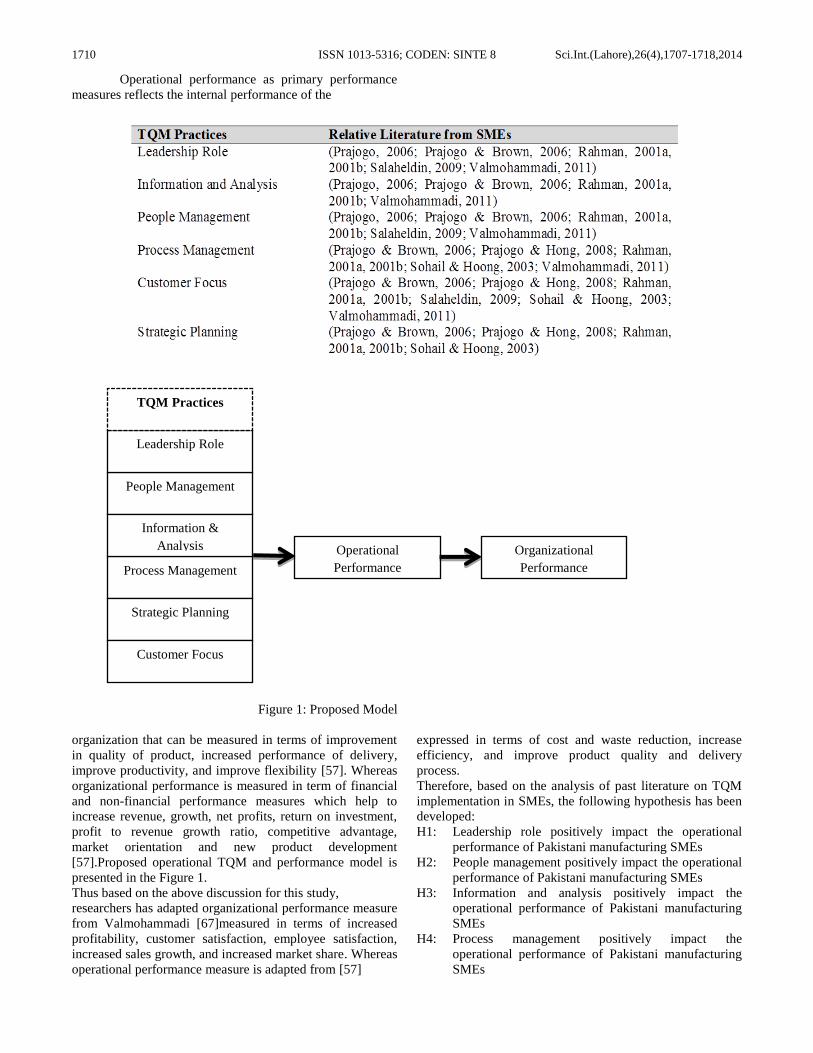
Operational performance as primary performance
measures reflects the internal performance of the
Figure 1: Proposed Model
organization that can be measured in terms of improvement
in quality of product, increased performance of delivery,
improve productivity, and improve flexibility [57]. Whereas
organizational performance is measured in term of financial
and non-financial performance measures which help to
increase revenue, growth, net profits, return on investment,
profit to revenue growth ratio, competitive advantage,
market orientation and new product development
[57].Proposed operational TQM and performance model is
presented in the Figure 1.
Thus based on the above discussion for this study,
researchers has adapted organizational performance measure
from Valmohammadi [67]measured in terms of increased
profitability, customer satisfaction, employee satisfaction,
increased sales growth, and increased market share. Whereas
operational performance measure is adapted from [57]
expressed in terms of cost and waste reduction, increase
efficiency, and improve product quality and delivery
process.
Therefore, based on the analysis of past literature on TQM
implementation in SMEs, the following hypothesis has been
developed:
H1: Leadership role positively impact the operational
performance of Pakistani manufacturing SMEs
H2: People management positively impact the operational
performance of Pakistani manufacturing SMEs
H3: Information and analysis positively impact the
operational performance of Pakistani manufacturing
SMEs
H4: Process management positively impact the
operational performance of Pakistani manufacturing
SMEs
Process Management
People Management
Information &
Analysis
Leadership Role
Strategic Planning
Customer Focus
Organizational
Performance
Operational
Performance
TQM Practices
Sci.Int.(Lahore),26(4),1707-1718,2014 ISSN 1013-5316; CODEN: SINTE 8 1711
H5: Customer focus positively impact the operational
performance of Pakistani manufacturing SMEs
H6: Strategic planning positively impact the operational
performance of Pakistani manufacturing SMEs
H7: Operational performance positively impact the
organizational performance of Pakistani
manufacturing SMEs
3.1. Research Methodology
This section includes; survey instrument, discussion on
sample, data collection procedures and the variables used in
the study. This section also includes discussion on statistical
methods used to evaluate the relationship between TQM
practices and performance of SMEs in Pakistan.
3.2. Survey Instrument
Survey instrument for this study has been adapted from
Prajogo [49] and initially the questionnaire includes 37 items
from which 6 items were deleted during data analysis and
initial interview with the quality assurance mangers at
SMEs. The questionnaire was in simple English and was
easily understandable to the respondents as these
respondents were also involved in dealing with international
customers. Each item in the questionnaire was measured on
five point Likert scale ranging from “strongly agree” to
“strongly disagree”. The extent of TQM implementation and
the level of organization performance both operational and
organizational performance were determined based on the
manager’s perceptions of how the organization was
performing on each constituent item.
3.3. Sample and procedure
The target population of this study was the employees
working at managerial level in SMEs in three major cities of
Punjab, Pakistan (Gujranwala, Gujrat, and Sialkot).
Gujranwala and Gujarat are considered as the hub of SMEs
in Punjab, Pakistan and these two cities are famous in
manufacturing electric fans, electric motors, washing
machines, ceramic, cutlery, leather, and power looms etc.
Sialkot is also one of the famous cities of Punjabfor export
of sports goods, surgical items, and leather products.
Majority of the SMEs in these cities are involved in exports
for many years and these SMEs had implemented ISO 9000-
2008 series of standards to meet the export requirements and
to assure quality of products.
Data was collected using a questionnaire survey and was
distributed using personal links of authors, however, a
formal permission was taken through HR or Admin
department and Chief Executive of each SMEs before
conducting this survey. A stratified sampling approach was
utilized in order to get heterogeneity among respondents to
reduce the common bias in survey. Questionnaire for this
study consists of two sections; first section was about the
general information of SMEs and the second section is to
inquire information regarding implementation of TQM
practices in SMEs and third section is about the
organizational performance measured in terms of operation
and quality performance of SMEs.
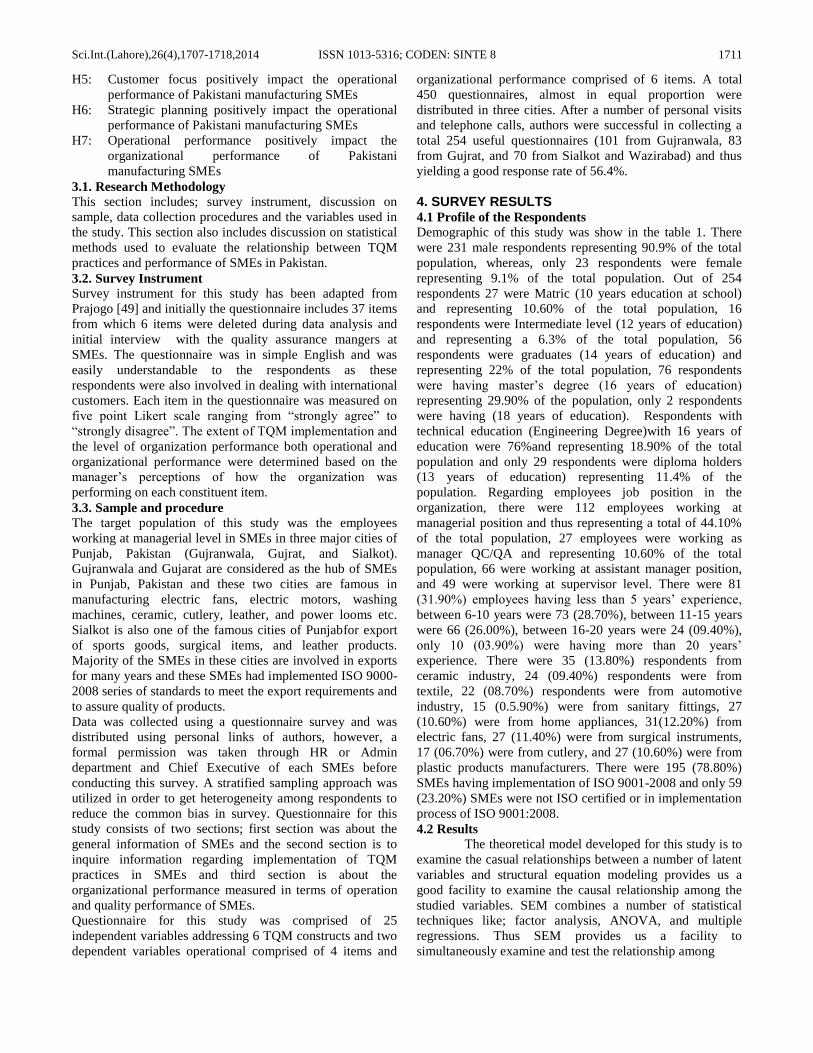
Questionnaire for this study was comprised of 25
independent variables addressing 6 TQM constructs and two
dependent variables operational comprised of 4 items and
organizational performance comprised of 6 items. A total
450 questionnaires, almost in equal proportion were
distributed in three cities. After a number of personal visits
and telephone calls, authors were successful in collecting a
total 254 useful questionnaires (101 from Gujranwala, 83
from Gujrat, and 70 from Sialkot and Wazirabad) and thus
yielding a good response rate of 56.4%.
4. SURVEY RESULTS 4.1 Profile of the Respondents
Demographic of this study was show in the table 1. There
were 231 male respondents representing 90.9% of the total
population, whereas, only 23 respondents were female
representing 9.1% of the total population. Out of 254
respondents 27 were Matric (10 years education at school)
and representing 10.60% of the total population, 16
respondents were Intermediate level (12 years of education)
and representing a 6.3% of the total population, 56
respondents were graduates (14 years of education) and
representing 22% of the total population, 76 respondents
were having master’s degree (16 years of education)
representing 29.90% of the population, only 2 respondents
were having (18 years of education). Respondents with
technical education (Engineering Degree)with 16 years of
education were 76%and representing 18.90% of the total
population and only 29 respondents were diploma holders
(13 years of education) representing 11.4% of the
population. Regarding employees job position in the
organization, there were 112 employees working at
managerial position and thus representing a total of 44.10%
of the total population, 27 employees were working as
manager QC/QA and representing 10.60% of the total
population, 66 were working at assistant manager position,
and 49 were working at supervisor level. There were 81
(31.90%) employees having less than 5 years’ experience,
between 6-10 years were 73 (28.70%), between 11-15 years
were 66 (26.00%), between 16-20 years were 24 (09.40%),
only 10 (03.90%) were having more than 20 years’
experience. There were 35 (13.80%) respondents from
ceramic industry, 24 (09.40%) respondents were from
textile, 22 (08.70%) respondents were from automotive
industry, 15 (0.5.90%) were from sanitary fittings, 27
(10.60%) were from home appliances, 31(12.20%) from
electric fans, 27 (11.40%) were from surgical instruments,
17 (06.70%) were from cutlery, and 27 (10.60%) were from
plastic products manufacturers. There were 195 (78.80%)
SMEs having implementation of ISO 9001-2008 and only 59
(23.20%) SMEs were not ISO certified or in implementation
process of ISO 9001:2008.
4.2 Results
The theoretical model developed for this study is to
examine the casual relationships between a number of latent
variables and structural equation modeling provides us a
good facility to examine the causal relationship among the
studied variables. SEM combines a number of statistical
techniques like; factor analysis, ANOVA, and multiple
regressions. Thus SEM provides us a facility to
simultaneously examine and test the relationship among
1712 ISSN 1013-5316; CODEN: SINTE 8 Sci.Int.(Lahore),26(4),1707-1718,2014
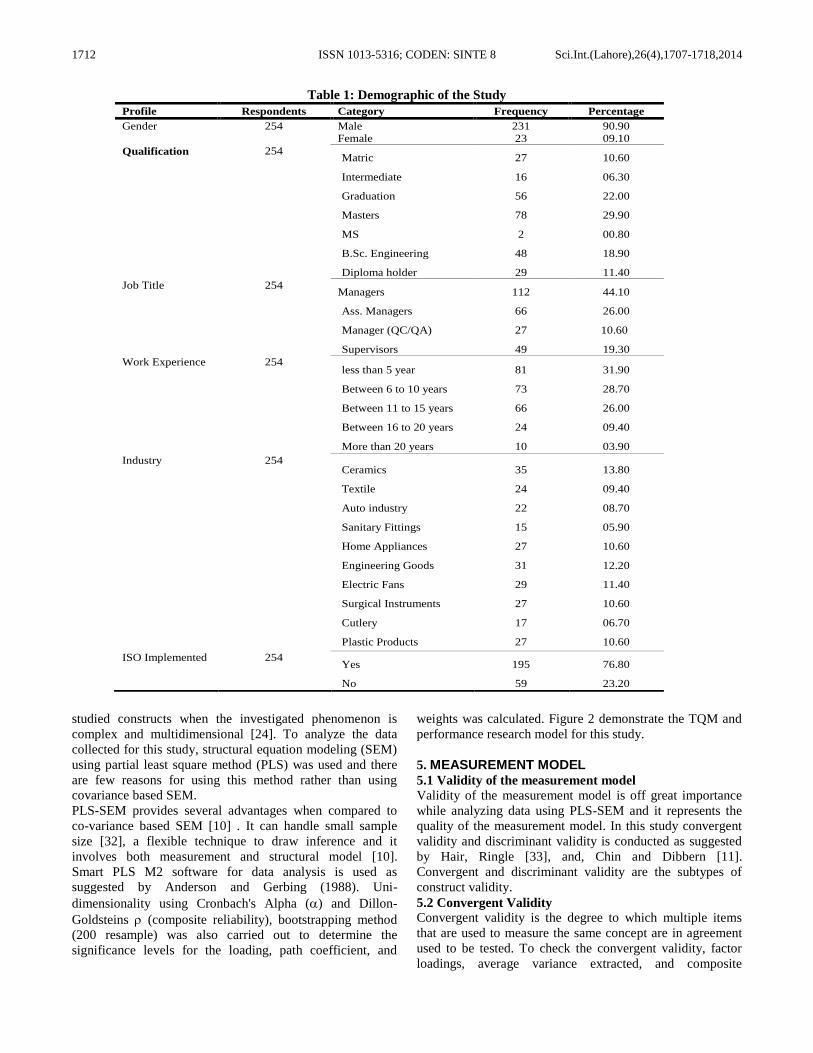
Table 1: Demographic of the Study
Profile Respondents Category Frequency Percentage
Gender 254 Male
Female
231
23
90.90
09.10
Qualification 254 Matric
Intermediate
Graduation
Masters
MS
B.Sc. Engineering
Diploma holder
27
16
56
78
2
48
29
10.60
06.30
22.00
29.90
00.80
18.90
11.40
Job Title 254 Managers
Ass. Managers
Manager (QC/QA)
Supervisors
112
66
27
49
44.10
26.00
10.60
19.30
Work Experience 254 less than 5 year
Between 6 to 10 years
Between 11 to 15 years
Between 16 to 20 years
More than 20 years
81
73
66
24
10
31.90
28.70
26.00
09.40
03.90
Industry 254 Ceramics
Textile
Auto industry
Sanitary Fittings
Home Appliances
Engineering Goods
Electric Fans
Surgical Instruments
Cutlery
Plastic Products
35
24
22
15
27
31
29
27
17
27
13.80
09.40
08.70
05.90
10.60
12.20
11.40
10.60
06.70
10.60
ISO Implemented 254 Yes
No
195
59
76.80
23.20
studied constructs when the investigated phenomenon is
complex and multidimensional [24]. To analyze the data
collected for this study, structural equation modeling (SEM)
using partial least square method (PLS) was used and there
are few reasons for using this method rather than using
covariance based SEM.
PLS-SEM provides several advantages when compared to
co-variance based SEM [10] . It can handle small sample
size [32], a flexible technique to draw inference and it
involves both measurement and structural model [10].
Smart PLS M2 software for data analysis is used as
suggested by Anderson and Gerbing (1988). Uni-
dimensionality using Cronbach's Alpha () and Dillon-
Goldsteins (composite reliability), bootstrapping method
(200 resample) was also carried out to determine the
significance levels for the loading, path coefficient, and
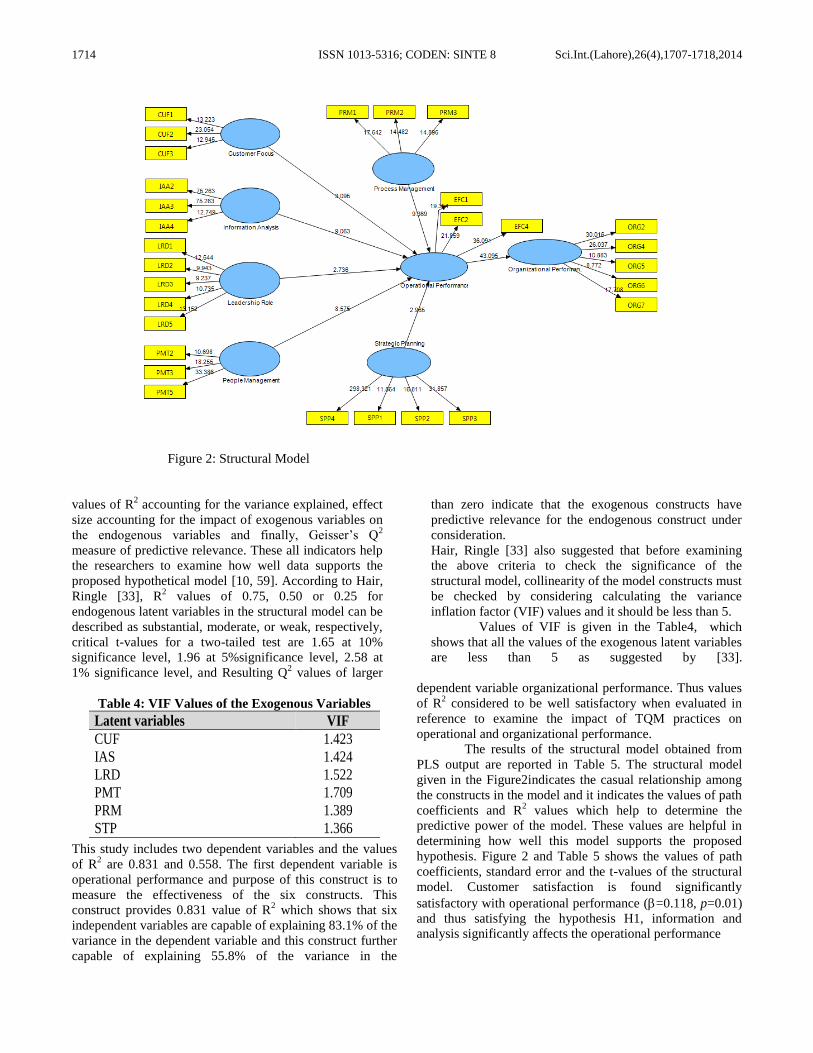
weights was calculated. Figure 2 demonstrate the TQM and
performance research model for this study.
5. MEASUREMENT MODEL
5.1 Validity of the measurement model
Validity of the measurement model is off great importance
while analyzing data using PLS-SEM and it represents the
quality of the measurement model. In this study convergent
validity and discriminant validity is conducted as suggested
by Hair, Ringle [33], and, Chin and Dibbern [11].
Convergent and discriminant validity are the subtypes of
construct validity.
5.2 Convergent Validity Convergent validity is the degree to which multiple items
that are used to measure the same concept are in agreement
used to be tested. To check the convergent validity, factor
loadings, average variance extracted, and composite
Sci.Int.(Lahore),26(4),1707-1718,2014 ISSN 1013-5316; CODEN: SINTE 8 1713
reliability are the main indicators [11, 33]. The reliability of
each manifest variable is measured on the basis of loadings
and how much each item load on the studied latent variable
[33]. There is a disagreement about the minimum accepted
value of manifest variable loadings in PLS-SEM literature.
Chin, Gopal [12] suggested that loadings of each item must
exceed a value of 0.6, Sarkar, Echambadi [61] suggested that
loadings of manifest variables exceed or approaches to 0.70,
whereas Hulland [35] investigated that loadings above 0.40
or 0.50 of a manifest variables appropriate. Further, Hair,
Ringle [33] recommended that loading between 0.40 and
0.70 of manifest variable may be removed in case if this
removal effects the composite reliability and no loss of
validity. Authors further concluded that it is better to
eliminated loadings of manifest variables below the value
0.40. Thus, results generated from this study provides us
insights that all the loadings are well above 0.50 and thus
satisfying the optimal level of defined manifest loadings.
Results depicting the convergent validity
5.3. Discriminant validity
Discriminant validity can be confirmed or examined when
AVE is greater than its correlation with all the other
constructs [28] and is known as Fornell-Larckers criteria.
Results reported in Table 3, provides a satisfactory level of
discriminant validity as squared correlation coefficient for
each construct is less than the square root of AVE. Hence,
the overall results shows measurement model of this study
confirmed an adequate discriminant and convergent validity.
5.4 Quality of the Structural Model
After evaluating the quality of the measurement model, main
focus of the statistical analysis using PLS-SEM is to check
the significance of the structural model. The structural
model in PLS-SEM is representing the relationship between
the latent variables included in the studied model and
enables the researchers to accept or reject the proposed
hypothesis. Three major indicators are examined to test the
hypothetical model which includes;
are given in the Table 2.
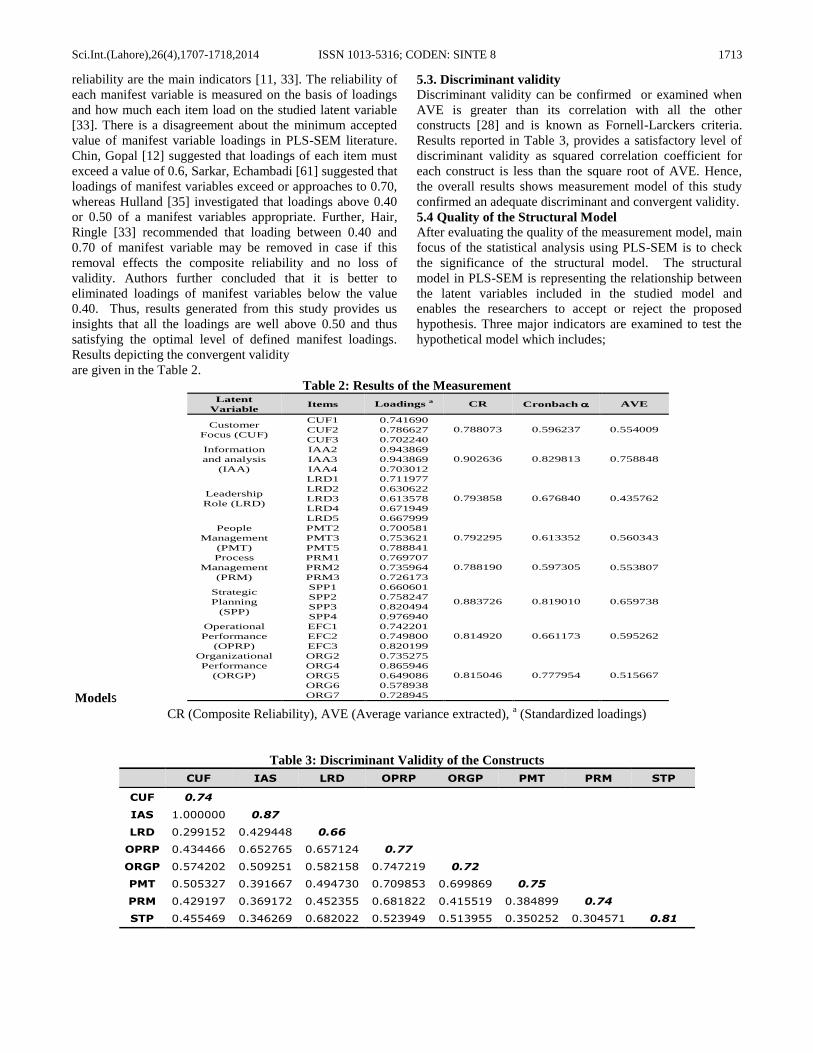
Table 2: Results of the Measurement
Models
Latent
Variable Items Loadings
a CR Cronbach AVE
Customer
Focus (CUF)
CUF1 0.741690
0.788073 0.596237 0.554009 CUF2 0.786627
CUF3 0.702240
Information
and analysis
(IAA)
IAA2 0.943869
0.902636 0.829813 0.758848 IAA3 0.943869
IAA4 0.703012
Leadership
Role (LRD)
LRD1 0.711977
0.793858 0.676840 0.435762
LRD2 0.630622
LRD3 0.613578
LRD4 0.671949
LRD5 0.667999
People
Management
(PMT)
PMT2 0.700581
0.792295 0.613352 0.560343 PMT3 0.753621
PMT5 0.788841
Process
Management
(PRM)
PRM1 0.769707
0.788190 0.597305 0.553807 PRM2 0.735964
PRM3 0.726173
Strategic
Planning
(SPP)
SPP1 0.660601
0.883726 0.819010 0.659738 SPP2 0.758247
SPP3 0.820494
SPP4 0.976940
Operational
Performance
(OPRP)
EFC1 0.742201
0.814920 0.661173 0.595262 EFC2 0.749800
EFC3 0.820199
Organizational
Performance
(ORGP)
ORG2 0.735275
0.815046 0.777954 0.515667
ORG4 0.865946
ORG5 0.649086
ORG6 0.578938
ORG7 0.728945
CR (Composite Reliability), AVE (Average variance extracted),
a (Standardized loadings)
Table 3: Discriminant Validity of the Constructs
CUF IAS LRD OPRP ORGP PMT PRM STP
CUF 0.74
IAS 1.000000 0.87
LRD 0.299152 0.429448 0.66
OPRP 0.434466 0.652765 0.657124 0.77
ORGP 0.574202 0.509251 0.582158 0.747219 0.72
PMT 0.505327 0.391667 0.494730 0.709853 0.699869 0.75
PRM 0.429197 0.369172 0.452355 0.681822 0.415519 0.384899 0.74
STP 0.455469 0.346269 0.682022 0.523949 0.513955 0.350252 0.304571 0.81
1714 ISSN 1013-5316; CODEN: SINTE 8 Sci.Int.(Lahore),26(4),1707-1718,2014
Figure 2: Structural Model
values of R2 accounting for the variance explained, effect
size accounting for the impact of exogenous variables on
the endogenous variables and finally, Geisser’s Q2
measure of predictive relevance. These all indicators help
the researchers to examine how well data supports the
proposed hypothetical model [10, 59]. According to Hair,
Ringle [33], R2 values of 0.75, 0.50 or 0.25 for
endogenous latent variables in the structural model can be
described as substantial, moderate, or weak, respectively,
critical t-values for a two-tailed test are 1.65 at 10%
significance level, 1.96 at 5%significance level, 2.58 at
1% significance level, and Resulting Q2 values of larger
than zero indicate that the exogenous constructs have
predictive relevance for the endogenous construct under
consideration. Hair, Ringle [33] also suggested that before examining
the above criteria to check the significance of the
structural model, collinearity of the model constructs must
be checked by considering calculating the variance
inflation factor (VIF) values and it should be less than 5.
Values of VIF is given in the Table4, which
shows that all the values of the exogenous latent variables
are less than 5 as suggested by [33].
Table 4: VIF Values of the Exogenous Variables
Latent variables VIF
CUF 1.423
IAS 1.424
LRD 1.522
PMT 1.709
PRM 1.389
STP 1.366
This study includes two dependent variables and the values
of R2 are 0.831 and 0.558. The first dependent variable is
operational performance and purpose of this construct is to
measure the effectiveness of the six constructs. This
construct provides 0.831 value of R2 which shows that six
independent variables are capable of explaining 83.1% of the
variance in the dependent variable and this construct further
capable of explaining 55.8% of the variance in the
dependent variable organizational performance. Thus values
of R2 considered to be well satisfactory when evaluated in
reference to examine the impact of TQM practices on
operational and organizational performance.
The results of the structural model obtained from
PLS output are reported in Table 5. The structural model
given in the Figure2indicates the casual relationship among
the constructs in the model and it indicates the values of path
coefficients and R2 values which help to determine the
predictive power of the model. These values are helpful in
determining how well this model supports the proposed
hypothesis. Figure 2 and Table 5 shows the values of path
coefficients, standard error and the t-values of the structural
model. Customer satisfaction is found significantly
satisfactory with operational performance (=0.118, p=0.01)
and thus satisfying the hypothesis H1, information and
analysis significantly affects the operational performance
Sci.Int.(Lahore),26(4),1707-1718,2014 ISSN 1013-5316; CODEN: SINTE 8 1715
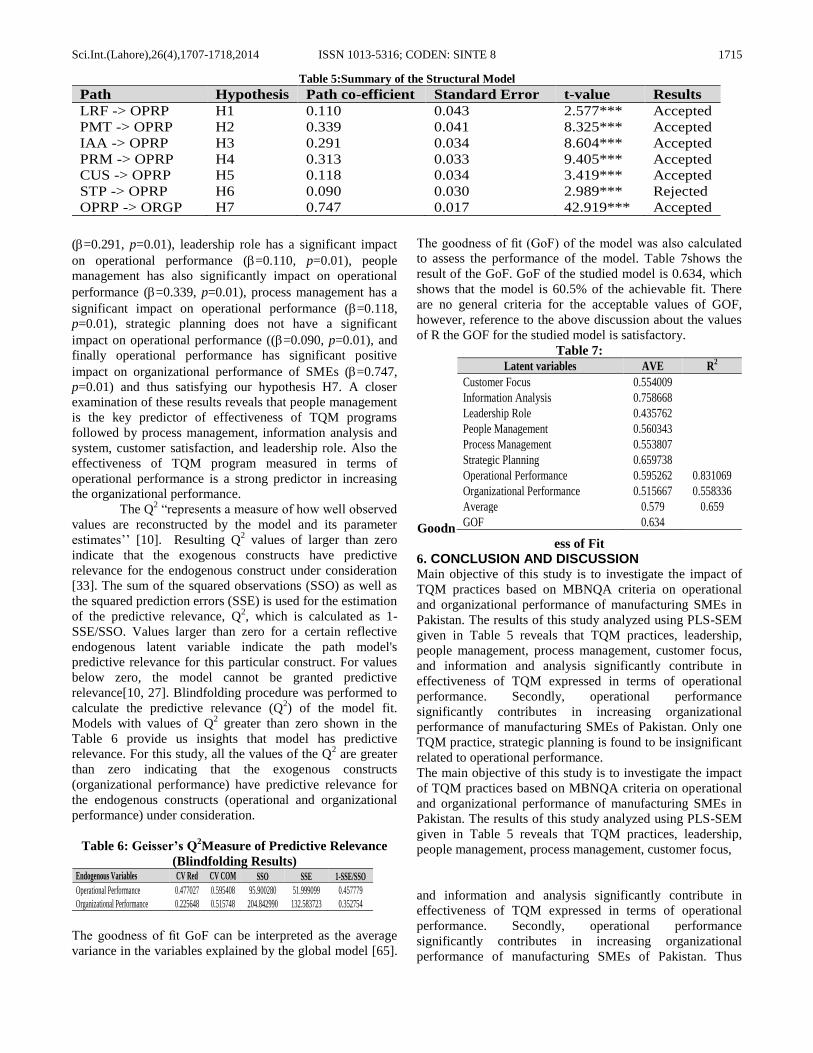
Table 5:Summary of the Structural Model
Path Hypothesis Path co-efficient Standard Error t-value Results
LRF -> OPRP H1 0.110 0.043 2.577*** Accepted
PMT -> OPRP H2 0.339 0.041 8.325*** Accepted
IAA -> OPRP H3 0.291 0.034 8.604*** Accepted
PRM -> OPRP H4 0.313 0.033 9.405*** Accepted
CUS -> OPRP H5 0.118 0.034 3.419*** Accepted
STP -> OPRP H6 0.090 0.030 2.989*** Rejected
OPRP -> ORGP H7 0.747 0.017 42.919*** Accepted
(=0.291, p=0.01), leadership role has a significant impact
on operational performance (=0.110, p=0.01), people
management has also significantly impact on operational
performance (=0.339, p=0.01), process management has a
significant impact on operational performance (=0.118,
p=0.01), strategic planning does not have a significant
impact on operational performance ((=0.090, p=0.01), and
finally operational performance has significant positive
impact on organizational performance of SMEs (=0.747,
p=0.01) and thus satisfying our hypothesis H7. A closer
examination of these results reveals that people management
is the key predictor of effectiveness of TQM programs
followed by process management, information analysis and
system, customer satisfaction, and leadership role. Also the
effectiveness of TQM program measured in terms of
operational performance is a strong predictor in increasing
the organizational performance.
The Q2 “represents a measure of how well observed
values are reconstructed by the model and its parameter
estimates’’ [10]. Resulting Q2 values of larger than zero
indicate that the exogenous constructs have predictive
relevance for the endogenous construct under consideration
[33]. The sum of the squared observations (SSO) as well as
the squared prediction errors (SSE) is used for the estimation
of the predictive relevance, Q2, which is calculated as 1-
SSE/SSO. Values larger than zero for a certain reflective
endogenous latent variable indicate the path model's
predictive relevance for this particular construct. For values
below zero, the model cannot be granted predictive
relevance[10, 27]. Blindfolding procedure was performed to
calculate the predictive relevance (Q2) of the model fit.
Models with values of Q2 greater than zero shown in the
Table 6 provide us insights that model has predictive
relevance. For this study, all the values of the Q2 are greater
than zero indicating that the exogenous constructs
(organizational performance) have predictive relevance for
the endogenous constructs (operational and organizational
performance) under consideration.
Table 6: Geisser’s Q2Measure of Predictive Relevance
(Blindfolding Results) Endogenous Variables CV Red CV COM SSO SSE 1-SSE/SSO
Operational Performance 0.477027 0.595408 95.900280 51.999099 0.457779
Organizational Performance 0.225648 0.515748 204.842990 132.583723 0.352754
The goodness of fit GoF can be interpreted as the average
variance in the variables explained by the global model [65].
The goodness of fit (GoF) of the model was also calculated
to assess the performance of the model. Table 7shows the
result of the GoF. GoF of the studied model is 0.634, which
shows that the model is 60.5% of the achievable fit. There
are no general criteria for the acceptable values of GOF,
however, reference to the above discussion about the values
of R the GOF for the studied model is satisfactory.
Table 7:
Goodn
Latent variables AVE R2
Customer Focus 0.554009
Information Analysis 0.758668
Leadership Role 0.435762
People Management 0.560343
Process Management 0.553807
Strategic Planning 0.659738
Operational Performance 0.595262 0.831069
Organizational Performance 0.515667 0.558336
Average 0.579 0.659
GOF 0.634
ess of Fit
6. CONCLUSION AND DISCUSSION
Main objective of this study is to investigate the impact of
TQM practices based on MBNQA criteria on operational
and organizational performance of manufacturing SMEs in
Pakistan. The results of this study analyzed using PLS-SEM
given in Table 5 reveals that TQM practices, leadership,
people management, process management, customer focus,
and information and analysis significantly contribute in
effectiveness of TQM expressed in terms of operational
performance. Secondly, operational performance
significantly contributes in increasing organizational
performance of manufacturing SMEs of Pakistan. Only one
TQM practice, strategic planning is found to be insignificant
related to operational performance.
The main objective of this study is to investigate the impact
of TQM practices based on MBNQA criteria on operational
and organizational performance of manufacturing SMEs in
Pakistan. The results of this study analyzed using PLS-SEM
given in Table 5 reveals that TQM practices, leadership,
people management, process management, customer focus,
and information and analysis significantly contribute in
effectiveness of TQM expressed in terms of operational
performance. Secondly, operational performance
significantly contributes in increasing organizational
performance of manufacturing SMEs of Pakistan. Thus
1716 ISSN 1013-5316; CODEN: SINTE 8 Sci.Int.(Lahore),26(4),1707-1718,2014
results from this study also shows that in order to increase
the organizational performance (secondary performance
measure) it is necessary that TQM practices should be
effectively implemented. These quality management
practices are helpful in increasing efficiency, cost and waste
reduction and improved quality of the product and these
indicators are predictors of organizational performance. In
manufacturing SMEs of Pakistan, the majority of the top
management positions are owned by the owners or their
relatives, therefore, management is well about the important
role of quality management.
Majority of the SMEs is making good contribution in
national GDP through foreign exports and thus to deliver
quality products according to the customer requirements,
these SMEs has implemented ISO-9000-2008 series of
standards and other than this these SMEs are also adapted
quality standards set by the foreign buyers. To deliver
products according to customer specifications, quality is
considered to be the integral part of the whole manufacturing
system. Although majority of the human resources in these
SMEs are labour, however, employees at supervisory level
are highly skilled and organization involve them in any
critical decision making, and has empowered to make
decision in any critical situation that affects the quality.
Pakistan is among the late adopter of quality management
philosophy and in 2010, Prime Minister Quality award has
been introduced by the National Productivity Organization
(NPO) of Pakistan. NPO also provides training and
development facilities to the human resources of the national
organizations and major objective is to provide guidance
about the implementation of ISO-9000 series of standards,
Six Sigma, lean, balanced score card to increase productivity
and quality. A number of SMEs both in manufacturing and
services has been nominated for Prime Minister Quality
award since 2010. Parallel to this SMEDA with a number of
international agencies are also making efforts for the
development of SMEs in Pakistan, and thus providing
energy for SMEs in developing a quality culture in the
country.
The operational model developed from this study will also
helpful for the SMEs to adopt quality management as a
strategic approach to boost their operational and
organizational performance. There are some limitations, as
this study included only a few manufacturing SMEs as
compared to 3.2 million SMEs in Pakistan, therefore, results
of this study cannot be generalized.
REFERENCES: 1. Agus, A. and Z. Hassan, Exploring the relationship
between the length of total quality management
adoption and financial performance: an empirical study
in Malaysia. International Journal of Management.
17(3): p. 323-333, 2000.
2. Ahire, Golhar, and Waller, Development and validation
of TQM implementation constructs. decision Sciences.
27(1): p. 23-56, 1996.
3. Anderson, et al., A Path Analytic Model of a Theory of
Quality Management Underlying the Deming
Management Method: Preliminary Empirical
Findings*. Decision Sciences. 26(5): p. 637-658, 1995.
4. Aziz, T. and A. Ahmad, An evaluation of business
improvement through quality management principles in
SMEs. International Journal of Quality and
Innovation. 2(2): p. 193-216, 2013.
5. Badri, Davis, and Davis, A study of measuring the
critical factors of quality management. International
Journal of Quality & Reliability Management. 12(2): p.
36-53, 1995.
6. Bayati, A. and A. Taghavi, The impacts of acquiring
ISO 9000 certification on the performance of SMEs in
Tehran. The TQM Magazine. 19(2): p. 140-149, 2007.
7. Bhutta, M.K.S., A.I. Rana, and U. Asad, SCM
practices and the health of the SMEs in Pakistan.
Supply Chain Management: An International Journal.
12(6): p. 412-422, 2007.
8. Black, S.A. and L.J. Porter, Identification of the
Critical Factors of TQM*. decision Sciences. 27(1): p.
1-21, 1996.
9. Bou-Llusar, J.C., et al., An empirical assessment of the
EFQM excellence model: evaluation as a TQM
framework relative to the MBNQA model. Journal of
Operations Management. 27(1): p. 1-22, 2009.
10. Chin, W.W., The partial least squares approach to
structural equation modeling. Modern methods for
business research. 295(2): p. 295-336, 1998.
11. Chin, W.W. and J. Dibbern, An introduction to a
permutation based procedure for multi-group PLS
analysis: Results of tests of differences on simulated
data and a cross cultural analysis of the sourcing of
information system services between Germany and the
USA, in Handbook of partial least squares. 2010,
Springer. p. 171-193.
12. Chin, W.W., A. Gopal, and W.D. Salisbury, Advancing
the theory of adaptive structuration: The development
of a scale to measure faithfulness of appropriation.
Information Systems Research. 8(4): p. 342-367, 1997.
13. Crosby, Quality is free: The art of making quality
certain. Vol. 94. 1979: McGraw-Hill New York.
14. Crosby, Quality Without Tears (Maidenhead, McGraw-
Hill). 1984.
15. Cua, K.O., K.E. McKone, and R.G. Schroeder,
Relationships between implementation of TQM, JIT,
and TPM and manufacturing performance. Journal of
Operations Management. 19(6): p. 675-694, 2001.
16. Curkovic, S., et al., Validating the Malcolm Baldrige
National Quality Award framework through structural
equation modelling. International Journal of
Production Research. 38(4): p. 765-791, 2000.
17. Dahlgaard-Park, The quality movement: where are you
going? Total Quality Management & Business
Excellence. 22(5): p. 493-516, 2011.
18. Dahlgaard-Park, et al., Diagnosing and prognosticating
the quality movement–a review on the 25 years quality
literature (1987–2011). Total Quality Management &
Business Excellence. 24(1-2): p. 1-18, 2013.
Sci.Int.(Lahore),26(4),1707-1718,2014 ISSN 1013-5316; CODEN: SINTE 8 1717
19. Dahlgaard and S.M. Dahlgaard-Park, Lean production,
six sigma quality, TQM and company culture. The
TQM magazine. 18(3): p. 263-281, 2006.
20. Dean, J.W. and D.E. Bowen, Management theory and
total quality: improving research and practice through
theory development. Academy of Management Review.
19(3): p. 392-418, 1994.
21. Deming, Quality, productivity, and competitive
position. Vol. 183. 1982: Massachusetts Institute of
Technology, Center for advanced engineering study
Cambridge, MA.
22. Demirbag, et al., An analysis of the relationship
between TQM implementation and organizational
performance: evidence from Turkish SMEs. Journal of
Manufacturing Technology Management. 17(6): p.
829-847, 2006.
23. Ebrahimi, M. and M. Sadeghi, Quality management
and performance: An annotated review. International
Journal of Production Research. (ahead-of-print): p. 1-
19, 2013.
24. Fidell, L.S. and B. Tabachnick, Using multivariate
statistics. 2006: Allyn & Bacon Boston.
25. Flynn, Schroeder, and Sakakibara, A framework for
quality management research and an associated
measurement instrument. Journal of Operations
Management. 11(4): p. 339-366, 1994.
26. Flynn, Schroeder, and Sakakibara, The impact of
quality management practices on performance and
competitive advantage. Decision Sciences. 26(5): p.
659-691, 1995.
27. Fornell, C. and J. Cha, Partial least squares In R. P.
Bagoozi (Ed.), Advanced methods of marketing
research, (pp. 52-78). 1994: Cambridge: Blackwell.
28. Fornell, C. and D.F. Larcker, Evaluating structural
equation models with unobservable variables and
measurement error. Journal of Marketing Research
(JMR). 18(1)1981.
29. Fotopoulos and Psomas, The structural relationships
between TQM factors and organizational performance.
The TQM Journal. 22(5): p. 539-552, 2010.
30. Fuentes, M.M.F., F.J.L. Montes, and L.M.M.
Fernández, Total quality management, strategic
orientation and organizational performance: the case of
Spanish companies. Total Quality Management &
Business Excellence. 17(3): p. 303-323, 2006.
31. Ghobadian, S. Speller, and M. Jones, Service quality:
concepts and models. International Journal of Quality
& Reliability Management. 11(9): p. 43-66, 1994.
32. Goodhue, D., W. Lewis, and R. Thompson. PLS, small
sample size, and statistical power in MIS research. in
System Sciences, 2006. HICSS'06. Proceedings of the
39th Annual Hawaii International Conference on.
2006. IEEE.
33. Hair, Ringle, and Sarstedt, PLS-SEM: Indeed a silver
bullet. The Journal of Marketing Theory and Practice.
19(2): p. 139-152, 2011.
34. Hill, J., C. Nancorrow, and L.T. Wright, Lifecycles and
crisis points in SMEs: a case approach. Marketing
Intelligence & Planning. 20(6): p. 361-9, 2002.
35. Hulland, J., Use of partial least squares (PLS) in
strategic management research: a review of four recent
studies. Strategic management journal. 20(2): p. 195-
204, 1999.
36. Ilkay, M.S. and E. Aslan, The effect of the ISO 9001
quality management system on the performance of
SMEs. International Journal of Quality & Reliability
Management. 29(7): p. 753-778, 2012.
37. Juran, The Quality Trilogy: A Universal Approach to
Managing for Quality, in ASQC 40th Annual Quality
Congress in Anaheim, California, 1986.
38. Kureshi, Faheem Qureshi, and Ali Sajid, Current health
of quality management practices in service sector
SMEs: A case study of Pakistan. The TQM Journal.
22(3): p. 317-329, 2010.
39. Kureshi, et al., Quality management practices of SME
in developing countries: a survey of manufacturing
SME in Pakistan. Journal of Quality and Technology
Management. 5(2): p. 63-89, 2009.
40. Lam, S.-Y., et al., A structural equation model of
TQM, market orientation and service quality: evidence
from a developing nation. Managing Service Quality.
22(3): p. 281-309, 2012.
41. Lee, S., B.-H. Rho, and S.-G. Lee, Impact of Malcolm
Baldrige National Quality Award criteria on
organizational quality performance. International
Journal of Production Research. 41(9): p. 2003-2020,
2003.
42. Madu, Kuei, and Jacob, An empirical assessment of the
influence of quality dimensions on organizational
performance. International Journal of Production
Research. 34(7): p. 1943-1962, 1996.
43. Malik, S.A., et al., TQM PRACTICES &
ORGANIZATIONAL PERFORMANCE: EVIDENCE
FROM PAKISTANI SMEs. International Journal of
Engineering & Technology. 10(4)2010.
44. Motwani, Mahmoud, and Rice, Quality Practices of
Indian Organizations:: An Empirical Analysis.
International Journal of Quality & Reliability
Management. 11(1): p. 38-52, 1994.
45. Parast, M.M., S.G. Adams, and E.C. Jones, Improving
operational and business performance in the petroleum
industry through quality management. International
journal of quality & reliability management. 28(4): p.
426-450, 2011.
46. Porter, L.J. and A.J. Parker, Total quality
management—the critical success factors. Total quality
management. 4(1): p. 13-22, 1993.
47. Powell, Total quality management as competitive
advantage: a review and empirical study. Strategic
management journal. 16(1): p. 15-37, 1995.
48. Prajogo, The comparative analysis of TQM practices
and quality performance between manufacturing and
service firms. International Journal of Service Industry
Management. 16(3): p. 217-228, 2005.
1718 ISSN 1013-5316; CODEN: SINTE 8 Sci.Int.(Lahore),26(4),1707-1718,2014
49. Prajogo, Progress of quality management practices in
Australian manufacturing firms. The TQM Magazine.
18(5): p. 501-513, 2006.
50. Prajogo and Brown, Approaches to adopting quality in
SMEs and the impact on quality management practices
and performance. Total Quality Management &
Business Excellence. 17(5): p. 555-566, 2006.
51. Prajogo and Hong, The effect of TQM on performance
in R&D environments: A perspective from South
Korean firms. Technovation. 28(12): p. 855-863, 2008.
52. Prajogo and Sohal, The relationship between TQM
practices, quality performance, and innovation
performance: An empirical examination. International
Journal of Quality & Reliability Management. 20(8): p.
901-918, 2003.
53. Prajogo and Sohal, Transitioning from total quality
management to total innovation management: an
Australian case. International Journal of Quality &
Reliability Management. 21(8): p. 861-875, 2004.
54. Rahman, A comparative study of TQM practice and
organisational performance of SMEs with and without
ISO 9000 certification. International Journal of
Quality & Reliability Management. 18(1): p. 35-49,
2001.
55. Rahman, Total quality management practices and
business outcome: Evidence from small and medium
enterprises in Western Australia. Total Quality
Management. 12(2): p. 201-210, 2001.
56. Reeves, C.A. and D.A. Bednar, Defining Quality:
Alternatives and Implications. Academy of
Management Review. 19(3): p. 419-445, 1994.
57. Salaheldin, Critical success factors for TQM
implementation and their impact on performance of
SMEs. International journal of productivity and
performance management. 58(3): p. 215-237, 2009.
58. Samson, D. and M. Terziovski, The relationship
between total quality management practices and
operational performance. Journal of operations
management. 17(4): p. 393-409, 1999.
59. Sang S, Lee JD, and Lee J, E-government adoption in
Cambodia: a partial least squares approach.
In:Transforming government: people, process, and
policy,. 2010: Emerald Group Publishing Limited,
Bingley, pp 138-157.
doi:10.1108/17506161011047370.
60. Saraph, Benson, and Schroeder, An instrument for
measuring the critical factors of quality management.
decision Sciences. 20(4): p. 810-829, 1989.
61. Sarkar, M.B., et al., The influence of complementarity,
compatibility, and relationship capital on alliance
performance. Journal of the academy of marketing
science. 29(4): p. 358-373, 2001.
62. Slack, N., S. Chambers, and R. Johnston, Operations
management. 2010: Pearson Education.
63. Sohail, M.S. and T.B. Hoong, TQM practices and
organizational performances of SMEs in Malaysia:
Some empirical observations. Benchmarking: An
International Journal. 10(1): p. 37-53, 2003.
64. Sohn, S., Y. Gyu Joo, and H. Kyu Han, Structural
equation model for the evaluation of national funding
on R&D project of SMEs in consideration with
MBNQA criteria. Evaluation and program planning.
30(1): p. 10-20, 2007.
65. Tenenhaus, M., et al., PLS path modeling.
Computational statistics and data analysis,. 48(1): p.
159-204, 2005.
66. Terziovski, Samson, and Dow, The business value of
quality management systems certification. Evidence
from Australia and New Zealand. Journal of
operations management. 15(1): p. 1-18, 1997.
67. Valmohammadi, C., The impact of TQM
implementation on the organizational performance of
Iranian manufacturing SMEs. The TQM Journal. 23(5):
p. 496-509, 2011.
68. Yong, J. and A. Wilkinson, Rethinking Total Quality
Management. Total Quality Management. 12(2): p.
247-258, 2001.
69. Yusof and Aspinwall, Critical success factors in small
and medium enterprises: survey results. Total Quality
Management. 11(4-6): p. 448-462, 2000.
70. Zakuan, N., et al., Proposed relationship of TQM and
organisational performance using structured equation
modelling. Total Quality Management. 21(2): p. 185-
203, 2010.
Related Documents