Chapter 26 Use of Partial Least Squares (PLS) in TQM Research: TQM Practices and Business Performance in SMEs Ali Turkyilmaz, Ekrem Tatoglu, Selim Zaim, and Coskun Ozkan Abstract Advances in structural equation modeling (SEM) techniques have made it possible for management researchers to simultaneously examine theory and measures. When using sophisticated SEM techniques such as covariance-based structural equation modeling (CBSEM) and partial least squares (PLS), researchers must be aware of their underlying assumptions and limitations. SEM models such as PLS can help total quality management (TQM) researchers achieve new insights. Researchers in the area of TQM need to apply this technique properly in order to better understand the complex relationships proposed in their models. This paper attempts to apply PLS in the area of TQM research. Consequently, special emphasis is placed on identifying the relationships between the most prominent TQM constructs and business performance based on a sample of SMEs operat- ing in the Turkish textile industry. The analysis of PLS results indicate that a good deal of support is found for the proposed model where a satisfactory per- centage of the variance in the dependent constructs is explained by the independent constructs. A. Turkyilmaz and S. Zaim Department of Industrial Engineering, Fatih University, Buyukcekmece, 34500 Istanbul, Turkey e-mail: [email protected], [email protected] E. Tatoglu Faculty of Economics and Administrative Sciences, Chair of International Trade and Business, Bahcesehir University, Besiktas, Istanbul, Turkey e-mail: [email protected] C. Ozkan Department of Industrial Engineering, Kocaeli University, Veziroglu Yerleskesi, 41040 Kocaeli, Turkey e-mail: coskun [email protected] V. Esposito Vinzi et al. (eds.), Handbook of Partial Least Squares, Springer Handbooks of Computational Statistics, DOI 10.1007/978-3-540-32827-8 27, c Springer-Verlag Berlin Heidelberg 2010 605

Welcome message from author
This document is posted to help you gain knowledge. Please leave a comment to let me know what you think about it! Share it to your friends and learn new things together.
Transcript
Chapter 26Use of Partial Least Squares (PLS) in TQMResearch: TQM Practices and BusinessPerformance in SMEs
Ali Turkyilmaz, Ekrem Tatoglu, Selim Zaim, and Coskun Ozkan
Abstract Advances in structural equation modeling (SEM) techniques have madeit possible for management researchers to simultaneously examine theory andmeasures. When using sophisticated SEM techniques such as covariance-basedstructural equation modeling (CBSEM) and partial least squares (PLS), researchersmust be aware of their underlying assumptions and limitations. SEM models suchas PLS can help total quality management (TQM) researchers achieve new insights.Researchers in the area of TQM need to apply this technique properly in orderto better understand the complex relationships proposed in their models. Thispaper attempts to apply PLS in the area of TQM research. Consequently, specialemphasis is placed on identifying the relationships between the most prominentTQM constructs and business performance based on a sample of SMEs operat-ing in the Turkish textile industry. The analysis of PLS results indicate that agood deal of support is found for the proposed model where a satisfactory per-centage of the variance in the dependent constructs is explained by the independentconstructs.
A. Turkyilmaz and S. ZaimDepartment of Industrial Engineering, Fatih University, Buyukcekmece,34500 Istanbul, Turkeye-mail: [email protected], [email protected]
E. TatogluFaculty of Economics and Administrative Sciences, Chair of International Trade and Business,Bahcesehir University, Besiktas, Istanbul, Turkeye-mail: [email protected]
C. OzkanDepartment of Industrial Engineering, Kocaeli University, Veziroglu Yerleskesi,41040 Kocaeli, Turkeye-mail: coskun [email protected]
V. Esposito Vinzi et al. (eds.), Handbook of Partial Least Squares, Springer Handbooksof Computational Statistics, DOI 10.1007/978-3-540-32827-8 27,c� Springer-Verlag Berlin Heidelberg 2010
605
606 A. Turkyilmaz et al.
26.1 Introduction
Advances in structural equation modeling (SEM) techniques have made it possi-ble for management researchers to simultaneously examine theory and measures.SEM is a comprehensive statistical approach to testing hypotheses about rela-tionships between observed and latent variables. It combines features of factoranalysis and multiple regression to study both the measurement and the structuralproperties of theoretical models. Such techniques are considered superior to moretraditional statistical techniques such as multiple regression, factor analysis, andmultidimensional scaling. However, researchers should apply these new techniquesappropriately. They must be aware of the underlying assumptions and limitations ofSEM techniques.
SEM is formally defined by two sets of linear equations called the inner and outermodel. The inner model specifies the relationships between unobserved or latentvariables (LVs), while the outer model specifies the relationships between LVs andtheir associated observed or manifest variables (MVs).
There are two common statistical approaches for structural model estimation.The most prominent SEM technique is the maximum likelihood (ML) based covari-ance structure analysis method the so-called CBSEM (Bollen 1989; Joreskog 1970;Rigdon 1998). The second approach is the Partial Least Squares (PLS)-based vari-ance analysis developed by Wold (1975, 1982, 1985). These two distinct methodsof SEM differ in terms of their objectives, statistical assumptions and the nature ofthe fit statistics they produce (Gefen et al. 2000). The main concern of PLS is, ingeneral, related to the explanatory power of the path model along with the signifi-cance level of standardized regression weights. In contrast, the objective of CBSEMis to show that the complete set of paths as specified in the model is reasonable, andthat the operationalization of the theory is corroborated and not disconfirmed by thesample data. These two methods also differ with respect to the type of relationshipthey support between the observed variables and their associated latent constructs(i.e. outer model). PLS supports two types of relationships, formative and reflective,whereas CBSEM supports only reflective indicators (Fornell and Bookstein 1982).
Although CBSEM has been widely adopted as a powerful approach and has beenused for parameter estimation in most applications of structural modeling, there aresome situations where PLS approach is superior to CBSEM. CBSEM is poorlysuited to deal with small data samples and can provide nonunique or otherwiseimproper solutions in some cases (Hulland 1999). Moreover, data from managementresearch often do not satisfy the requirements of multinormality and interval scal-ing for maximum likelihood estimation. More fundamentally, two serious problemsoften interfere with meaningful covariance structure analysis: inadmissible solutionsand factor indeterminacy (Fornell and Cha 1994; Wold 1985).
PLS is a general method for the estimation of path models involving latentconstructs indirectly measured by multiple indicators (Wold 1982). This tool isprimarily intended for causal-predictive analysis in which the problems exploredare complex and theoretical knowledge is scarce. PLS is an appropriate tech-nique to use in a theory development situation (Wold 1979). This technique uses a
26 Use of Partial Least Squares (PLS) in TQM Research 607
component-based approach to estimation. Consequently, it places minimal demandson sample size and residual distributions (Lohmoller 1989).
While SEM techniques such as CBSEM and PLS can enhance existing method-ological approaches to conducting quality management research, they should beapplied properly. Most quality management researcher are very familiar with thefundamentals of covariance-based-type SEM models, whereas current familiaritywith PLS is relatively low in the field of quality management, making it difficult forresearchers to properly evaluate its use.
Employing the PLS approach, Cassel et al. (2000) measured the European Cus-tomer Satisfaction Index (ECSI). In this study, they also used the Monte Carlosimulation method to evaluate the robustness of partial least squares. The authorsnoted that PLS is reasonably robust against multicollinearity, skew response dis-tributions, and various types of model misspecifications (Cassel et al. 2000, 1999;Cassel 2000). In another survey, Kanji (1998) also employed the PLS approach todevelop the Business Excellence Index model that simultaneously measures cus-tomers’, employers’ and shareholders’ satisfaction within an organization in order toobtain a comprehensive evaluation of the organizational performance (Kanji 1998;Kanji and Wallace 2000).
The purpose of this study is to help shape application of PLS in the area of totalquality management (TQM). In doing this special emphasis is placed on investigat-ing the relationships between TQM practices and the business performance of smalland medium-sized enterprises (SMEs) in Turkey. The rest of this study is organizedas follows: The next section provides a brief review of the theoretical backgroundof TQM. The third section presents the methodology of the study, followed by theresults. A discussion and conclusions are provided in the final section.
26.2 Theoretical Background
Any organization, regardless of its nature, is advised to adopt TQM practices togenerate high quality products or services and to meet the challenge of global com-petition. Total quality management (TQM) is an integrated management philosophyaiming at continuous improvement in all functions of an organization to produceand deliver commodities or services in line with customers’ needs or requirements,and it covers many important aspects, ranging from customer satisfaction, meet-ing customers’ requirements, and reducing rework and waste to increased employeeinvolvement, process management and supplier relations.
TQM helps firms establish an organizational culture committed to customer sat-isfaction through continuous improvement. This culture varies from one countryto another and between different industries, but has certain essential principles,which can be implemented to secure greater market share, increased profits, andreduced costs (Kanji and Wallace 2000). A review of extant literature on TQM andcontinuous improvement programs identifies a number of common aspects, whichinclude committed leadership, closer customer relationships, benchmarking, sup-plier relations, increased training, employee empowerment, zero defects mentality,
608 A. Turkyilmaz et al.
flexible manufacturing, process improvement and measurement (Saraph et al. 1989;Flynn et al. 1995; Anderson et al. 1994; Black and Porter 1996; Demirbag et al.2006). Furthermore, to determine the critical factors of TQM, various studies wereundertaken and different instruments were developed by individual researchers andinstitutions such as the Malcolm Baldrige Award, the EFQM (European Foun-dation for Quality Management), and the Deming Prize criteria Based on thesestudies, a wide range of management issues, approaches, and systematic empiricalinvestigations have been generated.
Measuring business performance is crucial for the effective management of anorganization. Therefore, to improve business performance, one needs to determinethe extent of TQM implementation and measure its impact on business performance(Gadenne and Sharma 2002). Traditionally, business performance has been mea-sured by using financial indicators, which may include inter alia profit, market share,earnings, and growth rate. Kaplan and Norton (1996) emphasized that financialindicators would measure only past performance. Therefore, in order to overcomethe potential shortcomings of traditional business performance systems they addednon-financial categories to the traditional performance measurement system.
There is a relatively large body of empirical studies that measures business per-formance by means of TQM criteria (see, e.g., Benson et al. 1991; Samson andTerziovski 1998; Flynn et al. 1995; Wilson and Collier 2000; Fynes and Voss 2001;Montes et al. 2003). These studies explore a variety of theoretical and empiricalissues. If the TQM plan is implemented properly, it has an impact on a wide rangeof areas, including better process management, understanding customers’ needs,improved customer satisfaction, improved internal communication, better problemsolving, and fewer errors.
Large-size firms have recently had a greater tendency to focus on their corebusiness areas and have therefore extensively relied on outsourcing. As the qualityof products and services depends extensively on the quality of suppliers’ productsand services, large firms encourage the application of TQM practices by their suppli-ers, the majority of which are small and medium-sized enterprises (SMEs). Despitesome attempts to investigate the relationships between TQM practices and thebusiness performance of SMEs (Ahire and Golhar 1996; McAdam and McKeown1999; Yusof and Aspinwall 2000; Sun and Cheng 2002; Lee 2004; Demirbag et al.2006), there is a lack of systematic empirical evidence regarding the level of TQMimplementation and its effect on the business performance of SMEs.
26.3 Variables and the Model
Based on a review and classification of the relevant empirical literature, the follow-ing TQM factors were, in a broad sense, identified as the most appropriate TQMconstructs within the context of SMEs, which include customer focus, top man-agement involvement, process management, supplier management, and employeerelations (Lee 2004; Demirbag et al. 2006).
Customer focus (CF), which is considered the major “driver” of TQM practices,addresses how and how well the organization determines current and emerging
26 Use of Partial Least Squares (PLS) in TQM Research 609
customer requirements and expectations; provides effective customer relationshipmanagement, and determines customer satisfaction (Kaynak 1995). In this study, wemeasure the CF construct using the following indicators: in-house market researchactivities of the firm, survey of customer choices, and reviewing the businessenvironment from the customers’ point of view.
Top management involvement (TMI) is an important factor in TQM implemen-tation as it improves business performance by influencing other TQM practices(Saraph et al. 1989; Ahire et al. 1996; Anderson et al. 1994; Flynn et al. 1995;Wilson and Collier 2000). In SMEs, the success of TQM applications depends ona strong leadership that must be initiated by the top management. Quality improve-ment plans proposed by various gurus primarily emphasize the commitment of topmanagement. The top management of the firm determines an appropriate orga-nizational culture, vision, and quality policy. Managers of organizations shoulddetermine objectives, and set specific measurable goals to satisfy customer expec-tations, and improve their organizations’ performance. They must also provideadequate resources for the implementation of quality efforts.
The employee relations (ER) construct investigated in this study includes a vari-ety of organizational development (OD) techniques to facilitate changes withinthe organization such as employee participation in decisions, employee recogni-tion, teamwork and the use of effective communications to create an awareness oforganizational goals. These OD techniques are generally considered the most rel-evant human resource practices in organizations that make effective use of TQMtechniques.
Process Management (PM) is mainly concerned with how the organizationdesigns and introduces products and services, and integrates production and deliveryrequirements (Kaynak 1995). It is therefore vital to the success of an organization.The PM construct is composed of the following items: availability of quality data,the extent to which quality data are used as tools for managing quality and the extentto which quality data and control charts are displayed for the production processesin the firm.
Suppliers play a well-recognized key role in quality management and have asignificant impact on several quality dimensions. Once it is recognized that the mate-rials and the components purchased are the main cause of quality problems and thatthe blame for this can often be placed on incorrect relations with suppliers, the logi-cal conclusion is that, in order to achieve adequate quality control of critical inputs,companies must invest more in forging relations with their suppliers. The constructsupplier relations (SR) is measured by the following items in this study: supplierselection criteria, longer term relationships, clarity of specifications, and reliance ona sufficiently small number of dependable suppliers.
Business performance (BF) is the final construct used in this study and representsthe performance measure in the latent variable model. All six constructs used in thisstudy are listed in Appendix A along with their associated indicators.
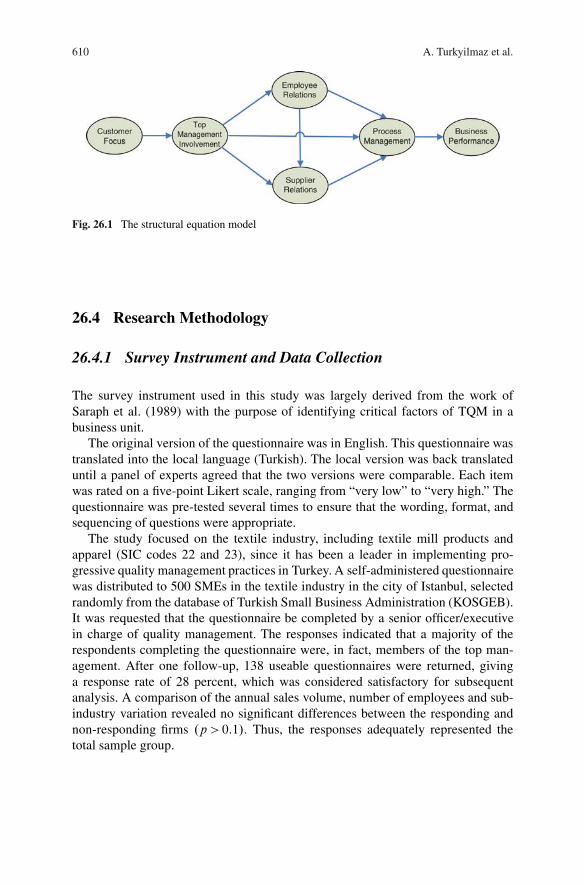
Drawing on a sample of SMEs in the Turkish apparel industry, we utilize the PLSmethod to evaluate the proposed relationships as indicated in Fig. 26.1.
610 A. Turkyilmaz et al.
Fig. 26.1 The structural equation model
26.4 Research Methodology
26.4.1 Survey Instrument and Data Collection
The survey instrument used in this study was largely derived from the work ofSaraph et al. (1989) with the purpose of identifying critical factors of TQM in abusiness unit.
The original version of the questionnaire was in English. This questionnaire wastranslated into the local language (Turkish). The local version was back translateduntil a panel of experts agreed that the two versions were comparable. Each itemwas rated on a five-point Likert scale, ranging from “very low” to “very high.” Thequestionnaire was pre-tested several times to ensure that the wording, format, andsequencing of questions were appropriate.
The study focused on the textile industry, including textile mill products andapparel (SIC codes 22 and 23), since it has been a leader in implementing pro-gressive quality management practices in Turkey. A self-administered questionnairewas distributed to 500 SMEs in the textile industry in the city of Istanbul, selectedrandomly from the database of Turkish Small Business Administration (KOSGEB).It was requested that the questionnaire be completed by a senior officer/executivein charge of quality management. The responses indicated that a majority of therespondents completing the questionnaire were, in fact, members of the top man-agement. After one follow-up, 138 useable questionnaires were returned, givinga response rate of 28 percent, which was considered satisfactory for subsequentanalysis. A comparison of the annual sales volume, number of employees and sub-industry variation revealed no significant differences between the responding andnon-responding firms .p > 0:1/. Thus, the responses adequately represented thetotal sample group.
26 Use of Partial Least Squares (PLS) in TQM Research 611
26.5 Results
26.5.1 PLS Estimation of the Structural Equation Model
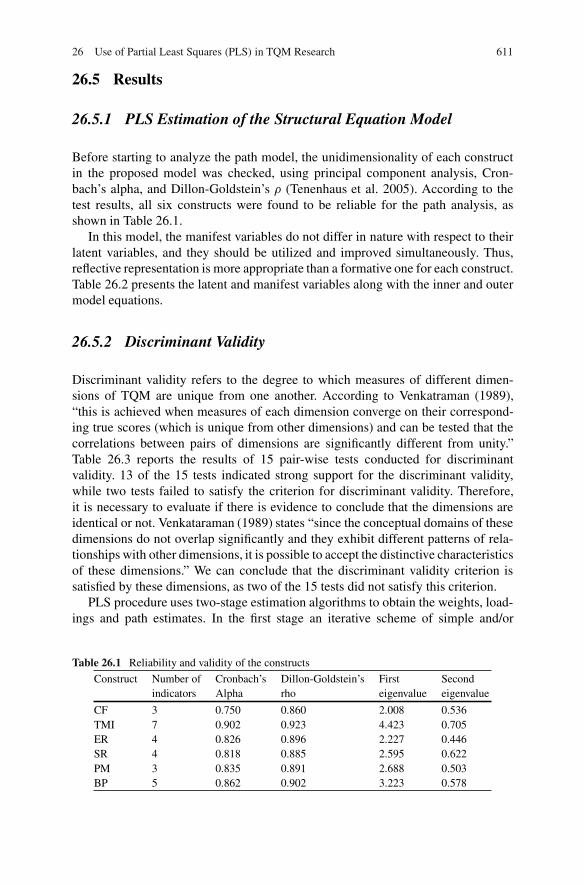
Before starting to analyze the path model, the unidimensionality of each constructin the proposed model was checked, using principal component analysis, Cron-bach’s alpha, and Dillon-Goldstein’s � (Tenenhaus et al. 2005). According to thetest results, all six constructs were found to be reliable for the path analysis, asshown in Table 26.1.
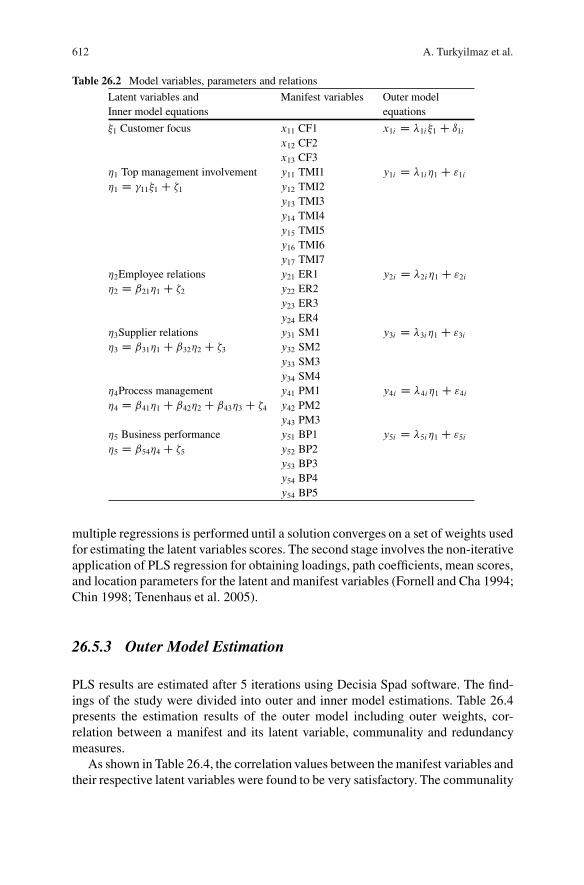
In this model, the manifest variables do not differ in nature with respect to theirlatent variables, and they should be utilized and improved simultaneously. Thus,reflective representation is more appropriate than a formative one for each construct.Table 26.2 presents the latent and manifest variables along with the inner and outermodel equations.
26.5.2 Discriminant Validity
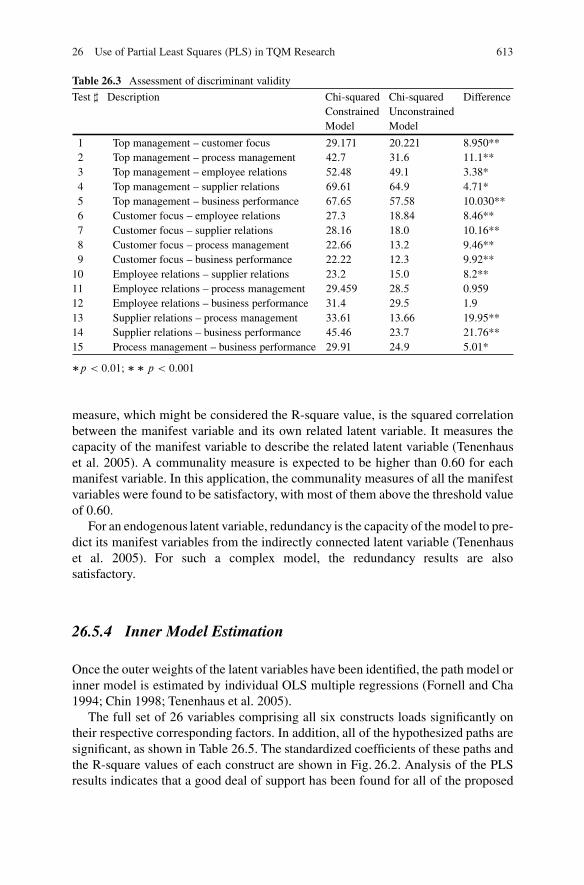
Discriminant validity refers to the degree to which measures of different dimen-sions of TQM are unique from one another. According to Venkatraman (1989),“this is achieved when measures of each dimension converge on their correspond-ing true scores (which is unique from other dimensions) and can be tested that thecorrelations between pairs of dimensions are significantly different from unity.”Table 26.3 reports the results of 15 pair-wise tests conducted for discriminantvalidity. 13 of the 15 tests indicated strong support for the discriminant validity,while two tests failed to satisfy the criterion for discriminant validity. Therefore,it is necessary to evaluate if there is evidence to conclude that the dimensions areidentical or not. Venkataraman (1989) states “since the conceptual domains of thesedimensions do not overlap significantly and they exhibit different patterns of rela-tionships with other dimensions, it is possible to accept the distinctive characteristicsof these dimensions.” We can conclude that the discriminant validity criterion issatisfied by these dimensions, as two of the 15 tests did not satisfy this criterion.
PLS procedure uses two-stage estimation algorithms to obtain the weights, load-ings and path estimates. In the first stage an iterative scheme of simple and/or
Table 26.1 Reliability and validity of the constructs
Construct Number of Cronbach’s Dillon-Goldstein’s First Secondindicators Alpha rho eigenvalue eigenvalue
CF 3 0.750 0.860 2.008 0.536TMI 7 0.902 0.923 4.423 0.705ER 4 0.826 0.896 2.227 0.446SR 4 0.818 0.885 2.595 0.622PM 3 0.835 0.891 2.688 0.503BP 5 0.862 0.902 3.223 0.578
612 A. Turkyilmaz et al.
Table 26.2 Model variables, parameters and relations
Latent variables and Manifest variables Outer modelInner model equations equations
�1 Customer focus x11 CF1 x1i D �1i�1 C ı1i
x12 CF2x13 CF3
�1 Top management involvement y11 TMI1 y1i D �1i�1 C "1i
�1 D 11�1 C �1 y12 TMI2y13 TMI3y14 TMI4y15 TMI5y16 TMI6y17 TMI7
�2Employee relations y21 ER1 y2i D �2i�1 C "2i
�2 D ˇ21�1 C �2 y22 ER2y23 ER3y24 ER4
�3Supplier relations y31 SM1 y3i D �3i�1 C "3i
�3 D ˇ31�1 C ˇ32�2 C �3 y32 SM2y33 SM3y34 SM4
�4Process management y41 PM1 y4i D �4i�1 C "4i
�4 D ˇ41�1 C ˇ42�2 C ˇ43�3 C �4 y42 PM2y43 PM3
�5 Business performance y51 BP1 y5i D �5i�1 C "5i
�5 D ˇ54�4 C �5 y52 BP2y53 BP3y54 BP4y54 BP5
multiple regressions is performed until a solution converges on a set of weights usedfor estimating the latent variables scores. The second stage involves the non-iterativeapplication of PLS regression for obtaining loadings, path coefficients, mean scores,and location parameters for the latent and manifest variables (Fornell and Cha 1994;Chin 1998; Tenenhaus et al. 2005).
26.5.3 Outer Model Estimation
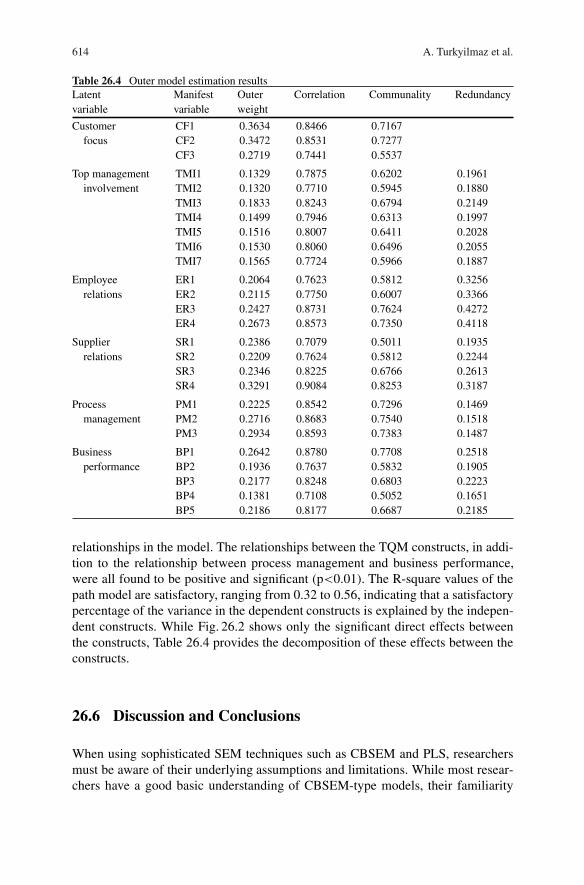
PLS results are estimated after 5 iterations using Decisia Spad software. The find-ings of the study were divided into outer and inner model estimations. Table 26.4presents the estimation results of the outer model including outer weights, cor-relation between a manifest and its latent variable, communality and redundancymeasures.
As shown in Table 26.4, the correlation values between the manifest variables andtheir respective latent variables were found to be very satisfactory. The communality
26 Use of Partial Least Squares (PLS) in TQM Research 613
Table 26.3 Assessment of discriminant validity
Test ] Description Chi-squared Chi-squared DifferenceConstrained UnconstrainedModel Model
1 Top management – customer focus 29:171 20:221 8.950**2 Top management – process management 42:7 31:6 11.1**3 Top management – employee relations 52:48 49:1 3.38*4 Top management – supplier relations 69:61 64:9 4.71*5 Top management – business performance 67:65 57:58 10.030**6 Customer focus – employee relations 27:3 18:84 8.46**7 Customer focus – supplier relations 28:16 18:0 10.16**8 Customer focus – process management 22:66 13:2 9.46**9 Customer focus – business performance 22:22 12:3 9.92**
10 Employee relations – supplier relations 23:2 15:0 8.2**11 Employee relations – process management 29:459 28:5 0.95912 Employee relations – business performance 31:4 29:5 1.913 Supplier relations – process management 33:61 13:66 19.95**14 Supplier relations – business performance 45:46 23:7 21.76**15 Process management – business performance 29:91 24:9 5.01*
�p < 0:01; � � p < 0:001
measure, which might be considered the R-square value, is the squared correlationbetween the manifest variable and its own related latent variable. It measures thecapacity of the manifest variable to describe the related latent variable (Tenenhauset al. 2005). A communality measure is expected to be higher than 0.60 for eachmanifest variable. In this application, the communality measures of all the manifestvariables were found to be satisfactory, with most of them above the threshold valueof 0.60.
For an endogenous latent variable, redundancy is the capacity of the model to pre-dict its manifest variables from the indirectly connected latent variable (Tenenhauset al. 2005). For such a complex model, the redundancy results are alsosatisfactory.
26.5.4 Inner Model Estimation
Once the outer weights of the latent variables have been identified, the path model orinner model is estimated by individual OLS multiple regressions (Fornell and Cha1994; Chin 1998; Tenenhaus et al. 2005).
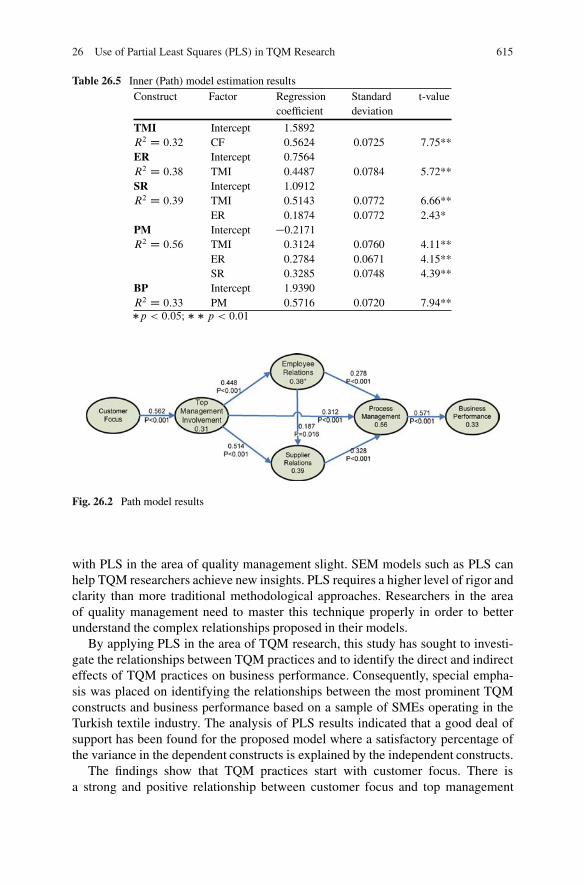
The full set of 26 variables comprising all six constructs loads significantly ontheir respective corresponding factors. In addition, all of the hypothesized paths aresignificant, as shown in Table 26.5. The standardized coefficients of these paths andthe R-square values of each construct are shown in Fig. 26.2. Analysis of the PLSresults indicates that a good deal of support has been found for all of the proposed
614 A. Turkyilmaz et al.
Table 26.4 Outer model estimation resultsLatent Manifest Outer Correlation Communality Redundancyvariable variable weight
Customer CF1 0.3634 0.8466 0.7167focus CF2 0.3472 0.8531 0.7277
CF3 0.2719 0.7441 0.5537
Top management TMI1 0.1329 0.7875 0.6202 0.1961involvement TMI2 0.1320 0.7710 0.5945 0.1880
TMI3 0.1833 0.8243 0.6794 0.2149TMI4 0.1499 0.7946 0.6313 0.1997TMI5 0.1516 0.8007 0.6411 0.2028TMI6 0.1530 0.8060 0.6496 0.2055TMI7 0.1565 0.7724 0.5966 0.1887
Employee ER1 0.2064 0.7623 0.5812 0.3256relations ER2 0.2115 0.7750 0.6007 0.3366
ER3 0.2427 0.8731 0.7624 0.4272ER4 0.2673 0.8573 0.7350 0.4118
Supplier SR1 0.2386 0.7079 0.5011 0.1935relations SR2 0.2209 0.7624 0.5812 0.2244
SR3 0.2346 0.8225 0.6766 0.2613SR4 0.3291 0.9084 0.8253 0.3187
Process PM1 0.2225 0.8542 0.7296 0.1469management PM2 0.2716 0.8683 0.7540 0.1518
PM3 0.2934 0.8593 0.7383 0.1487
Business BP1 0.2642 0.8780 0.7708 0.2518performance BP2 0.1936 0.7637 0.5832 0.1905
BP3 0.2177 0.8248 0.6803 0.2223BP4 0.1381 0.7108 0.5052 0.1651BP5 0.2186 0.8177 0.6687 0.2185
relationships in the model. The relationships between the TQM constructs, in addi-tion to the relationship between process management and business performance,were all found to be positive and significant (p<0.01). The R-square values of thepath model are satisfactory, ranging from 0.32 to 0.56, indicating that a satisfactorypercentage of the variance in the dependent constructs is explained by the indepen-dent constructs. While Fig. 26.2 shows only the significant direct effects betweenthe constructs, Table 26.4 provides the decomposition of these effects between theconstructs.
26.6 Discussion and Conclusions
When using sophisticated SEM techniques such as CBSEM and PLS, researchersmust be aware of their underlying assumptions and limitations. While most resear-chers have a good basic understanding of CBSEM-type models, their familiarity
26 Use of Partial Least Squares (PLS) in TQM Research 615
Table 26.5 Inner (Path) model estimation resultsConstruct Factor Regression Standard t-value
coefficient deviation
TMI Intercept 1.5892R2 D 0:32 CF 0.5624 0.0725 7.75**ER Intercept 0.7564R2 D 0:38 TMI 0.4487 0.0784 5.72**SR Intercept 1.0912R2 D 0:39 TMI 0.5143 0.0772 6.66**
ER 0.1874 0.0772 2.43*PM Intercept �0.2171R2 D 0:56 TMI 0.3124 0.0760 4.11**
ER 0.2784 0.0671 4.15**SR 0.3285 0.0748 4.39**
BP Intercept 1.9390R2 D 0:33 PM 0.5716 0.0720 7.94**�p < 0:05; � � p < 0:01
Fig. 26.2 Path model results
with PLS in the area of quality management slight. SEM models such as PLS canhelp TQM researchers achieve new insights. PLS requires a higher level of rigor andclarity than more traditional methodological approaches. Researchers in the areaof quality management need to master this technique properly in order to betterunderstand the complex relationships proposed in their models.
By applying PLS in the area of TQM research, this study has sought to investi-gate the relationships between TQM practices and to identify the direct and indirecteffects of TQM practices on business performance. Consequently, special empha-sis was placed on identifying the relationships between the most prominent TQMconstructs and business performance based on a sample of SMEs operating in theTurkish textile industry. The analysis of PLS results indicated that a good deal ofsupport has been found for the proposed model where a satisfactory percentage ofthe variance in the dependent constructs is explained by the independent constructs.
The findings show that TQM practices start with customer focus. There isa strong and positive relationship between customer focus and top management
616 A. Turkyilmaz et al.
involvement. Under increasing competitive pressure, the purpose of companies is toretain their customers. Therefore, determining and meeting customer requirementsare a necessary step to create a better business performance. Delivering qualityto customers in the competitive marketplace emphasizes the need to continuallyenhance customer’s satisfaction, which in turn leads many companies to adopt amore customer-oriented approach. Having a customer focus has now become a keyconcern for every company intent on increasing the value of its customer assets andboosting its business performance.
Top management involvement is necessary when the effectiveness of TQMimplementation is investigated. Effective leadership by top management also indi-rectly affects firm performance through the mediating effects of process manage-ment. In fact, the success of TQM applications hinges on strong leadership thatmust be initiated by the top management. Quality improvement plans proposed byvarious quality gurus strongly emphasize the top management commitment. The topmanagement of the organization is directly responsible for determining an appro-priate organizational culture, vision, and quality policy. Top managers should alsodetermine objectives, and develop specific and measurable goals to satisfy customerexpectations and improve their organizations’ performance. In order to enhancetheir business performance, managers must convey their priorities and expectationsto their employees. In this study, management leadership has been found to havea direct and positive relationship with employee relations, supplier relations andprocess management.
Supplier relations are another important underlying dimension of TQM practicesto improve business performance. Traditionally, vendors are selected from amongmany suppliers due to their ability to meet the quality requirements, delivery sched-ule, and the price offered. In this approach, suppliers compete aggressively withone another. The relationship between the buyer and the seller is usually adversar-ial. This traditional purchasing approach places special emphasis on the commercialtransaction between the supplier and the customer. The main purchasing objectivein this approach is to obtain the lowest possible price by creating strong competitionbetween the suppliers, and negotiating with them. However, in the modern businessworld, many firms prefer the strategy of few suppliers. The few supplier strategyimplies that a buyer wants to have a long-term relationship and the cooperation of afew dedicated suppliers. Using few suppliers can create value for the buyer and yieldboth lower transaction and production costs. The relationship between the buyer andthe supplier includes specified work-flow, sharing information through electronicdata interchange and the Internet, and joint planning and other mechanisms thatallow a just in time (JIT) system and TQM in the company.
Based on the survey results, a strong and positive relationship between the topmanagement involvement and employee relations has been noted. Building qual-ity awareness among employees, recognition of employees for superior qualityperformance, employee-involvement-type programs, and feedback about their per-formance are very important to achieve successful employee relations. Firm mustdevelop formal reward and recognition systems to encourage employee involve-ment, and support teamwork.
26 Use of Partial Least Squares (PLS) in TQM Research 617
Process management, which includes such sub-factors as the availability of qual-ity data, the extent to which quality data are used as a tool to manage quality, andthe extent to which data and control charts are displayed in work areas, has beenfound to have a strong impact on business performance. This might be explained bythe low level of personnel compliance with the implicit and explicit norms and rulesof the workplace. Under such circumstances, the marginal contribution of the inputsused for process management (inspection, supervision etc.) purposes to the totalquality would be high. This could explain the relatively high value of the processmanagement-coefficient in the model.
The TQM approach places a great deal of emphasis on the maintenance of pro-cess control; in other words, it ensures that these processes do not only behave asexpected, but also that the behavior of these processes does not create problemsfor the future. Thus, greater attention is paid to controlling the behavior of the pro-cesses that generate the products than to product conformity control. To achieve thisobjective, statistical instruments are used (e.g., the control sheet) in order to deter-mine whether the machinery and the various production processes are under control.These instruments are weak when only used by quality control specialists, but theybecome extremely powerful when the whole staff learns how to use them and applythem to their own activities. Consequently, the production personnel receive timelyand visible feedback on quality, i.e. information on the level of quality such as thepercentage of defective items and the frequency of mechanical breakdowns. In par-ticular, the process data gathered through quality controls are supplied in both avisible and timely way.
Another important conclusion and a managerial implication of this study is thatSMEs should focus more on reducing variation in the production process to improvebusiness performance. To improve process performance, top management involve-ment, supplier relations, and employee relations must be ensured. For SMEs inTurkey, customer focus or orientation is the most important quality practice for topmanagement involvement.
APPENDIX
Top Management Involvement
1. Extent to which top executives assume responsibility for quality performance(current practice)
2. Acceptance of responsibility for quality by major department heads3. Degree to which top management is evaluated for quality performance4. Extent to which the top management has objectives for quality performance5. Degree to which top management considers quality improvement as a way to
increase profits6. Extent to which top management has developed and communicated a vision7. Quality is emphasized throughout the company by the senior management
618 A. Turkyilmaz et al.
Supplier Relations
1. Extent to which suppliers are selected based on quality rather than price ordelivery schedule
2. Extent to which longer term relationships are offered to suppliers3. Clarity of specifications provided to suppliers4. Extent to which suppliers are selected based on quality rather than price or
delivery schedule
Process Management
1. Availability of quality data2. Extent to which quality data are used as tools to manage quality3. Extent to which quality data, control charts are displayed in work areas
Employee Relations
1. Effectiveness of quality teams or employee involvement type program in com-pany
2. Amount of feedback provided to the employees on their quality performance3. Extent to which quality awareness building among employees is on-going4. Extent to which employees are recognized for superior quality performance
Customer Focus
1. We do a lot in-house market research2. We often talk with or survey those who can influence our customer’s choices3. We periodically review the likely effect of changes in our business environment
Business Performance
1. Investments in R&D aimed at new innovations2. Capacity to develop a unique competitive profile3. New product/service development4. Market development5. Market orientation
References
Ahire, S. L., Golhar, D. Y., & Waller, M. A. (1996). Development and validation of TQMimplementation constructs. Decision Sciences, 27(1), 23–56.
Anderson, J. C., Rungtusanatham, M., & Schroeder, R. G. (1994). A Theory of quality managementunderlying the deming management method. Academy of Management Review, 19(3), 472–509.
26 Use of Partial Least Squares (PLS) in TQM Research 619
Benson, G. P., Saraph, J. V., & Schroeder, R. G. (1991). The effects of organizational context onquality management: an empirical investigation. Management Science, 37(9), 1107–1124.
Black, S. E., & Porter, L. J. (1996). Identification of the critical factors of TQM. Decision Sciences,27(1), 1–21.
Bollen, K. A. (1989). Structural equations with latent variables. New York, NY: Wiley.Cassel C. M. (2000). Measuring customer satisfaction on a national level using a super-population
approach. Total Quality Management, 11(7), 909–915.Cassel C. M., Hackl, P., & Westlund, A. H. (1999). Robustness of partial least squares method for
estimating latent variable quality structures. Journal of Applied Statistics, 26(4), 435–446.Cassel C. M., Hackl, P., & Westlund, A. H. (2000). On measurement of intangible assets: a study
of robustness of partial least squares. Total Quality Management, 11(7), 897–907.Chin, W. W. (1998). The partial least squares approach for structural equation modeling. In G. A.
Marcoulides (Ed.), Modern methods for business research (pp. 295–336). London: LawrenceErlbaum Associates.
Demirbag, M., Tatoglu, E., Tekinkus, M., & Zaim, S. (2006). An analysis of the relationshipbetween TQM implementation and organizational performance. Journal of ManufacturingTechnology Management, 17(6), 829–847.
Flyyn, B. B., Schroder, R. G., & Sakakibara, S. (1994). A framework for quality managementresearch and an associated measurement instrument. Journal of Operations Management, 11,339–366.
Flyyn, B. B., Schroeder, R. G., & Sakakibara, S. (1995). The impact of quality managementpractices on performance and competitive advantage. Decision Sciences, 26(5), 659–691.
Fornell, C., & Cha, J. (1994). Partial least squares. In R. P. Bagozzi (Ed.), Advanced methods inmarketing research (pp. 52–78). Cambridge: Basil Blackwell.
Fornell, C., & Bookstein, F. L. (1982). Two structural equation models: LISREL and PLS appliedto consumer exit-voice theory. Journal of Marketing Research, 19(4), 440–452.
Fynes, B., & Voss, C. (2001). A path analytic model of quality practices, quality performance andbusiness performance. Production and Operations Management, 10(4), 494–513.
Gadenne, D., & Sharma, B. (2002). An inter-industry comparison of quality management practicesand performance. Managing Service Quality, 12(6), 394–404.
Gefen D., Straub W. D., & Boudreau M. C. (2000). Structural equation modeling and regression:guidelines for research practice. Communications of the Association for Information Systems,4(7).
Hulland, J. (1999). Use of partial least squares (PLS) in strategic management research: a reviewof four recent studies. Strategic Management Journal, 20, 195–204.
Joreskog, K. G. (1970). A general method for analysis of covariance structure. Biometrika, 57,239–251.
Kanji, G. K. (1998). Measurement of business excellence. Total Quality Management, 9(7),633–643.
Kanji, G. K., & Wallace, W. (2000). Business excellence through customer satisfaction. TotalQuality Management, 11(7), 979–998.
Kaplan, R. S., & Norton, D. P. (1996). The balanced scorecard: translating strategy into action.Boston: Harvard Business School Press.
Kaynak, H. (2003). The relationship between total quality management practices and their effectson firm performance. Journal of Operations Management, 21, 405–435.
Lee, C. Y. (2004). Perception and development of total quality management in small manu-facturers: an exploratory study in China. Journal of Small Business Management, 42(1),102–115.
McAdam, R., & McKeown, M. (1999). Life after ISO 9000: an analysis of the impact of ISO9000 and total quality management on small businesses in Northern Ireland. Total QualityManagement, 10(2), 229–241.
Montes, F. J. L. M., Jover, A. V., & Fernandez, L. M. M. (2003). Factors affecting the relationshipbetween total quality management and organizational performance. International Journal ofQuality and Reliability Management, 20(2), 189–209.
620 A. Turkyilmaz et al.
Ridgon, E. E. (1998). Structural equations modeling. In G. A. Marcoulides (Ed.), Modern methodsfor business research (pp. 251–294). Mahwah, NJ: Lawrence Erlbaum Associates.
Samson, D., & Terziovski, M. (1998). The relationship between total quality management practicesand operational performance. Journal of Operations Management, 17, 393–409.
Saraph, J. V., Benson, G. P., & Schroder, R. G. (1989). An instrument for measuring the criticalfactors of quality management. Decision Sciences, 20, 810–829.
Sun, H., & Cheng, T. K. (2002). Comparing reasons, practices and effects of ISO 9000 certificationand TQM implementation in Norwegian SMEs and large firms. International Small BusinessJournal, 2(4), 421–440.
Tenenhaus, M., Vinzi, V. E., Chatelin, Y. M., & Lauro, C. (2005). PLS path modeling. Computa-tional Statistics & Data Analysis, 48, 159–205.
Wilson, D. D., & Collier, D. A. (2000). An empirical investigation of the Malcolm BaldrigeNational Quality Award causal model. Decision Sciences, 31(2), 361–390.
Wold, H. (1975). Soft modeling by latent variables: the non-linear iterative partial least squares(NIPALS) approach. In J. Gani (Ed.), Perspectives in probability and statistics: Papers, inHonour of M.S. Bartlett on the occasion of his 68th Birthday (pp. 117–142). London: AppliedProbability Trust, Academic.
Wold, H. (1982). Soft modeling: the basic design and some extensions. In K.G. Joreskog, &H. Wold (Eds.), Systems under indirect observation, Part 2 (pp. 1–54). Amsterdam: North-Holland.
Wold, H. (1985). Partial least squares. In S. Kotz, N. L. Johnson (Eds.), Encyclopedia of statisticalsciences, Vol. 6 (pp. 581–591). New York: Wiley.
Yusof, S. M., & Aspinwall, E. (2000). Total quality management implementation frameworks:comparison and review. Total Quality Management, 1(3), 281–294.
Related Documents