i MACHINGA DISTRICT COUNCIL Private Bag 1, Machinga December, 2017 Machinga District Council Socio Economic Profile 2017-2022

Welcome message from author
This document is posted to help you gain knowledge. Please leave a comment to let me know what you think about it! Share it to your friends and learn new things together.
Transcript
i
MACHINGA DISTRICT COUNCIL
Private Bag 1, Machinga
December, 2017
Machinga District Council
Socio Economic Profile 2017-2022
ii
On the Cover:
The photo shows a Standard 1 class at Namasika F.P. School in TA Kapoloma, Machinga District.
This congested classroom shows one of the serious challenges for the education sector in Malawi, in
general, and in Machinga, in particular. Machinga District Council, using this Socio Economic Profile
(SEP) and the District Development Plan (DDP) which will be formulated based on this SEP, seeks to
improve this situation.
iii
Table of Contents
List of Maps............................................................................................................................xvi
List of Tables.....................................................................................................................................xvi
LIST OF FIGURES ............................................................................................................... ix
ACRONYMS ....................................................................................................................... x
Foreword ........................................................................................................................ xiv
Acknowledgements ........................................................................................................... xv
Contributors .............................................................................................................................. ….xv
1.0 GENERAL FEATURES ................................................................................................ - 2 -
1.1 Physical Description ................................................................................................................ - 2 -
1.1.1 Location and Size ................................................................................................................. - 2 -
1.2 Geology and Mineral Resources of Machinga District ............................................................. - 3 -
1.2.1 Geology .............................................................................................................................. - 3 -
1.2.2 Mineral Resources ............................................................................................................... - 5 -
1.2.3 Geothermal Resources ........................................................................................................ - 7 -
1.2.4Hydrology ........................................................................................................................... - 8 -
1.2.5 Soil ..................................................................................................................................... - 9 -
1.2.6 Vegetation .......................................................................................................................... - 9 -
1.2.7Climate and Climate Change ................................................................................................ - 9 -
1.3Administrative Structures and Local Politics ............................................................................ - 13 -
1.3.1 Formal Administrative Structures ........................................................................................ - 13 -
1.3.2Informal Administrative Structure ........................................................................................ - 16 -
1.3.3 Politics ............................................................................................................................... - 16 -
1.4 The People ........................................................................................................................... - 16 -
1.4.1Tribes .................................................................................................................................. - 16 -
1.4.2 Languages .......................................................................................................................... - 16 -
1.4.3 Religion ............................................................................................................................. - 16 -
1.4.4 Culture/Beliefs ................................................................................................................... - 17 -
1.5Demography and Settlement.................................................................................................. - 17 -
1.5.1 Population and Its Characteristics ....................................................................................... - 17 -
1.5.2 Migratory Patterns ............................................................................................................. - 17 -
1.5.3 Urbanisation ...................................................................................................................... - 18 -
1.5.4 Settlement Patterns ............................................................................................................ - 19 -
iv
2.0 LAND USE ........................................................................................................... - 20 -
2.1 Land Tenure System ........................................................................................................... - 20 -
2.1.1 Customary Land .............................................................................................................. - 20 -
2.1.2Public Land ...................................................................................................................... - 20 -
2.1.3 Private Land ................................................................................................................... - 20 -
2.2 Land Use System ............................................................................................................... - 21 -
2.3 Urban Structure Plans ........................................................................................................ - 22 -
2.4 Key Issues .......................................................................................................................... - 22 -
2.5 Opportunities ................................................................................................................... - 23 -
3.0 Natural Resources .................................................................................................. - 24 -
3.1 Forest Reserves and Wildlife .............................................................................................. - 24 -
3.1.1Production of Forests/Tree Plantations ............................................................................. - 24 -
3.1.2 Forestry Sector Activities ................................................................................................. - 29 -
3.1.2 Forest Based Enterprises/Income-Generating Activities ..................................................... - 32 -
3.1.3 Forestry Worker to Population Ratio .............................................................................. - 32 -
3.1.4 Challenges in the Forestry Sector ..................................................................................... - 33 -
3.1.5 Solutions to Forestry Issues ............................................................................................. - 33 -
3.1.6 Opportunities in the Forestry Sector ............................................................................... - 33 -
4.0 Economy .............................................................................................................. - 34 -
4.1 Poverty Incidence .............................................................................................................. - 34 -
4.2 Local Economic Development (LED) .................................................................................. - 35 -
4.2.1 Agriculture ...................................................................................................................... - 35 -
4.2.2 Fisheries ............................................................................................................................. 49
4.3 Commerce and Industry ........................................................................................................ 60
4.3.1 Types and Size of Business Establishments ........................................................................... 60
4.3.2 Banking and Credit Facilities ............................................................................................... 63
4.3.3Business Promotion Services ................................................................................................ 64
4.3.4Labour and Employment ..................................................................................................... 65
4.4 Tourism ................................................................................................................................ 68
4.4.1 Liwonde National Park ....................................................................................................... 68
5.0 Social Services ........................................................................................................... 73
5.1 Health ................................................................................................................................... 73
5.1.1 Health Services .................................................................................................................... 74
5.1.1.4 Health Workers Staffing Levels ......................................................................................... 76
5.1.2 Machinga Health Status ...................................................................................................... 76
5.1.2.2 Maternal Deaths .............................................................................................................. 77
5.1.2.5 Other Health Indicators ................................................................................................... 80
5.1.3 Health Facility WASH ......................................................................................................... 80
v
5.1.4 Availability of Transport ...................................................................................................... 81
5.1.5 Health Governance and Community Participation ............................................................... 81
5.2 Water and Sanitation ............................................................................................................. 81
5.2.1 Water Supply ....................................................................................................................... 81
5.2.2 Status of Water Points ........................................................................................................ 83
5.2.3 Management of Water Supply Facilities .............................................................................. 83
5.2.4 Hydrology ......................................................................................................................... 84
5.2.5 Overview of Gravity-Fed Pipe Schemes in Machinga District .............................................. 85
5.2.6 Surface Water Monitoring .................................................................................................. 87
5.2.7 Availability of Ground Water in Machinga District ............................................................. 88
5.2.8 Urban/Peri-Urban Water Supply .......................................................................................... 91
5.2.9 Water Pollution ................................................................................................................. 92
5.2.10 Human Resources ............................................................................................................. 93
5.2.11 Threats to Water Resources and Water Supply Management ............................................. 94
5.2.12 Recommendations ............................................................................................................ 95
5.3 Education .............................................................................................................................. 96
5.3.1 Education Services............................................................................................................... 96
5.3.1.1 Preschool Education ......................................................................................................... 97
5.3.1.2 Primary School Education ................................................................................................ 97
5.3.1.3 Secondary Education ...................................................................................................... 102
5.3.2 Educational Facilities ......................................................................................................... 104
5.3.2.1 Classroom Blocks (Primary School) ................................................................................. 104
5.3.2.2 Primary School Teachers’ Houses ................................................................................... 105
5.3.2.3 Primary School Toilets .................................................................................................... 106
5.3.2.4 Primary School Libraries ................................................................................................. 107
5.3.2.5 Desks ............................................................................................................................. 107
5.3.2.6 Secondary School Classrooms ......................................................................................... 108
5.3.2.7 Secondary School Desks ................................................................................................. 109
5.3.2.8 Secondary School Libraries ............................................................................................. 109
5.3.2.9 Secondary School Teachers’ Houses ................................................................................ 110
5.3.2.10 Entertainment Halls ...................................................................................................... 110
5.3.2.11 Secondary School Toilets ................................................................................................ 111
5.3.3 Staffing Levels ................................................................................................................... 112
vi
5.3.3.1 Primary School Teachers ................................................................................................. 112
Source: ....................................................................................................................................... 112
5.3.3.2 Secondary School Teachers ............................................................................................. 113
5.4 Social Welfare and Community Development ...................................................................... 114
5.4.1 Social Welfare Services ....................................................................................................... 114
5.4.2 Human Resource ............................................................................................................... 119
5.4.3 Community Development Services .................................................................................... 119
5.4.3.4.1 Youth Participation ...................................................................................................... 122
5.4.3.4.2 Youth Clubs ................................................................................................................ 123
5.4.3.4.3 Out ............................................................................................................................. 123
6.0 HIV/AIDS, Nutrition, and Disaster Management ........................................................ 128
6.1 HIV/AIDS .............................................................................................................................. 128
6.1.1 District Mandate ................................................................................................................. 128
6.1.2 Coordination Structures ..................................................................................................... 128
6.1.3 HIV/AIDS Service Organizations ......................................................................................... 129
6.1.4 Facility-Based HIV/AIDS Services ........................................................................................ 129
6.2 Nutrition .............................................................................................................................. 131
6.2.1 Facilities Offering Nutrition Support .................................................................................. 131
6.2.2 Nutrition Support for HIV/AIDS-Affected People ............................................................... 133
6.2.3 ORT Support for Government Employees ......................................................................... 133
6.2.4 Nutrition Data Trends ....................................................................................................... 134
6.3 Disaster Risk Reduction, Response, Recovery, and Management........................................... 135
6.3.1 Types of Disasters .............................................................................................................. 136
6.3.2 Functionality of Disaster Management Structures ............................................................... 138
6.3.3 NGOsImplementing Disaster Risk Reduction ..................................................................... 139
6.3.4 Mechanisms to Reduce Vulnerability to Disasters ............................................................... 139
6.3.5 Adaptation to Climate Change .......................................................................................... 139
6.3.6 Challenges Facing the Sector .............................................................................................. 140
7.0 Infrastructure Development ....................................................................................... 141
7.1 Transportation ...................................................................................................................... 141
7.1.1 Road Transport .................................................................................................................. 141
7.1.2 Water Transport ................................................................................................................ 142
7.1.3 Rail Transport .................................................................................................................... 142
7.1.4 Air Transport ..................................................................................................................... 143
7.2 Communication ................................................................................................................... 143
7.2.1 Postal Services .................................................................................................................... 143
vii
7.2.2 Telephone Services ............................................................................................................ 143
7.2.3 Cellular Network .............................................................................................................. 144
7.2.4 Radio Network and Listenership ....................................................................................... 144
7.2.5 TV Networks and Viewership ............................................................................................ 144
7.2.6 Publications ....................................................................................................................... 145
7.2.7 Media Houses Representation in Machinga ....................................................................... 145
7.2.8 Internet Services ................................................................................................................ 145
7.3 Energy ................................................................................................................................. 145
6.6.2 Potential Power Generation Sites ...................................................................................... 146
6.6.3 Other Sources of Energy .................................................................................................... 146
7.4 Housing ............................................................................................................................... 146
7.4.1 Challenges ......................................................................................................................... 146
8.0 Governance ............................................................................................................ 147
8.1 Security Services .................................................................................................................... 147
8.1.1 Police Formations ............................................................................................................... 147
8.1.2 Number of Police Personnel............................................................................................... 147
8.1.3 Status of Community-Based Policing .................................................................................. 148
8.1.4 Victim Support Units .......................................................................................................... 148
8.1.5 Crime Levels ...................................................................................................................... 148
8.1.6 Challenges ......................................................................................................................... 149
8.1.7 Prison ................................................................................................................................ 149
8.2 Developmental Issues ........................................................................................................... 149
8.2.1 High Illiteracy Levels .......................................................................................................... 149
8.2.2 High Population Growth ................................................................................................... 149
8.2.3 Inadequate Health Services ................................................................................................ 150
8.2.4 Food Insecurity ................................................................................................................. 150
8.2.5 Environmental Degradation .............................................................................................. 150
8.2.6 Other Issues ...................................................................................................................... 150
9.0 NATIONAL DEVELOPMENT POLICIES ...................................................................... 151
9.1 Decentralization Policy and Local Governance ...................................................................... 152
10.0 District Development Planning Framework......................................................194
10.1 Prioritized District Issues and Constraints .............................................................. 154
viii
LIST OF TABLES
Table 1: Rare earth elements and their uses ......................................................................................... - 6 -
Table 2: Minimum temperatures for Machinga District ...................................................................... - 10 -
Table 3: Maximum temperatures for Machinga District ..................................................................... - 10 -
Table 4: Rainfall trends for Ntaja Station (mm) ................................................................................. - 10 -
Table 5: Average rainfall per extension planning area (mm) .............................................................. - 11 -
Table 6: Size of extension planning area and number of rain gauges .................................................. - 13 -
Table 7: Number of village and group village heads by TA/STA ........................................................ - 15 -
Table 8: Electoral trends .................................................................................................................... - 16 -
Table 9: In- and out-migration .......................................................................................................... - 17 -
Table 10: Net Migration .................................................................................................................... - 17 -
Table 11: Hectarage under forest plantation ...................................................................................... - 29 -
Table 12: Forestry staff ..................................................................................................................... - 32 -
Table 13: Forestry extension services ................................................................................................ - 32 -
Table 14: Smallholder Crop Production by Type of Crop, Hectarage, Yield, and Production .............. 38
Table 15: Distribution of markets by EPA ............................................................................................ 40
Table 16: List of EPAs and section vacant posts .................................................................................... 41
Table 17: District Farm Families per EPA .............................................................................................. 41
Table 18: List of Farm Input Sources by EPA (2016 – 2017) .................................................................. 41
Table 20: BVCs established in the minor strata for fisheries resource management ............................... 51
Table 21: Volume of fish catch by water body and values (2010 – 2015) ............................................ 52
Table 22: Production estimates for Machinga fish farming .................................................................. 54
Table 23: Machinga Fisheries Development Planning Framework ....................................................... 56
Table 24: Availability of Health Committees ....................................................................................... 81
Table 25: Number of adult literacy classes -Chichewa (2013 - 2017) .................................................. 120
Table 26: Distribution of Business Groups by Traditional Authorities (2013 – 2017) ........................... 120
Table 27: Human resources ............................................................................................................... 121
Table 28: Basic equipments for road construction and maintenance .................................................. 142
Table 29: Location and grade of postal facilities ................................................................................ 143
ix
LIST OF FIGURES
Figure 1: Land ownership .................................................................................................................. - 21 -
Figure 2: Charcoal bags consficated .................................................................................................. - 26 -
Figure 3: Encroachment .................................................................................................................... - 27 -
Figure 4: Village forest areas and their hectarage .............................................................................. - 28 -
Figure 5: Number of trees planted (2012 – 2016) ............................................................................. - 30 -
Figure 6: Percentage of poverty incidence in Machinga - 2016 .......................................................... - 35 -
Figure 7: Production for maize and rice ............................................................................................ - 37 -
Figure 8: Livestock ownership ............................................................................................................ 45
Figure 9: Lake Chiuta water level variation during wet and dry seasons .............................................. 57
Figure 10: Predicted water levels in Lake Chiuta by 2028 ................................................................... 58
Figure 11: Number of businesses by type ............................................................................................. 63
Figure 12: Graph showing leading causes of morbidity ........................................................................ 77
Figure 13: Maternal Deaths ................................................................................................................. 78
Figure 14: Utilisation of modern family planning methods .................................................................. 78
Figure 15: Prevelance of non-communicable diseases .......................................................................... 79
Figure 16: Proprietorship of Schools in Machinga District .................................................................... 97
Figure 17: Primary school enrolment .................................................................................................. 98
Figure 18: Primary school enrolment by zone (2013 – 2017) ............................................................... 99
Figure 19: Enrolment of boys and girls ................................................................................................ 99
Figure 20: Dropout rate of boys and girls .......................................................................................... 100
Figure 21: Overall passrate by zone (2013 – 2016) ............................................................................. 101
Figure 22: Primary GER and NER (2013 – 2017) ................................................................................ 102
Figure 23: Dropout rate by zone ....................................................................................................... 102
Figure 24: Secondary school enrolment ............................................................................................. 103
Figure 25: Number of primary classrooms ......................................................................................... 104
Figure 26: Pupil to classroom ratio .................................................................................................... 105
Figure 27: Primary teachers’ houses by zone (2014 – 2017) ............................................................... 106
Figure 28: Toilets in primary schools by zone (2013 – 2017) .............................................................. 106
Figure 29: Libraries in primary schools by zone (2013 – 2017) ........................................................... 107
Figure 30: Primary school desks by zone (2013 – 2017) ..................................................................... 108
x
Figure 31: Secondary school classrooms ............................................................................................. 108
Figure 32: Secondary student to classroom levels (2013 – 2017) ........................................................ 109
Figure 33: Number of secondary school desks (2013 – 2017) ............................................................. 109
Figure 34: Secondary school libraries ................................................................................................. 110
Figure 35: Secondary school teachers houses (2013 – 2017) ............................................................... 110
Figure 36: Secondary school halls (2103 – 2017) ................................................................................. 111
Figure 37: Secondary school toilets (2013 – 2017) .............................................................................. 111
Figure 38: Secondary school teachers ................................................................................................ 113
LIST OF MAPS
Map 1: Machinga District and other districts in the Eastern Region
Map 2: Geology of Machinga District
Map 3: Agro-Climatic Zones
Map 4: Land Use
Map 5: Machinga Protected Areas
Map 6: Market routes for processed fish from Machinga
Map 7: Lake Chiuta water level-variations during wet and dry seasons
Map 8: Gravity-fed systems
Map 9: Functionality of Gravity-fed systems
Map 10: Schools in Machinga
xi
ACRONYMS
ACP Assistant Commissioner of Police
ADC Area Development Committee
ADD Agriculture Development Division
AEDC Agriculture Extension Development Coordinator
AEDO Agriculture Extension Development Officer
AIDS Acquired Immuno Deficiency Syndrome
BMC Block Management Committee
BMO Borehole Maintenance Overseer
BVC Beach Village Committee
CACC Community AIDS Coordinating Committee
CAMFED Campaign for Female Education
CBCC Community Based Child Care Centre
CBO Community Based Organisation
CBRLD Community Based Rural Land Development Programme
CCPW Community Child Protection Workers
CHAM Christian Hospitals Association of Malawi
CMAM Community Management of Acute Malnutrition
COMSIP Community Savings and Investment Promotion
CSO Civil Society Organisation
CVSU Community Victim Support Unit
DACC District Aids Coodinating Committee
DADO District Agriculture Development Office
DCT District Coordinating Team
DEC District Executive Committee
DEMIS District Education Management Information System
DEVPOL Statement of Development Policy
DREAMS IC Determinded Realistic Empowerment AIDS Free Mentored Scale up Innovation Challenge
DWSIP District Water and Sanitation Investment Plan
DYO District Youth Officer
ECD Early Childhood Development
EPA Extension Planning Area
xii
FAO Food and Agriculture Organisation
FBO Faith Based Organisation
FHI360 Family Health International
GFS Gravity Fed System
HIV Human Immuno Virus
HSSP Health Sector Strategic Plan
HTC HIV Testing and Counselling
ICT Information Communication Technology
IGA Income Generating Activities
IPTE Initial Primary Teacher Education
LDF Local Development Fund
LED Local Economic Development
LGAP Local Government Accountability and Performance project
LUANAR Lilongwe University of Agriculture and Natural Resources
MALDECO Malawi Lake Development Company
MDHS Malawi Demographic and Health Survey
MGDS Malawi Growth and Development Strategy
MoEST Ministry of Education, Science and Technology
MP Member of Parliament
MSME Micro, Small and Medium Enterprises
NAC National AIDS Commission
NCST Nutrition Care and Support Treatment
NGO Non-Governmental Organisation
NRU Nutrition Rehabilitation Unit
NSO National Statistical Office
ODL Open and Distance Learning
OPC Office of the President and Cabinet
OTP Outpatient Therapeutic Program
OVC Orphan and Vulnerable Children
OVOP One Village One Product
PEA Primary Education Advisor
PHC Population and Housing Census
xiii
PMTCT Prevention of Mother to Child Transmission
RDP Rural Development Programme
REE Rare Earth Elements
RUTF Ready-to-use Therapeutic Food
SDG Sustainable Development Goal
SEP Socio Economic Profile
SFFRFM Smallholder Farmers Fertiliser Revolving Fund of Malawi
SFP Supplementary Feeding Programme
SIVAP Small Irrigation and Value Addition Project
STA Sub Traditional Authority
TA Traditional Authority
TDC Teacher Development Centre
TEVETA Technical Entrepreneur Vocational Training Authority
VDC Village Development Committee
VFA Village Forestry Area
VNRMC Village Natural Resources Management Committee
WMA Water Monitoring Assistant
WMS Welfare Monitoring Survey
WPC Water Point Committee
xiv
Foreword
The Machinga District Council 2017-2022 Socio Economic Profile (SEP) has been developed following a
thorough consultative and technical process. Reliable data and technical information were obtained from the
various sources.
Malawi Vision 2020
Malawi Vision 2020 is the country’s official long-term development perspective from which medium- and
short-term development strategy and plans are developed. The development of the Vision 2020, which was
officially published in 1998, followed 10-year Statements of Development Policies (DEVPOLs) that were used
after Malawi attained Independence in 1964.
Vision 2020 seeks to address nine strategic challenges which are:
(1) Good governance, (2) Sustainable economic growth and development, (3) Vibrant culture, (4) Economic
infrastructure, (5) Social sector development, (6) Science and technology-led development, (7) Fair and
equitable distribution of income and wealth, (8) Food security, (9) Sustainable natural resource and
environmental management.
The Malawi Growth and Development Strategy (MGDS) III (2017-2022)
The aims of the MGDS III are to build a productive, competitive, and resilient nation by consolidating the
achievements of MGDS I and MGDS II. The MGDS III has singled out six national priority areas that will spur
the socioeconomic development of this country. Agriculture and climate change management is expected to
contribute to national food security status, nutrition enhancement, environmental management, agro-
processing and value addition, and manufacturing and trade. Education and skills development will promote
industry, trade, technology adoption, increased productivity, and improved levels of employment. Energy,
industry, and tourism development will increase employment, productivity, exports, and net trade.
Transport and ICT infrastructure will augment agri-business, private sector growth, education and health
service provision, tourism development, and global partnerships, as well as security enhancement. Lastly,
effective implementation of health and population as a priority area will enhance productivity among the
labour force, reduce the disease burden, reduce unemployment and gender inequality, and enhance land-use
planning and human settlements to optimize ecosystem services to support key sectors such as energy,
health, agriculture, and tourism.
In line with the above MGDS III aspirations, the Machinga Socioeconomic Profile has analyzed gaps and
achievements to see where increased interventions should be made. The findings and conclusions of the SEP
will inform the preparation of the District Development Plan to be implemented during the period of 2017-
2022.
Councillor Margaret Uladi
Machinga District Council Chairperson
xv
Acknowledgements
The 2017 – 2022 Socioeconomic Profile (SEP) was prepared by the Machinga District Council through the
Socioeconomic Profile drafting team that was assembled by the District Executive Committee.
Contributors
The Machinga District Council is highly indebted to the following task team members for their contributions
towards the development of the various SEP chapters:
Mr. Kalaya (District Environmental Health Officer), Sarah Khozi (District Education Manager), George
Mdinga (District Education Information Management Officer), Yohane Mwangosi (Agriculture Planning
Officer), Martin Namaona (Farm Mechanisation Officer), Julio Chiwalo (Senior Assistant Animal Veterinary
Officer), Redson Mphande (Assistant Irrigation Officer), Joster Mharu (Assistant Meteorological Officer), B.
Mtayamanja(Principle Administrative Officer), Linda Chiwale (District Lands Officer), Montfort Somanje
(Assistant District Forestry Officer), Marvin Mkondiwa (Assistant Coorperative Liaison Officer), George
Mwazaangati (District Fisheries Officer), Chrissy Banda (Labour Officer), Steve Meja District (Water
Development Officer), Bertha Mijoya (District Social Welfare Officer), Mr. Kachinjika (Assistant Community
Development Officer), Sweden Zuze (District Youth Development Officer), Shepherd Jere (Assistant District
Disaster Risk Management Officer), Ben Tonho (Senior Nutrition HIV/AIDS Officer), Evance Chisiano
(District Information Officer), ACP Kawale (Officer-In-Charge,Machinga Police),and Willy Katimba (Acting
Monitoring And Evaluation Officer).
The Council gives special recognition to Mr Morson Magombo (Senior Economist) and Mr Mbawaka
Mwakhwawa (Acting Director for Planning and Development) for working tirelessly to compile this SEP. The
council would like also to thank officials from the Ministry of Local Government and Rural Development’s
Directorate of Planning and Policy, especially Moses Aaron Zuze and Walusungu V. Kayira for providing
technical backstopping
The District would also like to thank the Local Government Accountability and Performance (LGAP) project
for the financial and technical support, particularly by providing the technical services of the Lead Consultant
and the District Consultant, Dr. Milton Kutengule and Macward Themba, respectively. It would have been
difficult to accomplish this task without their capable facilitation.
Last but not least, I would like to commend the District Executive Committee (DEC), the Development
Committee of the Council, and the Full Council itself for contributions, recommending, and approving the
document. We have together charted a new direction for Machinga District Council, which should see us
effectively, and efficiently designing and implementing socioeconomic development activities in the district.
Bester Mandere
District Commissioner
xvi
Executive Summary
Machinga District Council has produced this socioeconomic profile as a tool to provide an overview of the
district and trigger sustainable development of its communities. The profile highlights three focus areas that
are critical and interdependent in the enhancement of socioeconomic development of the district: social
services delivery, economic services delivery, and demography and settlement patterns of the district.
The socioeconomic profile has, at all stages during its development, been responsive and aligned to the
global Sustainable Development Goals, the Malawi Vision 2020, and the priority areas in the Malawi
Growth and Development Strategy III, in particular, as well as sector-specific policy instruments, as will be
noted in the respective chapters.
Under social services delivery, the profile has critically analysed the current situation, gaps and their impact
on the district education, health, water service, social welfare, HIV/AIDS and nutrition, and disaster and risk
management.
An analysis of economic services also hinges on the current situation, gaps, and their impact in areas of
agricultural production (crop and livestock), irrigation, fisheries, forestry, mining, commerce and industry
(banking and credit facilities), labour and employment, communication, and tourism.
An analysis of the district geographic areas, demography, and settlement is similarly extensive. This analysis
focuses principally on population and its characteristics, settlement and migratory patterns, and land use and
available natural resources. The profile thus singles out three priority areas that have a huge bearing on the
socioeconomic development of the people of Machinga: health, agriculture, and education.
Health services: The socioeconomic profile provides information on the level of health services delivery and
access. It outlines the required and real situation of health services on the ground, and gives a snapshot of
disease prevalence and affects.
Agriculture: in this area, this socioeconomic profile highlights major cash crops for potential export and food
crops cultivated in Machinga. Likewise, aquaculture and capture fishery is one of the most important
economic undertakings by the people living near Lake Chilwa and Chiuta. Livestock keeping is another major
economic activity for the majority of people in the district; cattle, goats, and poultry are important sources
of income.
Education: The profile outlines the state of education mainly at the primary and secondary levels in the
district and indicates required spatial material for education improvement. The profile also looks at literacy
rates in the district, which are comparatively very low. The literacy rate in the general adult population in
the district is 59.7% (46.4% females); this is lower than the national adult literacy rate of 73.6%. A high
number of pupils drop out of the school system before they reach Standard 5. The district will therefore
consider education its priority area for development in the next five years, from 2017 to 2022.
- 2 -
CHAPTER I
1.0 GENERAL FEATURES
Machinga District is richly endowed with natural resources. In the development of this Socio-
economic profile, the District Council seeks to capitalize on its potential in line with the
development goals and benchmarks outlined in the Malawi Growth and Development Strategy III
(MGDS) III and the global Sustainable Development Goals (SDGs). For example, particular note has
been made of Priority Area #6, sub section 1:7 in the MGDS III, which outlines how the vast
geological and mineral potential in Malawi in general, and Machinga in particular, can be
economically exploited.
1.1 Physical Description
1.1.1 Location and Size
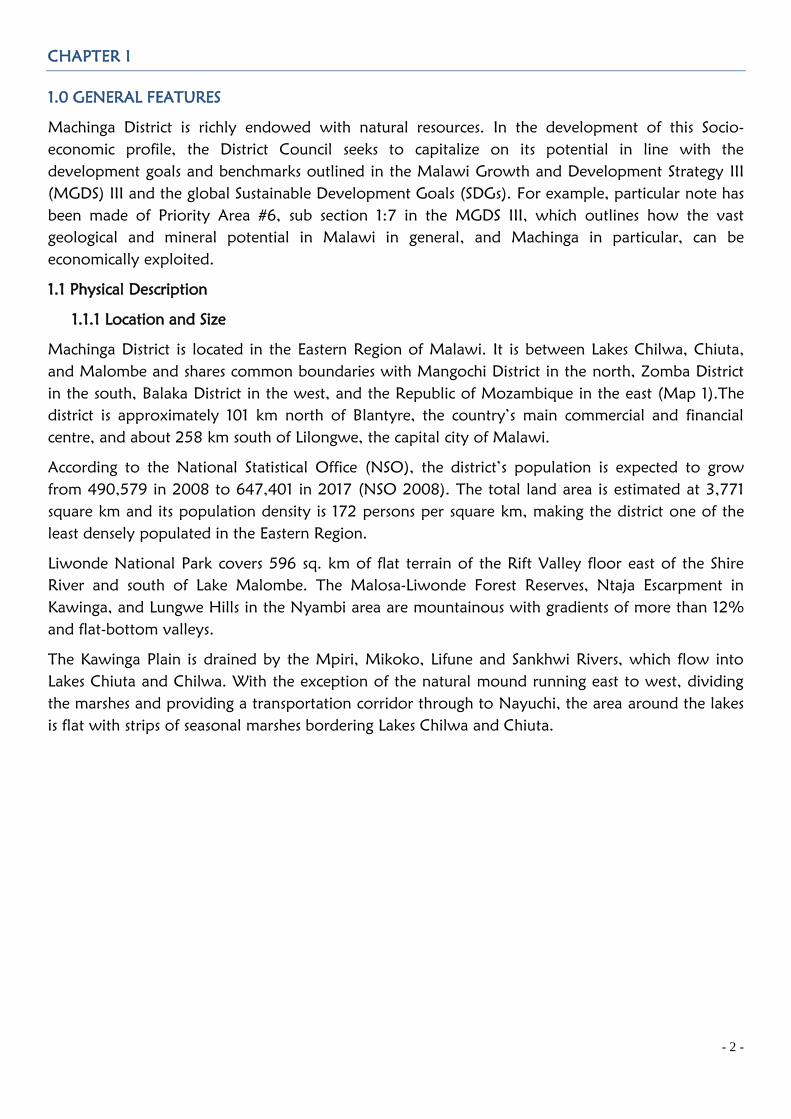
Machinga District is located in the Eastern Region of Malawi. It is between Lakes Chilwa, Chiuta,
and Malombe and shares common boundaries with Mangochi District in the north, Zomba District
in the south, Balaka District in the west, and the Republic of Mozambique in the east (Map 1).The
district is approximately 101 km north of Blantyre, the country’s main commercial and financial
centre, and about 258 km south of Lilongwe, the capital city of Malawi.
According to the National Statistical Office (NSO), the district’s population is expected to grow
from 490,579 in 2008 to 647,401 in 2017 (NSO 2008). The total land area is estimated at 3,771
square km and its population density is 172 persons per square km, making the district one of the
least densely populated in the Eastern Region.
Liwonde National Park covers 596 sq. km of flat terrain of the Rift Valley floor east of the Shire
River and south of Lake Malombe. The Malosa-Liwonde Forest Reserves, Ntaja Escarpment in
Kawinga, and Lungwe Hills in the Nyambi area are mountainous with gradients of more than 12%
and flat-bottom valleys.
The Kawinga Plain is drained by the Mpiri, Mikoko, Lifune and Sankhwi Rivers, which flow into
Lakes Chiuta and Chilwa. With the exception of the natural mound running east to west, dividing
the marshes and providing a transportation corridor through to Nayuchi, the area around the lakes
is flat with strips of seasonal marshes bordering Lakes Chilwa and Chiuta.
- 3 -
Map 1: Machinga District and other Eastern Region Districts
Source: Malawi Political Map – Extract of the Eastern Region (2008 PHC)
1.2 Geology and Mineral Resources of Machinga District
1.2.1 Geology
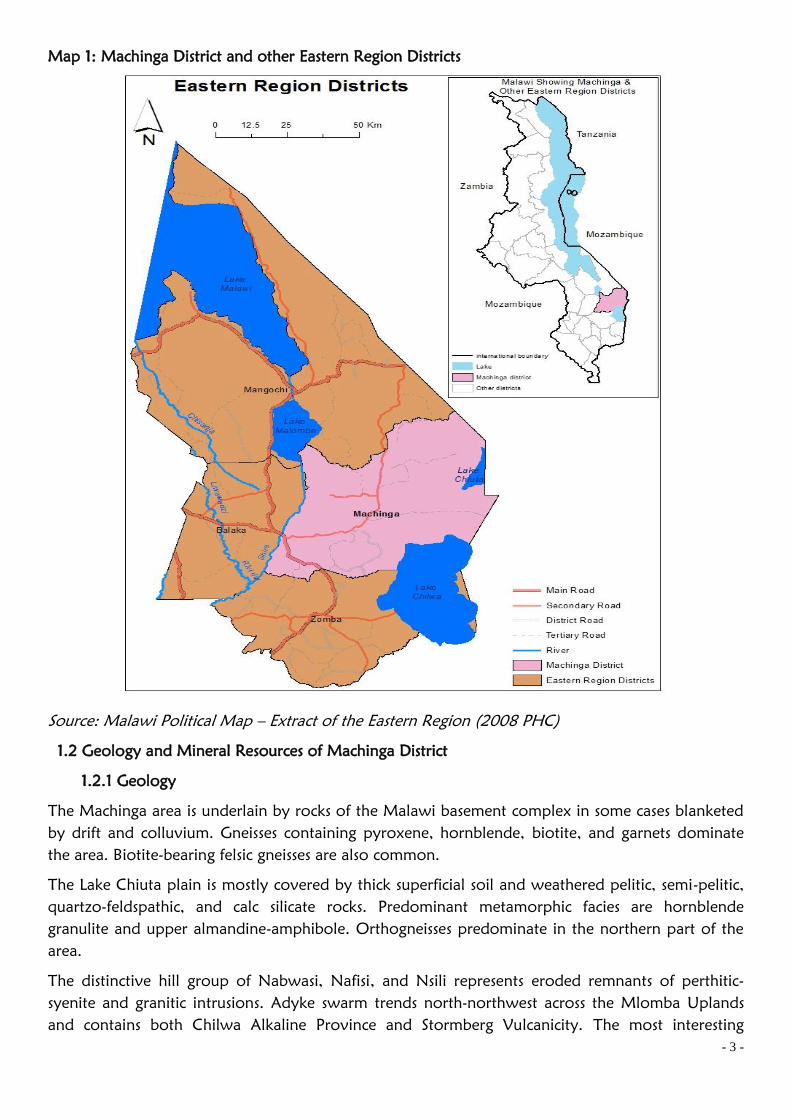
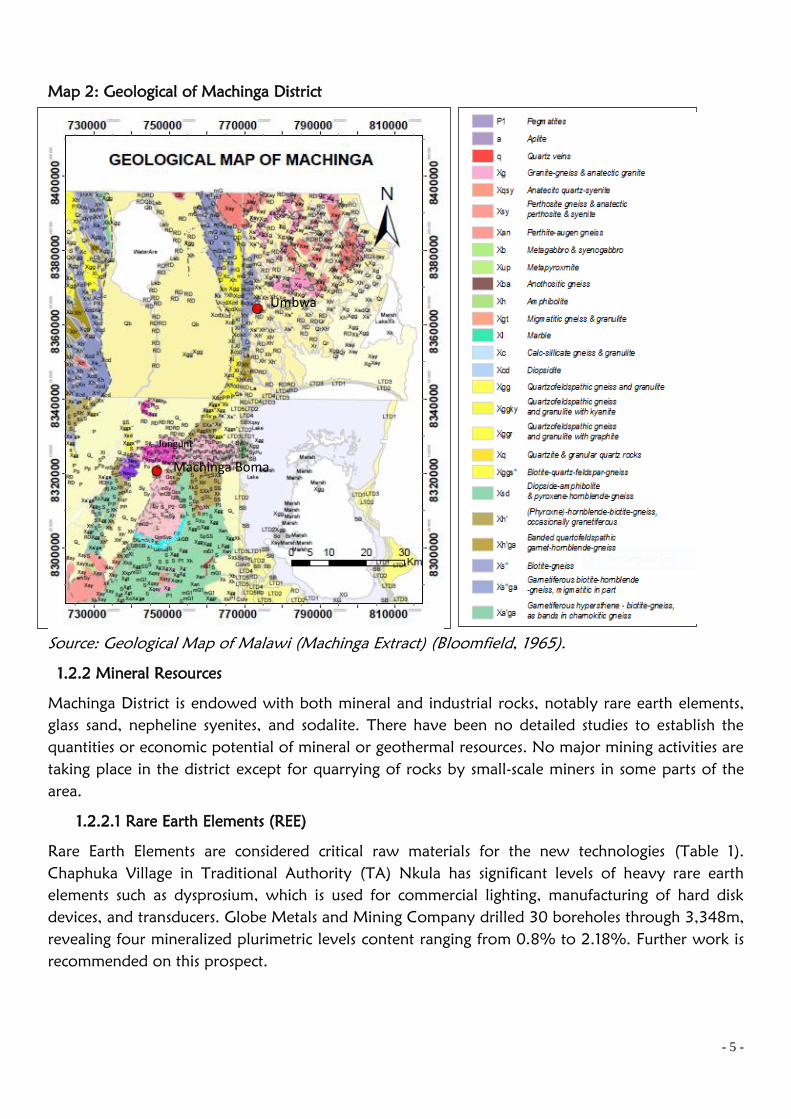
The Machinga area is underlain by rocks of the Malawi basement complex in some cases blanketed
by drift and colluvium. Gneisses containing pyroxene, hornblende, biotite, and garnets dominate
the area. Biotite-bearing felsic gneisses are also common.
The Lake Chiuta plain is mostly covered by thick superficial soil and weathered pelitic, semi-pelitic,
quartzo-feldspathic, and calc silicate rocks. Predominant metamorphic facies are hornblende
granulite and upper almandine-amphibole. Orthogneisses predominate in the northern part of the
area.
The distinctive hill group of Nabwasi, Nafisi, and Nsili represents eroded remnants of perthitic-
syenite and granitic intrusions. Adyke swarm trends north-northwest across the Mlomba Uplands
and contains both Chilwa Alkaline Province and Stormberg Vulcanicity. The most interesting
- 4 -
superficial deposition in the area is the Chiuta/Chilwa sandbar, which formed as a result of the
shrinkage of Lake Chilwa (Dawson, 1970).
The Upper Jurassic to Lower Cretaceous Chilwa Alkaline Province is well represented by a number
of both saturated and under-saturated plutons, some small vents, and numerous minor intrusions.
The four linked nepheline syenite ring complexes of Chikala, Chaune, Mongolowe, and Chinduzi
Hills form an east-west line and become increasingly alkaline westwards. There is also a small
foyaitic ring complex called Junguni Hill near the Shire River.
Chikala Hill is made up of three main groups of rocks: basement complex gneisses, metavolcanics,
and altered basic rocks, both syenites and nepheline syenites. The rocks in Chaone Hill are mainly
pulaskites and foyaites, while rocks in Mongolowe Hill are mainly syenite, pulaskite, foyaite, and
microfaite.
Chinduzi Hill lies to the south of Chikala Hill and is one of the nepheline syenites of complex basic
xenoliths and schlieren that are often oriented parallel to the lineation of the surrounding rocks.
There are also many thin pegmatite bands rich in nepheline.
Junguni Hill forms the smallest nepheline-syenite ring complex and lies on an isolated position. The
hill is surrounded by colluvial black sandy clay and is the most nepheline-rich of all the ring
complexes (Bloomfield, 1965).
- 5 -
Map 2: Geological of Machinga District
Source: Geological Map of Malawi (Machinga Extract) (Bloomfield, 1965).
1.2.2 Mineral Resources
Machinga District is endowed with both mineral and industrial rocks, notably rare earth elements,
glass sand, nepheline syenites, and sodalite. There have been no detailed studies to establish the
quantities or economic potential of mineral or geothermal resources. No major mining activities are
taking place in the district except for quarrying of rocks by small-scale miners in some parts of the
area.
1.2.2.1 Rare Earth Elements (REE)
Rare Earth Elements are considered critical raw materials for the new technologies (Table 1).
Chaphuka Village in Traditional Authority (TA) Nkula has significant levels of heavy rare earth
elements such as dysprosium, which is used for commercial lighting, manufacturing of hard disk
devices, and transducers. Globe Metals and Mining Company drilled 30 boreholes through 3,348m,
revealing four mineralized plurimetric levels content ranging from 0.8% to 2.18%. Further work is
recommended on this prospect.
Umbwa
Machinga Boma
Junguni

- 6 -
Table 1: Rare earth elements and their uses
Element Symbol Use
Scandium Sc Aerospace framework, high intensity street lamps, high performance
equipment
Yttrium Y Television sets, cancer treatment drugs, strength of alloys
Lanthanum La Camera lenses, battery electrodes, hydrogen storage
Cerium Ce Catalytic converters, coloured glass, steel production
Praseodymiu
m
Pr Super-strong magnets, welding goggles, lasers
Neodymium Nd Extremely strong permanent magnets, microphones, electric motors for
hybrid automobiles, lasers
Samarium Sm Cancer treatment, nuclear reactor control rods, x-ray lasers
Europium Eu Television screens, fluorescent glass, genetic screening tests
Gadolinium Gd Shielding nuclear reactors, nuclear marine propulsion, durability of alloys
Terbium Tb Television sets, fuel cells, sonar systems
Dysprosium Dy Commercial lighting, hard disk devices, transducers
Holmium Ho Lasers, glass colouring, high strength magnets
Erbium Er Glass colorant, signal amplification for fibre optical cables, metallurgical
uses
Thulium Tm High efficiency lasers, portable x-ray machines, high temperature super-
conductor
Ytterbium Yb Stainless-steel, lasers, ground monitoring devices
Lutetium Lu Refining petroleum, LED light bulbs, integrated circuit manufacturing
Source: https://cyberraiden.wordpress.com/2012/04/22/rare-earth-elements-and-their-uses
1.2.2.2 Glass/Silica Sands
A large deposit of glass sand (some 40 km long long) occurs in a sand bar between Lakes Chiuta
and Chilwa near the Mozambique border. Reserves of well-sorted quartz sand are estimated at 25
metric tonnes, averaging 92.7% SiO2and 0.62% iron, which are suitable for the manufacture of
brown (amber) quality glass containers.
The deposits also contain quartz sands (low Fe2O3Al2O3 contents) that could be suitable for the
manufacture of plate and window glass, as well as reasonably clear glass containers (Marteau. et al,
2015). The sand is also suitable for building purposes.
1.2.2.3 Nepheline Syenites
Nepheline syenites are under-saturated plutonic silica rocks made up of nepheline and alkali
feldspars in association with varying amounts of clinopyroxene, amphibole, sphene, zircon, and
biotite. These rocks are highly sought-after on international markets for their high feldspar content,
used in ceramic and glass manufacturing. They are also used as pigments and fillers. These rocks are
found in all the five nepheline syenite ring complexes: the Chikala, Chaone, Mongolowe, Chinduzi,
and Junguni Hills. No proper estimates of the reserves have been made so far but speculations are
that they may be in excess of 1 million tonnes.
1.2.2.4 Sodalite
Sodalite is a tectosilicate mineral widely used as an ornamental gemstone. Although massive
Sodalite samples are opaque, crystals are usually transparent to translucent. Machinga has a deposit
of sodalite at Junguni Hill. The hill is essentially composed of course-grained sodalite-nepheline plus
- 7 -
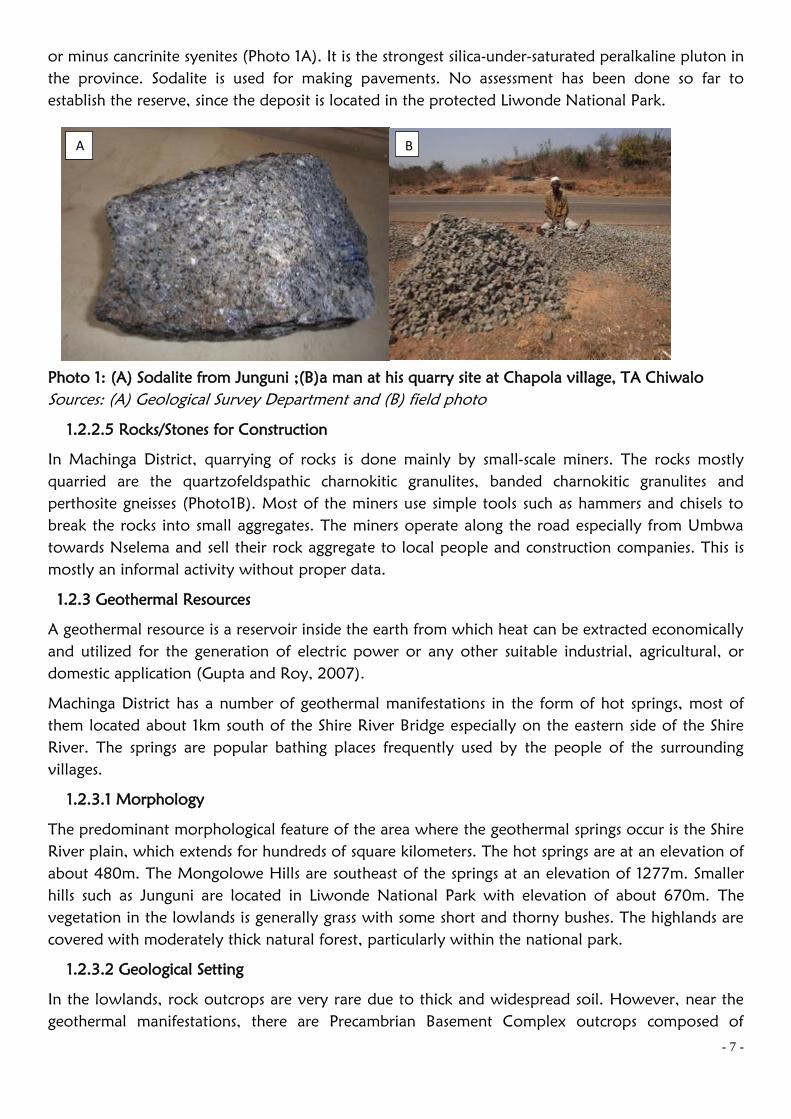
or minus cancrinite syenites (Photo 1A). It is the strongest silica-under-saturated peralkaline pluton in
the province. Sodalite is used for making pavements. No assessment has been done so far to
establish the reserve, since the deposit is located in the protected Liwonde National Park.
Photo 1: (A) Sodalite from Junguni ;(B)a man at his quarry site at Chapola village, TA Chiwalo
Sources: (A) Geological Survey Department and (B) field photo
1.2.2.5 Rocks/Stones for Construction
In Machinga District, quarrying of rocks is done mainly by small-scale miners. The rocks mostly
quarried are the quartzofeldspathic charnokitic granulites, banded charnokitic granulites and
perthosite gneisses (Photo1B). Most of the miners use simple tools such as hammers and chisels to
break the rocks into small aggregates. The miners operate along the road especially from Umbwa
towards Nselema and sell their rock aggregate to local people and construction companies. This is
mostly an informal activity without proper data.
1.2.3 Geothermal Resources
A geothermal resource is a reservoir inside the earth from which heat can be extracted economically
and utilized for the generation of electric power or any other suitable industrial, agricultural, or
domestic application (Gupta and Roy, 2007).
Machinga District has a number of geothermal manifestations in the form of hot springs, most of
them located about 1km south of the Shire River Bridge especially on the eastern side of the Shire
River. The springs are popular bathing places frequently used by the people of the surrounding
villages.
1.2.3.1 Morphology
The predominant morphological feature of the area where the geothermal springs occur is the Shire
River plain, which extends for hundreds of square kilometers. The hot springs are at an elevation of
about 480m. The Mongolowe Hills are southeast of the springs at an elevation of 1277m. Smaller
hills such as Junguni are located in Liwonde National Park with elevation of about 670m. The
vegetation in the lowlands is generally grass with some short and thorny bushes. The highlands are
covered with moderately thick natural forest, particularly within the national park.
1.2.3.2 Geological Setting
In the lowlands, rock outcrops are very rare due to thick and widespread soil. However, near the
geothermal manifestations, there are Precambrian Basement Complex outcrops composed of
A B
- 8 -
quartz-feldspathic gneiss with some strips of high grade-course grained marble. In the western and
southern parts, the regionally predominant biotite-hornblende gneiss largely outcrops the area. The
topographically high domes of Junguni and Mongolowe are composed of syenites and nepheline
syenites belonging to the Paleozoic Lake Malawi Granite Province.
There are many evident morphological breakups that may be referred to as faults, and the drainage
pattern itself indicates some preferential trends that could be related with hidden structures.
Accordingly, on the western side of the Shire River almost all the tributary streams flow to the east.
On the other hand, the rivers and streams on the eastern side of the Shire flow to the south
following the regional trends of the Rift Valley.
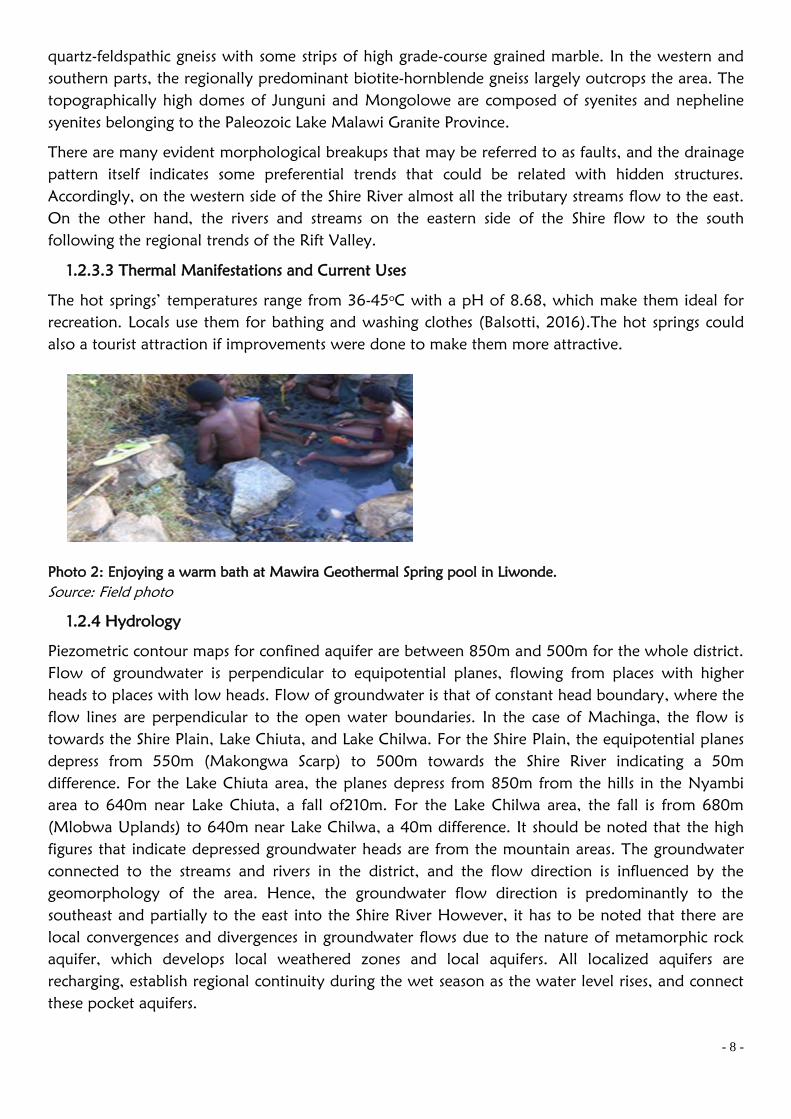
1.2.3.3 Thermal Manifestations and Current Uses
The hot springs’ temperatures range from 36-45oC with a pH of 8.68, which make them ideal for
recreation. Locals use them for bathing and washing clothes (Balsotti, 2016).The hot springs could
also a tourist attraction if improvements were done to make them more attractive.
Photo 2: Enjoying a warm bath at Mawira Geothermal Spring pool in Liwonde.
Source: Field photo
1.2.4 Hydrology
Piezometric contour maps for confined aquifer are between 850m and 500m for the whole district.
Flow of groundwater is perpendicular to equipotential planes, flowing from places with higher
heads to places with low heads. Flow of groundwater is that of constant head boundary, where the
flow lines are perpendicular to the open water boundaries. In the case of Machinga, the flow is
towards the Shire Plain, Lake Chiuta, and Lake Chilwa. For the Shire Plain, the equipotential planes
depress from 550m (Makongwa Scarp) to 500m towards the Shire River indicating a 50m
difference. For the Lake Chiuta area, the planes depress from 850m from the hills in the Nyambi
area to 640m near Lake Chiuta, a fall of210m. For the Lake Chilwa area, the fall is from 680m
(Mlobwa Uplands) to 640m near Lake Chilwa, a 40m difference. It should be noted that the high
figures that indicate depressed groundwater heads are from the mountain areas. The groundwater
connected to the streams and rivers in the district, and the flow direction is influenced by the
geomorphology of the area. Hence, the groundwater flow direction is predominantly to the
southeast and partially to the east into the Shire River However, it has to be noted that there are
local convergences and divergences in groundwater flows due to the nature of metamorphic rock
aquifer, which develops local weathered zones and local aquifers. All localized aquifers are
recharging, establish regional continuity during the wet season as the water level rises, and connect
these pocket aquifers.
- 9 -
1.2.5 Soil
The district has areas of low, medium, and high agricultural potential. Total arable land in
Machinga District is 3,012 square km, or 80% of the district’s total land area. Of that, only 1,340
square km (44%) has high agricultural potential; 207 square km (3%) have low agricultural
potential. There are 1,381 square km of marginal lands (46%) that are considered unsuitable for
agriculture.
1.2.5.1 Soil Types
There are four soil types occurring in the district. Nsanama, Nampeya, Nanyumbu, and Chikweo
EPAs have loamy sand to sandy loam soils and occur around Lakes Chiuta and Chilwa. Nyambi,
Mbonechera, and Mtubwi EPAs have clay loam-to-loam clay soils. The upper parts of the EPAs
have sandy loam to sandy clay, while the lower parts of EPAs have loam to sandy clay loam soils.
Soil erosion in the district has resulted in significant reduction of yields and formation of gullies and
floods in areas like TAs Liwonde and Sitola. The grazing lands in the district are all punctuated with
reels and gullies. According to the World Bank’s National Environmental Action Plan (1991), 13 tons
of soil per hectare per year are lost through erosion in Machinga District. This results in yield loss
from 2.6 to7.4%. Erosion has been accelerated by:
Cultivation on steep slopes, river beds, and river banks
Poor cultivation practices
Overgrazing
Monocropping
1.2.6 Vegetation
There are two major vegetation types in the district: semi-evergreen forest and perennially wet
grasslands. Semi-evergreen forest is found in Malosa, Chikala, Chinduzi, and Liwonde Forest
Reserves, where the dominant tree species are Brachystegia boehmii (Ntwana, Tsamba), Burkea
Africana (Nkalati), Brideliamicrantha (Nsopa), Pericopsisangolesis (Muwanga) and
Pterocarpusangolesis (Mlombwa). Perennially wet grasslands are in the Lake Chilwa and Chiuta
marshes, while open canopy woodlands and shrubs are mostly located in upland areas and in the
Kawinga Plains.
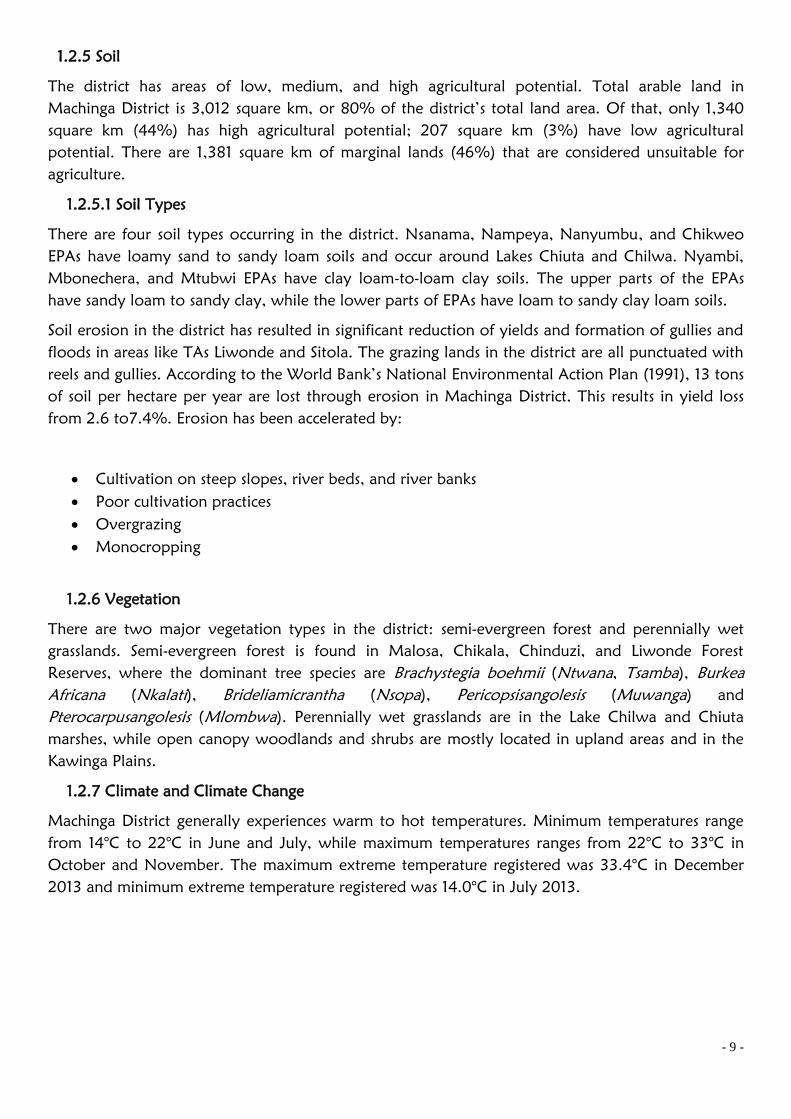
1.2.7 Climate and Climate Change
Machinga District generally experiences warm to hot temperatures. Minimum temperatures range
from 14°C to 22°C in June and July, while maximum temperatures ranges from 22°C to 33°C in
October and November. The maximum extreme temperature registered was 33.4°C in December
2013 and minimum extreme temperature registered was 14.0°C in July 2013.
- 10 -
Table 2: Minimum temperatures for Machinga District
Yr Jan Feb Mar Apr May June July Aug Sep Oct Nov Dec Mea
n
Min Max
2013 21.4 20.7 20.6 18.4 16 14.5 14.0 15.6 18.7 20 22.7 21.6 18.7 14.0 22.7
2014 21.3 20.9 20.9 19.1 16.7 14.8 14.9 15.8 17.3 19.1 21.0 21.8 18.6 14.8 21.8
2015 20.7 21.0 20.4 19.6 17.4 15.4 15.4 19.5 18.5 21.1 22.0 22.7 19.5 15.4 22.7
2016 22 21.7 21.5 20.6 17.6 14.9 15.1 14.8 16.2 20 22.5 21.4 19.0 14.8 22.5
Source: GoM DCC&MS: Ntaja Meteorological Station
Table 3: Maximum temperatures for Machinga District
Year Jan Feb Mar Apr May June July Aug Sep Oct Nov Dec Mean Min Max
2013 28.6 28.5 29.2 28.4 26.4 25.5 24.6 27.8 31.3 32.8 31.6 33.4 29.0 24.6 33.4
2014 29.5 29.3 28.6 29.6 28.4 29.3 23.6 29.6 30.9 33.1 32.9 30.6 29.6 23.6 33.1
2015 32.6 31.2 29.3 30.4 29.3 28.6 25.8 26.9 31.2 29.8 29.7 31.2 29.7 25.8 32.6
2016 29.7 30.7 30.6 29.8 30.6 29.6 26.2 29.3 30.6 31.6 30.4 31.9 30.1 26.2 31.9
Source: GoM DCC&MS: Ntaja Meteorological Station
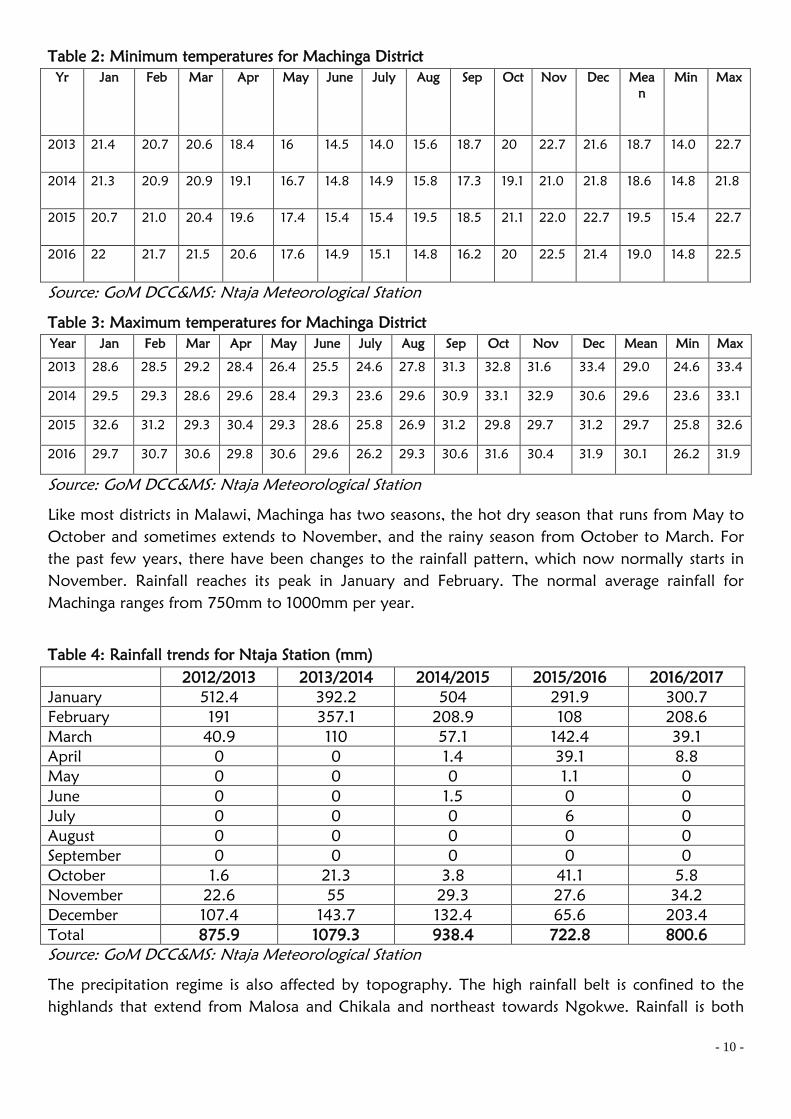
Like most districts in Malawi, Machinga has two seasons, the hot dry season that runs from May to
October and sometimes extends to November, and the rainy season from October to March. For
the past few years, there have been changes to the rainfall pattern, which now normally starts in
November. Rainfall reaches its peak in January and February. The normal average rainfall for
Machinga ranges from 750mm to 1000mm per year.
Table 4: Rainfall trends for Ntaja Station (mm)
2012/2013 2013/2014 2014/2015 2015/2016 2016/2017
January 512.4 392.2 504 291.9 300.7
February 191 357.1 208.9 108 208.6
March 40.9 110 57.1 142.4 39.1
April 0 0 1.4 39.1 8.8
May 0 0 0 1.1 0
June 0 0 1.5 0 0
July 0 0 0 6 0
August 0 0 0 0 0
September 0 0 0 0 0
October 1.6 21.3 3.8 41.1 5.8
November 22.6 55 29.3 27.6 34.2
December 107.4 143.7 132.4 65.6 203.4
Total 875.9 1079.3 938.4 722.8 800.6
Source: GoM DCC&MS: Ntaja Meteorological Station
The precipitation regime is also affected by topography. The high rainfall belt is confined to the
highlands that extend from Malosa and Chikala and northeast towards Ngokwe. Rainfall is both
- 11 -
conventional and orographic in nature, resulting in light to moderate intensities, except in severe
storms.
The low-lying areas experience low and unreliable rainfall, spatially and temporally, because the
rainfall is dominantly convective. Centres of low rainfall exist over rain shadow areas of Liwonde
Township and its extremities and Chilwa/Chiuta Marshes, with mean annual rainfall below 750mm
and 800mm, respectively. Any tropical cyclone moving from the Mozambique Channel westwards
passes over the southeastern part of the district during the rainy season, bringing with it strong
winds and torrential rainfall.
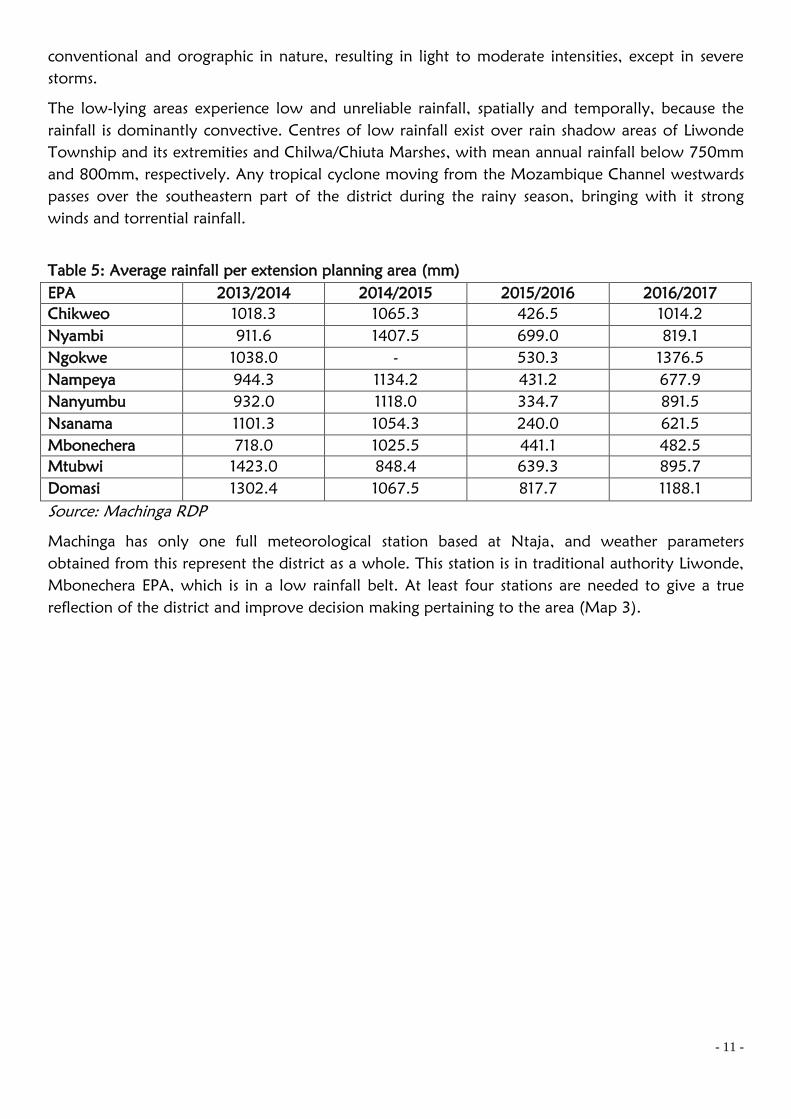
Table 5: Average rainfall per extension planning area (mm)
EPA 2013/2014 2014/2015 2015/2016 2016/2017
Chikweo 1018.3 1065.3 426.5 1014.2
Nyambi 911.6 1407.5 699.0 819.1
Ngokwe 1038.0 - 530.3 1376.5
Nampeya 944.3 1134.2 431.2 677.9
Nanyumbu 932.0 1118.0 334.7 891.5
Nsanama 1101.3 1054.3 240.0 621.5
Mbonechera 718.0 1025.5 441.1 482.5
Mtubwi 1423.0 848.4 639.3 895.7
Domasi 1302.4 1067.5 817.7 1188.1
Source: Machinga RDP
Machinga has only one full meteorological station based at Ntaja, and weather parameters
obtained from this represent the district as a whole. This station is in traditional authority Liwonde,
Mbonechera EPA, which is in a low rainfall belt. At least four stations are needed to give a true
reflection of the district and improve decision making pertaining to the area (Map 3).
- 12 -
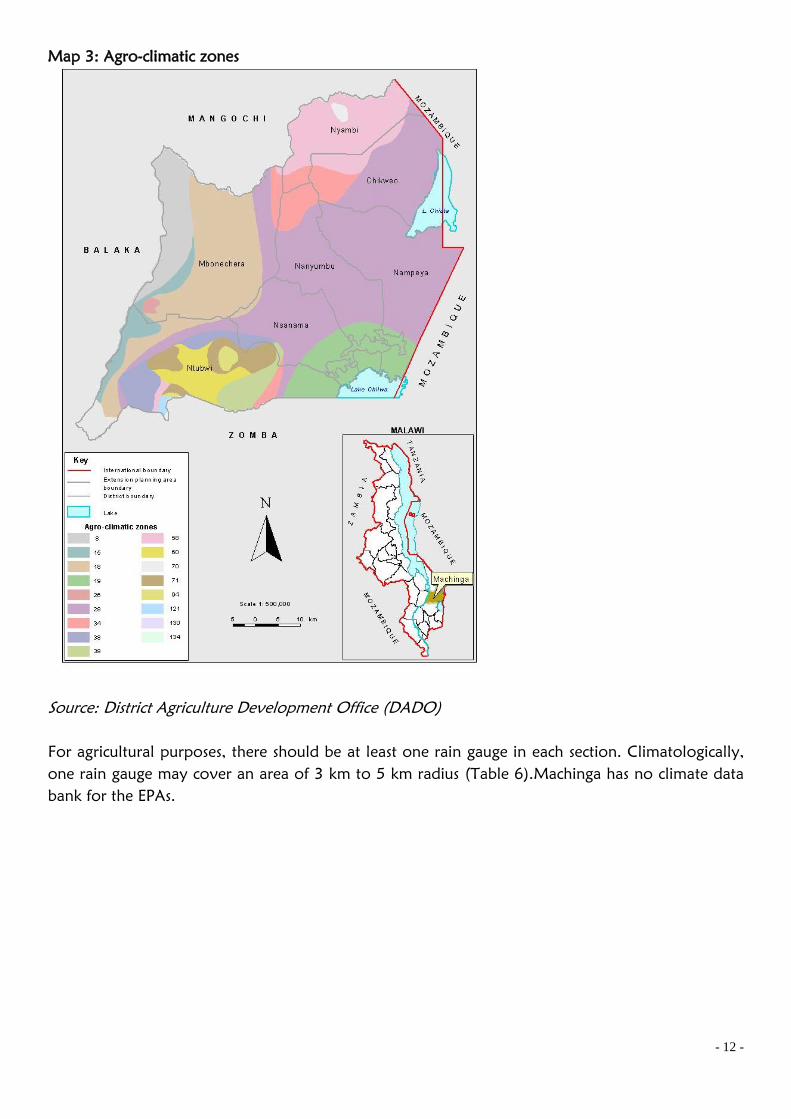
Map 3: Agro-climatic zones
Source: District Agriculture Development Office (DADO)
For agricultural purposes, there should be at least one rain gauge in each section. Climatologically,
one rain gauge may cover an area of 3 km to 5 km radius (Table 6).Machinga has no climate data
bank for the EPAs.
- 13 -
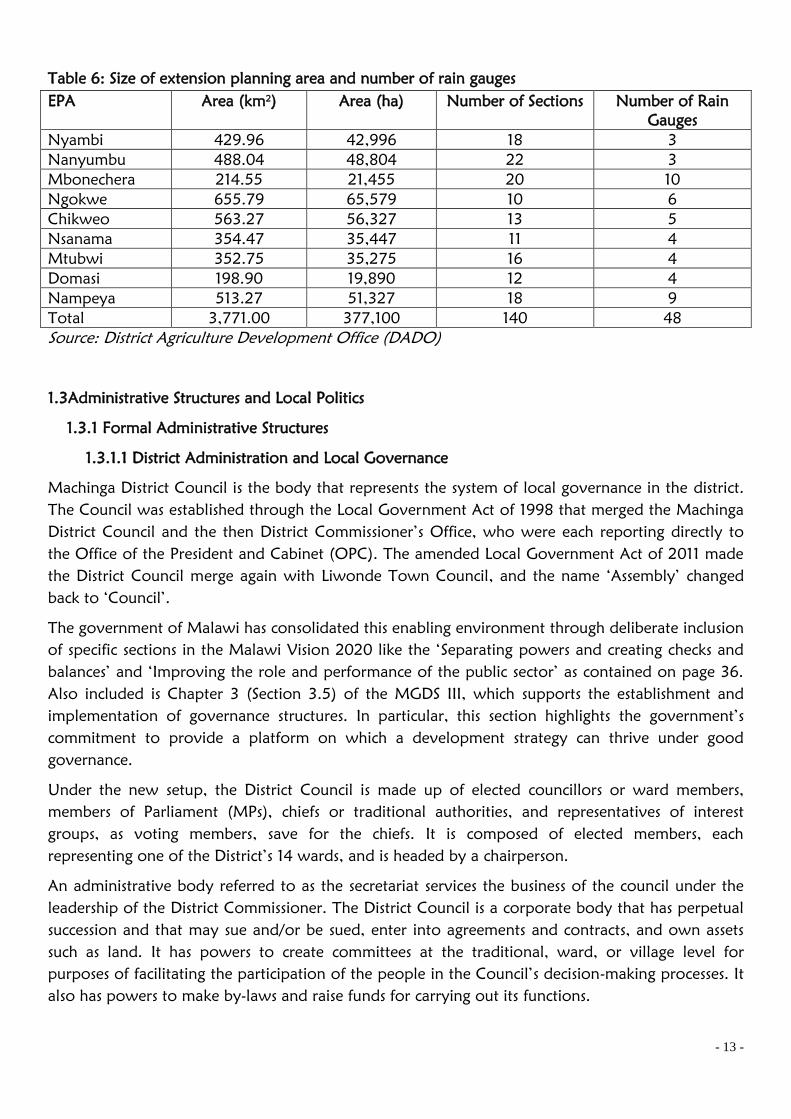
Table 6: Size of extension planning area and number of rain gauges
EPA Area (km2) Area (ha) Number of Sections Number of Rain
Gauges
Nyambi 429.96 42,996 18 3
Nanyumbu 488.04 48,804 22 3
Mbonechera 214.55 21,455 20 10
Ngokwe 655.79 65,579 10 6
Chikweo 563.27 56,327 13 5
Nsanama 354.47 35,447 11 4
Mtubwi 352.75 35,275 16 4
Domasi 198.90 19,890 12 4
Nampeya 513.27 51,327 18 9
Total 3,771.00 377,100 140 48
Source: District Agriculture Development Office (DADO)
1.3Administrative Structures and Local Politics
1.3.1 Formal Administrative Structures
1.3.1.1 District Administration and Local Governance
Machinga District Council is the body that represents the system of local governance in the district.
The Council was established through the Local Government Act of 1998 that merged the Machinga
District Council and the then District Commissioner’s Office, who were each reporting directly to
the Office of the President and Cabinet (OPC). The amended Local Government Act of 2011 made
the District Council merge again with Liwonde Town Council, and the name ‘Assembly’ changed
back to ‘Council’.
The government of Malawi has consolidated this enabling environment through deliberate inclusion
of specific sections in the Malawi Vision 2020 like the ‘Separating powers and creating checks and
balances’ and ‘Improving the role and performance of the public sector’ as contained on page 36.
Also included is Chapter 3 (Section 3.5) of the MGDS III, which supports the establishment and
implementation of governance structures. In particular, this section highlights the government’s
commitment to provide a platform on which a development strategy can thrive under good
governance.
Under the new setup, the District Council is made up of elected councillors or ward members,
members of Parliament (MPs), chiefs or traditional authorities, and representatives of interest
groups, as voting members, save for the chiefs. It is composed of elected members, each
representing one of the District’s 14 wards, and is headed by a chairperson.
An administrative body referred to as the secretariat services the business of the council under the
leadership of the District Commissioner. The District Council is a corporate body that has perpetual
succession and that may sue and/or be sued, enter into agreements and contracts, and own assets
such as land. It has powers to create committees at the traditional, ward, or village level for
purposes of facilitating the participation of the people in the Council’s decision-making processes. It
also has powers to make by-laws and raise funds for carrying out its functions.
- 14 -
The functions at the District Council, which are provided for in the Local Government Act of 1998
and are subject to National Development Plans and Policies, include:
Make policy and decisions on local governance and development for the district;
Consolidate and promote local democratic institutions and democratic participation;
Promote infrastructural and economic development through district development plans;
Mobilise resources within and outside the district;
Maintain peace and security in the district in conjunction with the national police service;
Make by-laws that facilitate its functions;
Appoint, develop, promote, and discipline its staff;
Cooperate with other district councils to learn from their experiences and exchange ideas;
Perform other functions and responsibilities, including the registration of births, deaths, and
marriages; and
Participate in the delivery of essential and local services as may be prescribed by an Act of
Parliament.
In the performance of its functions, the District Council has been mandated to form committees,
comprised of the councilor and co-opted members, which include 14 traditional authorities and 7
members of Parliament. There are six mandatory committees:
Finance Committee
Development Committee
Education Committee
Works Committee
Health and Environment Committee
Human Resource Committee
The Council may create additional bodies as it deems necessary.
1.3.1.2 Government and Non-Governmental Sectors
Under the administrative set-up of the Council, there is a District Executive Committee (DEC) that is
responsible for the preparation and execution of development plans. DEC draws its membership
from government ministries and departments, statutory co-operations, NGOs, and other civil
society groups.
The Local Government Act and Decentralisation Policy of 1998 recommended the devolution of
central government functions to district councils. In Machinga District, the following sectors have
devolved their functions: agriculture, education, fisheries, forestry, gender, health, housing,
immigration, irrigation, labour, national registration bureau, sports, trade, water development, and
youth development. Agriculture, health, and education are the only sectors that have completely
devolved their human resources.
There is also representation by the following statutory organisations:
Agricultural Development & Marketing Corporation (ADMARC)
Malawi Postal Corporation (MPC)
Malawi Council for the Handicapped (MACOHA)
Southern Region Water Board (SRWB)
Malawi Revenue Authority (MRA)
- 15 -
Electricity Supply Commission of Malawi (ESCOM)
Malawi Housing Corporation (MHC)
Machinga District has a number of non-governmental organisations (NGOs) and civil society
organisations (CSOs) that contribute to participation and economic empowerment of the
vulnerable groups, improve food security levels at household level, reduce illiteracy levels, and
increase access to health services. In contributing to these outcomes, there is good coordination
between the district council and these stakeholders(Annex 1 NGO database).
The council coordinates NGOs and CSOs through its DEC and the sub-committees of the DEC like
DACC. NGOs and CSOs play an integral part in the development of the district by working with
relevant sectors. The district, through DMECC, is involved in planning, monitoring, and evaluation
of their programmes by Organising joint monitoring and learning visits, and joint planning and
project review meetings.
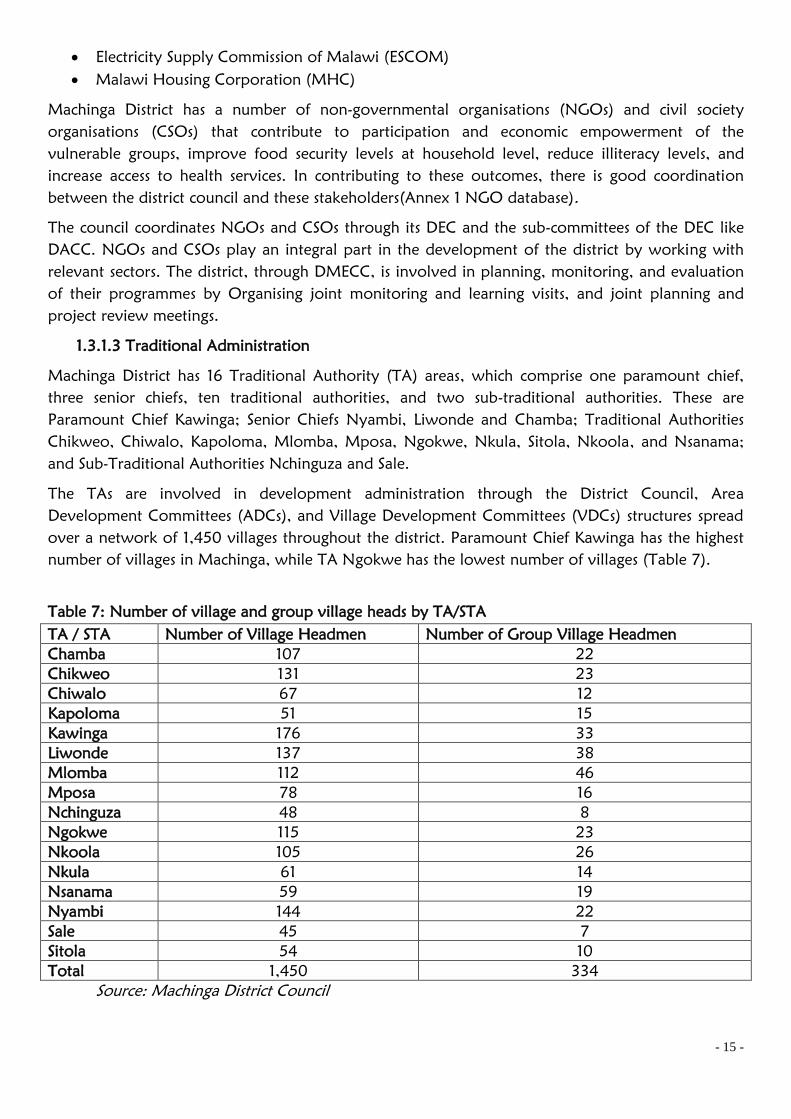
1.3.1.3 Traditional Administration
Machinga District has 16 Traditional Authority (TA) areas, which comprise one paramount chief,
three senior chiefs, ten traditional authorities, and two sub-traditional authorities. These are
Paramount Chief Kawinga; Senior Chiefs Nyambi, Liwonde and Chamba; Traditional Authorities
Chikweo, Chiwalo, Kapoloma, Mlomba, Mposa, Ngokwe, Nkula, Sitola, Nkoola, and Nsanama;
and Sub-Traditional Authorities Nchinguza and Sale.
The TAs are involved in development administration through the District Council, Area
Development Committees (ADCs), and Village Development Committees (VDCs) structures spread
over a network of 1,450 villages throughout the district. Paramount Chief Kawinga has the highest
number of villages in Machinga, while TA Ngokwe has the lowest number of villages (Table 7).
Table 7: Number of village and group village heads by TA/STA
TA / STA Number of Village Headmen Number of Group Village Headmen
Chamba 107 22
Chikweo 131 23
Chiwalo 67 12
Kapoloma 51 15
Kawinga 176 33
Liwonde 137 38
Mlomba 112 46
Mposa 78 16
Nchinguza 48 8
Ngokwe 115 23
Nkoola 105 26
Nkula 61 14
Nsanama 59 19
Nyambi 144 22
Sale 45 7
Sitola 54 10
Total 1,450 334
Source: Machinga District Council
- 16 -
1.3.2 Informal Administrative Structure
The dominant informal structures in the district are youth, men’s, and women’s groups. These
include community-based organisations (CBOs), faith-based organisations (FBOs), and support
groups. Such groups are most active in sports, traditional dances, and in caring for the aged,
orphans, and HIV/AIDS-affected persons (see details under the sector of Gender and Community
Services).
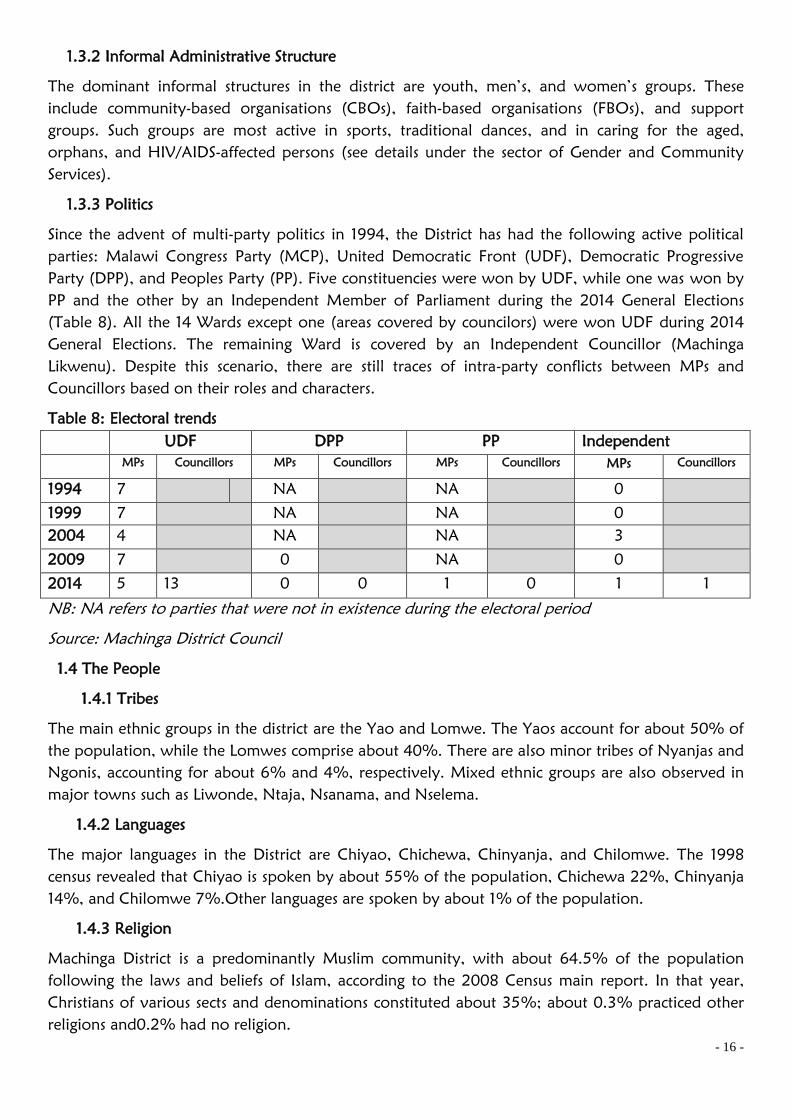
1.3.3 Politics
Since the advent of multi-party politics in 1994, the District has had the following active political
parties: Malawi Congress Party (MCP), United Democratic Front (UDF), Democratic Progressive
Party (DPP), and Peoples Party (PP). Five constituencies were won by UDF, while one was won by
PP and the other by an Independent Member of Parliament during the 2014 General Elections
(Table 8). All the 14 Wards except one (areas covered by councilors) were won UDF during 2014
General Elections. The remaining Ward is covered by an Independent Councillor (Machinga
Likwenu). Despite this scenario, there are still traces of intra-party conflicts between MPs and
Councillors based on their roles and characters.
Table 8: Electoral trends
UDF DPP PP Independent
MPs Councillors MPs Councillors MPs Councillors MPs Councillors
1994 7 NA NA 0
1999 7 NA NA 0
2004 4 NA NA 3
2009 7 0 NA 0
2014 5 13 0 0 1 0 1 1
NB: NA refers to parties that were not in existence during the electoral period
Source: Machinga District Council
1.4 The People
1.4.1 Tribes
The main ethnic groups in the district are the Yao and Lomwe. The Yaos account for about 50% of
the population, while the Lomwes comprise about 40%. There are also minor tribes of Nyanjas and
Ngonis, accounting for about 6% and 4%, respectively. Mixed ethnic groups are also observed in
major towns such as Liwonde, Ntaja, Nsanama, and Nselema.
1.4.2 Languages
The major languages in the District are Chiyao, Chichewa, Chinyanja, and Chilomwe. The 1998
census revealed that Chiyao is spoken by about 55% of the population, Chichewa 22%, Chinyanja
14%, and Chilomwe 7%.Other languages are spoken by about 1% of the population.
1.4.3 Religion
Machinga District is a predominantly Muslim community, with about 64.5% of the population
following the laws and beliefs of Islam, according to the 2008 Census main report. In that year,
Christians of various sects and denominations constituted about 35%; about 0.3% practiced other
religions and0.2% had no religion.
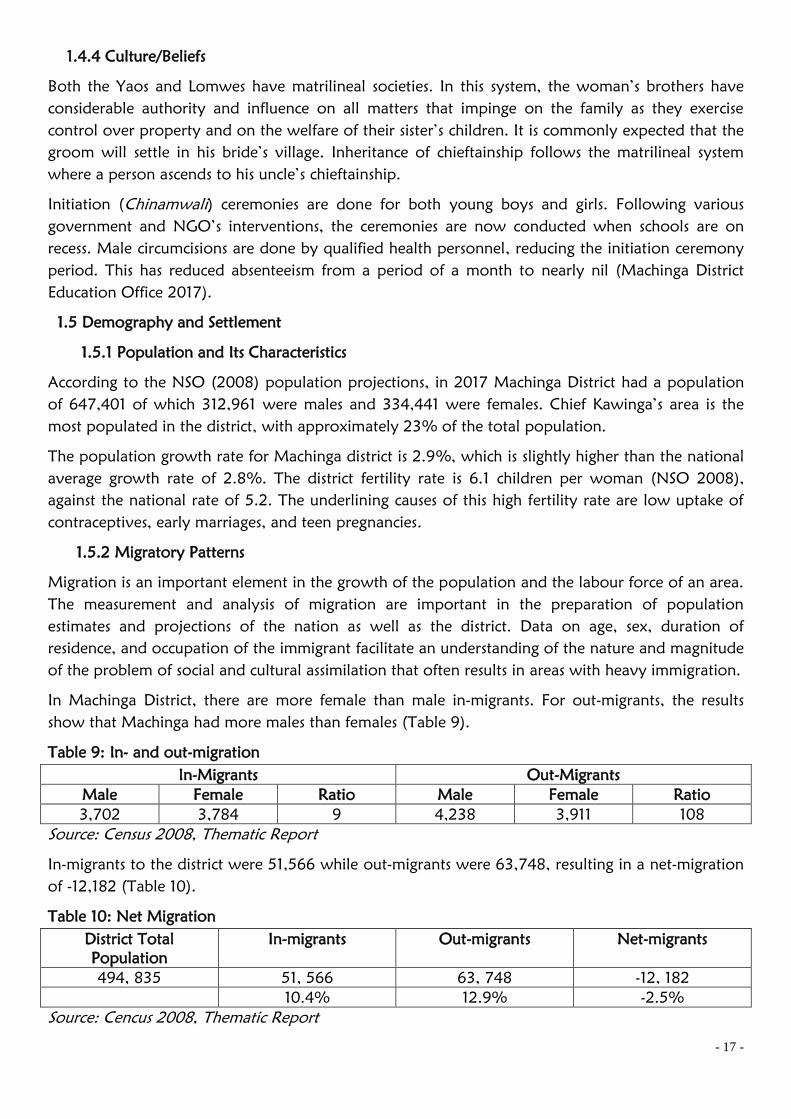
- 17 -
1.4.4 Culture/Beliefs
Both the Yaos and Lomwes have matrilineal societies. In this system, the woman’s brothers have
considerable authority and influence on all matters that impinge on the family as they exercise
control over property and on the welfare of their sister’s children. It is commonly expected that the
groom will settle in his bride’s village. Inheritance of chieftainship follows the matrilineal system
where a person ascends to his uncle’s chieftainship.
Initiation (Chinamwali) ceremonies are done for both young boys and girls. Following various
government and NGO’s interventions, the ceremonies are now conducted when schools are on
recess. Male circumcisions are done by qualified health personnel, reducing the initiation ceremony
period. This has reduced absenteeism from a period of a month to nearly nil (Machinga District
Education Office 2017).
1.5 Demography and Settlement
1.5.1 Population and Its Characteristics
According to the NSO (2008) population projections, in 2017 Machinga District had a population
of 647,401 of which 312,961 were males and 334,441 were females. Chief Kawinga’s area is the
most populated in the district, with approximately 23% of the total population.
The population growth rate for Machinga district is 2.9%, which is slightly higher than the national
average growth rate of 2.8%. The district fertility rate is 6.1 children per woman (NSO 2008),
against the national rate of 5.2. The underlining causes of this high fertility rate are low uptake of
contraceptives, early marriages, and teen pregnancies.
1.5.2 Migratory Patterns
Migration is an important element in the growth of the population and the labour force of an area.
The measurement and analysis of migration are important in the preparation of population
estimates and projections of the nation as well as the district. Data on age, sex, duration of
residence, and occupation of the immigrant facilitate an understanding of the nature and magnitude
of the problem of social and cultural assimilation that often results in areas with heavy immigration.
In Machinga District, there are more female than male in-migrants. For out-migrants, the results
show that Machinga had more males than females (Table 9).
Table 9: In- and out-migration
In-Migrants Out-Migrants
Male Female Ratio Male Female Ratio
3,702 3,784 9 4,238 3,911 108
Source: Census 2008, Thematic Report
In-migrants to the district were 51,566 while out-migrants were 63,748, resulting in a net-migration
of -12,182 (Table 10).
Table 10: Net Migration
District Total
Population
In-migrants Out-migrants Net-migrants
494, 835 51, 566 63, 748 -12, 182
10.4% 12.9% -2.5%
Source: Cencus 2008, Thematic Report
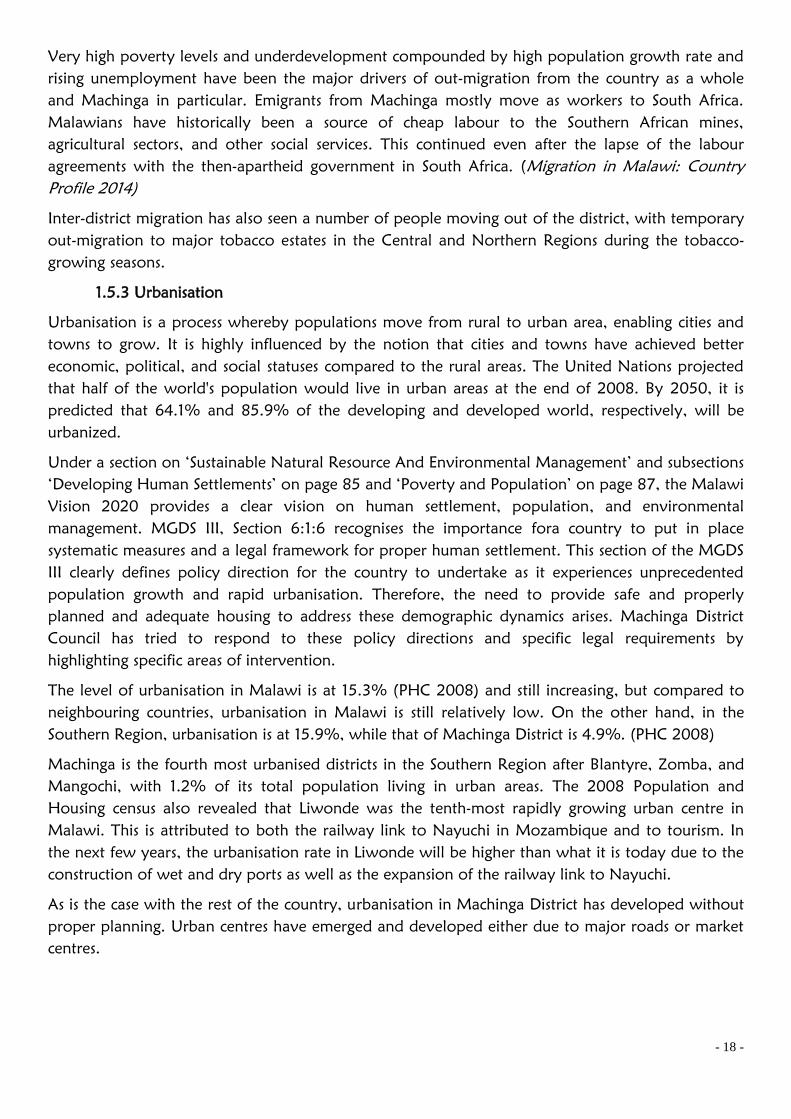
- 18 -
Very high poverty levels and underdevelopment compounded by high population growth rate and
rising unemployment have been the major drivers of out-migration from the country as a whole
and Machinga in particular. Emigrants from Machinga mostly move as workers to South Africa.
Malawians have historically been a source of cheap labour to the Southern African mines,
agricultural sectors, and other social services. This continued even after the lapse of the labour
agreements with the then-apartheid government in South Africa. (Migration in Malawi: Country
Profile 2014)
Inter-district migration has also seen a number of people moving out of the district, with temporary
out-migration to major tobacco estates in the Central and Northern Regions during the tobacco-
growing seasons.
1.5.3 Urbanisation
Urbanisation is a process whereby populations move from rural to urban area, enabling cities and
towns to grow. It is highly influenced by the notion that cities and towns have achieved better
economic, political, and social statuses compared to the rural areas. The United Nations projected
that half of the world's population would live in urban areas at the end of 2008. By 2050, it is
predicted that 64.1% and 85.9% of the developing and developed world, respectively, will be
urbanized.
Under a section on ‘Sustainable Natural Resource And Environmental Management’ and subsections
‘Developing Human Settlements’ on page 85 and ‘Poverty and Population’ on page 87, the Malawi
Vision 2020 provides a clear vision on human settlement, population, and environmental
management. MGDS III, Section 6:1:6 recognises the importance fora country to put in place
systematic measures and a legal framework for proper human settlement. This section of the MGDS
III clearly defines policy direction for the country to undertake as it experiences unprecedented
population growth and rapid urbanisation. Therefore, the need to provide safe and properly
planned and adequate housing to address these demographic dynamics arises. Machinga District
Council has tried to respond to these policy directions and specific legal requirements by
highlighting specific areas of intervention.
The level of urbanisation in Malawi is at 15.3% (PHC 2008) and still increasing, but compared to
neighbouring countries, urbanisation in Malawi is still relatively low. On the other hand, in the
Southern Region, urbanisation is at 15.9%, while that of Machinga District is 4.9%. (PHC 2008)
Machinga is the fourth most urbanised districts in the Southern Region after Blantyre, Zomba, and
Mangochi, with 1.2% of its total population living in urban areas. The 2008 Population and
Housing census also revealed that Liwonde was the tenth-most rapidly growing urban centre in
Malawi. This is attributed to both the railway link to Nayuchi in Mozambique and to tourism. In
the next few years, the urbanisation rate in Liwonde will be higher than what it is today due to the
construction of wet and dry ports as well as the expansion of the railway link to Nayuchi.
As is the case with the rest of the country, urbanisation in Machinga District has developed without
proper planning. Urban centres have emerged and developed either due to major roads or market
centres.

- 19 -
1.5.4 Settlement Patterns
The people of Machinga have settled in a nucleus, reserving peripheral land for agricultural
activities. Most of such settlements are in the rural areas of the district. People who reside close to
main roads and around trading centers settle linearly – taking advantage of the business
opportunities to showcase their merchandise to the road users.
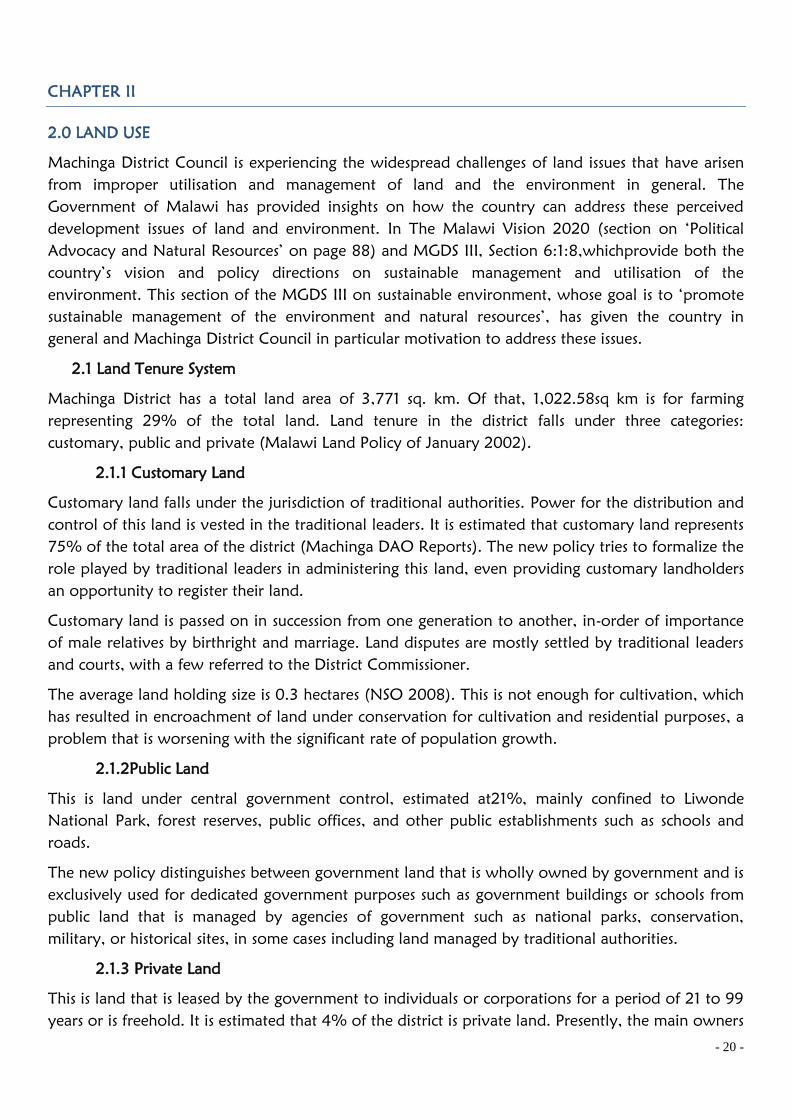
- 20 -
CHAPTER II
2.0 LAND USE
Machinga District Council is experiencing the widespread challenges of land issues that have arisen
from improper utilisation and management of land and the environment in general. The
Government of Malawi has provided insights on how the country can address these perceived
development issues of land and environment. In The Malawi Vision 2020 (section on ‘Political
Advocacy and Natural Resources’ on page 88) and MGDS III, Section 6:1:8,whichprovide both the
country’s vision and policy directions on sustainable management and utilisation of the
environment. This section of the MGDS III on sustainable environment, whose goal is to ‘promote
sustainable management of the environment and natural resources’, has given the country in
general and Machinga District Council in particular motivation to address these issues.
2.1 Land Tenure System
Machinga District has a total land area of 3,771 sq. km. Of that, 1,022.58sq km is for farming
representing 29% of the total land. Land tenure in the district falls under three categories:
customary, public and private (Malawi Land Policy of January 2002).
2.1.1 Customary Land
Customary land falls under the jurisdiction of traditional authorities. Power for the distribution and
control of this land is vested in the traditional leaders. It is estimated that customary land represents
75% of the total area of the district (Machinga DAO Reports). The new policy tries to formalize the
role played by traditional leaders in administering this land, even providing customary landholders
an opportunity to register their land.
Customary land is passed on in succession from one generation to another, in-order of importance
of male relatives by birthright and marriage. Land disputes are mostly settled by traditional leaders
and courts, with a few referred to the District Commissioner.
The average land holding size is 0.3 hectares (NSO 2008). This is not enough for cultivation, which
has resulted in encroachment of land under conservation for cultivation and residential purposes, a
problem that is worsening with the significant rate of population growth.
2.1.2Public Land
This is land under central government control, estimated at21%, mainly confined to Liwonde
National Park, forest reserves, public offices, and other public establishments such as schools and
roads.
The new policy distinguishes between government land that is wholly owned by government and is
exclusively used for dedicated government purposes such as government buildings or schools from
public land that is managed by agencies of government such as national parks, conservation,
military, or historical sites, in some cases including land managed by traditional authorities.
2.1.3 Private Land
This is land that is leased by the government to individuals or corporations for a period of 21 to 99
years or is freehold. It is estimated that 4% of the district is private land. Presently, the main owners
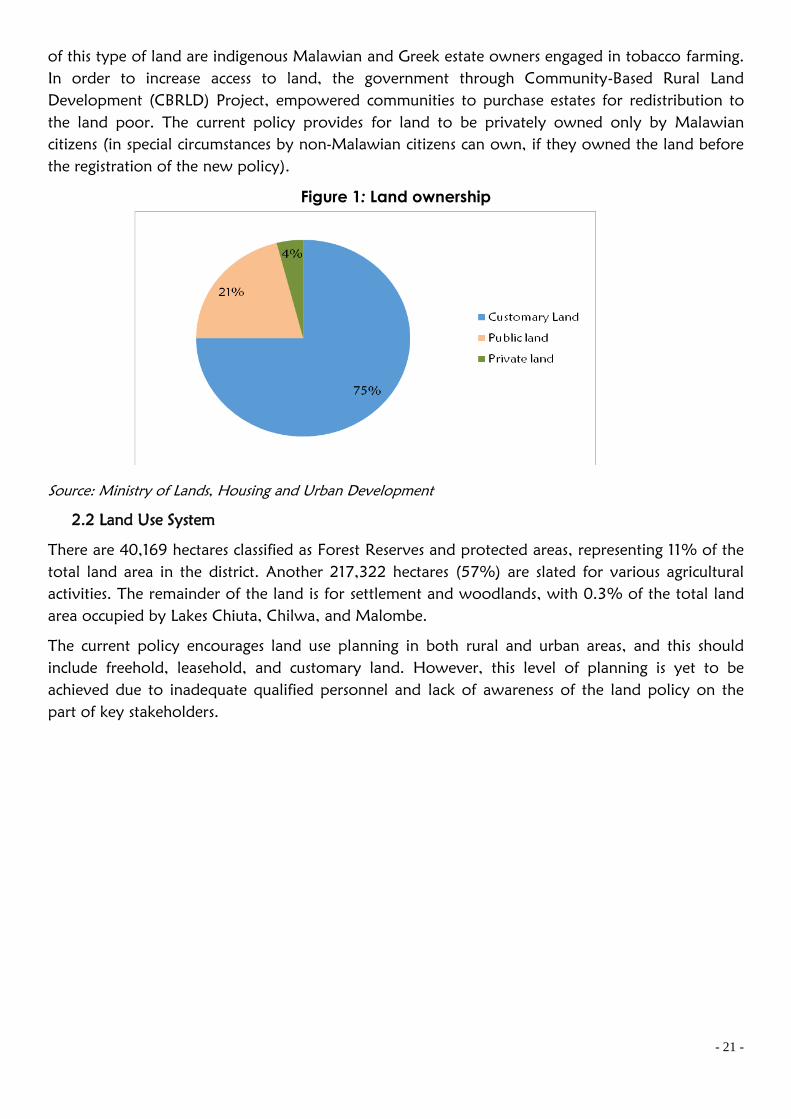
- 21 -
of this type of land are indigenous Malawian and Greek estate owners engaged in tobacco farming.
In order to increase access to land, the government through Community-Based Rural Land
Development (CBRLD) Project, empowered communities to purchase estates for redistribution to
the land poor. The current policy provides for land to be privately owned only by Malawian
citizens (in special circumstances by non-Malawian citizens can own, if they owned the land before
the registration of the new policy).
Figure 1: Land ownership
Source: Ministry of Lands, Housing and Urban Development
2.2 Land Use System
There are 40,169 hectares classified as Forest Reserves and protected areas, representing 11% of the
total land area in the district. Another 217,322 hectares (57%) are slated for various agricultural
activities. The remainder of the land is for settlement and woodlands, with 0.3% of the total land
area occupied by Lakes Chiuta, Chilwa, and Malombe.
The current policy encourages land use planning in both rural and urban areas, and this should
include freehold, leasehold, and customary land. However, this level of planning is yet to be
achieved due to inadequate qualified personnel and lack of awareness of the land policy on the
part of key stakeholders.
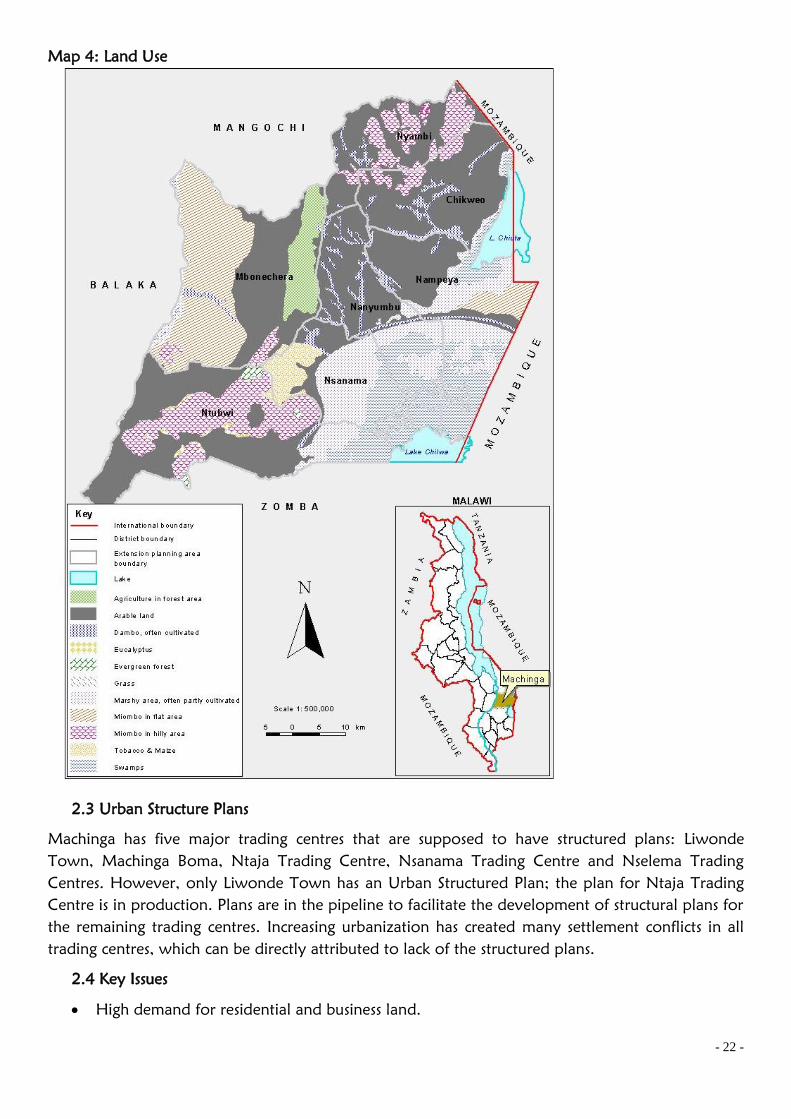
- 22 -
Map 4: Land Use
2.3 Urban Structure Plans
Machinga has five major trading centres that are supposed to have structured plans: Liwonde
Town, Machinga Boma, Ntaja Trading Centre, Nsanama Trading Centre and Nselema Trading
Centres. However, only Liwonde Town has an Urban Structured Plan; the plan for Ntaja Trading
Centre is in production. Plans are in the pipeline to facilitate the development of structural plans for
the remaining trading centres. Increasing urbanization has created many settlement conflicts in all
trading centres, which can be directly attributed to lack of the structured plans.
2.4 Key Issues
High demand for residential and business land.
- 23 -
2.5Opportunities
Merging of town and district councils
Other trading centres (Ntaja, Nselema, Nsanama) could benefit from technical staff (physical
planning) from Liwonde
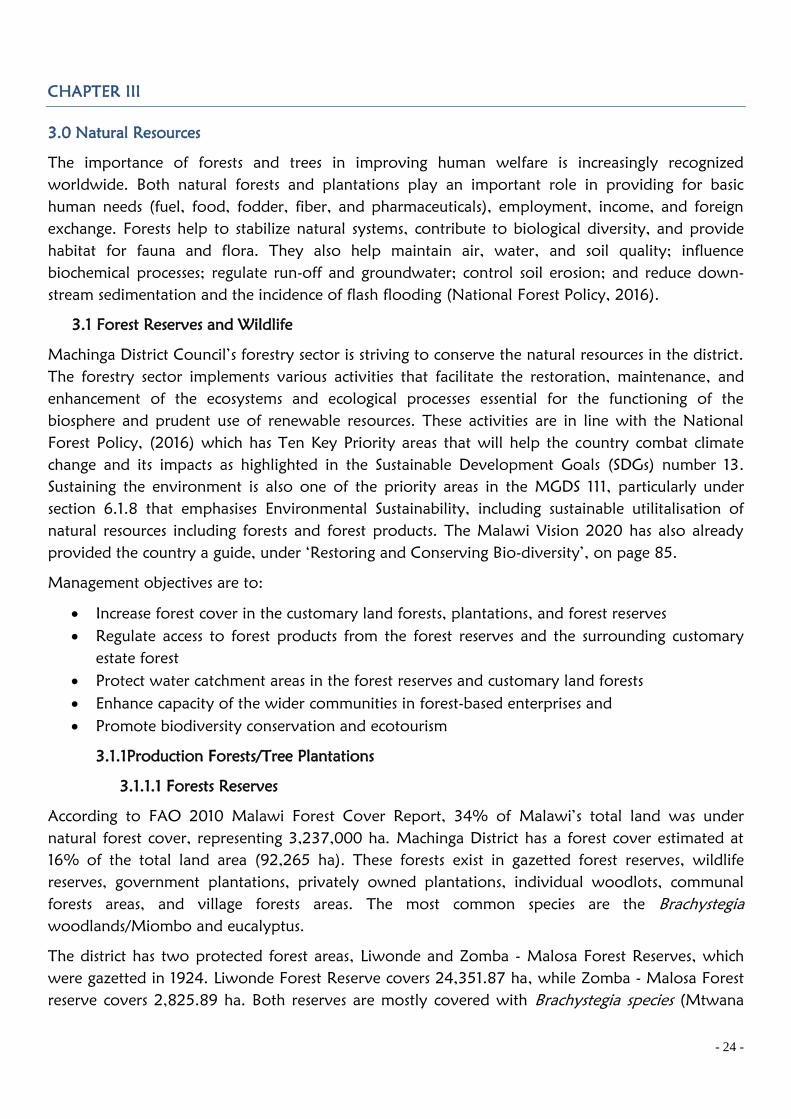
- 24 -
CHAPTER III
3.0 Natural Resources
The importance of forests and trees in improving human welfare is increasingly recognized
worldwide. Both natural forests and plantations play an important role in providing for basic
human needs (fuel, food, fodder, fiber, and pharmaceuticals), employment, income, and foreign
exchange. Forests help to stabilize natural systems, contribute to biological diversity, and provide
habitat for fauna and flora. They also help maintain air, water, and soil quality; influence
biochemical processes; regulate run-off and groundwater; control soil erosion; and reduce down-
stream sedimentation and the incidence of flash flooding (National Forest Policy, 2016).
3.1 Forest Reserves and Wildlife
Machinga District Council’s forestry sector is striving to conserve the natural resources in the district.
The forestry sector implements various activities that facilitate the restoration, maintenance, and
enhancement of the ecosystems and ecological processes essential for the functioning of the
biosphere and prudent use of renewable resources. These activities are in line with the National
Forest Policy, (2016) which has Ten Key Priority areas that will help the country combat climate
change and its impacts as highlighted in the Sustainable Development Goals (SDGs) number 13.
Sustaining the environment is also one of the priority areas in the MGDS 111, particularly under
section 6.1.8 that emphasises Environmental Sustainability, including sustainable utilitalisation of
natural resources including forests and forest products. The Malawi Vision 2020 has also already
provided the country a guide, under ‘Restoring and Conserving Bio-diversity’, on page 85.
Management objectives are to:
Increase forest cover in the customary land forests, plantations, and forest reserves
Regulate access to forest products from the forest reserves and the surrounding customary
estate forest
Protect water catchment areas in the forest reserves and customary land forests
Enhance capacity of the wider communities in forest-based enterprises and
Promote biodiversity conservation and ecotourism
3.1.1Production Forests/Tree Plantations
3.1.1.1 Forests Reserves
According to FAO 2010 Malawi Forest Cover Report, 34% of Malawi’s total land was under
natural forest cover, representing 3,237,000 ha. Machinga District has a forest cover estimated at
16% of the total land area (92,265 ha). These forests exist in gazetted forest reserves, wildlife
reserves, government plantations, privately owned plantations, individual woodlots, communal
forests areas, and village forests areas. The most common species are the Brachystegia
woodlands/Miombo and eucalyptus.
The district has two protected forest areas, Liwonde and Zomba - Malosa Forest Reserves, which
were gazetted in 1924. Liwonde Forest Reserve covers 24,351.87 ha, while Zomba - Malosa Forest
reserve covers 2,825.89 ha. Both reserves are mostly covered with Brachystegia species (Mtwana

- 25 -
and Mombo). The reserves cover six traditional authorities: Sitola, Nkula, Chamba, Nsanama,
Mposa, and Mlomba (Map 5).
The Liwonde Forest Reserve includes customary land at Chaone under Group Village Headman
Kaluma in the area of TA Chamba. In 1910, the area had only one village headman; now there are
seven group village headmen and 21 villages, with a population of 6,200. The village has more
than800 farm families, which has resulted in encroachment and deforestation in the forest reserve.
Map 5: Machinga Protected Areas
Source: Department of Forestry - Machinga
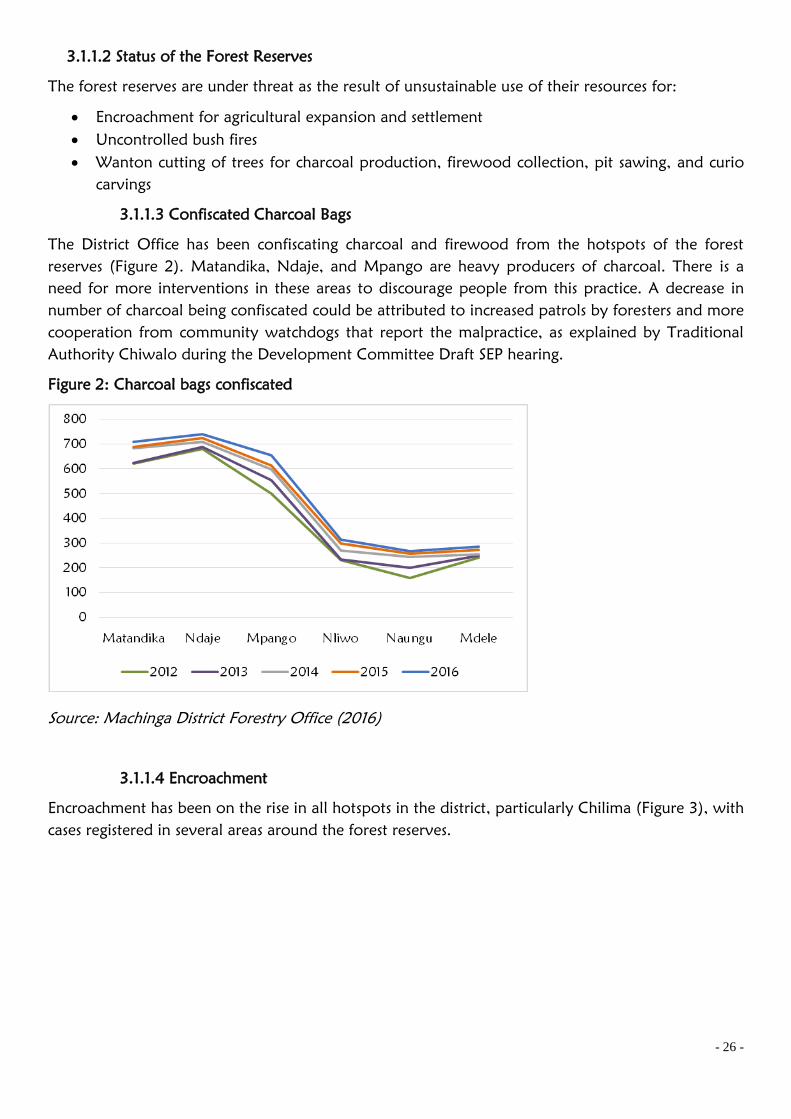
- 26 -
3.1.1.2 Status of the Forest Reserves
The forest reserves are under threat as the result of unsustainable use of their resources for:
Encroachment for agricultural expansion and settlement
Uncontrolled bush fires
Wanton cutting of trees for charcoal production, firewood collection, pit sawing, and curio
carvings
3.1.1.3 Confiscated Charcoal Bags
The District Office has been confiscating charcoal and firewood from the hotspots of the forest
reserves (Figure 2). Matandika, Ndaje, and Mpango are heavy producers of charcoal. There is a
need for more interventions in these areas to discourage people from this practice. A decrease in
number of charcoal being confiscated could be attributed to increased patrols by foresters and more
cooperation from community watchdogs that report the malpractice, as explained by Traditional
Authority Chiwalo during the Development Committee Draft SEP hearing.
Figure 2: Charcoal bags confiscated
Source: Machinga District Forestry Office (2016)
3.1.1.4 Encroachment
Encroachment has been on the rise in all hotspots in the district, particularly Chilima (Figure 3), with
cases registered in several areas around the forest reserves.
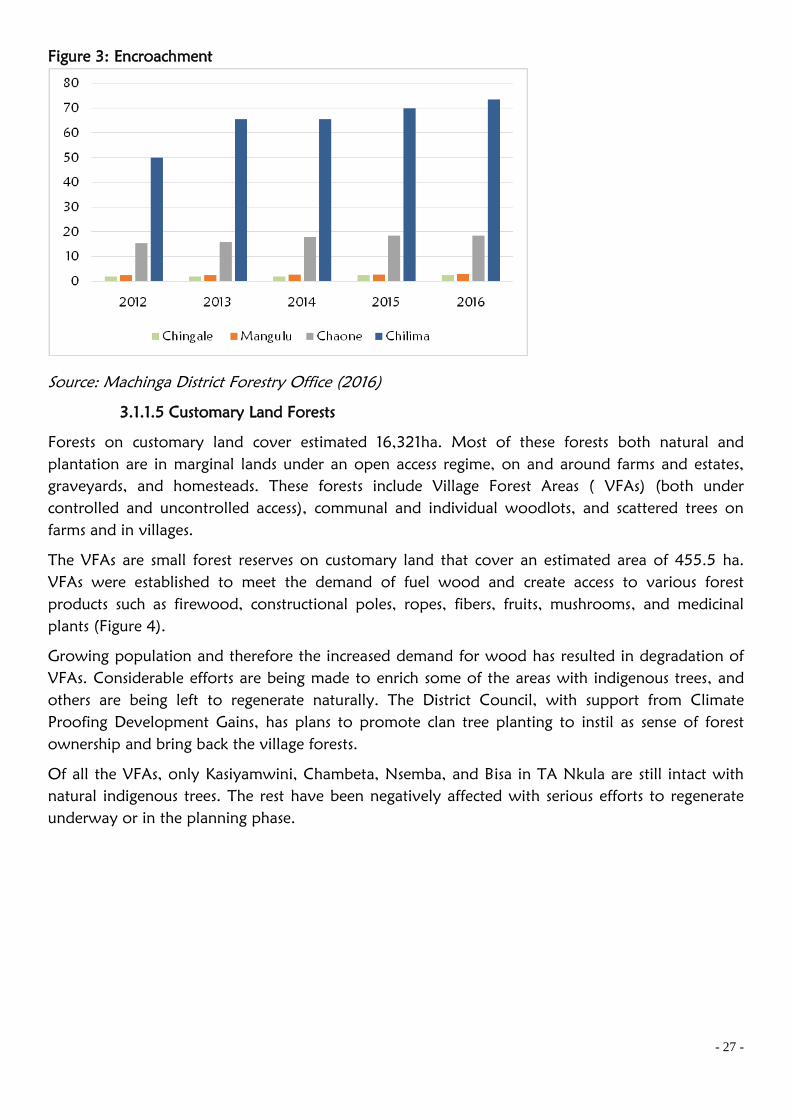
- 27 -
Figure 3: Encroachment
Source: Machinga District Forestry Office (2016)
3.1.1.5 Customary Land Forests
Forests on customary land cover estimated 16,321ha. Most of these forests both natural and
plantation are in marginal lands under an open access regime, on and around farms and estates,
graveyards, and homesteads. These forests include Village Forest Areas ( VFAs) (both under
controlled and uncontrolled access), communal and individual woodlots, and scattered trees on
farms and in villages.
The VFAs are small forest reserves on customary land that cover an estimated area of 455.5 ha.
VFAs were established to meet the demand of fuel wood and create access to various forest
products such as firewood, constructional poles, ropes, fibers, fruits, mushrooms, and medicinal
plants (Figure 4).
Growing population and therefore the increased demand for wood has resulted in degradation of
VFAs. Considerable efforts are being made to enrich some of the areas with indigenous trees, and
others are being left to regenerate naturally. The District Council, with support from Climate
Proofing Development Gains, has plans to promote clan tree planting to instil as sense of forest
ownership and bring back the village forests.
Of all the VFAs, only Kasiyamwini, Chambeta, Nsemba, and Bisa in TA Nkula are still intact with
natural indigenous trees. The rest have been negatively affected with serious efforts to regenerate
underway or in the planning phase.
- 28 -
Figure 4: Village forest areas and their hectarage
Source: District Forest Office 2016
3.1.1.6 Forest Plantations
Machinga has a number of isolated forest plantations. These were established around the forest
reserves particularly in areas that had shown an increasing demand for wood poles, firewood, and
bridge bearers. The plantations were established with Eucalyptus tree, and cover 3,222 hectares.
The plantation headquarters are based at Nauko, with sub-stations all over the periphery of the
forest reserves, the largest being Naminyanga.
While the forest reserves and plantations contribute significantly to soil and water conservation, the
reserves provide firewood and timber from dead wood and the plantations provide stacked wood,
head loads, and poles. The main buyers of wood are tobacco estates around Namadzi and
Thondwe and firewood vendors from Zomba and Kachere in Blantyre. Demand for poles and
firewood has grown so much that it is difficult to maintain the ideal rotation age of five years.
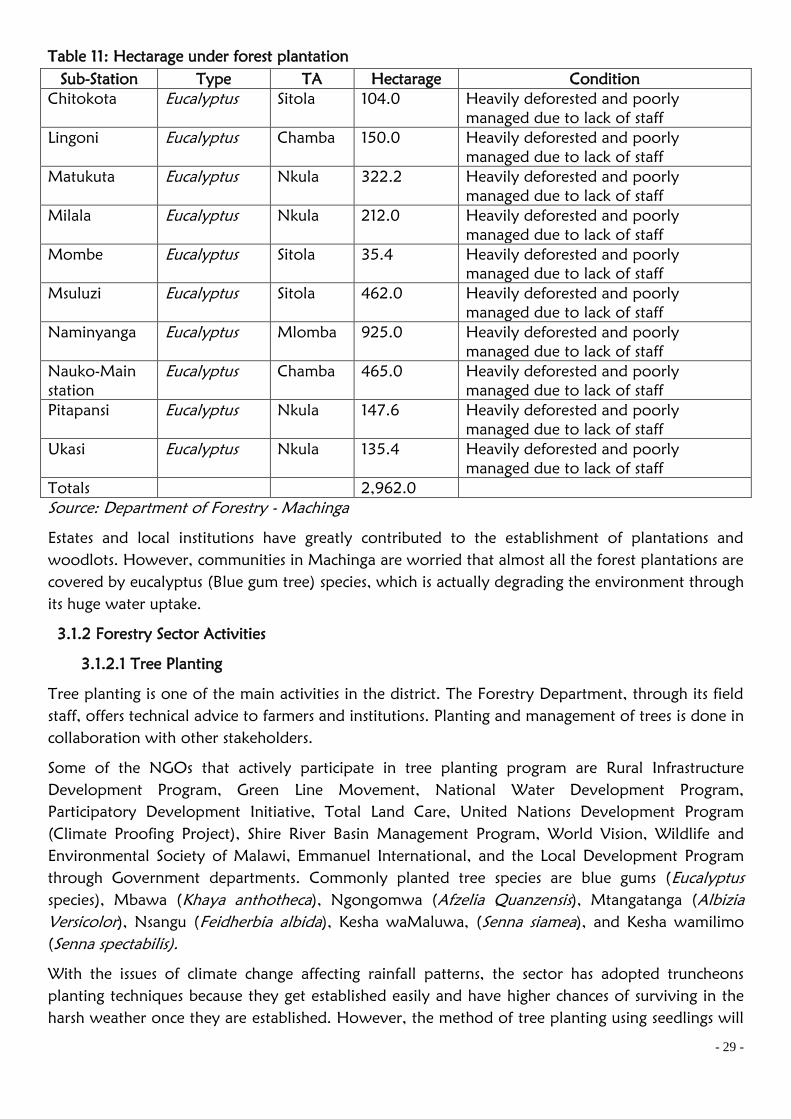
- 29 -
Table 11: Hectarage under forest plantation
Sub-Station Type TA Hectarage Condition
Chitokota Eucalyptus Sitola 104.0 Heavily deforested and poorly
managed due to lack of staff
Lingoni Eucalyptus Chamba 150.0 Heavily deforested and poorly
managed due to lack of staff
Matukuta Eucalyptus Nkula 322.2 Heavily deforested and poorly
managed due to lack of staff
Milala Eucalyptus Nkula 212.0 Heavily deforested and poorly
managed due to lack of staff
Mombe Eucalyptus Sitola 35.4 Heavily deforested and poorly
managed due to lack of staff
Msuluzi Eucalyptus Sitola 462.0 Heavily deforested and poorly
managed due to lack of staff
Naminyanga Eucalyptus Mlomba 925.0 Heavily deforested and poorly
managed due to lack of staff
Nauko-Main
station
Eucalyptus Chamba 465.0 Heavily deforested and poorly
managed due to lack of staff
Pitapansi Eucalyptus Nkula 147.6 Heavily deforested and poorly
managed due to lack of staff
Ukasi Eucalyptus Nkula 135.4 Heavily deforested and poorly
managed due to lack of staff
Totals 2,962.0
Source: Department of Forestry - Machinga
Estates and local institutions have greatly contributed to the establishment of plantations and
woodlots. However, communities in Machinga are worried that almost all the forest plantations are
covered by eucalyptus (Blue gum tree) species, which is actually degrading the environment through
its huge water uptake.
3.1.2 Forestry Sector Activities
3.1.2.1 Tree Planting
Tree planting is one of the main activities in the district. The Forestry Department, through its field
staff, offers technical advice to farmers and institutions. Planting and management of trees is done in
collaboration with other stakeholders.
Some of the NGOs that actively participate in tree planting program are Rural Infrastructure
Development Program, Green Line Movement, National Water Development Program,
Participatory Development Initiative, Total Land Care, United Nations Development Program
(Climate Proofing Project), Shire River Basin Management Program, World Vision, Wildlife and
Environmental Society of Malawi, Emmanuel International, and the Local Development Program
through Government departments. Commonly planted tree species are blue gums (Eucalyptus
species), Mbawa (Khaya anthotheca), Ngongomwa (Afzelia Quanzensis), Mtangatanga (Albizia
Versicolor), Nsangu (Feidherbia albida), Kesha waMaluwa, (Senna siamea), and Kesha wamilimo
(Senna spectabilis).
With the issues of climate change affecting rainfall patterns, the sector has adopted truncheons
planting techniques because they get established easily and have higher chances of surviving in the
harsh weather once they are established. However, the method of tree planting using seedlings will
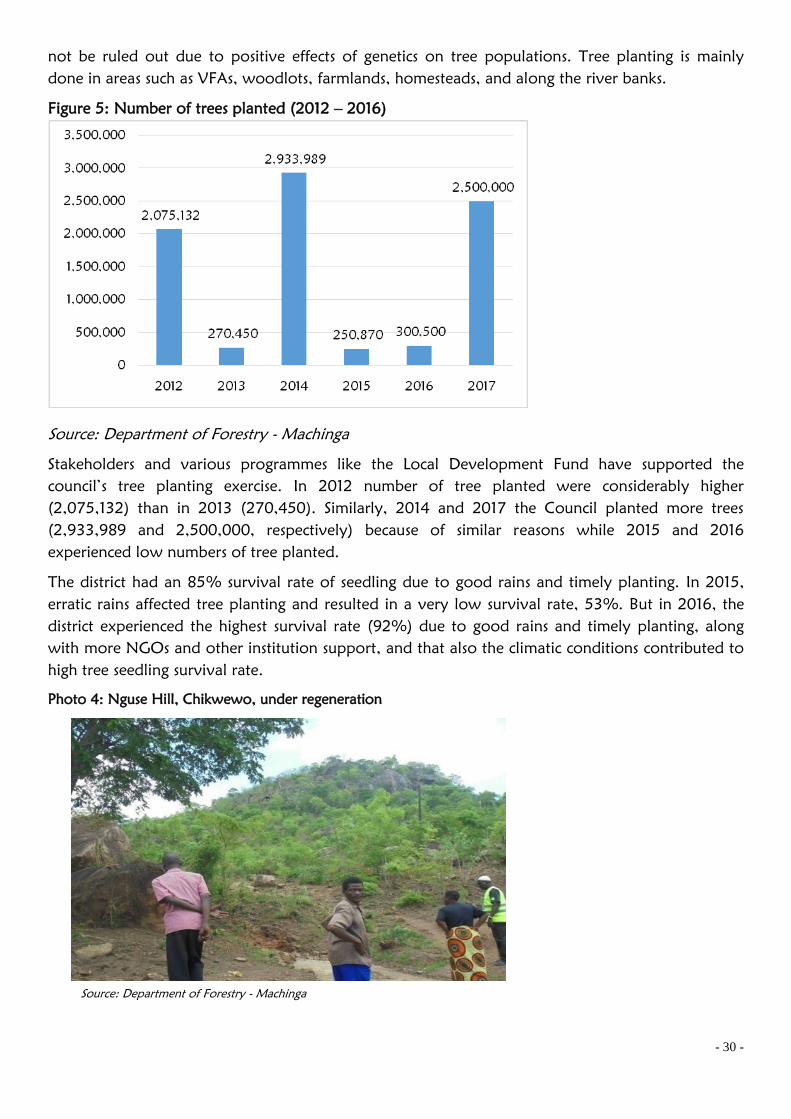
- 30 -
not be ruled out due to positive effects of genetics on tree populations. Tree planting is mainly
done in areas such as VFAs, woodlots, farmlands, homesteads, and along the river banks.
Figure 5: Number of trees planted (2012 – 2016)
Source: Department of Forestry - Machinga
Stakeholders and various programmes like the Local Development Fund have supported the
council’s tree planting exercise. In 2012 number of tree planted were considerably higher
(2,075,132) than in 2013 (270,450). Similarly, 2014 and 2017 the Council planted more trees
(2,933,989 and 2,500,000, respectively) because of similar reasons while 2015 and 2016
experienced low numbers of tree planted.
The district had an 85% survival rate of seedling due to good rains and timely planting. In 2015,
erratic rains affected tree planting and resulted in a very low survival rate, 53%. But in 2016, the
district experienced the highest survival rate (92%) due to good rains and timely planting, along
with more NGOs and other institution support, and that also the climatic conditions contributed to
high tree seedling survival rate.
Photo 4: Nguse Hill, Chikwewo, under regeneration
Source: Department of Forestry - Machinga
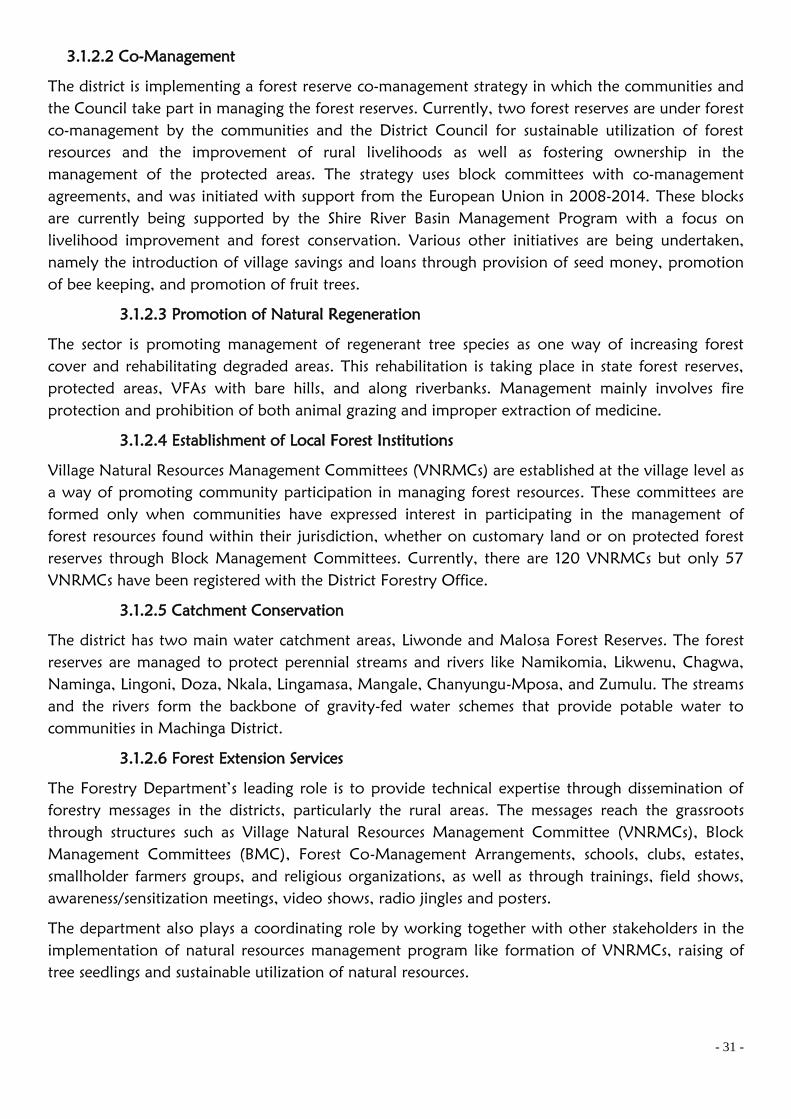
- 31 -
3.1.2.2 Co-Management
The district is implementing a forest reserve co-management strategy in which the communities and
the Council take part in managing the forest reserves. Currently, two forest reserves are under forest
co-management by the communities and the District Council for sustainable utilization of forest
resources and the improvement of rural livelihoods as well as fostering ownership in the
management of the protected areas. The strategy uses block committees with co-management
agreements, and was initiated with support from the European Union in 2008-2014. These blocks
are currently being supported by the Shire River Basin Management Program with a focus on
livelihood improvement and forest conservation. Various other initiatives are being undertaken,
namely the introduction of village savings and loans through provision of seed money, promotion
of bee keeping, and promotion of fruit trees.
3.1.2.3 Promotion of Natural Regeneration
The sector is promoting management of regenerant tree species as one way of increasing forest
cover and rehabilitating degraded areas. This rehabilitation is taking place in state forest reserves,
protected areas, VFAs with bare hills, and along riverbanks. Management mainly involves fire
protection and prohibition of both animal grazing and improper extraction of medicine.
3.1.2.4 Establishment of Local Forest Institutions
Village Natural Resources Management Committees (VNRMCs) are established at the village level as
a way of promoting community participation in managing forest resources. These committees are
formed only when communities have expressed interest in participating in the management of
forest resources found within their jurisdiction, whether on customary land or on protected forest
reserves through Block Management Committees. Currently, there are 120 VNRMCs but only 57
VNRMCs have been registered with the District Forestry Office.
3.1.2.5 Catchment Conservation
The district has two main water catchment areas, Liwonde and Malosa Forest Reserves. The forest
reserves are managed to protect perennial streams and rivers like Namikomia, Likwenu, Chagwa,
Naminga, Lingoni, Doza, Nkala, Lingamasa, Mangale, Chanyungu-Mposa, and Zumulu. The streams
and the rivers form the backbone of gravity-fed water schemes that provide potable water to
communities in Machinga District.
3.1.2.6 Forest Extension Services
The Forestry Department’s leading role is to provide technical expertise through dissemination of
forestry messages in the districts, particularly the rural areas. The messages reach the grassroots
through structures such as Village Natural Resources Management Committee (VNRMCs), Block
Management Committees (BMC), Forest Co-Management Arrangements, schools, clubs, estates,
smallholder farmers groups, and religious organizations, as well as through trainings, field shows,
awareness/sensitization meetings, video shows, radio jingles and posters.
The department also plays a coordinating role by working together with other stakeholders in the
implementation of natural resources management program like formation of VNRMCs, raising of
tree seedlings and sustainable utilization of natural resources.

- 32 -
The district has an extension and protection workforce of 189 ranging from the district forestry
officer to general worker, with a deficit of 979 as per requirement. This number is inadequate to
effectively perform the district’s extension duties (see Table 12).
Communities and local leaders in Machinga have also complained about the laxity of the forestry
staff in enforcing forest resources management that, they argue, has led to rampant forest depletion.
Table 12: Forestry staff
Post Established Posts Posts Filled Gaps Grade
District Forestry Officer 1 1 0 I
Assistant District Forestry Officer 1 1 0 I
Foresters 4 3 1 K
Senior Forestry Assistants 2 0 0 M
Forestry Assistants 12 3 9 M
Forestry Guards 60 18 42 O
Patrolmen/Patrol Ladies 70 28 42 Q
Senior Clerical Officer 1 0 1 L
Clerical Officer 2 0 2 M
Accounts Assistants 1 1 0 M
Copy Typist 2 0 2 Q
Messengers 1 0 1 Q
Mechanics 1 1 0 Q
Drivers 2 2 0 N
Plant Operators 1 0 1 -
PBX Operators 2 1 1 -
Tradesman 1 1 0 Q
Security Guards 3 0 3 -
Labourers 1,000 127 873
Total 1167 187 978
Source: Department of Forestry - Machinga
3.1.2 Forest Based Enterprises/Income-Generating Activities
The District Forestry Office has introduced environmental friendly income generating activities
(IGAs) as short-term strategies to reduce pressure on forests and promote management of forest
resources. Examples include beekeeping, mushroom production, fruit juice and wine production,
irrigation, fish farming, livestock production, and cane furniture production, as cited in the
Livelihoods Survey and VAP process of selected villages.
3.1.3 Forestry Worker to Population Ratio
In a normal situation, one forestry extension worker is expected to reach a population of 6,994
residents. The current ratio in the area of Paramount Chief Kawinga is 1:113,002.
Table 13: Forestry extension services
Forestry Extension Worker EPA STA
Forestry Assistant Nanyumbu TA Kawinga, Nyambi,
Chikweo
Forestry Assistant Mbonechera TA Liwonde, Sitola, Nkula
Senior Technical Officer Domasi TA Chamba/Mposa
Forestry Assistant Nsanama STA Nsanama, TA Mlomba
Source: Department of Forestry – Machinga
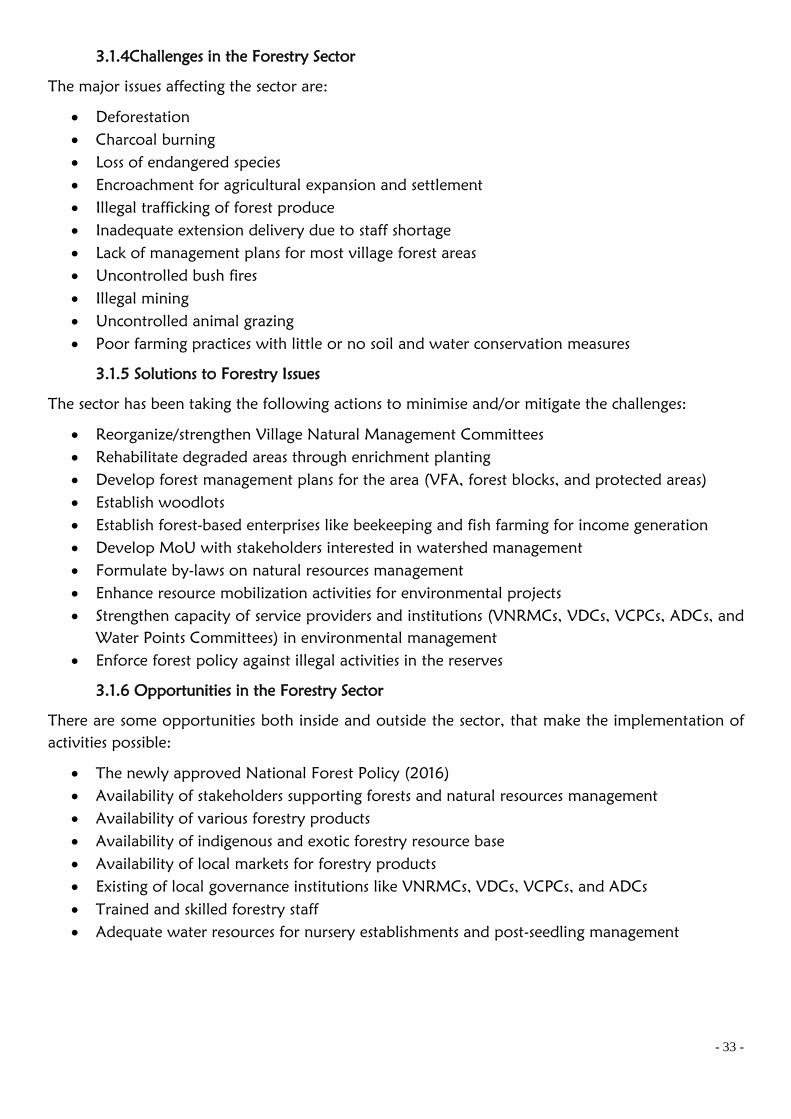
- 33 -
3.1.4Challenges in the Forestry Sector
The major issues affecting the sector are:
Deforestation
Charcoal burning
Loss of endangered species
Encroachment for agricultural expansion and settlement
Illegal trafficking of forest produce
Inadequate extension delivery due to staff shortage
Lack of management plans for most village forest areas
Uncontrolled bush fires
Illegal mining
Uncontrolled animal grazing
Poor farming practices with little or no soil and water conservation measures
3.1.5 Solutions to Forestry Issues
The sector has been taking the following actions to minimise and/or mitigate the challenges:
Reorganize/strengthen Village Natural Management Committees
Rehabilitate degraded areas through enrichment planting
Develop forest management plans for the area (VFA, forest blocks, and protected areas)
Establish woodlots
Establish forest-based enterprises like beekeeping and fish farming for income generation
Develop MoU with stakeholders interested in watershed management
Formulate by-laws on natural resources management
Enhance resource mobilization activities for environmental projects
Strengthen capacity of service providers and institutions (VNRMCs, VDCs, VCPCs, ADCs, and
Water Points Committees) in environmental management
Enforce forest policy against illegal activities in the reserves
3.1.6 Opportunities in the Forestry Sector
There are some opportunities both inside and outside the sector, that make the implementation of
activities possible:
The newly approved National Forest Policy (2016)
Availability of stakeholders supporting forests and natural resources management
Availability of various forestry products
Availability of indigenous and exotic forestry resource base
Availability of local markets for forestry products
Existing of local governance institutions like VNRMCs, VDCs, VCPCs, and ADCs
Trained and skilled forestry staff
Adequate water resources for nursery establishments and post-seedling management
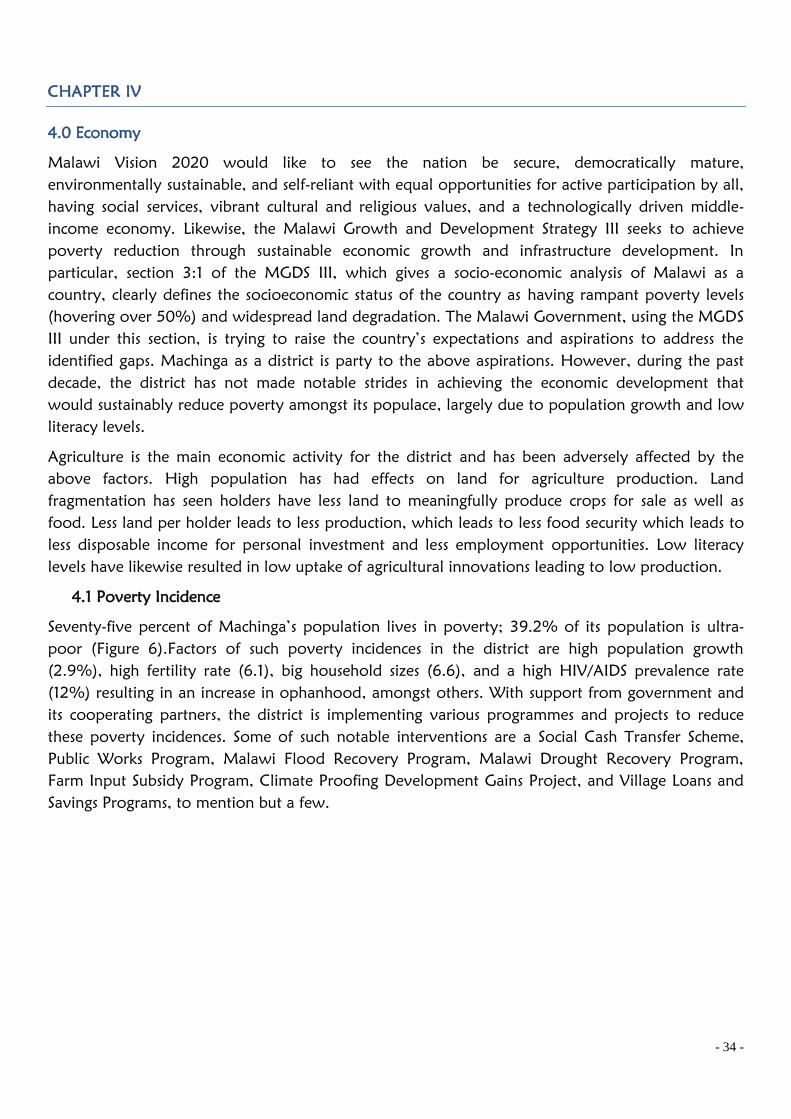
- 34 -
CHAPTER IV
4.0 Economy
Malawi Vision 2020 would like to see the nation be secure, democratically mature,
environmentally sustainable, and self-reliant with equal opportunities for active participation by all,
having social services, vibrant cultural and religious values, and a technologically driven middle-
income economy. Likewise, the Malawi Growth and Development Strategy III seeks to achieve
poverty reduction through sustainable economic growth and infrastructure development. In
particular, section 3:1 of the MGDS III, which gives a socio-economic analysis of Malawi as a
country, clearly defines the socioeconomic status of the country as having rampant poverty levels
(hovering over 50%) and widespread land degradation. The Malawi Government, using the MGDS
III under this section, is trying to raise the country’s expectations and aspirations to address the
identified gaps. Machinga as a district is party to the above aspirations. However, during the past
decade, the district has not made notable strides in achieving the economic development that
would sustainably reduce poverty amongst its populace, largely due to population growth and low
literacy levels.
Agriculture is the main economic activity for the district and has been adversely affected by the
above factors. High population has had effects on land for agriculture production. Land
fragmentation has seen holders have less land to meaningfully produce crops for sale as well as
food. Less land per holder leads to less production, which leads to less food security which leads to
less disposable income for personal investment and less employment opportunities. Low literacy
levels have likewise resulted in low uptake of agricultural innovations leading to low production.
4.1 Poverty Incidence
Seventy-five percent of Machinga’s population lives in poverty; 39.2% of its population is ultra-
poor (Figure 6).Factors of such poverty incidences in the district are high population growth
(2.9%), high fertility rate (6.1), big household sizes (6.6), and a high HIV/AIDS prevalence rate
(12%) resulting in an increase in ophanhood, amongst others. With support from government and
its cooperating partners, the district is implementing various programmes and projects to reduce
these poverty incidences. Some of such notable interventions are a Social Cash Transfer Scheme,
Public Works Program, Malawi Flood Recovery Program, Malawi Drought Recovery Program,
Farm Input Subsidy Program, Climate Proofing Development Gains Project, and Village Loans and
Savings Programs, to mention but a few.
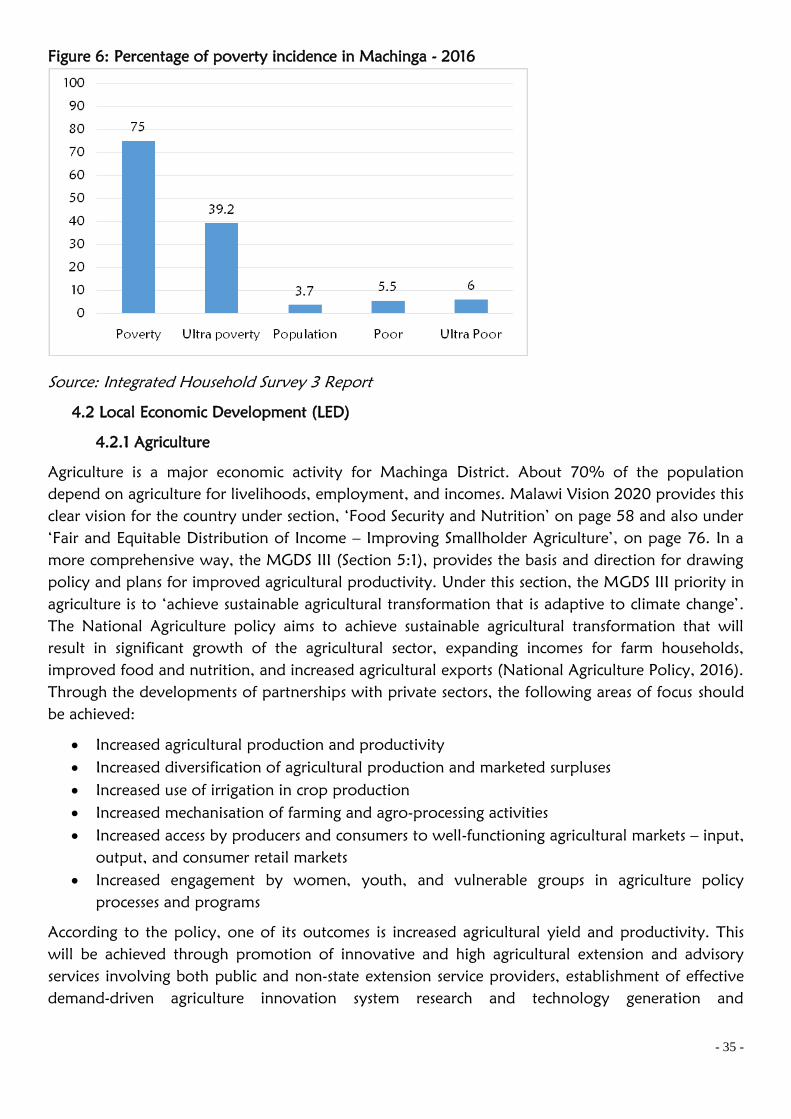
- 35 -
Figure 6: Percentage of poverty incidence in Machinga - 2016
Source: Integrated Household Survey 3 Report
4.2 Local Economic Development (LED)
4.2.1 Agriculture
Agriculture is a major economic activity for Machinga District. About 70% of the population
depend on agriculture for livelihoods, employment, and incomes. Malawi Vision 2020 provides this
clear vision for the country under section, ‘Food Security and Nutrition’ on page 58 and also under
‘Fair and Equitable Distribution of Income – Improving Smallholder Agriculture’, on page 76. In a
more comprehensive way, the MGDS III (Section 5:1), provides the basis and direction for drawing
policy and plans for improved agricultural productivity. Under this section, the MGDS III priority in
agriculture is to ‘achieve sustainable agricultural transformation that is adaptive to climate change’.
The National Agriculture policy aims to achieve sustainable agricultural transformation that will
result in significant growth of the agricultural sector, expanding incomes for farm households,
improved food and nutrition, and increased agricultural exports (National Agriculture Policy, 2016).
Through the developments of partnerships with private sectors, the following areas of focus should
be achieved:
Increased agricultural production and productivity
Increased diversification of agricultural production and marketed surpluses
Increased use of irrigation in crop production
Increased mechanisation of farming and agro-processing activities
Increased access by producers and consumers to well-functioning agricultural markets – input,
output, and consumer retail markets
Increased engagement by women, youth, and vulnerable groups in agriculture policy
processes and programs
According to the policy, one of its outcomes is increased agricultural yield and productivity. This
will be achieved through promotion of innovative and high agricultural extension and advisory
services involving both public and non-state extension service providers, establishment of effective
demand-driven agriculture innovation system research and technology generation and
- 36 -
dissemination, and facilitation of timely and equitable access for farmer to higher quality farm
inputs including inorganic and organic fertiliser, improved seed, livestock breeds, and fish fingerings.
According to MGDS III, the agriculture sector’s productive capacity is being undermined by climate
change. Other challenges include low use of climate change and meteorological information, post-
harvest losses, lack of agriculture diversification, low irrigation development, small landholding
sizes, land degradation, and underdeveloped market systems. These challenges affect the national
economy, hence the need to ensure that they are properly managed.
“Realizing that climate change has adverse impacts on the agriculture sector, a number of
strategies will be put in place to address them through adaptation and mitigation. Adaptation
will enhance preparation for and negate the effects of climate change, thereby reducing
vulnerability of communities and ecosystems”. MGDS III
For the past five years, on average, 30% of the farming households in Machinga District run out of
food from their own production by November, months before the next harvest is ready(APES
reports). They also have no stable access to food due to lack of stable incomes. However, the 2016-
17 season was different as the district received normal rains and by November, only 10% of farming
households should be food insecure. Major causes of food insecurity among farming households are
low food production levels and low livestock production. In some instances, crop yields are
generally low due to poor soil fertility, pest1 and disease
2 incidences, and low uptake of improved
and modern agricultural technologies. Machinga District has the potential for dambo production
and irrigated agriculture, but such opportunities have not been fully explored. The district has a
potential of 12,500 hectares of irrigable land, of which 3,024 hectares are developed. However,
only 1,572 hectares are being utilised. Livestock production in the district is affected by high
mortality rate of young stocks, poor feeding practices, lack of grazing land, poor housing, livestock
pests and disease incidences, and poor breeding practices. Furthermore, land degradation and soil
erosion are rampant due to unsustainable farming practices such as mono-cropping and cultivation
of marginal lands. Staffing constraints results in fewer farmers being reached by agriculture extension
messages. The extension worker to farmer ratio is 1:2,938, well above the recommended ratio of
1:800. As a result, there is little adoption of modern farming techniques.
4.2.1.1 Crops
4.2.1.1.1 Agricultural Production
Machinga District is endowed with different soils, which enable the growing of a variety of crops.
The major cash crops for the district are cotton and tobacco. Some crops like maize, rice, sorghum,
groundnuts, pigeon peas, and cassava are grown for both food and sale. Smallholder farmers are
growing most crops, with a few estates growing tobacco. The growing of tobacco in the district has
decreased with the price fluctuations on the auction floors. The minor crops grown in the district
include horticultural crops, chillies, sesame, beans, millet, and soya beans.
Crop production in the district has varied greatly over the past five years. In particular, there has
been great variation in cropped areas, largely because of poor rainfall distribution resulting in
inadequate water for either irrigation or rain-fed cropping. Input uptake has also played a role in
the variations. Likewise, crop production has varied over the years (Figure 7 and Table 14).
1 Fall army worms, mealy bug, red locusts in crops, and ticks in livestock
2 Cassava mosaic, banana bunchy top, tick-bone diseases, (heart water), and NCD etc
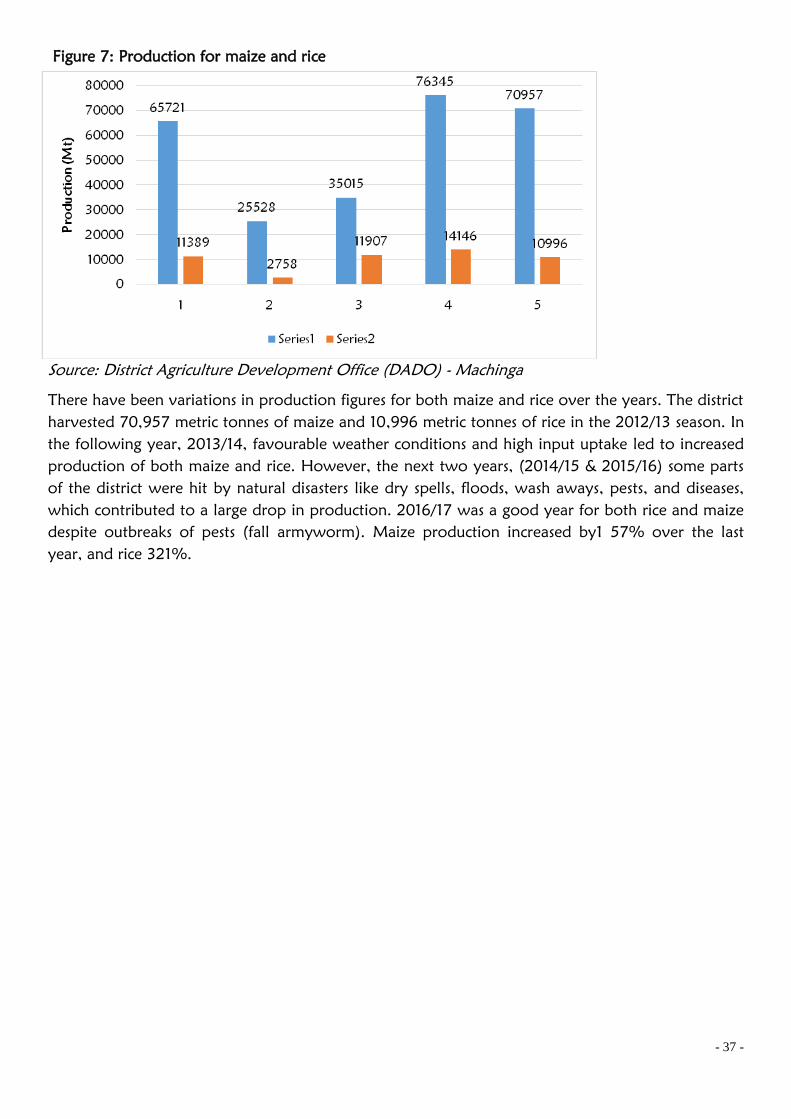
- 37 -
Figure 7: Production for maize and rice
Source: District Agriculture Development Office (DADO) - Machinga
There have been variations in production figures for both maize and rice over the years. The district
harvested 70,957 metric tonnes of maize and 10,996 metric tonnes of rice in the 2012/13 season. In
the following year, 2013/14, favourable weather conditions and high input uptake led to increased
production of both maize and rice. However, the next two years, (2014/15 & 2015/16) some parts
of the district were hit by natural disasters like dry spells, floods, wash aways, pests, and diseases,
which contributed to a large drop in production. 2016/17 was a good year for both rice and maize
despite outbreaks of pests (fall armyworm). Maize production increased by1 57% over the last
year, and rice 321%.

- 38 -
Table 14: Smallholder Crop Production by Type of Crop, Hectarage, Yield, and Production
Area (Ha) Yield (kg/Ha) Production (mt)
2017 2016 2015 2014 2013 2012 2017 2016 2015 2014 2013 2012 2017 2016 2015 2014 2013 2012
Major Crops
Local Maize 16,833 16,105 15,782 16,430 16,650 17,374 482 168 249 530 497 456 8,120 2,704 3,925 8,705 8,274 7,919
Hybrid 14,553 14,361 13,950 13,671 14,062 13,067 1,972 734 1,015 2,447 2,200 1,932 28,702 10,542 14,164 33,447 30,943 25,243
OPV 20,954 21,197 21,093 21,569 21,436 21,604 1,379 579 802 1,585 1,481 13,856 28,899 12,282 16,926 34,193 31,740 29,286
Rice (local) 7,816 3,558 8,693 9,020 8,552 8,015 927 345 884 1,040 837 892 7,242 1,222 7,682 9,384 7,162 7,148
Rice (Pussa) 367 243 291 357 70 616 2,436 1,077 2,479 2,661 2,400 2,397 894 262 721 950 168 1,477
Rice (TCG10) 659 620 695 680 660 602 2,231 1,151 2,738 3,702 3,102 3,032 1,470 714 1,903 2,158 2,047 1,825
Rice
(Kilombero) 864 588 727 705 697 622 2,064 860 2,202 2,345 2,323 2,033 1,783 560 1,601 1,654 1,619 1,264
Sorghum 8,481 8,143 8,317 8,310 8,305 8,366 663 440 634 644 629 591 5,619 3,583 5,271 5,351 5,222 4,948
G/nuts
(Chalimbana) 8,367 7,882 8,098 8,039 7,906 7,950 623 385 558 598 580 533 5,209 3,036 4,517 4,808 4,583 4,235
G/nuts (CG 7) 2,207 1,547 1,473 1,416 1,224 1,119 803 611 667 749 690 633 1,772 796 983 1,060 845 709
Cowpeas 5,772 5,492 5,127 5,030 4,992 5,020 456 282 346 451 420 363 2,632 1,547 1,772 2,267 2,099 1,824
Pigeon Peas 17,694 16,700 16,079 14,902 14,202 13,966 959 748 838 882 830 479 16,967 12,490 13,469 13,148 11,786 10,462
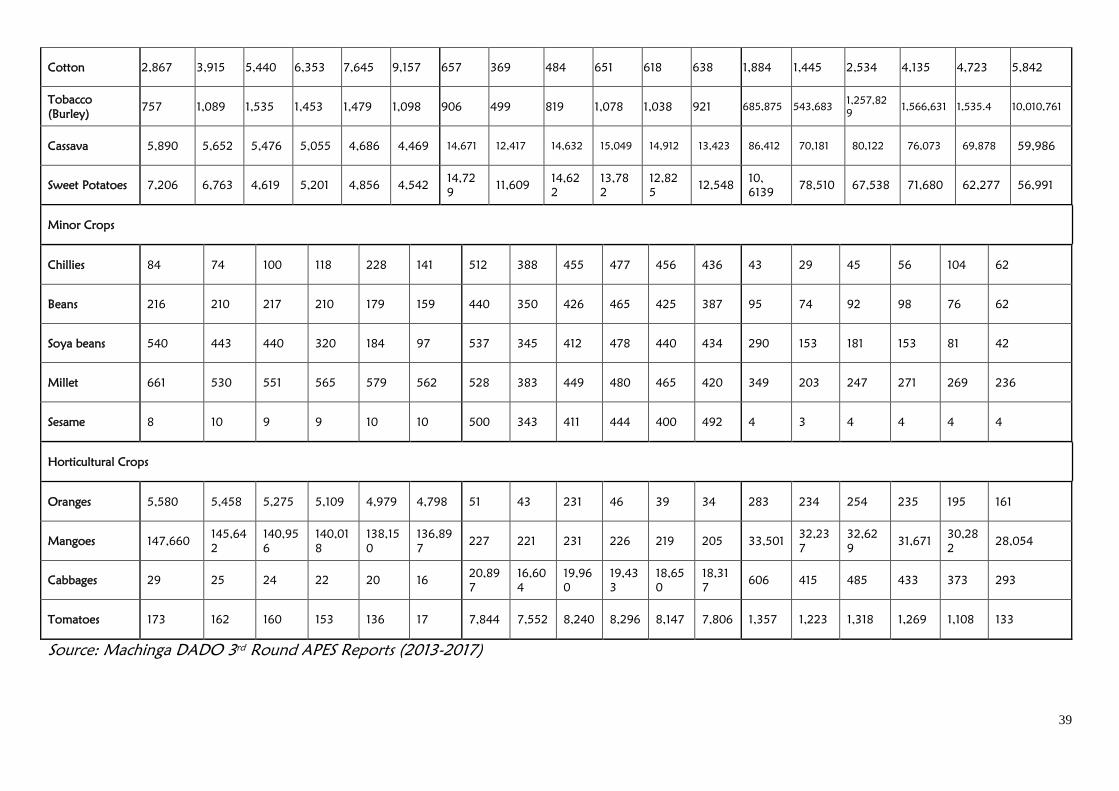
39
Cotton 2,867 3,915 5,440 6,353 7,645 9,157 657 369 484 651 618 638 1,884 1,445 2,534 4,135 4,723 5,842
Tobacco
(Burley) 757 1,089 1,535 1,453 1,479 1,098 906 499 819 1,078 1,038 921 685,875 543,683
1,257,82
9 1,566,631 1,535.4 10,010,761
Cassava 5,890 5,652 5,476 5,055 4,686 4,469 14,671 12,417 14,632 15,049 14,912 13,423 86,412 70,181 80,122 76,073 69,878 59,986
Sweet Potatoes 7,206 6,763 4,619 5,201 4,856 4,542 14,72
9 11,609
14,62
2
13,78
2
12,82
5 12,548
10,
6139 78,510 67,538 71,680 62,277 56,991
Minor Crops
Chillies 84 74 100 118 228 141 512 388 455 477 456 436 43 29 45 56 104 62
Beans 216 210 217 210 179 159 440 350 426 465 425 387 95 74 92 98 76 62
Soya beans 540 443 440 320 184 97 537 345 412 478 440 434 290 153 181 153 81 42
Millet 661 530 551 565 579 562 528 383 449 480 465 420 349 203 247 271 269 236
Sesame 8 10 9 9 10 10 500 343 411 444 400 492 4 3 4 4 4 4
Horticultural Crops
Oranges 5,580 5,458 5,275 5,109 4,979 4,798 51 43 231 46 39 34 283 234 254 235 195 161
Mangoes 147,660 145,64
2
140,95
6
140,01
8
138,15
0
136,89
7 227 221 231 226 219 205 33,501
32,23
7
32,62
9 31,671
30,28
2 28,054
Cabbages 29 25 24 22 20 16 20,89
7
16,60
4
19,96
0
19,43
3
18,65
0
18,31
7 606 415 485 433 373 293
Tomatoes 173 162 160 153 136 17 7,844 7,552 8,240 8,296 8,147 7,806 1,357 1,223 1,318 1,269 1,108 133
Source: Machinga DADO 3rd Round APES Reports (2013-2017)
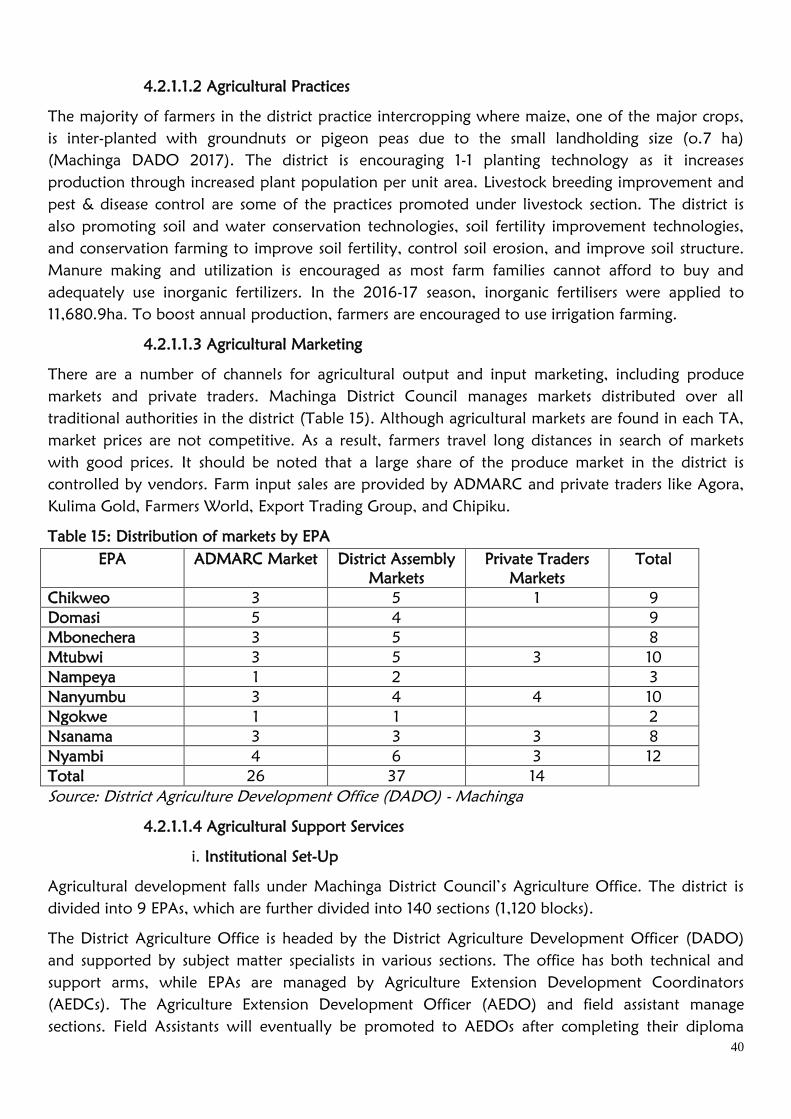
40
4.2.1.1.2 Agricultural Practices
The majority of farmers in the district practice intercropping where maize, one of the major crops,
is inter-planted with groundnuts or pigeon peas due to the small landholding size (o.7 ha)
(Machinga DADO 2017). The district is encouraging 1-1 planting technology as it increases
production through increased plant population per unit area. Livestock breeding improvement and
pest & disease control are some of the practices promoted under livestock section. The district is
also promoting soil and water conservation technologies, soil fertility improvement technologies,
and conservation farming to improve soil fertility, control soil erosion, and improve soil structure.
Manure making and utilization is encouraged as most farm families cannot afford to buy and
adequately use inorganic fertilizers. In the 2016-17 season, inorganic fertilisers were applied to
11,680.9ha. To boost annual production, farmers are encouraged to use irrigation farming.
4.2.1.1.3 Agricultural Marketing
There are a number of channels for agricultural output and input marketing, including produce
markets and private traders. Machinga District Council manages markets distributed over all
traditional authorities in the district (Table 15). Although agricultural markets are found in each TA,
market prices are not competitive. As a result, farmers travel long distances in search of markets
with good prices. It should be noted that a large share of the produce market in the district is
controlled by vendors. Farm input sales are provided by ADMARC and private traders like Agora,
Kulima Gold, Farmers World, Export Trading Group, and Chipiku.
Table 15: Distribution of markets by EPA
EPA ADMARC Market District Assembly
Markets
Private Traders
Markets
Total
Chikweo 3 5 1 9
Domasi 5 4 9
Mbonechera 3 5 8
Mtubwi 3 5 3 10
Nampeya 1 2 3
Nanyumbu 3 4 4 10
Ngokwe 1 1 2
Nsanama 3 3 3 8
Nyambi 4 6 3 12
Total 26 37 14
Source: District Agriculture Development Office (DADO) - Machinga
4.2.1.1.4 Agricultural Support Services
i. Institutional Set-Up
Agricultural development falls under Machinga District Council’s Agriculture Office. The district is
divided into 9 EPAs, which are further divided into 140 sections (1,120 blocks).
The District Agriculture Office is headed by the District Agriculture Development Officer (DADO)
and supported by subject matter specialists in various sections. The office has both technical and
support arms, while EPAs are managed by Agriculture Extension Development Coordinators
(AEDCs). The Agriculture Extension Development Officer (AEDO) and field assistant manage
sections. Field Assistants will eventually be promoted to AEDOs after completing their diploma
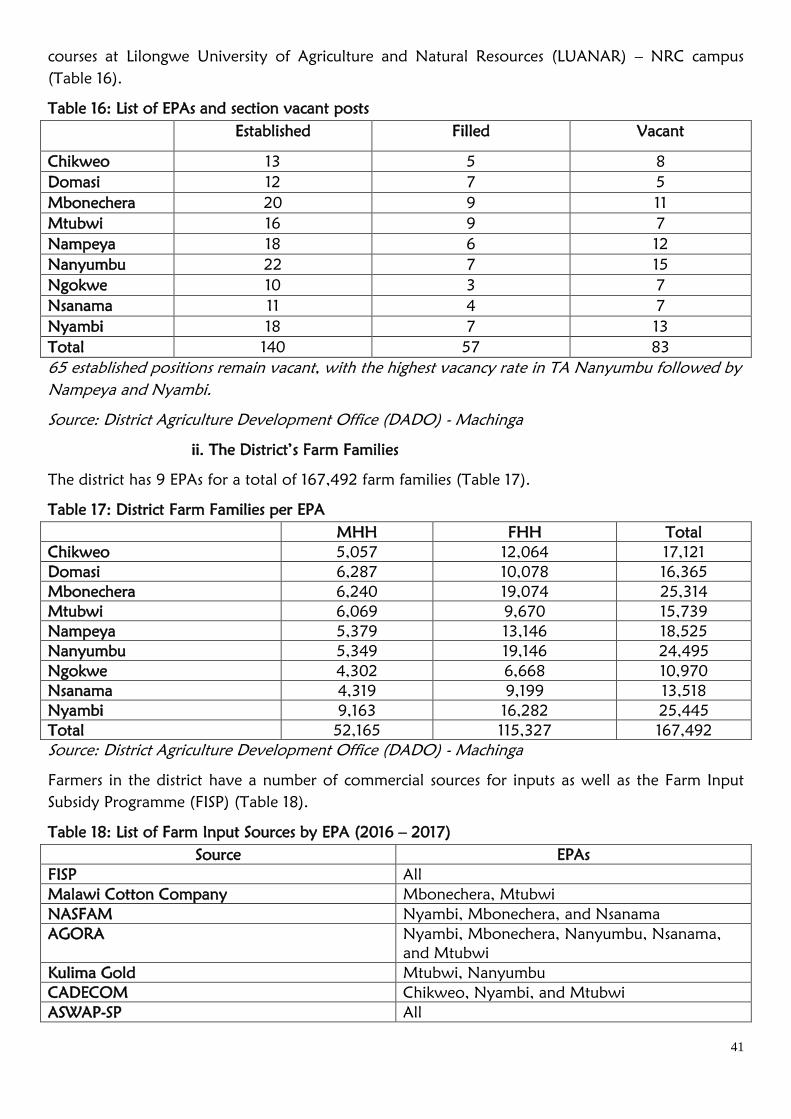
41
courses at Lilongwe University of Agriculture and Natural Resources (LUANAR) – NRC campus
(Table 16).
Table 16: List of EPAs and section vacant posts
Established Filled Vacant
Chikweo 13 5 8
Domasi 12 7 5
Mbonechera 20 9 11
Mtubwi 16 9 7
Nampeya 18 6 12
Nanyumbu 22 7 15
Ngokwe 10 3 7
Nsanama 11 4 7
Nyambi 18 7 13
Total 140 57 83
65 established positions remain vacant, with the highest vacancy rate in TA Nanyumbu followed by
Nampeya and Nyambi.
Source: District Agriculture Development Office (DADO) - Machinga
ii. The District’s Farm Families
The district has 9 EPAs for a total of 167,492 farm families (Table 17).
Table 17: District Farm Families per EPA
MHH FHH Total
Chikweo 5,057 12,064 17,121
Domasi 6,287 10,078 16,365
Mbonechera 6,240 19,074 25,314
Mtubwi 6,069 9,670 15,739
Nampeya 5,379 13,146 18,525
Nanyumbu 5,349 19,146 24,495
Ngokwe 4,302 6,668 10,970
Nsanama 4,319 9,199 13,518
Nyambi 9,163 16,282 25,445
Total 52,165 115,327 167,492
Source: District Agriculture Development Office (DADO) - Machinga
Farmers in the district have a number of commercial sources for inputs as well as the Farm Input
Subsidy Programme (FISP) (Table 18).
Table 18: List of Farm Input Sources by EPA (2016 – 2017)
Source EPAs
FISP All
Malawi Cotton Company Mbonechera, Mtubwi
NASFAM Nyambi, Mbonechera, and Nsanama
AGORA Nyambi, Mbonechera, Nanyumbu, Nsanama,
and Mtubwi
Kulima Gold Mtubwi, Nanyumbu
CADECOM Chikweo, Nyambi, and Mtubwi
ASWAP-SP All
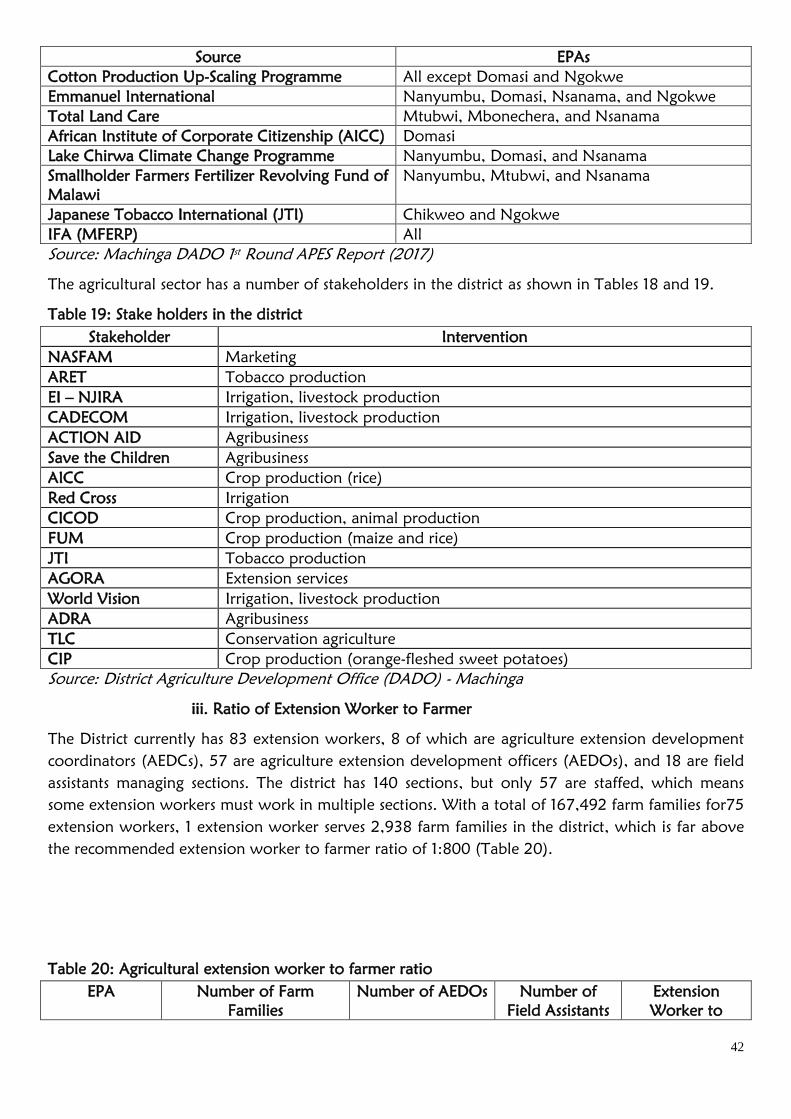
42
Source EPAs
Cotton Production Up-Scaling Programme All except Domasi and Ngokwe
Emmanuel International Nanyumbu, Domasi, Nsanama, and Ngokwe
Total Land Care Mtubwi, Mbonechera, and Nsanama
African Institute of Corporate Citizenship (AICC) Domasi
Lake Chirwa Climate Change Programme Nanyumbu, Domasi, and Nsanama
Smallholder Farmers Fertilizer Revolving Fund of
Malawi
Nanyumbu, Mtubwi, and Nsanama
Japanese Tobacco International (JTI) Chikweo and Ngokwe
IFA (MFERP) All
Source: Machinga DADO 1st Round APES Report (2017)
The agricultural sector has a number of stakeholders in the district as shown in Tables 18 and 19.
Table 19: Stake holders in the district
Stakeholder Intervention
NASFAM Marketing
ARET Tobacco production
EI – NJIRA Irrigation, livestock production
CADECOM Irrigation, livestock production
ACTION AID Agribusiness
Save the Children Agribusiness
AICC Crop production (rice)
Red Cross Irrigation
CICOD Crop production, animal production
FUM Crop production (maize and rice)
JTI Tobacco production
AGORA Extension services
World Vision Irrigation, livestock production
ADRA Agribusiness
TLC Conservation agriculture
CIP Crop production (orange-fleshed sweet potatoes)
Source: District Agriculture Development Office (DADO) - Machinga
iii. Ratio of Extension Worker to Farmer
The District currently has 83 extension workers, 8 of which are agriculture extension development
coordinators (AEDCs), 57 are agriculture extension development officers (AEDOs), and 18 are field
assistants managing sections. The district has 140 sections, but only 57 are staffed, which means
some extension workers must work in multiple sections. With a total of 167,492 farm families for75
extension workers, 1 extension worker serves 2,938 farm families in the district, which is far above
the recommended extension worker to farmer ratio of 1:800 (Table 20).
Table 20: Agricultural extension worker to farmer ratio
EPA Number of Farm
Families
Number of AEDOs Number of
Field Assistants
Extension
Worker to
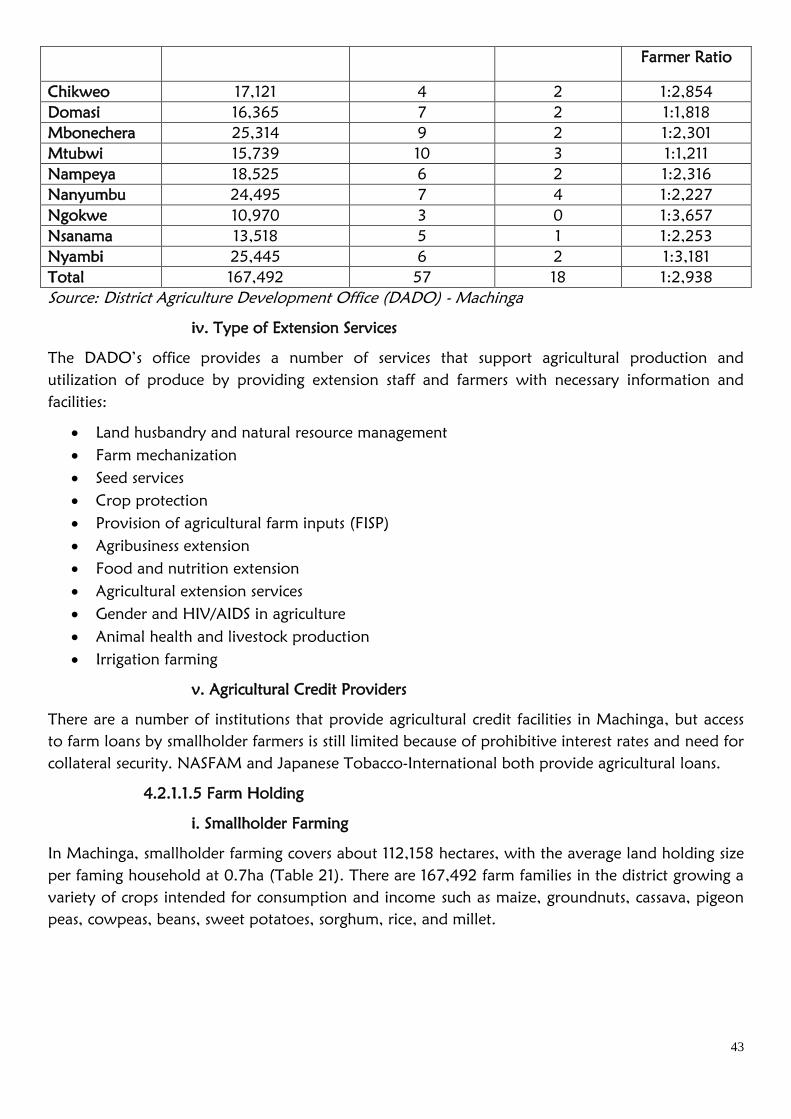
43
Farmer Ratio
Chikweo 17,121 4 2 1:2,854
Domasi 16,365 7 2 1:1,818
Mbonechera 25,314 9 2 1:2,301
Mtubwi 15,739 10 3 1:1,211
Nampeya 18,525 6 2 1:2,316
Nanyumbu 24,495 7 4 1:2,227
Ngokwe 10,970 3 0 1:3,657
Nsanama 13,518 5 1 1:2,253
Nyambi 25,445 6 2 1:3,181
Total 167,492 57 18 1:2,938
Source: District Agriculture Development Office (DADO) - Machinga
iv. Type of Extension Services
The DADO’s office provides a number of services that support agricultural production and
utilization of produce by providing extension staff and farmers with necessary information and
facilities:
Land husbandry and natural resource management
Farm mechanization
Seed services
Crop protection
Provision of agricultural farm inputs (FISP)
Agribusiness extension
Food and nutrition extension
Agricultural extension services
Gender and HIV/AIDS in agriculture
Animal health and livestock production
Irrigation farming
v. Agricultural Credit Providers
There are a number of institutions that provide agricultural credit facilities in Machinga, but access
to farm loans by smallholder farmers is still limited because of prohibitive interest rates and need for
collateral security. NASFAM and Japanese Tobacco-International both provide agricultural loans.
4.2.1.1.5 Farm Holding
i. Smallholder Farming
In Machinga, smallholder farming covers about 112,158 hectares, with the average land holding size
per faming household at 0.7ha (Table 21). There are 167,492 farm families in the district growing a
variety of crops intended for consumption and income such as maize, groundnuts, cassava, pigeon
peas, cowpeas, beans, sweet potatoes, sorghum, rice, and millet.
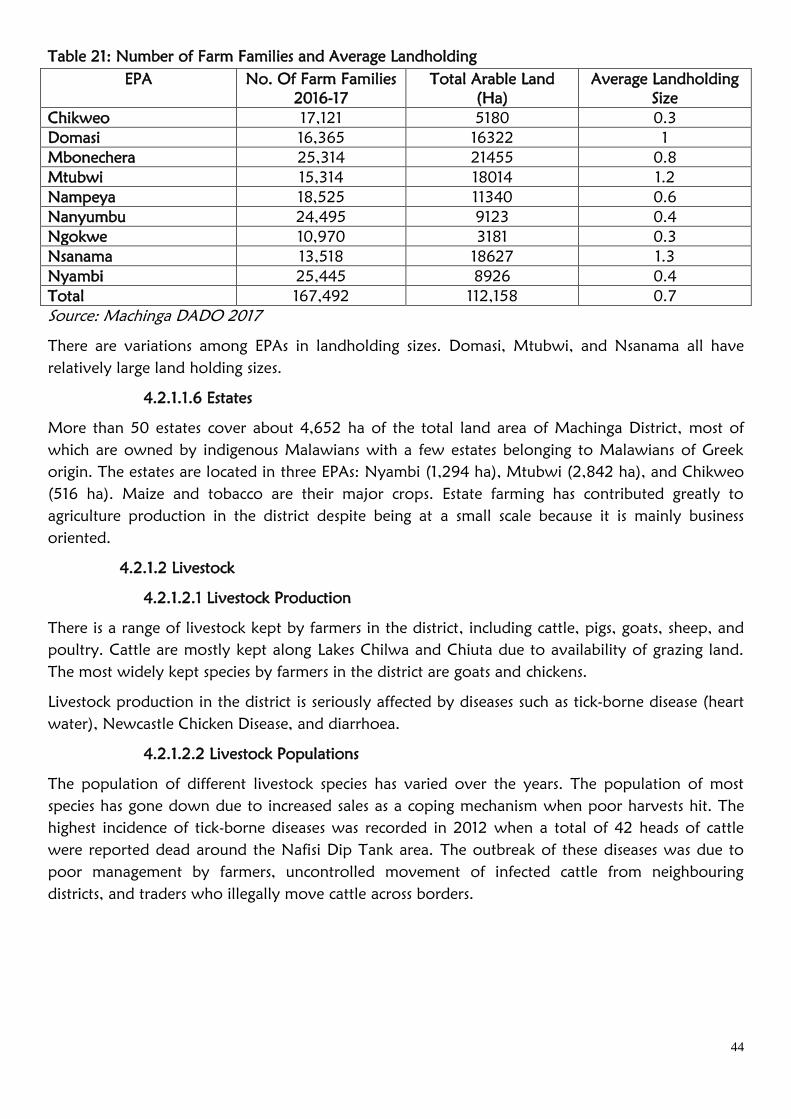
44
Table 21: Number of Farm Families and Average Landholding
EPA No. Of Farm Families
2016-17
Total Arable Land
(Ha)
Average Landholding
Size
Chikweo 17,121 5180 0.3
Domasi 16,365 16322 1
Mbonechera 25,314 21455 0.8
Mtubwi 15,314 18014 1.2
Nampeya 18,525 11340 0.6
Nanyumbu 24,495 9123 0.4
Ngokwe 10,970 3181 0.3
Nsanama 13,518 18627 1.3
Nyambi 25,445 8926 0.4
Total 167,492 112,158 0.7
Source: Machinga DADO 2017
There are variations among EPAs in landholding sizes. Domasi, Mtubwi, and Nsanama all have
relatively large land holding sizes.
4.2.1.1.6 Estates
More than 50 estates cover about 4,652 ha of the total land area of Machinga District, most of
which are owned by indigenous Malawians with a few estates belonging to Malawians of Greek
origin. The estates are located in three EPAs: Nyambi (1,294 ha), Mtubwi (2,842 ha), and Chikweo
(516 ha). Maize and tobacco are their major crops. Estate farming has contributed greatly to
agriculture production in the district despite being at a small scale because it is mainly business
oriented.
4.2.1.2 Livestock
4.2.1.2.1 Livestock Production
There is a range of livestock kept by farmers in the district, including cattle, pigs, goats, sheep, and
poultry. Cattle are mostly kept along Lakes Chilwa and Chiuta due to availability of grazing land.
The most widely kept species by farmers in the district are goats and chickens.
Livestock production in the district is seriously affected by diseases such as tick-borne disease (heart
water), Newcastle Chicken Disease, and diarrhoea.
4.2.1.2.2 Livestock Populations
The population of different livestock species has varied over the years. The population of most
species has gone down due to increased sales as a coping mechanism when poor harvests hit. The
highest incidence of tick-borne diseases was recorded in 2012 when a total of 42 heads of cattle
were reported dead around the Nafisi Dip Tank area. The outbreak of these diseases was due to
poor management by farmers, uncontrolled movement of infected cattle from neighbouring
districts, and traders who illegally move cattle across borders.
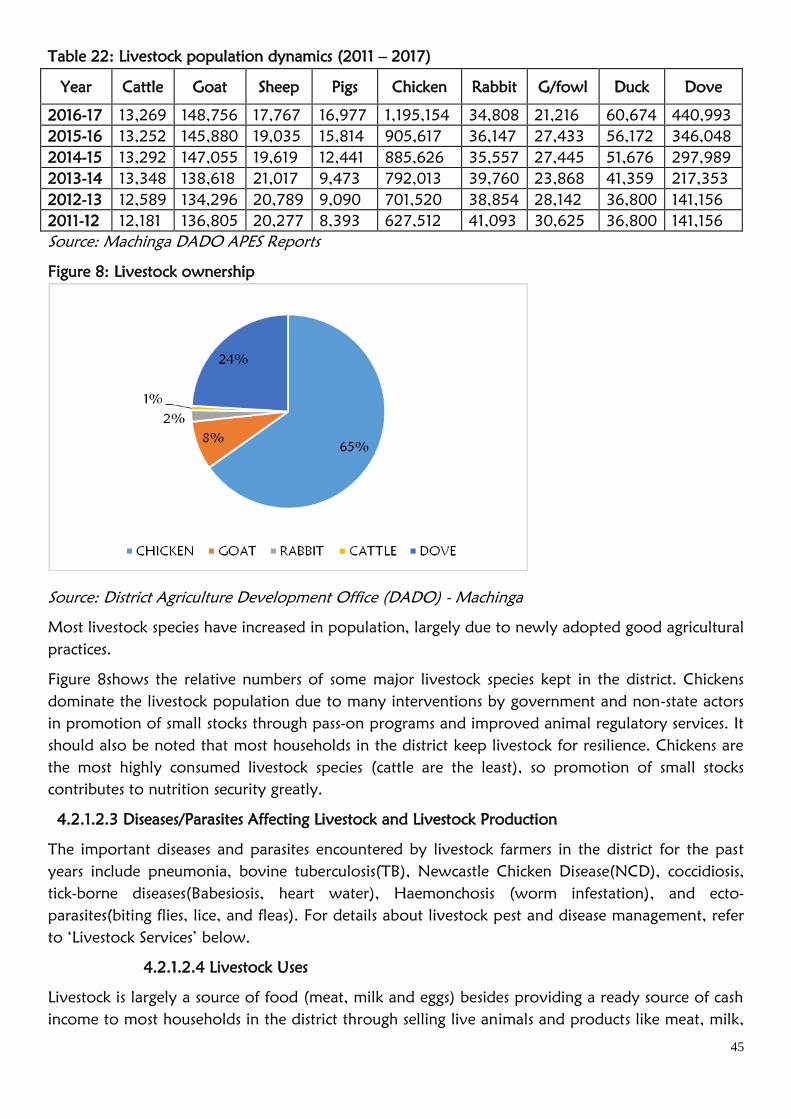
45
Table 22: Livestock population dynamics (2011 – 2017)
Year Cattle Goat Sheep Pigs Chicken Rabbit G/fowl Duck Dove
2016-17 13,269 148,756 17,767 16,977 1,195,154 34,808 21,216 60,674 440,993
2015-16 13,252 145,880 19,035 15,814 905,617 36,147 27,433 56,172 346,048
2014-15 13,292 147,055 19,619 12,441 885,626 35,557 27,445 51,676 297,989
2013-14 13,348 138,618 21,017 9,473 792,013 39,760 23,868 41,359 217,353
2012-13 12,589 134,296 20,789 9,090 701,520 38,854 28,142 36,800 141,156
2011-12 12,181 136,805 20,277 8,393 627,512 41,093 30,625 36,800 141,156
Source: Machinga DADO APES Reports
Figure 8: Livestock ownership
Source: District Agriculture Development Office (DADO) - Machinga
Most livestock species have increased in population, largely due to newly adopted good agricultural
practices.
Figure 8shows the relative numbers of some major livestock species kept in the district. Chickens
dominate the livestock population due to many interventions by government and non-state actors
in promotion of small stocks through pass-on programs and improved animal regulatory services. It
should also be noted that most households in the district keep livestock for resilience. Chickens are
the most highly consumed livestock species (cattle are the least), so promotion of small stocks
contributes to nutrition security greatly.
4.2.1.2.3 Diseases/Parasites Affecting Livestock and Livestock Production
The important diseases and parasites encountered by livestock farmers in the district for the past
years include pneumonia, bovine tuberculosis(TB), Newcastle Chicken Disease(NCD), coccidiosis,
tick-borne diseases(Babesiosis, heart water), Haemonchosis (worm infestation), and ecto-
parasites(biting flies, lice, and fleas). For details about livestock pest and disease management, refer
to ‘Livestock Services’ below.
4.2.1.2.4 Livestock Uses
Livestock is largely a source of food (meat, milk and eggs) besides providing a ready source of cash
income to most households in the district through selling live animals and products like meat, milk,
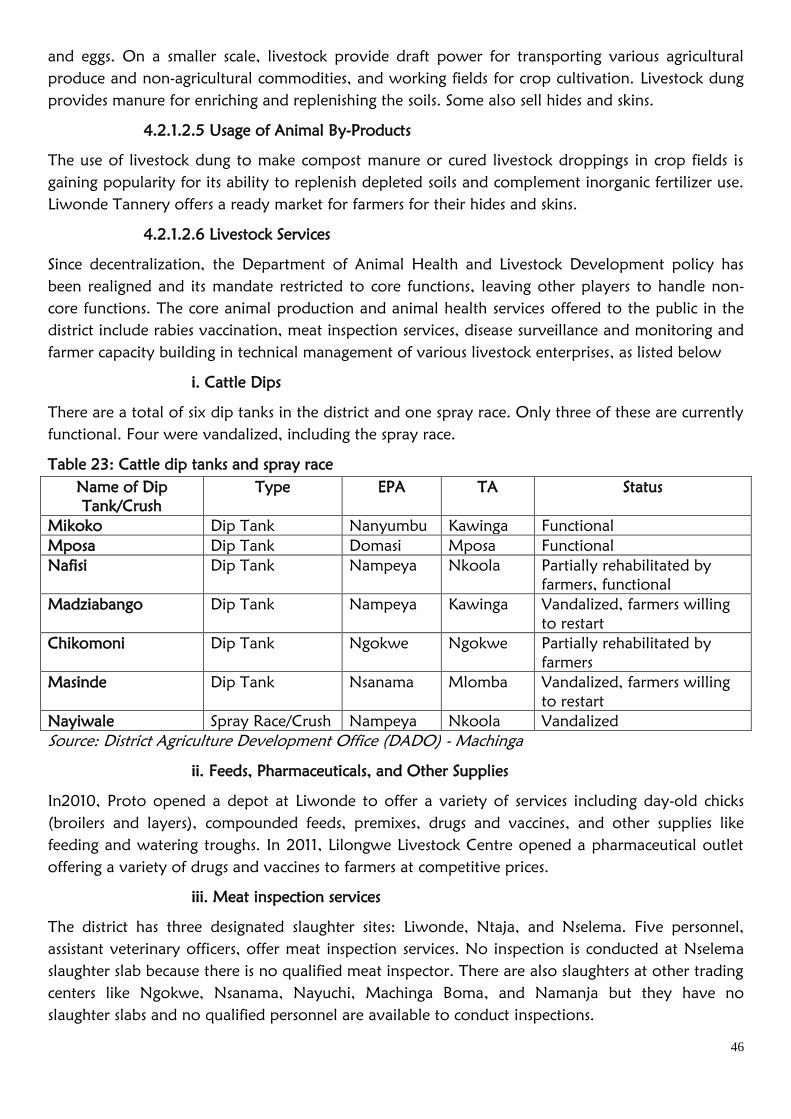
46
and eggs. On a smaller scale, livestock provide draft power for transporting various agricultural
produce and non-agricultural commodities, and working fields for crop cultivation. Livestock dung
provides manure for enriching and replenishing the soils. Some also sell hides and skins.
4.2.1.2.5 Usage of Animal By-Products
The use of livestock dung to make compost manure or cured livestock droppings in crop fields is
gaining popularity for its ability to replenish depleted soils and complement inorganic fertilizer use.
Liwonde Tannery offers a ready market for farmers for their hides and skins.
4.2.1.2.6 Livestock Services
Since decentralization, the Department of Animal Health and Livestock Development policy has
been realigned and its mandate restricted to core functions, leaving other players to handle non-
core functions. The core animal production and animal health services offered to the public in the
district include rabies vaccination, meat inspection services, disease surveillance and monitoring and
farmer capacity building in technical management of various livestock enterprises, as listed below
i. Cattle Dips
There are a total of six dip tanks in the district and one spray race. Only three of these are currently
functional. Four were vandalized, including the spray race.
Table 23: Cattle dip tanks and spray race
Name of Dip
Tank/Crush
Type EPA TA Status
Mikoko Dip Tank Nanyumbu Kawinga Functional
Mposa Dip Tank Domasi Mposa Functional
Nafisi Dip Tank Nampeya Nkoola Partially rehabilitated by
farmers, functional
Madziabango Dip Tank Nampeya Kawinga Vandalized, farmers willing
to restart
Chikomoni Dip Tank Ngokwe Ngokwe Partially rehabilitated by
farmers
Masinde Dip Tank Nsanama Mlomba Vandalized, farmers willing
to restart
Nayiwale Spray Race/Crush Nampeya Nkoola Vandalized
Source: District Agriculture Development Office (DADO) - Machinga
ii. Feeds, Pharmaceuticals, and Other Supplies
In2010, Proto opened a depot at Liwonde to offer a variety of services including day-old chicks
(broilers and layers), compounded feeds, premixes, drugs and vaccines, and other supplies like
feeding and watering troughs. In 2011, Lilongwe Livestock Centre opened a pharmaceutical outlet
offering a variety of drugs and vaccines to farmers at competitive prices.
iii. Meat inspection services
The district has three designated slaughter sites: Liwonde, Ntaja, and Nselema. Five personnel,
assistant veterinary officers, offer meat inspection services. No inspection is conducted at Nselema
slaughter slab because there is no qualified meat inspector. There are also slaughters at other trading
centers like Ngokwe, Nsanama, Nayuchi, Machinga Boma, and Namanja but they have no
slaughter slabs and no qualified personnel are available to conduct inspections.
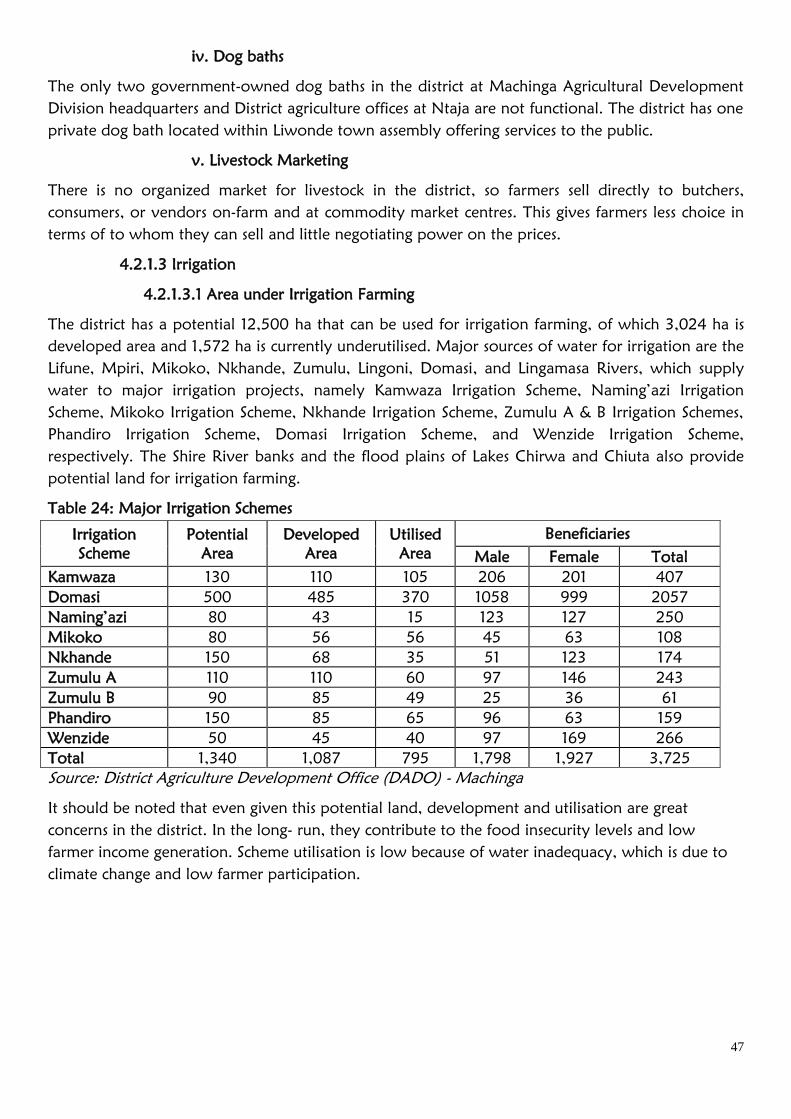
47
iv. Dog baths
The only two government-owned dog baths in the district at Machinga Agricultural Development
Division headquarters and District agriculture offices at Ntaja are not functional. The district has one
private dog bath located within Liwonde town assembly offering services to the public.
v. Livestock Marketing
There is no organized market for livestock in the district, so farmers sell directly to butchers,
consumers, or vendors on-farm and at commodity market centres. This gives farmers less choice in
terms of to whom they can sell and little negotiating power on the prices.
4.2.1.3 Irrigation
4.2.1.3.1 Area under Irrigation Farming
The district has a potential 12,500 ha that can be used for irrigation farming, of which 3,024 ha is
developed area and 1,572 ha is currently underutilised. Major sources of water for irrigation are the
Lifune, Mpiri, Mikoko, Nkhande, Zumulu, Lingoni, Domasi, and Lingamasa Rivers, which supply
water to major irrigation projects, namely Kamwaza Irrigation Scheme, Naming’azi Irrigation
Scheme, Mikoko Irrigation Scheme, Nkhande Irrigation Scheme, Zumulu A & B Irrigation Schemes,
Phandiro Irrigation Scheme, Domasi Irrigation Scheme, and Wenzide Irrigation Scheme,
respectively. The Shire River banks and the flood plains of Lakes Chirwa and Chiuta also provide
potential land for irrigation farming.
Table 24: Major Irrigation Schemes
Irrigation
Scheme
Potential
Area
Developed
Area
Utilised
Area
Beneficiaries
Male Female Total
Kamwaza 130 110 105 206 201 407
Domasi 500 485 370 1058 999 2057
Naming’azi 80 43 15 123 127 250
Mikoko 80 56 56 45 63 108
Nkhande 150 68 35 51 123 174
Zumulu A 110 110 60 97 146 243
Zumulu B 90 85 49 25 36 61
Phandiro 150 85 65 96 63 159
Wenzide 50 45 40 97 169 266
Total 1,340 1,087 795 1,798 1,927 3,725
Source: District Agriculture Development Office (DADO) - Machinga
It should be noted that even given this potential land, development and utilisation are great
concerns in the district. In the long- run, they contribute to the food insecurity levels and low
farmer income generation. Scheme utilisation is low because of water inadequacy, which is due to
climate change and low farmer participation.
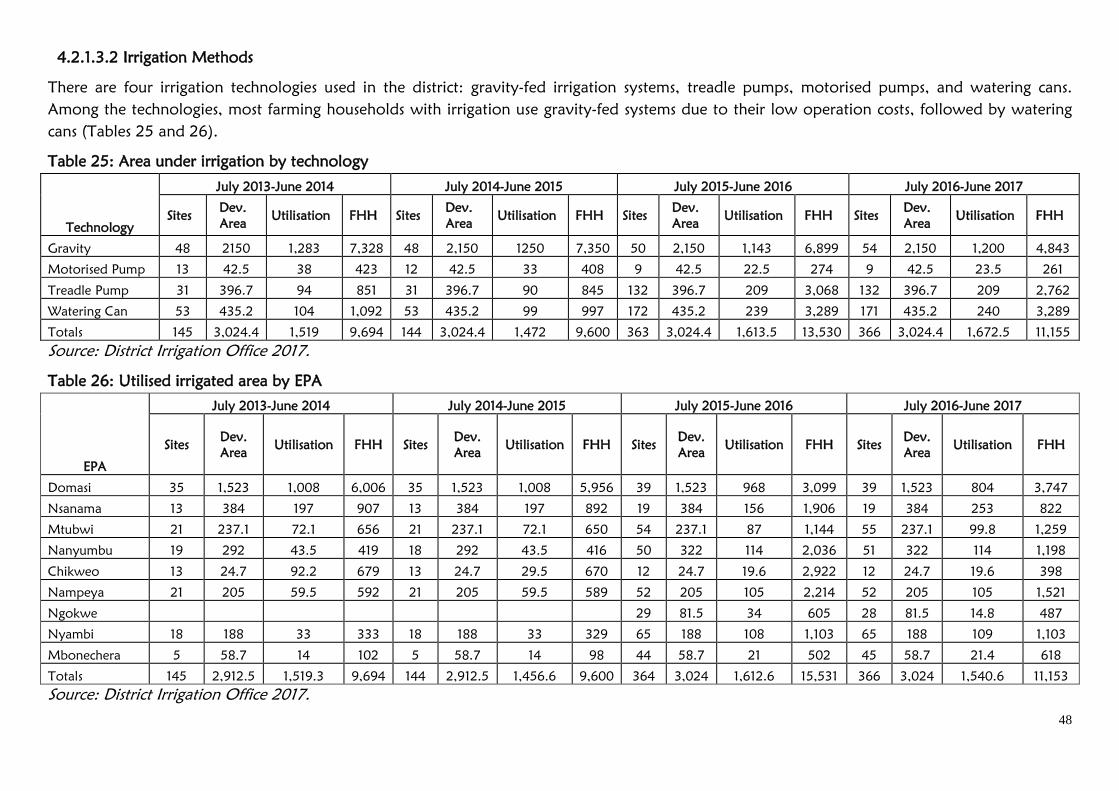
48
4.2.1.3.2 Irrigation Methods
There are four irrigation technologies used in the district: gravity-fed irrigation systems, treadle pumps, motorised pumps, and watering cans.
Among the technologies, most farming households with irrigation use gravity-fed systems due to their low operation costs, followed by watering
cans (Tables 25 and 26).
Table 25: Area under irrigation by technology
Technology
July 2013-June 2014 July 2014-June 2015 July 2015-June 2016 July 2016-June 2017
Sites Dev.
Area Utilisation FHH Sites
Dev.
Area Utilisation FHH Sites
Dev.
Area Utilisation FHH Sites
Dev.
Area Utilisation FHH
Gravity 48 2150 1,283 7,328 48 2,150 1250 7,350 50 2,150 1,143 6,899 54 2,150 1,200 4,843
Motorised Pump 13 42.5 38 423 12 42.5 33 408 9 42.5 22.5 274 9 42.5 23.5 261
Treadle Pump 31 396.7 94 851 31 396.7 90 845 132 396.7 209 3,068 132 396.7 209 2,762
Watering Can 53 435.2 104 1,092 53 435.2 99 997 172 435.2 239 3,289 171 435.2 240 3,289
Totals 145 3,024.4 1,519 9,694 144 3,024.4 1,472 9,600 363 3,024.4 1,613.5 13,530 366 3,024.4 1,672.5 11,155
Source: District Irrigation Office 2017.
Table 26: Utilised irrigated area by EPA
EPA
July 2013-June 2014 July 2014-June 2015 July 2015-June 2016 July 2016-June 2017
Sites Dev.
Area Utilisation FHH Sites
Dev.
Area Utilisation FHH Sites
Dev.
Area Utilisation FHH Sites
Dev.
Area Utilisation FHH
Domasi 35 1,523 1,008 6,006 35 1,523 1,008 5,956 39 1,523 968 3,099 39 1,523 804 3,747
Nsanama 13 384 197 907 13 384 197 892 19 384 156 1,906 19 384 253 822
Mtubwi 21 237.1 72.1 656 21 237.1 72.1 650 54 237.1 87 1,144 55 237.1 99.8 1,259
Nanyumbu 19 292 43.5 419 18 292 43.5 416 50 322 114 2,036 51 322 114 1,198
Chikweo 13 24.7 92.2 679 13 24.7 29.5 670 12 24.7 19.6 2,922 12 24.7 19.6 398
Nampeya 21 205 59.5 592 21 205 59.5 589 52 205 105 2,214 52 205 105 1,521
Ngokwe
29 81.5 34 605 28 81.5 14.8 487
Nyambi 18 188 33 333 18 188 33 329 65 188 108 1,103 65 188 109 1,103
Mbonechera 5 58.7 14 102 5 58.7 14 98 44 58.7 21 502 45 58.7 21.4 618
Totals 145 2,912.5 1,519.3 9,694 144 2,912.5 1,456.6 9,600 364 3,024 1,612.6 15,531 366 3,024 1,540.6 11,153
Source: District Irrigation Office 2017.
49
4.2.1.4 Nutrition
4.2.1.4.1 Facilities Offering Nutrition Support
The agriculture sector’s food and nutrition section promotes dietary diversification and backyard
gardening as well as providing trainings and nutrition education to community nutrition
groups/CBOs on a number of food and nutrition-related issues:
Food processing, preparation, utilization and storage
Food budgeting
Nutrition and HIV/AIDS
Micronutrient deficiency disorders
Dietary-related non-communicable diseases
4.2.1.4.2 Nutrition Support for HIV/AIDS-Affected People
MGDS III (Section 6:1:10) discusses the HIV/AIDS Management in Malawi. Its broader goal is to
enhance efforts for HIV/AIDS prevention, treatment and management of related impacts and has
provided the national policy guiding principle on nutrition and management of HIV/AIDS.
One major pathway is through agriculture. There are a number of trainings being provided to
people living with HIV/AIDS by the agriculture sector and other stakeholders. Most of these
trainings are provided for CBOs. These trainings include linking nutrition to HIV/AIDS; participants
are trained on frequency of feeding, choice of foods, food preparation, and use of herbal remedies
for different opportunistic infections that may result from their infection. Programs like the FISP also
deliberately target such vulnerable groups to ensure food and nutrition security; the program
provides a nutritionally valuable legume package in addition to maize.
4.2.1.4.3 2% ORT Support for Government Employees
Different sectors are implementing the 2% ORT support differently. Some sectors provide food
items, while others provide cash to employees that have declared their positive sero status. The
agriculture sector provides MK5, 000to each employee.
4.2.2Fisheries
Fishing is a significant livelihood source for people of Machinga District. Approximately 4,000
people are directly engaged in fishing as gear owners and crew, and more than 5,000 people work
in fish processing, transportation, and marketing. The number of people engaged in the fishery
value chain fluctuates year on year depending on the water surface area, which is a major
determinant of fish productivity.
Lakes Chiuta and Chilwa and the Shire River are the three major fisheries in the district. Despite the
high potential, the Shire River fishery is not well developed and not easily accessible to the major
market routes. Subsistence fishing occurs in the Domasi, Likangala, Lisanjala, Lifune, Mpiri, and
Likwenu Rivers. There are 30 active fish beaches in Lakes Chilwa and Chiuta, which form the base
for fishing activities in fishing villages, processing, and marketing. In Lake Chilwa, these beaches are
under the jurisdiction of Senior Chief Kawinga, Traditional Authorities Mlomba and Mposa, and
STA Mchinguza. In Lake Chiuta, they are under TAs Ngokwe and Chikwewo. Fish production from
Lake Chiuta is estimated that between 3,000 – 5,000 tonnes per year and valued at $394,800
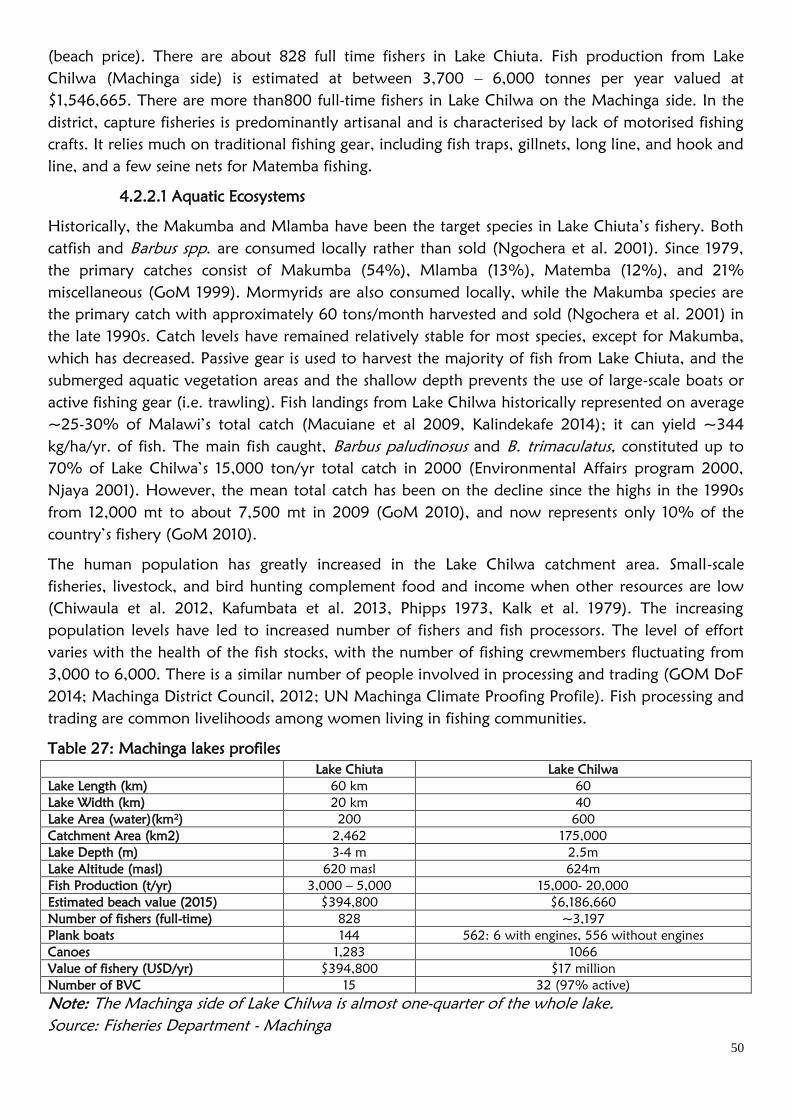
50
(beach price). There are about 828 full time fishers in Lake Chiuta. Fish production from Lake
Chilwa (Machinga side) is estimated at between 3,700 – 6,000 tonnes per year valued at
$1,546,665. There are more than800 full-time fishers in Lake Chilwa on the Machinga side. In the
district, capture fisheries is predominantly artisanal and is characterised by lack of motorised fishing
crafts. It relies much on traditional fishing gear, including fish traps, gillnets, long line, and hook and
line, and a few seine nets for Matemba fishing.
4.2.2.1 Aquatic Ecosystems
Historically, the Makumba and Mlamba have been the target species in Lake Chiuta’s fishery. Both
catfish and Barbus spp. are consumed locally rather than sold (Ngochera et al. 2001). Since 1979,
the primary catches consist of Makumba (54%), Mlamba (13%), Matemba (12%), and 21%
miscellaneous (GoM 1999). Mormyrids are also consumed locally, while the Makumba species are
the primary catch with approximately 60 tons/month harvested and sold (Ngochera et al. 2001) in
the late 1990s. Catch levels have remained relatively stable for most species, except for Makumba,
which has decreased. Passive gear is used to harvest the majority of fish from Lake Chiuta, and the
submerged aquatic vegetation areas and the shallow depth prevents the use of large-scale boats or
active fishing gear (i.e. trawling). Fish landings from Lake Chilwa historically represented on average
~25-30% of Malawi’s total catch (Macuiane et al 2009, Kalindekafe 2014); it can yield ~344
kg/ha/yr. of fish. The main fish caught, Barbus paludinosus and B. trimaculatus, constituted up to
70% of Lake Chilwa’s 15,000 ton/yr total catch in 2000 (Environmental Affairs program 2000,
Njaya 2001). However, the mean total catch has been on the decline since the highs in the 1990s
from 12,000 mt to about 7,500 mt in 2009 (GoM 2010), and now represents only 10% of the
country’s fishery (GoM 2010).
The human population has greatly increased in the Lake Chilwa catchment area. Small-scale
fisheries, livestock, and bird hunting complement food and income when other resources are low
(Chiwaula et al. 2012, Kafumbata et al. 2013, Phipps 1973, Kalk et al. 1979). The increasing
population levels have led to increased number of fishers and fish processors. The level of effort
varies with the health of the fish stocks, with the number of fishing crewmembers fluctuating from
3,000 to 6,000. There is a similar number of people involved in processing and trading (GOM DoF
2014; Machinga District Council, 2012; UN Machinga Climate Proofing Profile). Fish processing and
trading are common livelihoods among women living in fishing communities.
Table 27: Machinga lakes profiles
Lake Chiuta Lake Chilwa
Lake Length (km) 60 km 60
Lake Width (km) 20 km 40
Lake Area (water)(km2) 200 600
Catchment Area (km2) 2,462 175,000
Lake Depth (m) 3-4 m 2.5m
Lake Altitude (masl) 620 masl 624m
Fish Production (t/yr) 3,000 – 5,000 15,000- 20,000
Estimated beach value (2015) $394,800 $6,186,660
Number of fishers (full-time) 828 ~3,197
Plank boats 144 562: 6 with engines, 556 without engines
Canoes 1,283 1066
Value of fishery (USD/yr) $394,800 $17 million
Number of BVC 15 32 (97% active)
Note: The Machinga side of Lake Chilwa is almost one-quarter of the whole lake.
Source: Fisheries Department - Machinga

51
4.2.2.2 Fisheries Governance and Structure
In order to protect and manage fisheries resources and to support local communities and the
private sector in the development of capture fisheries and aquaculture, the Department of Fisheries
offers extension and training services, research (in both capture fisheries and aquaculture), and
enforcement of fisheries laws and regulations.
The extension services for capture fisheries follow the participatory fisheries management (PFM)
regime, which advocates the participation and engagement of local communities through Local
Fisheries Management Authorities(LFMAs) e.g. Beach Village Committees (BVCs) and Fisheries
Associations (FA) with support from government. The LFMAs (BVCs and FAs) act as intermediaries
between fishing communities and the Department of Fisheries. Participatory fisheries management
allows for a two-way channel of communication in the sustainable management of the fisheries
resources through active engagement of resource users and adoption of fisheries regulations. The
extension services are delivered through designated areas known as minor strata along the coastline
and corresponding beaches. As stipulated in the local community participation act, fishing
communities form local management structures known as BVCs and a sub-committee is elected to
assist in the management of the fisheries resources in a designated area (Table 28).
Table 19: BVCs established in the minor strata for fisheries resource management
Water Body Minor Stratum Number of BVCS Total
Lake Chiuta 10.1 Dinji 7 15
10.2 Saleya 8
Lake Chilwa 9.1 Namanja 6 18
9.2 Mposa 12, including 5 RVCs
Source: Fisheries Department - Machinga
Extension services in the aquaculture subsector follow the new agriculture demand-driven pluralistic
extension policy. Pluralistic extension recognizes the inherent diversity of farmers and farming
systems and the need to address challenges in rural development with different services and
approaches. It is characterized by the coexistence of multiple public, private, and mixed extension
systems and approaches; multiple providers and types of services; diverse funding streams; and
multiple sources of information—all of which benefit from some degree of coordination and
regulation that facilitates interaction and learning. Ideally, the outcome of pluralistic extension
services is that different client groups in different contexts are satisfied with their access to the
services that they have demanded.
4.2.2.2.1 Enforcement and Inspectorate Services
Monitoring and controlling of fishing activities by government is needed to ensure that fishing laws
and regulations are complied with. The main goal of the licensing and inspectorate unit is to
maintain effective fisheries inspections in areas not under participatory fisheries management and
also to support local fisheries management authorities in enforcement in order to control
exploitation and ensure sustainable utilisation of fish resources.
Due to limited staffing levels in the Department of Fisheries, the enforcement section for the district
is located in Zomba District. Machinga District carries out enforcement activities in liaison with the
Zomba District Fisheries Office, especially for Lake Chilwa. Enforcement activities for Lake Chiuta
very much rely on local community participation as they have strong fisheries governance structures
in place.
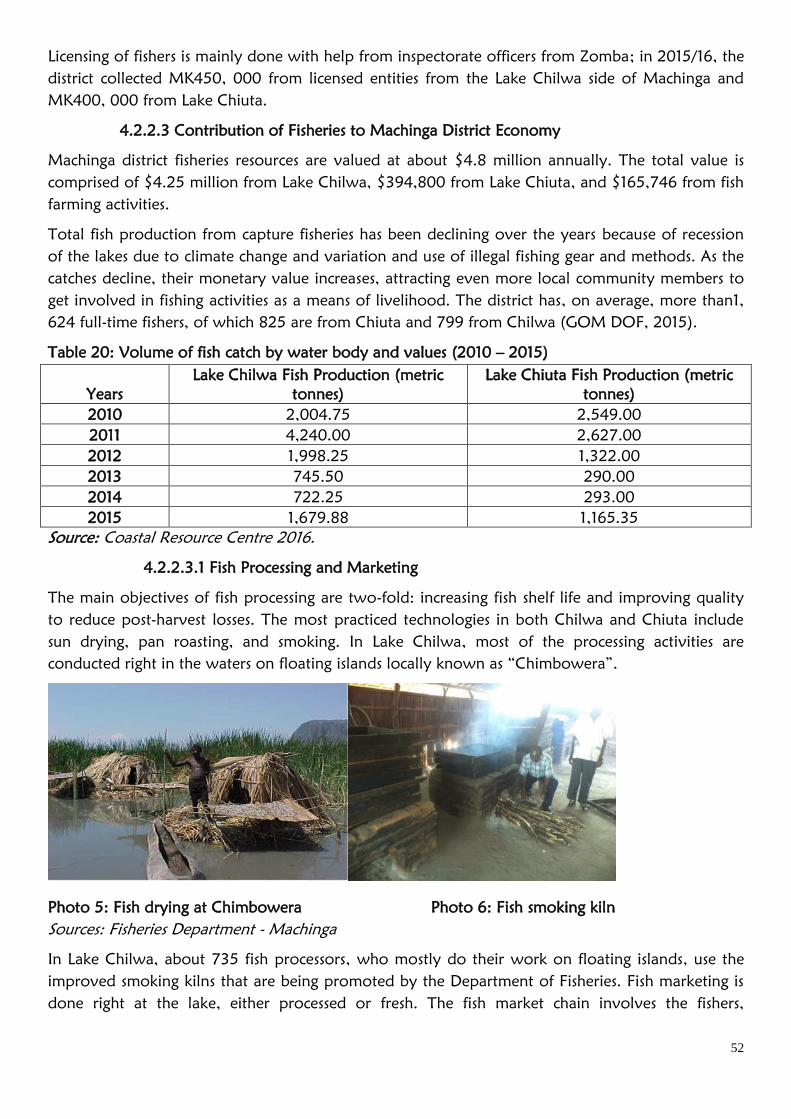
52
Licensing of fishers is mainly done with help from inspectorate officers from Zomba; in 2015/16, the
district collected MK450, 000 from licensed entities from the Lake Chilwa side of Machinga and
MK400, 000 from Lake Chiuta.
4.2.2.3 Contribution of Fisheries to Machinga District Economy
Machinga district fisheries resources are valued at about $4.8 million annually. The total value is
comprised of $4.25 million from Lake Chilwa, $394,800 from Lake Chiuta, and $165,746 from fish
farming activities.
Total fish production from capture fisheries has been declining over the years because of recession
of the lakes due to climate change and variation and use of illegal fishing gear and methods. As the
catches decline, their monetary value increases, attracting even more local community members to
get involved in fishing activities as a means of livelihood. The district has, on average, more than1,
624 full-time fishers, of which 825 are from Chiuta and 799 from Chilwa (GOM DOF, 2015).
Table 20: Volume of fish catch by water body and values (2010 – 2015)
Years
Lake Chilwa Fish Production (metric
tonnes)
Lake Chiuta Fish Production (metric
tonnes)
2010 2,004.75 2,549.00
2011 4,240.00 2,627.00
2012 1,998.25 1,322.00
2013 745.50 290.00
2014 722.25 293.00
2015 1,679.88 1,165.35
Source: Coastal Resource Centre 2016.
4.2.2.3.1 Fish Processing and Marketing
The main objectives of fish processing are two-fold: increasing fish shelf life and improving quality
to reduce post-harvest losses. The most practiced technologies in both Chilwa and Chiuta include
sun drying, pan roasting, and smoking. In Lake Chilwa, most of the processing activities are
conducted right in the waters on floating islands locally known as “Chimbowera”.
Photo 5: Fish drying at Chimbowera Photo 6: Fish smoking kiln
Sources: Fisheries Department - Machinga
In Lake Chilwa, about 735 fish processors, who mostly do their work on floating islands, use the
improved smoking kilns that are being promoted by the Department of Fisheries. Fish marketing is
done right at the lake, either processed or fresh. The fish market chain involves the fishers,
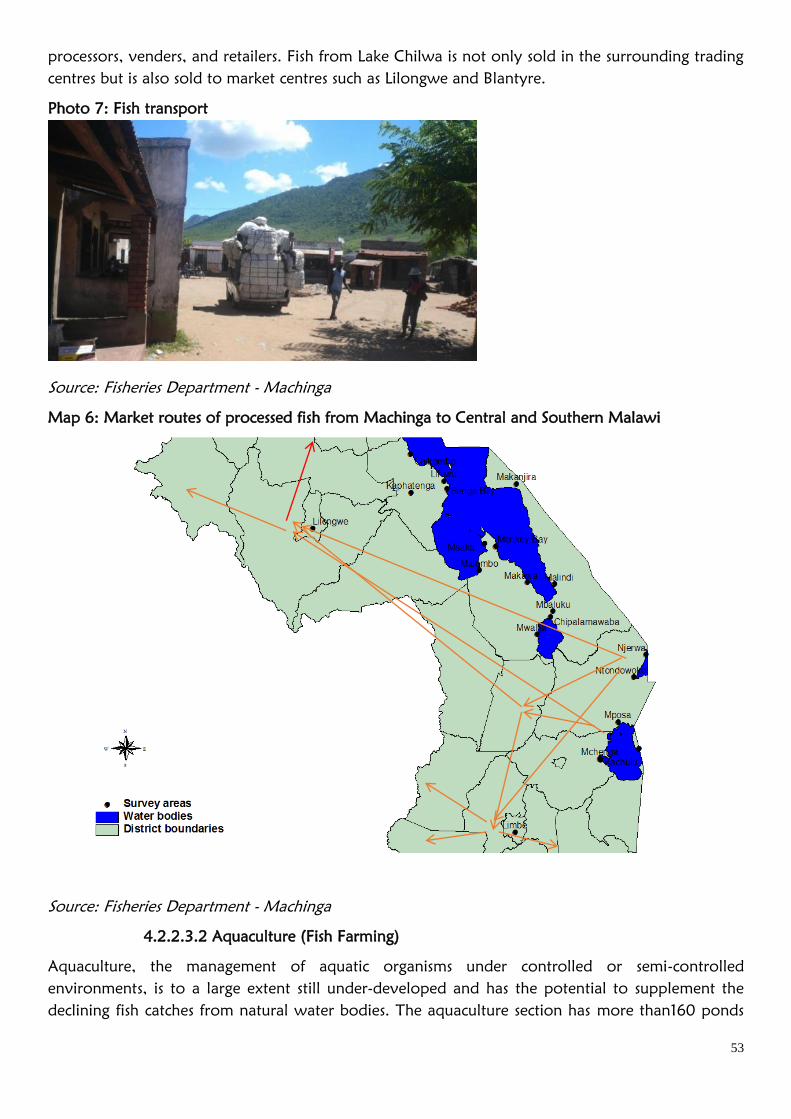
53
processors, venders, and retailers. Fish from Lake Chilwa is not only sold in the surrounding trading
centres but is also sold to market centres such as Lilongwe and Blantyre.
Photo 7: Fish transport
Source: Fisheries Department - Machinga
Map 6: Market routes of processed fish from Machinga to Central and Southern Malawi
Source: Fisheries Department - Machinga
4.2.2.3.2 Aquaculture (Fish Farming)
Aquaculture, the management of aquatic organisms under controlled or semi-controlled
environments, is to a large extent still under-developed and has the potential to supplement the
declining fish catches from natural water bodies. The aquaculture section has more than160 ponds

54
throughout the district. Benefits from aquaculture include promoting household-level food security,
increasing animal protein intake, providing an alternative source of livelihood, and a source of
income.
Table 30: Status of fish farming
Total # of
Fish
Farmers
Total # of
Ponds
Total Pond
Area (sq.m)
Total Area
(ha)
Total Ponds under
Utilization
Total no of
ponds dried up
623 168 54627.8 5.4627 154 14
Source: Fisheries Department - Machinga
Table 21: Production estimates for Machinga fish farming
ADD District Fish Species
Area
(ha)
Average
Yield
(kg/ha)
Production
(mt) REMARKS
Machinga Machinga Oreochromis shiranus 6.25 5,934 37.09 8.00
Oreochromis karongae 0 0 0
Tilapia rendalli 0 0 0
Other 0 0 0
Machinga Total 6.25 5,934 37.09
Final Round 2015-16 5.46 6,289 34.34
Production
increase by
8% due to
increase in
area.
First Round 2015-16 3.61 9,972 36.00
Source: Fisheries Department - Machinga
Production increased by 8% 34.34 to 37.90 tonnes due to an increase in pond area and good
management. With the estimated production of about 37.09 metric tonnes from fish farming and a
minimum fresh fish price of MK2,000 per kilogram, the value of fish farming in the district is
pegged at MK74,180,000($98,906.7)
i. Opportunities and Challenges to the Development of Small-Scale
Aquaculture
The district has one of the highest potentials for growth in fish farming in the country. The district
has several perennial rivers, the presence of several irrigation schemes as potential areas to expand
with fish ponds, and good soils for the construction of fish ponds. Lake Chiuta and the Shire River
could be potential sites for small-scale cage culture. There are, however, a number of challenges,
including low precipitation leading to low water levels, lack of capacity for the fish farmers
(especially in the areas of pond management and marketing), and low availability of inputs like
fingerlings and feeds, which are currently produced by the National Aquaculture Centre at Domasi
and MALDECO Aquaculture Limited in Mangochi, respectively.
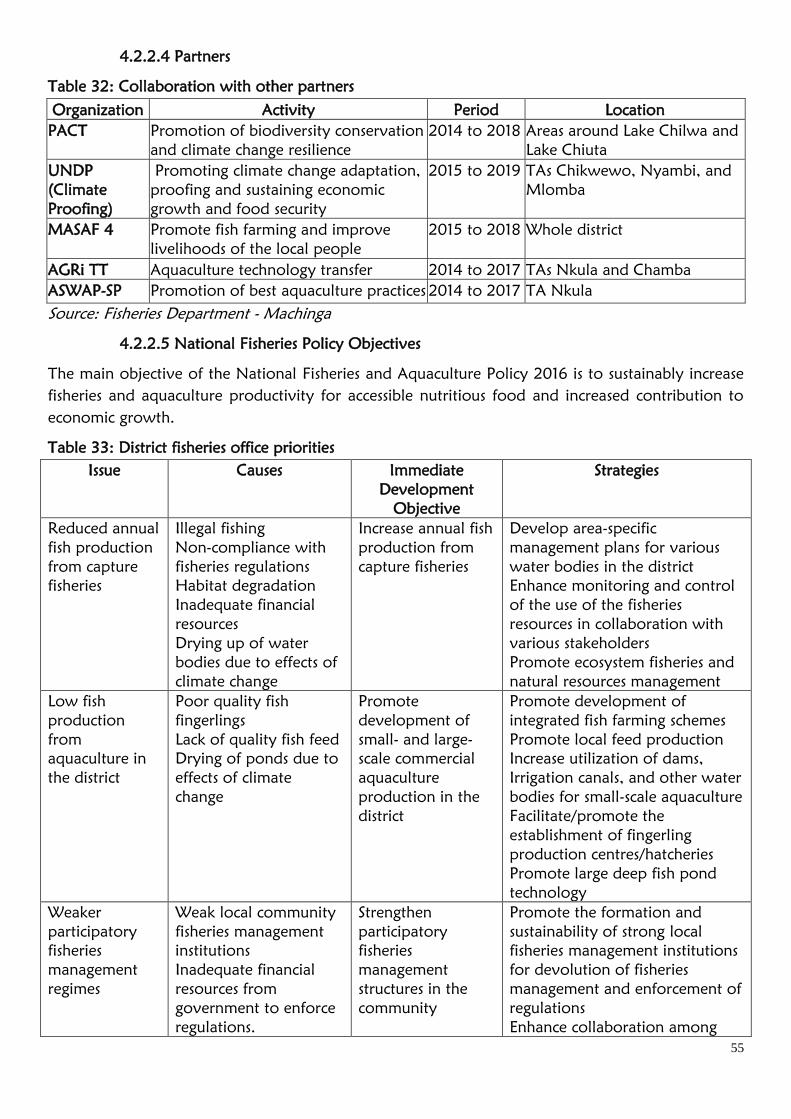
55
4.2.2.4 Partners
Table 32: Collaboration with other partners
Organization Activity Period Location
PACT Promotion of biodiversity conservation
and climate change resilience
2014 to 2018 Areas around Lake Chilwa and
Lake Chiuta
UNDP
(Climate
Proofing)
Promoting climate change adaptation,
proofing and sustaining economic
growth and food security
2015 to 2019 TAs Chikwewo, Nyambi, and
Mlomba
MASAF 4 Promote fish farming and improve
livelihoods of the local people
2015 to 2018 Whole district
AGRi TT Aquaculture technology transfer 2014 to 2017 TAs Nkula and Chamba
ASWAP-SP Promotion of best aquaculture practices 2014 to 2017 TA Nkula
Source: Fisheries Department - Machinga
4.2.2.5 National Fisheries Policy Objectives
The main objective of the National Fisheries and Aquaculture Policy 2016 is to sustainably increase
fisheries and aquaculture productivity for accessible nutritious food and increased contribution to
economic growth.
Table 33: District fisheries office priorities
Issue Causes Immediate
Development
Objective
Strategies
Reduced annual
fish production
from capture
fisheries
Illegal fishing
Non-compliance with
fisheries regulations
Habitat degradation
Inadequate financial
resources
Drying up of water
bodies due to effects of
climate change
Increase annual fish
production from
capture fisheries
Develop area-specific
management plans for various
water bodies in the district
Enhance monitoring and control
of the use of the fisheries
resources in collaboration with
various stakeholders
Promote ecosystem fisheries and
natural resources management
Low fish
production
from
aquaculture in
the district
Poor quality fish
fingerlings
Lack of quality fish feed
Drying of ponds due to
effects of climate
change
Promote
development of
small- and large-
scale commercial
aquaculture
production in the
district
Promote development of
integrated fish farming schemes
Promote local feed production
Increase utilization of dams,
Irrigation canals, and other water
bodies for small-scale aquaculture
Facilitate/promote the
establishment of fingerling
production centres/hatcheries
Promote large deep fish pond
technology
Weaker
participatory
fisheries
management
regimes
Weak local community
fisheries management
institutions
Inadequate financial
resources from
government to enforce
regulations.
Strengthen
participatory
fisheries
management
structures in the
community
Promote the formation and
sustainability of strong local
fisheries management institutions
for devolution of fisheries
management and enforcement of
regulations
Enhance collaboration among
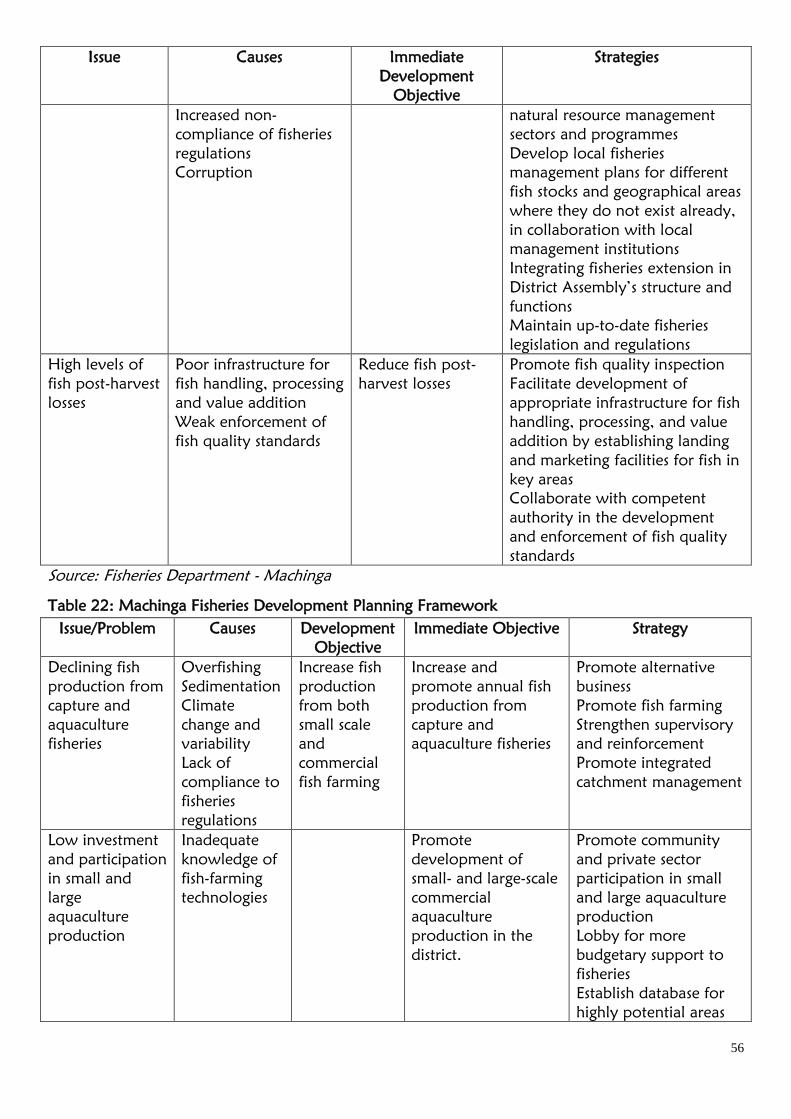
56
Issue Causes Immediate
Development
Objective
Strategies
Increased non-
compliance of fisheries
regulations
Corruption
natural resource management
sectors and programmes
Develop local fisheries
management plans for different
fish stocks and geographical areas
where they do not exist already,
in collaboration with local
management institutions
Integrating fisheries extension in
District Assembly’s structure and
functions
Maintain up-to-date fisheries
legislation and regulations
High levels of
fish post-harvest
losses
Poor infrastructure for
fish handling, processing
and value addition
Weak enforcement of
fish quality standards
Reduce fish post-
harvest losses
Promote fish quality inspection
Facilitate development of
appropriate infrastructure for fish
handling, processing, and value
addition by establishing landing
and marketing facilities for fish in
key areas
Collaborate with competent
authority in the development
and enforcement of fish quality
standards
Source: Fisheries Department - Machinga
Table 22: Machinga Fisheries Development Planning Framework
Issue/Problem Causes Development
Objective
Immediate Objective Strategy
Declining fish
production from
capture and
aquaculture
fisheries
Overfishing
Sedimentation
Climate
change and
variability
Lack of
compliance to
fisheries
regulations
Increase fish
production
from both
small scale
and
commercial
fish farming
Increase and
promote annual fish
production from
capture and
aquaculture fisheries
Promote alternative
business
Promote fish farming
Strengthen supervisory
and reinforcement
Promote integrated
catchment management
Low investment
and participation
in small and
large
aquaculture
production
Inadequate
knowledge of
fish-farming
technologies
Promote
development of
small- and large-scale
commercial
aquaculture
production in the
district.
Promote community
and private sector
participation in small
and large aquaculture
production
Lobby for more
budgetary support to
fisheries
Establish database for
highly potential areas
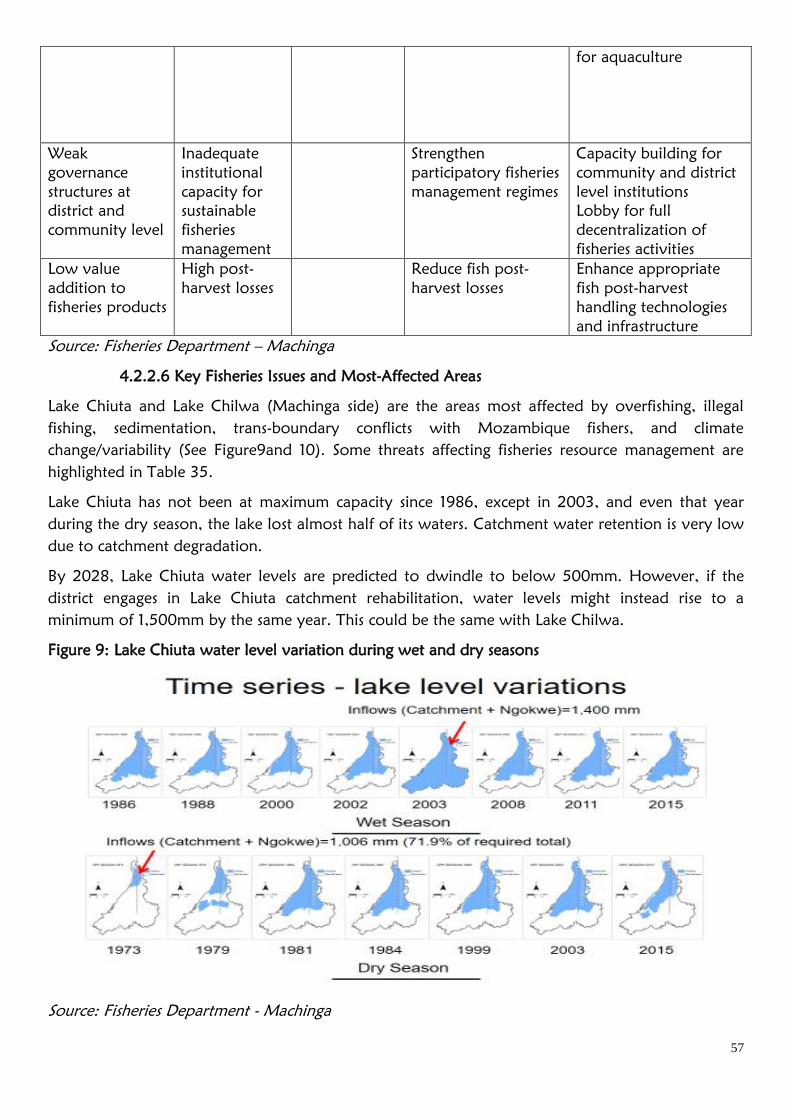
57
for aquaculture
Weak
governance
structures at
district and
community level
Inadequate
institutional
capacity for
sustainable
fisheries
management
Strengthen
participatory fisheries
management regimes
Capacity building for
community and district
level institutions
Lobby for full
decentralization of
fisheries activities
Low value
addition to
fisheries products
High post-
harvest losses
Reduce fish post-
harvest losses
Enhance appropriate
fish post-harvest
handling technologies
and infrastructure
Source: Fisheries Department – Machinga
4.2.2.6 Key Fisheries Issues and Most-Affected Areas
Lake Chiuta and Lake Chilwa (Machinga side) are the areas most affected by overfishing, illegal
fishing, sedimentation, trans-boundary conflicts with Mozambique fishers, and climate
change/variability (See Figure9and 10). Some threats affecting fisheries resource management are
highlighted in Table 35.
Lake Chiuta has not been at maximum capacity since 1986, except in 2003, and even that year
during the dry season, the lake lost almost half of its waters. Catchment water retention is very low
due to catchment degradation.
By 2028, Lake Chiuta water levels are predicted to dwindle to below 500mm. However, if the
district engages in Lake Chiuta catchment rehabilitation, water levels might instead rise to a
minimum of 1,500mm by the same year. This could be the same with Lake Chilwa.
Figure 9: Lake Chiuta water level variation during wet and dry seasons
Source: Fisheries Department - Machinga
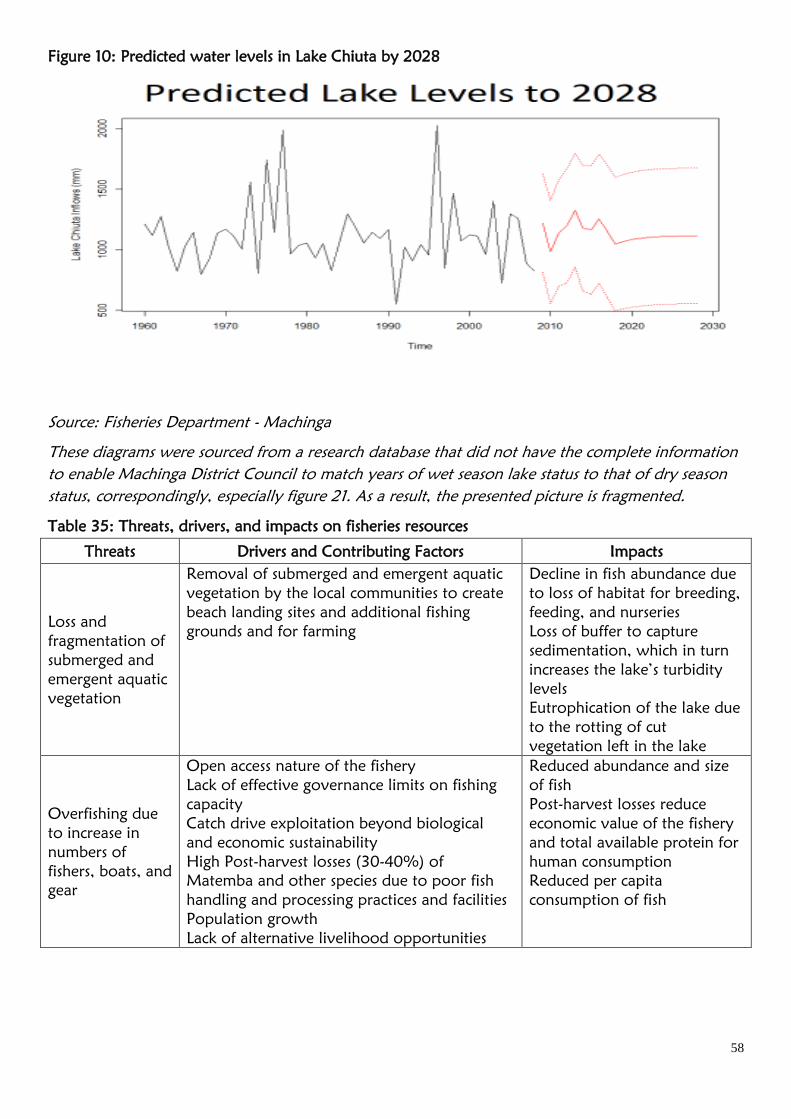
58
Figure 10: Predicted water levels in Lake Chiuta by 2028
Source: Fisheries Department - Machinga
These diagrams were sourced from a research database that did not have the complete information
to enable Machinga District Council to match years of wet season lake status to that of dry season
status, correspondingly, especially figure 21. As a result, the presented picture is fragmented.
Table 35: Threats, drivers, and impacts on fisheries resources
Threats Drivers and Contributing Factors Impacts
Loss and
fragmentation of
submerged and
emergent aquatic
vegetation
Removal of submerged and emergent aquatic
vegetation by the local communities to create
beach landing sites and additional fishing
grounds and for farming
Decline in fish abundance due
to loss of habitat for breeding,
feeding, and nurseries
Loss of buffer to capture
sedimentation, which in turn
increases the lake’s turbidity
levels
Eutrophication of the lake due
to the rotting of cut
vegetation left in the lake
Overfishing due
to increase in
numbers of
fishers, boats, and
gear
Open access nature of the fishery
Lack of effective governance limits on fishing
capacity
Catch drive exploitation beyond biological
and economic sustainability
High Post-harvest losses (30-40%) of
Matemba and other species due to poor fish
handling and processing practices and facilities
Population growth
Lack of alternative livelihood opportunities
Reduced abundance and size
of fish
Post-harvest losses reduce
economic value of the fishery
and total available protein for
human consumption
Reduced per capita
consumption of fish
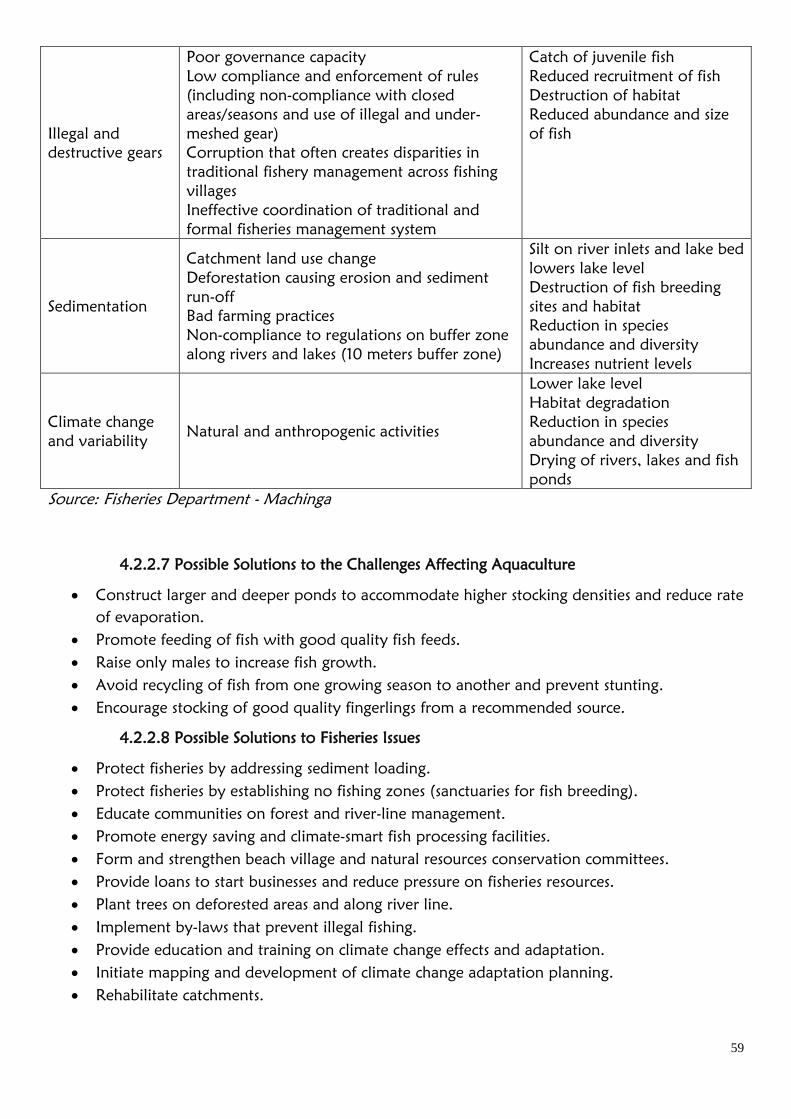
59
Illegal and
destructive gears
Poor governance capacity
Low compliance and enforcement of rules
(including non-compliance with closed
areas/seasons and use of illegal and under-
meshed gear)
Corruption that often creates disparities in
traditional fishery management across fishing
villages
Ineffective coordination of traditional and
formal fisheries management system
Catch of juvenile fish
Reduced recruitment of fish
Destruction of habitat
Reduced abundance and size
of fish
Sedimentation
Catchment land use change
Deforestation causing erosion and sediment
run-off
Bad farming practices
Non-compliance to regulations on buffer zone
along rivers and lakes (10 meters buffer zone)
Silt on river inlets and lake bed
lowers lake level
Destruction of fish breeding
sites and habitat
Reduction in species
abundance and diversity
Increases nutrient levels
Climate change
and variability Natural and anthropogenic activities
Lower lake level
Habitat degradation
Reduction in species
abundance and diversity
Drying of rivers, lakes and fish
ponds
Source: Fisheries Department - Machinga
4.2.2.7 Possible Solutions to the Challenges Affecting Aquaculture
Construct larger and deeper ponds to accommodate higher stocking densities and reduce rate
of evaporation.
Promote feeding of fish with good quality fish feeds.
Raise only males to increase fish growth.
Avoid recycling of fish from one growing season to another and prevent stunting.
Encourage stocking of good quality fingerlings from a recommended source.
4.2.2.8 Possible Solutions to Fisheries Issues
Protect fisheries by addressing sediment loading.
Protect fisheries by establishing no fishing zones (sanctuaries for fish breeding).
Educate communities on forest and river-line management.
Promote energy saving and climate-smart fish processing facilities.
Form and strengthen beach village and natural resources conservation committees.
Provide loans to start businesses and reduce pressure on fisheries resources.
Plant trees on deforested areas and along river line.
Implement by-laws that prevent illegal fishing.
Provide education and training on climate change effects and adaptation.
Initiate mapping and development of climate change adaptation planning.
Rehabilitate catchments.
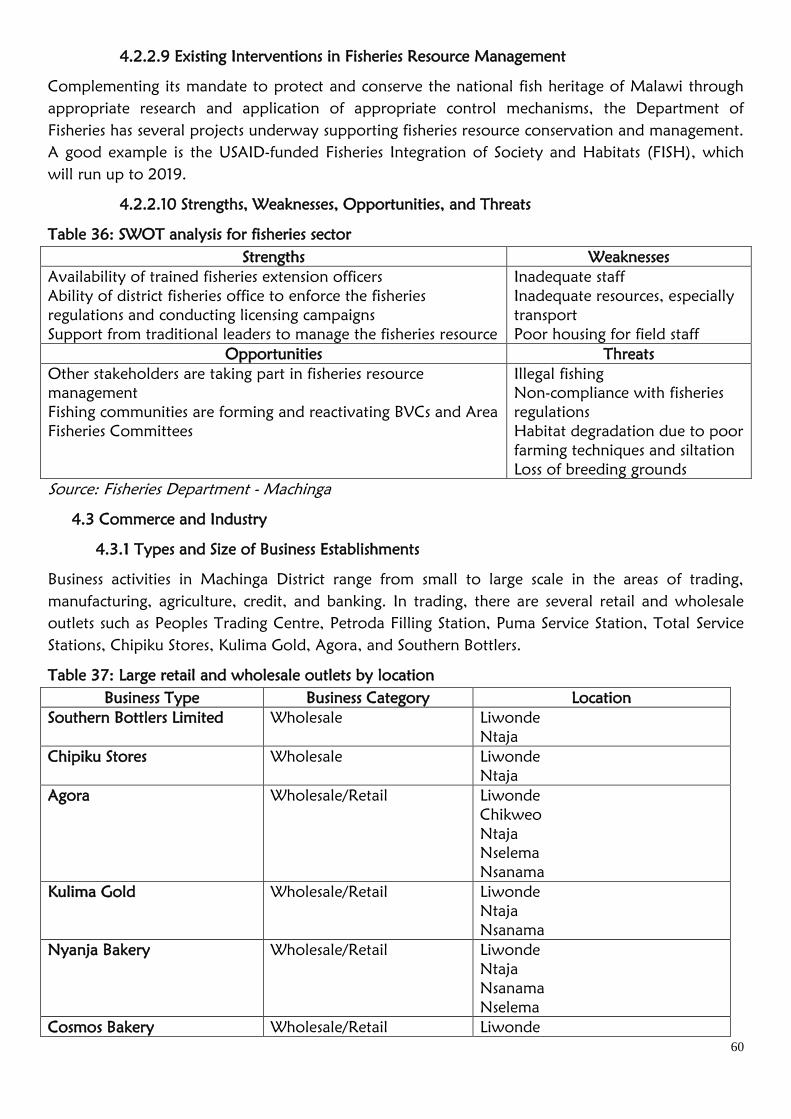
60
4.2.2.9 Existing Interventions in Fisheries Resource Management
Complementing its mandate to protect and conserve the national fish heritage of Malawi through
appropriate research and application of appropriate control mechanisms, the Department of
Fisheries has several projects underway supporting fisheries resource conservation and management.
A good example is the USAID-funded Fisheries Integration of Society and Habitats (FISH), which
will run up to 2019.
4.2.2.10 Strengths, Weaknesses, Opportunities, and Threats
Table 36: SWOT analysis for fisheries sector
Strengths Weaknesses
Availability of trained fisheries extension officers
Ability of district fisheries office to enforce the fisheries
regulations and conducting licensing campaigns
Support from traditional leaders to manage the fisheries resource
Inadequate staff
Inadequate resources, especially
transport
Poor housing for field staff
Opportunities Threats
Other stakeholders are taking part in fisheries resource
management
Fishing communities are forming and reactivating BVCs and Area
Fisheries Committees
Illegal fishing
Non-compliance with fisheries
regulations
Habitat degradation due to poor
farming techniques and siltation
Loss of breeding grounds
Source: Fisheries Department - Machinga
4.3 Commerce and Industry
4.3.1 Types and Size of Business Establishments
Business activities in Machinga District range from small to large scale in the areas of trading,
manufacturing, agriculture, credit, and banking. In trading, there are several retail and wholesale
outlets such as Peoples Trading Centre, Petroda Filling Station, Puma Service Station, Total Service
Stations, Chipiku Stores, Kulima Gold, Agora, and Southern Bottlers.
Table 37: Large retail and wholesale outlets by location
Business Type Business Category Location
Southern Bottlers Limited Wholesale Liwonde
Ntaja
Chipiku Stores Wholesale Liwonde
Ntaja
Agora Wholesale/Retail Liwonde
Chikweo
Ntaja
Nselema
Nsanama
Kulima Gold Wholesale/Retail Liwonde
Ntaja
Nsanama
Nyanja Bakery Wholesale/Retail Liwonde
Ntaja
Nsanama
Nselema
Cosmos Bakery Wholesale/Retail Liwonde
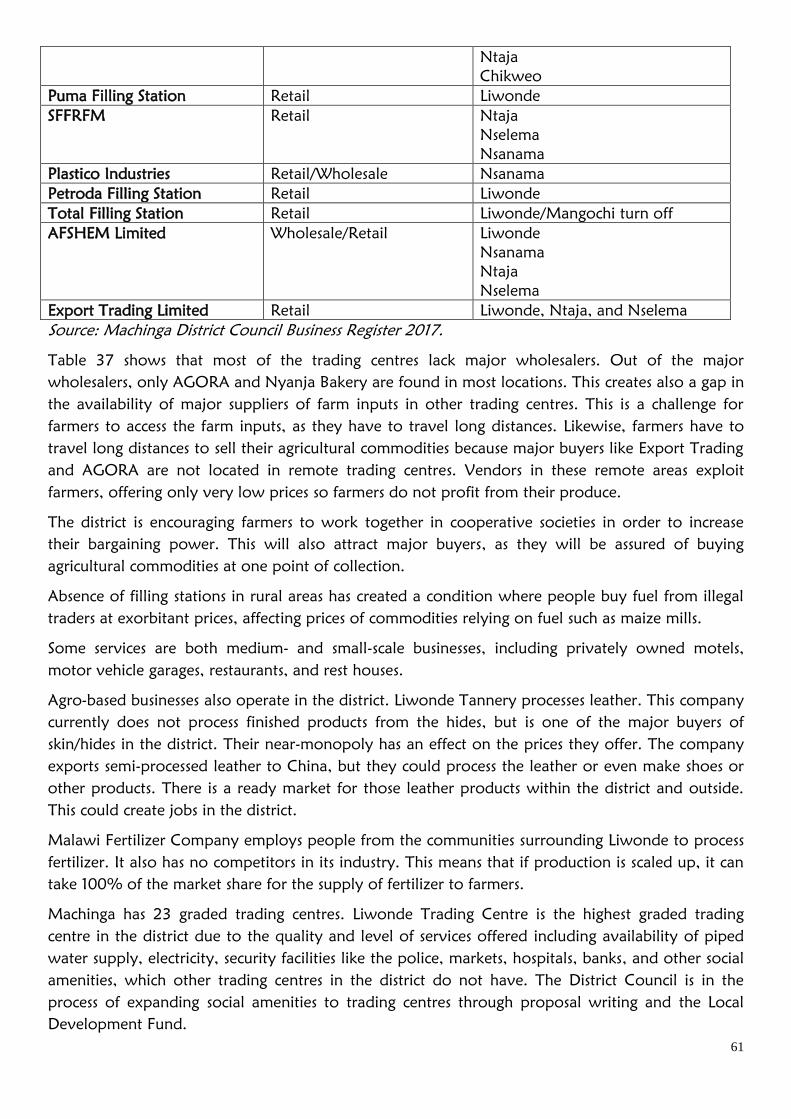
61
Ntaja
Chikweo
Puma Filling Station Retail Liwonde
SFFRFM Retail Ntaja
Nselema
Nsanama
Plastico Industries Retail/Wholesale Nsanama
Petroda Filling Station Retail Liwonde
Total Filling Station Retail Liwonde/Mangochi turn off
AFSHEM Limited Wholesale/Retail Liwonde
Nsanama
Ntaja
Nselema
Export Trading Limited Retail Liwonde, Ntaja, and Nselema
Source: Machinga District Council Business Register 2017.
Table 37 shows that most of the trading centres lack major wholesalers. Out of the major
wholesalers, only AGORA and Nyanja Bakery are found in most locations. This creates also a gap in
the availability of major suppliers of farm inputs in other trading centres. This is a challenge for
farmers to access the farm inputs, as they have to travel long distances. Likewise, farmers have to
travel long distances to sell their agricultural commodities because major buyers like Export Trading
and AGORA are not located in remote trading centres. Vendors in these remote areas exploit
farmers, offering only very low prices so farmers do not profit from their produce.
The district is encouraging farmers to work together in cooperative societies in order to increase
their bargaining power. This will also attract major buyers, as they will be assured of buying
agricultural commodities at one point of collection.
Absence of filling stations in rural areas has created a condition where people buy fuel from illegal
traders at exorbitant prices, affecting prices of commodities relying on fuel such as maize mills.
Some services are both medium- and small-scale businesses, including privately owned motels,
motor vehicle garages, restaurants, and rest houses.
Agro-based businesses also operate in the district. Liwonde Tannery processes leather. This company
currently does not process finished products from the hides, but is one of the major buyers of
skin/hides in the district. Their near-monopoly has an effect on the prices they offer. The company
exports semi-processed leather to China, but they could process the leather or even make shoes or
other products. There is a ready market for those leather products within the district and outside.
This could create jobs in the district.
Malawi Fertilizer Company employs people from the communities surrounding Liwonde to process
fertilizer. It also has no competitors in its industry. This means that if production is scaled up, it can
take 100% of the market share for the supply of fertilizer to farmers.
Machinga has 23 graded trading centres. Liwonde Trading Centre is the highest graded trading
centre in the district due to the quality and level of services offered including availability of piped
water supply, electricity, security facilities like the police, markets, hospitals, banks, and other social
amenities, which other trading centres in the district do not have. The District Council is in the
process of expanding social amenities to trading centres through proposal writing and the Local
Development Fund.
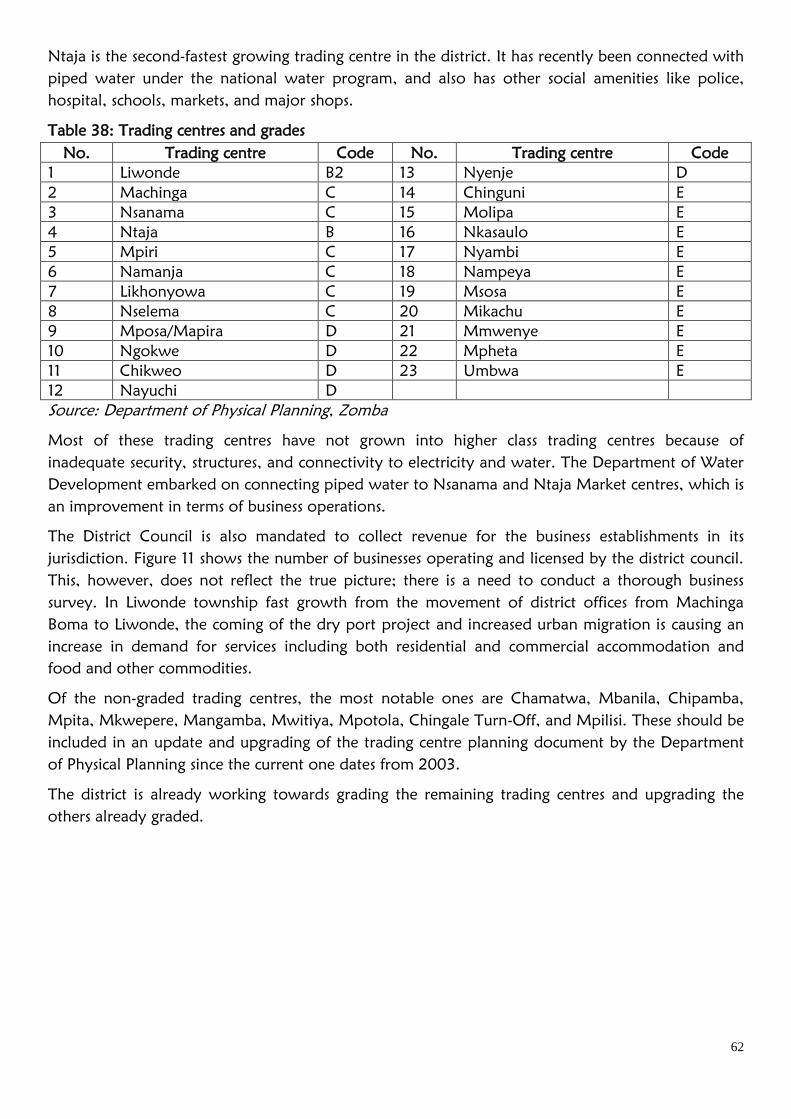
62
Ntaja is the second-fastest growing trading centre in the district. It has recently been connected with
piped water under the national water program, and also has other social amenities like police,
hospital, schools, markets, and major shops.
Table 38: Trading centres and grades
No. Trading centre Code No. Trading centre Code
1 Liwonde B2 13 Nyenje D
2 Machinga C 14 Chinguni E
3 Nsanama C 15 Molipa E
4 Ntaja B 16 Nkasaulo E
5 Mpiri C 17 Nyambi E
6 Namanja C 18 Nampeya E
7 Likhonyowa C 19 Msosa E
8 Nselema C 20 Mikachu E
9 Mposa/Mapira D 21 Mmwenye E
10 Ngokwe D 22 Mpheta E
11 Chikweo D 23 Umbwa E
12 Nayuchi D
Source: Department of Physical Planning, Zomba
Most of these trading centres have not grown into higher class trading centres because of
inadequate security, structures, and connectivity to electricity and water. The Department of Water
Development embarked on connecting piped water to Nsanama and Ntaja Market centres, which is
an improvement in terms of business operations.
The District Council is also mandated to collect revenue for the business establishments in its
jurisdiction. Figure 11 shows the number of businesses operating and licensed by the district council.
This, however, does not reflect the true picture; there is a need to conduct a thorough business
survey. In Liwonde township fast growth from the movement of district offices from Machinga
Boma to Liwonde, the coming of the dry port project and increased urban migration is causing an
increase in demand for services including both residential and commercial accommodation and
food and other commodities.
Of the non-graded trading centres, the most notable ones are Chamatwa, Mbanila, Chipamba,
Mpita, Mkwepere, Mangamba, Mwitiya, Mpotola, Chingale Turn-Off, and Mpilisi. These should be
included in an update and upgrading of the trading centre planning document by the Department
of Physical Planning since the current one dates from 2003.
The district is already working towards grading the remaining trading centres and upgrading the
others already graded.
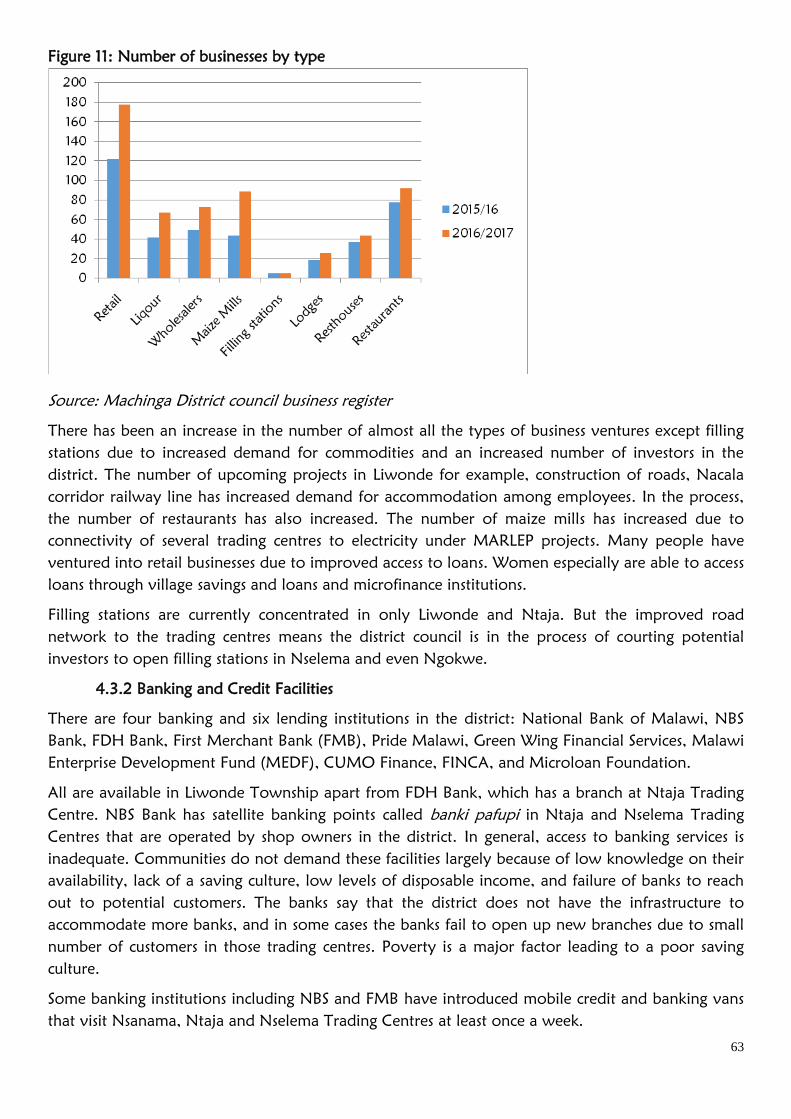
63
Figure 11: Number of businesses by type
Source: Machinga District council business register
There has been an increase in the number of almost all the types of business ventures except filling
stations due to increased demand for commodities and an increased number of investors in the
district. The number of upcoming projects in Liwonde for example, construction of roads, Nacala
corridor railway line has increased demand for accommodation among employees. In the process,
the number of restaurants has also increased. The number of maize mills has increased due to
connectivity of several trading centres to electricity under MARLEP projects. Many people have
ventured into retail businesses due to improved access to loans. Women especially are able to access
loans through village savings and loans and microfinance institutions.
Filling stations are currently concentrated in only Liwonde and Ntaja. But the improved road
network to the trading centres means the district council is in the process of courting potential
investors to open filling stations in Nselema and even Ngokwe.
4.3.2 Banking and Credit Facilities
There are four banking and six lending institutions in the district: National Bank of Malawi, NBS
Bank, FDH Bank, First Merchant Bank (FMB), Pride Malawi, Green Wing Financial Services, Malawi
Enterprise Development Fund (MEDF), CUMO Finance, FINCA, and Microloan Foundation.
All are available in Liwonde Township apart from FDH Bank, which has a branch at Ntaja Trading
Centre. NBS Bank has satellite banking points called banki pafupi in Ntaja and Nselema Trading
Centres that are operated by shop owners in the district. In general, access to banking services is
inadequate. Communities do not demand these facilities largely because of low knowledge on their
availability, lack of a saving culture, low levels of disposable income, and failure of banks to reach
out to potential customers. The banks say that the district does not have the infrastructure to
accommodate more banks, and in some cases the banks fail to open up new branches due to small
number of customers in those trading centres. Poverty is a major factor leading to a poor saving
culture.
Some banking institutions including NBS and FMB have introduced mobile credit and banking vans
that visit Nsanama, Ntaja and Nselema Trading Centres at least once a week.
64
Some people do not patronize banks because access to loans is very limited. Most of the
commercial banks offer loans to both the formal and informal employment sector. For commercial
banks, the base lending rate is 30.5%, while for micro-finance institutions, it is 38%.
Apart from these formal banking and lending institutions, there are several village banks that are
organized by the community members themselves. This Village Savings and Loan initiative is being
spearheaded by government and NGOs through the Community Development Office under
COMSIP. The loans given or accessed from the village banks have interest rates ranging from 10%
to 30%, and are available to members only. Data shows that these loans are accessed mostly by
women, who use them to run small-scale businesses. Farmers access loans from MEDF at 15%.They
do not use the banks because of lack of collateral or because they are not organised as cooperatives
or associations.
4.3.3Business Promotion Services
Business advisory, promotion and training services are provided by both private and public
institutions such as MACOHA, Ministry of Labour, Ministry of Gender and Children and Social
Welfare, Ministry of Industry and Trade, and Ministry of Agriculture and Food Security. These
institutions offer different services in the promotion of businesses in the district, including business
idea generation, group formation, value addition, provision of processing machines, market
linkages, product packaging and quality control, technical skills development, and cooperative
member education/management.
There are many small and medium enterprises (SMEs) in the district but only a few are formally
registered by the government. Currently the district has a total of 19 registered farmer’s
cooperatives and 7 farmers' associations. Support is needed for the provision of business advisory
services to these SMEs as the development of these organisations will facilitate growth in per capita
income, access to markets, business performance, access to foreign exchange and employment.
Realising the importance of the MSME sector in improving the productive base of the economy
through value addition and job creation, the district has embarked on some efforts in supporting
these SMEs in value addition and market linkages. Currently, the district has two One Village One
Product (OVOP) projects: Likhomo Beekeeping and Honey Processors Cooperative Society and
Zumulu Rice Milling, Packaging and Marketing Cooperative Society.
There are 19 registered cooperatives in the district, but only 9are functional. Sometimes farmers are
not committed to running cooperatives. Other cooperatives are established by projects and lack
proper handover to the relevant government sector (Trade and Industry).Support is needed to
build the capacity of the cooperatives to make them vibrant.
Cooperatives are supposed to be supervised by the district trade officer on monthly basis, but
resource limitations means that this does not always happen. The district currently receives monthly
average funding of MK240, 000 to monitor and build the capacity of the cooperatives. The
required amount is about MK1, 000,000. It is therefore important that government consider
increasing this allocation.
It has been shown that farmers with value addition equipment have a comparative advantage over
those without s as they are able to fetch better prices on the market as well producing quality value-
added products. Value addition facilities in the district are still a challenge since only seven groups
have them and demand is increasing. Farmers are, however, accessing these facilities through other
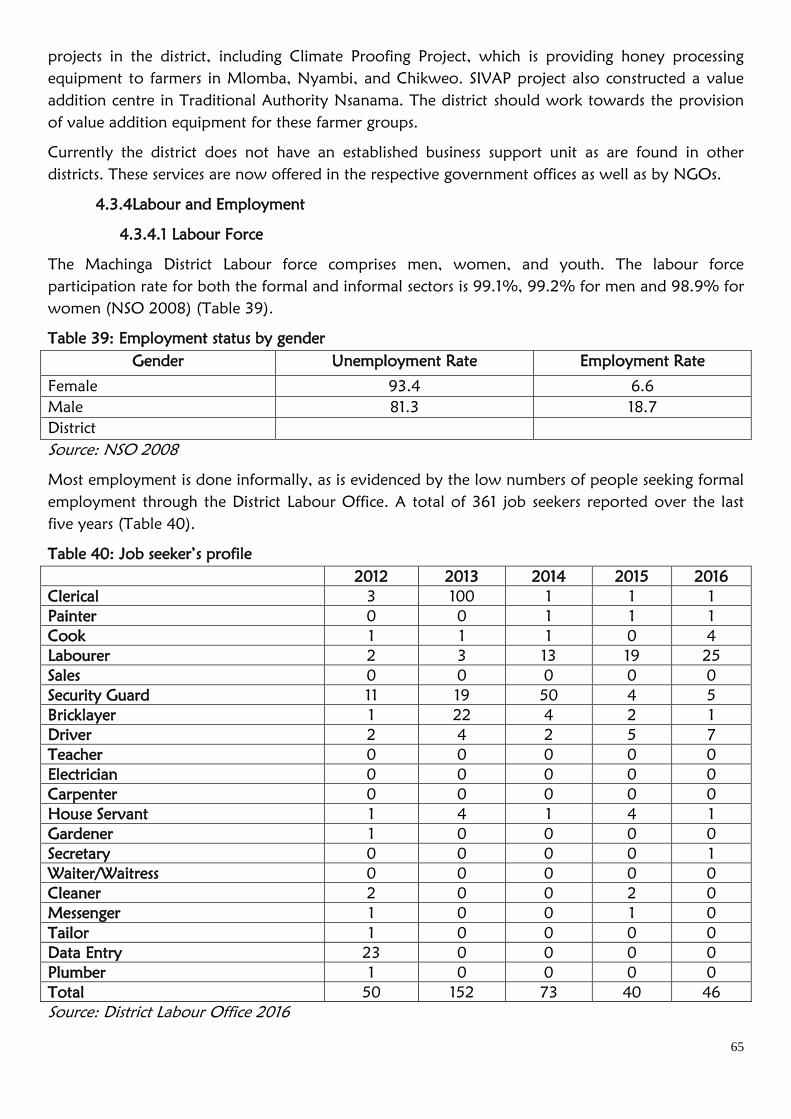
65
projects in the district, including Climate Proofing Project, which is providing honey processing
equipment to farmers in Mlomba, Nyambi, and Chikweo. SIVAP project also constructed a value
addition centre in Traditional Authority Nsanama. The district should work towards the provision
of value addition equipment for these farmer groups.
Currently the district does not have an established business support unit as are found in other
districts. These services are now offered in the respective government offices as well as by NGOs.
4.3.4Labour and Employment
4.3.4.1 Labour Force
The Machinga District Labour force comprises men, women, and youth. The labour force
participation rate for both the formal and informal sectors is 99.1%, 99.2% for men and 98.9% for
women (NSO 2008) (Table 39).
Table 39: Employment status by gender
Gender Unemployment Rate Employment Rate
Female 93.4 6.6
Male 81.3 18.7
District
Source: NSO 2008
Most employment is done informally, as is evidenced by the low numbers of people seeking formal
employment through the District Labour Office. A total of 361 job seekers reported over the last
five years (Table 40).
Table 40: Job seeker’s profile
2012 2013 2014 2015 2016
Clerical 3 100 1 1 1
Painter 0 0 1 1 1
Cook 1 1 1 0 4
Labourer 2 3 13 19 25
Sales 0 0 0 0 0
Security Guard 11 19 50 4 5
Bricklayer 1 22 4 2 1
Driver 2 4 2 5 7
Teacher 0 0 0 0 0
Electrician 0 0 0 0 0
Carpenter 0 0 0 0 0
House Servant 1 4 1 4 1
Gardener 1 0 0 0 0
Secretary 0 0 0 0 1
Waiter/Waitress 0 0 0 0 0
Cleaner 2 0 0 2 0
Messenger 1 0 0 1 0
Tailor 1 0 0 0 0
Data Entry 23 0 0 0 0
Plumber 1 0 0 0 0
Total 50 152 73 40 46
Source: District Labour Office 2016
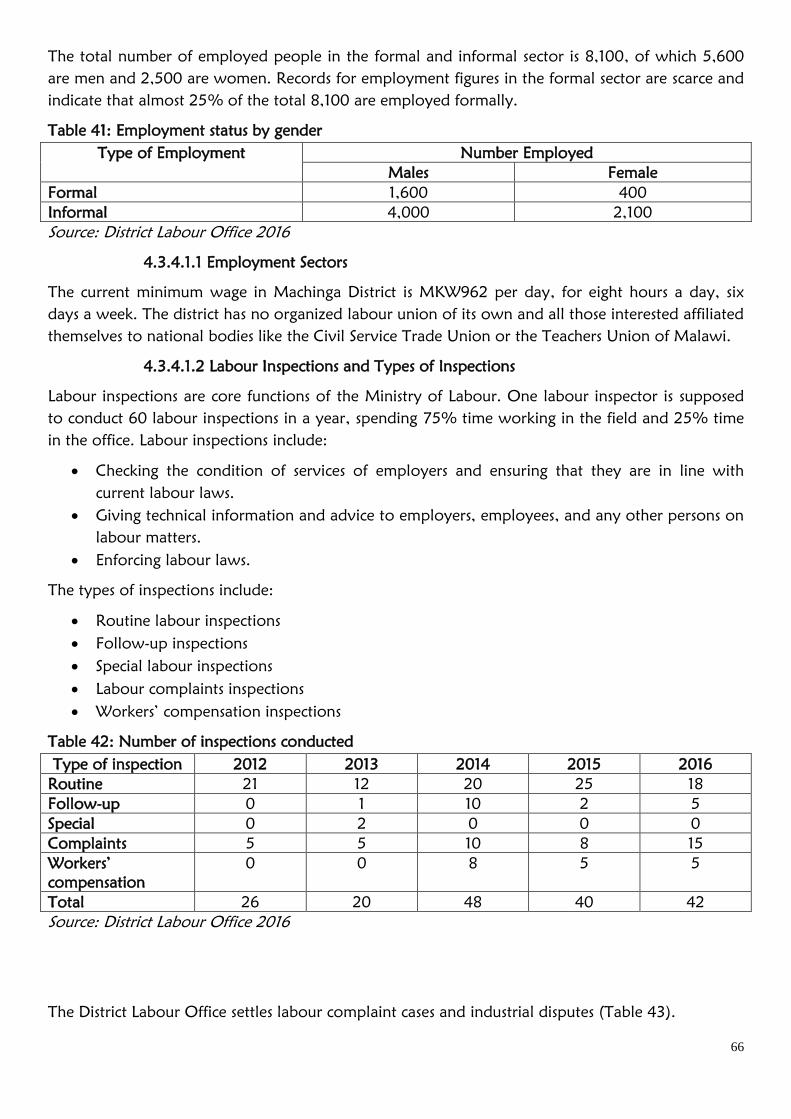
66
The total number of employed people in the formal and informal sector is 8,100, of which 5,600
are men and 2,500 are women. Records for employment figures in the formal sector are scarce and
indicate that almost 25% of the total 8,100 are employed formally.
Table 41: Employment status by gender
Type of Employment Number Employed
Males Female
Formal 1,600 400
Informal 4,000 2,100
Source: District Labour Office 2016
4.3.4.1.1 Employment Sectors
The current minimum wage in Machinga District is MKW962 per day, for eight hours a day, six
days a week. The district has no organized labour union of its own and all those interested affiliated
themselves to national bodies like the Civil Service Trade Union or the Teachers Union of Malawi.
4.3.4.1.2 Labour Inspections and Types of Inspections
Labour inspections are core functions of the Ministry of Labour. One labour inspector is supposed
to conduct 60 labour inspections in a year, spending 75% time working in the field and 25% time
in the office. Labour inspections include:
Checking the condition of services of employers and ensuring that they are in line with
current labour laws.
Giving technical information and advice to employers, employees, and any other persons on
labour matters.
Enforcing labour laws.
The types of inspections include:
Routine labour inspections
Follow-up inspections
Special labour inspections
Labour complaints inspections
Workers’ compensation inspections
Table 42: Number of inspections conducted
Type of inspection 2012 2013 2014 2015 2016
Routine 21 12 20 25 18
Follow-up 0 1 10 2 5
Special 0 2 0 0 0
Complaints 5 5 10 8 15
Workers’
compensation
0 0 8 5 5
Total 26 20 48 40 42
Source: District Labour Office 2016
The District Labour Office settles labour complaint cases and industrial disputes (Table 43).
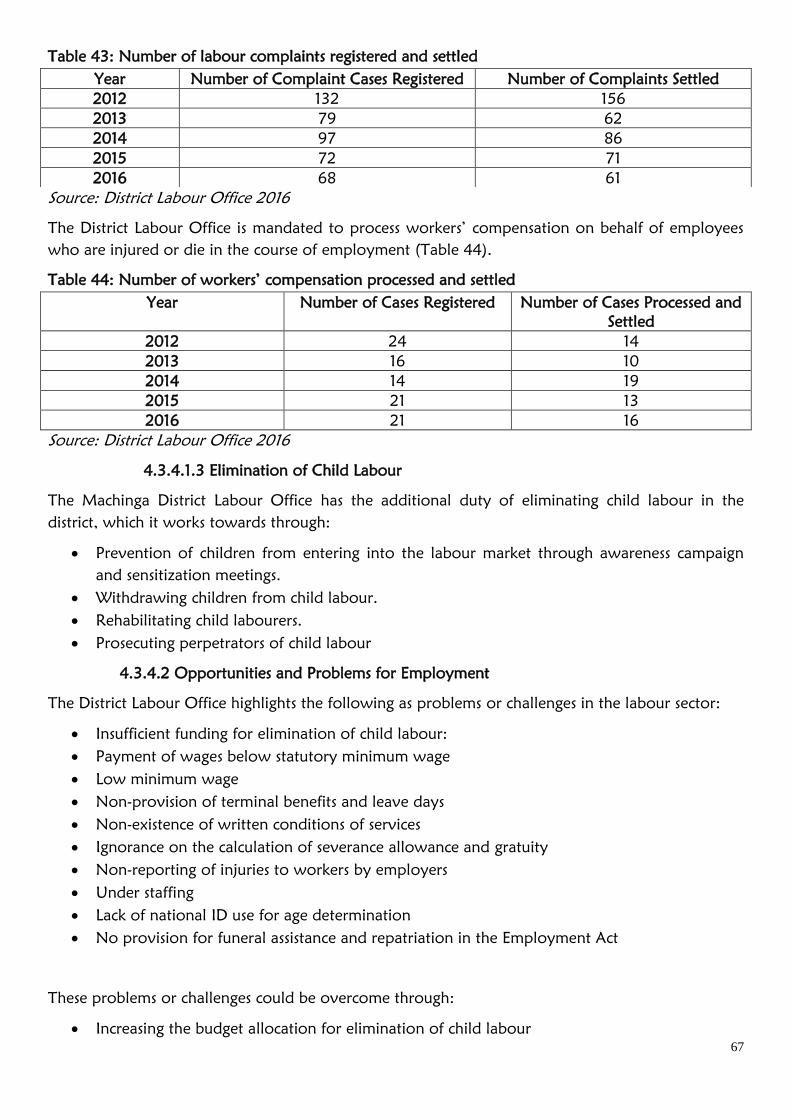
67
Table 43: Number of labour complaints registered and settled
Source: District Labour Office 2016
The District Labour Office is mandated to process workers’ compensation on behalf of employees
who are injured or die in the course of employment (Table 44).
Table 44: Number of workers’ compensation processed and settled
Year Number of Cases Registered Number of Cases Processed and
Settled
2012 24 14
2013 16 10
2014 14 19
2015 21 13
2016 21 16
Source: District Labour Office 2016
4.3.4.1.3 Elimination of Child Labour
The Machinga District Labour Office has the additional duty of eliminating child labour in the
district, which it works towards through:
Prevention of children from entering into the labour market through awareness campaign
and sensitization meetings.
Withdrawing children from child labour.
Rehabilitating child labourers.
Prosecuting perpetrators of child labour
4.3.4.2 Opportunities and Problems for Employment
The District Labour Office highlights the following as problems or challenges in the labour sector:
Insufficient funding for elimination of child labour:
Payment of wages below statutory minimum wage
Low minimum wage
Non-provision of terminal benefits and leave days
Non-existence of written conditions of services
Ignorance on the calculation of severance allowance and gratuity
Non-reporting of injuries to workers by employers
Under staffing
Lack of national ID use for age determination
No provision for funeral assistance and repatriation in the Employment Act
These problems or challenges could be overcome through:
Increasing the budget allocation for elimination of child labour
Year Number of Complaint Cases Registered Number of Complaints Settled
2012 132 156
2013 79 62
2014 97 86
2015 72 71
2016 68 61
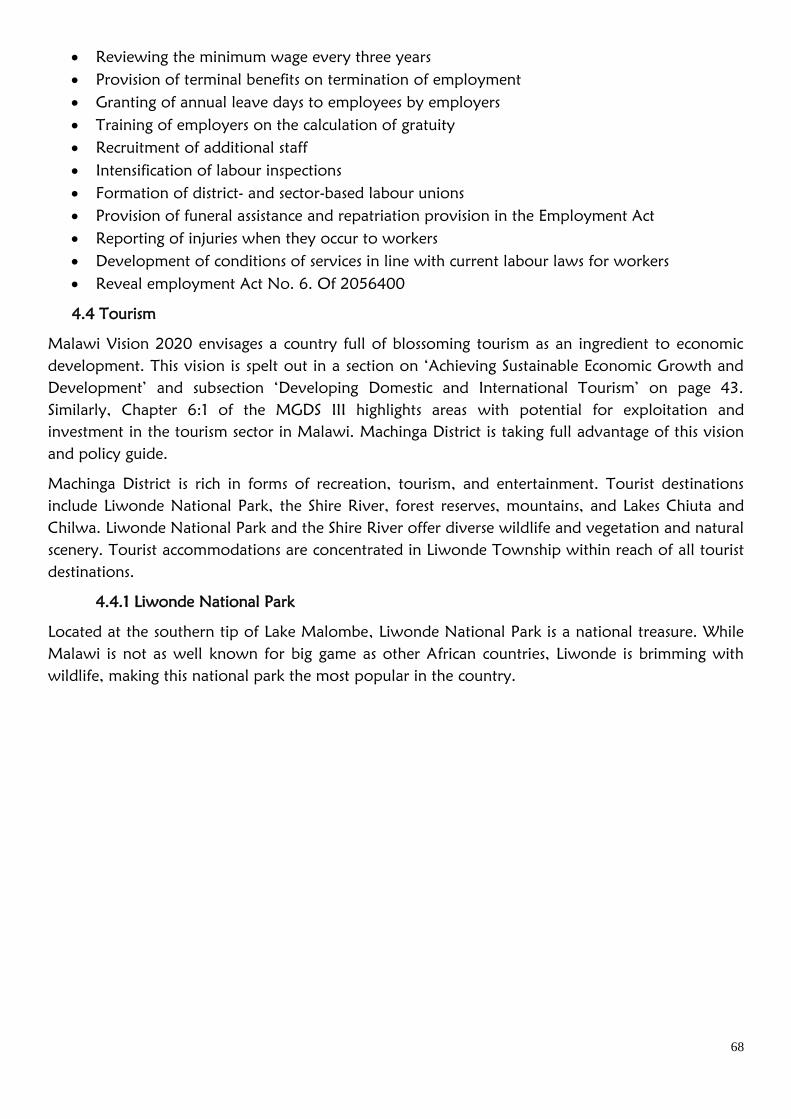
68
Reviewing the minimum wage every three years
Provision of terminal benefits on termination of employment
Granting of annual leave days to employees by employers
Training of employers on the calculation of gratuity
Recruitment of additional staff
Intensification of labour inspections
Formation of district- and sector-based labour unions
Provision of funeral assistance and repatriation provision in the Employment Act
Reporting of injuries when they occur to workers
Development of conditions of services in line with current labour laws for workers
Reveal employment Act No. 6. Of 2056400
4.4 Tourism
Malawi Vision 2020 envisages a country full of blossoming tourism as an ingredient to economic
development. This vision is spelt out in a section on ‘Achieving Sustainable Economic Growth and
Development’ and subsection ‘Developing Domestic and International Tourism’ on page 43.
Similarly, Chapter 6:1 of the MGDS III highlights areas with potential for exploitation and
investment in the tourism sector in Malawi. Machinga District is taking full advantage of this vision
and policy guide.
Machinga District is rich in forms of recreation, tourism, and entertainment. Tourist destinations
include Liwonde National Park, the Shire River, forest reserves, mountains, and Lakes Chiuta and
Chilwa. Liwonde National Park and the Shire River offer diverse wildlife and vegetation and natural
scenery. Tourist accommodations are concentrated in Liwonde Township within reach of all tourist
destinations.
4.4.1 Liwonde National Park
Located at the southern tip of Lake Malombe, Liwonde National Park is a national treasure. While
Malawi is not as well known for big game as other African countries, Liwonde is brimming with
wildlife, making this national park the most popular in the country.
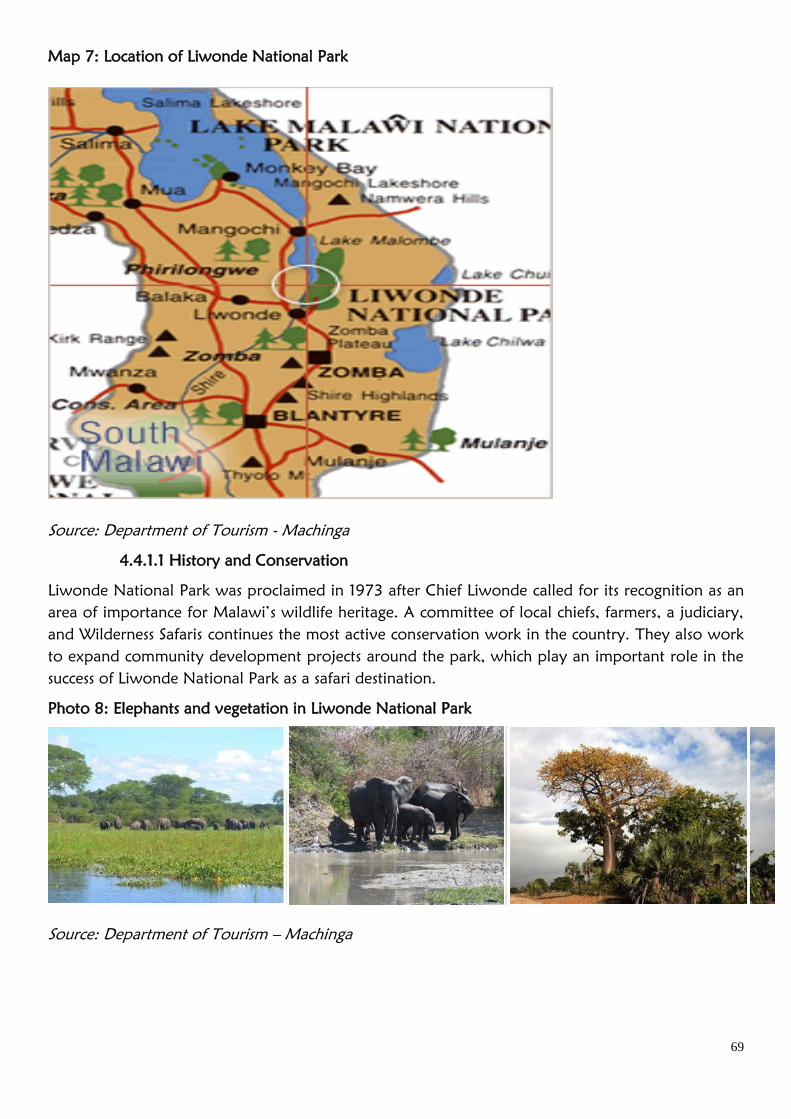
69
Map 7: Location of Liwonde National Park
Source: Department of Tourism - Machinga
4.4.1.1 History and Conservation
Liwonde National Park was proclaimed in 1973 after Chief Liwonde called for its recognition as an
area of importance for Malawi’s wildlife heritage. A committee of local chiefs, farmers, a judiciary,
and Wilderness Safaris continues the most active conservation work in the country. They also work
to expand community development projects around the park, which play an important role in the
success of Liwonde National Park as a safari destination.
Photo 8: Elephants and vegetation in Liwonde National Park
Source: Department of Tourism – Machinga
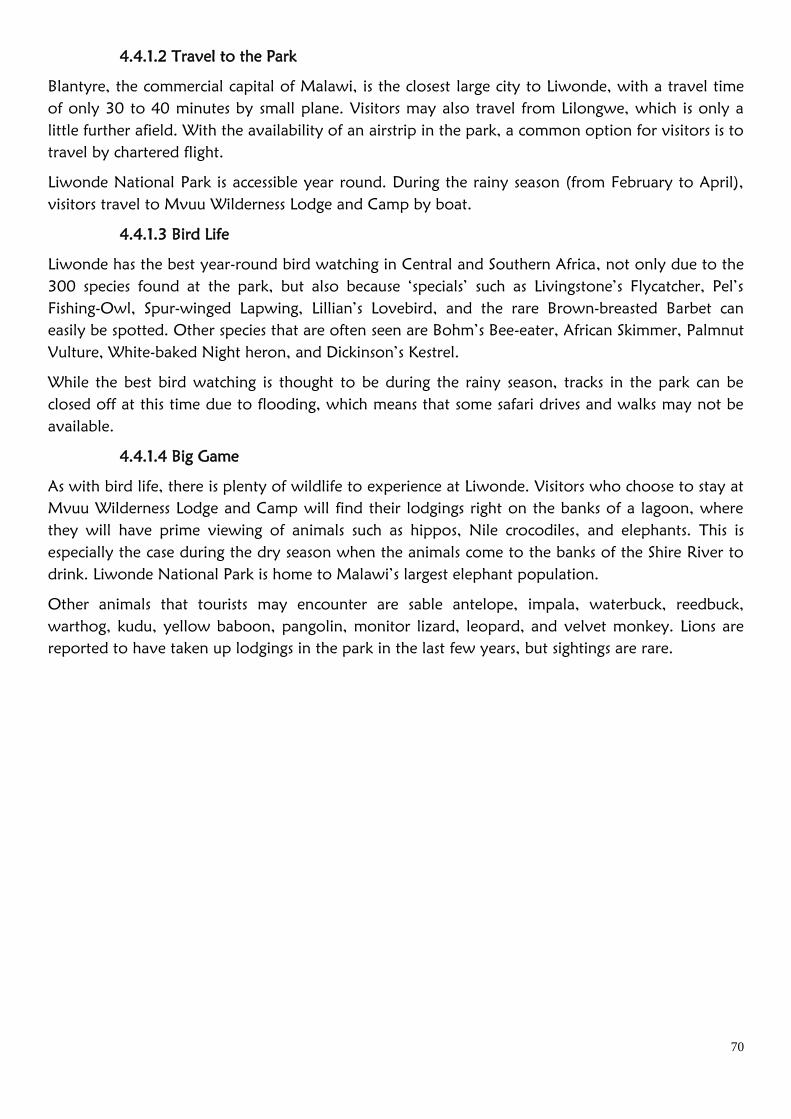
70
4.4.1.2 Travel to the Park
Blantyre, the commercial capital of Malawi, is the closest large city to Liwonde, with a travel time
of only 30 to 40 minutes by small plane. Visitors may also travel from Lilongwe, which is only a
little further afield. With the availability of an airstrip in the park, a common option for visitors is to
travel by chartered flight.
Liwonde National Park is accessible year round. During the rainy season (from February to April),
visitors travel to Mvuu Wilderness Lodge and Camp by boat.
4.4.1.3 Bird Life
Liwonde has the best year-round bird watching in Central and Southern Africa, not only due to the
300 species found at the park, but also because ‘specials’ such as Livingstone’s Flycatcher, Pel’s
Fishing-Owl, Spur-winged Lapwing, Lillian’s Lovebird, and the rare Brown-breasted Barbet can
easily be spotted. Other species that are often seen are Bohm’s Bee-eater, African Skimmer, Palmnut
Vulture, White-baked Night heron, and Dickinson’s Kestrel.
While the best bird watching is thought to be during the rainy season, tracks in the park can be
closed off at this time due to flooding, which means that some safari drives and walks may not be
available.
4.4.1.4 Big Game
As with bird life, there is plenty of wildlife to experience at Liwonde. Visitors who choose to stay at
Mvuu Wilderness Lodge and Camp will find their lodgings right on the banks of a lagoon, where
they will have prime viewing of animals such as hippos, Nile crocodiles, and elephants. This is
especially the case during the dry season when the animals come to the banks of the Shire River to
drink. Liwonde National Park is home to Malawi’s largest elephant population.
Other animals that tourists may encounter are sable antelope, impala, waterbuck, reedbuck,
warthog, kudu, yellow baboon, pangolin, monitor lizard, leopard, and velvet monkey. Lions are
reported to have taken up lodgings in the park in the last few years, but sightings are rare.
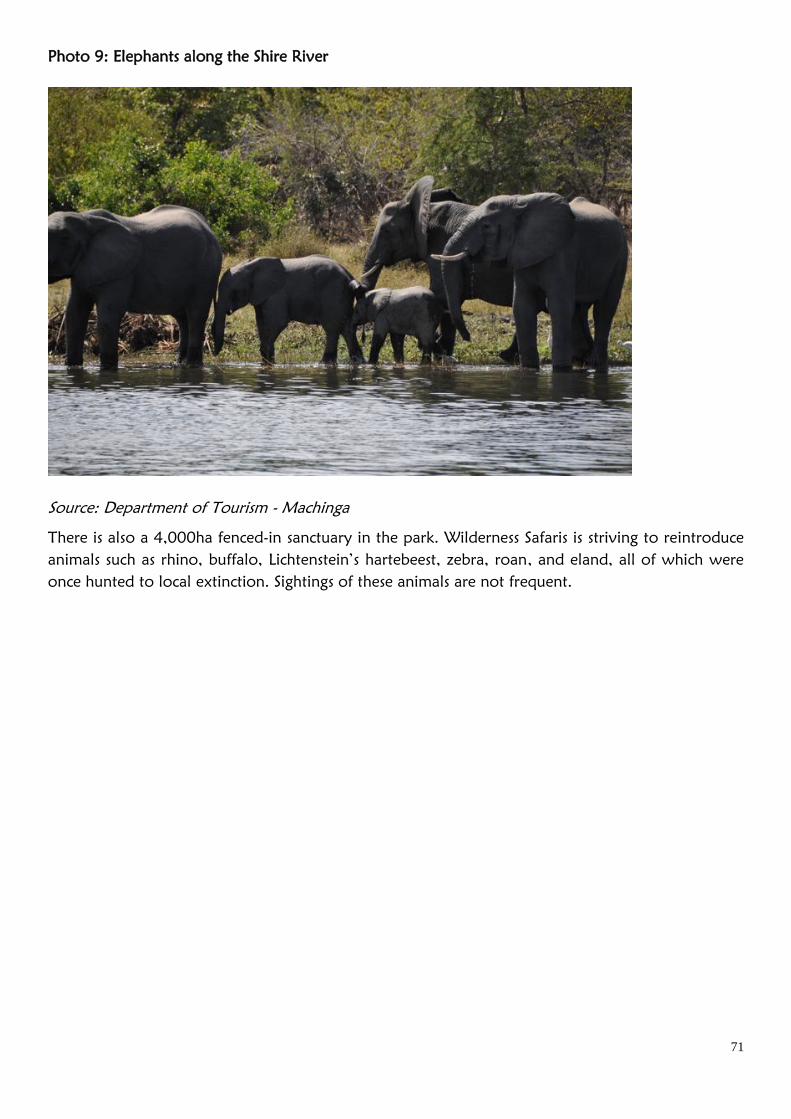
71
Photo 9: Elephants along the Shire River
Source: Department of Tourism - Machinga
There is also a 4,000ha fenced-in sanctuary in the park. Wilderness Safaris is striving to reintroduce
animals such as rhino, buffalo, Lichtenstein’s hartebeest, zebra, roan, and eland, all of which were
once hunted to local extinction. Sightings of these animals are not frequent.

72
Photo 10: Liwonde landscape
Source: Department of Tourism - Machinga
4.4.1.5 Landscape
The landscape of Liwonde is highly diverse, with dry Mopani woodlands covering the eastern half
of the park interspersed with Candelabra trees (euphorbia). Areas of Miombo woodland can be
found on a few hill slopes in the south and east, while palm savannah and baobabs are found on
the extensive floodplains of the river, which have a more tropical feel due to the dense vegetation
along the riverbanks.
4.4.1.6 The People
Five hundred people benefit financially from the Wilderness Safari Lodge and Camp in Liwonde
National Park through employment and education for the local people, as well as conservation
efforts in and around the park.
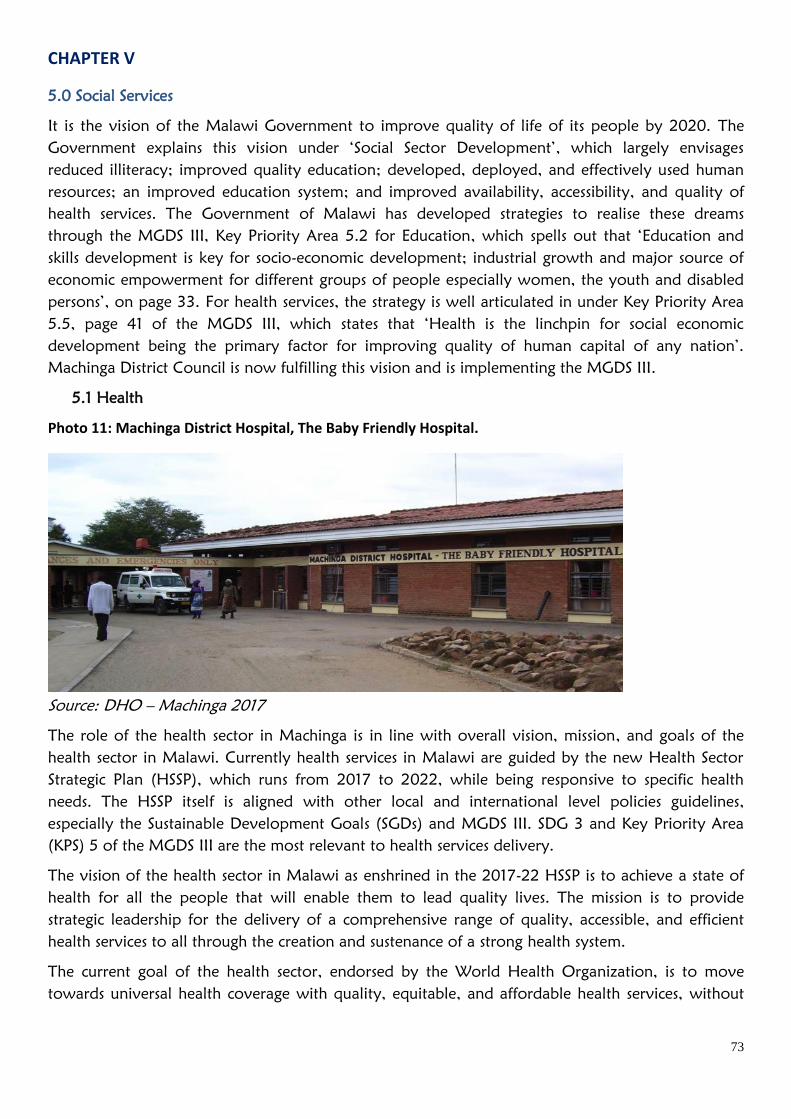
73
CHAPTER V
5.0 Social Services
It is the vision of the Malawi Government to improve quality of life of its people by 2020. The
Government explains this vision under ‘Social Sector Development’, which largely envisages
reduced illiteracy; improved quality education; developed, deployed, and effectively used human
resources; an improved education system; and improved availability, accessibility, and quality of
health services. The Government of Malawi has developed strategies to realise these dreams
through the MGDS III, Key Priority Area 5.2 for Education, which spells out that ‘Education and
skills development is key for socio-economic development; industrial growth and major source of
economic empowerment for different groups of people especially women, the youth and disabled
persons’, on page 33. For health services, the strategy is well articulated in under Key Priority Area
5.5, page 41 of the MGDS III, which states that ‘Health is the linchpin for social economic
development being the primary factor for improving quality of human capital of any nation’.
Machinga District Council is now fulfilling this vision and is implementing the MGDS III.
5.1 Health
Photo 11: Machinga District Hospital, The Baby Friendly Hospital.
Source: DHO – Machinga 2017
The role of the health sector in Machinga is in line with overall vision, mission, and goals of the
health sector in Malawi. Currently health services in Malawi are guided by the new Health Sector
Strategic Plan (HSSP), which runs from 2017 to 2022, while being responsive to specific health
needs. The HSSP itself is aligned with other local and international level policies guidelines,
especially the Sustainable Development Goals (SGDs) and MGDS III. SDG 3 and Key Priority Area
(KPS) 5 of the MGDS III are the most relevant to health services delivery.
The vision of the health sector in Malawi as enshrined in the 2017-22 HSSP is to achieve a state of
health for all the people that will enable them to lead quality lives. The mission is to provide
strategic leadership for the delivery of a comprehensive range of quality, accessible, and efficient
health services to all through the creation and sustenance of a strong health system.
The current goal of the health sector, endorsed by the World Health Organization, is to move
towards universal health coverage with quality, equitable, and affordable health services, without
74
discrimination, and available to all irrespective of social economic status, distance to health facilities,
age, sex, or tribe.
Machinga District Health Office develops annual implementation plans to guide delivery of health
services in line with the HSSP. The community needs are factored into the plans through their
participation, along with local leaders, during the planning and review meetings.
5.1.1 Health Services
5.1.1.1 Type of Health Services Offered in Machinga
All health facilities in the district have outpatient services, and the district hospital has admission
services. In addition to these curative health services, programs also provide specific curative and
preventive health services:
Maternal and child health services such as antenatal, child nutrition screening and treatment,
immunization
HIV/AIDS services such as anti-retroviral viral treatment, prevention of mother-to-child
transmission
Youth-friendly health services
Environmental health services such as water and sanitation, food safety and hygiene, disease
surveillance and control, disaster management, health care waste management, occupational
health and safety, and port health services
Health promotion and behaviour change
Disease control programs for Malaria, Schistosomiasis, and TB
Palliative and home-based care
School health and nutrition
Infection prevention
Baby-friendly health initiatives
Voluntary medical male circumcision
5.1.1.2 Target Population for Health Services in Machinga
The population of Machinga District is estimated at 647,401, and is projected to rise to 760,547 by
2022. Since various age groups and age categories have specific health needs, the population is
further broken down (Table 45).
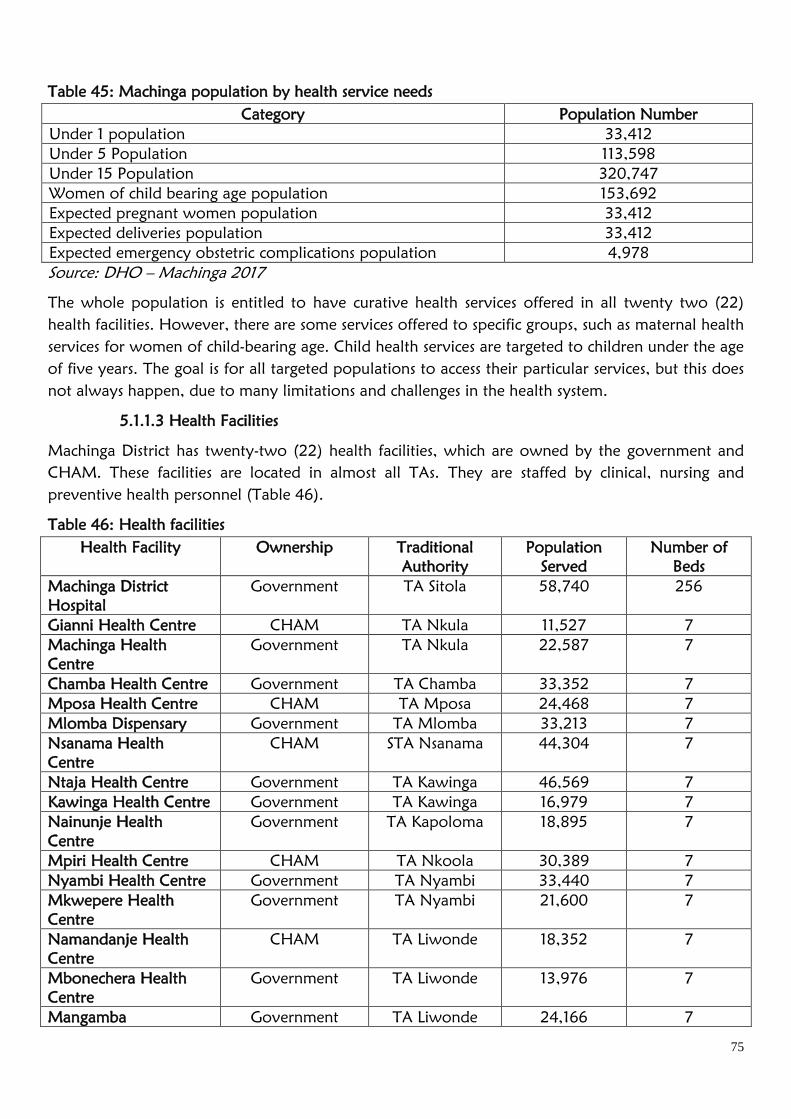
75
Table 45: Machinga population by health service needs
Category Population Number
Under 1 population 33,412
Under 5 Population 113,598
Under 15 Population 320,747
Women of child bearing age population 153,692
Expected pregnant women population 33,412
Expected deliveries population 33,412
Expected emergency obstetric complications population 4,978
Source: DHO – Machinga 2017
The whole population is entitled to have curative health services offered in all twenty two (22)
health facilities. However, there are some services offered to specific groups, such as maternal health
services for women of child-bearing age. Child health services are targeted to children under the age
of five years. The goal is for all targeted populations to access their particular services, but this does
not always happen, due to many limitations and challenges in the health system.
5.1.1.3 Health Facilities
Machinga District has twenty-two (22) health facilities, which are owned by the government and
CHAM. These facilities are located in almost all TAs. They are staffed by clinical, nursing and
preventive health personnel (Table 46).
Table 46: Health facilities
Health Facility Ownership Traditional
Authority
Population
Served
Number of
Beds
Machinga District
Hospital
Government TA Sitola 58,740 256
Gianni Health Centre CHAM TA Nkula 11,527 7
Machinga Health
Centre
Government TA Nkula 22,587 7
Chamba Health Centre Government TA Chamba 33,352 7
Mposa Health Centre CHAM TA Mposa 24,468 7
Mlomba Dispensary Government TA Mlomba 33,213 7
Nsanama Health
Centre
CHAM STA Nsanama 44,304 7
Ntaja Health Centre Government TA Kawinga 46,569 7
Kawinga Health Centre Government TA Kawinga 16,979 7
Nainunje Health
Centre
Government TA Kapoloma 18,895 7
Mpiri Health Centre CHAM TA Nkoola 30,389 7
Nyambi Health Centre Government TA Nyambi 33,440 7
Mkwepere Health
Centre
Government TA Nyambi 21,600 7
Namandanje Health
Centre
CHAM TA Liwonde 18,352 7
Mbonechera Health
Centre
Government TA Liwonde 13,976 7
Mangamba Government TA Liwonde 24,166 7

76
Health Facility Ownership Traditional
Authority
Population
Served
Number of
Beds
Nayuchi Health Centre Government TA Nchinguza 20,539 7
Namanja Health
Centre
Government TA Nchinguza 36,607 7
Ntholowa Health
Centre
CHAM TA Kawinga 13,397 7
Chikweo Health Centre Government TA Chikweo 86,528 7
Ngokwe Health Centre Government TA Ngokwe 37,354 7
Chaone Health Centre CHAM TA Mposa 90,087 7
Source: DHO – Machinga 2017
Machinga District has only one secondary health facility, located in Liwonde Town. This means the
district hospital receives many referrals from health centers, which affects the quality of health
service delivery. If the district couldhave a rural health centre at Ntaja Trading Centre, some of the
referrals couldbe handled there, improving quality and access to health services.
Health policy provides for at least onehealth facility for a population of 10,000. With the current
population of Machinga at 647,401, the district should have at least sixty (60) health facilities
instead of twenty-two (22). This has led to congestion and long distances to reach health facilities.
For instance, Chikweo catchment area has a population of about 86,000 but only one health
centre.
5.1.1.4 Health Workers Staffing Levels
The district requires various cadres of health workers to effectively deliver health services. When
health workers are few, those available are overworked and quality of health services suffers.
Table 47: Health workers staffing levels
Cadre Requirement Available Shortfall
HSAs 668 (1/1000) 341 327
MA/Clinical Officers 70 46 24
Nurses 376 89 287
Doctors 10 2 8
Source: DHO – Machinga 2017 Annual Report
The current staffing levels show that the district has a critical shortage of health workers. Almost all
health centers have one medical assistant (MA) except Chikweo and Ntaja, which have two MAs
and seven nurses. Most health centers have an average of only two nurses. This means that the
district cannot effectively deliver health services, and that the available health workers are
completely overworked. There is a need to recruit more health workers as established in the
Machinga Establishment Warranty.
5.1.2 Machinga Health Status
5.1.2.1 Leading Causes of Sickness and Deaths
The primary aim of health services is to reduce morbidity (sickness) and mortality in the general
population. The leading cause of morbidity is malaria followed by acute respiratory infections (ARI)
and diarrhea. These diseases are also the leading causes of the high mortality rate. Malaria leads to
several complications such as anemia, low birth weight in babies, stillbirths, and malnutrition.
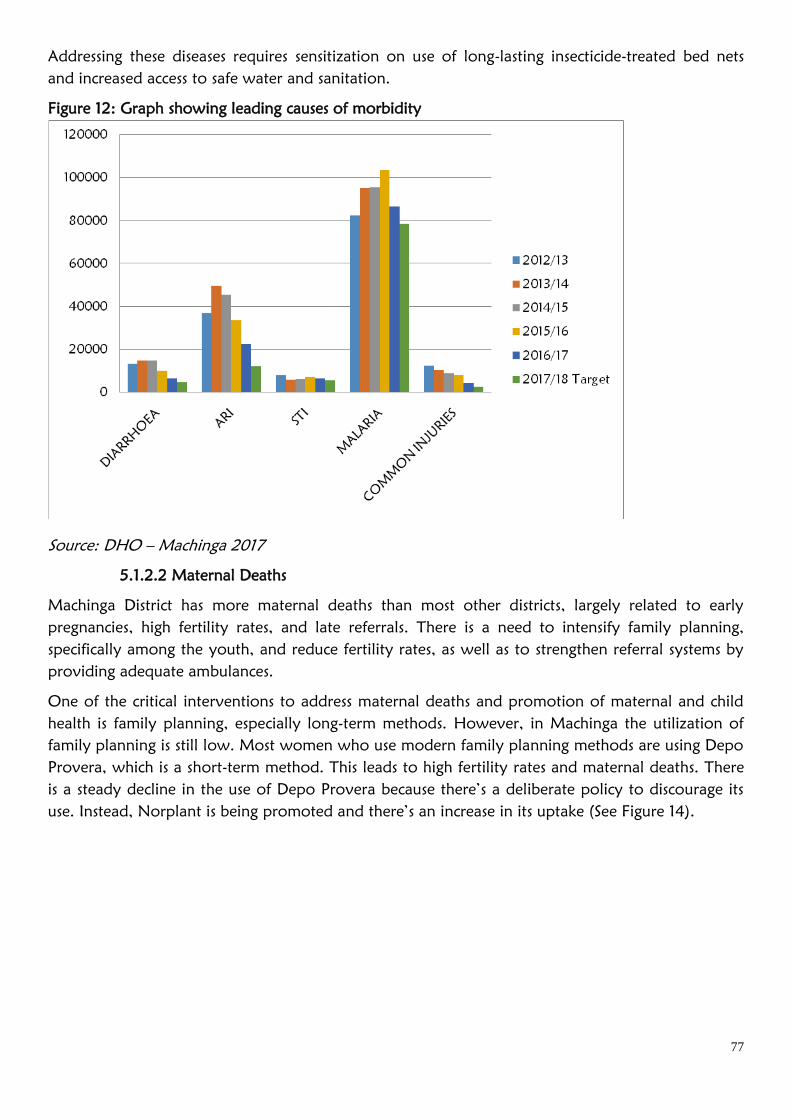
77
Addressing these diseases requires sensitization on use of long-lasting insecticide-treated bed nets
and increased access to safe water and sanitation.
Figure 12: Graph showing leading causes of morbidity
Source: DHO – Machinga 2017
5.1.2.2 Maternal Deaths
Machinga District has more maternal deaths than most other districts, largely related to early
pregnancies, high fertility rates, and late referrals. There is a need to intensify family planning,
specifically among the youth, and reduce fertility rates, as well as to strengthen referral systems by
providing adequate ambulances.
One of the critical interventions to address maternal deaths and promotion of maternal and child
health is family planning, especially long-term methods. However, in Machinga the utilization of
family planning is still low. Most women who use modern family planning methods are using Depo
Provera, which is a short-term method. This leads to high fertility rates and maternal deaths. There
is a steady decline in the use of Depo Provera because there’s a deliberate policy to discourage its
use. Instead, Norplant is being promoted and there’s an increase in its uptake (See Figure 14).
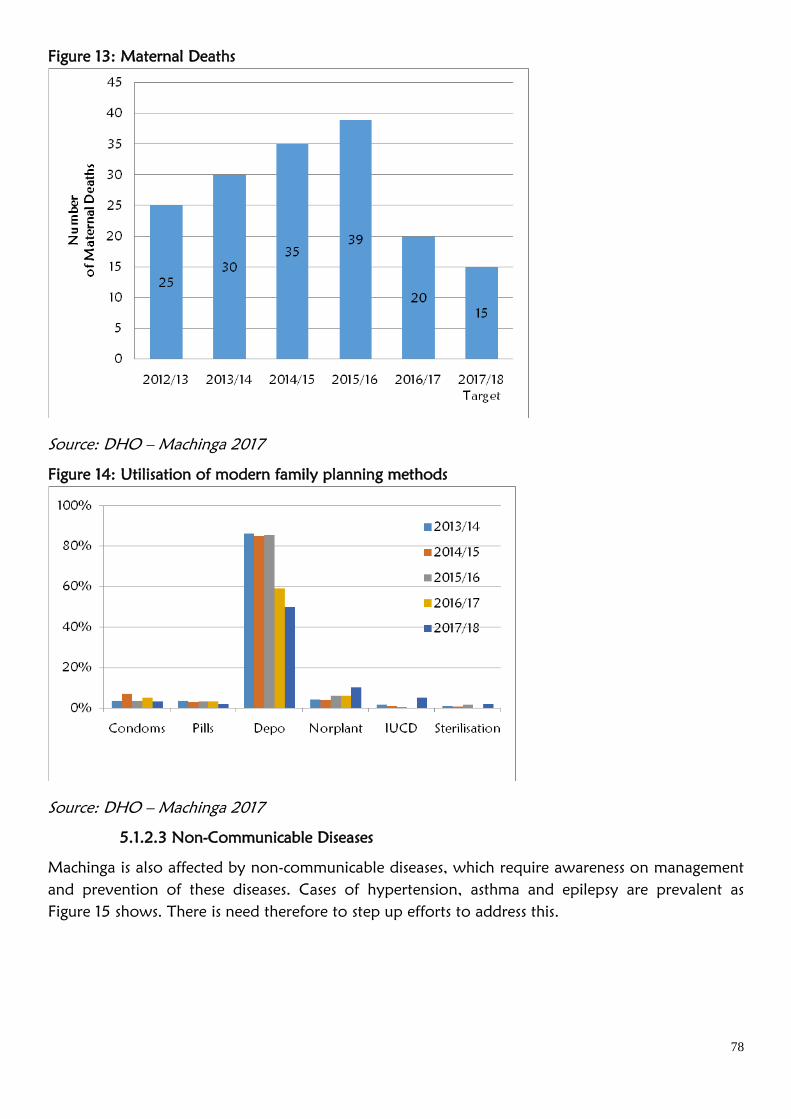
78
Figure 13: Maternal Deaths
Source: DHO – Machinga 2017
Figure 14: Utilisation of modern family planning methods
Source: DHO – Machinga 2017
5.1.2.3 Non-Communicable Diseases
Machinga is also affected by non-communicable diseases, which require awareness on management
and prevention of these diseases. Cases of hypertension, asthma and epilepsy are prevalent as
Figure 15 shows. There is need therefore to step up efforts to address this.
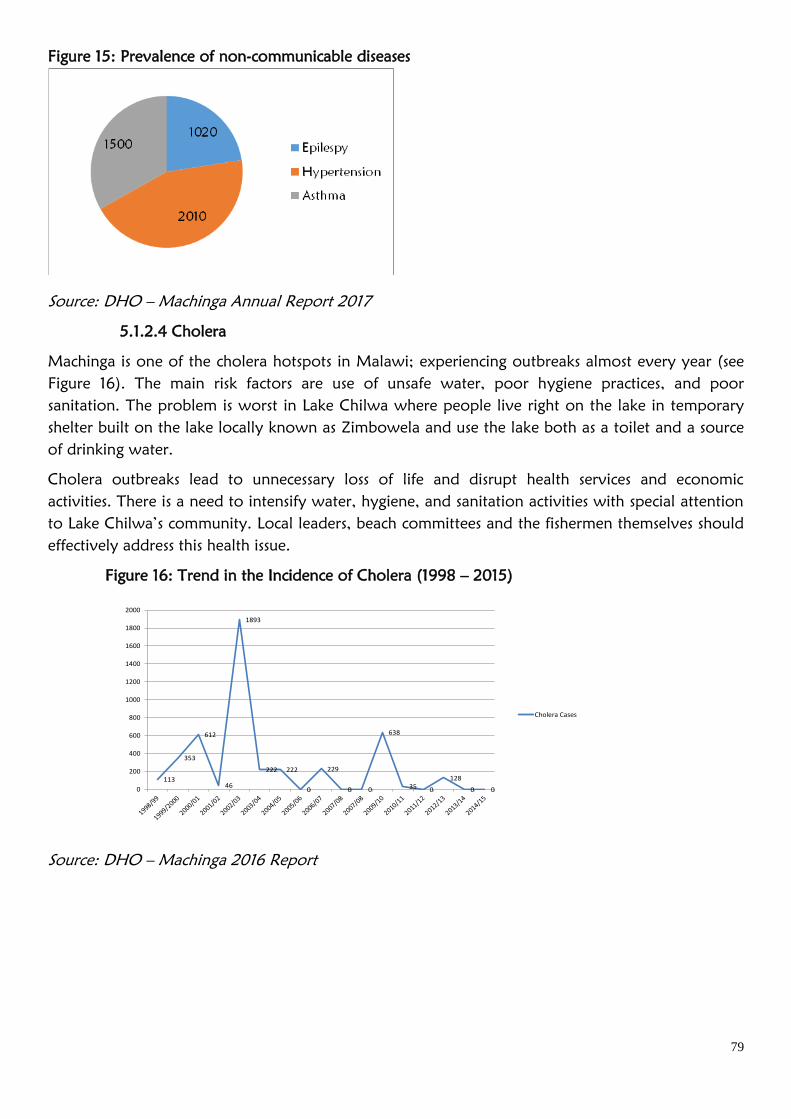
79
Figure 15: Prevalence of non-communicable diseases
Source: DHO – Machinga Annual Report 2017
5.1.2.4 Cholera
Machinga is one of the cholera hotspots in Malawi; experiencing outbreaks almost every year (see
Figure 16). The main risk factors are use of unsafe water, poor hygiene practices, and poor
sanitation. The problem is worst in Lake Chilwa where people live right on the lake in temporary
shelter built on the lake locally known as Zimbowela and use the lake both as a toilet and a source
of drinking water.
Cholera outbreaks lead to unnecessary loss of life and disrupt health services and economic
activities. There is a need to intensify water, hygiene, and sanitation activities with special attention
to Lake Chilwa’s community. Local leaders, beach committees and the fishermen themselves should
effectively address this health issue.
Figure 16: Trend in the Incidence of Cholera (1998 – 2015)
Cholera Trend from 1999
113
353
612
46
1893
222 222
0
229
0 0
638
35 0
128
0 00
200
400
600
800
1000
1200
1400
1600
1800
2000
Cholera Cases
Cholera Cases
Source: DHO – Machinga 2016 Report
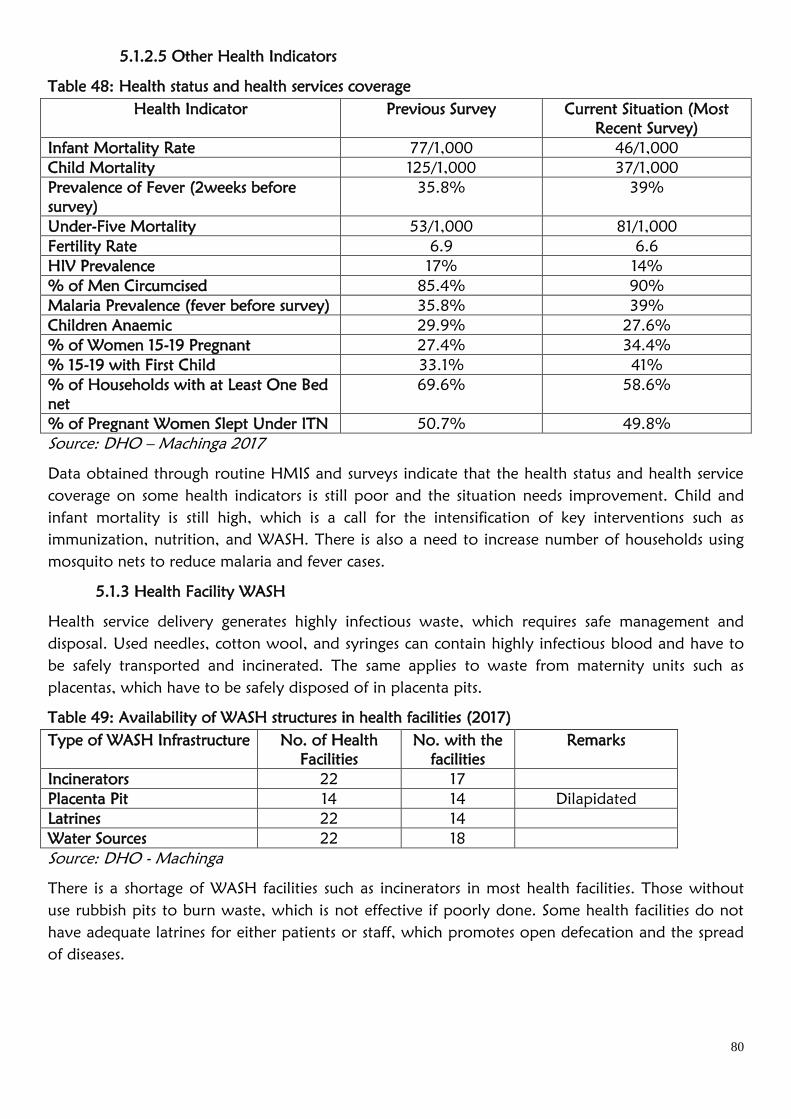
80
5.1.2.5 Other Health Indicators
Table 48: Health status and health services coverage
Health Indicator Previous Survey Current Situation (Most
Recent Survey)
Infant Mortality Rate 77/1,000 46/1,000
Child Mortality 125/1,000 37/1,000
Prevalence of Fever (2weeks before
survey)
35.8% 39%
Under-Five Mortality 53/1,000 81/1,000
Fertility Rate 6.9 6.6
HIV Prevalence 17% 14%
% of Men Circumcised 85.4% 90%
Malaria Prevalence (fever before survey) 35.8% 39%
Children Anaemic 29.9% 27.6%
% of Women 15-19 Pregnant 27.4% 34.4%
% 15-19 with First Child 33.1% 41%
% of Households with at Least One Bed
net
69.6% 58.6%
% of Pregnant Women Slept Under ITN 50.7% 49.8%
Source: DHO – Machinga 2017
Data obtained through routine HMIS and surveys indicate that the health status and health service
coverage on some health indicators is still poor and the situation needs improvement. Child and
infant mortality is still high, which is a call for the intensification of key interventions such as
immunization, nutrition, and WASH. There is also a need to increase number of households using
mosquito nets to reduce malaria and fever cases.
5.1.3 Health Facility WASH
Health service delivery generates highly infectious waste, which requires safe management and
disposal. Used needles, cotton wool, and syringes can contain highly infectious blood and have to
be safely transported and incinerated. The same applies to waste from maternity units such as
placentas, which have to be safely disposed of in placenta pits.
Table 49: Availability of WASH structures in health facilities (2017)
Type of WASH Infrastructure No. of Health
Facilities
No. with the
facilities
Remarks
Incinerators 22 17
Placenta Pit 14 14 Dilapidated
Latrines 22 14
Water Sources 22 18
Source: DHO - Machinga
There is a shortage of WASH facilities such as incinerators in most health facilities. Those without
use rubbish pits to burn waste, which is not effective if poorly done. Some health facilities do not
have adequate latrines for either patients or staff, which promotes open defecation and the spread
of diseases.
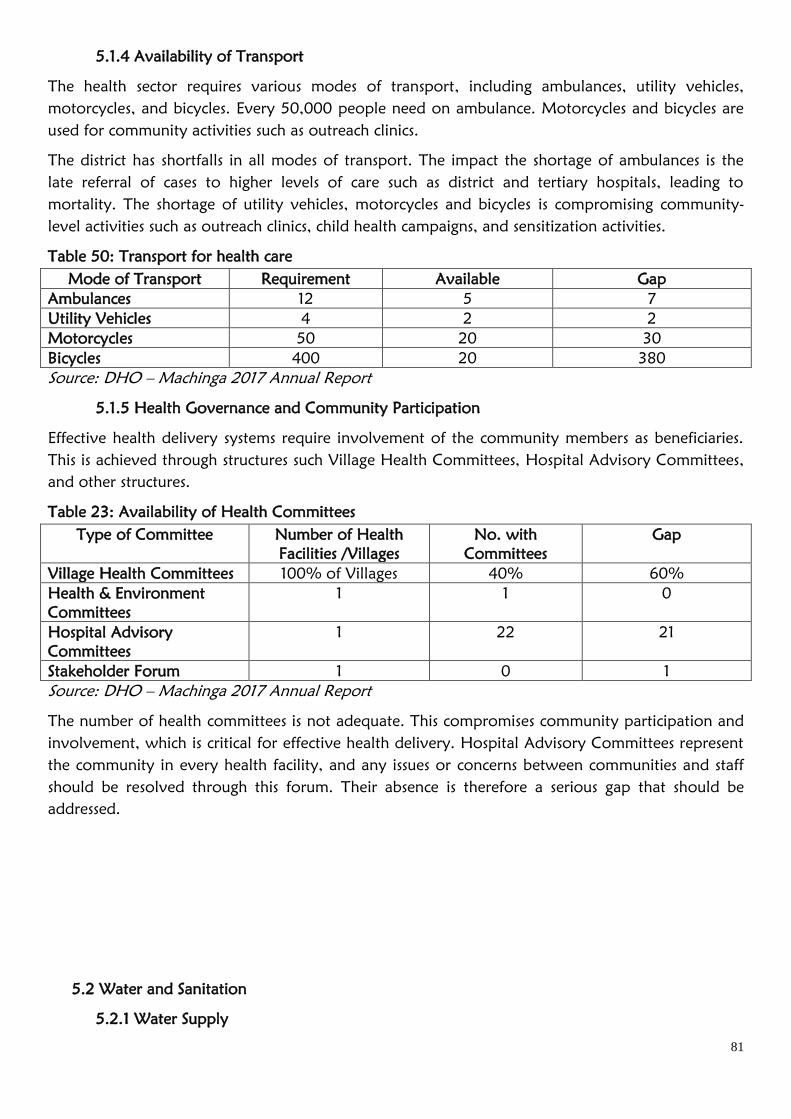
81
5.1.4 Availability of Transport
The health sector requires various modes of transport, including ambulances, utility vehicles,
motorcycles, and bicycles. Every 50,000 people need on ambulance. Motorcycles and bicycles are
used for community activities such as outreach clinics.
The district has shortfalls in all modes of transport. The impact the shortage of ambulances is the
late referral of cases to higher levels of care such as district and tertiary hospitals, leading to
mortality. The shortage of utility vehicles, motorcycles and bicycles is compromising community-
level activities such as outreach clinics, child health campaigns, and sensitization activities.
Table 50: Transport for health care
Mode of Transport Requirement Available Gap
Ambulances 12 5 7
Utility Vehicles 4 2 2
Motorcycles 50 20 30
Bicycles 400 20 380
Source: DHO – Machinga 2017 Annual Report
5.1.5 Health Governance and Community Participation
Effective health delivery systems require involvement of the community members as beneficiaries.
This is achieved through structures such Village Health Committees, Hospital Advisory Committees,
and other structures.
Table 23: Availability of Health Committees
Type of Committee Number of Health
Facilities /Villages
No. with
Committees
Gap
Village Health Committees 100% of Villages 40% 60%
Health & Environment
Committees
1 1 0
Hospital Advisory
Committees
1 22 21
Stakeholder Forum 1 0 1
Source: DHO – Machinga 2017 Annual Report
The number of health committees is not adequate. This compromises community participation and
involvement, which is critical for effective health delivery. Hospital Advisory Committees represent
the community in every health facility, and any issues or concerns between communities and staff
should be resolved through this forum. Their absence is therefore a serious gap that should be
addressed.
5.2 Water and Sanitation
5.2.1 Water Supply
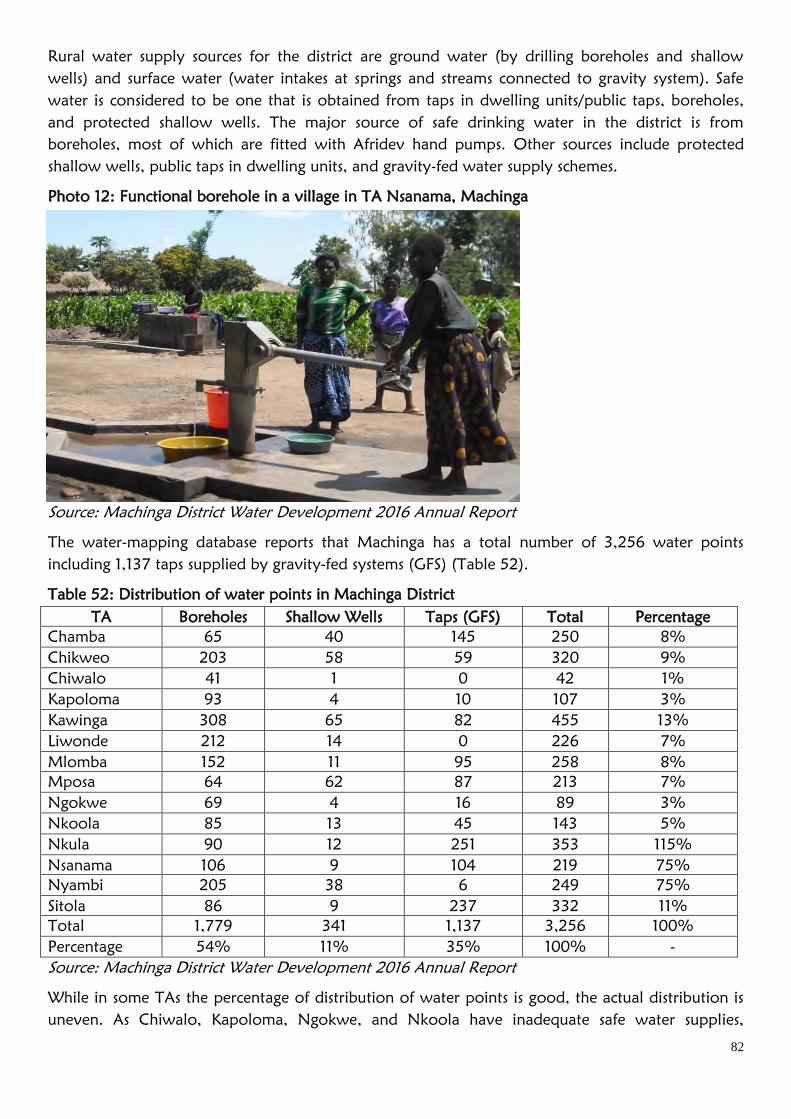
82
Rural water supply sources for the district are ground water (by drilling boreholes and shallow
wells) and surface water (water intakes at springs and streams connected to gravity system). Safe
water is considered to be one that is obtained from taps in dwelling units/public taps, boreholes,
and protected shallow wells. The major source of safe drinking water in the district is from
boreholes, most of which are fitted with Afridev hand pumps. Other sources include protected
shallow wells, public taps in dwelling units, and gravity-fed water supply schemes.
Photo 12: Functional borehole in a village in TA Nsanama, Machinga
Source: Machinga District Water Development 2016 Annual Report
The water-mapping database reports that Machinga has a total number of 3,256 water points
including 1,137 taps supplied by gravity-fed systems (GFS) (Table 52).
Table 52: Distribution of water points in Machinga District
TA Boreholes Shallow Wells Taps (GFS) Total Percentage
Chamba 65 40 145 250 8%
Chikweo 203 58 59 320 9%
Chiwalo 41 1 0 42 1%
Kapoloma 93 4 10 107 3%
Kawinga 308 65 82 455 13%
Liwonde 212 14 0 226 7%
Mlomba 152 11 95 258 8%
Mposa 64 62 87 213 7%
Ngokwe 69 4 16 89 3%
Nkoola 85 13 45 143 5%
Nkula 90 12 251 353 115%
Nsanama 106 9 104 219 75%
Nyambi 205 38 6 249 75%
Sitola 86 9 237 332 11%
Total 1,779 341 1,137 3,256 100%
Percentage 54% 11% 35% 100% -
Source: Machinga District Water Development 2016 Annual Report
While in some TAs the percentage of distribution of water points is good, the actual distribution is
uneven. As Chiwalo, Kapoloma, Ngokwe, and Nkoola have inadequate safe water supplies,
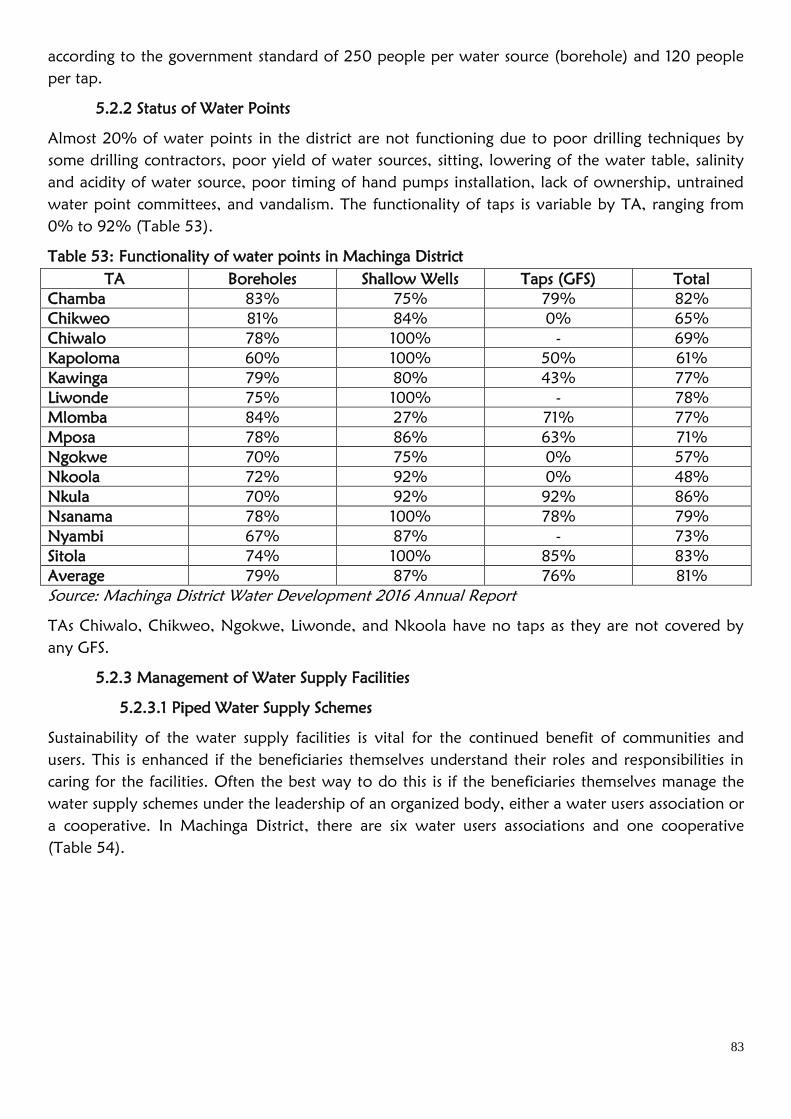
83
according to the government standard of 250 people per water source (borehole) and 120 people
per tap.
5.2.2 Status of Water Points
Almost 20% of water points in the district are not functioning due to poor drilling techniques by
some drilling contractors, poor yield of water sources, sitting, lowering of the water table, salinity
and acidity of water source, poor timing of hand pumps installation, lack of ownership, untrained
water point committees, and vandalism. The functionality of taps is variable by TA, ranging from
0% to 92% (Table 53).
Table 53: Functionality of water points in Machinga District
TA Boreholes Shallow Wells Taps (GFS) Total
Chamba 83% 75% 79% 82%
Chikweo 81% 84% 0% 65%
Chiwalo 78% 100% - 69%
Kapoloma 60% 100% 50% 61%
Kawinga 79% 80% 43% 77%
Liwonde 75% 100% - 78%
Mlomba 84% 27% 71% 77%
Mposa 78% 86% 63% 71%
Ngokwe 70% 75% 0% 57%
Nkoola 72% 92% 0% 48%
Nkula 70% 92% 92% 86%
Nsanama 78% 100% 78% 79%
Nyambi 67% 87% - 73%
Sitola 74% 100% 85% 83%
Average 79% 87% 76% 81%
Source: Machinga District Water Development 2016 Annual Report
TAs Chiwalo, Chikweo, Ngokwe, Liwonde, and Nkoola have no taps as they are not covered by
any GFS.
5.2.3 Management of Water Supply Facilities
5.2.3.1 Piped Water Supply Schemes
Sustainability of the water supply facilities is vital for the continued benefit of communities and
users. This is enhanced if the beneficiaries themselves understand their roles and responsibilities in
caring for the facilities. Often the best way to do this is if the beneficiaries themselves manage the
water supply schemes under the leadership of an organized body, either a water users association or
a cooperative. In Machinga District, there are six water users associations and one cooperative
(Table 54).
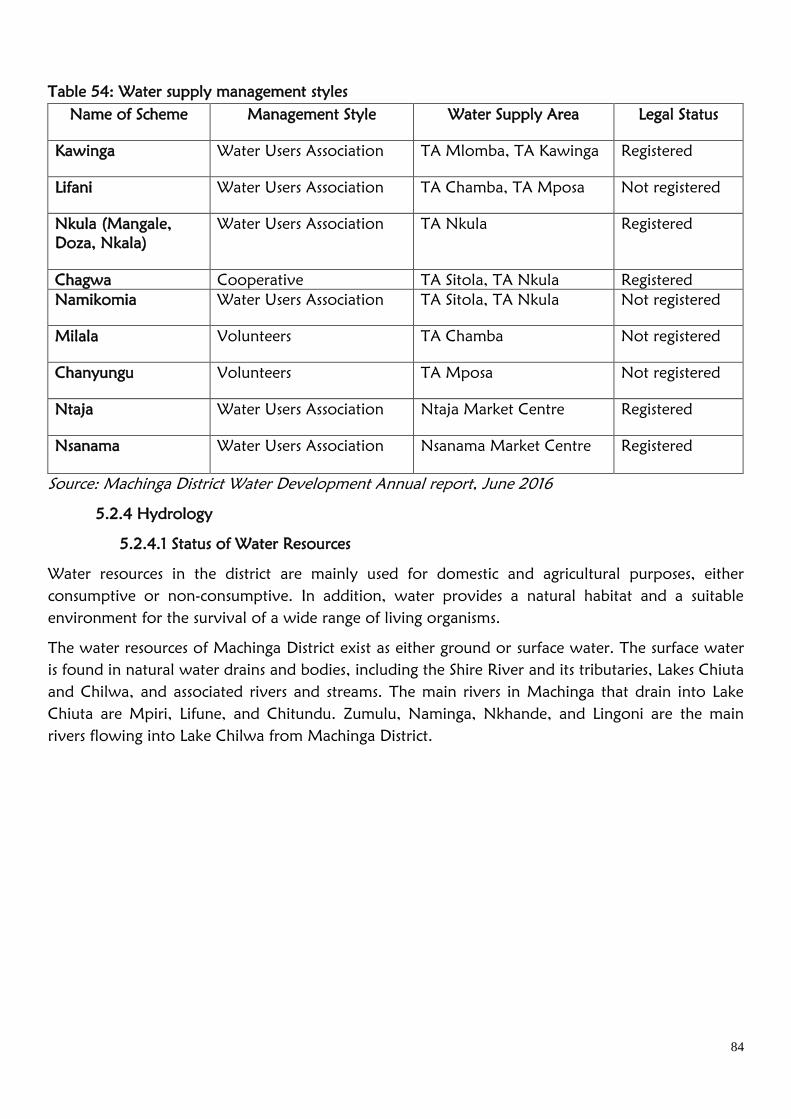
84
Table 54: Water supply management styles
Name of Scheme Management Style Water Supply Area Legal Status
Kawinga Water Users Association TA Mlomba, TA Kawinga Registered
Lifani Water Users Association TA Chamba, TA Mposa Not registered
Nkula (Mangale,
Doza, Nkala)
Water Users Association TA Nkula Registered
Chagwa Cooperative TA Sitola, TA Nkula Registered
Namikomia Water Users Association TA Sitola, TA Nkula Not registered
Milala Volunteers TA Chamba Not registered
Chanyungu Volunteers TA Mposa Not registered
Ntaja Water Users Association Ntaja Market Centre Registered
Nsanama Water Users Association Nsanama Market Centre Registered
Source: Machinga District Water Development Annual report, June 2016
5.2.4 Hydrology
5.2.4.1 Status of Water Resources
Water resources in the district are mainly used for domestic and agricultural purposes, either
consumptive or non-consumptive. In addition, water provides a natural habitat and a suitable
environment for the survival of a wide range of living organisms.
The water resources of Machinga District exist as either ground or surface water. The surface water
is found in natural water drains and bodies, including the Shire River and its tributaries, Lakes Chiuta
and Chilwa, and associated rivers and streams. The main rivers in Machinga that drain into Lake
Chiuta are Mpiri, Lifune, and Chitundu. Zumulu, Naminga, Nkhande, and Lingoni are the main
rivers flowing into Lake Chilwa from Machinga District.

85
5.2.4.2 Drainage
Drainage in Machinga District can be categorized into three areas:
Lake Chilwa area
Lake Chiuta area
Shire Plain
In the Lake Chilwa area, the Masanje is the only perennial river draining to the west and emptying
into Lake Chilwa. Two mature perennial rivers, the Mkhande and Mikoko, flow southeast into Lake
Chilwa.
The two perennial rivers flowing into Lake Chiuta are the Mpiri and Lifune, but their flows become
sluggish in the dry season. Short, steep boulder-stream courses of minor streams drain the Nsili Hills
as flash floods only in times of heavy rainfall.
The Shire River connects Lake Malawi with the Zambezi flowing southwest. The Likwenu and
Lisanjala Rivers, which begin in major mountains masses, flow into the Shire River.
5.2.5 Overview of Gravity-Fed Pipe Schemes in Machinga District
There are 11 gravity-fed piped water supply schemes in Machinga of various sizes and age, with
1,137 standpipes that were previously constructed by the government (Table 55).
Table 55: Sizes of GFSs in Machinga District
Name of
Scheme
Location System Size Year
Total Pipeline
Length (m) Constructed Rehabilitated
Kawinga Mlomba, Kawinga 174,590 1983 2013 (Not completed)
Lifani Malemia (Zomba),
Chamba, Mposa 31,055 1977 2013 (Not completed)
Milala Sitola, Nkula,
Chamba 11,570 1985
Needs to be
rehabilitated
Chagwa Nkula 29,055 1976 2007
Namikomia Sitola, Nkula,
Nsanama 66,290 1983
2003 (Has turbidity
problems)
Chanyungu Mlomba
12,936 2000 Needs to be
rehabilitated
Naungu Sitola
7,754 2003 Needs to be
rehabilitated
Doza Nkula 2,329 2001 2013
Dala Sitola
2,429 2003 Needs to be
rehabilitated
Mangale Nkula 4,494 2001 2013
Nkala Nkula 5,876 2001 2013
Source: Machinga District Water Development Annual report, June 2016
All these GFSs depend on surface water sources originating in the Malosa Hills and the “Mtonya
Ring Structure” (Chikala, Chaone, Mangolowe, and Chinduzi Hills) located in the southwestern part
of the district. Only the Kawinga System stretches its distribution lines into the centre and eastern
parts of Machinga District. All the 10 other GFS pipelines remain within a close perimeter around
those hills covered by forest reserves.
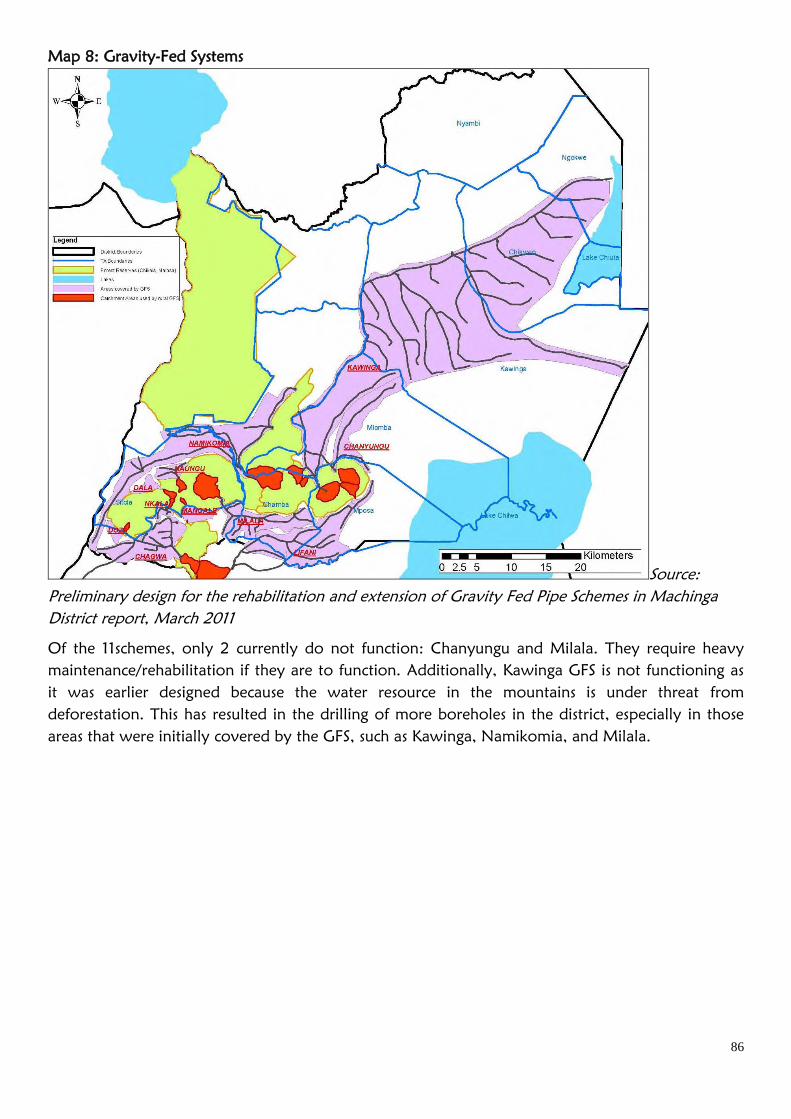
86
Map 8: Gravity-Fed Systems
Source:
Preliminary design for the rehabilitation and extension of Gravity Fed Pipe Schemes in Machinga
District report, March 2011
Of the 11schemes, only 2 currently do not function: Chanyungu and Milala. They require heavy
maintenance/rehabilitation if they are to function. Additionally, Kawinga GFS is not functioning as
it was earlier designed because the water resource in the mountains is under threat from
deforestation. This has resulted in the drilling of more boreholes in the district, especially in those
areas that were initially covered by the GFS, such as Kawinga, Namikomia, and Milala.
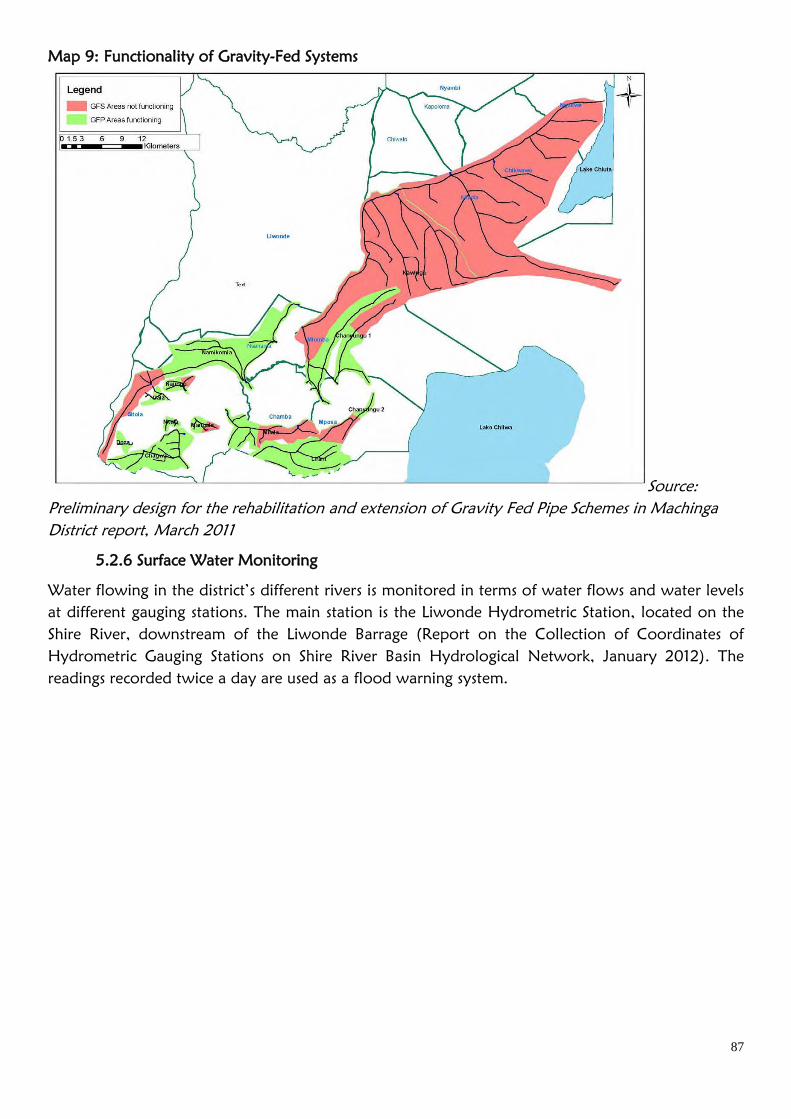
87
Map 9: Functionality of Gravity-Fed Systems
Source:
Preliminary design for the rehabilitation and extension of Gravity Fed Pipe Schemes in Machinga
District report, March 2011
5.2.6 Surface Water Monitoring
Water flowing in the district’s different rivers is monitored in terms of water flows and water levels
at different gauging stations. The main station is the Liwonde Hydrometric Station, located on the
Shire River, downstream of the Liwonde Barrage (Report on the Collection of Coordinates of
Hydrometric Gauging Stations on Shire River Basin Hydrological Network, January 2012). The
readings recorded twice a day are used as a flood warning system.
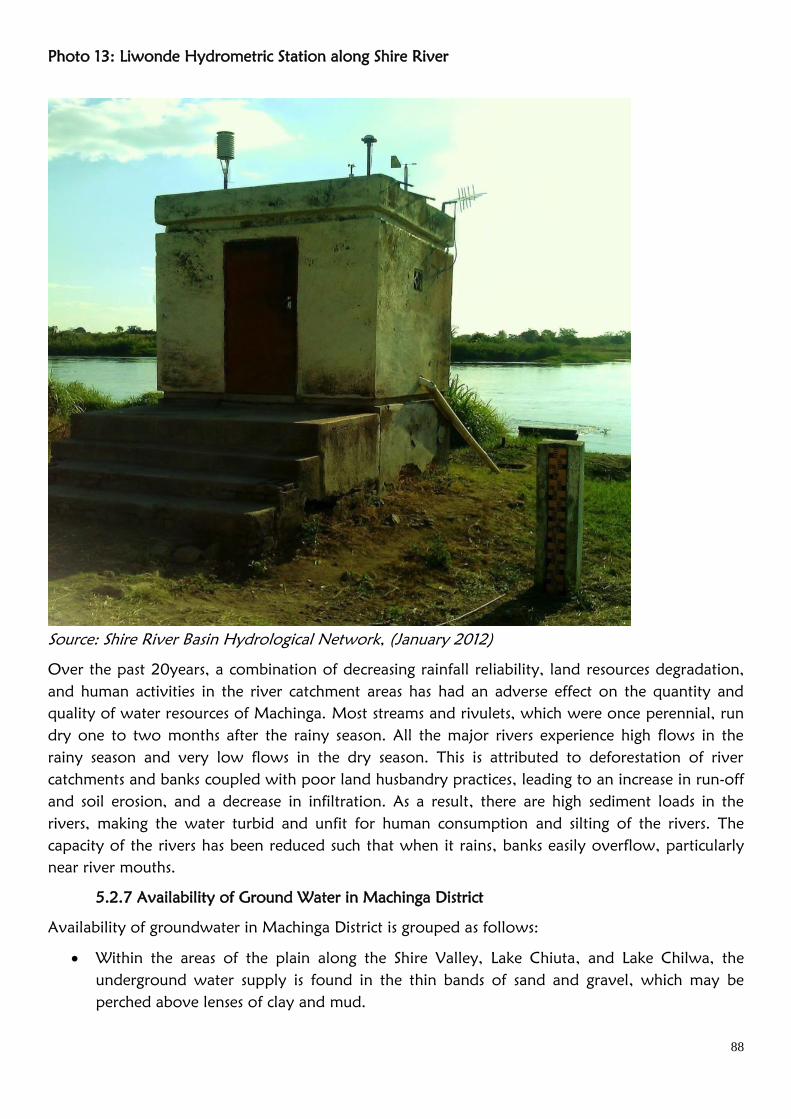
88
Photo 13: Liwonde Hydrometric Station along Shire River
Source: Shire River Basin Hydrological Network, (January 2012)
Over the past 20years, a combination of decreasing rainfall reliability, land resources degradation,
and human activities in the river catchment areas has had an adverse effect on the quantity and
quality of water resources of Machinga. Most streams and rivulets, which were once perennial, run
dry one to two months after the rainy season. All the major rivers experience high flows in the
rainy season and very low flows in the dry season. This is attributed to deforestation of river
catchments and banks coupled with poor land husbandry practices, leading to an increase in run-off
and soil erosion, and a decrease in infiltration. As a result, there are high sediment loads in the
rivers, making the water turbid and unfit for human consumption and silting of the rivers. The
capacity of the rivers has been reduced such that when it rains, banks easily overflow, particularly
near river mouths.
5.2.7 Availability of Ground Water in Machinga District
Availability of groundwater in Machinga District is grouped as follows:
Within the areas of the plain along the Shire Valley, Lake Chiuta, and Lake Chilwa, the
underground water supply is found in the thin bands of sand and gravel, which may be
perched above lenses of clay and mud.
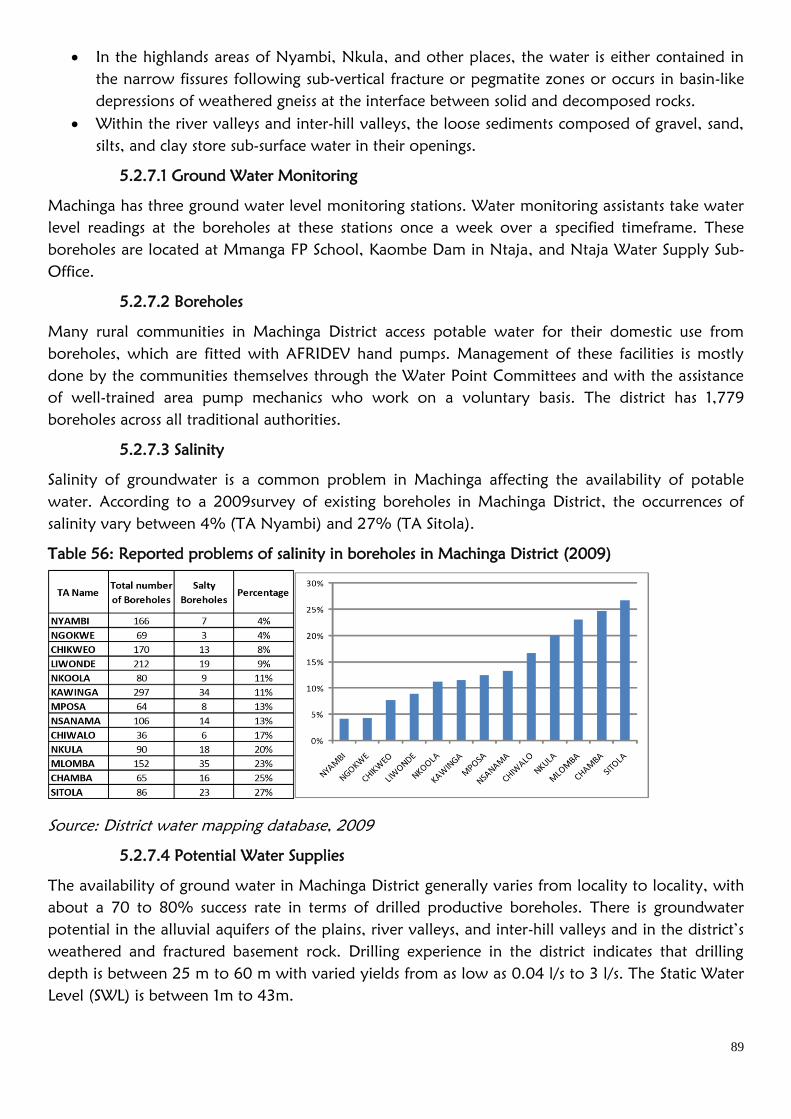
89
In the highlands areas of Nyambi, Nkula, and other places, the water is either contained in
the narrow fissures following sub-vertical fracture or pegmatite zones or occurs in basin-like
depressions of weathered gneiss at the interface between solid and decomposed rocks.
Within the river valleys and inter-hill valleys, the loose sediments composed of gravel, sand,
silts, and clay store sub-surface water in their openings.
5.2.7.1 Ground Water Monitoring
Machinga has three ground water level monitoring stations. Water monitoring assistants take water
level readings at the boreholes at these stations once a week over a specified timeframe. These
boreholes are located at Mmanga FP School, Kaombe Dam in Ntaja, and Ntaja Water Supply Sub-
Office.
5.2.7.2 Boreholes
Many rural communities in Machinga District access potable water for their domestic use from
boreholes, which are fitted with AFRIDEV hand pumps. Management of these facilities is mostly
done by the communities themselves through the Water Point Committees and with the assistance
of well-trained area pump mechanics who work on a voluntary basis. The district has 1,779
boreholes across all traditional authorities.
5.2.7.3 Salinity
Salinity of groundwater is a common problem in Machinga affecting the availability of potable
water. According to a 2009survey of existing boreholes in Machinga District, the occurrences of
salinity vary between 4% (TA Nyambi) and 27% (TA Sitola).
Table 56: Reported problems of salinity in boreholes in Machinga District (2009)
Source: District water mapping database, 2009
5.2.7.4 Potential Water Supplies
The availability of ground water in Machinga District generally varies from locality to locality, with
about a 70 to 80% success rate in terms of drilled productive boreholes. There is groundwater
potential in the alluvial aquifers of the plains, river valleys, and inter-hill valleys and in the district’s
weathered and fractured basement rock. Drilling experience in the district indicates that drilling
depth is between 25 m to 60 m with varied yields from as low as 0.04 l/s to 3 l/s. The Static Water
Level (SWL) is between 1m to 43m.
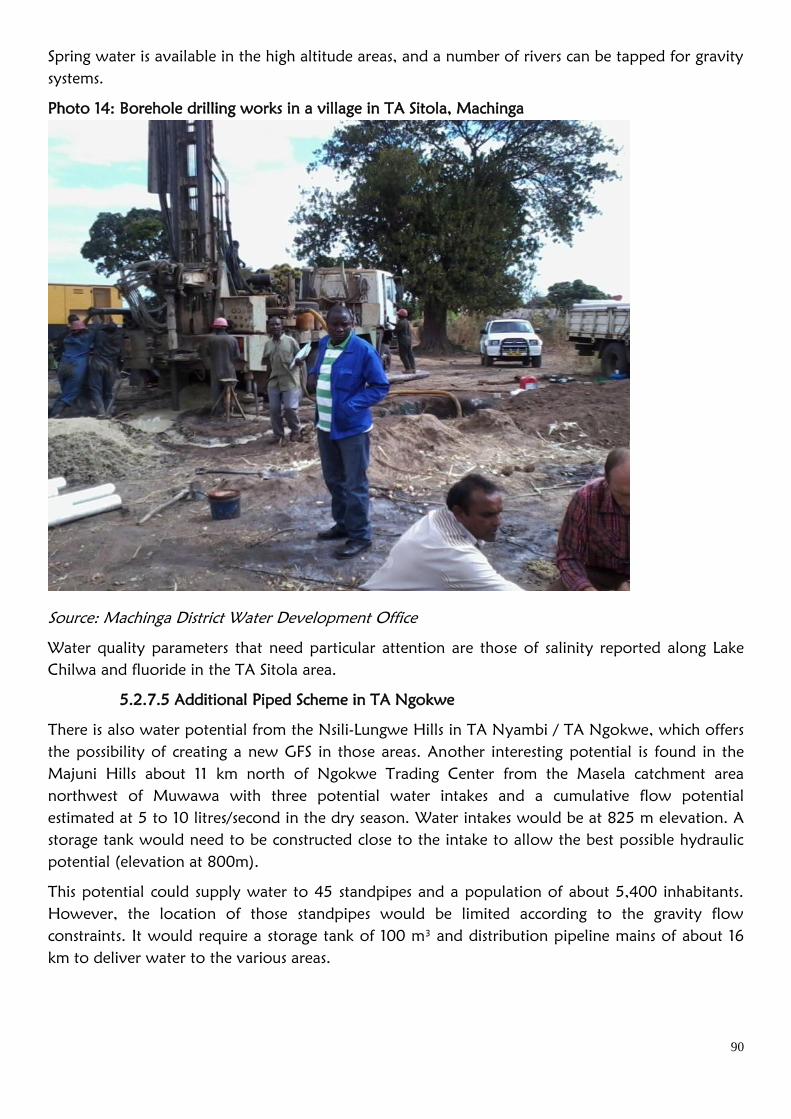
90
Spring water is available in the high altitude areas, and a number of rivers can be tapped for gravity
systems.
Photo 14: Borehole drilling works in a village in TA Sitola, Machinga
Source: Machinga District Water Development Office
Water quality parameters that need particular attention are those of salinity reported along Lake
Chilwa and fluoride in the TA Sitola area.
5.2.7.5 Additional Piped Scheme in TA Ngokwe
There is also water potential from the Nsili-Lungwe Hills in TA Nyambi / TA Ngokwe, which offers
the possibility of creating a new GFS in those areas. Another interesting potential is found in the
Majuni Hills about 11 km north of Ngokwe Trading Center from the Masela catchment area
northwest of Muwawa with three potential water intakes and a cumulative flow potential
estimated at 5 to 10 litres/second in the dry season. Water intakes would be at 825 m elevation. A
storage tank would need to be constructed close to the intake to allow the best possible hydraulic
potential (elevation at 800m).
This potential could supply water to 45 standpipes and a population of about 5,400 inhabitants.
However, the location of those standpipes would be limited according to the gravity flow
constraints. It would require a storage tank of 100 m3 and distribution pipeline mains of about 16
km to deliver water to the various areas.
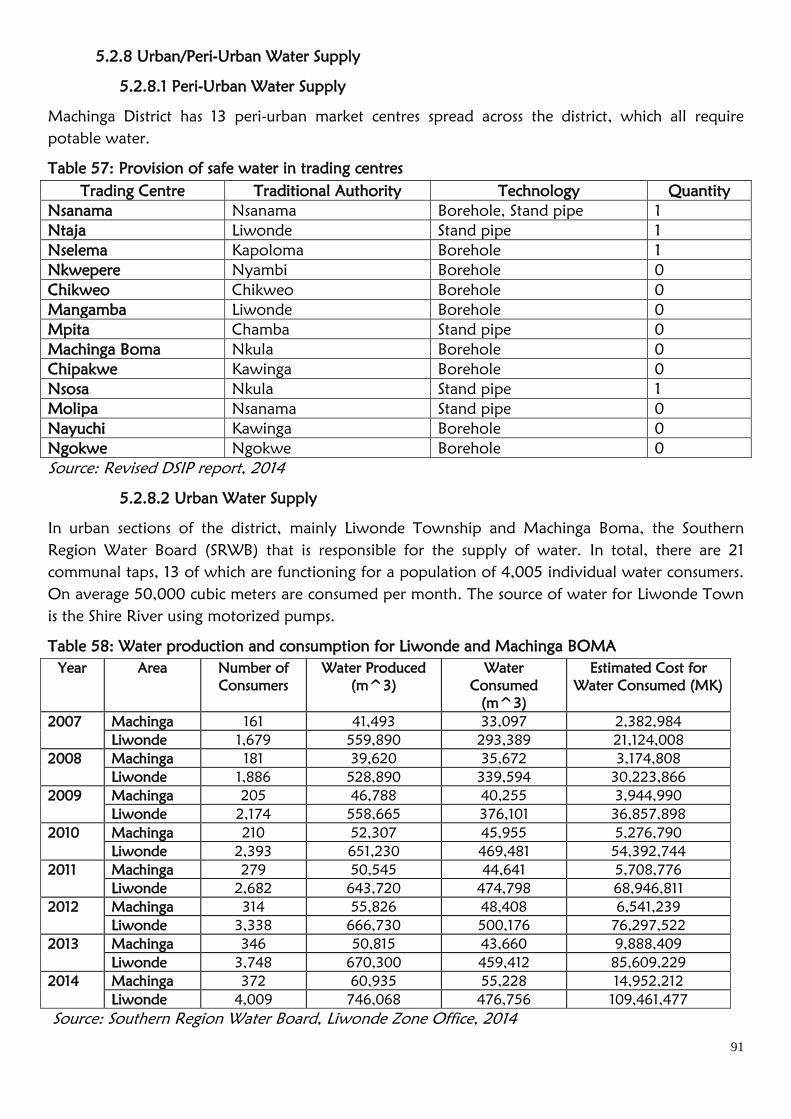
91
5.2.8 Urban/Peri-Urban Water Supply
5.2.8.1 Peri-Urban Water Supply
Machinga District has 13 peri-urban market centres spread across the district, which all require
potable water.
Table 57: Provision of safe water in trading centres
Trading Centre Traditional Authority Technology Quantity
Nsanama Nsanama Borehole, Stand pipe 1
Ntaja Liwonde Stand pipe 1
Nselema Kapoloma Borehole 1
Nkwepere Nyambi Borehole 0
Chikweo Chikweo Borehole 0
Mangamba Liwonde Borehole 0
Mpita Chamba Stand pipe 0
Machinga Boma Nkula Borehole 0
Chipakwe Kawinga Borehole 0
Nsosa Nkula Stand pipe 1
Molipa Nsanama Stand pipe 0
Nayuchi Kawinga Borehole 0
Ngokwe Ngokwe Borehole 0
Source: Revised DSIP report, 2014
5.2.8.2 Urban Water Supply
In urban sections of the district, mainly Liwonde Township and Machinga Boma, the Southern
Region Water Board (SRWB) that is responsible for the supply of water. In total, there are 21
communal taps, 13 of which are functioning for a population of 4,005 individual water consumers.
On average 50,000 cubic meters are consumed per month. The source of water for Liwonde Town
is the Shire River using motorized pumps.
Table 58: Water production and consumption for Liwonde and Machinga BOMA
Year Area Number of
Consumers
Water Produced
(m^3)
Water
Consumed
(m^3)
Estimated Cost for
Water Consumed (MK)
2007 Machinga 161 41,493 33,097 2,382,984
Liwonde 1,679 559,890 293,389 21,124,008
2008 Machinga 181 39,620 35,672 3,174,808
Liwonde 1,886 528,890 339,594 30,223,866
2009 Machinga 205 46,788 40,255 3,944,990
Liwonde 2,174 558,665 376,101 36,857,898
2010 Machinga 210 52,307 45,955 5,276,790
Liwonde 2,393 651,230 469,481 54,392,744
2011 Machinga 279 50,545 44,641 5,708,776
Liwonde 2,682 643,720 474,798 68,946,811
2012 Machinga 314 55,826 48,408 6,541,239
Liwonde 3,338 666,730 500,176 76,297,522
2013 Machinga 346 50,815 43,660 9,888,409
Liwonde 3,748 670,300 459,412 85,609,229
2014 Machinga 372 60,935 55,228 14,952,212
Liwonde 4,009 746,068 476,756 109,461,477
Source: Southern Region Water Board, Liwonde Zone Office, 2014
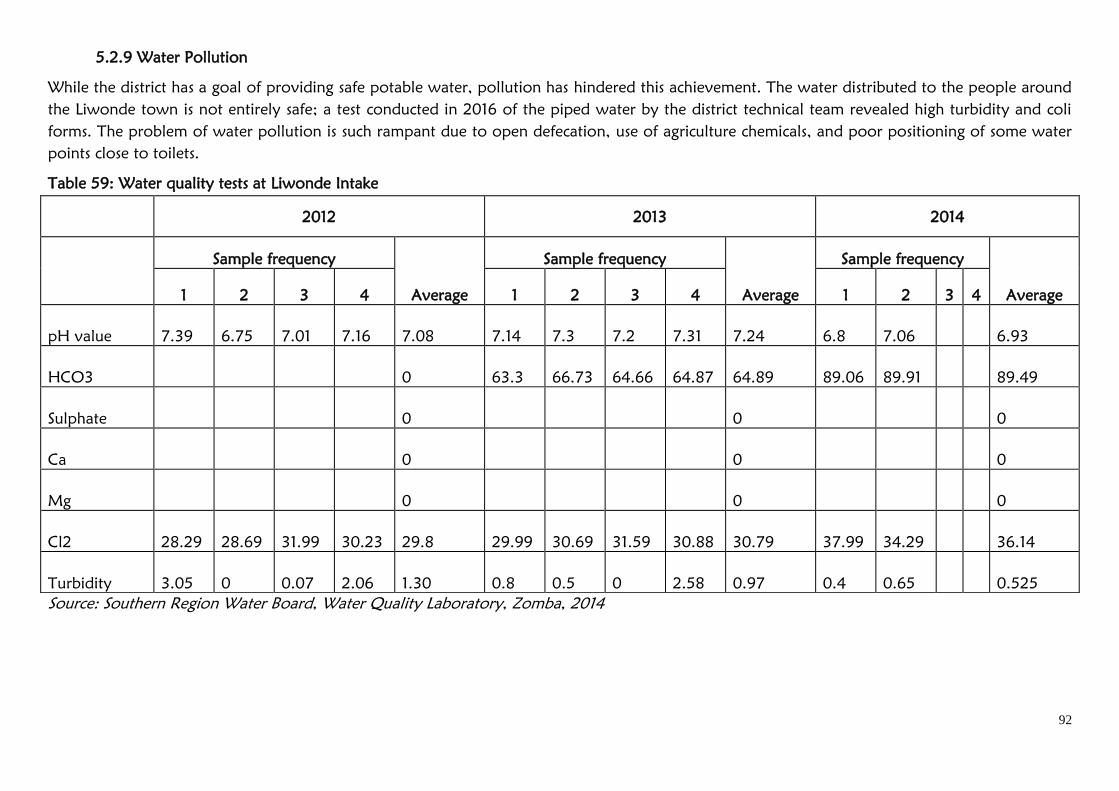
92
5.2.9 Water Pollution
While the district has a goal of providing safe potable water, pollution has hindered this achievement. The water distributed to the people around
the Liwonde town is not entirely safe; a test conducted in 2016 of the piped water by the district technical team revealed high turbidity and coli
forms. The problem of water pollution is such rampant due to open defecation, use of agriculture chemicals, and poor positioning of some water
points close to toilets.
Table 59: Water quality tests at Liwonde Intake
Source: Southern Region Water Board, Water Quality Laboratory, Zomba, 2014
2012 2013 2014
Sample frequency
Average
Sample frequency
Average
Sample frequency
Average 1 2 3 4 1 2 3 4 1 2 3 4
pH value 7.39 6.75 7.01 7.16 7.08 7.14 7.3 7.2 7.31 7.24 6.8 7.06 6.93
HCO3 0 63.3 66.73 64.66 64.87 64.89 89.06 89.91 89.49
Sulphate 0 0 0
Ca 0 0 0
Mg 0 0 0
Cl2 28.29 28.69 31.99 30.23 29.8 29.99 30.69 31.59 30.88 30.79 37.99 34.29 36.14
Turbidity 3.05 0 0.07 2.06 1.30 0.8 0.5 0 2.58 0.97 0.4 0.65 0.525
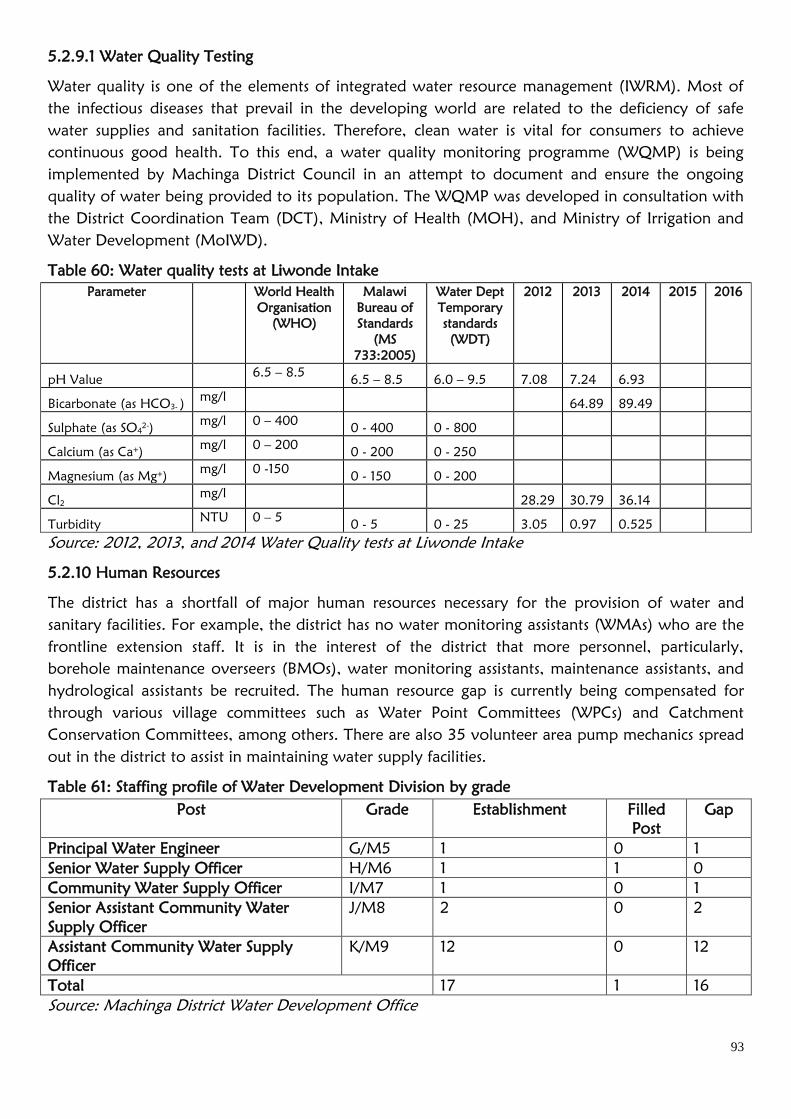
93
5.2.9.1 Water Quality Testing
Water quality is one of the elements of integrated water resource management (IWRM). Most of
the infectious diseases that prevail in the developing world are related to the deficiency of safe
water supplies and sanitation facilities. Therefore, clean water is vital for consumers to achieve
continuous good health. To this end, a water quality monitoring programme (WQMP) is being
implemented by Machinga District Council in an attempt to document and ensure the ongoing
quality of water being provided to its population. The WQMP was developed in consultation with
the District Coordination Team (DCT), Ministry of Health (MOH), and Ministry of Irrigation and
Water Development (MoIWD).
Table 60: Water quality tests at Liwonde Intake
Parameter World Health
Organisation
(WHO)
Malawi
Bureau of
Standards
(MS
733:2005)
Water Dept
Temporary
standards
(WDT)
2012 2013 2014 2015 2016
pH Value 6.5 – 8.5
6.5 – 8.5 6.0 – 9.5 7.08 7.24 6.93
Bicarbonate (as HCO3- ) mg/l
64.89 89.49
Sulphate (as SO4
2-)
mg/l 0 – 400 0 - 400 0 - 800
Calcium (as Ca+)
mg/l 0 – 200 0 - 200 0 - 250
Magnesium (as Mg+)
mg/l 0 -150 0 - 150 0 - 200
Cl2 mg/l
28.29 30.79 36.14
Turbidity NTU 0 – 5
0 - 5 0 - 25 3.05 0.97 0.525
Source: 2012, 2013, and 2014 Water Quality tests at Liwonde Intake
5.2.10 Human Resources
The district has a shortfall of major human resources necessary for the provision of water and
sanitary facilities. For example, the district has no water monitoring assistants (WMAs) who are the
frontline extension staff. It is in the interest of the district that more personnel, particularly,
borehole maintenance overseers (BMOs), water monitoring assistants, maintenance assistants, and
hydrological assistants be recruited. The human resource gap is currently being compensated for
through various village committees such as Water Point Committees (WPCs) and Catchment
Conservation Committees, among others. There are also 35 volunteer area pump mechanics spread
out in the district to assist in maintaining water supply facilities.
Table 61: Staffing profile of Water Development Division by grade
Post Grade Establishment Filled
Post
Gap
Principal Water Engineer G/M5 1 0 1
Senior Water Supply Officer H/M6 1 1 0
Community Water Supply Officer I/M7 1 0 1
Senior Assistant Community Water
Supply Officer
J/M8 2 0 2
Assistant Community Water Supply
Officer
K/M9 12 0 12
Total 17 1 16
Source: Machinga District Water Development Office
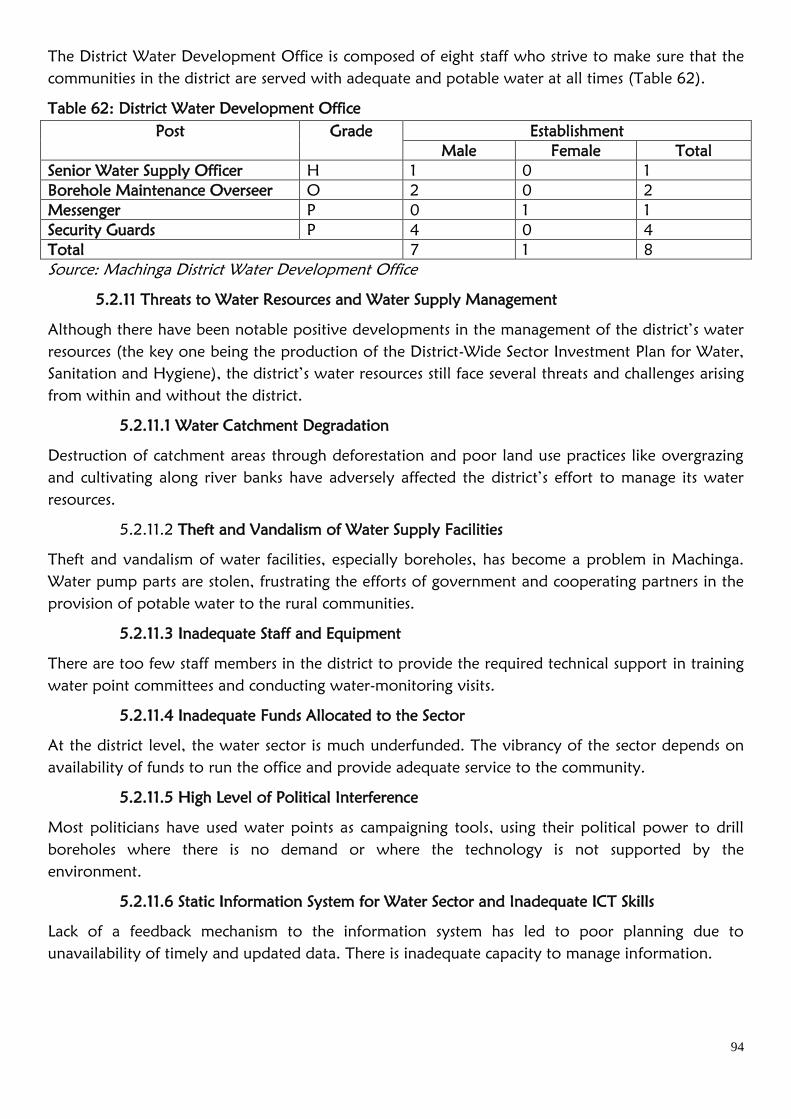
94
The District Water Development Office is composed of eight staff who strive to make sure that the
communities in the district are served with adequate and potable water at all times (Table 62).
Table 62: District Water Development Office
Post Grade Establishment
Male Female Total
Senior Water Supply Officer H 1 0 1
Borehole Maintenance Overseer O 2 0 2
Messenger P 0 1 1
Security Guards P 4 0 4
Total 7 1 8
Source: Machinga District Water Development Office
5.2.11 Threats to Water Resources and Water Supply Management
Although there have been notable positive developments in the management of the district’s water
resources (the key one being the production of the District-Wide Sector Investment Plan for Water,
Sanitation and Hygiene), the district’s water resources still face several threats and challenges arising
from within and without the district.
5.2.11.1 Water Catchment Degradation
Destruction of catchment areas through deforestation and poor land use practices like overgrazing
and cultivating along river banks have adversely affected the district’s effort to manage its water
resources.
5.2.11.2 Theft and Vandalism of Water Supply Facilities
Theft and vandalism of water facilities, especially boreholes, has become a problem in Machinga.
Water pump parts are stolen, frustrating the efforts of government and cooperating partners in the
provision of potable water to the rural communities.
5.2.11.3 Inadequate Staff and Equipment
There are too few staff members in the district to provide the required technical support in training
water point committees and conducting water-monitoring visits.
5.2.11.4 Inadequate Funds Allocated to the Sector
At the district level, the water sector is much underfunded. The vibrancy of the sector depends on
availability of funds to run the office and provide adequate service to the community.
5.2.11.5 High Level of Political Interference
Most politicians have used water points as campaigning tools, using their political power to drill
boreholes where there is no demand or where the technology is not supported by the
environment.
5.2.11.6 Static Information System for Water Sector and Inadequate ICT Skills
Lack of a feedback mechanism to the information system has led to poor planning due to
unavailability of timely and updated data. There is inadequate capacity to manage information.
95
5.2.11.7 Lack of Information Sharing Among Stakeholders
Since there is poor coordination among stakeholders, no common plan for the district exists. It is a
challenge for stakeholders to share notes on the progress of various programs.
5.2.11.8 Invasive Species
Invasive species have a negative effect on water resources as they reduce the amount and quality of
water in a dam. The main invasive species in Machinga District is water hyacinth, locally known as
Namasipuni.
5.2.11.9 Poor Supply Chain for Spare Parts
Unavailability of retail outlets that sell parts for the maintenance of water supply facilities in some
areas of the district poses a challenge to the sustainable supply of potable water for the rural
communities. Most non-functional boreholes are not functioning as a result of non-availability of
spares in the proximity of the communities.
5.2.11.10 Inaccessibility of Some Areas Due to Terrain
The location of some hilly settlements makes it difficult for service providers to develop water
points to supply these areas.
5.2.12 Recommendations
It is important to note that in an effort to establish sustainable management of the district’s water
and wetland resources, and properly coordinate resource allocation, the District Council through
the DCT produced a District Water and Sanitation Investment Plan (DWSIP) for Water, Sanitation
and Hygiene for 2008 – 2015. It is expected that, in line with the decentralisation policy, all actions
on water and environmental sanitation will be managed at district level following this plan. With
this plan in place, general management of the district water and wetland resources seems to be on
the right track. However, in order to improve management of water and wetland resources, the
following need to be considered:
There is a need for communities to be sensitised on the importance of protecting their water
supply facilities. They need to realise that taking care of water facilities is their responsibility.
Likewise, communities need to realise that the protection of facilities reduces the need for
frequent maintenance, which ultimately helps to ensure a reliable water supply.
There is a need to strengthen coordination of water resource management at the district
level by utilising the DWSIP in the management of the water and wetland resources, and
through coordination of all interventions on safe water supply. The plan advocates an
integrated approach to management of water and wetland resources.
There is a need to train VNRMCs to enable communities have the technical know-how of
catchment area protection. The training should also instil a sense of ownership of these areas.
When improving accessibility to safe water, emphasis should be placed on empowering local
communities to maintain and repair their own water facilities. Communities should be
trained in operation and maintenance. At the same time, provision should be made to
ensure that spare parts are easily available to communities. Furthermore, community-policing
structures should be strengthened.
The District Council should improve roads and bridges to make remote villages accessible to
water service providers.
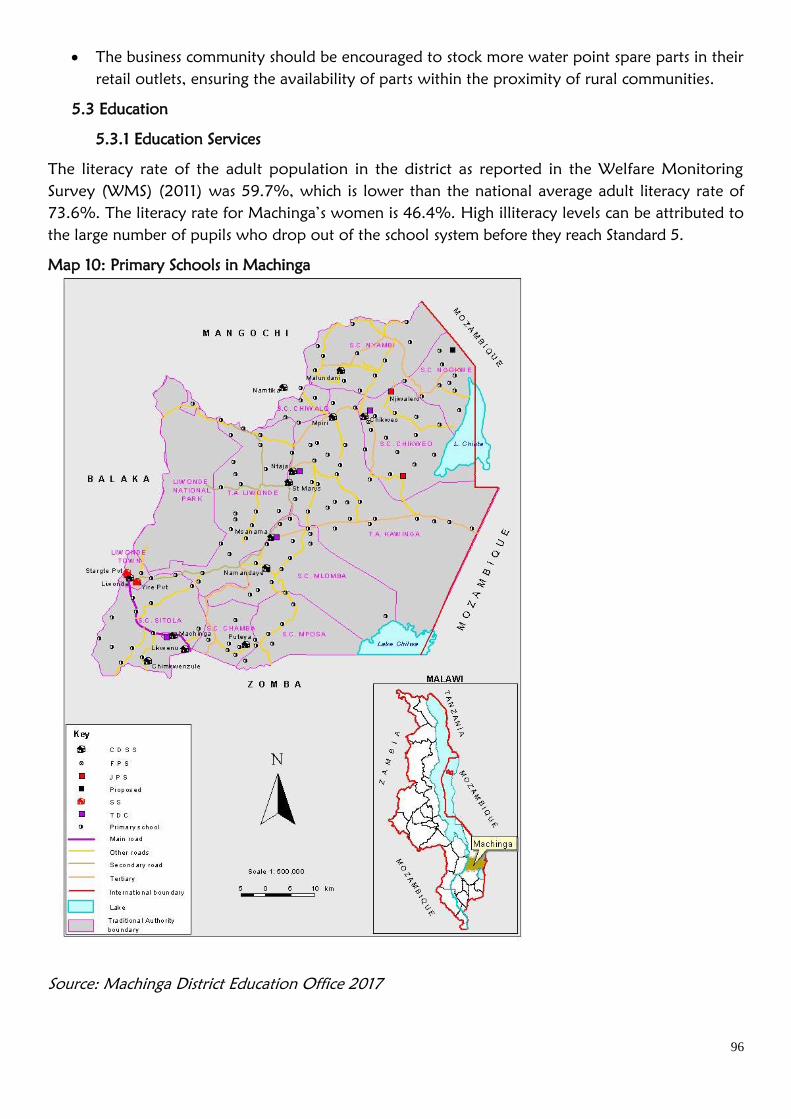
96
The business community should be encouraged to stock more water point spare parts in their
retail outlets, ensuring the availability of parts within the proximity of rural communities.
5.3 Education
5.3.1 Education Services
The literacy rate of the adult population in the district as reported in the Welfare Monitoring
Survey (WMS) (2011) was 59.7%, which is lower than the national average adult literacy rate of
73.6%. The literacy rate for Machinga’s women is 46.4%. High illiteracy levels can be attributed to
the large number of pupils who drop out of the school system before they reach Standard 5.
Map 10: Primary Schools in Machinga
Source: Machinga District Education Office 2017
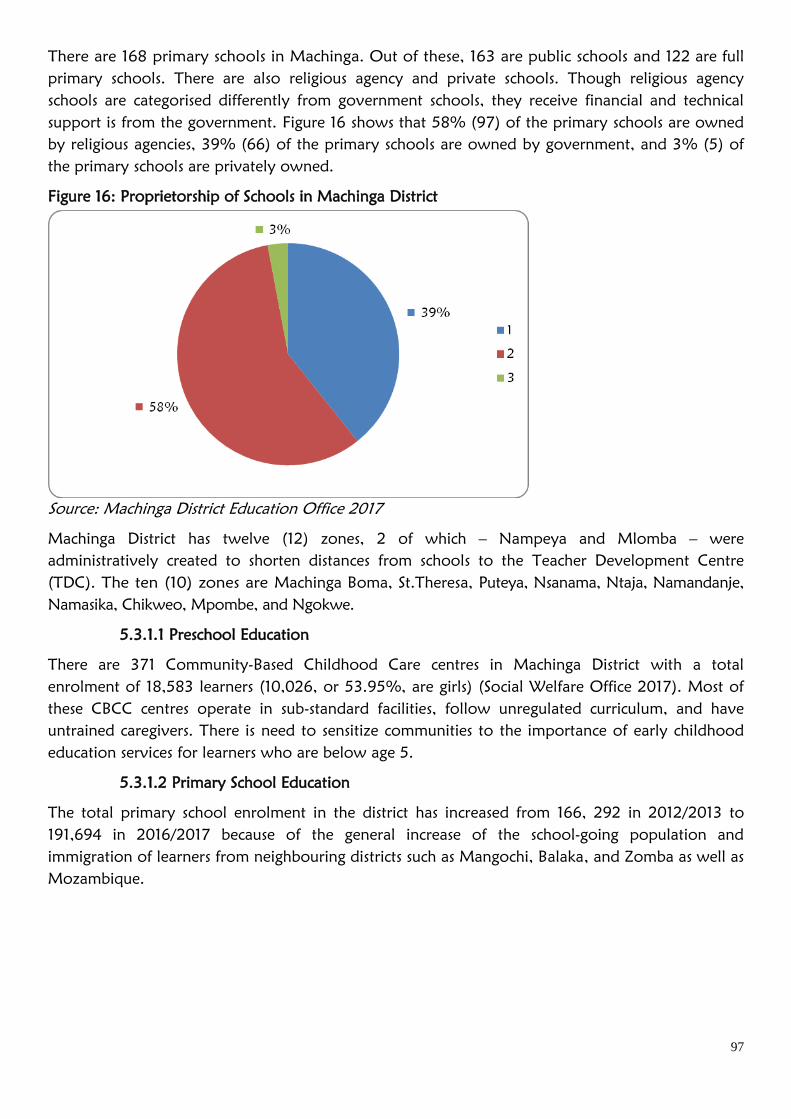
97
There are 168 primary schools in Machinga. Out of these, 163 are public schools and 122 are full
primary schools. There are also religious agency and private schools. Though religious agency
schools are categorised differently from government schools, they receive financial and technical
support is from the government. Figure 16 shows that 58% (97) of the primary schools are owned
by religious agencies, 39% (66) of the primary schools are owned by government, and 3% (5) of
the primary schools are privately owned.
Figure 16: Proprietorship of Schools in Machinga District
Source: Machinga District Education Office 2017
Machinga District has twelve (12) zones, 2 of which – Nampeya and Mlomba – were
administratively created to shorten distances from schools to the Teacher Development Centre
(TDC). The ten (10) zones are Machinga Boma, St.Theresa, Puteya, Nsanama, Ntaja, Namandanje,
Namasika, Chikweo, Mpombe, and Ngokwe.
5.3.1.1 Preschool Education
There are 371 Community-Based Childhood Care centres in Machinga District with a total
enrolment of 18,583 learners (10,026, or 53.95%, are girls) (Social Welfare Office 2017). Most of
these CBCC centres operate in sub-standard facilities, follow unregulated curriculum, and have
untrained caregivers. There is need to sensitize communities to the importance of early childhood
education services for learners who are below age 5.
5.3.1.2 Primary School Education
The total primary school enrolment in the district has increased from 166, 292 in 2012/2013 to
191,694 in 2016/2017 because of the general increase of the school-going population and
immigration of learners from neighbouring districts such as Mangochi, Balaka, and Zomba as well as
Mozambique.
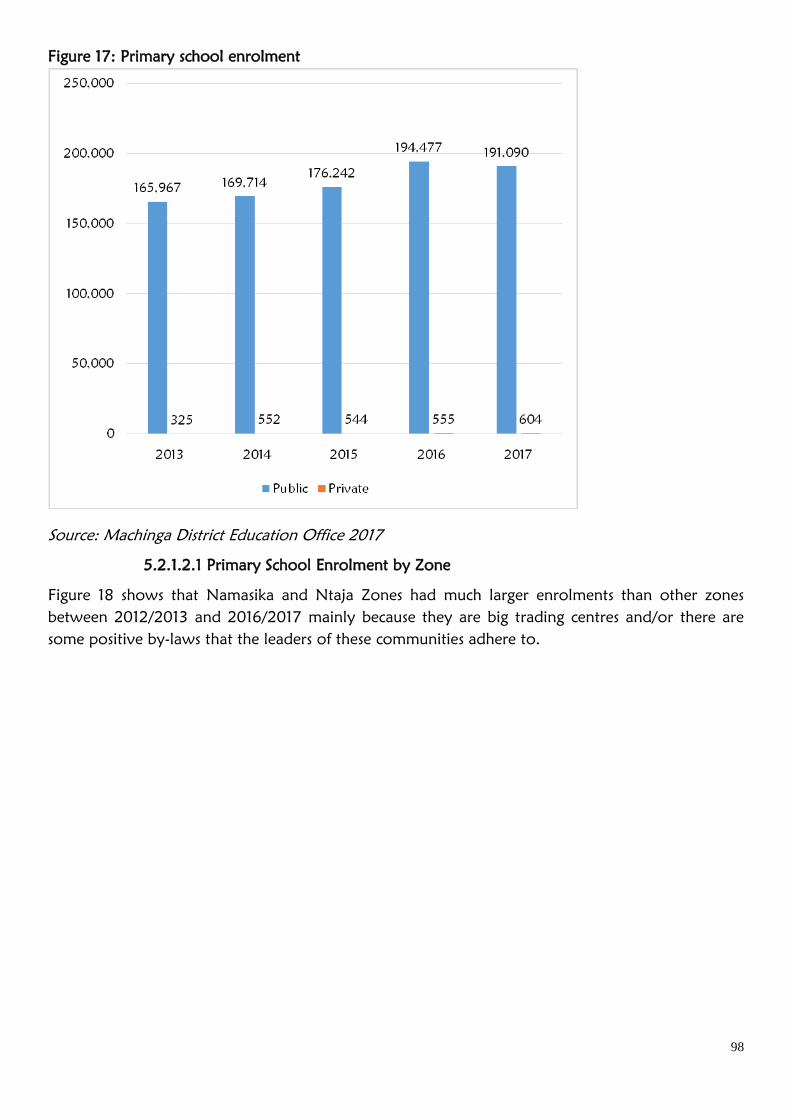
98
Figure 17: Primary school enrolment
Source: Machinga District Education Office 2017
5.2.1.2.1 Primary School Enrolment by Zone
Figure 18 shows that Namasika and Ntaja Zones had much larger enrolments than other zones
between 2012/2013 and 2016/2017 mainly because they are big trading centres and/or there are
some positive by-laws that the leaders of these communities adhere to.
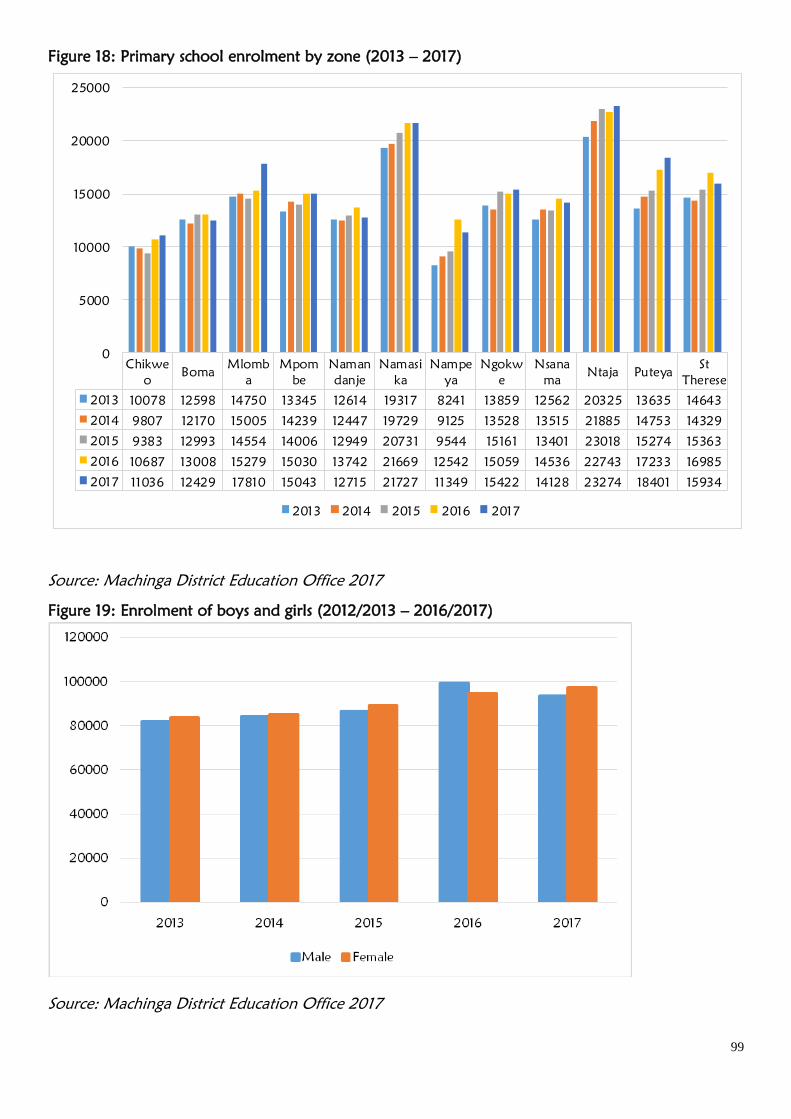
99
Figure 18: Primary school enrolment by zone (2013 – 2017)
Chikwe
oBoma
Mlomb
a
Mpom
be
Naman
danje
Namasi
ka
Nampe
ya
Ngokw
e
Nsana
maNtaja Puteya
St
Therese
2013 10078 12598 14750 13345 12614 19317 8241 13859 12562 20325 13635 14643
2014 9807 12170 15005 14239 12447 19729 9125 13528 13515 21885 14753 14329
2015 9383 12993 14554 14006 12949 20731 9544 15161 13401 23018 15274 15363
2016 10687 13008 15279 15030 13742 21669 12542 15059 14536 22743 17233 16985
2017 11036 12429 17810 15043 12715 21727 11349 15422 14128 23274 18401 15934
0
5000
10000
15000
20000
25000
2013 2014 2015 2016 2017
Source: Machinga District Education Office 2017
Figure 19: Enrolment of boys and girls (2012/2013 – 2016/2017)
Source: Machinga District Education Office 2017
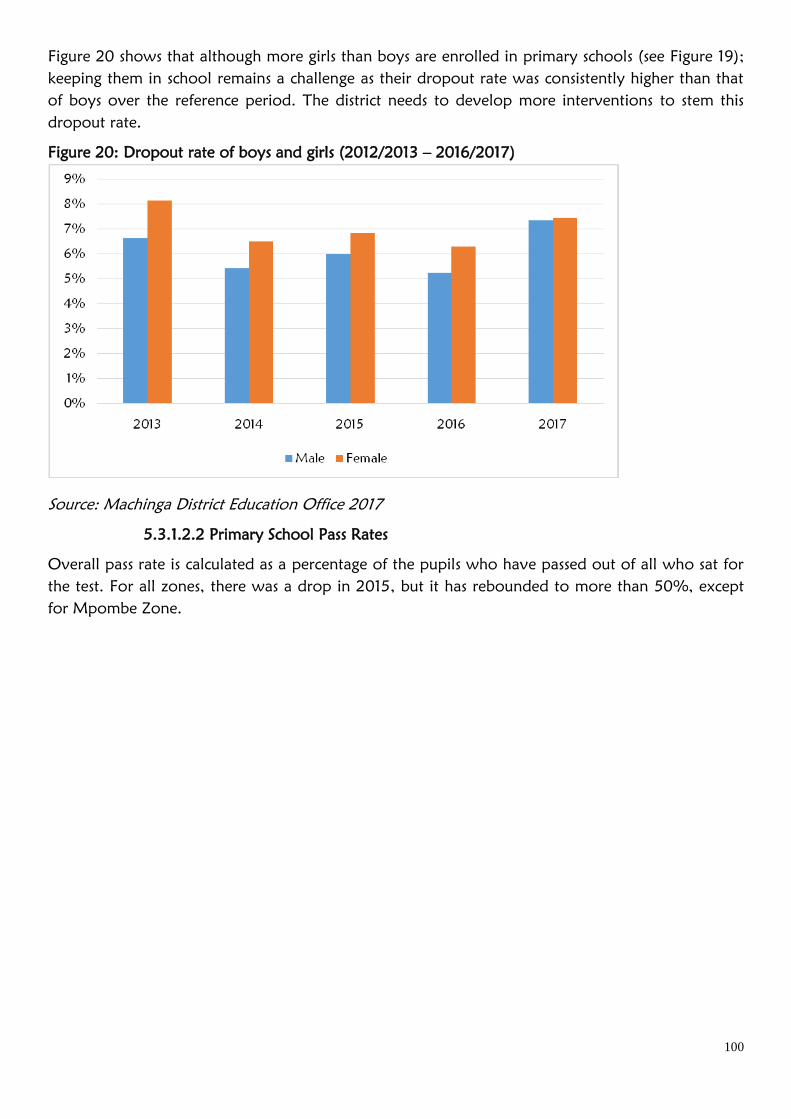
100
Figure 20 shows that although more girls than boys are enrolled in primary schools (see Figure 19);
keeping them in school remains a challenge as their dropout rate was consistently higher than that
of boys over the reference period. The district needs to develop more interventions to stem this
dropout rate.
Figure 20: Dropout rate of boys and girls (2012/2013 – 2016/2017)
Source: Machinga District Education Office 2017
5.3.1.2.2 Primary School Pass Rates
Overall pass rate is calculated as a percentage of the pupils who have passed out of all who sat for
the test. For all zones, there was a drop in 2015, but it has rebounded to more than 50%, except
for Mpombe Zone.
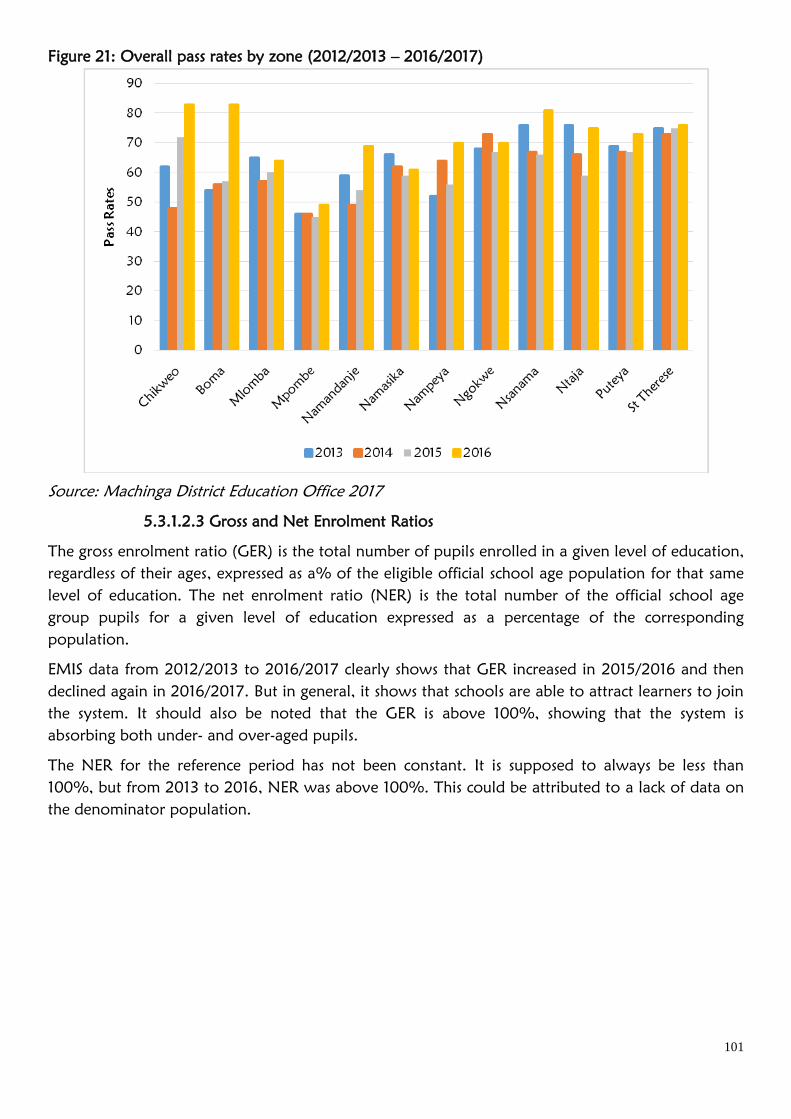
101
Figure 21: Overall pass rates by zone (2012/2013 – 2016/2017)
Source: Machinga District Education Office 2017
5.3.1.2.3 Gross and Net Enrolment Ratios
The gross enrolment ratio (GER) is the total number of pupils enrolled in a given level of education,
regardless of their ages, expressed as a% of the eligible official school age population for that same
level of education. The net enrolment ratio (NER) is the total number of the official school age
group pupils for a given level of education expressed as a percentage of the corresponding
population.
EMIS data from 2012/2013 to 2016/2017 clearly shows that GER increased in 2015/2016 and then
declined again in 2016/2017. But in general, it shows that schools are able to attract learners to join
the system. It should also be noted that the GER is above 100%, showing that the system is
absorbing both under- and over-aged pupils.
The NER for the reference period has not been constant. It is supposed to always be less than
100%, but from 2013 to 2016, NER was above 100%. This could be attributed to a lack of data on
the denominator population.
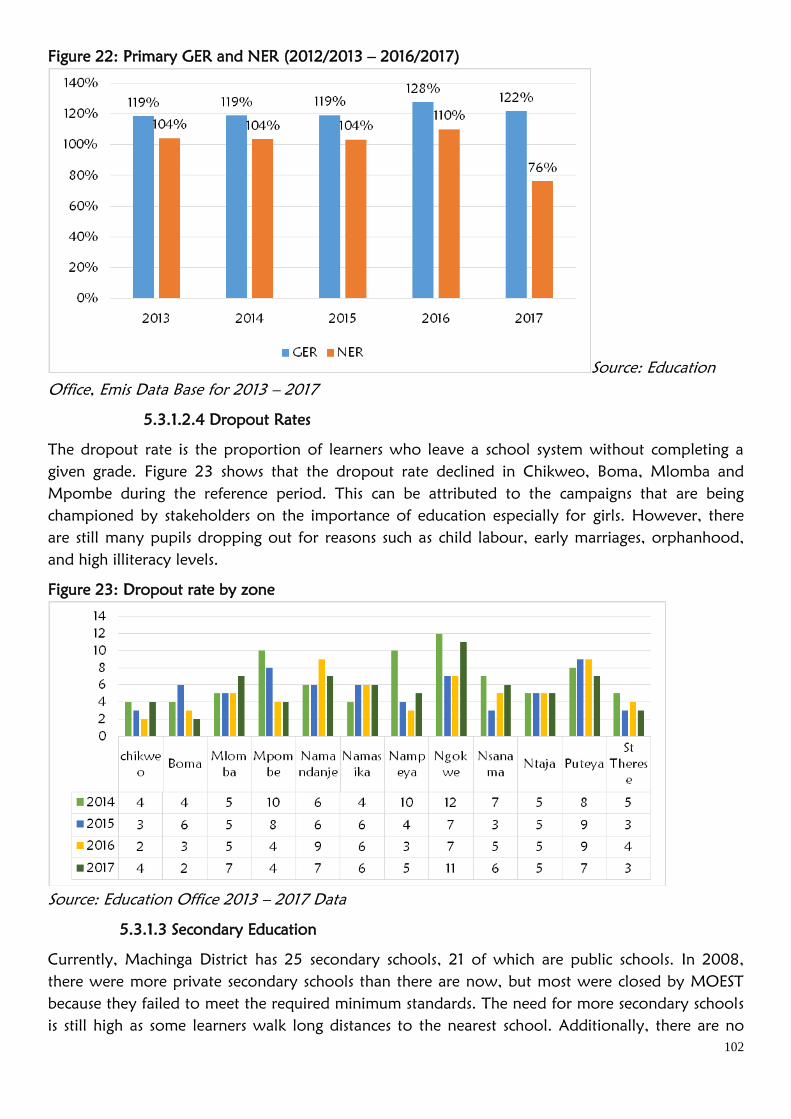
102
Figure 22: Primary GER and NER (2012/2013 – 2016/2017)
Source: Education
Office, Emis Data Base for 2013 – 2017
5.3.1.2.4 Dropout Rates
The dropout rate is the proportion of learners who leave a school system without completing a
given grade. Figure 23 shows that the dropout rate declined in Chikweo, Boma, Mlomba and
Mpombe during the reference period. This can be attributed to the campaigns that are being
championed by stakeholders on the importance of education especially for girls. However, there
are still many pupils dropping out for reasons such as child labour, early marriages, orphanhood,
and high illiteracy levels.
Figure 23: Dropout rate by zone
Source: Education Office 2013 – 2017 Data
5.3.1.3 Secondary Education
Currently, Machinga District has 25 secondary schools, 21 of which are public schools. In 2008,
there were more private secondary schools than there are now, but most were closed by MOEST
because they failed to meet the required minimum standards. The need for more secondary schools
is still high as some learners walk long distances to the nearest school. Additionally, there are no

103
district boarding schools as is the case in other districts. Despite these challenges, enrolment has
been steadily increasing due to the efforts of many NGOs that support the sector.
Figure 24: Secondary school enrolment
Source: Machinga District Education EMIS 2013 - 2017
The number of orphans in Machinga District Secondary Schools is steadily increasing due to
HIV/AIDS. Most of these orphans require material as well as psycho-social support and care to
enable them to withstand the effects of orphanhood. To alleviate some of these challenges,
bursaries are being provided by the government, NGOs, and religious institutions.
5.3.1.4 Tertiary Education
Machinga District has one conventional teacher training college, which provides a two-year teacher
education programme. Machinga Teacher Training College opened in September 2010. Currently,
the college accommodates 2,608 students (Table 64). Note that Open and Distance Mode of
Learning phased out in 2015/2016.
Table 64: Enrolment of student teachers against school years (2012/2013 – 2016/2017)
Year Males Females Total
IPTE ODL IPTE ODL
2013 328 658 306 322 1,614
2014 364 566 227 384 1,541
2015 290 296 132 28 746
2016 241 0 95 0 336
2017 293 0 62 0 355
NB: IPTE means Initial Primary Teacher Education and ODL stands Open and Distance Learning.
Source: Machinga District Education Office 2017
The student teacher dropout rate increased from 2.41% in 2015 to 4.76% in 2016. Most students
drop out mainly due to pregnancy, alternative employment and family responsibility.
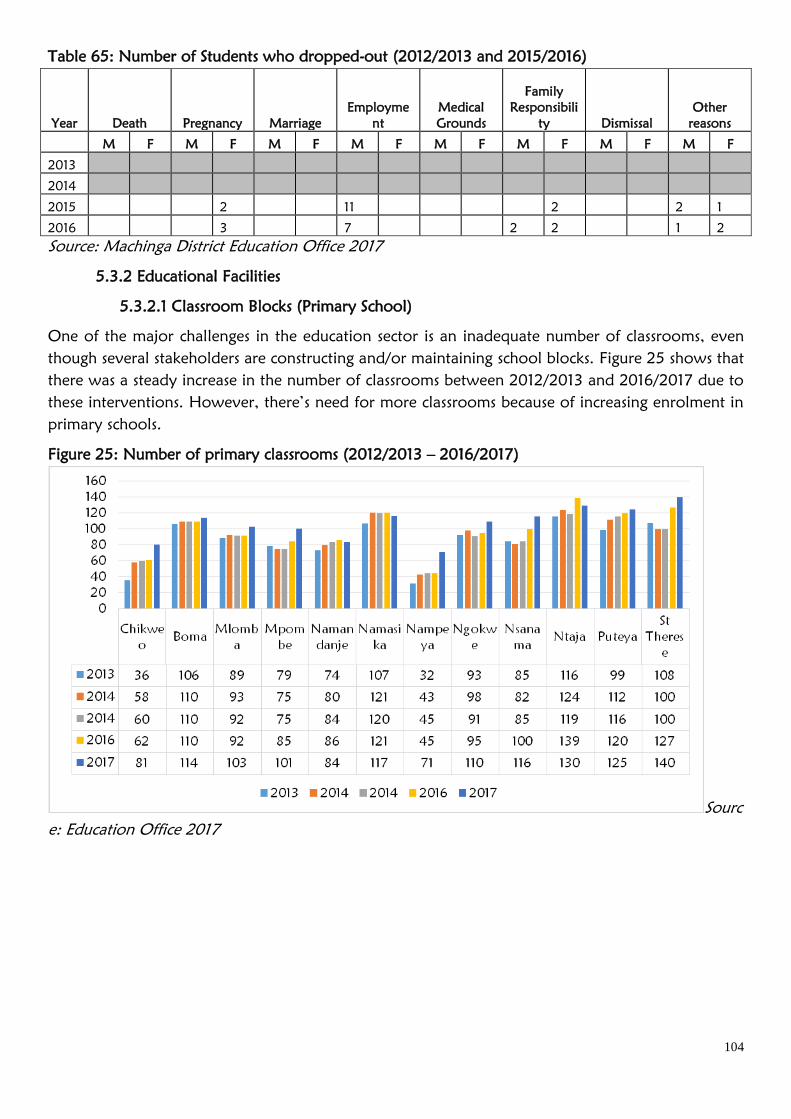
104
Table 65: Number of Students who dropped-out (2012/2013 and 2015/2016)
Year Death Pregnancy Marriage
Employme
nt
Medical
Grounds
Family
Responsibili
ty Dismissal
Other
reasons
M F M F M F M F M F M F M F M F
2013
2014
2015 2 11 2 2 1
2016 3 7 2 2 1 2
Source: Machinga District Education Office 2017
5.3.2 Educational Facilities
5.3.2.1 Classroom Blocks (Primary School)
One of the major challenges in the education sector is an inadequate number of classrooms, even
though several stakeholders are constructing and/or maintaining school blocks. Figure 25 shows that
there was a steady increase in the number of classrooms between 2012/2013 and 2016/2017 due to
these interventions. However, there’s need for more classrooms because of increasing enrolment in
primary schools.
Figure 25: Number of primary classrooms (2012/2013 – 2016/2017)
Sourc
e: Education Office 2017
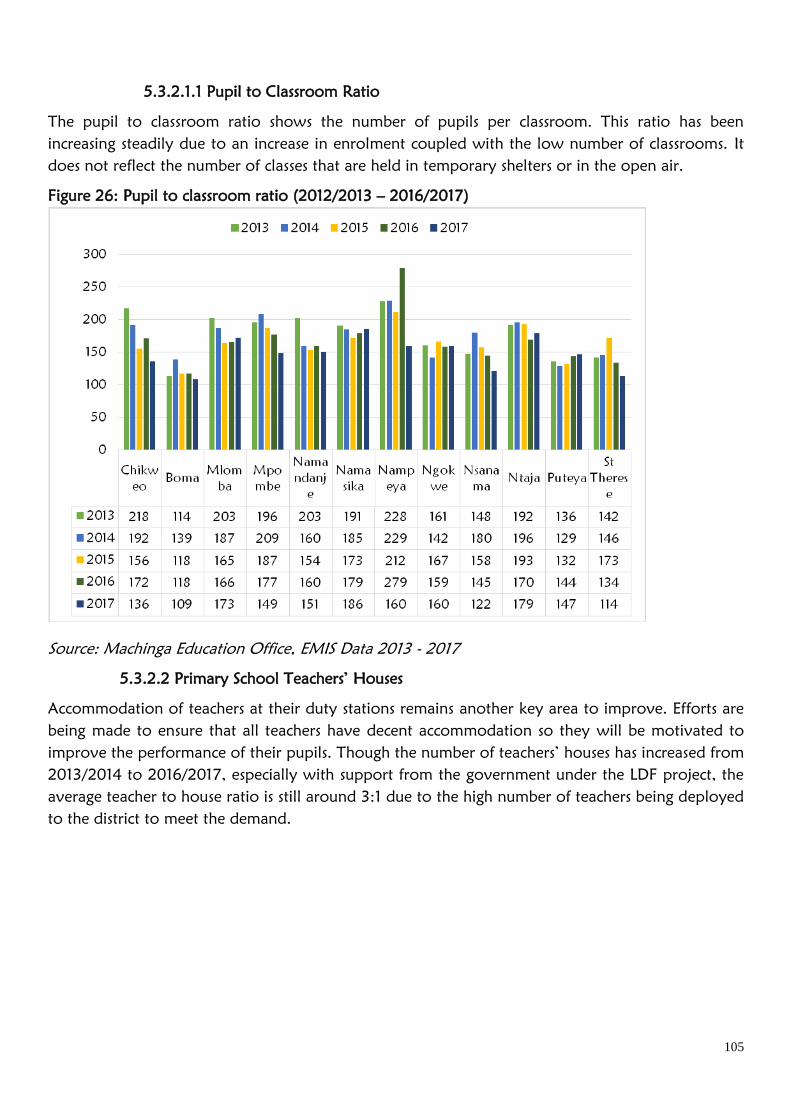
105
5.3.2.1.1 Pupil to Classroom Ratio
The pupil to classroom ratio shows the number of pupils per classroom. This ratio has been
increasing steadily due to an increase in enrolment coupled with the low number of classrooms. It
does not reflect the number of classes that are held in temporary shelters or in the open air.
Figure 26: Pupil to classroom ratio (2012/2013 – 2016/2017)
Source: Machinga Education Office, EMIS Data 2013 - 2017
5.3.2.2 Primary School Teachers’ Houses
Accommodation of teachers at their duty stations remains another key area to improve. Efforts are
being made to ensure that all teachers have decent accommodation so they will be motivated to
improve the performance of their pupils. Though the number of teachers’ houses has increased from
2013/2014 to 2016/2017, especially with support from the government under the LDF project, the
average teacher to house ratio is still around 3:1 due to the high number of teachers being deployed
to the district to meet the demand.
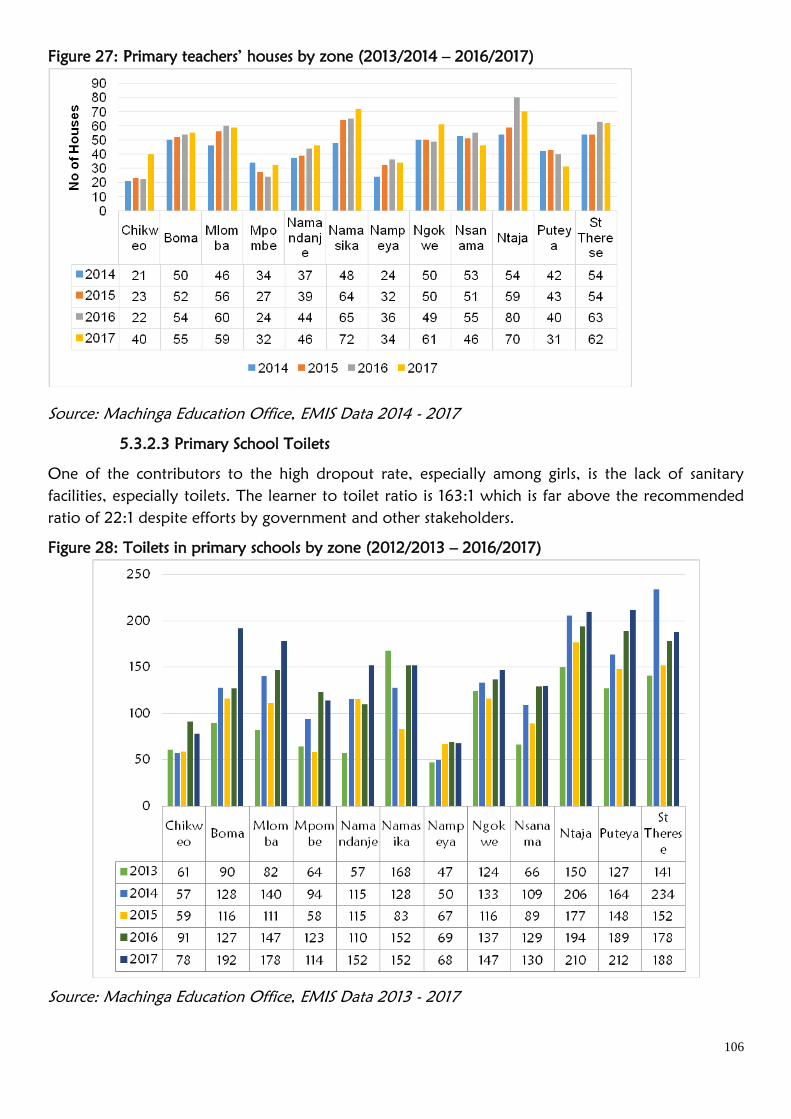
106
Figure 27: Primary teachers’ houses by zone (2013/2014 – 2016/2017)
Source: Machinga Education Office, EMIS Data 2014 - 2017
5.3.2.3 Primary School Toilets
One of the contributors to the high dropout rate, especially among girls, is the lack of sanitary
facilities, especially toilets. The learner to toilet ratio is 163:1 which is far above the recommended
ratio of 22:1 despite efforts by government and other stakeholders.
Figure 28: Toilets in primary schools by zone (2012/2013 – 2016/2017)
Source: Machinga Education Office, EMIS Data 2013 - 2017
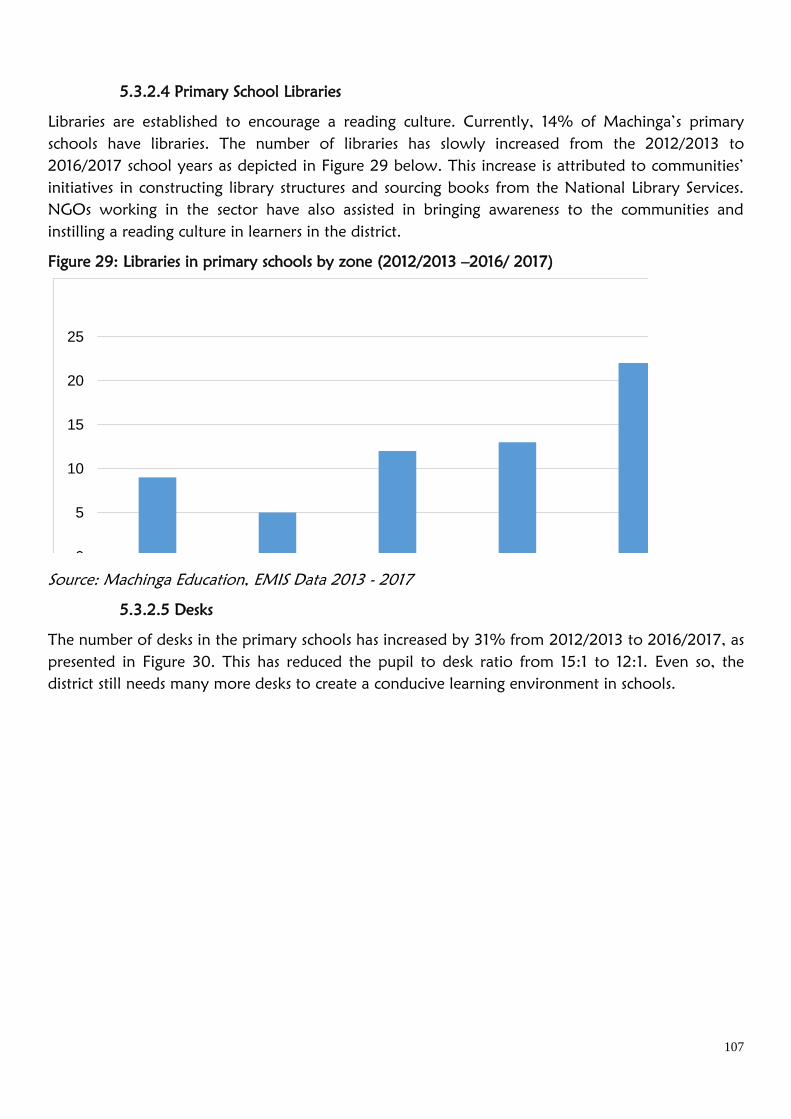
107
5.3.2.4 Primary School Libraries
Libraries are established to encourage a reading culture. Currently, 14% of Machinga’s primary
schools have libraries. The number of libraries has slowly increased from the 2012/2013 to
2016/2017 school years as depicted in Figure 29 below. This increase is attributed to communities’
initiatives in constructing library structures and sourcing books from the National Library Services.
NGOs working in the sector have also assisted in bringing awareness to the communities and
instilling a reading culture in learners in the district.
Figure 29: Libraries in primary schools by zone (2012/2013 –2016/ 2017)
0
5
10
15
20
25
2013 2014 2015 2016 2017
Source: Machinga Education, EMIS Data 2013 - 2017
5.3.2.5 Desks
The number of desks in the primary schools has increased by 31% from 2012/2013 to 2016/2017, as
presented in Figure 30. This has reduced the pupil to desk ratio from 15:1 to 12:1. Even so, the
district still needs many more desks to create a conducive learning environment in schools.
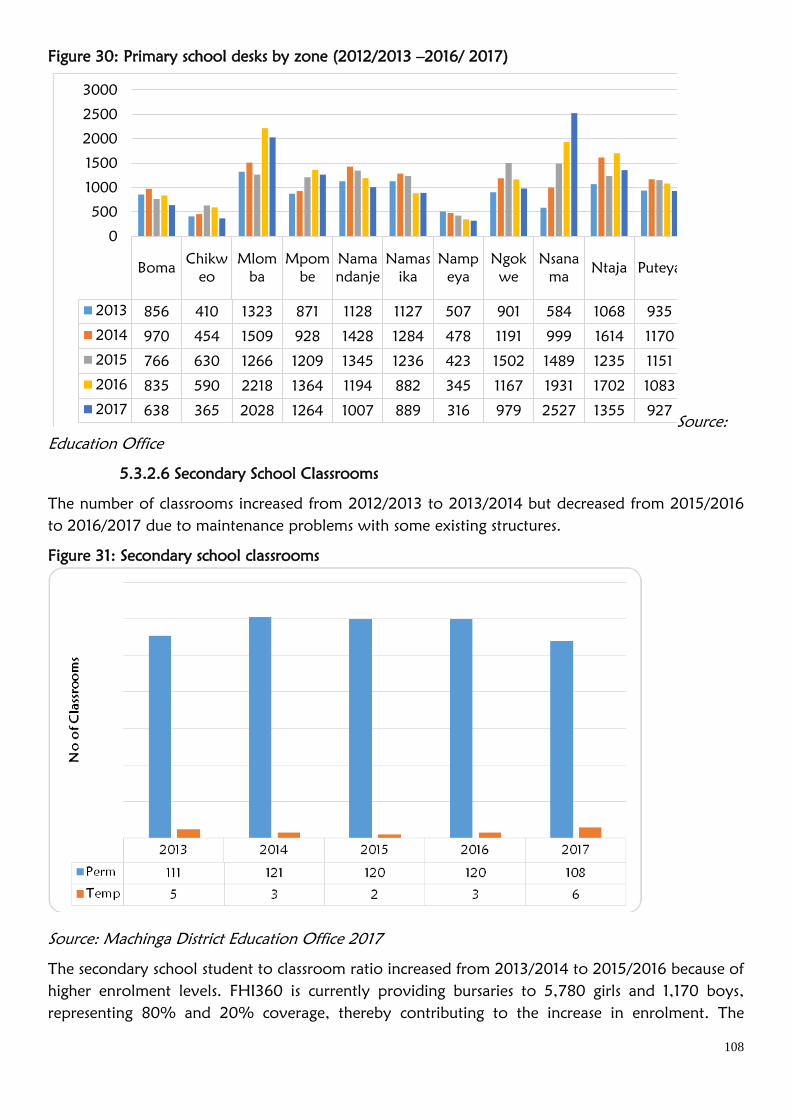
108
Figure 30: Primary school desks by zone (2012/2013 –2016/ 2017)
BomaChikw
eo
Mlom
ba
Mpom
be
Nama
ndanje
Namas
ika
Namp
eya
Ngok
we
Nsana
maNtaja Puteya
St
Theres
e
2013 856 410 1323 871 1128 1127 507 901 584 1068 935 1491
2014 970 454 1509 928 1428 1284 478 1191 999 1614 1170 1537
2015 766 630 1266 1209 1345 1236 423 1502 1489 1235 1151 1722
2016 835 590 2218 1364 1194 882 345 1167 1931 1702 1083 2512
2017 638 365 2028 1264 1007 889 316 979 2527 1355 927 2390
0
500
1000
1500
2000
2500
3000
2013 2014 2015 2016 2017
Source:
Education Office
5.3.2.6 Secondary School Classrooms
The number of classrooms increased from 2012/2013 to 2013/2014 but decreased from 2015/2016
to 2016/2017 due to maintenance problems with some existing structures.
Figure 31: Secondary school classrooms
Source: Machinga District Education Office 2017
The secondary school student to classroom ratio increased from 2013/2014 to 2015/2016 because of
higher enrolment levels. FHI360 is currently providing bursaries to 5,780 girls and 1,170 boys,
representing 80% and 20% coverage, thereby contributing to the increase in enrolment. The
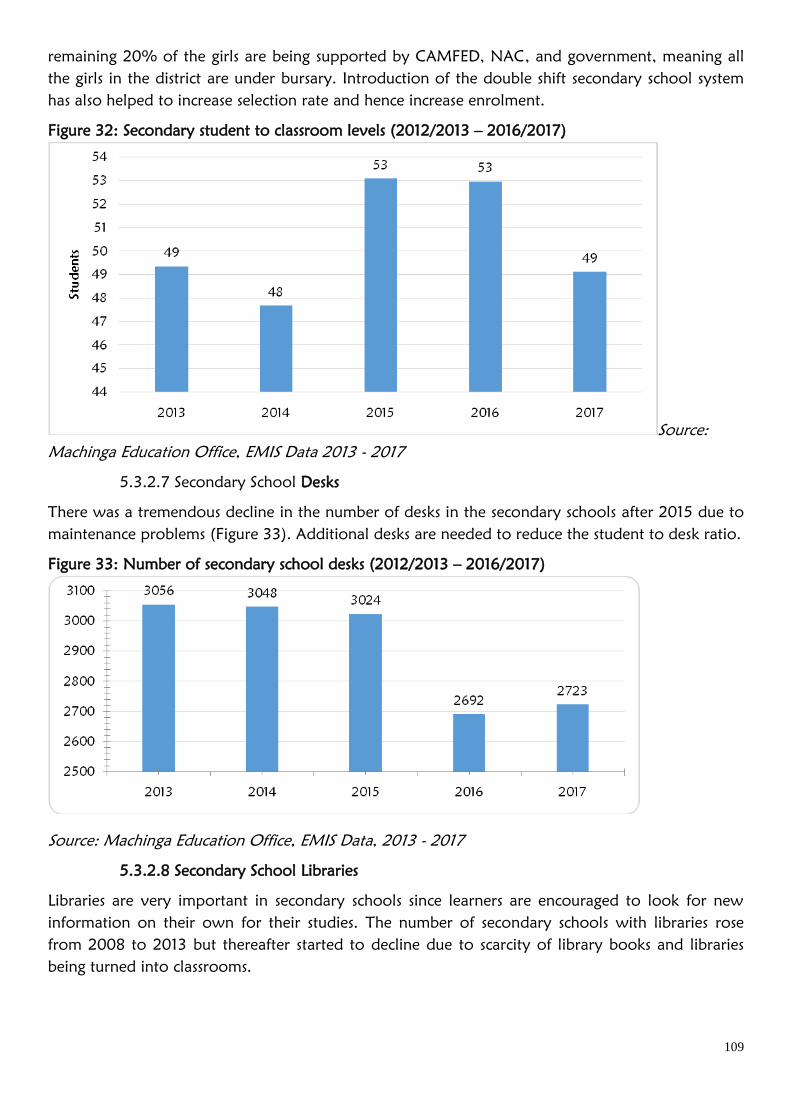
109
remaining 20% of the girls are being supported by CAMFED, NAC, and government, meaning all
the girls in the district are under bursary. Introduction of the double shift secondary school system
has also helped to increase selection rate and hence increase enrolment.
Figure 32: Secondary student to classroom levels (2012/2013 – 2016/2017)
Source:
Machinga Education Office, EMIS Data 2013 - 2017
5.3.2.7 Secondary School Desks
There was a tremendous decline in the number of desks in the secondary schools after 2015 due to
maintenance problems (Figure 33). Additional desks are needed to reduce the student to desk ratio.
Figure 33: Number of secondary school desks (2012/2013 – 2016/2017)
Source: Machinga Education Office, EMIS Data, 2013 - 2017
5.3.2.8 Secondary School Libraries
Libraries are very important in secondary schools since learners are encouraged to look for new
information on their own for their studies. The number of secondary schools with libraries rose
from 2008 to 2013 but thereafter started to decline due to scarcity of library books and libraries
being turned into classrooms.
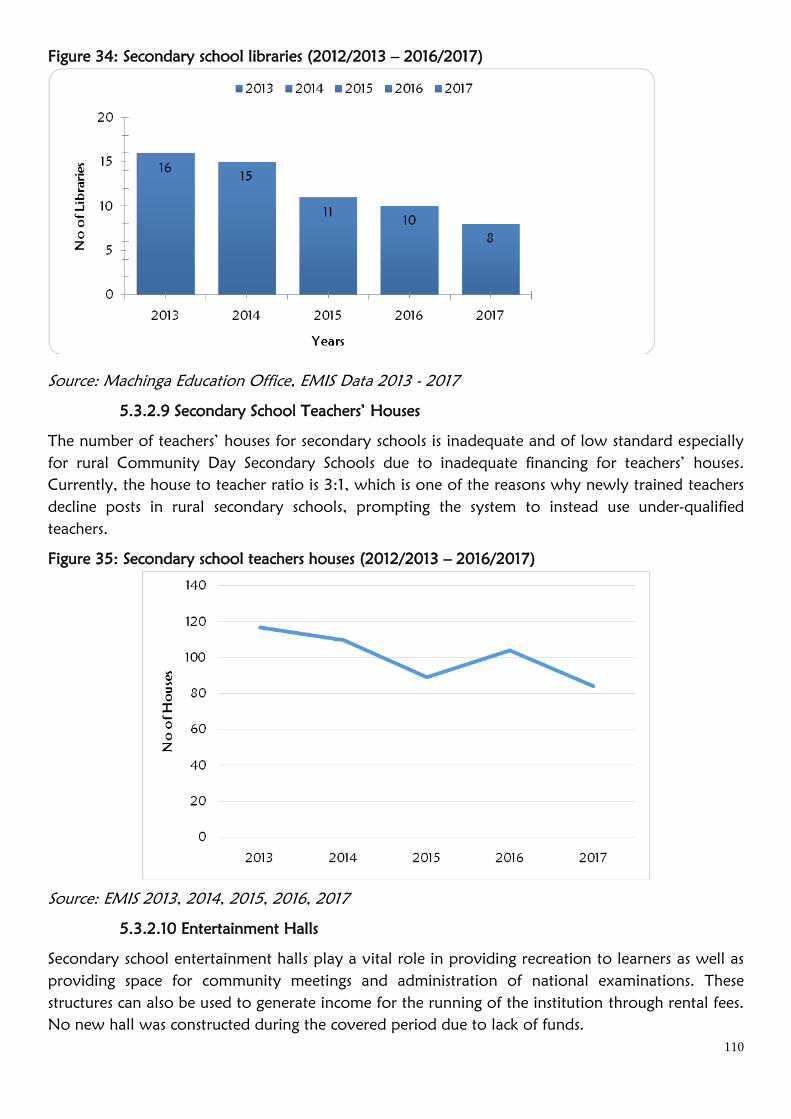
110
Figure 34: Secondary school libraries (2012/2013 – 2016/2017)
Source: Machinga Education Office, EMIS Data 2013 - 2017
5.3.2.9 Secondary School Teachers’ Houses
The number of teachers’ houses for secondary schools is inadequate and of low standard especially
for rural Community Day Secondary Schools due to inadequate financing for teachers’ houses.
Currently, the house to teacher ratio is 3:1, which is one of the reasons why newly trained teachers
decline posts in rural secondary schools, prompting the system to instead use under-qualified
teachers.
Figure 35: Secondary school teachers houses (2012/2013 – 2016/2017)
Source: EMIS 2013, 2014, 2015, 2016, 2017
5.3.2.10 Entertainment Halls
Secondary school entertainment halls play a vital role in providing recreation to learners as well as
providing space for community meetings and administration of national examinations. These
structures can also be used to generate income for the running of the institution through rental fees.
No new hall was constructed during the covered period due to lack of funds.
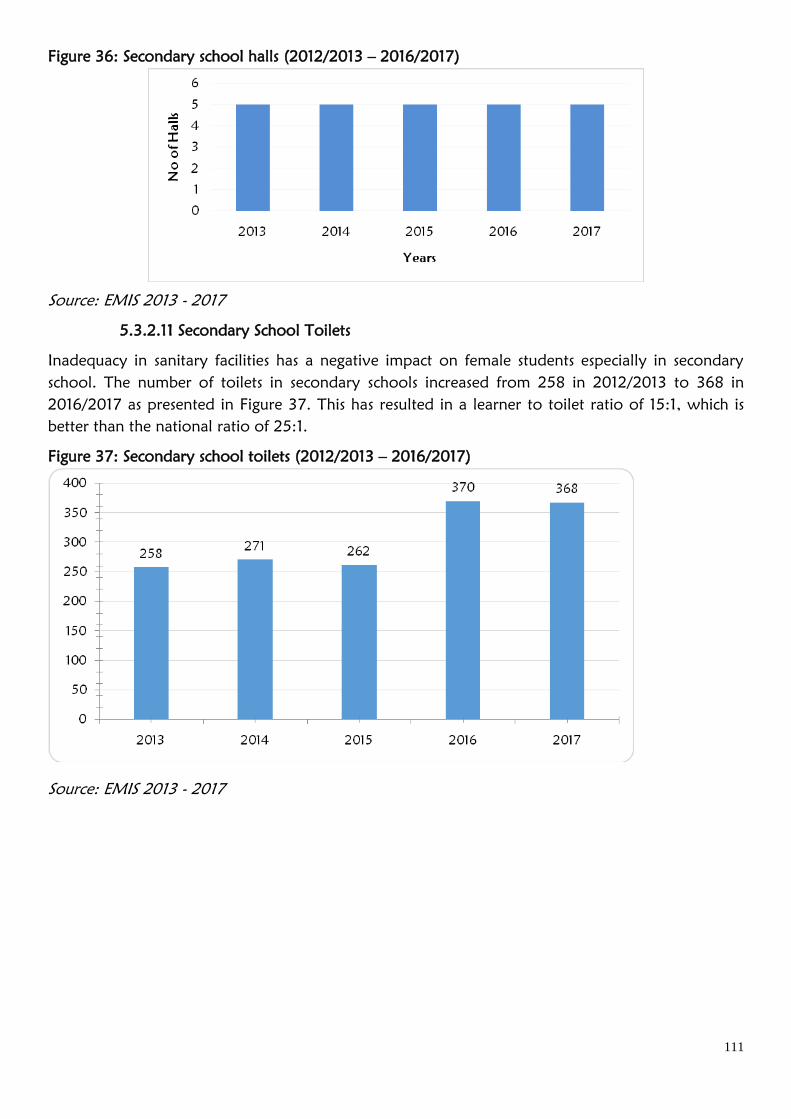
111
Figure 36: Secondary school halls (2012/2013 – 2016/2017)
Source: EMIS 2013 - 2017
5.3.2.11 Secondary School Toilets
Inadequacy in sanitary facilities has a negative impact on female students especially in secondary
school. The number of toilets in secondary schools increased from 258 in 2012/2013 to 368 in
2016/2017 as presented in Figure 37. This has resulted in a learner to toilet ratio of 15:1, which is
better than the national ratio of 25:1.
Figure 37: Secondary school toilets (2012/2013 – 2016/2017)
Source: EMIS 2013 - 2017
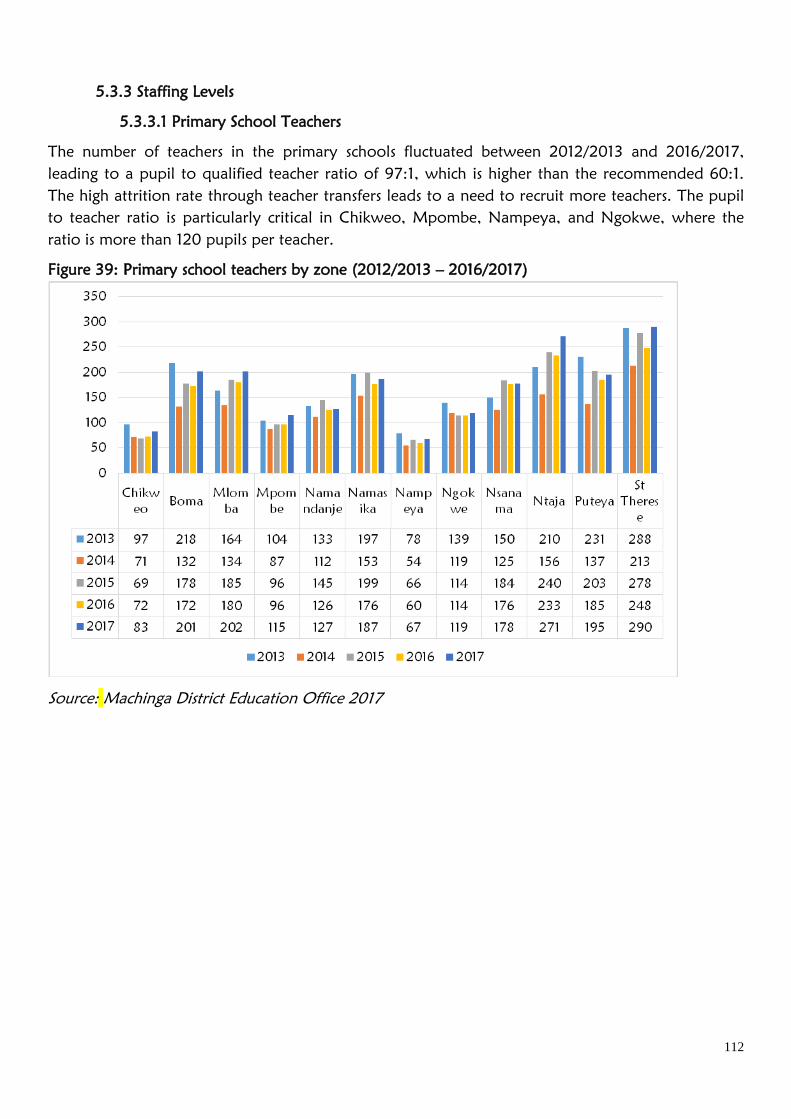
112
5.3.3 Staffing Levels
5.3.3.1 Primary School Teachers
The number of teachers in the primary schools fluctuated between 2012/2013 and 2016/2017,
leading to a pupil to qualified teacher ratio of 97:1, which is higher than the recommended 60:1.
The high attrition rate through teacher transfers leads to a need to recruit more teachers. The pupil
to teacher ratio is particularly critical in Chikweo, Mpombe, Nampeya, and Ngokwe, where the
ratio is more than 120 pupils per teacher.
Figure 39: Primary school teachers by zone (2012/2013 – 2016/2017)
Source: Machinga District Education Office 2017
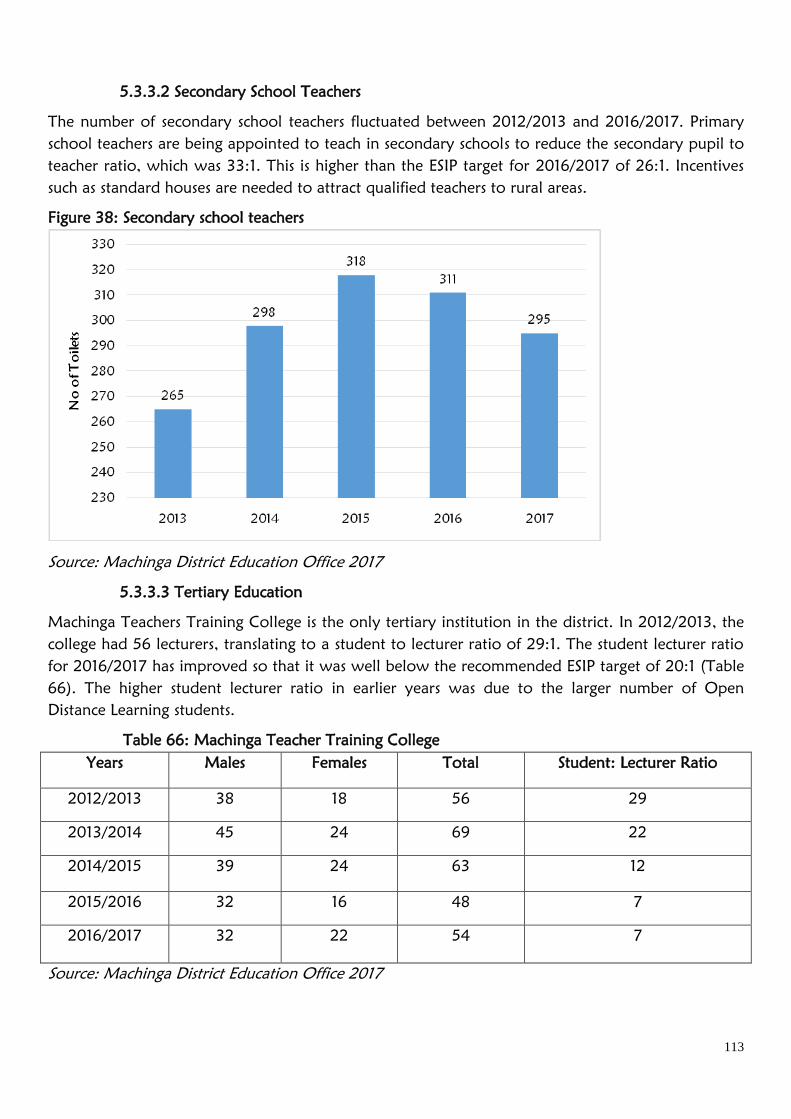
113
5.3.3.2 Secondary School Teachers
The number of secondary school teachers fluctuated between 2012/2013 and 2016/2017. Primary
school teachers are being appointed to teach in secondary schools to reduce the secondary pupil to
teacher ratio, which was 33:1. This is higher than the ESIP target for 2016/2017 of 26:1. Incentives
such as standard houses are needed to attract qualified teachers to rural areas.
Figure 38: Secondary school teachers
Source: Machinga District Education Office 2017
5.3.3.3 Tertiary Education
Machinga Teachers Training College is the only tertiary institution in the district. In 2012/2013, the
college had 56 lecturers, translating to a student to lecturer ratio of 29:1. The student lecturer ratio
for 2016/2017 has improved so that it was well below the recommended ESIP target of 20:1 (Table
66). The higher student lecturer ratio in earlier years was due to the larger number of Open
Distance Learning students.
Table 66: Machinga Teacher Training College
Years Males Females Total Student: Lecturer Ratio
2012/2013 38 18 56 29
2013/2014 45 24 69 22
2014/2015 39 24 63 12
2015/2016 32 16 48 7
2016/2017 32 22 54 7
Source: Machinga District Education Office 2017
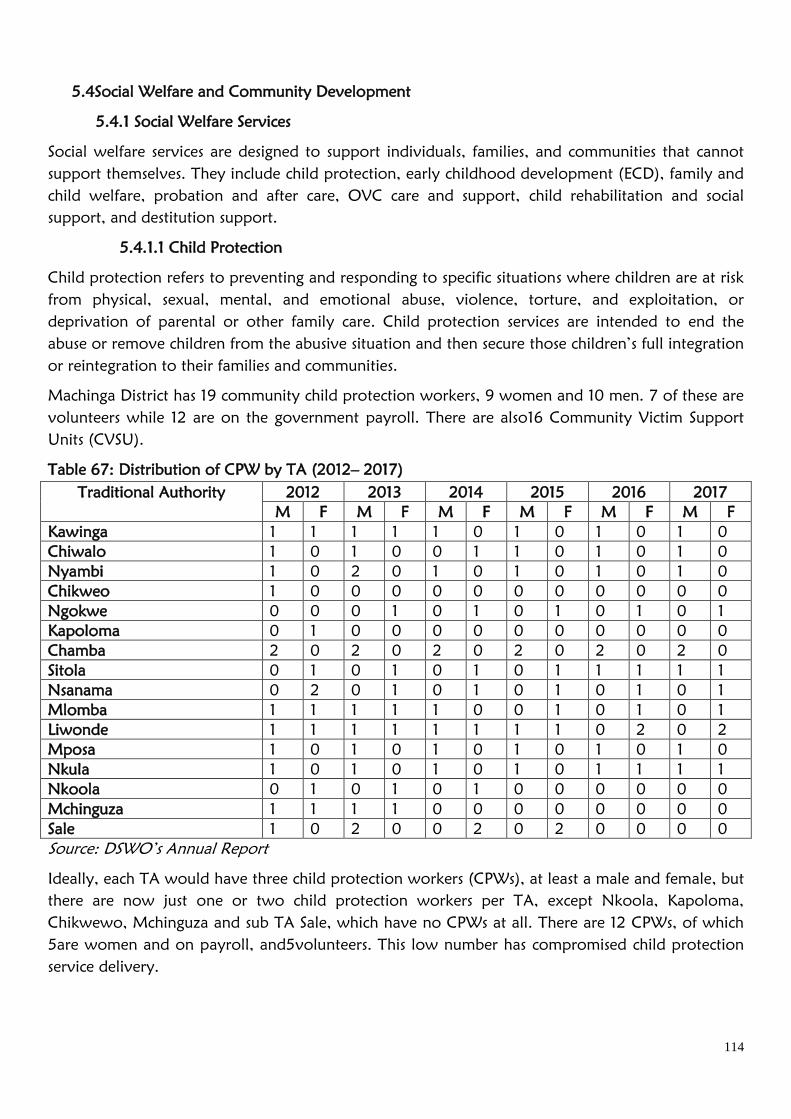
114
5.4Social Welfare and Community Development
5.4.1 Social Welfare Services
Social welfare services are designed to support individuals, families, and communities that cannot
support themselves. They include child protection, early childhood development (ECD), family and
child welfare, probation and after care, OVC care and support, child rehabilitation and social
support, and destitution support.
5.4.1.1 Child Protection
Child protection refers to preventing and responding to specific situations where children are at risk
from physical, sexual, mental, and emotional abuse, violence, torture, and exploitation, or
deprivation of parental or other family care. Child protection services are intended to end the
abuse or remove children from the abusive situation and then secure those children’s full integration
or reintegration to their families and communities.
Machinga District has 19 community child protection workers, 9 women and 10 men. 7 of these are
volunteers while 12 are on the government payroll. There are also16 Community Victim Support
Units (CVSU).
Table 67: Distribution of CPW by TA (2012– 2017)
Traditional Authority 2012 2013 2014 2015 2016 2017
M F M F M F M F M F M F
Kawinga 1 1 1 1 1 0 1 0 1 0 1 0
Chiwalo 1 0 1 0 0 1 1 0 1 0 1 0
Nyambi 1 0 2 0 1 0 1 0 1 0 1 0
Chikweo 1 0 0 0 0 0 0 0 0 0 0 0
Ngokwe 0 0 0 1 0 1 0 1 0 1 0 1
Kapoloma 0 1 0 0 0 0 0 0 0 0 0 0
Chamba 2 0 2 0 2 0 2 0 2 0 2 0
Sitola 0 1 0 1 0 1 0 1 1 1 1 1
Nsanama 0 2 0 1 0 1 0 1 0 1 0 1
Mlomba 1 1 1 1 1 0 0 1 0 1 0 1
Liwonde 1 1 1 1 1 1 1 1 0 2 0 2
Mposa 1 0 1 0 1 0 1 0 1 0 1 0
Nkula 1 0 1 0 1 0 1 0 1 1 1 1
Nkoola 0 1 0 1 0 1 0 0 0 0 0 0
Mchinguza 1 1 1 1 0 0 0 0 0 0 0 0
Sale 1 0 2 0 0 2 0 2 0 0 0 0
Source: DSWO’s Annual Report
Ideally, each TA would have three child protection workers (CPWs), at least a male and female, but
there are now just one or two child protection workers per TA, except Nkoola, Kapoloma,
Chikwewo, Mchinguza and sub TA Sale, which have no CPWs at all. There are 12 CPWs, of which
5are women and on payroll, and5volunteers. This low number has compromised child protection
service delivery.
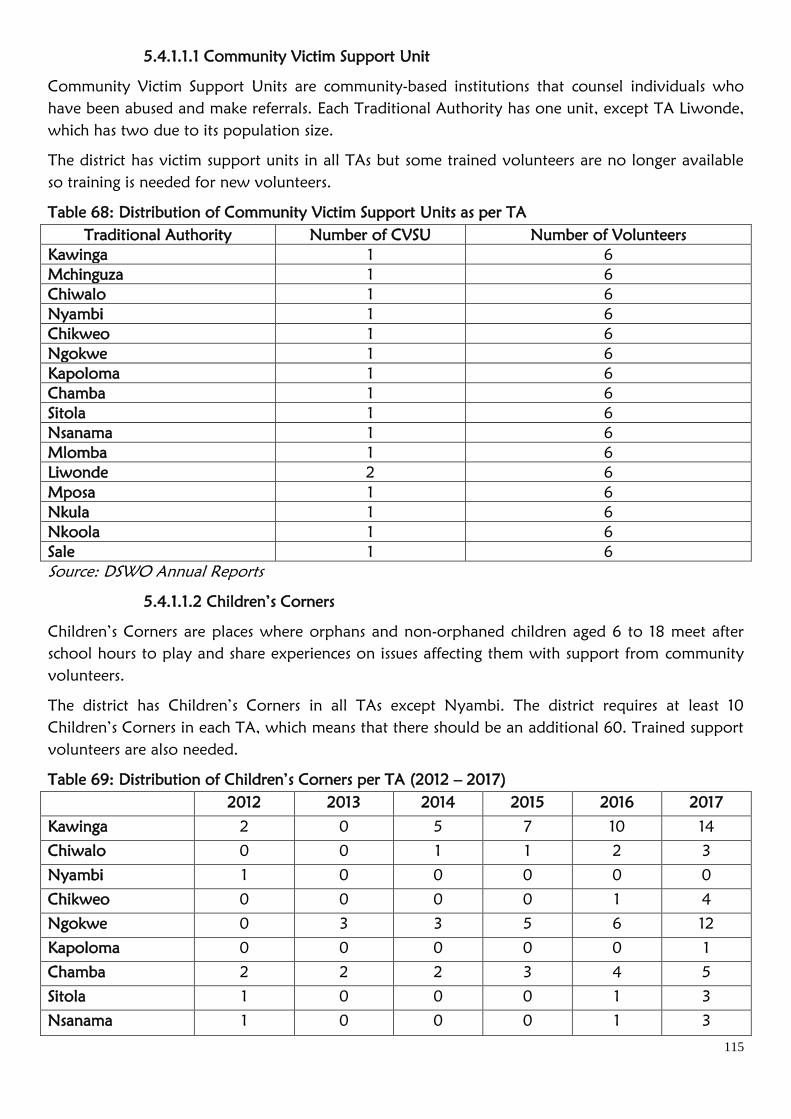
115
5.4.1.1.1 Community Victim Support Unit
Community Victim Support Units are community-based institutions that counsel individuals who
have been abused and make referrals. Each Traditional Authority has one unit, except TA Liwonde,
which has two due to its population size.
The district has victim support units in all TAs but some trained volunteers are no longer available
so training is needed for new volunteers.
Table 68: Distribution of Community Victim Support Units as per TA
Traditional Authority Number of CVSU Number of Volunteers
Kawinga 1 6
Mchinguza 1 6
Chiwalo 1 6
Nyambi 1 6
Chikweo 1 6
Ngokwe 1 6
Kapoloma 1 6
Chamba 1 6
Sitola 1 6
Nsanama 1 6
Mlomba 1 6
Liwonde 2 6
Mposa 1 6
Nkula 1 6
Nkoola 1 6
Sale 1 6
Source: DSWO Annual Reports
5.4.1.1.2 Children’s Corners
Children’s Corners are places where orphans and non-orphaned children aged 6 to 18 meet after
school hours to play and share experiences on issues affecting them with support from community
volunteers.
The district has Children’s Corners in all TAs except Nyambi. The district requires at least 10
Children’s Corners in each TA, which means that there should be an additional 60. Trained support
volunteers are also needed.
Table 69: Distribution of Children’s Corners per TA (2012 – 2017)
2012 2013 2014 2015 2016 2017
Kawinga 2 0 5 7 10 14
Chiwalo 0 0 1 1 2 3
Nyambi 1 0 0 0 0 0
Chikweo 0 0 0 0 1 4
Ngokwe 0 3 3 5 6 12
Kapoloma 0 0 0 0 0 1
Chamba 2 2 2 3 4 5
Sitola 1 0 0 0 1 3
Nsanama 1 0 0 0 1 3
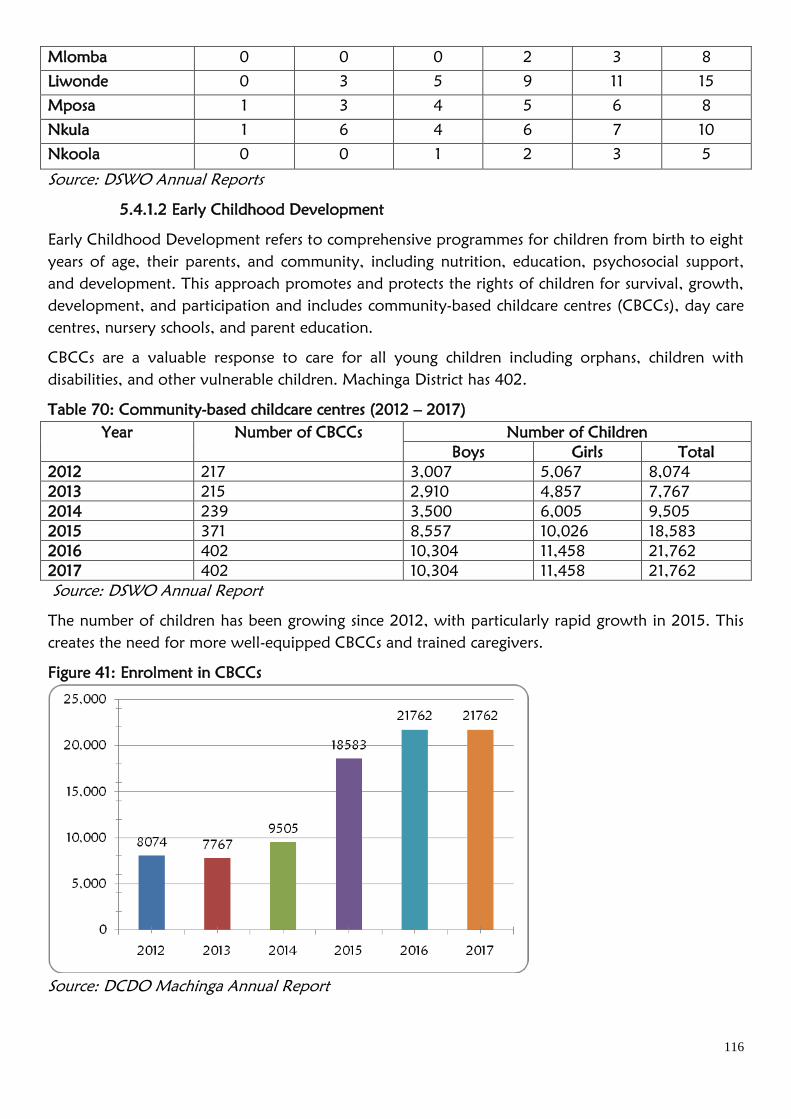
116
Mlomba 0 0 0 2 3 8
Liwonde 0 3 5 9 11 15
Mposa 1 3 4 5 6 8
Nkula 1 6 4 6 7 10
Nkoola 0 0 1 2 3 5
Source: DSWO Annual Reports
5.4.1.2 Early Childhood Development
Early Childhood Development refers to comprehensive programmes for children from birth to eight
years of age, their parents, and community, including nutrition, education, psychosocial support,
and development. This approach promotes and protects the rights of children for survival, growth,
development, and participation and includes community-based childcare centres (CBCCs), day care
centres, nursery schools, and parent education.
CBCCs are a valuable response to care for all young children including orphans, children with
disabilities, and other vulnerable children. Machinga District has 402.
Table 70: Community-based childcare centres (2012 – 2017)
Year Number of CBCCs Number of Children
Boys Girls Total
2012 217 3,007 5,067 8,074
2013 215 2,910 4,857 7,767
2014 239 3,500 6,005 9,505
2015 371 8,557 10,026 18,583
2016 402 10,304 11,458 21,762
2017 402 10,304 11,458 21,762
Source: DSWO Annual Report
The number of children has been growing since 2012, with particularly rapid growth in 2015. This
creates the need for more well-equipped CBCCs and trained caregivers.
Figure 41: Enrolment in CBCCs
Source: DCDO Machinga Annual Report
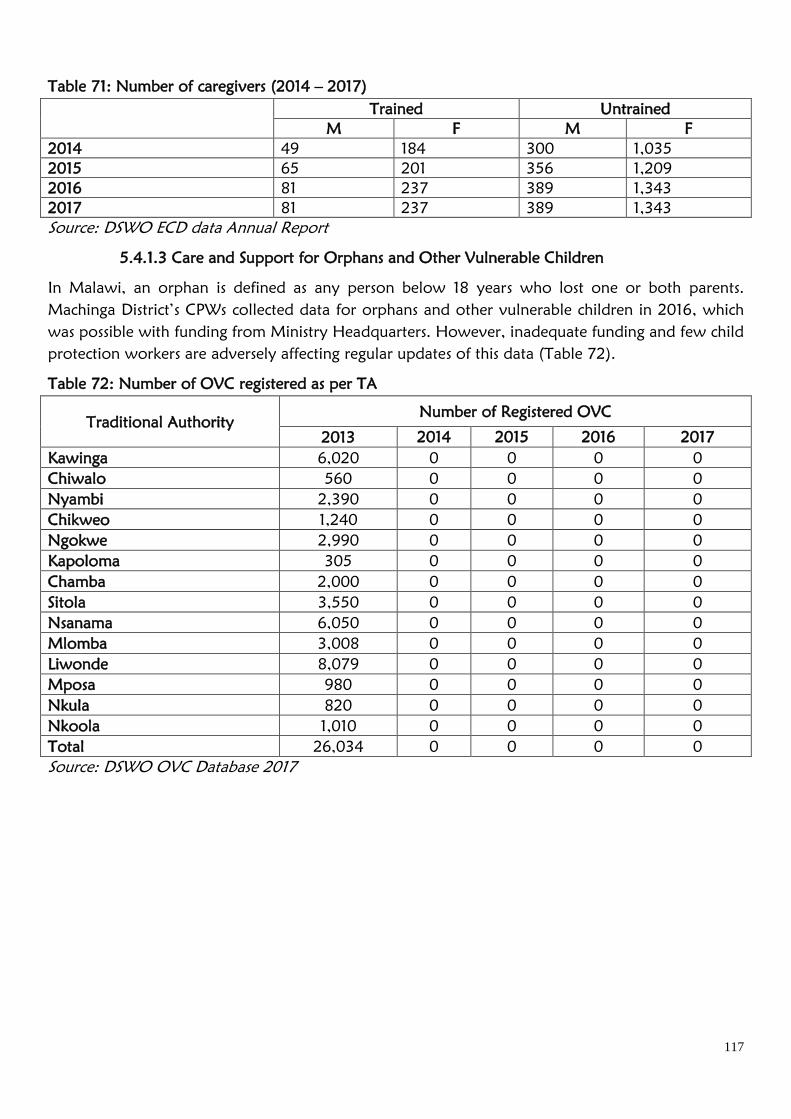
117
Table 71: Number of caregivers (2014 – 2017)
Trained Untrained
M F M F
2014 49 184 300 1,035
2015 65 201 356 1,209
2016 81 237 389 1,343
2017 81 237 389 1,343
Source: DSWO ECD data Annual Report
5.4.1.3 Care and Support for Orphans and Other Vulnerable Children
In Malawi, an orphan is defined as any person below 18 years who lost one or both parents.
Machinga District’s CPWs collected data for orphans and other vulnerable children in 2016, which
was possible with funding from Ministry Headquarters. However, inadequate funding and few child
protection workers are adversely affecting regular updates of this data (Table 72).
Table 72: Number of OVC registered as per TA
Traditional Authority Number of Registered OVC
2013 2014 2015 2016 2017
Kawinga 6,020 0 0 0 0
Chiwalo 560 0 0 0 0
Nyambi 2,390 0 0 0 0
Chikweo 1,240 0 0 0 0
Ngokwe 2,990 0 0 0 0
Kapoloma 305 0 0 0 0
Chamba 2,000 0 0 0 0
Sitola 3,550 0 0 0 0
Nsanama 6,050 0 0 0 0
Mlomba 3,008 0 0 0 0
Liwonde 8,079 0 0 0 0
Mposa 980 0 0 0 0
Nkula 820 0 0 0 0
Nkoola 1,010 0 0 0 0
Total 26,034 0 0 0 0
Source: DSWO OVC Database 2017
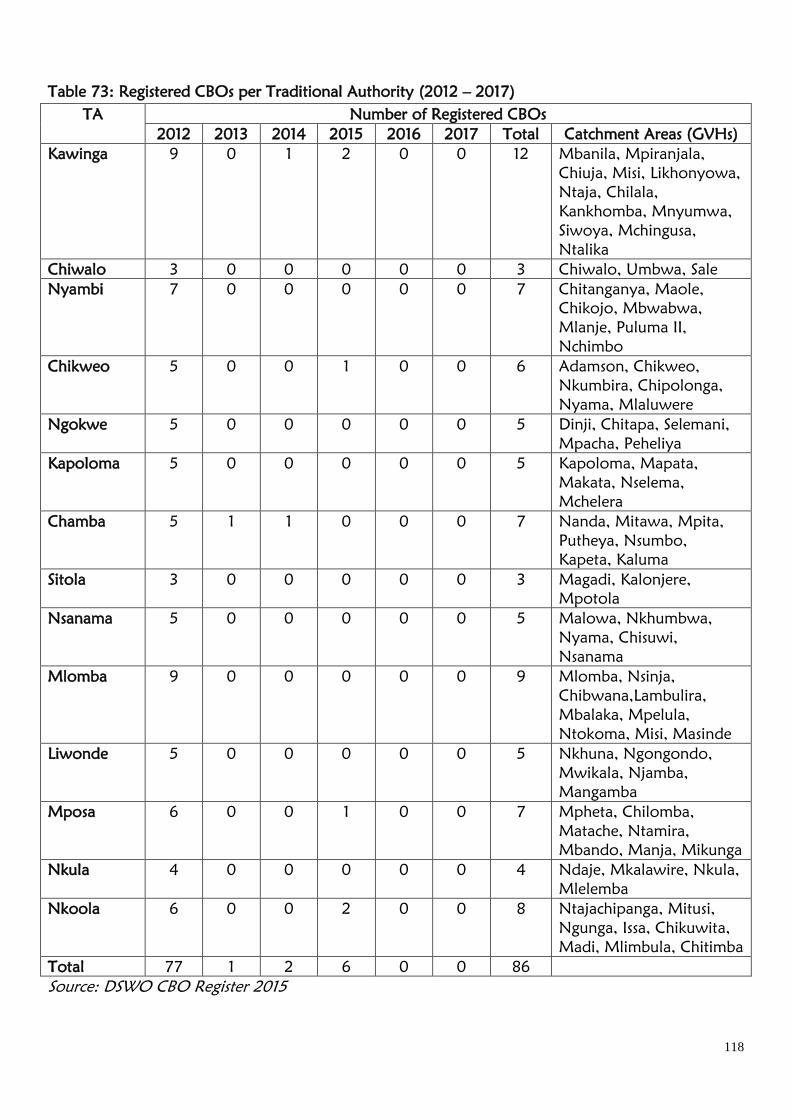
118
Table 73: Registered CBOs per Traditional Authority (2012 – 2017)
TA Number of Registered CBOs
2012 2013 2014 2015 2016 2017 Total Catchment Areas (GVHs)
Kawinga 9 0 1 2 0 0 12 Mbanila, Mpiranjala,
Chiuja, Misi, Likhonyowa,
Ntaja, Chilala,
Kankhomba, Mnyumwa,
Siwoya, Mchingusa,
Ntalika
Chiwalo 3 0 0 0 0 0 3 Chiwalo, Umbwa, Sale
Nyambi 7 0 0 0 0 0 7 Chitanganya, Maole,
Chikojo, Mbwabwa,
Mlanje, Puluma II,
Nchimbo
Chikweo 5 0 0 1 0 0 6 Adamson, Chikweo,
Nkumbira, Chipolonga,
Nyama, Mlaluwere
Ngokwe 5 0 0 0 0 0 5 Dinji, Chitapa, Selemani,
Mpacha, Peheliya
Kapoloma 5 0 0 0 0 0 5 Kapoloma, Mapata,
Makata, Nselema,
Mchelera
Chamba 5 1 1 0 0 0 7 Nanda, Mitawa, Mpita,
Putheya, Nsumbo,
Kapeta, Kaluma
Sitola 3 0 0 0 0 0 3 Magadi, Kalonjere,
Mpotola
Nsanama 5 0 0 0 0 0 5 Malowa, Nkhumbwa,
Nyama, Chisuwi,
Nsanama
Mlomba 9 0 0 0 0 0 9 Mlomba, Nsinja,
Chibwana,Lambulira,
Mbalaka, Mpelula,
Ntokoma, Misi, Masinde
Liwonde 5 0 0 0
0 0 5 Nkhuna, Ngongondo,
Mwikala, Njamba,
Mangamba
Mposa 6 0 0 1 0 0 7 Mpheta, Chilomba,
Matache, Ntamira,
Mbando, Manja, Mikunga
Nkula 4 0 0 0 0 0 4 Ndaje, Mkalawire, Nkula,
Mlelemba
Nkoola 6 0 0 2 0 0 8 Ntajachipanga, Mitusi,
Ngunga, Issa, Chikuwita,
Madi, Mlimbula, Chitimba
Total 77 1 2 6 0 0 86
Source: DSWO CBO Register 2015
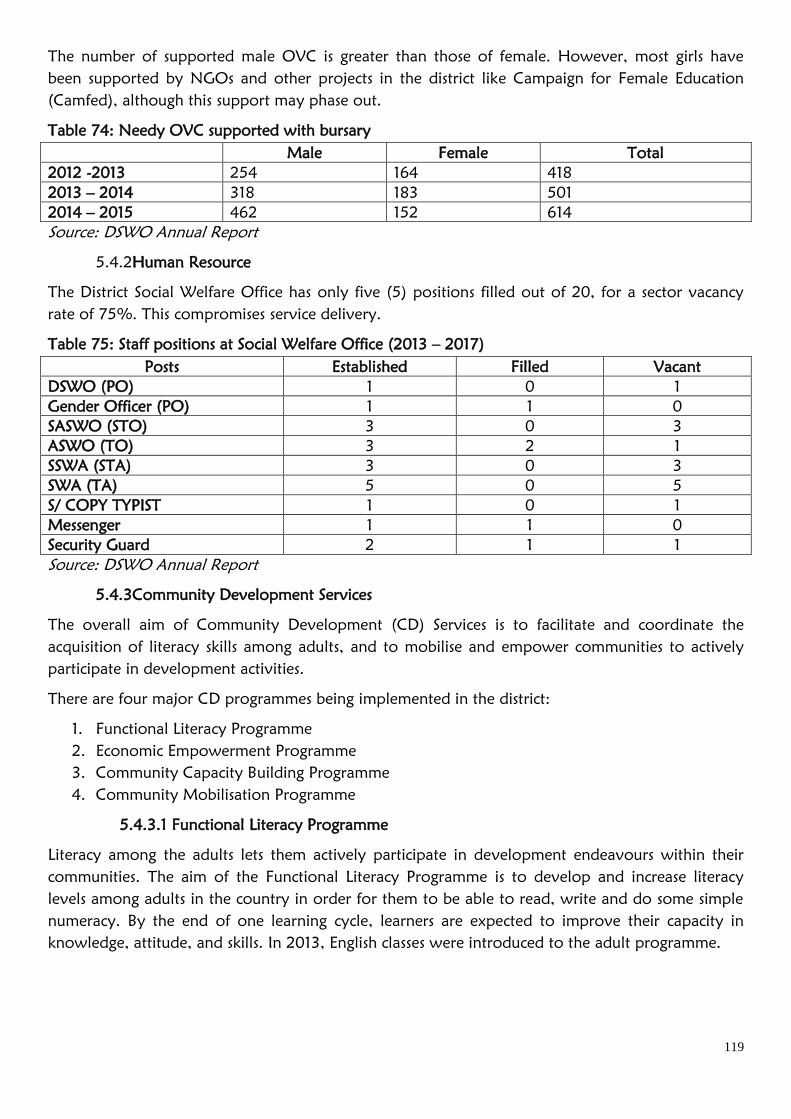
119
The number of supported male OVC is greater than those of female. However, most girls have
been supported by NGOs and other projects in the district like Campaign for Female Education
(Camfed), although this support may phase out.
Table 74: Needy OVC supported with bursary
Male Female Total
2012 -2013 254 164 418
2013 – 2014 318 183 501
2014 – 2015 462 152 614
Source: DSWO Annual Report
5.4.2Human Resource
The District Social Welfare Office has only five (5) positions filled out of 20, for a sector vacancy
rate of 75%. This compromises service delivery.
Table 75: Staff positions at Social Welfare Office (2013 – 2017)
Posts Established Filled Vacant
DSWO (PO) 1 0 1
Gender Officer (PO) 1 1 0
SASWO (STO) 3 0 3
ASWO (TO) 3 2 1
SSWA (STA) 3 0 3
SWA (TA) 5 0 5
S/ COPY TYPIST 1 0 1
Messenger 1 1 0
Security Guard 2 1 1
Source: DSWO Annual Report
5.4.3Community Development Services
The overall aim of Community Development (CD) Services is to facilitate and coordinate the
acquisition of literacy skills among adults, and to mobilise and empower communities to actively
participate in development activities.
There are four major CD programmes being implemented in the district:
1. Functional Literacy Programme
2. Economic Empowerment Programme
3. Community Capacity Building Programme
4. Community Mobilisation Programme
5.4.3.1 Functional Literacy Programme
Literacy among the adults lets them actively participate in development endeavours within their
communities. The aim of the Functional Literacy Programme is to develop and increase literacy
levels among adults in the country in order for them to be able to read, write and do some simple
numeracy. By the end of one learning cycle, learners are expected to improve their capacity in
knowledge, attitude, and skills. In 2013, English classes were introduced to the adult programme.
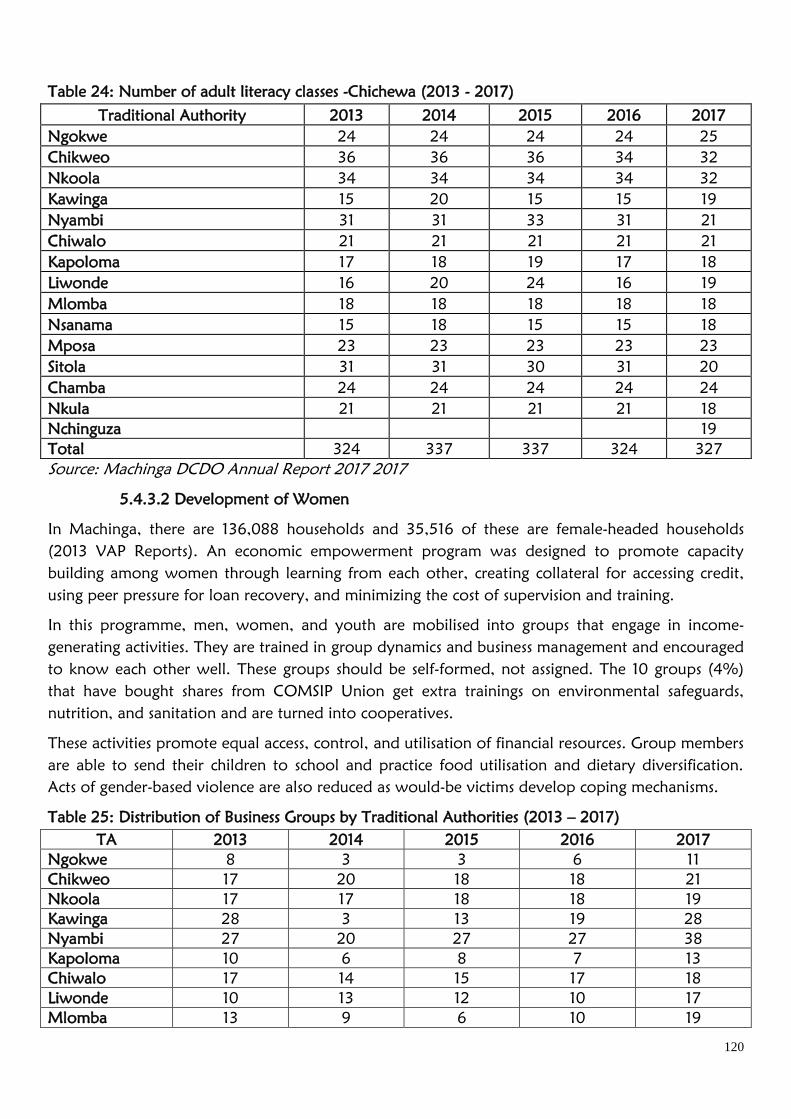
120
Table 24: Number of adult literacy classes -Chichewa (2013 - 2017)
Traditional Authority 2013 2014 2015 2016 2017
Ngokwe 24 24 24 24 25
Chikweo 36 36 36 34 32
Nkoola 34 34 34 34 32
Kawinga 15 20 15 15 19
Nyambi 31 31 33 31 21
Chiwalo 21 21 21 21 21
Kapoloma 17 18 19 17 18
Liwonde 16 20 24 16 19
Mlomba 18 18 18 18 18
Nsanama 15 18 15 15 18
Mposa 23 23 23 23 23
Sitola 31 31 30 31 20
Chamba 24 24 24 24 24
Nkula 21 21 21 21 18
Nchinguza
19
Total 324 337 337 324 327
Source: Machinga DCDO Annual Report 2017 2017
5.4.3.2 Development of Women
In Machinga, there are 136,088 households and 35,516 of these are female-headed households
(2013 VAP Reports). An economic empowerment program was designed to promote capacity
building among women through learning from each other, creating collateral for accessing credit,
using peer pressure for loan recovery, and minimizing the cost of supervision and training.
In this programme, men, women, and youth are mobilised into groups that engage in income-
generating activities. They are trained in group dynamics and business management and encouraged
to know each other well. These groups should be self-formed, not assigned. The 10 groups (4%)
that have bought shares from COMSIP Union get extra trainings on environmental safeguards,
nutrition, and sanitation and are turned into cooperatives.
These activities promote equal access, control, and utilisation of financial resources. Group members
are able to send their children to school and practice food utilisation and dietary diversification.
Acts of gender-based violence are also reduced as would-be victims develop coping mechanisms.
Table 25: Distribution of Business Groups by Traditional Authorities (2013 – 2017)
TA 2013 2014 2015 2016 2017
Ngokwe 8 3 3 6 11
Chikweo 17 20 18 18 21
Nkoola 17 17 18 18 19
Kawinga 28 3 13 19 28
Nyambi 27 20 27 27 38
Kapoloma 10 6 8 7 13
Chiwalo 17 14 15 17 18
Liwonde 10 13 12 10 17
Mlomba 13 9 6 10 19
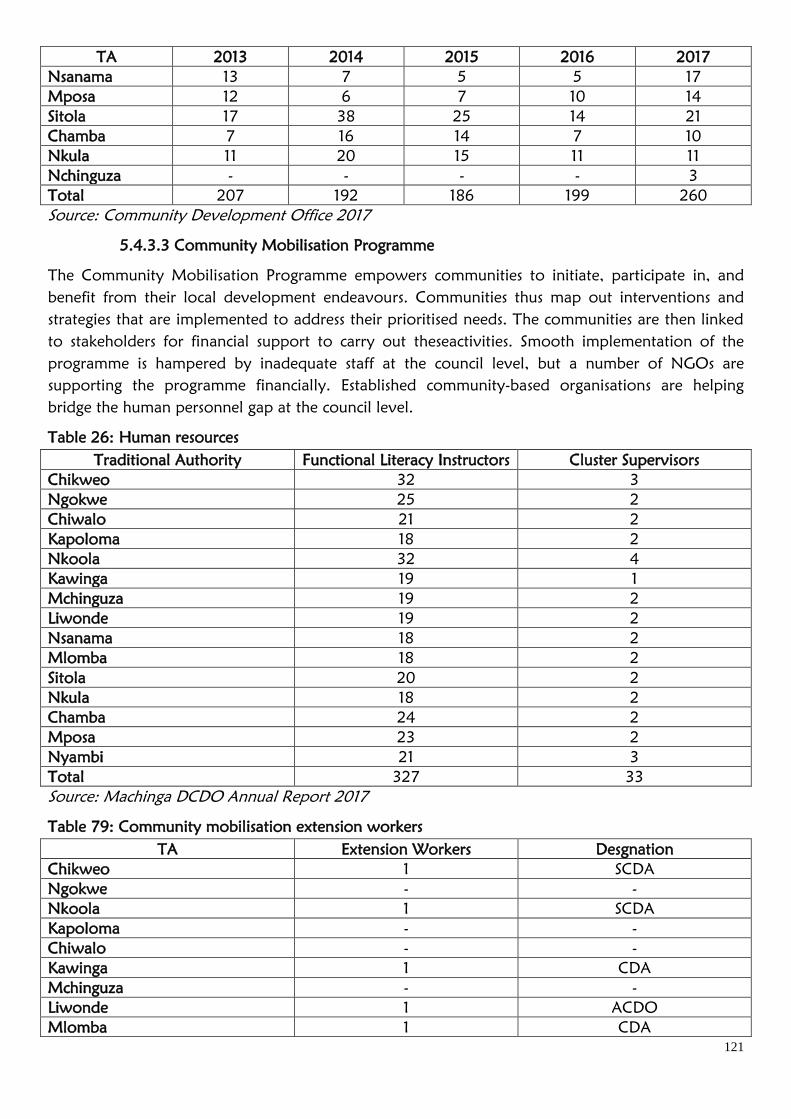
121
TA 2013 2014 2015 2016 2017
Nsanama 13 7 5 5 17
Mposa 12 6 7 10 14
Sitola 17 38 25 14 21
Chamba 7 16 14 7 10
Nkula 11 20 15 11 11
Nchinguza - - - - 3
Total 207 192 186 199 260
Source: Community Development Office 2017
5.4.3.3 Community Mobilisation Programme
The Community Mobilisation Programme empowers communities to initiate, participate in, and
benefit from their local development endeavours. Communities thus map out interventions and
strategies that are implemented to address their prioritised needs. The communities are then linked
to stakeholders for financial support to carry out theseactivities. Smooth implementation of the
programme is hampered by inadequate staff at the council level, but a number of NGOs are
supporting the programme financially. Established community-based organisations are helping
bridge the human personnel gap at the council level.
Table 26: Human resources
Traditional Authority Functional Literacy Instructors Cluster Supervisors
Chikweo 32 3
Ngokwe 25 2
Chiwalo 21 2
Kapoloma 18 2
Nkoola 32 4
Kawinga 19 1
Mchinguza 19 2
Liwonde 19 2
Nsanama 18 2
Mlomba 18 2
Sitola 20 2
Nkula 18 2
Chamba 24 2
Mposa 23 2
Nyambi 21 3
Total 327 33
Source: Machinga DCDO Annual Report 2017
Table 79: Community mobilisation extension workers
TA Extension Workers Desgnation
Chikweo 1 SCDA
Ngokwe - -
Nkoola 1 SCDA
Kapoloma - -
Chiwalo - -
Kawinga 1 CDA
Mchinguza - -
Liwonde 1 ACDO
Mlomba 1 CDA
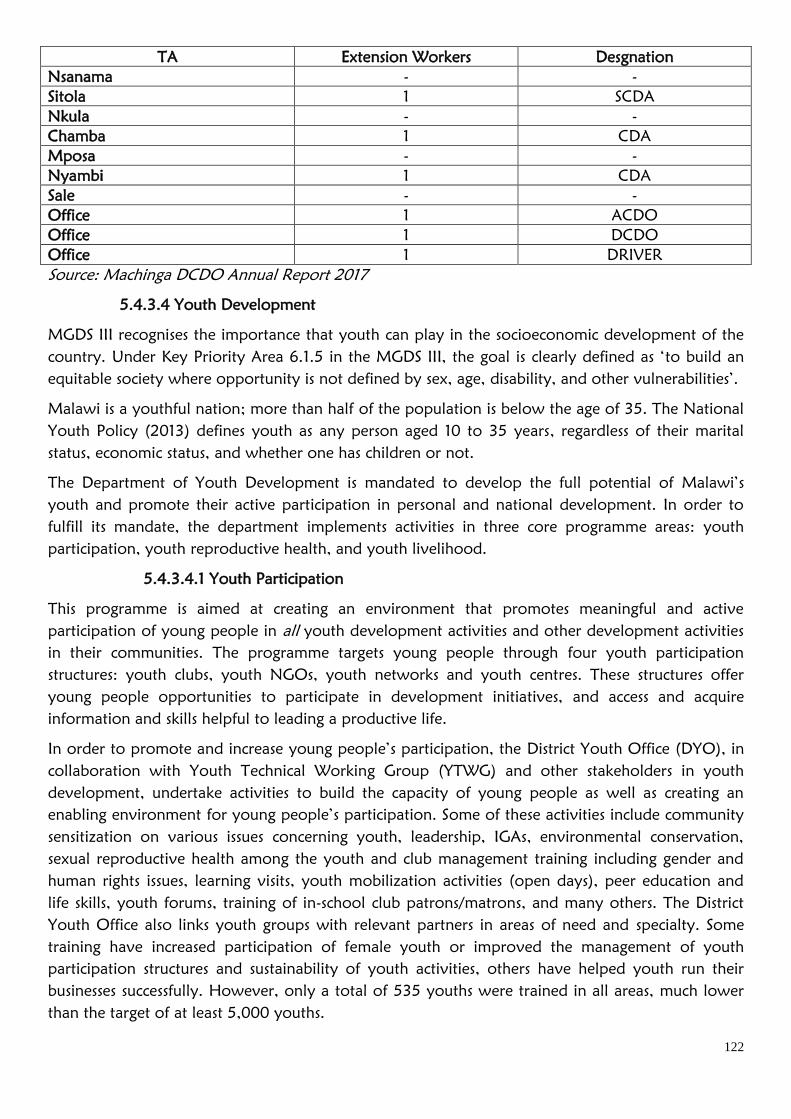
122
TA Extension Workers Desgnation
Nsanama - -
Sitola 1 SCDA
Nkula - -
Chamba 1 CDA
Mposa - -
Nyambi 1 CDA
Sale - -
Office 1 ACDO
Office 1 DCDO
Office 1 DRIVER
Source: Machinga DCDO Annual Report 2017
5.4.3.4 Youth Development
MGDS III recognises the importance that youth can play in the socioeconomic development of the
country. Under Key Priority Area 6.1.5 in the MGDS III, the goal is clearly defined as ‘to build an
equitable society where opportunity is not defined by sex, age, disability, and other vulnerabilities’.
Malawi is a youthful nation; more than half of the population is below the age of 35. The National
Youth Policy (2013) defines youth as any person aged 10 to 35 years, regardless of their marital
status, economic status, and whether one has children or not.
The Department of Youth Development is mandated to develop the full potential of Malawi’s
youth and promote their active participation in personal and national development. In order to
fulfill its mandate, the department implements activities in three core programme areas: youth
participation, youth reproductive health, and youth livelihood.
5.4.3.4.1 Youth Participation
This programme is aimed at creating an environment that promotes meaningful and active
participation of young people in all youth development activities and other development activities
in their communities. The programme targets young people through four youth participation
structures: youth clubs, youth NGOs, youth networks and youth centres. These structures offer
young people opportunities to participate in development initiatives, and access and acquire
information and skills helpful to leading a productive life.
In order to promote and increase young people’s participation, the District Youth Office (DYO), in
collaboration with Youth Technical Working Group (YTWG) and other stakeholders in youth
development, undertake activities to build the capacity of young people as well as creating an
enabling environment for young people’s participation. Some of these activities include community
sensitization on various issues concerning youth, leadership, IGAs, environmental conservation,
sexual reproductive health among the youth and club management training including gender and
human rights issues, learning visits, youth mobilization activities (open days), peer education and
life skills, youth forums, training of in-school club patrons/matrons, and many others. The District
Youth Office also links youth groups with relevant partners in areas of need and specialty. Some
training have increased participation of female youth or improved the management of youth
participation structures and sustainability of youth activities, others have helped youth run their
businesses successfully. However, only a total of 535 youths were trained in all areas, much lower
than the target of at least 5,000 youths.
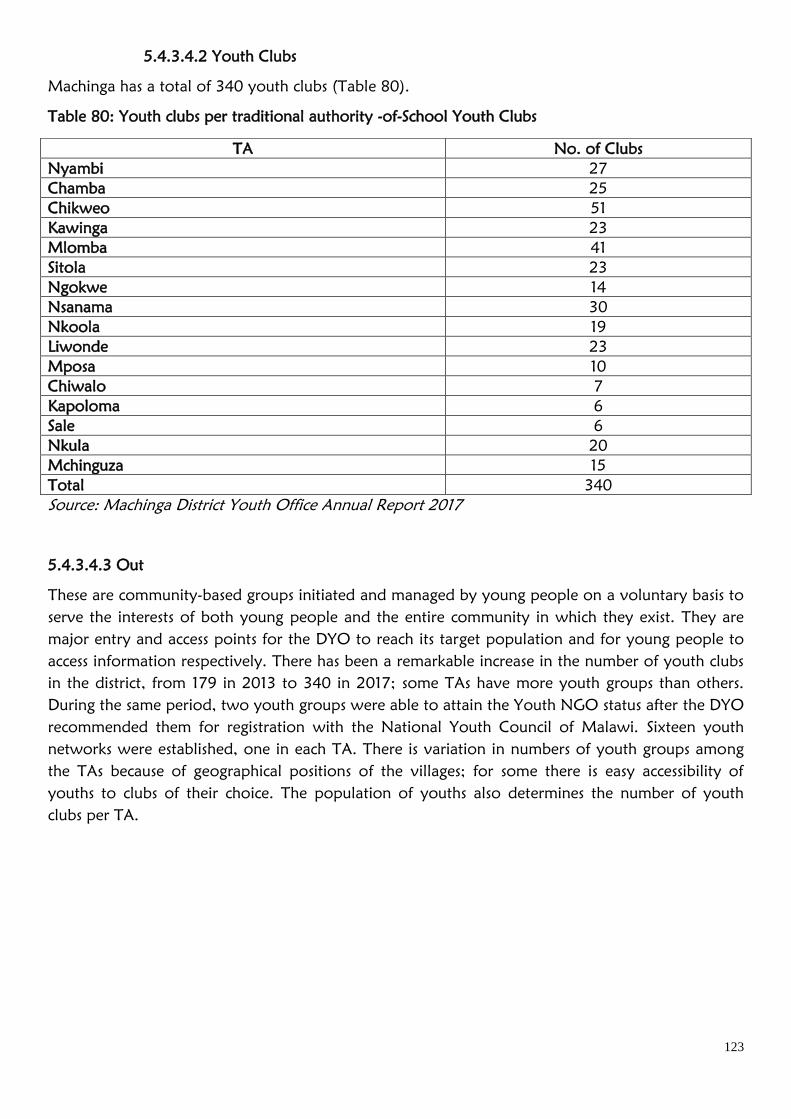
123
5.4.3.4.2 Youth Clubs
Machinga has a total of 340 youth clubs (Table 80).
Table 80: Youth clubs per traditional authority -of-School Youth Clubs
Source: Machinga District Youth Office Annual Report 2017
5.4.3.4.3 Out
These are community-based groups initiated and managed by young people on a voluntary basis to
serve the interests of both young people and the entire community in which they exist. They are
major entry and access points for the DYO to reach its target population and for young people to
access information respectively. There has been a remarkable increase in the number of youth clubs
in the district, from 179 in 2013 to 340 in 2017; some TAs have more youth groups than others.
During the same period, two youth groups were able to attain the Youth NGO status after the DYO
recommended them for registration with the National Youth Council of Malawi. Sixteen youth
networks were established, one in each TA. There is variation in numbers of youth groups among
the TAs because of geographical positions of the villages; for some there is easy accessibility of
youths to clubs of their choice. The population of youths also determines the number of youth
clubs per TA.
TA No. of Clubs
Nyambi 27
Chamba 25
Chikweo 51
Kawinga 23
Mlomba 41
Sitola 23
Ngokwe 14
Nsanama 30
Nkoola 19
Liwonde 23
Mposa 10
Chiwalo 7
Kapoloma 6
Sale 6
Nkula 20
Mchinguza 15
Total 340
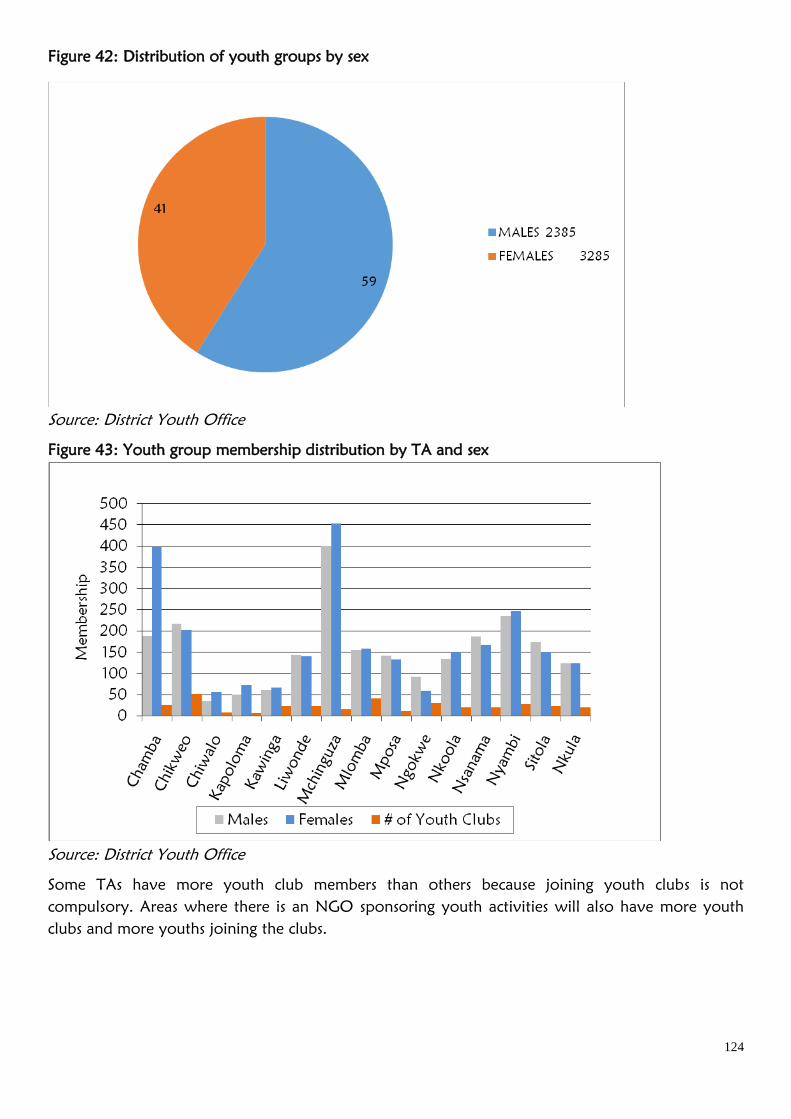
124
Figure 42: Distribution of youth groups by sex
Source: District Youth Office
Figure 43: Youth group membership distribution by TA and sex
Source: District Youth Office
Some TAs have more youth club members than others because joining youth clubs is not
compulsory. Areas where there is an NGO sponsoring youth activities will also have more youth
clubs and more youths joining the clubs.
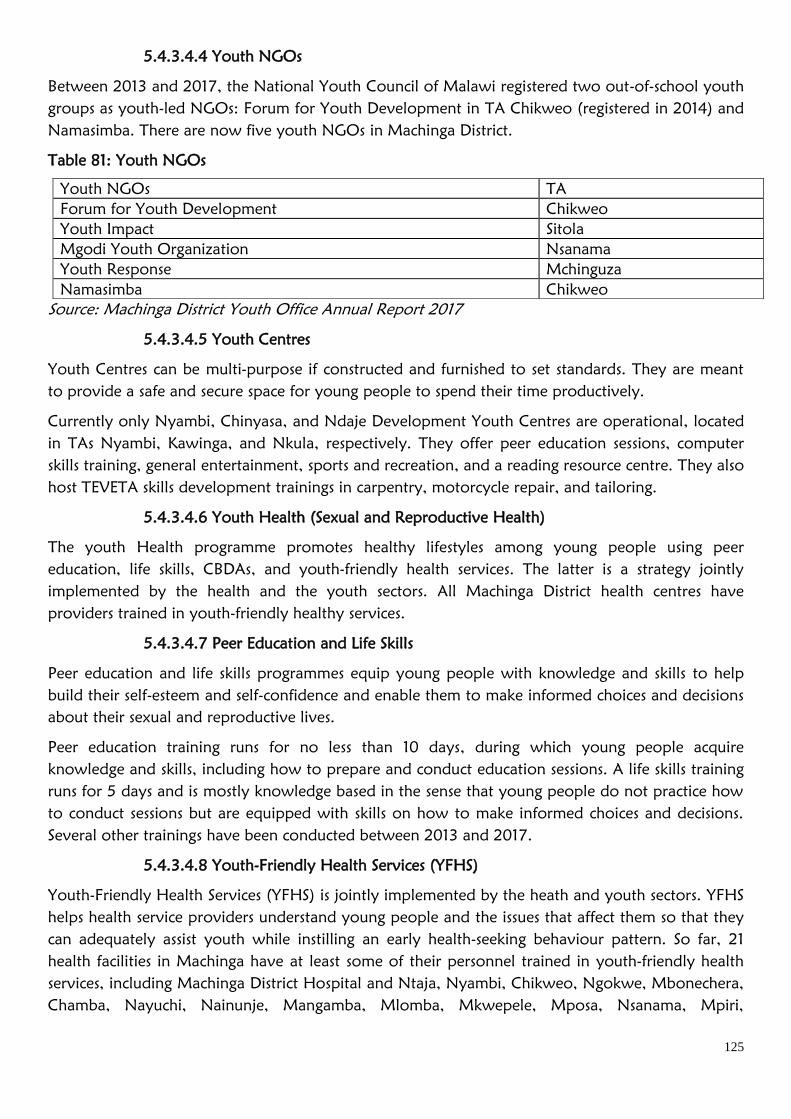
125
5.4.3.4.4 Youth NGOs
Between 2013 and 2017, the National Youth Council of Malawi registered two out-of-school youth
groups as youth-led NGOs: Forum for Youth Development in TA Chikweo (registered in 2014) and
Namasimba. There are now five youth NGOs in Machinga District.
Table 81: Youth NGOs
Source: Machinga District Youth Office Annual Report 2017
5.4.3.4.5 Youth Centres
Youth Centres can be multi-purpose if constructed and furnished to set standards. They are meant
to provide a safe and secure space for young people to spend their time productively.
Currently only Nyambi, Chinyasa, and Ndaje Development Youth Centres are operational, located
in TAs Nyambi, Kawinga, and Nkula, respectively. They offer peer education sessions, computer
skills training, general entertainment, sports and recreation, and a reading resource centre. They also
host TEVETA skills development trainings in carpentry, motorcycle repair, and tailoring.
5.4.3.4.6 Youth Health (Sexual and Reproductive Health)
The youth Health programme promotes healthy lifestyles among young people using peer
education, life skills, CBDAs, and youth-friendly health services. The latter is a strategy jointly
implemented by the health and the youth sectors. All Machinga District health centres have
providers trained in youth-friendly healthy services.
5.4.3.4.7 Peer Education and Life Skills
Peer education and life skills programmes equip young people with knowledge and skills to help
build their self-esteem and self-confidence and enable them to make informed choices and decisions
about their sexual and reproductive lives.
Peer education training runs for no less than 10 days, during which young people acquire
knowledge and skills, including how to prepare and conduct education sessions. A life skills training
runs for 5 days and is mostly knowledge based in the sense that young people do not practice how
to conduct sessions but are equipped with skills on how to make informed choices and decisions.
Several other trainings have been conducted between 2013 and 2017.
5.4.3.4.8 Youth-Friendly Health Services (YFHS)
Youth-Friendly Health Services (YFHS) is jointly implemented by the heath and youth sectors. YFHS
helps health service providers understand young people and the issues that affect them so that they
can adequately assist youth while instilling an early health-seeking behaviour pattern. So far, 21
health facilities in Machinga have at least some of their personnel trained in youth-friendly health
services, including Machinga District Hospital and Ntaja, Nyambi, Chikweo, Ngokwe, Mbonechera,
Chamba, Nayuchi, Nainunje, Mangamba, Mlomba, Mkwepele, Mposa, Nsanama, Mpiri,
Youth NGOs TA
Forum for Youth Development Chikweo
Youth Impact Sitola
Mgodi Youth Organization Nsanama
Youth Response Mchinguza
Namasimba Chikweo
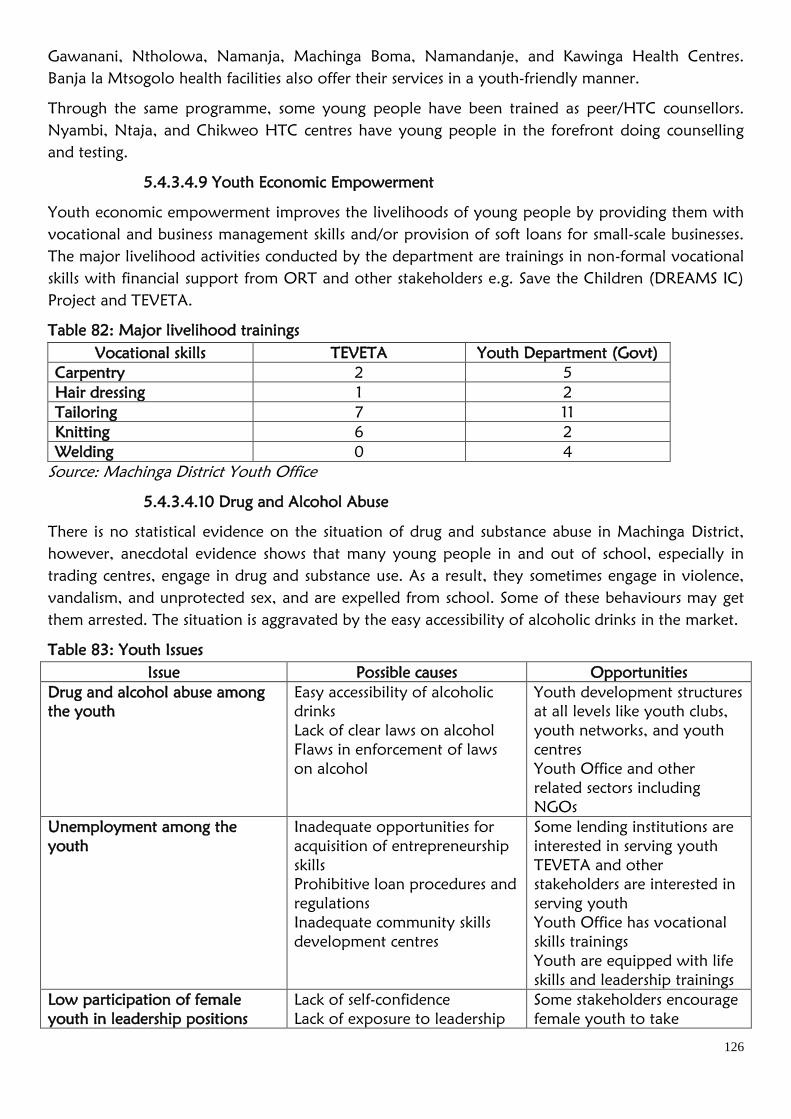
126
Gawanani, Ntholowa, Namanja, Machinga Boma, Namandanje, and Kawinga Health Centres.
Banja la Mtsogolo health facilities also offer their services in a youth-friendly manner.
Through the same programme, some young people have been trained as peer/HTC counsellors.
Nyambi, Ntaja, and Chikweo HTC centres have young people in the forefront doing counselling
and testing.
5.4.3.4.9 Youth Economic Empowerment
Youth economic empowerment improves the livelihoods of young people by providing them with
vocational and business management skills and/or provision of soft loans for small-scale businesses.
The major livelihood activities conducted by the department are trainings in non-formal vocational
skills with financial support from ORT and other stakeholders e.g. Save the Children (DREAMS IC)
Project and TEVETA.
Table 82: Major livelihood trainings
Vocational skills TEVETA Youth Department (Govt)
Carpentry 2 5
Hair dressing 1 2
Tailoring 7 11
Knitting 6 2
Welding 0 4
Source: Machinga District Youth Office
5.4.3.4.10 Drug and Alcohol Abuse
There is no statistical evidence on the situation of drug and substance abuse in Machinga District,
however, anecdotal evidence shows that many young people in and out of school, especially in
trading centres, engage in drug and substance use. As a result, they sometimes engage in violence,
vandalism, and unprotected sex, and are expelled from school. Some of these behaviours may get
them arrested. The situation is aggravated by the easy accessibility of alcoholic drinks in the market.
Table 83: Youth Issues
Issue Possible causes Opportunities
Drug and alcohol abuse among
the youth
Easy accessibility of alcoholic
drinks
Lack of clear laws on alcohol
Flaws in enforcement of laws
on alcohol
Youth development structures
at all levels like youth clubs,
youth networks, and youth
centres
Youth Office and other
related sectors including
NGOs
Unemployment among the
youth
Inadequate opportunities for
acquisition of entrepreneurship
skills
Prohibitive loan procedures and
regulations
Inadequate community skills
development centres
Some lending institutions are
interested in serving youth
TEVETA and other
stakeholders are interested in
serving youth
Youth Office has vocational
skills trainings
Youth are equipped with life
skills and leadership trainings
Low participation of female
youth in leadership positions
Lack of self-confidence
Lack of exposure to leadership
Some stakeholders encourage
female youth to take
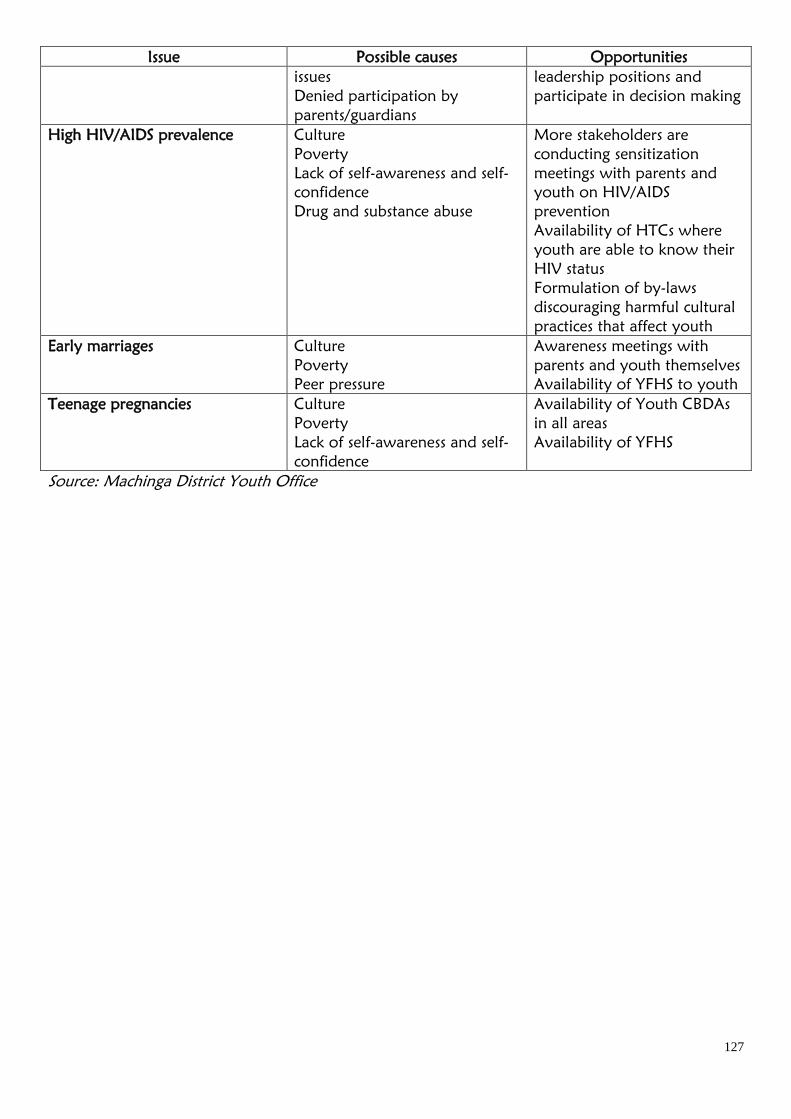
127
Issue Possible causes Opportunities
issues
Denied participation by
parents/guardians
leadership positions and
participate in decision making
High HIV/AIDS prevalence Culture
Poverty
Lack of self-awareness and self-
confidence
Drug and substance abuse
More stakeholders are
conducting sensitization
meetings with parents and
youth on HIV/AIDS
prevention
Availability of HTCs where
youth are able to know their
HIV status
Formulation of by-laws
discouraging harmful cultural
practices that affect youth
Early marriages Culture
Poverty
Peer pressure
Awareness meetings with
parents and youth themselves
Availability of YFHS to youth
Teenage pregnancies Culture
Poverty
Lack of self-awareness and self-
confidence
Availability of Youth CBDAs
in all areas
Availability of YFHS
Source: Machinga District Youth Office
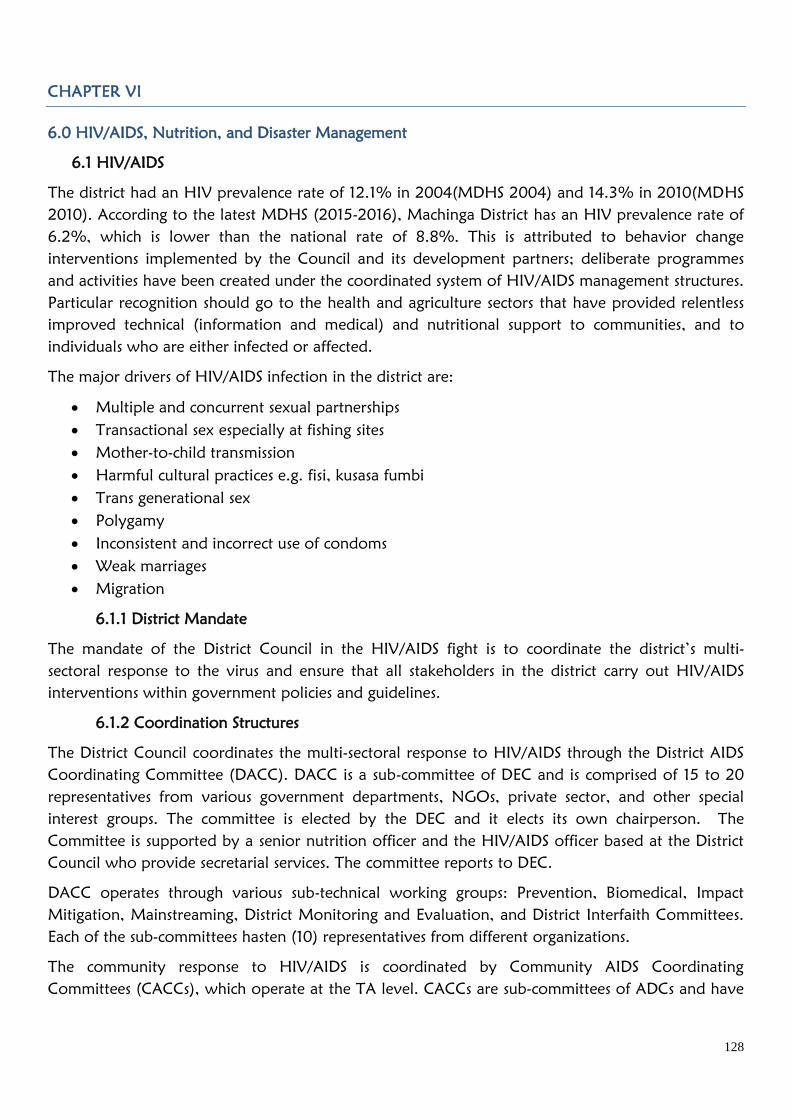
128
CHAPTER VI
6.0 HIV/AIDS, Nutrition, and Disaster Management
6.1 HIV/AIDS
The district had an HIV prevalence rate of 12.1% in 2004(MDHS 2004) and 14.3% in 2010(MDHS
2010). According to the latest MDHS (2015-2016), Machinga District has an HIV prevalence rate of
6.2%, which is lower than the national rate of 8.8%. This is attributed to behavior change
interventions implemented by the Council and its development partners; deliberate programmes
and activities have been created under the coordinated system of HIV/AIDS management structures.
Particular recognition should go to the health and agriculture sectors that have provided relentless
improved technical (information and medical) and nutritional support to communities, and to
individuals who are either infected or affected.
The major drivers of HIV/AIDS infection in the district are:
Multiple and concurrent sexual partnerships
Transactional sex especially at fishing sites
Mother-to-child transmission
Harmful cultural practices e.g. fisi, kusasa fumbi
Trans generational sex
Polygamy
Inconsistent and incorrect use of condoms
Weak marriages
Migration
6.1.1 District Mandate
The mandate of the District Council in the HIV/AIDS fight is to coordinate the district’s multi-
sectoral response to the virus and ensure that all stakeholders in the district carry out HIV/AIDS
interventions within government policies and guidelines.
6.1.2 Coordination Structures
The District Council coordinates the multi-sectoral response to HIV/AIDS through the District AIDS
Coordinating Committee (DACC). DACC is a sub-committee of DEC and is comprised of 15 to 20
representatives from various government departments, NGOs, private sector, and other special
interest groups. The committee is elected by the DEC and it elects its own chairperson. The
Committee is supported by a senior nutrition officer and the HIV/AIDS officer based at the District
Council who provide secretarial services. The committee reports to DEC.
DACC operates through various sub-technical working groups: Prevention, Biomedical, Impact
Mitigation, Mainstreaming, District Monitoring and Evaluation, and District Interfaith Committees.
Each of the sub-committees hasten (10) representatives from different organizations.
The community response to HIV/AIDS is coordinated by Community AIDS Coordinating
Committees (CACCs), which operate at the TA level. CACCs are sub-committees of ADCs and have
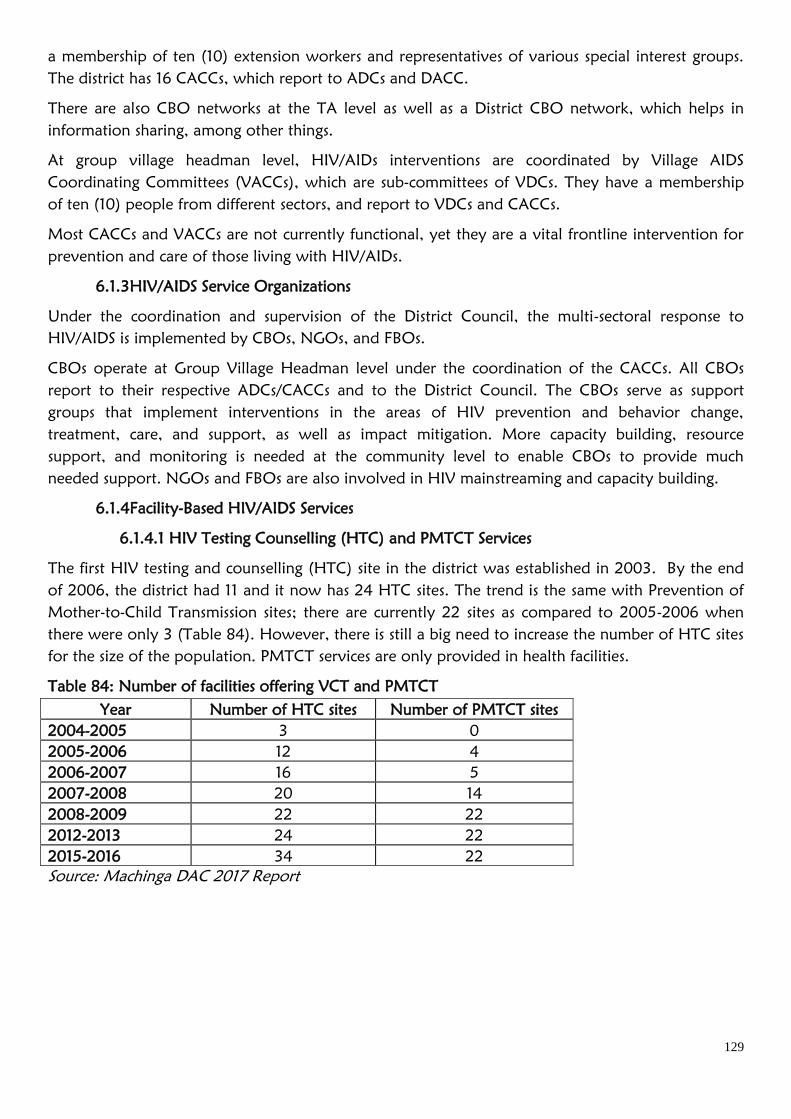
129
a membership of ten (10) extension workers and representatives of various special interest groups.
The district has 16 CACCs, which report to ADCs and DACC.
There are also CBO networks at the TA level as well as a District CBO network, which helps in
information sharing, among other things.
At group village headman level, HIV/AIDs interventions are coordinated by Village AIDS
Coordinating Committees (VACCs), which are sub-committees of VDCs. They have a membership
of ten (10) people from different sectors, and report to VDCs and CACCs.
Most CACCs and VACCs are not currently functional, yet they are a vital frontline intervention for
prevention and care of those living with HIV/AIDs.
6.1.3HIV/AIDS Service Organizations
Under the coordination and supervision of the District Council, the multi-sectoral response to
HIV/AIDS is implemented by CBOs, NGOs, and FBOs.
CBOs operate at Group Village Headman level under the coordination of the CACCs. All CBOs
report to their respective ADCs/CACCs and to the District Council. The CBOs serve as support
groups that implement interventions in the areas of HIV prevention and behavior change,
treatment, care, and support, as well as impact mitigation. More capacity building, resource
support, and monitoring is needed at the community level to enable CBOs to provide much
needed support. NGOs and FBOs are also involved in HIV mainstreaming and capacity building.
6.1.4Facility-Based HIV/AIDS Services
6.1.4.1 HIV Testing Counselling (HTC) and PMTCT Services
The first HIV testing and counselling (HTC) site in the district was established in 2003. By the end
of 2006, the district had 11 and it now has 24 HTC sites. The trend is the same with Prevention of
Mother-to-Child Transmission sites; there are currently 22 sites as compared to 2005-2006 when
there were only 3 (Table 84). However, there is still a big need to increase the number of HTC sites
for the size of the population. PMTCT services are only provided in health facilities.
Table 84: Number of facilities offering VCT and PMTCT
Year Number of HTC sites Number of PMTCT sites
2004-2005 3 0
2005-2006 12 4
2006-2007 16 5
2007-2008 20 14
2008-2009 22 22
2012-2013 24 22
2015-2016 34 22
Source: Machinga DAC 2017 Report

130
Table 85: Machinga HTC sites
TA/STA HTC Site
Sitola Machinga DHO, BLM (Private), Liwonde Medical Clinic (Private), PSI
Kawinga Kawinga Health Centre, Nayuchi HC, Namanja HC, Ntholowa HC (CHAM)
Liwonde Mbonechera HC, Namandanje HC, Mangamba HC
Kapoloma Nainunje HC
Chamba Chamba HC
Mlomba Mlomba HC
Nyambi Nyambi HC, Mkwepere HC
Chikweo Chikweo HC, Mpiri HC (CHAM)
Nsanama Nsanama HC
Chiwalo None
Mposa Mposa HC (CHAM)
Nkoola None
Ngokwe Ngokwe HC
Nkula Gawanani, Machinga Health Centre
Source: Machinga DAC 2017 Report
There are no HTC sites in TA Nkoola and TA Chiwalo. These areas need to be provided with HTC
services.
6.1.4.2 ART Services
In 2006, Machinga District Hospital was the sole provider of Antiretroviral Therapy (ART). There
are now 22 health centers providing ART services, including Banja La Mtsogolo (a private health
facility) (Table 86).
Table 86: Number of ART sites
Year Number of ART Centres
2004-2005 0
2005-2006 1
2006-2007 1
2007-2008 3
2008-2009 4
2009-2010 7
2010-2011
2011-2012
2012-2013 8
2013-2014
2014-2015
2015-2016 22
Source: Machinga DAC Report 2017
The number of people accessing ART services has also been increasing since the District Health
Office (DHO) started to provide these services. In 2004-2005, 1,204 people aged 15-49 years tested
HIV positive and the figure rose to 7,576 in 2009-2010.The number of people receiving ARVs
similarly increased over the same time.
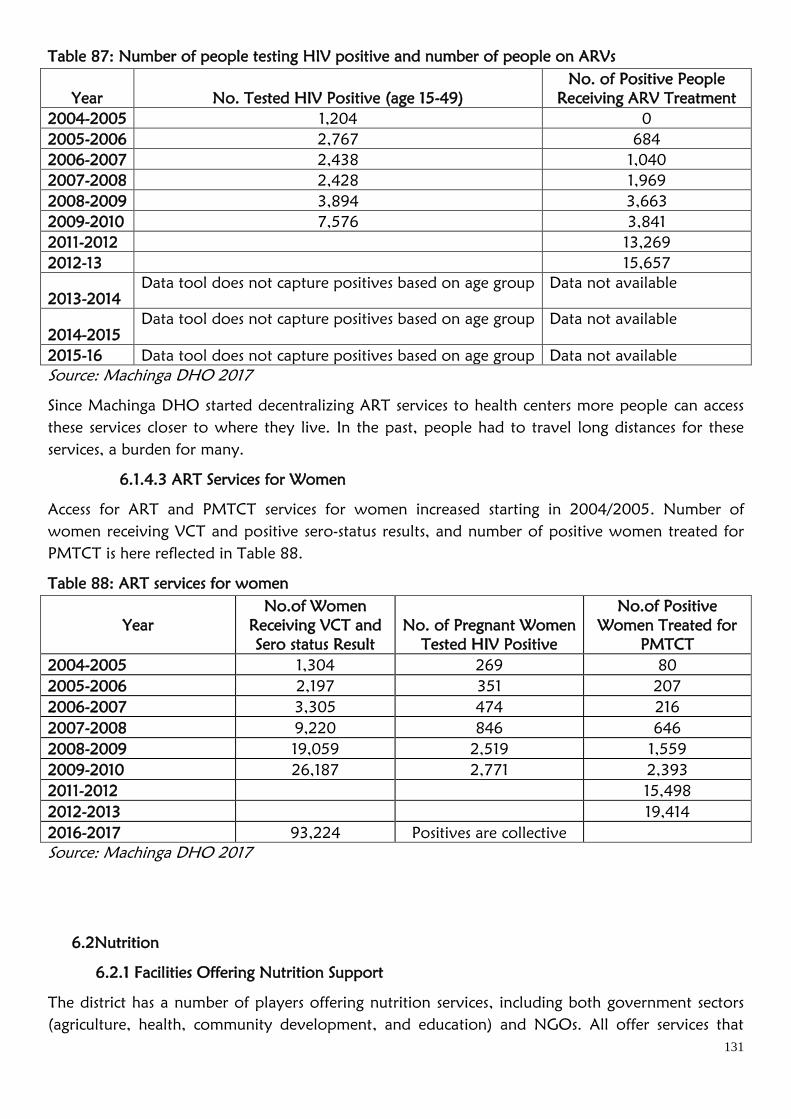
131
Table 87: Number of people testing HIV positive and number of people on ARVs
Year No. Tested HIV Positive (age 15-49)
No. of Positive People
Receiving ARV Treatment
2004-2005 1,204 0
2005-2006 2,767 684
2006-2007 2,438 1,040
2007-2008 2,428 1,969
2008-2009 3,894 3,663
2009-2010 7,576 3,841
2011-2012
13,269
2012-13 15,657
2013-2014
Data tool does not capture positives based on age group Data not available
2014-2015
Data tool does not capture positives based on age group Data not available
2015-16 Data tool does not capture positives based on age group Data not available
Source: Machinga DHO 2017
Since Machinga DHO started decentralizing ART services to health centers more people can access
these services closer to where they live. In the past, people had to travel long distances for these
services, a burden for many.
6.1.4.3 ART Services for Women
Access for ART and PMTCT services for women increased starting in 2004/2005. Number of
women receiving VCT and positive sero-status results, and number of positive women treated for
PMTCT is here reflected in Table 88.
Table 88: ART services for women
Year
No.of Women
Receiving VCT and
Sero status Result
No. of Pregnant Women
Tested HIV Positive
No.of Positive
Women Treated for
PMTCT
2004-2005 1,304 269 80
2005-2006 2,197 351 207
2006-2007 3,305 474 216
2007-2008 9,220 846 646
2008-2009 19,059 2,519 1,559
2009-2010 26,187 2,771 2,393
2011-2012
15,498
2012-2013
19,414
2016-2017 93,224 Positives are collective
Source: Machinga DHO 2017
6.2Nutrition
6.2.1 Facilities Offering Nutrition Support
The district has a number of players offering nutrition services, including both government sectors
(agriculture, health, community development, and education) and NGOs. All offer services that

132
target prevention of malnutrition except for the health sector, which mainly targets management of
malnutrition.
The Community Management of Acute Malnutrition (CMAM) Program offers nutrition support
through a number of health facilities under the DHO. It increases the ability of people to prevent,
recognize, and manage malnutrition within their communities. CMAM has four main components:
1. Community Outreach: Community activities such as case identification, referral, follow up,
and case management.
2. Supplementary Feeding Programme (SFP): Managing children, and pregnant and lactating
women with moderate malnutrition through supplements and other commodities –corn soy
blend (Likuni phala), cooking oil, sugar – to prevent children from deteriorating to severe
malnutrition.
3. Outpatient Therapeutic Program (OTP): Targeting children with severe acute malnutrition
but without medical complications, and with good appetite. They are provided with Ready-
to-use Therapeutic Food (RUTF). OTP assists children gain weight and prevents deaths. If
conditions deteriorate, children are transferred to NRU.
4. Nutrition Rehabilitation Unit (NRU): Two cases are handled at the NRU:
Children with complicated severe acute malnutrition are managed as inpatients through
the use of supplements and other commodities, Formula 75 and 100, and routine drugs.
Children with severe acute malnutrition but with medical complications are treated as in-
patients until the child is stabilized and complications are treated. When appetite returns,
the child is discharged as an outpatient to the OTP.
The CMAM increases coverage by making services accessible to a larger population suffering from
severe acute malnutrition. Forty-seven (47%) percent of under-5 children participate in nutritional
programmes/CMAM (IHS3 2012).
Table 89: Facilities offering nutrition support
Name of Facility (Health Centre) Nutrition Support
Gawanani OTP/SFP
Kawinga OTP
Machinga OTP
Machinga Hospital OTP/SFP/NRU
Mangamba OTP/SFP
Mbonechera OTP/SFP
Mkwepere OTP/SFP
Mlomba OTP
Mpiri OTP/SFP
Mposa OTP
Nsanama OTP/SFP/NRU
Nainunje OTP
Namandanje OTP/SFP/NRU
Namanja OTP/SFP
Nayuchi OTP/SFP
Ngokwe OTP/SFP
Ntaja OTP
Ntholowa OTP
Nyambi OTP
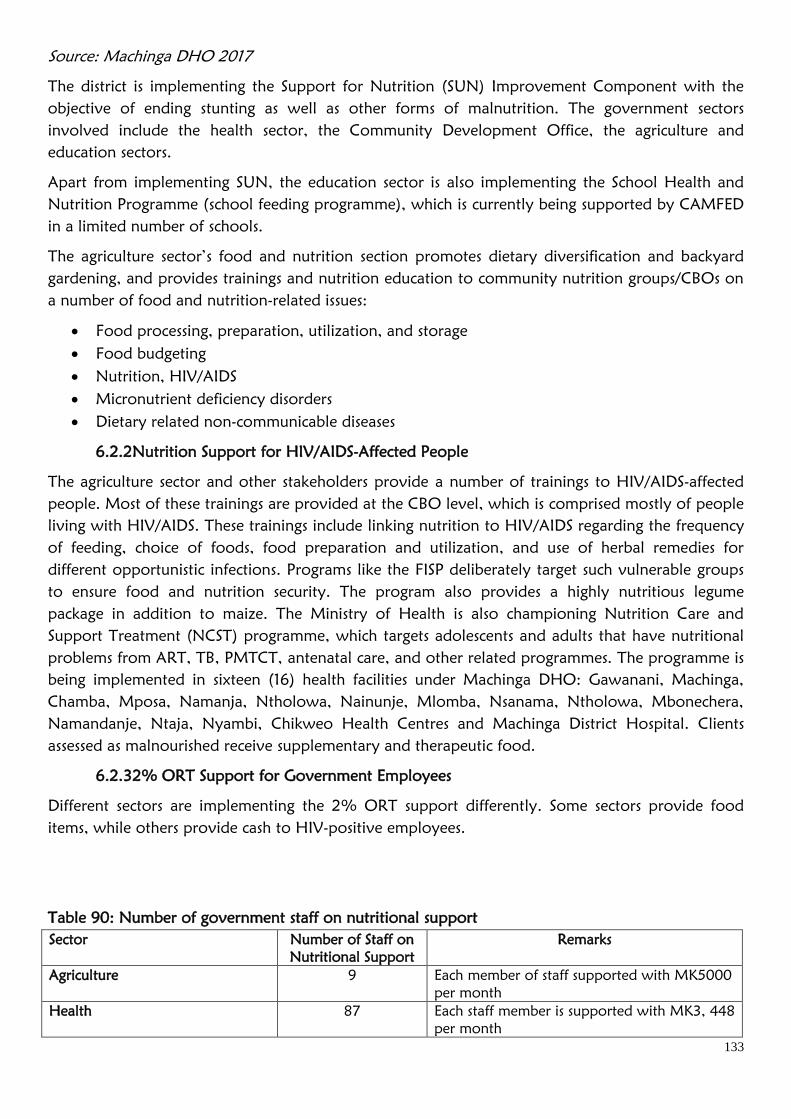
133
Source: Machinga DHO 2017
The district is implementing the Support for Nutrition (SUN) Improvement Component with the
objective of ending stunting as well as other forms of malnutrition. The government sectors
involved include the health sector, the Community Development Office, the agriculture and
education sectors.
Apart from implementing SUN, the education sector is also implementing the School Health and
Nutrition Programme (school feeding programme), which is currently being supported by CAMFED
in a limited number of schools.
The agriculture sector’s food and nutrition section promotes dietary diversification and backyard
gardening, and provides trainings and nutrition education to community nutrition groups/CBOs on
a number of food and nutrition-related issues:
Food processing, preparation, utilization, and storage
Food budgeting
Nutrition, HIV/AIDS
Micronutrient deficiency disorders
Dietary related non-communicable diseases
6.2.2Nutrition Support for HIV/AIDS-Affected People
The agriculture sector and other stakeholders provide a number of trainings to HIV/AIDS-affected
people. Most of these trainings are provided at the CBO level, which is comprised mostly of people
living with HIV/AIDS. These trainings include linking nutrition to HIV/AIDS regarding the frequency
of feeding, choice of foods, food preparation and utilization, and use of herbal remedies for
different opportunistic infections. Programs like the FISP deliberately target such vulnerable groups
to ensure food and nutrition security. The program also provides a highly nutritious legume
package in addition to maize. The Ministry of Health is also championing Nutrition Care and
Support Treatment (NCST) programme, which targets adolescents and adults that have nutritional
problems from ART, TB, PMTCT, antenatal care, and other related programmes. The programme is
being implemented in sixteen (16) health facilities under Machinga DHO: Gawanani, Machinga,
Chamba, Mposa, Namanja, Ntholowa, Nainunje, Mlomba, Nsanama, Ntholowa, Mbonechera,
Namandanje, Ntaja, Nyambi, Chikweo Health Centres and Machinga District Hospital. Clients
assessed as malnourished receive supplementary and therapeutic food.
6.2.32% ORT Support for Government Employees
Different sectors are implementing the 2% ORT support differently. Some sectors provide food
items, while others provide cash to HIV-positive employees.
Table 90: Number of government staff on nutritional support
Sector Number of Staff on
Nutritional Support
Remarks
Agriculture 9 Each member of staff supported with MK5000
per month
Health 87 Each staff member is supported with MK3, 448
per month
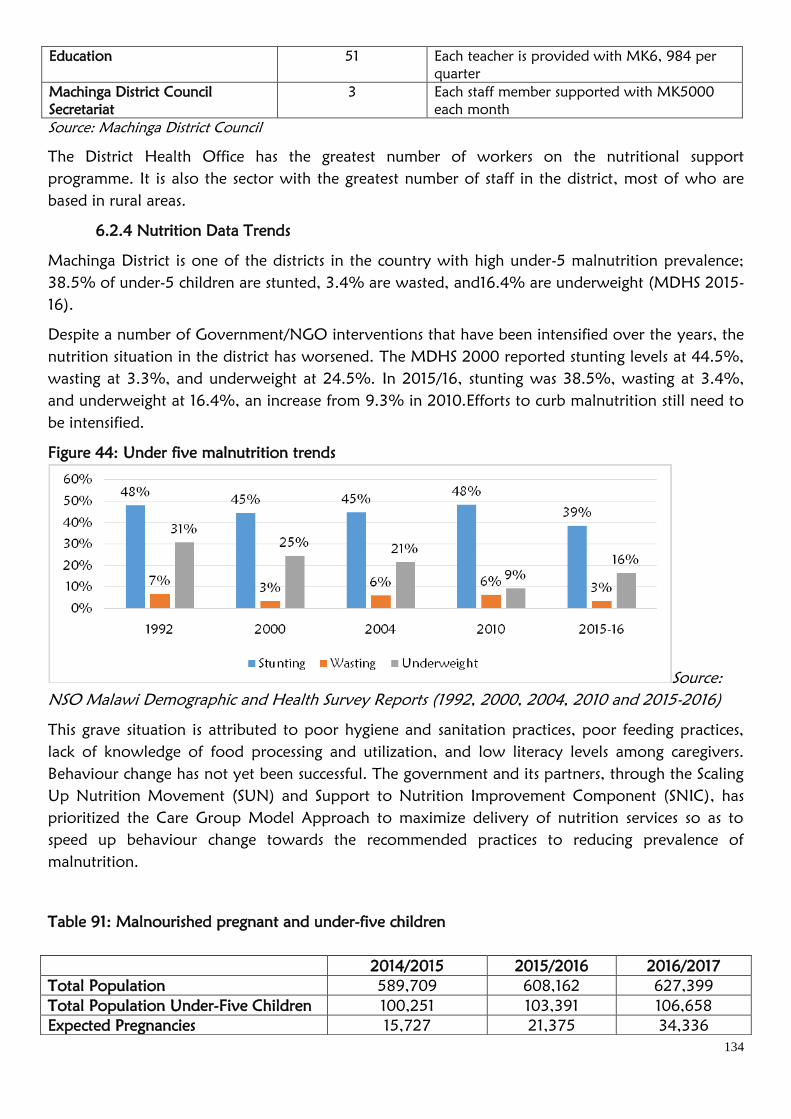
134
Education 51 Each teacher is provided with MK6, 984 per
quarter
Machinga District Council
Secretariat
3 Each staff member supported with MK5000
each month
Source: Machinga District Council
The District Health Office has the greatest number of workers on the nutritional support
programme. It is also the sector with the greatest number of staff in the district, most of who are
based in rural areas.
6.2.4 Nutrition Data Trends
Machinga District is one of the districts in the country with high under-5 malnutrition prevalence;
38.5% of under-5 children are stunted, 3.4% are wasted, and16.4% are underweight (MDHS 2015-
16).
Despite a number of Government/NGO interventions that have been intensified over the years, the
nutrition situation in the district has worsened. The MDHS 2000 reported stunting levels at 44.5%,
wasting at 3.3%, and underweight at 24.5%. In 2015/16, stunting was 38.5%, wasting at 3.4%,
and underweight at 16.4%, an increase from 9.3% in 2010.Efforts to curb malnutrition still need to
be intensified.
Figure 44: Under five malnutrition trends
Source:
NSO Malawi Demographic and Health Survey Reports (1992, 2000, 2004, 2010 and 2015-2016)
This grave situation is attributed to poor hygiene and sanitation practices, poor feeding practices,
lack of knowledge of food processing and utilization, and low literacy levels among caregivers.
Behaviour change has not yet been successful. The government and its partners, through the Scaling
Up Nutrition Movement (SUN) and Support to Nutrition Improvement Component (SNIC), has
prioritized the Care Group Model Approach to maximize delivery of nutrition services so as to
speed up behaviour change towards the recommended practices to reducing prevalence of
malnutrition.
Table 91: Malnourished pregnant and under-five children
2014/2015 2015/2016 2016/2017
Total Population 589,709 608,162 627,399
Total Population Under-Five Children 100,251 103,391 106,658
Expected Pregnancies 15,727 21,375 34,336
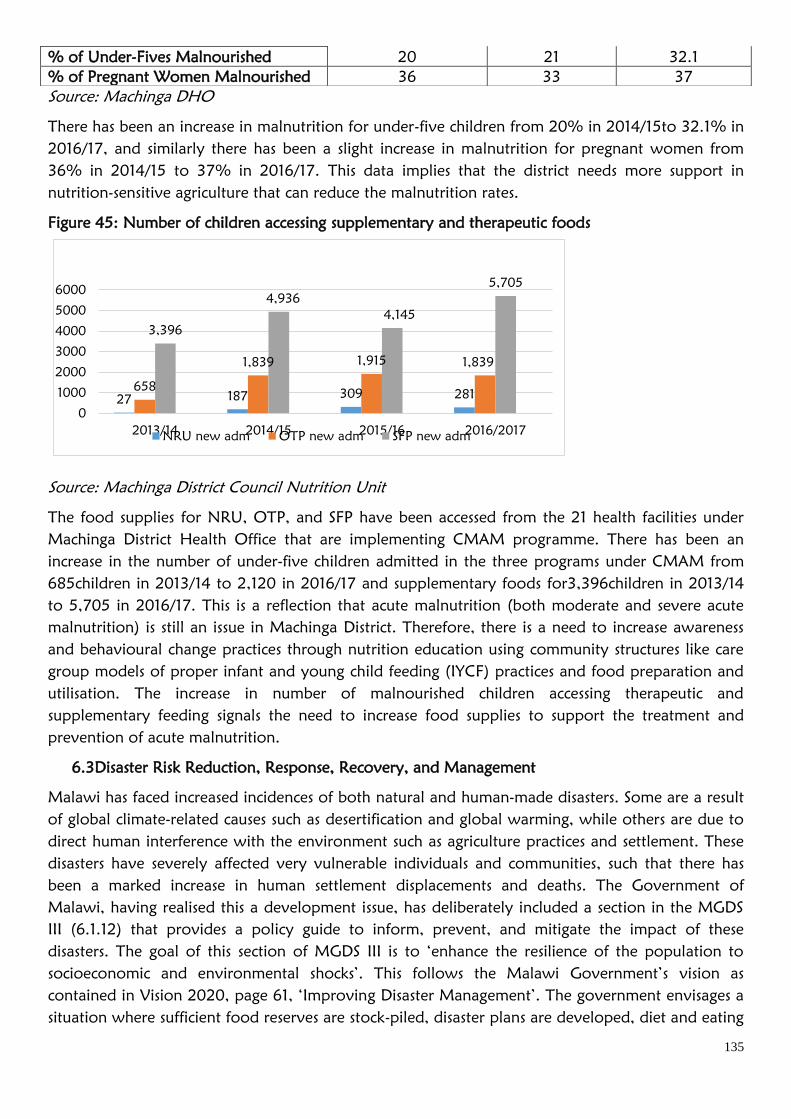
135
Source: Machinga DHO
There has been an increase in malnutrition for under-five children from 20% in 2014/15to 32.1% in
2016/17, and similarly there has been a slight increase in malnutrition for pregnant women from
36% in 2014/15 to 37% in 2016/17. This data implies that the district needs more support in
nutrition-sensitive agriculture that can reduce the malnutrition rates.
Figure 45: Number of children accessing supplementary and therapeutic foods
27 187 309 281658
1,839 1,915 1,839
3,396
4,936
4,145
5,705
0
1000
2000
3000
4000
5000
6000
2013/14 2014/15 2015/16 2016/2017NRU new adm OTP new adm SFP new adm
Source: Machinga District Council Nutrition Unit
The food supplies for NRU, OTP, and SFP have been accessed from the 21 health facilities under
Machinga District Health Office that are implementing CMAM programme. There has been an
increase in the number of under-five children admitted in the three programs under CMAM from
685children in 2013/14 to 2,120 in 2016/17 and supplementary foods for3,396children in 2013/14
to 5,705 in 2016/17. This is a reflection that acute malnutrition (both moderate and severe acute
malnutrition) is still an issue in Machinga District. Therefore, there is a need to increase awareness
and behavioural change practices through nutrition education using community structures like care
group models of proper infant and young child feeding (IYCF) practices and food preparation and
utilisation. The increase in number of malnourished children accessing therapeutic and
supplementary feeding signals the need to increase food supplies to support the treatment and
prevention of acute malnutrition.
6.3Disaster Risk Reduction, Response, Recovery, and Management
Malawi has faced increased incidences of both natural and human-made disasters. Some are a result
of global climate-related causes such as desertification and global warming, while others are due to
direct human interference with the environment such as agriculture practices and settlement. These
disasters have severely affected very vulnerable individuals and communities, such that there has
been a marked increase in human settlement displacements and deaths. The Government of
Malawi, having realised this a development issue, has deliberately included a section in the MGDS
III (6.1.12) that provides a policy guide to inform, prevent, and mitigate the impact of these
disasters. The goal of this section of MGDS III is to ‘enhance the resilience of the population to
socioeconomic and environmental shocks’. This follows the Malawi Government’s vision as
contained in Vision 2020, page 61, ‘Improving Disaster Management’. The government envisages a
situation where sufficient food reserves are stock-piled, disaster plans are developed, diet and eating
% of Under-Fives Malnourished 20 21 32.1
% of Pregnant Women Malnourished 36 33 37
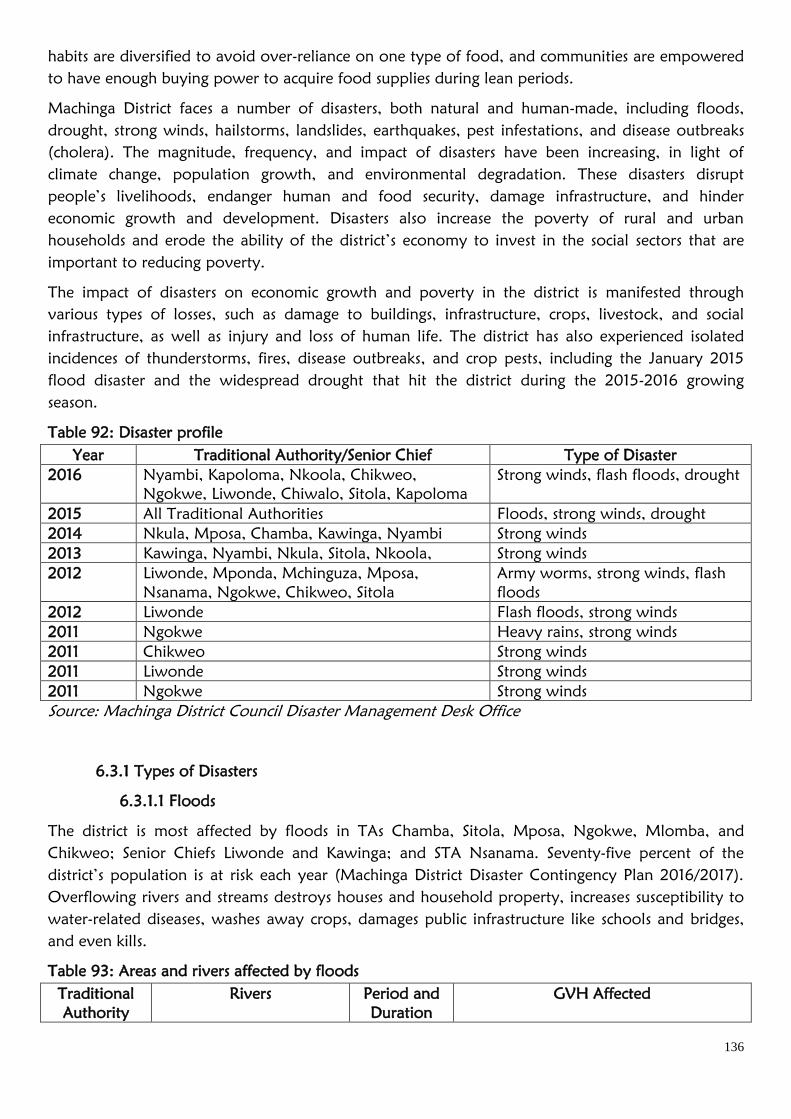
136
habits are diversified to avoid over-reliance on one type of food, and communities are empowered
to have enough buying power to acquire food supplies during lean periods.
Machinga District faces a number of disasters, both natural and human-made, including floods,
drought, strong winds, hailstorms, landslides, earthquakes, pest infestations, and disease outbreaks
(cholera). The magnitude, frequency, and impact of disasters have been increasing, in light of
climate change, population growth, and environmental degradation. These disasters disrupt
people’s livelihoods, endanger human and food security, damage infrastructure, and hinder
economic growth and development. Disasters also increase the poverty of rural and urban
households and erode the ability of the district’s economy to invest in the social sectors that are
important to reducing poverty.
The impact of disasters on economic growth and poverty in the district is manifested through
various types of losses, such as damage to buildings, infrastructure, crops, livestock, and social
infrastructure, as well as injury and loss of human life. The district has also experienced isolated
incidences of thunderstorms, fires, disease outbreaks, and crop pests, including the January 2015
flood disaster and the widespread drought that hit the district during the 2015-2016 growing
season.
Table 92: Disaster profile
Year Traditional Authority/Senior Chief Type of Disaster
2016 Nyambi, Kapoloma, Nkoola, Chikweo,
Ngokwe, Liwonde, Chiwalo, Sitola, Kapoloma
Strong winds, flash floods, drought
2015 All Traditional Authorities Floods, strong winds, drought
2014 Nkula, Mposa, Chamba, Kawinga, Nyambi Strong winds
2013 Kawinga, Nyambi, Nkula, Sitola, Nkoola, Strong winds
2012 Liwonde, Mponda, Mchinguza, Mposa,
Nsanama, Ngokwe, Chikweo, Sitola
Army worms, strong winds, flash
floods
2012 Liwonde Flash floods, strong winds
2011 Ngokwe Heavy rains, strong winds
2011 Chikweo Strong winds
2011 Liwonde Strong winds
2011 Ngokwe Strong winds
Source: Machinga District Council Disaster Management Desk Office
6.3.1 Types of Disasters
6.3.1.1 Floods
The district is most affected by floods in TAs Chamba, Sitola, Mposa, Ngokwe, Mlomba, and
Chikweo; Senior Chiefs Liwonde and Kawinga; and STA Nsanama. Seventy-five percent of the
district’s population is at risk each year (Machinga District Disaster Contingency Plan 2016/2017).
Overflowing rivers and streams destroys houses and household property, increases susceptibility to
water-related diseases, washes away crops, damages public infrastructure like schools and bridges,
and even kills.
Table 93: Areas and rivers affected by floods
Traditional
Authority
Rivers Period and
Duration
GVH Affected
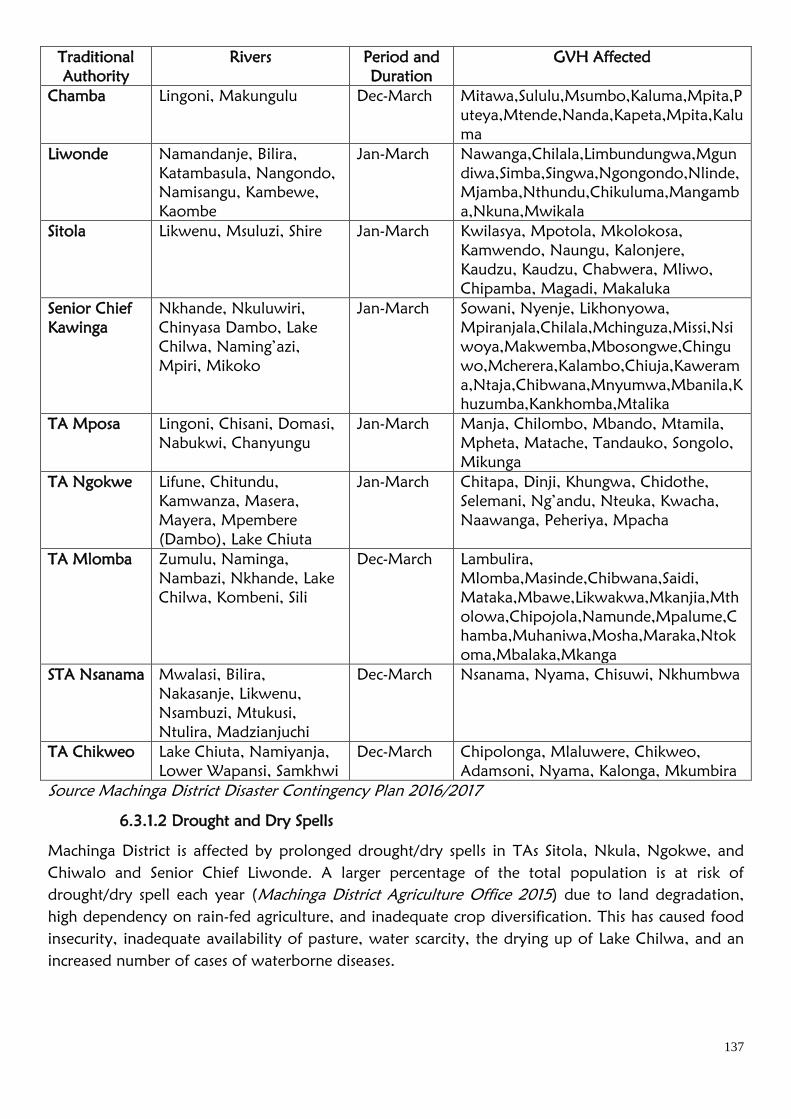
137
Traditional
Authority
Rivers Period and
Duration
GVH Affected
Chamba Lingoni, Makungulu Dec-March Mitawa,Sululu,Msumbo,Kaluma,Mpita,P
uteya,Mtende,Nanda,Kapeta,Mpita,Kalu
ma
Liwonde Namandanje, Bilira,
Katambasula, Nangondo,
Namisangu, Kambewe,
Kaombe
Jan-March Nawanga,Chilala,Limbundungwa,Mgun
diwa,Simba,Singwa,Ngongondo,Nlinde,
Mjamba,Nthundu,Chikuluma,Mangamb
a,Nkuna,Mwikala
Sitola Likwenu, Msuluzi, Shire Jan-March Kwilasya, Mpotola, Mkolokosa,
Kamwendo, Naungu, Kalonjere,
Kaudzu, Kaudzu, Chabwera, Mliwo,
Chipamba, Magadi, Makaluka
Senior Chief
Kawinga
Nkhande, Nkuluwiri,
Chinyasa Dambo, Lake
Chilwa, Naming’azi,
Mpiri, Mikoko
Jan-March Sowani, Nyenje, Likhonyowa,
Mpiranjala,Chilala,Mchinguza,Missi,Nsi
woya,Makwemba,Mbosongwe,Chingu
wo,Mcherera,Kalambo,Chiuja,Kaweram
a,Ntaja,Chibwana,Mnyumwa,Mbanila,K
huzumba,Kankhomba,Mtalika
TA Mposa Lingoni, Chisani, Domasi,
Nabukwi, Chanyungu
Jan-March Manja, Chilombo, Mbando, Mtamila,
Mpheta, Matache, Tandauko, Songolo,
Mikunga
TA Ngokwe Lifune, Chitundu,
Kamwanza, Masera,
Mayera, Mpembere
(Dambo), Lake Chiuta
Jan-March Chitapa, Dinji, Khungwa, Chidothe,
Selemani, Ng’andu, Nteuka, Kwacha,
Naawanga, Peheriya, Mpacha
TA Mlomba Zumulu, Naminga,
Nambazi, Nkhande, Lake
Chilwa, Kombeni, Sili
Dec-March Lambulira,
Mlomba,Masinde,Chibwana,Saidi,
Mataka,Mbawe,Likwakwa,Mkanjia,Mth
olowa,Chipojola,Namunde,Mpalume,C
hamba,Muhaniwa,Mosha,Maraka,Ntok
oma,Mbalaka,Mkanga
STA Nsanama Mwalasi, Bilira,
Nakasanje, Likwenu,
Nsambuzi, Mtukusi,
Ntulira, Madzianjuchi
Dec-March Nsanama, Nyama, Chisuwi, Nkhumbwa
TA Chikweo Lake Chiuta, Namiyanja,
Lower Wapansi, Samkhwi
Dec-March Chipolonga, Mlaluwere, Chikweo,
Adamsoni, Nyama, Kalonga, Mkumbira
Source Machinga District Disaster Contingency Plan 2016/2017
6.3.1.2 Drought and Dry Spells
Machinga District is affected by prolonged drought/dry spells in TAs Sitola, Nkula, Ngokwe, and
Chiwalo and Senior Chief Liwonde. A larger percentage of the total population is at risk of
drought/dry spell each year (Machinga District Agriculture Office 2015) due to land degradation,
high dependency on rain-fed agriculture, and inadequate crop diversification. This has caused food
insecurity, inadequate availability of pasture, water scarcity, the drying up of Lake Chilwa, and an
increased number of cases of waterborne diseases.
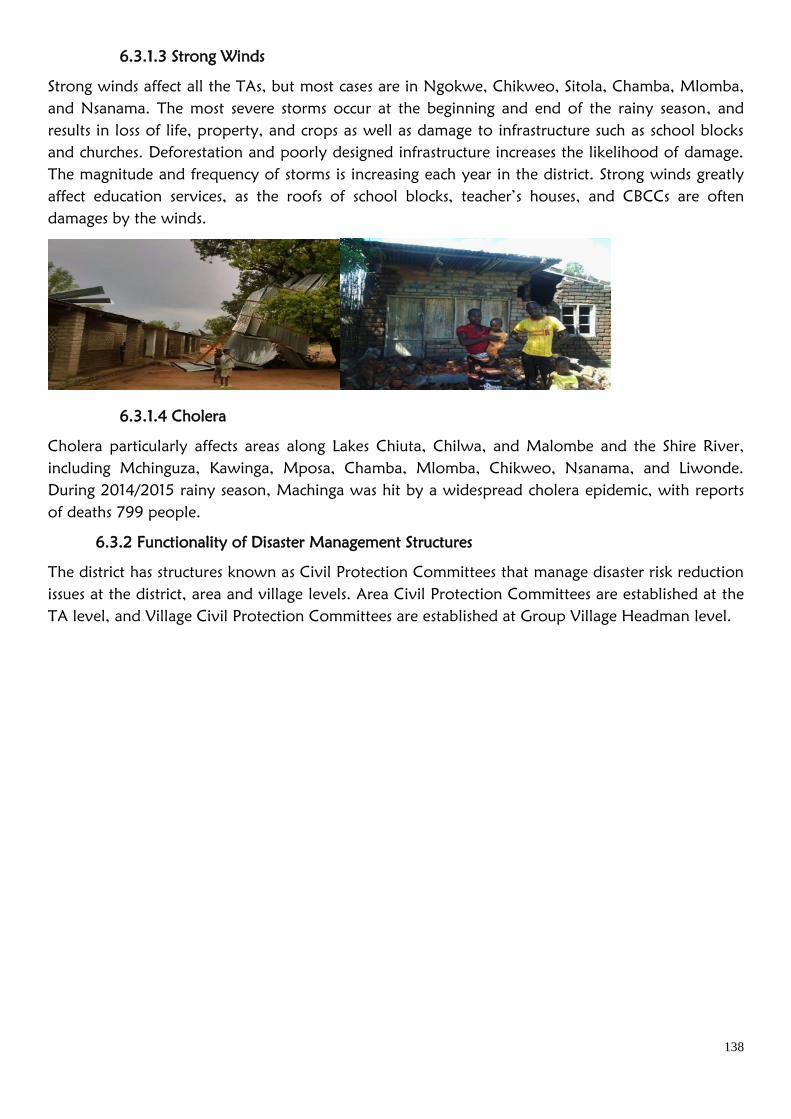
138
6.3.1.3 Strong Winds
Strong winds affect all the TAs, but most cases are in Ngokwe, Chikweo, Sitola, Chamba, Mlomba,
and Nsanama. The most severe storms occur at the beginning and end of the rainy season, and
results in loss of life, property, and crops as well as damage to infrastructure such as school blocks
and churches. Deforestation and poorly designed infrastructure increases the likelihood of damage.
The magnitude and frequency of storms is increasing each year in the district. Strong winds greatly
affect education services, as the roofs of school blocks, teacher’s houses, and CBCCs are often
damages by the winds.
6.3.1.4 Cholera
Cholera particularly affects areas along Lakes Chiuta, Chilwa, and Malombe and the Shire River,
including Mchinguza, Kawinga, Mposa, Chamba, Mlomba, Chikweo, Nsanama, and Liwonde.
During 2014/2015 rainy season, Machinga was hit by a widespread cholera epidemic, with reports
of deaths 799 people.
6.3.2 Functionality of Disaster Management Structures
The district has structures known as Civil Protection Committees that manage disaster risk reduction
issues at the district, area and village levels. Area Civil Protection Committees are established at the
TA level, and Village Civil Protection Committees are established at Group Village Headman level.
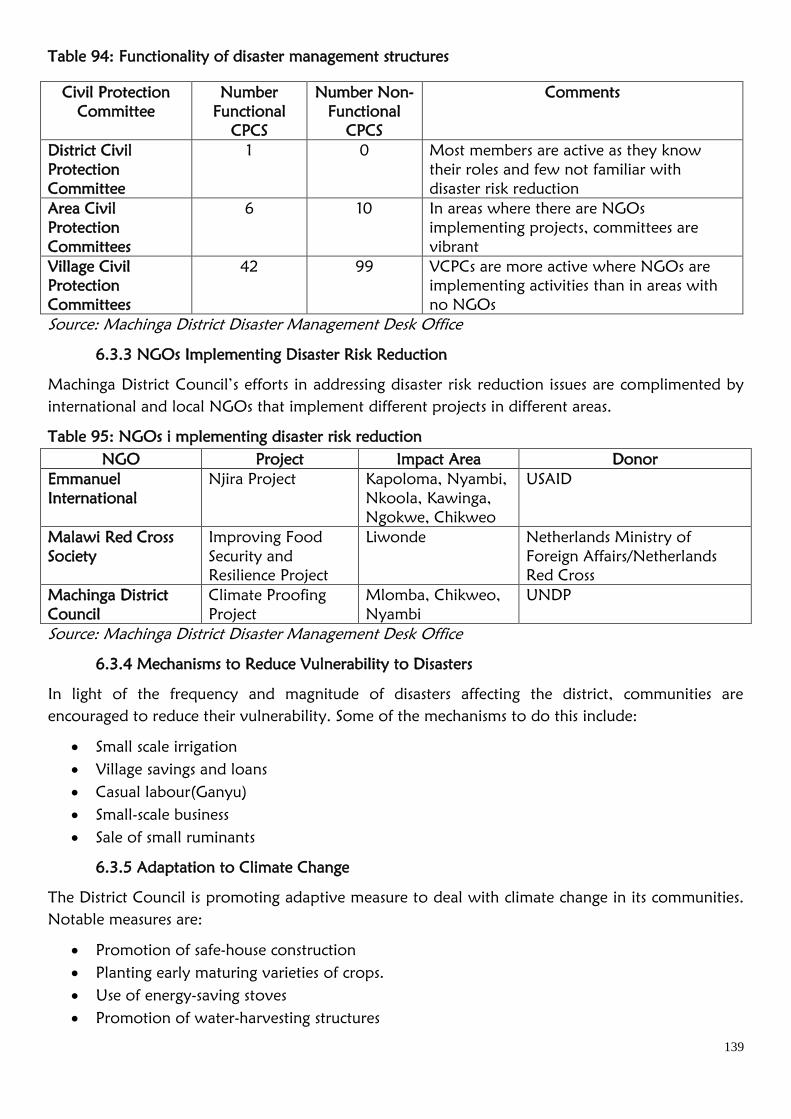
139
Table 94: Functionality of disaster management structures
Civil Protection
Committee
Number
Functional
CPCS
Number Non-
Functional
CPCS
Comments
District Civil
Protection
Committee
1 0 Most members are active as they know
their roles and few not familiar with
disaster risk reduction
Area Civil
Protection
Committees
6 10 In areas where there are NGOs
implementing projects, committees are
vibrant
Village Civil
Protection
Committees
42 99 VCPCs are more active where NGOs are
implementing activities than in areas with
no NGOs
Source: Machinga District Disaster Management Desk Office
6.3.3 NGOs Implementing Disaster Risk Reduction
Machinga District Council’s efforts in addressing disaster risk reduction issues are complimented by
international and local NGOs that implement different projects in different areas.
Table 95: NGOs i mplementing disaster risk reduction
NGO Project Impact Area Donor
Emmanuel
International
Njira Project Kapoloma, Nyambi,
Nkoola, Kawinga,
Ngokwe, Chikweo
USAID
Malawi Red Cross
Society
Improving Food
Security and
Resilience Project
Liwonde Netherlands Ministry of
Foreign Affairs/Netherlands
Red Cross
Machinga District
Council
Climate Proofing
Project
Mlomba, Chikweo,
Nyambi
UNDP
Source: Machinga District Disaster Management Desk Office
6.3.4 Mechanisms to Reduce Vulnerability to Disasters
In light of the frequency and magnitude of disasters affecting the district, communities are
encouraged to reduce their vulnerability. Some of the mechanisms to do this include:
Small scale irrigation
Village savings and loans
Casual labour(Ganyu)
Small-scale business
Sale of small ruminants
6.3.5 Adaptation to Climate Change
The District Council is promoting adaptive measure to deal with climate change in its communities.
Notable measures are:
Promotion of safe-house construction
Planting early maturing varieties of crops.
Use of energy-saving stoves
Promotion of water-harvesting structures

140
Watershed management
6.3.6 Challenges Facing the Sector
Inadequate funding to carry out activities
Incapacitated/weak local disaster risk management structures
Poorly coordinated disaster risk-reduction activities
Lack of devolution of disaster risk functions to local levels
Delayed response to disasters
Few NGOs implementing disaster risk-reduction activities
Lack of early warning system
Poorly constructed structures(houses and others)
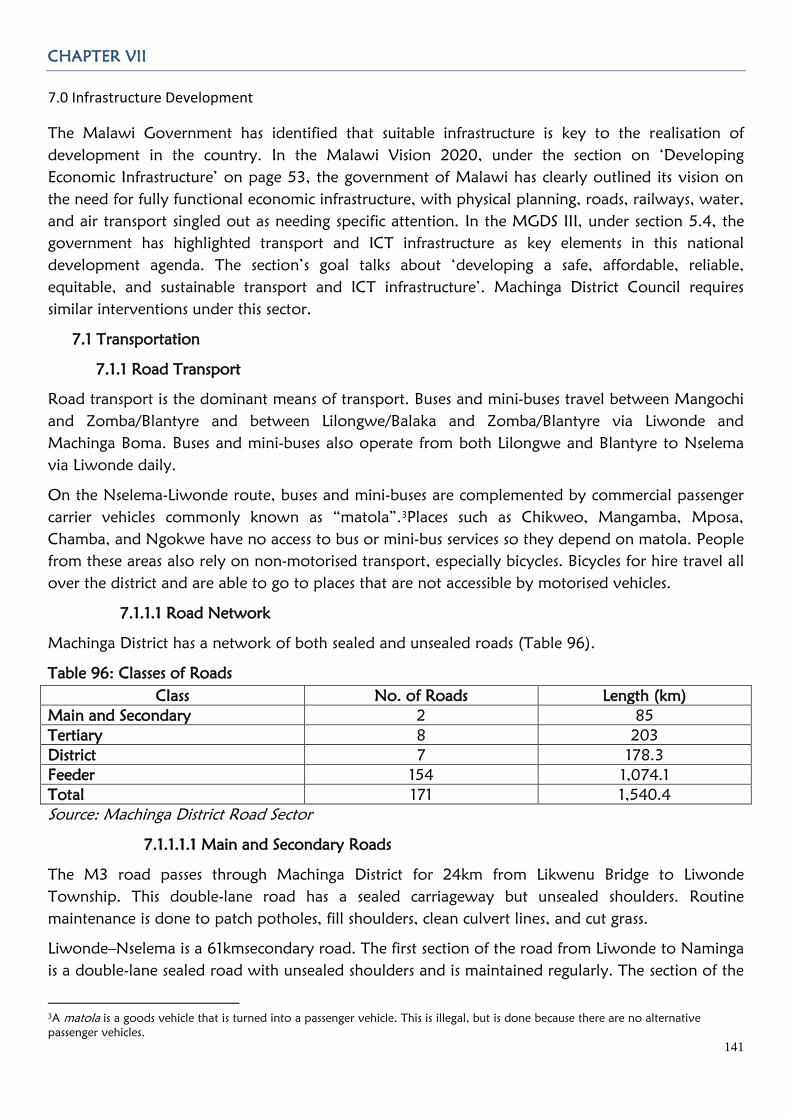
141
CHAPTER VII
7.0 Infrastructure Development
The Malawi Government has identified that suitable infrastructure is key to the realisation of
development in the country. In the Malawi Vision 2020, under the section on ‘Developing
Economic Infrastructure’ on page 53, the government of Malawi has clearly outlined its vision on
the need for fully functional economic infrastructure, with physical planning, roads, railways, water,
and air transport singled out as needing specific attention. In the MGDS III, under section 5.4, the
government has highlighted transport and ICT infrastructure as key elements in this national
development agenda. The section’s goal talks about ‘developing a safe, affordable, reliable,
equitable, and sustainable transport and ICT infrastructure’. Machinga District Council requires
similar interventions under this sector.
7.1 Transportation
7.1.1 Road Transport
Road transport is the dominant means of transport. Buses and mini-buses travel between Mangochi
and Zomba/Blantyre and between Lilongwe/Balaka and Zomba/Blantyre via Liwonde and
Machinga Boma. Buses and mini-buses also operate from both Lilongwe and Blantyre to Nselema
via Liwonde daily.
On the Nselema-Liwonde route, buses and mini-buses are complemented by commercial passenger
carrier vehicles commonly known as “matola”.3Places such as Chikweo, Mangamba, Mposa,
Chamba, and Ngokwe have no access to bus or mini-bus services so they depend on matola. People
from these areas also rely on non-motorised transport, especially bicycles. Bicycles for hire travel all
over the district and are able to go to places that are not accessible by motorised vehicles.
7.1.1.1 Road Network
Machinga District has a network of both sealed and unsealed roads (Table 96).
Table 96: Classes of Roads
Class No. of Roads Length (km)
Main and Secondary 2 85
Tertiary 8 203
District 7 178.3
Feeder 154 1,074.1
Total 171 1,540.4
Source: Machinga District Road Sector
7.1.1.1.1 Main and Secondary Roads
The M3 road passes through Machinga District for 24km from Likwenu Bridge to Liwonde
Township. This double-lane road has a sealed carriageway but unsealed shoulders. Routine
maintenance is done to patch potholes, fill shoulders, clean culvert lines, and cut grass.
Liwonde–Nselema is a 61kmsecondary road. The first section of the road from Liwonde to Naminga
is a double-lane sealed road with unsealed shoulders and is maintained regularly. The section of the
3A matola is a goods vehicle that is turned into a passenger vehicle. This is illegal, but is done because there are no alternative
passenger vehicles.
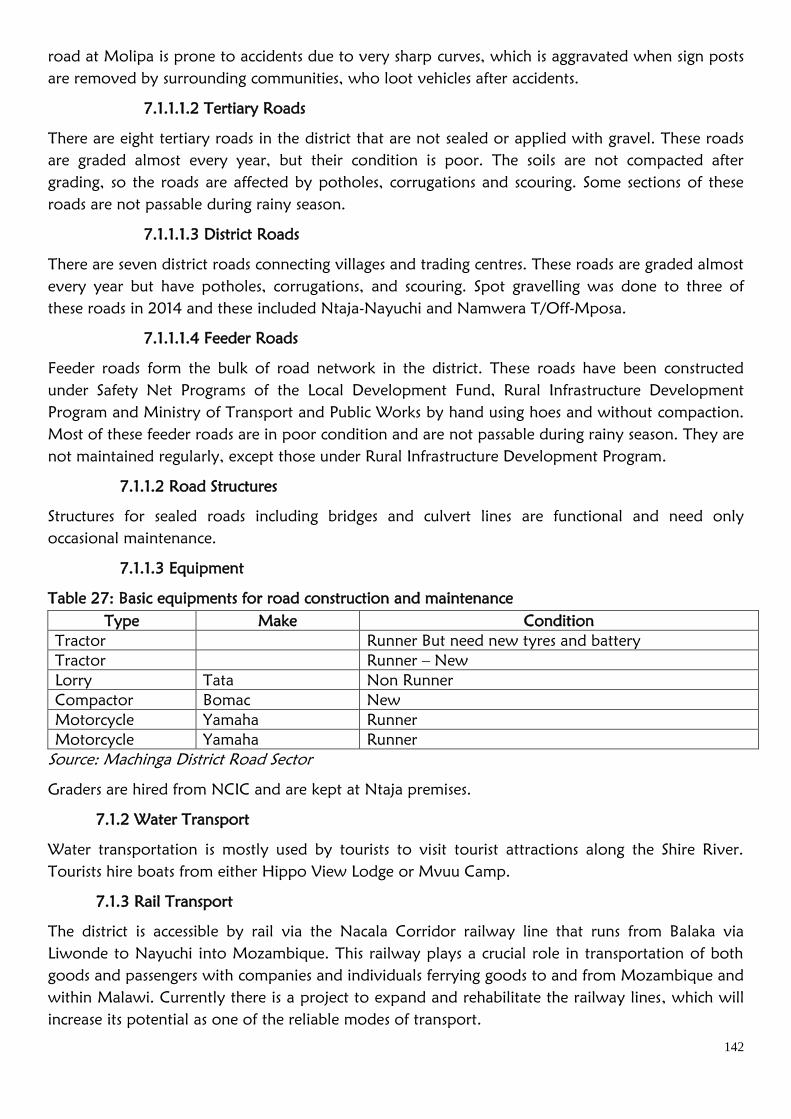
142
road at Molipa is prone to accidents due to very sharp curves, which is aggravated when sign posts
are removed by surrounding communities, who loot vehicles after accidents.
7.1.1.1.2 Tertiary Roads
There are eight tertiary roads in the district that are not sealed or applied with gravel. These roads
are graded almost every year, but their condition is poor. The soils are not compacted after
grading, so the roads are affected by potholes, corrugations and scouring. Some sections of these
roads are not passable during rainy season.
7.1.1.1.3 District Roads
There are seven district roads connecting villages and trading centres. These roads are graded almost
every year but have potholes, corrugations, and scouring. Spot gravelling was done to three of
these roads in 2014 and these included Ntaja-Nayuchi and Namwera T/Off-Mposa.
7.1.1.1.4 Feeder Roads
Feeder roads form the bulk of road network in the district. These roads have been constructed
under Safety Net Programs of the Local Development Fund, Rural Infrastructure Development
Program and Ministry of Transport and Public Works by hand using hoes and without compaction.
Most of these feeder roads are in poor condition and are not passable during rainy season. They are
not maintained regularly, except those under Rural Infrastructure Development Program.
7.1.1.2 Road Structures
Structures for sealed roads including bridges and culvert lines are functional and need only
occasional maintenance.
7.1.1.3 Equipment
Table 27: Basic equipments for road construction and maintenance
Type Make Condition
Tractor Runner But need new tyres and battery
Tractor Runner – New
Lorry Tata Non Runner
Compactor Bomac New
Motorcycle Yamaha Runner
Motorcycle Yamaha Runner
Source: Machinga District Road Sector
Graders are hired from NCIC and are kept at Ntaja premises.
7.1.2 Water Transport
Water transportation is mostly used by tourists to visit tourist attractions along the Shire River.
Tourists hire boats from either Hippo View Lodge or Mvuu Camp.
7.1.3 Rail Transport
The district is accessible by rail via the Nacala Corridor railway line that runs from Balaka via
Liwonde to Nayuchi into Mozambique. This railway plays a crucial role in transportation of both
goods and passengers with companies and individuals ferrying goods to and from Mozambique and
within Malawi. Currently there is a project to expand and rehabilitate the railway lines, which will
increase its potential as one of the reliable modes of transport.
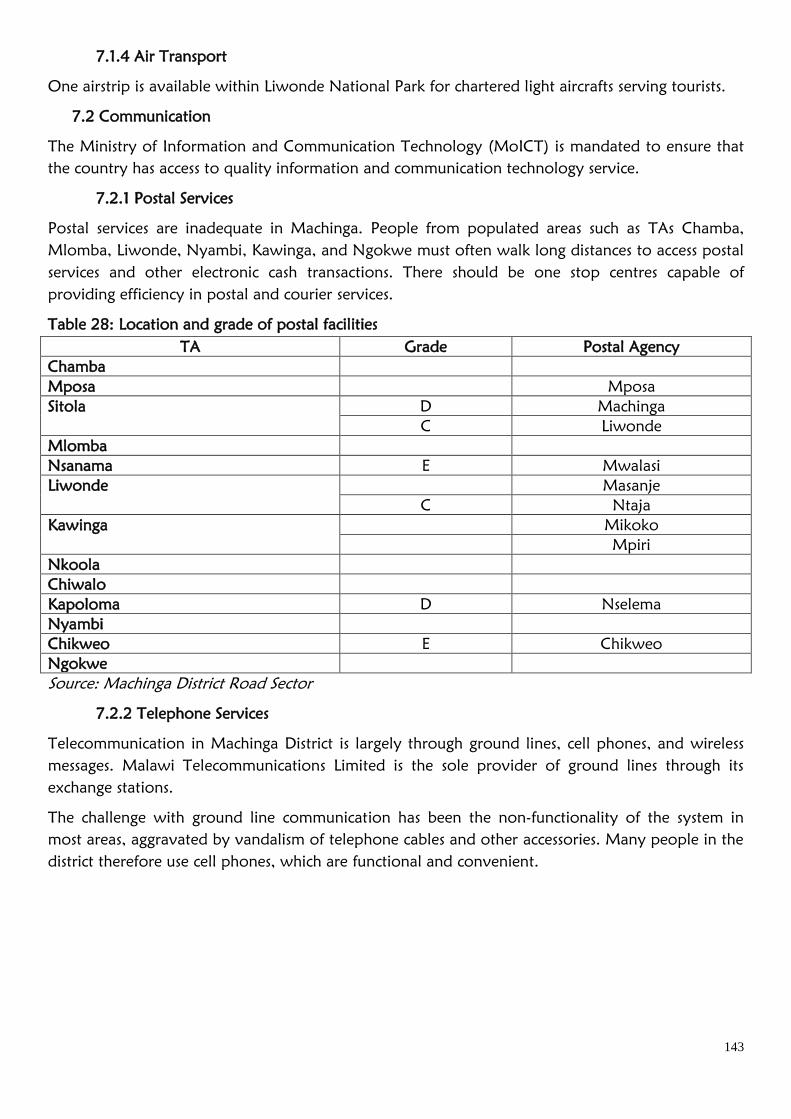
143
7.1.4 Air Transport
One airstrip is available within Liwonde National Park for chartered light aircrafts serving tourists.
7.2 Communication
The Ministry of Information and Communication Technology (MoICT) is mandated to ensure that
the country has access to quality information and communication technology service.
7.2.1 Postal Services
Postal services are inadequate in Machinga. People from populated areas such as TAs Chamba,
Mlomba, Liwonde, Nyambi, Kawinga, and Ngokwe must often walk long distances to access postal
services and other electronic cash transactions. There should be one stop centres capable of
providing efficiency in postal and courier services.
Table 28: Location and grade of postal facilities
TA Grade Postal Agency
Chamba
Mposa Mposa
Sitola D Machinga
C Liwonde
Mlomba
Nsanama E Mwalasi
Liwonde Masanje
C Ntaja
Kawinga Mikoko
Mpiri
Nkoola
Chiwalo
Kapoloma D Nselema
Nyambi
Chikweo E Chikweo
Ngokwe
Source: Machinga District Road Sector
7.2.2 Telephone Services
Telecommunication in Machinga District is largely through ground lines, cell phones, and wireless
messages. Malawi Telecommunications Limited is the sole provider of ground lines through its
exchange stations.
The challenge with ground line communication has been the non-functionality of the system in
most areas, aggravated by vandalism of telephone cables and other accessories. Many people in the
district therefore use cell phones, which are functional and convenient.

144
Table 99: Malawi Telecommunications services
Station Telephone Lines Available Telephone Lines Used Public Phones
Machinga 120 80 1
Liwonde 650 550 4
Mwalasi 79 79 0
Ntaja 500 219 0
Nselema 78 78 0
Source: MTL - Machinga
7.2.3 Cellular Network
Cellular networks have largely improved telecommunication in the district. There are four networks
available in the district, with Airtel and Telecom Networks Limited dominating the waves.
Table 100: Coverage of Cellular Networks
Network Area of Coverage by Trading Center
Airtel Machinga Boma, Liwonde Town, Nsanama, Ntaja, Nselema, Chikweo
TNM Machinga Boma, Liwonde Town, Nsanama, Ntaja, Ngokwe
MTL Machinga Boma, Liwonde Town
Access Liwonde Town
Source: Airtel, TNM, MTL and Access
7.2.4 Radio Network and Listenership
The district is fully covered in terms of radio listenership. Each TA is served by at least one radio
station such as Malawi Broadcasting Corporation Radio 1 and 2, or Zodiak. The following radio
stations also enjoy listenership in some parts of the district: Radio Maria, Radio Islam, Yoneco FM,
Joy FM, MIJ FM, Chanco Community Radio, Blantyre Synod Radio, Transworld Radio, Ufulu FM,
Galaxy FM, and Capital Radio.
In a bid to enhance citizen participation, different organisations have facilitated formation of radio
listening clubs in some parts of the district.
Table 101: Number of radio listening clubs
Organisation Nyambi Ngokwe Chikweo Chamba Nkula Kawinga Chiwalo
YONECO 5 5
PSI 4 4 4
CDT 5 2 5 5
Blantyre
SYNOD
2
Story
Workshop
5
Source: Machinga DCDO
7.2.5 TV Networks and Viewership
Some parts of Machinga District have access to MBC TV like Liwonde Township and Machinga
Boma while some residents of Ntaja can view Luntha TV. Residents of Liwonde Town and
Machinga Boma, have access to pay TV such as Multchoice.
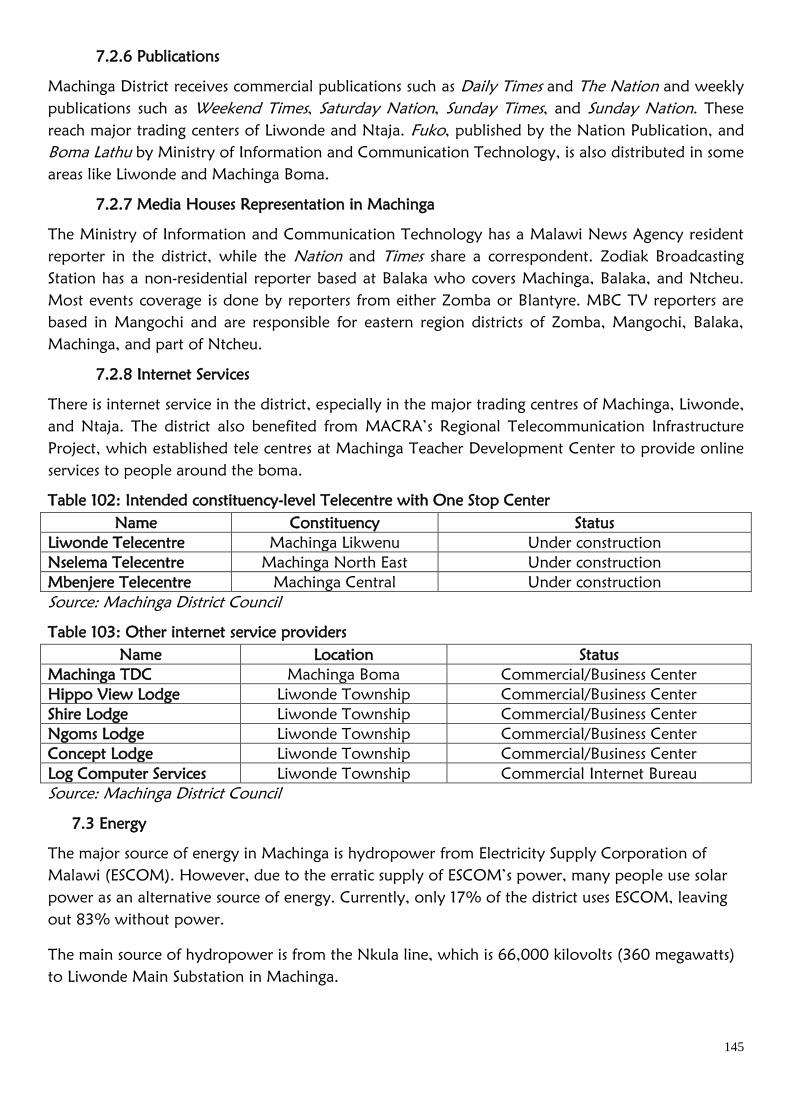
145
7.2.6 Publications
Machinga District receives commercial publications such as Daily Times and The Nation and weekly
publications such as Weekend Times, Saturday Nation, Sunday Times, and Sunday Nation. These
reach major trading centers of Liwonde and Ntaja. Fuko, published by the Nation Publication, and
Boma Lathu by Ministry of Information and Communication Technology, is also distributed in some
areas like Liwonde and Machinga Boma.
7.2.7 Media Houses Representation in Machinga
The Ministry of Information and Communication Technology has a Malawi News Agency resident
reporter in the district, while the Nation and Times share a correspondent. Zodiak Broadcasting
Station has a non-residential reporter based at Balaka who covers Machinga, Balaka, and Ntcheu.
Most events coverage is done by reporters from either Zomba or Blantyre. MBC TV reporters are
based in Mangochi and are responsible for eastern region districts of Zomba, Mangochi, Balaka,
Machinga, and part of Ntcheu.
7.2.8 Internet Services
There is internet service in the district, especially in the major trading centres of Machinga, Liwonde,
and Ntaja. The district also benefited from MACRA’s Regional Telecommunication Infrastructure
Project, which established tele centres at Machinga Teacher Development Center to provide online
services to people around the boma.
Table 102: Intended constituency-level Telecentre with One Stop Center
Name Constituency Status
Liwonde Telecentre Machinga Likwenu Under construction
Nselema Telecentre Machinga North East Under construction
Mbenjere Telecentre Machinga Central Under construction
Source: Machinga District Council
Table 103: Other internet service providers
Name Location Status
Machinga TDC Machinga Boma Commercial/Business Center
Hippo View Lodge Liwonde Township Commercial/Business Center
Shire Lodge Liwonde Township Commercial/Business Center
Ngoms Lodge Liwonde Township Commercial/Business Center
Concept Lodge Liwonde Township Commercial/Business Center
Log Computer Services Liwonde Township Commercial Internet Bureau
Source: Machinga District Council
7.3 Energy
The major source of energy in Machinga is hydropower from Electricity Supply Corporation of
Malawi (ESCOM). However, due to the erratic supply of ESCOM’s power, many people use solar
power as an alternative source of energy. Currently, only 17% of the district uses ESCOM, leaving
out 83% without power.
The main source of hydropower is from the Nkula line, which is 66,000 kilovolts (360 megawatts)
to Liwonde Main Substation in Machinga.
146
The main substation at Liwonde also redistributes electricity to parts of Ntaja, Mselema, and
Namwera in Mangochi. The current power is able to meet the demand for consumers, and ESCOM
is able to support consumers even during peak periods i.e. morning from 5.30 to 7.00a.m., midday
from 11.00 to 12.00 noon and evening from 5.30 to 7.00 p.m.
6.6.2Potential Power Generation Sites
From 2018 January, all generating plants will be manned by EGENCO as established by a
parliamentary act, and ESCOM shall buy power to redistribute to customers. The government is
also still in the process of establishing an electricity link to Mozambique through a World Bank
project; this connection is expected to be complete by 2021.
6.6.3Other Sources of Energy
At the moment, the majority of the households (94.4%) continue to use wood, paraffin, etc, as fuel
sources.
7.4 Housing
Machinga District is among those benefiting from the Malawi Decent and Affordable Housing
Subsidy Program (DAHSP), which is implemented in two forms: as a grant and as a loan. Grants
target those vulnerable individuals that cannot manage to construct a decent house on their own.
The government will build them houses, for which they will not pay anything.
Loans are for those households/individuals that can pay within a specified period. Beneficiaries are
identified at constituency level, 80 per constituency including 5 vulnerable individuals. Machinga
District has 7 constituencies, which means 560 beneficiaries are identified and targeted. The
program started in the 2014/2015 financial year in Machinga District, where the 560 beneficiaries
were selected. Among the 560 beneficiaries, 82 did not receive cement, iron sheets, ridges, and
timbers. Currently, about 225 beneficiaries have completed their houses. However, since 2014/15,
assistance in the form of houses for the vulnerable has not yet begun.
The program is continuing with 2016/2017 financial year where 560 beneficiaries have been
identified and are being supplied with building materials. Identification of 2017/2018 beneficiaries is
also in progress. Those beneficiaries from the list of 560 who were initially identified but had not
benefitted in the 2014/2015, are now getting the intended supplies.
7.4.1 Challenges
The program suffers from:
Poor quality materials
Unreliable delivery of materials
Political interference
147
CHAPTER VIII
8.0 Governance
Coming from a background of 30 years of single-party rule, Malawi realized the need to change its
political and social dynamics. An immediate area to focus on after democratic pluralism was
‘governance’. The Malawi Government’s goal is outlined in Vision 2020 under ‘Good Governance’,
which is one of the biggest sections in document, covering pages 33 to 39. MGDS III section 3.5
highlights the need to provide an enabling environment for making good decisions and therefore
about the ‘best possible process for making those decisions”.
8.1 Security Services
The main security service provider in Machinga is the Malawi Police Service. Although there is
proliferation of private, security firms providing services to various businesses and individuals.
However, while these private firms play a part in security in Machinga especially in urban centres
their coverage is small and insignificant and therefore the focus of this part is on the Malawi Police
Services.
8.1.1 Police Formations
Machinga has one Police Station at Machinga Boma, four Police Posts at Ntaja, Nselema, Nayuchi,
and Liwonde, and four Police Units at Ngokwe, Chikweo, Mangamba, and Mposa. Machinga also
has three permanent police check points at Liwonde, Nsanama, and Machinga.
8.1.1.1 Distribution of Police Formations per TA/STAs
Policing in Machinga is divided into various policing areas, as follows:
1. Machinga Policing Area: Covers the areas of TAs Sitola, Nkula, and part of Chamba.
2. Ntaja Policing Area: Covers the areas of Paramount Chief Kawinga and Part of Liwonde, and
TAs Mlomba, Nsanama, and Nkoola.
3. Nayuchi Policing Area: Covers the areas of STA Mchinguza along the Malawi/Mozambique
boarder.
4. Liwonde Policing Area: Covers the areas of TAs Sitola and Liwonde Township.
5. Nselema Policing Area: Covers the areas of Senior Chief Nyambi, TAs Chiwalo, and
Kapoloma, and STA Salle.
6. Ngokwe Policing Area: Covers the area of TA Ngokwe.
7. Mangamba Policing Area: Covers part of Senior TA Liwonde.
8. Chikweo Policing Area: Covers the area of TAs Chikweo and Nkoola.
9. Mposa Policing area: Covers areas around TA Mposa and Lake Chilwa.
The above zoning of the district covers more than 90% of the district. Though all the major zones
of the district are covered with security services, access to these services is still a major challenge
since each police formation covers an average radius of 10 to 15 km.
8.1.2 Number of Police Personnel
As of July 2017, the number of police personnel in Machinga was at 234 for the civilian population
of 647,401 (NSO 2008). This means that the police to resident ratio is 1: 2,767, much higher than
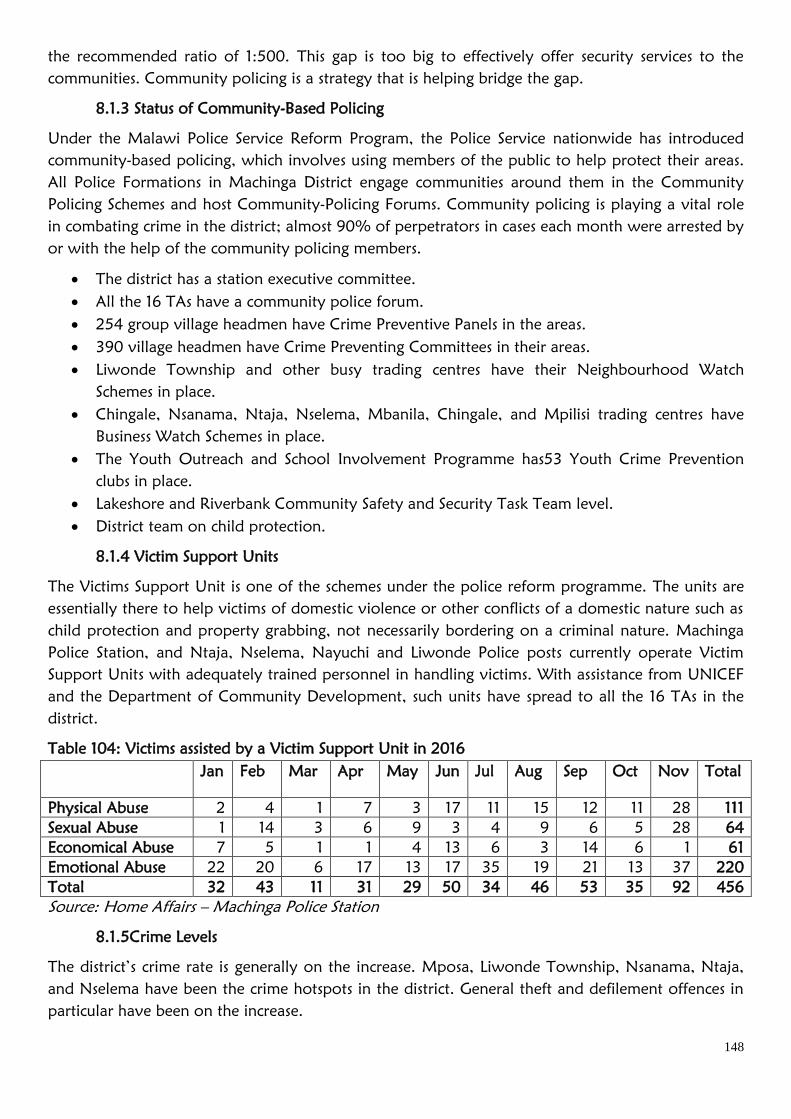
148
the recommended ratio of 1:500. This gap is too big to effectively offer security services to the
communities. Community policing is a strategy that is helping bridge the gap.
8.1.3 Status of Community-Based Policing
Under the Malawi Police Service Reform Program, the Police Service nationwide has introduced
community-based policing, which involves using members of the public to help protect their areas.
All Police Formations in Machinga District engage communities around them in the Community
Policing Schemes and host Community-Policing Forums. Community policing is playing a vital role
in combating crime in the district; almost 90% of perpetrators in cases each month were arrested by
or with the help of the community policing members.
The district has a station executive committee.
All the 16 TAs have a community police forum.
254 group village headmen have Crime Preventive Panels in the areas.
390 village headmen have Crime Preventing Committees in their areas.
Liwonde Township and other busy trading centres have their Neighbourhood Watch
Schemes in place.
Chingale, Nsanama, Ntaja, Nselema, Mbanila, Chingale, and Mpilisi trading centres have
Business Watch Schemes in place.
The Youth Outreach and School Involvement Programme has53 Youth Crime Prevention
clubs in place.
Lakeshore and Riverbank Community Safety and Security Task Team level.
District team on child protection.
8.1.4 Victim Support Units
The Victims Support Unit is one of the schemes under the police reform programme. The units are
essentially there to help victims of domestic violence or other conflicts of a domestic nature such as
child protection and property grabbing, not necessarily bordering on a criminal nature. Machinga
Police Station, and Ntaja, Nselema, Nayuchi and Liwonde Police posts currently operate Victim
Support Units with adequately trained personnel in handling victims. With assistance from UNICEF
and the Department of Community Development, such units have spread to all the 16 TAs in the
district.
Table 104: Victims assisted by a Victim Support Unit in 2016
Jan Feb Mar Apr May Jun Jul Aug Sep Oct Nov Total
Physical Abuse 2 4 1 7 3 17 11 15 12 11 28 111
Sexual Abuse 1 14 3 6 9 3 4 9 6 5 28 64
Economical Abuse 7 5 1 1 4 13 6 3 14 6 1 61
Emotional Abuse 22 20 6 17 13 17 35 19 21 13 37 220
Total 32 43 11 31 29 50 34 46 53 35 92 456
Source: Home Affairs – Machinga Police Station
8.1.5Crime Levels
The district’s crime rate is generally on the increase. Mposa, Liwonde Township, Nsanama, Ntaja,
and Nselema have been the crime hotspots in the district. General theft and defilement offences in
particular have been on the increase.
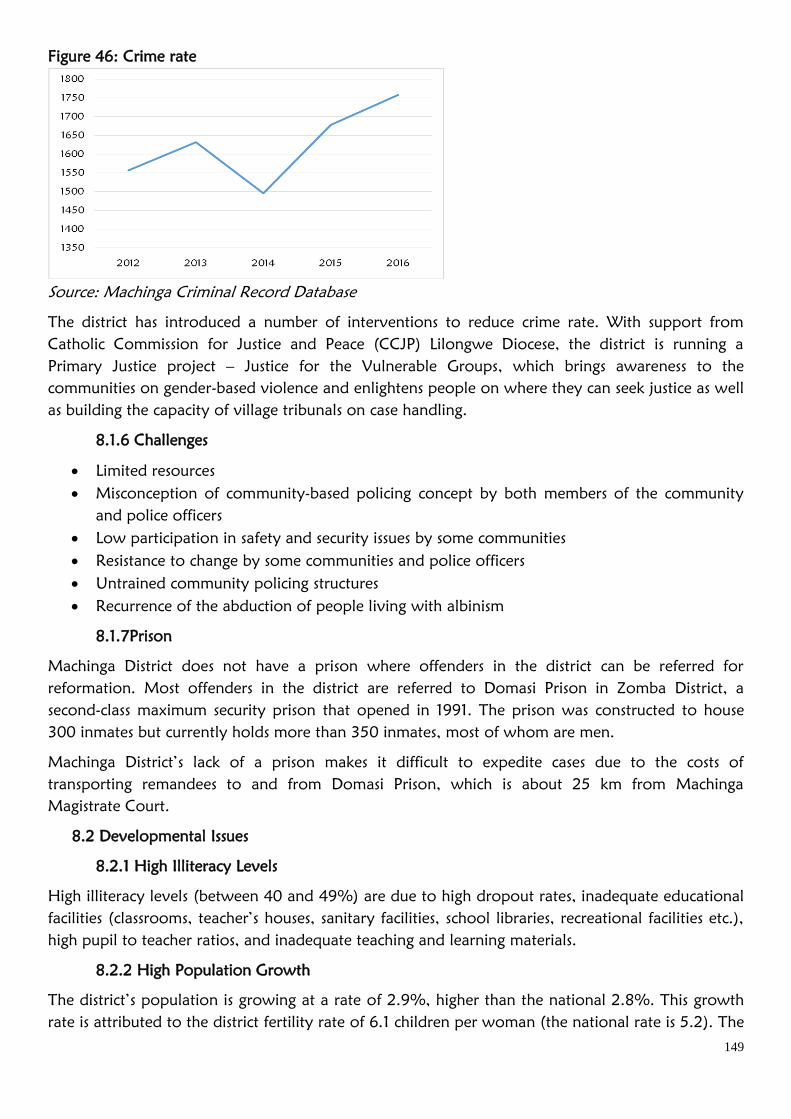
149
Figure 46: Crime rate
Source: Machinga Criminal Record Database
The district has introduced a number of interventions to reduce crime rate. With support from
Catholic Commission for Justice and Peace (CCJP) Lilongwe Diocese, the district is running a
Primary Justice project – Justice for the Vulnerable Groups, which brings awareness to the
communities on gender-based violence and enlightens people on where they can seek justice as well
as building the capacity of village tribunals on case handling.
8.1.6 Challenges
Limited resources
Misconception of community-based policing concept by both members of the community
and police officers
Low participation in safety and security issues by some communities
Resistance to change by some communities and police officers
Untrained community policing structures
Recurrence of the abduction of people living with albinism
8.1.7Prison
Machinga District does not have a prison where offenders in the district can be referred for
reformation. Most offenders in the district are referred to Domasi Prison in Zomba District, a
second-class maximum security prison that opened in 1991. The prison was constructed to house
300 inmates but currently holds more than 350 inmates, most of whom are men.
Machinga District’s lack of a prison makes it difficult to expedite cases due to the costs of
transporting remandees to and from Domasi Prison, which is about 25 km from Machinga
Magistrate Court.
8.2 Developmental Issues
8.2.1 High Illiteracy Levels
High illiteracy levels (between 40 and 49%) are due to high dropout rates, inadequate educational
facilities (classrooms, teacher’s houses, sanitary facilities, school libraries, recreational facilities etc.),
high pupil to teacher ratios, and inadequate teaching and learning materials.
8.2.2 High Population Growth
The district’s population is growing at a rate of 2.9%, higher than the national 2.8%. This growth
rate is attributed to the district fertility rate of 6.1 children per woman (the national rate is 5.2). The
150
underlining causes of this high fertility rate are low uptake of contraceptives, early marriages, and
teen pregnancies.
8.2.3 Inadequate Health Services
The district is failing to provide adequate health services to its residents due to high population
growth and inadequate:
health facilities;
number of health personnel;
WASH facilities in health facilities; and
Number of ambulance vehicles or bicycles for HSAs.
Additionally, the high illiteracy levels in Machinga contribute to the low uptake of health education
messages.
8.2.4 Food Insecurity
In Machinga District, most farming households run out of food from their own production by
November each year. The major causes of the food insecurity among farming households are:
Low food production levels.
Low livestock production and animal malnutrition.
Poor soil fertility and pest and disease incidences.
Low uptake of improved and modern agricultural technologies.
Only 1,572 hectares out of a possible 12, 500 hectares are being irrigated.
High mortality rate of young stocks, poor feeding practices, poor grazing land, poor
housing, livestock pests and diseases, and improper breeding practices.
Unsustainable farming practices such as mono-cropping and cultivation of marginal lands.
A high extension worker to farmer ratio of1:2,938 (the recommended ratio is1:800).
Low fish production from Lake Chilwa and Chiuta due to overfishing, illegal fishing,
sedimentation, and climate change.
8.2.5 Environmental Degradation
This is due to inadequate forest services and unsustainable utilization of natural resources by the
communities. Of paramount concern is the increasing rate of encroachment in the protected forest
reserves, particularly at Chaone and Chilima.
8.2.6 Other Issues
Additional issues include:
Acute malnutrition
Limited accessibility to potable water and sanitation services
Poor transport and communication facilities
Low disposable income at household level
Limited access to justice by the vulnerable
Inadequate support to vulnerable women and children
Weak local government decentralized institutions
Low participation of youth in development programmes
151
CHAPTER IX
NATIONAL DEVELOPMENT POLICIES
Malawi Vision 2020
Malawi Vision 2020 is the country’s official long-term development plan, from which medium- and
short-term development strategies and plans are developed. The development of the Vision 2020,
which was officially published in 1998, followed 10-year Development Plans (DEVPO) that were
used after Malawi attained Independence in 1964.
Vision 2020 has nine Strategic Challenges:
1. Good governance
2. Sustainable economic growth and development
3. Vibrant culture
4. Economic infrastructure
5. Social sector development
6. Science and technology-led development
7. Fair and equitable distribution of income and wealth
8. Food security
9. Sustainable natural resource and environmental management
The Malawi Growth and Development Strategy (MGDS) III
The aims of the MGDS III are to build a productive, competitive, and resilient nation by
consolidating the achievements of MGDS I and MGDS II. The MGDS III has singled out six national
priority areas that will spur socioeconomic development of this country. Agriculture and climate
change management will contribute to national food security status, nutrition enhancement,
environmental management, agro-processing and value addition, and manufacturing and trade.
Education and skill development will promote industry, trade, technology adoption, increased
productivity, and improved levels of employment. Energy, industry, and tourism development will
increase employment, productivity, exports, and net trade. Transport and ICT infrastructure will
augment agri-business, private sector growth, education and health service provision, tourism
development, and global partnerships, as well as security enhancement. Lastly effective
implementation of health and population as a priority area will enhance productivity among the
labour force, reduce the disease burden, reduce unemployment and gender inequality, and enhance
land-use planning and human settlements to optimize ecosystem services to support key sectors such
as energy, health, agriculture, and tourism.
In line with the above MGDS III aspirations, the Machinga Socio-Economic Profile has likewise,
looked at gaps and achievements made in similar thematic areas where stepping stones and
increased interventions should be made.

152
1. The Sustainable Development Goals (SDGs)
The Sustainable Development Goals (SDGs) are a collection of 17 global goals set by the United
Nations. The broad goals are interrelated though each has its own targets to achieve. The total
number of targets is 169. The SDGs cover a broad range of social and economic development issues.
These include poverty, hunger, health, education, climate change, gender equality, water,
sanitation, energy, environment and social justice. The SDGs are also known as "Transforming our
World: the 2030 Agenda for Sustainable Development" or 2030 Agenda in short. The goals were
developed to replace the Millennium Development Goals (MDGs) which ended in 2015. Unlike the
MDGs, the SDG framework does not distinguish between "developed" and "developing" nations.
Instead, the goals apply to all countries. The Malawi Government, in general and Machinga District
Council, in particular, has taken deliberate cognizance of the minimum requirements of the SDGs,
for its development programmes and projects.
Goal 1: No Poverty
Goal 2: Zero Hunger
Goal 3: Good Health and Well-Being for people
Goal 4: Quality Education
Goal 5: Gender Equality
Goal 6: Clean Water and Sanitation
Goal 7: Affordable and Clean Energy
Goal 8: Decent Work and Economic Growth
Goal 9: Industry, Innovation and Infrastructure
Goal 10: Reduced Inequalities
Goal 11: Sustainable Cities and Communities
Goal 12: Responsible Consumption and Production
Goal 13: Climate Action
Goal 14: Life Below Water
Goal 15: Life on Land
Goal 16: Peace, Justice and Strong Institutions
Goal 17: Partnerships for the Goals
2. Decentralization Policy and Local Governance
Decentralization of political and administrative authority to district level represents a paramount
priority of the Malawi Government, as outlined in the National Decentralization Policy. The policy
in Malawi was approved by cabinet in 1998 and was backed by the Local Government Act. The
form of decentralization implemented in Malawi is referred to as “devolution.” The
Decentralization Policy aims at:
Devolving administrative and political authority to the districts
Integrating governmental agencies at the district and local level into one administrative unit
through the process of institutional integration, manpower absorption, composite budgeting
and provision of funds for the decentralized services
Diverting the centre of implementation responsibilities and transfers to the districts
Assigning functions and responsibilities to the various levels of government
153
Promoting popular participation in governance and development of the districts through
actively involving the ordinary people in designing, implementing, monitoring and
evaluating their socio-economic interventions in the rural areas.
The District Council emphasizes that implementation of the DDP will promote the decentralization
process and further guide the government in its efforts to achieve sustainable poverty reduction
through socio-economic and political empowerment of the poor.
154
CHAPTER X - DISTRICT DEVELOPMENT PLANNING FRAMEWORK (DDPF)
Machinga District Council underwent a rigorous search for development needs among its various
strata of the community. Significantly, most secondary data was obtained from Village Action
Planning (VAP) process, District Executive Committee consultations, contributions and input from
the District Multi-stakeholder Conference and NGOs and CSOs. Priorities were ranked as follows, as
major constraints to district development in Machinga;
1. Prioritized District Issues and Constraints
1. High illiteracy levels
2. food insecurity
3. poor roads network/ inaccessible roads
4. low economic empowerment
5. lack of safe and portable water
6. High environmental degradation
7. insufficient recreation facilities
8. long distance to access health services
9. high unemployment among the youths
10. high death rate
11. insecurity
12. high mortality rate
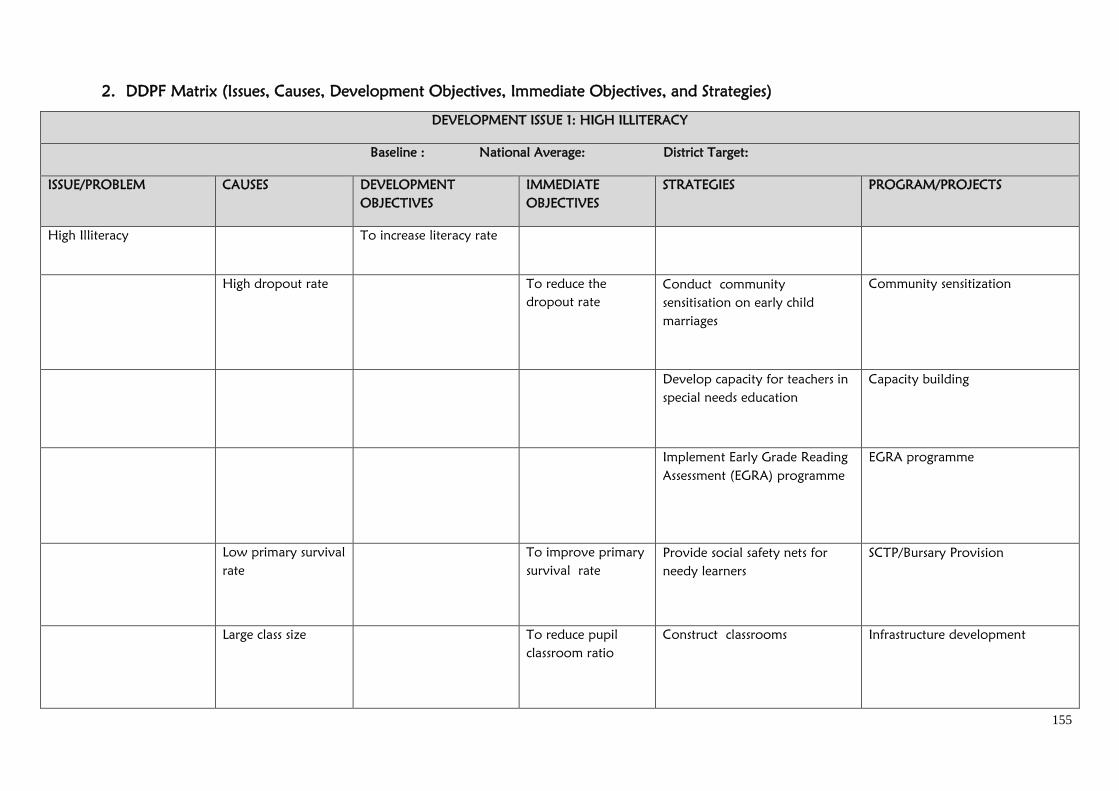
155
2. DDPF Matrix (Issues, Causes, Development Objectives, Immediate Objectives, and Strategies)
DEVELOPMENT ISSUE 1: HIGH ILLITERACY
Baseline : National Average: District Target:
ISSUE/PROBLEM CAUSES DEVELOPMENT
OBJECTIVES
IMMEDIATE
OBJECTIVES
STRATEGIES PROGRAM/PROJECTS
High Illiteracy To increase literacy rate
High dropout rate To reduce the
dropout rate
Conduct community
sensitisation on early child
marriages
Community sensitization
Develop capacity for teachers in
special needs education
Capacity building
Implement Early Grade Reading
Assessment (EGRA) programme
EGRA programme
Low primary survival
rate
To improve primary
survival rate
Provide social safety nets for
needy learners
SCTP/Bursary Provision
Large class size To reduce pupil
classroom ratio
Construct classrooms Infrastructure development
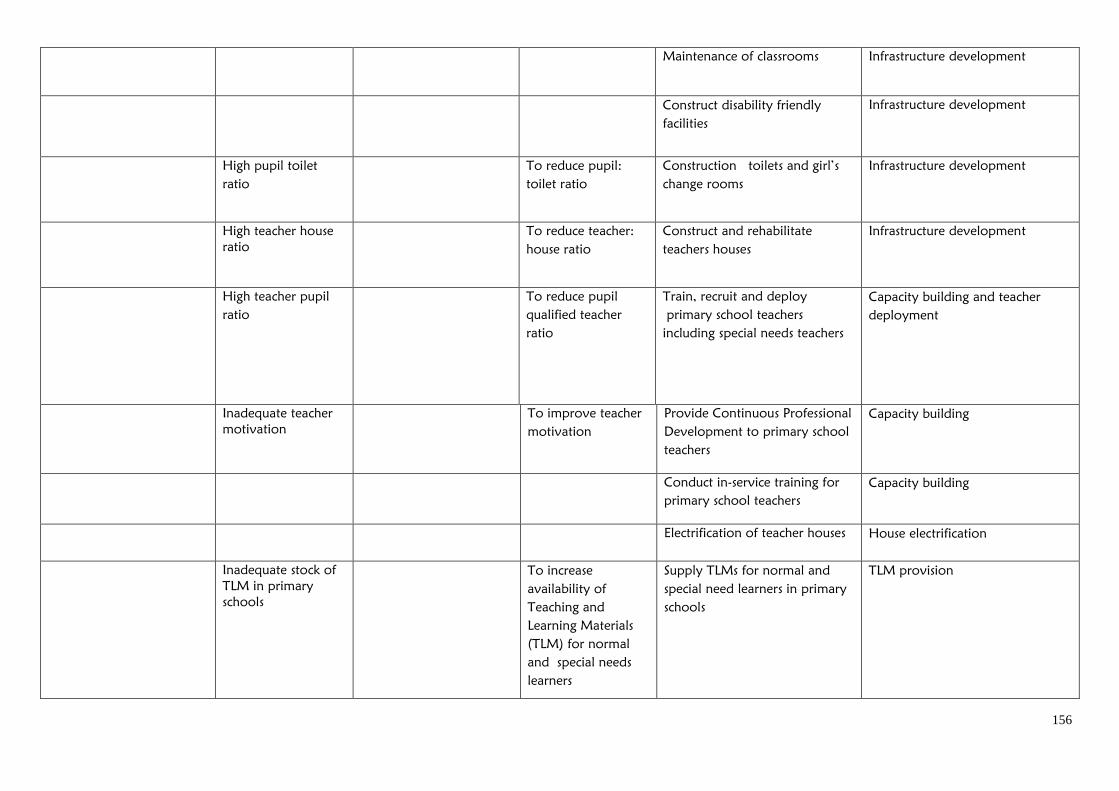
156
Maintenance of classrooms Infrastructure development
Construct disability friendly
facilities
Infrastructure development
High pupil toilet
ratio
To reduce pupil:
toilet ratio
Construction toilets and girl’s
change rooms
Infrastructure development
High teacher house
ratio
To reduce teacher:
house ratio
Construct and rehabilitate
teachers houses
Infrastructure development
High teacher pupil
ratio
To reduce pupil
qualified teacher
ratio
Train, recruit and deploy
primary school teachers
including special needs teachers
Capacity building and teacher
deployment
Inadequate teacher
motivation
To improve teacher
motivation
Provide Continuous Professional
Development to primary school
teachers
Capacity building
Conduct in-service training for
primary school teachers
Capacity building
Electrification of teacher houses House electrification
Inadequate stock of
TLM in primary
schools
To increase
availability of
Teaching and
Learning Materials
(TLM) for normal
and special needs
learners
Supply TLMs for normal and
special need learners in primary
schools
TLM provision
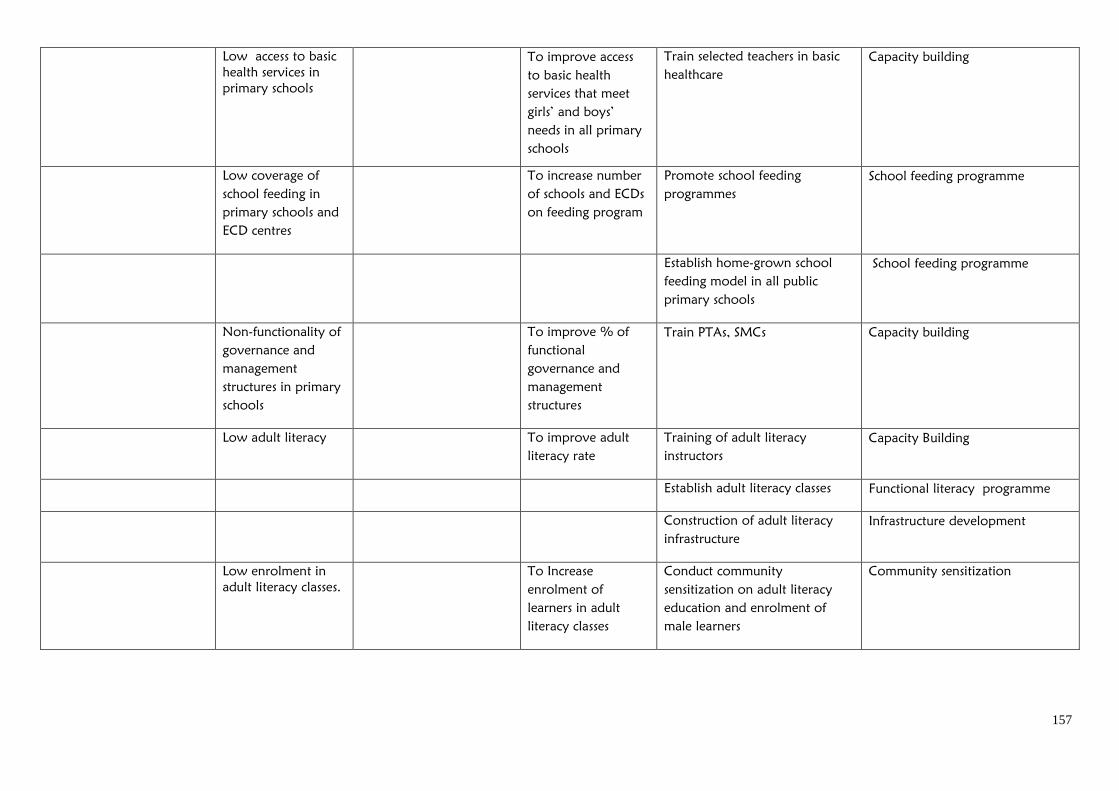
157
Low access to basic
health services in
primary schools
To improve access
to basic health
services that meet
girls’ and boys’
needs in all primary
schools
Train selected teachers in basic
healthcare
Capacity building
Low coverage of
school feeding in
primary schools and
ECD centres
To increase number
of schools and ECDs
on feeding program
Promote school feeding
programmes
School feeding programme
Establish home-grown school
feeding model in all public
primary schools
School feeding programme
Non-functionality of
governance and
management
structures in primary
schools
To improve % of
functional
governance and
management
structures
Train PTAs, SMCs Capacity building
Low adult literacy To improve adult
literacy rate
Training of adult literacy
instructors
Capacity Building
Establish adult literacy classes Functional literacy programme
Construction of adult literacy
infrastructure
Infrastructure development
Low enrolment in
adult literacy classes.
To Increase
enrolment of
learners in adult
literacy classes
Conduct community
sensitization on adult literacy
education and enrolment of
male learners
Community sensitization
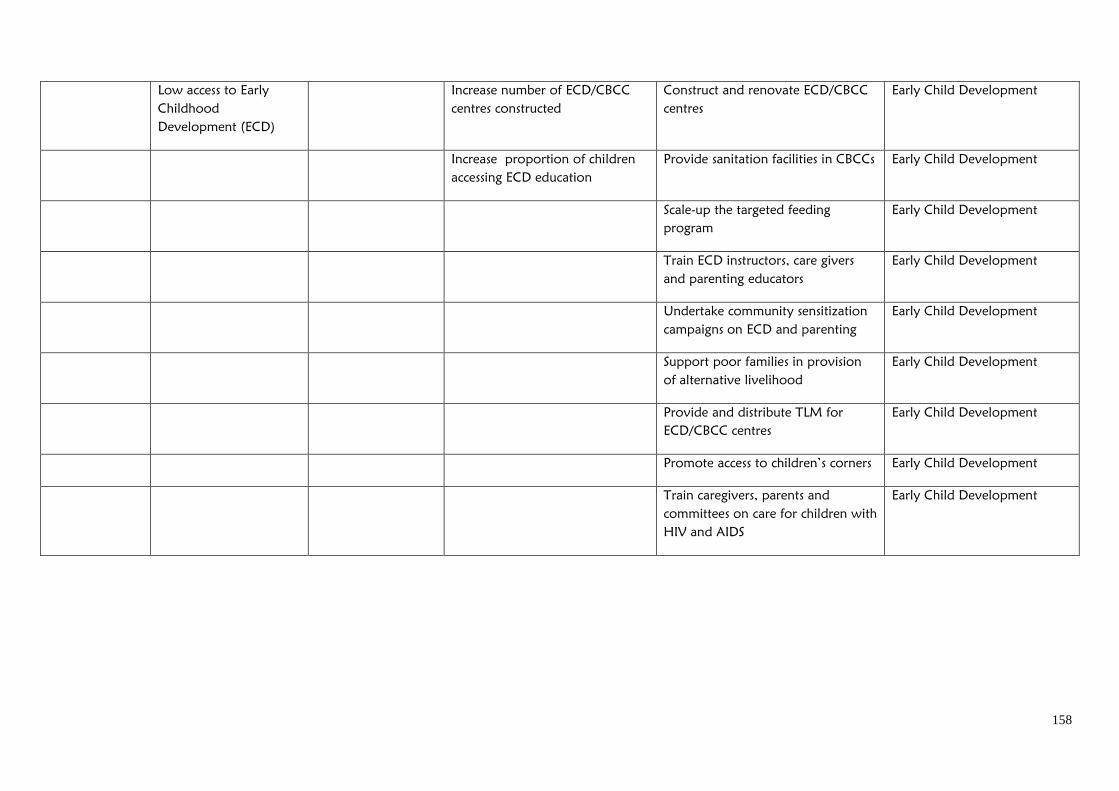
158
Low access to Early
Childhood
Development (ECD)
Increase number of ECD/CBCC
centres constructed
Construct and renovate ECD/CBCC
centres
Early Child Development
Increase proportion of children
accessing ECD education
Provide sanitation facilities in CBCCs Early Child Development
Scale-up the targeted feeding
program
Early Child Development
Train ECD instructors, care givers
and parenting educators
Early Child Development
Undertake community sensitization
campaigns on ECD and parenting
Early Child Development
Support poor families in provision
of alternative livelihood
Early Child Development
Provide and distribute TLM for
ECD/CBCC centres
Early Child Development
Promote access to children’s corners Early Child Development
Train caregivers, parents and
committees on care for children with
HIV and AIDS
Early Child Development
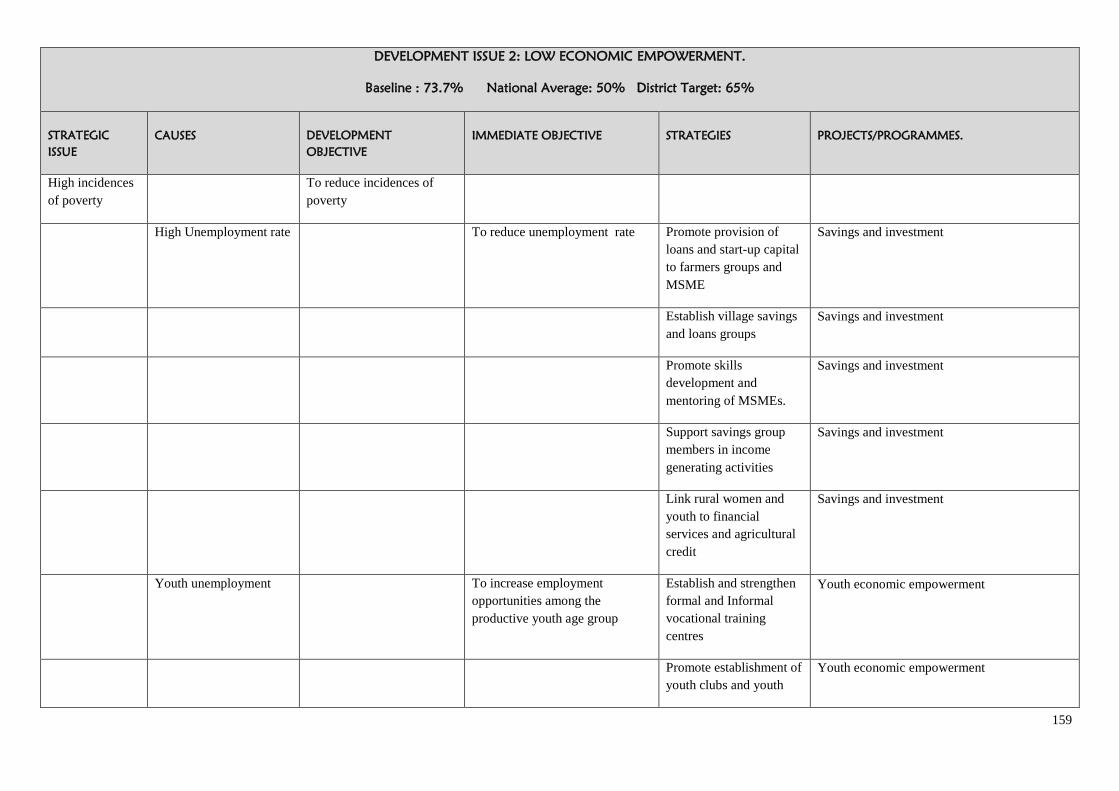
159
DEVELOPMENT ISSUE 2: LOW ECONOMIC EMPOWERMENT.
Baseline : 73.7% National Average: 50% District Target: 65%
STRATEGIC
ISSUE
CAUSES DEVELOPMENT
OBJECTIVE
IMMEDIATE OBJECTIVE STRATEGIES PROJECTS/PROGRAMMES.
High incidences
of poverty
To reduce incidences of
poverty
High Unemployment rate To reduce unemployment rate Promote provision of
loans and start-up capital
to farmers groups and
MSME
Savings and investment
Establish village savings
and loans groups
Savings and investment
Promote skills
development and
mentoring of MSMEs.
Savings and investment
Support savings group
members in income
generating activities
Savings and investment
Link rural women and
youth to financial
services and agricultural
credit
Savings and investment
Youth unemployment To increase employment
opportunities among the
productive youth age group
Establish and strengthen
formal and Informal
vocational training
centres
Youth economic empowerment
Promote establishment of
youth clubs and youth
Youth economic empowerment
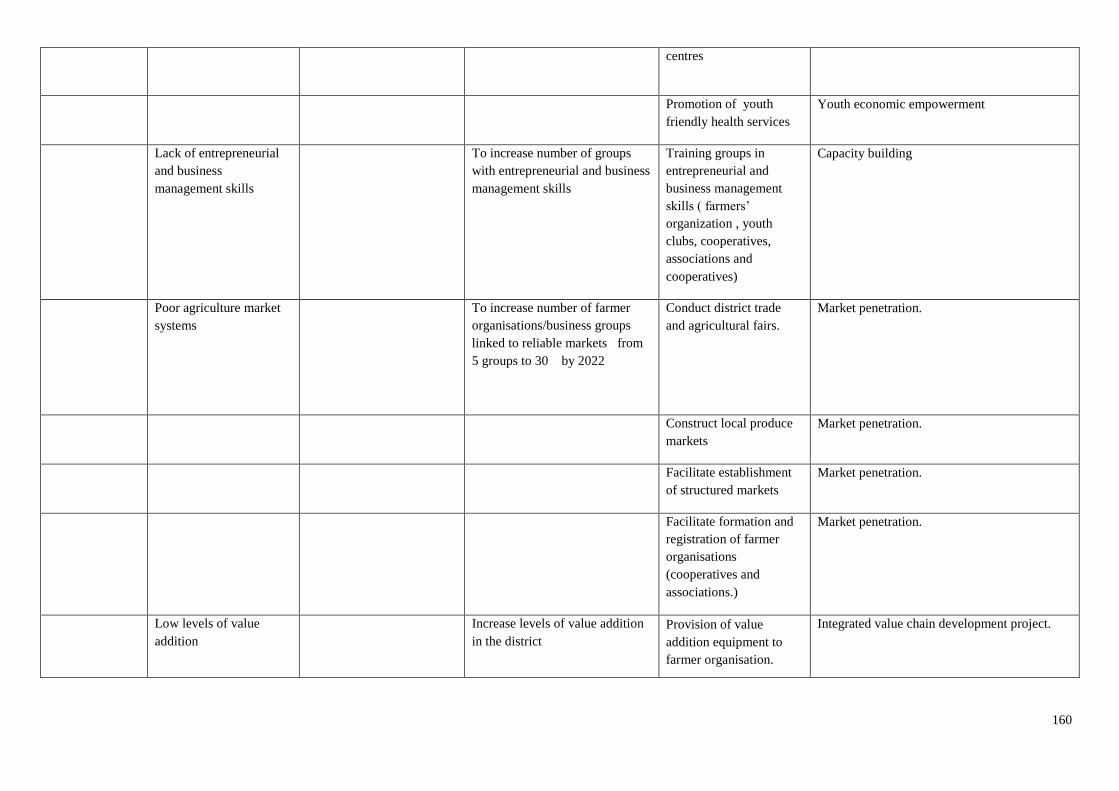
160
centres
Promotion of youth
friendly health services
Youth economic empowerment
Lack of entrepreneurial
and business
management skills
To increase number of groups
with entrepreneurial and business
management skills
Training groups in
entrepreneurial and
business management
skills ( farmers’
organization , youth
clubs, cooperatives,
associations and
cooperatives)
Capacity building
Poor agriculture market
systems
To increase number of farmer
organisations/business groups
linked to reliable markets from
5 groups to 30 by 2022
Conduct district trade
and agricultural fairs.
Market penetration.
Construct local produce
markets
Market penetration.
Facilitate establishment
of structured markets
Market penetration.
Facilitate formation and
registration of farmer
organisations
(cooperatives and
associations.)
Market penetration.
Low levels of value
addition
Increase levels of value addition
in the district
Provision of value
addition equipment to
farmer organisation.
Integrated value chain development project.
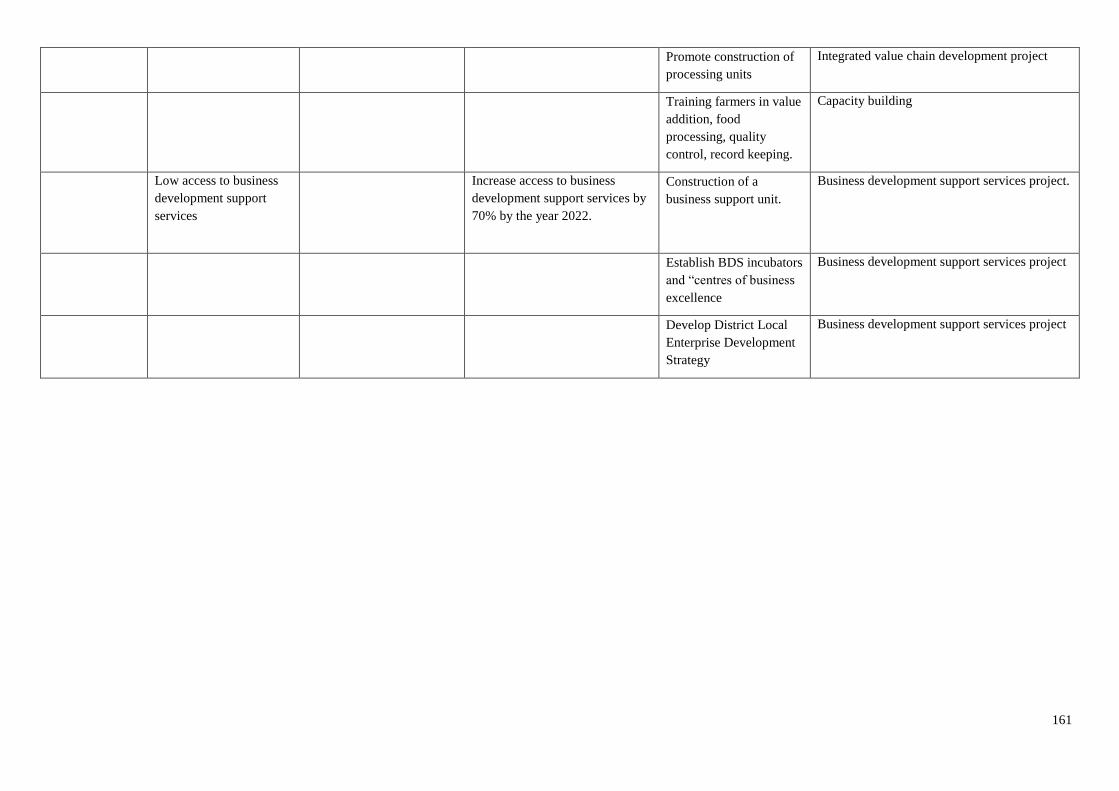
161
Promote construction of
processing units
Integrated value chain development project
Training farmers in value
addition, food
processing, quality
control, record keeping.
Capacity building
Low access to business
development support
services
Increase access to business
development support services by
70% by the year 2022.
Construction of a
business support unit.
Business development support services project.
Establish BDS incubators
and “centres of business
excellence
Business development support services project
Develop District Local
Enterprise Development
Strategy
Business development support services project
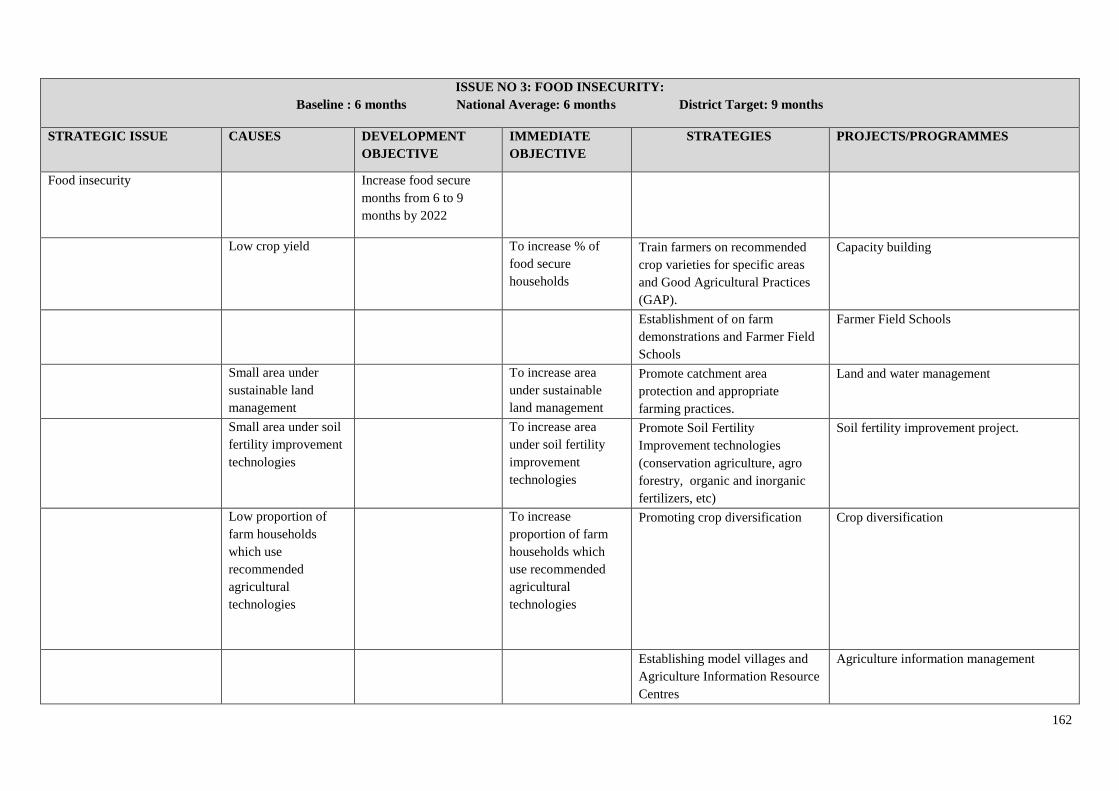
162
ISSUE NO 3: FOOD INSECURITY:
Baseline : 6 months National Average: 6 months District Target: 9 months
STRATEGIC ISSUE CAUSES DEVELOPMENT
OBJECTIVE
IMMEDIATE
OBJECTIVE
STRATEGIES PROJECTS/PROGRAMMES
Food insecurity Increase food secure
months from 6 to 9
months by 2022
Low crop yield To increase % of
food secure
households
Train farmers on recommended
crop varieties for specific areas
and Good Agricultural Practices
(GAP).
Capacity building
Establishment of on farm
demonstrations and Farmer Field
Schools
Farmer Field Schools
Small area under
sustainable land
management
To increase area
under sustainable
land management
Promote catchment area
protection and appropriate
farming practices.
Land and water management
Small area under soil
fertility improvement
technologies
To increase area
under soil fertility
improvement
technologies
Promote Soil Fertility
Improvement technologies
(conservation agriculture, agro
forestry, organic and inorganic
fertilizers, etc)
Soil fertility improvement project.
Low proportion of
farm households
which use
recommended
agricultural
technologies
To increase
proportion of farm
households which
use recommended
agricultural
technologies
Promoting crop diversification Crop diversification
Establishing model villages and
Agriculture Information Resource
Centres
Agriculture information management
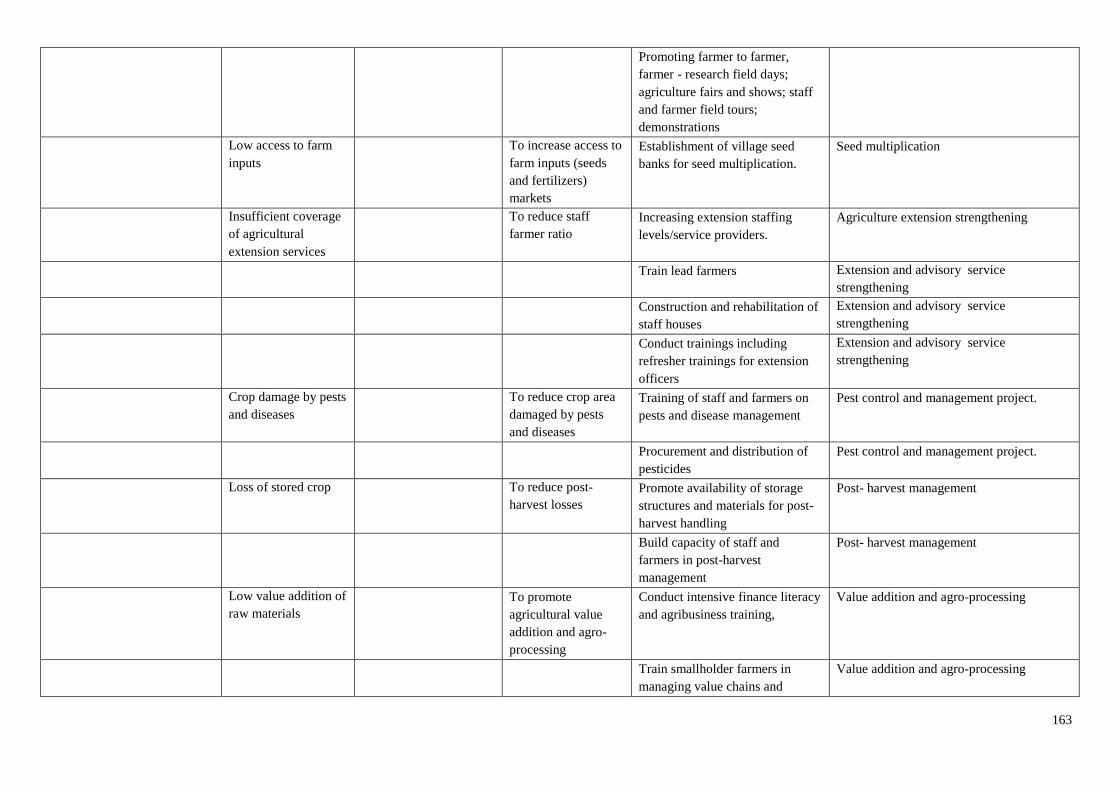
163
Promoting farmer to farmer,
farmer - research field days;
agriculture fairs and shows; staff
and farmer field tours;
demonstrations
Low access to farm
inputs
To increase access to
farm inputs (seeds
and fertilizers)
markets
Establishment of village seed
banks for seed multiplication.
Seed multiplication
Insufficient coverage
of agricultural
extension services
To reduce staff
farmer ratio
Increasing extension staffing
levels/service providers.
Agriculture extension strengthening
Train lead farmers Extension and advisory service
strengthening Construction and rehabilitation of
staff houses
Extension and advisory service
strengthening
Conduct trainings including
refresher trainings for extension
officers
Extension and advisory service
strengthening
Crop damage by pests
and diseases
To reduce crop area
damaged by pests
and diseases
Training of staff and farmers on
pests and disease management
Pest control and management project.
Procurement and distribution of
pesticides
Pest control and management project.
Loss of stored crop To reduce post-
harvest losses
Promote availability of storage
structures and materials for post-
harvest handling
Post- harvest management
Build capacity of staff and
farmers in post-harvest
management
Post- harvest management
Low value addition of
raw materials
To promote
agricultural value
addition and agro-
processing
Conduct intensive finance literacy
and agribusiness training,
Value addition and agro-processing
Train smallholder farmers in
managing value chains and
Value addition and agro-processing

164
enterprise management.
Food wastage To reduce food
wastage from 25% to
15% by 2022
Training farming households in
Food budgeting, Meal planning
and preparation.
Nutrition Education project.
Low livestock
production
To increase livestock
production and
productivity
Building capacity of extension
staff and lead farmers in crop and
livestock diversification
Livestock diversification.
Train lead farmers on livestock
diversification.
Livestock diversification
Sensitization and strengthening of
farmer groups to own and manage
drug boxes
Livestock diversification
Rehabilitation and management
of 6 dip tanks.
Livestock diversification
Poor fisheries
management and
development
To promote sustainable
fisheries management
and commercial
aquaculture
development
Reduce fishing effort Promotion of alternative
business (IGA) for fish
farmers
Fisheries Management
Construct fishponds. Fisheries Management
Develop integrated fish farming
schemes.
Fisheries Management
Reduce the impacts
of climate change on
fishers and fish
farmers
Promotion of integrated
Agriculture Aquaculture
initiatives (IAA).
Fisheries Management
Promote Climate smart fish
farming practices.
Fisheries Management
Enhance compliance
to fisheries
regulation
Enforce fishing regulations. Fisheries Management

165
Reduce fish post-
harvest losses
Facilitate development of
appropriate infrastructure for fish
handling and processing.
Fisheries Management
Establishing landing and
marketing facilities for fish
Fisheries Management
In adequate
Institutional capacity
for fisheries
management
Increase number of
fisheries governance
structures
Establish and revamp local
fisheries management committees
Fisheries Management
Small area under
irrigation
To increase area
under irrigation
Rehabilitate irrigation schemes
and small earth dams
Irrigation development
Identify areas with irrigation
potential
Irrigation development
Construct small, medium and
large scale irrigation schemes
Irrigation development
Provide support infrastructure for
irrigation schemes.
Irrigation development
Establish and train Water Users
Associations (WUA) and
cooperatives
Irrigation development
Establishing rain and ground
water harvesting systems
Irrigation development
Facilitate management of water
catchment areas
Irrigation development
Promote water-harvesting
technologies.
Irrigation development
Training of staff and farmers in
scheme management
Capacity building
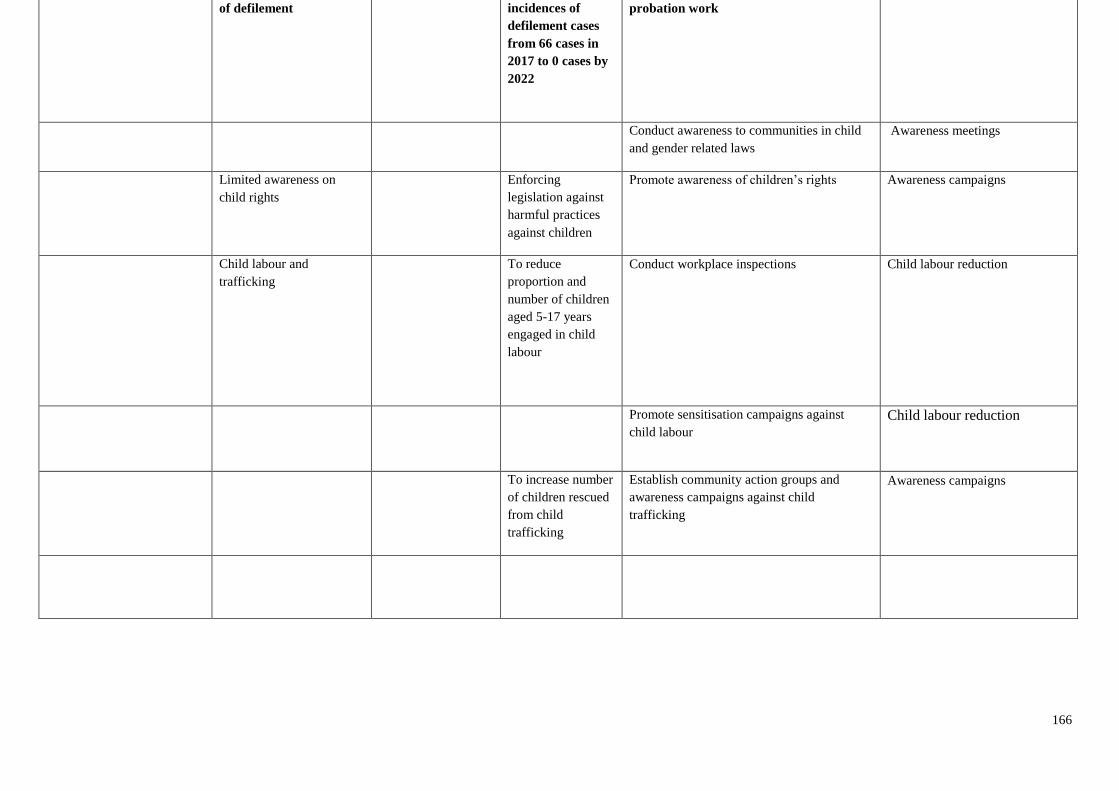
166
of defilement incidences of
defilement cases
from 66 cases in
2017 to 0 cases by
2022
probation work
Conduct awareness to communities in child
and gender related laws
Awareness meetings
Limited awareness on
child rights
Enforcing
legislation against
harmful practices
against children
Promote awareness of children’s rights Awareness campaigns
Child labour and
trafficking
To reduce
proportion and
number of children
aged 5-17 years
engaged in child
labour
Conduct workplace inspections Child labour reduction
Promote sensitisation campaigns against
child labour
Child labour reduction
To increase number
of children rescued
from child
trafficking
Establish community action groups and
awareness campaigns against child
trafficking
Awareness campaigns
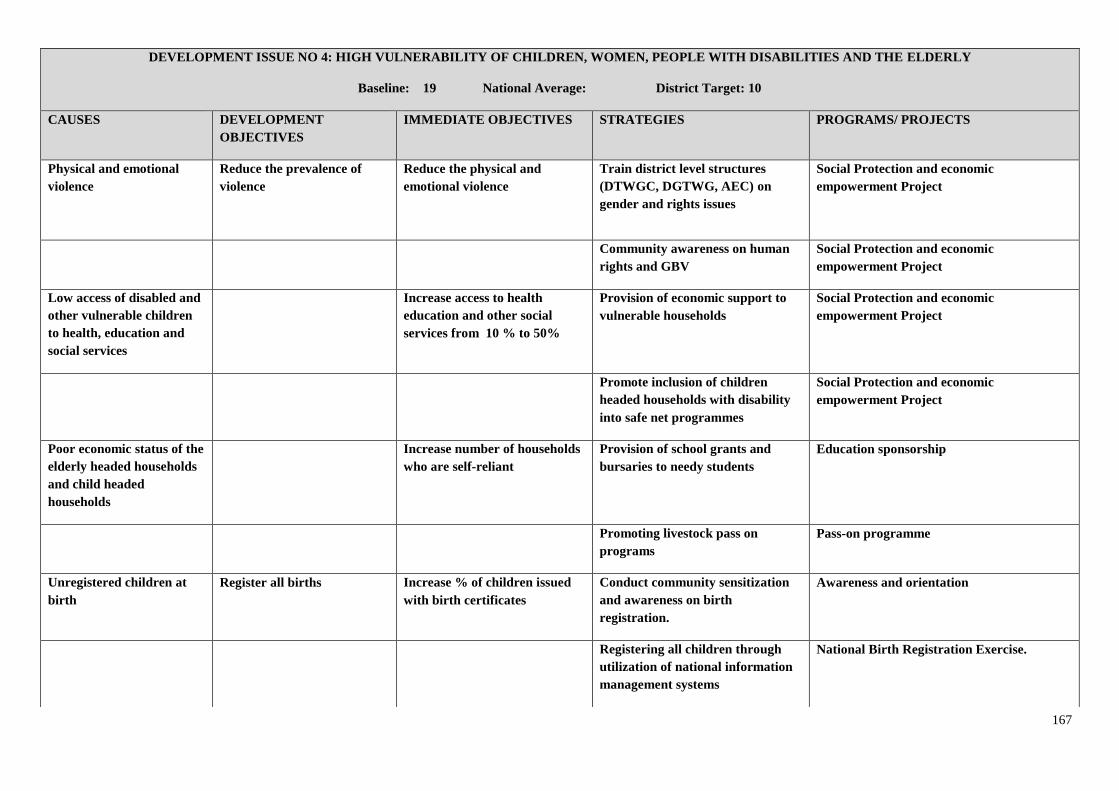
167
DEVELOPMENT ISSUE NO 4: HIGH VULNERABILITY OF CHILDREN, WOMEN, PEOPLE WITH DISABILITIES AND THE ELDERLY
Baseline: 19 National Average: District Target: 10
CAUSES DEVELOPMENT
OBJECTIVES
IMMEDIATE OBJECTIVES STRATEGIES PROGRAMS/ PROJECTS
Physical and emotional
violence
Reduce the prevalence of
violence
Reduce the physical and
emotional violence
Train district level structures
(DTWGC, DGTWG, AEC) on
gender and rights issues
Social Protection and economic
empowerment Project
Community awareness on human
rights and GBV
Social Protection and economic
empowerment Project
Low access of disabled and
other vulnerable children
to health, education and
social services
Increase access to health
education and other social
services from 10 % to 50%
Provision of economic support to
vulnerable households
Social Protection and economic
empowerment Project
Promote inclusion of children
headed households with disability
into safe net programmes
Social Protection and economic
empowerment Project
Poor economic status of the
elderly headed households
and child headed
households
Increase number of households
who are self-reliant
Provision of school grants and
bursaries to needy students
Education sponsorship
Promoting livestock pass on
programs
Pass-on programme
Unregistered children at
birth
Register all births Increase % of children issued
with birth certificates
Conduct community sensitization
and awareness on birth
registration.
Awareness and orientation
Registering all children through
utilization of national information
management systems
National Birth Registration Exercise.
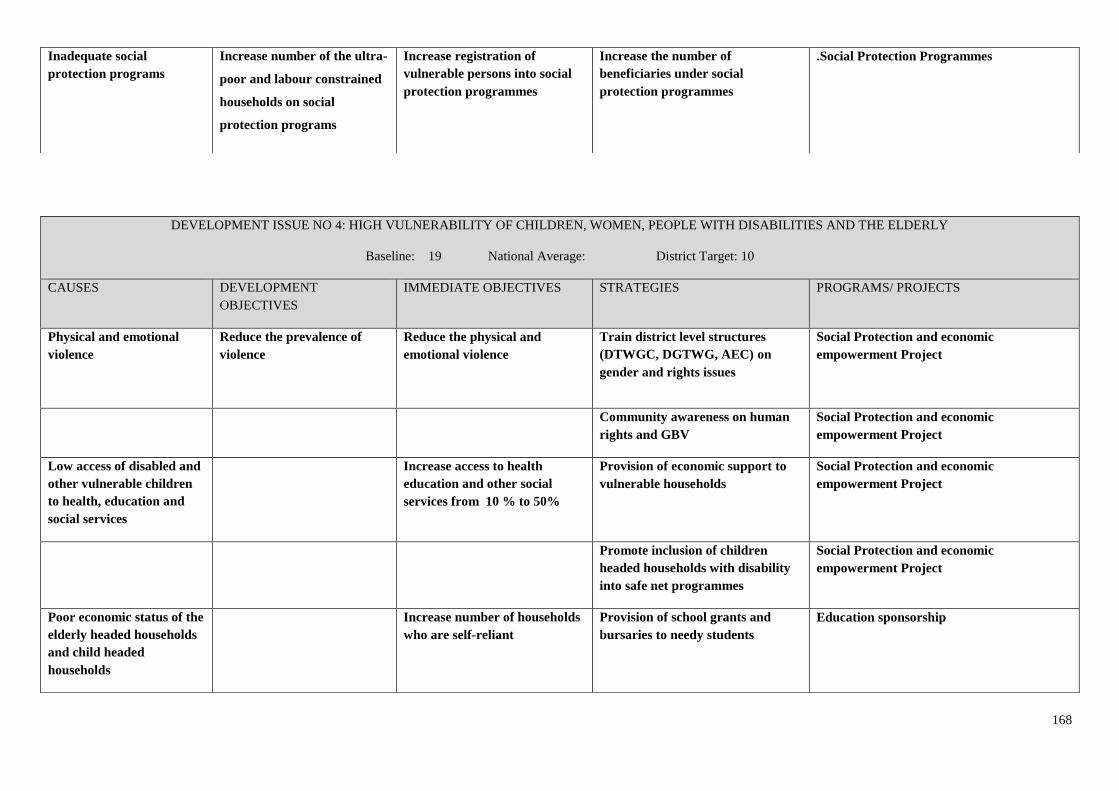
168
Inadequate social
protection programs
Increase number of the ultra-
poor and labour constrained
households on social
protection programs
Increase registration of
vulnerable persons into social
protection programmes
Increase the number of
beneficiaries under social
protection programmes
.Social Protection Programmes
DEVELOPMENT ISSUE NO 4: HIGH VULNERABILITY OF CHILDREN, WOMEN, PEOPLE WITH DISABILITIES AND THE ELDERLY
Baseline: 19 National Average: District Target: 10
CAUSES DEVELOPMENT
OBJECTIVES
IMMEDIATE OBJECTIVES STRATEGIES PROGRAMS/ PROJECTS
Physical and emotional
violence
Reduce the prevalence of
violence
Reduce the physical and
emotional violence
Train district level structures
(DTWGC, DGTWG, AEC) on
gender and rights issues
Social Protection and economic
empowerment Project
Community awareness on human
rights and GBV
Social Protection and economic
empowerment Project
Low access of disabled and
other vulnerable children
to health, education and
social services
Increase access to health
education and other social
services from 10 % to 50%
Provision of economic support to
vulnerable households
Social Protection and economic
empowerment Project
Promote inclusion of children
headed households with disability
into safe net programmes
Social Protection and economic
empowerment Project
Poor economic status of the
elderly headed households
and child headed
households
Increase number of households
who are self-reliant
Provision of school grants and
bursaries to needy students
Education sponsorship

169
DEVELOPMENT ISSUE NO 5: ENVIRONMENTAL DEGRADATION AND CLIMATE CHANGE:
Baseline: National Average: District Target:
ISSUE/ PROBLEM CAUSES DEVELOPMENT
OBJECTIVES
IMMEDIATE
OBJECTIVES
STRATEGIES PROGRAMMES / PROJECTS
Environmental degradation
and Climate Change
To reduce environmental
degradation
Poor and improper
waste management
To improve waste
management practices
by 2022
Market
Schools
Hospitals
Town
Dumping site.
Improve solid and liquid
waste management systems
Pollution control and waste
management
Promoting livestock pass on
programs
Pass-on programme
Unregistered children at
birth
Register all births Increase % of children issued
with birth certificates
Conduct community sensitization
and awareness on birth
registration.
Awareness and orientation
Registering all children through
utilization of national information
management systems
National Birth Registration Exercise.
Inadequate social
protection programs
Increase number of the ultra-
poor and labour constrained
households on social
protection programs
Increase registration of
vulnerable persons into social
protection programmes
Increase the number of
beneficiaries under social
protection programmes
Social Protection Programmes
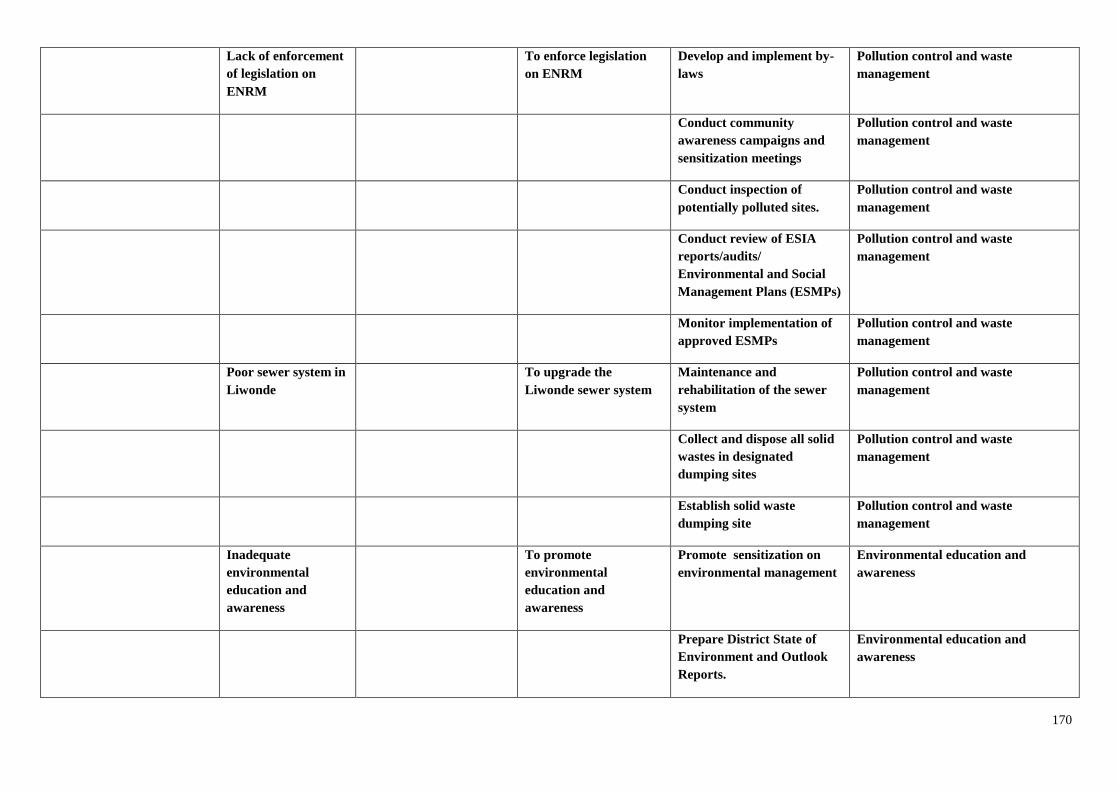
170
Lack of enforcement
of legislation on
ENRM
To enforce legislation
on ENRM
Develop and implement by-
laws
Pollution control and waste
management
Conduct community
awareness campaigns and
sensitization meetings
Pollution control and waste
management
Conduct inspection of
potentially polluted sites.
Pollution control and waste
management
Conduct review of ESIA
reports/audits/
Environmental and Social
Management Plans (ESMPs)
Pollution control and waste
management
Monitor implementation of
approved ESMPs
Pollution control and waste
management
Poor sewer system in
Liwonde
To upgrade the
Liwonde sewer system
Maintenance and
rehabilitation of the sewer
system
Pollution control and waste
management
Collect and dispose all solid
wastes in designated
dumping sites
Pollution control and waste
management
Establish solid waste
dumping site
Pollution control and waste
management
Inadequate
environmental
education and
awareness
To promote
environmental
education and
awareness
Promote sensitization on
environmental management
Environmental education and
awareness
Prepare District State of
Environment and Outlook
Reports.
Environmental education and
awareness
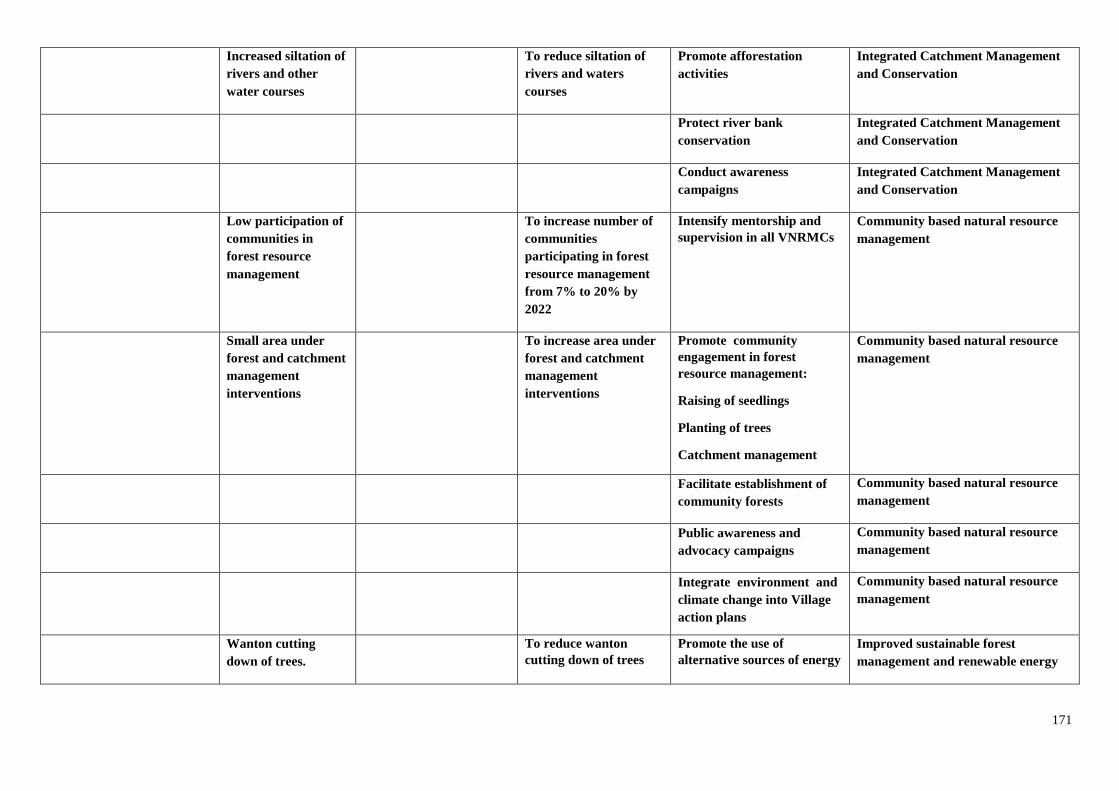
171
Increased siltation of
rivers and other
water courses
To reduce siltation of
rivers and waters
courses
Promote afforestation
activities
Integrated Catchment Management
and Conservation
Protect river bank
conservation
Integrated Catchment Management
and Conservation
Conduct awareness
campaigns
Integrated Catchment Management
and Conservation
Low participation of
communities in
forest resource
management
To increase number of
communities
participating in forest
resource management
from 7% to 20% by
2022
Intensify mentorship and
supervision in all VNRMCs
Community based natural resource
management
Small area under
forest and catchment
management
interventions
To increase area under
forest and catchment
management
interventions
Promote community
engagement in forest
resource management:
Raising of seedlings
Planting of trees
Catchment management
Community based natural resource
management
Facilitate establishment of
community forests
Community based natural resource
management
Public awareness and
advocacy campaigns
Community based natural resource
management
Integrate environment and
climate change into Village
action plans
Community based natural resource
management
Wanton cutting
down of trees.
To reduce wanton
cutting down of trees
Promote the use of
alternative sources of energy
Improved sustainable forest
management and renewable energy
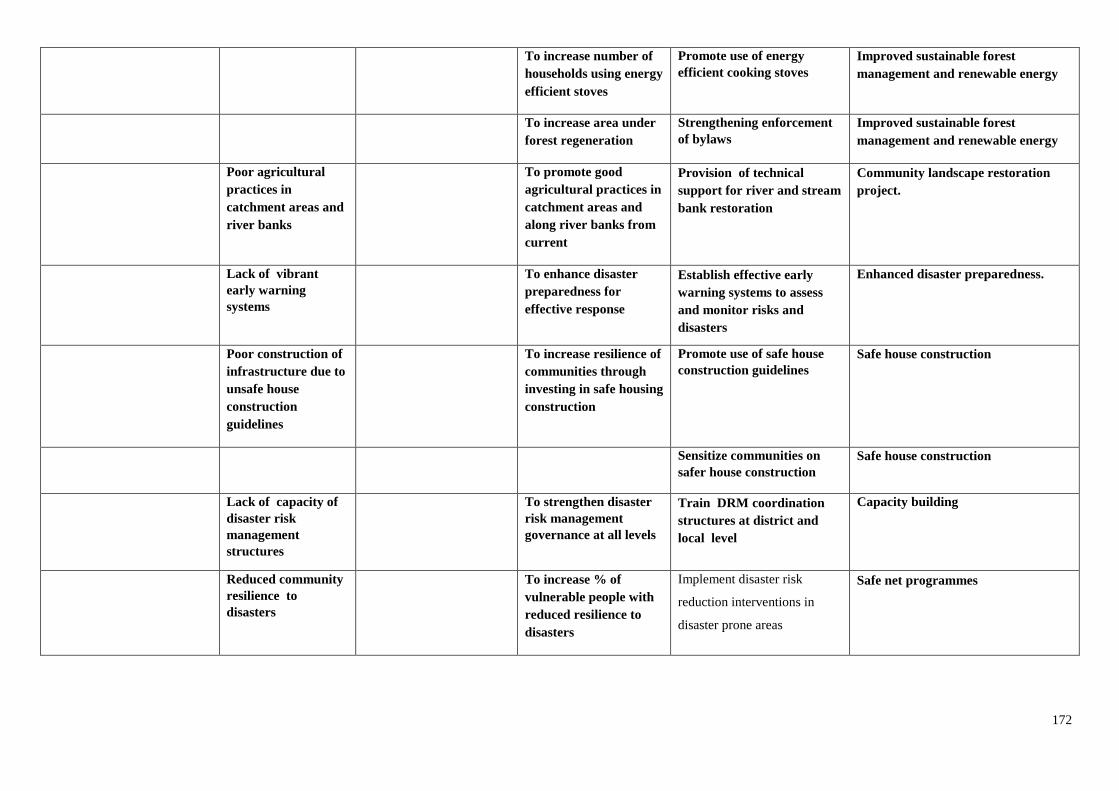
172
To increase number of
households using energy
efficient stoves
Promote use of energy
efficient cooking stoves
Improved sustainable forest
management and renewable energy
To increase area under
forest regeneration
Strengthening enforcement
of bylaws
Improved sustainable forest
management and renewable energy
Poor agricultural
practices in
catchment areas and
river banks
To promote good
agricultural practices in
catchment areas and
along river banks from
current
Provision of technical
support for river and stream
bank restoration
Community landscape restoration
project.
Lack of vibrant
early warning
systems
To enhance disaster
preparedness for
effective response
Establish effective early
warning systems to assess
and monitor risks and
disasters
Enhanced disaster preparedness.
Poor construction of
infrastructure due to
unsafe house
construction
guidelines
To increase resilience of
communities through
investing in safe housing
construction
Promote use of safe house
construction guidelines
Safe house construction
Sensitize communities on
safer house construction
Safe house construction
Lack of capacity of
disaster risk
management
structures
To strengthen disaster
risk management
governance at all levels
Train DRM coordination
structures at district and
local level
Capacity building
Reduced community
resilience to
disasters
To increase % of
vulnerable people with
reduced resilience to
disasters
Implement disaster risk
reduction interventions in
disaster prone areas
Safe net programmes
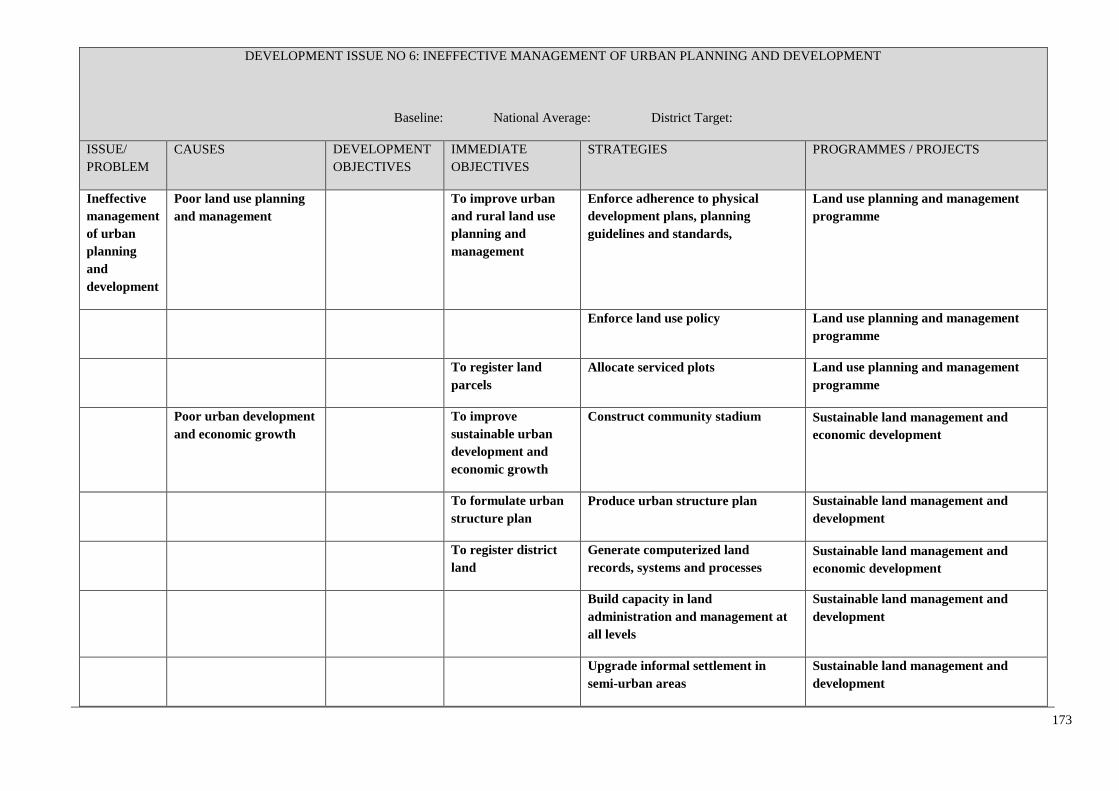
173
DEVELOPMENT ISSUE NO 6: INEFFECTIVE MANAGEMENT OF URBAN PLANNING AND DEVELOPMENT
Baseline: National Average: District Target:
ISSUE/
PROBLEM
CAUSES DEVELOPMENT
OBJECTIVES
IMMEDIATE
OBJECTIVES
STRATEGIES PROGRAMMES / PROJECTS
Ineffective
management
of urban
planning
and
development
Poor land use planning
and management
To improve urban
and rural land use
planning and
management
Enforce adherence to physical
development plans, planning
guidelines and standards,
Land use planning and management
programme
Enforce land use policy Land use planning and management
programme
To register land
parcels
Allocate serviced plots Land use planning and management
programme
Poor urban development
and economic growth
To improve
sustainable urban
development and
economic growth
Construct community stadium Sustainable land management and
economic development
To formulate urban
structure plan
Produce urban structure plan Sustainable land management and
development
To register district
land
Generate computerized land
records, systems and processes
Sustainable land management and
economic development
Build capacity in land
administration and management at
all levels
Sustainable land management and
development
Upgrade informal settlement in
semi-urban areas
Sustainable land management and
development
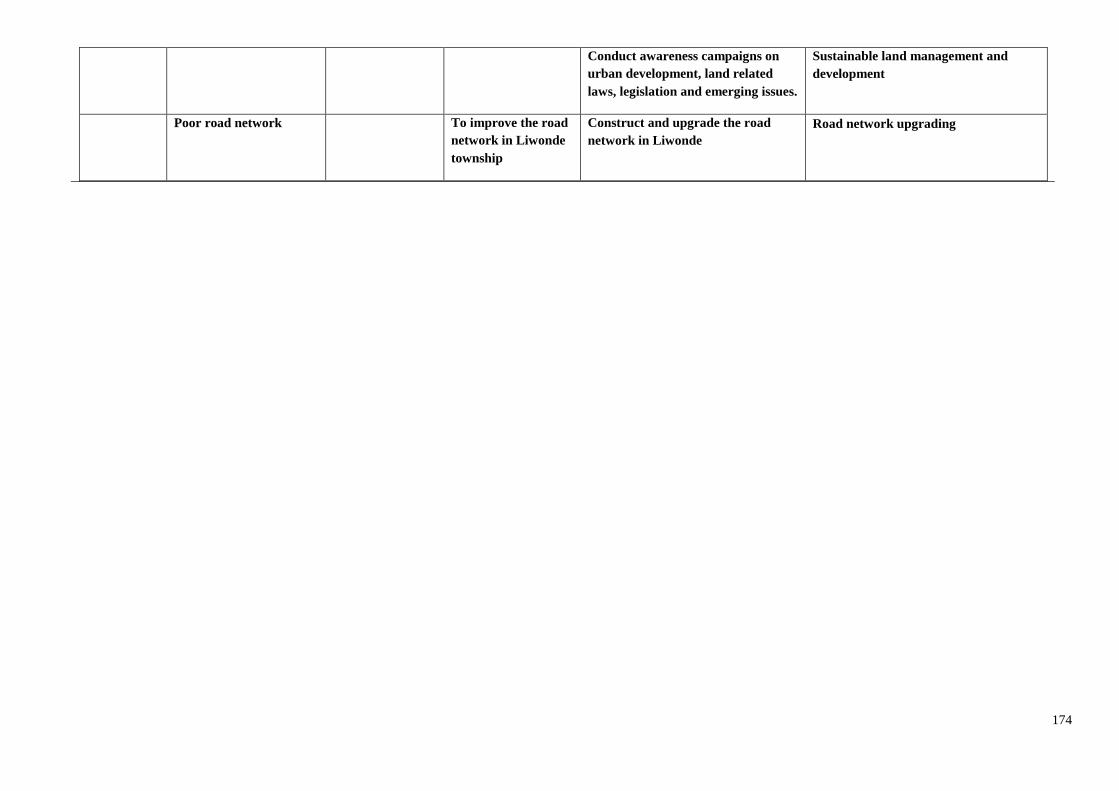
174
Conduct awareness campaigns on
urban development, land related
laws, legislation and emerging issues.
Sustainable land management and
development
Poor road network To improve the road
network in Liwonde
township
Construct and upgrade the road
network in Liwonde
Road network upgrading
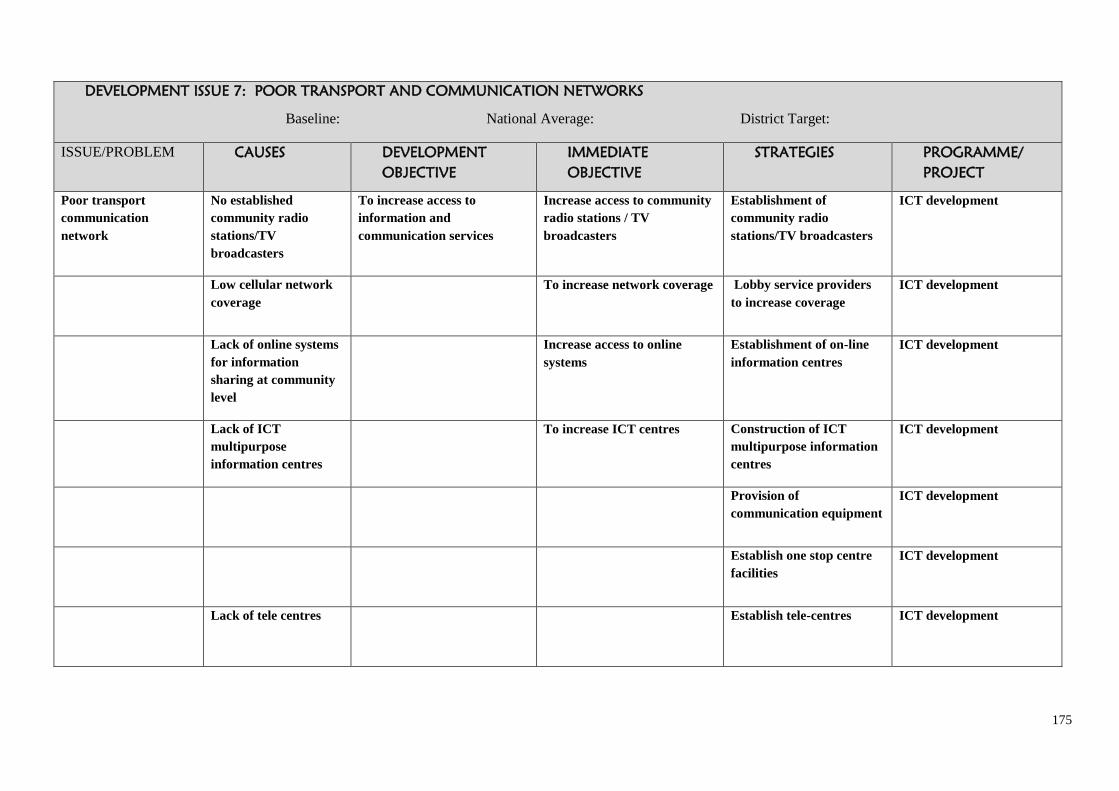
175
DEVELOPMENT ISSUE 7: POOR TRANSPORT AND COMMUNICATION NETWORKS
Baseline: National Average: District Target:
ISSUE/PROBLEM CAUSES DEVELOPMENT
OBJECTIVE
IMMEDIATE
OBJECTIVE
STRATEGIES PROGRAMME/
PROJECT
Poor transport
communication
network
No established
community radio
stations/TV
broadcasters
To increase access to
information and
communication services
Increase access to community
radio stations / TV
broadcasters
Establishment of
community radio
stations/TV broadcasters
ICT development
Low cellular network
coverage
To increase network coverage Lobby service providers
to increase coverage
ICT development
Lack of online systems
for information
sharing at community
level
Increase access to online
systems
Establishment of on-line
information centres
ICT development
Lack of ICT
multipurpose
information centres
To increase ICT centres Construction of ICT
multipurpose information
centres
ICT development
Provision of
communication equipment
ICT development
Establish one stop centre
facilities
ICT development
Lack of tele centres Establish tele-centres ICT development
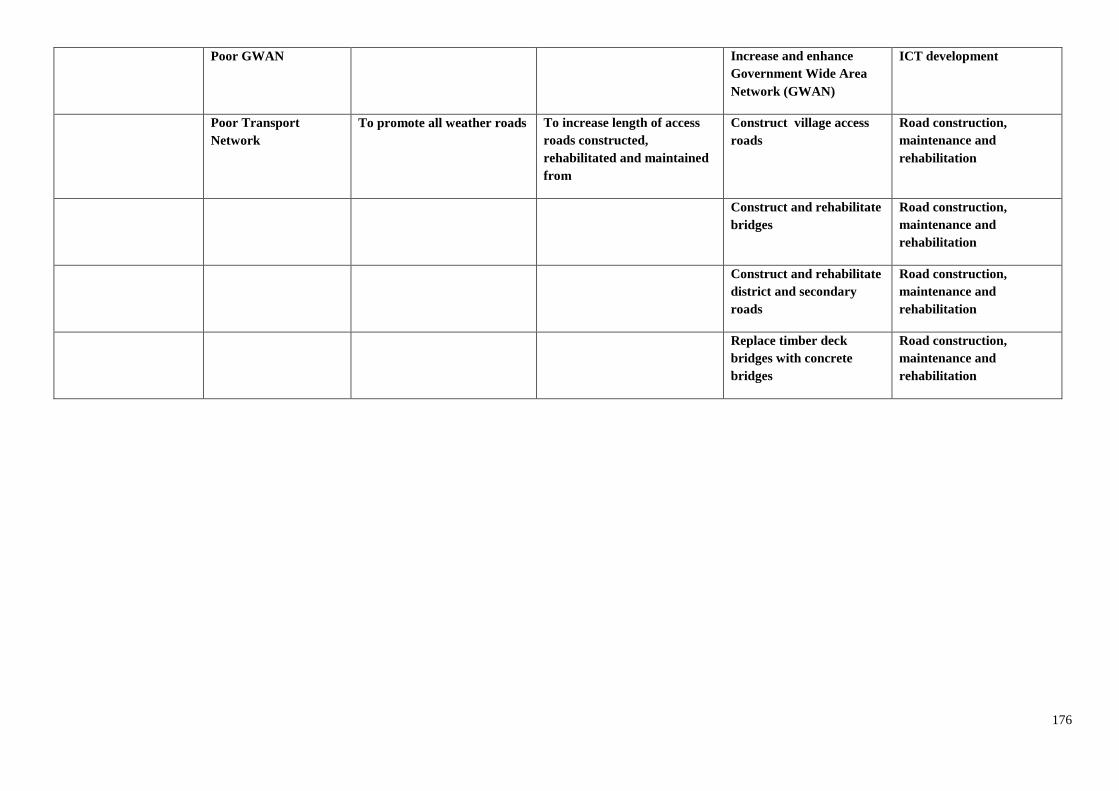
176
Poor GWAN Increase and enhance
Government Wide Area
Network (GWAN)
ICT development
Poor Transport
Network
To promote all weather roads To increase length of access
roads constructed,
rehabilitated and maintained
from
Construct village access
roads
Road construction,
maintenance and
rehabilitation
Construct and rehabilitate
bridges
Road construction,
maintenance and
rehabilitation
Construct and rehabilitate
district and secondary
roads
Road construction,
maintenance and
rehabilitation
Replace timber deck
bridges with concrete
bridges
Road construction,
maintenance and
rehabilitation
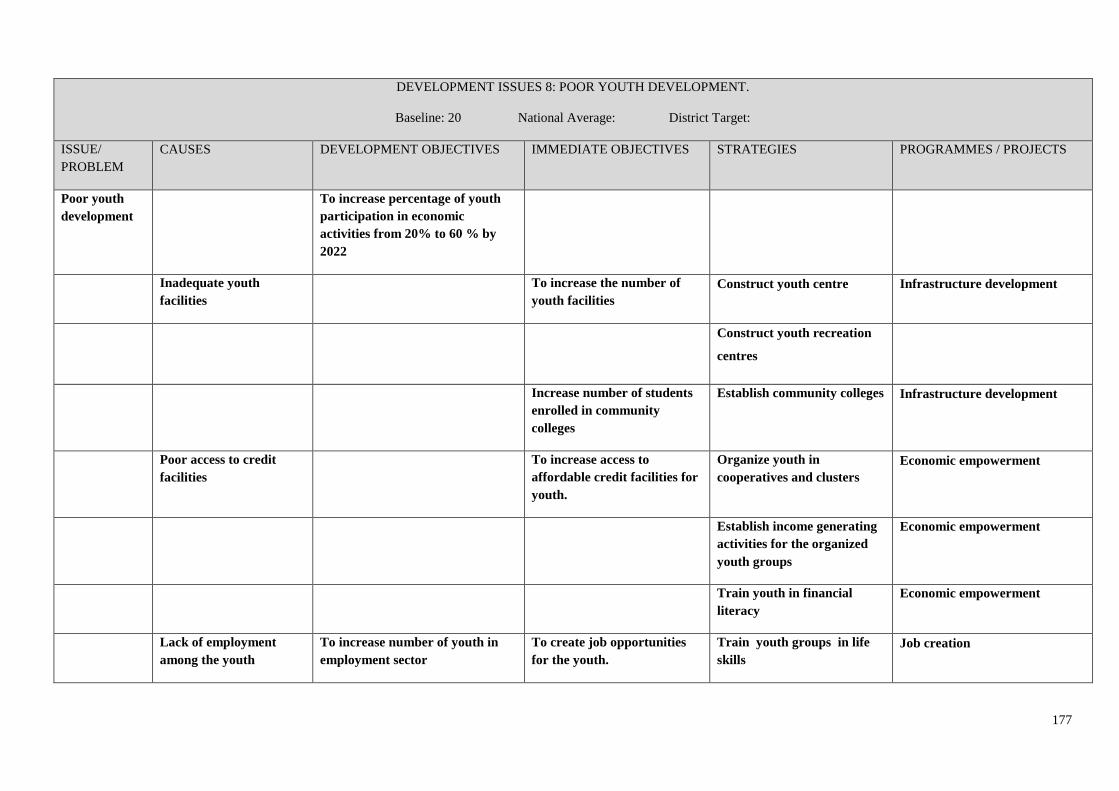
177
DEVELOPMENT ISSUES 8: POOR YOUTH DEVELOPMENT.
Baseline: 20 National Average: District Target:
ISSUE/
PROBLEM
CAUSES DEVELOPMENT OBJECTIVES IMMEDIATE OBJECTIVES STRATEGIES PROGRAMMES / PROJECTS
Poor youth
development
To increase percentage of youth
participation in economic
activities from 20% to 60 % by
2022
Inadequate youth
facilities
To increase the number of
youth facilities
Construct youth centre Infrastructure development
Construct youth recreation
centres
Increase number of students
enrolled in community
colleges
Establish community colleges Infrastructure development
Poor access to credit
facilities
To increase access to
affordable credit facilities for
youth.
Organize youth in
cooperatives and clusters
Economic empowerment
Establish income generating
activities for the organized
youth groups
Economic empowerment
Train youth in financial
literacy
Economic empowerment
Lack of employment
among the youth
To increase number of youth in
employment sector
To create job opportunities
for the youth.
Train youth groups in life
skills
Job creation
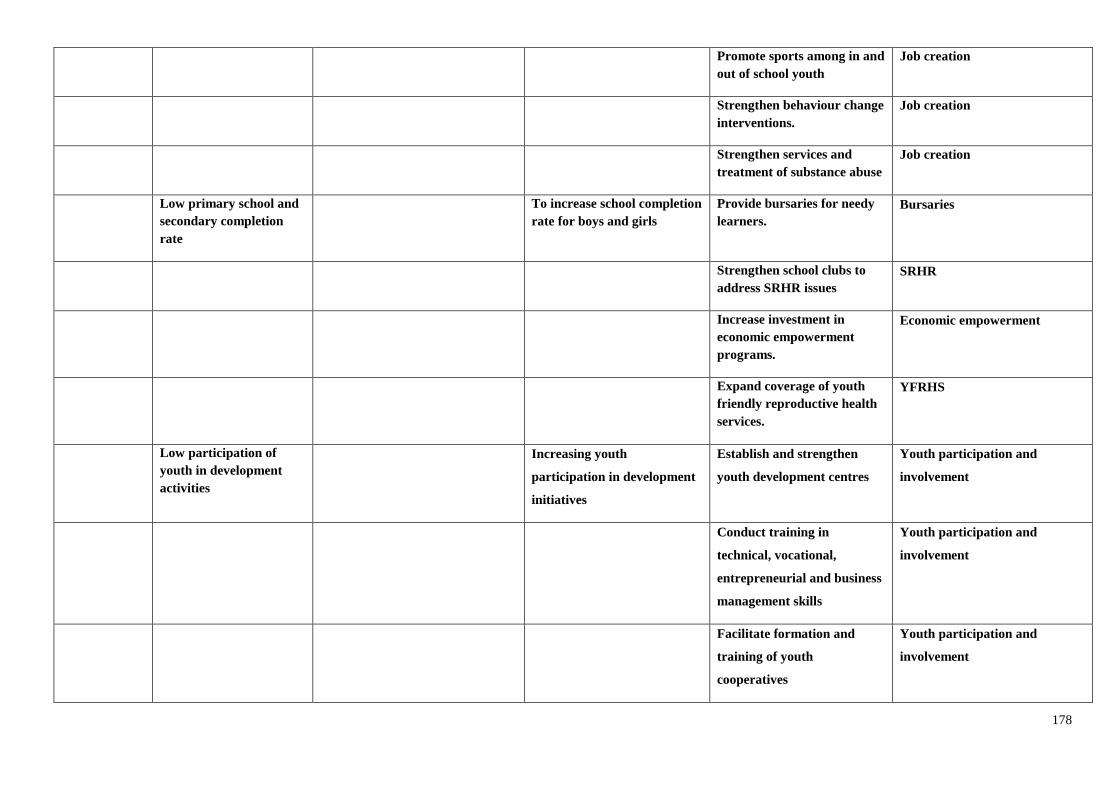
178
Promote sports among in and
out of school youth
Job creation
Strengthen behaviour change
interventions.
Job creation
Strengthen services and
treatment of substance abuse
Job creation
Low primary school and
secondary completion
rate
To increase school completion
rate for boys and girls
Provide bursaries for needy
learners.
Bursaries
Strengthen school clubs to
address SRHR issues
SRHR
Increase investment in
economic empowerment
programs.
Economic empowerment
Expand coverage of youth
friendly reproductive health
services.
YFRHS
Low participation of
youth in development
activities
Increasing youth
participation in development
initiatives
Establish and strengthen
youth development centres
Youth participation and
involvement
Conduct training in
technical, vocational,
entrepreneurial and business
management skills
Youth participation and
involvement
Facilitate formation and
training of youth
cooperatives
Youth participation and
involvement
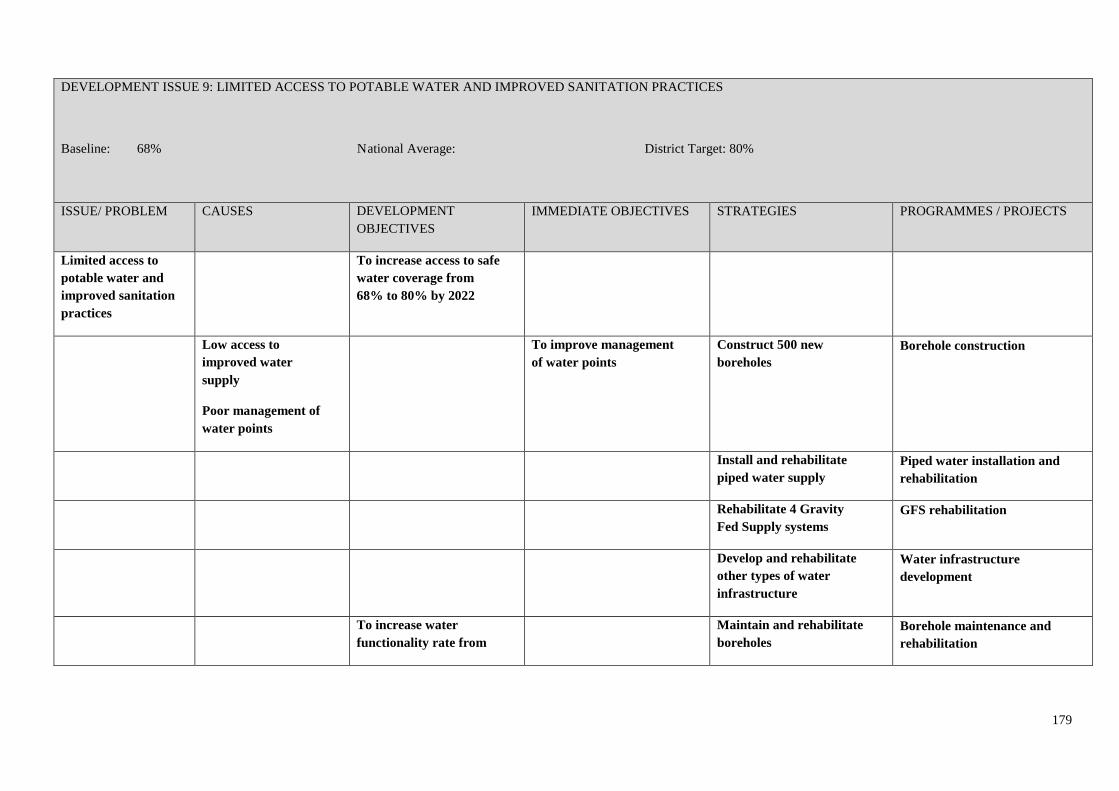
179
DEVELOPMENT ISSUE 9: LIMITED ACCESS TO POTABLE WATER AND IMPROVED SANITATION PRACTICES
Baseline: 68% National Average: District Target: 80%
ISSUE/ PROBLEM CAUSES DEVELOPMENT
OBJECTIVES
IMMEDIATE OBJECTIVES STRATEGIES PROGRAMMES / PROJECTS
Limited access to
potable water and
improved sanitation
practices
To increase access to safe
water coverage from
68% to 80% by 2022
Low access to
improved water
supply
Poor management of
water points
To improve management
of water points
Construct 500 new
boreholes
Borehole construction
Install and rehabilitate
piped water supply
Piped water installation and
rehabilitation
Rehabilitate 4 Gravity
Fed Supply systems
GFS rehabilitation
Develop and rehabilitate
other types of water
infrastructure
Water infrastructure
development
To increase water
functionality rate from
Maintain and rehabilitate
boreholes
Borehole maintenance and
rehabilitation
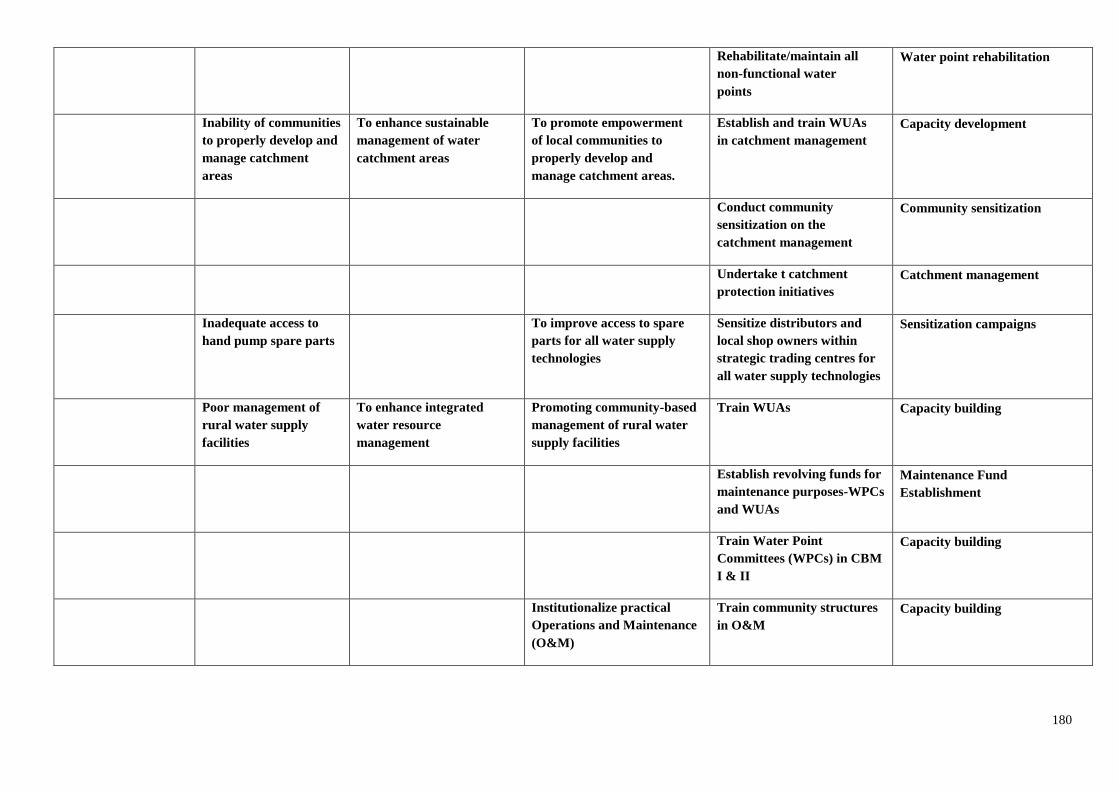
180
Rehabilitate/maintain all
non-functional water
points
Water point rehabilitation
Inability of communities
to properly develop and
manage catchment
areas
To enhance sustainable
management of water
catchment areas
To promote empowerment
of local communities to
properly develop and
manage catchment areas.
Establish and train WUAs
in catchment management
Capacity development
Conduct community
sensitization on the
catchment management
Community sensitization
Undertake t catchment
protection initiatives
Catchment management
Inadequate access to
hand pump spare parts
To improve access to spare
parts for all water supply
technologies
Sensitize distributors and
local shop owners within
strategic trading centres for
all water supply technologies
Sensitization campaigns
Poor management of
rural water supply
facilities
To enhance integrated
water resource
management
Promoting community-based
management of rural water
supply facilities
Train WUAs Capacity building
Establish revolving funds for
maintenance purposes-WPCs
and WUAs
Maintenance Fund
Establishment
Train Water Point
Committees (WPCs) in CBM
I & II
Capacity building
Institutionalize practical
Operations and Maintenance
(O&M)
Train community structures
in O&M
Capacity building
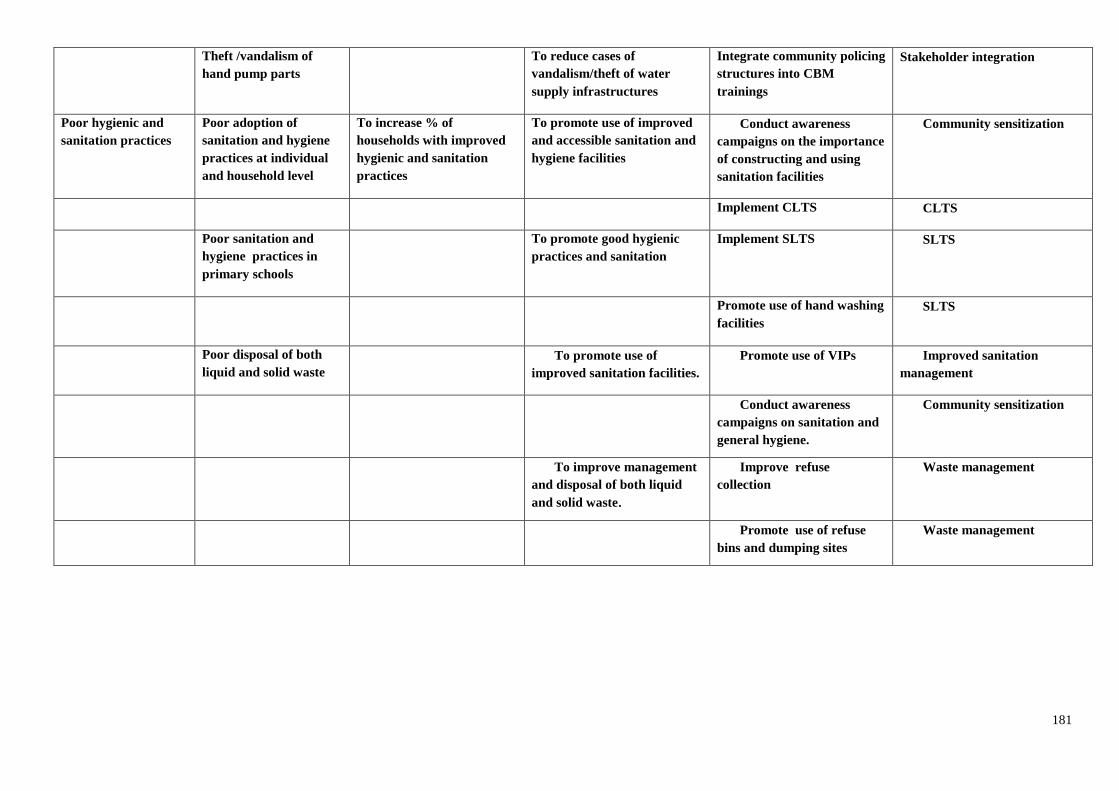
181
Theft /vandalism of
hand pump parts
To reduce cases of
vandalism/theft of water
supply infrastructures
Integrate community policing
structures into CBM
trainings
Stakeholder integration
Poor hygienic and
sanitation practices
Poor adoption of
sanitation and hygiene
practices at individual
and household level
To increase % of
households with improved
hygienic and sanitation
practices
To promote use of improved
and accessible sanitation and
hygiene facilities
Conduct awareness
campaigns on the importance
of constructing and using
sanitation facilities
Community sensitization
Implement CLTS CLTS
Poor sanitation and
hygiene practices in
primary schools
To promote good hygienic
practices and sanitation
Implement SLTS SLTS
Promote use of hand washing
facilities
SLTS
Poor disposal of both
liquid and solid waste
To promote use of
improved sanitation facilities.
Promote use of VIPs Improved sanitation
management
Conduct awareness
campaigns on sanitation and
general hygiene.
Community sensitization
To improve management
and disposal of both liquid
and solid waste.
Improve refuse
collection
Waste management
Promote use of refuse
bins and dumping sites
Waste management
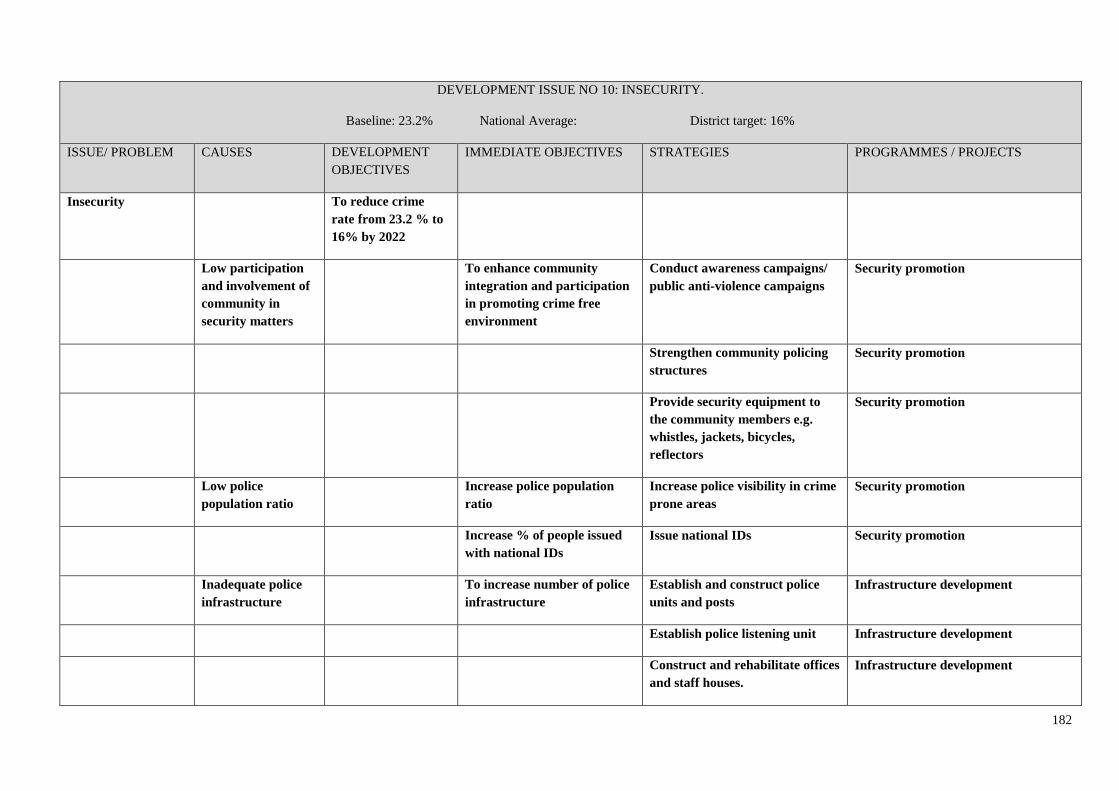
182
DEVELOPMENT ISSUE NO 10: INSECURITY.
Baseline: 23.2% National Average: District target: 16%
ISSUE/ PROBLEM CAUSES DEVELOPMENT
OBJECTIVES
IMMEDIATE OBJECTIVES STRATEGIES PROGRAMMES / PROJECTS
Insecurity To reduce crime
rate from 23.2 % to
16% by 2022
Low participation
and involvement of
community in
security matters
To enhance community
integration and participation
in promoting crime free
environment
Conduct awareness campaigns/
public anti-violence campaigns
Security promotion
Strengthen community policing
structures
Security promotion
Provide security equipment to
the community members e.g.
whistles, jackets, bicycles,
reflectors
Security promotion
Low police
population ratio
Increase police population
ratio
Increase police visibility in crime
prone areas
Security promotion
Increase % of people issued
with national IDs
Issue national IDs Security promotion
Inadequate police
infrastructure
To increase number of police
infrastructure
Establish and construct police
units and posts
Infrastructure development
Establish police listening unit Infrastructure development
Construct and rehabilitate offices
and staff houses.
Infrastructure development
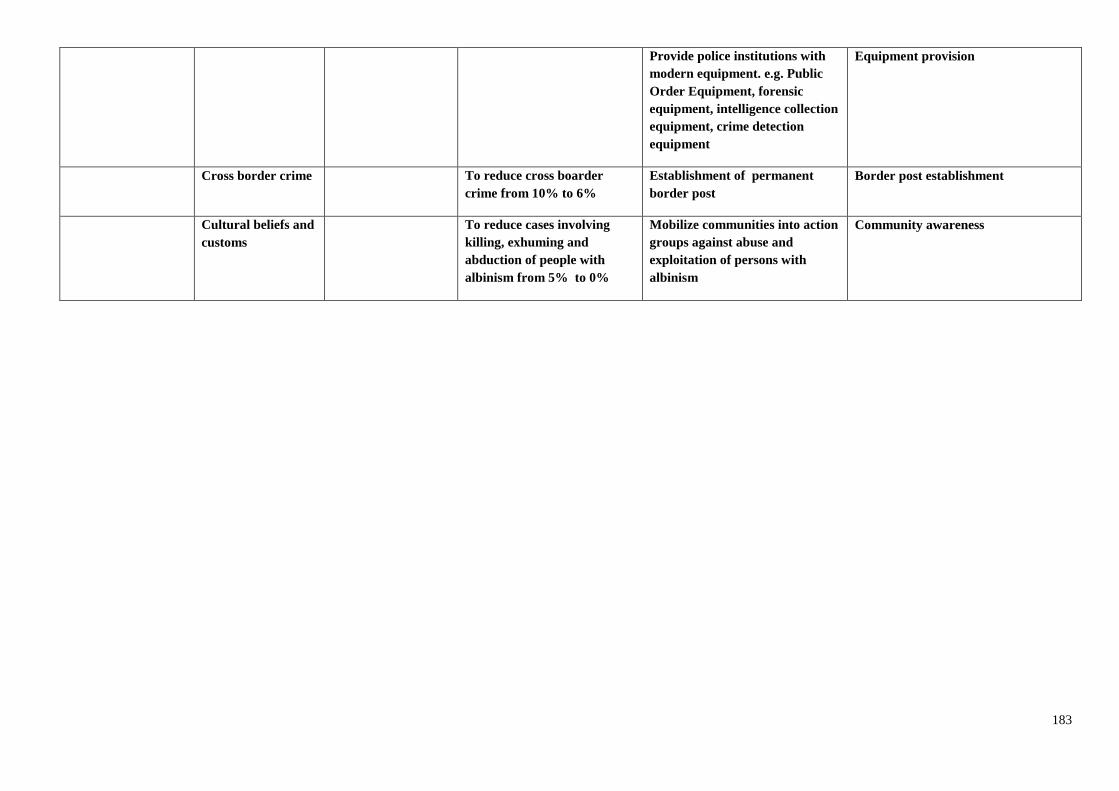
183
Provide police institutions with
modern equipment. e.g. Public
Order Equipment, forensic
equipment, intelligence collection
equipment, crime detection
equipment
Equipment provision
Cross border crime To reduce cross boarder
crime from 10% to 6%
Establishment of permanent
border post
Border post establishment
Cultural beliefs and
customs
To reduce cases involving
killing, exhuming and
abduction of people with
albinism from 5% to 0%
Mobilize communities into action
groups against abuse and
exploitation of persons with
albinism
Community awareness
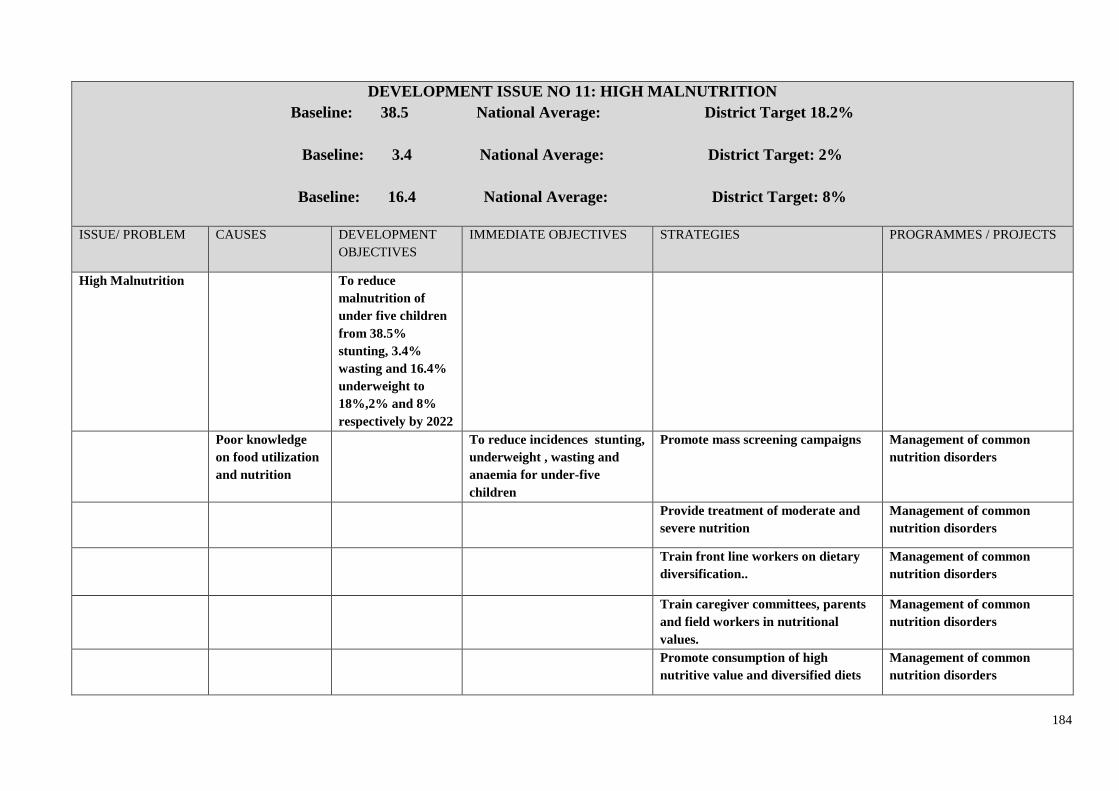
184
DEVELOPMENT ISSUE NO 11: HIGH MALNUTRITION
Baseline: 38.5 National Average: District Target 18.2%
Baseline: 3.4 National Average: District Target: 2%
Baseline: 16.4 National Average: District Target: 8%
ISSUE/ PROBLEM CAUSES DEVELOPMENT
OBJECTIVES
IMMEDIATE OBJECTIVES STRATEGIES PROGRAMMES / PROJECTS
High Malnutrition To reduce
malnutrition of
under five children
from 38.5%
stunting, 3.4%
wasting and 16.4%
underweight to
18%,2% and 8%
respectively by 2022
Poor knowledge
on food utilization
and nutrition
To reduce incidences stunting,
underweight , wasting and
anaemia for under-five
children
Promote mass screening campaigns Management of common
nutrition disorders
Provide treatment of moderate and
severe nutrition
Management of common
nutrition disorders
Train front line workers on dietary
diversification..
Management of common
nutrition disorders
Train caregiver committees, parents
and field workers in nutritional
values.
Management of common
nutrition disorders
Promote consumption of high
nutritive value and diversified diets
Management of common
nutrition disorders
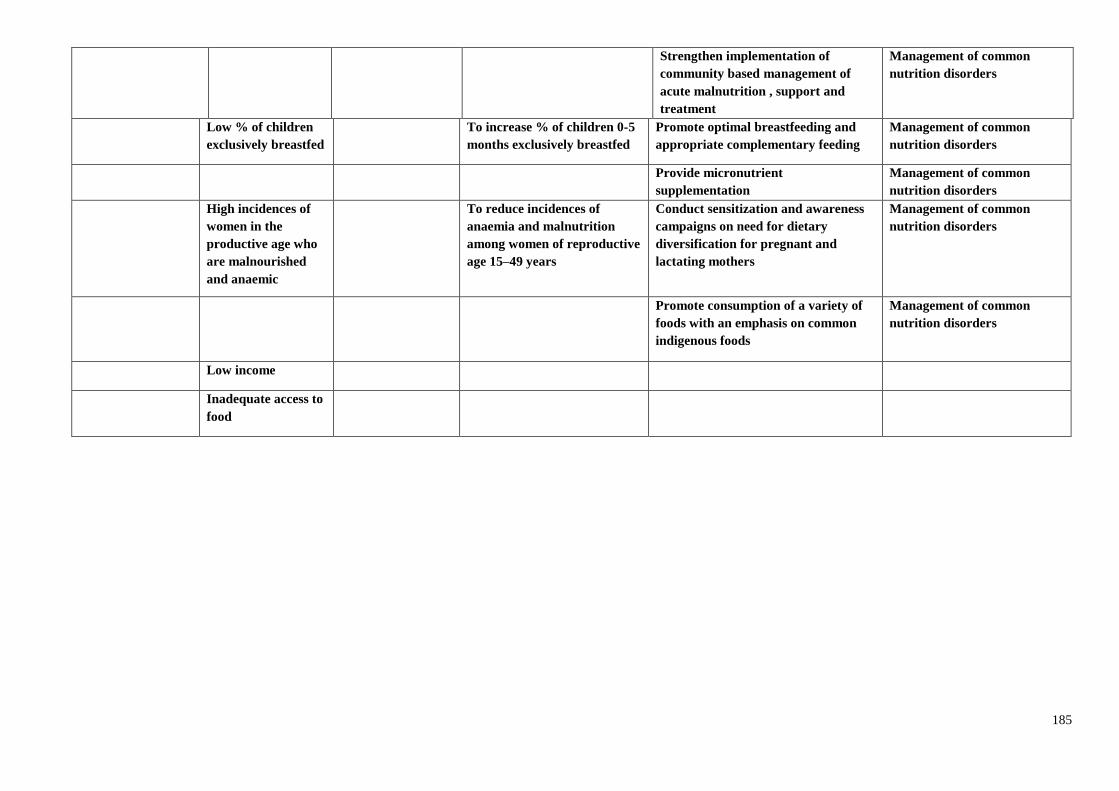
185
Strengthen implementation of
community based management of
acute malnutrition , support and
treatment
Management of common
nutrition disorders
Low % of children
exclusively breastfed
To increase % of children 0-5
months exclusively breastfed
Promote optimal breastfeeding and
appropriate complementary feeding
Management of common
nutrition disorders
Provide micronutrient
supplementation
Management of common
nutrition disorders
High incidences of
women in the
productive age who
are malnourished
and anaemic
To reduce incidences of
anaemia and malnutrition
among women of reproductive
age 15–49 years
Conduct sensitization and awareness
campaigns on need for dietary
diversification for pregnant and
lactating mothers
Management of common
nutrition disorders
Promote consumption of a variety of
foods with an emphasis on common
indigenous foods
Management of common
nutrition disorders
Low income
Inadequate access to
food
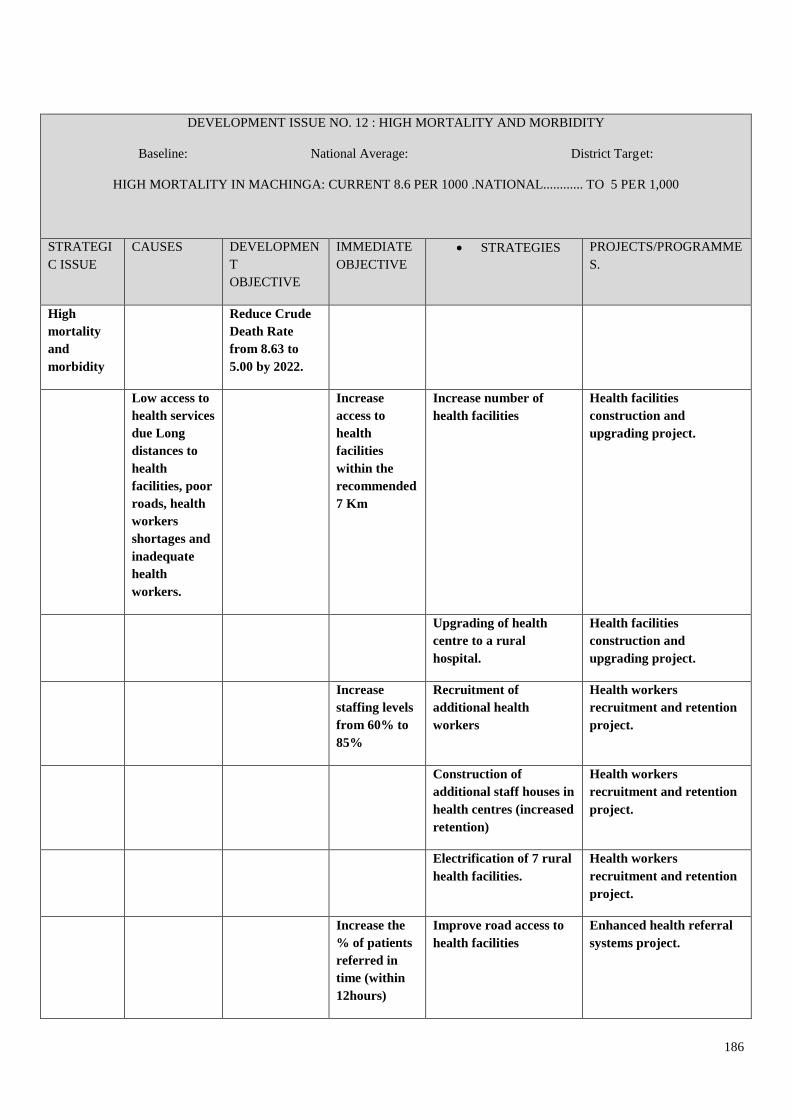
186
DEVELOPMENT ISSUE NO. 12 : HIGH MORTALITY AND MORBIDITY
Baseline: National Average: District Target:
HIGH MORTALITY IN MACHINGA: CURRENT 8.6 PER 1000 .NATIONAL............ TO 5 PER 1,000
STRATEGI
C ISSUE
CAUSES DEVELOPMEN
T
OBJECTIVE
IMMEDIATE
OBJECTIVE
STRATEGIES PROJECTS/PROGRAMME
S.
High
mortality
and
morbidity
Reduce Crude
Death Rate
from 8.63 to
5.00 by 2022.
Low access to
health services
due Long
distances to
health
facilities, poor
roads, health
workers
shortages and
inadequate
health
workers.
Increase
access to
health
facilities
within the
recommended
7 Km
Increase number of
health facilities
Health facilities
construction and
upgrading project.
Upgrading of health
centre to a rural
hospital.
Health facilities
construction and
upgrading project.
Increase
staffing levels
from 60% to
85%
Recruitment of
additional health
workers
Health workers
recruitment and retention
project.
Construction of
additional staff houses in
health centres (increased
retention)
Health workers
recruitment and retention
project.
Electrification of 7 rural
health facilities.
Health workers
recruitment and retention
project.
Increase the
% of patients
referred in
time (within
12hours)
Improve road access to
health facilities
Enhanced health referral
systems project.
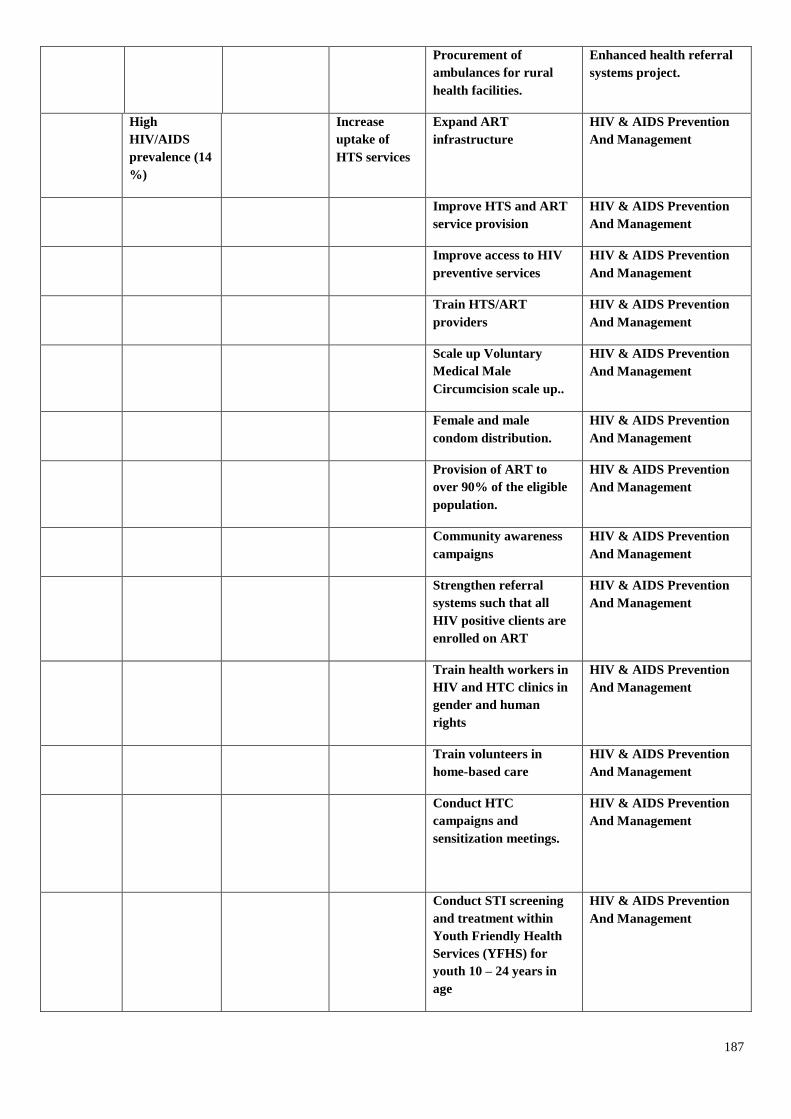
187
Procurement of
ambulances for rural
health facilities.
Enhanced health referral
systems project.
High
HIV/AIDS
prevalence (14
%)
Increase
uptake of
HTS services
Expand ART
infrastructure
HIV & AIDS Prevention
And Management
Improve HTS and ART
service provision
HIV & AIDS Prevention
And Management
Improve access to HIV
preventive services
HIV & AIDS Prevention
And Management
Train HTS/ART
providers
HIV & AIDS Prevention
And Management
Scale up Voluntary
Medical Male
Circumcision scale up..
HIV & AIDS Prevention
And Management
Female and male
condom distribution.
HIV & AIDS Prevention
And Management
Provision of ART to
over 90% of the eligible
population.
HIV & AIDS Prevention
And Management
Community awareness
campaigns
HIV & AIDS Prevention
And Management
Strengthen referral
systems such that all
HIV positive clients are
enrolled on ART
HIV & AIDS Prevention
And Management
Train health workers in
HIV and HTC clinics in
gender and human
rights
HIV & AIDS Prevention
And Management
Train volunteers in
home-based care
HIV & AIDS Prevention
And Management
Conduct HTC
campaigns and
sensitization meetings.
HIV & AIDS Prevention
And Management
Conduct STI screening
and treatment within
Youth Friendly Health
Services (YFHS) for
youth 10 – 24 years in
age
HIV & AIDS Prevention
And Management
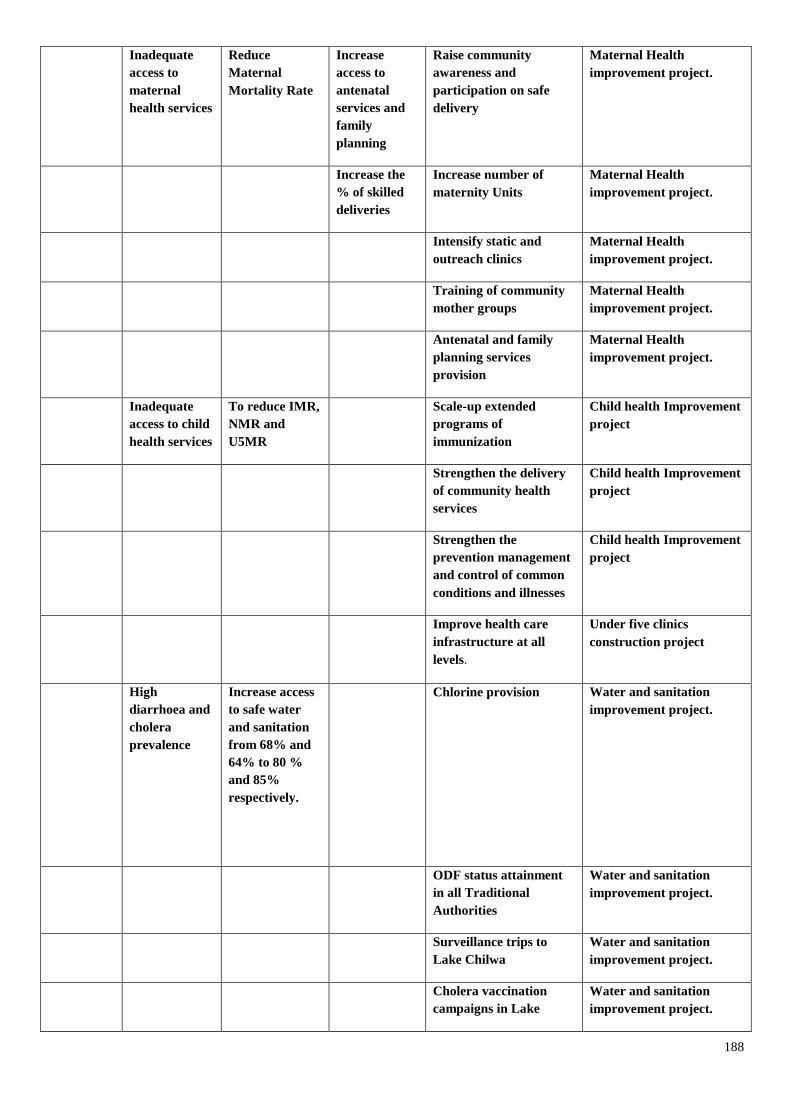
188
Inadequate
access to
maternal
health services
Reduce
Maternal
Mortality Rate
Increase
access to
antenatal
services and
family
planning
Raise community
awareness and
participation on safe
delivery
Maternal Health
improvement project.
Increase the
% of skilled
deliveries
Increase number of
maternity Units
Maternal Health
improvement project.
Intensify static and
outreach clinics
Maternal Health
improvement project.
Training of community
mother groups
Maternal Health
improvement project.
Antenatal and family
planning services
provision
Maternal Health
improvement project.
Inadequate
access to child
health services
To reduce IMR,
NMR and
U5MR
Scale-up extended
programs of
immunization
Child health Improvement
project
Strengthen the delivery
of community health
services
Child health Improvement
project
Strengthen the
prevention management
and control of common
conditions and illnesses
Child health Improvement
project
Improve health care
infrastructure at all
levels.
Under five clinics
construction project
High
diarrhoea and
cholera
prevalence
Increase access
to safe water
and sanitation
from 68% and
64% to 80 %
and 85%
respectively.
Chlorine provision Water and sanitation
improvement project.
ODF status attainment
in all Traditional
Authorities
Water and sanitation
improvement project.
Surveillance trips to
Lake Chilwa
Water and sanitation
improvement project.
Cholera vaccination
campaigns in Lake
Water and sanitation
improvement project.
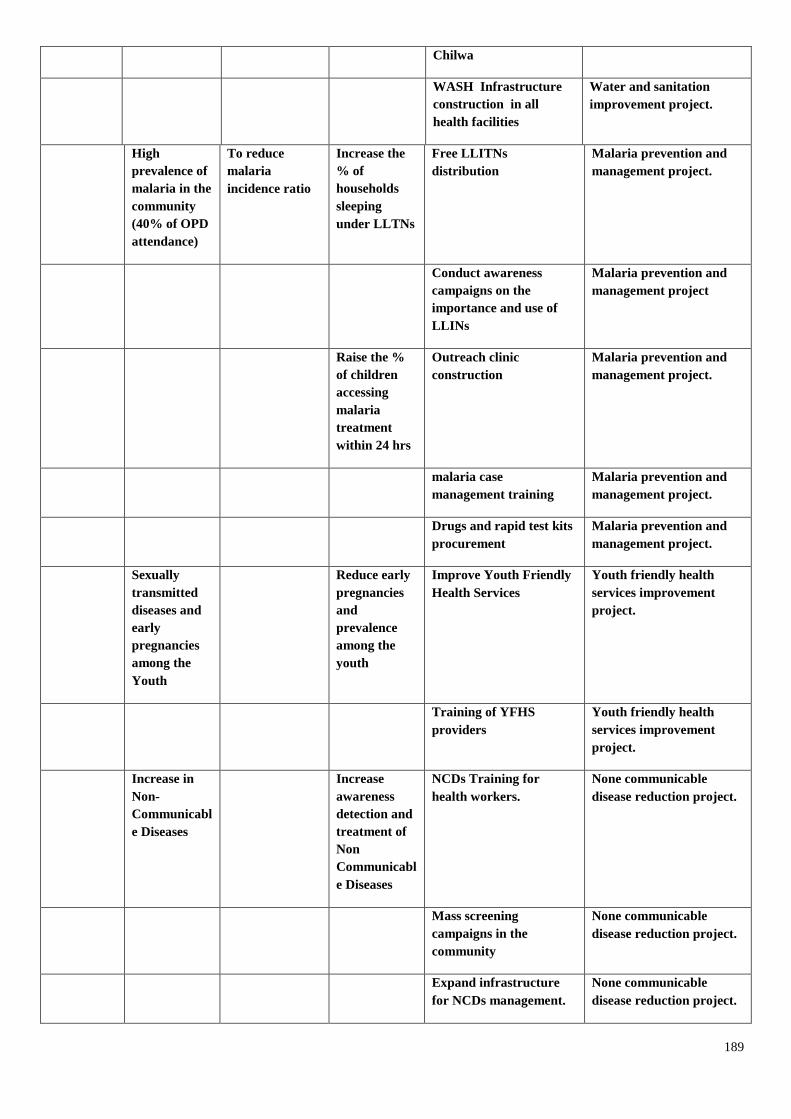
189
Chilwa
WASH Infrastructure
construction in all
health facilities
Water and sanitation
improvement project.
High
prevalence of
malaria in the
community
(40% of OPD
attendance)
To reduce
malaria
incidence ratio
Increase the
% of
households
sleeping
under LLTNs
Free LLITNs
distribution
Malaria prevention and
management project.
Conduct awareness
campaigns on the
importance and use of
LLINs
Malaria prevention and
management project
Raise the %
of children
accessing
malaria
treatment
within 24 hrs
Outreach clinic
construction
Malaria prevention and
management project.
malaria case
management training
Malaria prevention and
management project.
Drugs and rapid test kits
procurement
Malaria prevention and
management project.
Sexually
transmitted
diseases and
early
pregnancies
among the
Youth
Reduce early
pregnancies
and
prevalence
among the
youth
Improve Youth Friendly
Health Services
Youth friendly health
services improvement
project.
Training of YFHS
providers
Youth friendly health
services improvement
project.
Increase in
Non-
Communicabl
e Diseases
Increase
awareness
detection and
treatment of
Non
Communicabl
e Diseases
NCDs Training for
health workers.
None communicable
disease reduction project.
Mass screening
campaigns in the
community
None communicable
disease reduction project.
Expand infrastructure
for NCDs management.
None communicable
disease reduction project.
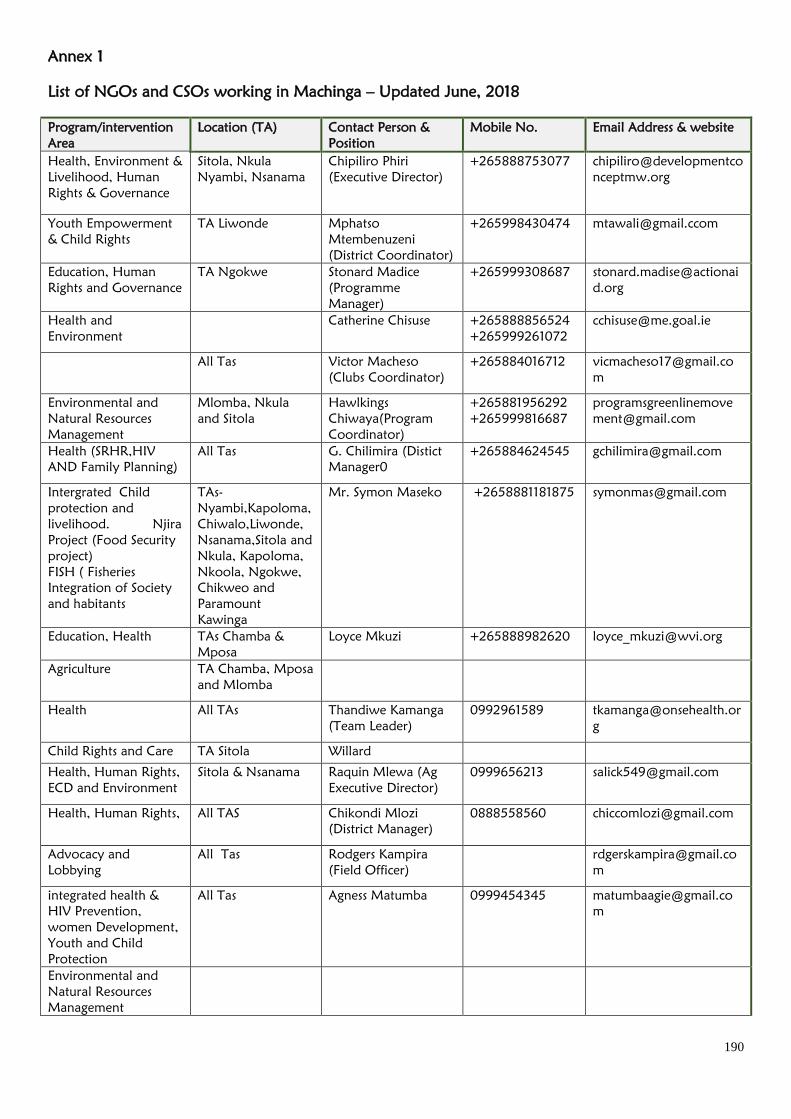
190
Annex 1
List of NGOs and CSOs working in Machinga – Updated June, 2018
Program/intervention
Area
Location (TA) Contact Person &
Position
Mobile No. Email Address & website
Health, Environment &
Livelihood, Human
Rights & Governance
Sitola, Nkula
Nyambi, Nsanama
Chipiliro Phiri
(Executive Director)
+265888753077 chipiliro@developmentco
nceptmw.org
Youth Empowerment
& Child Rights
TA Liwonde Mphatso
Mtembenuzeni
(District Coordinator)
+265998430474 [email protected]
Education, Human
Rights and Governance
TA Ngokwe Stonard Madice
(Programme
Manager)
+265999308687 stonard.madise@actionai
d.org
Health and
Environment
Catherine Chisuse +265888856524
+265999261072
All Tas Victor Macheso
(Clubs Coordinator)
+265884016712 [email protected]
m
Environmental and
Natural Resources
Management
Mlomba, Nkula
and Sitola
Hawlkings
Chiwaya(Program
Coordinator)
+265881956292
+265999816687
programsgreenlinemove
Health (SRHR,HIV
AND Family Planning)
All Tas G. Chilimira (Distict
Manager0
+265884624545 [email protected]
Intergrated Child
protection and
livelihood. Njira
Project (Food Security
project)
FISH ( Fisheries
Integration of Society
and habitants
TAs-
Nyambi,Kapoloma,
Chiwalo,Liwonde,
Nsanama,Sitola and
Nkula, Kapoloma,
Nkoola, Ngokwe,
Chikweo and
Paramount
Kawinga
Mr. Symon Maseko +2658881181875 [email protected]
Education, Health TAs Chamba &
Mposa
Loyce Mkuzi
+265888982620 [email protected]
Agriculture TA Chamba, Mposa
and Mlomba
Health All TAs Thandiwe Kamanga
(Team Leader)
0992961589 [email protected]
g
Child Rights and Care TA Sitola Willard
Health, Human Rights,
ECD and Environment
Sitola & Nsanama Raquin Mlewa (Ag
Executive Director)
0999656213 [email protected]
Health, Human Rights, All TAS Chikondi Mlozi
(District Manager)
0888558560 [email protected]
Advocacy and
Lobbying
All Tas Rodgers Kampira
(Field Officer)
m
integrated health &
HIV Prevention,
women Development,
Youth and Child
Protection
All Tas Agness Matumba 0999454345 [email protected]
m
Environmental and
Natural Resources
Management
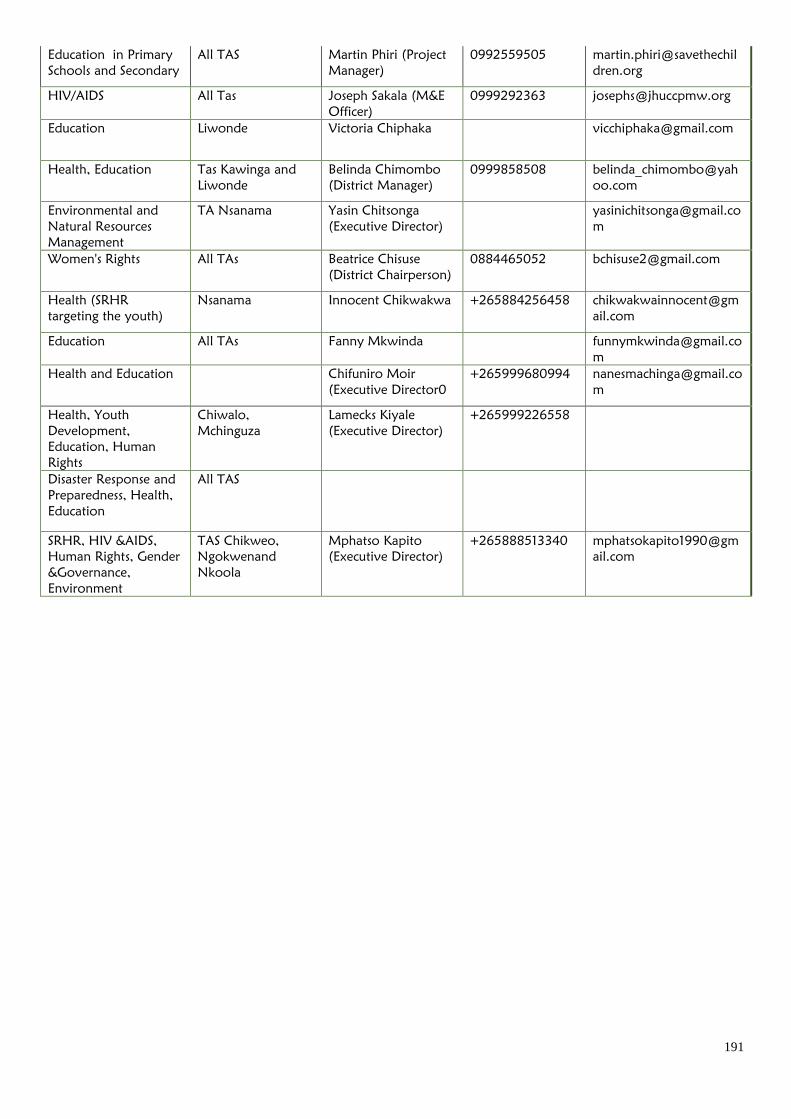
191
Education in Primary
Schools and Secondary
All TAS Martin Phiri (Project
Manager)
0992559505 martin.phiri@savethechil
dren.org
HIV/AIDS All Tas Joseph Sakala (M&E
Officer)
0999292363 [email protected]
Education Liwonde Victoria Chiphaka [email protected]
Health, Education Tas Kawinga and
Liwonde
Belinda Chimombo
(District Manager)
0999858508 belinda_chimombo@yah
oo.com
Environmental and
Natural Resources
Management
TA Nsanama Yasin Chitsonga
(Executive Director)
m
Women's Rights All TAs Beatrice Chisuse
(District Chairperson)
0884465052 [email protected]
Health (SRHR
targeting the youth)
Nsanama Innocent Chikwakwa +265884256458 chikwakwainnocent@gm
ail.com
Education All TAs
Fanny Mkwinda [email protected]
m
Health and Education Chifuniro Moir
(Executive Director0
+265999680994 [email protected]
m
Health, Youth
Development,
Education, Human
Rights
Chiwalo,
Mchinguza
Lamecks Kiyale
(Executive Director)
+265999226558
Disaster Response and
Preparedness, Health,
Education
All TAS
SRHR, HIV &AIDS,
Human Rights, Gender
&Governance,
Environment
TAS Chikweo,
Ngokwenand
Nkoola
Mphatso Kapito
(Executive Director)
+265888513340 mphatsokapito1990@gm
ail.com
Related Documents