ANNUAL REPORT 2016

Welcome message from author
This document is posted to help you gain knowledge. Please leave a comment to let me know what you think about it! Share it to your friends and learn new things together.
Transcript
ANNUALREPORT
2016
“Our company is sustained by the strength of its relationships with all key stakeholders. These relationships are as strong as ever, because our stakeholders recognise and understand the value of our company.
Our stakeholders understand the temporary nature of the industry crisis. They recognise the stability and strength with which we are meeting all our obligations; and they see the same bright future that lies ahead.”

HIS MAJESTY
SULTAN QABOOS BIN SAID

HIS MAJESTY
SULTAN QABOOS BIN SAID
CONTENTS
Renaissance Services SAOGP.O. Box 1676, P.C. 114, Muttrah, Sultanate of OmanTel.: +968 2479 6636 Fax: +968 2479 6639www.renaissance-oman.com
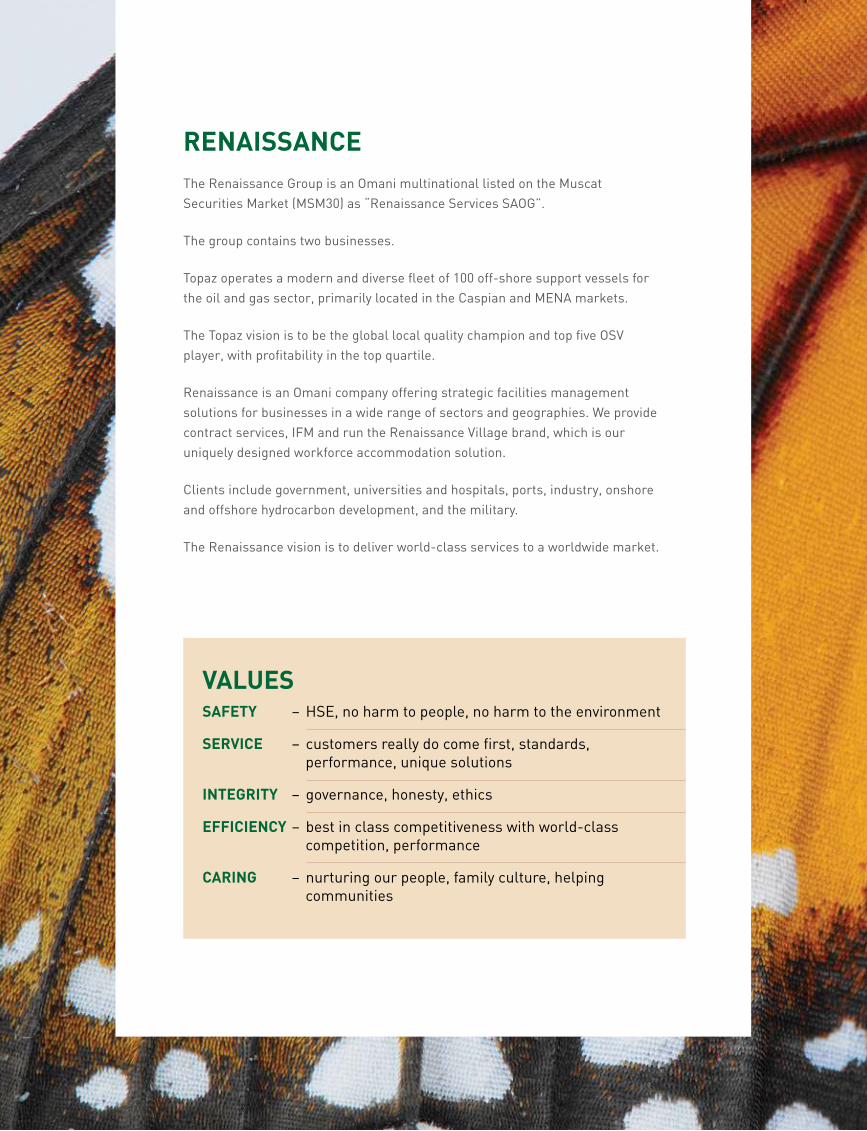
RENAISSANCEThe Renaissance Group is an Omani multinational listed on the Muscat Securities Market (MSM30) as “Renaissance Services SAOG”. The group contains two businesses. Topaz operates a modern and diverse fleet of 100 off-shore support vessels for the oil and gas sector, primarily located in the Caspian and MENA markets. The Topaz vision is to be the global local quality champion and top five OSV player, with profitability in the top quartile. Renaissance is an Omani company offering strategic facilities management solutions for businesses in a wide range of sectors and geographies. We provide contract services, IFM and run the Renaissance Village brand, which is our uniquely designed workforce accommodation solution. Clients include government, universities and hospitals, ports, industry, onshore and offshore hydrocarbon development, and the military.
The Renaissance vision is to deliver world-class services to a worldwide market.
Board of Directors 6
Financial Highlights 8
Chairman’s Report 10
Chief Executive’s Report 20
Auditors’ Report on Corporate Governance 31
Report on Corporate Governance 32
Auditors’ Report on Financial Statements 40
Financial Statements 46
VALUESSAFETY – HSE, no harm to people, no harm to the environment
SERVICE – customers really do come first, standards, performance, unique solutions
INTEGRITY – governance, honesty, ethics
EFFICIENCY – best in class competitiveness with world-class competition, performance
CARING – nurturing our people, family culture, helping communities
CONTENTS
Renaissance Services SAOGP.O. Box 1676, P.C. 114, Muttrah, Sultanate of OmanTel.: +968 2479 6636 Fax: +968 2479 6639www.renaissance-oman.com
RENAISSANCEThe Renaissance Group is an Omani multinational listed on the Muscat Securities Market (MSM30) as “Renaissance Services SAOG”. The group contains two businesses. Topaz operates a modern and diverse fleet of 100 off-shore support vessels for the oil and gas sector, primarily located in the Caspian and MENA markets. The Topaz vision is to be the global local quality champion and top five OSV player, with profitability in the top quartile. Renaissance is an Omani company offering strategic facilities management solutions for businesses in a wide range of sectors and geographies. We provide contract services, IFM and run the Renaissance Village brand, which is our uniquely designed workforce accommodation solution. Clients include government, universities and hospitals, ports, industry, onshore and offshore hydrocarbon development, and the military.
The Renaissance vision is to deliver world-class services to a worldwide market.
Board of Directors 6
Financial Highlights 8
Chairman’s Report 10
Chief Executive’s Report 20
Auditors’ Report on Corporate Governance 31
Report on Corporate Governance 32
Auditors’ Report on Financial Statements 40
Financial Statements 46
VALUESSAFETY – HSE, no harm to people, no harm to the environment
SERVICE – customers really do come first, standards, performance, unique solutions
INTEGRITY – governance, honesty, ethics
EFFICIENCY – best in class competitiveness with world-class competition, performance
CARING – nurturing our people, family culture, helping communities
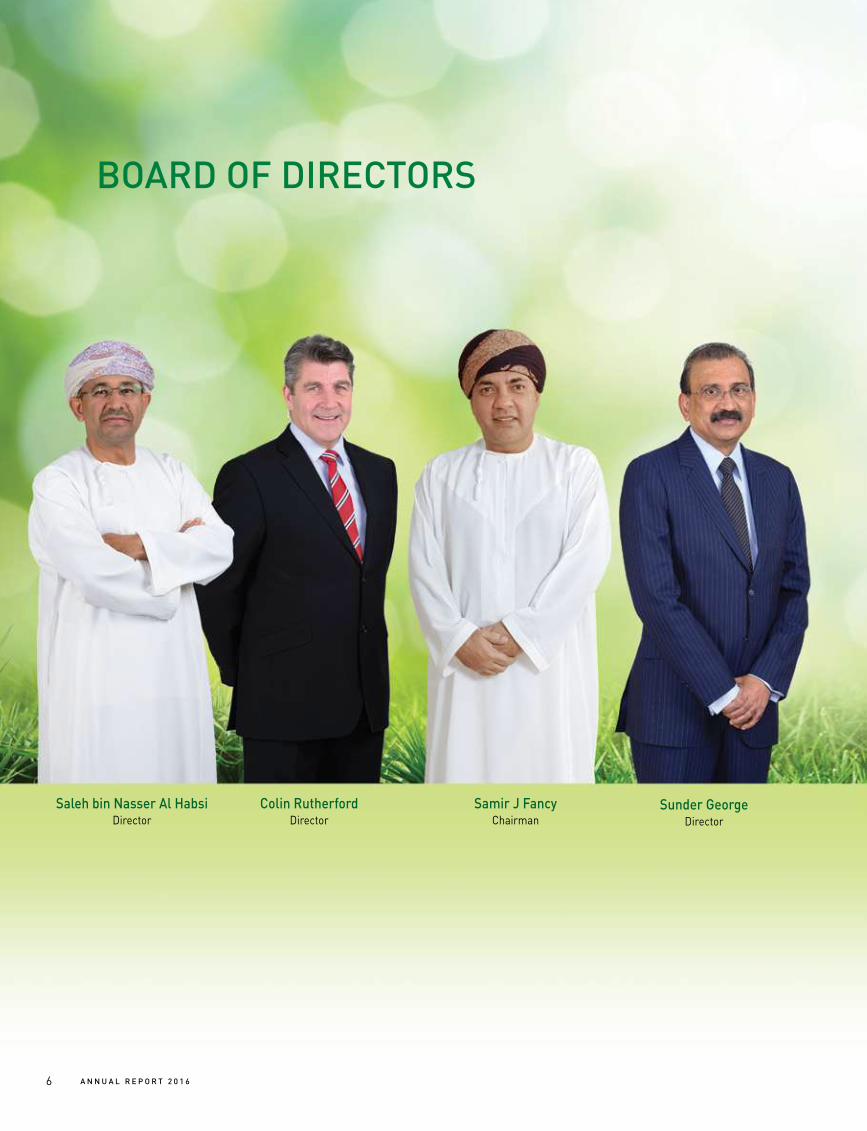
BOARD OF DIRECTORS
A N N U A L R E P O R T 2 0 1 66
Colin RutherfordDirector
Saleh bin Nasser Al HabsiDirector
Sunder GeorgeDirector
Samir J FancyChairman
7A N N U A L R E P O R T 2 0 1 6
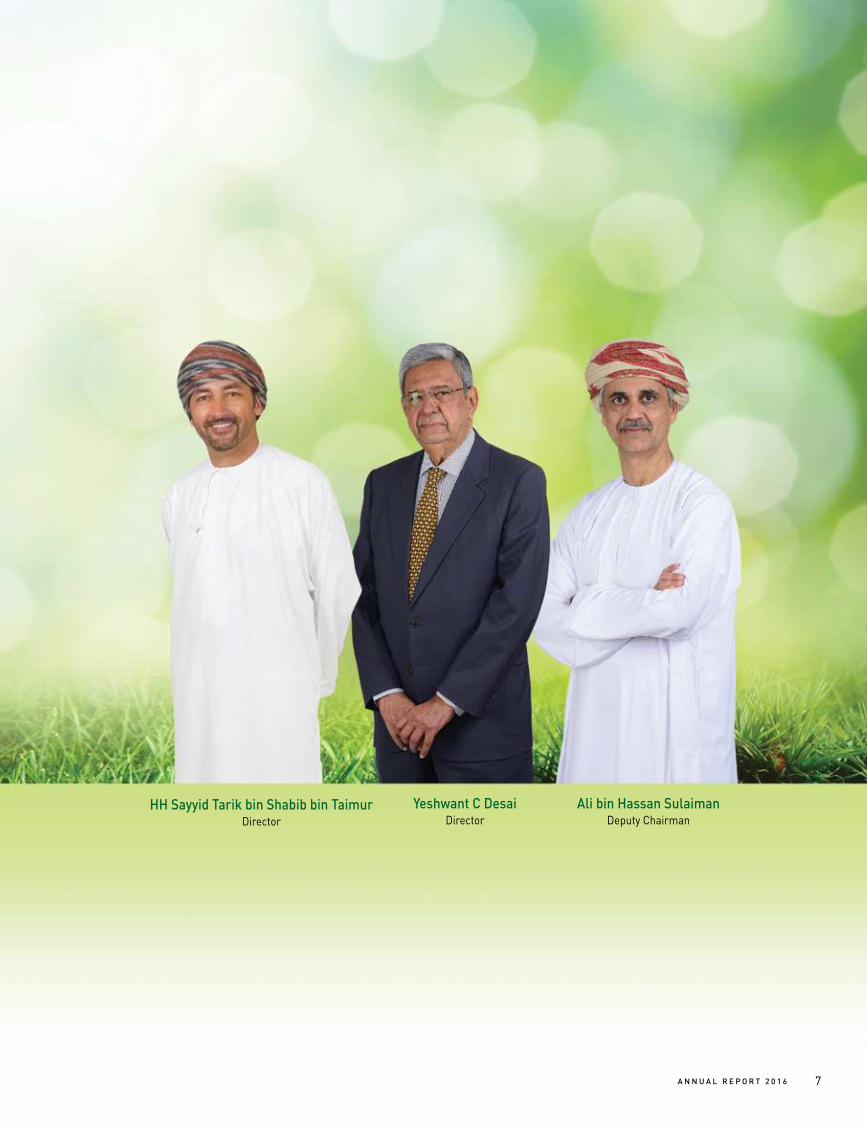
HH Sayyid Tarik bin Shabib bin TaimurDirector
Yeshwant C DesaiDirector
Ali bin Hassan SulaimanDeputy Chairman
USD Million
SUMMARY FINANCIAL INFORMATION
Revenue EBITDA
# Before one-offs
Profit fromOperations
ProfitBefore Tax
Profit After Tax(Before Minority)
USD Million USD Million
Gearing Total Liabilities/Net Worth
2.23
1.621.58
1.29
93.8
20.8
1.3
128.3
56.4
29.4
536.4
182.6
615.6
211.7
2015 2016 2015 2016
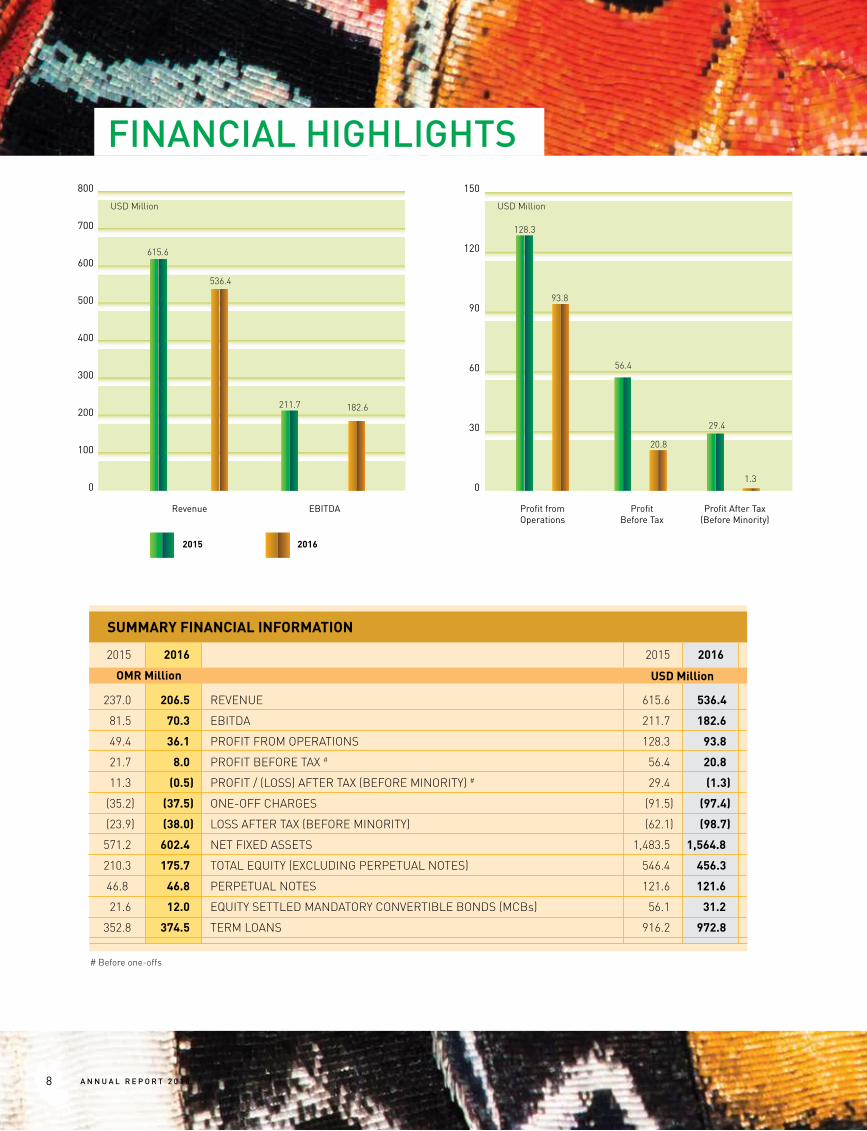
237.0 206.5 REVENUE 615.6 536.4
81.5 70.3 EBITDA 211.7 182.6
49.4 36.1 PROFIT FROM OPERATIONS 128.3 93.8
21.7 8.0 PROFIT BEFORE TAX # 56.4 20.8
11.3 (0.5) PROFIT / (LOSS) AFTER TAX (BEFORE MINORITY) # 29.4 (1.3)
(35.2) (37.5) ONE-OFF CHARGES (91.5) (97.4)
(23.9) (38.0) LOSS AFTER TAX (BEFORE MINORITY) (62.1) (98.7)
571.2 602.4 NET FIXED ASSETS 1,483.5 1,564.8
210.3 175.7 TOTAL EQUITY (EXCLUDING PERPETUAL NOTES) 546.4 456.3
46.8 46.8 PERPETUAL NOTES 121.6 121.6
21.6 12.0 EQUITY SETTLED MANDATORY CONVERTIBLE BONDS (MCBs) 56.1 31.2
352.8 374.5 TERM LOANS 916.2 972.8
OMR Million
20162015
0
100
200
300
400
500
600
700
800
0
30
60
90
120
150
0.0
0.5
1.0
1.5
2.0
2.5
Ratio
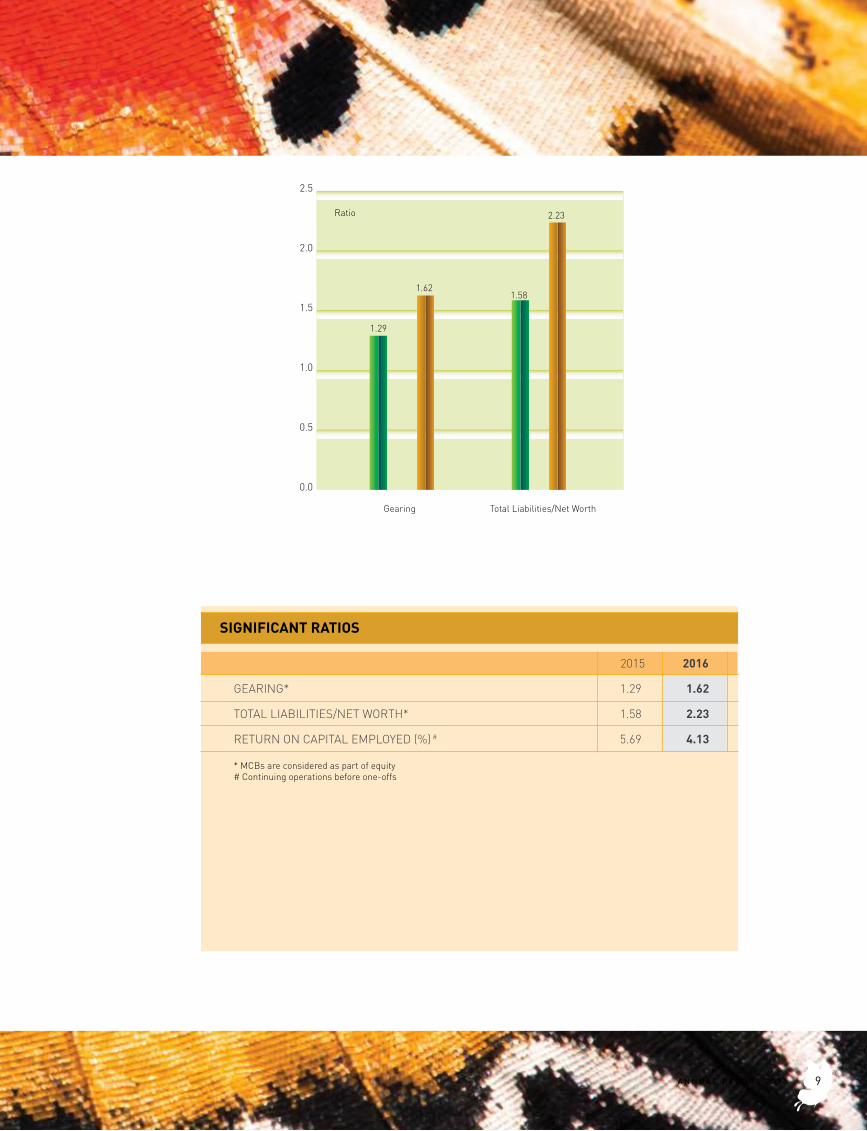
SIGNIFICANT RATIOS
2015 2016
GEARING* 1.29 1.62
TOTAL LIABILITIES/NET WORTH* 1.58 2.23
RETURN ON CAPITAL EMPLOYED (%) # 5.69 4.13
* MCBs are considered as part of equity# Continuing operations before one-offs
FINANCIAL HIGHLIGHTS
A N N U A L R E P O R T 2 0 1 68
USD Million
SUMMARY FINANCIAL INFORMATION
Revenue EBITDA
# Before one-offs
Profit fromOperations
ProfitBefore Tax
Profit After Tax(Before Minority)
USD Million USD Million
Gearing Total Liabilities/Net Worth
2.23
1.621.58
1.29
93.8
20.8
1.3
128.3
56.4
29.4
536.4
182.6
615.6
211.7
2015 2016 2015 2016
237.0 206.5 REVENUE 615.6 536.4
81.5 70.3 EBITDA 211.7 182.6
49.4 36.1 PROFIT FROM OPERATIONS 128.3 93.8
21.7 8.0 PROFIT BEFORE TAX # 56.4 20.8
11.3 (0.5) PROFIT / (LOSS) AFTER TAX (BEFORE MINORITY) # 29.4 (1.3)
(35.2) (37.5) ONE-OFF CHARGES (91.5) (97.4)
(23.9) (38.0) LOSS AFTER TAX (BEFORE MINORITY) (62.1) (98.7)
571.2 602.4 NET FIXED ASSETS 1,483.5 1,564.8
210.3 175.7 TOTAL EQUITY (EXCLUDING PERPETUAL NOTES) 546.4 456.3
46.8 46.8 PERPETUAL NOTES 121.6 121.6
21.6 12.0 EQUITY SETTLED MANDATORY CONVERTIBLE BONDS (MCBs) 56.1 31.2
352.8 374.5 TERM LOANS 916.2 972.8
OMR Million
20162015
0
100
200
300
400
500
600
700
800
0
30
60
90
120
150
0.0
0.5
1.0
1.5
2.0
2.5
Ratio
SIGNIFICANT RATIOS
2015 2016
GEARING* 1.29 1.62
TOTAL LIABILITIES/NET WORTH* 1.58 2.23
RETURN ON CAPITAL EMPLOYED (%) # 5.69 4.13
* MCBs are considered as part of equity# Continuing operations before one-offs
9A N N U A L R E P O R T 2 0 1 6
CHAIRMAN’SREPORT
A N N U A L R E P O R T 2 0 1 610
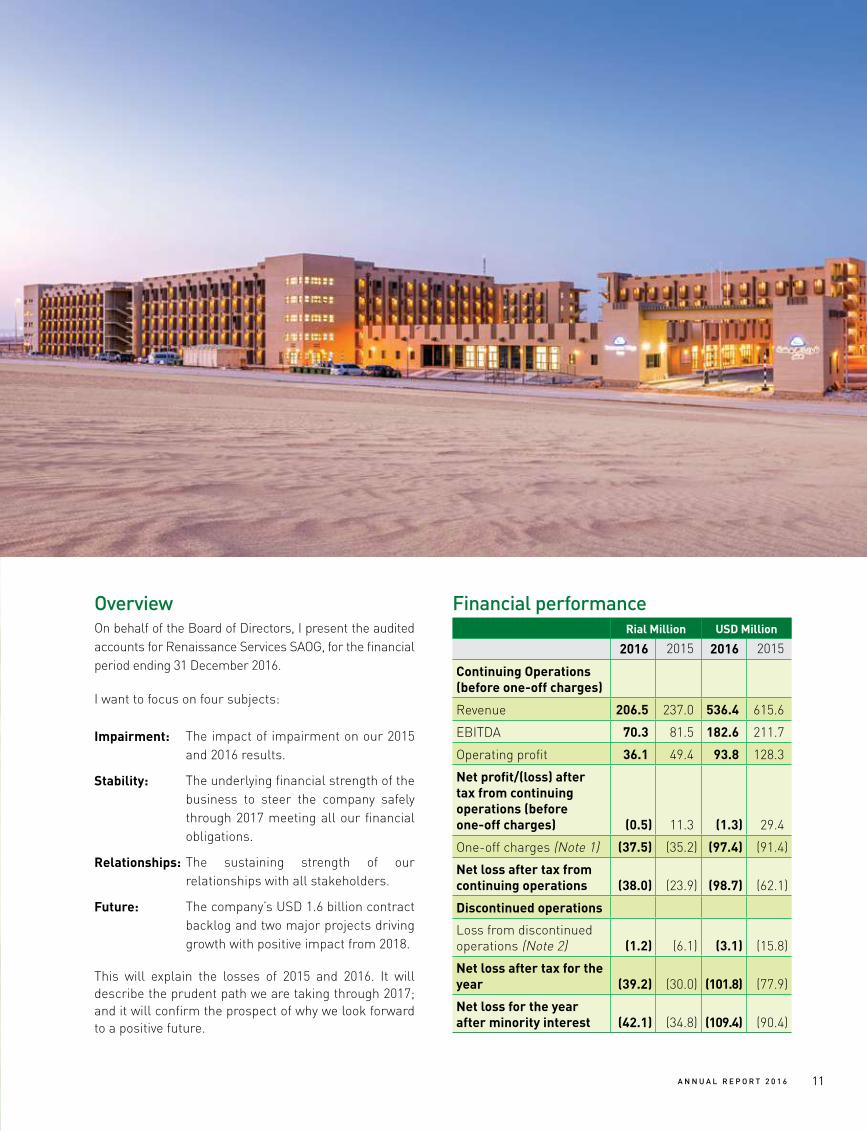
OverviewOn behalf of the Board of Directors, I present the audited accounts for Renaissance Services SAOG, for the financial period ending 31 December 2016.
I want to focus on four subjects:
Impairment: The impact of impairment on our 2015 and 2016 results.
Stability: The underlying financial strength of the business to steer the company safely through 2017 meeting all our financial obligations.
Relationships: The sustaining strength of our relationships with all stakeholders.
Future: The company’s USD 1.6 billion contract backlog and two major projects driving growth with positive impact from 2018.
This will explain the losses of 2015 and 2016. It will describe the prudent path we are taking through 2017; and it will confirm the prospect of why we look forward to a positive future.
Financial performance Rial Million USD Million
2016 2015 2016 2015
Continuing Operations (before one-off charges)
Revenue 206.5 237.0 536.4 615.6
EBITDA 70.3 81.5 182.6 211.7
Operating profit 36.1 49.4 93.8 128.3
Net profit/(loss) after tax from continuing operations (before one-off charges) (0.5) 11.3 (1.3) 29.4
One-off charges (Note 1) (37.5) (35.2) (97.4) (91.4)
Net loss after tax from continuing operations (38.0) (23.9) (98.7) (62.1)
Discontinued operations
Loss from discontinued operations (Note 2) (1.2) (6.1) (3.1) (15.8)
Net loss after tax for the year (39.2) (30.0) (101.8) (77.9)
Net loss for the year after minority interest (42.1) (34.8) (109.4) (90.4)
11A N N U A L R E P O R T 2 0 1 6
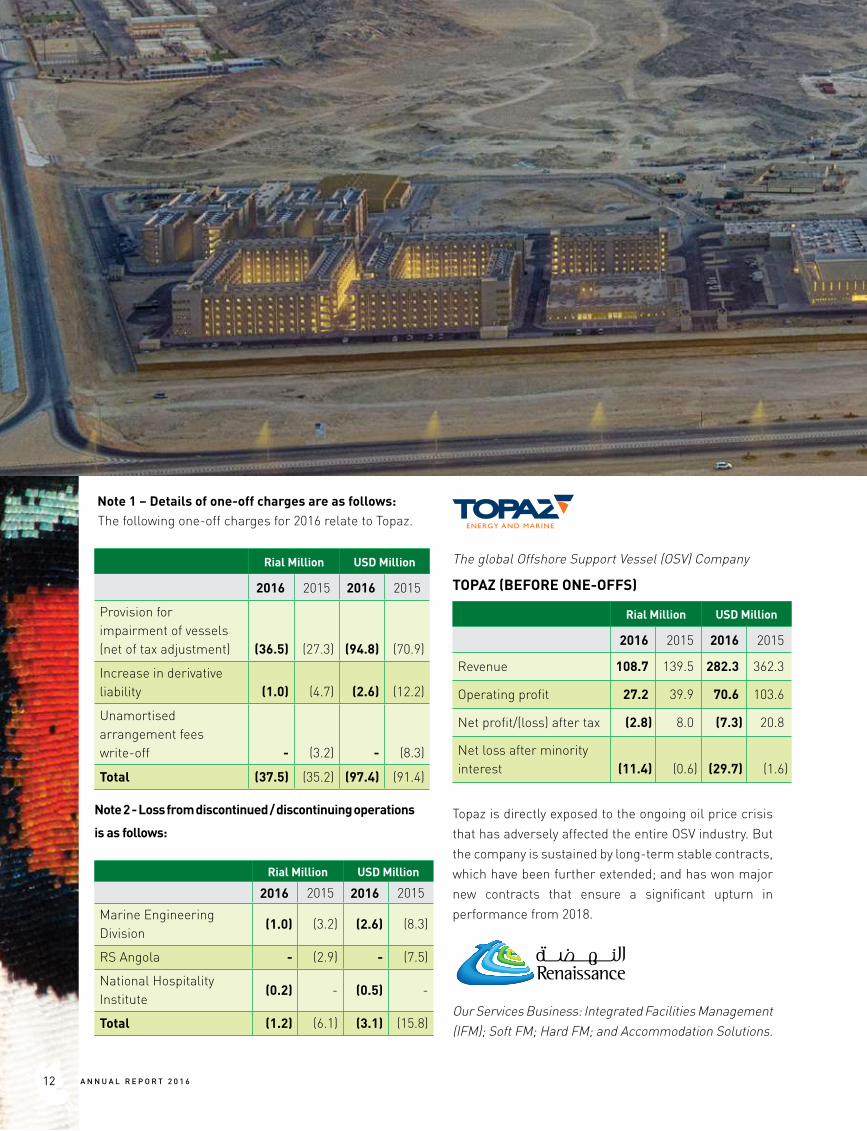
Note 1 – Details of one-off charges are as follows: The following one-off charges for 2016 relate to Topaz.
Rial Million USD Million
2016 2015 2016 2015
Provision for impairment of vessels (net of tax adjustment) (36.5) (27.3) (94.8) (70.9)
Increase in derivative liability (1.0) (4.7) (2.6) (12.2)
Unamortised arrangement fees write-off - (3.2) - (8.3)
Total (37.5) (35.2) (97.4) (91.4)
Note 2 - Loss from discontinued / discontinuing operations
is as follows:
Rial Million USD Million
2016 2015 2016 2015
Marine Engineering Division
(1.0) (3.2) (2.6) (8.3)
RS Angola - (2.9) - (7.5)
National Hospitality Institute
(0.2) - (0.5) -
Total (1.2) (6.1) (3.1) (15.8)
The global Offshore Support Vessel (OSV) Company
TOPAZ (BEFORE ONE-OFFS)
Rial Million USD Million
2016 2015 2016 2015
Revenue 108.7 139.5 282.3 362.3
Operating profit 27.2 39.9 70.6 103.6
Net profit/(loss) after tax (2.8) 8.0 (7.3) 20.8
Net loss after minority interest (11.4) (0.6) (29.7) (1.6)
Topaz is directly exposed to the ongoing oil price crisis that has adversely affected the entire OSV industry. But the company is sustained by long-term stable contracts, which have been further extended; and has won major new contracts that ensure a significant upturn in performance from 2018.
Our Services Business: Integrated Facilities Management (IFM); Soft FM; Hard FM; and Accommodation Solutions.
A N N U A L R E P O R T 2 0 1 612
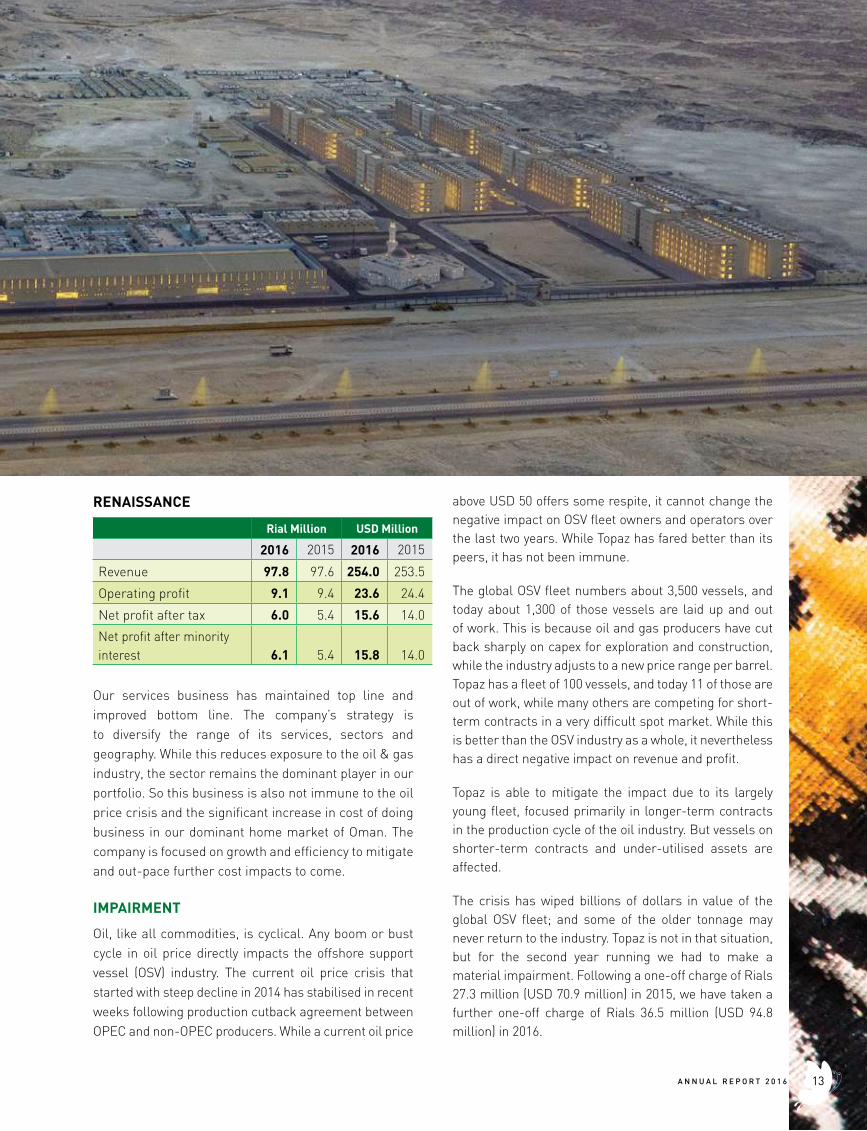
RENAISSANCE
Rial Million USD Million
2016 2015 2016 2015
Revenue 97.8 97.6 254.0 253.5
Operating profit 9.1 9.4 23.6 24.4
Net profit after tax 6.0 5.4 15.6 14.0
Net profit after minority interest 6.1 5.4 15.8 14.0
Our services business has maintained top line and improved bottom line. The company’s strategy is to diversify the range of its services, sectors and geography. While this reduces exposure to the oil & gas industry, the sector remains the dominant player in our portfolio. So this business is also not immune to the oil price crisis and the significant increase in cost of doing business in our dominant home market of Oman. The company is focused on growth and efficiency to mitigate and out-pace further cost impacts to come.
IMPAIRMENT
Oil, like all commodities, is cyclical. Any boom or bust cycle in oil price directly impacts the offshore support vessel (OSV) industry. The current oil price crisis that started with steep decline in 2014 has stabilised in recent weeks following production cutback agreement between OPEC and non-OPEC producers. While a current oil price
above USD 50 offers some respite, it cannot change the negative impact on OSV fleet owners and operators over the last two years. While Topaz has fared better than its peers, it has not been immune.
The global OSV fleet numbers about 3,500 vessels, and today about 1,300 of those vessels are laid up and out of work. This is because oil and gas producers have cut back sharply on capex for exploration and construction, while the industry adjusts to a new price range per barrel. Topaz has a fleet of 100 vessels, and today 11 of those are out of work, while many others are competing for short-term contracts in a very difficult spot market. While this is better than the OSV industry as a whole, it nevertheless has a direct negative impact on revenue and profit.
Topaz is able to mitigate the impact due to its largely young fleet, focused primarily in longer-term contracts in the production cycle of the oil industry. But vessels on shorter-term contracts and under-utilised assets are affected.
The crisis has wiped billions of dollars in value of the global OSV fleet; and some of the older tonnage may never return to the industry. Topaz is not in that situation, but for the second year running we had to make a material impairment. Following a one-off charge of Rials 27.3 million (USD 70.9 million) in 2015, we have taken a further one-off charge of Rials 36.5 million (USD 94.8 million) in 2016.
13A N N U A L R E P O R T 2 0 1 6
While we do not take these charges lightly, we draw some solace from being in a far better position than most industry peers. While the loss of value hurts, it is not a cash loss and Topaz EBITDA achievement of USD 145 million underwrites the strength and allows the company to meet all of its financial commitments throughout the prolonged crisis.
This particular bust cycle in oil price has had unprecedented negative impact on the industry – more so than even lower price cycles. This is because when the oil price ranged from USD 100-147 a barrel, the industry embarked on major expansion and development of previously uneconomic oilfields. Readjustment has been painful.
We expect 2017 to be another challenging year. As oil price stabilises, we expect vessel utilisation to improve paving the way for improvement in rates. So whilst we feel further major impairment in 2017 unlikely, we cannot rule out any impact at this stage. But we have reason for cautious optimism while markets reprice oil for the future. The underlying reality is that oil supplies shall have to meet increasing demand at the right price over the years ahead.
STABILITY
The company has been sustained throughout this crisis by a solid foundation of stability: A strong balance sheet; sustainable healthy cash flows; long-term financing arrangements matched with our long-term asset profile; Rials 30 million cash in the balance sheet; fully funded capex programmes; and well managed low counter-party risk.
Central to this financial stability has been the actions taken in anticipation of strong headwinds arising from declining oil prices. The company has in place long-term financial arrangements aligned with our cash flows, our requirements and our obligations. This includes long-term facilities at competitive rates.
All our capex obligations are fully funded, either through equity and loans in place, or through inherent contract terms. This includes the entire capex requirement as we invest for growth in the TCO Project for Topaz and the Renaissance Village Duqm.
While getting paid is a rising concern in the market place, we have been able to sustain the collection of our receivables through the quality and stability of our client-base.
Chairman’s Report
A N N U A L R E P O R T 2 0 1 614
During the year, the company has successfully concluded its negotiations with Standard Chartered Private Equity regarding 9.8% shares held by them in Topaz. The new structure reduces the guaranteed IRR from existing 12% to 8% and extends the deadline within which the liquidity event may occur from 3 to 5/6 years, in return for granting an additional 3.7% equity position in Topaz. This outcome reflects the solid partnership and collaboration between the shareholders allowing the group to tide over the business cycle and protect value in the company.
RELATIONSHIPS
The company is also sustained by the strength of its relationships with all key stakeholders: our clients and customers; our shareholders and bondholders; our bankers and other financial institutions; our professional advisors – legal, auditing, commercial, industry; government, official agencies and institutions; suppliers and service providers; the communities in which we serve; and, of course, our own people.
Our relationships remain as strong as ever, because all of these people recognise and understand the value of our company and our two principal businesses. They understand the temporary nature of the industry crisis; they recognise the stability and strength with which we are meeting all our contractual, legal and financial obligations; and they see the same bright future that lies ahead.
On behalf of the Board of Directors I would like to record our appreciation for all these relationships and their confidence and belief in our company.
FUTURE
We have been sailing under dark skies for these last two years; but we have always had a clear eye on a bright future. This is not based on unfounded optimism; but rather on the relevance and potential of the businesses and markets in which we operate – backed up by a contract backlog of USD 1.6 billion. We also have two major flagship projects in place where the full benefits shall start to flow in 2018.
15A N N U A L R E P O R T 2 0 1 6
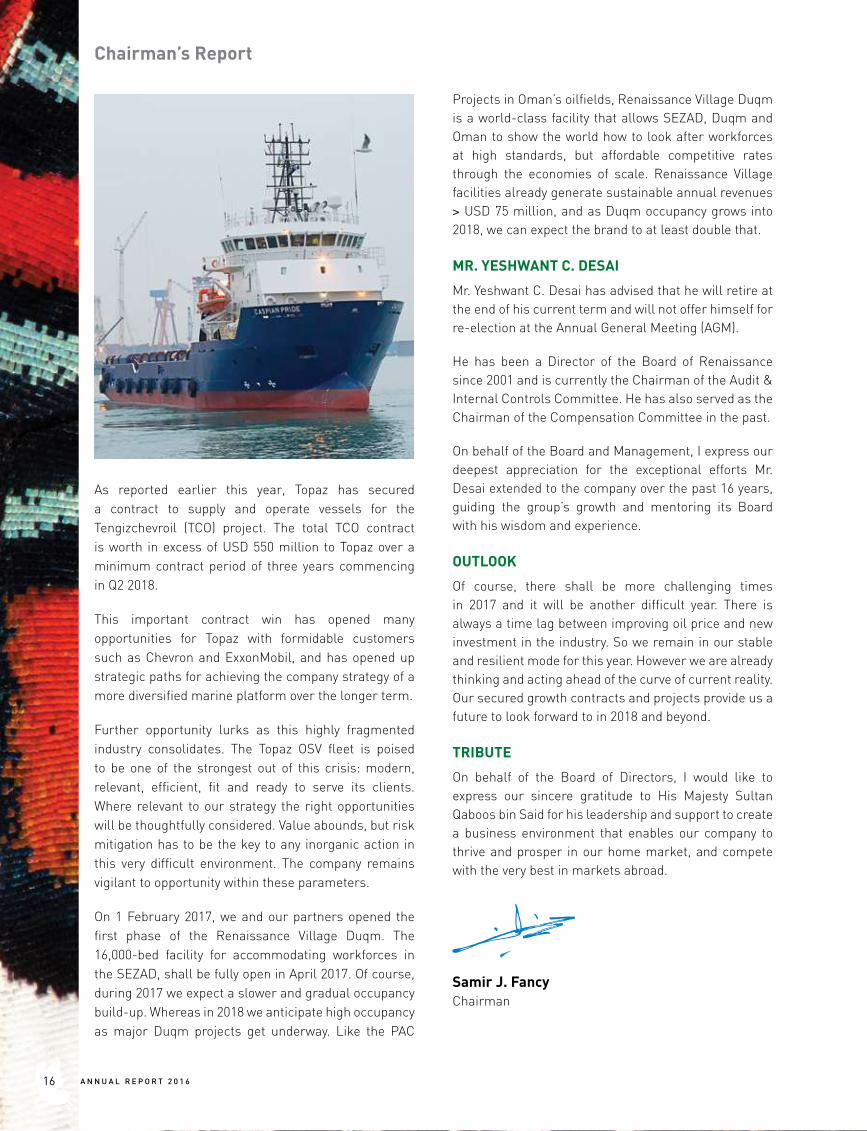
As reported earlier this year, Topaz has secured a contract to supply and operate vessels for the Tengizchevroil (TCO) project. The total TCO contract is worth in excess of USD 550 million to Topaz over a minimum contract period of three years commencing in Q2 2018.
This important contract win has opened many opportunities for Topaz with formidable customers such as Chevron and ExxonMobil, and has opened up strategic paths for achieving the company strategy of a more diversified marine platform over the longer term.
Further opportunity lurks as this highly fragmented industry consolidates. The Topaz OSV fleet is poised to be one of the strongest out of this crisis: modern, relevant, efficient, fit and ready to serve its clients. Where relevant to our strategy the right opportunities will be thoughtfully considered. Value abounds, but risk mitigation has to be the key to any inorganic action in this very difficult environment. The company remains vigilant to opportunity within these parameters.
On 1 February 2017, we and our partners opened the first phase of the Renaissance Village Duqm. The 16,000-bed facility for accommodating workforces in the SEZAD, shall be fully open in April 2017. Of course, during 2017 we expect a slower and gradual occupancy build-up. Whereas in 2018 we anticipate high occupancy as major Duqm projects get underway. Like the PAC
Projects in Oman’s oilfields, Renaissance Village Duqm is a world-class facility that allows SEZAD, Duqm and Oman to show the world how to look after workforces at high standards, but affordable competitive rates through the economies of scale. Renaissance Village facilities already generate sustainable annual revenues > USD 75 million, and as Duqm occupancy grows into 2018, we can expect the brand to at least double that.
MR. YESHWANT C. DESAI
Mr. Yeshwant C. Desai has advised that he will retire at the end of his current term and will not offer himself for re-election at the Annual General Meeting (AGM).
He has been a Director of the Board of Renaissance since 2001 and is currently the Chairman of the Audit & Internal Controls Committee. He has also served as the Chairman of the Compensation Committee in the past.
On behalf of the Board and Management, I express our deepest appreciation for the exceptional efforts Mr. Desai extended to the company over the past 16 years, guiding the group’s growth and mentoring its Board with his wisdom and experience.
OUTLOOK
Of course, there shall be more challenging times in 2017 and it will be another difficult year. There is always a time lag between improving oil price and new investment in the industry. So we remain in our stable and resilient mode for this year. However we are already thinking and acting ahead of the curve of current reality. Our secured growth contracts and projects provide us a future to look forward to in 2018 and beyond.
TRIBUTE
On behalf of the Board of Directors, I would like to express our sincere gratitude to His Majesty Sultan Qaboos bin Said for his leadership and support to create a business environment that enables our company to thrive and prosper in our home market, and compete with the very best in markets abroad.
Samir J. FancyChairman
Chairman’s Report
A N N U A L R E P O R T 2 0 1 616
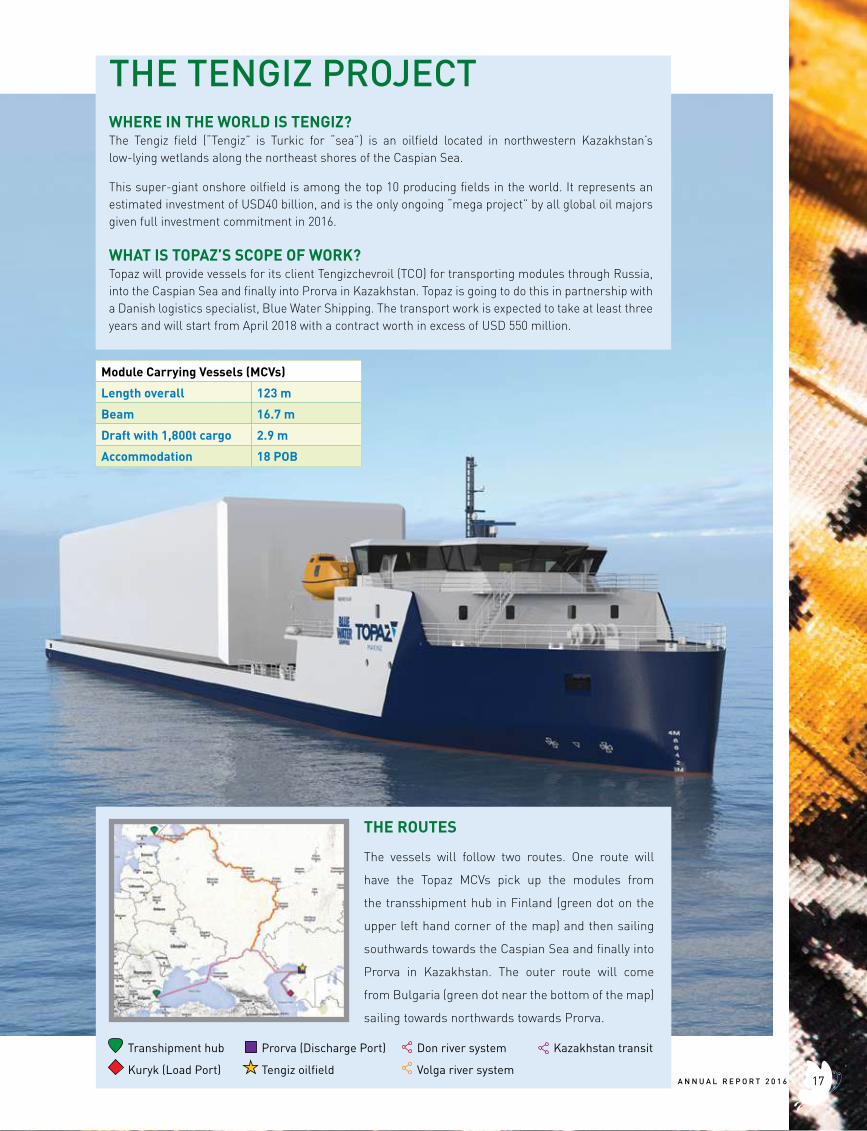
THE ROUTES
The vessels will follow two routes. One route will
have the Topaz MCVs pick up the modules from
the transshipment hub in Finland (green dot on the
upper left hand corner of the map) and then sailing
southwards towards the Caspian Sea and finally into
Prorva in Kazakhstan. The outer route will come
from Bulgaria (green dot near the bottom of the map)
sailing towards northwards towards Prorva.
Transhipment hub
Kuryk (Load Port)
Prorva (Discharge Port)
Tengiz oilfield
Don river system
Volga river system
Kazakhstan transit
WHERE IN THE WORLD IS TENGIZ?The Tengiz field (“Tengiz” is Turkic for “sea”) is an oilfield located in northwestern Kazakhstan’s low-lying wetlands along the northeast shores of the Caspian Sea.
This super-giant onshore oilfield is among the top 10 producing fields in the world. It represents an estimated investment of USD40 billion, and is the only ongoing “mega project” by all global oil majors given full investment commitment in 2016.
WHAT IS TOPAZ’S SCOPE OF WORK?Topaz will provide vessels for its client Tengizchevroil (TCO) for transporting modules through Russia, into the Caspian Sea and finally into Prorva in Kazakhstan. Topaz is going to do this in partnership with a Danish logistics specialist, Blue Water Shipping. The transport work is expected to take at least three years and will start from April 2018 with a contract worth in excess of USD 550 million.
Module Carrying Vessels (MCVs)
Length overall 123 m
Beam 16.7 m
Draft with 1,800t cargo 2.9 m
Accommodation 18 POB
THE TENGIZ PROJECT
17A N N U A L R E P O R T 2 0 1 6

RENAISSANCE FACILITIES MANAGEMENT SERVICES
A N N U A L R E P O R T 2 0 1 618

19A N N U A L R E P O R T 2 0 1 6
CHIEFEXECUTIVE’SREPORT
A N N U A L R E P O R T 2 0 1 620
CEO Report 2016We expect the challenges of 2016 to continue in 2017. Through the coming year we plan prudent efficiency measures and new growth initiatives to improve upon 2016 performance. But we can only forecast more significant improvements in 2018 and 2019; arising principally from two innovative game changing drivers: growth in our strategic investment of RENAISSANCE VILLAGE DUQM in RENAISSANCE; and by realisation of the USD550 million Tengizchevroil (TCO) contract in TOPAZ.
RS GROUP Consolidated
Rial million2015
Audited2016
Audited
Revenue 237.0 206.5
EBITDA 81.5 70.3
PAT (30.0) (39.2)
PATMI (34.8) (42.1)
The group’s consolidated loss performance has been affected by one-off impairment charges on vessels in the Topaz offshore support vessel (OSV) fleet of Rials 36.5 million; following similar charges of Rials 27.3 million last year.
TOPAZTopaz performance excluding one-off charges
Rial million2015
Audited2016
Audited
Revenue 139.5 108.7
Operating Profit 39.9 27.2
PAT 8.0 (2.8)
PATMI (0.6) (11.4)
In recent years the group has restructured, with Topaz operating as an independently managed entity with its own governance structure. As such, Renaissance Board Members and Executive Management carry out fiduciary responsibilities by, with and through our respective roles on the subsidiary Topaz Board and Committees. Topaz Executive Management also attend all Renaissance Board meetings and Audit Committee meetings, to ensure a transparent flow of information, guidance and direction.
From the Renaissance perspective, we continue to offer full support to the Topaz Executive Management Team and appreciate its achievements throughout the oil price crisis that has affected the global OSV industry over the past two years. In spite of the crisis, Topaz continues to out-perform its peers. Topaz has renewed and extended all major long-term contracts, that provide stability and sustainable cash-flows to meet all
21A N N U A L R E P O R T 2 0 1 6
Chief Executive’s Report
the company’s obligations; and has won an innovative substantial contract with Tengizchevroil (TCO) that ensures additional positive growth for the company from 2018.
For further details on this and all other Topaz matters, my colleague the Topaz CEO, produces a detailed report within the Topaz Annual Report, which may be read via the link on the Renaissance website [Link: http://www.topazworld.com/en/investors/reports-presentations]
RENAISSANCE
Rial million 2015Audited
2016Audited
Revenue 97.6 97.8
Operating Profit 9.4 9.1
PAT 5.4 6.0
PATMI 5.4 6.1
While we have seen some improved bottom line performance in 2016 in the RENAISSANCE services businesses, this has been tempered by reduced revenue in the oil & gas sector as the industry adjusts to the re-pricing of oil. Also, the cost of doing business has increased in the oil-reliant economies in which we operate; including our dominant home market of Oman.
For 2017 we are working to increase revenues with targeted new business in contract services, increasing occupancy in Renaissance Villages PDO, a full year of the EMIRATES TASTE business in UAE, and opening the new RENAISSANCE VILLAGE DUQM. This shall be partially offset by a downturn of revenue in Norway, where a number of rigs are laid up, reducing demand for our services.
If we realise our targets for increased revenue in 2017, we do not expect this to be matched by a corresponding ratio increase in PAT. We anticipate increased profitability across all businesses except Norway; and the RENAISSANCE VILLAGE DUQM has planned P&L loss in a year of occupancy build-up, before making an anticipated significant growth contribution in 2018.
In 2017 we anticipate further increases in cost of doing business in our home market of Oman. The impact of mandatory 3% increment for Omani employees, the change in visa fees for expats, and the proposed 3% increase in corporate tax rate to 15%, shall impact costs by Rials 700K in 2017. We may expect other increases from other government departments that charge for a service or administrative process; as well as further reduction in subsidies for utilities and fuel, as the government seeks to increase revenue and reduce costs. We also anticipate an inflationary impact on cost of food commodities this year.
In addition to these external cost pressures, we have also planned an increase in employment costs as we seek to strengthen and enlarge the leadership team, at various levels, for growth and succession; with additional resources in HR, Operations and Business Development.
Increased costs shall of course temper our growth trajectory in what we see as a transition year, while the RENAISSANCE VILLAGE DUQM grows to full-scale operations. However, we remain confident in our ability to grow the business in these difficult times. The same cost pressures that challenge us, also afflict our clients and potential clients. RENAISSANCE offers services that have a proven track record of maintaining or improving standards while driving down costs and creating efficiencies for our clients. In these difficult times our role and potential is significant in the lives of our customer base.
A N N U A L R E P O R T 2 0 1 622
SUSTAINABILITYRENAISSANCE commitment to sustainability underwrites our values and provides the platform of stability and purpose upon which we may drive continuous improvement in service, standards, performance, growth and value.
For further details on our progress and plans in our ENVIRONMENT, SOCIAL RESPONSIBILITY, GOVERNANCE (ESG) agenda and our commitment to QHSE and IN-COUNTRY VALUE (ICV), please refer to our separate Sustainability Report. [Link: http://www.renaissanceoman.com/en/sustainability/]
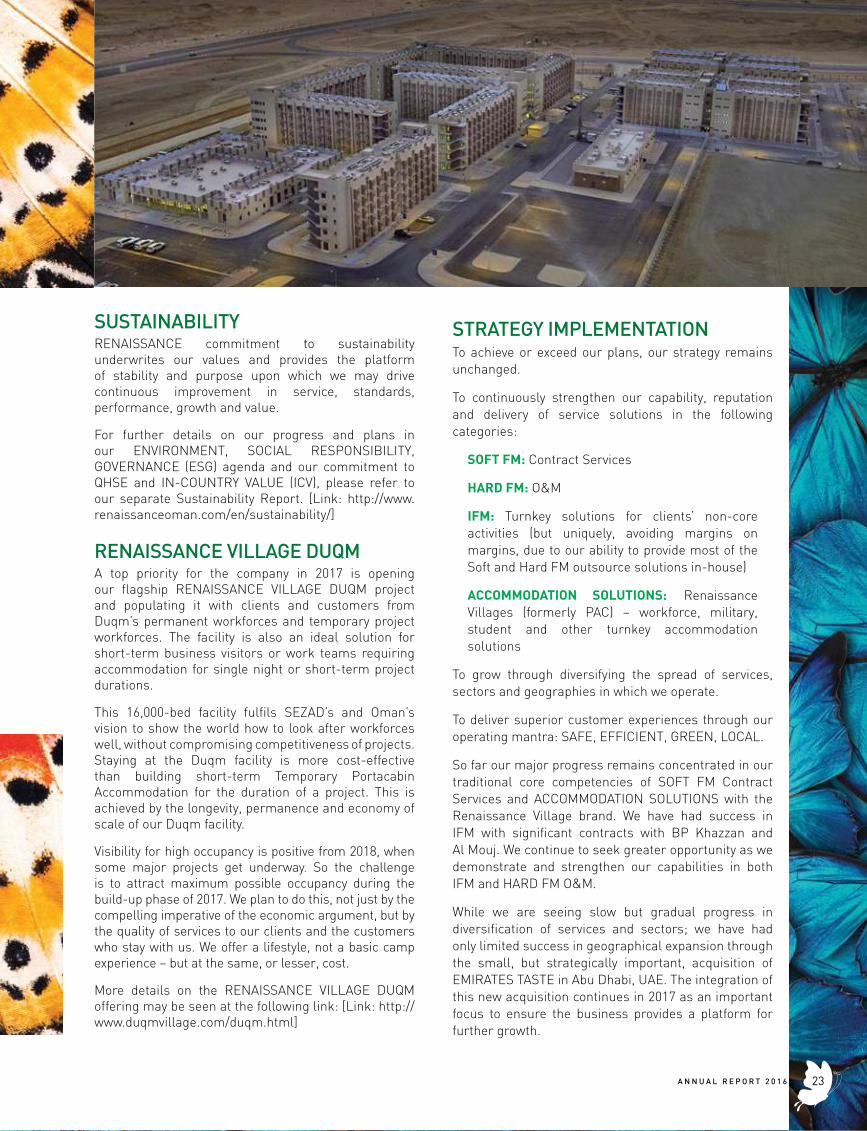
RENAISSANCE VILLAGE DUQMA top priority for the company in 2017 is opening our flagship RENAISSANCE VILLAGE DUQM project and populating it with clients and customers from Duqm’s permanent workforces and temporary project workforces. The facility is also an ideal solution for short-term business visitors or work teams requiring accommodation for single night or short-term project durations.
This 16,000-bed facility fulfils SEZAD’s and Oman’s vision to show the world how to look after workforces well, without compromising competitiveness of projects. Staying at the Duqm facility is more cost-effective than building short-term Temporary Portacabin Accommodation for the duration of a project. This is achieved by the longevity, permanence and economy of scale of our Duqm facility.
Visibility for high occupancy is positive from 2018, when some major projects get underway. So the challenge is to attract maximum possible occupancy during the build-up phase of 2017. We plan to do this, not just by the compelling imperative of the economic argument, but by the quality of services to our clients and the customers who stay with us. We offer a lifestyle, not a basic camp experience – but at the same, or lesser, cost.
More details on the RENAISSANCE VILLAGE DUQM offering may be seen at the following link: [Link: http://www.duqmvillage.com/duqm.html]
STRATEGY IMPLEMENTATIONTo achieve or exceed our plans, our strategy remains unchanged.
To continuously strengthen our capability, reputation and delivery of service solutions in the following categories:
SOFT FM: Contract Services
HARD FM: O&M
IFM: Turnkey solutions for clients’ non-core activities (but uniquely, avoiding margins on margins, due to our ability to provide most of the Soft and Hard FM outsource solutions in-house)
ACCOMMODATION SOLUTIONS: Renaissance Villages (formerly PAC) – workforce, military, student and other turnkey accommodation solutions
To grow through diversifying the spread of services, sectors and geographies in which we operate.
To deliver superior customer experiences through our operating mantra: SAFE, EFFICIENT, GREEN, LOCAL.
So far our major progress remains concentrated in our traditional core competencies of SOFT FM Contract Services and ACCOMMODATION SOLUTIONS with the Renaissance Village brand. We have had success in IFM with significant contracts with BP Khazzan and Al Mouj. We continue to seek greater opportunity as we demonstrate and strengthen our capabilities in both IFM and HARD FM O&M.
While we are seeing slow but gradual progress in diversification of services and sectors; we have had only limited success in geographical expansion through the small, but strategically important, acquisition of EMIRATES TASTE in Abu Dhabi, UAE. The integration of this new acquisition continues in 2017 as an important focus to ensure the business provides a platform for further growth.
23A N N U A L R E P O R T 2 0 1 6
In 2017 we anticipate 85% of Revenue and 87% of PAT to come from Oman. A number that is likely to grow in subsequent years with higher occupancy growth in RENAISSANCE VILLAGE DUQM. So, we are directing more focus and resources to ensure greater geographical expansion in neighbouring markets.
We continue to work at growing our HARD FM capability and building on our breakthrough into services in the Utilities sector. We have been competing for major waste management opportunities, in JV with international expertise, but so far without success. We still believe this is a potential growth area for the company.
While we would have wished to have greater success in our diversification efforts, we shall continue to vigorously pursue opportunity in our traditional areas of competence. What we have achieved is the establishment of an IFM track record, and we are now pre-qualified and actively bidding on a much larger stage of IFM and HARD FM opportunities. We are learning lessons from each new diversification effort and experience; and these shall translate into new success in time.
STRATEGIES FOR GROWTHWhile we have plans and initiatives in play for all aspects of our business, it is appropriate we provide some headline comments on our strategies for growth within the context of our overall strategy.
Growth through contract tendering
This is what improves our ROE as pure services business requires minimum capital investment, when we provide the services within client-owned facilities. Margins are usually very tight in this type of business – and this is a factor across all GCC markets. We have identified some specific major tender targets for 2017. If successful, there would be some positive impact in 2017, with full benefit flowing into the years that follow.
Growth through supplementary services
In each of our contracts and in our Renaissance Villages, we make every effort to provide other supplementary services either to the client or the individual customers, within the confines of the facility. This enhances the offering to our customer-base as well as bringing increased revenue to our business.
Chief Executive’s Report
A N N U A L R E P O R T 2 0 1 624
Growth through value innovation
One example of value innovation is our ACCOMMODATION SOLUTIONS in the form of the Renaissance Village brand. These deliver higher standards at lower costs through economies of scale. But an independent survey conducted by Shell some years ago also proved that these permanent facilities deliver additional tangible and intangible value, including: less consumption of water and electricity through quality of permanent infrastructure; better safety performance and lower downtime of absence through sickness.
We have Renaissance Villages which we own 100% in the oilfields; and RENAISSANCE VILLAGE DUQM which we own 51% with valued strategic partners investing in the balance 49%.
We are developing a win-win formula for future initiatives where up to 100% of the property (PROPCO) may be owned by investors; while securing longevity for RENAISSANCE as the operator (OPCO) in exchange for our intellectual property in developing the concept from design to operation.
We are also working on developing the thinking of some clients in terms of how they outsource their services in packaged cyclical tendering for individual services; rather than considering the full IFM cost-efficiency approach. In this regard, we are uniquely placed to offer solutions due to our ability to deliver at both the IFM level and self-perform at the SOFT & HARD FM levels; so avoiding margins on margins for our clients.
We are also looking at how we may innovate the delivery of some of our services; migrating from physical energy (people) to mechanical energy (plant, equipment and technology) to drive both standards and efficiency; and upgrade the attractiveness of jobs for Omanis.
Growth through investment
Of course some of the accommodation projects shall require investment for growth. We are looking at potential expansion of our RENAISSANCE VILLAGE DUQM in the years ahead, as well as a complimentary Beach Club Facility.
Our investment in Warehousing, Cold Storage and Logistics capability in our Central Stores in Mabela is already paying dividends in driving down our costs, increasing our buying-power and enhancing our logistics and supplies offering. The investment in Warehousing and Cold Storage in Duqm is also intended to create scale and value in this capability in the future.
Growth through merger & acquisition (M&A)
This same approach is taken in the prospect of achieving further growth through merger and/or acquisition, beyond the recent EMIRATES TASTE acquisition. Again, we continue to react to opportunities when they arise; but we do not have any specific M&A target in view at this time.
Growth through diversification
This is of course an integral part of the overall strategy (to diversify our services, our sectors and our geography). We are continuing to compete for utility services, waste management and HARD FM opportunities. Oil & Gas, Healthcare, Education, Defence and Industry are sectors in which we excel; and these shall remain a core part of our growing client base. We are exploring in what ways we may provide more services and add greater value in other key sectors, including: Ports & Airports; Logistics; Manufacturing; Tourism; and Agriculture & Fisheries.
ORGANISATION CAPABILITY TO EXECUTE THE STRATEGYA strategic HR focus is essential to ensure we have the leadership and skill sets at every level of the organisation to execute our strategy. We are seeking to make some important new appointments in 2017, aligned with our diversification and growth ambitions.
In addition to our ISO 9001, HACCP and ISO 22000 certification, for 2017 we have planned ISO 14001 certification for our Environment impact processes and OHSAS 18001 to further strengthen our Safety system.
DIVIDEND RECORDThe Renaissance Dividend Policy is based on the proposition that cash is returned to shareholders in the form of higher dividend pay-outs when there are no credible value creating opportunities to invest in the business.
In 2016 our Board is proposing no dividend, as it is important to maintain the cash position of the company through this period of uncertainty in oil markets. We look forward to restoring a practice of regular dividend payments, as soon as practicable.
25A N N U A L R E P O R T 2 0 1 6
Chief Executive’s Report
2012 2013 2014 2015 2016
% Rial’000 % Rial’000 % Rial’000 % Rial’000 % Rial’000
Cash dividend - - 10 2,821 10 2,821 - - - -
Stock dividend - - - - - - - - - -
Total dividend - - 10 2,821 10 2,821 - - - -
RISKS
Political
Our core ‘home’ markets are politically stable.
Economic
Prospects of a stronger oil price and evidence that reforms in regional economies are taking place, should eventually lead to higher revenues and controlled spending. These facts are improving overall outlook for the region over the medium term, but we must expect further reticence and austerity in 2017, and cautious improvement from 2018.
GCC economies are introducing VAT in 2018. This will generate revenue and impact the economy; but it will also have a cost impact on private sector businesses, inflation and reduced consumer spending.
Overall, for 2017 as in 2016, the oil and gas reliant markets and economies in which we operate remain mired in a deep austerity crisis, in spite of the recent OPEC and Non-OPEC output deal and improvement in oil price.
There are common themes still at play for governments in the geographies where we serve: Tight fiscal discipline, significant cutbacks in public expenditure, increases in taxation, increases in fees for government services and administration, removal of government subsidies, and merger and down-sizing of government departments and government-owned companies.
For us this means the same as last year: Clients are spending less and demanding more. A fact we must strive to convert into opportunity rather than hindrance.
Social
The social fabric in our core home markets are strong. One key factor is to ensure success in initiatives to develop an effective and productive workforce. Within our own company our ICV and CSR programmes play an important role in this vital objective in all the communities in which we operate.
Technological
We must consider technological developments at three levels: Our markets; our industry and our own internal systems and processes. We see we have room for further improvement but recognising this we do not see an inherent risk.
Environmental
We continue to make progress every year in reducing our carbon footprint and significantly reducing food waste.
Legal
We maintain a robust governance structure and control of all contractual, legal and moral obligations and apply strong assurance processes to ensure compliance.
OUTLOOKThe delay in some key Duqm projects means 2017 shall be a build-up year for our own project. The good news is the outlook is positive for Duqm as a project of national importance and the catalyst shall be award of the Refinery EPC packages by mid-2017.
While we shall achieve underlying growth in 2017, the impact shall be eroded by the increased costs of doing business; and our own investment in resources for growth and succession. But we then look forward with confidence to improved performance in 2018 and 2019 driven by our RENAISSANCE VILLAGE DUQM. This shall be supplemented by increasing success in our broader strategy implementation.
Stephen R. Thomas OBECEO
A N N U A L R E P O R T 2 0 1 626
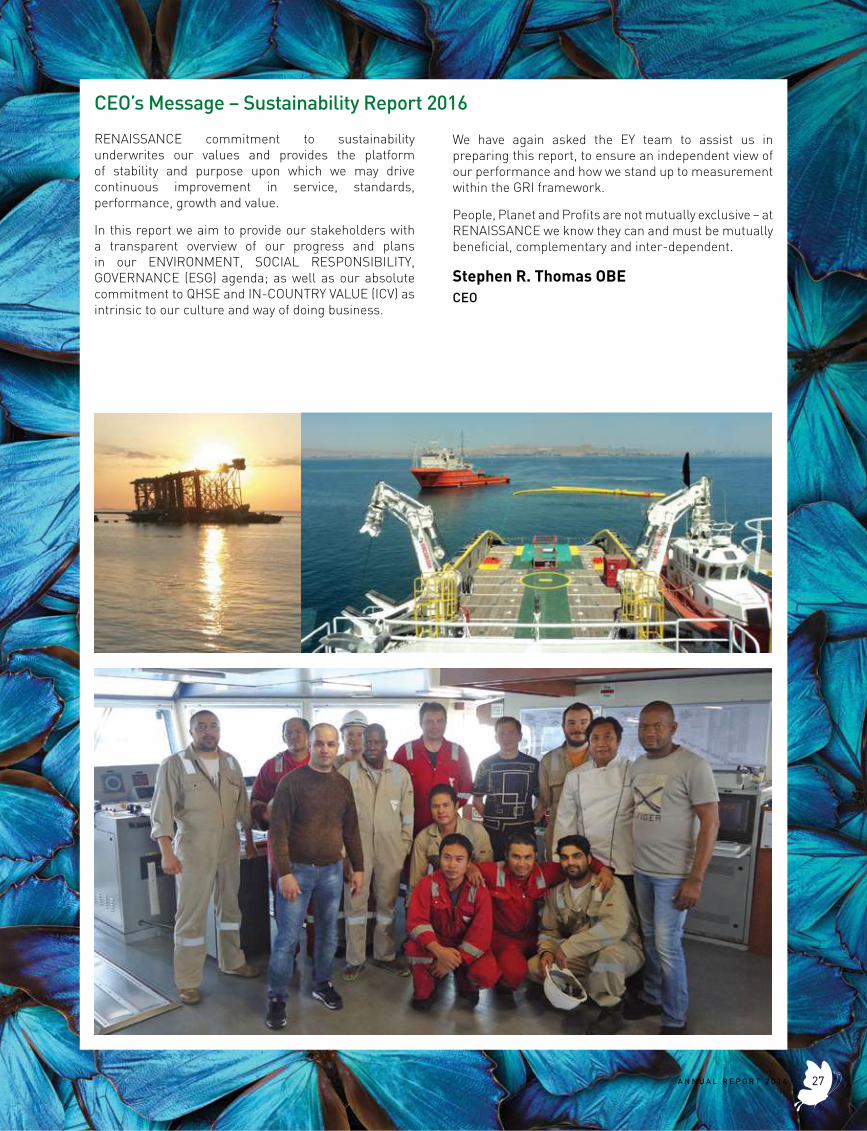
CEO’s Message – Sustainability Report 2016
RENAISSANCE commitment to sustainability underwrites our values and provides the platform of stability and purpose upon which we may drive continuous improvement in service, standards, performance, growth and value.
In this report we aim to provide our stakeholders with a transparent overview of our progress and plans in our ENVIRONMENT, SOCIAL RESPONSIBILITY, GOVERNANCE (ESG) agenda; as well as our absolute commitment to QHSE and IN-COUNTRY VALUE (ICV) as intrinsic to our culture and way of doing business.
We have again asked the EY team to assist us in preparing this report, to ensure an independent view of our performance and how we stand up to measurement within the GRI framework.
People, Planet and Profits are not mutually exclusive – at RENAISSANCE we know they can and must be mutually beneficial, complementary and inter-dependent.
Stephen R. Thomas OBECEO
27A N N U A L R E P O R T 2 0 1 6
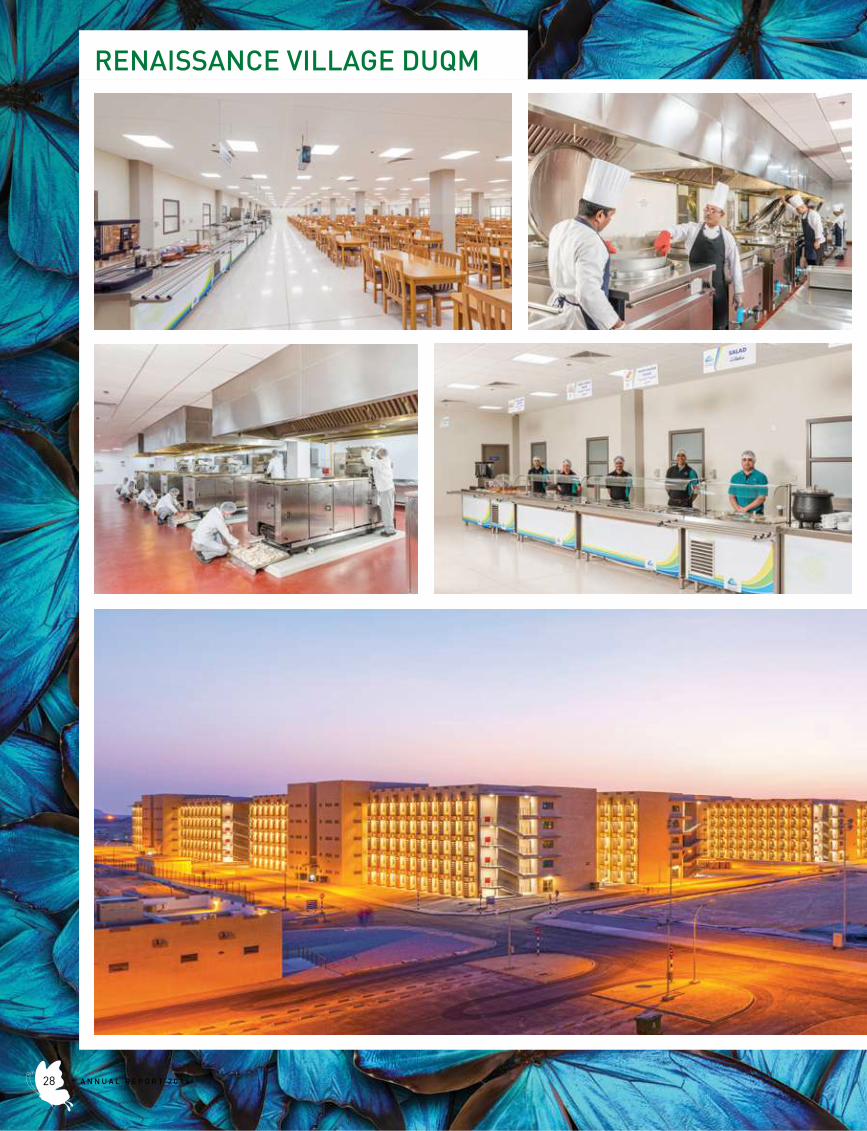
RENAISSANCE VILLAGE DUQM
A N N U A L R E P O R T 2 0 1 628
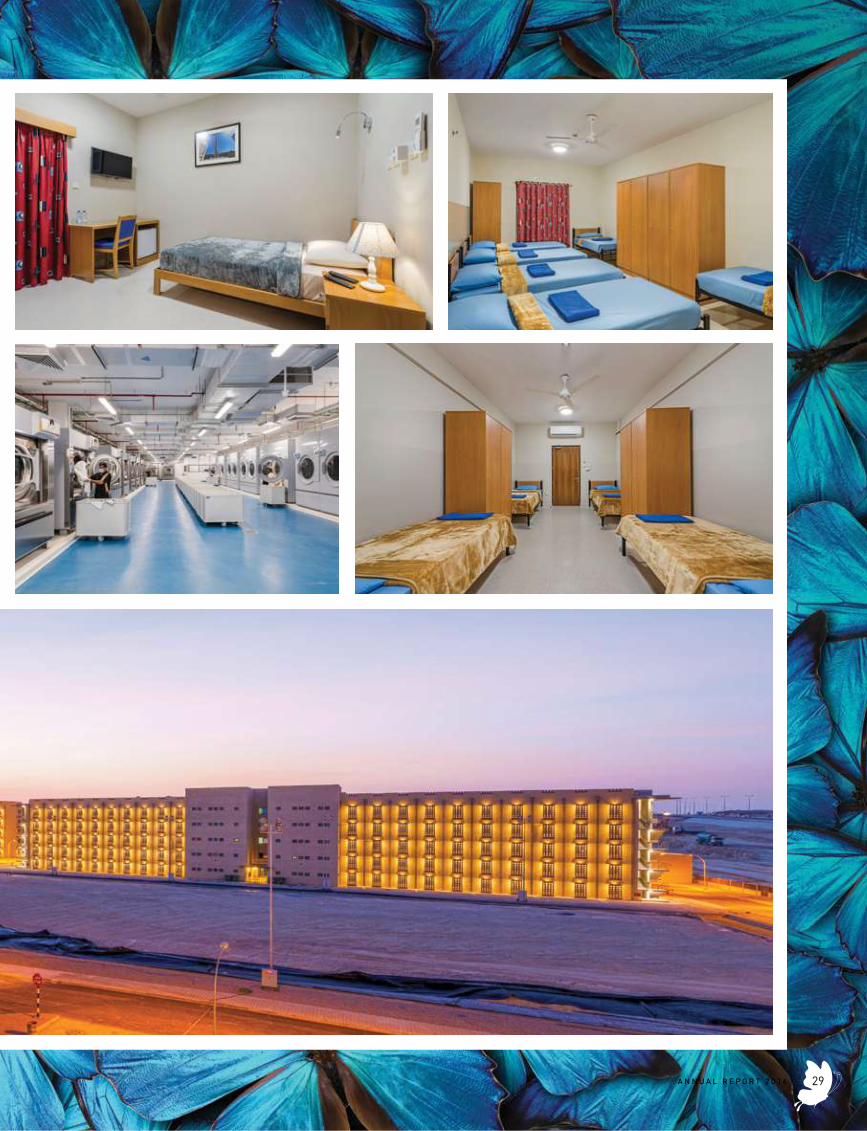
29A N N U A L R E P O R T 2 0 1 6
Sohar International Urea and Chemical Industries
Renaissance Customers include the following
Chief Executive’s Report
A N N U A L R E P O R T 2 0 1 630
31A N N U A L R E P O R T 2 0 1 6
REPORT ON CORPORATE GOVERNANCECorporate governance is an internal system encompassing policies, processes and people, which serves the needs of shareholders and other stakeholders, by directing and controlling management activities with good business savvy, objectivity, accountability and integrity. Sound corporate governance is not only about structure and clarity in management and areas of responsibility, but it also encourages good transparency so that shareholders can understand and monitor the development of the company.
The Board and the Management of Renaissance Services SAOG (the “Company”) are committed to adopt the best practices of corporate governance that promote ethical standards and individual integrity. The Company will continue to focus on its resources, strengths and strategies for creating, safeguarding and enhancing shareholders’ value while at the same time protecting the interests of its stakeholders.
This report illustrates how the Principles of Corporate Governance and the provisions of the Code of Corporate Governance, set out in the Capital Market Authority’s (CMA) Code of Corporate Governance for companies listed on the Muscat Securities Market (MSM), and the Provisions for Disclosure stipulated in the Executive Regulations of the Capital Market Law, are adhered to by the Company.
The Company believes that the Code prescribes a minimum framework for governance of a business. The Company’s philosophy is to develop this minimum framework and institutionalise its principles as an ingredient of its corporate culture. This will lay the foundation for further development of a model of governance with superior governance practices, which are vital for growing a successful business. The Company recognises that transparency, disclosure, financial controls and accountability are the pillars of any good system of corporate governance.
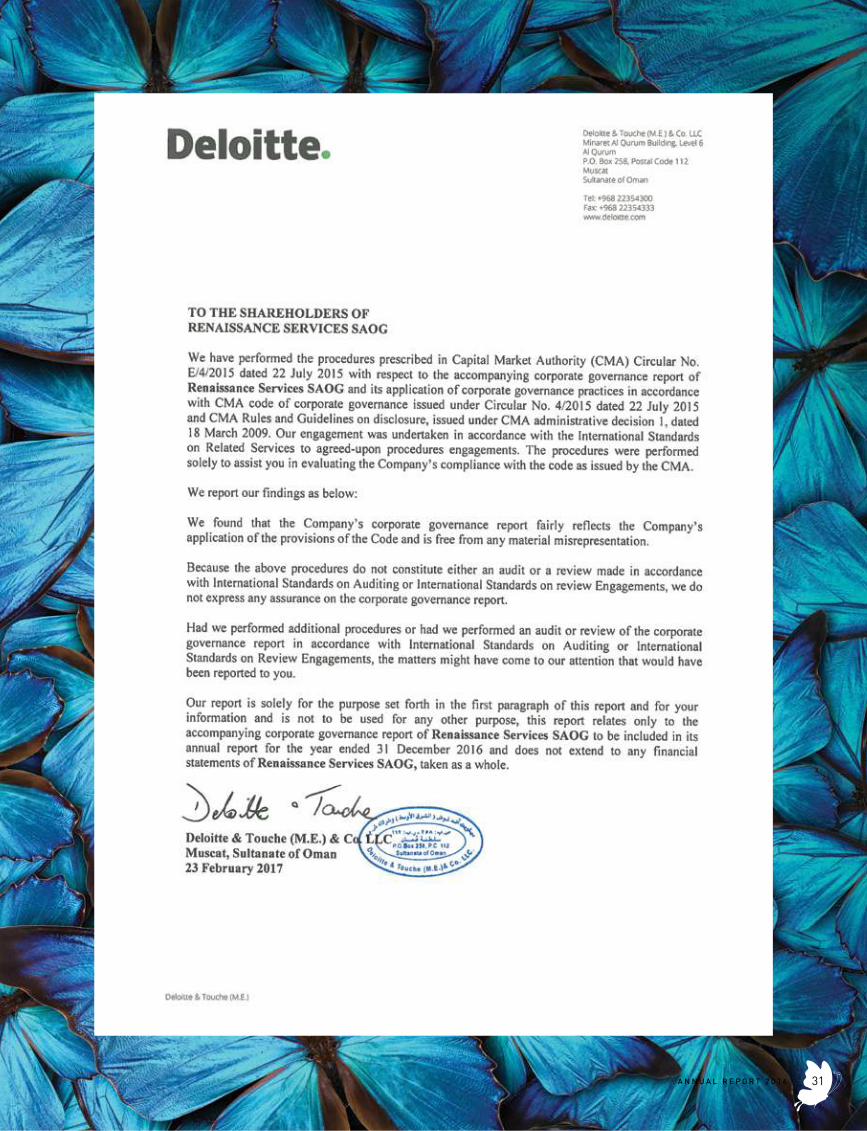
In accordance with the Provision for Disclosure stipulated in the Executive Regulation of the Capital Market Law, Deloitte & Touche (M.E.) has issued a separate Factual Findings Report on the Company’s Corporate Governance Report for the year ended 31 December 2016.
1. New Code of Corporate GovernanceThe Capital Market Authority circulated a new Code of Corporate Governance (the ‘Code’) for public joint stock companies, which came into force and effect as of July 2016. The new Code replaced the 2003 Code of Corporate Governance for Public Listed Companies (‘the Old Code’).
The Company has applied the principles of the Code
and is fully compliant with its provisions.
Since the introduction of the Code, the Company has implemented the following provisions including but not limited to:
- Updated existing/developed new company policies to ensure compliance with the Code;
- Renamed the Board Sub-Committees;- Pre-approved all related party transactions in the
ordinary course of business by the Audit and Internal Controls Committee and Board;
- Complied with the provisions of the Code relating to conduct of Board meetings;
- Measured the performance of the Board Sub-committees in 2016;
- Initiated the process of appointing an independent consultant to develop criteria for measuring the performance of the Board and Sub-committees in 2017;
- Conducted corporate governance training for the Board and Executive Management.
As of the date of this report, the provisions of the Code relating to the independence of the Directors do not apply. The CMA issued guidance on the provisions relating to the independence of Directors, clarifying that these provisions will only apply upon election of a new Board. As the Board of Directors were last elected in March 2014, the provisions will apply from March 2017 at the next Board elections. All Board members are therefore currently considered independent until a new Board has been elected in March 2017, at which point the new Board of Directors will be constituted in accordance with the provisions in the Code relating to independence of Directors.
2. Company’s PhilosophyThe Company upholds a governance philosophy that aims at enhancing long term shareholder value while at the same time adheres to the law and observes the ethical standards of the business environment within which it operates.
According to the Company’s governance paradigm the management assumes accountability to the Board, and the Board assumes accountability to the Shareholders. The Board’s role is to be an active participant and a decision-maker in fostering the overall success of the Company by enhancing shareholder value, selecting and evaluating the top management team, approving and overseeing the corporate strategy and management’s business plan, and acting as a resource for management in matters of planning and policy.
A N N U A L R E P O R T 2 0 1 632
The Board monitors corporate performance against the strategic and business plans, and evaluates on a regular basis whether those plans pay off in terms of operating results.
In order that it can effectively discharge its governance responsibilities, the Board ensures that all Board members are non-executive.
Furthermore, the Board accesses independent legal and expert advice of professionals who also assist the management. The Board also encourages active participation and decision making on the part of shareholders in General Meeting proceedings.
The Board maintains a positive and ethical work environment that is conducive to attracting, retaining and motivating a diverse group of top quality employees at all levels. The Board, through the Nomination and Remuneration Committee, reviews and decides the parameters for assessment and compensation of key personnel.
The Board abides by ethical behaviour principles at all times. It ensures that the Company complies with all laws and regulations and has developed a Code of Ethics that promotes these values among its employees. The Company has also developed a comprehensive number of policies to ensure compliance with the requirements of the new Code of Corporate Governance, as well as updated its policies in existence prior to the introduction of the new code. These policies include, but are not limited to, Audit and Internal Controls Committee Policy, Rules for Related Party Transactions, Disclosure Guidelines, Corporate Social Responsibility Policy, Conflict of Interest Policy, Board Secretarial Duties, Auditor Consultancy Policy and a number of other policies.
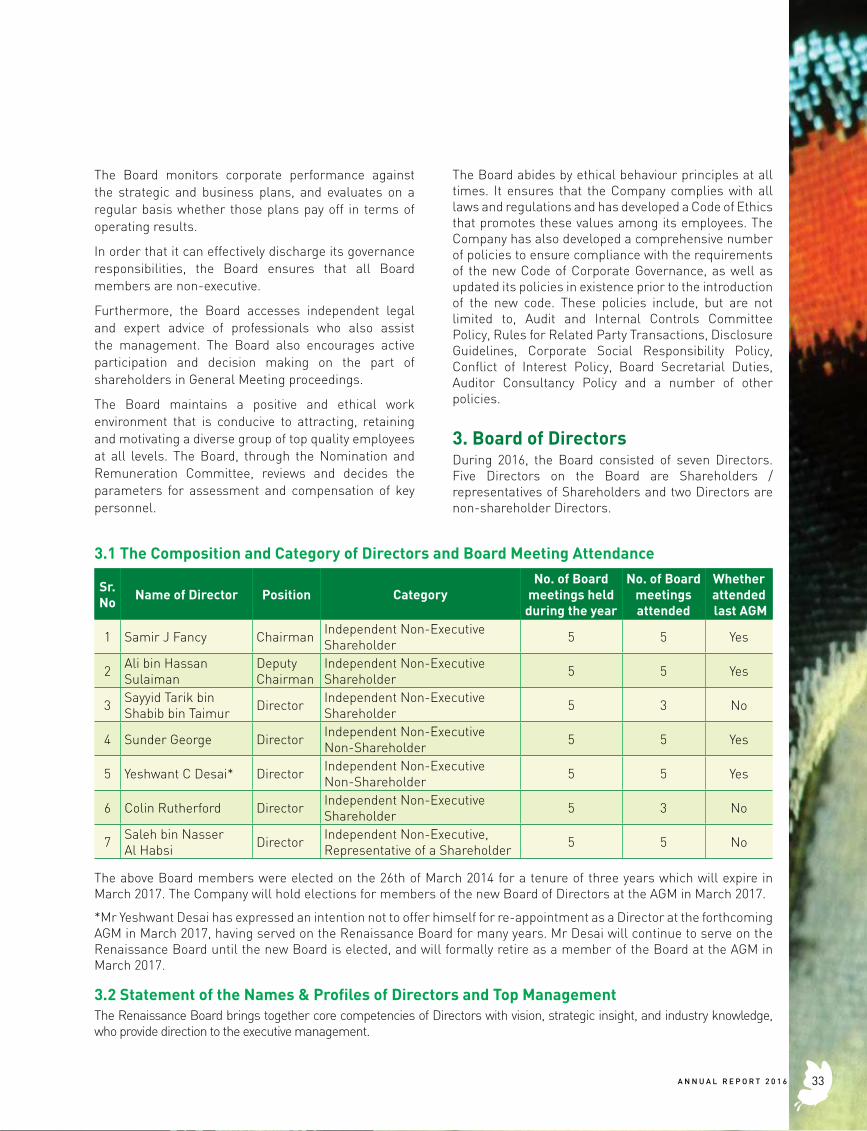
3. Board of Directors During 2016, the Board consisted of seven Directors. Five Directors on the Board are Shareholders / representatives of Shareholders and two Directors are non-shareholder Directors.
3.1 The Composition and Category of Directors and Board Meeting Attendance
Sr. No Name of Director Position Category
No. of Board meetings held
during the year
No. of Board meetings attended
Whether attended last AGM
1 Samir J Fancy Chairman Independent Non-Executive Shareholder 5 5 Yes
2 Ali bin Hassan Sulaiman
Deputy Chairman
Independent Non-Executive Shareholder 5 5 Yes
3 Sayyid Tarik bin Shabib bin Taimur Director Independent Non-Executive
Shareholder 5 3 No
4 Sunder George Director Independent Non-Executive Non-Shareholder 5 5 Yes
5 Yeshwant C Desai* Director Independent Non-Executive Non-Shareholder 5 5 Yes
6 Colin Rutherford Director Independent Non-Executive Shareholder 5 3 No
7 Saleh bin Nasser Al Habsi Director Independent Non-Executive,
Representative of a Shareholder 5 5 No
The above Board members were elected on the 26th of March 2014 for a tenure of three years which will expire in March 2017. The Company will hold elections for members of the new Board of Directors at the AGM in March 2017.
*Mr Yeshwant Desai has expressed an intention not to offer himself for re-appointment as a Director at the forthcoming AGM in March 2017, having served on the Renaissance Board for many years. Mr Desai will continue to serve on the Renaissance Board until the new Board is elected, and will formally retire as a member of the Board at the AGM in March 2017.
3.2 Statement of the Names & Profiles of Directors and Top Management The Renaissance Board brings together core competencies of Directors with vision, strategic insight, and industry knowledge, who provide direction to the executive management.
33A N N U A L R E P O R T 2 0 1 6
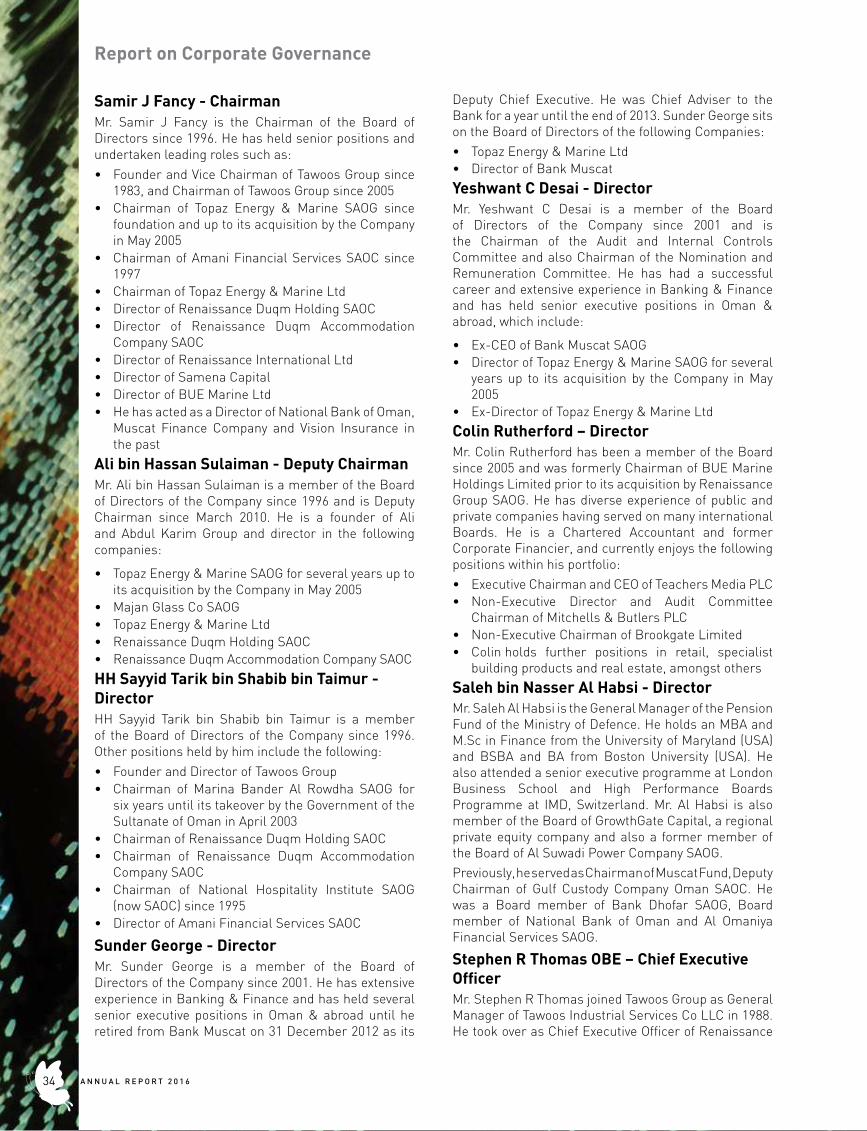
Samir J Fancy - ChairmanMr. Samir J Fancy is the Chairman of the Board of Directors since 1996. He has held senior positions and undertaken leading roles such as:• Founder and Vice Chairman of Tawoos Group since
1983, and Chairman of Tawoos Group since 2005• Chairman of Topaz Energy & Marine SAOG since
foundation and up to its acquisition by the Company in May 2005
• Chairman of Amani Financial Services SAOC since 1997
• Chairman of Topaz Energy & Marine Ltd• Director of Renaissance Duqm Holding SAOC• Director of Renaissance Duqm Accommodation
Company SAOC• Director of Renaissance International Ltd• Director of Samena Capital• Director of BUE Marine Ltd• He has acted as a Director of National Bank of Oman,
Muscat Finance Company and Vision Insurance in the past
Ali bin Hassan Sulaiman - Deputy Chairman Mr. Ali bin Hassan Sulaiman is a member of the Board of Directors of the Company since 1996 and is Deputy Chairman since March 2010. He is a founder of Ali and Abdul Karim Group and director in the following companies:
• Topaz Energy & Marine SAOG for several years up to its acquisition by the Company in May 2005
• Majan Glass Co SAOG• Topaz Energy & Marine Ltd• Renaissance Duqm Holding SAOC• Renaissance Duqm Accommodation Company SAOC
HH Sayyid Tarik bin Shabib bin Taimur - DirectorHH Sayyid Tarik bin Shabib bin Taimur is a member of the Board of Directors of the Company since 1996. Other positions held by him include the following: • Founder and Director of Tawoos Group• Chairman of Marina Bander Al Rowdha SAOG for
six years until its takeover by the Government of the Sultanate of Oman in April 2003
• Chairman of Renaissance Duqm Holding SAOC• Chairman of Renaissance Duqm Accommodation
Company SAOC• Chairman of National Hospitality Institute SAOG
(now SAOC) since 1995• Director of Amani Financial Services SAOC
Sunder George - DirectorMr. Sunder George is a member of the Board of Directors of the Company since 2001. He has extensive experience in Banking & Finance and has held several senior executive positions in Oman & abroad until he retired from Bank Muscat on 31 December 2012 as its
Deputy Chief Executive. He was Chief Adviser to the Bank for a year until the end of 2013. Sunder George sits on the Board of Directors of the following Companies: • Topaz Energy & Marine Ltd• Director of Bank Muscat
Yeshwant C Desai - DirectorMr. Yeshwant C Desai is a member of the Board of Directors of the Company since 2001 and is the Chairman of the Audit and Internal Controls Committee and also Chairman of the Nomination and Remuneration Committee. He has had a successful career and extensive experience in Banking & Finance and has held senior executive positions in Oman & abroad, which include:
• Ex-CEO of Bank Muscat SAOG• Director of Topaz Energy & Marine SAOG for several
years up to its acquisition by the Company in May 2005
• Ex-Director of Topaz Energy & Marine Ltd
Colin Rutherford – DirectorMr. Colin Rutherford has been a member of the Board since 2005 and was formerly Chairman of BUE Marine Holdings Limited prior to its acquisition by Renaissance Group SAOG. He has diverse experience of public and private companies having served on many international Boards. He is a Chartered Accountant and former Corporate Financier, and currently enjoys the following positions within his portfolio:• Executive Chairman and CEO of Teachers Media PLC• Non-Executive Director and Audit Committee
Chairman of Mitchells & Butlers PLC• Non-Executive Chairman of Brookgate Limited• Colin holds further positions in retail, specialist
building products and real estate, amongst others
Saleh bin Nasser Al Habsi - DirectorMr. Saleh Al Habsi is the General Manager of the Pension Fund of the Ministry of Defence. He holds an MBA and M.Sc in Finance from the University of Maryland (USA) and BSBA and BA from Boston University (USA). He also attended a senior executive programme at London Business School and High Performance Boards Programme at IMD, Switzerland. Mr. Al Habsi is also member of the Board of GrowthGate Capital, a regional private equity company and also a former member of the Board of Al Suwadi Power Company SAOG. Previously, he served as Chairman of Muscat Fund, Deputy Chairman of Gulf Custody Company Oman SAOC. He was a Board member of Bank Dhofar SAOG, Board member of National Bank of Oman and Al Omaniya Financial Services SAOG.
Stephen R Thomas OBE – Chief Executive OfficerMr. Stephen R Thomas joined Tawoos Group as General Manager of Tawoos Industrial Services Co LLC in 1988. He took over as Chief Executive Officer of Renaissance
Report on Corporate Governance
A N N U A L R E P O R T 2 0 1 634
Services SAOG in 1998. In the 2010 United Kingdom New Year’s Honours List, Mr. Thomas was appointed an Officer of the Most Excellent Order of the British Empire (OBE) for services to business abroad and services to the community in Oman. He also held senior positions in the Group including the following positions:• Director of Renaissance Hospitality Services
SAOG since foundation and until its merger with Renaissance Services SAOG in April 2002
• Founder and former Chairman of Oman Society for Petroleum Services (“OPAL”)
• Director of Topaz Energy & Marine Ltd
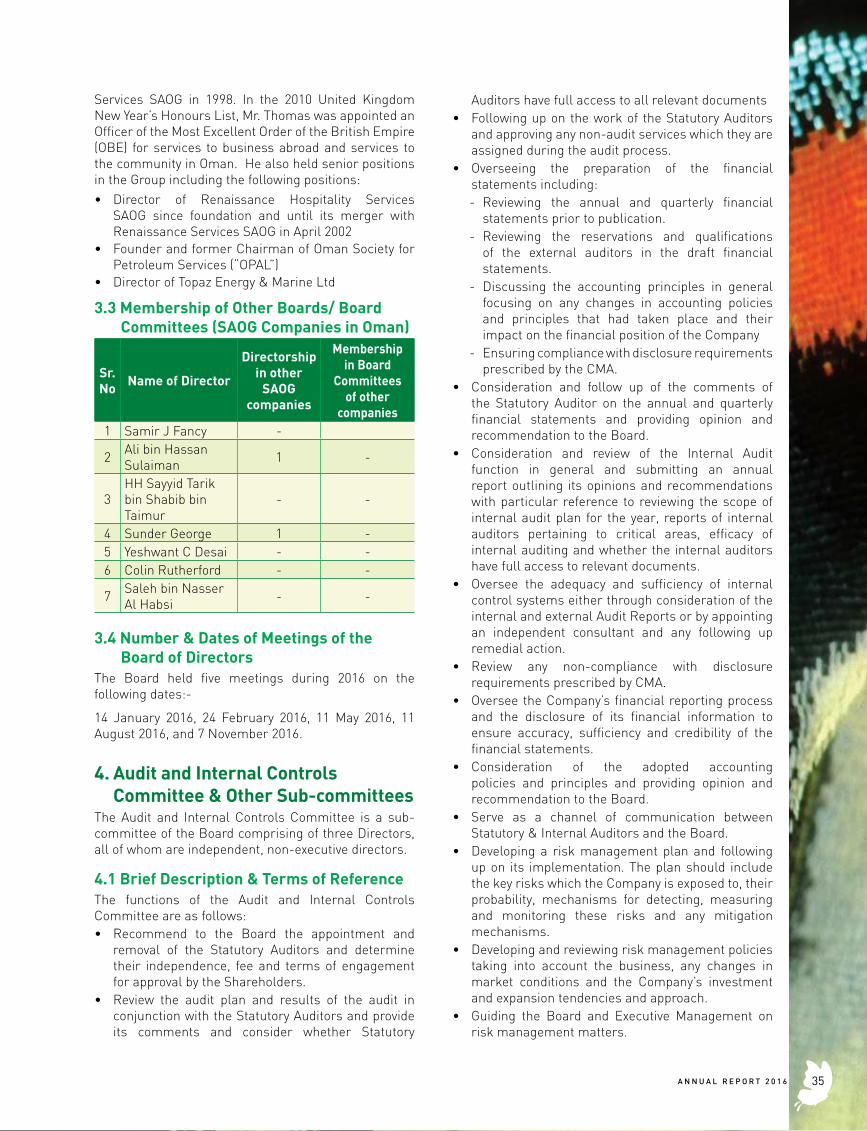
3.3 Membership of Other Boards/ Board Committees (SAOG Companies in Oman)
Sr. No Name of Director
Directorship in other
SAOG companies
Membership in Board
Committees of other
companies1 Samir J Fancy -
2 Ali bin Hassan Sulaiman 1 -
3HH Sayyid Tarik bin Shabib bin Taimur
- -
4 Sunder George 1 -5 Yeshwant C Desai - -6 Colin Rutherford - -
7 Saleh bin Nasser Al Habsi - -
3.4 Number & Dates of Meetings of the Board of Directors
The Board held five meetings during 2016 on the following dates:-
14 January 2016, 24 February 2016, 11 May 2016, 11 August 2016, and 7 November 2016.
4. Audit and Internal Controls Committee & Other Sub-committees
The Audit and Internal Controls Committee is a sub-committee of the Board comprising of three Directors, all of whom are independent, non-executive directors.
4.1 Brief Description & Terms of Reference The functions of the Audit and Internal Controls Committee are as follows:• Recommend to the Board the appointment and
removal of the Statutory Auditors and determine their independence, fee and terms of engagement for approval by the Shareholders.
• Review the audit plan and results of the audit in conjunction with the Statutory Auditors and provide its comments and consider whether Statutory
Auditors have full access to all relevant documents • Following up on the work of the Statutory Auditors
and approving any non-audit services which they are assigned during the audit process.
• Overseeing the preparation of the financial statements including:
- Reviewing the annual and quarterly financial statements prior to publication.
- Reviewing the reservations and qualifications of the external auditors in the draft financial statements.
- Discussing the accounting principles in general focusing on any changes in accounting policies and principles that had taken place and their impact on the financial position of the Company
- Ensuring compliance with disclosure requirements prescribed by the CMA.
• Consideration and follow up of the comments of the Statutory Auditor on the annual and quarterly financial statements and providing opinion and recommendation to the Board.
• Consideration and review of the Internal Audit function in general and submitting an annual report outlining its opinions and recommendations with particular reference to reviewing the scope of internal audit plan for the year, reports of internal auditors pertaining to critical areas, efficacy of internal auditing and whether the internal auditors have full access to relevant documents.
• Oversee the adequacy and sufficiency of internal control systems either through consideration of the internal and external Audit Reports or by appointing an independent consultant and any following up remedial action.
• Review any non-compliance with disclosure requirements prescribed by CMA.
• Oversee the Company’s financial reporting process and the disclosure of its financial information to ensure accuracy, sufficiency and credibility of the financial statements.
• Consideration of the adopted accounting policies and principles and providing opinion and recommendation to the Board.
• Serve as a channel of communication between Statutory & Internal Auditors and the Board.
• Developing a risk management plan and following up on its implementation. The plan should include the key risks which the Company is exposed to, their probability, mechanisms for detecting, measuring and monitoring these risks and any mitigation mechanisms.
• Developing and reviewing risk management policies taking into account the business, any changes in market conditions and the Company’s investment and expansion tendencies and approach.
• Guiding the Board and Executive Management on risk management matters.
35A N N U A L R E P O R T 2 0 1 6
• Reporting periodically, or as directed by the Board, on the risk status and management.
• Review proposed related party transactions and providing appropriate recommendations to the Board.
• Validating and verifying the overall efficiency of Executive Management in implementing operational directives and guidelines set up by the Board.
• Creating policies for safeguarding the Company’s human, material and intellectual resources and assets.
• Seek the assistance of any other entity on a consultancy basis to assist it to perform its duties.
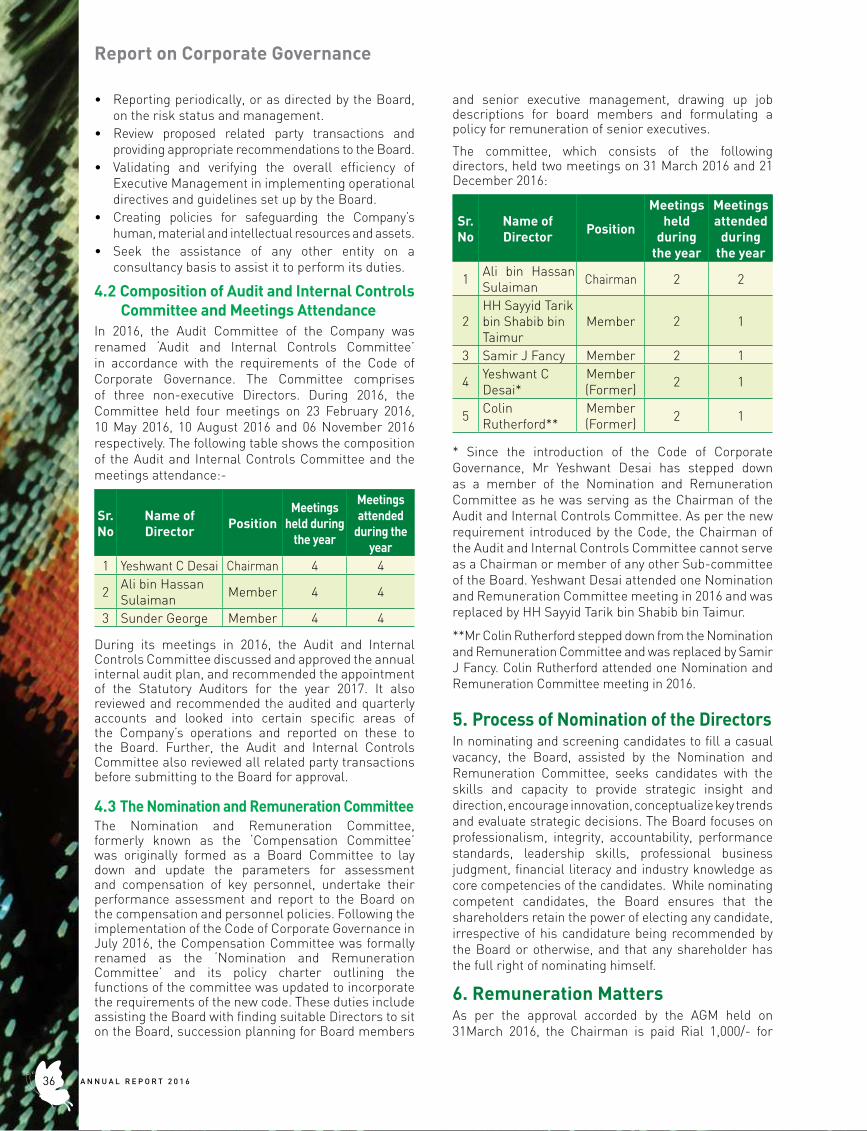
4.2 Composition of Audit and Internal Controls Committee and Meetings Attendance
In 2016, the Audit Committee of the Company was renamed ‘Audit and Internal Controls Committee’ in accordance with the requirements of the Code of Corporate Governance. The Committee comprises of three non-executive Directors. During 2016, the Committee held four meetings on 23 February 2016, 10 May 2016, 10 August 2016 and 06 November 2016 respectively. The following table shows the composition of the Audit and Internal Controls Committee and the meetings attendance:-
Sr. No
Name of Director Position
Meetings held during
the year
Meetings attended
during the year
1 Yeshwant C Desai Chairman 4 4
2 Ali bin Hassan Sulaiman Member 4 4
3 Sunder George Member 4 4
During its meetings in 2016, the Audit and Internal Controls Committee discussed and approved the annual internal audit plan, and recommended the appointment of the Statutory Auditors for the year 2017. It also reviewed and recommended the audited and quarterly accounts and looked into certain specific areas of the Company’s operations and reported on these to the Board. Further, the Audit and Internal Controls Committee also reviewed all related party transactions before submitting to the Board for approval.
4.3 The Nomination and Remuneration CommitteeThe Nomination and Remuneration Committee, formerly known as the ‘Compensation Committee’ was originally formed as a Board Committee to lay down and update the parameters for assessment and compensation of key personnel, undertake their performance assessment and report to the Board on the compensation and personnel policies. Following the implementation of the Code of Corporate Governance in July 2016, the Compensation Committee was formally renamed as the ‘Nomination and Remuneration Committee’ and its policy charter outlining the functions of the committee was updated to incorporate the requirements of the new code. These duties include assisting the Board with finding suitable Directors to sit on the Board, succession planning for Board members
and senior executive management, drawing up job descriptions for board members and formulating a policy for remuneration of senior executives.
The committee, which consists of the following directors, held two meetings on 31 March 2016 and 21 December 2016:
Sr. No
Name of Director Position
Meetings held
during the year
Meetings attended
during the year
1 Ali bin Hassan Sulaiman Chairman 2 2
2HH Sayyid Tarik bin Shabib bin Taimur
Member 2 1
3 Samir J Fancy Member 2 1
4 Yeshwant C Desai*
Member (Former) 2 1
5 Colin Rutherford**
Member (Former) 2 1
* Since the introduction of the Code of Corporate Governance, Mr Yeshwant Desai has stepped down as a member of the Nomination and Remuneration Committee as he was serving as the Chairman of the Audit and Internal Controls Committee. As per the new requirement introduced by the Code, the Chairman of the Audit and Internal Controls Committee cannot serve as a Chairman or member of any other Sub-committee of the Board. Yeshwant Desai attended one Nomination and Remuneration Committee meeting in 2016 and was replaced by HH Sayyid Tarik bin Shabib bin Taimur.
**Mr Colin Rutherford stepped down from the Nomination and Remuneration Committee and was replaced by Samir J Fancy. Colin Rutherford attended one Nomination and Remuneration Committee meeting in 2016.
5. Process of Nomination of the DirectorsIn nominating and screening candidates to fill a casual vacancy, the Board, assisted by the Nomination and Remuneration Committee, seeks candidates with the skills and capacity to provide strategic insight and direction, encourage innovation, conceptualize key trends and evaluate strategic decisions. The Board focuses on professionalism, integrity, accountability, performance standards, leadership skills, professional business judgment, financial literacy and industry knowledge as core competencies of the candidates. While nominating competent candidates, the Board ensures that the shareholders retain the power of electing any candidate, irrespective of his candidature being recommended by the Board or otherwise, and that any shareholder has the full right of nominating himself.
6. Remuneration MattersAs per the approval accorded by the AGM held on 31March 2016, the Chairman is paid Rial 1,000/- for
Report on Corporate Governance
A N N U A L R E P O R T 2 0 1 636
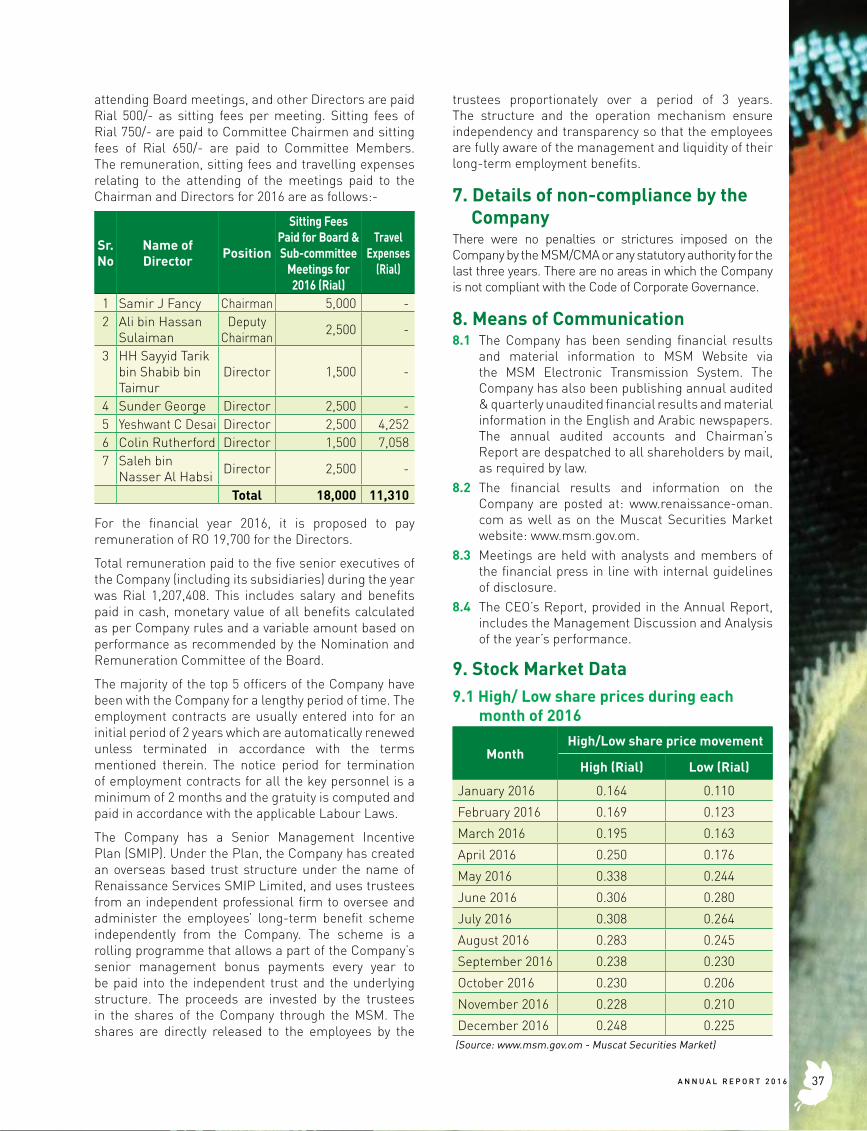
attending Board meetings, and other Directors are paid Rial 500/- as sitting fees per meeting. Sitting fees of Rial 750/- are paid to Committee Chairmen and sitting fees of Rial 650/- are paid to Committee Members. The remuneration, sitting fees and travelling expenses relating to the attending of the meetings paid to the Chairman and Directors for 2016 are as follows:-
Sr. No
Name of Director Position
Sitting Fees Paid for Board & Sub-committee
Meetings for 2016 (Rial)
Travel Expenses
(Rial)
1 Samir J Fancy Chairman 5,000 -2 Ali bin Hassan
SulaimanDeputy
Chairman 2,500 -
3 HH Sayyid Tarik bin Shabib bin Taimur
Director 1,500 -
4 Sunder George Director 2,500 -5 Yeshwant C Desai Director 2,500 4,2526 Colin Rutherford Director 1,500 7,0587 Saleh bin
Nasser Al Habsi Director 2,500 -
Total 18,000 11,310
For the financial year 2016, it is proposed to pay remuneration of RO 19,700 for the Directors.
Total remuneration paid to the five senior executives of the Company (including its subsidiaries) during the year was Rial 1,207,408. This includes salary and benefits paid in cash, monetary value of all benefits calculated as per Company rules and a variable amount based on performance as recommended by the Nomination and Remuneration Committee of the Board.
The majority of the top 5 officers of the Company have been with the Company for a lengthy period of time. The employment contracts are usually entered into for an initial period of 2 years which are automatically renewed unless terminated in accordance with the terms mentioned therein. The notice period for termination of employment contracts for all the key personnel is a minimum of 2 months and the gratuity is computed and paid in accordance with the applicable Labour Laws.
The Company has a Senior Management Incentive Plan (SMIP). Under the Plan, the Company has created an overseas based trust structure under the name of Renaissance Services SMIP Limited, and uses trustees from an independent professional firm to oversee and administer the employees’ long-term benefit scheme independently from the Company. The scheme is a rolling programme that allows a part of the Company’s senior management bonus payments every year to be paid into the independent trust and the underlying structure. The proceeds are invested by the trustees in the shares of the Company through the MSM. The shares are directly released to the employees by the
trustees proportionately over a period of 3 years. The structure and the operation mechanism ensure independency and transparency so that the employees are fully aware of the management and liquidity of their long-term employment benefits.
7. Details of non-compliance by the Company
There were no penalties or strictures imposed on the Company by the MSM/CMA or any statutory authority for the last three years. There are no areas in which the Company is not compliant with the Code of Corporate Governance.
8. Means of Communication 8.1 The Company has been sending financial results
and material information to MSM Website via the MSM Electronic Transmission System. The Company has also been publishing annual audited & quarterly unaudited financial results and material information in the English and Arabic newspapers. The annual audited accounts and Chairman’s Report are despatched to all shareholders by mail, as required by law.
8.2 The financial results and information on the Company are posted at: www.renaissance-oman.com as well as on the Muscat Securities Market website: www.msm.gov.om.
8.3 Meetings are held with analysts and members of the financial press in line with internal guidelines of disclosure.
8.4 The CEO’s Report, provided in the Annual Report, includes the Management Discussion and Analysis of the year’s performance.
9. Stock Market Data9.1 High/ Low share prices during each
month of 2016
MonthHigh/Low share price movement
High (Rial) Low (Rial)
January 2016 0.164 0.110
February 2016 0.169 0.123
March 2016 0.195 0.163
April 2016 0.250 0.176
May 2016 0.338 0.244
June 2016 0.306 0.280
July 2016 0.308 0.264
August 2016 0.283 0.245
September 2016 0.238 0.230
October 2016 0.230 0.206
November 2016 0.228 0.210
December 2016 0.248 0.225 (Source: www.msm.gov.om - Muscat Securities Market)
37A N N U A L R E P O R T 2 0 1 6
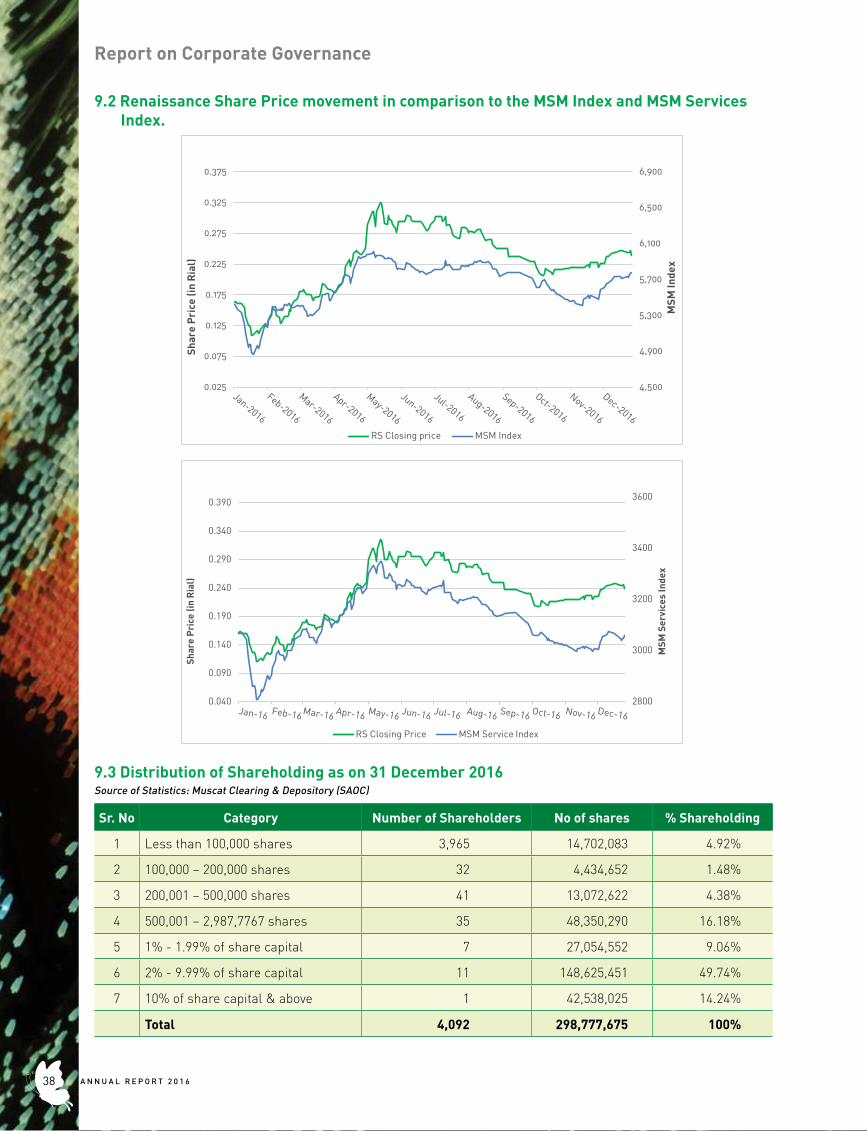
9.2 Renaissance Share Price movement in comparison to the MSM Index and MSM Services Index.
4,500
4,900
5,300
5,700
6,100
6,500
6,900
0.025
0.075
0.125
0.175
0.225
0.275
0.325
0.375
MSM
Inde
x
Shar
e P
rice
(in
Ria
l)
RS Closing price MSM Index
2800
3000
3200
3400
3600
0.040
0.090
0.140
0.190
0.240
0.290
0.340
0.390
MSM
Ser
vice
s In
dex
Shar
e P
rice
(in
Ria
l)
RS Closing Price MSM Service Index
9.3 Distribution of Shareholding as on 31 December 2016Source of Statistics: Muscat Clearing & Depository (SAOC)
Sr. No Category Number of Shareholders No of shares % Shareholding
1 Less than 100,000 shares 3,965 14,702,083 4.92%
2 100,000 – 200,000 shares 32 4,434,652 1.48%
3 200,001 – 500,000 shares 41 13,072,622 4.38%
4 500,001 – 2,987,7767 shares 35 48,350,290 16.18%
5 1% - 1.99% of share capital 7 27,054,552 9.06%
6 2% - 9.99% of share capital 11 148,625,451 49.74%
7 10% of share capital & above 1 42,538,025 14.24%
Total 4,092 298,777,675 100%
Report on Corporate Governance
A N N U A L R E P O R T 2 0 1 638
9.4 The Company has issued 423,141,678 mandatory convertible bonds (MCBs) at Rial 0.102 each on 25 July 2012 and listed on Muscat Securities Market (MSM) on 6 August 2012. The MCBs carry a coupon rate of 3.75% per annum and shall be converted at face value (Rial 0.100) through conversion into shares of the Company at the conversion price. In accordance with the issue prospectus, the conversion would be carried out in three tranches, 33.33% at the end of third and fourth year each and 33.34% at the end of fifth year, commencing from the third anniversary and ending on the fifth anniversary from the issue date.
However, in order to safeguard the interests of all stakeholders including MCB holders, the Company offered a repurchase option to MCB holders wishing to tender their MCBs to the Company prior to the first conversion date. To date, the Company has repurchased the first tranche of MCBs in July 2015, the second tranche in September 2015 and third tranche in July 2016 from MCB holders who offered to tender their MCBs.
Following the repurchase of the third tranche, the remaining 80,824,189 MCB’s are held by those MCB holders who chose not to participate in the repurchase scheme. These MCBs will be converted into shares in July 2017.
10. Professional Profile of the Statutory Auditors
Deloitte (Deloitte Touche Tohmatsu Limited), a UK private company limited by guarantee (“DTTL”) is a globally connected network of member firms in more than 150 countries and territories and each of its member firms are legally separate and independent entities. Deloitte employs more than 220,000 professionals globally.
Deloitte & Touche (M.E.) is a member firm of Deloitte Touche Tohmatsu Limited and is a leading professional services firm established in the Middle East region with uninterrupted presence since 1926. It provides audit, tax, consulting, and financial advisory services through 26 offices in 15 countries with more than 3,300 partners, directors and staff. It is a Tier 1 Tax advisor in the GCC region since 2010 (according to the International Tax Review World Tax Rankings). It has also received numerous awards in the last few years which include best employer in the Middle East, best consulting firm, the Middle East Training & Development Excellence Award by the Institute of Chartered Accountants in England and Wales (ICAEW), as well as the best CSR integrated organisation.
10.1 Audit Fees paid to the AuditorsDuring the year 2016, aggregate professional fees in the amount of Rial 198,232 were paid by the Company to Deloitte in respect of services provided for audit.
11. Confirmation by the Board of Directors
Renaissance is committed to conducting business legally and professionally under the highest standards of business ethics and moral code. This same high standard is expected and required of all Renaissance subsidiary companies and people working at every level throughout the group.
The Board of Directors confirms its accountability for the preparation of the financial statements in accordance with the applicable standards and rules.
The Board of Directors confirms that it has reviewed the efficiency and adequacy of the internal control systems of the Company. The Board is pleased to inform shareholders that adequate and efficient internal controls are in place, and that they are in full compliance with the internal rules and regulations.
The Board of Directors also confirms that there are no material matters that affect the continuation of the Company, and its ability to continue its operations during the next financial year.
_________________ ________________ Chairman Director
39A N N U A L R E P O R T 2 0 1 6
A N N U A L R E P O R T 2 0 1 640
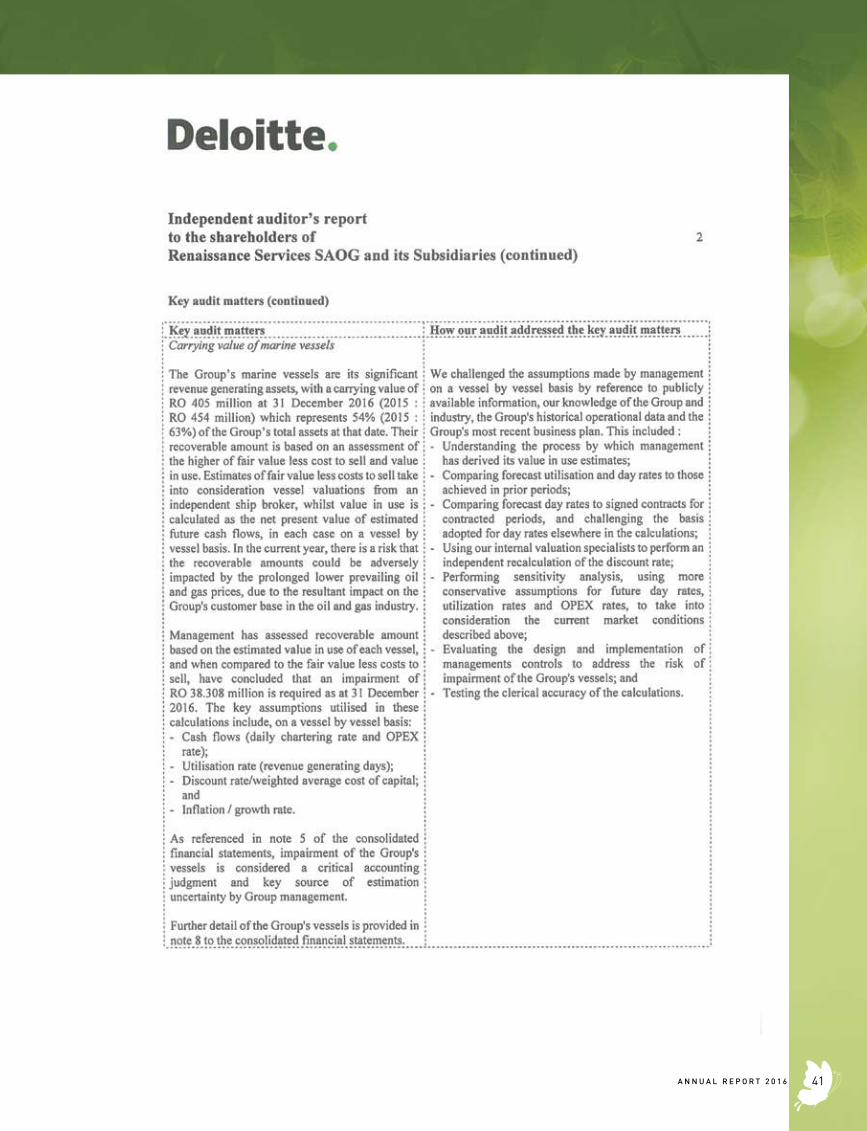
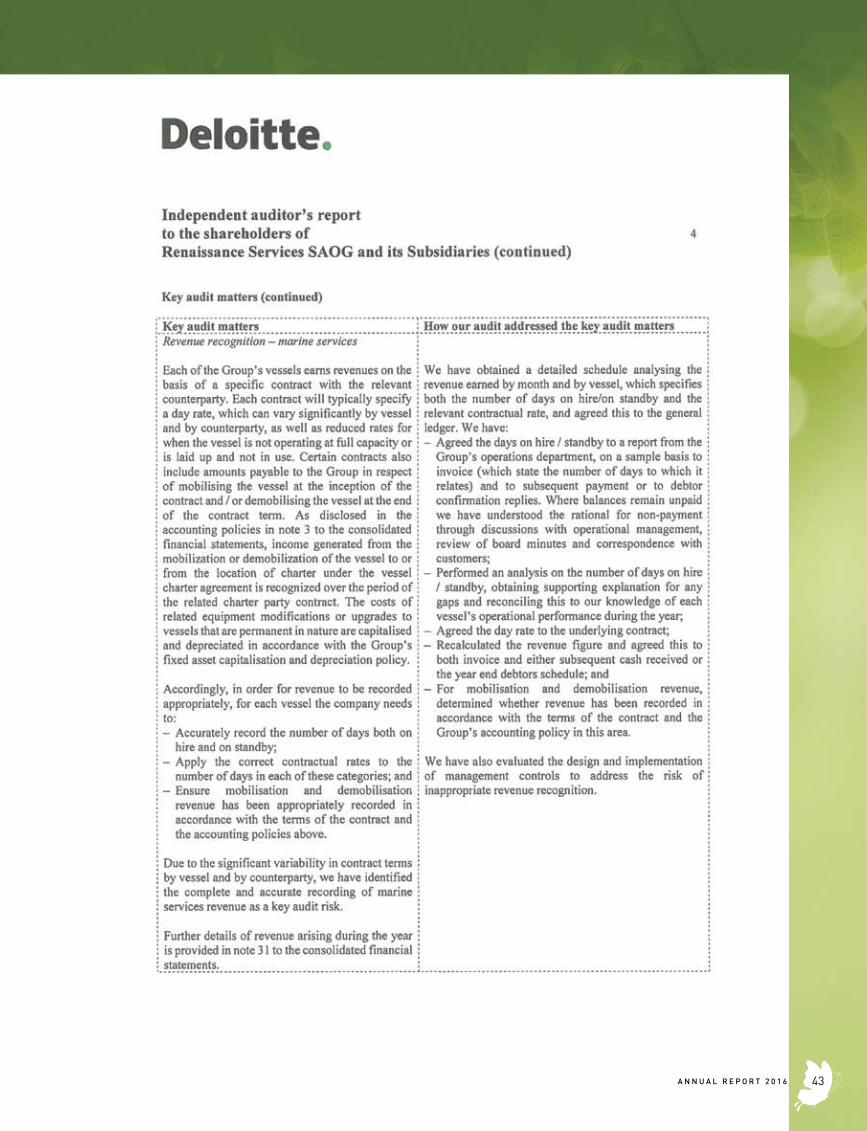
41A N N U A L R E P O R T 2 0 1 6
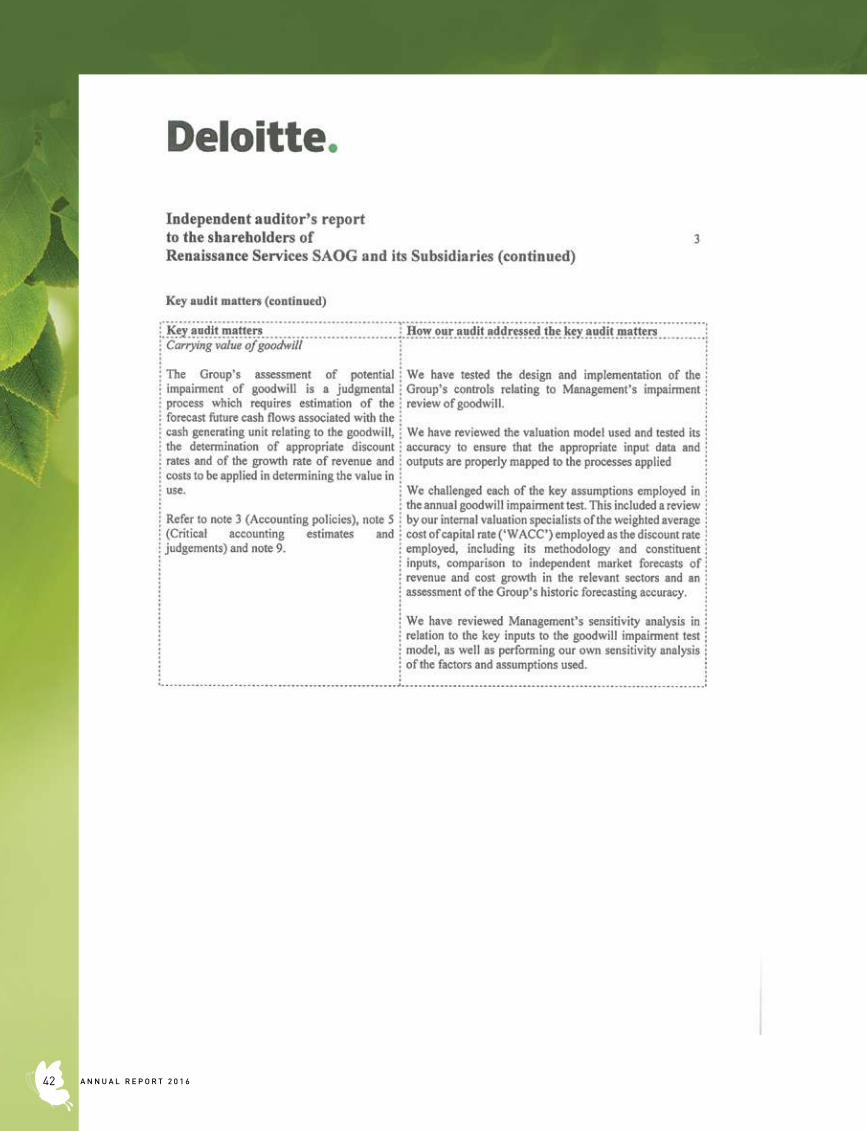
A N N U A L R E P O R T 2 0 1 642
43A N N U A L R E P O R T 2 0 1 6
A N N U A L R E P O R T 2 0 1 644
45A N N U A L R E P O R T 2 0 1 6
RENAISSANCE SERVICES SAOG AND ITS SUBSIDIARY COMPANIES
CONSOLIDATED STATEMENT OF PROFIT OR LOSS AND OTHER COMPREHENSIVE INCOMEFOR THE YEAR ENDED 31 DECEMBER 2016
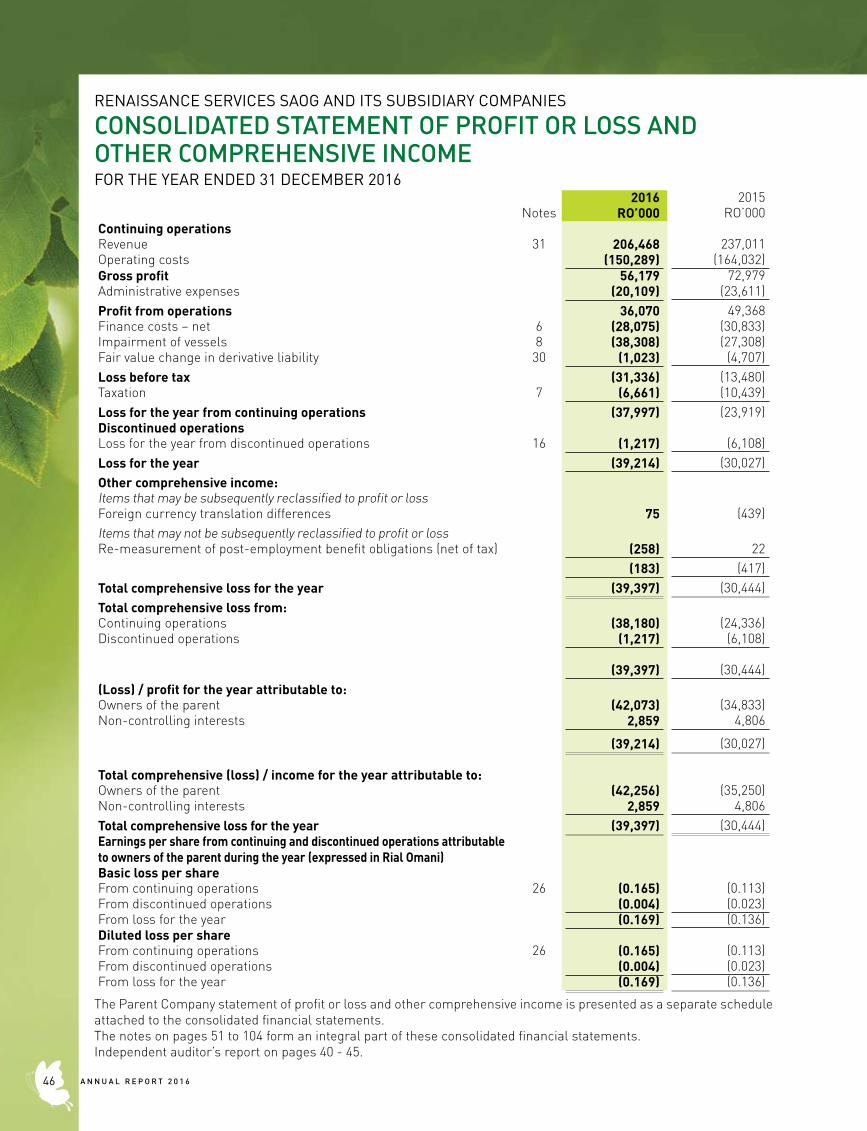
2016 2015Notes RO’000 RO’000
Continuing operationsRevenue 31 206,468 237,011 Operating costs (150,289) (164,032)Gross profit 56,179 72,979Administrative expenses (20,109) (23,611) Profit from operations 36,070 49,368Finance costs – net 6 (28,075) (30,833)Impairment of vessels 8 (38,308) (27,308)Fair value change in derivative liability 30 (1,023) (4,707)Loss before tax (31,336) (13,480)Taxation 7 (6,661) (10,439)Loss for the year from continuing operations (37,997) (23,919)Discontinued operationsLoss for the year from discontinued operations 16 (1,217) (6,108)Loss for the year (39,214) (30,027)Other comprehensive income:Items that may be subsequently reclassified to profit or lossForeign currency translation differences 75 (439)Items that may not be subsequently reclassified to profit or lossRe-measurement of post-employment benefit obligations (net of tax) (258) 22
(183) (417)Total comprehensive loss for the year (39,397) (30,444)Total comprehensive loss from:Continuing operations (38,180) (24,336)Discontinued operations (1,217) (6,108)
(39,397) (30,444)(Loss) / profit for the year attributable to: Owners of the parent (42,073) (34,833)Non-controlling interests 2,859 4,806
(39,214) (30,027)
Total comprehensive (loss) / income for the year attributable to:Owners of the parent (42,256) (35,250)Non-controlling interests 2,859 4,806Total comprehensive loss for the year (39,397) (30,444)Earnings per share from continuing and discontinued operations attributable to owners of the parent during the year (expressed in Rial Omani)Basic loss per shareFrom continuing operations 26 (0.165) (0.113)From discontinued operations (0.004) (0.023)From loss for the year (0.169) (0.136)Diluted loss per shareFrom continuing operations 26 (0.165) (0.113)From discontinued operations (0.004) (0.023)From loss for the year (0.169) (0.136)
The Parent Company statement of profit or loss and other comprehensive income is presented as a separate schedule attached to the consolidated financial statements.The notes on pages 51 to 104 form an integral part of these consolidated financial statements.Independent auditor’s report on pages 40 - 45.
A N N U A L R E P O R T 2 0 1 646
RENAISSANCE SERVICES SAOG AND ITS SUBSIDIARY COMPANIES
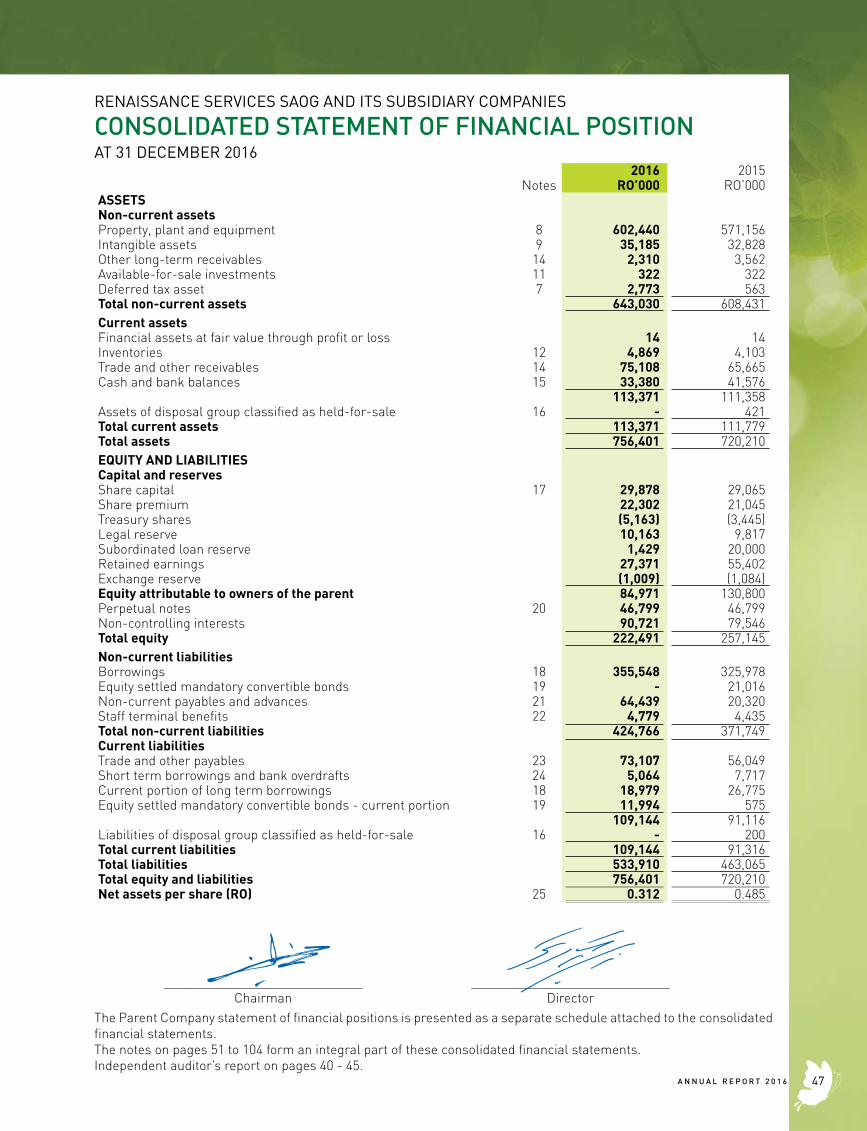
CONSOLIDATED STATEMENT OF FINANCIAL POSITIONAT 31 DECEMBER 2016
2016 2015Notes RO’000 RO’000
ASSETSNon-current assetsProperty, plant and equipment 8 602,440 571,156Intangible assets 9 35,185 32,828Other long-term receivables 14 2,310 3,562Available-for-sale investments 11 322 322Deferred tax asset 7 2,773 563Total non-current assets 643,030 608,431Current assetsFinancial assets at fair value through profit or loss 14 14Inventories 12 4,869 4,103Trade and other receivables 14 75,108 65,665Cash and bank balances 15 33,380 41,576
113,371 111,358Assets of disposal group classified as held-for-sale 16 - 421Total current assets 113,371 111,779Total assets 756,401 720,210EQUITY AND LIABILITIESCapital and reservesShare capital 17 29,878 29,065Share premium 22,302 21,045Treasury shares (5,163) (3,445)Legal reserve 10,163 9,817Subordinated loan reserve 1,429 20,000Retained earnings 27,371 55,402Exchange reserve (1,009) (1,084)Equity attributable to owners of the parent 84,971 130,800Perpetual notes 20 46,799 46,799Non-controlling interests 90,721 79,546Total equity 222,491 257,145Non-current liabilitiesBorrowings 18 355,548 325,978Equity settled mandatory convertible bonds 19 - 21,016Non-current payables and advances 21 64,439 20,320Staff terminal benefits 22 4,779 4,435Total non-current liabilities 424,766 371,749Current liabilitiesTrade and other payables 23 73,107 56,049Short term borrowings and bank overdrafts 24 5,064 7,717Current portion of long term borrowings 18 18,979 26,775Equity settled mandatory convertible bonds - current portion 19 11,994 575
109,144 91,116Liabilities of disposal group classified as held-for-sale 16 - 200Total current liabilities 109,144 91,316Total liabilities 533,910 463,065Total equity and liabilities 756,401 720,210Net assets per share (RO) 25 0.312 0.485
_____________________________ _____________________________ Chairman DirectorThe Parent Company statement of financial positions is presented as a separate schedule attached to the consolidated financial statements.The notes on pages 51 to 104 form an integral part of these consolidated financial statements.Independent auditor’s report on pages 40 - 45.
47A N N U A L R E P O R T 2 0 1 6
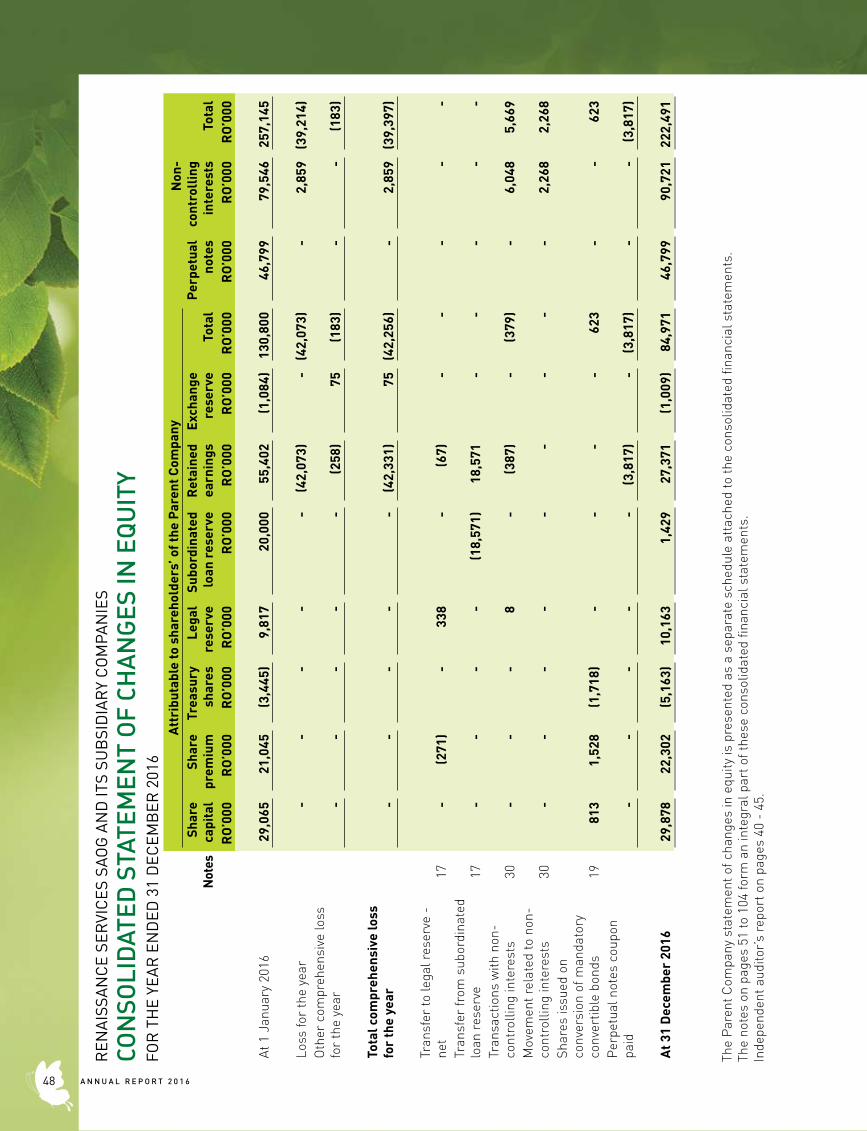
REN
AIS
SAN
CE
SER
VIC
ES S
AOG
AN
D IT
S SU
BSI
DIA
RY
CO
MPA
NIE
S
CON
SOLI
DAT
ED S
TATE
MEN
T O
F CH
AN
GES
IN E
QU
ITY
FOR
TH
E YE
AR
EN
DED
31
DEC
EMB
ER 2
016
Att
ribu
tabl
e to
sha
reho
lder
s’ o
f the
Par
ent C
ompa
nyP
erpe
tual
note
s
Non
- co
ntro
llin
gin
tere
sts
Tota
lN
otes
Shar
eca
pita
lSh
are
prem
ium
Trea
sury
shar
esLe
gal
rese
rve
Subo
rdin
ated
loan
res
erve
Ret
aine
dea
rnin
gsEx
chan
gere
serv
eTo
tal
RO
’000
RO
’000
RO
’000
RO
’000
RO
’000
RO
’000
RO
’000
RO
’000
RO
’000
RO
’000
RO
’000
At 1
Jan
uary
201
629
,065
21,0
45(3
,445
)9,
817
20,0
0055
,402
(1,0
84)
130,
800
46,7
9979
,546
257,
145
Loss
for
the
year
--
--
-(4
2,07
3)-
(42,
073)
-2,
859
(39,
214)
Oth
er c
ompr
ehen
sive
loss
fo
r th
e ye
ar-
--
--
(258
)75
(183
)-
-(1
83)
Tota
l com
preh
ensi
ve lo
ss
for
the
year
--
--
-(4
2,33
1)75
(42,
256)
-2,
859
(39,
397)
Tran
sfer
to le
gal r
eser
ve -
ne
t17
-(2
71)
-33
8-
(67)
--
--
-Tr
ansf
er fr
om s
ubor
dina
ted
loan
res
erve
17-
--
-(1
8,57
1)18
,571
--
--
-Tr
ansa
ctio
ns w
ith n
on-
cont
rolli
ng in
tere
sts
30-
--
8-
(387
)-
(379
)-
6,04
85,
669
Mov
emen
t rel
ated
to n
on-
cont
rolli
ng in
tere
sts
30-
--
--
--
--
2,26
82,
268
Shar
es is
sued
on
conv
ersi
on o
f man
dato
ry
conv
ertib
le b
onds
1981
31,
528
(1,7
18)
--
--
623
--
623
Per
petu
al n
otes
cou
pon
paid
--
--
-(3
,817
)-
(3,8
17)
--
(3,8
17)
At 3
1 D
ecem
ber
2016
29,8
7822
,302
(5,1
63)
10,1
631,
429
27,3
71(1
,009
)84
,971
46
,799
90,7
2122
2,49
1
The
Par
ent C
ompa
ny s
tate
men
t of c
hang
es in
equ
ity is
pre
sent
ed a
s a
sepa
rate
sch
edul
e at
tach
ed to
the
cons
olid
ated
fina
ncia
l sta
tem
ents
.Th
e no
tes
on p
ages
51
to 1
04 fo
rm a
n in
tegr
al p
art o
f the
se c
onso
lidat
ed fi
nanc
ial s
tate
men
ts.
Inde
pend
ent a
udito
r’s
repo
rt o
n pa
ges
40 -
45.
A N N U A L R E P O R T 2 0 1 648
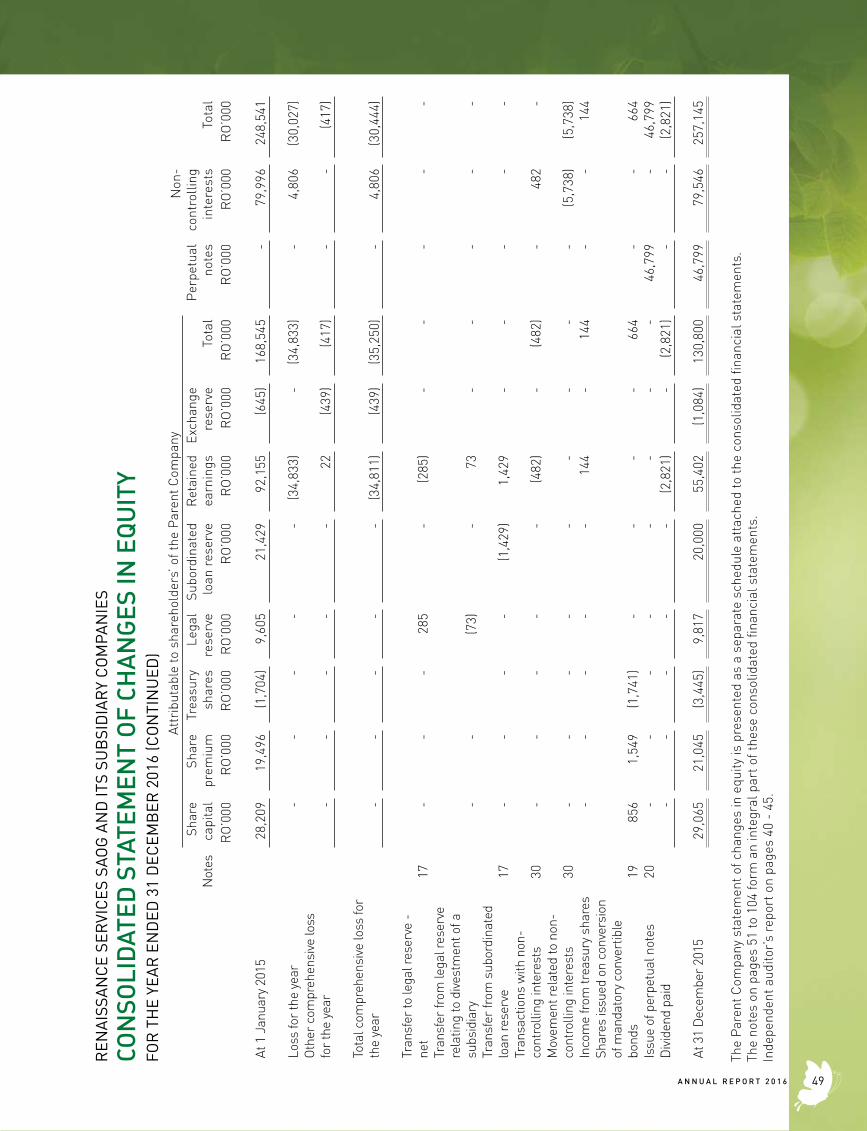
REN
AIS
SAN
CE
SER
VIC
ES S
AOG
AN
D IT
S SU
BSI
DIA
RY
CO
MPA
NIE
S
CON
SOLI
DAT
ED S
TATE
MEN
T O
F CH
AN
GES
IN E
QU
ITY
FOR
TH
E YE
AR
EN
DED
31
DEC
EMB
ER 2
016
(CO
NTI
NU
ED)
Attr
ibut
able
to s
hare
hold
ers’
of t
he P
aren
t Com
pany
Per
petu
alno
tes
Non
- co
ntro
lling
inte
rest
sTo
tal
Not
esSh
are
capi
tal
Shar
epr
emiu
mTr
easu
rysh
ares
Lega
lre
serv
eSu
bord
inat
edlo
an r
eser
veR
etai
ned
earn
ings
Exch
ange
rese
rve
Tota
lR
O’0
00R
O’0
00R
O’0
00R
O’0
00R
O’0
00R
O’0
00R
O’0
00R
O’0
00R
O’0
00R
O’0
00R
O’0
00
At 1
Jan
uary
201
528
,209
19,4
96(1
,704
)9,
605
21,4
2992
,155
(645
)16
8,54
5-
79,9
9624
8,54
1
Loss
for
the
year
--
--
-(3
4,83
3)-
(34,
833)
-4,
806
(30,
027)
Oth
er c
ompr
ehen
sive
loss
fo
r th
e ye
ar-
--
--
22(4
39)
(417
)-
-(4
17)
Tota
l com
preh
ensi
ve lo
ss fo
r th
e ye
ar-
--
--
(34,
811)
(439
)(3
5,25
0)-
4,80
6(3
0,44
4)
Tran
sfer
to le
gal r
eser
ve -
ne
t17
--
-28
5-
(285
)-
--
--
Tran
sfer
from
lega
l res
erve
re
latin
g to
div
estm
ent o
f a
subs
idia
ry-
-(7
3)-
73-
--
--
Tran
sfer
from
sub
ordi
nate
d lo
an re
serv
e17
--
--
(1,4
29)
1,42
9-
--
--
Tran
sact
ions
with
non
-co
ntro
lling
inte
rest
s30
--
--
-(4
82)
-(4
82)
-48
2-
Mov
emen
t rel
ated
to n
on-
cont
rolli
ng in
tere
sts
30-
--
--
--
--
(5,7
38)
(5,7
38)
Inco
me
from
trea
sury
sha
res
--
--
-14
4-
1
44-
-14
4Sh
ares
issu
ed o
n co
nver
sion
of
man
dato
ry c
onve
rtib
le
bond
s19
856
1,54
9(1
,741
)-
--
-
66
4-
-66
4Is
sue
of p
erpe
tual
not
es
20
--
--
--
--
46,7
99-
46,7
99D
ivid
end
paid
--
--
-(2
,821
)-
(2,8
21)
--
(2,8
21)
At 3
1 D
ecem
ber
2015
29,0
6521
,045
(3,4
45)
9,81
720
,000
55,4
02(1
,084
)13
0,80
0 46
,799
79,5
4625
7,14
5
The
Par
ent C
ompa
ny s
tate
men
t of c
hang
es in
equ
ity is
pre
sent
ed a
s a
sepa
rate
sch
edul
e at
tach
ed to
the
cons
olid
ated
fina
ncia
l sta
tem
ents
.Th
e no
tes
on p
ages
51
to 1
04 fo
rm a
n in
tegr
al p
art o
f the
se c
onso
lidat
ed fi
nanc
ial s
tate
men
ts.
Inde
pend
ent a
udito
r’s
repo
rt o
n pa
ges
40 -
45.
49A N N U A L R E P O R T 2 0 1 6
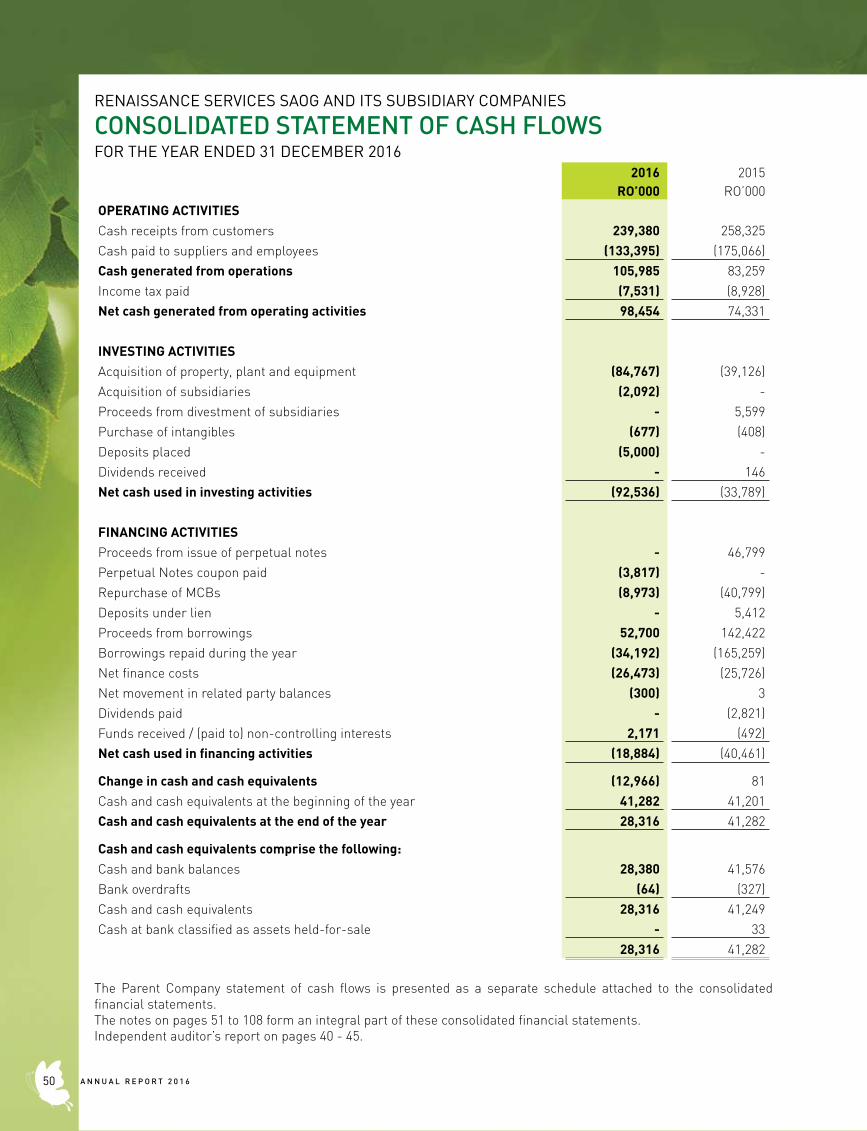
RENAISSANCE SERVICES SAOG AND ITS SUBSIDIARY COMPANIES
CONSOLIDATED STATEMENT OF CASH FLOWSFOR THE YEAR ENDED 31 DECEMBER 2016
2016 2015RO’000 RO’000
OPERATING ACTIVITIESCash receipts from customers 239,380 258,325Cash paid to suppliers and employees (133,395) (175,066)Cash generated from operations 105,985 83,259Income tax paid (7,531) (8,928)Net cash generated from operating activities 98,454 74,331
INVESTING ACTIVITIESAcquisition of property, plant and equipment (84,767) (39,126)Acquisition of subsidiaries (2,092) -Proceeds from divestment of subsidiaries - 5,599Purchase of intangibles (677) (408)Deposits placed (5,000) -Dividends received - 146Net cash used in investing activities (92,536) (33,789)
FINANCING ACTIVITIESProceeds from issue of perpetual notes - 46,799Perpetual Notes coupon paid (3,817) -Repurchase of MCBs (8,973) (40,799)Deposits under lien - 5,412Proceeds from borrowings 52,700 142,422Borrowings repaid during the year (34,192) (165,259)Net finance costs (26,473) (25,726)Net movement in related party balances (300) 3Dividends paid - (2,821)Funds received / (paid to) non-controlling interests 2,171 (492)Net cash used in financing activities (18,884) (40,461)
Change in cash and cash equivalents (12,966) 81Cash and cash equivalents at the beginning of the year 41,282 41,201Cash and cash equivalents at the end of the year 28,316 41,282
Cash and cash equivalents comprise the following:Cash and bank balances 28,380 41,576Bank overdrafts (64) (327) Cash and cash equivalents 28,316 41,249Cash at bank classified as assets held-for-sale - 33
28,316 41,282
The Parent Company statement of cash flows is presented as a separate schedule attached to the consolidated financial statements.The notes on pages 51 to 108 form an integral part of these consolidated financial statements.Independent auditor’s report on pages 40 - 45.
A N N U A L R E P O R T 2 0 1 650
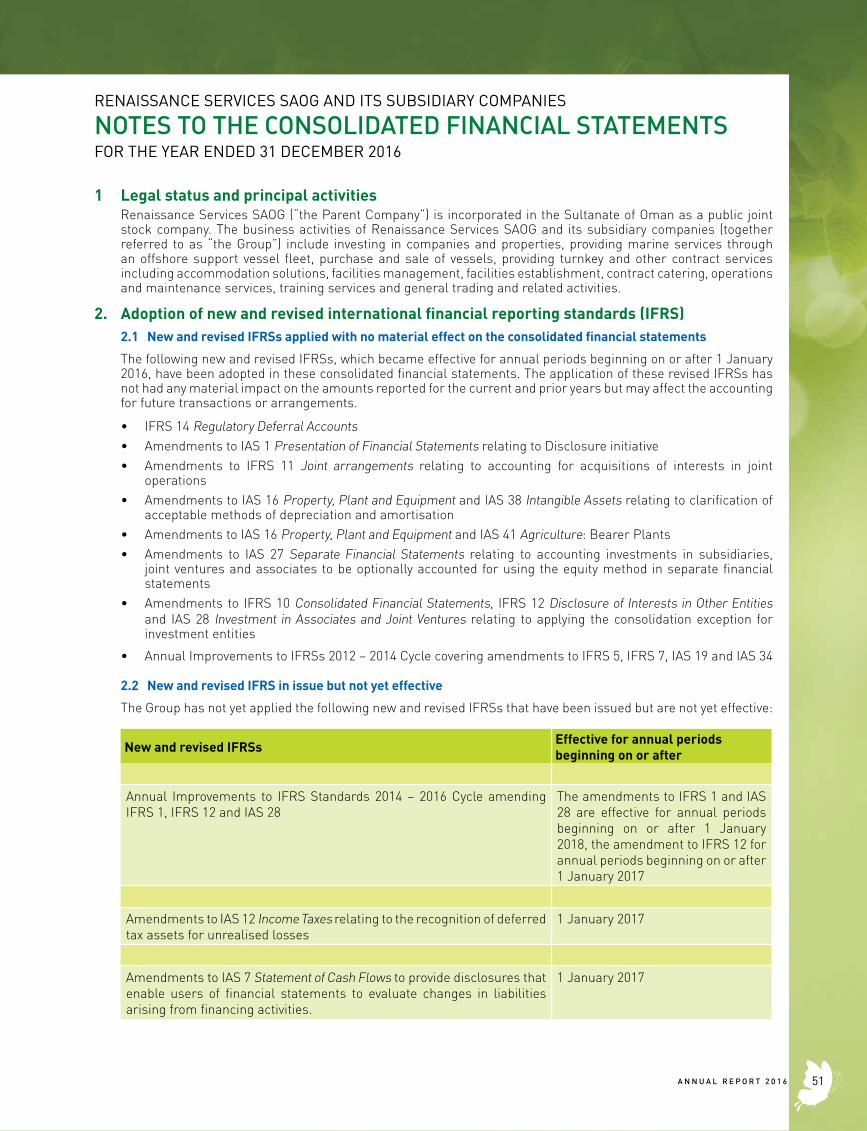
1 Legal status and principal activitiesRenaissance Services SAOG (“the Parent Company”) is incorporated in the Sultanate of Oman as a public joint stock company. The business activities of Renaissance Services SAOG and its subsidiary companies (together referred to as “the Group”) include investing in companies and properties, providing marine services through an offshore support vessel fleet, purchase and sale of vessels, providing turnkey and other contract services including accommodation solutions, facilities management, facilities establishment, contract catering, operations and maintenance services, training services and general trading and related activities.
2. Adoption of new and revised international financial reporting standards (IFRS)2.1 New and revised IFRSs applied with no material effect on the consolidated financial statements
The following new and revised IFRSs, which became effective for annual periods beginning on or after 1 January 2016, have been adopted in these consolidated financial statements. The application of these revised IFRSs has not had any material impact on the amounts reported for the current and prior years but may affect the accounting for future transactions or arrangements.
• IFRS 14 Regulatory Deferral Accounts• Amendments to IAS 1 Presentation of Financial Statements relating to Disclosure initiative• Amendments to IFRS 11 Joint arrangements relating to accounting for acquisitions of interests in joint
operations• Amendments to IAS 16 Property, Plant and Equipment and IAS 38 Intangible Assets relating to clarification of
acceptable methods of depreciation and amortisation• Amendments to IAS 16 Property, Plant and Equipment and IAS 41 Agriculture: Bearer Plants• Amendments to IAS 27 Separate Financial Statements relating to accounting investments in subsidiaries,
joint ventures and associates to be optionally accounted for using the equity method in separate financial statements
• Amendments to IFRS 10 Consolidated Financial Statements, IFRS 12 Disclosure of Interests in Other Entities and IAS 28 Investment in Associates and Joint Ventures relating to applying the consolidation exception for investment entities
• Annual Improvements to IFRSs 2012 – 2014 Cycle covering amendments to IFRS 5, IFRS 7, IAS 19 and IAS 34
2.2 New and revised IFRS in issue but not yet effective
The Group has not yet applied the following new and revised IFRSs that have been issued but are not yet effective:
New and revised IFRSs Effective for annual periods beginning on or after
Annual Improvements to IFRS Standards 2014 – 2016 Cycle amending IFRS 1, IFRS 12 and IAS 28
The amendments to IFRS 1 and IAS 28 are effective for annual periods beginning on or after 1 January 2018, the amendment to IFRS 12 for annual periods beginning on or after 1 January 2017
Amendments to IAS 12 Income Taxes relating to the recognition of deferred tax assets for unrealised losses
1 January 2017
Amendments to IAS 7 Statement of Cash Flows to provide disclosures that enable users of financial statements to evaluate changes in liabilities arising from financing activities.
1 January 2017
RENAISSANCE SERVICES SAOG AND ITS SUBSIDIARY COMPANIES
NOTES TO THE CONSOLIDATED FINANCIAL STATEMENTSFOR THE YEAR ENDED 31 DECEMBER 2016
51A N N U A L R E P O R T 2 0 1 6
RENAISSANCE SERVICES SAOG AND ITS SUBSIDIARY COMPANIES
NOTES TO THE CONSOLIDATED FINANCIAL STATEMENTSFOR THE YEAR ENDED 31 DECEMBER 2016
2 Adoption of new and revised International Financial Reporting Standards (IFRS) (continued)2.2 New and revised IFRS in issue but not yet effective (continued)
IFRIC 22 Foreign Currency Transactions and Advance Consideration
The interpretation addresses foreign currency transactions or parts of transactions where:
• there is consideration that is denominated or priced in a foreign currency;
• the entity recognises a prepayment asset or a deferred income liability in respect of that consideration, in advance of the recognition of the related asset, expense or income; and
• the prepayment asset or deferred income liability is non-monetary
1 January 2018
Amendments to IFRS 2 Share Based Payment regarding classification and measurement of share based payment transactions
1 January 2018
Amendments to IFRS 4 Insurance Contracts: Relating to the different effective dates of IFRS 9 and the forthcoming new insurance contracts standard
1 January 2018
Amendments to IAS 40 Investment Property: Amends paragraph 57 to state that an entity shall transfer a property to, or from, investment property when, and only when, there is evidence of a change in use. A change of use occurs if property meets, or ceases to meet, the definition of investment property. A change in management’s intentions for the use of a property by itself does not constitute evidence of a change in use.
1 January 2018
Amendments to IFRS 7 Financial Instruments: Disclosures relating to disclosures about the initial application of IFRS 9
When IFRS 9 is first applied
IFRS 7 Financial Instruments: Disclosures relating to the additional hedge accounting disclosures (and consequential amendments) resulting from the introduction of the hedge accounting chapter in IFRS 9
When IFRS 9 is first applied
A N N U A L R E P O R T 2 0 1 652
RENAISSANCE SERVICES SAOG AND ITS SUBSIDIARY COMPANIES
NOTES TO THE CONSOLIDATED FINANCIAL STATEMENTSFOR THE YEAR ENDED 31 DECEMBER 2016
2 Adoption of new and revised International Financial Reporting Standards (IFRS) (continued)2.2 New and revised IFRS in issue but not yet effective (continued)
New and revised IFRSs Effective for annual periods beginning on or after
IFRS 9 Financial Instruments (revised versions in 2009, 2010, 2013 and 2014)
IFRS 9 issued in November 2009 introduced new requirements for the classification and measurement of financial assets. IFRS 9 was subsequently amended in October 2010 to include requirements for the classification and measurement of financial liabilities and for derecognition, and in November 2013 to include the new requirements for general hedge accounting. Another revised version of IFRS 9 was issued in July 2014 mainly to include a) impairment requirements for financial assets and b) limited amendments to the classification and measurement requirements by introducing a ‘fair value through other comprehensive income’ (FVTOCI) measurement category for certain simple debt instruments.
A finalised version of IFRS 9 which contains accounting requirements for financial instruments, replacing IAS 39 Financial Instruments: Recognition and Measurement. The standard contains requirements in the following areas:
Classification and measurement: Financial assets are classified by reference to the business model within which they are held and their contractual cash flow characteristics. The 2014 version of IFRS 9 introduces a ‘fair value through other comprehensive income category for certain debt instruments. Financial liabilities are classified in a similar manner to under IAS 39, however there are differences in the requirements applying to the measurement of an entity’s own credit risk.
Impairment: The 2014 version of IFRS 9 introduces an ‘expected credit loss’ model for the measurement of the impairment of financial assets, so it is no longer necessary for a credit event to have occurred before a credit loss is recognised.
Hedge accounting: Introduces a new hedge accounting model that is designed to be more closely aligned with how entities undertake risk management activities when hedging financial and non-financial risk exposures.
Derecognition: The requirements for the derecognition of financial assets and liabilities are carried forward from IAS 39.
1 January 2018
53A N N U A L R E P O R T 2 0 1 6
RENAISSANCE SERVICES SAOG AND ITS SUBSIDIARY COMPANIES
NOTES TO THE CONSOLIDATED FINANCIAL STATEMENTSFOR THE YEAR ENDED 31 DECEMBER 2016
2 Adoption of new and revised International Financial Reporting Standards (IFRS) (continued)2.2 New and revised IFRS in issue but not yet effective (continued)
New and revised IFRSs Effective for annual periods beginning on or after
IFRS 15 Revenue from Contracts with Customers
In May 2014, IFRS 15 was issued which established a single comprehensive model for entities to use in accounting for revenue arising from contracts with customers. IFRS 15 will supersede the current revenue recognition guidance including IAS 18 Revenue, IAS 11 Construction Contracts and the related interpretations when it becomes effective.
The core principle of IFRS 15 is that an entity should recognize revenue to depict the transfer of promised goods or services to customers in an amount that reflects the consideration to which the entity expects to be entitled in exchange for those goods or services. Specifically, the standard introduces a 5-step approach to revenue recognition:Step 1: Identify the contract(s) with a customerStep 2: Identify the performance obligations in the contractStep 3: Determine the transaction priceStep 4: Allocate the transaction price to the performance obligations in the contractStep 5: Recognise revenue when (or as) the entity satisfies a performance obligation
Under IFRS 15, an entity recognises when (or as) a performance obligation is satisfied, i.e. when ‘control’ of the goods or services underlying the particular performance obligation is transferred to the customer. Far more prescriptive guidance has been added in IFRS 15 to deal with specific scenarios. Furthermore, extensive disclosures are required by IFRS 15.
1 January 2018
Amendments to IFRS 15 Revenue from Contracts with Customers to clarify three aspects of the standard (identifying performance obligations, principal versus agent considerations, and licensing) and to provide some transition relief for modified contracts and completed contracts.
1 January 2018
IFRS 16 Leases
IFRS 16 specifies how an IFRS reporter will recognise, measure, present and disclose leases. The standard provides a single lessee accounting model, requiring lessees to recognise assets and liabilities for all leases unless the lease term is 12 months or less or the underlying asset has a low value. Lessors continue to classify leases as operating or finance, with IFRS 16’s approach to lessor accounting substantially unchanged from its predecessor, IAS 17.
1 January 2019
Amendments to IFRS 10 Consolidated Financial Statements and IAS 28 Investments in Associates and Joint Ventures (2011) relating to the treatment of the sale or contribution of assets from and investor to its associate or joint venture.
Effective date deferred indefinitely
A N N U A L R E P O R T 2 0 1 654
RENAISSANCE SERVICES SAOG AND ITS SUBSIDIARY COMPANIES
NOTES TO THE CONSOLIDATED FINANCIAL STATEMENTSFOR THE YEAR ENDED 31 DECEMBER 2016
2 Adoption of new and revised International Financial Reporting Standards (IFRS) (continued)The Board of Directors anticipates that these new standards, interpretations and amendments will be adopted in the Group’s consolidated financial statements as and when they are applicable and adoption of these new standards, interpretations and amendments, except for IFRS 9, IFRS 15 and IFRS 16, may have no material impact on the consolidated financial statements of the Group in the period of initial application.
The Board of Directors anticipates that IFRS 15 and IFRS 9 will be adopted in the Group’s consolidated financial statements for the annual period beginning 1 January 2018 and that IFRS 16 will be adopted in the Group’s consolidated financial statements for the annual period beginning 1 January 2019. The application of IFRS 15 and IFRS 9 may have impact on amounts reported and disclosures made in the Group’s consolidated financial statements in respect of revenue from contracts with customers and the Group’s financial assets and financial liabilities and the application of IFRS 16 may have impact on amounts reported and disclosures made in the Group’s consolidated financial statements in respect of its leases.
However, it is not practicable to provide a reasonable estimate of effects of the application of these standards until the Group performs a detailed review.
3 Summary of significant accounting policiesStatement of compliance and basis of preparation
The consolidated financial statements have been prepared in accordance with International Financial Reporting Standards (IFRS) and applicable requirements of the Commercial Companies Law of 1974 and the disclosure requirements of the Capital Market Authority (CMA) of Sultanate of Oman. The standalone statement of financial position, statement of comprehensive income, changes in equity and cash flows of the Parent Company are given in the attached schedule to the consolidated financial statements, in order to comply with the disclosure requirements of CMA. For a further understanding of the standalone Parent Company’s financial position and the results of its operations and the auditor’s report on those financial statements, the schedule should be read in conjunction with the full set of separate financial statements of the Parent Company on which an unqualified opinion dated 23 February 2017 was rendered by the auditors.
These financial statements have been prepared in Rial Omani (RO) rounded to the nearest thousand, unless otherwise stated.
Items included in the financial statements of each of the Group’s entities are measured using the currency of the primary economic environment in which the entity operates (the functional currency). The consolidated financial statements are presented in Rial Omani (RO), which is the Group’s presentation currency.
The consolidated financial statements are prepared under the historical cost convention modified to include the measurement at fair value of the following assets and liabilities:• Financial assets at fair value through profit or loss; • Available-for-sale investments; and• Derivative financial instruments.
The preparation of consolidated financial statements in conformity with IFRS requires the use of certain critical accounting estimates. It also requires management to exercise its judgement in the process of applying the Group’s accounting policies. The areas involving a higher degree of judgement or complexity, or areas where assumptions and estimates are significant to the consolidated financial statements are disclosed in note 5.
55A N N U A L R E P O R T 2 0 1 6
RENAISSANCE SERVICES SAOG AND ITS SUBSIDIARY COMPANIES
NOTES TO THE CONSOLIDATED FINANCIAL STATEMENTSFOR THE YEAR ENDED 31 DECEMBER 2016
3 Summary of significant accounting policies (continued)Statement of compliance and basis of preparation (continued)
Basis of consolidation
Subsidiaries
Subsidiaries are all entities (including structured entities) over which the Group has control. The Group controls an entity when the Group is exposed to, or has rights to, variable returns from its involvement with the entity and has the ability to affect those returns through its power over the entity. Subsidiaries are fully consolidated from the date on which control is transferred to the Group. They are deconsolidated from the date that control ceases. Losses applicable to the non-controlling interests in a subsidiary are attributed to the non-controlling interests even if this results in the non-controlling interests having a deficit balance.
Upon loss of control, the Group derecognises the assets and liabilities of the subsidiary, any non-controlling interests and the other components of equity related to the subsidiary. Any difference between the (i) the aggregate of the fair value of the consideration received and fair value of any retained interest and (ii) the previous carrying value of the assets (including goodwill) and the liabilities of the subsidiaries and any non-controlling interest is recognised in the statement of profit or loss. If the Group retains any interest on entity that was a subsidiary in the past, then such interest is measured at fair value at the date that the control is lost. Subsequently, it is accounted for as equity accounted investee or as an available-for-sale financial asset depending on the level of influence retained.
The financial statements of the subsidiaries are prepared for the same reporting year as the Parent Company, using consistent accounting policies.
Associates
Associates are all entities over which, the group has significant influence but not control, generally accompanying a shareholding of between 20% and 50% of the voting rights. Investments in associates are accounted for using the equity method of accounting. Under the equity method, the investment is initially recognised at cost, and the carrying amount is increased or decreased to recognise the investor’s share of profit or loss of the investee after the date of acquisition. Investment in associates includes goodwill identified on acquisition.
If the ownership interest in an associate is reduced but significant influence is retained, only a proportionate share of the amounts previously recognised in other comprehensive income is reclassified to profit or loss where appropriate.
The Group’s share of post-acquisition profit or loss and other comprehensive income of the associates are recognised in the Group’s profit or loss and other comprehensive income respectively, with a corresponding adjustment to the carrying amount of the investment. When the Group’s share of losses in an associate equals or exceeds its interest in the associate, including any other unsecured receivables, the Group does not recognise further losses, unless it has incurred legal or constructive obligations or made payments on behalf of the associate.
The Group determines at each reporting date whether there is any objective evidence that the investment in an associate is impaired. If this is the case, the Group calculates the amount of impairment as the difference between the recoverable amount of the associate and its carrying value and recognises the amount in the profit or loss.
Profits and losses resulting from upstream and downstream transactions between the Group and its associate are recognised in the Group’s consolidated financial statements only to the extent of unrelated investor’s interests in the associates. Unrealised losses are eliminated unless the transaction provides evidence of an impairment of the asset transferred.
Dilution gains and losses arising in investments in associates are recognised in the in the profit or loss.
A N N U A L R E P O R T 2 0 1 656

RENAISSANCE SERVICES SAOG AND ITS SUBSIDIARY COMPANIES
NOTES TO THE CONSOLIDATED FINANCIAL STATEMENTSFOR THE YEAR ENDED 31 DECEMBER 2016
3 Summary of significant accounting policies (continued)Joint arrangements
The Group has applied IFRS 11 to all joint arrangements. Under IFRS 11, investments in joint arrangements are classified as either joint operations or joint ventures depending on the contractual rights and obligations of each investor. Joint ventures are accounted for using the equity method.
Under the equity method of accounting, interests in joint ventures are initially recognised at cost and adjusted thereafter to recognise the Group’s share of the post-acquisition profits or losses and movements in other comprehensive income. When the Group’s share of losses in a joint venture equals or exceeds its interest in the joint ventures (which includes any long-term interests that, in substance, form part of the group’s net investment in the joint ventures), the Group does not recognise further losses, unless it has incurred obligations or made payments on behalf of the joint ventures.
Unrealised gains on transactions between the Group and its joint ventures are eliminated to the extent of the Group’s interest in the joint ventures. Unrealised losses are also eliminated unless the transaction provides evidence of an impairment of the asset transferred. Accounting policies of the joint ventures have been changed where necessary to ensure consistency with the policies adopted by the Group.
Transactions eliminated on consolidation
Inter-company transactions, balances and unrealised gains on transactions between group companies are eliminated. Unrealised losses are also eliminated. When necessary, amounts reported by subsidiaries are adjusted to conform to the group’s accounting policies.
Accounting for business combinations
The Group applies the acquisition method to account for business combinations. The consideration transferred for the acquisition of a subsidiary is the fair value of the assets transferred, the liabilities incurred to the former owners of the acquiree and the equity interests issued by the Group. The consideration transferred includes the fair value of any asset or liability resulting from a contingent consideration arrangement. Identifiable assets acquired and liabilities, contingent liabilities assumed in a business combination are measured initially at their fair values at the acquisition date. The Group recognises any non-controlling interest in the acquiree on an acquisition-by-acquisition basis, either at fair value or at the non-controlling interest’s proportionate share of the recognised amounts of acquiree’s identifiable net assets. Acquisition-related costs are expensed as incurred.
If the business combination is achieved in stages, the acquisition date carrying value of the acquirer’s previously held equity interest in the acquiree is re-measured to fair value at the acquisition date; any gains or losses arising from such re-measurement are recognised in profit or loss.
Any contingent consideration to be transferred by the Group is recognised at fair value at the acquisition date. Subsequent changes to the fair value of contingent consideration that is deemed to be an asset or liability is recognised in accordance with IAS 39 either in profit or loss or as a change to other comprehensive income. Contingent consideration that is classified as equity is not re-measured, and its subsequent settlement is accounted within equity.
The excess of the consideration transferred, the amount of any non-controlling interest in the acquiree and the acquisition-date fair value of any previous equity interest in the acquiree over the fair value of the identifiable net assets acquired is recorded as goodwill. If the total of consideration transferred, non-controlling interest recognised and previously held interest measured is less than the fair value of the net assets of the subsidiary acquired in the case of a bargain purchase, the difference is recognised directly in the profit or loss.
57A N N U A L R E P O R T 2 0 1 6
RENAISSANCE SERVICES SAOG AND ITS SUBSIDIARY COMPANIES
NOTES TO THE CONSOLIDATED FINANCIAL STATEMENTSFOR THE YEAR ENDED 31 DECEMBER 2016
3 Summary of significant accounting policies (continued)
Disposal of subsidiaries
When the Group ceases to have control, any retained interest in the entity is re-measured to its fair value at the date when control is ceased, with the change in carrying amount recognised in profit or loss. The fair value is the initial carrying amount for the purposes of subsequently accounting for the retained interest as an associate, joint venture or a financial asset. In addition, any amounts previously recognised in other comprehensive income in respect of that entity are accounted for, as if the Group had directly disposed the related assets or liabilities. This may mean that amounts previously recognised in other comprehensive income are reclassified to the profit or loss.
Non-controlling interests
Transactions with non-controlling interests that do not result in loss of control are accounted for as equity transactions – that is, as transactions with the owners in their capacity as owners. The difference between fair value of any consideration paid and the relevant share acquired of the carrying value of net assets of the subsidiary is recorded in equity. Gains or losses on disposals to non-controlling interests are also recorded in equity.
Property, plant and equipment
Owned assets
Items of property, plant and equipment are stated at cost less accumulated depreciation and impairment losses, if any. Cost of marine vessels includes purchase price paid to third parties, including registration and legal documentation costs, all directly attributable costs incurred to bring the vessel into working condition at the area of planned use, mobilisation costs to the operating location, sea trial costs, significant rebuild expenditure incurred during the life of the asset and financing costs incurred during the construction period of vessels. In certain operating locations where the time taken for mobilisation is significant and the customer pays a mobilisation fee, certain mobilisation costs are charged to the profit or loss. Costs for other items of property, plant and equipment include expenditure that is directly attributable to the acquisition of the asset. When parts of an item of property, plant and equipment have different useful lives, they are accounted for as separate items of property, plant and equipment.
Subsequent expenditure
Expenditure incurred to replace a component of an item of property, plant and equipment that is accounted for separately, including major inspection and overhaul expenditure is capitalised. Other subsequent expenditure is capitalised only when it increases the future economic benefits embodied in property, plant and equipment. All other expenditure is recognised in the profit or loss as an expense as incurred.
Depreciation
Depreciation is charged to the profit or loss on a straight line basis over the estimated useful lives of items of property, plant and equipment. The estimated useful lives are as follows:
YearsBuildings and improvements 5 - 25Marine vessels and boats acquired 15 - 30Plant, machinery and office equipment 1 - 15Motor vehicles 3Furniture and fixtures 3 - 5
Freehold land is not depreciated. The cost of certain assets used on specific contracts is depreciated to estimated residual value over the period of the respective contract, including extensions if any. Depreciation method, useful lives and residual values are reviewed at each reporting date.
Vessels that are no longer being chartered and are held-for-sale are transferred to inventories at their carrying value.
A N N U A L R E P O R T 2 0 1 658
RENAISSANCE SERVICES SAOG AND ITS SUBSIDIARY COMPANIES
NOTES TO THE CONSOLIDATED FINANCIAL STATEMENTSFOR THE YEAR ENDED 31 DECEMBER 2016
3 Summary of significant accounting policies (continued)
Property, plant and equipment (continued)
Capital work-in-progress
Capital work-in-progress is stated at cost and comprises all costs including borrowing costs directly attributable to bringing the assets under construction ready for their intended use. Capital work-in-progress is transferred to property, plant and equipment at cost on completion. No depreciation is charged on capital work-in-progress.
Dry docking costs
The expenditure incurred on vessel dry docking, a component of property, plant and equipment, is amortised over the period from the date of dry docking, to the date on which the management estimates that the next dry docking is due which is generally between two to three years.
Vessel refurbishment costs on owned assetsOwned assets
Costs incurred to refurbish owned assets are capitalised within property, plant and equipment and then depreciated over the shorter of the estimated economic life of the related refurbishment or the remaining life of the vessel.
Intangible assets
Goodwill
Goodwill that arises on the acquisition of subsidiaries is presented within intangible assets. Goodwill is initially measured at the fair value of consideration transferred plus the recognised amount of any non-controlling interest in the acquiree plus, if the business combination is achieved in stages, the fair value of pre-existing equity interest in the acquiree, less the net recognised amount (generally fair value) of the identifiable assets acquired and liabilities assumed. Any negative goodwill is immediately recognised in profit or loss. Following initial recognition, goodwill is measured at cost less any accumulated impairment losses. Goodwill is reviewed for impairment, annually, or more frequently if events or changes in circumstances indicate that the carrying value may be impaired.
For the purpose of impairment testing, goodwill acquired in a business combination is, from the acquisition date, allocated to each of the Group’s cash-generating units, or Groups of cash-generating units, that are expected to benefit from the synergies of the combination, irrespective of whether other assets and liabilities of the Group are assigned to those units or Groups of units. Each unit or group of units to which the goodwill is so allocated:
• represents the lowest level within the Group at which the goodwill is monitored for internal management purposes; and
• is not larger than a segment based on the Group’s operating segment format determined in accordance with IFRS 8 - Operating Segments.
Impairment is determined by assessing the recoverable amount of the cash-generating unit (group of cash-generating units), to which the goodwill relates. Where the recoverable amount of the cash-generating unit (group of cash-generating units) is less than the carrying amount, an impairment loss is recognised. Where goodwill forms part of a cash-generating unit (group of cash-generating units) and part of the operation within that unit is disposed of, the goodwill associated with the operation disposed of is included in the carrying amount of the operation when determining the gain or loss on disposal of the operation. Goodwill disposed of in this circumstance is measured based on the relative values of the operation disposed of and the portion of the cash-generating unit retained.
59A N N U A L R E P O R T 2 0 1 6
RENAISSANCE SERVICES SAOG AND ITS SUBSIDIARY COMPANIES
NOTES TO THE CONSOLIDATED FINANCIAL STATEMENTSFOR THE YEAR ENDED 31 DECEMBER 2016
3 Summary of significant accounting policies (continued)
Other intangible assets
Other intangible assets acquired by the Group are measured on initial recognition at cost. The cost of intangible assets acquired in a business combination is their fair value as at the date of acquisition. Following initial recognition, intangible assets are carried at cost less accumulated amortisation and any accumulated impairment losses. The useful lives of other intangible assets are assessed to be finite and generally amortised over 5 to 10 years.
Intangible assets with finite lives are amortised over the useful life and assessed for impairment whenever there is an indication that the intangible asset may be impaired. The amortisation period and the amortisation method for an intangible asset with a finite useful life are reviewed at least at each financial year-end. Changes in the expected useful life or the expected pattern of consumption of future economic benefits embodied in the asset is accounted for by changing the amortisation period or method, as appropriate, and treated as changes in accounting estimates. The amortisation expense on intangible assets with finite lives is recognised in the profit or loss in the expense category consistent with the function of the intangible asset.
Financial assets
Classification
The Group classifies its financial assets in the following categories: at fair value through profit or loss, loans and receivables, and available-for-sale. The classification depends on the purpose for which the financial assets were acquired. Management determines the classification of its financial assets upon initial recognition.
Financial assets at fair value through profit or loss
Financial assets at fair value through profit or loss are financial assets held for trading. A financial asset is classified in this category if acquired principally for the purpose of selling in the short-term. Derivatives are also categorised as held for trading unless they are designated as hedges. Assets in this category are classified as current assets if expected to be settled within twelve months, otherwise they are classified as non-current.
Loans and receivables
Loans and receivables are non-derivative financial assets with fixed or determinable payments that are not quoted in an active market. They are included in current assets, except for maturities greater than twelve months after the end of the reporting period. These are classified as non-current assets. The Group’s loans and receivables comprise ‘trade and other receivables’, ‘other long term receivables’ and ‘cash and cash equivalents’ in the statement of financial position.
Available-for-sale financial assets
Available-for-sale financial assets are non-derivatives that are either designated in this category or not classified in any of the other categories. They are included in non-current assets unless the investment matures or management intends to dispose them within twelve months of the end of the reporting period.
A N N U A L R E P O R T 2 0 1 660
RENAISSANCE SERVICES SAOG AND ITS SUBSIDIARY COMPANIES
NOTES TO THE CONSOLIDATED FINANCIAL STATEMENTSFOR THE YEAR ENDED 31 DECEMBER 2016
3 Summary of significant accounting policies (continued)
Recognition and measurement
Regular purchases and sales of financial assets are recognised on the trade-date – the date on which the Group commits to purchase or sell the asset. Investments are initially recognised at fair value plus transaction costs for all financial assets not carried at fair value through profit or loss. Financial assets carried at fair value through profit or loss are initially recognised at fair value, and transaction costs are expensed in the profit or loss. Financial assets are derecognised when the rights to receive cash flows from the investments have expired or have been transferred and the Group has transferred substantially all risks and rewards of ownership. Available-for-sale financial assets and financial assets at fair value through profit or loss are subsequently carried at fair value. Loans and receivables are subsequently carried at amortised cost using the effective interest method.
Gains or losses arising from changes in the fair value of the ‘financial assets at fair value through profit or loss’ category are recognised in the profit or loss in the period in which they arise.
Changes in the fair value of monetary and non-monetary securities classified as available-for-sale are recognised in other comprehensive income.
When securities classified as available-for-sale are sold or impaired, the accumulated fair value adjustments recognised in equity are recognised in the profit or loss under ‘gains and losses from investment securities’.
Interest on available-for-sale securities calculated using the effective interest method is recognised in the profit or loss as part of finance income. Dividends on available-for-sale equity instruments are recognised in the profit or loss as part of other income when the Group’s right to receive payments is established.
Impairment of financial assets
Assets carried at amortised cost
The Group assesses at the end of each reporting period, whether there is objective evidence that a financial asset or group of financial assets are impaired. A financial asset or a group of financial assets are impaired and impairment losses are incurred only if there is objective evidence of impairment as a result of one or more events that occurred after the initial recognition of the asset (a ‘loss event’) and that loss event (or events) has an impact on the estimated future cash flows of the financial asset or group of financial assets that can be reliably estimated.
Evidence of impairment may include indications that the debtors or a group of debtors are experiencing significant financial difficulty, default or delinquency in interest or principal payments, the probability that they will enter bankruptcy or other financial reorganisation, and where observable data indicate that there is a measurable decrease in the estimated future cash flows, such as changes in arrears or economic conditions that correlate with defaults.
For loans and receivables category, the amount of the loss is measured as the difference between the asset’s carrying amount and the present value of estimated future cash flows (excluding future credit losses that have not been incurred) discounted at the financial asset’s original effective interest rate. The carrying amount of the asset is reduced and the amount of the loss is recognised in the profit or loss. If a loan or held-to-maturity investment has a variable interest rate, the discount rate for measuring any impairment loss is the current effective interest rate determined under the contract. As a practical expedient, the Group may measure impairment on the basis of an instrument’s fair value using an observable market price.
If, in a subsequent period, the amount of the impairment loss decreases and the decrease can be related objectively to an event occurring after the impairment was recognised (such as an improvement in the debtor’s credit rating), the reversal of the previously recognised impairment loss is recognised in the profit or loss.
61A N N U A L R E P O R T 2 0 1 6
RENAISSANCE SERVICES SAOG AND ITS SUBSIDIARY COMPANIES
NOTES TO THE CONSOLIDATED FINANCIAL STATEMENTSFOR THE YEAR ENDED 31 DECEMBER 2016
3 Summary of significant accounting policies (continued)
Impairment of financial assets (continued)
Assets classified as available-for-sale
The Group assesses at the end of each reporting period whether there is objective evidence that a financial asset or a group of financial assets are impaired. For debt securities, the Group uses the criteria explained above. In the case of equity investments classified as available-for-sale, a significant or prolonged decline in the fair value of the security below its cost is also evidence that the assets are impaired. If any such evidence exists for available-for-sale financial assets, the cumulative loss - measured as the difference between the acquisition cost and the current fair value, less any impairment loss on that financial asset previously recognised in profit or loss is removed from equity and recognised in the profit or loss. Impairment losses recognised in the consolidated statement of profit or loss on equity instruments are not reversed through the profit or loss. Any increase in fair value subsequent to an impairment loss is recognised in other comprehensive income. If, in a subsequent period, the fair value of a debt instrument classified as available-for-sale increases and the increase can be objectively related to an event occurring after the impairment loss was recognised in profit or loss, the impairment loss is reversed through the profit or loss.
Impairment of non-financial assets
Non-financial assets (other than goodwill)
The carrying amounts of the Group’s non-financial assets are reviewed at each reporting date to determine whether there is any indication of impairment. If any such indication exists, then the asset’s recoverable amount is estimated. An impairment loss is recognised if the carrying amount of an asset or its cash generating unit exceeds its recoverable amount. Impairment losses, are recognised in the profit or loss.
The recoverable amount of an asset or its cash generating unit is the greater of its value-in-use and its fair value less costs to sell. In assessing value-in-use, the estimated future cash flows are discounted to their present value using a pre-tax discount rate that reflects current market assessments of time value of money and risks specific to the asset. For the purpose of impairment testing, assets are grouped together into the smallest group of assets that generates cash inflows from continuing use that are largely independent of the cash inflows of other assets or groups of assets (the cash-generating unit).
Impairment losses recognised in prior periods are assessed at each reporting date for any indications that the loss has decreased or no longer exists. An impairment loss is reversed if there has been a change in the estimates used to determine the recoverable amount. An impairment loss is reversed only to the extent that the asset’s carrying amount does not exceed the carrying amount that would have been determined, net of depreciation or amortisation, if no impairment loss had been recognised.
Inventories
Inventories are valued at the lower of cost and net realisable value. Cost is determined applying the first-in, first-out and the weighted average methods depending on the category of inventory and includes all costs incurred in acquiring and bringing them to their present location and condition. Net realisable value signifies the estimated selling price in the ordinary course of business, less estimated costs of completion and selling expenses.
A N N U A L R E P O R T 2 0 1 662
RENAISSANCE SERVICES SAOG AND ITS SUBSIDIARY COMPANIES
NOTES TO THE CONSOLIDATED FINANCIAL STATEMENTSFOR THE YEAR ENDED 31 DECEMBER 2016
3 Summary of significant accounting policies (continued)
Trade and other receivables
Trade receivables are recognised initially at fair value and subsequently measured at amortised cost using the effective interest rate method, less provision for impairment. A provision for impairment of trade receivables is established when there is objective evidence that the Group will not be able to collect all amounts due according to the original terms of receivables. Significant financial difficulties of the debtor, probability that the debtor will enter bankruptcy or financial reorganisation, and default or delinquency in payments are considered indicators that the trade receivable is impaired.
Cash and cash equivalents
Cash and cash equivalents comprise cash at hand, bank balances and short-term deposits with an original maturity of three months or less. Bank borrowings that are repayable on demand and form an integral part of the Group’s cash management are included as a component of cash and cash equivalents for the purpose of statement of cash flows.
Deposits under lien
Cash, which is under lien and held by commercial banks, is classified as deposits under lien.
Share capital
Ordinary shares are classified as equity. Incremental costs directly attributable to the issue of ordinary shares are recognised as a deduction from equity, net of any tax effects.
Own equity instruments which are reacquired (treasury shares) are deducted from equity. No gain or loss is recognised in the profit or loss on the purchase, sale, issue or cancellation of the Group’s own equity instruments. Any gain or loss or income related to these shares is directly transferred to retained earnings and shown in the statement of changes in equity.
Gains and losses on measurement of transactions with shareholders are recognised in equity.
Perpetual notes
The perpetual notes are instruments issued by the Group with no fixed redemption date. The notes currently carry affixed periodic rate of 7.9% per annum, payable semi-annually in arrears. Coupon liability is recognised on the perpetual notes and the related charge recognised in equity, only upon occurrence of certain trigger events specified in the terms of perpetual notes. Management has accounted for these instruments as equity in the consolidated financial statements as the notes do not carry an obligation to make payments. The transaction costs incurred on issuance of these notes are deducted from equity.
Trade and other payables
Liabilities are recognised for amounts to be paid in the future for goods or services received, whether billed by the supplier or not. These are measured at amortised cost.
63A N N U A L R E P O R T 2 0 1 6
RENAISSANCE SERVICES SAOG AND ITS SUBSIDIARY COMPANIES
NOTES TO THE CONSOLIDATED FINANCIAL STATEMENTSFOR THE YEAR ENDED 31 DECEMBER 2016
3 Summary of significant accounting policies (continued)
Non-current assets (or disposal groups) classified as held-for-sale
Non-current assets (or disposal groups) are classified as assets held-for-sale when their carrying amount is to be recovered principally through a sale transaction and a sale is considered highly probable. They are stated at the lower of carrying amount and their fair value less costs to sell.
Discontinued operations
A discontinued operation is a component of an entity that either has been disposed of, or is classified as held-for- sale, and, represents a separate major line of business or geographical area of operations, is part of a single coordinated plan to dispose of a separate major line of business or geographical area of operations or is a subsidiary acquired exclusively with a view to resale. Results of discontinued operations are presented separately in the profit or loss.
Interest bearing borrowings
Borrowings are recognised initially at fair value, net of transaction costs incurred. Borrowings are subsequently carried at amortised cost; any difference between the proceeds (net of transaction costs) and the redemption value is recognised in the profit or loss over the period of the borrowings using the effective interest method.
Fees paid on the establishment of loan facilities are recognised as transaction costs of the loan to the extent that it is probable that some or all of the facility will be drawn down. In this case, the fee is deferred until the draw-down occurs. To the extent there is no evidence that it is probable that some or all of the facility will be drawn down, the fee is capitalised as a pre-payment for liquidity services and amortised over the period of the facility to which it relates.
Provisions
A provision is recognised in the statement of financial position when the Group has a legal or constructive obligation as a result of a past event, and it is probable that an outflow of economic benefit will be required to settle the obligation. If the effect is material, provisions are determined by discounting the expected future cash flows at a pre-tax rate that reflects current market assessments of the time value of money and, where appropriate, the risks specific to the liabilities.
Onerous contracts
A provision for onerous contract is recognised when the expected benefits to be derived by the Group from a contract are lower than the unavoidable costs of meeting its obligations under the contract. The provision is measured at the present value of the lower of the expected cost of terminating the contract and the expected net cost of continuing with the contract. Before a provision is established, the Group recognises any impairment loss on the assets associated with that contract.
A N N U A L R E P O R T 2 0 1 664
RENAISSANCE SERVICES SAOG AND ITS SUBSIDIARY COMPANIES
NOTES TO THE CONSOLIDATED FINANCIAL STATEMENTSFOR THE YEAR ENDED 31 DECEMBER 2016
3 Summary of significant accounting policies (continued)
Leases
Group as a lessee
Finance leases, which transfer to the Group, substantially all the risks and benefits incidental to ownership of the leased item, are capitalised at the inception of the lease at the fair value of the leased asset or, if lower, at the present value of the minimum lease payments. Subsequent to initial recognition, leased assets are depreciated over the shorter of the estimated useful life of the asset or the lease term, unless it is reasonably certain that the Group will obtain ownership by the end of the lease term. Lease payments are apportioned between the finance charges and reduction of the lease liability so as to achieve a constant rate of interest on the remaining balance of the liability. Finance charges are charged directly to the profit or loss.
Capitalised leased assets are depreciated over the estimated useful life of the asset or the lease term, whichever is less.
Leases where the lessor retains substantially all the risks and benefits of ownership of the asset are classified as operating leases and are not recognised in the Group’s statement of financial position. Operating lease payments are recognised as an expense in the profit or loss on a straight-line basis over the lease term. Lease incentives are recognised as an integral part of the total lease expense, over the term of the lease.
Group as a lessor
Finance leases, which transfer from the group substantially all of the risks and rewards incidental to ownership of the leased item, are recognised as a disposal of asset at the inception of the lease and are presented as receivables under a finance lease at an amount equal to the net investment in the finance lease. Lease receivables are apportioned between finance income and reductions of the receivables under a finance lease so as to achieve a constant periodic rate of return on the lessor’s net investment in the finance lease. Finance income earned is recognised in the profit or loss. Lease receivables due within one year are disclosed as current assets.
Employee benefits
Contributions to a defined contribution retirement plan for Omani employees, in accordance with the Oman social insurance scheme, are recognised as an expense in the profit or loss as incurred.
End of service benefits are accrued in accordance with the terms of employment of the Group’s employees at the reporting date, having regard to the requirements of the Oman Labour Law 2003, as amended (for employees working in Oman). Employee entitlements to annual leave and leave passage are recognised when they accrue to employees and an accrual is made for the estimated liability arising as a result of services rendered by employees up to the reporting date. These accruals are included in current liabilities, while that relating to end of service benefits is disclosed as a non-current liability. The entitlement to these benefits is based upon the employees’ salary and length of service, subject to completion of a minimum service period. The expected costs of these benefits are accrued over the period of employment.
For non-Omani companies the end of service benefits are provided as per the respective regulations in their country.
The Group also operates a defined benefit pension plan which defines the amount of pension benefit that an employee will receive on retirement, usually dependent on one or more factors such as age, years of service and compensation. The liability recognised in the statement of financial position in respect of defined benefit pension plans is the present value of the defined benefit obligation at the end of the reporting period less the fair value of plan assets. The defined benefit obligation is calculated annually by independent actuaries using the projected unit credit method. The present value of the defined benefit obligation is determined by discounting the estimated future cash outflows using interest rates of high-quality corporate bonds that are denominated in the currency in which the benefits will be paid, and that have terms to maturity approximating to the terms of the related pension obligation. In countries where there is no deep market in such bonds, the market rates on government bonds are used. Actuarial gains and losses arising from experience adjustments and changes in actuarial assumptions are charged or credited to equity in other comprehensive income in the period in which they arise. Past-service costs are recognised immediately in profit or loss.
65A N N U A L R E P O R T 2 0 1 6
RENAISSANCE SERVICES SAOG AND ITS SUBSIDIARY COMPANIES
NOTES TO THE CONSOLIDATED FINANCIAL STATEMENTSFOR THE YEAR ENDED 31 DECEMBER 2016
3 Summary of significant accounting policies (continued)
Dividend distribution
Dividends are recognised as a liability in the year in which they are approved by the company’s shareholders.
Revenue recognition
Marine services
Revenue comprises operating lease rent from charter of marine vessels, mobilisation income, and revenue from provision of on-board accommodation, catering services and sale of fuel and other consumables.
Lease rent income is recognised on a straight line basis over the period of the lease. Revenue from provision of on-board accommodation and catering services is recognised over the period of hire of such accommodation while revenue from sale of fuel and other consumables is recognised when delivered. Income generated from the mobilisation or demobilisation of the vessel to or from the location of charter under the vessel charter agreement is recognised over the period of the related charter party contract.
Goods sold and services rendered
Revenue from the sale of goods is recognised in the profit or loss when the significant risks and rewards of ownership have been transferred to the buyer i.e. when goods are delivered, accepted by the customer and the amount of revenue can be measured reliably.
Revenue from services rendered is recognised in the profit or loss in proportion to the stage of completion of the transaction in the accounting period in which the services are rendered and the right to receive the consideration is established. No revenue is recognised if there are significant uncertainties regarding the recovery of the consideration due, associated costs or the possible return of goods.
Maintenance contracts
Income from maintenance contracts is recognised in the profit or loss on a straight line basis evenly over the term of the contract.
Dividend income
Dividend income is recognised in the profit or loss on the date that the right to receive dividend is established.
Others
Sale of operating assets are shown as part of revenue and are recognised when the right to receive is established.
Interest expense and income
Interest expense on borrowings is calculated using the effective interest rate method. Financing costs are recognised as an expense in the profit or loss in the period in which they are incurred.
Borrowing costs comprise interest payable on borrowings. Borrowing costs directly attributable to the acquisition, construction or production of qualifying assets, which are assets that necessarily take a substantial period of time to get ready for their intended use or sale, are added to the cost of those assets, until such time as the assets are substantially ready for their intended use or sale. Investment income earned on the temporary investment of specific borrowings pending their expenditure on qualifying assets is deducted from the cost of those assets. All other borrowing costs are recognised as an expense in the year in which they are incurred. Borrowing costs are calculated using effective interest rate method.
Interest income is recognised in the profit or loss as it accrues, taking into account the effective yield on the asset.
A N N U A L R E P O R T 2 0 1 666

RENAISSANCE SERVICES SAOG AND ITS SUBSIDIARY COMPANIES
NOTES TO THE CONSOLIDATED FINANCIAL STATEMENTSFOR THE YEAR ENDED 31 DECEMBER 2016
3 Summary of significant accounting policies (continued)
Directors’ remuneration
The Board of Directors’ remuneration of the Parent Company is accrued within the limits specified by the Capital Market Authority and the requirements of the Commercial Companies Law of the Sultanate of Oman.
Segment reporting
An operating segment is the component of the Group that engages in business activities from which it may earn revenues and incur expenses, including revenue and expenses that relate to transaction with any of the Group’s other components, whose operating results are reviewed regularly by the Group CEO (being the chief operating decision maker) to make decisions about resources allocated to each segment and assess its performance, and for which discrete financial information is available.
Segment results that are reported to the Group CEO include items directly attributable to a segment as well as those that can be allocated on a reasonable basis. Unallocated items comprise mainly corporate assets and head office tax expenses.
Segment capital expenditure is the total cost incurred during the year to acquire property, plant and equipment, and intangible assets other than goodwill.
Income tax
Income tax is provided for in accordance with the fiscal regulations of the country in which the Group operates.
Income tax on the profit or loss for the year comprises current and deferred taxation. Income tax is recognised in the profit or loss except to the extent that it relates to items recognised directly in the equity or other comprehensive income.
Current tax is the expected tax payable on the taxable income for the year, using tax rates enacted or substantially enacted at the reporting date, and any adjustment to tax payable in respect of previous years.
Deferred tax is provided using the liability method, providing for temporary differences between the carrying amounts of assets and liabilities for financial reporting purposes and the amounts used for income tax purposes. Deferred tax is calculated on the basis of the tax rates that are expected to apply to the year when the asset is realised or the liability is settled based on tax rates (and tax laws) that have been enacted or substantially enacted by the reporting date. The tax effects on the temporary differences are disclosed under non-current liabilities as deferred tax.
A deferred tax asset is recognised only to the extent that it is probable that future taxable profits will be available against which the unused tax losses and credits can be utilised. The carrying amount of deferred tax assets is reviewed at reporting date and reduced to the extent that it is no longer probable that the related tax benefit will be realised.
Deferred tax assets and liabilities are offset if there is a legally enforceable right to offset current tax assets and liabilities and they relate to income taxes levied by the same tax authority on the same taxable entity, or on different taxable entities, but they intend to settle current tax assets and liabilities on a net basis or their tax assets and liabilities will be realised simultaneously.
In determining the amount of current and deferred tax, the Group takes into account the impact of uncertain tax positions and whether additional taxes and interest may be due. The assessment regarding adequacy of tax liability for open tax year relies on estimates and assumptions and may involve a series of judgments about future events. New information may become available that causes the Group to change its judgment regarding the adequacy of existing tax liabilities; such changes to tax liabilities will impact tax expense in the period that such a determination is made.
67A N N U A L R E P O R T 2 0 1 6
RENAISSANCE SERVICES SAOG AND ITS SUBSIDIARY COMPANIES
NOTES TO THE CONSOLIDATED FINANCIAL STATEMENTSFOR THE YEAR ENDED 31 DECEMBER 2016
3 Summary of significant accounting policies (continued)
Earnings per share
The Group presents basic and diluted earnings per share data for its ordinary shares. Basic earnings per share is calculated by dividing the profit or loss attributable to ordinary shareholders of the Parent Company by the weighted average number of ordinary shares outstanding during the year, adjusted for own shares held. Diluted earnings per share is calculated by adjusting the profit and loss attributable to ordinary shareholders and the weighted average number of ordinary shares outstanding to assume conversion of all dilutive potential ordinary shares.
Foreign currency
Transactions denominated in foreign currencies are translated to the respective functional currencies of the Group entities at exchange rates ruling at the dates of the transactions. Monetary assets and liabilities denominated in foreign currencies at the reporting date are retranslated to the functional currency at the exchange rate ruling at that date. The foreign currency gain or loss on monetary items is the difference between amortised cost in functional currency at the beginning of the year, adjusted for effective interest and payments during the year and the amortised cost in foreign currency translated at the exchange rate at the end of the year.
Non-monetary assets and liabilities denominated in foreign currencies that are measured at fair value are retranslated to the functional currency at the exchange rate at the date that the fair value was determined. Non-monetary items in a foreign currency that are measured based on historical cost are translated using the exchange rate at the date of the transaction.
Foreign operations
Foreign currency differences arising on retranslation are recognised in profit or loss except for differences arising in retranslation of a financial liability designated as a hedge of the net investment in a foreign operation, or qualifying cash flow hedges, to the extent these hedges are effective, which are recognised in other comprehensive income.
The assets and liabilities of foreign operations, including goodwill and fair value adjustments arising on acquisition, are translated to Rial Omani at exchange rates at the reporting date. The income and expenses of foreign operations are translated to Rial Omani at exchange rates at the date of the transaction. Foreign currency differences if any are recognised in other comprehensive income and are reflected in the exchange reserve in equity. When a foreign operation is disposed of, in part or in full, the relevant amount in the exchange reserve is transferred to profit or loss as part of the profit or loss on disposal. Foreign exchange gains and losses arising from a monetary item receivable from or payable to a foreign operation, the settlement of which is neither planned nor likely in the foreseeable future, are considered to form part of net investment in a foreign operation and are recognised in other comprehensive income, and are presented within the equity in the translation reserve.
A N N U A L R E P O R T 2 0 1 668
RENAISSANCE SERVICES SAOG AND ITS SUBSIDIARY COMPANIES
NOTES TO THE CONSOLIDATED FINANCIAL STATEMENTSFOR THE YEAR ENDED 31 DECEMBER 2016
3 Summary of significant accounting policies (continued)Derivatives
Derivatives are stated at fair value.
For the purpose of hedge accounting, hedges are classified into two categories: (a) fair value hedges which hedge the exposure to changes in the fair value of a recognised asset or liability; and (b) cash flow hedges which hedge exposure to variability in cash flows of a recognised asset or liability or a highly probable transaction.
The Group holds derivative financial instruments to hedge its foreign currency and interest rate risk exposures.
On initial designation of the hedge, the Group formally documents the relationship between the hedging instrument and hedged item, including the risk management objectives and strategy in undertaking the hedge transaction, together with the methods that will be used to assess the effectiveness of the hedging relationship. The Group makes an assessment, both at the inception of the hedge relationship as well as on an ongoing basis, whether the hedging instruments are expected to be ‘highly effective’ in offsetting the changes in the fair value or cash flows of the respective hedged items during the period for which the hedge is designated, and whether the actual results of each hedge are within a range of 80-125 percent. For a cash flow hedge of a forecast transaction, the transaction should be highly probable to occur and should present an exposure to variations in cash flows that could ultimately affect reported profit or loss.
Derivatives are recognised initially at fair value. Attributable transaction costs are recognised in profit or loss as incurred. Subsequent to initial recognition, derivatives are measured at fair value, and changes therein are accounted for as described below.
Cash flow hedges
When a derivative is designated as the hedging instrument in a hedge of the variability in cash flows attributable to a particular risk associated with a recognised asset or liability or a highly probable forecast transaction that could affect profit or loss, the effective portion of changes in the fair value of the derivative is recognised in other comprehensive income and presented in the hedging reserve in equity. Any ineffective portion of changes in the fair value of the derivative is recognised immediately in profit or loss.
If the hedging instrument no longer meets the criteria for hedge accounting, expires or is sold, terminated, exercised, or the designation is revoked, then hedge accounting is discontinued prospectively. The cumulative gain or loss previously recognised in other comprehensive income and presented in the hedging reserve in equity remains there until the forecast transaction affects profit or loss. When the hedged item is a non-financial asset, the amount recognised in other comprehensive income is transferred to the carrying amount of the asset when the asset is recognised. If the forecast transaction is no longer expected to occur, then the balance in other comprehensive income is recognised immediately in profit or loss. In other cases, the amount recognised in other comprehensive income is transferred to profit or loss in the same period that the hedged item affects profit or loss.
69A N N U A L R E P O R T 2 0 1 6
RENAISSANCE SERVICES SAOG AND ITS SUBSIDIARY COMPANIES
NOTES TO THE CONSOLIDATED FINANCIAL STATEMENTSFOR THE YEAR ENDED 31 DECEMBER 2016
3 Summary of significant accounting policies (continued)
Derivatives (continued)
Other non-trading derivatives
When a derivative financial instrument is not designated in a hedge relationship that qualifies for hedge accounting, all changes in its fair value are recognised immediately in the profit or loss.
Determination of fair values
Certain of the Group’s accounting policies and disclosures require the determination of fair value, for both financial and non-financial assets and liabilities. Fair values have been determined for measurement and/or disclosure purposes based on the following methods. When applicable, further information about the assumptions made in determining fair values is disclosed in the notes specific to the asset or liability.
Investments
For investments traded in organised financial markets, fair value is determined by reference to Stock Exchange quoted market bid prices at the close of business on the reporting date. (Level 1).
For unquoted investments, a reasonable estimate of the fair value is determined by reference to the market value of a similar investment or is based on the expected discounted cash flows (Level 2).
Fair value cannot be reliably measured for certain unquoted investments. Such investments are measured at cost. (Level 3).
Other interest bearing items
The fair value of interest-bearing items is estimated based on discounted cash flows using market interest rates for items with similar terms and risk characteristics. (Level 2).
4 Financial risk management
Financial risks factors
Financial instruments carried on the statement of financial position comprise investments, other long-term receivables, trade receivables, amount due from related parties, cash in hand and at bank, term loans, bank borrowings, trade and other payables and amount due to related parties.
The Group has exposure to the following risks from its use of financial instruments: • Credit risk• Liquidity risk• Market risk
This note presents information about the Group’s exposure to each of the above risks, the Group’s objectives, policies and processes for measuring and managing risk, and the management of capital. Further quantitative disclosures are included throughout these financial statements.
The Board of Directors has overall responsibility for the establishment and oversight of the Group’s risk management framework. The Group’s risk management policies are established to identify and analyse the risks faced by the Group, to set appropriate risk limits and controls, and to monitor risks and adherence to limits. Risk management policies and systems are reviewed regularly to reflect changes in market conditions and the Group’s activities. The Group, through its training and management standards and procedures, aims to develop a disciplined and constructive control environment in which all employees understand their roles and obligations.
The Audit Committee oversees how management monitors compliance with the Group’s risk management policies and procedures, and reviews the adequacy of the risk management framework in relation to the risks faced by the Group. The Audit Committee is assisted in its oversight role by Internal Audit. Internal Audit undertakes both regular and ad-hoc reviews of risk management controls and procedures, the results of which are reported to the Audit Committee.
A N N U A L R E P O R T 2 0 1 670
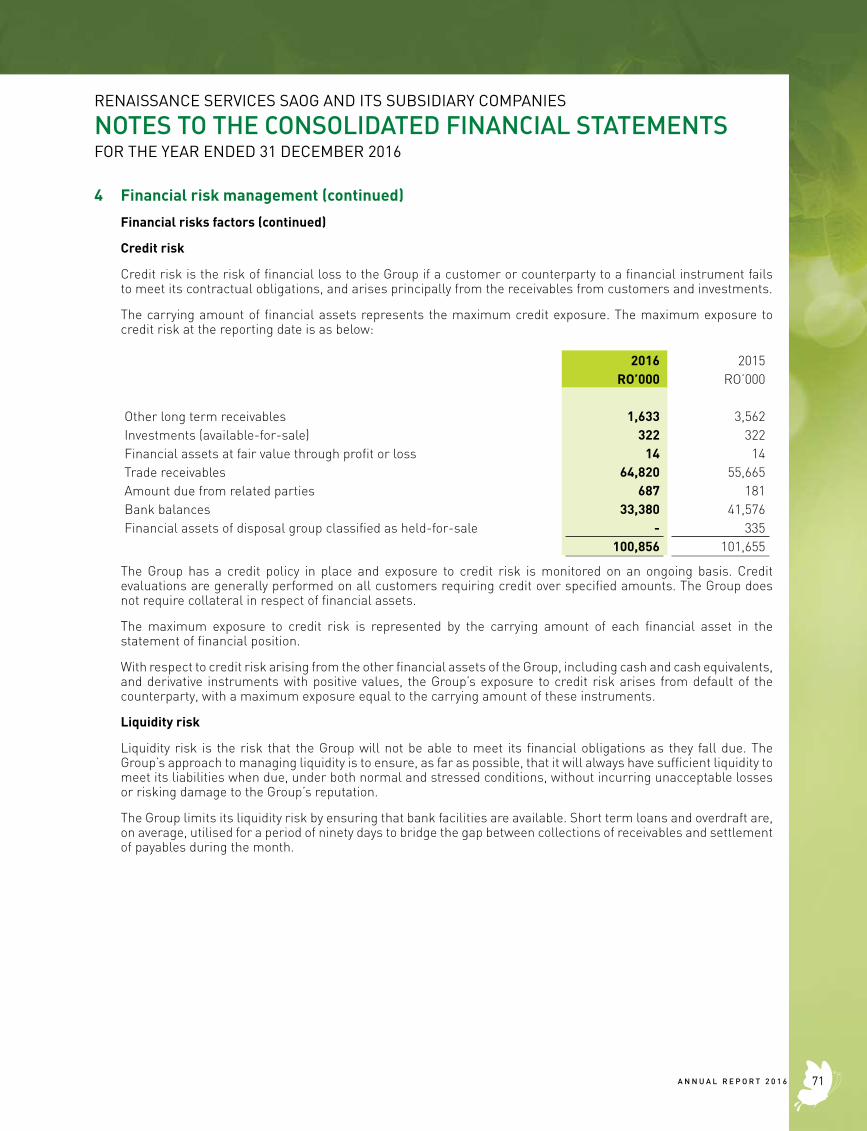
RENAISSANCE SERVICES SAOG AND ITS SUBSIDIARY COMPANIES
NOTES TO THE CONSOLIDATED FINANCIAL STATEMENTSFOR THE YEAR ENDED 31 DECEMBER 2016
4 Financial risk management (continued)
Financial risks factors (continued)
Credit risk
Credit risk is the risk of financial loss to the Group if a customer or counterparty to a financial instrument fails to meet its contractual obligations, and arises principally from the receivables from customers and investments.
The carrying amount of financial assets represents the maximum credit exposure. The maximum exposure to credit risk at the reporting date is as below:
2016 2015RO’000 RO’000
Other long term receivables 1,633 3,562Investments (available-for-sale) 322 322Financial assets at fair value through profit or loss 14 14Trade receivables 64,820 55,665Amount due from related parties 687 181Bank balances 33,380 41,576Financial assets of disposal group classified as held-for-sale - 335
100,856 101,655
The Group has a credit policy in place and exposure to credit risk is monitored on an ongoing basis. Credit evaluations are generally performed on all customers requiring credit over specified amounts. The Group does not require collateral in respect of financial assets.
The maximum exposure to credit risk is represented by the carrying amount of each financial asset in the statement of financial position.
With respect to credit risk arising from the other financial assets of the Group, including cash and cash equivalents, and derivative instruments with positive values, the Group’s exposure to credit risk arises from default of the counterparty, with a maximum exposure equal to the carrying amount of these instruments.
Liquidity risk
Liquidity risk is the risk that the Group will not be able to meet its financial obligations as they fall due. The Group’s approach to managing liquidity is to ensure, as far as possible, that it will always have sufficient liquidity to meet its liabilities when due, under both normal and stressed conditions, without incurring unacceptable losses or risking damage to the Group’s reputation.
The Group limits its liquidity risk by ensuring that bank facilities are available. Short term loans and overdraft are, on average, utilised for a period of ninety days to bridge the gap between collections of receivables and settlement of payables during the month.
71A N N U A L R E P O R T 2 0 1 6
RENAISSANCE SERVICES SAOG AND ITS SUBSIDIARY COMPANIES
NOTES TO THE CONSOLIDATED FINANCIAL STATEMENTSFOR THE YEAR ENDED 31 DECEMBER 2016
4 Financial risk management (continued)
Financial risks factors (continued)
Liquidity risk (continued)
The contractual maturities of financial liabilities, including estimated interest payments and excluding the impact of netting agreements at reporting date is as below:
31 December 2016Carrying
amountContractual
cash flowsUpto
1 year1 year to 5
yearsMore than 5
yearsRO’000 RO’000 RO’000 RO’000 RO’000
Borrowings 374,527 461,711 42,532 298,842 120,338Equity settled mandatory convertible bonds 11,994 262 262 - -Short-term borrowings and bank overdrafts 5,064 5,064 5,064 - -Trade and other payables (including derivatives) 79,694 79,694 60,871 18,823 -
471,279 546,731 108,729 317,665 120,338
31 December 2015Borrowings 352,753 448,850 56,092 270,583 122,175Equity settled mandatory convertible bonds 21,826 995 504 491 -Short-term borrowings and bank overdrafts 7,717 7,717 7,717 - -Trade and other payables (including derivatives) 66,539 66,539 43,831 22,708 -
448,835 524,101 108,144 293,782 122,175
Market risk
Market risk is the risk that changes in market prices, such as foreign exchange rates, interest rates and equity prices will affect the Group’s income or the value of its holdings of financial instruments. The objective of market risk management is to manage and control market risk exposures within acceptable parameters, while optimising the return on risk.
The Group also enters into derivative transactions, primarily interest rate swaps and forward currency contracts. The purpose is to manage the interest rate and currency risks arising from the Group’s operations and its sources of finance.
Foreign exchange risk
Trade accounts payable include amounts due in foreign currencies, mainly US Dollar, Euro, Pounds Sterling, UAE Dirham, Singapore Dollar, Norwegian Kroner, Kazakhstan Tenge, Nigerian Naira and Azerbaijan New Manat.
As Rial Omani (RO) is pegged to the US Dollar, the risk of transactions made in US Dollar is considered minimal. With respect to other currencies mentioned above, should the Rial Omani (RO) weaken / strengthen by 5%, with all other variables held constant, the resulting impact on the Group’s consolidated financial statements is considered to be insignificant.
A N N U A L R E P O R T 2 0 1 672
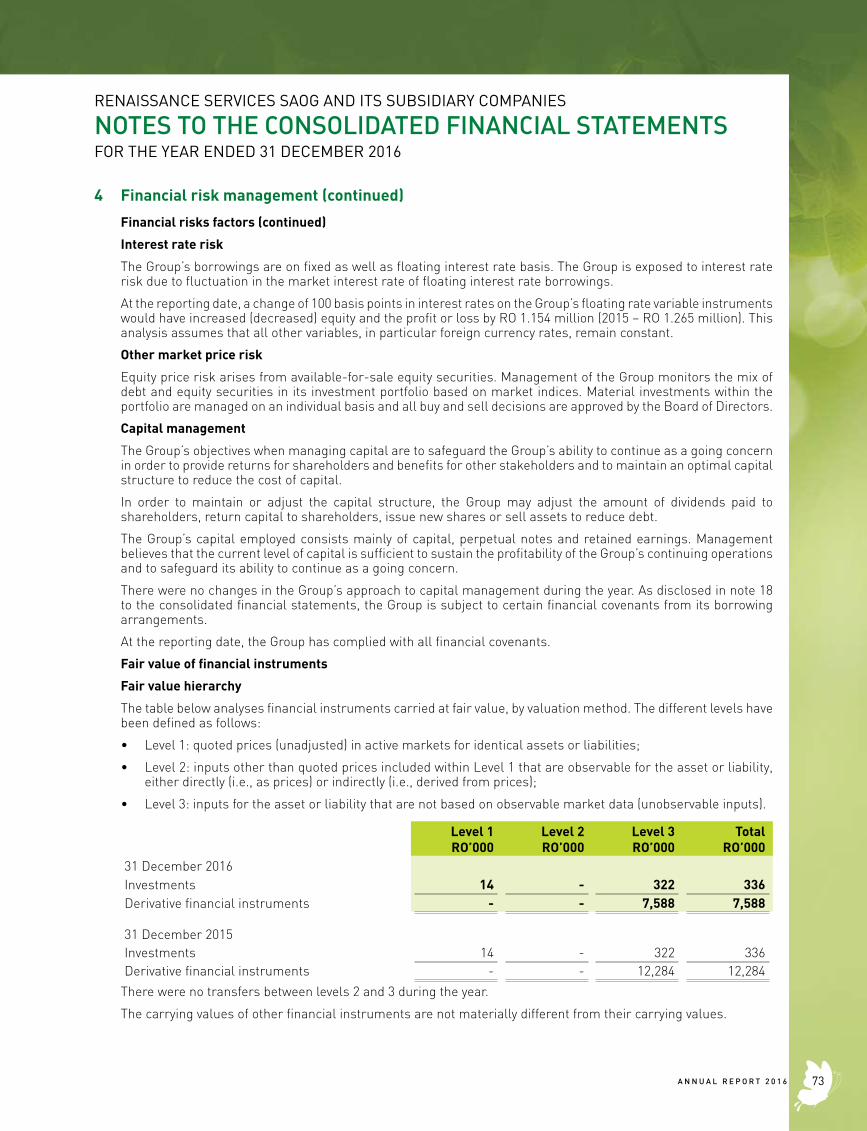
RENAISSANCE SERVICES SAOG AND ITS SUBSIDIARY COMPANIES
NOTES TO THE CONSOLIDATED FINANCIAL STATEMENTSFOR THE YEAR ENDED 31 DECEMBER 2016
4 Financial risk management (continued)
Financial risks factors (continued)
Interest rate risk
The Group’s borrowings are on fixed as well as floating interest rate basis. The Group is exposed to interest rate risk due to fluctuation in the market interest rate of floating interest rate borrowings.
At the reporting date, a change of 100 basis points in interest rates on the Group’s floating rate variable instruments would have increased (decreased) equity and the profit or loss by RO 1.154 million (2015 – RO 1.265 million). This analysis assumes that all other variables, in particular foreign currency rates, remain constant.
Other market price risk
Equity price risk arises from available-for-sale equity securities. Management of the Group monitors the mix of debt and equity securities in its investment portfolio based on market indices. Material investments within the portfolio are managed on an individual basis and all buy and sell decisions are approved by the Board of Directors.
Capital management
The Group’s objectives when managing capital are to safeguard the Group’s ability to continue as a going concern in order to provide returns for shareholders and benefits for other stakeholders and to maintain an optimal capital structure to reduce the cost of capital.
In order to maintain or adjust the capital structure, the Group may adjust the amount of dividends paid to shareholders, return capital to shareholders, issue new shares or sell assets to reduce debt.
The Group’s capital employed consists mainly of capital, perpetual notes and retained earnings. Management believes that the current level of capital is sufficient to sustain the profitability of the Group’s continuing operations and to safeguard its ability to continue as a going concern.
There were no changes in the Group’s approach to capital management during the year. As disclosed in note 18 to the consolidated financial statements, the Group is subject to certain financial covenants from its borrowing arrangements.
At the reporting date, the Group has complied with all financial covenants.
Fair value of financial instruments
Fair value hierarchy
The table below analyses financial instruments carried at fair value, by valuation method. The different levels have been defined as follows:
• Level 1: quoted prices (unadjusted) in active markets for identical assets or liabilities;
• Level 2: inputs other than quoted prices included within Level 1 that are observable for the asset or liability, either directly (i.e., as prices) or indirectly (i.e., derived from prices);
• Level 3: inputs for the asset or liability that are not based on observable market data (unobservable inputs).
Level 1RO’000
Level 2RO’000
Level 3RO’000
TotalRO’000
31 December 2016Investments 14 - 322 336Derivative financial instruments - - 7,588 7,588
31 December 2015Investments 14 - 322 336Derivative financial instruments - - 12,284 12,284
There were no transfers between levels 2 and 3 during the year.
The carrying values of other financial instruments are not materially different from their carrying values.
73A N N U A L R E P O R T 2 0 1 6
RENAISSANCE SERVICES SAOG AND ITS SUBSIDIARY COMPANIES
NOTES TO THE CONSOLIDATED FINANCIAL STATEMENTSFOR THE YEAR ENDED 31 DECEMBER 2016
5 Critical accounting estimates and judgements
Judgements
In the process of applying the Group’s accounting policies, management has made the following significant judgements, apart from those involving estimations, which have the most significant effect in the amounts recognised in the consolidated financial statements:
Leases
Where the group acts as a lessor, management exercises judgment in assessing whether a lease is a finance lease or an operating lease. The judgement as to which category applies to a specific lease depends on management’s assessment of whether in substance the risks and rewards of ownership of the assets have been transferred to the lessee. In the instances where management estimates that the risks and rewards have been transferred, the lease is considered as a finance lease, otherwise it is accounted for as an operating lease.
The Group’s property, plant and equipment include marine crafts such as barges and other vessels of a specialist nature capable of operating in difficult climatic conditions. Although these vessels are currently leased to customers under contracts which contain purchase options, the leases have been judged by management to be operating leases.
Where the Group acts as a lessor, management have based this judgement on a number of factors that indicate that, in substance, the risks and rewards of owning these vessels remain with the Group, which include:
• the lease periods are generally for a short term (10 years) when compared with the overall estimated economic life of the vessels (30 years or more);
• the leases do not automatically transfer the ownership of the vessels at the end of the lease term;
• the Group is responsible for regular dry-docking and insurance in addition to maintenance of the vessels;
• the customer is unlikely to want to bear the cost and responsibility of owning and maintaining these specialised vessels and is, therefore, unlikely to exercise options to purchase;
• the recent renewal by the customer of one major leasing contract for a secondary period despite the purchase option being available to the lessee; and
• the expectation that the customer would wish to renew its contracts for the leases of the vessels from the Group due to the Group’s proven track record and established support and services infrastructure in the region of operation.
Provisions
In line with the Group’s accounting policy, management’s judgement is that the nature of the Group’s financing of its long term operating assets having useful life of 25 to 30 years, primarily through term loans with average tenure of 7 to 8 years, creates a constructive obligation to arrange re-financing of debt on an on-going basis, as and when circumstances permit. Management, therefore, view the related refinancing and arrangement fees to be part of on-going costs of finance and have created a provision for such costs and for other constructive liabilities in an amount of RO 7.4 million (2015 – RO 5.9 million) included in accrued expenses, provisions and other payables.
Estimates and assumptions
The preparation of consolidated financial statements requires management to make estimates and assumptions that affect the application of accounting policies and reported amounts of assets and liabilities, income and expenses. Actual results may differ from these estimates.
Estimates and underlying assumptions are reviewed on an ongoing basis. Revisions to accounting estimates are recognised in the period in which the estimate is revised and in any future periods affected.
The key assumptions concerning the future and other key sources of estimation uncertainty at the reporting date, that have a significant risk of causing a material adjustment to the carrying amounts of assets and liabilities within the next financial year are discussed below.
A N N U A L R E P O R T 2 0 1 674
RENAISSANCE SERVICES SAOG AND ITS SUBSIDIARY COMPANIES
NOTES TO THE CONSOLIDATED FINANCIAL STATEMENTSFOR THE YEAR ENDED 31 DECEMBER 2016
5 Critical accounting estimates and judgements (continued)
Impairment of goodwill
The Group determines whether goodwill is impaired at least on an annual basis. This requires an estimation of the value in use of the cash-generating units to which the goodwill is allocated. Estimating the value in use requires the Group to make an estimate of the expected future cash flows from the cash-generating unit and also to choose a suitable discount rate in order to calculate the present value of those cash flows. These calculations use current year actual free cash flows determined from EBITDA, which is extrapolated using the estimated growth rate of 3%. The growth rate does not exceed the long-term average growth rate of the business in which the CGU operates. The net carrying amount of goodwill at 31 December 2016 was RO 32.381 million (2015 - RO 31.431 million).
Impairment of vessels
The Group determines whether its vessels are impaired when there are indicators of impairment as defined in IAS 36. This requires an estimation of the value-in-use of the cash-generating unit, which is the vessel owning and chartering segment. Estimating the value-in-use requires the Group to make an estimate of the expected future cash flows from this cash-generating unit and also to choose a suitable discount rate in order to calculate the present value of those cash flows. The Group used an estimated growth rate of 3% to extrapolate the cash flows used for value-in-use. The carrying value of the vessels as at 31 December 2016 was RO 404.879 million (2015: RO 453.706 million).
The recoverable amount of all vessels has been determined based on value in use calculations where the fair value less cost to sell was lower than the carrying amount. These calculations use pre-tax cash flow projections based on the financial budgets approved by the management covering a period of 5 years based on the expected utilization rates of the individual vessels. Cash flows beyond five years are estimated using a nil growth rate.
Impairment of accounts receivable
An estimate of the collectible amount of trade accounts receivable is made when collection of the full amount is no longer probable. For individually significant amounts, this estimation is performed on an individual basis. Amounts which are not individually significant, but which are past due, are assessed collectively and a provision applied according to the length of time past due, based on historical recovery rates.
At the reporting date, gross trade accounts receivable were RO 67.881 million (2015 – RO 64.380 million) and the provision for doubtful debts was RO 3.061 million (2015: RO 8.715 million). Any difference between the amounts actually collected in future periods and the amounts expected will be recognised in the profit or loss.
Impairment of inventories
Inventories are held at the lower of cost and net realisable value. When inventories become old or obsolete, an estimate is made of their net realisable value. For individually significant amounts this estimation is performed on an individual basis.
At the reporting date, gross inventories were RO 4.869 million (2015 - RO 4.103 million) and no provisions for old and obsolete inventories was recorded, based on management assessment (2015 - RO Nil). Any difference between the amounts actually realised in future periods and the amounts expected will be recognised in the profit or loss.
Useful lives of tangible and intangible assets
The useful lives, residual values and methods of depreciation / amortization of property, plant and equipment and other intangible assets are reviewed, and adjusted if appropriate, at each financial year end. In the review process, the Group takes guidance from recent acquisitions, as well as market and industry trends.
Provision for tax and deferred tax
The Group reviews the provision for tax on a regular basis. In determining the provision for tax, laws of particular jurisdictions (where applicable entity is registered) are taken into account. The management considers the provision for tax to be a reasonable estimate of potential tax liability after considering the applicable laws and past experience.
Management has evaluated the available evidence about future taxable income and other possible sources of realization of income tax assets, and the amount recognized has been limited to the amount that, based on management’s best estimate, is more likely than not to be realized.
75A N N U A L R E P O R T 2 0 1 6
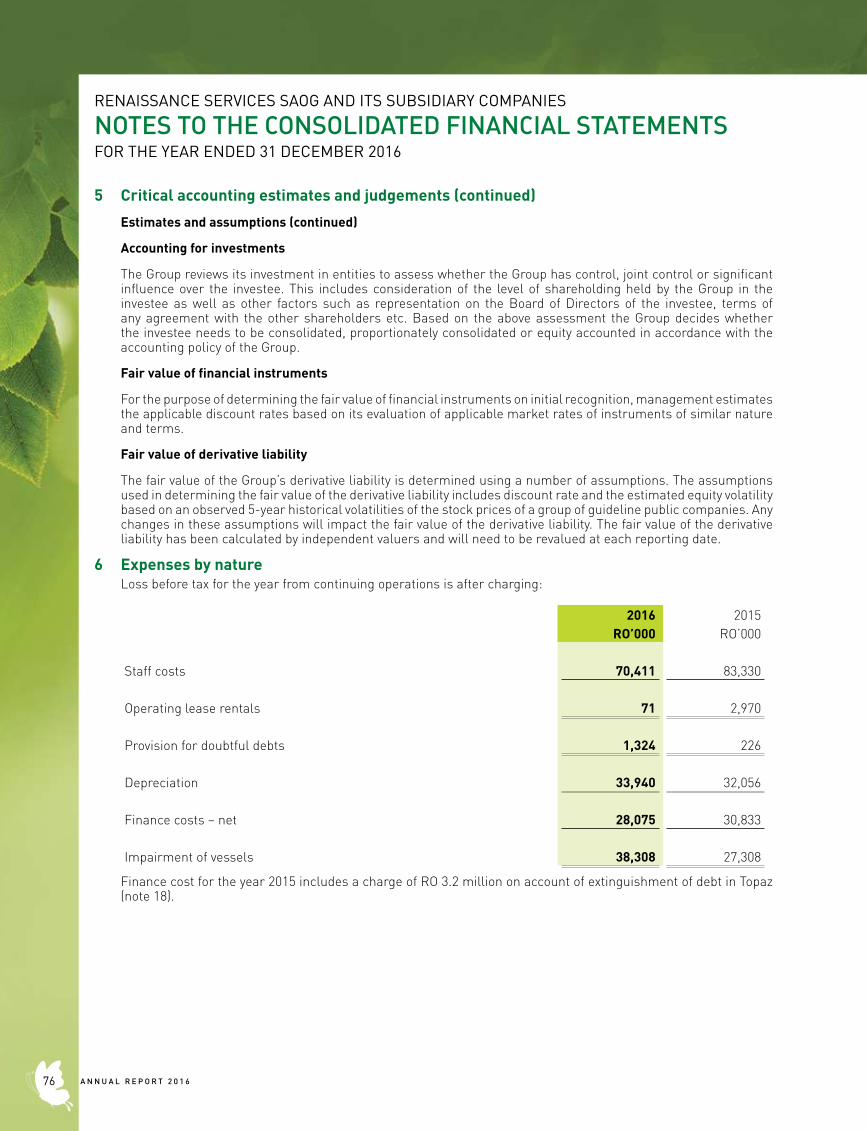
RENAISSANCE SERVICES SAOG AND ITS SUBSIDIARY COMPANIES
NOTES TO THE CONSOLIDATED FINANCIAL STATEMENTSFOR THE YEAR ENDED 31 DECEMBER 2016
5 Critical accounting estimates and judgements (continued)
Estimates and assumptions (continued)
Accounting for investments
The Group reviews its investment in entities to assess whether the Group has control, joint control or significant influence over the investee. This includes consideration of the level of shareholding held by the Group in the investee as well as other factors such as representation on the Board of Directors of the investee, terms of any agreement with the other shareholders etc. Based on the above assessment the Group decides whether the investee needs to be consolidated, proportionately consolidated or equity accounted in accordance with the accounting policy of the Group.
Fair value of financial instruments
For the purpose of determining the fair value of financial instruments on initial recognition, management estimates the applicable discount rates based on its evaluation of applicable market rates of instruments of similar nature and terms.
Fair value of derivative liability
The fair value of the Group’s derivative liability is determined using a number of assumptions. The assumptions used in determining the fair value of the derivative liability includes discount rate and the estimated equity volatility based on an observed 5-year historical volatilities of the stock prices of a group of guideline public companies. Any changes in these assumptions will impact the fair value of the derivative liability. The fair value of the derivative liability has been calculated by independent valuers and will need to be revalued at each reporting date.
6 Expenses by natureLoss before tax for the year from continuing operations is after charging:
2016 2015RO’000 RO’000
Staff costs 70,411 83,330
Operating lease rentals 71 2,970
Provision for doubtful debts 1,324 226
Depreciation 33,940 32,056
Finance costs – net 28,075 30,833
Impairment of vessels 38,308 27,308
Finance cost for the year 2015 includes a charge of RO 3.2 million on account of extinguishment of debt in Topaz (note 18).
A N N U A L R E P O R T 2 0 1 676
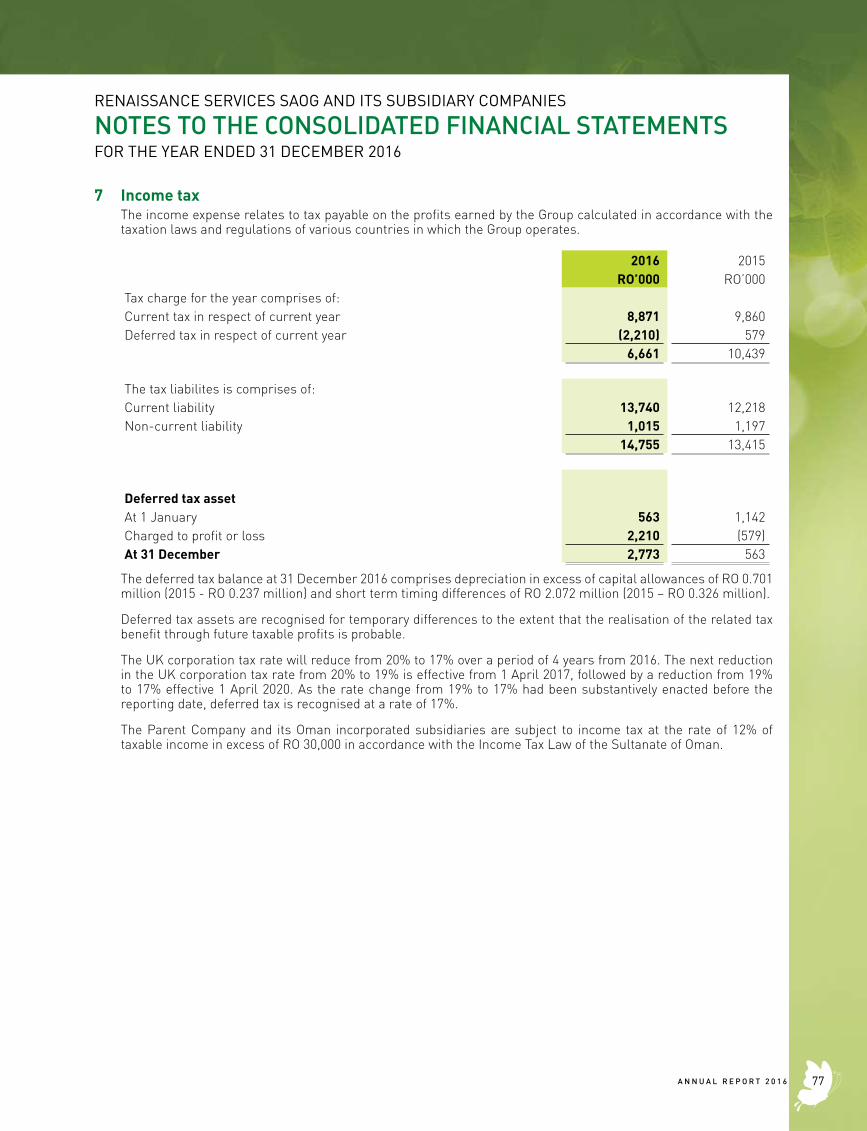
RENAISSANCE SERVICES SAOG AND ITS SUBSIDIARY COMPANIES
NOTES TO THE CONSOLIDATED FINANCIAL STATEMENTSFOR THE YEAR ENDED 31 DECEMBER 2016
7 Income taxThe income expense relates to tax payable on the profits earned by the Group calculated in accordance with the taxation laws and regulations of various countries in which the Group operates.
2016 2015RO’000 RO’000
Tax charge for the year comprises of:Current tax in respect of current year 8,871 9,860Deferred tax in respect of current year (2,210) 579
6,661 10,439
The tax liabilites is comprises of: Current liability 13,740 12,218Non-current liability 1,015 1,197
14,755 13,415
Deferred tax assetAt 1 January 563 1,142Charged to profit or loss 2,210 (579)At 31 December 2,773 563
The deferred tax balance at 31 December 2016 comprises depreciation in excess of capital allowances of RO 0.701 million (2015 - RO 0.237 million) and short term timing differences of RO 2.072 million (2015 – RO 0.326 million).
Deferred tax assets are recognised for temporary differences to the extent that the realisation of the related tax benefit through future taxable profits is probable.
The UK corporation tax rate will reduce from 20% to 17% over a period of 4 years from 2016. The next reduction in the UK corporation tax rate from 20% to 19% is effective from 1 April 2017, followed by a reduction from 19% to 17% effective 1 April 2020. As the rate change from 19% to 17% had been substantively enacted before the reporting date, deferred tax is recognised at a rate of 17%.
The Parent Company and its Oman incorporated subsidiaries are subject to income tax at the rate of 12% of taxable income in excess of RO 30,000 in accordance with the Income Tax Law of the Sultanate of Oman.
77A N N U A L R E P O R T 2 0 1 6
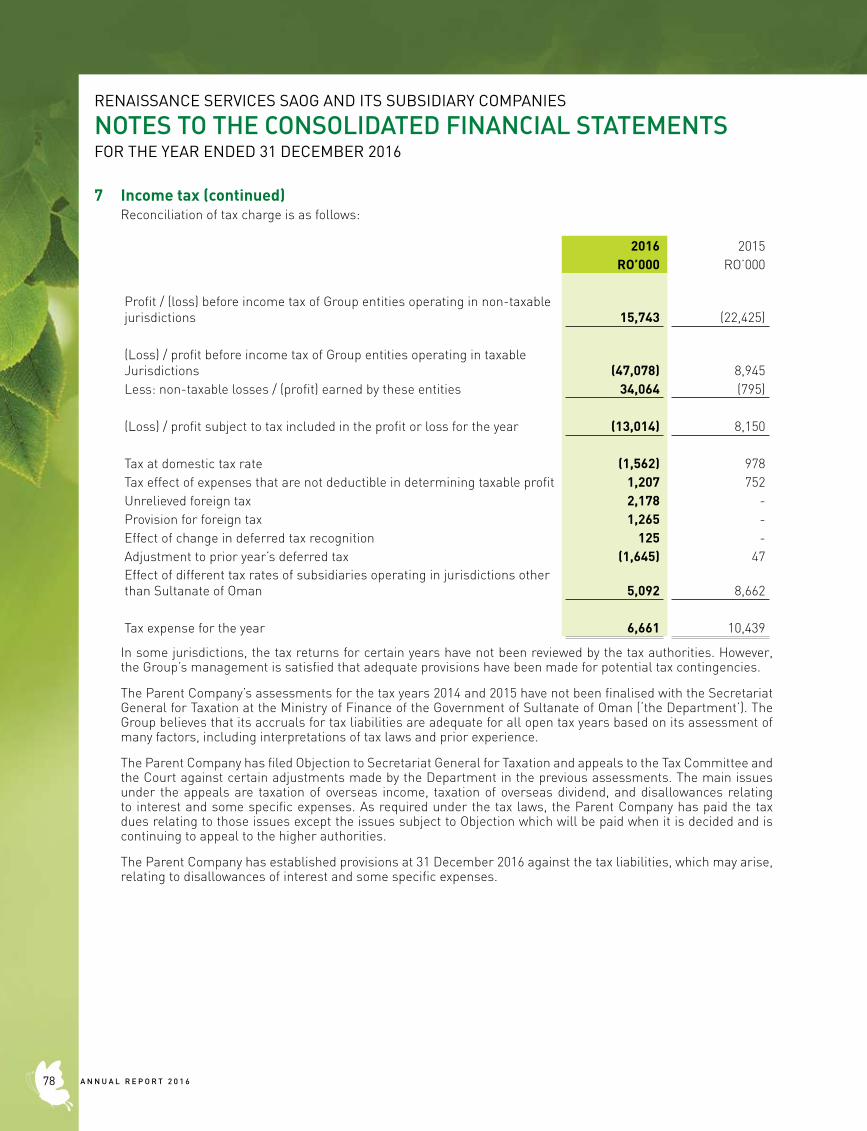
RENAISSANCE SERVICES SAOG AND ITS SUBSIDIARY COMPANIES
NOTES TO THE CONSOLIDATED FINANCIAL STATEMENTSFOR THE YEAR ENDED 31 DECEMBER 2016
7 Income tax (continued)Reconciliation of tax charge is as follows:
2016 2015RO’000 RO’000
Profit / (loss) before income tax of Group entities operating in non-taxable jurisdictions 15,743 (22,425)
(Loss) / profit before income tax of Group entities operating in taxable Jurisdictions (47,078) 8,945Less: non-taxable losses / (profit) earned by these entities 34,064 (795)
(Loss) / profit subject to tax included in the profit or loss for the year (13,014) 8,150
Tax at domestic tax rate (1,562) 978Tax effect of expenses that are not deductible in determining taxable profit 1,207 752Unrelieved foreign tax 2,178 -Provision for foreign tax 1,265 -Effect of change in deferred tax recognition 125 -Adjustment to prior year’s deferred tax (1,645) 47Effect of different tax rates of subsidiaries operating in jurisdictions other than Sultanate of Oman 5,092 8,662
Tax expense for the year 6,661 10,439
In some jurisdictions, the tax returns for certain years have not been reviewed by the tax authorities. However, the Group’s management is satisfied that adequate provisions have been made for potential tax contingencies.
The Parent Company’s assessments for the tax years 2014 and 2015 have not been finalised with the Secretariat General for Taxation at the Ministry of Finance of the Government of Sultanate of Oman (‘the Department’). The Group believes that its accruals for tax liabilities are adequate for all open tax years based on its assessment of many factors, including interpretations of tax laws and prior experience.
The Parent Company has filed Objection to Secretariat General for Taxation and appeals to the Tax Committee and the Court against certain adjustments made by the Department in the previous assessments. The main issues under the appeals are taxation of overseas income, taxation of overseas dividend, and disallowances relating to interest and some specific expenses. As required under the tax laws, the Parent Company has paid the tax dues relating to those issues except the issues subject to Objection which will be paid when it is decided and is continuing to appeal to the higher authorities.
The Parent Company has established provisions at 31 December 2016 against the tax liabilities, which may arise, relating to disallowances of interest and some specific expenses.
A N N U A L R E P O R T 2 0 1 678
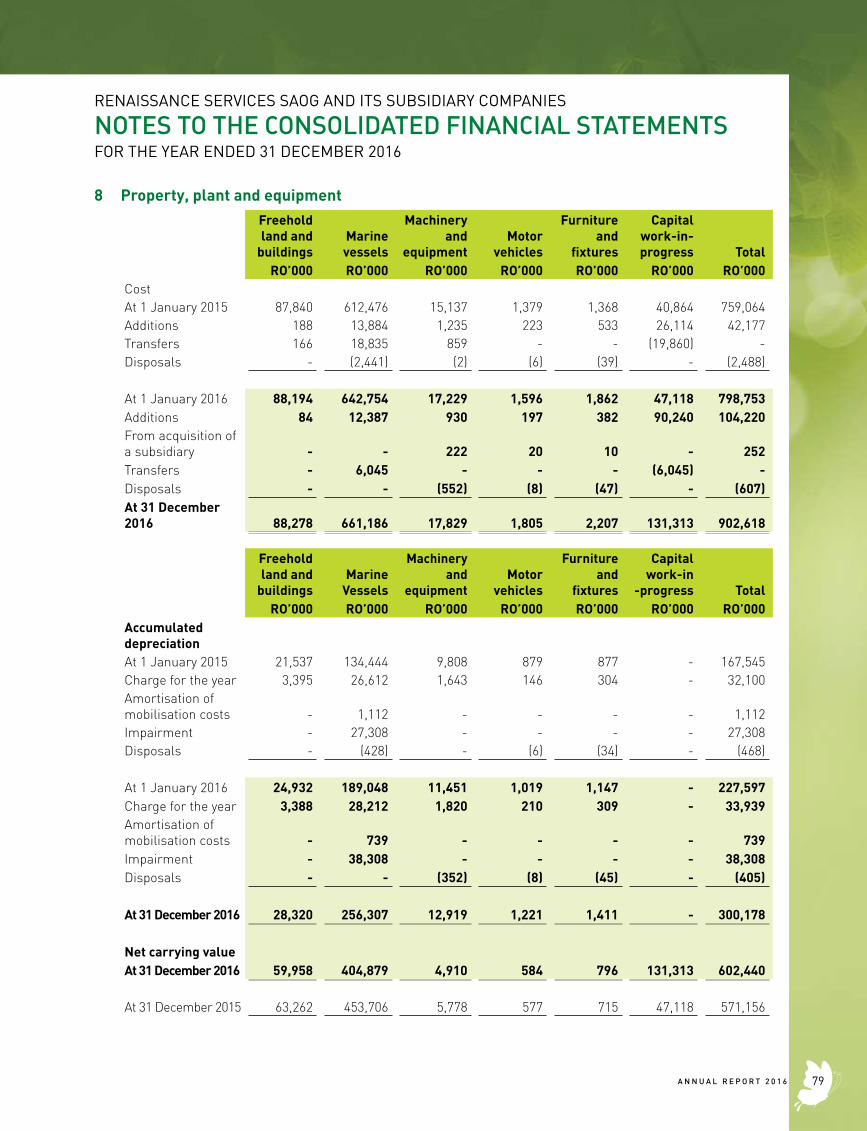
RENAISSANCE SERVICES SAOG AND ITS SUBSIDIARY COMPANIES
NOTES TO THE CONSOLIDATED FINANCIAL STATEMENTSFOR THE YEAR ENDED 31 DECEMBER 2016
8 Property, plant and equipment Freeholdland and
buildingsMarinevessels
Machineryand
equipmentMotor
vehicles
Furnitureand
fixtures
Capitalwork-in-progress Total
RO’000 RO’000 RO’000 RO’000 RO’000 RO’000 RO’000Cost At 1 January 2015 87,840 612,476 15,137 1,379 1,368 40,864 759,064 Additions 188 13,884 1,235 223 533 26,114 42,177Transfers 166 18,835 859 - - (19,860) -Disposals - (2,441) (2) (6) (39) - (2,488)
At 1 January 2016 88,194 642,754 17,229 1,596 1,862 47,118 798,753Additions 84 12,387 930 197 382 90,240 104,220From acquisition of a subsidiary - - 222 20 10 - 252Transfers - 6,045 - - - (6,045) -Disposals - - (552) (8) (47) - (607)At 31 December 2016 88,278 661,186 17,829 1,805 2,207 131,313 902,618
Freeholdland and
buildingsMarine
Vessels
Machineryand
equipmentMotor
vehicles
Furnitureand
fixtures
Capitalwork-in
-progress TotalRO’000 RO’000 RO’000 RO’000 RO’000 RO’000 RO’000
Accumulated depreciationAt 1 January 2015 21,537 134,444 9,808 879 877 - 167,545 Charge for the year 3,395 26,612 1,643 146 304 - 32,100Amortisation of mobilisation costs - 1,112 - - - - 1,112Impairment - 27,308 - - - - 27,308Disposals - (428) - (6) (34) - (468)
At 1 January 2016 24,932 189,048 11,451 1,019 1,147 - 227,597Charge for the year 3,388 28,212 1,820 210 309 - 33,939Amortisation of mobilisation costs - 739 - - - - 739Impairment - 38,308 - - - - 38,308Disposals - - (352) (8) (45) - (405)
At 31 December 2016 28,320 256,307 12,919 1,221 1,411 - 300,178
Net carrying valueAt 31 December 2016 59,958 404,879 4,910 584 796 131,313 602,440
At 31 December 2015 63,262 453,706 5,778 577 715 47,118 571,156
79A N N U A L R E P O R T 2 0 1 6
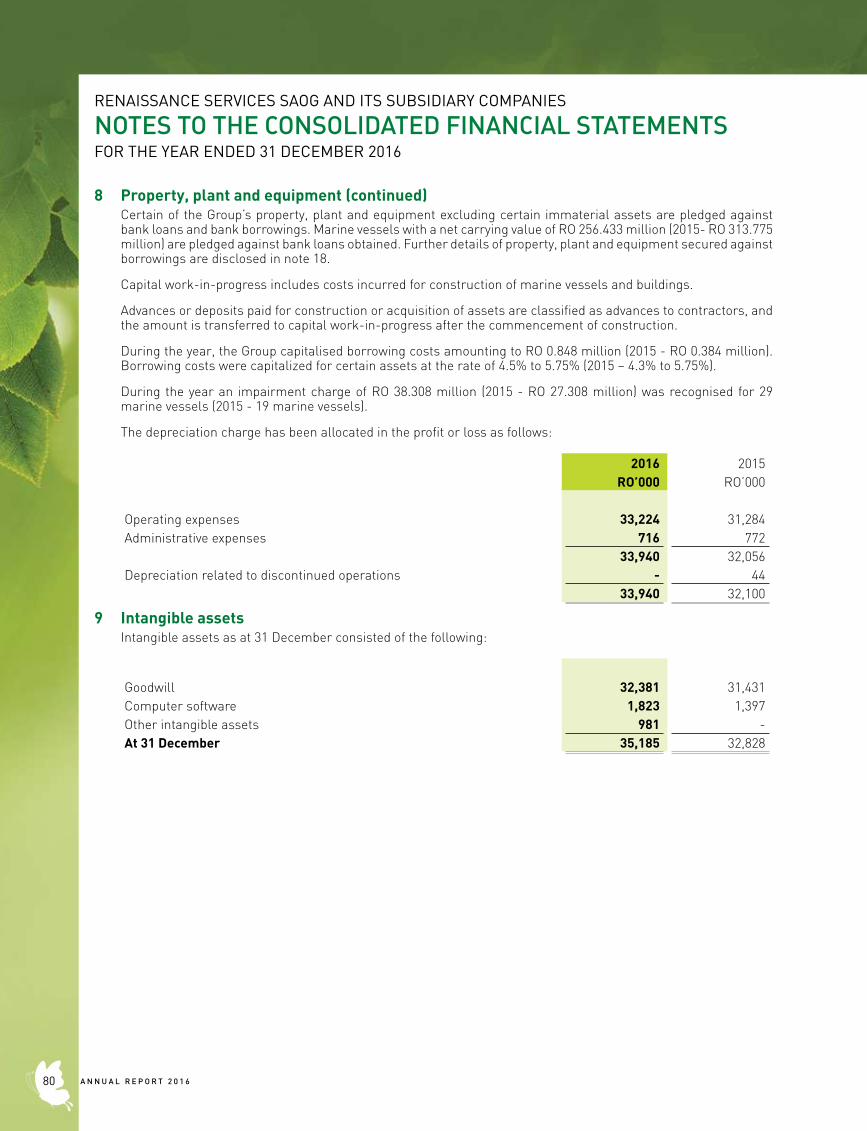
RENAISSANCE SERVICES SAOG AND ITS SUBSIDIARY COMPANIES
NOTES TO THE CONSOLIDATED FINANCIAL STATEMENTSFOR THE YEAR ENDED 31 DECEMBER 2016
8 Property, plant and equipment (continued)Certain of the Group’s property, plant and equipment excluding certain immaterial assets are pledged against bank loans and bank borrowings. Marine vessels with a net carrying value of RO 256.433 million (2015- RO 313.775 million) are pledged against bank loans obtained. Further details of property, plant and equipment secured against borrowings are disclosed in note 18.
Capital work-in-progress includes costs incurred for construction of marine vessels and buildings.
Advances or deposits paid for construction or acquisition of assets are classified as advances to contractors, and the amount is transferred to capital work-in-progress after the commencement of construction.
During the year, the Group capitalised borrowing costs amounting to RO 0.848 million (2015 - RO 0.384 million). Borrowing costs were capitalized for certain assets at the rate of 4.5% to 5.75% (2015 – 4.3% to 5.75%).
During the year an impairment charge of RO 38.308 million (2015 - RO 27.308 million) was recognised for 29 marine vessels (2015 - 19 marine vessels).
The depreciation charge has been allocated in the profit or loss as follows:
2016 2015RO’000 RO’000
Operating expenses 33,224 31,284Administrative expenses 716 772
33,940 32,056Depreciation related to discontinued operations - 44
33,940 32,100
9 Intangible assetsIntangible assets as at 31 December consisted of the following:
Goodwill 32,381 31,431Computer software 1,823 1,397Other intangible assets 981 -At 31 December 35,185 32,828
A N N U A L R E P O R T 2 0 1 680
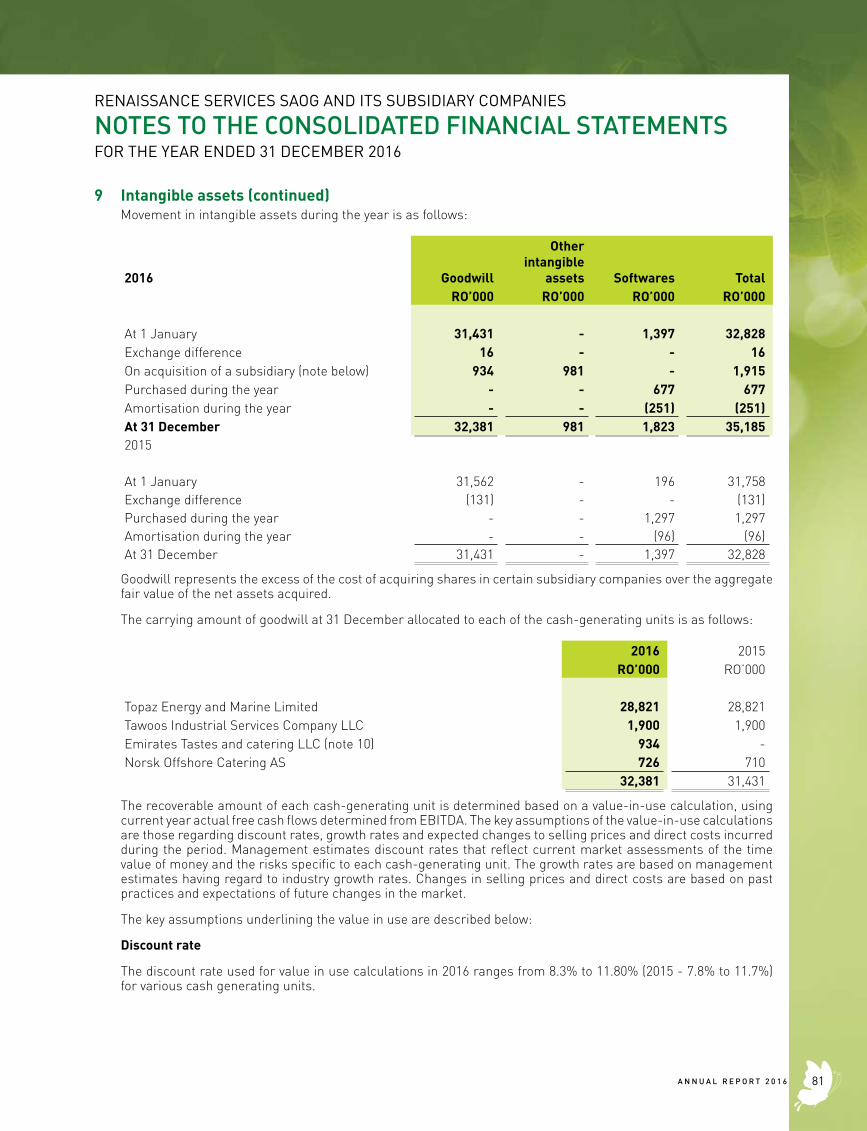
RENAISSANCE SERVICES SAOG AND ITS SUBSIDIARY COMPANIES
NOTES TO THE CONSOLIDATED FINANCIAL STATEMENTSFOR THE YEAR ENDED 31 DECEMBER 2016
9 Intangible assets (continued)Movement in intangible assets during the year is as follows:
2016 Goodwill
Other intangible
assets Softwares TotalRO’000 RO’000 RO’000 RO’000
At 1 January 31,431 - 1,397 32,828Exchange difference 16 - - 16On acquisition of a subsidiary (note below) 934 981 - 1,915Purchased during the year - - 677 677Amortisation during the year - - (251) (251)At 31 December 32,381 981 1,823 35,1852015
At 1 January 31,562 - 196 31,758Exchange difference (131) - - (131)Purchased during the year - - 1,297 1,297Amortisation during the year - - (96) (96)At 31 December 31,431 - 1,397 32,828
Goodwill represents the excess of the cost of acquiring shares in certain subsidiary companies over the aggregate fair value of the net assets acquired.
The carrying amount of goodwill at 31 December allocated to each of the cash-generating units is as follows:
2016 2015RO’000 RO’000
Topaz Energy and Marine Limited 28,821 28,821Tawoos Industrial Services Company LLC 1,900 1,900Emirates Tastes and catering LLC (note 10) 934 -Norsk Offshore Catering AS 726 710
32,381 31,431
The recoverable amount of each cash-generating unit is determined based on a value-in-use calculation, using current year actual free cash flows determined from EBITDA. The key assumptions of the value-in-use calculations are those regarding discount rates, growth rates and expected changes to selling prices and direct costs incurred during the period. Management estimates discount rates that reflect current market assessments of the time value of money and the risks specific to each cash-generating unit. The growth rates are based on management estimates having regard to industry growth rates. Changes in selling prices and direct costs are based on past practices and expectations of future changes in the market.
The key assumptions underlining the value in use are described below:
Discount rate
The discount rate used for value in use calculations in 2016 ranges from 8.3% to 11.80% (2015 - 7.8% to 11.7%) for various cash generating units.
81A N N U A L R E P O R T 2 0 1 6
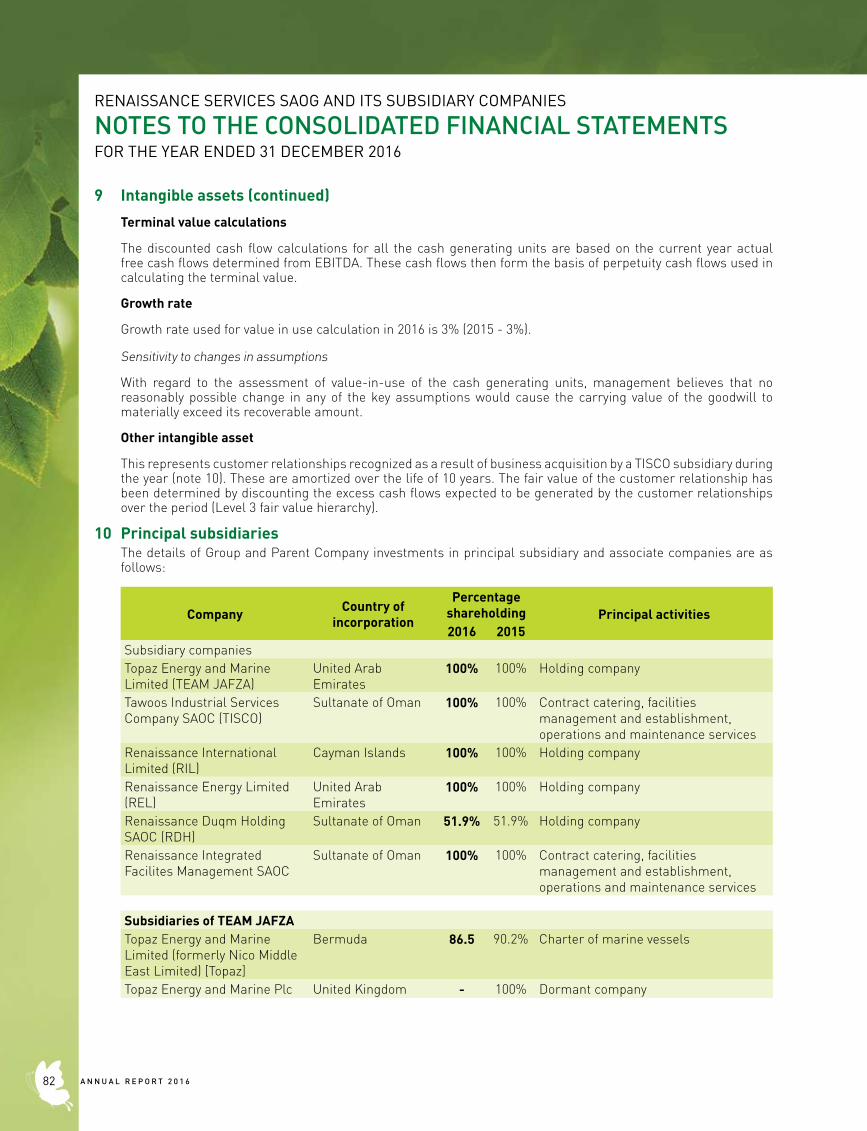
RENAISSANCE SERVICES SAOG AND ITS SUBSIDIARY COMPANIES
NOTES TO THE CONSOLIDATED FINANCIAL STATEMENTSFOR THE YEAR ENDED 31 DECEMBER 2016
9 Intangible assets (continued)
Terminal value calculations
The discounted cash flow calculations for all the cash generating units are based on the current year actual free cash flows determined from EBITDA. These cash flows then form the basis of perpetuity cash flows used in calculating the terminal value.
Growth rate
Growth rate used for value in use calculation in 2016 is 3% (2015 - 3%).
Sensitivity to changes in assumptions
With regard to the assessment of value-in-use of the cash generating units, management believes that no reasonably possible change in any of the key assumptions would cause the carrying value of the goodwill to materially exceed its recoverable amount.
Other intangible asset
This represents customer relationships recognized as a result of business acquisition by a TISCO subsidiary during the year (note 10). These are amortized over the life of 10 years. The fair value of the customer relationship has been determined by discounting the excess cash flows expected to be generated by the customer relationships over the period (Level 3 fair value hierarchy).
10 Principal subsidiaries The details of Group and Parent Company investments in principal subsidiary and associate companies are as follows:
Company Country of incorporation
Percentage shareholding Principal activities 2016 2015
Subsidiary companiesTopaz Energy and Marine Limited (TEAM JAFZA)
United Arab Emirates
100% 100% Holding company
Tawoos Industrial Services Company SAOC (TISCO)
Sultanate of Oman 100% 100% Contract catering, facilities management and establishment, operations and maintenance services
Renaissance International Limited (RIL)
Cayman Islands 100% 100% Holding company
Renaissance Energy Limited (REL)
United Arab Emirates
100% 100% Holding company
Renaissance Duqm Holding SAOC (RDH)
Sultanate of Oman 51.9% 51.9% Holding company
Renaissance Integrated Facilites Management SAOC
Sultanate of Oman 100% 100% Contract catering, facilities management and establishment, operations and maintenance services
Subsidiaries of TEAM JAFZA Topaz Energy and Marine Limited (formerly Nico Middle East Limited) [Topaz]
Bermuda 86.5 90.2% Charter of marine vessels
Topaz Energy and Marine Plc United Kingdom - 100% Dormant company
A N N U A L R E P O R T 2 0 1 682
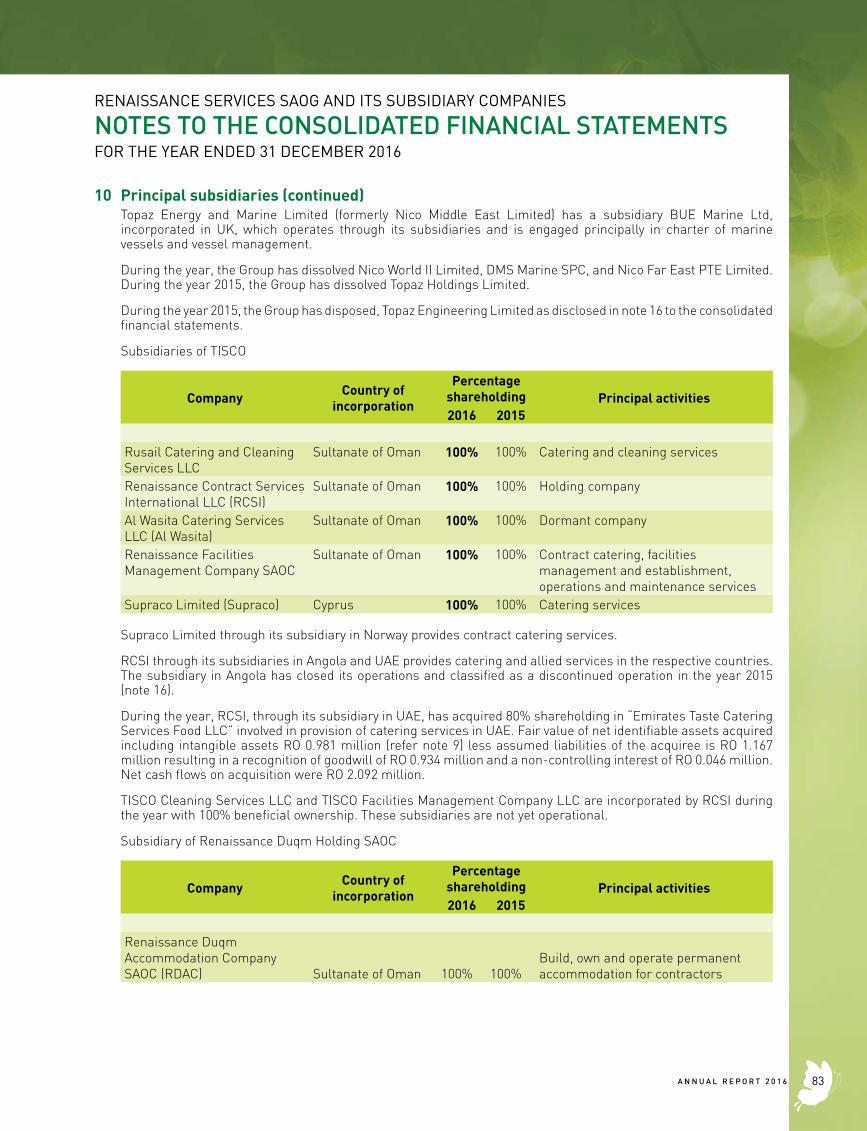
RENAISSANCE SERVICES SAOG AND ITS SUBSIDIARY COMPANIES
NOTES TO THE CONSOLIDATED FINANCIAL STATEMENTSFOR THE YEAR ENDED 31 DECEMBER 2016
10 Principal subsidiaries (continued)Topaz Energy and Marine Limited (formerly Nico Middle East Limited) has a subsidiary BUE Marine Ltd, incorporated in UK, which operates through its subsidiaries and is engaged principally in charter of marine vessels and vessel management.
During the year, the Group has dissolved Nico World II Limited, DMS Marine SPC, and Nico Far East PTE Limited. During the year 2015, the Group has dissolved Topaz Holdings Limited.
During the year 2015, the Group has disposed, Topaz Engineering Limited as disclosed in note 16 to the consolidated financial statements.
Subsidiaries of TISCO
Company Country of incorporation
Percentage shareholding Principal activities 2016 2015
Rusail Catering and Cleaning Services LLC
Sultanate of Oman 100% 100% Catering and cleaning services
Renaissance Contract Services International LLC (RCSI)
Sultanate of Oman 100% 100% Holding company
Al Wasita Catering Services LLC (Al Wasita)
Sultanate of Oman 100% 100% Dormant company
Renaissance Facilities Management Company SAOC
Sultanate of Oman 100% 100% Contract catering, facilities management and establishment, operations and maintenance services
Supraco Limited (Supraco) Cyprus 100% 100% Catering services
Supraco Limited through its subsidiary in Norway provides contract catering services.
RCSI through its subsidiaries in Angola and UAE provides catering and allied services in the respective countries. The subsidiary in Angola has closed its operations and classified as a discontinued operation in the year 2015 (note 16).
During the year, RCSI, through its subsidiary in UAE, has acquired 80% shareholding in “Emirates Taste Catering Services Food LLC” involved in provision of catering services in UAE. Fair value of net identifiable assets acquired including intangible assets RO 0.981 million (refer note 9) less assumed liabilities of the acquiree is RO 1.167 million resulting in a recognition of goodwill of RO 0.934 million and a non-controlling interest of RO 0.046 million. Net cash flows on acquisition were RO 2.092 million.
TISCO Cleaning Services LLC and TISCO Facilities Management Company LLC are incorporated by RCSI during the year with 100% beneficial ownership. These subsidiaries are not yet operational.
Subsidiary of Renaissance Duqm Holding SAOC
Company Country of incorporation
Percentage shareholding Principal activities 2016 2015
Renaissance Duqm Accommodation Company SAOC (RDAC) Sultanate of Oman 100% 100%
Build, own and operate permanent accommodation for contractors
83A N N U A L R E P O R T 2 0 1 6
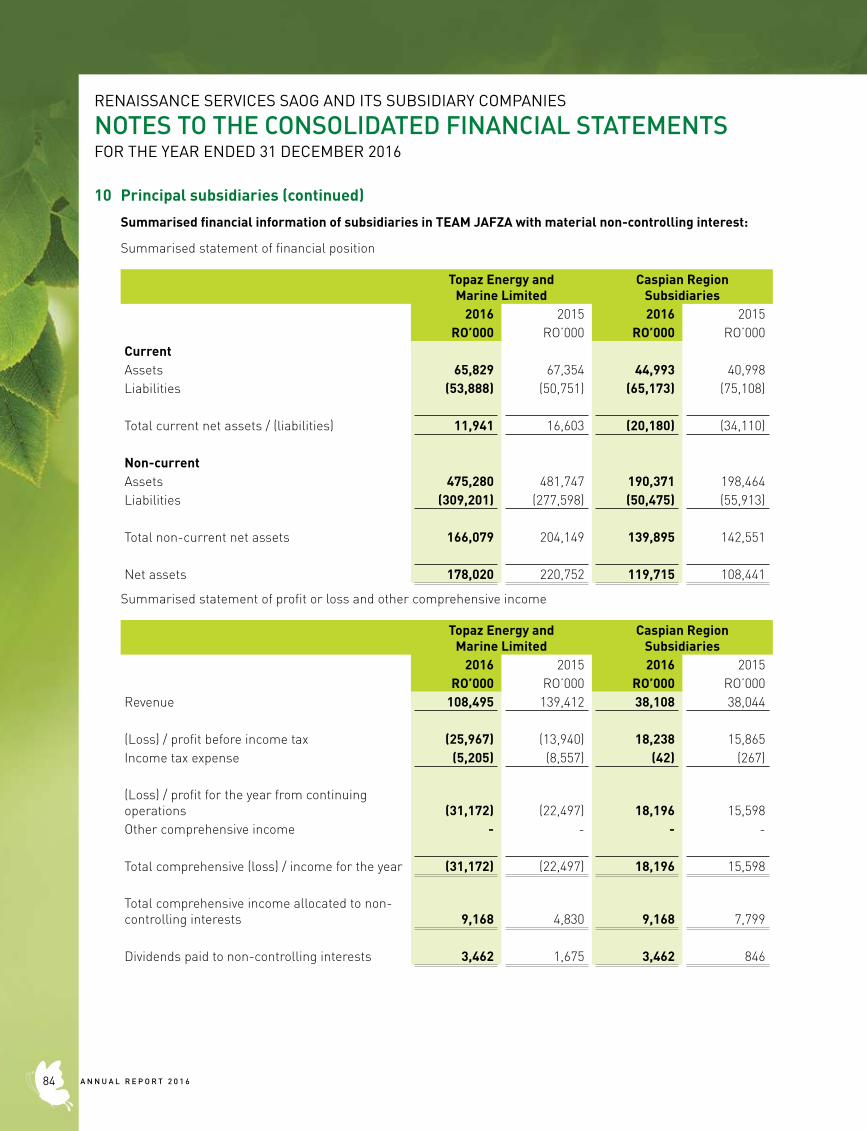
RENAISSANCE SERVICES SAOG AND ITS SUBSIDIARY COMPANIES
NOTES TO THE CONSOLIDATED FINANCIAL STATEMENTSFOR THE YEAR ENDED 31 DECEMBER 2016
10 Principal subsidiaries (continued)
Summarised financial information of subsidiaries in TEAM JAFZA with material non-controlling interest:
Summarised statement of financial position
Topaz Energy and Marine Limited
Caspian Region Subsidiaries
2016 2015 2016 2015 RO’000 RO’000 RO’000 RO’000CurrentAssets 65,829 67,354 44,993 40,998Liabilities (53,888) (50,751) (65,173) (75,108)
Total current net assets / (liabilities) 11,941 16,603 (20,180) (34,110) Non-currentAssets 475,280 481,747 190,371 198,464Liabilities (309,201) (277,598) (50,475) (55,913) Total non-current net assets 166,079 204,149 139,895 142,551 Net assets 178,020 220,752 119,715 108,441
Summarised statement of profit or loss and other comprehensive income
Topaz Energy and Marine Limited
Caspian Region Subsidiaries
2016 2015 2016 2015 RO’000 RO’000 RO’000 RO’000Revenue 108,495 139,412 38,108 38,044 (Loss) / profit before income tax (25,967) (13,940) 18,238 15,865Income tax expense (5,205) (8,557) (42) (267) (Loss) / profit for the year from continuing operations (31,172) (22,497) 18,196 15,598Other comprehensive income - - - - Total comprehensive (loss) / income for the year (31,172) (22,497) 18,196 15,598 Total comprehensive income allocated to non-controlling interests 9,168 4,830 9,168 7,799
Dividends paid to non-controlling interests 3,462 1,675 3,462 846
A N N U A L R E P O R T 2 0 1 684
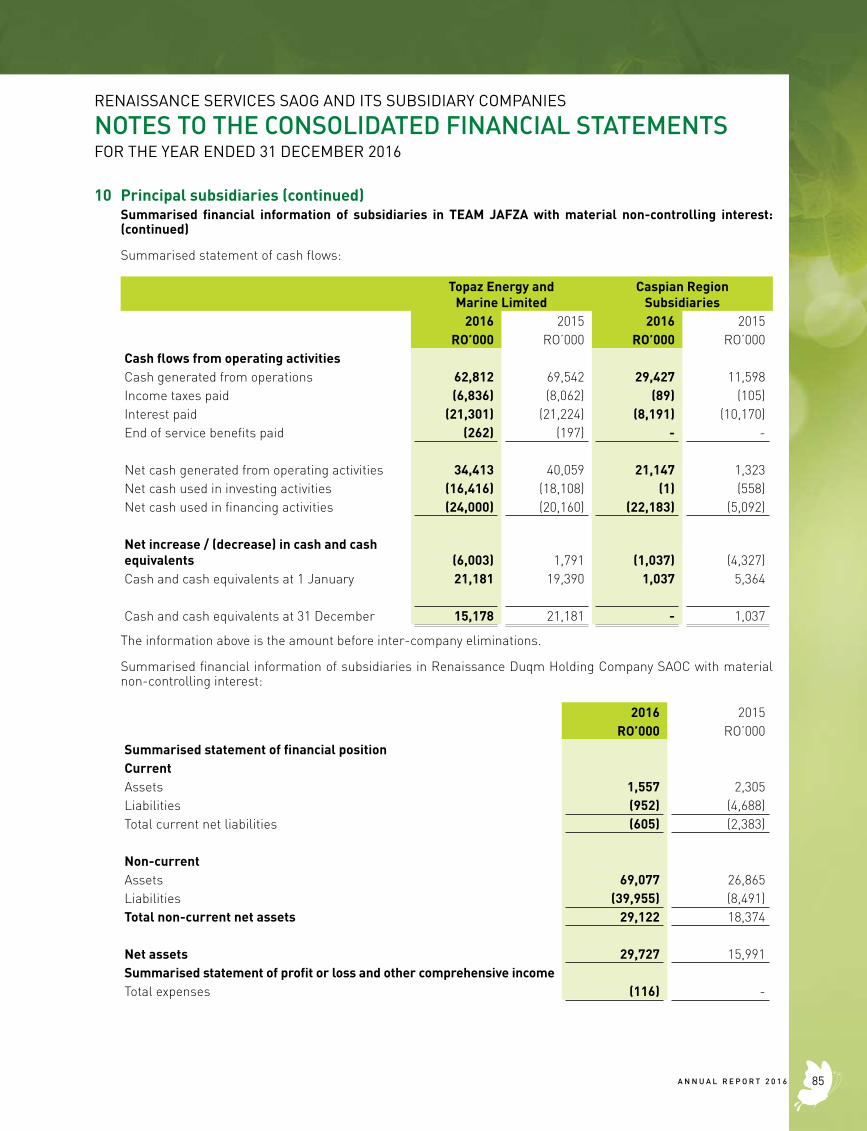
RENAISSANCE SERVICES SAOG AND ITS SUBSIDIARY COMPANIES
NOTES TO THE CONSOLIDATED FINANCIAL STATEMENTSFOR THE YEAR ENDED 31 DECEMBER 2016
10 Principal subsidiaries (continued)Summarised financial information of subsidiaries in TEAM JAFZA with material non-controlling interest: (continued)
Summarised statement of cash flows:
Topaz Energy and Marine Limited
Caspian Region Subsidiaries
2016 2015 2016 2015RO’000 RO’000 RO’000 RO’000
Cash flows from operating activitiesCash generated from operations 62,812 69,542 29,427 11,598Income taxes paid (6,836) (8,062) (89) (105)Interest paid (21,301) (21,224) (8,191) (10,170)End of service benefits paid (262) (197) - - Net cash generated from operating activities 34,413 40,059 21,147 1,323Net cash used in investing activities (16,416) (18,108) (1) (558)Net cash used in financing activities (24,000) (20,160) (22,183) (5,092) Net increase / (decrease) in cash and cash equivalents (6,003) 1,791 (1,037) (4,327)Cash and cash equivalents at 1 January 21,181 19,390 1,037 5,364 Cash and cash equivalents at 31 December 15,178 21,181 - 1,037
The information above is the amount before inter-company eliminations.
Summarised financial information of subsidiaries in Renaissance Duqm Holding Company SAOC with material non-controlling interest:
2016 2015RO’000 RO’000
Summarised statement of financial positionCurrentAssets 1,557 2,305Liabilities (952) (4,688)Total current net liabilities (605) (2,383)
Non-currentAssets 69,077 26,865Liabilities (39,955) (8,491)Total non-current net assets 29,122 18,374
Net assets 29,727 15,991Summarised statement of profit or loss and other comprehensive income Total expenses (116) -
85A N N U A L R E P O R T 2 0 1 6
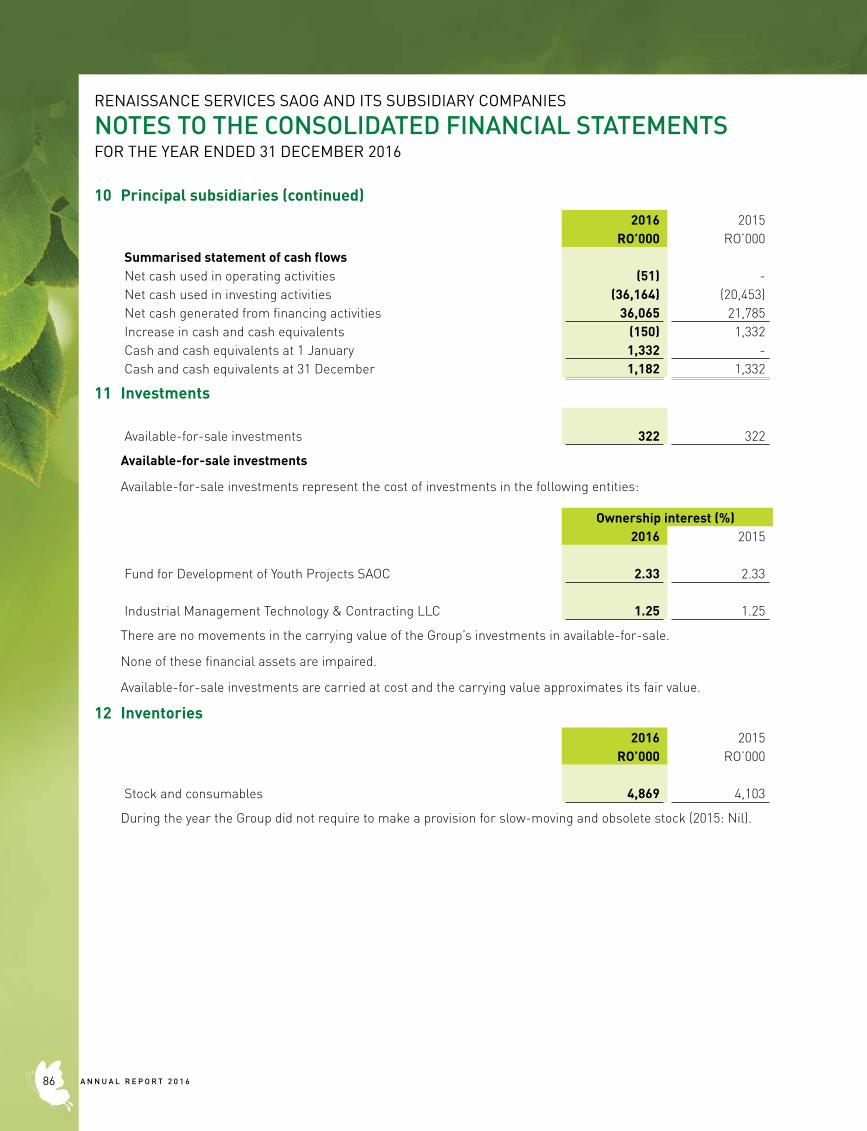
RENAISSANCE SERVICES SAOG AND ITS SUBSIDIARY COMPANIES
NOTES TO THE CONSOLIDATED FINANCIAL STATEMENTSFOR THE YEAR ENDED 31 DECEMBER 2016
10 Principal subsidiaries (continued)2016 2015
RO’000 RO’000Summarised statement of cash flowsNet cash used in operating activities (51) -Net cash used in investing activities (36,164) (20,453)Net cash generated from financing activities 36,065 21,785Increase in cash and cash equivalents (150) 1,332Cash and cash equivalents at 1 January 1,332 -Cash and cash equivalents at 31 December 1,182 1,332
11 Investments
Available-for-sale investments 322 322
Available-for-sale investments
Available-for-sale investments represent the cost of investments in the following entities:
Ownership interest (%)2016 2015
Fund for Development of Youth Projects SAOC 2.33 2.33
Industrial Management Technology & Contracting LLC 1.25 1.25
There are no movements in the carrying value of the Group’s investments in available-for-sale.
None of these financial assets are impaired.
Available-for-sale investments are carried at cost and the carrying value approximates its fair value.
12 Inventories 2016 2015
RO’000 RO’000
Stock and consumables 4,869 4,103
During the year the Group did not require to make a provision for slow-moving and obsolete stock (2015: Nil).
A N N U A L R E P O R T 2 0 1 686
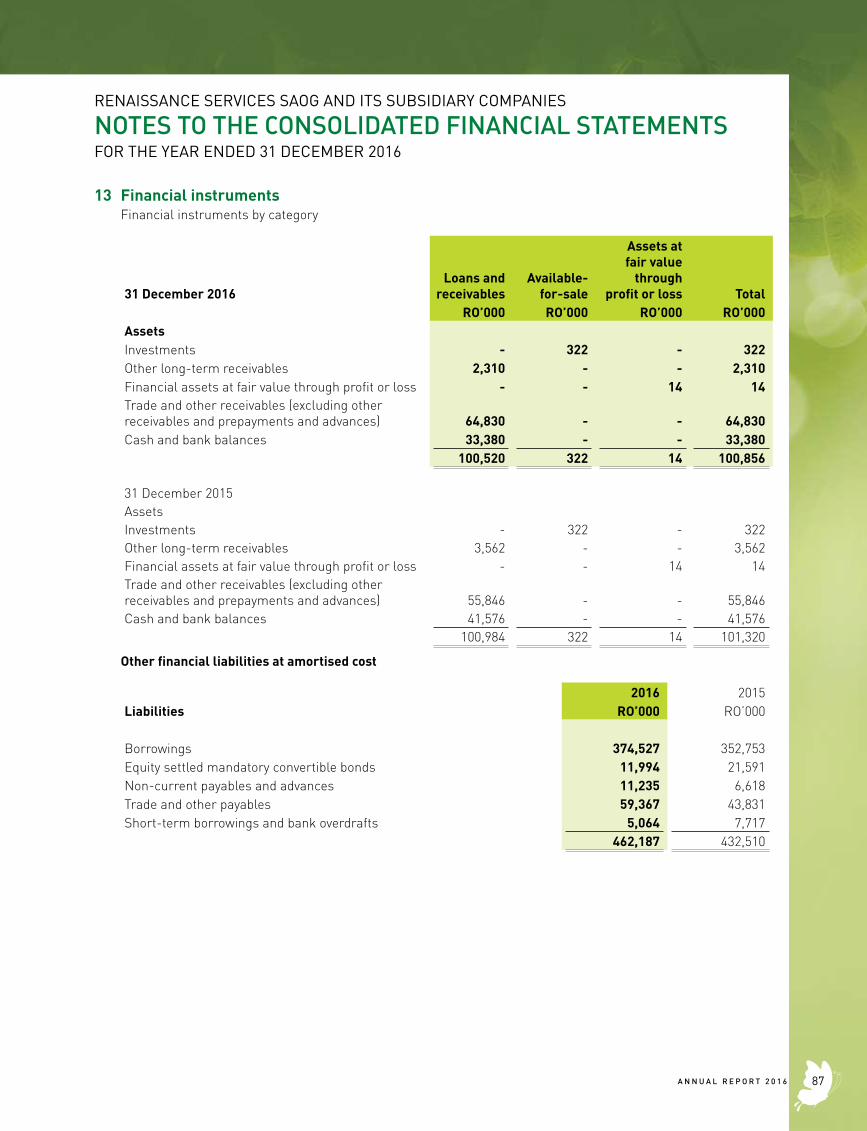
RENAISSANCE SERVICES SAOG AND ITS SUBSIDIARY COMPANIES
NOTES TO THE CONSOLIDATED FINANCIAL STATEMENTSFOR THE YEAR ENDED 31 DECEMBER 2016
13 Financial instruments Financial instruments by category
31 December 2016Loans and
receivablesAvailable-
for-sale
Assets at fair value
through profit or loss Total
RO’000 RO’000 RO’000 RO’000AssetsInvestments - 322 - 322Other long-term receivables 2,310 - - 2,310Financial assets at fair value through profit or loss - - 14 14Trade and other receivables (excluding other receivables and prepayments and advances) 64,830 - - 64,830Cash and bank balances 33,380 - - 33,380
100,520 322 14 100,856
31 December 2015AssetsInvestments - 322 - 322Other long-term receivables 3,562 - - 3,562Financial assets at fair value through profit or loss - - 14 14Trade and other receivables (excluding other receivables and prepayments and advances) 55,846 - - 55,846Cash and bank balances 41,576 - - 41,576
100,984 322 14 101,320
Other financial liabilities at amortised cost
2016 2015Liabilities RO’000 RO’000
Borrowings 374,527 352,753Equity settled mandatory convertible bonds 11,994 21,591Non-current payables and advances 11,235 6,618Trade and other payables 59,367 43,831Short-term borrowings and bank overdrafts 5,064 7,717
462,187 432,510
87A N N U A L R E P O R T 2 0 1 6
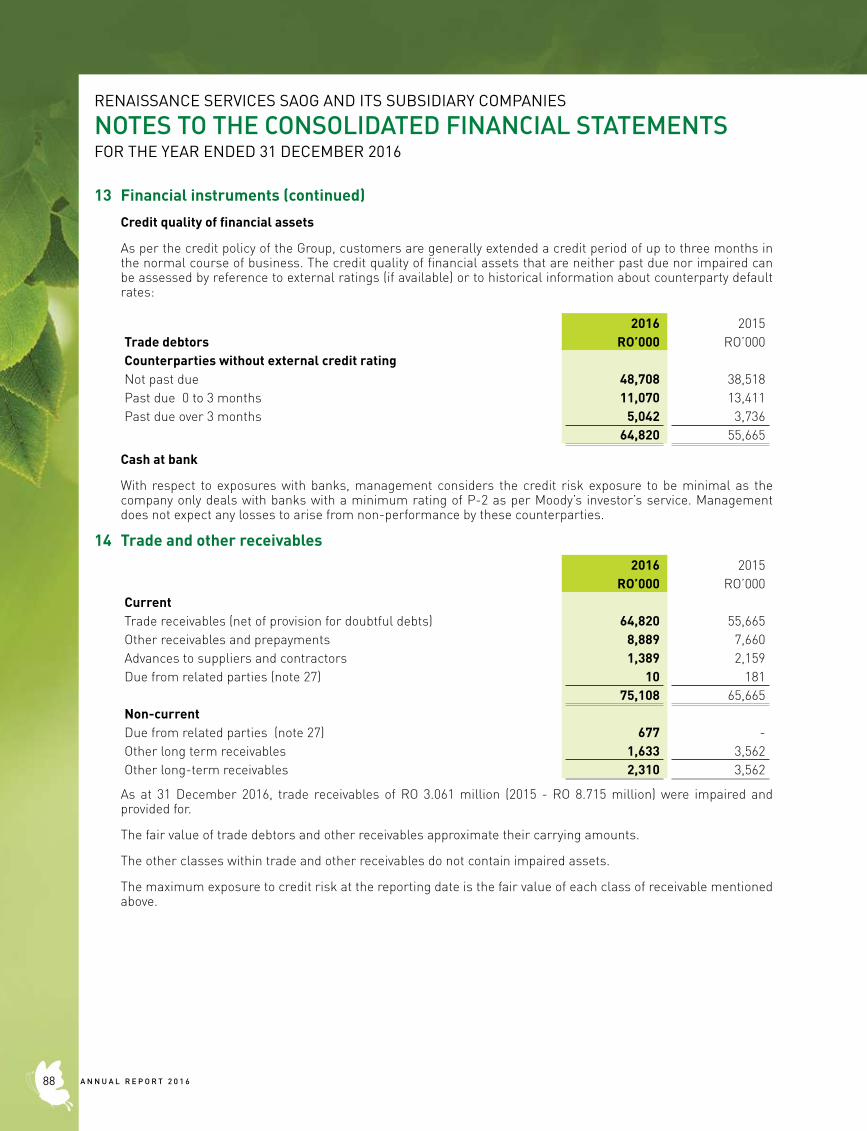
RENAISSANCE SERVICES SAOG AND ITS SUBSIDIARY COMPANIES
NOTES TO THE CONSOLIDATED FINANCIAL STATEMENTSFOR THE YEAR ENDED 31 DECEMBER 2016
13 Financial instruments (continued)
Credit quality of financial assets
As per the credit policy of the Group, customers are generally extended a credit period of up to three months in the normal course of business. The credit quality of financial assets that are neither past due nor impaired can be assessed by reference to external ratings (if available) or to historical information about counterparty default rates:
2016 2015Trade debtors RO’000 RO’000Counterparties without external credit ratingNot past due 48,708 38,518Past due 0 to 3 months 11,070 13,411Past due over 3 months 5,042 3,736
64,820 55,665
Cash at bank
With respect to exposures with banks, management considers the credit risk exposure to be minimal as the company only deals with banks with a minimum rating of P-2 as per Moody’s investor’s service. Management does not expect any losses to arise from non-performance by these counterparties.
14 Trade and other receivables 2016 2015
RO’000 RO’000CurrentTrade receivables (net of provision for doubtful debts) 64,820 55,665Other receivables and prepayments 8,889 7,660Advances to suppliers and contractors 1,389 2,159Due from related parties (note 27) 10 181
75,108 65,665Non-currentDue from related parties (note 27) 677 -Other long term receivables 1,633 3,562Other long-term receivables 2,310 3,562
As at 31 December 2016, trade receivables of RO 3.061 million (2015 - RO 8.715 million) were impaired and provided for.
The fair value of trade debtors and other receivables approximate their carrying amounts.
The other classes within trade and other receivables do not contain impaired assets.
The maximum exposure to credit risk at the reporting date is the fair value of each class of receivable mentioned above.
A N N U A L R E P O R T 2 0 1 688
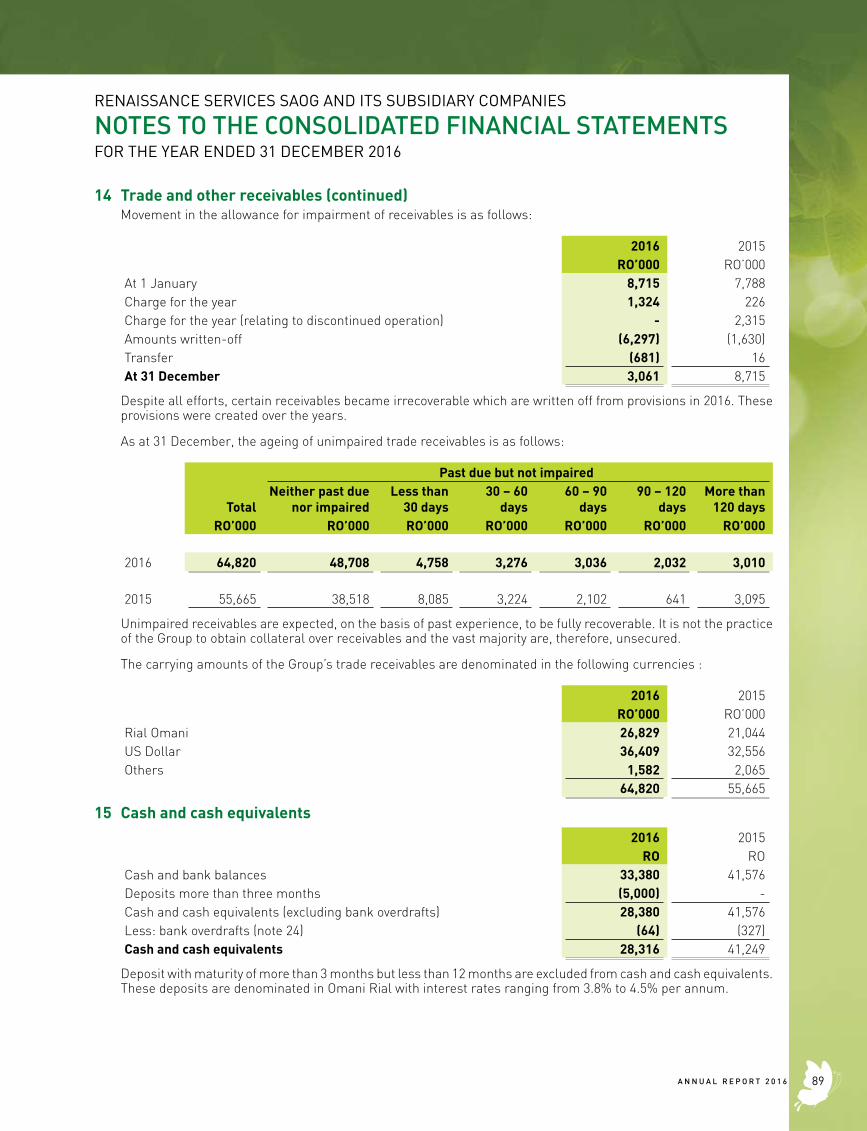
RENAISSANCE SERVICES SAOG AND ITS SUBSIDIARY COMPANIES
NOTES TO THE CONSOLIDATED FINANCIAL STATEMENTSFOR THE YEAR ENDED 31 DECEMBER 2016
14 Trade and other receivables (continued)Movement in the allowance for impairment of receivables is as follows:
2016 2015RO’000 RO’000
At 1 January 8,715 7,788Charge for the year 1,324 226Charge for the year (relating to discontinued operation) - 2,315Amounts written-off (6,297) (1,630)Transfer (681) 16At 31 December 3,061 8,715
Despite all efforts, certain receivables became irrecoverable which are written off from provisions in 2016. These provisions were created over the years.
As at 31 December, the ageing of unimpaired trade receivables is as follows:
Past due but not impaired
TotalNeither past due
nor impairedLess than
30 days30 – 60
days60 – 90
days90 – 120
daysMore than
120 daysRO’000 RO’000 RO’000 RO’000 RO’000 RO’000 RO’000
2016 64,820 48,708 4,758 3,276 3,036 2,032 3,010
2015 55,665 38,518 8,085 3,224 2,102 641 3,095
Unimpaired receivables are expected, on the basis of past experience, to be fully recoverable. It is not the practice of the Group to obtain collateral over receivables and the vast majority are, therefore, unsecured.
The carrying amounts of the Group’s trade receivables are denominated in the following currencies :
2016 2015RO’000 RO’000
Rial Omani 26,829 21,044US Dollar 36,409 32,556Others 1,582 2,065
64,820 55,665
15 Cash and cash equivalents2016 2015
RO ROCash and bank balances 33,380 41,576Deposits more than three months (5,000) -Cash and cash equivalents (excluding bank overdrafts) 28,380 41,576Less: bank overdrafts (note 24) (64) (327)Cash and cash equivalents 28,316 41,249
Deposit with maturity of more than 3 months but less than 12 months are excluded from cash and cash equivalents. These deposits are denominated in Omani Rial with interest rates ranging from 3.8% to 4.5% per annum.
89A N N U A L R E P O R T 2 0 1 6
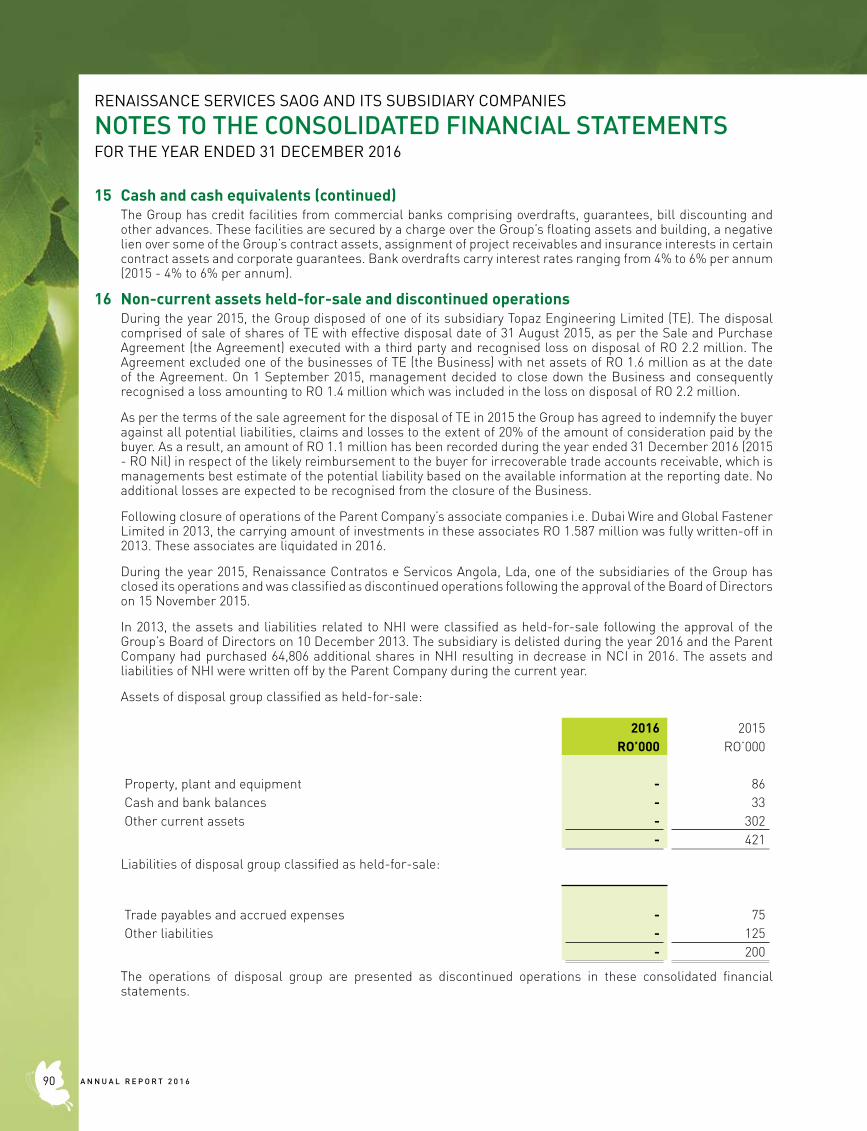
RENAISSANCE SERVICES SAOG AND ITS SUBSIDIARY COMPANIES
NOTES TO THE CONSOLIDATED FINANCIAL STATEMENTSFOR THE YEAR ENDED 31 DECEMBER 2016
15 Cash and cash equivalents (continued)The Group has credit facilities from commercial banks comprising overdrafts, guarantees, bill discounting and other advances. These facilities are secured by a charge over the Group’s floating assets and building, a negative lien over some of the Group’s contract assets, assignment of project receivables and insurance interests in certain contract assets and corporate guarantees. Bank overdrafts carry interest rates ranging from 4% to 6% per annum (2015 - 4% to 6% per annum).
16 Non-current assets held-for-sale and discontinued operationsDuring the year 2015, the Group disposed of one of its subsidiary Topaz Engineering Limited (TE). The disposal comprised of sale of shares of TE with effective disposal date of 31 August 2015, as per the Sale and Purchase Agreement (the Agreement) executed with a third party and recognised loss on disposal of RO 2.2 million. The Agreement excluded one of the businesses of TE (the Business) with net assets of RO 1.6 million as at the date of the Agreement. On 1 September 2015, management decided to close down the Business and consequently recognised a loss amounting to RO 1.4 million which was included in the loss on disposal of RO 2.2 million.
As per the terms of the sale agreement for the disposal of TE in 2015 the Group has agreed to indemnify the buyer against all potential liabilities, claims and losses to the extent of 20% of the amount of consideration paid by the buyer. As a result, an amount of RO 1.1 million has been recorded during the year ended 31 December 2016 (2015 - RO Nil) in respect of the likely reimbursement to the buyer for irrecoverable trade accounts receivable, which is managements best estimate of the potential liability based on the available information at the reporting date. No additional losses are expected to be recognised from the closure of the Business.
Following closure of operations of the Parent Company’s associate companies i.e. Dubai Wire and Global Fastener Limited in 2013, the carrying amount of investments in these associates RO 1.587 million was fully written-off in 2013. These associates are liquidated in 2016.
During the year 2015, Renaissance Contratos e Servicos Angola, Lda, one of the subsidiaries of the Group has closed its operations and was classified as discontinued operations following the approval of the Board of Directors on 15 November 2015.
In 2013, the assets and liabilities related to NHI were classified as held-for-sale following the approval of the Group’s Board of Directors on 10 December 2013. The subsidiary is delisted during the year 2016 and the Parent Company had purchased 64,806 additional shares in NHI resulting in decrease in NCI in 2016. The assets and liabilities of NHI were written off by the Parent Company during the current year.
Assets of disposal group classified as held-for-sale:
2016 2015RO’000 RO’000
Property, plant and equipment - 86Cash and bank balances - 33Other current assets - 302
- 421
Liabilities of disposal group classified as held-for-sale:
Trade payables and accrued expenses - 75Other liabilities - 125
- 200
The operations of disposal group are presented as discontinued operations in these consolidated financial statements.
A N N U A L R E P O R T 2 0 1 690
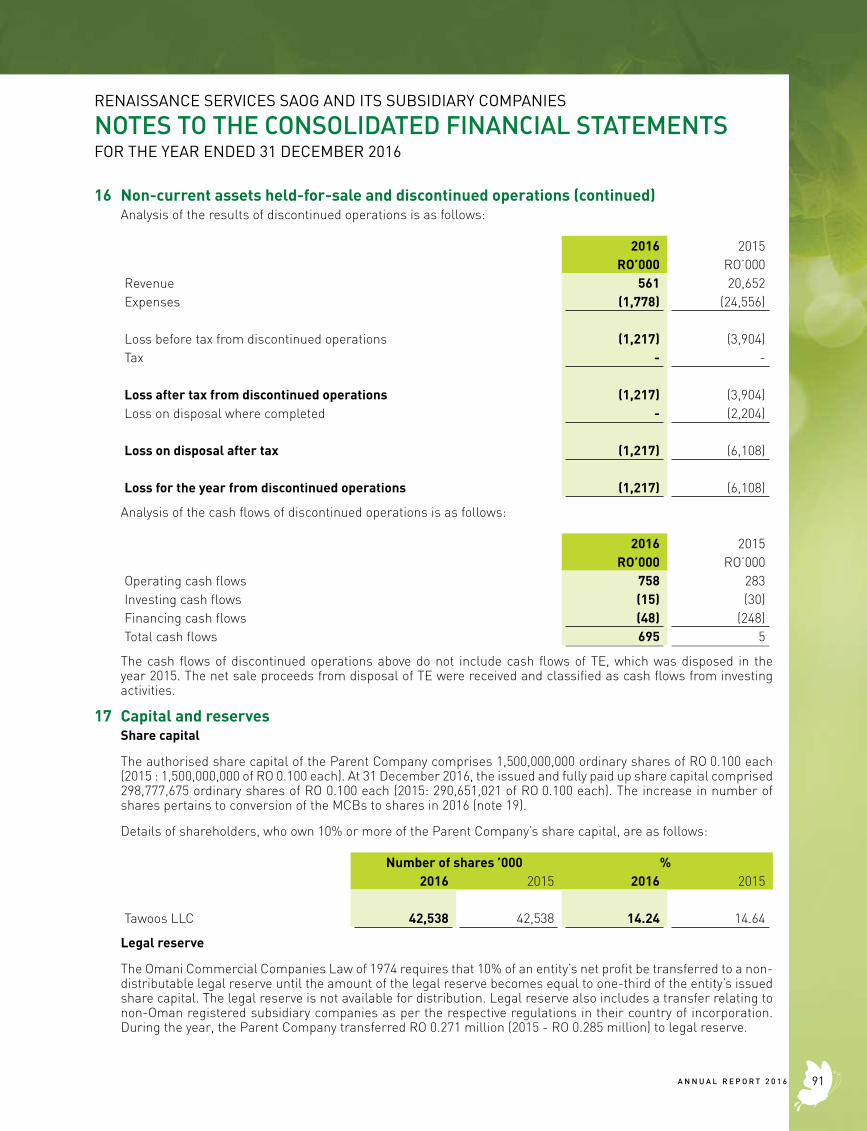
RENAISSANCE SERVICES SAOG AND ITS SUBSIDIARY COMPANIES
NOTES TO THE CONSOLIDATED FINANCIAL STATEMENTSFOR THE YEAR ENDED 31 DECEMBER 2016
16 Non-current assets held-for-sale and discontinued operations (continued)Analysis of the results of discontinued operations is as follows:
2016 2015RO’000 RO’000
Revenue 561 20,652Expenses (1,778) (24,556)
Loss before tax from discontinued operations (1,217) (3,904)Tax - -
Loss after tax from discontinued operations (1,217) (3,904)Loss on disposal where completed - (2,204)
Loss on disposal after tax (1,217) (6,108)
Loss for the year from discontinued operations (1,217) (6,108)
Analysis of the cash flows of discontinued operations is as follows:
2016 2015RO’000 RO’000
Operating cash flows 758 283Investing cash flows (15) (30)Financing cash flows (48) (248)Total cash flows 695 5
The cash flows of discontinued operations above do not include cash flows of TE, which was disposed in the year 2015. The net sale proceeds from disposal of TE were received and classified as cash flows from investing activities.
17 Capital and reservesShare capital
The authorised share capital of the Parent Company comprises 1,500,000,000 ordinary shares of RO 0.100 each (2015 : 1,500,000,000 of RO 0.100 each). At 31 December 2016, the issued and fully paid up share capital comprised 298,777,675 ordinary shares of RO 0.100 each (2015: 290,651,021 of RO 0.100 each). The increase in number of shares pertains to conversion of the MCBs to shares in 2016 (note 19).
Details of shareholders, who own 10% or more of the Parent Company’s share capital, are as follows:
Number of shares ’000 %2016 2015 2016 2015
Tawoos LLC 42,538 42,538 14.24 14.64
Legal reserve
The Omani Commercial Companies Law of 1974 requires that 10% of an entity’s net profit be transferred to a non-distributable legal reserve until the amount of the legal reserve becomes equal to one-third of the entity’s issued share capital. The legal reserve is not available for distribution. Legal reserve also includes a transfer relating to non-Oman registered subsidiary companies as per the respective regulations in their country of incorporation. During the year, the Parent Company transferred RO 0.271 million (2015 - RO 0.285 million) to legal reserve.
91A N N U A L R E P O R T 2 0 1 6
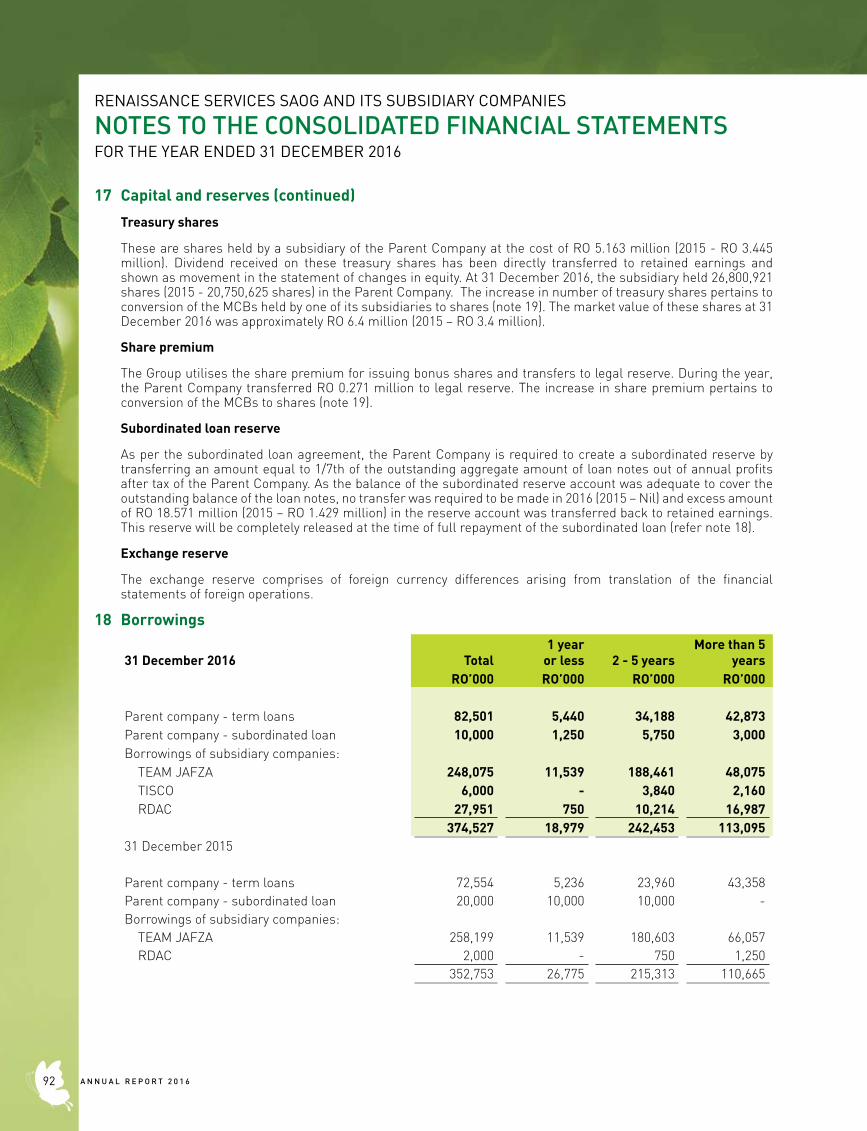
RENAISSANCE SERVICES SAOG AND ITS SUBSIDIARY COMPANIES
NOTES TO THE CONSOLIDATED FINANCIAL STATEMENTSFOR THE YEAR ENDED 31 DECEMBER 2016
17 Capital and reserves (continued)
Treasury shares
These are shares held by a subsidiary of the Parent Company at the cost of RO 5.163 million (2015 - RO 3.445 million). Dividend received on these treasury shares has been directly transferred to retained earnings and shown as movement in the statement of changes in equity. At 31 December 2016, the subsidiary held 26,800,921 shares (2015 - 20,750,625 shares) in the Parent Company. The increase in number of treasury shares pertains to conversion of the MCBs held by one of its subsidiaries to shares (note 19). The market value of these shares at 31 December 2016 was approximately RO 6.4 million (2015 – RO 3.4 million).
Share premium
The Group utilises the share premium for issuing bonus shares and transfers to legal reserve. During the year, the Parent Company transferred RO 0.271 million to legal reserve. The increase in share premium pertains to conversion of the MCBs to shares (note 19).
Subordinated loan reserve
As per the subordinated loan agreement, the Parent Company is required to create a subordinated reserve by transferring an amount equal to 1/7th of the outstanding aggregate amount of loan notes out of annual profits after tax of the Parent Company. As the balance of the subordinated reserve account was adequate to cover the outstanding balance of the loan notes, no transfer was required to be made in 2016 (2015 – Nil) and excess amount of RO 18.571 million (2015 – RO 1.429 million) in the reserve account was transferred back to retained earnings. This reserve will be completely released at the time of full repayment of the subordinated loan (refer note 18).
Exchange reserve
The exchange reserve comprises of foreign currency differences arising from translation of the financial statements of foreign operations.
18 Borrowings
31 December 2016 Total1 year
or less 2 - 5 yearsMore than 5
yearsRO’000 RO’000 RO’000 RO’000
Parent company - term loans 82,501 5,440 34,188 42,873Parent company - subordinated loan 10,000 1,250 5,750 3,000Borrowings of subsidiary companies: TEAM JAFZA 248,075 11,539 188,461 48,075 TISCO 6,000 - 3,840 2,160 RDAC 27,951 750 10,214 16,987
374,527 18,979 242,453 113,09531 December 2015
Parent company - term loans 72,554 5,236 23,960 43,358Parent company - subordinated loan 20,000 10,000 10,000 - Borrowings of subsidiary companies: TEAM JAFZA 258,199 11,539 180,603 66,057 RDAC 2,000 - 750 1,250
352,753 26,775 215,313 110,665
A N N U A L R E P O R T 2 0 1 692
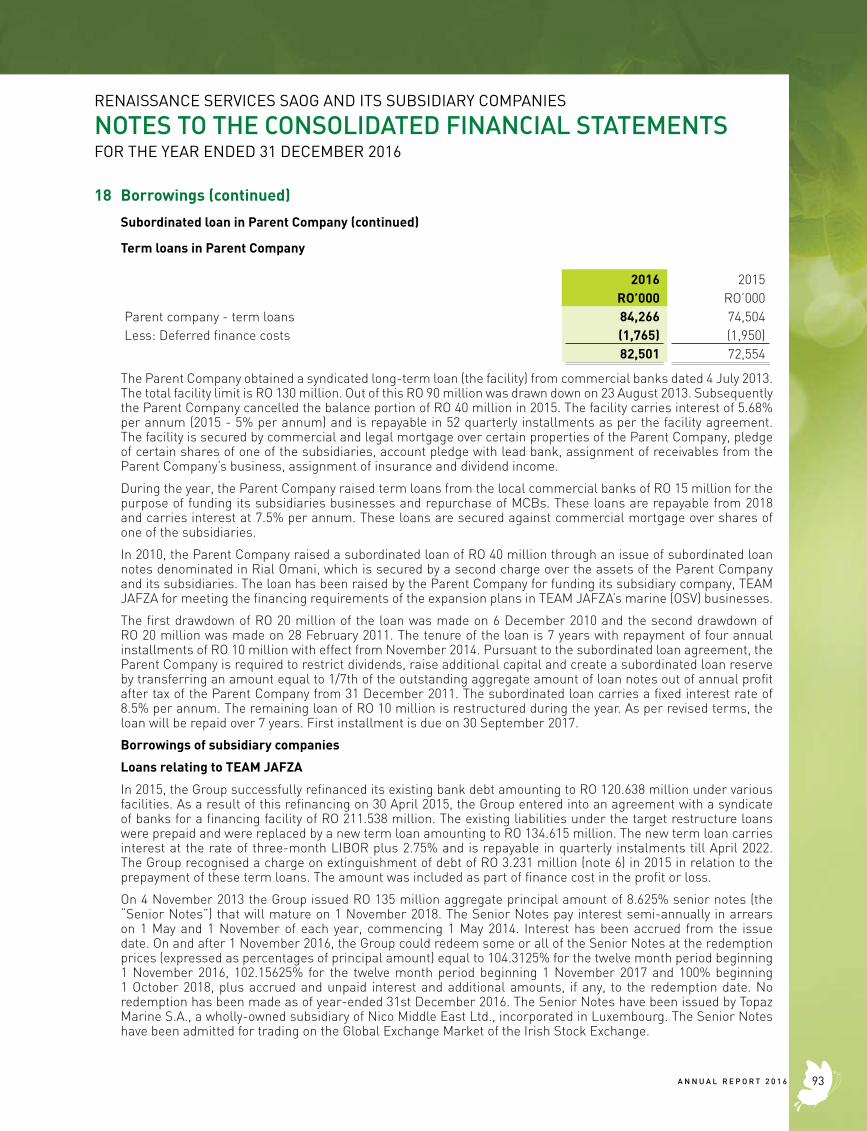
RENAISSANCE SERVICES SAOG AND ITS SUBSIDIARY COMPANIES
NOTES TO THE CONSOLIDATED FINANCIAL STATEMENTSFOR THE YEAR ENDED 31 DECEMBER 2016
18 Borrowings (continued)
Subordinated loan in Parent Company (continued)
Term loans in Parent Company
2016 2015RO’000 RO’000
Parent company - term loans 84,266 74,504Less: Deferred finance costs (1,765) (1,950)
82,501 72,554
The Parent Company obtained a syndicated long-term loan (the facility) from commercial banks dated 4 July 2013. The total facility limit is RO 130 million. Out of this RO 90 million was drawn down on 23 August 2013. Subsequently the Parent Company cancelled the balance portion of RO 40 million in 2015. The facility carries interest of 5.68% per annum (2015 - 5% per annum) and is repayable in 52 quarterly installments as per the facility agreement. The facility is secured by commercial and legal mortgage over certain properties of the Parent Company, pledge of certain shares of one of the subsidiaries, account pledge with lead bank, assignment of receivables from the Parent Company’s business, assignment of insurance and dividend income.
During the year, the Parent Company raised term loans from the local commercial banks of RO 15 million for the purpose of funding its subsidiaries businesses and repurchase of MCBs. These loans are repayable from 2018 and carries interest at 7.5% per annum. These loans are secured against commercial mortgage over shares of one of the subsidiaries.
In 2010, the Parent Company raised a subordinated loan of RO 40 million through an issue of subordinated loan notes denominated in Rial Omani, which is secured by a second charge over the assets of the Parent Company and its subsidiaries. The loan has been raised by the Parent Company for funding its subsidiary company, TEAM JAFZA for meeting the financing requirements of the expansion plans in TEAM JAFZA’s marine (OSV) businesses.
The first drawdown of RO 20 million of the loan was made on 6 December 2010 and the second drawdown of RO 20 million was made on 28 February 2011. The tenure of the loan is 7 years with repayment of four annual installments of RO 10 million with effect from November 2014. Pursuant to the subordinated loan agreement, the Parent Company is required to restrict dividends, raise additional capital and create a subordinated loan reserve by transferring an amount equal to 1/7th of the outstanding aggregate amount of loan notes out of annual profit after tax of the Parent Company from 31 December 2011. The subordinated loan carries a fixed interest rate of 8.5% per annum. The remaining loan of RO 10 million is restructured during the year. As per revised terms, the loan will be repaid over 7 years. First installment is due on 30 September 2017.
Borrowings of subsidiary companies
Loans relating to TEAM JAFZA
In 2015, the Group successfully refinanced its existing bank debt amounting to RO 120.638 million under various facilities. As a result of this refinancing on 30 April 2015, the Group entered into an agreement with a syndicate of banks for a financing facility of RO 211.538 million. The existing liabilities under the target restructure loans were prepaid and were replaced by a new term loan amounting to RO 134.615 million. The new term loan carries interest at the rate of three-month LIBOR plus 2.75% and is repayable in quarterly instalments till April 2022. The Group recognised a charge on extinguishment of debt of RO 3.231 million (note 6) in 2015 in relation to the prepayment of these term loans. The amount was included as part of finance cost in the profit or loss.
On 4 November 2013 the Group issued RO 135 million aggregate principal amount of 8.625% senior notes (the “Senior Notes”) that will mature on 1 November 2018. The Senior Notes pay interest semi-annually in arrears on 1 May and 1 November of each year, commencing 1 May 2014. Interest has been accrued from the issue date. On and after 1 November 2016, the Group could redeem some or all of the Senior Notes at the redemption prices (expressed as percentages of principal amount) equal to 104.3125% for the twelve month period beginning 1 November 2016, 102.15625% for the twelve month period beginning 1 November 2017 and 100% beginning 1 October 2018, plus accrued and unpaid interest and additional amounts, if any, to the redemption date. No redemption has been made as of year-ended 31st December 2016. The Senior Notes have been issued by Topaz Marine S.A., a wholly-owned subsidiary of Nico Middle East Ltd., incorporated in Luxembourg. The Senior Notes have been admitted for trading on the Global Exchange Market of the Irish Stock Exchange.
93A N N U A L R E P O R T 2 0 1 6
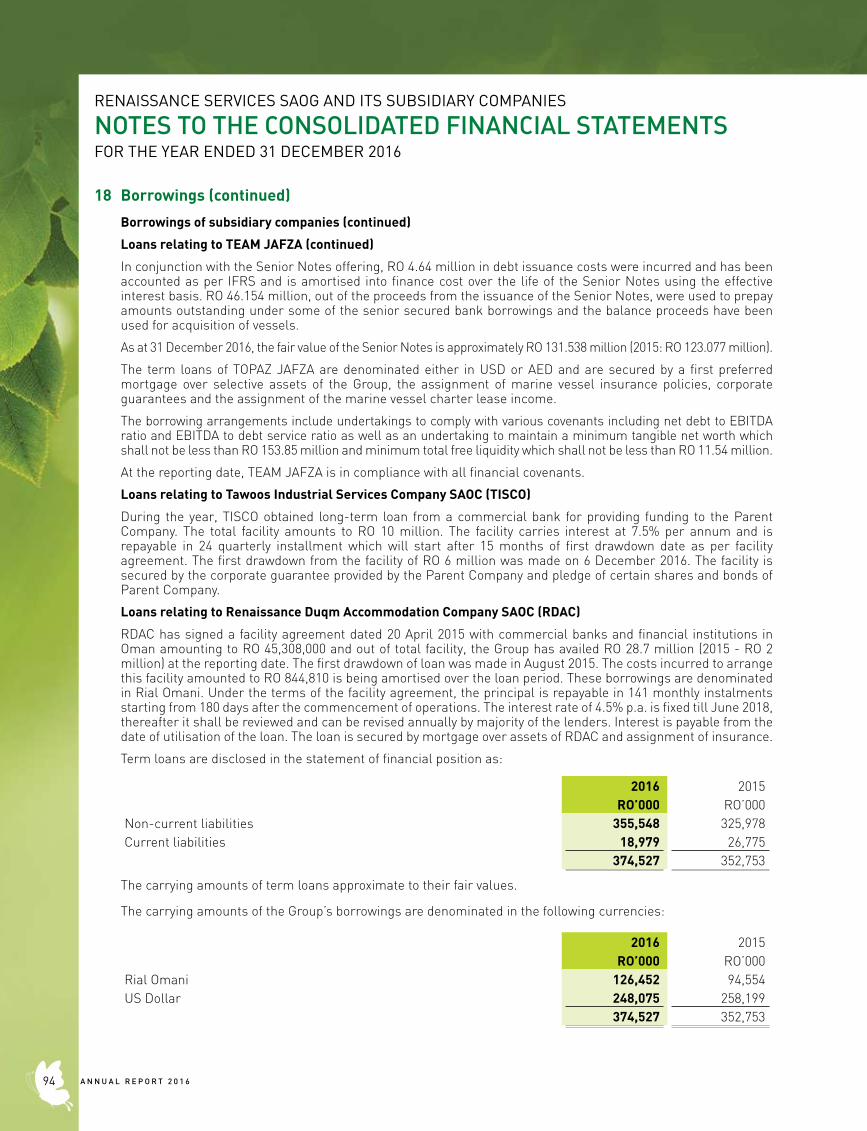
RENAISSANCE SERVICES SAOG AND ITS SUBSIDIARY COMPANIES
NOTES TO THE CONSOLIDATED FINANCIAL STATEMENTSFOR THE YEAR ENDED 31 DECEMBER 2016
18 Borrowings (continued)
Borrowings of subsidiary companies (continued)
Loans relating to TEAM JAFZA (continued)
In conjunction with the Senior Notes offering, RO 4.64 million in debt issuance costs were incurred and has been accounted as per IFRS and is amortised into finance cost over the life of the Senior Notes using the effective interest basis. RO 46.154 million, out of the proceeds from the issuance of the Senior Notes, were used to prepay amounts outstanding under some of the senior secured bank borrowings and the balance proceeds have been used for acquisition of vessels.
As at 31 December 2016, the fair value of the Senior Notes is approximately RO 131.538 million (2015: RO 123.077 million).
The term loans of TOPAZ JAFZA are denominated either in USD or AED and are secured by a first preferred mortgage over selective assets of the Group, the assignment of marine vessel insurance policies, corporate guarantees and the assignment of the marine vessel charter lease income.
The borrowing arrangements include undertakings to comply with various covenants including net debt to EBITDA ratio and EBITDA to debt service ratio as well as an undertaking to maintain a minimum tangible net worth which shall not be less than RO 153.85 million and minimum total free liquidity which shall not be less than RO 11.54 million.
At the reporting date, TEAM JAFZA is in compliance with all financial covenants.
Loans relating to Tawoos Industrial Services Company SAOC (TISCO)
During the year, TISCO obtained long-term loan from a commercial bank for providing funding to the Parent Company. The total facility amounts to RO 10 million. The facility carries interest at 7.5% per annum and is repayable in 24 quarterly installment which will start after 15 months of first drawdown date as per facility agreement. The first drawdown from the facility of RO 6 million was made on 6 December 2016. The facility is secured by the corporate guarantee provided by the Parent Company and pledge of certain shares and bonds of Parent Company.
Loans relating to Renaissance Duqm Accommodation Company SAOC (RDAC)
RDAC has signed a facility agreement dated 20 April 2015 with commercial banks and financial institutions in Oman amounting to RO 45,308,000 and out of total facility, the Group has availed RO 28.7 million (2015 - RO 2 million) at the reporting date. The first drawdown of loan was made in August 2015. The costs incurred to arrange this facility amounted to RO 844,810 is being amortised over the loan period. These borrowings are denominated in Rial Omani. Under the terms of the facility agreement, the principal is repayable in 141 monthly instalments starting from 180 days after the commencement of operations. The interest rate of 4.5% p.a. is fixed till June 2018, thereafter it shall be reviewed and can be revised annually by majority of the lenders. Interest is payable from the date of utilisation of the loan. The loan is secured by mortgage over assets of RDAC and assignment of insurance.
Term loans are disclosed in the statement of financial position as:
2016 2015RO’000 RO’000
Non-current liabilities 355,548 325,978Current liabilities 18,979 26,775
374,527 352,753
The carrying amounts of term loans approximate to their fair values.
The carrying amounts of the Group’s borrowings are denominated in the following currencies:
2016 2015RO’000 RO’000
Rial Omani 126,452 94,554US Dollar 248,075 258,199
374,527 352,753
A N N U A L R E P O R T 2 0 1 694
RENAISSANCE SERVICES SAOG AND ITS SUBSIDIARY COMPANIES
NOTES TO THE CONSOLIDATED FINANCIAL STATEMENTSFOR THE YEAR ENDED 31 DECEMBER 2016
19 Equity settled mandatory convertible bondsThe Parent Company issued 423,141,678 Mandatory Convertible Bonds (MCB) to its shareholders at RO 0.102 each (including 2 Baisas for expenses) on 25 July 2012. The Group companies subscribed 30,673,468 bonds out of the total issue. The bonds carry a coupon rate of 3.75% per annum. The MCB shall be converted into equity shares of the Parent Company at the conversion price. The conversion price shall be equal to the average of the closing market price of the shares, as quoted on Muscat Securities Market (MSM), in the 30 days prior to the respective date of conversion, subject to adjustments including rights issue, stock dividend, split and reverse split of shares divided by the conversion factor (1.7). The conversion will be carried out in three tranches of 33.33% in third and fourth year each and 33.34% in fifth year from the issue date. The number of outstanding MCBs shall convert upon each conversion into equity shares, so as to fully convert all the outstanding MCBs at the end of fifth anniversary from the issue date. The bonds are listed on MSM and classified as liabilities in accordance with the guidance given in IAS-32 ‘Financial instrument: Presentation’.
In conjunction with MCB, RO 0.372 million in bond issuance costs were incurred and have been accounted as per IFRS and are amortised into finance costs over the life of the MCB using the effective interest method.
For all banking covenants calculations, MCBs are considered as part of equity.
The shareholders and the MCB holders of the Parent Company approved MCBs repurchase program in their respective General meetings held in June 2015. Accordingly, the Parent Company completed repurchase of first tranche of MCBs in July 2015. Out of 141,032,909 due for conversion in July 2015, 126,914,334 MCBs were repurchased at a price of RO 0.170 per MCB amounting to RO 21.6 million. The balance 14,118,575 MCBs were converted to 8,556,712 shares at a conversion price of RO 0.165 per MCB. The Parent Company has also repurchased 127,320,320 out of second tranche of MCBs in August 2015 at a repurchase price of RO 0.151 amounting to RO 19.2 million. The balance 13,734,065 MCBs were converted to 8,126,665 shares at a conversion price of RO 0.169 per MCB during current year. During the year, the Parent Company also repurchased 60,230,215 out of third and final tranche of MCBs in August 2016 at a repurchase price of RO 0.149 amounting to RO 8.97 million. The remaining 80,824,189 MCBs in the third thanche shall be converted to equity shares in 2017.
As at 31 December 2016, the quoted market value of the outstanding MCBs was RO 11.6 million (2015 – RO 19.48 million).
Mandatory Convertible Bonds are disclosed in the statement of financial position as:
2016 2015RO’000 RO’000
Non-current liabilities - 21,016Current liabilities 11,994 575
11,994 21,591
20 Perpetual notesThe Group issued step-up subordinated perpetual notes (perpetual notes) on 29 July 2015. Renaissance International Limited (the Issuer), a limited liability company registered in the Cayman Islands and a wholly-owned subsidiary of the Parent Company, has issued RO 48.3 million (USD 125.5 million) perpetual notes. Issuance costs amounting to RO 1.5 million (USD 3.9 million) were incurred. The perpetual notes are listed on the Irish Stock Exchange. These perpetual notes are a perpetual security in respect of which there is no fixed redemption date. The perpetual notes are callable by the issuer 5 years after the issue date, being 29 July 2020 (the First Call Date). The perpetual notes bear a coupon rate of 7.9% per annum, from the issue date to the first call date, payable semi-annually in arrears, however coupon is payable only upon occurrence of certain events, which are at the Group’s discretion. The perpetual notes are classified as equity instruments. Post the first call date the coupon rate on perpetual notes shall increase to 12.9% per annum on the outstanding perpetual notes. The coupon liability under perpetual notes is recorded as a liability and the related charge recognised in equity in the period in which the trigger for such coupon liability occurs.
95A N N U A L R E P O R T 2 0 1 6
RENAISSANCE SERVICES SAOG AND ITS SUBSIDIARY COMPANIES
NOTES TO THE CONSOLIDATED FINANCIAL STATEMENTSFOR THE YEAR ENDED 31 DECEMBER 2016
21 Non-current payables and advances2016 2015
RO’000 RO’000Advance from customers 43,097 -Derivative financial instrument (note 30) 7,588 12,284Income tax payable 1,015 1,197Other payables and advances 12,739 6,618Deferred income - 221
64,439 20,320
Other payables include RO 10.6 million (2015 – RO 4.9 million) classified as long-term as the Group has unconditional right at the reporting date to refinance these payables as they fall due.
22 Staff terminal benefits The table below outlines the Group’s post-employment liabilities:
2016 2015RO’000 RO’000
Defined benefit pension plan - Funded (a) 48 -Unfunded benefits (b) 4,731 4,435
4,779 4,435
(a) Defined benefit pension plan - Funded relating to the Group’s subsidiary in Norway. During the year, this subsidiary who maintained three defined benefit pension plans for offshore employees, the first plan starting when the employee is 60 years old and has to stop working offshore. This plan covers the period up until the employee reaches the age of 67 years old. The second plan covers the period after the employee is 67 years old. The third plan is a defined benefit plan for onshore employees. The subsidiary decided to terminate two of the defined benefit plans after reaching an agreement with the employees where employees in the two defined benefit schemes were moved to contribution-based scheme. The subsidiary recognised a loss of RO 24,641 on settlement of the defined benefit plans.
The subsidiary’s pension scheme covers a total of 250 employees (2015 – 278 employees). The pension scheme give the right to defined future benefits, which are mainly dependent on the number of years worked, salary level at time of retirement and the amount of payment from the national insurance fund. The obligations are covered through an insurance company. The calculated pension obligations are based on calculations of an actuary.
In addition, the subsidiary has 4 persons that have retired and whose pension contributions are covered by the subsidiary.
The amount recognised in the statement of financial position is determined as follows:
2016 2015RO’000 RO’000
Present value of defined benefit obligation 2,060 4,464Fair value of plan assets (2,012) (4,692)Liability / (assets) in the statement of financial position 48 (228)
A N N U A L R E P O R T 2 0 1 696
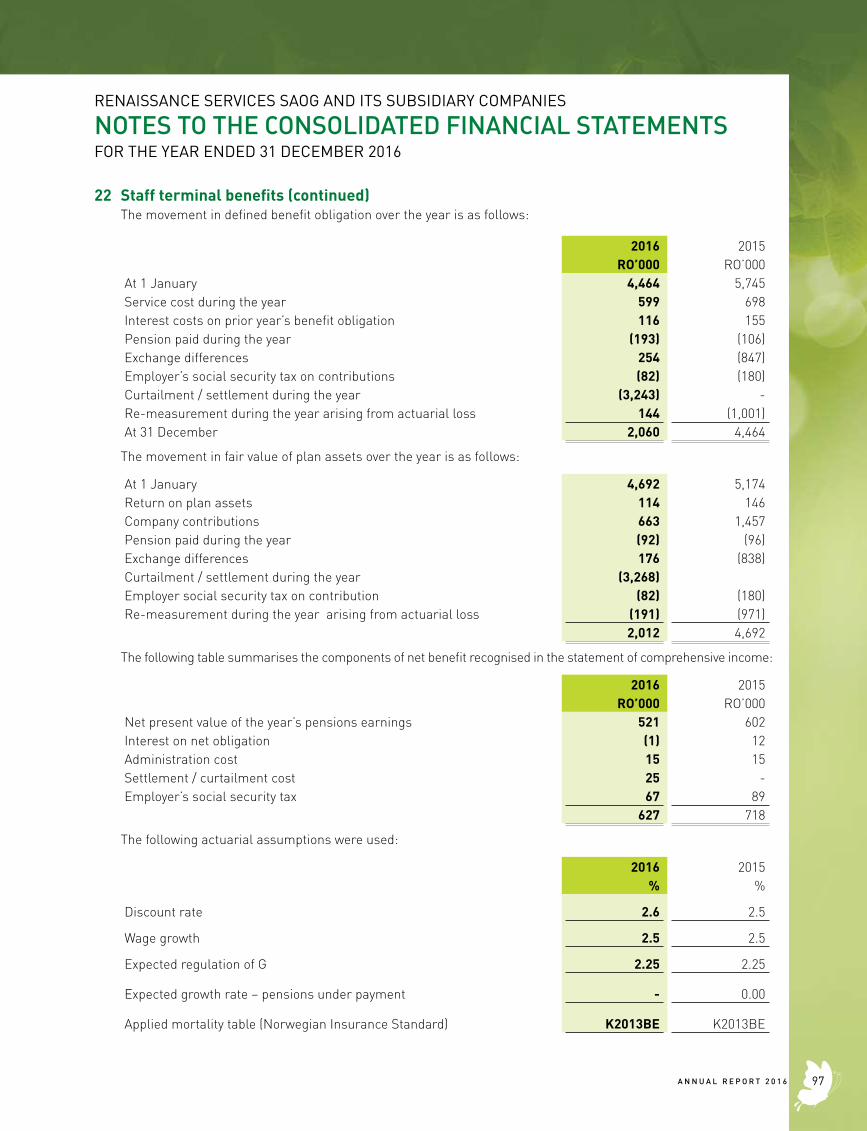
RENAISSANCE SERVICES SAOG AND ITS SUBSIDIARY COMPANIES
NOTES TO THE CONSOLIDATED FINANCIAL STATEMENTSFOR THE YEAR ENDED 31 DECEMBER 2016
22 Staff terminal benefits (continued)The movement in defined benefit obligation over the year is as follows:
2016 2015RO’000 RO’000
At 1 January 4,464 5,745Service cost during the year 599 698Interest costs on prior year’s benefit obligation 116 155Pension paid during the year (193) (106)Exchange differences 254 (847)Employer’s social security tax on contributions (82) (180)Curtailment / settlement during the year (3,243) -Re-measurement during the year arising from actuarial loss 144 (1,001)At 31 December 2,060 4,464
The movement in fair value of plan assets over the year is as follows:
At 1 January 4,692 5,174Return on plan assets 114 146Company contributions 663 1,457Pension paid during the year (92) (96)Exchange differences 176 (838)Curtailment / settlement during the year (3,268)Employer social security tax on contribution (82) (180)Re-measurement during the year arising from actuarial loss (191) (971)
2,012 4,692
The following table summarises the components of net benefit recognised in the statement of comprehensive income:
2016 2015 RO’000 RO’000Net present value of the year’s pensions earnings 521 602Interest on net obligation (1) 12Administration cost 15 15Settlement / curtailment cost 25 -Employer’s social security tax 67 89
627 718
The following actuarial assumptions were used:
2016 2015 % %
Discount rate 2.6 2.5
Wage growth 2.5 2.5
Expected regulation of G 2.25 2.25
Expected growth rate – pensions under payment - 0.00
Applied mortality table (Norwegian Insurance Standard) K2013BE K2013BE
97A N N U A L R E P O R T 2 0 1 6
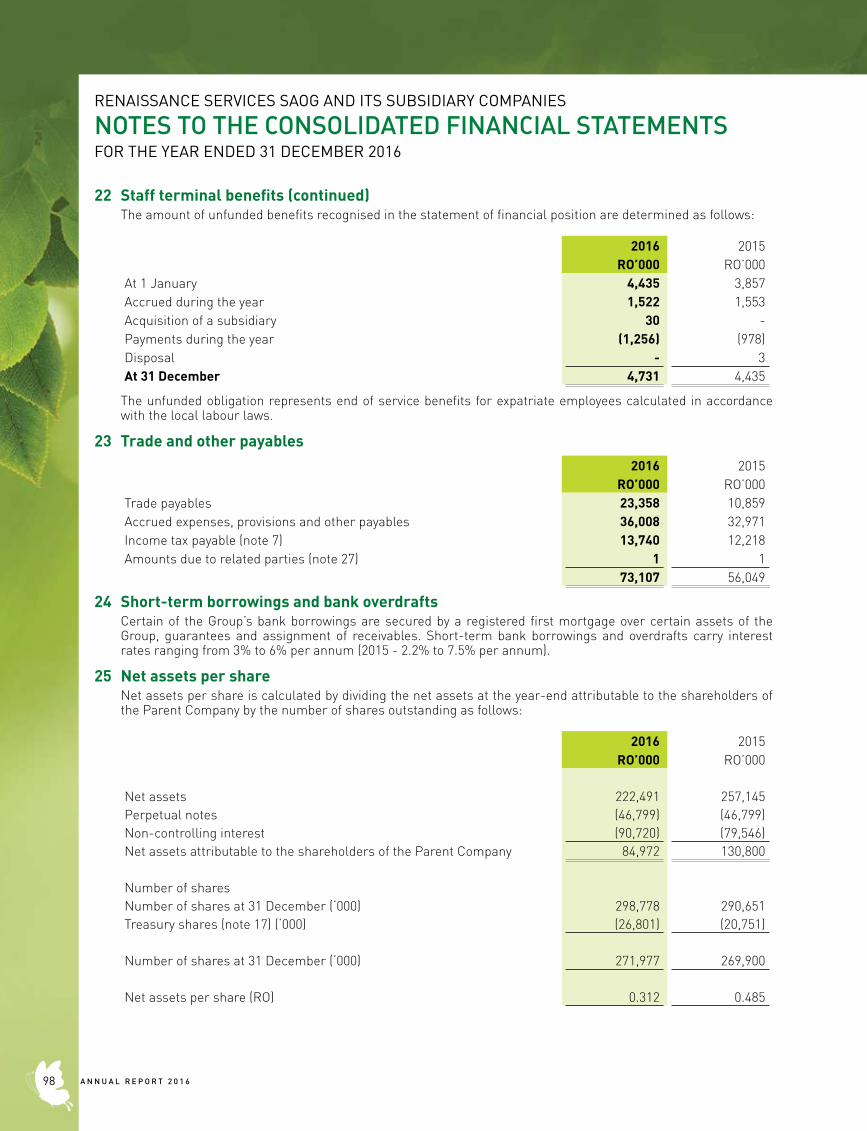
RENAISSANCE SERVICES SAOG AND ITS SUBSIDIARY COMPANIES
NOTES TO THE CONSOLIDATED FINANCIAL STATEMENTSFOR THE YEAR ENDED 31 DECEMBER 2016
22 Staff terminal benefits (continued)The amount of unfunded benefits recognised in the statement of financial position are determined as follows:
2016 2015 RO’000 RO’000At 1 January 4,435 3,857Accrued during the year 1,522 1,553Acquisition of a subsidiary 30 -Payments during the year (1,256) (978)Disposal - 3At 31 December 4,731 4,435
The unfunded obligation represents end of service benefits for expatriate employees calculated in accordance with the local labour laws.
23 Trade and other payables2016 2015
RO’000 RO’000Trade payables 23,358 10,859Accrued expenses, provisions and other payables 36,008 32,971Income tax payable (note 7) 13,740 12,218Amounts due to related parties (note 27) 1 1
73,107 56,049
24 Short-term borrowings and bank overdrafts Certain of the Group’s bank borrowings are secured by a registered first mortgage over certain assets of the Group, guarantees and assignment of receivables. Short-term bank borrowings and overdrafts carry interest rates ranging from 3% to 6% per annum (2015 - 2.2% to 7.5% per annum).
25 Net assets per shareNet assets per share is calculated by dividing the net assets at the year-end attributable to the shareholders of the Parent Company by the number of shares outstanding as follows:
2016 2015 RO’000 RO’000
Net assets 222,491 257,145Perpetual notes (46,799) (46,799)Non-controlling interest (90,720) (79,546)Net assets attributable to the shareholders of the Parent Company 84,972 130,800
Number of sharesNumber of shares at 31 December (‘000) 298,778 290,651Treasury shares (note 17) (‘000) (26,801) (20,751)
Number of shares at 31 December (‘000) 271,977 269,900
Net assets per share (RO) 0.312 0.485
A N N U A L R E P O R T 2 0 1 698
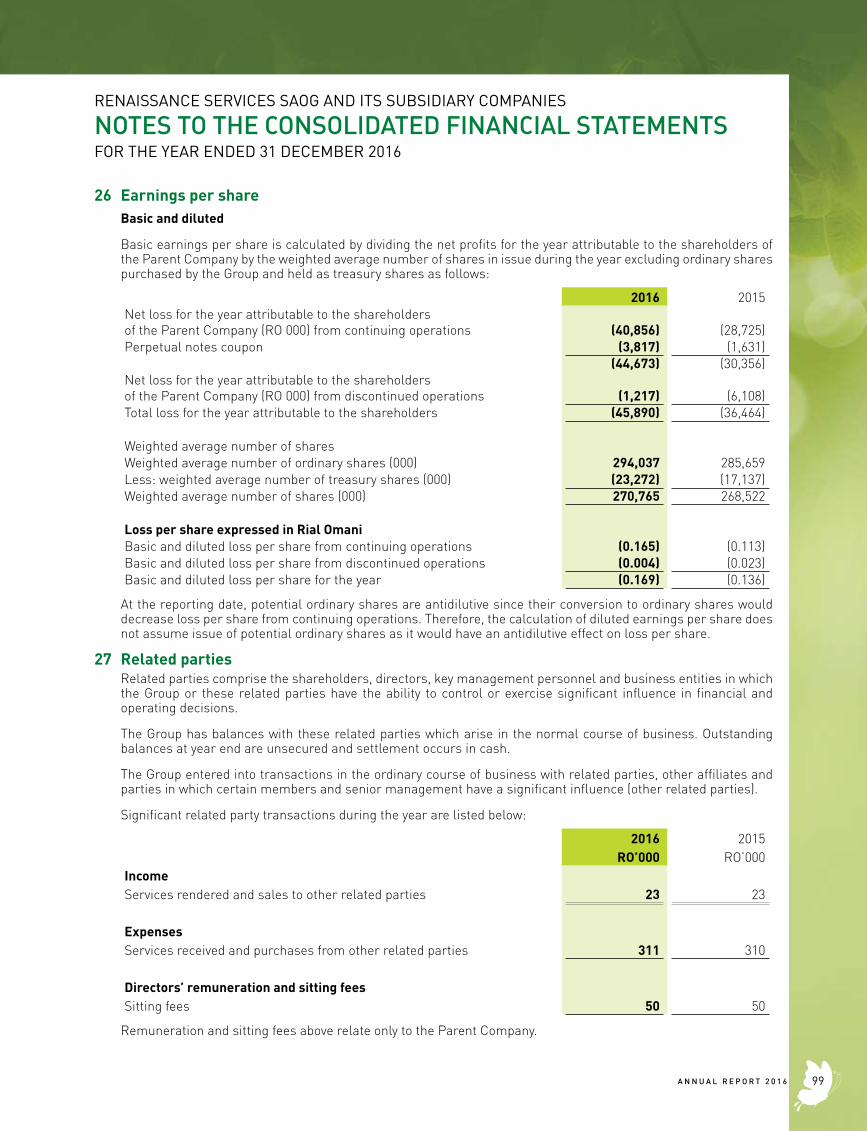
RENAISSANCE SERVICES SAOG AND ITS SUBSIDIARY COMPANIES
NOTES TO THE CONSOLIDATED FINANCIAL STATEMENTSFOR THE YEAR ENDED 31 DECEMBER 2016
26 Earnings per shareBasic and diluted
Basic earnings per share is calculated by dividing the net profits for the year attributable to the shareholders of the Parent Company by the weighted average number of shares in issue during the year excluding ordinary shares purchased by the Group and held as treasury shares as follows:
2016 2015Net loss for the year attributable to the shareholders of the Parent Company (RO 000) from continuing operations (40,856) (28,725)Perpetual notes coupon (3,817) (1,631)
(44,673) (30,356)Net loss for the year attributable to the shareholders of the Parent Company (RO 000) from discontinued operations (1,217) (6,108)Total loss for the year attributable to the shareholders (45,890) (36,464)
Weighted average number of sharesWeighted average number of ordinary shares (000) 294,037 285,659Less: weighted average number of treasury shares (000) (23,272) (17,137)Weighted average number of shares (000) 270,765 268,522
Loss per share expressed in Rial OmaniBasic and diluted loss per share from continuing operations (0.165) (0.113)Basic and diluted loss per share from discontinued operations (0.004) (0.023)Basic and diluted loss per share for the year (0.169) (0.136)
At the reporting date, potential ordinary shares are antidilutive since their conversion to ordinary shares would decrease loss per share from continuing operations. Therefore, the calculation of diluted earnings per share does not assume issue of potential ordinary shares as it would have an antidilutive effect on loss per share.
27 Related parties Related parties comprise the shareholders, directors, key management personnel and business entities in which the Group or these related parties have the ability to control or exercise significant influence in financial and operating decisions.
The Group has balances with these related parties which arise in the normal course of business. Outstanding balances at year end are unsecured and settlement occurs in cash.
The Group entered into transactions in the ordinary course of business with related parties, other affiliates and parties in which certain members and senior management have a significant influence (other related parties).
Significant related party transactions during the year are listed below:
2016 2015RO’000 RO’000
IncomeServices rendered and sales to other related parties 23 23
ExpensesServices received and purchases from other related parties 311 310
Directors’ remuneration and sitting feesSitting fees 50 50
Remuneration and sitting fees above relate only to the Parent Company.
99A N N U A L R E P O R T 2 0 1 6
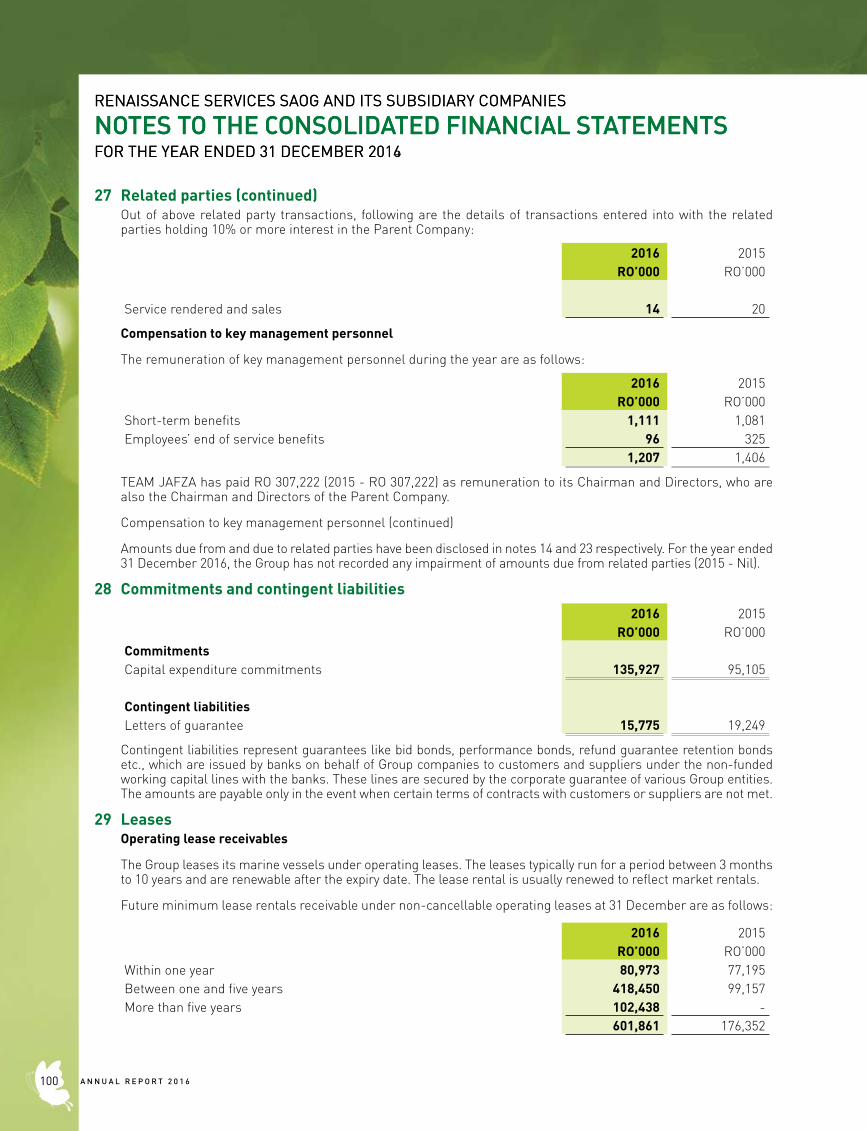
RENAISSANCE SERVICES SAOG AND ITS SUBSIDIARY COMPANIES
NOTES TO THE CONSOLIDATED FINANCIAL STATEMENTSFOR THE YEAR ENDED 31 DECEMBER 2016
27 Related parties (continued)Out of above related party transactions, following are the details of transactions entered into with the related parties holding 10% or more interest in the Parent Company:
2016 2015RO’000 RO’000
Service rendered and sales 14 20
Compensation to key management personnel
The remuneration of key management personnel during the year are as follows:
2016 2015RO’000 RO’000
Short-term benefits 1,111 1,081Employees’ end of service benefits 96 325
1,207 1,406
TEAM JAFZA has paid RO 307,222 (2015 - RO 307,222) as remuneration to its Chairman and Directors, who are also the Chairman and Directors of the Parent Company.
Compensation to key management personnel (continued)
Amounts due from and due to related parties have been disclosed in notes 14 and 23 respectively. For the year ended 31 December 2016, the Group has not recorded any impairment of amounts due from related parties (2015 - Nil).
28 Commitments and contingent liabilities2016 2015
RO’000 RO’000CommitmentsCapital expenditure commitments 135,927 95,105
Contingent liabilitiesLetters of guarantee 15,775 19,249
Contingent liabilities represent guarantees like bid bonds, performance bonds, refund guarantee retention bonds etc., which are issued by banks on behalf of Group companies to customers and suppliers under the non-funded working capital lines with the banks. These lines are secured by the corporate guarantee of various Group entities. The amounts are payable only in the event when certain terms of contracts with customers or suppliers are not met.
29 LeasesOperating lease receivables
The Group leases its marine vessels under operating leases. The leases typically run for a period between 3 months to 10 years and are renewable after the expiry date. The lease rental is usually renewed to reflect market rentals.
Future minimum lease rentals receivable under non-cancellable operating leases at 31 December are as follows:
2016 2015RO’000 RO’000
Within one year 80,973 77,195Between one and five years 418,450 99,157More than five years 102,438 -
601,861 176,352
RENAISSANCE SERVICES SAOG AND ITS SUBSIDIARY COMPANIES
NOTES TO THE CONSOLIDATED FINANCIAL STATEMENTSFOR THE YEAR ENDED 31 DECEMBER 2014
A N N U A L R E P O R T 2 0 1 6100
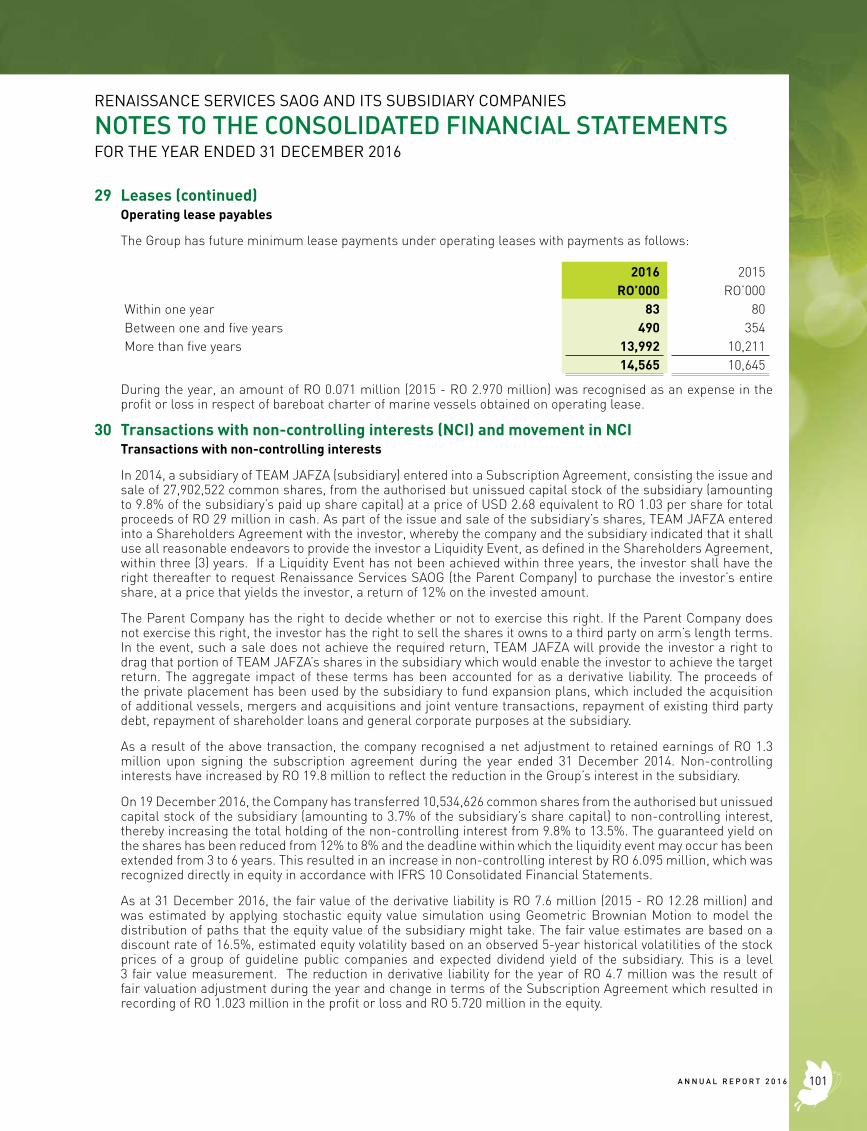
RENAISSANCE SERVICES SAOG AND ITS SUBSIDIARY COMPANIES
NOTES TO THE CONSOLIDATED FINANCIAL STATEMENTSFOR THE YEAR ENDED 31 DECEMBER 2016
29 Leases (continued)Operating lease payables
The Group has future minimum lease payments under operating leases with payments as follows:
2016 2015RO’000 RO’000
Within one year 83 80Between one and five years 490 354More than five years 13,992 10,211
14,565 10,645
During the year, an amount of RO 0.071 million (2015 - RO 2.970 million) was recognised as an expense in the profit or loss in respect of bareboat charter of marine vessels obtained on operating lease.
30 Transactions with non-controlling interests (NCI) and movement in NCITransactions with non-controlling interests
In 2014, a subsidiary of TEAM JAFZA (subsidiary) entered into a Subscription Agreement, consisting the issue and sale of 27,902,522 common shares, from the authorised but unissued capital stock of the subsidiary (amounting to 9.8% of the subsidiary’s paid up share capital) at a price of USD 2.68 equivalent to RO 1.03 per share for total proceeds of RO 29 million in cash. As part of the issue and sale of the subsidiary’s shares, TEAM JAFZA entered into a Shareholders Agreement with the investor, whereby the company and the subsidiary indicated that it shall use all reasonable endeavors to provide the investor a Liquidity Event, as defined in the Shareholders Agreement, within three (3) years. If a Liquidity Event has not been achieved within three years, the investor shall have the right thereafter to request Renaissance Services SAOG (the Parent Company) to purchase the investor’s entire share, at a price that yields the investor, a return of 12% on the invested amount.
The Parent Company has the right to decide whether or not to exercise this right. If the Parent Company does not exercise this right, the investor has the right to sell the shares it owns to a third party on arm’s length terms. In the event, such a sale does not achieve the required return, TEAM JAFZA will provide the investor a right to drag that portion of TEAM JAFZA’s shares in the subsidiary which would enable the investor to achieve the target return. The aggregate impact of these terms has been accounted for as a derivative liability. The proceeds of the private placement has been used by the subsidiary to fund expansion plans, which included the acquisition of additional vessels, mergers and acquisitions and joint venture transactions, repayment of existing third party debt, repayment of shareholder loans and general corporate purposes at the subsidiary.
As a result of the above transaction, the company recognised a net adjustment to retained earnings of RO 1.3 million upon signing the subscription agreement during the year ended 31 December 2014. Non-controlling interests have increased by RO 19.8 million to reflect the reduction in the Group’s interest in the subsidiary.
On 19 December 2016, the Company has transferred 10,534,626 common shares from the authorised but unissued capital stock of the subsidiary (amounting to 3.7% of the subsidiary’s share capital) to non-controlling interest, thereby increasing the total holding of the non-controlling interest from 9.8% to 13.5%. The guaranteed yield on the shares has been reduced from 12% to 8% and the deadline within which the liquidity event may occur has been extended from 3 to 6 years. This resulted in an increase in non-controlling interest by RO 6.095 million, which was recognized directly in equity in accordance with IFRS 10 Consolidated Financial Statements.
As at 31 December 2016, the fair value of the derivative liability is RO 7.6 million (2015 - RO 12.28 million) and was estimated by applying stochastic equity value simulation using Geometric Brownian Motion to model the distribution of paths that the equity value of the subsidiary might take. The fair value estimates are based on a discount rate of 16.5%, estimated equity volatility based on an observed 5-year historical volatilities of the stock prices of a group of guideline public companies and expected dividend yield of the subsidiary. This is a level 3 fair value measurement. The reduction in derivative liability for the year of RO 4.7 million was the result of fair valuation adjustment during the year and change in terms of the Subscription Agreement which resulted in recording of RO 1.023 million in the profit or loss and RO 5.720 million in the equity.
101A N N U A L R E P O R T 2 0 1 6
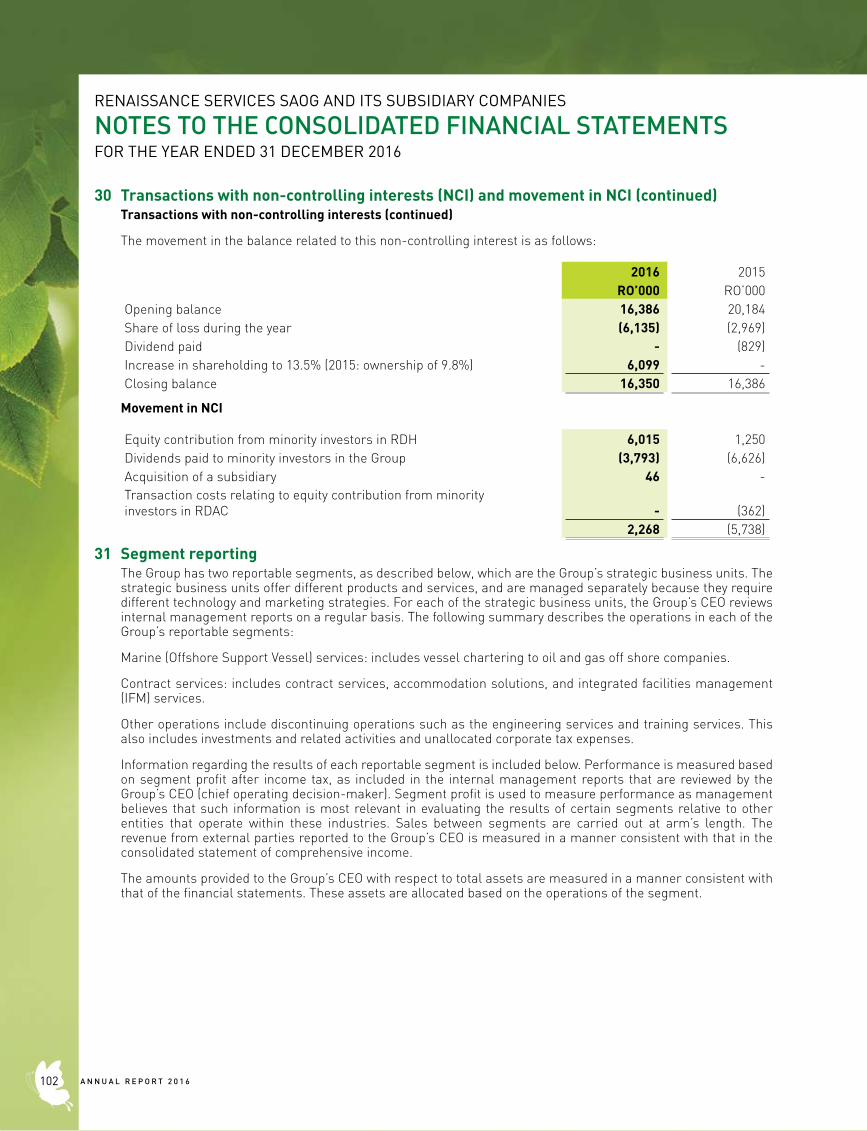
30 Transactions with non-controlling interests (NCI) and movement in NCI (continued)Transactions with non-controlling interests (continued)
The movement in the balance related to this non-controlling interest is as follows:
2016 2015RO’000 RO’000
Opening balance 16,386 20,184Share of loss during the year (6,135) (2,969)Dividend paid - (829)Increase in shareholding to 13.5% (2015: ownership of 9.8%) 6,099 -Closing balance 16,350 16,386
Movement in NCI
Equity contribution from minority investors in RDH 6,015 1,250Dividends paid to minority investors in the Group (3,793) (6,626)Acquisition of a subsidiary 46 -Transaction costs relating to equity contribution from minorityinvestors in RDAC - (362)
2,268 (5,738)
31 Segment reportingThe Group has two reportable segments, as described below, which are the Group’s strategic business units. The strategic business units offer different products and services, and are managed separately because they require different technology and marketing strategies. For each of the strategic business units, the Group’s CEO reviews internal management reports on a regular basis. The following summary describes the operations in each of the Group’s reportable segments:
Marine (Offshore Support Vessel) services: includes vessel chartering to oil and gas off shore companies.
Contract services: includes contract services, accommodation solutions, and integrated facilities management (IFM) services.
Other operations include discontinuing operations such as the engineering services and training services. This also includes investments and related activities and unallocated corporate tax expenses.
Information regarding the results of each reportable segment is included below. Performance is measured based on segment profit after income tax, as included in the internal management reports that are reviewed by the Group’s CEO (chief operating decision-maker). Segment profit is used to measure performance as management believes that such information is most relevant in evaluating the results of certain segments relative to other entities that operate within these industries. Sales between segments are carried out at arm’s length. The revenue from external parties reported to the Group’s CEO is measured in a manner consistent with that in the consolidated statement of comprehensive income.
The amounts provided to the Group’s CEO with respect to total assets are measured in a manner consistent with that of the financial statements. These assets are allocated based on the operations of the segment.
RENAISSANCE SERVICES SAOG AND ITS SUBSIDIARY COMPANIES
NOTES TO THE CONSOLIDATED FINANCIAL STATEMENTSFOR THE YEAR ENDED 31 DECEMBER 2016
A N N U A L R E P O R T 2 0 1 6102
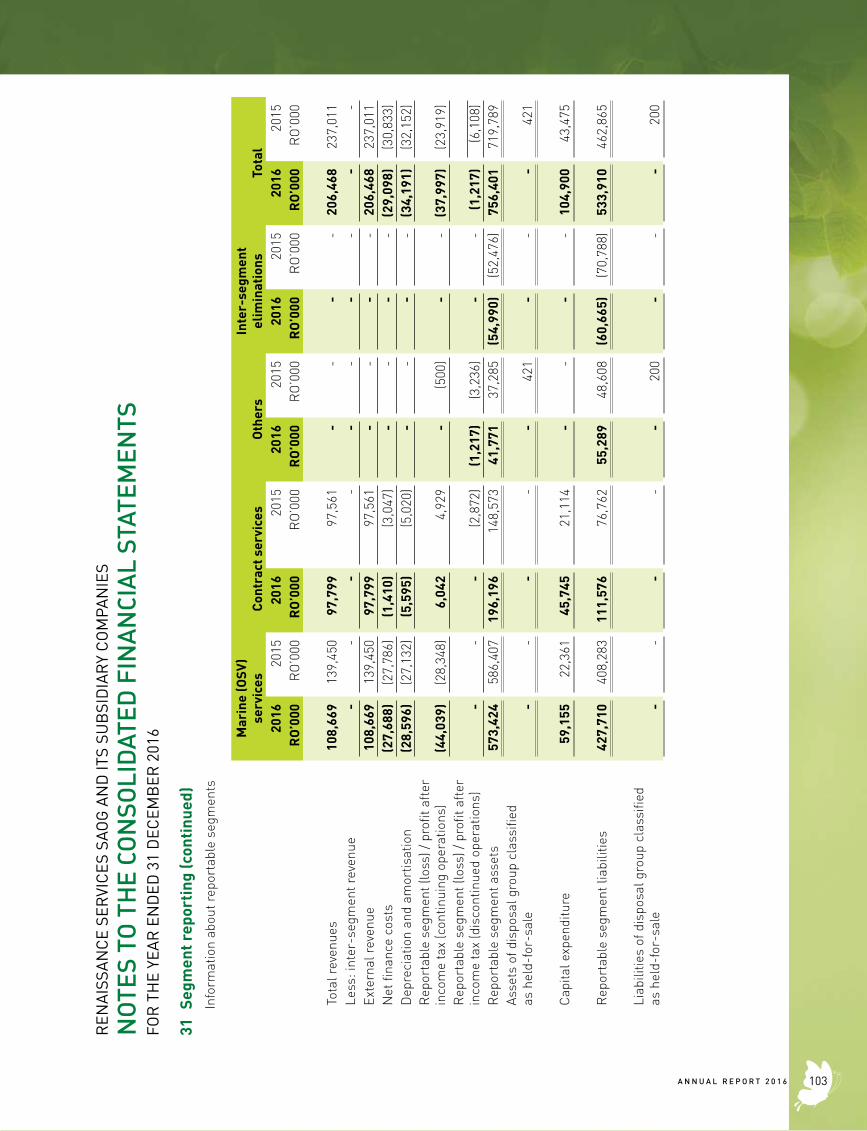
REN
AIS
SAN
CE
SER
VIC
ES S
AOG
AN
D IT
S SU
BSI
DIA
RY
CO
MPA
NIE
S
NO
TES
TO T
HE
CON
SOLI
DAT
ED F
INA
NCI
AL
STAT
EMEN
TSFO
R T
HE
YEA
R E
ND
ED 3
1 D
ECEM
BER
201
6
31 S
egm
ent r
epor
ting
(con
tinu
ed)
Info
rmat
ion
abou
t rep
orta
ble
segm
ents
Mar
ine
(OSV
) se
rvic
esC
ontr
act s
ervi
ces
Oth
ers
Inte
r-se
gmen
t el
imin
atio
nsTo
tal
20
16 2
015
2016
2015
2016
2015
2016
2015
2016
2015
R
O’0
00R
O’0
00R
O’0
00R
O’0
00R
O’0
00R
O’0
00R
O’0
00R
O’0
00R
O’0
00R
O’0
00
Tota
l rev
enue
s10
8,66
913
9,45
097
,799
97,5
61-
--
-20
6,46
823
7,01
1Le
ss: i
nter
-seg
men
t rev
enue
-
--
--
--
--
-Ex
tern
al r
even
ue10
8,66
913
9,45
097
,799
97,5
61-
--
-20
6,46
823
7,01
1N
et fi
nanc
e co
sts
(27,
688)
(27,
786)
(1,4
10)
(3,0
47)
--
--
(29,
098)
(30,
833)
Dep
reci
atio
n an
d am
ortis
atio
n(2
8,59
6)(2
7,13
2)(5
,595
)(5
,020
)-
--
-(3
4,19
1)(3
2,15
2)R
epor
tabl
e se
gmen
t (lo
ss) /
pro
fit a
fter
in
com
e ta
x (c
ontin
uing
ope
ratio
ns)
(44,
039)
(28,
348)
6,04
24,
929
-(5
00)
--
(37,
997)
(23,
919)
Rep
orta
ble
segm
ent (
loss
) / p
rofit
aft
er
inco
me
tax
(dis
cont
inue
d op
erat
ions
)-
--
(2,8
72)
(1,2
17)
(3,2
36)
--
(1,2
17)
(6,1
08)
Rep
orta
ble
segm
ent a
sset
s57
3,42
458
6,40
719
6,19
614
8,57
341
,771
37,2
85(5
4,99
0)(5
2,47
6)75
6,40
171
9,78
9As
sets
of d
ispo
sal g
roup
cla
ssifi
ed
as h
eld-
for-
sale
--
--
-42
1-
--
421
Cap
ital e
xpen
ditu
re59
,155
22,3
6145
,745
21,1
14-
--
-10
4,90
043
,475
Rep
orta
ble
segm
ent l
iabi
litie
s42
7,71
040
8,28
311
1,57
676
,762
55,2
8948
,608
(60,
665)
(70,
788)
533,
910
462,
865
Liab
ilitie
s of
dis
posa
l gro
up c
lass
ified
as
hel
d-fo
r-sa
le-
--
--
200
--
-20
0
103A N N U A L R E P O R T 2 0 1 6
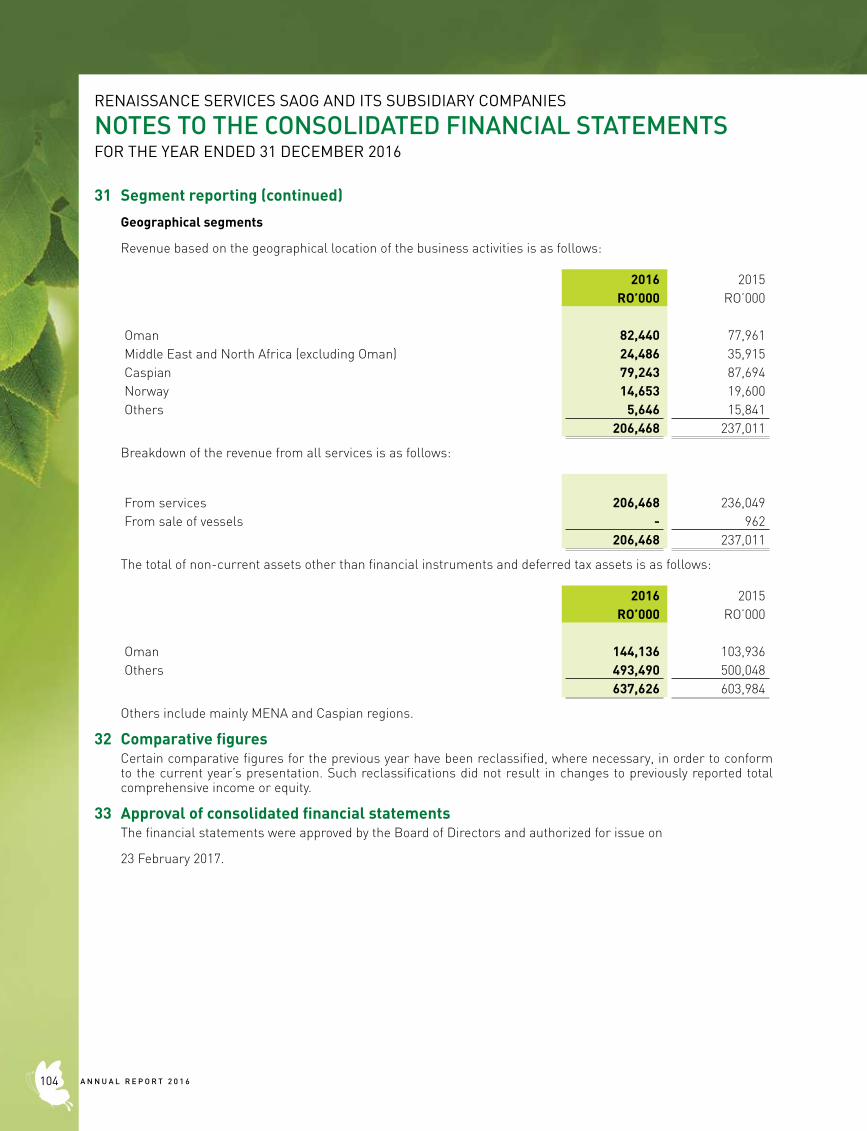
RENAISSANCE SERVICES SAOG AND ITS SUBSIDIARY COMPANIES
NOTES TO THE CONSOLIDATED FINANCIAL STATEMENTSFOR THE YEAR ENDED 31 DECEMBER 2016
31 Segment reporting (continued)
Geographical segments
Revenue based on the geographical location of the business activities is as follows:
2016 2015RO’000 RO’000
Oman 82,440 77,961Middle East and North Africa (excluding Oman) 24,486 35,915Caspian 79,243 87,694Norway 14,653 19,600Others 5,646 15,841
206,468 237,011
Breakdown of the revenue from all services is as follows:
From services 206,468 236,049From sale of vessels - 962
206,468 237,011
The total of non-current assets other than financial instruments and deferred tax assets is as follows:
2016 2015RO’000 RO’000
Oman 144,136 103,936Others 493,490 500,048
637,626 603,984
Others include mainly MENA and Caspian regions.
32 Comparative figuresCertain comparative figures for the previous year have been reclassified, where necessary, in order to conform to the current year’s presentation. Such reclassifications did not result in changes to previously reported total comprehensive income or equity.
33 Approval of consolidated financial statementsThe financial statements were approved by the Board of Directors and authorized for issue on
23 February 2017.
A N N U A L R E P O R T 2 0 1 6104
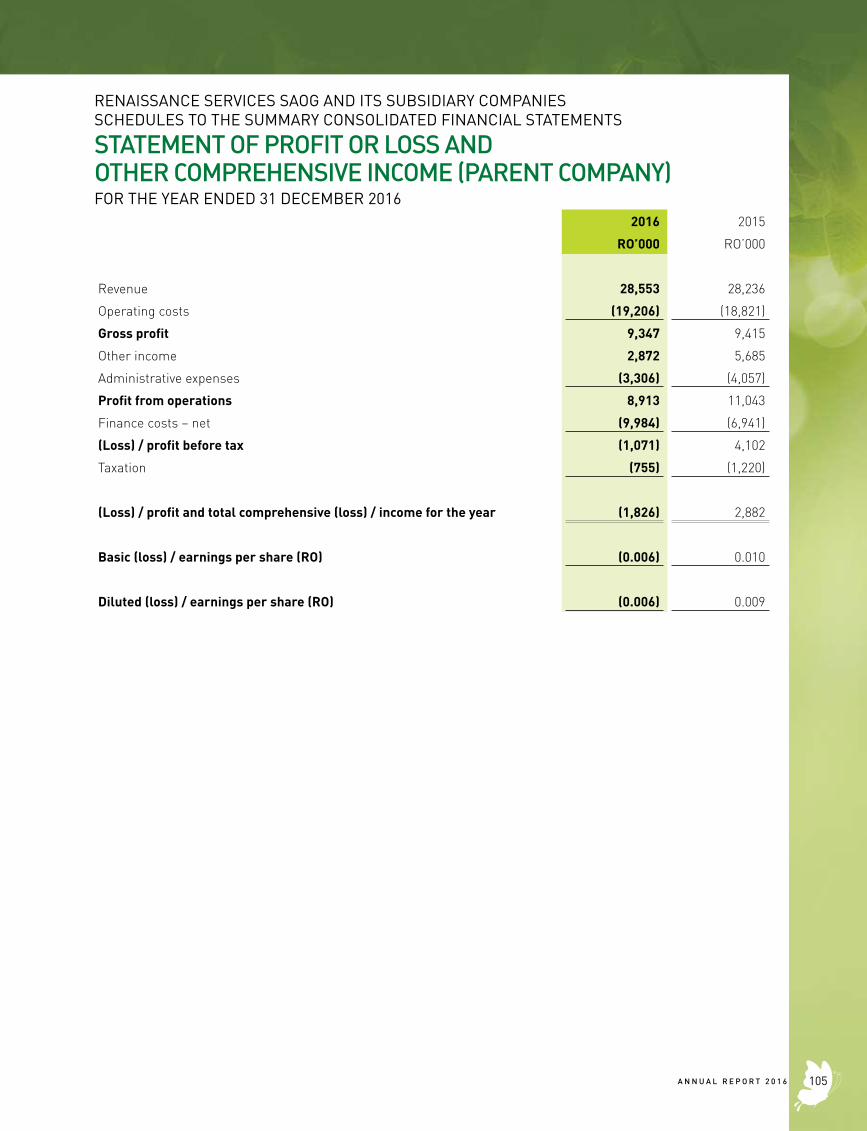
RENAISSANCE SERVICES SAOG AND ITS SUBSIDIARY COMPANIESSCHEDULES TO THE SUMMARY CONSOLIDATED FINANCIAL STATEMENTS
STATEMENT OF PROFIT OR LOSS AND OTHER COMPREHENSIVE INCOME (PARENT COMPANY)FOR THE YEAR ENDED 31 DECEMBER 2016
2016 2015
RO’000 RO’000
Revenue 28,553 28,236
Operating costs (19,206) (18,821)
Gross profit 9,347 9,415
Other income 2,872 5,685
Administrative expenses (3,306) (4,057)
Profit from operations 8,913 11,043
Finance costs – net (9,984) (6,941)
(Loss) / profit before tax (1,071) 4,102
Taxation (755) (1,220)
(Loss) / profit and total comprehensive (loss) / income for the year (1,826) 2,882
Basic (loss) / earnings per share (RO) (0.006) 0.010
Diluted (loss) / earnings per share (RO) (0.006) 0.009
105A N N U A L R E P O R T 2 0 1 6
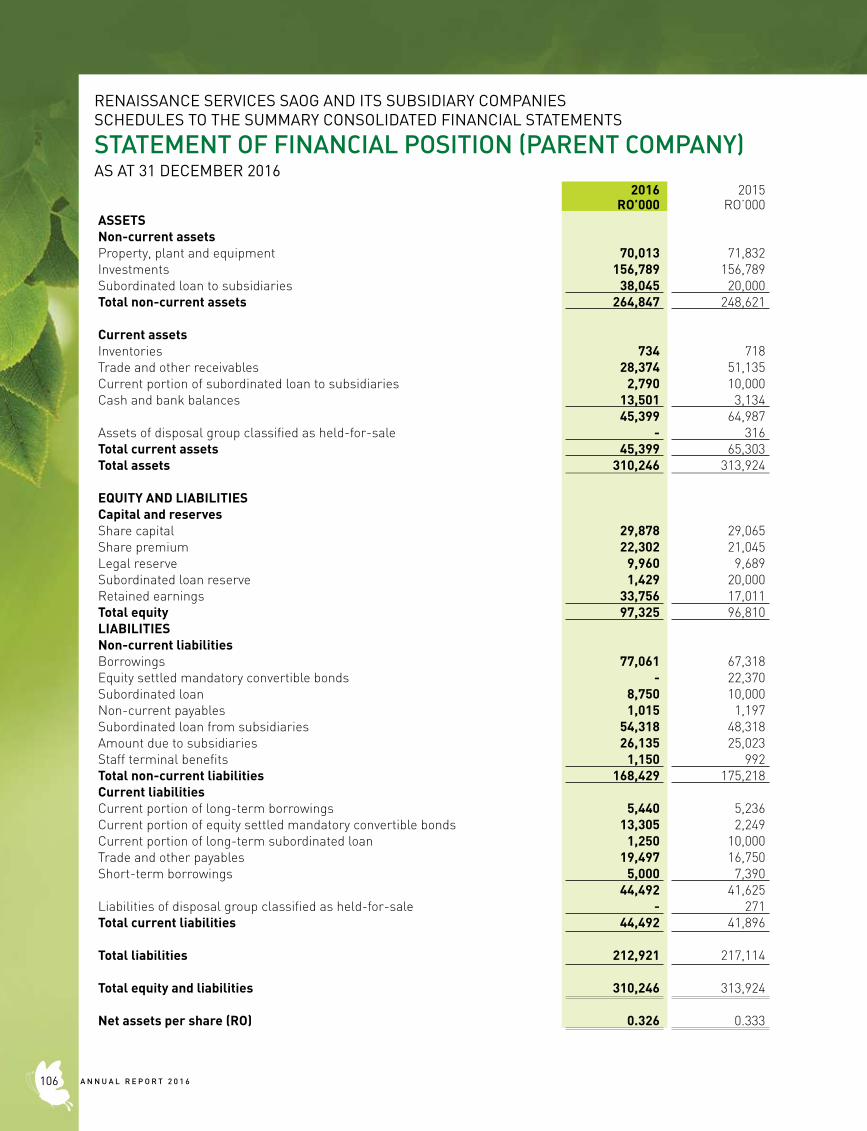
RENAISSANCE SERVICES SAOG AND ITS SUBSIDIARY COMPANIESSCHEDULES TO THE SUMMARY CONSOLIDATED FINANCIAL STATEMENTS
STATEMENT OF FINANCIAL POSITION (PARENT COMPANY)AS AT 31 DECEMBER 2016
2016 2015RO’000 RO’000
ASSETSNon-current assetsProperty, plant and equipment 70,013 71,832Investments 156,789 156,789Subordinated loan to subsidiaries 38,045 20,000Total non-current assets 264,847 248,621
Current assetsInventories 734 718Trade and other receivables 28,374 51,135Current portion of subordinated loan to subsidiaries 2,790 10,000Cash and bank balances 13,501 3,134
45,399 64,987Assets of disposal group classified as held-for-sale - 316Total current assets 45,399 65,303Total assets 310,246 313,924
EQUITY AND LIABILITIESCapital and reservesShare capital 29,878 29,065Share premium 22,302 21,045Legal reserve 9,960 9,689Subordinated loan reserve 1,429 20,000Retained earnings 33,756 17,011Total equity 97,325 96,810LIABILITIESNon-current liabilitiesBorrowings 77,061 67,318Equity settled mandatory convertible bonds - 22,370Subordinated loan 8,750 10,000Non-current payables 1,015 1,197Subordinated loan from subsidiaries 54,318 48,318Amount due to subsidiaries 26,135 25,023Staff terminal benefits 1,150 992Total non-current liabilities 168,429 175,218Current liabilitiesCurrent portion of long-term borrowings 5,440 5,236Current portion of equity settled mandatory convertible bonds 13,305 2,249Current portion of long-term subordinated loan 1,250 10,000Trade and other payables 19,497 16,750Short-term borrowings 5,000 7,390
44,492 41,625Liabilities of disposal group classified as held-for-sale - 271Total current liabilities 44,492 41,896
Total liabilities 212,921 217,114
Total equity and liabilities 310,246 313,924
Net assets per share (RO) 0.326 0.333
A N N U A L R E P O R T 2 0 1 6106

RENAISSANCE SERVICES SAOG AND ITS SUBSIDIARY COMPANIES SCHEDULES TO THE SUMMARY CONSOLIDATED FINANCIAL STATEMENTS
STATEMENT OF CHANGES IN EQUITY (PARENT COMPANY)FOR THE YEAR ENDED 31 DECEMBER 2016
Sharecapital
Sharepremium
Legalreserve
Subordinatedloan reserve
Retainedearnings Total
RO’000 RO’000 RO’000 RO’000 RO’000 RO’000
At 1 January 2015 28,209 19,496 9,404 21,429 15,806 94,344
Comprehensive income:
Profit for the year - - - - 2,882 2,882
Shares issued on conversion of MCBs 856 1,549 - - - 2,405
Transfer from subordinated loan reserve - - - (1,429) 1,429 -
Transfer to legal reserve - - 285 - (285) -
Dividend paid - - - - (2,821) (2,821)
At 1 January 2016 29,065 21,045 9,689 20,000 17,011 96,810
Comprehensive income:
Loss for the year - - - - (1,826) (1,826)
Shares issued on conversion of MCBs 813 1,528 - - 2,341
Transfer from subordinated loan reserve - - - (18,571) 18,571 -
Transfer to legal reserve - (271) 271 - - -
At 31 December 2016 29,878 22,302 9,960 1,429 33,756 97,325
107A N N U A L R E P O R T 2 0 1 6
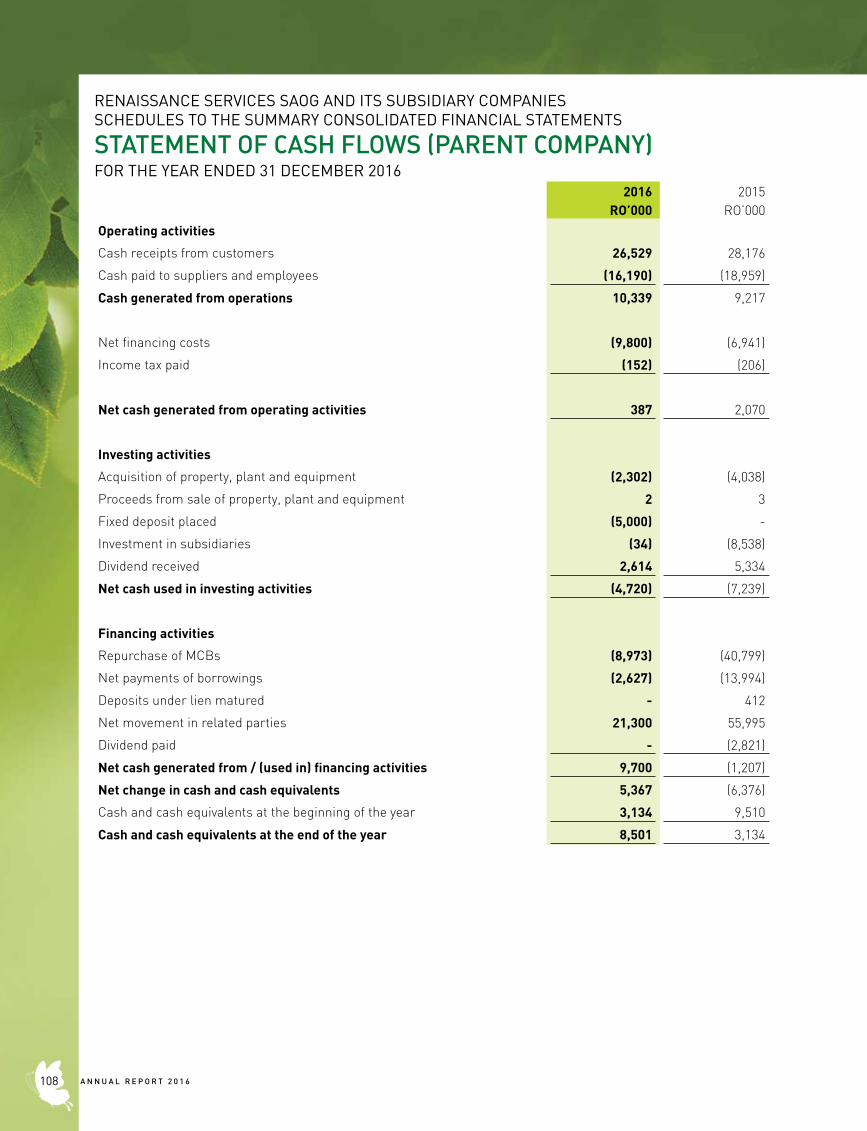
RENAISSANCE SERVICES SAOG AND ITS SUBSIDIARY COMPANIES SCHEDULES TO THE SUMMARY CONSOLIDATED FINANCIAL STATEMENTS
STATEMENT OF CASH FLOWS (PARENT COMPANY)FOR THE YEAR ENDED 31 DECEMBER 2016
2016 2015RO’000 RO’000
Operating activities
Cash receipts from customers 26,529 28,176
Cash paid to suppliers and employees (16,190) (18,959)
Cash generated from operations 10,339 9,217
Net financing costs (9,800) (6,941)
Income tax paid (152) (206)
Net cash generated from operating activities 387 2,070
Investing activities
Acquisition of property, plant and equipment (2,302) (4,038)
Proceeds from sale of property, plant and equipment 2 3
Fixed deposit placed (5,000) -
Investment in subsidiaries (34) (8,538)
Dividend received 2,614 5,334
Net cash used in investing activities (4,720) (7,239)
Financing activities
Repurchase of MCBs (8,973) (40,799)
Net payments of borrowings (2,627) (13,994)
Deposits under lien matured - 412
Net movement in related parties 21,300 55,995
Dividend paid - (2,821)
Net cash generated from / (used in) financing activities 9,700 (1,207)
Net change in cash and cash equivalents 5,367 (6,376)
Cash and cash equivalents at the beginning of the year 3,134 9,510
Cash and cash equivalents at the end of the year 8,501 3,134
A N N U A L R E P O R T 2 0 1 6108
Related Documents