DS2831 Digital TV Spectrum Analyzer User Guide

Welcome message from author
This document is posted to help you gain knowledge. Please leave a comment to let me know what you think about it! Share it to your friends and learn new things together.
Transcript

DS2831 Digital TV Spectrum Analyzer
User Guide

DS2831 Digital TV Spectrum Analyzer
2
Table of Contents
PART I: DS2831 BASICS 6
Safety Precautions 7
Statement of FCC Compliance 9
Warranty 10
Chapter 1: General Information 11
1-1 About the DS2831 Digital TV Spectrum Analyzer 11 1-2 Accessories and Measurement Options 12 1-3 Technical Support & Service 13 1-4 Annual Service Verification 13 1-5 Electrostatic Discharge Caution 13 1-6 Battery Care 14
Glossary of Acronyms 16
Chapter 2: Instrument Overview 18
2-1 Unpacking the DS2831 Instrument 18 2-2 Powering On the DS2831 18 2-3 Front Panel Overview 19 2-4 Top Panel Overview 20 2-5 Control Overview 21 2-6 Measurement Main Menu 22 2-7 Measurement Mode Selection 24 2-8 About the Soft Carrying Case 24
Chapter 3: Quick Start Guide (Making a Measurement) 25
PART II: SETTINGS AND MEASUREMENTS 34
Chapter 4: Channel Plans 35
4-1 Creating a User Channel Plan 35 4-2 Editing Channel Plans 37 4-3 Importing and Exporting Channel Plans 39
Chapter 5: Analog TV 40
5-1 Channel Measurement 40 5-2 Analog FM 41 5-3 FM Demodulation 41 5-4 HUM Modulation 42 5-5 Channel Scan 43 5-6 Mini-Scan 44 5-7 Downstream Passive Sweep 45 5-8 Tilt Measurement 48

DS2831 Digital TV Spectrum Analyzer
3
Chapter 6: Analog Non-Linear Distortion Measurement 49
6-1 Carrier-to-Composite Noise Ratio 49 6-2 CTB / CSO 51
Chapter 7: Analog TV Video 52
7-1 Depth of Modulation (DOM) 52 7-2 In-Channel Frequency Response 53 7-3 Differential Gain and Differential Phase 55 7-4 Chrominance to Luminance Delay Inequality 56
Chapter 8: Digital Signal Measurement 57
8-1 DVB-C Measurement 58 8-2 OFDM 58 8-3 Digital HUM 59 8-4 Constellation Diagram 60 8-5 MER & BER Statistics Graph 61 8-6 Error Vector Spectrum (EVS) Function 62 8-7 Adaptive Equalizer, Frequency Response, and Group Delay 63
Chapter 9: Transport Stream Analysis 66
9-1 Transport Stream Real-time Analysis 67 9-2 Basic Information 68 9-3 TR 101 290 Priority 1, 2 and 3 Tests 69 9-4 PID Viewer 72 9-5 PCR Analysis 73 9-6 Program List 73 9-7 PSI/SI Table Analysis 74 9-8 PSI/PSIP Table Analysis 76 9-9 Data Capture 78
Chapter 10: Downstream Spectrum Analysis 81
10-1 Frequency Settings 82 10-2 Amplitude Settings 82 10-3 RBW & VBW Bandwidth/Sweep Setting 84 10-4 Markers 85 10-5 Trace Setting 86 10-6 Detector Type Setting 87 10-7 Display Mode Setting 87 A Note on Upstream Spectrum Analysis 89
Chapter 11: Persistence Analysis 90
11-1 Introduction to Persistence Theory 90 11-2 Introduction to Persistence Technology 90 11-3 Introduction to Persistence Application 91 11-4 Persistence Recording 91
Chapter 12: Reverse Path Sweep 95
12-1 System Architecture 95 12-2 Operation Principle 95 12-3 Measurement Setup 96 12-4 Bidirectional Test System Parameters and Range Setup 103 12-5 System Connection 104 12-6 Troubleshooting 104
DS2831 Digital TV Spectrum Analyzer
4
Chapter 13: Upstream Signal Generator 105
13-1 Basic Operation 105 13-2 Sweep Function 106
Chapter 14: Loopback Test 107
Chapter 15: DOCSIS 3.1 Cable Modem Test 108
15-1 Basic Operation 108 15-2 Cable Modem Tools 110
Chapter 16: Throughput Testing 114
16-1 Starting iPerf Error! Bookmark not defined. 16-2 Testing From Your DS2831 Error! Bookmark not defined.
Chapter 17: PPPoE 120
Chapter 18: PING 121
Chapter 19: Traceroute 122
Chapter 20: FTP 123
Chapter 21: Browser 124
Chapter 22: WiFi Analysis 125
Chapter 23: DOCSIS 3.1 OFDM DS Channel Test 126
23-1 OFDM Integrated Channel Test 127 23-2 OFDM In-Band Frequency Response 129 23-3 OFDM Spectrum Measurement 130
Chapter 24: Optical Fiber Applications 131
24-1 Introduction to Fiber Connectors 131 24-2 Optical Power Meter 133 24-3 VFL (Visual Fault Location) 134 24-4 Fiber Scope 135
PART III: BACKGROUND AND CONCEPTS 136
Chapter 25: Analog TV Standards & Color Systems 137
Chapter 26: Analog TV Baseband Signals 140
26-1 Understanding Composite Video Signal 140 26-2 Principles of Interlaced Scanning 142 26-3 Principles of Gated Measurements 143
Chapter 27: Resolution and Video Bandwidth 149
27-1 Resolution Bandwidth filter (RBW) 149 27-2 Video Bandwidth filter (VBW) 149

DS2831 Digital TV Spectrum Analyzer
5
Chapter 28: Detector Mode 150
Chapter 29: International CATV Standards 151
Application Note: A Study of Digital Persistence Analysis 159
PART IV: SYSTEM FUNCTIONS 163
Chapter 30: System Settings 164
30-1 About (System Information) 164 30-2 General Settings 165 30-3 Measure Settings 169
Chapter 31: File Management 172
31-1 File Operations 172 31-2 Importing and Exporting Data 174
Chapter 32: Saving Data 175
32-1 Screenshots 175 32-2 Measurement Data 175
Chapter 33: Auto Test 176
33-1 Creating a Project 176
33-2 Managing Projects 177
33-3 Work Orders 178
Specifications 179
Application Note: WiFi Hotspot & Remote Assist 182
Application Note: Error Vector Spectrum 185

Part I: DS2831 Basics
6
Part I DS2831 Basics

Part I: DS2831 Basics
7
Safety Precautions
The following are general safety precautions that are not necessarily related to any specific part or
procedure, and do not necessarily appear elsewhere in this publication. These precautions must be
thoroughly understood, and they apply to all phases of operation and maintenance. Deviser Instruments,
Inc. assumes no liability for the operator’s failure to comply with these precautions.
WARNING
Plug Compatibility
Before connecting to AC power, please insure the adaptor plug fits the wall configuration on
one end, and the power supply plug configuration on the other end. Incorrect configuration may damage the power supply.
WARNING
Shock Hazard
To avoid the possibility of severe injury or death, observe the following precautions when
using the DS2831 Digital TV Spectrum Analyzer:
• Do not remove the system covers, and do not perform electrical tests if there are
signs of shipping damage to the outer enclosure.
• When connecting test cables to a line, do not touch the cable’s metal contact
points, or allow the cable leads to touch each other.
• Use only the supplied power cords and connect only to a properly grounded wall
outlet. Do not use extension cords that do not have a protective ground conductor.
WARNING
Explosion Hazard Do not operate the instrument in the presence of flammable gases or fumes.
WARNING
Do Not Use If Damaged
Do not use this product if it shows visible damage, fails to perform, has been stored in
unfavorable conditions, or has been subject to severe transportation stresses. Secure the
product against any unintended operation and contact a Deviser Instruments, Inc. Factory
Authorized Service Center for assistance.
WARNING
Remove Power Observe general safety precautions. Do not open the instrument with the power on.
WARNING
Battery Care
Danger of explosion if the battery is incorrectly replaced. It is recommended to replace the
battery only with the same type. Do not dispose of batteries in fire or trash. Batteries must be recycled or disposed of properly.

Part I: DS2831 Basics
8
Maintenance and Safety Considerations
Calibrating the Meter
Any instrument with analog circuitry (including preamplifiers, filters, etc.) may change in performance over
time. Regular calibration will keep your instrument in optimal working condition to support your test, design,
troubleshooting, and manufacturing needs.
It is recommended to calibrate and verify the instrument at least once per year to ensure that it meets the
stated performance specifications.
To avoid damaging the default calibration data stored in device memory, instrument calibration should
only be performed with appropriate equipment by qualified personnel at a Deviser Instruments, Factory-
Authorized Service Center.
Environmental conditions:
Calibration and verification tests should be performed in a laboratory where the ambient temperature and
relative humidity can be controlled.
Warm up:
Allow up to at least 5 minutes’ warm- up before calibrating the instrument. If the unit has been exposed to
or stored in a high-humidity (condensing) environment, allow more time.
For detailed information on calibration procedures, please contact an authorized Deviser distributor.
Other Safety and Maintenance Tips
Please charge and discharge the battery every 3 months to extend battery life. Recharge the battery only
in the instrument; If left unused, a fully charged battery will discharge itself over time.
Never use a damaged or worn-out adapter or battery. During charge, the unit may be warm to the touch
even if it is powered off. To avoid overheating, always disconnect the unit from the AC adapter before
storing it in the carrying case.
CAUTION: Extreme temperatures will affect the ability of the battery to charge. Allow the battery to return
to room temperature before use or charging. Storing a battery in extreme hot or cold temperatures will
reduce its capacity and lifetime. It is recommended to store batteries at temperatures less than 25°C.
The unit cannot be used in its carrying case for more than 1 hour if the ambient temperature exceeds 35°C.
CAUTION: Use only the original AC-DC adapter and battery to power the unit. To charge, simply insert the
battery into the unit’s back panel, plug in the AC-DC adapter, and switch the power on if necessary. If the
LED is red, the battery is charging. When fully charged, the LED will turn green. Time required to fully charge
a depleted battery is approximately four hours, but may be longer if the instrument is in use while charging.
CAUTION: While updating firmware, the unit must remain connected to power and at more than 60%
battery power. If power fails during the updating process, instrument function may be affected.
DANGER: The DS2831 contains an optional VFL (Visual Fault Locator). To avoid eye damage, never look
directly into the VFL output port while the light is on, and wear appropriate eye protection when necessary.
Part I: DS2831 Basics
9
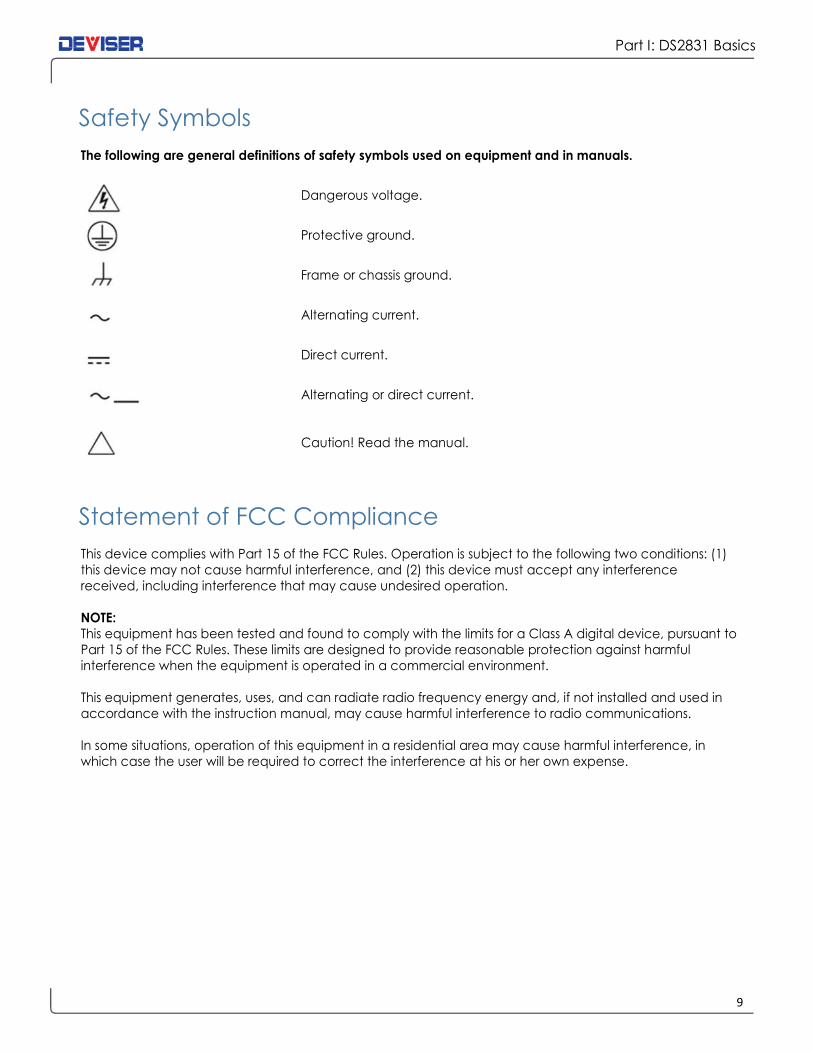
Safety Symbols
The following are general definitions of safety symbols used on equipment and in manuals.
Dangerous voltage.
Protective ground.
Frame or chassis ground.
Alternating current.
Direct current.
Alternating or direct current.
Caution! Read the manual.
Statement of FCC Compliance
This device complies with Part 15 of the FCC Rules. Operation is subject to the following two conditions: (1)
this device may not cause harmful interference, and (2) this device must accept any interference
received, including interference that may cause undesired operation.
NOTE:
This equipment has been tested and found to comply with the limits for a Class A digital device, pursuant to
Part 15 of the FCC Rules. These limits are designed to provide reasonable protection against harmful
interference when the equipment is operated in a commercial environment.
This equipment generates, uses, and can radiate radio frequency energy and, if not installed and used in
accordance with the instruction manual, may cause harmful interference to radio communications.
In some situations, operation of this equipment in a residential area may cause harmful interference, in
which case the user will be required to correct the interference at his or her own expense.

Part I: DS2831 Basics
10
Warranty
This Deviser Instruments, Inc. product is warrantied against defects in material and workmanship for a period
of 36 months from the date of shipment. Under warranty, Deviser Instruments, Inc. will, at its option, either
repair or replace products which prove to be defective.
Extended warranty options are available. Please contact your local Deviser Instruments sales representative
for more information.
For warranty service or repair, this product must be returned to a Deviser Instruments Factory Authorized
Service Center designated. The buyer shall prepay shipping charges to Deviser Instruments Inc. or to the
service center and Deviser Instruments Inc. or the service center shall pay the shipping charges to return the
product to the buyer. However, for products returned to Deviser Instruments Inc. or one of its authorized
service centers outside the warranty period, the buyer is responsible for all shipping charges, duties, and
taxes, both ways.
Deviser Instruments Inc. warrants that software and firmware designated by Deviser Instruments Inc. for use
with an instrument will execute its programming instructions when properly installed on that instrument.
Deviser Instruments Inc. does not warrant that the operation of the instrument or its software or firmware will
be uninterrupted or error-free.
Limitation of Warranty
Unauthorized repair or update, physical damage or improper operational voltage (at the power supply or
RF input) will void this warranty. The main lithium battery is covered for a period of 12 months.
The foregoing warranty shall not apply to defects resulting from the following:
• Improper or inadequate use or maintenance by Buyer
• Buyer-supplied software or interfacing
• Unauthorized modification or misuse
• Operation outside of the environmental specifications for the product.
NO OTHER WARRANTY IS EXPRESSED OR IMPLIED. DEVISER INSTRUMENTS INC SPECIFICALLY DISCLAIMS THE
IMPLIED WARRANTIES OF MERCHANTABILITY AND FITNESS FOR A PARTICULAR PURPOSE.
Updates, if any, may be downloaded from the Deviser web site at http://www.deviserinstruments.com/.
Part I: DS2831 Basics
11
Chapter 1: General Information
The DS2831 is a Digital TV spectrum analyzer that integrates multiple measurement applications in a single
instrument, ideal for use by CATV field technicians and HE engineers.
The firmware installed on the DS2831 is updated on a regular basis. This User Guide describes procedures for
operating the instrument, based on the most recent firmware version up to the date listed on the guide.
1-1 About the DS2831 Digital TV Spectrum Analyzer
With the latest in RF test and measurement technology, this DS2831 spectrum analyzer includes a host of
features typically found in more expensive instruments and provides outstanding performance for value.
The RF front end of this true spectrum analyzer offers a dynamic range of 80dB @ 30kHz RBW.
The state-of-the-art cable modem supports DOCSIS 3.1 measurements; in addition to standard SCQAM
capabilities (32 downstream carriers, 8 upstream carriers), the DS2831 now offers OFDM demodulation for
downstream channels up to 192 MHz wide and upstream channels either 48 or 96 MHz wide.
The DS2831 adds a capacitive LCD touchscreen and a host of crucial functions, enabling field engineers to
perform in-service measurements and identify interference signals that are invisible to many field analyzers
currently available on the RF test equipment market. Spectrum & QAM analyses are shown simultaneously,
allowing the user to verify analog / digital characteristics of the same carrier at the same time. With the
upstream spectrum analysis tool, users can perform persistence tests (up to a span of 206MHz) to find
intermittent impairments that traditional spectrum analyzers fail to see.
Gated C/N, CSO, and CTB measurements, triggering on VITS test signals, allow for non-interfering in-service
basic CATV channel tests. By using the appropriate VITS test signal on a specific video line, the DS2831 can
also perform video parameter measurements such as differential gain/phase – which the FCC requires to
be tested every 3 years. With the advent of LTE interference ingress signals, the DS2831’s EVS (Error Vector
Spectrum) Frequency or Time function enables non-interfering tests “under the QAM signal”.
As another example of the DS2831’s exceptional versatility, it also supports MPEG TS (transport stream)
analysis. This function provides the MPEG program information and channel frequency list – so that, when
attempting to troubleshoot, a field engineer can easily identify the QAM carrier of interest based on the
particular program complaint from the customer. When used in conjunction with the DS1610 broadband
network monitoring system, the instrument can also capture a sweep response trace of the upstream path.
The DS2831 is supported by the cloud-based Deviser ARGOSYNC platform for asset & data management.
Each instrument comes with Measurement, Constellation, Spectrum, Tilt, Scan, and Mini-Scan downstream
functions, and Cable Modem, Spectrum, Ping, FTP, Traceroute, PPPoE, and Browser modes. Optional tools
may be enabled either at the time of purchase, or at a later date as your test needs evolve.
• In-service C/N, CSO, and CTB gated testing • Deviser ARGOSYNC app
• Supports optical fiber tools, such as power
meter, fault locator, & inspection probe
• EVS: in-service interference location
under a QAM carrier (e.g. LTE)
• Analog TV video gated measurement • TR 101 290 monitoring
• Upstream spectrum persistence analysis • Reverse path sweep
• Wi-Fi measurements • Analog CATV measurement suite
• Upstream signal generator (up to QAM256) • 32x8 cable modem with OFDM

Part I: DS2831 Basics
12
1-2 Accessories and Measurement Options
The following components and options are available with your DS2831 Digital TV Spectrum Analyzer.
Model No. Description Order No.
DS2831-002 DS2831 Digital TV Spectrum Analyzer 0110.2800.02
SFL10-KK TOKO F-F Connector 6190.0500.01
DS2831-003 CD (Toolbox Software and Operation Manual) 6190.0600.70
DS2831-004 Quick Start Guide 6190.0600.71
FSP060-DBAE1 AC/DC Adapter 6290.0700.01
DS2831-008 Soft Carrying Case 6110.0600.14
DS2831-010 Carabiner Red Deviser Logo 6110.0600.17
DS2831-011 Carabiner Blue Deviser Logo 6110.0600.18
DS2831-012 Plated Key Ring 6110.0600.19
DS2831-013 DS2831 Inspection Certificate 6110.0600.32
DS2831-700 Extended Spectrum (1220 ~2150 MHz) 2110.2800.27
DS2831-800 DPS (Digital Persistence Spectrum) 2110.2800.28
DS2831-801 C/N, CSO, CTB Gated Measurement 2110.2800.29
DS2831-802 Analog Video Parameters Measurement (DG/DP, CLDI, ICR, DOM) 2110.2800.30
DS2831-803 EVS (Error Vector Spectrum) 2110.2800.31
DS2831-804 TS Analysis 2110.2800.32
DS2831-805 WiFi Analysis 2110.2800.33
DS2831-806 Reverse Path Sweep 2110.2800.34
DS2831-212 DS2831 FSK Unit 2110.2800.06
DS2831-807 Upstream Signal Generator with FEC 2110.2800.35
CDA-20360 Built-in DOCSIS 3.0 8×4 Cable Modem 5110.0000.13
DS2831-809 DOCSIS 3.1 Cable Modem (32x8) 2110.2800.38
DS2831-811 Passive Sweep 2110.2800.01
OPM Optical Power Meter and VFL Module 2130.7000.29
DS2831-204 Visual Fault Locator 2110.2800.02
DS2831-210 Optical Power Measurement (OPM) 2110.2800.03
AFEI400 Deviser Auto Fiber Endface Inspector AFEI400 6250.0900.11
DS2831-211 GPS 2110.2800.04
DS2831-005 DS2831 operation manual hard copy 6190.0600.75
AE4000-733 Power Cord Plug Type (EU) 6290.0500.03
AE4000-734 Power Cord Plug Type (US) 6290.0500.04
AE4000-735 Power Cord Plug Type (UK) 6290.0500.05
AE4000-736 Power Cord Plug Type (Australia) 6290.0500.06
Part I: DS2831 Basics
13
1-3 Technical Support & Service
Deviser Instruments Inc. offers a 3-year standard warranty, and ongoing support and training services.
Customers are eligible to receive initial on-site training from our technical support engineers in a “train the
trainer” format. Our application engineers can also answer questions and provide ongoing technical
support regarding software or equipment.
For special applications, Deviser instruments offers custom software design at an extremely competitive rate
and time-to-market.
Ongoing development and “maintenance engineering” is provided on all products; yearly maintenance
programs are offered to ensure that customers fully benefit from the latest upgrades available. Technical
documents and application guides are released on an ongoing basis.
1-4 Annual Service Verification
Accurate test measurements are critical to your business. Deviser Instruments recommends an annual
calibration and performance verification as a means to keep your instrument in optimal working condition.
Please contact Deviser Instruments for an RMA number and the location of the nearest Authorized Deviser
Instruments service center. Our authorized service centers are skilled and certified in the calibration, service,
repair, and performance verification of our products.
1-5 Electrostatic Discharge Caution
The DS2831 Digital TV Spectrum Analyzer, like other high-performance instruments, is susceptible to
electrostatic discharge (ESD) damage. Coaxial cables and antennas often build up a static charge, which
may damage the DS2831 input circuitry. DS2831 operators must be aware of the potential for ESD damage
and take all necessary precautions.
It is recommended to discharge the static by connecting a short or load device to the cable or antenna
before connecting them to the DS2831. It is important to remember that the operator may also carry a
static charge that can cause damage. Following the practices outlined in the above standards will ensure
a safe environment for both personnel and equipment.
• When connecting a coaxial cable to the instrument for the first time that day, the center conductor
of the cable and the outer braided shielding layer should be quickly grounded.
• During service, ensure that the technician is grounded before removing inner components or pulling
out connecting cables.
• Ensure that the instrument is well grounded, so as not to store any static charges.
• Electrostatic protection of this instrument is up to standards of 6KV contact and 8KV air-gap.
Part I: DS2831 Basics
14
1-6 Battery Care
The DS2831 can be supplied with power in two different ways: with a battery or with the power adapter
provided.
1-6.1 Battery
The DS2831 uses a 7.4V/10Ah lithium battery for autonomous operation. Battery life during continuous use
(on a full charge) is estimated at more than 8 hours. When the voltage falls below 7.15V, the instrument will
display an alert indicating low charge. At 6.8V or less, it will display a second alert and the battery icon will
flicker. At 6.5V or less, following a third alert, the instrument will emit a long audible beep and shut down
automatically. Further use requires that the unit be connected to an external AC or DC power source,
which will also charge the battery. If the unit stays off, it will take about 4 hours to fully recharge. Charging
time will be longer if the unit is in use.
NOTE: Use only Deviser Instruments-approved batteries, adapters, and chargers provided with this
instrument.
WARNING: Low temperatures may cause a temporary reduction of the battery capacity. This will not
damage the battery. High temperatures, however, may cause permanent damage to the battery. See
stated specifications for environmental tolerances. Recommended charging temperature is 10~35°C.
NOTE: It is advisable to replace the battery when operational time falls below 50% of original capacity.
1-6.2 Charging the Unit
There are two ways to charge the DS2831 battery: with the traditional AC/DC adapter plug, or with the
DS2831 dual-slot charging deck.
With the DC Port
Using the plug, you can recharge the battery while continuing to operate the device.
1. Connect the adapter cord to the power supply; then insert the DC connector into the VDC power inlet at the top left of the instrument (while facing the screen). You can continue to operate the meter while
plugged in.
2. When the charging indicator displays a gradually-filling battery icon in the status bar on the screen, the instrument is charging. The LED next to the power button indicates status: green means fully charged,
red means charging in progress, and red and green flickering indicates no battery or abnormal battery.
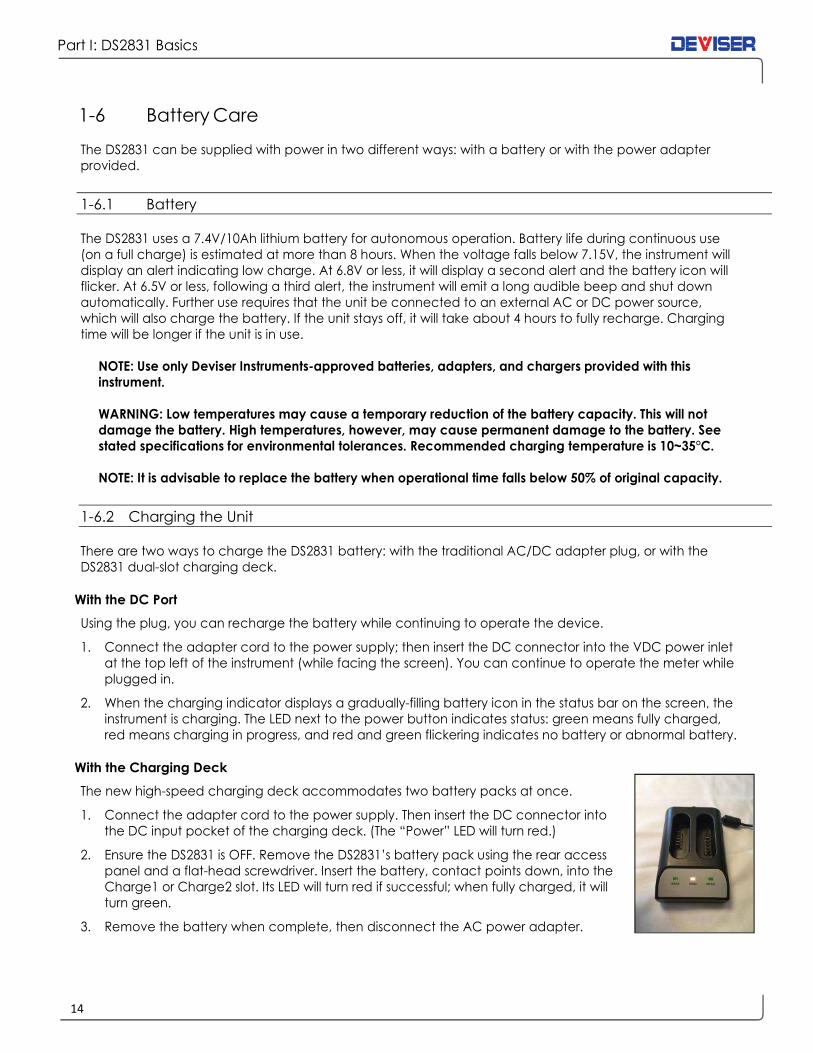
With the Charging Deck
The new high-speed charging deck accommodates two battery packs at once.
1. Connect the adapter cord to the power supply. Then insert the DC connector into the DC input pocket of the charging deck. (The “Power” LED will turn red.)
2. Ensure the DS2831 is OFF. Remove the DS2831’s battery pack using the rear access panel and a flat-head screwdriver. Insert the battery, contact points down, into the
Charge1 or Charge2 slot. Its LED will turn red if successful; when fully charged, it will
turn green.
3. Remove the battery when complete, then disconnect the AC power adapter.

Part I: DS2831 Basics
15
High-speed charging deck, with dual battery slots
With either method, once the instrument reaches full charge, it is recommended to charge for 1 additional
hour to help extend the operation time. After charging, unplug the DC connector, and then pull out the AC
adapter from the outlet.
To avoid overheating, do not leave the AC adapter and power supply connected while storing.
NOTE: Charge the instrument fully before using it for the first time.
Adapter Specifications
Model No. FSP060-DBAE1
AC input ~100-240V, 1.5A, 50-60Hz
DC output 12.0V 5A MAX

Part I: DS2831 Basics
16
Glossary of Acronyms
AAC Advanced Audio Coding
AC-3 Dolby AC-3 audio coding
ACPR Adjacent Channel Power Ratio
AEC Audio Engineering Society
AES Advanced Encryption Standard
ATDMA Advanced Time Division Multiple Access
ATSC Advanced Television Systems Committee
AVG Average
BAT Bouquet Association Table
BER Bit Error Rate
BPCP Bidirectional Coded Picture
CAT Conditional Access Table
CCIR International Radio Consultative Committee
CCN Carrier-to-Composite Noise Ratio
CRC Cyclic Redundancy Check
CSO Composite Second Order Beat
CTB Composite Triple Beat
CM Cable Modem
CLDI Chrominance-Luminance Delay Inequality
CLGI Chrominance-Luminance Gain Inequality
CMTS Cable Modem Terminal System
CPE Customer Premise Equipment
CVBS Composite Video Broadcast Signal
Color Video Blanking and Sync
Composite Video, Blanking, Synchronization
Composite Video Bar Signal
CW Continuous Wave
DAVIC Digital Audio Video Council
DCT Discrete Cosine Transform
DFT Discrete Fourier Transform
DG Differential Gain
DHCP Dynamic Host Configuration Protocol
DIT Discontinuity Information Table
DOM Depth of Modulation
DNS Domain Name System
DOCSIS Data-Over-Cable Service Interface
Specifications
DP Differential Phase
DTS Decoding Time Stamp
DVB Digital Video Broadcasting
DVB-C Digital Video Broadcasting-Cable
EAP Extensible Authentication Protocol
EBU European Broadcasting Union
ECM Entitlement Control Meassage
EIA Electronic Industries Association
EIT Event Information Table
EMM Entitlement Management Message
eMTA Embedded multimedia terminal adapter
EPG Electronic Program Guide
ES Elementary Stream
ETSI European Telecommunications Standards
Institute
ETT Extended Text Table
EVM Error Vector Magnitude
EVS Error Vector Spectrum
ES Errored second
FCC Federal Communications Commission
FDD Frequency division duplex
FEC Forward Error Correction
FFT Fast Fourier Transform
FIP Fiber Inspection Probe
FM Frequency Modulation
FSK Frequency-Shift Keying
FTP File Transfer Protocol
GCR Ghost Cancellation Reference
GOP Group of Pictures
GPS Global Positioning System
HD High Definition (video)
HFC Hybrid Fiber-Coaxial
ICP Intra Coded Picture
ICR In Channel Frequency Response
IEC International Electrotechnical Commission
IEEE Institute of Electrical & Electronics Engineers
IMD Intermodulation Distortion
IP Internet Protocol
IRD Integrated Receiver Decoder
ISO International Organization for Standardization
ITU International Telecommunications Union
JCTEA Japan Cable Television Engineering
Association
LAN Local Area Network
LSB Least Significant Bit
LTE Long term evolution
MAC Media Access Control layer
MER Modulation Error Ratio
MGT Master Guide Table
MPE MultiProtocol Encapsulation
MPEG Moving Pictures Expert Group
MSB Most Significant Bit
MSD Minimum Signal Duration
NCTA National Cable Television Association
NEG Negative peak
NIT Network Information Table
NTSC National Television Standards Committee

Part I: DS2831 Basics
17
NVOD Near Video On Demand
OFDM Orthogonal frequency division multiplexing
OFDMA Orthogonal frequency division multiple
access
OPM Optical Power Meter
PAL Phase Alternate Line
PAT Program Association Table
PCP Predictive Coded Picture
PCR Program Clock Reference
PDCCH Physical downlink control channel
PES Packetized Elementary Stream
PID Packet Identifier
PMT Program Map Table
POS Positive Peak
POI Probability Of Intercept
PING Packet Internet Groper
PPPoE Point to Point Protocol over Ethernet
PSI Program Specific Information
PSIP Program and System Information Protocol
PSK Phase Shift Key
PTS Presentation Time Stamp
QAM Quadrature Amplitude Modulation
QPSK Quadrature phase shift keying
RMS Root Mean Square
RBW Resolution Band Width
RRT Ratings Text Table
RSSI Received signal strength indicator
RST Running Status Table
RF Radio Frequency
SAM Sample detector
SES Severely errored second
SCDMA Synchronous Code Division Multiple Access
SC-FDMA Single carrier frequency division multiple
access
SCTE Society of Cable Telecommunication
Engineers
SD Standard Definition (video)
SDT Service Description Table
SES Severely errored second
SECAM Sequential Color and Memory
Sequential Couleur avec Memoire
SI Service Information
SIT Selection Information Table
SMPTE Society of Motion Picture and Television
Engineers
SNR Signal-to-Noise Ratio
SSID Service Set Identifier
ST Stuffing Table
STB Set Top Box
STC System Time Clock
STD System Target Decoder
STT System Time Table
TDMA Time Division Multiple Access
TDD Time division duplex
TDT Time and Date Table
TFTP Trivial File Transfer Protocol
TKIP Temporal Key Integrity Protocol
TOD Time Of Day
TOT Time Offset Table
TS Transport Stream
TSDT Transport Stream Description Table
TVCT Terrestrial Virtual Channel Table
UCD Upstream Channel Descriptor
UE User equipment
UTC Coordinated Universal Time
VBW Video Band Width
VCT Virtual Channel Table
VFL Visual Fault Locator
V/A Video to Audio carrier level ratio
VITS Vertical Interval Test Signal
VoIP Voice over Internet Protocol
VSB Vestigial Sideband Modulation
WiFi Wireless Fidelity
WEP Wired Equivalent Privacy
WPA-PSK Wi-Fi Protected Access -Pre-shared key
Part I: DS2831 Basics
18
Chapter 2: Instrument Overview
This chapter describes how to get started with the DS2831 Digital TV Spectrum Analyzer. Topics covered in this
section include:
• Overview of instrument panels, display, and operation
• Changing measurement modes and applications
2-1 Unpacking the DS2831 Instrument
When unpacking your DS2831 instrument for the first time, it is recommended that you follow these steps.
1. Open the package carefully. Check the box and packing material; keep them for potential future servicing of your product. If the packing material is damaged, the product may have sustained
damage during shipping; please proceed with caution during the following steps. Keep detailed
records and pictures of any physical damage to the box or the equipment inside. Remove the
instrument, and search for any physical damage that could have occurred during shipping. Follow
the stated instructions upon initial power-up. If repairs are required, contact your nearest Deviser
Instruments Inc. representative.
2. Check that all accessories and materials are accounted for. If accessories or other components are missing, contact your nearest Deviser Instruments Inc. representative.
3. Connect the power supply to the instrument. Charge fully before using.
For a comprehensive list of compatible accessories, see Section 1-2.
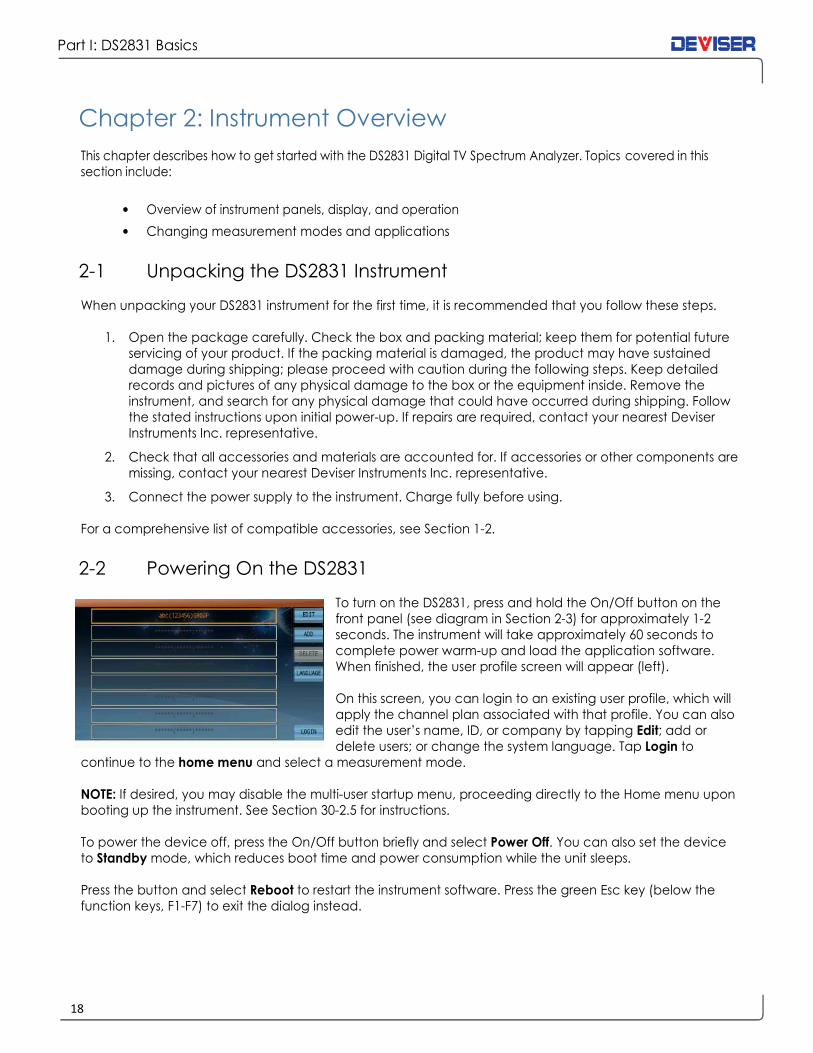
2-2 Powering On the DS2831
To turn on the DS2831, press and hold the On/Off button on the
front panel (see diagram in Section 2-3) for approximately 1-2
seconds. The instrument will take approximately 60 seconds to
complete power warm-up and load the application software.
When finished, the user profile screen will appear (left).
On this screen, you can login to an existing user profile, which will
apply the channel plan associated with that profile. You can also
edit the user’s name, ID, or company by tapping Edit; add or
delete users; or change the system language. Tap Login to
continue to the home menu and select a measurement mode.
NOTE: If desired, you may disable the multi-user startup menu, proceeding directly to the Home menu upon
booting up the instrument. See Section 30-2.5 for instructions.
To power the device off, press the On/Off button briefly and select Power Off. You can also set the device
to Standby mode, which reduces boot time and power consumption while the unit sleeps.
Press the button and select Reboot to restart the instrument software. Press the green Esc key (below the
function keys, F1-F7) to exit the dialog instead.

19
Part I: DS2831 Basics
2-3 Front Panel Overview
The DS2831 Digital TV Spectrum Analyzer’s front panel contains the software boot switch and a number of
LED status indicator lights. It also bears the unit’s model number. You can use the LCD touchscreen to
navigate most basic functions; just use your finger or the provided stylus to tap the desired icon or setting.
1. LED Charge Indicator This light shows the battery charge status. When red, the battery is charging; when green, it is fully charged.
2. Power ON/OFF Press to turn the DS2831’s application software ON and OFF. Press while ON to shut down, reboot, or place
the unit in standby mode.
3. Brightness Control With the unit powered on, press the green button to the left of the power button to launch the DS2831
screen brightness control. Use the arrow keys (8) or rotary knob (9) to adjust the setting from 0-100%, then
press this button again to confirm.
4. Function Keys Keys F1-F7 are used to select corresponding settings or features displayed on the screen. Press one of these
keys to select the menu item displayed closest to it. For example, when selecting “Downstream” or
“Upstream”, the listed settings will appear next to the F1 and F2 keys, respectively. Press F1 to select
Downstream and F2 to select Upstream.
5. Measurement Modes
The four keys located next to the rotary knob will activate different measurement modes. Press SPECT for the
spectrum analysis mode; SLM for channel measurement; CM for cable modem; and AUX for simultaneous
QAM and spectrum analysis (provided that the DS2831 is tuned to a digital carrier frequency and is in FFT
acquisition setting).
6. Navigation Keys
The six keys located along the bottom of the screen activate different DS2831 management menus. Press
CH for the Channel Editor menu; FILE to manage or view saved files; SAVE to save a screenshot or data file;
AUTO to access the auto test menu; SETUP to change system settings; and HOME to return to the
measurement application menu.

Part I: DS2831 Basics
20
7. Dual Alphanumeric Keypad
The keypad can be used to input numerical entries or type words (e.g., for naming files). Press the green
Back key to erase the last entry, if you entered an unintended value.
8. Arrow Keys
The arrow keys above and below the rotary knob are used to adjust settings or move markers. Press the top
arrow to increase the selected value and the bottom arrow to decrease it.
9. Rotary Knob
This spinning knob can be used to change the parameter to control, or to move marker lines. Place a finger
in the round depression (or along the protruding lip on the right side) and turn the knob clockwise to move
right, or counter-clockwise to move left. Push the knob in, like a button, to confirm the entry.
10. Esc Button
Press the Esc button to cancel an entry or return to the previous application or menu.
11. Touchscreen
The DS2831 features a capacitive LCD touchscreen as an alternate means of operating the unit. Tap the
screen to select icons, explore menus, and more.
2-4 Top Panel Overview
The test instrument’s top panel contains connectors and ports used to transfer data, charge the instrument,
display data on a PC, and other functions. See the diagram and descriptions below.
Adapter Used to supply the DS2831 with electricity and charge the battery. Connect to a wall outlet using the power
supply included.
USB Type-A port The DS2831 has a Type-A USB 2.0 port that accepts USB storage devices for transferring measurements,
setup files, screen images, GPS dongle option, and other data.
LAN port The LAN port is used to connect the device to a PC. The Deviser ARGOSYNC platform provides an easy
method to manage, archive, analyze, and print measurement data.
VFL port Generates a red beam that highlights faults, stresses, and bends in an optical fiber connected to the port.
For safety, do not look directly into the VFL port when the light is on.
21
Part I: DS2831 Basics
OPM port Measures magnitude of optical signal transmitted through a fiber connected to this port. Has FC/SC/ST
replaceable adapter.
FSK Communication (COM) port / USG Output Used to facilitate FSK (Frequency Shift Keying) communications in some applications. For details, see
Chapter 13: Reverse Path Sweep and Chapter 14: Upstream Signal Generator.
RF Input 75 Ω, N-Type female connector. Maximum input is +21 dBm at 100 VDC.
2-5 Control Overview
The DS2831 employs a 7”, 800x480 capacitive color touchscreen that is configured for ease of use. You can
quickly and easily change measurement functions by tapping the screen with a finger or the included stylus
pen; or by pressing the function softkeys (F1–F7) located off the right side of the screen. Each measurement
application has its own menu structure. In Part II, Settings and Measurements, we discuss each application’s
display and controls in detail.
In any given application, submenus will appear along the righthand side of the screen (marked with a “>”).
You can expand a submenu to view the individual settings and tools within by tapping it, or by pressing the
function key (F1-F7) next to it. These tools can be edited with the function keys.
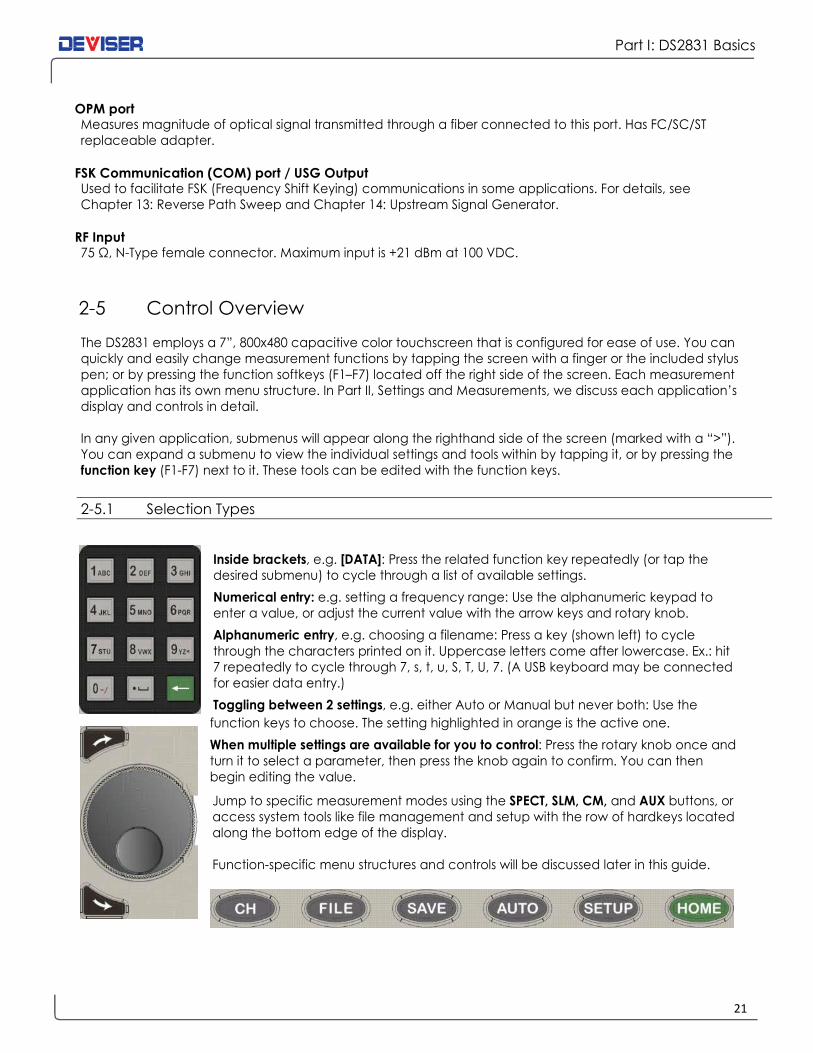
2-5.1 Selection Types
Inside brackets, e.g. [DATA]: Press the related function key repeatedly (or tap the
desired submenu) to cycle through a list of available settings.
Numerical entry: e.g. setting a frequency range: Use the alphanumeric keypad to
enter a value, or adjust the current value with the arrow keys and rotary knob.
Alphanumeric entry, e.g. choosing a filename: Press a key (shown left) to cycle
through the characters printed on it. Uppercase letters come after lowercase. Ex.: hit
7 repeatedly to cycle through 7, s, t, u, S, T, U, 7. (A USB keyboard may be connected
for easier data entry.)
Toggling between 2 settings, e.g. either Auto or Manual but never both: Use the
function keys to choose. The setting highlighted in orange is the active one.
When multiple settings are available for you to control: Press the rotary knob once and
turn it to select a parameter, then press the knob again to confirm. You can then
begin editing the value.
Jump to specific measurement modes using the SPECT, SLM, CM, and AUX buttons, or
access system tools like file management and setup with the row of hardkeys located
along the bottom edge of the display.
Function-specific menu structures and controls will be discussed later in this guide.
Part I: DS2831 Basics
22
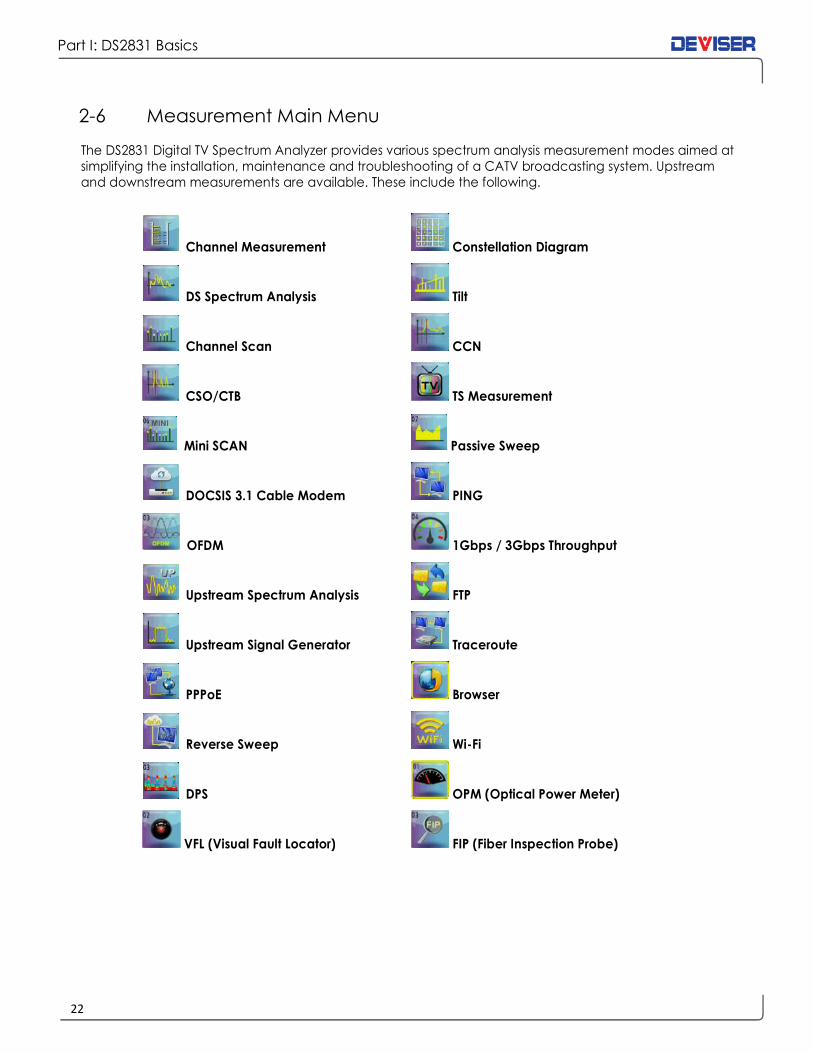
2-6 Measurement Main Menu
The DS2831 Digital TV Spectrum Analyzer provides various spectrum analysis measurement modes aimed at
simplifying the installation, maintenance and troubleshooting of a CATV broadcasting system. Upstream
and downstream measurements are available. These include the following.
Channel Measurement Constellation Diagram
DS Spectrum Analysis Tilt
Channel Scan CCN
CSO/CTB TS Measurement
Mini SCAN Passive Sweep
DOCSIS 3.1 Cable Modem PING
OFDM 1Gbps / 3Gbps Throughput
Upstream Spectrum Analysis FTP
Upstream Signal Generator Traceroute
PPPoE Browser
Reverse Sweep Wi-Fi
DPS OPM (Optical Power Meter)
VFL (Visual Fault Locator) FIP (Fiber Inspection Probe)
23
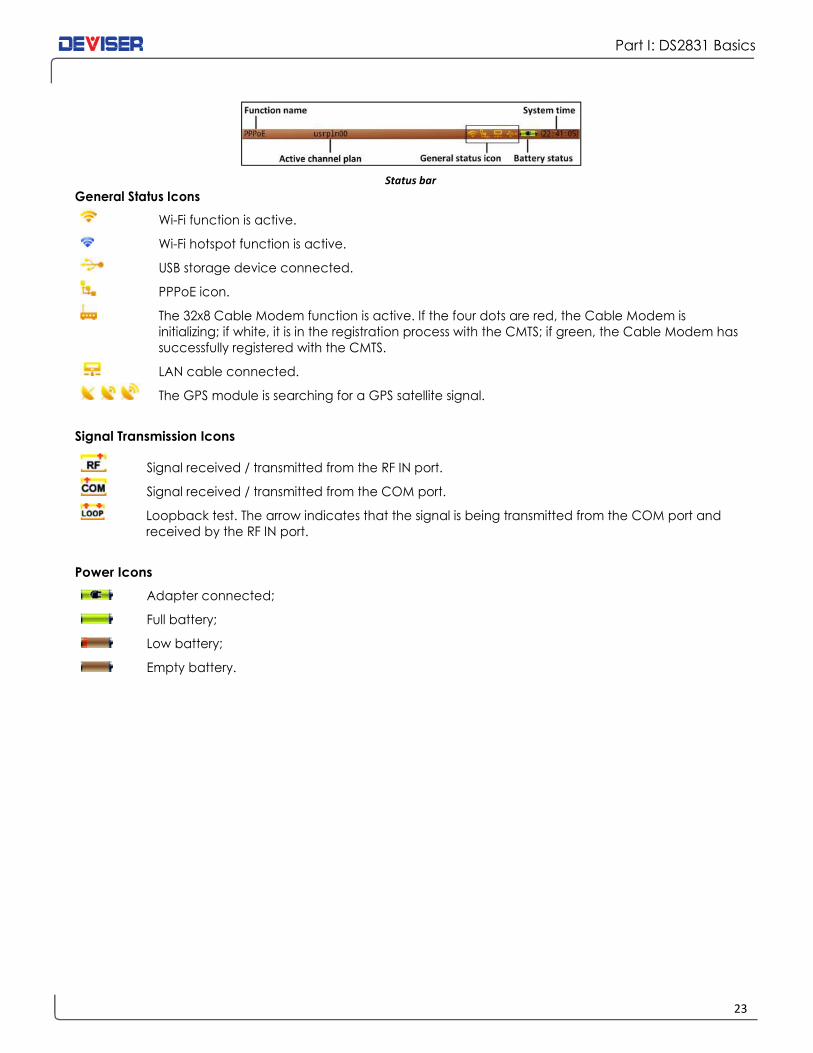
Part I: DS2831 Basics
Status bar
General Status Icons
Wi-Fi function is active.
Wi-Fi hotspot function is active.
USB storage device connected.
PPPoE icon.
The 32x8 Cable Modem function is active. If the four dots are red, the Cable Modem is
initializing; if white, it is in the registration process with the CMTS; if green, the Cable Modem has
successfully registered with the CMTS.
LAN cable connected.
The GPS module is searching for a GPS satellite signal.
Signal Transmission Icons
Signal received / transmitted from the RF IN port.
Signal received / transmitted from the COM port.
Loopback test. The arrow indicates that the signal is being transmitted from the COM port and
received by the RF IN port.
Power Icons
Adapter connected; Full battery; Low battery; Empty battery.
Part I: DS2831 Basics
24
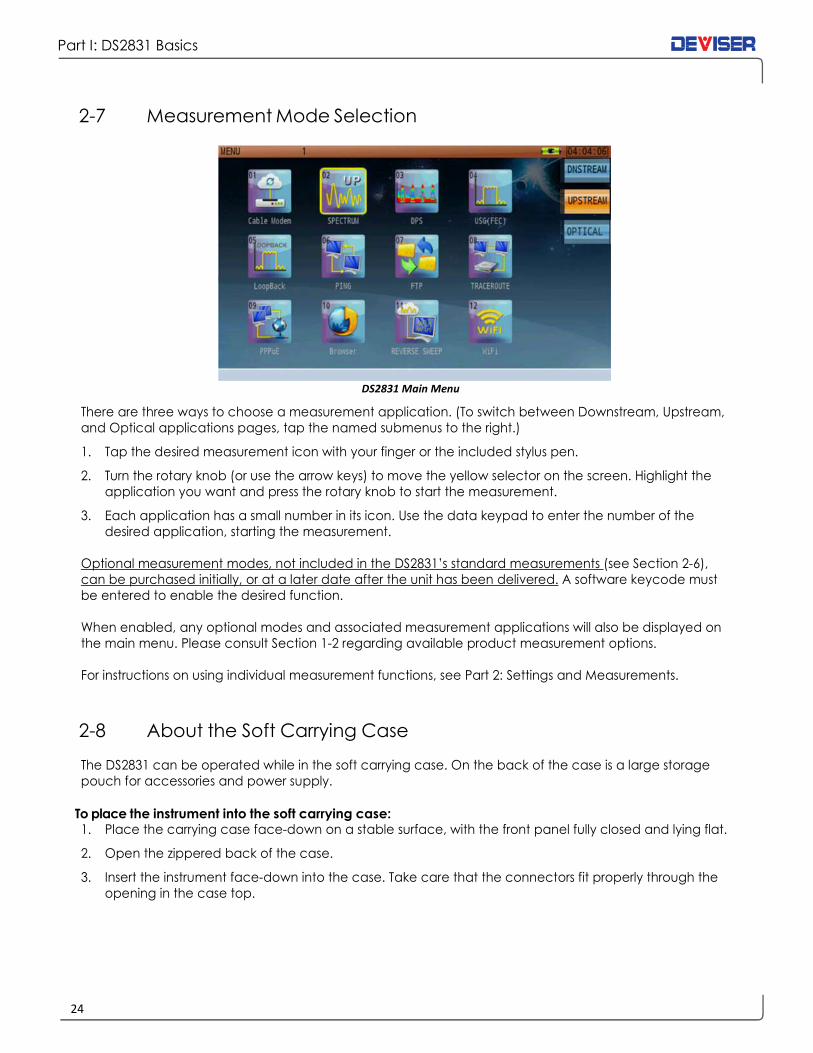
2-7 Measurement Mode Selection
DS2831 Main Menu
There are three ways to choose a measurement application. (To switch between Downstream, Upstream,
and Optical applications pages, tap the named submenus to the right.)
1. Tap the desired measurement icon with your finger or the included stylus pen.
2. Turn the rotary knob (or use the arrow keys) to move the yellow selector on the screen. Highlight the application you want and press the rotary knob to start the measurement.
3. Each application has a small number in its icon. Use the data keypad to enter the number of the desired application, starting the measurement.
Optional measurement modes, not included in the DS2831’s standard measurements (see Section 2-6),
can be purchased initially, or at a later date after the unit has been delivered. A software keycode must
be entered to enable the desired function.
When enabled, any optional modes and associated measurement applications will also be displayed on
the main menu. Please consult Section 1-2 regarding available product measurement options.
For instructions on using individual measurement functions, see Part 2: Settings and Measurements.
2-8 About the Soft Carrying Case
The DS2831 can be operated while in the soft carrying case. On the back of the case is a large storage
pouch for accessories and power supply.
To place the instrument into the soft carrying case: 1. Place the carrying case face-down on a stable surface, with the front panel fully closed and lying flat.
2. Open the zippered back of the case.
3. Insert the instrument face-down into the case. Take care that the connectors fit properly through the opening in the case top.

25
Part I: DS2831 Basics
Chapter 3: Quick Start Guide (Making a Measurement)
This chapter will provide the basics of setting up and performing select measurements with the DS2831.
Press the Power button (shown below) and use the arrow keys and F7 to log in to an existing user profile (or
press F2 to create one). This places you at the Home menu, where you can select from all measurement
applications currently enabled on the instrument.

Part I: DS2831 Basics
26
Using the Rotary Knob & Arrow Keys
When operating any menu on the DS2831, such as the Home measurement menu (shown above), you can
use the rotary knob to make selections. In addition, each icon has a number; simply enter that number on
the keypad to launch its measurement. (Alternatively, simply tap that icon on the touchscreen.)
Turn the knob to move the cursor until it is highlighting your selection. Then
press the knob in to confirm your choice.
Press the arrow keys above and below the knob to change pages or scroll up
and down lists.

27
Part I: DS2831 Basics
Spectrum Analysis Menu Maps: Downstream, Upstream, & DPS

Part I: DS2831 Basics
28
Set Up Your Channel Plan First
Before launching a measurement with the DS2831, it is recommended to set up the channel plan you wish
to use for testing. You can do this from the Channel Plan Editor (press CH below the screen).
For detailed instructions on channel plan creation and setup, see Chapter 4: Channel Plans.
Use the plan creator (below, left) to establish and name a standard plan based on your region. Most North
American users will base their plan on the NCTA standard. Check the boxes to establish whether your plan
will include analog channels, digital channels, or both. When finished, press Start (F3) to auto-generate the
channel plan based on a scan of local channel availability. You can then edit the individual channels in
your plan to suit your test needs. Channel auto-detection takes ~2 minutes on a fully loaded spectrum.
The DS2831 can recognize analog, digital, and OFDM carriers. However, it cannot distinguish between a
digital DVB-C or DOCSIS carrier, so be sure to properly identify your DOCSIS SC-QAM carriers (once only) as
the DOCSIS signal type (with other parameters, such as Symbol Rate & Standard). (See below, bottom-left.)

29
Part I: DS2831 Basics
Spectrum Analysis
In Spectrum Analysis mode, press the rotary knob to bring up
the highlight selector. Then turn the knob to highlight the
setting you wish to modify. (Alternatively, just tap the setting
on the touchscreen.)
Then use the rotary knob or arrow keys to quickly set the
desired value.
Press the function buttons (labeled F1 ~ F7) to navigate the
measurement settings submenus, as shown.
Optical Power Meter
Connect the fiber for testing. Press Length (F1), then use the
function keys (F1-F7) to select a measurement wavelength.
You can also set the reference level with the rotary knob or
arrow keys.
Fiber Inspection
Connect the fiber, adjust the view settings/focus,
then press Diagnosis (F1) for Pass/Fail testing.
Visual Fault Location
Connect the fiber, then press ON to illuminate.
Press 1 or 2 Hz to flash.

Part I: DS2831 Basics
30
Reverse Path Sweep
The DS2831 features two ways to sweep your reverse path. The first, “Active Reverse Sweep”, synchronizes
together with the Kingstone monitoring platform.
1. On the DS2831, set up measurement parameters for reverse path sweep. 2. Log in to the DS1610 “KingStone” to activate reverse path sweep. 3. View measurement traces simultaneously at the DS1610 (as it is viewed locally at the HE) and the
DS2831 (as viewed in the field). Compare traces for level and Frequency Response delta.
4. Transmit the US sweep signal, store a reference, move to another location, and compare the stored reference with the live reference.
5. View sweep reference traces simultaneously with Spectrum Analyzer traces on the same screen.

31
Part I: DS2831 Basics
The second way to conduct reverse path sweep is with the PNM method, which relies on the US SC-QAM
adaptive EQ power coefficients. This function provides much higher sweep resolution, with up to 24 sweep
reference points in each of your 6.4MHz US channels (up to 8 US channels, and enables hi-res sweep traces
up to 51.2MHz wide.
In the case below, the DS2831 would perform at 8 resolution points fewer than the 192 sweep resolution
points in the Passive Sweep app offered with the DS2831.
In addition to the Sweep reference function, this mode provides individual in-channel frequency response
information, as well as Group Delay and Equalizer coefficients for each of the individual US channels.

Part I: DS2831 Basics
32
32x8 Cable Modem Measurement
Procedure: 1. After properly identifying DOCSIS
channels in your channel plan, set
parameters for your testing needs.
Be sure to set up your DOCSIS
channels correctly before initiating
the cable modem.
2. In the Cable Modem application, open the DOCSIS channel list and
select your desired channel. This
speeds up testing.
3. Press “OK” to confirm. Note status. If connection does not succeed,
re-check measurement
parameters.
4. Note: the CM can receive signals of -10 ~ +20dBmV. Signals outside
this range will prevent CMTS
connection. Adjust the attenuation
level to fit this range.

33
Part I: DS2831 Basics
Advanced Upstream Signal Generator (FEC)
1. Fixed frequency mode.
2. Sweep frequency mode.

Part II: Settings and Measurements
34
Part II Settings and
Measurements
35
Part II: Settings and Measurements
Chapter 4: Channel Plans
Controlling and managing channel plans is a crucial component of HFC network maintenance, among
other tasks common to cable & broadband technicians. Press the CH button located below the DS2831
display to open the channel plan manager utility.
The channel plan manager is separated into two panes. Turn the rotary knob to switch between them, and
press the arrow keys to move up and down.
• The left pane lists a total of 16 user plans (up to 100 plans may be stored on one DS2831) that can
be individually edited. By default, they are named “usrpln00” through “usrpln15”, but can be
renamed as the operator desires. An asterisk (*) marks the channel plan currently in use.
o It is possible to overwrite the active plan. Exercise caution when editing.
• The right pane lists details on the selected channel plan, including type and frequency info.
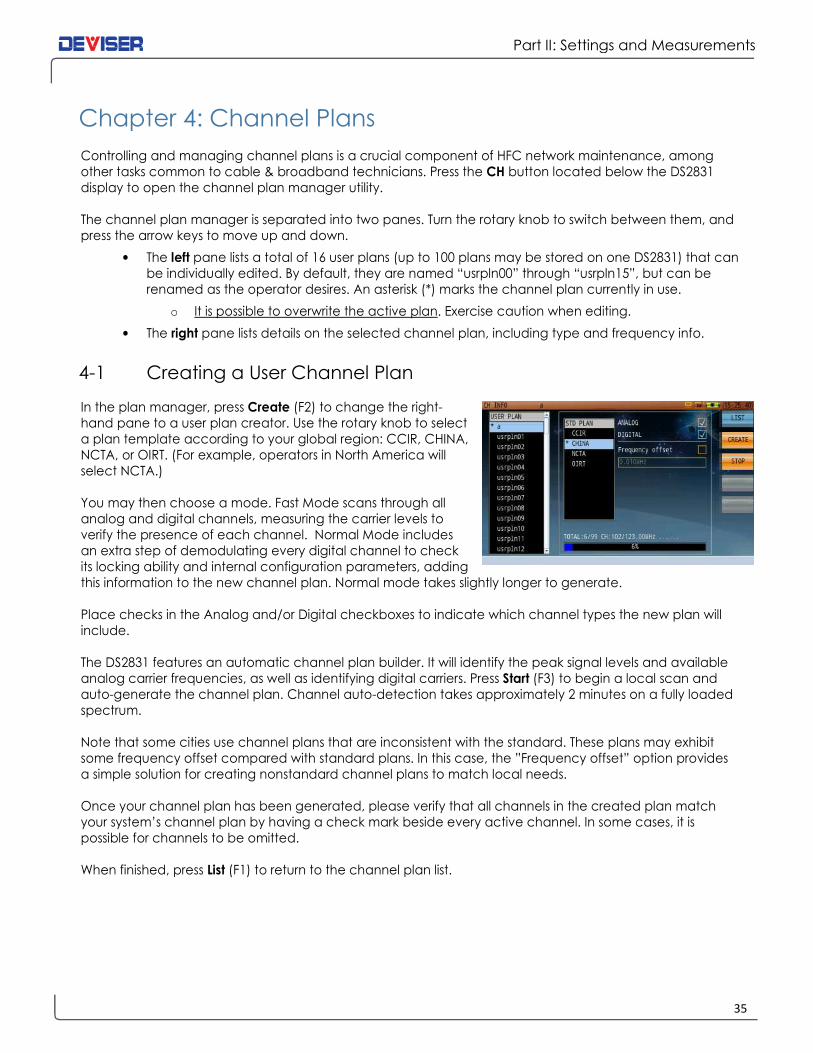
4-1 Creating a User Channel Plan
In the plan manager, press Create (F2) to change the right-
hand pane to a user plan creator. Use the rotary knob to select
a plan template according to your global region: CCIR, CHINA,
NCTA, or OIRT. (For example, operators in North America will
select NCTA.)
You may then choose a mode. Fast Mode scans through all
analog and digital channels, measuring the carrier levels to
verify the presence of each channel. Normal Mode includes
an extra step of demodulating every digital channel to check
its locking ability and internal configuration parameters, adding
this information to the new channel plan. Normal mode takes slightly longer to generate.
Place checks in the Analog and/or Digital checkboxes to indicate which channel types the new plan will
include.
The DS2831 features an automatic channel plan builder. It will identify the peak signal levels and available
analog carrier frequencies, as well as identifying digital carriers. Press Start (F3) to begin a local scan and
auto-generate the channel plan. Channel auto-detection takes approximately 2 minutes on a fully loaded
spectrum.
Note that some cities use channel plans that are inconsistent with the standard. These plans may exhibit
some frequency offset compared with standard plans. In this case, the ”Frequency offset” option provides
a simple solution for creating nonstandard channel plans to match local needs.
Once your channel plan has been generated, please verify that all channels in the created plan match
your system’s channel plan by having a check mark beside every active channel. In some cases, it is
possible for channels to be omitted.
When finished, press List (F1) to return to the channel plan list.
Part II: Settings and Measurements
36
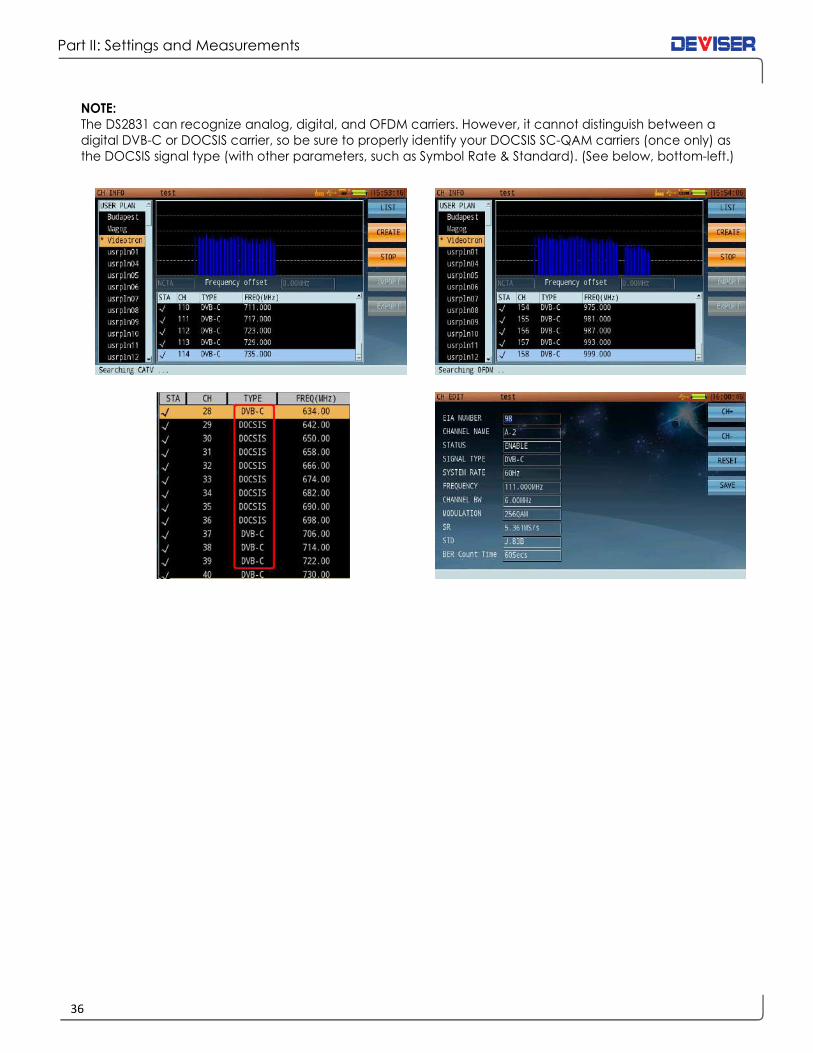
NOTE:
The DS2831 can recognize analog, digital, and OFDM carriers. However, it cannot distinguish between a
digital DVB-C or DOCSIS carrier, so be sure to properly identify your DOCSIS SC-QAM carriers (once only) as
the DOCSIS signal type (with other parameters, such as Symbol Rate & Standard). (See below, bottom-left.)

37
Part II: Settings and Measurements
4-2 Editing Channel Plans
There are several ways to modify an existing channel plan. To
change its name, highlight it in the left pane and press Edit (F3).
Enter a new plan name using the alphanumeric keypad, then
press OK to confirm.
To activate or deactivate all channels in a plan, highlight the
plan and press Ena All / Dis All (F6). Please ensure that all active
channels are checked, and that all inactive channel locations
are unchecked.
You can also modify the plan channel-by-channel. Highlight it in
the left pane and press the rotary knob to make it the active
plan. Turn the knob to highlight the right-hand pane. Use the
arrow keys to highlight the channel and press Edit (F3).
In this screen, you can edit a variety of individual channel
parameters. For a list of all available selections, see below.
Analog TV Channel Parameters Channel serial number
Channel name: Edit with keypad
Channel status: [Enable / Disable]
Signal type: [Analog FM / Analog TV / DOCSIS / DVB-C]
System rate: [50Hz / 60Hz]
Frequency: Edit with keypad
Video frequency: Edit with keypad
Audio frequency: Edit with keypad
TV standard: [NTSC-M / PAL-B / PAL-D / PAL-G / PAL-H / PAL-I / PAL-K / PAL-M / PAL-N] Noise BW: Edit with keypad
CNR mode: [Gate Off / Gate On]
CNR field: [Odd / Even]
CNR line: 525-line system: Field 1 (odd), line 1~263; Field 2 (even), line 2~262
625-lines system: Field 1 (odd), line 1~313; Field 2 (even), line 2~312
CTBCSO mode: [Gate Off / Gate On]
CTBCSO field: [Odd / Even]
CTBCSO line: 525-line system: Field 1 (odd), line 1~263; Field 2 (even), line 2~262
625-line system: Field 1 (odd), line 1~313; Field 2 (even), line 2~312
Supported Analog TV Standards
TV standard Lines per frame Field frequency Color encoding method
NTSC-M 525 60Hz NTSC
PAL-M 525 60Hz NTSC
PAL-B,D,G,H,I,K 625 50Hz PAL
PAL-N 625 50Hz PAL
NOTE: For Analog channels, you will need to instruct the DS2831 where to look for “Gated” quiet line,
GCR or Multiburst, CCR-7 VITS test signals, field and line location. If these changes are made during
testing, said changes will not be saved for the next test. It is recommended to make initial edits to
the channel plan prior to testing, in order to retain channel specifications.

Part II: Settings and Measurements
38
Digital Channel Parameters Channel serial number:
Channel name: Edit with keypad
Channel status: [Enable / Disable]
Signal type: [Analog FM / Analog TV / DOCSIS / DVB-C]
System rate: [50Hz / 60Hz]
Frequency: Edit with keypad
Measure BW: Edit with keypad
Modulation: [16QAM / 32QAM / 64QAM / 128QAM / 256QAM]
SR (System Rate): The symbol rate is auto-configured according to the modulation type and standard. It
will set automatically once the modulation type and standard are selected. Users can
input values manually, ranging between 4.00MS/s ~ 7.00MS/s.
STD (Standard): [J.83A / J.83B / J.83C / DOCSIS / EurDOCSIS]
BER Statistical Time: The BER measurement time in BER statistical and auto test BER statistical functions.
US and EU Default Symbol Rate for DVB-C and DOCSIS
Standard and Modulation Type Symbol Rate Bandwidth
ITU-T J.83 Annex A 64QAM 6.952MS/s 8MHz
ITU-T J.83 Annex A 256QAM 6.952MS/s 8MHz
ITU-T J.83 Annex B 64QAM 5.057MS/s 6MHz
ITU-T J.83 Annex B 256QAM 5.361MS/s 6MHz
ITU-T J.83 Annex C 64QAM 5.274MS/s 6MHz
ITU-T J.83 Annex C256QAM 5.274MS/s 6MHz
DOCSIS 64QAM 5.057MS/s 6MHz
DOCSIS 256QAM 5.361MS/s 6MHz
EuroDOCSIS 64QAM 6.952MS/s 8MHz
EuroDOCSIS 256QAM 6.952MS/s 8MHz
Turn the rotary knob to move the cursor to the parameter you want to modify. Press the and arrow
keys to choose your setting.
NOTE: Some parameters are auto-coupled together. Editing one of these will auto-edit related settings as
well, optimizing your configuration. If the auto-adjusted settings do not match your requirements, you
may proceed to adjust them manually.
Each signal type selection (i.e., Analog TV, DVB-C or
DOCSIS) will automatically populate default values
for the chosen standard. Use the CH+ and CH- keys
(F1 and F2) to quickly switch from one channel to the
next. When switching channels or exiting the edit
dialog, you will be prompted to save your changes.
Select OK to save, or Cancel to discard changes.
More channel plan templates are available in the
DS2831 Toolbox software. Deviser may be able to
write customer-specific channel plans upon request.
NOTE: For Digital channels, the plan editor knows Analog from Digital, but not DVB-C from DOCSIS. You must instruct your channel plan on the line 4 of the channel edit window.

39
Part II: Settings and Measurements
4-3 Importing and Exporting Channel Plans
To transfer user channel plan data to and from the DS2831, you will first need to insert a USB storage device
into the instrument’s top panel.
Once the application reads the USB device, the Export (F5) key appears. In addition, if the USB device
already contains some channel plan data, Import (F4) appears. This indicates that plans can be imported
to the DS2831, as well as exported for use in a PC or other instrument.
Procedure: 1. Press Export to open a dialog, as shown above. The plans saved to the DS2831’s local memory appear
on the right, with plans (if any) saved to the USB device on the left.
2. Using the arrow keys, highlight a plan in local memory and click the rotary knob to place a check mark next to it. Repeat until all plans for export are marked.
3. Then, turn the rotary knob to highlight the [<<<<<<] button between the two panes and click the knob
to confirm.
The selected plan(s) will be transferred to the USB device.
If a plan with the same name already exists on the destination USB device, a message will pop up asking if it
is to be replaced. Click OK to overwrite, or press Esc (below F7) to cancel.
The process for importing channel plans to the DS2831 is similar. Simply insert a USB storage device with
saved channel plan data, select Import instead of Export, and select your desired plans in the left-hand
pane. Then navigate to the [>>>>>>] button and confirm the copy operation.

Part II: Settings and Measurements
40
Chapter 5: Analog TV
In this chapter, we discuss the DS2831’s powerful suite of Analog TV signal measurement applications –
including the Channel Measurement, Analog FM, FM Demodulation, HUM Modulation, Channel Scan,
Passive Sweep, and Tilt functions.
5-1 Channel Measurement
In this mode, the DS2831 measures the basic parameters of a channel. Currently-supported channel types
are analog TV, analog FM, and DVB-C. Note that the channel measurement menu (along the right side of
the screen) displays different settings depending on the channel type being measured.
The Analog TV application (shown below) can be used to read audio and video levels and V/A. A color-
coded bar indicates the signal level of the video carrier (red and yellow indicate higher levels).
Use the rotary knob to highlight the channel number, video frequency, and audio frequency fields, then
enter your desired values with the data keypad. You can also use the arrow keys to adjust the current
values, such as moving to the next active channel in the channel list.
5-1.1 Settings
Channel: The channel to measure. Select any active analog or digital channel in the active
channel plan.
Video Freq: Input range 5-1200 MHz.
Audio Freq: Input range 5-1200 MHz.
Button Operation HUM: Switches to hum modulation function.
DOM: Switches to Depth of Modulation function.
CLDI: Switches to Chrominance-Luminance Time Delay Inequality function.
DG/DP: Switches to Differential Gain/ Differential Phase function.
ICR: Switches to In-Channel Frequency Response function.
41
Part II: Settings and Measurements
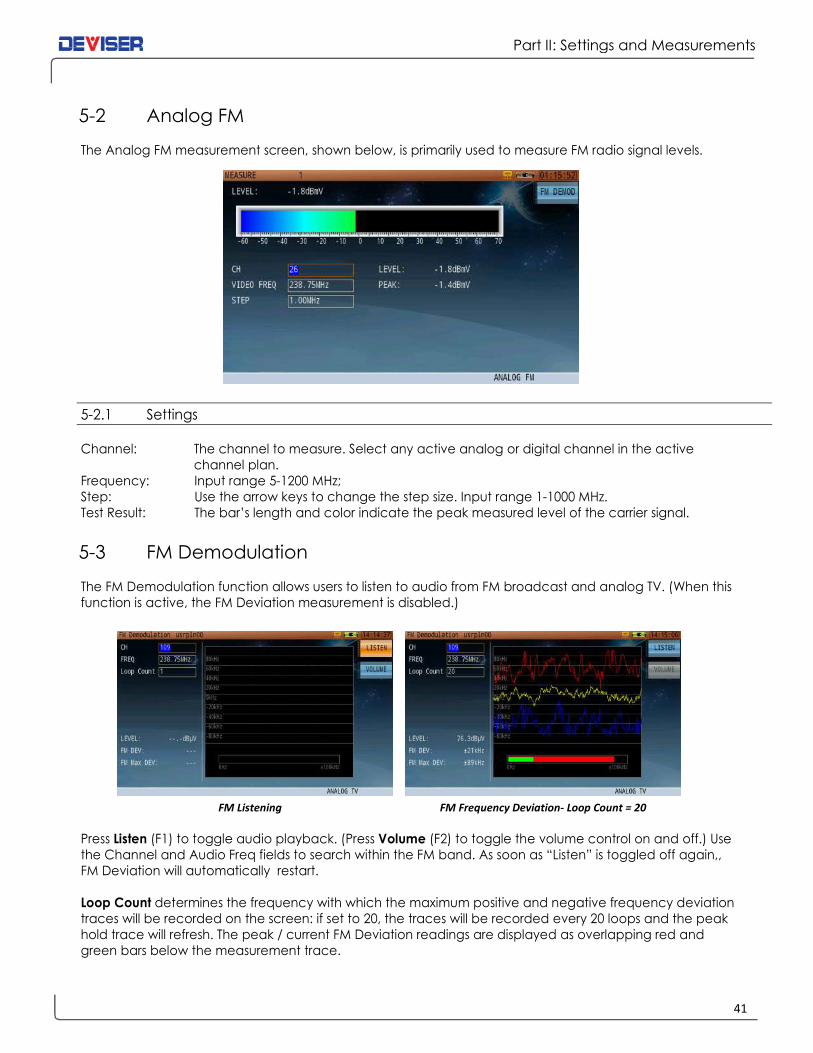
5-2 Analog FM
The Analog FM measurement screen, shown below, is primarily used to measure FM radio signal levels.
5-2.1 Settings
Channel: The channel to measure. Select any active analog or digital channel in the active
channel plan.
Frequency: Input range 5-1200 MHz;
Step: Use the arrow keys to change the step size. Input range 1-1000 MHz.
Test Result: The bar’s length and color indicate the peak measured level of the carrier signal.
5-3 FM Demodulation
The FM Demodulation function allows users to listen to audio from FM broadcast and analog TV. (When this
function is active, the FM Deviation measurement is disabled.)
FM Listening FM Frequency Deviation- Loop Count = 20
Press Listen (F1) to toggle audio playback. (Press Volume (F2) to toggle the volume control on and off.) Use
the Channel and Audio Freq fields to search within the FM band. As soon as “Listen” is toggled off again,,
FM Deviation will automatically restart.
Loop Count determines the frequency with which the maximum positive and negative frequency deviation
traces will be recorded on the screen: if set to 20, the traces will be recorded every 20 loops and the peak
hold trace will refresh. The peak / current FM Deviation readings are displayed as overlapping red and
green bars below the measurement trace.
Part II: Settings and Measurements
42
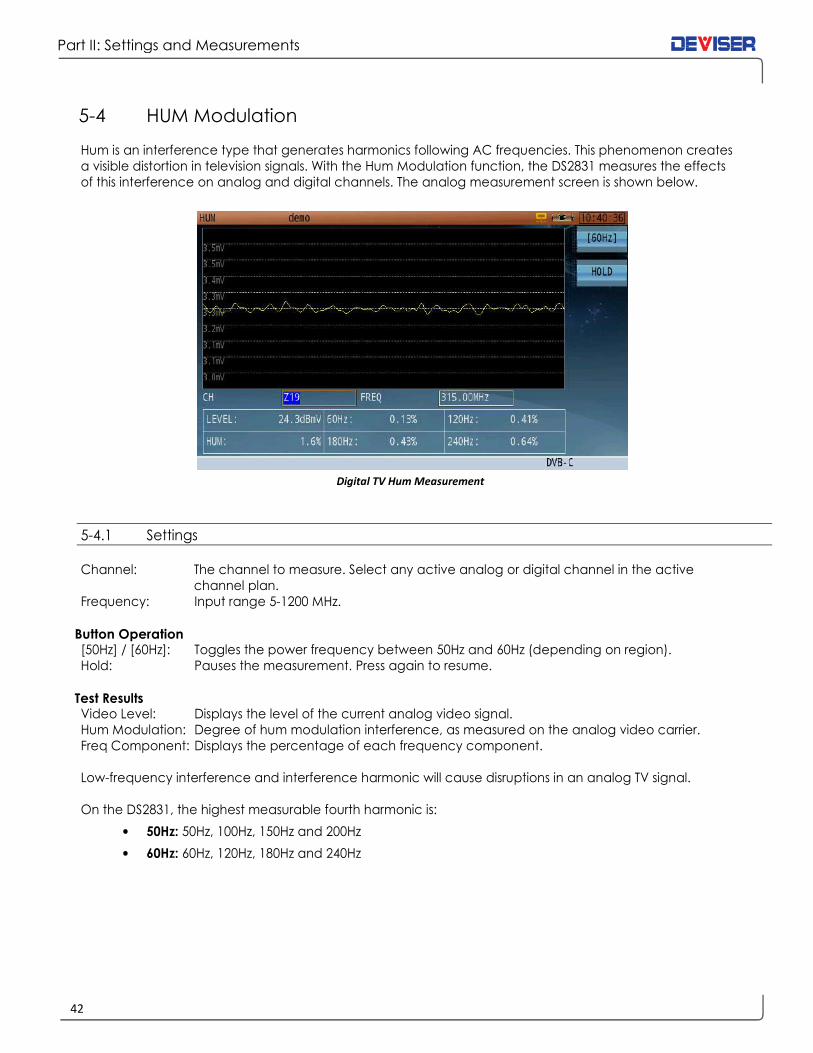
5-4 HUM Modulation
Hum is an interference type that generates harmonics following AC frequencies. This phenomenon creates
a visible distortion in television signals. With the Hum Modulation function, the DS2831 measures the effects
of this interference on analog and digital channels. The analog measurement screen is shown below.
Digital TV Hum Measurement
5-4.1 Settings
Channel: The channel to measure. Select any active analog or digital channel in the active
channel plan.
Frequency: Input range 5-1200 MHz.
Button Operation [50Hz] / [60Hz]: Toggles the power frequency between 50Hz and 60Hz (depending on region).
Hold: Pauses the measurement. Press again to resume.
Test Results Video Level: Displays the level of the current analog video signal.
Hum Modulation: Degree of hum modulation interference, as measured on the analog video carrier.
Freq Component: Displays the percentage of each frequency component.
Low-frequency interference and interference harmonic will cause disruptions in an analog TV signal.
On the DS2831, the highest measurable fourth harmonic is:
• 50Hz: 50Hz, 100Hz, 150Hz and 200Hz
• 60Hz: 60Hz, 120Hz, 180Hz and 240Hz

43
Part II: Settings and Measurements
5-5 Channel Scan
The DS2831 offers a channel scan function to quickly measure the flatness and amplitude of a CATV system
(shown below). By default, the instrument scans all active analog or digital channels in the active channel
plan. On analog channels, the Video Carrier level is displayed in green, and the Audio Carrier in yellow. On
digital channels, Channel Power is displayed in blue, and MER in red.
Using the touchscreen, move the vertical slider to select a channel to measure.
Channel Scan Identifies OFDM Signals Channel Scan Touchscreen Controls
5-5.1 Settings
Button Operation [HOLD] Pauses the measurement. Press again to resume.
[MER] Performs a quick MER scan of all digital channels present. Note that the unit must be
connected with a valid active channel plan that includes digital signals. MER readings
will appear as red bars.
Test Results Total Power: The total power level measured over a specified bandwidth.
Level/Power: Measurement results of a specified channel. The DS2831 measures the sync pulse of an
analog video carrier for analog channels, and channel power over the specified
bandwidth for digital channels.

Part II: Settings and Measurements
44
5-6 Mini-Scan
An alternative channel scan function, the Mini-Scan, is included in new DS2831 models. Where the standard
channel scan looks at all channels in the active plan, Mini-Scan allows the user to examine up to 16 select
channels of special interest. When launching this mode, you must select 2 or more channels from the active
channel plan to measure.
You can perform a mini-scan in two ways: normal mode and fast mode. Normal mode measures both the
MER value and average power of a digital channel, while fast mode measures only average power.
Mini-Scan Channel Setup

45
Part II: Settings and Measurements
5-7 Downstream Passive Sweep
Use Passive Sweep mode to save spectrum data as a reference trace for later comparison. Up to 8 trace
records can be saved to the DS2831 as reference traces. This feature is primarily used when an active
sweep reference generator is not in use at the HE or hub. Press Start (F1) to begin the measurement.
When a reference trace has been saved by pressing Save Ref (F2), (it will appear at the top of the screen
to indicate this), it can be compared to a live trace downstream from a location at which the live trace is
being measured. Press Load Ref (F3) to open a list of reference traces saved to the internal hard drive. Use
the rotary knob to select one.
The following figure is a comparison of two traces, before and after passing through a 4-way splitter. The
amplitude shown by the marker is equal to the differentials of the two traces.
Diagram of Passive Sweep
As above, first connect the DS2831 to the input terminal of a
splitter. Depending on the splitter used, we can see that the
differential value is equal to the splitter port loss of an equal
dB value. Begin a channel sweep measurement, and save
the trace result as a reference. Then switch the DS2831 to the
splitter’s output port, and initiate a second channel sweep.
Compare the live measurement with the saved trace. We
can see that the differential value is -7.1dB, which indicates
that the signal has been attenuated 7.1dB – including 7dB
attenuation for the splitter, connector attenuation, and
signal fluctuation.
TIP: In Channel Scan, position the marker to a specific digital channel, then press the Aux ( ) key to
view the channel scan and QAM analysis side-by-side.

Part II: Settings and Measurements
46
The DS2831 features two ways to sweep the reverse path. The first, “Active Reverse Sweep”, works in
concert with the Kingstone monitoring platform.
1. On the DS2831, set up measurement parameters for reverse path sweep. 2. Log in to the DS1610 “KingStone” to activate reverse path sweep. 3. View measurement traces simultaneously at the DS1610 (as it is viewed locally at the HE) and the
DS2831 (as viewed in the field). Compare traces for level and Frequency Response delta.
4. Transmit the US sweep signal, store a reference, move to another location, and compare the stored reference with the live reference.
5. View sweep reference traces simultaneously with Spectrum Analyzer traces on the same screen.
47
Part II: Settings and Measurements
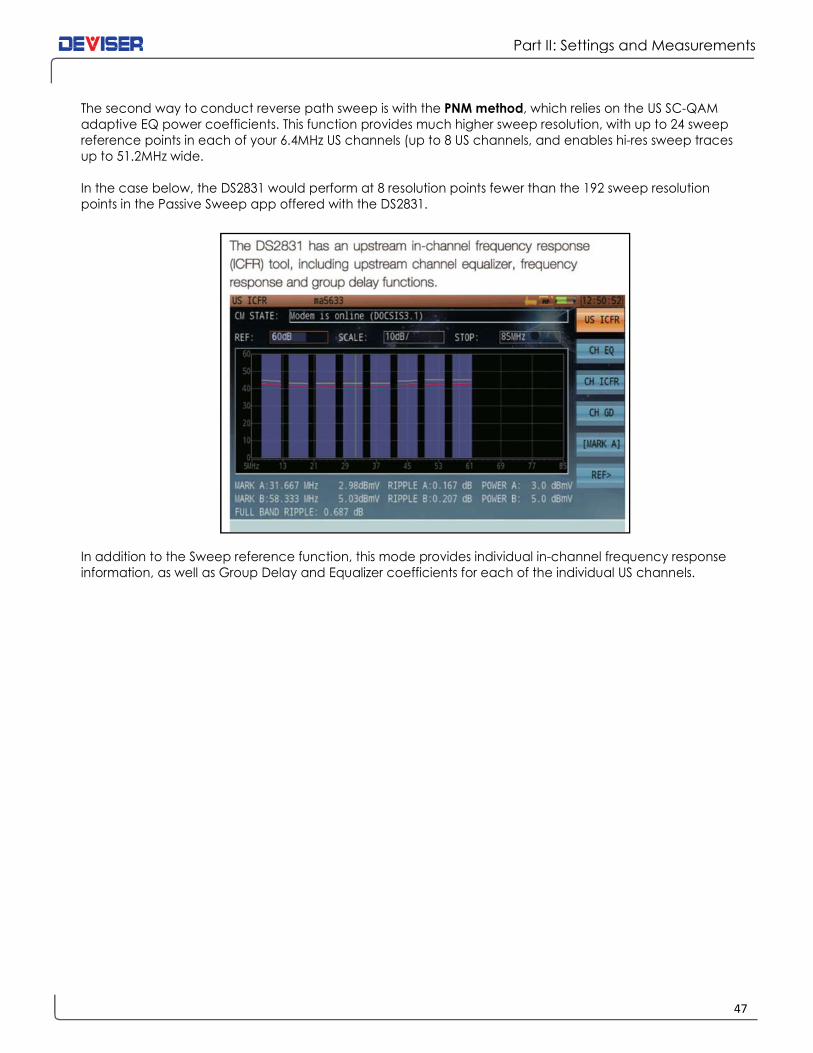
The second way to conduct reverse path sweep is with the PNM method, which relies on the US SC-QAM
adaptive EQ power coefficients. This function provides much higher sweep resolution, with up to 24 sweep
reference points in each of your 6.4MHz US channels (up to 8 US channels, and enables hi-res sweep traces
up to 51.2MHz wide.
In the case below, the DS2831 would perform at 8 resolution points fewer than the 192 sweep resolution
points in the Passive Sweep app offered with the DS2831.
In addition to the Sweep reference function, this mode provides individual in-channel frequency response
information, as well as Group Delay and Equalizer coefficients for each of the individual US channels.

Part II: Settings and Measurements
48
5-8 Tilt Measurement
The Tilt measurement helps to quickly measure the flatness of a CATV system and the gain of the splitters /
taps. This feature provides power levels for up to 16 channels. Upon entering the Tilt function, you will be
prompted to set the tilt channel plan. A minimum of 4 channels is required to begin measuring.
There are 2 markers in the tilt measurement screen. Press Mark A (F3) to activate MarkerA on the screen;
press F3 again to activate Mark B. You may only control the marker that’s currently active. When you move
the marker over a channel using the arrow keys, its level and channel type are displayed.
The Tilt measurement has two different view modes: Graph and List. Press F1 to toggle between them.
Tilt Measurement – Graph Display Tilt Measurement – Channel Listing Display
You can select the channels in your tilt plan from the
tilt editing dialog (shown right). Choose 4-16 channels
from the list of active channels in the active channel
plan to perform a tilt measurement.
All active channels in the channel plan are listed and
available in the tilt plan editing dialog.
5-8.1 Settings
Button Operation [Graph] / [List]: Toggles the measurement display between Graph and List mode.
Hold: Pauses the measurement. Press again to resume.
[MarkA] / [MarkB]: Toggles the active marker between A and B.
Setup: Opens the tilt plan editing dialog, allowing you to select 4-16 channels to test.
Test Results In Graph mode, all selected channels – no matter which – are automatically organized by frequency from
left to right. The tilt value (“A-B”) is measured between Markers A & B.
Analog channels measure the peak sync pulse of the video carrier, while digital channels measure average
power.

49
Part II: Settings and Measurements
Chapter 6: Analog Non-Linear Distortion Measurement
In this chapter, we discuss technical background and instructions for using the Analog Non-Linear Distortion
function on the DS2831.
6-1 Carrier-to-Composite Noise Ratio
Before measuring CCN Ratio with your DS2831 analyzer, visit the channel plan editor (see Chapter 4:
Channel Plans) to set up the video carrier frequency and noise bandwidth correction as necessary for your
measurement. The noise bandwidth may differ depending on the channel bandwidth, which itself depends
on your location: NA, EU, or another region. The NTSC-M system, used in North America, as specified by the
FCC, employs a 4MHz noise bandwidth correction, while PAL-D systems use a 5.75MHz noise correction.
Noise measurement bandwidth for various TV standards
Standard I B, G K1, L D, K M, N
Video bandwidth 6.75 5.75 7.25 6.75 4.95
Noise bandwidth 5.08 4.75 5.58 5.75 4.00
Typically, CCN measurements require that system
engineers first measure the video carrier level (where
the sync tip of the modulation is the absolute peak
level); then remove the video modulation by shutting
down the modulator - or simply remove the
modulation from the carrier – to allow accurate noise
measurement. Unfortunately, removing the
modulation interrupts service.
A better way to measure CCN accurately is to perform
an in-service “gated” measurement, with the help of
gating technology and quiet line insertion in the
vertical blanking interval of video signals that are off the viewable screen (usually below line 12). If you
choose a higher VITS line, you may start encountering video modulation, and thus visible interference on
the television picture.
In a gated CCN test, the DS2831 will first measure peak carrier level, and then trigger on the appropriate
VITS line # (preset for each channel; can be set in the channel plan editor) to measure noise. Occasionally,
VITS lines are already quiet enough when video signals are delivered by the Broadcaster. It is highly
recommended to use your own VITS inserter to remove any measurement uncertainty.
Many other types of test signals may be inserted for gated mode testing, including in-channel frequency
response, differential gain, and differential phase. A quiet line is absolutely required for measuring CCN,
CSO, CTB, or cross-modulation. The DS2831 is equipped with triggering technology that accurately locks
onto a specific VITS line and provides precise measurement results.

Part II: Settings and Measurements
50
Gated CCN Measurement – Frequency Domain Waveform
To conduct a gated measurement, ensure that the video carrier frequency, noise bandwidth, TV signal
standard, odd/even field, and line number are set properly in the channel plan editor. (See Section 4-2.)
CCN gated measurements support the following TV standards:
System & standard Line/frame Field frequency Color encoding technique
NTSC-M 525 60Hz NTSC
PAL-M 525 60Hz NTSC
PAL-B, D, G, H, I, K 625 50Hz PAL
PAL-N 625 50Hz PAL
Per frame 525 lines system: Field 1 (odd field), line 1-263; Field 2 (even field), line2-262
Per frame 625 lines system: Field 1 (odd field), line 1- 313; Field 2 (even field), line2-312
Gated CCN Measurement – Time Domain Waveform

51
Part II: Settings and Measurements
6-2 CTB / CSO
Typically, CTB/CSO measurements require that system engineers first measure the video carrier level (where
the sync tip of the modulation is the absolute peak level); then remove the video modulation by shutting
down the modulator - or simply remove the modulation from the carrier – to allow accurate noise
measurement. Unfortunately, removing the modulation interrupts service.
A better way to measure CTB/CSO accurately is to perform an in-service “gated” measurement, with the
help of gating technology and quiet line deletion/insertion in the vertical blanking interval of video signals
that are off the viewable screen (usually below line 12). If you choose a higher VITS line, you may encounter
video modulation, and thus visible interference on the television picture.
Occasionally, VITS lines are already quiet enough when video signals are delivered by the Broadcaster. It is
highly recommended to use your own VITS inserter to remove any measurement uncertainty. CTB distortion
falls exactly at the video carrier frequency. But CSO distortion typically falls ±0.75 MHz and ±1.25 MHz from
the video carrier. In a PAL-D system, the CSO production falls ±0.25MHz and ±1.25MHz from the carrier.
When we measure CSO and CTB, the test results are in terms of C/CSO and C/CTB. In the gated mode, the
DS2831 will first measure absolute carrier level, then trigger the appropriate VITS line # (preset for each
channel – can be set in the channel plan editor) to measure noise.
The CTB interference signal, however, falls exactly under the video carrier frequency; and since the video
carrier amplitude is likely to be higher than the interference, a gated CTB measurement must use a line-
removing/inserter equipment to remove one line, or at least one field of one line, of the video carrier signal.
Many other types of test signals may be inserted for gated mode testing, including in-channel frequency
response, differential gain, and differential phase. A quiet line is absolutely required for measuring CCN,
CSO, CTB, or cross-modulation. The DS2831 is equipped with triggering technology that accurately locks
onto a specific VITS line and provides precise measurement results.
CSO/CTB Measurement Gated CSO/CTB Measurement – Frequency Domain Waveform
NOTE: Using such line-removing/inserter equipment for CTB
measurements will cause a slightly audible "ticking" noise
in your television set speaker output. This test requires that
the test signal be inserted only for the duration of the
actual test, and not left "on" all the time – so as to avoid
customer concerns about audio problems.
Gated CSO/CTB Measurement – Time Domain Waveform
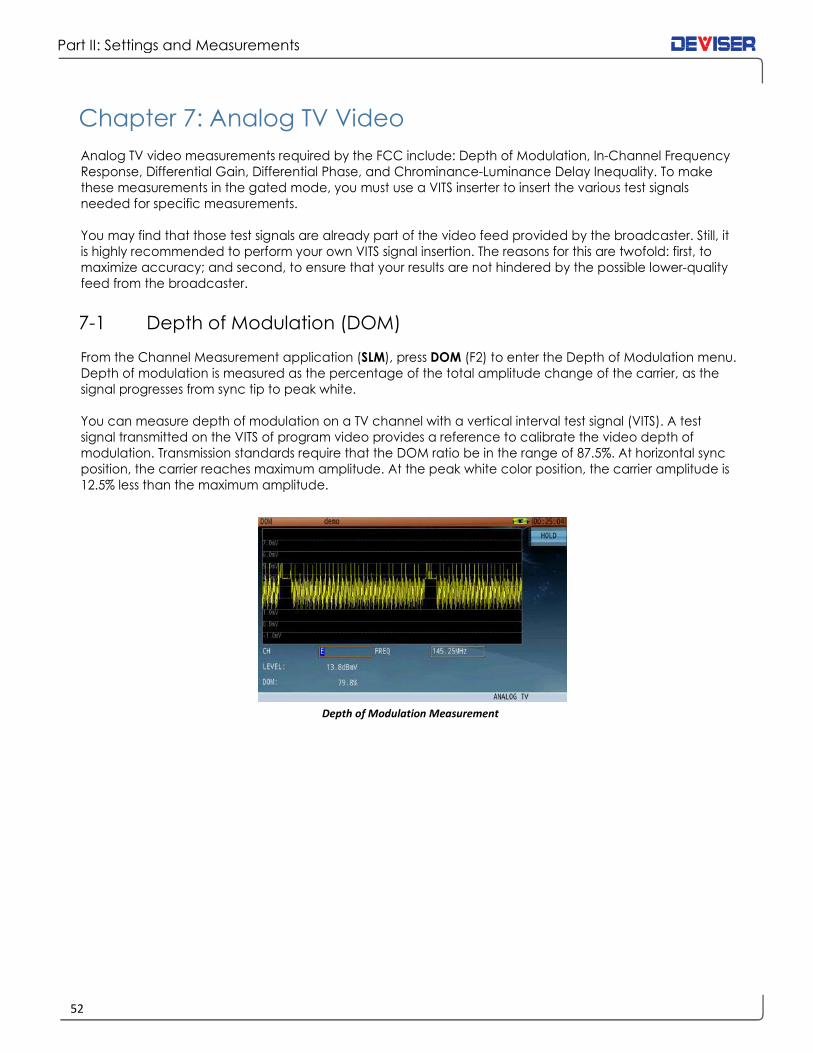
Part II: Settings and Measurements
52
Chapter 7: Analog TV Video
Analog TV video measurements required by the FCC include: Depth of Modulation, In-Channel Frequency
Response, Differential Gain, Differential Phase, and Chrominance-Luminance Delay Inequality. To make
these measurements in the gated mode, you must use a VITS inserter to insert the various test signals
needed for specific measurements.
You may find that those test signals are already part of the video feed provided by the broadcaster. Still, it
is highly recommended to perform your own VITS signal insertion. The reasons for this are twofold: first, to
maximize accuracy; and second, to ensure that your results are not hindered by the possible lower-quality
feed from the broadcaster.
7-1 Depth of Modulation (DOM)
From the Channel Measurement application (SLM), press DOM (F2) to enter the Depth of Modulation menu.
Depth of modulation is measured as the percentage of the total amplitude change of the carrier, as the
signal progresses from sync tip to peak white.
You can measure depth of modulation on a TV channel with a vertical interval test signal (VITS). A test
signal transmitted on the VITS of program video provides a reference to calibrate the video depth of
modulation. Transmission standards require that the DOM ratio be in the range of 87.5%. At horizontal sync
position, the carrier reaches maximum amplitude. At the peak white color position, the carrier amplitude is
12.5% less than the maximum amplitude.
Depth of Modulation Measurement

53
Part II: Settings and Measurements
7-2 In-Channel Frequency Response
In-channel frequency response (ICFR) is used to measure the amplitude response flatness of a channel,
anywhere on the HFC network. The ICR measurement can be made with a vertical interval test signal (VITS).
The DS2831 supports the following test signals:
• Ghost Cancellation Reference (GCR) • Multiburst
If using a GCR test signal, it is not necessary to set up the multiburst packet frequencies. But if using a cable
multiburst, make sure that the analyzer multiburst packet frequencies match the test signal frequencies.
(You can preset these settings in the channel plan editor; see Section 4-2.) Failure to set up the multiburst
packet frequencies may produce faulty measurement results, as the DS2831 does not scan automatically
for these frequencies.
A typical multiburst signal includes six discrete frequencies in TV signal video bandwidth. These frequencies
differ between PAL-D and NTSC-M standards:
• PAL-D: 500kHz, 1.0MHz, 2.0MHz, 4.0MHz, 4.8MHz, 5.8MHz
• NTSC-M: 500kHz, 1.0MHz, 2.0MHz, 3.0MHz, 3.58MHz, 4.2MHz
Press the ICR function key to enter the ICR menu. The default ICR measurement mode is in frequency
domain, gated mode off (inactive). If a VITS signal is present in the baseband input signal (full field), users
can use the frequency domain mode to measure ICR. Press Gated (F1) to toggle the gated mode ON/OFF.
ICR – Full Field Multiburst Signal ICR – Marker Operation
Markers can be used in either auto or manual mode. Toggle between them by pressing Auto (F3). In Auto
mode, the DS2831 will automatically detect the higher and lower levels and display measurement results. In
manual mode, the Mark function (F4) is now enabled. Pressing the F4 repeatedly to cycle between Marker
1 and Marker 2. Use the rotary knob to move the marker to the desired frequency.
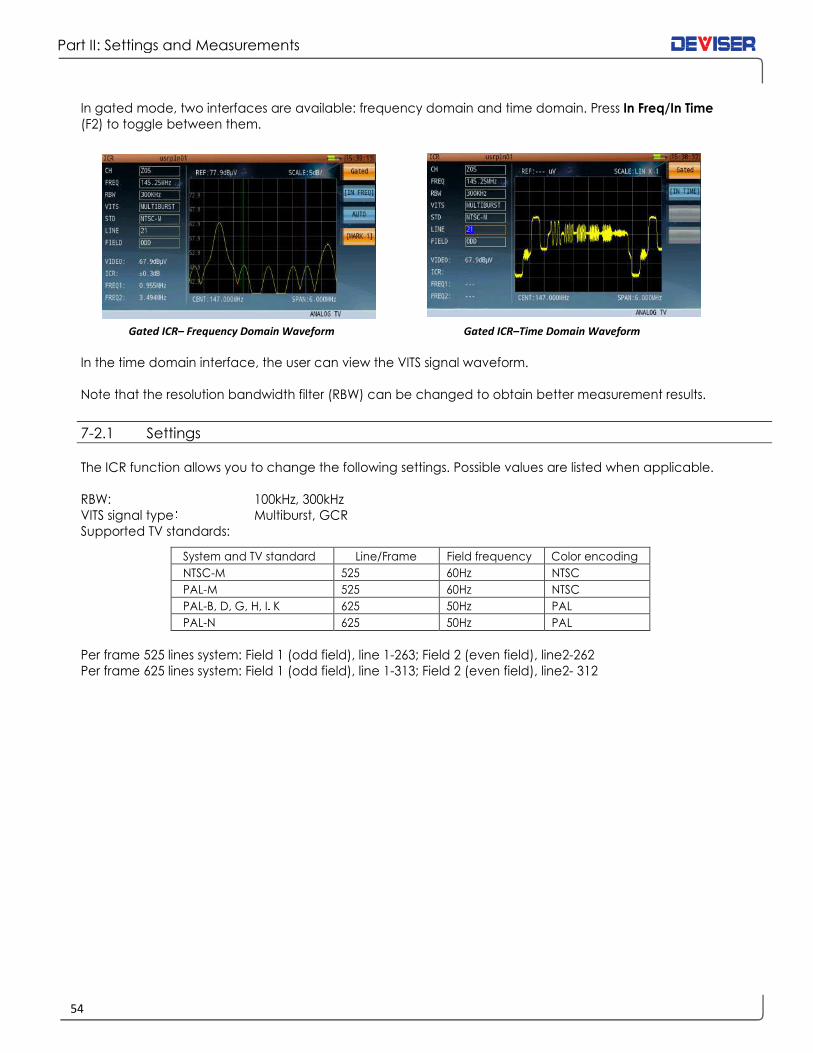
Part II: Settings and Measurements
54
In gated mode, two interfaces are available: frequency domain and time domain. Press In Freq/In Time
(F2) to toggle between them.
Gated ICR– Frequency Domain Waveform Gated ICR–Time Domain Waveform
In the time domain interface, the user can view the VITS signal waveform.
Note that the resolution bandwidth filter (RBW) can be changed to obtain better measurement results.
7-2.1 Settings
The ICR function allows you to change the following settings. Possible values are listed when applicable.
RBW: 100kHz, 300kHz
VITS signal type: Multiburst, GCR
Supported TV standards:
System and TV standard Line/Frame Field frequency Color encoding
NTSC-M 525 60Hz NTSC
PAL-M 525 60Hz NTSC
PAL-B, D, G, H, I,K 625 50Hz PAL
PAL-N 625 50Hz PAL
Per frame 525 lines system: Field 1 (odd field), line 1-263; Field 2 (even field), line2-262
Per frame 625 lines system: Field 1 (odd field), line 1-313; Field 2 (even field), line2- 312

55
Part II: Settings and Measurements
7-3 Differential Gain and Differential Phase
From the Channel Measurement application, press DG/DP to open the Differential Gain / Differential Phase
measurement menu.
Differential Gain and Differential Phase are defined as variations of the amplitude and phase of a Color
Sub-carrier superimposed on a luminance signal of varying IRE. Common practice is to use a luminance
variation in a stairstep (5 or 10 stairs), or a continuous ramp above the 0 IRE and reaching 90 IRE.
The measurement of Diff Gain & Phase is based on
variations of the demodulated color sub-carrier that is
the Color Vector. The amplitude and phase of the Color
Vector is measured at each step, and the peak-to-
peak variation is termed the Differential Gain & Phase.
Modern signal processing enables users to position the
sample locations on the test signal, while providing
measurement averaging and calculating the Peak-to-
peak variations & acceptance limits comparison.
7-3.1 Settings
The DG/DP function allows you to change the following settings. Possible values are listed when applicable.
VITS signal:
Per frame 525 lines system, the VITS signal is: FCC and NTC-7
Per frame 625 lines system, the VITS signal is: CCIR330,,,,UK ITS,,,,GB19
The above VITS signals include the modulated staircase signal superimposed over the color subcarrier.
(Detailed VITS signal information is documented in Section 25-3 of this User Guide.)
TV Standard and System Line/Frame Field frequency Color encoding technique
NTSC-M 525 60Hz NTSC
PAL-M 525 60Hz NTSC
PAL-B,D,G,H,I,K 625 50Hz PAL
PAL-N 625 50Hz PAL
Per frame 525 lines system: Field 1 (odd field), line 1-263; Field 2 (even field), line2-262
Per frame 625 lines system: Field 1 (odd field), line 1-313; Field 2 (even field), line2- 312
A Note About the IRE
The IRE is a unit equal to 1/140 of the peak-
to-peak amplitude of the video signals –
typically 1 volt. The 0 IRE point is at blanking
level, with sync tip at -40 IRE and white
extending to +100 IRE. IRE stands for
Institute of Radio Engineers, the organization that defined the unit.
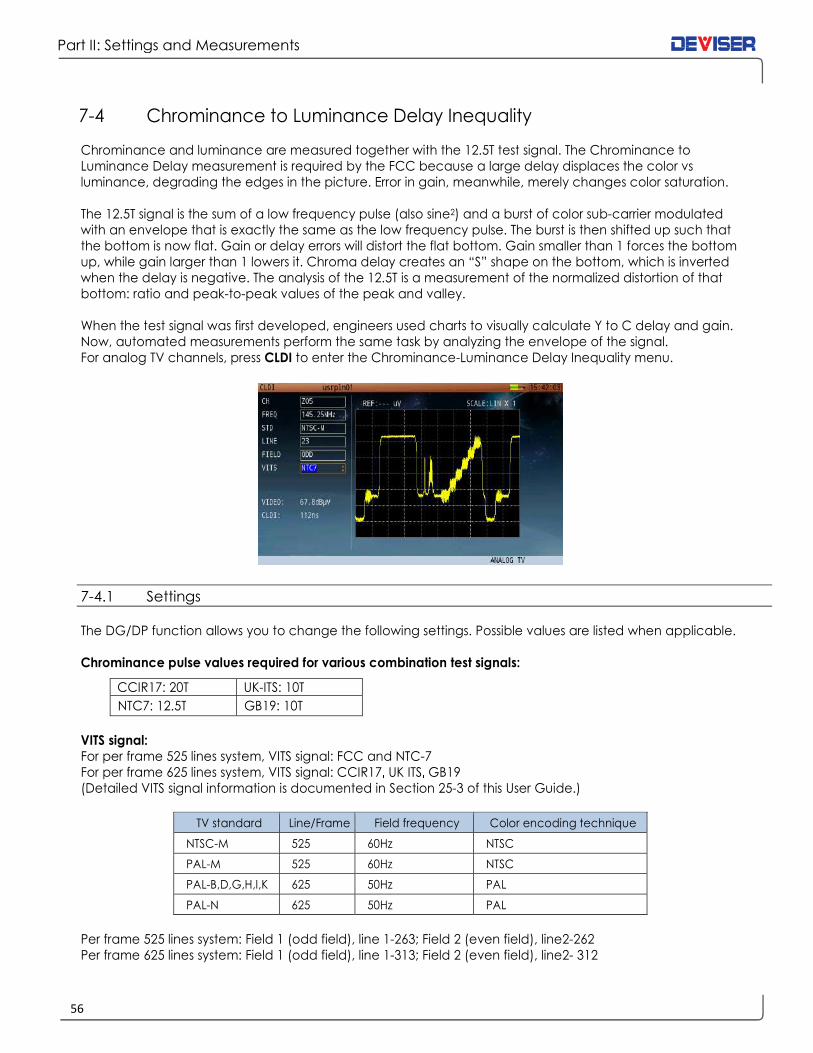
Part II: Settings and Measurements
56
7-4 Chrominance to Luminance Delay Inequality
Chrominance and luminance are measured together with the 12.5T test signal. The Chrominance to
Luminance Delay measurement is required by the FCC because a large delay displaces the color vs
luminance, degrading the edges in the picture. Error in gain, meanwhile, merely changes color saturation.
The 12.5T signal is the sum of a low frequency pulse (also sine2) and a burst of color sub-carrier modulated
with an envelope that is exactly the same as the low frequency pulse. The burst is then shifted up such that
the bottom is now flat. Gain or delay errors will distort the flat bottom. Gain smaller than 1 forces the bottom
up, while gain larger than 1 lowers it. Chroma delay creates an “S” shape on the bottom, which is inverted
when the delay is negative. The analysis of the 12.5T is a measurement of the normalized distortion of that
bottom: ratio and peak-to-peak values of the peak and valley.
When the test signal was first developed, engineers used charts to visually calculate Y to C delay and gain.
Now, automated measurements perform the same task by analyzing the envelope of the signal.
For analog TV channels, press CLDI to enter the Chrominance-Luminance Delay Inequality menu.
7-4.1 Settings
The DG/DP function allows you to change the following settings. Possible values are listed when applicable.
Chrominance pulse values required for various combination test signals:
CCIR17: 20T UK-ITS: 10T
NTC7: 12.5T GB19: 10T
VITS signal:
For per frame 525 lines system, VITS signal: FCC and NTC-7
For per frame 625 lines system, VITS signal: CCIR17,UK ITS,GB19 (Detailed VITS signal information is documented in Section 25-3 of this User Guide.)
TV standard Line/Frame Field frequency Color encoding technique
NTSC-M 525 60Hz NTSC
PAL-M 525 60Hz NTSC
PAL-B,D,G,H,I,K 625 50Hz PAL
PAL-N 625 50Hz PAL
Per frame 525 lines system: Field 1 (odd field), line 1-263; Field 2 (even field), line2-262
Per frame 625 lines system: Field 1 (odd field), line 1-313; Field 2 (even field), line2- 312

57
Part II: Settings and Measurements
Chapter 8: Digital Signal Measurement
DVB-C QAM analysis functions include the following channel measurements:
• Constellation diagram • MER & BER statistics analysis
• Channel power • EVS (Error vector spectrum)
• Equalizer coefficient display and distance to fault • Simultaneous spectrum & channel scan
• In-band frequency response • Digital channel SNR
• In-band group delay • Digital Hum
Parameter Settings
The DS2831’s DVB-C analysis function is fully automated, except for a few simple parameters like frequency.
All other parameters are acquired automatically (but may still be manually adjusted at the user’s wish).
Adjustable parameters and range of the DVB-C function of the DS2831 are as follows.
Parameter Key Value Range
Channel number CH All active channels in the active channel plan
Center frequency FREQ 5~1200 MHz
Channel bandwidth BW 1~50 MHz
Modulation mode MODE J.83A / C: 16 / 32 / 64 / 128 / 256 QAM
J.83B: 64 / 256 QAM
Symbol Rate (MS/s) SR J.83A / B / C: 4~7 MS/s, self-adaptive
J.83D: Fixed at 10.762 MS/s
DVB-C Standard STD J.83A, B, & C, self-adaptive (J.83D by option only)
Interleave Depth (n/a) Self-adaptive only. Setting is displayed in status bar.
Relevant Icons QAM signal losing lock
QAM signal lock
Interleave depth of the I & J signals

Part II: Settings and Measurements
58
8-1 DVB-C Measurement
The digital channel measurement screen (shown below) displays basic digital metrics after demodulation.
Use the rotary knob to move between parameters:
channel, frequency and bandwidth. When the cursor
highlights a field, you can adjust the value with the
arrow keys or input your desired value with the keypad.
8-1.1 Settings
Button Operation HUM Opens Digital HUM function.
CONS Opens Constellation diagram function.
BER Opens BER & MER statistics diagram function.
EQU Opens Equalizer coefficient & in-band response function.
EVS Opens EVS function.
TS MEAS Opens MPEG-2 TS analysis function.
8-2 OFDM
The DS2831’s DOCSIS 3.1 cable modem includes upstream and downstream OFDM functionality. OFDM
(Orthogonal Frequency Division Multiplexing) distributes a signal among multiple subcarriers, optimizing
overall speed and mitigating the effect of impairments that may affect some but not all subcarriers.
OFDM subcarriers may be either 25 or 50kHz, while bonded channels may be as wide as 192 MHz for
downstream transmissions and 48 or 96 MHz for upstream transmissions.
DOCSIS 3.1 DS/US OFDM Demodulation EVS Captures Interference Under OFDM Carriers
Note:
When switching to a different channel, the DS2831
will automatically run a channel-locking sequence.
This refreshes the parameter list and test results.

59
Part II: Settings and Measurements
8-3 Digital HUM
Hum modulation, or power source frequency modulation distortion, comes from a power source frequency
interference. HUM modulation generally degrades MER values of a digital carrier. The DS2831 supports hum
modulation measurements for digital channels. The measurement interface is shown below.
8-3.1 Settings
Channel The channel to measure. You can select any active channel in the active channel plan.
Frequency Input range 5-1200 MHz.
Button Operation [50Hz] / [60Hz] Toggles the power frequency between 50Hz and 60Hz.
Hold: Pauses the measurement. Press again to resume.
Test Results Average Power: Measured over the occupied bandwidth (Level).
Hum Modulation: Degree of hum modulation interference, as measured under the digital QAM carrier.
(DOCSIS specification recommends not to exceed 5%; the less, the better.)
Freq Component: Displays the percentage of HUM for each of the distortion frequencies.
You can choose the AC power frequency according to your local region.
The DS2831 can measure the following low-frequency interference and interference harmonics:
• 50Hz: 100Hz, 150Hz and 200Hz
• 60Hz: 120Hz, 180Hz and 240Hz
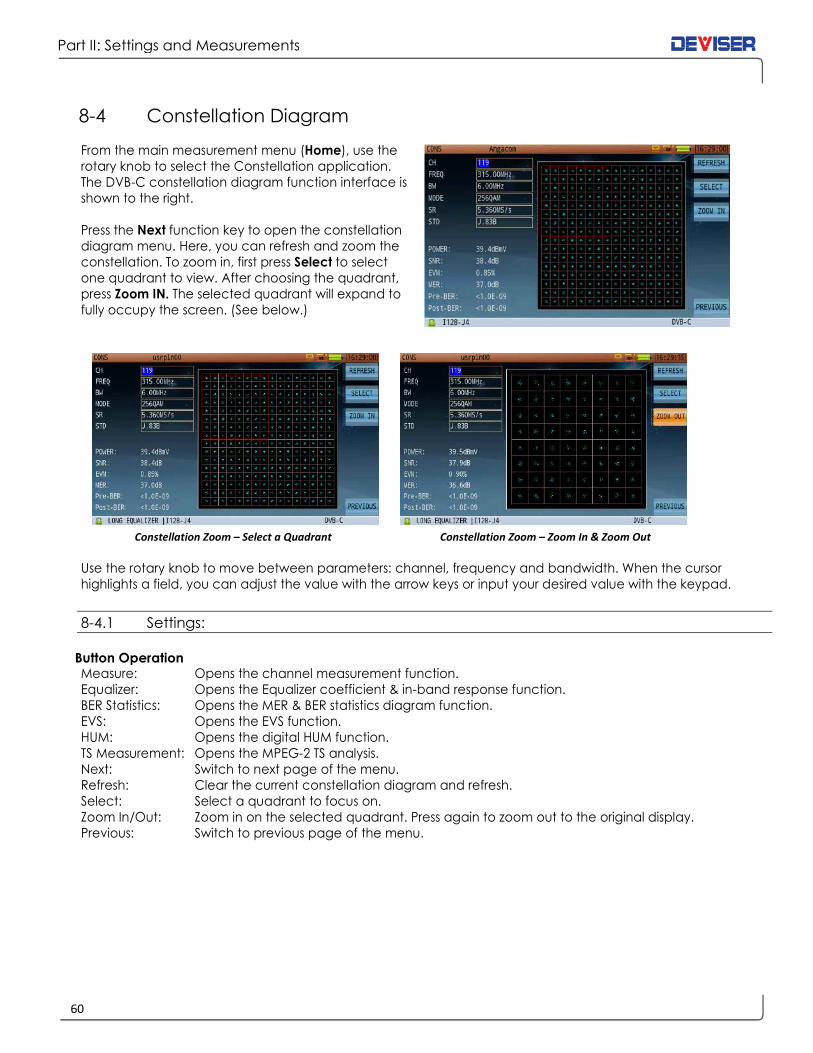
Part II: Settings and Measurements
60
8-4 Constellation Diagram
From the main measurement menu (Home), use the
rotary knob to select the Constellation application.
The DVB-C constellation diagram function interface is
shown to the right.
Press the Next function key to open the constellation
diagram menu. Here, you can refresh and zoom the
constellation. To zoom in, first press Select to select
one quadrant to view. After choosing the quadrant,
press Zoom IN. The selected quadrant will expand to
fully occupy the screen. (See below.)
Constellation Zoom – Select a Quadrant Constellation Zoom – Zoom In & Zoom Out
Use the rotary knob to move between parameters: channel, frequency and bandwidth. When the cursor
highlights a field, you can adjust the value with the arrow keys or input your desired value with the keypad.
8-4.1 Settings:
Button Operation Measure: Opens the channel measurement function.
Equalizer: Opens the Equalizer coefficient & in-band response function.
BER Statistics: Opens the MER & BER statistics diagram function.
EVS: Opens the EVS function.
HUM: Opens the digital HUM function.
TS Measurement: Opens the MPEG-2 TS analysis.
Next: Switch to next page of the menu.
Refresh: Clear the current constellation diagram and refresh.
Select: Select a quadrant to focus on.
Zoom In/Out: Zoom in on the selected quadrant. Press again to zoom out to the original display.
Previous: Switch to previous page of the menu.

61
Part II: Settings and Measurements
8-5 MER & BER Statistics Graph
The DVB-C MER & BER statistics function, shown below, provides analysis over time.
BER & MER Statistical Graph BER & MER Statistical History Record
The statistics interface is divided into two parts: a statistical graph of change over time, and a summary of
current measurement settings. The graph displays Pre-BER in yellow and Post-BER in red (per the reference
scale on the left). MER is displayed by the blue line and referenced to the scale on the right.
Two bar graphs appear under the statistical curve: ES (Errored Seconds) and SES
(Severely-Errored Seconds). When Pre-BER measures worse than 1.0E-09, the ES bar
records and displays yellow lines. When Post-BER measures worse than 1.0E-03, the
SES bar records and displays red lines.
Press Time (F1) to set the recording duration from 1 min to 48 hrs. in 1-sec. intervals
(see right). Note that an errored second (ES) is one in which 1 bit error occurs within
1s. A severely errored second (SES) is one in which the error rate is equal to or worse than 10E-3.
8-5.1 Settings
NOTE: the parameters listed below the graphical interface cannot be edited directly. For any modifications,
press the CH key below the display to open the Channel Plan Editor. (See Chapter 4 for more details.)
MER: Modulation error ratio.
PRE-/POST-BER: Bit error rate before / after error correction.
ES: Errored second. If one or more correctable or uncorrectable bit errors occurs in a one-
second time window, the ES increases by 1.
SES: Severely-errored second. If the number of uncorrectable bit errors divided by the total
number of transmitted bits is equal or more than 1.0E-3, then the SES increases by 1.
TIME: Duration of the test.
COR / UNCOR: Total number of corrected / uncorrected bit errors.
SUM: Total number of received bits.
Pre-BER (SUM): The bit error rate before total error correction. Pre-BER (SUM) = (COR+UNCOR)/SUM.
Post-BER (SUM): The bit error rate after total error correction. Pre-BER (SUM) = UNCOR/SUM.
Button Operation Time: Set the duration of the test.
Start: Start/end the test.

Part II: Settings and Measurements
62
8-6 Error Vector Spectrum (EVS) Function
The EVS function is a powerful tool for locating signal interference under the QAM (DVB-C or DOCSIS) in-
service. Traditional methods require briefly interrupting the QAM signal, in order to see any distortion
products mixed with the noise floor underneath. This is non-ideal in today’s HFC preventive network
maintenance practices.
The EVS function helps find interference signals under the QAM signal without interrupting service. It works
two different ways: in the time domain, and in the frequency domain. The frequency domain function is
typically used to find interference signals of much narrower bandwidth than the QAM signal.
Error Vector Spectrum – Frequency Domain Error Vector Spectrum – Time Domain
However, when the interference is broadband in nature – meaning that its bandwidth is close or wider than
the QAM bandwidth (5MHz, or 10MHz in the case of LTE signals) – the time domain function is the right tool.
In recent years, the most common and disruptive broadband signals are cellular LTE signals that may creep
into an HFC network and interfere with QAM signals being transmitted over Cable at the same frequencies.
Frequently used LTE bandwidths include 5, 10, and 20MHz. These types of bandwidth are all close to or
wider than the DVB-C signal bandwidth. Both LTE and DVB-C are digital signals, and are similar to noise. The
DS2831 uses the EVS time-domain function to display LTE sub-frames coming in every 1ms (above, right).
For a guide to identifying LTE interference with EVS, see the EVS application note on page 185.
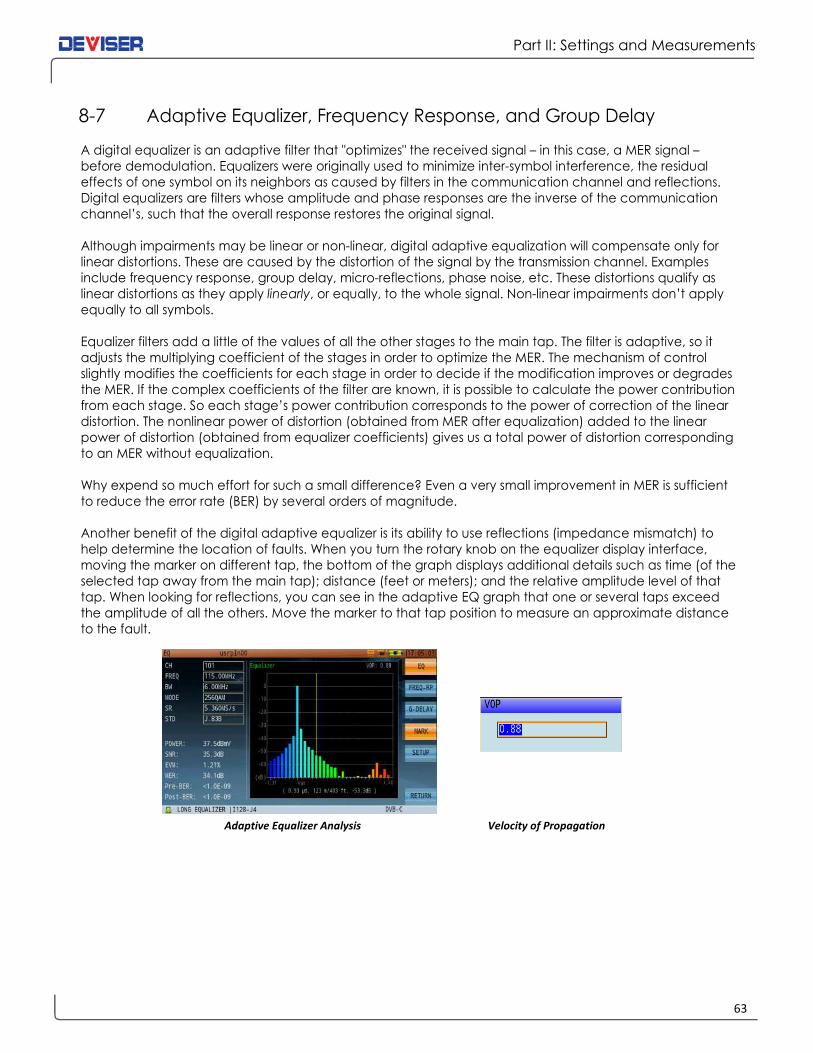
63
Part II: Settings and Measurements
8-7 Adaptive Equalizer, Frequency Response, and Group Delay
A digital equalizer is an adaptive filter that "optimizes" the received signal – in this case, a MER signal –
before demodulation. Equalizers were originally used to minimize inter-symbol interference, the residual
effects of one symbol on its neighbors as caused by filters in the communication channel and reflections.
Digital equalizers are filters whose amplitude and phase responses are the inverse of the communication
channel’s, such that the overall response restores the original signal.
Although impairments may be linear or non-linear, digital adaptive equalization will compensate only for
linear distortions. These are caused by the distortion of the signal by the transmission channel. Examples
include frequency response, group delay, micro-reflections, phase noise, etc. These distortions qualify as
linear distortions as they apply linearly, or equally, to the whole signal. Non-linear impairments don’t apply
equally to all symbols.
Equalizer filters add a little of the values of all the other stages to the main tap. The filter is adaptive, so it
adjusts the multiplying coefficient of the stages in order to optimize the MER. The mechanism of control
slightly modifies the coefficients for each stage in order to decide if the modification improves or degrades
the MER. If the complex coefficients of the filter are known, it is possible to calculate the power contribution
from each stage. So each stage’s power contribution corresponds to the power of correction of the linear
distortion. The nonlinear power of distortion (obtained from MER after equalization) added to the linear
power of distortion (obtained from equalizer coefficients) gives us a total power of distortion corresponding
to an MER without equalization.
Why expend so much effort for such a small difference? Even a very small improvement in MER is sufficient
to reduce the error rate (BER) by several orders of magnitude.
Another benefit of the digital adaptive equalizer is its ability to use reflections (impedance mismatch) to
help determine the location of faults. When you turn the rotary knob on the equalizer display interface,
moving the marker on different tap, the bottom of the graph displays additional details such as time (of the
selected tap away from the main tap); distance (feet or meters); and the relative amplitude level of that
tap. When looking for reflections, you can see in the adaptive EQ graph that one or several taps exceed
the amplitude of all the others. Move the marker to that tap position to measure an approximate distance
to the fault.
Adaptive Equalizer Analysis Velocity of Propagation

Part II: Settings and Measurements
64
8-7.1 Frequency Response Function
The frequency response menu is used to measure in-band flatness of the selected channel. There are two
horizontal markers which will detect min/max automatically and provide you with flatness information in dB
displayed at the top right corner of the graph. A vertical marker is available for frequency and amplitude
information at every point of the curve; turning the rotary knob will provide this information at different
frequencies. The data is displayed at the bottom of the screen.
In this mode, if there is an impedance mismatch somewhere downstream of the measurement location, the
DS2831 will display "standing waves" in the frequency response trace. You can determine the approximate
distance to the fault or impedance mismatch by using the following formula:
D = 492(VP/F)
D = distance in feet to the impedance mismatch VP = coaxial cable's velocity of propagation (generally 87% or 0.87)
F = frequency in MHz separating each standing wave ripple—that is, the bandwidth spanned by one cycle
of the standing wave
For example, assume a standing wave is visible in the sweep receiver’s frequency response display, and
there is 0.4 MHz from the peak of one ripple to the next. If the feeder cable VP is 87% (0.87), then the
distance to the fault is just under 1100 feet.
D = 492(0.87/0.4) D = 492(2.18) D = 1070 feet
In-Band Frequency Response Analysis
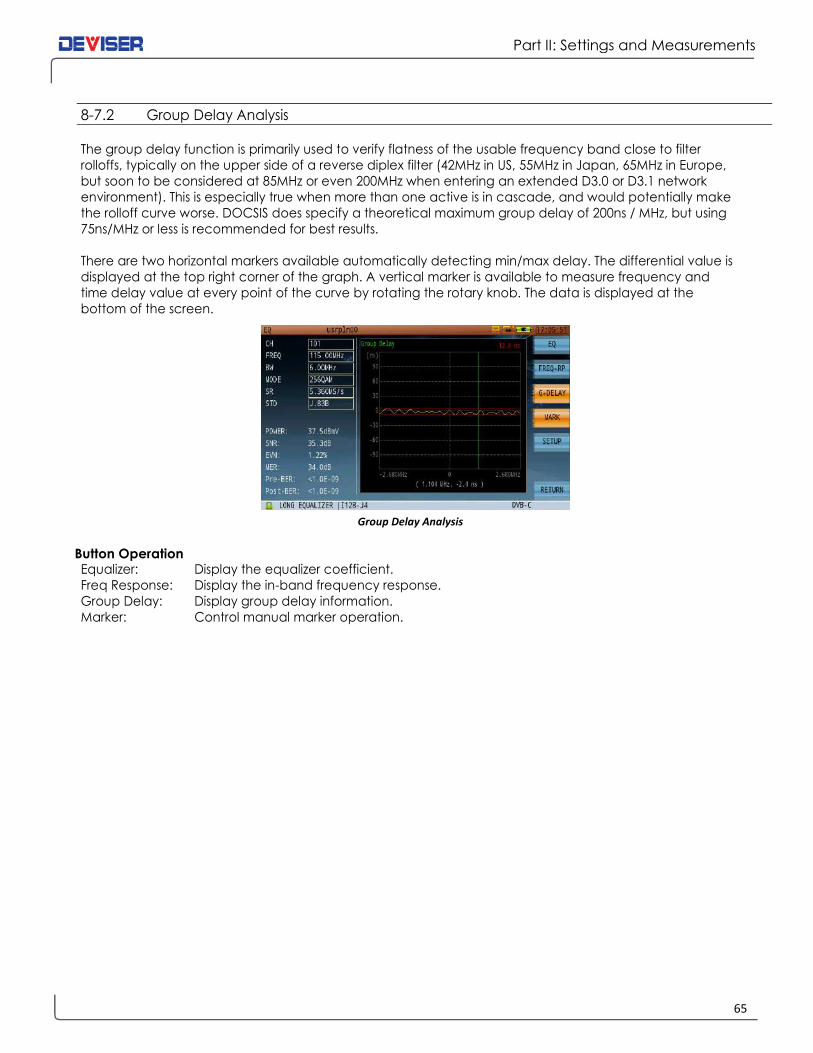
65
Part II: Settings and Measurements
8-7.2 Group Delay Analysis
The group delay function is primarily used to verify flatness of the usable frequency band close to filter
rolloffs, typically on the upper side of a reverse diplex filter (42MHz in US, 55MHz in Japan, 65MHz in Europe,
but soon to be considered at 85MHz or even 200MHz when entering an extended D3.0 or D3.1 network
environment). This is especially true when more than one active is in cascade, and would potentially make
the rolloff curve worse. DOCSIS does specify a theoretical maximum group delay of 200ns / MHz, but using
75ns/MHz or less is recommended for best results.
There are two horizontal markers available automatically detecting min/max delay. The differential value is
displayed at the top right corner of the graph. A vertical marker is available to measure frequency and
time delay value at every point of the curve by rotating the rotary knob. The data is displayed at the
bottom of the screen.
Group Delay Analysis
Button Operation Equalizer: Display the equalizer coefficient.
Freq Response: Display the in-band frequency response.
Group Delay: Display group delay information.
Marker: Control manual marker operation.

Part II: Settings and Measurements
66
Chapter 9: Transport Stream Analysis
The Transport Stream (TS) analysis function supports DVB & ATSC standard real-time TS analysis.
Functions include:
• Basic Information • PCR Analysis
• TR 101 290 Priority 1, 2 and 3 Tests • Program List
• PID Viewer • PSI/SI
• Program Information • Data Capture
Supported Standards
MPEG-1 ISO-IEC-11172-2(Video)
ISO-IEC-11172-3(Audio)
MPEG-2
ISO/IEC 13818-1 (System)
ISO/IEC 13818-2 (Video)
ISO/IEC 13818-3 (Audio)
ISO/IEC 13818-6 (DSM-CC)
ISO/IEC 13818-7 (AAC)
MPEG-4 ISO/IEC 14496-2 (Video)
ISO/IEC 14496-3 (Audio)
H264 ITU-T H.264
ISO/IEC 14496-10 (AVC)

67
Part II: Settings and Measurements
9-1 Transport Stream Real-time Analysis
This function parses the information from audio and video ES. It supports MPEG-1/2/4, H.264 video format
and MPEG-1/2/4, AAC audio format. Up to two sets of audio information can be displayed.
It lists all programs' SID, Service Name, CA, provider, service type, video PID, video type, Audio1 PID, Audio2
PID, Audio type in the top pane.
The bottom pane displays video/audio information of the selected program. Video information includes
resolution, frame rate, bit rate, profile, level, aspect ratio and chroma type. Audio information includes
mode, layer, bit rate, sampling, profile, channel configuration and emphasis.
These parameters may be different according to the audio/video format (below, left) If the parameter is
not parsed or the program is an encrypted program, ‘---’ will be displayed (below, right). If the program has
no video information, the message “No PAT” will appear.
Transport Stream: Real-Time Analysis Encrypted Program Information
9-1.1 Settings
SID: The program number in decimal or hexadecimal according to the Setup.
Service Name: The service name of the program. ‘---’is displayed if the description doesn’t exist.
CA: stands for not encrypted, and stands for encrypted.
Provider: The provider of the program. ‘---’is displayed if the description doesn’t exist.
Service Type: A brief description of the service type of the program.
Video PID: The video PID of the selected program.
Video Type: The video type of the program. ‘---’is displayed if video information is not available.
Audio PID1: The first audio PID of the selected program.
Audio PID2: The second audio PID of the selected program.
Audio Type: The audio type of the program, e.g. MPEG2 Audio.
Program information is displayed at the bottom of the screen.
The real-time analysis option offers two submenus: video/audio information and bandwidth. Bandwidth
shows the selected program’s bandwidth information in the highlighted program list. The yellow curve is the
video BW rate curve (if video information is included in the program). The green and purple curves are the
first and second audio BW curves (if audio information is included). The horizontal coordinate describes the
percentage of the current over a period of time. The vertical coordinates on the left and right respectively
describe the percentage of the video bandwidth and audio bandwidth in the program. If the program is
not a digital TV program, no curve will be displayed.

Part II: Settings and Measurements
68
Occupied Bandwidth Analysis
9-2 Basic Information
Transport Stream Basic Information
This screen displays basic information for the transport stream.
TS RATE: Shows the stream’s transport rate in a second (Mb/s). The DS2831 displays ; Min, Max,
Avg and Current TS rate of the last second interval.
TS STRUCTURE: Describes the components of the TS and the percentage of each component, including
video, audio, PSI/SI, empty packet and other types of information (example: data or
encryption information).
OTHER INFO: Describes miscellaneous information of the stream.
LENGTH: The length of the packets in bytes, there are 188 bytes and/or 204 bytes type in any
given transport stream structure.
PROG COUNT: Shows the total number of programs.
TS ID: Different channels have different TS ID, this indicates the number of IDs (or channels).
PID COUNT: The sum of PIDs of a stream.
NET ID: The PID of NIT indicated by PAT, if not indicated, ‘---’is displayed.
NET NAME: The provider (Operator) name, ‘---’is displayed if it is not provided in the steam.

69
Part II: Settings and Measurements
9-3 TR 101 290 Priority 1, 2 and 3 Tests
The DVB group has established a battery of recommended
measurements to perform on transport streams, set forth in the
ETSI TR101290 document. Based on TR 101 290 advisories, errors
to be detected by means of these recommended tests are
graded into three levels of priority: Priority 1, 2, and 3.
Priority 1 – no decidability
Priority 2 – partially no decidability
Priority 3 – errors in the supplementary information/SI
Due to hardware resource limits, the DS2831’s TS analysis does not include buffer-test-related parameters.
9-3.1 Priority 1 Parameters
(1) TS_sync_loss: It is suggested that five consecutive correct sync bytes are sufficient for sync acquisition,
and two or more consecutive corrupted sync bytes indicate a sync loss. The loss of transport stream
synchronization, which may occur either because of severe interference or simply because of a break in
the line, is called “TS_sync_loss”. “TS_sync_loss” occurs when the content of the sync bytes of at least 3
successful transport stream packets is not equal to 0x47.
(2) Sync_byte_error: is set as soon as the correct sync byte (0x47) does not appear after 188 or 204 bytes.
This is fundamental since this structure is used throughout the channel encoder and decoder chains for
synchronization. It is also important for the decoder to check every sync byte for correctness since the
encoders may not necessarily check the sync byte. Some encoders may use the sync byte flag signal on
a parallel interface to control the randomizer re-sending a byte inversion without checking that the
corresponding byte is a valid sync byte. A “sync_byte_error” occurs when the content of a sync byte in
the transport stream header is not equal to 0x47.
(3) PAT_error: The Program Association Table (PAT), only appears in PID 0x0000 packets, tells the decoder
what programs are in the TS and points to the Program Map Tables (PMT) which in turn point to the
component video, audio and data streams that make up the program. If the PAT is missing then the
decoder can decode no programs.
A PAT error occurs when: 1.- the PAT is missing, 2.- the repetition rate is greater than 500 ms, 3.- the PAT is
scrambled or 4.- the table ID is not equal to zero.
(4) Continuity_count_error: Each transport stream packet contains a 4-byte-long header, a 4-bit counter
which counts from 0 to 15 in a loop, and then begins at zero again after an overflow (modulo 16
counter). However, each transport stream packet for each PID has its own continuity counter, i.e.
packets with a PID=100, e.g., have a different counter, as do packets with a PID=200. It is the purpose of
this counter to enable one to recognize missing or repeated transport stream packets of the same PID in
order to draw attention to any multiplexer problems.
Such problems can also arise as a result of errors in remultiplexing or due to random bit errors in the
transmission link. Although MPEG-2 allows discontinuities in the transport stream, they must be indicated
in the adaptation field, e.g. after a switch-over (discontinuity indicator=1). In the case of zero packets
(PID=0x1FF), discontinuities are allowed and are not verified.
A continuity_error occurs when
• The same TS packet is transmitted twice without a discontinuity being indicated, or
• If a packet is missing (count incremented by 2) without a discontinuity being indicated, or
• The sequence of packets is wrong.

Part II: Settings and Measurements
70
(5) PMT_error: For each program, a Program Map Table (PMT) is transmitted at maximum intervals of 500 ms.
The PIDs of the MAPs are listed in the PAT. The PMT contains the respective PIDs of all elementary streams
belonging to this program. If a PMT referred to in the PAT is missing, the set top box or decoder will be
unable to demultiplex or decode them. If a PMT is listed in the PAT but is either missing, errored or
scrambled, will lead to the error message “PMT_error”.
A “PMT error” occurs when
• A PMT listed in the PAT is missing,
• A section of the PMT is not repeated after 500 ms or less,
• A PMT is scrambled,
• The table ID is not 2.
(6) PID_error: The PIDs of all elementary streams of a given program are contained in the associated
program map table (PMT). The PIDs are pointers to the elementary streams: they are used to access to
the corresponding packets of the elementary stream to be decoded. If a PID is listed in a PMT but not
contained in the transport stream, the decoder will be unable to access the corresponding elementary
stream.
A “PID_error” occurs when
• Transport stream packets with a PID referred to in a PMT but not contained in the transport
stream or
• Their repetition rate exceeds a user-definable limit which is usually 500 ms or less.
9-3.2 Priority 2 Parameters
(1) Transport_error: Every MPEG-2 transport stream packet contains a bit called Transport Error Indicator
which is transmitted right after the sync byte. This bit flags any errors in the transport stream packets at
the receiver. During the transmission, bit errors may occur for various reasons. If error protection (at least
Reed Solomon in DVB and ATSC) is no longer able to repair all errors in a packet, this bit is set indicating
this packet can no longer be utilized by the MPEG-2 decoder and must be discarded.
A transport_error occurs when:
• The transport error indicator bit in the TS header is set to 1.
(2) CRC_error: During transmission, all tables in the MPEG-2 transport stream, whether they are PSI tables or
other private tables according to DVB (SI tables) or according to ATSC (PSIP tables), are protected by a
CRC checksum. It is 32 bits long and transmitted at the end of each sector. Each sector, which can be
composed of many transport stream packets, is thus additionally protected. A CRC error has occurred if
these checksums don’t match the content of the actual section of the respective table. The MPEG-2
decoder must then discard this table content and wait for this section to be repeated.
A CRC_error occurs when:
• A table (PAT, PMT, CAT, NIT,...) in a section has a wrong checksum which doesn’t match its
content.
(3) PCR_repetition_error: The PCRs are used to re-generate the local 27 MHz system clock. If the PCRs are
not transmitted with sufficient regularity, then this clock may jitter or drift. The receiver/decoder may
even go out of lock. In DVB, a repetition period of not more than 100 ms is permitted, previously a max of
40ms was recommended.
A PCR_error occurs when
• The difference between two successive PCR values of a program is greater than 100 ms, and no
discontinuity is indicated in the adaptation field or Header Optional adaptation field, or
• The time interval between two packets with PCR values of a program is more than 40 ms.
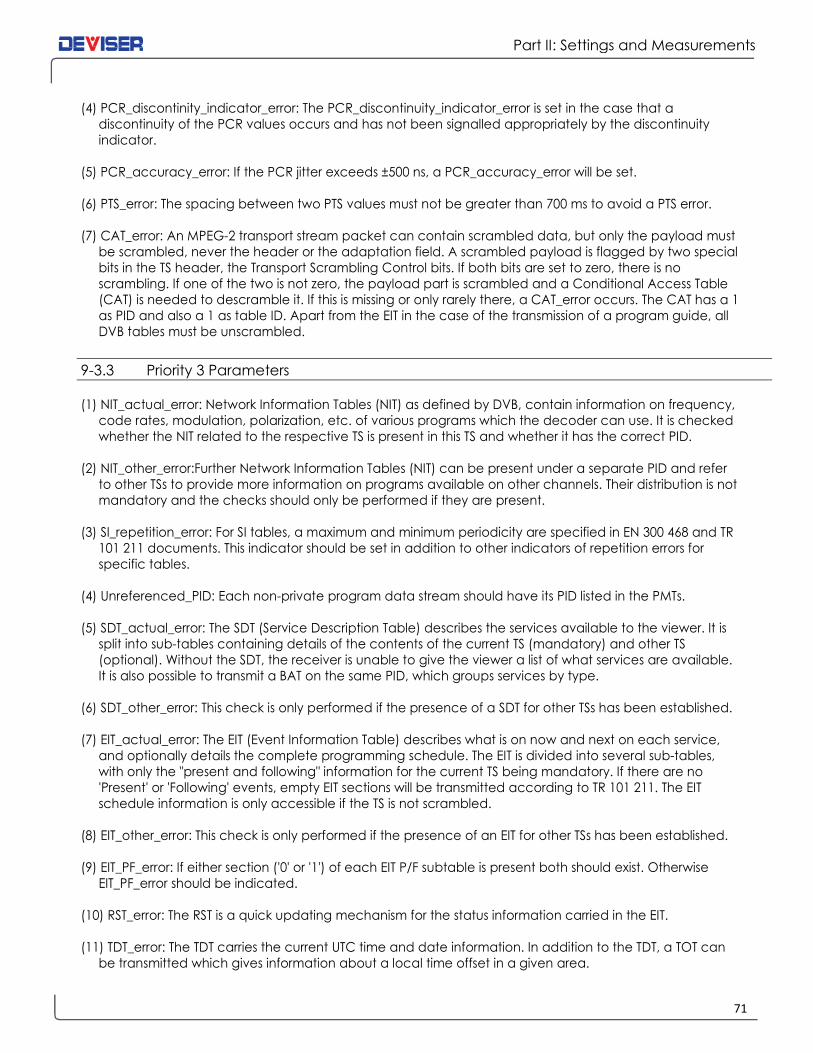
71
Part II: Settings and Measurements
(4) PCR_discontinity_indicator_error: The PCR_discontinuity_indicator_error is set in the case that a
discontinuity of the PCR values occurs and has not been signalled appropriately by the discontinuity
indicator.
(5) PCR_accuracy_error: If the PCR jitter exceeds ±500 ns, a PCR_accuracy_error will be set.
(6) PTS_error: The spacing between two PTS values must not be greater than 700 ms to avoid a PTS error.
(7) CAT_error: An MPEG-2 transport stream packet can contain scrambled data, but only the payload must
be scrambled, never the header or the adaptation field. A scrambled payload is flagged by two special
bits in the TS header, the Transport Scrambling Control bits. If both bits are set to zero, there is no
scrambling. If one of the two is not zero, the payload part is scrambled and a Conditional Access Table
(CAT) is needed to descramble it. If this is missing or only rarely there, a CAT_error occurs. The CAT has a 1
as PID and also a 1 as table ID. Apart from the EIT in the case of the transmission of a program guide, all
DVB tables must be unscrambled.
9-3.3 Priority 3 Parameters
(1) NIT_actual_error: Network Information Tables (NIT) as defined by DVB, contain information on frequency,
code rates, modulation, polarization, etc. of various programs which the decoder can use. It is checked
whether the NIT related to the respective TS is present in this TS and whether it has the correct PID.
(2) NIT_other_error:Further Network Information Tables (NIT) can be present under a separate PID and refer
to other TSs to provide more information on programs available on other channels. Their distribution is not
mandatory and the checks should only be performed if they are present.
(3) SI_repetition_error: For SI tables, a maximum and minimum periodicity are specified in EN 300 468 and TR
101 211 documents. This indicator should be set in addition to other indicators of repetition errors for
specific tables.
(4) Unreferenced_PID: Each non-private program data stream should have its PID listed in the PMTs.
(5) SDT_actual_error: The SDT (Service Description Table) describes the services available to the viewer. It is
split into sub-tables containing details of the contents of the current TS (mandatory) and other TS
(optional). Without the SDT, the receiver is unable to give the viewer a list of what services are available.
It is also possible to transmit a BAT on the same PID, which groups services by type.
(6) SDT_other_error: This check is only performed if the presence of a SDT for other TSs has been established.
(7) EIT_actual_error: The EIT (Event Information Table) describes what is on now and next on each service,
and optionally details the complete programming schedule. The EIT is divided into several sub-tables,
with only the "present and following" information for the current TS being mandatory. If there are no
'Present' or 'Following' events, empty EIT sections will be transmitted according to TR 101 211. The EIT
schedule information is only accessible if the TS is not scrambled.
(8) EIT_other_error: This check is only performed if the presence of an EIT for other TSs has been established.
(9) EIT_PF_error: If either section ('0' or '1') of each EIT P/F subtable is present both should exist. Otherwise
EIT_PF_error should be indicated.
(10) RST_error: The RST is a quick updating mechanism for the status information carried in the EIT.
(11) TDT_error: The TDT carries the current UTC time and date information. In addition to the TDT, a TOT can
be transmitted which gives information about a local time offset in a given area.
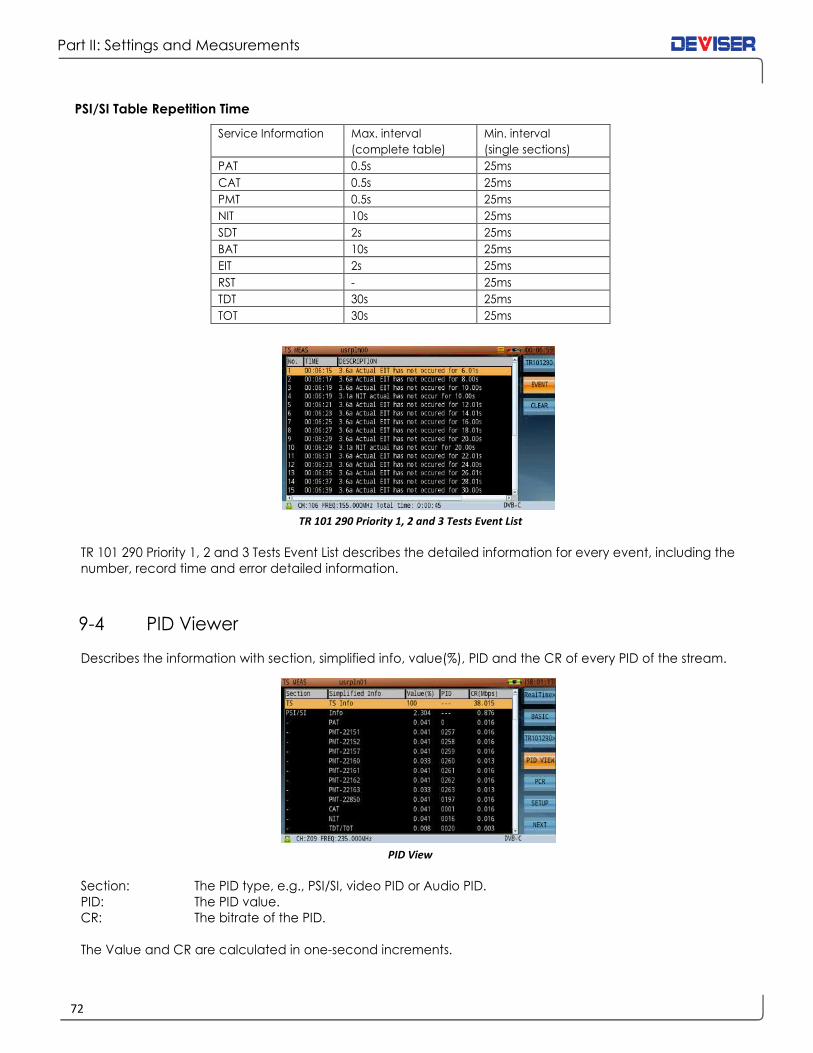
Part II: Settings and Measurements
72
PSI/SI Table Repetition Time
Service Information Max. interval
(complete table)
Min. interval
(single sections)
PAT 0.5s 25ms
CAT 0.5s 25ms
PMT 0.5s 25ms
NIT 10s 25ms
SDT 2s 25ms
BAT 10s 25ms
EIT 2s 25ms
RST - 25ms
TDT 30s 25ms
TOT 30s 25ms
TR 101 290 Priority 1, 2 and 3 Tests Event List
TR 101 290 Priority 1, 2 and 3 Tests Event List describes the detailed information for every event, including the
number, record time and error detailed information.
9-4 PID Viewer
Describes the information with section, simplified info, value(%), PID and the CR of every PID of the stream.
PID View
Section: The PID type, e.g., PSI/SI, video PID or Audio PID.
PID: The PID value.
CR: The bitrate of the PID.
The Value and CR are calculated in one-second increments.

73
Part II: Settings and Measurements
9-5 PCR Analysis
Displays the PCR accuracy and PCR interval of the selected program.
PCR Accuracy and PCR Interval Analysis
As shown above, the top half of the screen displays detailed PCR information in one transport stream,
including PCR PID, min/max accuracy and min/max interval. If the PCR doesn’t exist, ‘---’is displayed.
(Different programs can have the same PCR and/or each program can have its own PCR.)
Use the arrow keys to choose programs in the top half of the screen. PCR accuracy and PCR interval traces
display in the same area. The left vertical coordinates shows PCR accuracy coordinates in ns. The right
vertical coordinates shows PCR interval condinates in ms. Two red lines show the PCR accuracy limits. PCR
accuracy of the selected program should be within ±500 ns, and PCR interval between 0~40 ms.
9-6 Program List
Lists program information in ascending order of frequency in the current transport network. Available info
includes program number, frequency, SID, service name, CA, provider, and service type. Depending on the
encoding method, the program information may be displayed differently, so you might see the program
information of the selected frequency, or the program information of all frequencies. The CA may be
different from the real-time and PROG INFO subfunctions because they acquire the CA value differently.
The CA of this subfunction is retrieved from TS directly. Users can quickly find the corresponding channel
frequency program. When troubleshooting, the field engineer can more easily identify which QAM carrier
to focus on based on the particular program complaint from the customer.
Creating Program List Complete Creating Program List
A program list can be saved in the instrument’s memory, so that the next time the instrument is powered on,
users can directly recall the program list by pressing Start again. The old program list will be replaced by the
stored program list, even if the new list has not yet completed initialization.
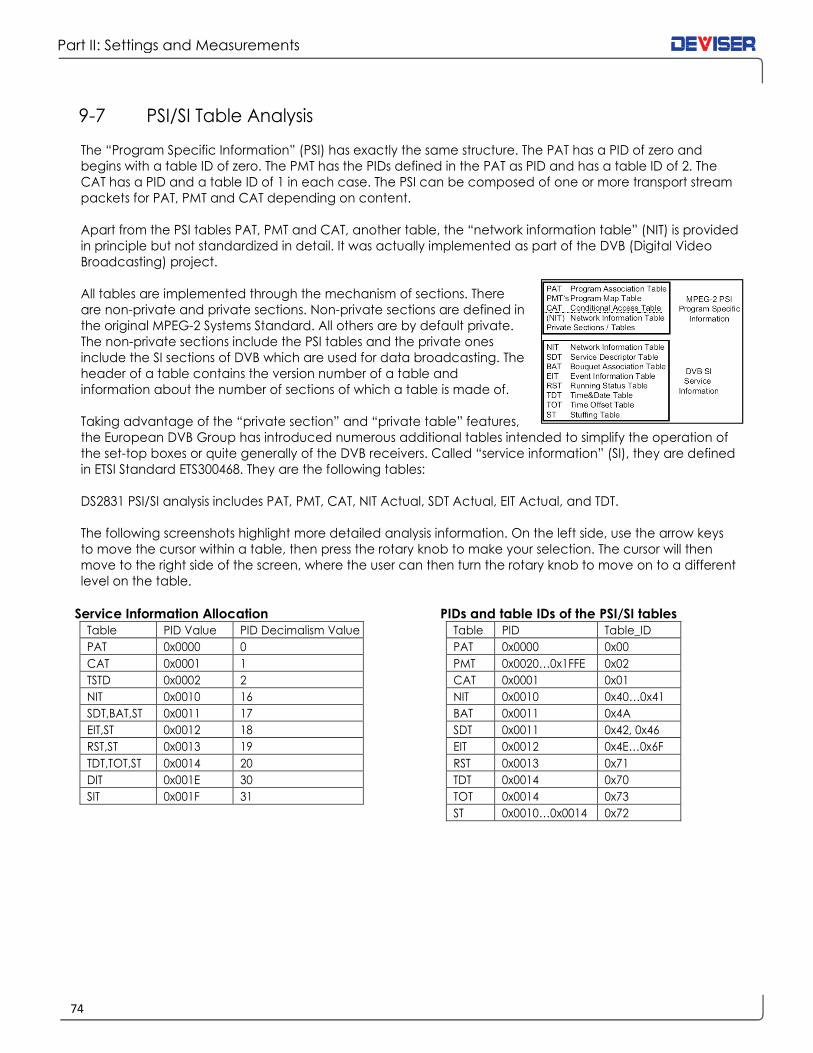
Part II: Settings and Measurements
74
9-7 PSI/SI Table Analysis
The “Program Specific Information” (PSI) has exactly the same structure. The PAT has a PID of zero and
begins with a table ID of zero. The PMT has the PIDs defined in the PAT as PID and has a table ID of 2. The
CAT has a PID and a table ID of 1 in each case. The PSI can be composed of one or more transport stream
packets for PAT, PMT and CAT depending on content.
Apart from the PSI tables PAT, PMT and CAT, another table, the “network information table” (NIT) is provided
in principle but not standardized in detail. It was actually implemented as part of the DVB (Digital Video
Broadcasting) project.
All tables are implemented through the mechanism of sections. There
are non-private and private sections. Non-private sections are defined in
the original MPEG-2 Systems Standard. All others are by default private.
The non-private sections include the PSI tables and the private ones
include the SI sections of DVB which are used for data broadcasting. The
header of a table contains the version number of a table and
information about the number of sections of which a table is made of.
Taking advantage of the “private section” and “private table” features,
the European DVB Group has introduced numerous additional tables intended to simplify the operation of
the set-top boxes or quite generally of the DVB receivers. Called “service information” (SI), they are defined
in ETSI Standard ETS300468. They are the following tables:
DS2831 PSI/SI analysis includes PAT, PMT, CAT, NIT Actual, SDT Actual, EIT Actual, and TDT.
The following screenshots highlight more detailed analysis information. On the left side, use the arrow keys
to move the cursor within a table, then press the rotary knob to make your selection. The cursor will then
move to the right side of the screen, where the user can then turn the rotary knob to move on to a different
level on the table.
Service Information Allocation
Table PID Value PID Decimalism Value
PAT 0x0000 0
CAT 0x0001 1
TSTD 0x0002 2
NIT 0x0010 16
SDT,BAT,ST 0x0011 17
EIT,ST 0x0012 18
RST,ST 0x0013 19
TDT,TOT,ST 0x0014 20
DIT 0x001E 30
SIT 0x001F 31
PIDs and table IDs of the PSI/SI tables
Table PID Table_ID
PAT 0x0000 0x00
PMT 0x0020…0x1FFE 0x02
CAT 0x0001 0x01
NIT 0x0010 0x40…0x41
BAT 0x0011 0x4A
SDT 0x0011 0x42, 0x46
EIT 0x0012 0x4E…0x6F
RST 0x0013 0x71
TDT 0x0014 0x70
TOT 0x0014 0x73
ST 0x0010…0x0014 0x72

75
Part II: Settings and Measurements
PSI/SI Analysis-PAT Table PSI/SI Analysis-PMT Table
PSI/SI Analysis-CAT Table PSI/SI Analysis-NIT Table
PSI/SI Analysis-SDT Table PSI/SI Analysis-EIT Table
PSI/SI Analysis-TDT Table

Part II: Settings and Measurements
76
9-8 PSI/PSIP Table Analysis
Like the SI tables, DVB & ATSC also provide PSIP (Program and System Information Protocol) tables.
PSIP stands for "program and system information protocol" and represents a similar store of information to
that given on DVB SI. In ATSC, the following tables are used: the Master Guide Table (MGT), the Event
Information Table (EIT), the Extended Text Table (ETT), the System Time Table (STT), the Rating Region Table
(RRT), and the Cable Virtual Channel Table (CVCT) or the Terrestrial Virtual Channel Table (TVCT).
According to ATSC, the PSI tables defined in MPEG-2 and provided in the MPEG Standard are used for
accessing the video and audio streams, i.e. the transport stream carries one PAT and several PMTs. The
conditional access information is also referenced via a CAT.
The actual ATSC tables are implemented as “private tables”. The Master Guide Table, contains the PIDs for
some of these ATSC tables. The Master Guide Table can be recognized by the packet ID = 0x1FFB and the
table ID = 0xC7. The transport stream must contain at least four Event Information Tables (EIT-0, EIT-1, EIT-2,
EIT-3) and the PIDs for these EITs are found in the Master Guide Table. Up to 128 further Event Information
Tables are possible but also optional. An EIT contains a 3-hour section of an electronic program guide
(EPG). Together with the 4 mandatory EITs, it is possible to cover a period of 12 hours. Furthermore, Extended
Text Tables may optionally be accessed through the MGT. Each existing Extended Text Table (ETT) is
allocated to one EIT. Thus, e.g. ETT-0 contains extended text information for EIT- 0. It is possible to have up to
a total of 128 ETTs.
PSIP Table ID Ranges and Value
Table PID Table ID Value (hex)
Program Association Table (PAT) 0x0 0x0
Program Map Table (PMT) per PAT 0x2
Conditional Access Table (CAT) 0x1 0x1
Master Guide Table (MGT) 0x1FFB 0xC7
Terrestrial Virtual Channel Table
(TVCT)
0x1FFB 0xC8
Cable Virtual Channel Table (CVCT) 0x1FFB 0Xc9
Rating Region Table (RRT) 0x1FFB 0xCA
Event Information Table (EIT) per MGT 0xCB
Extended Text Table (ETT) per MGT 0xCC
System Time Tables (STT) 0x1FFB 0xCD
In the Virtual Channel Table, which can be present either as Terrestrial Virtual Channel Table (TVCT) or as
Cable Virtual Channel Table (CVCT) depending on the transmission path, identification information for the
virtual channels, i.e. programs, contained in a multiplexed transport stream are transmitted. The VCT
contains, among other things, the program names. The VCT is thus comparable to the SDT table in DVB.
In the System Time Table (STT), all the necessary time information is transmitted. The STT can be recognized
by the packet ID = 0x1FFB and the table ID = 0xCD. In the STT, the GPS (Global Positioning System) time and
the time difference between GPS time and UTC (Universal Time Coordinated (= GMT)) is transmitted. The
Rating Region Table (RRT) can be used for restricting the size of the audience in terms of age or region. In
addition to the information about region (e.g. a Federal State in the US), information relating to the
minimum age set for the program currently being broadcast is also included. Using the RRT, a type of
parental lock can be implemented in the set-top box. The RRT is recognized by the packet ID = 0x1FFB and
the table ID = 0xCA.

77
Part II: Settings and Measurements
The PIDs and Table IDs of the PSIP tables are listed in Table: PSIP Table ID Ranges and Value.
ATSC PSIP tables
PSIP table hierarchy ETTs carry text messages for describing virtual channels and events.
PSI/PSIP Analysis-PAT Table PSI/PSIP Analysis-PMT Table
PSI/PSIP Analysis-CAT Table PSI/PSIP Analysis-MGT Table

Part II: Settings and Measurements
78
PSI/PSIP Analysis-VCT Table PSI/PSIP Analysis-EIT Table
PSI/PSIP Analysis-ETT Table PSI/PSIP Analysis-STT Table
9-9 Data Capture
Data Capture
The image above shows captured transport package data according to PID value. This function divides the
PID into six types: video, audio, PCR, PSI/SI, ECM/EMM and DATA. Choose a type and press the rotary knob
to confirm; the related PID value will display in PID position. Next, input a capture number (up to 255). Press
Start (F1) to capture data. Press Clear (F2) to clear all captured data.
The left pane displays captured data files; their contents appear on the right in hexadecimal format. Use
the rotary knob to highlight a file in order to view its contents.
Note that the data capture function only supports real-time capture.

79
Part II: Settings and Measurements
TR 101 290 Priority 1, 2 and 3 Parameter Limits
You can set measurement limits on TR 101 290 Priority 1, 2 and 3 tests, applying them to real-time TS analysis.
(See above.) Closing and re-opening the TS analysis mode will reset all limits back to default values.
PSI/SI Table Repetition Time
Service Information Max. interval
(complete table)
Min. interval
(single sections)
PAT 0.5s 25ms
CAT 0.5s 25ms
PMT 0.5s 25ms
NIT 10s 25ms
SDT 2s 25ms
BAT 10s 25ms
EIT 2s 25ms
RST - 25ms
TDT 30s 25ms
TOT 30s 25ms
Channel Parameters Setup Other Parameters Setup
You can select from two standards: DVB and ATSC.
Choose DVB to view PSI/SI analysis, and ATSC to view
PSI/PSIP analysis (shown, right).
DVB (PSI/SI: Program Specific Information/ Service
Information)
ATSC (PSI/PSIP: Program Specific Information /Program
and System Information Protocol)

Part II: Settings and Measurements
80
For data format, you can select either decimalism or hexadecimal. Their
PID values are 514 and 0x202, respectively.
Note that you must select the correct character encoding according to
your local operator’s preferred language and region. If an incorrect
data format is used, the parser program will show garbled information.
Simply use the "Auto Detect" option to automatically recognize the
proper character encoding.
Auto Detects Romanian (ISO 8859-16)
West European (ISO 8859-15) Celtic (ISO 8859-14)
Baltic (ISO 8859-13) Thai (ISO 8859-11)
North European (ISO 8859-10) West European & Turkish (ISO
8859-9)
Latin/Hebrew (ISO 8859-8) Latin/Greek (ISO 8859-7)
Latin/Arabic (ISO 8859-6) Latin/Cyrillic (ISO 8859-5)
North (-East) European (ISO 8859-4) South European (ISO 8859-3)
East European (ISO 8859-2) West European (ISO 8859-1)
Simplified Chinese (GB-2312-1980) GBK
GB18030-0 Traditional Chinese (Big5 subset)
EUC-KR JISX0201-0
JISX0208-0 JISX0201-1
JISX0208-1 UTF-8
UTF-16 LE UTF-16 BE
The filter has two options: "video+audio" or "all". The filter only takes effect for the signal channel program list
and overall program list. Some transport streams only include the audio signal in the network; choosing
"video+audio" for these may filter the audio signal, possibly preventing the audio program from appearing
in the the program list.

81
Part II: Settings and Measurements
Chapter 10: Downstream Spectrum Analysis
The spectrum frequency band of the DS2831 covers cable, terrestrial and satellite frequency bands. The
following sections contain instructions for setting up spectrum analysis functions.
Press Downstream (F1) in the home screen and tap Spectrum to launch the application.
The spectrum analysis function is one of the primary, basic and most powerful functions of the DS2831.
For several decades, it has been suggested that a good spectrum analyzer is one of the most effective
troubleshooting tools a field CATV engineer can use to help identify impairments on a HFC network.
Spectrum Analyzer Display Overview
In the spectrum analysis mode, use the rotary knob or touchscreen to select a measurement parameter.
Edit with the keypad or arrow keys, then confirm by pressing the rotary knob or Enter to set. Refer to the
numbered figure and associated definitions below.
1. Channel plan name.
2. Start frequency.
3. Stop frequency.
4. Resolution bandwidth filter. (RBW)
5. Video bandwidth filter. (VBW)
6. Sweep time.
7. Detector mode.
8. Reference level.
9. Graph display scale, in dB per division.
10. Amplitude scale.
11. Markers.
12. During simultaneous spectrum & QAM analysis, the lock icon is red (QAM signal
locked) or green (unlocked).
13. Pre-amplifier: icon appears when pre-amp is activated. Otherwise empty.
14. Spectrum analysis mode: DFT or FFT.
15. Attenuation level.
16. Frequency and level of marker A.
17. Frequency and level of marker B.
18. Delta variation between marker A and B (in frequency and level).
19. Active trace: up to 4 traces can appear at once on the DS2831. Only 1 trace is controlled at a time.
20. Test Point Compensation. (TP)
21. Multi-function soft-keys: a button followed by an arrow “>” means there is a sub-menu available. A button with a bracket “[ ]” means the button offers multi-functions.
The 7 function keys (F1-F7) on the first level menu represent the frequency, amplitude, bandwidth/sweep,
marker, trace, detector and display control parameter settings.

Part II: Settings and Measurements
82
10-1 Frequency Settings
Press FREQ (F1) to enter the frequency menu. From there, you can access the various submenus by pressing
F1-F7 (shown below). Some parameters, such as the center frequency (4-1220 MHz, or 4-2150 MHz if the
frequency extension option has been purchased), can be manually entered with the numerical keypad or
adjusted with the arrow keys. The default frequency step is 10MHz but can be manually changed to 100kHz,
250kHz, 1MHz, 50MHz, 100MHz, or CH (based on active channels in the active channel plan). Press the
rotary knob to confirm your setting.
Frequency and Span Setting Menu
10-1.1 Span Settings
In the same submenu for Frequency, press Span (F5) to set the span with the numerical keypad. You can
also adjust the current value with the arrow keys (10 MHz step). Press the rotary knob to confirm. (Max span
range is 0-1216 MHz, or –2146 MHz if the frequency extension option has been purchased). The span can
also be set automatically by dialing in the start/stop frequency.
10-2 Amplitude Settings
Amplitude settings include reference level, attenuator, unit & scale reference, and pre-amplifier on/off.
10-2.1 Setting the Reference Level
The reference level can range from -80 ~ +70dBmV and is displayed at the top of the display window (REF).
In the amplitude submenu, press the Reference (F1), then use the arrow keys to change the reference level
value in steps of 10dB.
10-2.2 Setting the Attenuator
There are two ways to set the attenuator: manual or automatic. In manual mode, an asterisk (*) will appear
before the attenuator icon at the bottom of the screen.
In the amplitude submenu, press ATT> (F2) to enter the attenuation submenu. If the attenuator is currently
set to automatic, press Auto (F1) to toggle it to manual, or vice-versa. To manually control the attenuator,
set it to Manual and press Input (F2) to input the attenuation value with the numerical keypad (within 1dB).
Press the rotary knob to confirm your selection. Press INC (F3)or DEC (F4) to increase or decrease the value.
The adjustable range of the attenuator is 0- 30dB. Pressing the arrow keys adjusts attenutation by 5dB.

83
Part II: Settings and Measurements
Amplitude Setting Menu - Attenuator
10-2.3 Setting the Pre-Amplifier
Press AMPL> (F2), then AMP (F5) to toggle the pre-amplifier ON (orange) and OFF (blue). When the pre-
amplifier is on, an amplifier icon will appear at the lower left corner of the screen.
10-2.4 Setting the Amplitude Scale and Unit
Press AMPL> (F2) and then Scale (F4) to open the scale setting sub-menu. The default value is 10dB/division.
Divisions of 1, 2, 5, 10, and 20dB are available.
Amplitude Setting Menu – Unit, Scale & Amplifier
Still in the Amplitude menu, press Unit (F3) to open the unit setting sub-menu. You may choose dBµV, dBmV,
or dBm. For your convenience, conversion factors are listed below.
dBm = dBµV - 108.8
dBmV = dBµV - 60
dBm = dBmV - 48.8

Part II: Settings and Measurements
84
10-3 RBW & VBW Bandwidth/Sweep Setting
In this section, we cover procedures for setting up RBW, VBW and sweep time values; spectrum calculation
mode; and trace hold features.
10-3.1 Resolution Bandwidth (RBW) Filter
The RBW filters can be used in manual or automatic mode. In manual mode, an asterisk (*) appears before
the RBW parameter at the top of the screen.
Press BW/SWP> (F3) to enter the submenu and then RBW> (F1). Select Auto to allow the DS2831 to choose a
suitable RBW according to sweep speed, span and VBW selections, or Manual to choose an RBW from the
following choices: 1 kHz, 3 kHz, 10 kHz, 30 kHz, 100 kHz, 300 kHz, 1 MHz and 3 MHz.
Bandwidth/Sweep Menu
10-3.2 Video Bandwidth (VBW) Filter
The VBW can be used in manual and automatic mode. In manual mode, an asterisk (*) appears before the
VBW parameter under the RBW parameter at the top of the screen.
Press BW/SWP> (F3) to enter the submenu and then VBW> (F2). ). Select Auto to allow the DS2831 to choose
a suitable VBW according to sweep speed, span and RBW selections, or Manual to choose a VBW from the
following choices: 1 kHz, 3 kHz, 10 kHz, 30 kHz, 100 kHz, 300 kHz, 1 MHz and 3 MHz.
10-3.3 Sweep Time (SWP)
There are two ways to set the sweep time: manual and automatic. In manual mode, an asterisk (*) appears
before the sweep time parameter.
Press BW/SWP> (F3) to enter the submenu and then Sweep> (F3). Select Auto to allow the DS2831 to choose
a suitable sweep time according to the active Span, VBW and RBW settings, or Manual to choose a sweep
speed using the arrow keys in steps of 10ms. Press the rotary knob to confirm.
Spectrum analyzers normally couple sweep time, span setting and resolution bandwidth selections
automatically. This allows the signal to be measured enough time to achieve full amplitude within the RBW
for an accurate & calibrated measurement. If any of the parameters are not in “sync”, an “UNCAL”
message will appear in the status bar at the bottom of the screen.
WARNING
For less experienced users: changing RBW, VBW, and sweep time settings in manual mode
may produce inaccurate measurement results. If analyzer measurements are uncalibrated
because of faulty relation between RBW, VBW, and sweep time settings, an "uncal" message will appear in the bottom toolbar."

85
Part II: Settings and Measurements
Control and spectrum calculation mode
The DS2831 offers two spectrum calculation modes, FFT and DFT. The DFT is the foundation of FFT, and the
FFT is the fast algorithm of DFT. Every result calculated with DFT represents a pixel point of the spectrum
trace, while every result calculated with FFT represents a segment of the spectrum trace. If a faster sweep
speed is required, the FFT mode is better suited for the task. In the digital persistence mode introduced later,
only the FFT mode can be used.
Spectrum hold mode
While in the DS Spectrum analyzer mode, press F7 to reveal the Hold button. This pauses the trace for
analysis. Press Hold again to resume normal operation.
Auto Sweep Time Manual Modify Sweep Time Cause UNCAL Information
10-4 Markers
The DS2831 offers two markers; A and B.
Press Mark (F4) to enter the submenu.
Then press F1 to toggle between Mark
A and Mark B. Only one can be active
at a time.
Peak Search Automatically finds the highest
amplitude peak on the spectrum
analyzer trace (below, left).
Next Peak Automatically finds the next highest amplitude peak on the spectrum analyzer trace (below, right).

Part II: Settings and Measurements
86
Marker to center frequency Moves the active marker to the center frequency of the spectrum trace (shown above).
Marker -> REF Moves the active marker to the reference level (shown below).
10-5 Trace Setting
The DS2831 can display 4 traces simultaneously. The display settings are: max. hold, min. hold, average and
normal. Each trace is actively displayed on the screen, individually or simultaneously, each with a different
color, 1, 2, 3 or 4 traces at a time. You can toggle in a circular way when pressing F1 repeatedly. Press Write
(F2) to activate the desired trace. Press Blank (F4) to deactivate and turn off the current trace. Each trace
is identified at the bottom right (1-2-3-4) to the left of the TP value. In any of the Spectrum Analysis modes,
the number highlighted in black at the bottom right is the active (controllable) trace.
Four Traces Display Simultaneously Trace Setting Menu
Max Hold, Min Hold, and Average Trace Press Trace (F5) to enter the submenu. Here, Max Hold, Min Hold, Average or normal trace (Write) behavior
can be applied to the trace display mode.
Am
plitu
de
Am
plitu
de

87
Part II: Settings and Measurements
10-6 Detector Type Setting
Press Detector> (F6) to enter the detector mode submenu. Here, you may choose 1 of 5 detector modes:
• SAM (sample detector, F1)
• POS (Positive peak detector, F2)
• AVG (Average detector, F3)
• NEG (Negative peak detector, F4)
• RMS (Root mean square detector, F5).
Detector Mode Setting
10-7 Display Mode Setting
Display Mode Setting
The spectrum analysis function offers 4 display modes: curve, solid, spectrogram, and combined Curve/
Spectrogram. Press Display> (F7) to enter the submenu, then press Curve (F1), Solid (F2), SPO (F3), or
CRV+SPO (F4) to select your desired display mode.
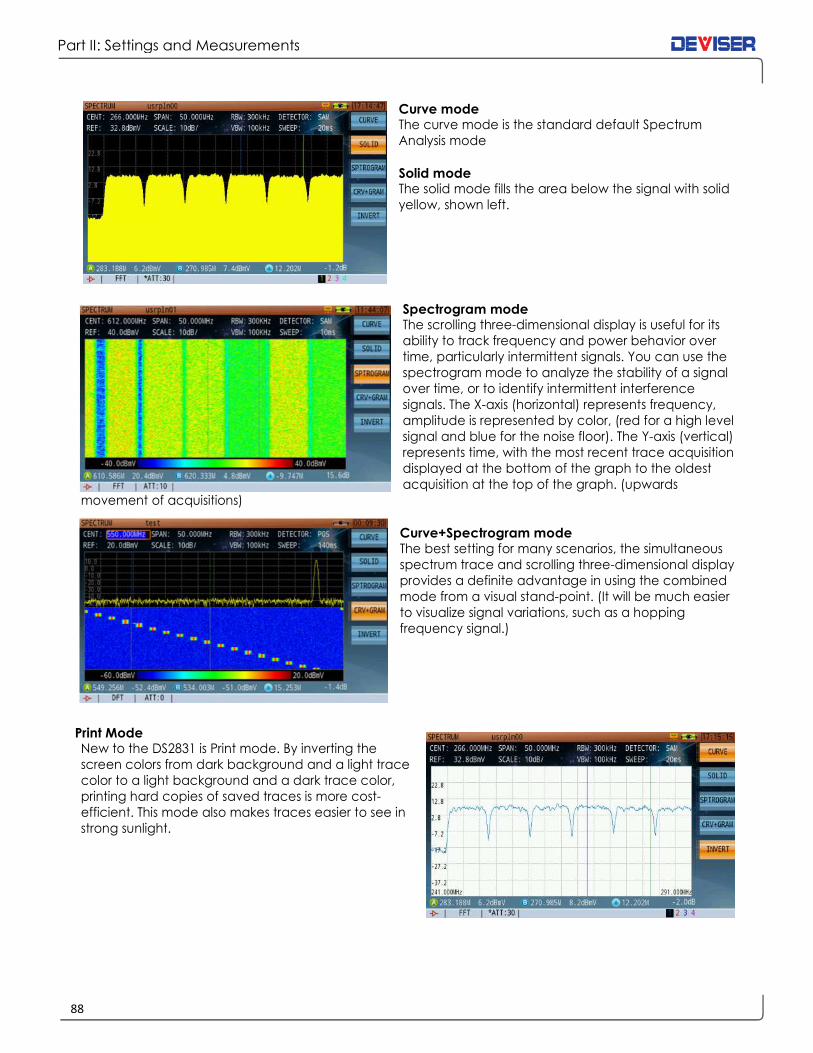
Part II: Settings and Measurements
88
Curve mode The curve mode is the standard default Spectrum
Analysis mode
Solid mode The solid mode fills the area below the signal with solid
yellow, shown left.
Spectrogram mode The scrolling three-dimensional display is useful for its
ability to track frequency and power behavior over
time, particularly intermittent signals. You can use the
spectrogram mode to analyze the stability of a signal
over time, or to identify intermittent interference
signals. The X-axis (horizontal) represents frequency,
amplitude is represented by color, (red for a high level
signal and blue for the noise floor). The Y-axis (vertical)
represents time, with the most recent trace acquisition
displayed at the bottom of the graph to the oldest
acquisition at the top of the graph. (upwards
movement of acquisitions)
Curve+Spectrogram mode The best setting for many scenarios, the simultaneous
spectrum trace and scrolling three-dimensional display
provides a definite advantage in using the combined
mode from a visual stand-point. (It will be much easier
to visualize signal variations, such as a hopping
frequency signal.)
Print Mode New to the DS2831 is Print mode. By inverting the
screen colors from dark background and a light trace
color to a light background and a dark trace color,
printing hard copies of saved traces is more cost-
efficient. This mode also makes traces easier to see in
strong sunlight.
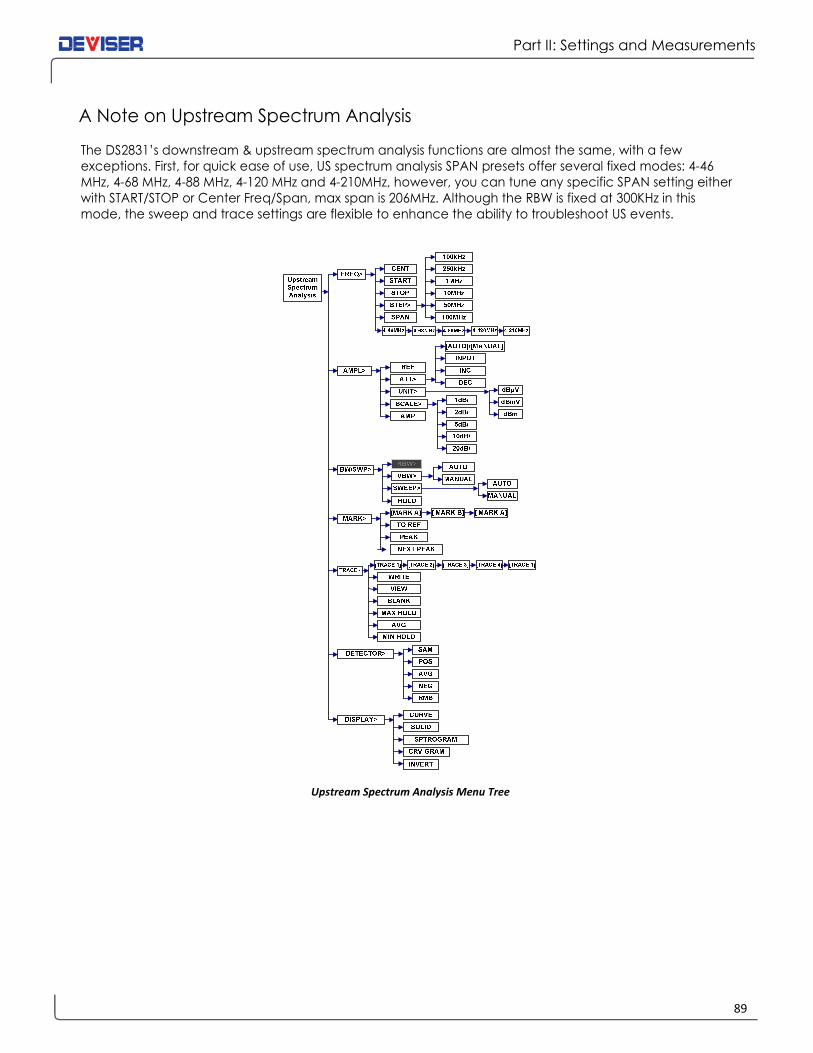
89
Part II: Settings and Measurements
A Note on Upstream Spectrum Analysis
The DS2831’s downstream & upstream spectrum analysis functions are almost the same, with a few
exceptions. First, for quick ease of use, US spectrum analysis SPAN presets offer several fixed modes: 4-46
MHz, 4-68 MHz, 4-88 MHz, 4-120 MHz and 4-210MHz, however, you can tune any specific SPAN setting either
with START/STOP or Center Freq/Span, max span is 206MHz. Although the RBW is fixed at 300KHz in this
mode, the sweep and trace settings are flexible to enhance the ability to troubleshoot US events.
Upstream Spectrum Analysis Menu Tree

Part II: Settings and Measurements
90
Chapter 11: Persistence Analysis
11-1 Introduction to Persistence Theory
Spectrum persistence analysis is the latest in digital processing technology, usually found in much more
expensive equipment. With the DS2831 and other powerful test equipment, Deviser has introduced this
technology into more cost-effective equipment, providing an ideal solution for CATV operators.
Persistence testing can capture a “bursty” (interfering-undesired) signal hiding under a bursty Bonded US
DOCSIS (desired) signal – or even Common Path distortions whose low levels make them difficult to detect.
Traditional spectrum analysis is often incapable of isolating these undesired interfering signals unless desired
signal transmissions are turned off. Persistence technology captures “bursty” signals and displays them in an
easy-to-read display.
Interfering lower level bursty signals are often found under the desired signals, and detection can pose a
significant challenge. Persistence technology can help you capture, isolate and visualize hard-to-find
signals, similar to the EVS function (Section 8-5). EVS technology is used to find those continued broadcast
QAM signal covered interference signals at higher frequencies, while persistence technology is mostly used
to find those TDMA covered interference signals.
For a more thorough treatment of the DS2831’s DPS function, see the Application Note: A Study of Digital
Persistence Analysis (pg. 159) following Chapter 28 of this user guide.
11-2 Introduction to Persistence Technology
To open the Persistence function from the Home menu, first press Upstream (F2) then select DPS.
A persistence waveform is a bitmap, not a trace. In this mode, every pixel uses a different color (shown
below), based on how often the signal occupies the same pixel. A “cold” color (blues and indigos) shows a
pixel with less signal presence, and a “warm” color (reds and oranges) shows a pixel with a high presence
of signal. In the DPS display mode, when the sweep time is increased or decreased, the waveform color
display will dynamically adapt to the new setting in a real time mode. In the DPS mode, the sweep time
range is 20ms to 25secs.
Persistence principle
Persistence Wave Color Display Range

91
Part II: Settings and Measurements
As shown below, when viewing a DOCSIS upstream channel in the normal spectrum analysis mode, you
can only see the noise floor and the DOCSIS upstream signal transmission. Using the persistence mode, you
can easily and clearly identify both the DOCSIS upstream signal transmission and the underlying low level
interference signal normally covered by upstream signal and otherwise undistinguishable interference
signal. It is important to note that this method identifies the interference signal without service interruptions.
Low-Level Signals Covered by High-Level Signal Persistence Shows Ingress Signal Covered by DOCSIS Upstream Signal
11-3 Introduction to Persistence Application
In the Persistence mode, 4 markers are available: 2 vertical and 2 horizontal. When MARK A is highlighted,
vertical marker A is controlled with the rotary knob, and the horizontal marker with the arrow keys. In this
mode, because the measurement is made over a pre-selected period of time buffer, the amplitude range
of the same signal cannot be measured by a single vertical marker at any given frequency. Hence, the
need to use the horizontal marker to evaluate the level of the interference carrier.
It is recommended to use the vertical marker to best tune on the interferer frequency, and the horizontal
marker to measure the level of the interferer. Once the horizontal marker has been set to the peak level of
the interferer, press To Ref (F2) to set the horizontal marker as the reference level.
The persistence mode is fixed at sample detection by default. RBW and VBW are also fixed at 300 kHz each.
FFT sweep mode is also used by default and cannot be changed.
11-4 Persistence Recording
Persistence recording is related to several parameters. Possible values are listed where applicable.
Sweep Time: 100 ~ 5000ms.
Record Frames: 50 frames max.
Max Saved Files: 5 files.
The DS2831 offers two persistence recording methods: normal record and trigger record.
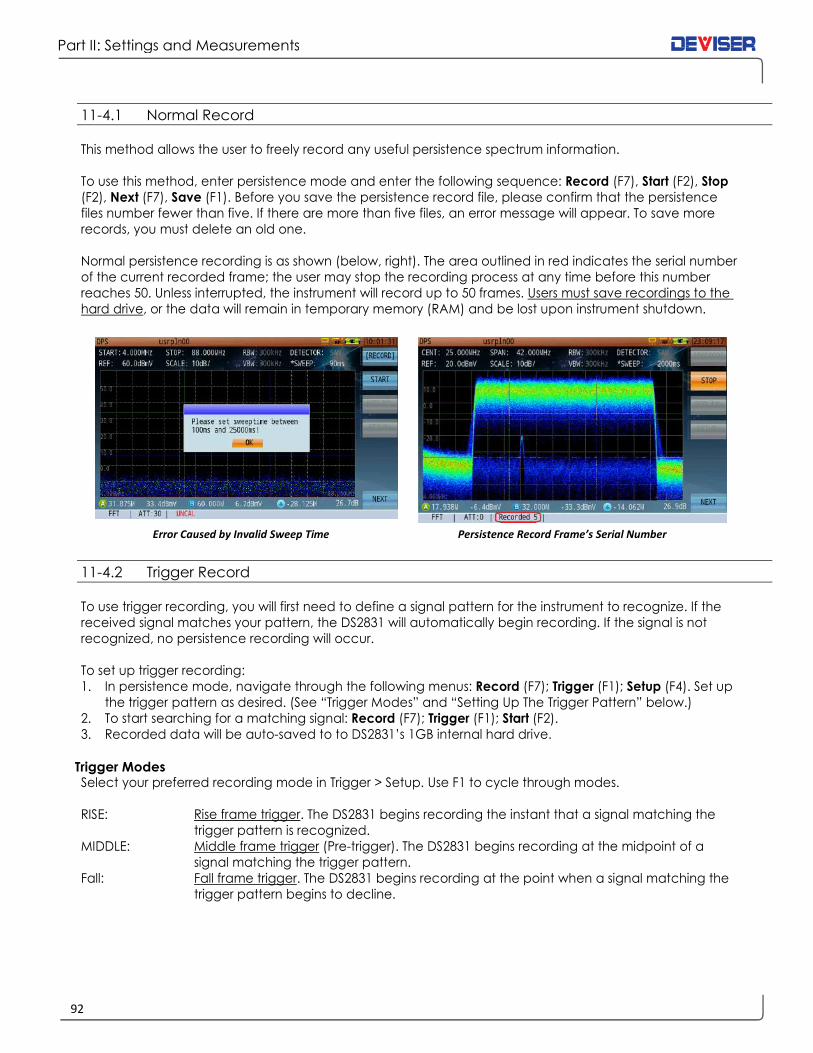
Part II: Settings and Measurements
92
11-4.1 Normal Record
This method allows the user to freely record any useful persistence spectrum information.
To use this method, enter persistence mode and enter the following sequence: Record (F7), Start (F2), Stop
(F2), Next (F7), Save (F1). Before you save the persistence record file, please confirm that the persistence
files number fewer than five. If there are more than five files, an error message will appear. To save more
records, you must delete an old one.
Normal persistence recording is as shown (below, right). The area outlined in red indicates the serial number
of the current recorded frame; the user may stop the recording process at any time before this number
reaches 50. Unless interrupted, the instrument will record up to 50 frames. Users must save recordings to the
hard drive, or the data will remain in temporary memory (RAM) and be lost upon instrument shutdown.
Error Caused by Invalid Sweep Time Persistence Record Frame’s Serial Number
11-4.2 Trigger Record
To use trigger recording, you will first need to define a signal pattern for the instrument to recognize. If the
received signal matches your pattern, the DS2831 will automatically begin recording. If the signal is not
recognized, no persistence recording will occur.
To set up trigger recording:
1. In persistence mode, navigate through the following menus: Record (F7); Trigger (F1); Setup (F4). Set up
the trigger pattern as desired. (See “Trigger Modes” and “Setting Up The Trigger Pattern” below.)
2. To start searching for a matching signal: Record (F7); Trigger (F1); Start (F2).
3. Recorded data will be auto-saved to to DS2831’s 1GB internal hard drive.
Trigger Modes Select your preferred recording mode in Trigger > Setup. Use F1 to cycle through modes.
RISE: Rise frame trigger. The DS2831 begins recording the instant that a signal matching the
trigger pattern is recognized.
MIDDLE: Middle frame trigger (Pre-trigger). The DS2831 begins recording at the midpoint of a
signal matching the trigger pattern.
Fall: Fall frame trigger. The DS2831 begins recording at the point when a signal matching the
trigger pattern begins to decline.

93
Part II: Settings and Measurements
Trigger Recording Setup
Trigger Condition In the figure above, the purple rectangle indicates the trigger condition. If the signal amplitude is higher
than the amplitude range covered by this area, or if the signal enters the trigger area from the left or right
sides, then persistence recording will not trigger. Recording will only occur if the signal enters the "rectangle
from below, and does not reach higher than the top side. If these conditions are met, the signal will trigger
the persistence recording function.
Setting Up the Trigger Pattern 1. In Record > Trigger > Setup, press Min Freq (F2) and use the arrow keys to shift the rectangle’s left side
(minimum frequency) left or right. You can also turn the rotary knob for more sensitive adjustments, 10%
the speed of the arrow keys. Then press Max Freq (F3) and define the rectangle’s right side (maximum
frequency).
2. Press Max Level (F4) and use the arrow keys and rotary knob to shift the rectangle’s top side (max signal
level) up or down. Then press Min Level (F5) and define the rectangle’s bottom side (min. signal level).
3. Press Move (F6). Here, you can adjust the entire trigger zone’s position on the measurement grid. Use
the arrow keys to move it up or down, and the rotary knob to move it left or right.
11-4.3 Playing Back Persistence Recordings
To play back a recording, enter the following sequence: Record (F7); Next (F7); Load (F2). Choose one of
the listed recordings and click the rotary knob to confirm. Go back to the last menu page (F7) and press
Replay (F3) to view the recording.
You can view recordings at normal speed by pressing Cont (F1), or use the Next (F2) and Prev (F3) keys to
examine the current recording frame-by-frame. The current frame number and timestamp are displayed at
the bottom of the screen.
Alternatively, you can view recordings on a PC with the proper software. Contact Deviser Instruments for
more information.
Playback Persistence Record
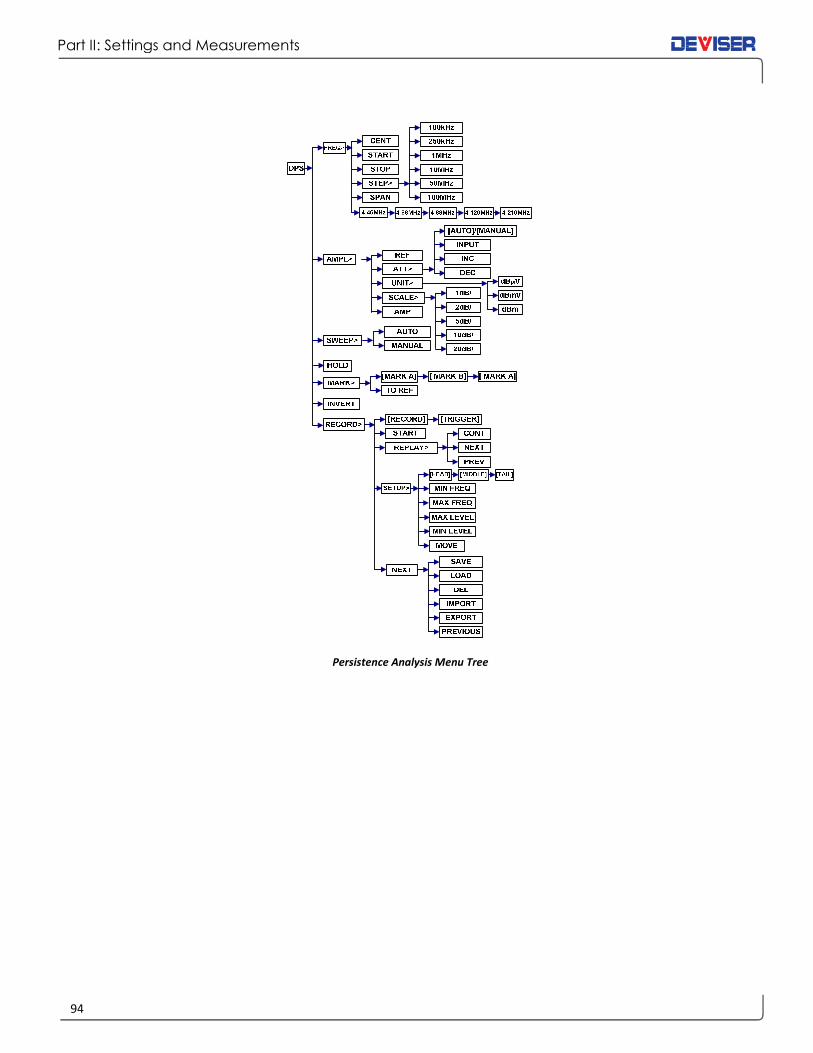
Part II: Settings and Measurements
94
Persistence Analysis Menu Tree

95
Part II: Settings and Measurements
Chapter 12: Reverse Path Sweep
This chapter provides instructions and test principles, parameters, setup methods, to connect the DS2831
sweep function with the DS1610: Deviser’s HE return sweep receiver.
12-1 System Architecture
As shown (right), the DS1610-1D upstream
receiver at the headend (or hub) receives
FSK modulated communication data and
RF discrete frequency points, which are
transmitted upstream by the DS2831. In the
downstream direction, the DS1610 sends
data back to up to 4 DS2831 units deployed
to the field via the DS1615 FSK modulator –
broadcasting received DS2831 data back
upstream to the DS2831s in the field.
Each unit receives only its own data (IDed
by serial number). The RF and COM ports of
DS2831 are well identified as (COM) for
upstream USG transmission and FSK
communication, (RF IN) for the downstream spectrum receiver.
12-2 Operation Principle
The DS1610 uses TDMA and half-duplex communication methods to manage multiple DS2831 units. One
DS1610 will connect with up to four DS2831 field units in quasi-real-time at once, and communicates with
one of these units at a time.
The registration process is controlled by the DS1610. The two devices are synchronized with FSK pilot carriers.
When a new DS2831 sends a registration request (in the form of a pilot signal transmission) in the upstream
path to the DS1610, the DS1610 briefly interrupts communication with all other connected instruments and
processes the new DS2831's request. Once registered, the DS2831 will receive a confirmation from the
DS1610. If the DS2831 doesn’t receive this confirmation within a fixed period, it will automatically re-transmit
its request. The DS1610 listens for registration requests in real time at the pilot frequency, detecting received
signals whether or not the pilot carrier from DS2831s or DS2500Cs are at the preferred range level.
When a pilot signal is detected, the system automatically enters the registration process. A bi-directional
FSK communication is initiated to establish communication and allow data transmission at that frequency
channel. Note that the DS1610 and DS2831 must use the same FSK pilot frequency for US & DS
communication; otherwise, the registration process will fail.

Part II: Settings and Measurements
96
12-3 Measurement Setup
12-3.1 Headend Equipment Setup
DS1610 communication setup: Using a PC server, log in to the DS1610 client interface (shown below). Note that proper login credentials
are required to access the system and all configuration settings. Contact your system administrator for more
information.
DS1610 Login Interface
DS1615 downstream FSK communication setup: 1. Right-click the DS1610 icon (shown below, left) and select Downstream Settings.
2. If entering the downstream parameter setup menu for the first time, click the "Add" button. If a set of parameters already exists, click to highlight it and select Edit.
Find out DS1615 Parameters Setting Menu Open DS1615 Downstream Parameters Setting Interface
3. In the parameter settings menu (right), input the downstream amplitude and frequency. Click OK to save the new settings. If
settings fail to save, verify that the software was installed properly
and that the network connection is valid.
4. The "Batch Setting" function can be used to set several DS1615 units to the same parameters simultaneously.
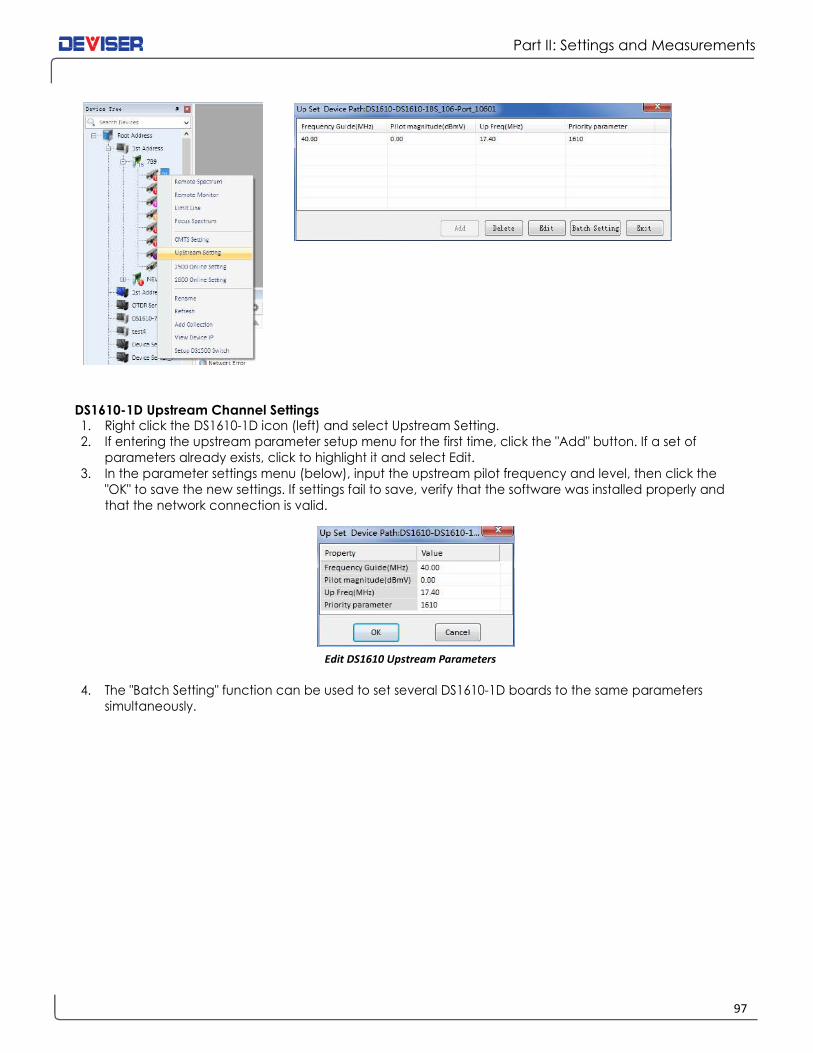
97
Part II: Settings and Measurements
DS1610-1D Upstream Channel Settings 1. Right click the DS1610-1D icon (left) and select Upstream Setting. 2. If entering the upstream parameter setup menu for the first time, click the "Add" button. If a set of
parameters already exists, click to highlight it and select Edit.
3. In the parameter settings menu (below), input the upstream pilot frequency and level, then click the "OK" to save the new settings. If settings fail to save, verify that the software was installed properly and
that the network connection is valid.
Edit DS1610 Upstream Parameters
4. The "Batch Setting" function can be used to set several DS1610-1D boards to the same parameters simultaneously.

Part II: Settings and Measurements
98
Online Troubleshooting, Frequency and Amplitude settings 1. Right-click the DS1610-1D icon (shown below) and select "2800 Online Setting".
Open Online Troubleshooting Device Parameters Setting Function
2. Setup menu: Amplitude, TP, Time step and Frequency.
Online Troubleshooting Device Parameters List
3. Groups of frequency and amplitude can be set for each port (1~16). Click "OK" to save these settings. If settings fail to save,
verify that the software was installed properly and that the
network connection is valid.
4. The "Batch Setting" function can be used to set several DS1610-1D boards to the same parameters simultaneously.

99
Part II: Settings and Measurements
12-3.2 DS2831 Sweep Parameters Setting
1. From the Home menu, press Upstream (F2) and use the rotary knob to open the Reverse Sweep mode.
2. In this mode, press Setup (F4). Configuring Reverse Sweep involves setting 6 different communication
parameters: Pilot Frequency, Down Link Frequency, Up Link Frequency, Pilot Level, IP Compensation
(Insertion point compensation), Reverse Sweep Slope and Reverse Sweep Port.
DS2831 Main Menu – (reverse sweep) DS2831 Reverse Sweep Communication Settings

Part II: Settings and Measurements
100
12-3.3 Reverse Path Sweep Display Overview
To explore the Reverse Path Sweep display interface, refer to the numbered figure and associated
definitions below.
1. Spectrum analyzer settings. Copied from upstream spectrum mode.
2. Green line depicts signal levels trans-mitted to / received from HE DS1610.
3. Assembled sweep frequency response trace.*
4. Reverse sweep transmission parameters. In this example:
[10]:50MHz, (frequency of the active
marker is the 10th inserted sweep point
of the reverse sweep trace, at 50MHz),
8dBmV (DS2831 US transmit level) - -
2.6dBmV (received DS level from the
DS1610)=10.6dB loss in the US path
being measured.
[SHIFT]: -3dB
[SLOPE]: 5.0dB
[SHIFT]: Adjusts the transmitted signal level for all frequency points.
[SLOPE]: Transmitted level difference between 1st and last inserted sweep points. -10~ +10dB.
5. The DS2831 upstream sweep transmit frequencies (sweep points) received by DS1610 at the headend.
6. FSK sync icon. If the DS2831 and DS1610 are not synced, it will remain red and display “Offline”. When registration starts, it will show “Send Pilot…” & “Waiting Pilot…”. When registration is successful and
remains active, the icon will alternate between yellow and green.
7. DS1610 upstream ID#. For example, for the 01/01/Port_10101 shown above, the first 01 is the board # of the DS1610, the second 01 is the port # of the DS1610 - 01 board, and Port_10101 is the port name.
8. Headend test point compensation
9. Insertion point compensation:
10. The difference in amplitude level between the local spectrum trace and the received headend/Hub spectrum trace at the marker position.
11. Field spectrum trace: at the DS2831 field location.
12. The spectrum trace sent to the DS2831 as it is received by the DS1610 at the headend, from the DS2831
13. Local test point compensation value.
* The example here shows a trace formed from 16 connected discrete-frequency RF signals initially transmitted upstream by the DS2831, then
received by the DS1610 at HE. The DS1610 then re-transmits those sweep points through the FSK DS carrier frequency, back to the DS2831. Up to 16
discrete-frequency RF signals can be transmitted upstream by the DS2831. The sweep technician will determine how many sweep points can be
used based on the local network health, spectrum space available, and amount of bandwidth already occupied by live signals.

101
Part II: Settings and Measurements
Reverse Path Sweep Full Screen Display
14. Reference return sweep trace.
15. Reference return sweep trace transmit and receive parameters.
16. The reference return sweep trace upstream sweep transmit frequencies (sweep points) received by DS1610 at the headend.
12-3.4 Reverse Path Sweep Operation
From the Home menu, press Upstream (F2) and use the rotary knob to open the reverse path sweep mode.
First, press Setup (F4). Set up the following parameters as desired for your measurement: pilot frequency,
uplink frequency, downlink frequency, pilot level, insertion point compensation, reverse path sweep slope
and reverse sweep port.
Reverse sweep port can be toggled between the RF port and COM port. The FSK communication port must
use COM port. If the user sets up the RF port as a reverse sweep port, the port signals should be configured
as shown (below, left). In this configuration, the RF port cannot view the local spectrum image at the same
time as reverse path sweep.
RF Port as Reverse Path Sweep Port COM Port as Reverse Path Sweep Port
If the user sets up the COM port as a reverse sweep port, the port signals should be configured as shown
(above, right). Now RF port can receive local spectrum.
Once the parameters listed above have been set, press Login (F1). Synchronization messages will appear in
the lower left corner of the display: “Send pilot …”, “Waiting Pilot…” (with a red icon). When the icon begins
alternating between yellow and green, the DS2831 and DS1610 are connected and the DS2831 will start
displaying the sweep frequency response trace.
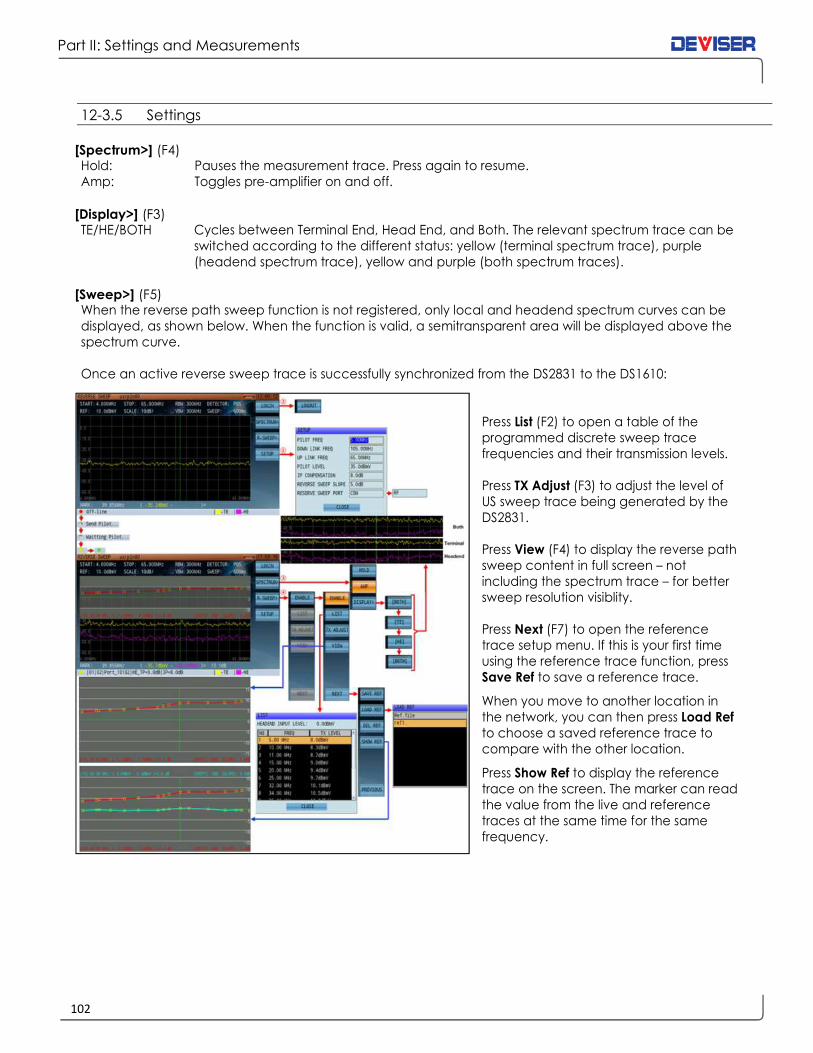
Part II: Settings and Measurements
102
12-3.5 Settings
[Spectrum>] (F4) Hold: Pauses the measurement trace. Press again to resume.
Amp: Toggles pre-amplifier on and off.
[Display>] (F3) TE/HE/BOTH Cycles between Terminal End, Head End, and Both. The relevant spectrum trace can be
switched according to the different status: yellow (terminal spectrum trace), purple
(headend spectrum trace), yellow and purple (both spectrum traces).
[Sweep>] (F5) When the reverse path sweep function is not registered, only local and headend spectrum curves can be
displayed, as shown below. When the function is valid, a semitransparent area will be displayed above the
spectrum curve.
Once an active reverse sweep trace is successfully synchronized from the DS2831 to the DS1610:
Press List (F2) to open a table of the
programmed discrete sweep trace
frequencies and their transmission levels.
Press TX Adjust (F3) to adjust the level of
US sweep trace being generated by the
DS2831.
Press View (F4) to display the reverse path
sweep content in full screen – not
including the spectrum trace – for better
sweep resolution visiblity.
Press Next (F7) to open the reference
trace setup menu. If this is your first time
using the reference trace function, press
Save Ref to save a reference trace.
When you move to another location in
the network, you can then press Load Ref
to choose a saved reference trace to
compare with the other location.
Press Show Ref to display the reference
trace on the screen. The marker can read
the value from the live and reference
traces at the same time for the same
frequency.
103
Part II: Settings and Measurements
12-4 Bidirectional Test System Parameters and Range Setup
12-4.1 Downstream Communication Signal Parameters
1. Down Freq = the DS communication signal frequency from the DS1615. The comms carrier bandwidth is less than 300 kHz. Note: Take special care to avoid inserting these comms channels on an occupied
spectrum where active signal is present.
Input range value = 42~120MHz (Note: This is an intrusive carrier signal. Take special care to ensure the
spectrum space is empty and available). The comms signal frequency must be identical to the "Down
Link Freq" set in the DS2831.
2. Down Amp = the DS output communication signal (comms) amplitude from the DS1615. The amplitude of the signal should be about the estimated downstream distance (in dB of loss) from the HE. (As a
general safe practices, always start the comms signal level as low as possible and work your way up to
the point of “sync”, so not to introduce unnecessary additional RF power and potentially overdrive your
lasers and introduce non-linear distortions on your network, ensuring high enough levels to maintain a
reliable communication between the HE and field location. (2-3dB additional headroom is acceptable)
Input range = 25~50dBmV.
3. Sync Code: This is reserved for system extension function and normally does not need to be modified, it is recommended to use the default value.
12-4.2 Upstream Communication Signal Parameters
1. Pilot Frequency: this signal frequency is required for a valid DS2831 registration with the HE equipment., Do not insert the pilot frequency channel where active signals may be present (e.g. DOCSIS channels).
Valid range = 5~65MHz. The value must be the same as the "Pilot Freq" in the DS2831 parameter setting.
2. Pilot Amplitude: The DS1610-D will validate the DS2831 registration amplitude. The value should be less than the pilot amplitude transmitted from DS2831 so that the DS1610-1D can correctly accept the
DS2831 registration request. The pilot signal amplitude received by the DS1610-1D should be equal to
the pilot signal amplitude from the DS2831 minus (-) the estimated attenuation from the DS2831 (field
location) to the DS1610-1D (HE or Hub).
Note: The pilot amplitude should be greater than the combined noise and interference signal in the
network at any given US port of the DS1610-1D to avoid that the DS1610-1D mistakes random noise as a
registering request from the DS2831. It is recommended to choose the port with the worse signal quality
as the standard when setting up. However, Special care should be given to insure the pilot carrier level
is not “too high” on clean looking nodes so as to avoid unnecessary RF energy contributions on the
return path.
3. Up Freq = the frequency used by the DS2831 for communication. This narrow FSK modulated signal uses a bandwidth of less than 200 kHz. Do not insert these comms channels on an occupied spectrum where
active signal is present.
Input value range = 42 ~ 120 MHz. The value must be identical with "Up Link Freq" in the DS2831
parameter setting.

Part II: Settings and Measurements
104
12-4.3 Settings
Amp: Equal to the measured signal amplitude transmitted by DS2831. It must comply with
network management requirements. (It is recommended to limit the transmitted signal
amplitude as much as possible to avoid interference with other comms, DTV or DOCSIS
signals in the network, increase overall RF power, and/or generating distortion products.)
Input range: 0~60 dBmV
Time step: Equal to the transmission delay between two adjacent frequency points. Input range:
10ms ~ 30s
Freq: This signal is bursty and at a single frequency. Do not use occupied spectrum when
setting up, this is an interfering signal carrier. Input range: 42~120 MHz
12-5 System Connection
12-5.1 Headend System Connection
1. The DS1610-1D connects with your upstream optical receiver test points (the same as your CMTS) 2. The DS1615 output signal is combined into downstream optical transmitter signal. (DC coupler
connection)
Note: Before combining the signal with your downstream broadcast network, be sure to verify that the
chosen DS frequency is unused by any other live signals.
12-5.2 DS2831 Connection
1. The DS2831 has two ports: RF and COM. The RF port is the receiver port for local position spectrum signals. Press R-Sweep > Com > RF to enable the RF port to receive the comms signals. The COM port is
for upstream transmission being generated by the DS2831 towards the DS1610 system upstream, used in
bidirectional measurements. By default, the COM port receives the FSK communication signal.
2. At terminal position, if you want to look at all the information, use a two-way splitter, one splitter's path connected to the COM port, to transmit upstream test signals and receive the DS1610 broadcast signal,
another path connected to RF port to measure local position spectrum traces.
At the optical node or bidirectional amplifier, the COM port of the DS2831 should be connected to the
bi-directional amplifier (or bidirectional optical node) reverse path output test port; the RF port should
be connected to the output test port of a bi-directional amplifier (or bi-directional optical node).
12-6 Troubleshooting
If the DS2831 cannot register, use the spectrum analysis function of the DS2831 to verify whether the
downstream signal sent by DS1615 is active & normal or not. If not, check the relevant parameter settings of
the downstream communication and health of the downstream network; then run the client side of the
DS1610-1D. Open the 1610-1D port connected with the DS2831, and open the maximum value display.
When the DS2831 is registering, the frame should pause for a while, and the maximum value should show
that the "pilot frequency" has a signal which is over the "pilot amplitude"; if it doesn’t display or the
amplitude value is lower, verify the relevant parameter settings of the upstream comms channel and the
status of the upstream network.

105
Part II: Settings and Measurements
Chapter 13: Upstream Signal Generator
The upstream signal generator (USG) optional function is used to characterize the quality of a signal being
transmitted in an RF upstream HFC link.
The USG generates upstream carrier signals from 5~210MHz (PRBS coding with a QAM signal is desirable if
FEC coding of an upstream QAM carrier is required for Pre-Post FEC performance verification). It supports
QPSK, 16QAM, 64QAM and 256QAM modulation modes, as well as J.83Annex A & J.83 Annex B FEC code
modes. The symbol rate range is 1~7MS/s. MER performance >43db.
13-1 Basic Operation
From the Home menu, press Upstream (F2) and use the rotary knob to open the Upstream Signal Generator
application. To adjust parameters (see below), use the rotary knob to highlight and select the desired
setting. Then use the arrow keys to adjust its value. Click the rotary knob to confirm your choice. FREQ, STD,
SR (Symbol Rate), LEVEL, MODE and SHIFT may be adjusted.
NOTE: Before pressing Start, first ensure that no active signals are present at the same frequency, as the USG
signal will disrupt existing live signals on the network (e.g., DOCSIS signals).
The gray bar will fill up with yellow if USG is successful, indicating transmitting signal.
Upstream Signal Generator and function submenus

Part II: Settings and Measurements
106
13-1.1 Settings
The following parameters can be adjusted in the USG mode.
Freq. range: 5~120MHz. This range allows network characterization over 42 MHz [NA] or 65 MHz [EU],
as diplex filter field upgrades continue.
Standard: J.83A, J.83B
Symbol Rate: 1.00 ~ 7.00MS/s
Level: 0 ~ 60dBmV
Modulation: Annex A: CW, QPSK, 16 / 64 / 256 QAM
Annex B: CW, 64 / 256 QAM
SHIFT: -6dB~+6dB (used to compensate for the test cable length or input port insertion loss)
13-2 Sweep Function
The USG application offers a frequency stepping (sweeping) function. Follow the instructions below to
activate it.
Press Sweep> (F2) to open the frequency sweep submenu. Here, press Freq (F3)to open a dialog for setting
the start/stop frequencies of the sweep. You can set up to 4 guardband frequencies.
The shadowed parts on the display screen will show the currently programmed guardbands. For a CW
signal sweep, the frequency steps are 1MHz, and the sweep will only jump over guardband frequencies. For
modulated signals, since the bandwidth occupied by the signal is large, the guardbands are equal to half
of the generated test signals, directly related to the symbol rate of the test signals selected. This may limit
the symbol rate required, depending on spacing available between live (desired) signals.
Even if the instrument has started transmitting test signals, amplitude adjustments can be made by pressing
the [+1dB] and [-1dB] function keys to ensure that the amplitude of the transmitted test signals is exactly as
desired. The frequency and amplitude of the sweep test signals will dynamically update on the screen. This
helps to prevent measurement errors; unlike levels, frequency cannot be adjusted during a measurement.
The Interval key allows the user to set a delay between each of the test carrier frequency steps to be
generated, speeding up or slowing down the sweep motion. This delay may range from 100~1000ms.
Single/Repeat, meanwhile, is used to control the frequency sweep to run a single cycle or on a running
loop until you press the Stop key.
By default, the DS2831’s RF port is used for test signal output. Press RF/COM (F4) to toggle the output port to
COM instead.
As a general safe practice, always initiate a USG test signal transmission with levels as low as possible at first
and work your way up to a level quasi-equal to that of your live DOCSIS signals. This prevents introducing
unnecessary additional RF power, potentially overdriving your lasers, and introducing non-linear distortions
on your network.
Finally, press Zero (F7) to self-calibrate the USG. The cable connection of self calibration is shown as Figure
19 2 to connect RF port and COM port. At this moment, COM is USG output port, the output signals will
enter RF port and are received by DS2831 itself spectrum function, then execute self calibration and
generate the compensation data. If user select 【有效CAL ON】, the application will execute self calibration and generate the compensation, but if user select 【无效 CAL OFF】, signals emission will not use the compensation data but use signal generator itself original calibration data.

107
Part II: Settings and Measurements
Chapter 14: Loopback Test
The Loopback Test function is a level test that only provides information on level loss in a loop. The levels
measured indicate RF levels measured at the input, as it is received.
The output signal generator (indicating the output level generated), minus the received level at the RF IN
port, indicates the signal loss in the loop under test.

Part II: Settings and Measurements
108
Chapter 15: DOCSIS 3.1 Cable Modem Test
To link a PC to the instrument and use the DS2831 as a DOCSIS 3.1 32x8 or OFDM cable modem, connect a
standard Ethernet cable to the LAN port in the DS2831’s top panel. Set the computer network IP settings to
DHCP. The computer can then access the Internet once the Cable Modem has registered with the CMTS.
The DS2831 incorporates an automatic switching Ethernet chip. The DHCP function of the instrument does
not conflict with the DHCP function of an external computer, so the DHCP mode does not need to be
disabled.
There is one exception, however. If the Cable Modem configuration files sent by CMTS include the setting
Maximum_Number_of_CPEs=1 (meaning that the Cable Modem can support only one CPE device), the
DS2831’s DHCP does need to be disabled. This allows the computer to automatically acquire an IP.
15-1 Basic Operation
Before starting a cable modem measurement, ensure that DHCP is enabled in the unit’s settings.
If the downstream frequency and upstream channel ID of the bidirectional network are already known,
press DS Freq (F4) to preset the priority downstream frequency and upstream channel ID. This helps shorten
registration time dramatically, as the instrument will not have to scan for the DS DOCSIS main channel
frequencies and will instead seek connection at the programmed frequency directly. (See below.)
Users may also set the "Level Correction" value to compensate for inaccuracies. The final result displayed on
the screen will be the measurement result + Level Correction value.
Cable Modem Downstream Frequency Configuration
:
The above icons appear when the Cable Modem function is active. The color of the four dots indicates the
CM status.
Red: CM is initializing.
White: CM is registering with the CMTS.
Green: CM has successfully registered with the CMTS.

109
Part II: Settings and Measurements
Configure your channel plan before conducting the CM measurement, as shown below.
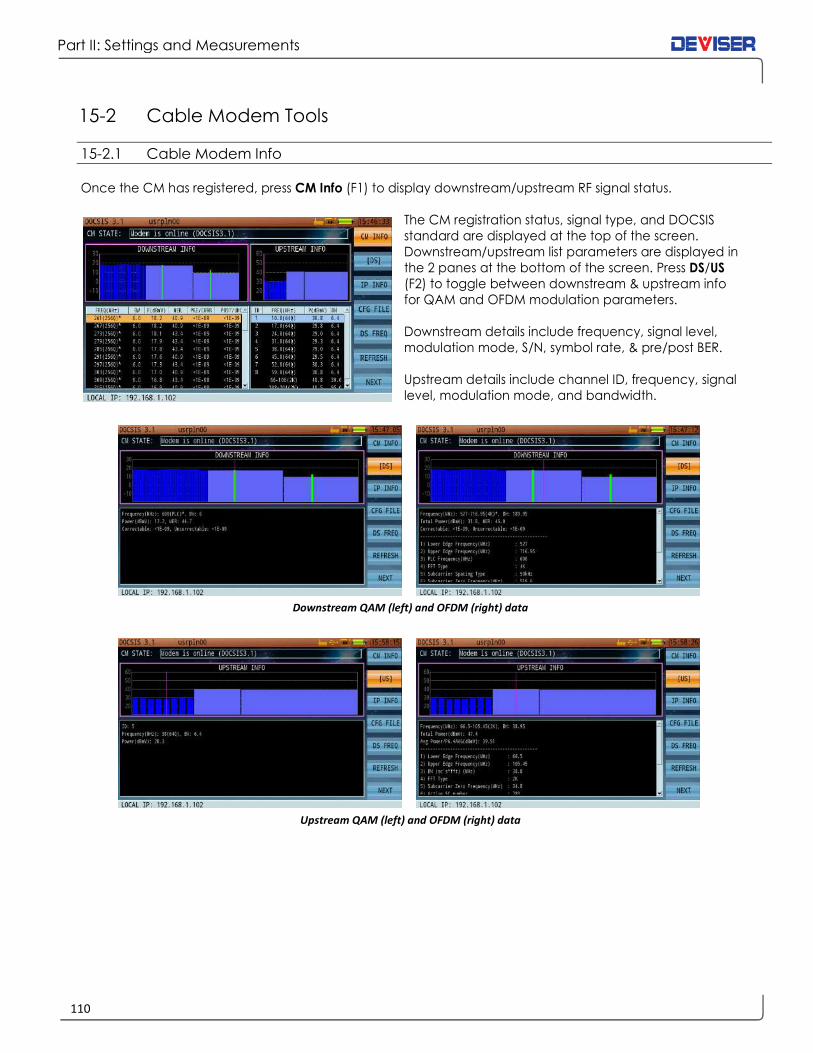
Part II: Settings and Measurements
110
15-2 Cable Modem Tools
15-2.1 Cable Modem Info
Once the CM has registered, press CM Info (F1) to display downstream/upstream RF signal status.
The CM registration status, signal type, and DOCSIS
standard are displayed at the top of the screen.
Downstream/upstream list parameters are displayed in
the 2 panes at the bottom of the screen. Press DS/US
(F2) to toggle between downstream & upstream info
for QAM and OFDM modulation parameters.
Downstream details include frequency, signal level,
modulation mode, S/N, symbol rate, & pre/post BER.
Upstream details include channel ID, frequency, signal
level, modulation mode, and bandwidth.
Downstream QAM (left) and OFDM (right) data
Upstream QAM (left) and OFDM (right) data
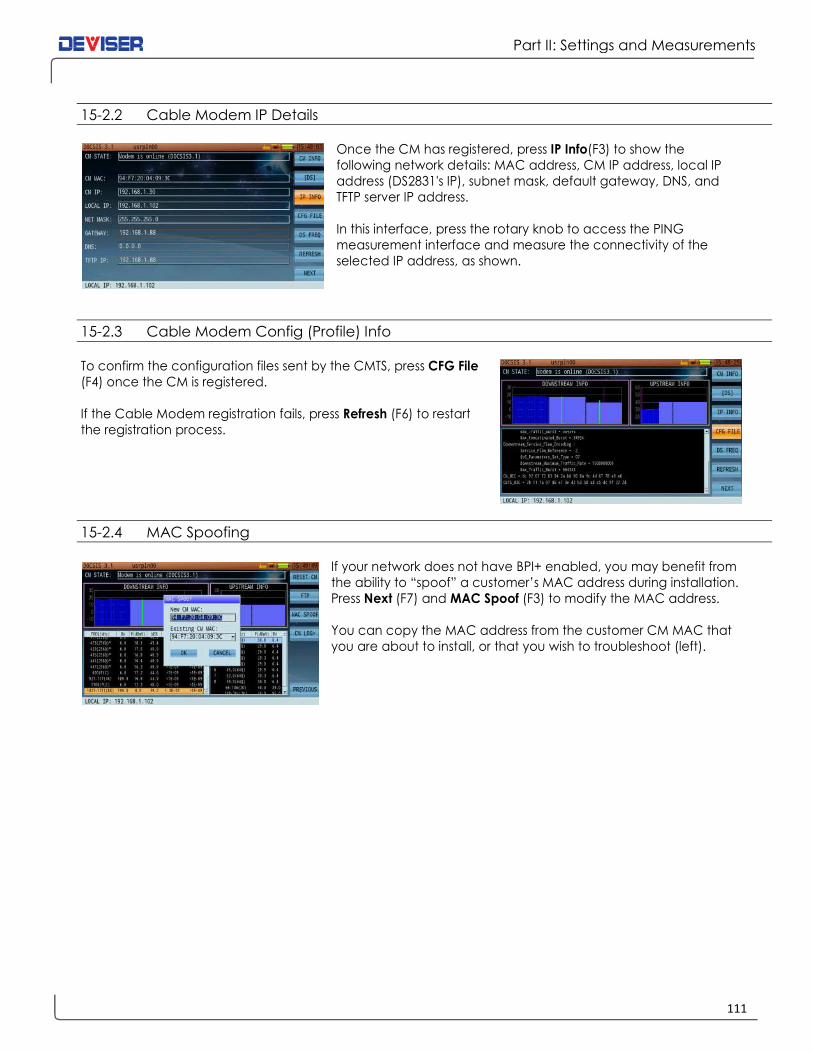
111
Part II: Settings and Measurements
15-2.2 Cable Modem IP Details
Once the CM has registered, press IP Info(F3) to show the
following network details: MAC address, CM IP address, local IP
address (DS2831's IP), subnet mask, default gateway, DNS, and
TFTP server IP address.
In this interface, press the rotary knob to access the PING
measurement interface and measure the connectivity of the
selected IP address, as shown.
15-2.3 Cable Modem Config (Profile) Info
To confirm the configuration files sent by the CMTS, press CFG File
(F4) once the CM is registered.
If the Cable Modem registration fails, press Refresh (F6) to restart
the registration process.
15-2.4 MAC Spoofing
If your network does not have BPI+ enabled, you may benefit from
the ability to “spoof” a customer’s MAC address during installation.
Press Next (F7) and MAC Spoof (F3) to modify the MAC address.
You can copy the MAC address from the customer CM MAC that
you are about to install, or that you wish to troubleshoot (left).
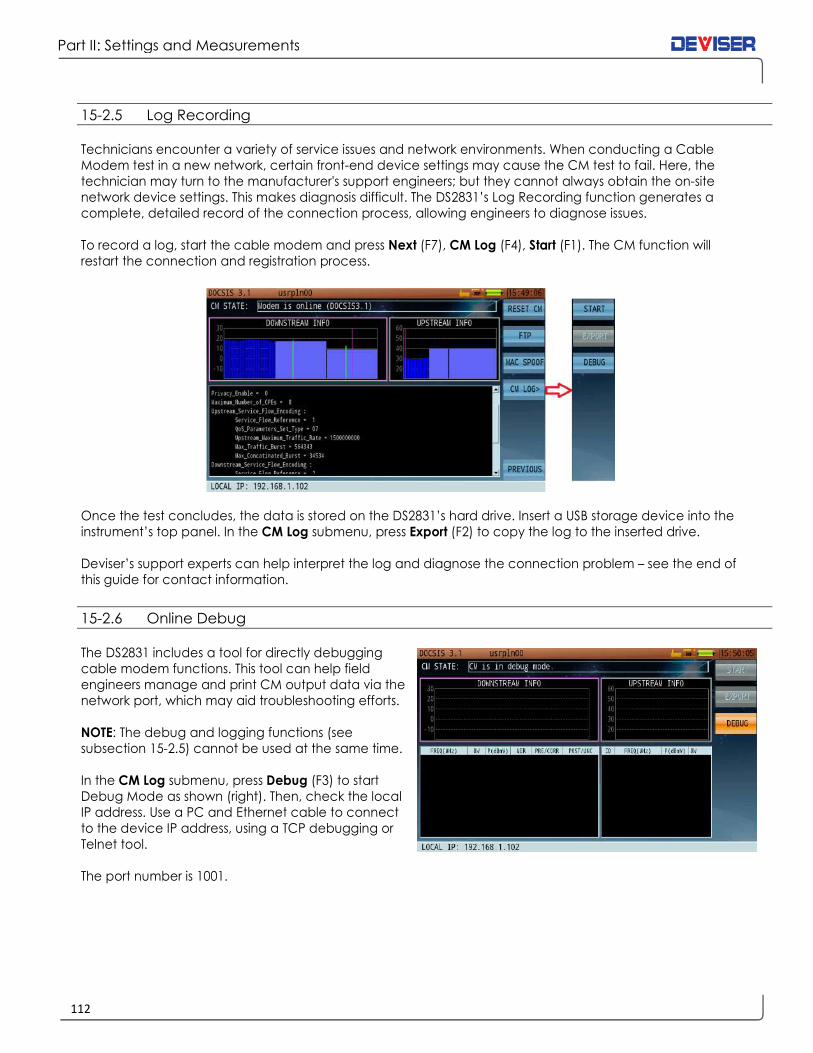
Part II: Settings and Measurements
112
15-2.5 Log Recording
Technicians encounter a variety of service issues and network environments. When conducting a Cable
Modem test in a new network, certain front-end device settings may cause the CM test to fail. Here, the
technician may turn to the manufacturer's support engineers; but they cannot always obtain the on-site
network device settings. This makes diagnosis difficult. The DS2831’s Log Recording function generates a
complete, detailed record of the connection process, allowing engineers to diagnose issues.
To record a log, start the cable modem and press Next (F7), CM Log (F4), Start (F1). The CM function will
restart the connection and registration process.
Once the test concludes, the data is stored on the DS2831’s hard drive. Insert a USB storage device into the
instrument’s top panel. In the CM Log submenu, press Export (F2) to copy the log to the inserted drive.
Deviser’s support experts can help interpret the log and diagnose the connection problem – see the end of
this guide for contact information.
15-2.6 Online Debug
The DS2831 includes a tool for directly debugging
cable modem functions. This tool can help field
engineers manage and print CM output data via the
network port, which may aid troubleshooting efforts.
NOTE: The debug and logging functions (see
subsection 15-2.5) cannot be used at the same time.
In the CM Log submenu, press Debug (F3) to start
Debug Mode as shown (right). Then, check the local
IP address. Use a PC and Ethernet cable to connect
to the device IP address, using a TCP debugging or
Telnet tool.
The port number is 1001.
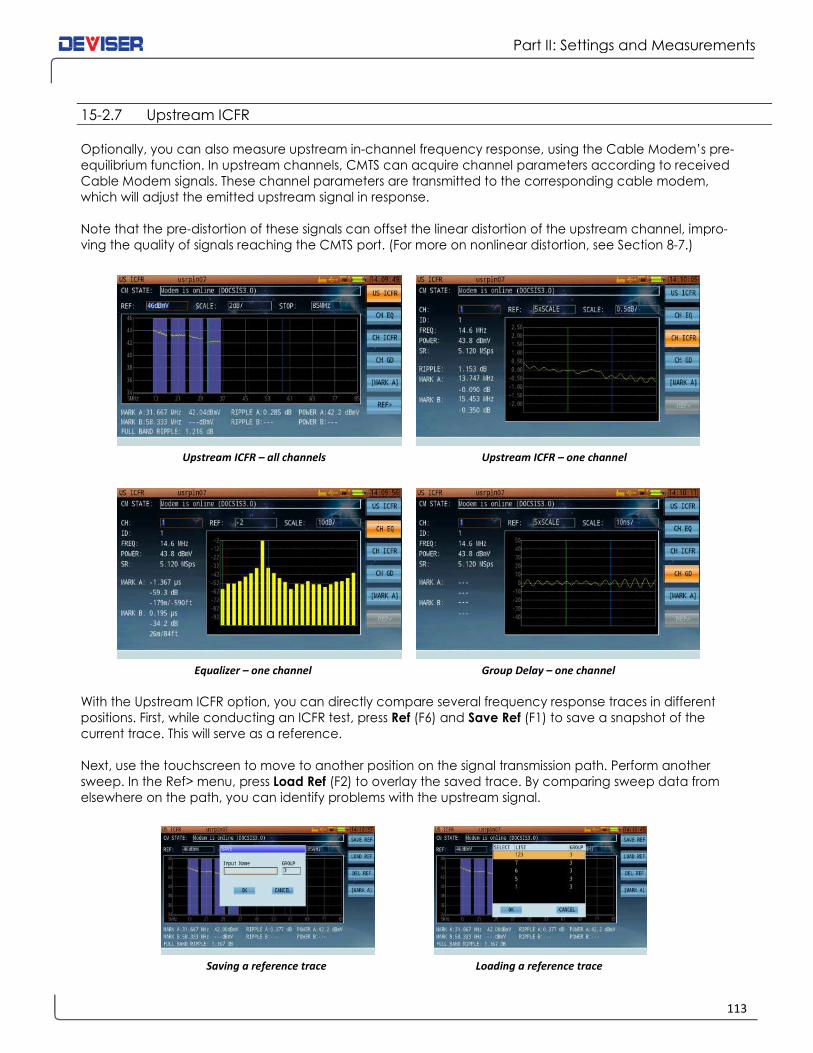
113
Part II: Settings and Measurements
15-2.7 Upstream ICFR
Optionally, you can also measure upstream in-channel frequency response, using the Cable Modem’s pre-
equilibrium function. In upstream channels, CMTS can acquire channel parameters according to received
Cable Modem signals. These channel parameters are transmitted to the corresponding cable modem,
which will adjust the emitted upstream signal in response.
Note that the pre-distortion of these signals can offset the linear distortion of the upstream channel, impro-
ving the quality of signals reaching the CMTS port. (For more on nonlinear distortion, see Section 8-7.)
Upstream ICFR – all channels Upstream ICFR – one channel
Equalizer – one channel Group Delay – one channel
With the Upstream ICFR option, you can directly compare several frequency response traces in different
positions. First, while conducting an ICFR test, press Ref (F6) and Save Ref (F1) to save a snapshot of the
current trace. This will serve as a reference.
Next, use the touchscreen to move to another position on the signal transmission path. Perform another
sweep. In the Ref> menu, press Load Ref (F2) to overlay the saved trace. By comparing sweep data from
elsewhere on the path, you can identify problems with the upstream signal.
Saving a reference trace Loading a reference trace
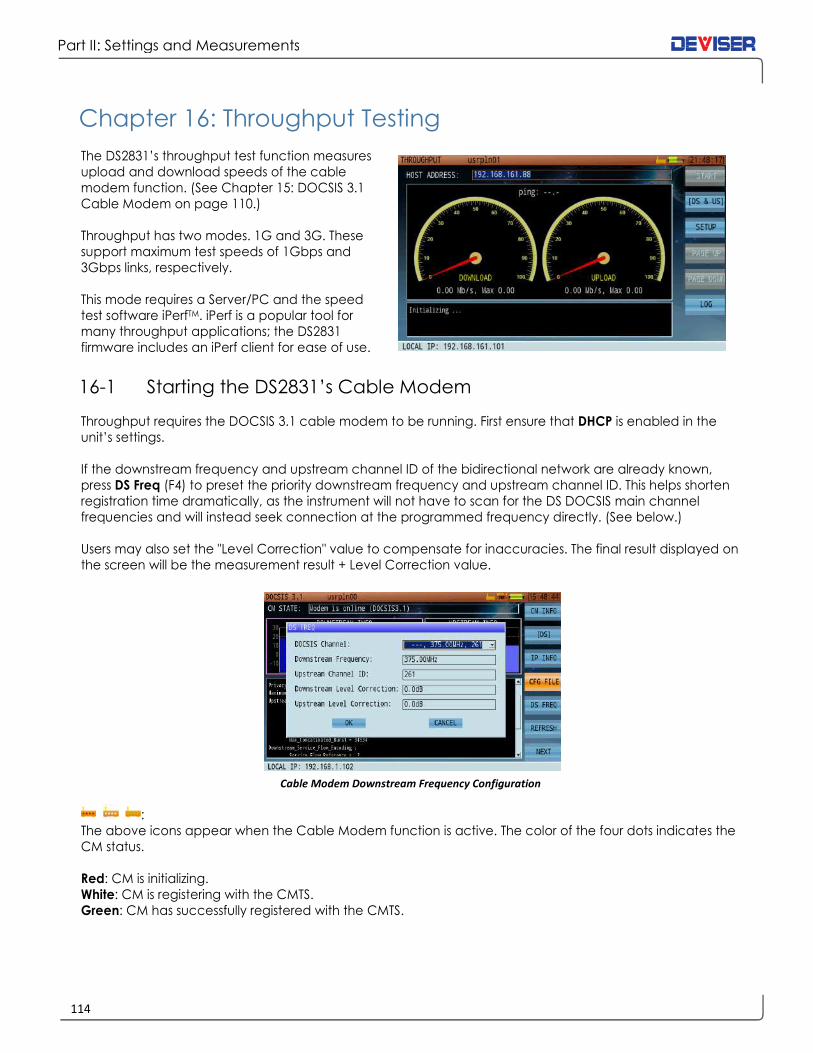
Part II: Settings and Measurements
114
Chapter 16: Throughput Testing
The DS2831’s throughput test function measures
upload and download speeds of the cable
modem function. (See Chapter 15: DOCSIS 3.1
Cable Modem on page 110.)
Throughput has two modes. 1G and 3G. These
support maximum test speeds of 1Gbps and
3Gbps links, respectively.
This mode requires a Server/PC and the speed
test software iPerfTM. iPerf is a popular tool for
many throughput applications; the DS2831
firmware includes an iPerf client for ease of use.
16-1 Starting the DS2831’s Cable Modem
Throughput requires the DOCSIS 3.1 cable modem to be running. First ensure that DHCP is enabled in the
unit’s settings.
If the downstream frequency and upstream channel ID of the bidirectional network are already known,
press DS Freq (F4) to preset the priority downstream frequency and upstream channel ID. This helps shorten
registration time dramatically, as the instrument will not have to scan for the DS DOCSIS main channel
frequencies and will instead seek connection at the programmed frequency directly. (See below.)
Users may also set the "Level Correction" value to compensate for inaccuracies. The final result displayed on
the screen will be the measurement result + Level Correction value.
Cable Modem Downstream Frequency Configuration
:
The above icons appear when the Cable Modem function is active. The color of the four dots indicates the
CM status.
Red: CM is initializing.
White: CM is registering with the CMTS.
Green: CM has successfully registered with the CMTS.

115
Part II: Settings and Measurements
Configure your channel plan before conducting the CM measurement, as shown below.

Part II: Settings and Measurements
116
16-2 Starting iPerf
You can download the iPerf software from <https://github.com/esnet/iperf> and set up an iPerf server
connected to CMTS. Select the link suited for your operating system. Deviser recommends a 64-bit Linux
server running Ubuntu v3.1.3.
The following sample instructions are based on a MacOS PC and a Windows server; but any combination of
operating systems can be used. Visit the link above for downloads and instructions that best suit your
hardware options.
Windows Server: (San Jose test server 96.82.109.100) To build your own 64-bit Windows server with Microsoft
Server 2012 O/s, download iPerf 3.1.3 at <https://iperf.fr/download/windows/iperf-3.1.3-win64.zip>
MacOS PC: For a MacOS PC (Core 2 Duo, Xeon, i3, i5, i7), you have a 64-bit CP. To test iPerf, download the
file here: <https://iperf.fr/download/apple/iperf-3.1.3-macos-x86_64.zip>
• The file “iperf3” will download to your PC.
• Default Apple security settings may block this application if it does not recognize the developer. To
resolve this, go to System Preferences > Security settings. Under “Allow apps downloaded from”,
locate the app and approve it.
• Run the app.
To test the server from a MacOS PC, place iPerf on the desktop. Run the “Terminal” prompt and change
the directory to iPerf’s location, e.g. “cd/users/*your username*/desktop”. Type DIRS to ensure that the
directory is correct.
Then enter “./iperf3 –c 96.82.109.100”. The following processes should appear in the Terminal window.
Connecting to host 96.82.109.100, port 5201
[ 4] local 192.168.0.7 port 50782 connected to 96.82.109.100 port 5201
[ ID] Interval Transfer Bandwidth
[ 4] 0.00-1.00 sec 432 KBytes 3.53 Mbits/sec
[ 4] 1.00-2.00 sec 308 KBytes 2.53 Mbits/sec
[ 4] 2.00-3.00 sec 402 KBytes 3.29 Mbits/sec
[ 4] 3.00-4.00 sec 284 KBytes 2.33 Mbits/sec
[ 4] 4.00-5.00 sec 445 KBytes 3.65 Mbits/sec
[ 4] 5.00-6.00 sec 590 KBytes 4.83 Mbits/sec
[ 4] 6.00-7.00 sec 467 KBytes 3.82 Mbits/sec
[ 4] 7.00-8.00 sec 327 KBytes 2.68 Mbits/sec
[ 4] 8.00-9.00 sec 293 KBytes 2.39 Mbits/sec
[ 4] 9.00-10.00 sec 452 KBytes 3.72 Mbits/sec
- - - - - - - - - - - - - - - - - - - - - - - - -
[ ID] Interval Transfer Bandwidth
[ 4] 0.00-10.00 sec 3.91 MBytes 3.28 Mbits/sec sender
[ 4] 0.00-10.00 sec 3.82 MBytes 3.21 Mbits/sec receiver
iperf Done.

117
Part II: Settings and Measurements
If you check the Windows server running iPerf3, a message will have appeared in the DOS prompt window.
----------------------------------------------
Server listening on 5201]
----------------------------------------------
While iPerf3 is running from the DS2831 or the remote PC, the following processes will also appear.
Connecting to host 96.82.109.100, port 5201
[ 9] local 192.168.0.7 port 50782 connected to 96.82.109.100 port 5201
[ ID] Interval Transfer Bandwidth
[ 9] 0.00-1.01 sec 307 KBytes 2.50 Mbits/sec
[ 9] 1.01-2.01 sec 307 KBytes 2.50 Mbits/sec
[ 9] 2.01-3.01 sec 400 KBytes 3.28 Mbits/sec
[ 9] 3.01-4.01 sec 290 KBytes 2.39 Mbits/sec
[ 9] 4.01-5.00 sec 441 KBytes 3.62 Mbits/sec
[ 9] 5.00-6.00 sec 591 KBytes 4.85 Mbits/sec
[ 9] 6.00-7.00 sec 464 KBytes 3.80 Mbits/sec
[ 9] 7.00-8.00 sec 328 KBytes 2.68 Mbits/sec
[ 9] 8.00-9.01 sec 294 KBytes 2.39 Mbits/sec
[ 9] 9.01-10.00 sec 455 KBytes 3.77 Mbits/sec
[ 9] 10.00-10.07 sec 36.8 KBytes 4.71 Mbits/sec
- - - - - - - - - - - - - - - - - - - - - - - - -
[ ID] Interval Transfer Bandwidth
[ 9] 0.00-10.07 sec 0.00 Bytes 0.00 bits/sec sender
[ 9] 0.00-10.07 sec 3.82 MBytes 3.19 Mbits/sec receiver
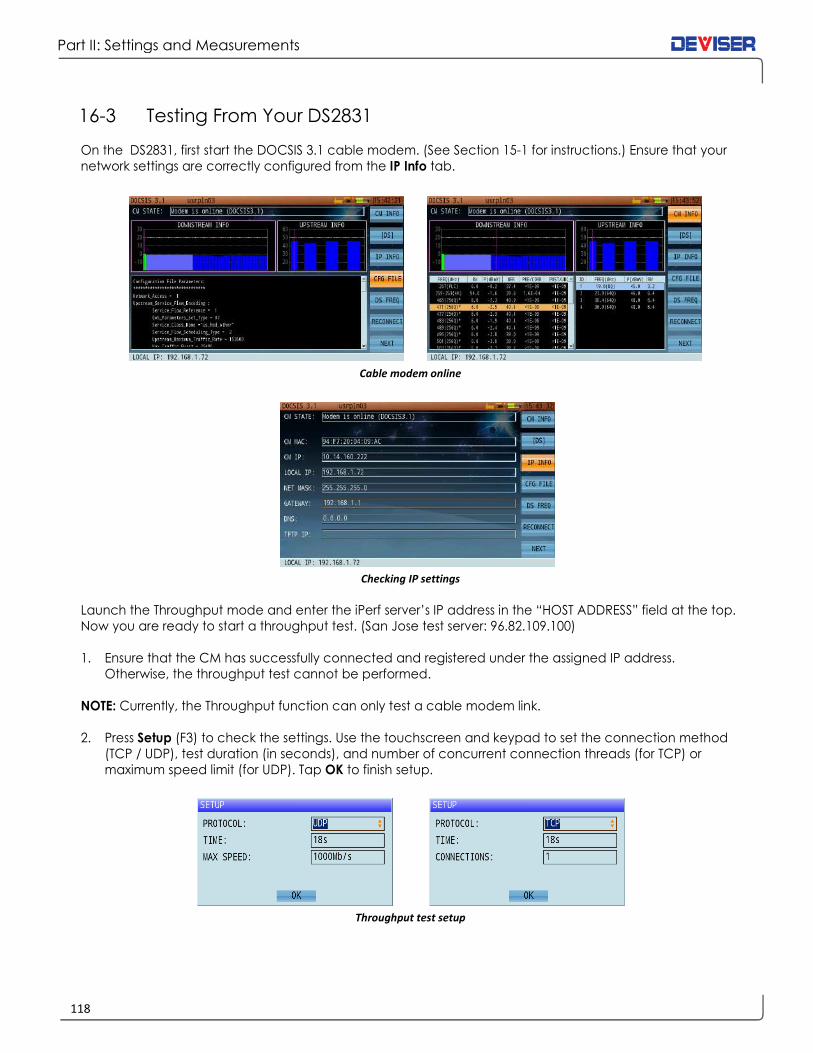
Part II: Settings and Measurements
118
16-3 Testing From Your DS2831
On the DS2831, first start the DOCSIS 3.1 cable modem. (See Section 15-1 for instructions.) Ensure that your
network settings are correctly configured from the IP Info tab.
Cable modem online
Checking IP settings
Launch the Throughput mode and enter the iPerf server’s IP address in the “HOST ADDRESS” field at the top.
Now you are ready to start a throughput test. (San Jose test server: 96.82.109.100)
1. Ensure that the CM has successfully connected and registered under the assigned IP address. Otherwise, the throughput test cannot be performed.
NOTE: Currently, the Throughput function can only test a cable modem link.
2. Press Setup (F3) to check the settings. Use the touchscreen and keypad to set the connection method
(TCP / UDP), test duration (in seconds), and number of concurrent connection threads (for TCP) or
maximum speed limit (for UDP). Tap OK to finish setup.
Throughput test setup

119
Part II: Settings and Measurements
3. Press F2 repeatedly to select the desired test items: upstream, downstream, or both.
4. Finally, press Start (F1) to begin testing. During the test, you may press Stop (F1) at any time to interrupt
the test before the scheduled time limit.
Conducting a throughput test; viewing results
5. After the test, press Log (F7) to view the throughput results. Use Page Up (F5) and Page Down (F6) to
scroll through the test log.
Additional Links For more information on DS2831 functions, contact [email protected] or consult the user guide.
For more information on iPerf: http://software.es.net/iperf
Source code and issue tracker: https://github.com/esnet/iperf
Downloads of iperf3 are available at: http://downloads.es.net/pub/iperf/
To check out the most recent code, clone the GIT repository at: https://github.com/esnet/iperf.git

Part II: Settings and Measurements
120
Chapter 17: PPPoE
As a PPPoE client, you only need to provide a user name and password to initiate PPPoE dialing. Enter a
username and password in the top two fields, using the alphanumeric keypad.
Once a login is entered, press Connect (F1) to initiate PPPoE dialing. Upon a successful connection; the
following parameters will be acquired and displayed, as shown (below, left):
• IP address of PPP0
• Server IP address
• Subnet mask
• DNS
If the connection fails, an error code and error information will display for reference, as shown (below, right).
PPPoE Dialing PPPoE Connection Error

121
Part II: Settings and Measurements
Chapter 18: PING
PING is effective for quickly verifying your network connectivity status and speed, as shown below.
Ping Result Display
Input the network or IP address (e.g., www.google.com) to be tested in the host address box at the top,
using the alphanumeric keypad. Then press Ping (F1) once to start the network test. You may press it again
to stop the test, if necessary.
Ping results appear in real time in the window, as shown above.
Settings
Packet Count: the number of data packets sent by the assigned PING order.
Unlimited: If this box is checked, the PING function will fire continuously until Stop is pressed.
Packet length: The packet length of the PING request.
Interval: Time interval delay between ping packets, in ms.

Part II: Settings and Measurements
122
Chapter 19: Traceroute
Traceroute is another practical network test used to verify your network route, connectivity status, & speed
(as shown below). It identifies each hop <IP address> along the path between the instrument and the
destination host.
Traceroute Results
Results displayed include the IP address and name of each hop between the DS2831 and the destination
host, and the time (in ms) for the data to transmit to and from the routing equipment.
Input the desired network address to test in the host address bar, and then press Start (F1) to initiate the test.
Press F1 again to stop the test. Results are displayed in real-time.
Max. HOPS refers to the maximum number of hops allowed for the test (user-defined).
If the list of data cannot be displayed all at once, a scroll bar appears. (See above.) Press Page Up (F2) and
Page Down (F3) to scroll up and down the information window.

123
Part II: Settings and Measurements
Chapter 20: FTP
The FTP mode is useful for testing upload/download speeds between the DS2831 and an FTP server, as
shown below.
FTP Test
Measurement Settings
Server IP: FTP server IP address
Port: Sets the port number used by the FTP server (the default is 21)
Username Sets the username when connecting to a server that requires credentials.
Password: Sets the password when connecting to a server that requires credentials.
Anonymous login: Checked for ON, empty for OFF. (Ensure the desired server allows for anonymous login.)
When ready, press Start (F1) to initiate the test. The upload/download speed will display in real time. A status
bar at the bottom of the screen indicates the degree of test progress. If the test encounters problems, an
error message will display in the information window (shown below).
FTP Login Error

Part II: Settings and Measurements
124
Chapter 21: Browser
From the Home menu, press Upstream (F2) and use the rotary knob to open the Browser application. This
function equips the DS2831 with a basic web browser, able to load simple text, pictures, and hyperlinks and
remember a number of website URLs.
Before opening any web page, ensure that your network setup is correct and active; the DS2831 must be
connected to the Internet with an Ethernet cable, WiFi connection, or active Cable Modem session.
Note that web page Java or Flash plug-ins may not work as intended on the DS2831’s browser, and may
not be properly formatted for the unit’s display.
Hyperlinks are highlighted in blue ( ) and may be available in the title bar of the browser. Use the
arrow keys to scroll through different hyperlinks, then click the rotary knob to execute and open the related
webpage. If the page is too large to fit on the DS2831’s display, use the rotary knob to scroll up and down.
To skip ahead to the next page or return to the previous page, use the Next (F5) and Previous (F4) keys.
Press URL (F3) to enter a new web site address with the alphanumeric keypad. Press the rotary knob to
confirm your selection (shown below).
For frequently-accessed websites, a Bookmark menu is available for your convenience. Press Bookmark (F2)
to open the bookmarks dialog. Use the arrow keys to highlight a URL from the list, and press the rotary knob
to confirm your selection. If you want to set a particular URL as your homepage, use the rotary knob to
select the Set to Homepage button. An asterisk (*) in the homepage column (shown below) indicates that
this URL is the homepage, and will open automatically when the browser is opened.
Browser stored Website URLs Browser Bookmark menu
NOTE: An updated browser is now available. If your DS2831 unit is unable to display images on the Internet,
inquire with your local Deviser representative about upgrading your firmware to take full advantage of a
better-performing Browser function.

125
Part II: Settings and Measurements
Chapter 22: WiFi Analysis
The WiFi analysis mode is primarily used to display the surrounding WiFi channels, their SSID, their designated
channel within the WiFi band used, and their relative amplitude level from the DS2831 location. (See the
figures below for the graphical interface.)
The WiFi Analysis function has two display modes: graphical and list. The list mode shows the name, status,
channel, relative signal strength, MAC address, and encryption method of the SSID carriers detected.
Users can select a hotspot to connect to in the list page. If a successful WiFi connection is established,
network tools such as Browser, PING and TRACEROUTE can be used.
Currently, the WiFi analysis function supports WLAN of 2.4G and 5G.
2.4GWiFi Channel - Graphical Display 5G WiFi Channel - Graphical Display
WiFi Channel - List Display Add New WiFi Network
Connected Network Status
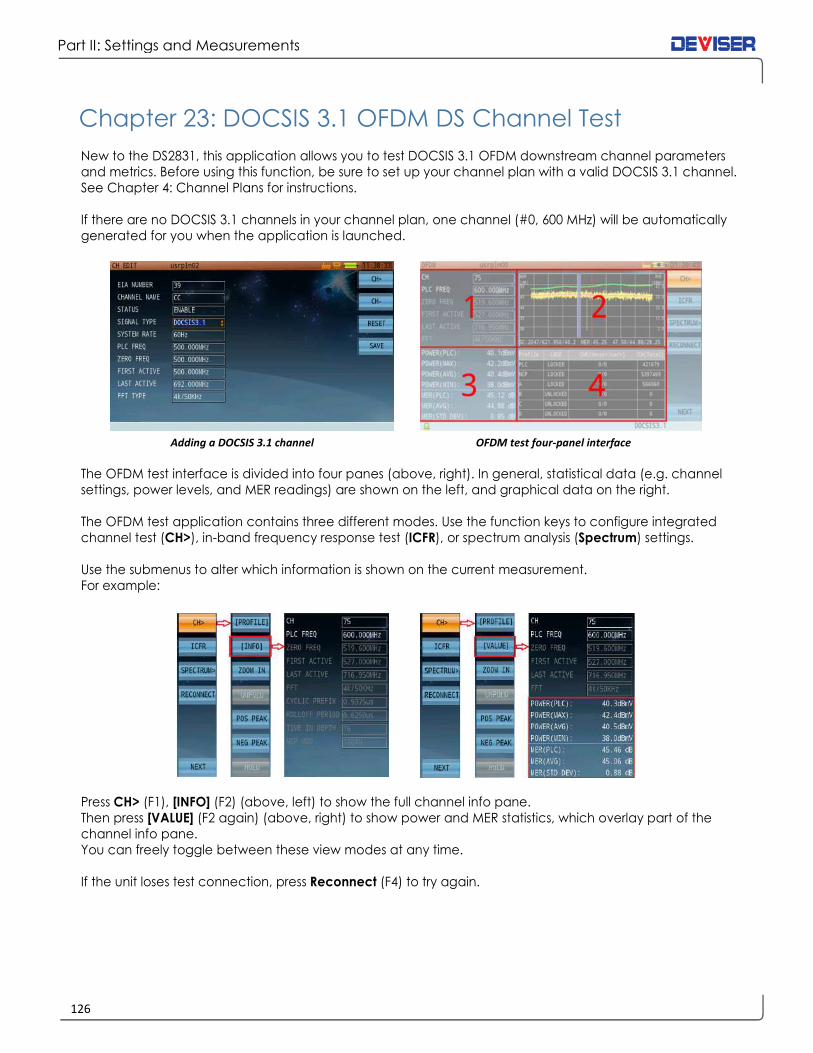
Part II: Settings and Measurements
126
Chapter 23: DOCSIS 3.1 OFDM DS Channel Test
New to the DS2831, this application allows you to test DOCSIS 3.1 OFDM downstream channel parameters
and metrics. Before using this function, be sure to set up your channel plan with a valid DOCSIS 3.1 channel.
See Chapter 4: Channel Plans for instructions.
If there are no DOCSIS 3.1 channels in your channel plan, one channel (#0, 600 MHz) will be automatically
generated for you when the application is launched.
Adding a DOCSIS 3.1 channel OFDM test four-panel interface
The OFDM test interface is divided into four panes (above, right). In general, statistical data (e.g. channel
settings, power levels, and MER readings) are shown on the left, and graphical data on the right.
The OFDM test application contains three different modes. Use the function keys to configure integrated
channel test (CH>), in-band frequency response test (ICFR), or spectrum analysis (Spectrum) settings.
Use the submenus to alter which information is shown on the current measurement.
For example:
Press CH> (F1), [INFO] (F2) (above, left) to show the full channel info pane.
Then press [VALUE] (F2 again) (above, right) to show power and MER statistics, which overlay part of the
channel info pane.
You can freely toggle between these view modes at any time.
If the unit loses test connection, press Reconnect (F4) to try again.

127
Part II: Settings and Measurements
23-1 OFDM Integrated Channel Test
The integrated channel test contains channel power, MER, profile information, and other basic parameters.
To adjust settings, press CH> (F1) to explore the submenu.
23-1.1 Settings
Button Operation [Profile / Graph]: Toggles Pane 4 between user profile information (displayed as a table) and OFDM sub-
carrier MER graph.
[Value / Info]: Toggles Pane 3 between channel information and power/MER readings.
[Zoom In / Out]: Zoom in to expand Pane 2 graph display to fullscreen. Zoom out to return to normal view.
[Fold / Unfold]: Only when zoomed in to power/MER carrier graph, When unfolded, each horizontal pixel
identifies the signal level from one carrier. Use the touchscreen or arrow keys to examine
different carriers. (See below.)
POS PEAK: Moves graph cursor to the MER positive peak value.
NEG PEAK: Moves graph cursor to the MER negative peak value.
HOLD: Pauses the measurement for closer analysis. Zoom for best visibility.
Folded view, MER graph (zoomed out) Unfolded view, MER graph (zoomed in)

Part II: Settings and Measurements
128
Test Results
POWER (P6): Divides OFDM signal into segments of 6MHz bandwidth, then calculates channel power
separately for each segment.
POWER (PLC): Channel power at location of PLC (power line communication). (6MHz)
POWER (MAX): Maximum readings of all POWER (P6) within OFDM frequency span.
POWER (AVG): Average readings of all POWER (P6) within OFDM frequency span.
POWER (MIN): Minimum readings of all POWER (P6) within OFDM frequency span.
MER (PLC): Average MER value of OFDM valid subcarriers (8 or 16) with PLC signal.
MER (AVG): Average MER value of all OFDM valid subcarriers.
MER (STD DEV): Standard deviation among all valid subcarriers’ MER and average values.
MER PCTL (2%): Normal (Gaussian) distribution of all valid subcarriers according to the MER value. This
value is a MER statistical threshold, that is, the number of carriers whose MER is lower than
this threshold occupies all the active carriers 2% of the number.
CW (TOTAL): Total Code Word, the total number of transmission code words.
CWE (Uncor): Uncorrected code word error, uncorrectable error code word.
CWE (Corr): Corrected code word error, error-correcting error code word.
23-1.2 Interpreting the Data
The test interface includes a color-coded graph of signal levels
and MER carrier statistics (shown, right). The graph illustrates two
important measurements: the P6 power distribution curve, and
the MER distribution curve.
Power (P6) Distribution Curve When performing this measurement, the OFDM signal is first
divided into 6MHz-bandwidths, and then the power levels of
each segment are calculated and connected into a curve.
This appears as the green trace in the graph.
For example, in a 4K OFDM scenario where the occupied bandwidth is 204.8MHz and each carrier is 50kHz,
the signal can be divided into 32 frequency bands of 6MHz, each covering 120 carriers. By calculating the
power levels of these 32 bands, we get 32 distinct data points to connect into a trace.
MER Distribution Curve Here, the DS2831 reads the MER of all subcarriers and processes them according to the width of the display
window. This appears as the yellow and pink traces in the graph.
For example, in a 4K OFDM scenario where the display window is 256 pixels wide, each pixel must display
the MER data of 16 carriers. By calculating the maximum, minimum, and average MER of these 16 carriers
and plotting them, the user can see how they fluctuate over time.
In the graph above, the yellow trace reflects the difference between the maximum/minimum MER values
of all carriers in each column, while the pink curve reflects their average MER. The blue translucent region marks the PLC frequency.
You can also move the cursor (red line), using the touchscreen or arrow keys. Check the bottom of the
screen to see the subcarrier currently marked by the cursor, as well as its carrier number, frequency, power
level, MER, and more. The cursor can be moved to the corresponding carrier with the positive/negative
peak search tools (F5 and F6).

129
Part II: Settings and Measurements
In the CH> (F1) menu, enter Profile view to see the
profile information table (shown, right).
This table shows the status of NCP, PLC, & profiles A, B,
C, and D; as well as bit error rate statistics.
In the same menu, enter Graph view to see the carrier
MER distribution graph. This graph shows the ratio of
[occurrences of all MER values across all carriers] :
[total number of carriers].
As shown, most carriers measure at 44~48dB MER.
Among these, about 98% of carriers measure >45.25dB.
23-2 OFDM In-Band Frequency Response
From the main OFDM menu, press ICFR (F2) to enter ICFR mode.
In this mode, you can view in-band frequency response curves and group time-delay curves individually, in
order to determine whether the current signal transmission meets design requirements. If the ICFR values
fluctuate too widely over time, there may be a problem with the cable, connectors, or other components.

Part II: Settings and Measurements
130
23-3 OFDM Spectrum Measurement
The OFDM spectrum mode is designed to quickly analyze an OFDM channel or full-band spectrum. Press
[CH / Full BW] (F1) to toggle between views.
Customizable parameters include REF (reference level), display scale, RBW, and VBW.
The spectrum display occupies panes 2 and 4 of the OFDM interface, as shown below.
Spectrum Measurement – OFDM Channel
When measuring an OFDM channel, the start frequency corresponds to the OFDM signal’s zero frequency;
spectrum span is determined by the signal’s occupied bandwidth. In the example above:
• Start freq. = 519.6 MHz
• Span = 204.8 MHz
Spectrum Measurement – Full-Band Spectrum
When measuring the full-band spectrum, the frequency range is fixed at 105~1220 MHz.

131
Part II: Settings and Measurements
Chapter 24: Optical Fiber Applications
The DS2831 is equipped with a variety of optical measurement functions and tools, for use in testing and
maintenance of fiber-optic communications equipment. These include:
• Optical power meter (OPM)
• Visual fault locator (VFL)
• Fiber optical inspection scope (FIP)
Optical Measurement Screen
From the Home menu, press F3 to open the optical measurement menu (shown above). The optical power
meter (OPM), visual fault locator (VFL) and fiber optical inspection scope (FIP) applications are available
from this screen; use the rotary knob or dial the appropriate icon number to launch your desired function.
24-1 Introduction to Fiber Connectors
Fiber connectors are the most common passive device used in the field of fiber-optic communications.
These components connect the endfaces of two optical fibers, allowing the continuous transmission of
optical signal. In an optical communications system, connectors appear at nearly every juncture: fiber end-
faces, passive and active optical components’ input and output ports, fiber jumpers, and more.
An optical fiber connector is composed of a pin and connector. For example, with the FC/PC connector
type, “FC” specifies one of several external connection types. (Other external connection formats include
SC, ST, LC, MU, MT-RJ, D4, and E2000.) “PC” indicates the shape of the pin (or “endface”), which can be of
the PC, APC, or UPC standards.
Let’s take a closer look at these different types of fiber endface.

Part II: Settings and Measurements
132
Straight physical contact (PC)
The fiber ends are pressed together in the connector. There is no air gap left to cause reflections. The return
loss is 30 – 55 dB. This is the most common connector type for single mode fibers (e.g. FC/PC, ST, SC/PC, DIN,
HMS, and E2000 connectors).
Slanted (angled) physical contact (APC)
In these connectors, the ends of the fibers are slanted. Again, no air gap is left. This gives the best return loss
(60-80 dB). These connectors are used for high-speed telecom and CATV links (e.g. FC/APC, SC/APC, and
E2000-HRL connectors).
Straight air gap
Inside these connectors is a small air gap between the two fiber ends. Their return loss is less than 14 dB and
the reflection is fairly high. Straight air gap connectors (e.g. ST connectors), are used for multimode fibers.
FC Connector SC Connector ST F Connector
The DS2831 uses the FC/SC/ST replaceable universal
connector interface. Users may replace these with
different connector interfaces, as appropriate for
field applications. (See below.)
NOTE: If you purchased your DS2831 after July 1st,
2016, the default connector type for the OPM
function is SC-APC. VFL is standard with ST-PC.
Replaceable FC/SC/ST universal connector interface

133
Part II: Settings and Measurements
24-2 Optical Power Meter
Optical Power Meter Measurement Screen
Procedure:
1. Connect the optical power meter signal input port to the optical fiber for testing. 2. In the Home menu’s optical application page, use the rotary knob to launch the optical power meter
function.
3. As shown above, set the wavelength as desired. Available wavelengths include 850, 980, 1300, 1310, 1490, 1550, and 1610nm. Optical power measurement results will appear on the gauge, with numeric
readings listed below.
4. Press the Esc button to quit power meter operation and return to the menu.
DBm and mW Conversion table
dBm mW
30.0 1W 1000
20.0 100mW 100
10.0 10mW 10
7.0 5mW 5
0.0 1mW 1
-3.0 500µW 0.5
-10.0 100µW 0.1
-20.0 10µW 0.01
-30.0 1µW 0.001
-40.0 100nW 0.0001

Part II: Settings and Measurements
134
24-3 VFL (Visual Fault Location)
In practice, engineers often use a type of red light source to visually identify bends, faults, or breaks in a
length of optical fiber. These light sources are usually termed visual fault locators.
Through the VFL port on the DS2831’s top panel, it is possible to perform the same function. When active,
the port emits a bright red LED beam.
Visual Fault Locator Screen
Procedure: 1. Connect the optical fiber for testing to the VFL signal output port on the DS2831’s top panel. 2. In the Home menu’s optical application page, use the rotary knob to launch the visual fault locator
function.
3. Press ON (F1) to switch on the beam. Examine the length of the fiber for places where the beam shines
through more easily; these spots may indicate weak fiber walls.
4. Press F2 repeatedly to cycle through flash modes. Normal causes a continuous beam. 1Hz causes the
beam to flash on and off at a rate of about 1 flash per second. 2Hz causes the beam to flash at about
2 flashes per second.
5. When finished, turn the beam OFF (F1) and disconnect the fiber from the DS2831. Press the Esc
button to quit VFL operation and return to the menu.
SAFETY WARNING!
Take caution with high-powered light sources, or serious eye damage may occur.
To avoid risk of blindness, do not look directly into the VFL port, and keep the safety cap on when this function is not in use.

135
Part II: Settings and Measurements
24-4 Fiber Scope
A crucial part of optical fiber maintenance is ensuring that the fiber endface is free of contamination.
When particles of dirt or debris become caught in the endface, signal transmission performance suffers. The
DS2831’s fiber inspection scope allows you to examine connector endfaces in real-time, identifying issues
with automatic pass/fail testing.
Fiber Optical Inspection Scope
Procedure: 1. Connect the fiber inspection scope USB connector to the USB port in the DS2831’s top panel. Then
connect the optical fiber for testing to this connector.
2. In the Home menu’s optical application page, use the rotary knob to launch the fiber inspection
scope application.
3. The scope’s image will appear on the DS2831 screen. Using the focus knob on the scope, adjust the image until it is clear.
4. The entry fields on the right allow you to control the scope’s brightness, contrast, and sharpness. Use the rotary knob and arrow keys to tune these values, creating a clearly visible image (as above).
5. Press Diagnosis (F1). The DS2831 will attempt to highlight contamination. If it cannot produce a result,
re-adjust the focus and image parameters and try again. If contamination is detected, it will appear in
red on the screen with a FAIL notification. Otherwise, the instrument will show PASS.
6. When finished, press Esc to quit the inspection scope function and return to the menu.

Part III: Background and Concepts
136
Part III Background and
Concepts

137
Part III: Background and Concepts
Unit Conversion Chart
Unit Impedance 50Ω Impedance 75Ω
µV 1µV=10-6V 1µV=10-6V
mV 1mV=1000µV 1mV=1000µV
dBµV 0dBµV=1µV 0dBµV=1µV
dBmV 0dBmV=1mV 0dBmV=1mV
dBm 0dBm=107dBµV 0dBm=108.8dBµV
Chapter 25: Analog TV Standards & Color Systems
There are many different TV standards in use around the world, defining in detail the acceptable baseband
and RF structure of a signal. But for broadband engineers and technicians, the key points are bandwidth;
the dimensions of the lower (vestigial) and upper sidebands; and the frequency & amplitude relationships
of the video (luminance), color (chrominance) and audio subcarriers.
In terms of these parameters, the vast majority of TV transmissions fall into just six categories, which are
illustrated in the following diagrams.
(Note: These diagrams do not define parameters such as field frequency, line frequency, or color encoding
technique, points which distinguish the NTSC, PAL and SECAM systems.)
Today, there are 10 primary TV standards in use around the world. These standards are: B, D, G, H, I, K, K1, L,
M, and N. There are three types of color transmission system: PAL, NTSC, and SECAM.
Different standards and systems have different field frequencies, line frequencies, and color encoding
techniques. For example, Europe and China use the PAL-D color transmission system and TV standard, while
North America (USA, Canada & Mexico) use NTSC-M color transmission system and TV standard.
Refer to the table below for information on TV-standard/color system compatibility. Letters (e.g. B, G, M)
refer to TV standards. Encoding techniques (e.g. NTSC, PAL) refer to systems.
TV Standard and Color Transmission System Relationships:
Standard Compatible with:
B PAL,SECAM D SECAM
G PAL,SECAM H PAL,SECAM I PAL
K SECAM
K1 SECAM
L SECAM
M NTSC,PAL N PAL

Part III: Background and Concepts
138
Reference for the Following Diagrams: Cs: Audio carrier
Cv: Video carrier
Cc: Color subcarrier
VSB: Vestigial Sideband
USB: Upper Sideband
TV Standard - M, N TV Standard - B, G
TV Standard - D, K TV Standard - H
TV Standard – I TV Standard - K1, L

139
Part III: Background and Concepts
TV standard and color system parameters setup
TV Standard Lines per frame Field frequency Color encoding Color subcarrier
NTSC-M 525 60Hz NTSC 3.58MHz
PAL-M 525 60Hz NTSC 3.58MHz
PAL-B,D,G,H,I 625 50Hz PAL 4.43MHz
PAL-N 625 50Hz PAL 4.43MHz
PAL-N combo 625 50Hz PAL 3.58MHz
SECAM 625 50Hz SECAM 4.406MHz
4.250MHz
Different standard audio frequency and bandwidth
Analog TV standard Audio 1 offset (MHz) Audio 2 offset (MHz) Channel bandwidth (MHz)
NTSC-M 4.50 4.50 6.00
PAL-B 5.50 5.85 7.00
PAL-D 6.50 6.85 8.00
PAL-H 5.50 5.85 8.00
PAL-I 6.00 6.50 8.00
PAL-K 6.50 6.85 8.00
PAL-M 4.50 4.50 6.00
PAL-N 4.50 4.50 6.00
SECAM-B 5.50 5.85 7.00
SECAM-D 6.50 6.85 8.00
SECAM-G 5.50 5.85 8.00
SECAM-H 5.50 5.85 8.00
SECAM-K1 6.50 6.85 8.00
SECAM-K 6.50 6.85 8.00
SECAM-L 6.50 6.85 8.00

Part III: Background and Concepts
140
Chapter 26: Analog TV Baseband Signals
26-1 Understanding Composite Video Signal
A composite video signal is a signal containing all three main components required to generate video.
These components are:
• The luminance signal contains the intensity (brightness) information of the video image.
• The chrominance signal contains the color information of the video image.
• The synchronization signal controls the scanning of the signal on a display such as a TV screen.
The monochrome composite signal (or “Y signal”) is constructed from two of these components: luminance
and synchronization.
Here, the luminance steps from white to black. The chrominance signal is also called the “C signal”.
Finally, the composite color video signal (or “Color Video, Blank, and Sync”
(CVBS) signal) is the sum of the Y and C signals. CVBS = Y + C.

141
Part III: Background and Concepts
The synchronization signals in an analog composite baseband
To reproduce an image, both the camera and the video display are scanned horizontally and vertically
(see graph a in the above figure). The horizontal lines on the screen are scanned alternately – first the odd-
numbered lines, then the even – as in interlaced scanning systems, or they might be scanned sequentially
as in progressive scanning systems.
Both the camera and display must be synchronized to scan the same part of the image at the same time.
This synchronization is handled by the horizontal sync pulse, which is part of the baseband video signal. The
horizontal sync pulse starts a horizontal trace. During the horizontal blanking interval, the beam returns to
the left side of the screen and waits for the horizontal sync pulse before tracing another line. This is called
“horizontal retrace” (see graph b in above).
When the beam reaches the bottom of the screen, it must return to the top to begin the next field / frame.
This is called the “vertical retrace” and is signaled by the vertical sync pulse (see graph c above). Vertical
retracing takes much longer than a single horizontal retrace, so a longer synchronizing interval – called the
“vertical blanking interval” – is employed. No information is written on the video screen during the horizontal
or vertical blanking intervals.
Each video standard sets a series of synchronization signals that controls how the video signal is displayed.
For instance, PAL signals display a video frame 25 times a second and a frame contains 625 video lines,
while NTSC signals display a video frame 30 times a second, but with only 525 lines.
Active Image Value
Video Format Lines/Frame Active Lines Frame Rate
(frames/sec)
Line
Duration
Active Line
Duration
NTSC 525 480/486 29.97 63.55 µs 52.2 µs
PAL/SECAM 625 576 25.00 64.00 µs 52.0 µs

Part III: Background and Concepts
142
The active video image resulting from the scanning always has an aspect ratio (horizontal/vertical) of 4/3,
regardless of the video format. The color composite video signal shows that the scanning process requires
some additional room on the left and right sides of each line, as well as on the top and bottom, of the
active video image region. This additional room includes the synchronization signals, color bursts, and other
format-specific information, like the ITS, which are not part of the active video image. Approximately 90% of
all the lines, and 80% of each line, can transmit the active image information. The exact values depend on
the video format, as shown in the table above.
"Active Lines" represents the number of lines that are actually used to transmit the image information. For
example, only 480 lines out of 525 lines per frame transmit the image information in NTSC. Likewise, on each
line, the image information is transmitted only during the active lines sequence, which is shorter than the
entire line duration. For example, of 63.55 µs, only 52.2 µs are the active line duration in NTSC. Frame rate is
the scanning speed.
26-2 Principles of Interlaced Scanning
All composite video systems display the video image on a TV screen using an interlaced scanning
technique. The figure below depicts the concept of interlaced scanning.
Video Scanning Interlaced Scanning on a TV Screen
The analog video signal includes synchronization pulses that control the scanning line by line from left to
right and field by field from top to bottom. The pulses that control the line-by-line scanning are called the
horizontal synchronization pulses (H-Sync). The pulses that control the vertical scanning are called the
vertical synchronization pulses (V-Sync).
Two interlaced fields compose a complete frame. The first field, called the odd field, scans the odd lines of
the video image. The second field, called the even field, scans the even lines of the video image. The
process repeats for every frame.
Picture Area larger than Screen Area

143
Part III: Background and Concepts
26-3 Principles of Gated Measurements
Field A television image, or frame, is composed of 525 (or 625 lines). When displayed, these are delivered in two
successive fields of 262.5 (or 312.5 lines) interlaced together on a CRT. When Field is set to Entire Frame, the
line count starts at line one in field one (often referred to as the “odd field”) and ends at 525 (or 625) in field
two (often referred to as the “even field”). When Field is set to Field One or Field Two, the line count begins
at “1” with the first full line in the selected field and ends at count 263 (or 313) for Field One, and 262 (or 312)
for Field Two.
Sync Analog broadcast or cable television signals are usually amplitude-modulated on an RF carrier. For NTSC
and PAL broadcasts, typically the RF carrier amplitude is maximized at the sync tips of the baseband video
waveform and minimized at the “white” level. This results in a demodulated waveform on the analyzer
where the sync pulses are on top, or positive (Sync [Pos]). With SECAM broadcasts, typically the RF carrier
amplitude is minimized at the sync tips of the video waveform and maximized at the “white” level. This
results in a waveform on the analyzer where the sync pulses are at the bottom, or negative (Sync [Neg]). A
normal baseband video waveform for all TV standards will have the sync tips on the bottom. When TV
Source is set to Ext Video In, Sync should be set to Neg.
Composite color TV video signal is composed by the modulated chrominance, and is added to the
luminance information along with appropriate horizontal and vertical sync signals, blanking signals, and
color burst signals. In a system of 625 scanning lines, there are 25 blanking lines, lines 623~22 in odd field and
line lines 311~335 in even field. These lines are used to transmit blanking signal for the electron beam at the
end of the line scanning and field scanning can come back to the start point of the picture. In a system of
625 scanning lines, every field has 25 lines as the flyback line, so every frame only has 575 effective lines.
When engineers test TV systems, they often use full-field test signals, requiring interruption of TV broadcast.
Obviously, if we want to test the dynamic parameters, we cannot conduct measurements and broadcast
TV programs at the same time. As the TV industry has continued to develop, TV program broadcast hours
continuously increase. TV program service providers hope to monitor TV system performance parameters
and judge whether the broadcast equipment is sufficient or not according to these parameters. They can
modify this equipment according to these parameters. This requirement is very important for TV program
service providers.
Vertical blanking interval is not used to transmit any information. Later, researchers use these free lines to
convey auxiliary signals for increasing the bandwidth utilization ratio. Vertical Interval Test Signal (VITS) can
give important system dynamic performance parameters without influencing the TV program broadcast.
VITS also provides the possibility to automatically monitor, modify and broadcast. Inserting test signals in the
vertical blanking interval is used in real time monitoring, helping to modify and improve TV transmission
quality by at least determining which parameter is below acceptable quality or does not meet mandatory
thresholds prescribed by the FCC. Now, the VITS signal is an indispensable part of international and
domestic TV signals.
Some signals can measure video parameters: in-channel frequency response, luminance nonlinear
distortion, Differential Gain, Differential Phase, Chrominance Luminance Gain Inequality and Chrominance
Luminance Time Delay Inequality. These test signals are combined into some composite test signals
meeting the video transmission line signal and insert vertical blanking interval after the field sync pulse.
These composite signals are called VITS signal and these vertical blanking interval line are called insert test
line.

Part III: Background and Concepts
144
26-3.1 CCN, CSO and CTB Gated Measurements
CCN, C/CSO and C/CTB all can do gated measurement, but the C/CTB gated measurement is slightly
different from C/N’s and C/CSO’s: C/CTB interference falls right at the video carrier frequency. First, we shall
discuss CCN and C/CSO gated measurement.
CCN gated measurements must measure video signal carrier peak levels and corrected noise levels (over
a specified bandwidth) on a quiet line during the vertical blanking interval. These two results are then used
to calculate CCN.
A C/CSO gated measurement also needs to measure video signal carrier peak level and second order
beat on a quiet line during the vertical blanking interval, and then uses the results to calculate C/CSO.
C/CTB gated measurements differ from CCN and C/CSO, because the third order beat coherent distortion
is located directly at the video carrier frequency. By definition, this signal is covered by the video carrier. In
order to measure the third order beat, you must shut off the video signal carrier. Using traditional methods,
you would need to shut off the modulator, let the video carrier level disappear, and then measure the third
order beat right at the video carrier frequency. In gated measurement mode, however, it is suggested that
you use a quiet line inserter, which gates off at the necessary time (at the specified field).
The DS2831 first measures the video carrier peak level during the sync pulse. Then, while the quiet line
inserter removes a specified line at the same time in every frame, the instrument uses the gated function to
measure third order beat. The instrument uses two results to calculate the C/CTB. The effects of removing a
quite line during a specific vertical blanking interval are the same as if you shut off the modulator, but at a
very brief, specific time.
The figure below illustrates how a quiet line inserter should be installed behind each modulator to be tested.
The advantage of using a quiet line inserter is that, prior to inserting a quiet line, it removes the line to be
used for insertion of the quiet line first. Using this method, C/CTB measurements are almost undetectable by
the end user customer: a low-level audible sound is emitted, but this is a better solution than removing
modulation, which renders TV picture and sound inoperable for the duration of the test.
When performing a C/CTB measurement with a quiet line inserter (remembering to remove the line first) by
removing/inserting only one of the 2 video fields, the audible distortion coming out of the speaker of your
television is almost indistinguishable. (If both fields are used, the pitch of the audible distortion is higher and
more noticeable.)
CTB quit line removing equipment connection
Quiet line inserter in this example: TVMS4200.

145
Part III: Background and Concepts
26-3.2 Video Parameters Gated Measurement
VITS (Vertical Interval Test Signal) In the past, engineers often used full-field test signal to test TV systems. This particular test process requires
the field or HE engineer to interrupt the specific channels from broadcasting. In today’s HFC networks, for
competitive and other reasons, this is no longer a feasible plan. With the continuous growth of the CATV
industry, it is critical that broadcast TV programs are not interrupted during testing and monitoring of CATV
system performance. VITS, a method of inserting undetectable test signals during the vertical blanking
interval, allows CATV operators to conduct performance testing without disrupting service to customers.
1. VITS insert position provision. The composite test signal is inserted into an empty, unimportant or undesired line of the vertical blanking
interval behind the sync pulse field, e.g. lines 16-22 or line 329-335 in a 625-line system. (These particular lines
do not typically show, and/or cannot be visualized on the viewable portion of your television screen.)
In 1969, CCIR changed its recommendation for usage of international TV programs from 625 line systems to
VITS. The recommended VITS insertion position is as follows:
Insertion Line Application
16 (329) Data and communication signal
17, 18 (330, 33) International VITS signal position, for
21 (334) Teletext broadcast
The following figures illustrate some of the most widely used VITS signals.
CCIR Line 17
CCIR17 test signal The first peak from the left is a white flag with peak amplitude of 700mV (relative to blanking level) and a
width of 10µs; a zero carrier reference (base white) for measuring video signal amplitude and depth of
modulation. The second from the left is 2T pulse with a half-amplitude width of 200ns, it is used to measure K
factor. Cable TV systems use K-2T factor to replace echo measurement. The third from the left is a
composite sine square pulse with a half-amplitude width of 20T (2µs). The 4.43MHz color subcarrier sine
wave is filled in the 20 sine square envelope (standard for luminance signal), 20T modulated chrominance
pulse is used to measure Chrominance-Luminance Delay Inequality and Gain Inequality. The fourth from
the left is 5-step luminance staircase signal; every staircase step is 140mV, which is used to measure
luminance nonlinear characteristic.

Part III: Background and Concepts
146
CCIR Line 18(multiburst)
CCIR 18 test signal CCIR 18, also called a multiburst signal, consists of a set of single frequency sine wave signals with equal
amplitude. The left side is a white flag with a peak amplitude 420mVp-p and provide amplitude standard
for the following multiburst signals. Followed by six sine wave frequency packets, each frequency packet is:
0.5, 1.0, 2.0, 4.0, 4.8, and 5.8MHz. The multiburst signal is used to measure transmission system video
bandwidth frequency and amplitude response characteristic.
GCR signal line A for 525-line systems
Ghost Cancellation Reference (GCR)
This signal is also often used to measure in-channel frequency response.
CCIR Line 330

147
Part III: Background and Concepts
CCIR 330 test signal The first peak from the left is a white flag with peak amplitude of 700mV (relative to blanking level) and a
width of 10µs; a zero carrier reference (base white) for measuring video signal amplitude and depth of
modulation. The second from the left is 2T pulse with a half-amplitude width of 200ns, it is used to measure K
factor. Cable TV systems use K-2T factor to replace echo measurement. The third from the left is the
blanking level and 5 luminance steps superimposed with a 4.43MHz color subcarrier sine wave; the color
burst is 280mV and used to lock color signal phase. The 5-step luminance staircase and blanking is used to
represent six different luminance levels. This third part of the signal is used to measure DG and DP.
GB19 NTC-7 Composite
UK ITS1
The VITS composite signals are composed of several basic types of test signal:
1. 0.7±7mV line bar, as the standard level; 2. 2T pulse: used to measure high frequency character of channel; 3. 10T or 20T pulse made up of a sine-squared luminance pulse and a chrominance packet with a sine-
squared envelope: used to measure Chrominance-Luminance Inequality character of a channel.
4. 5-step luminance staircase signal: used to measure Luminance nonlinear distortion of channel. 5. Luminance steps superimposed with modulated chrominance: used to measure chrominance
amplitude and phase distortion caused by luminance amplitude change of a channel.
6. Multiburst: used to measure the flatness of a channel in 6MHz video bandwidth.
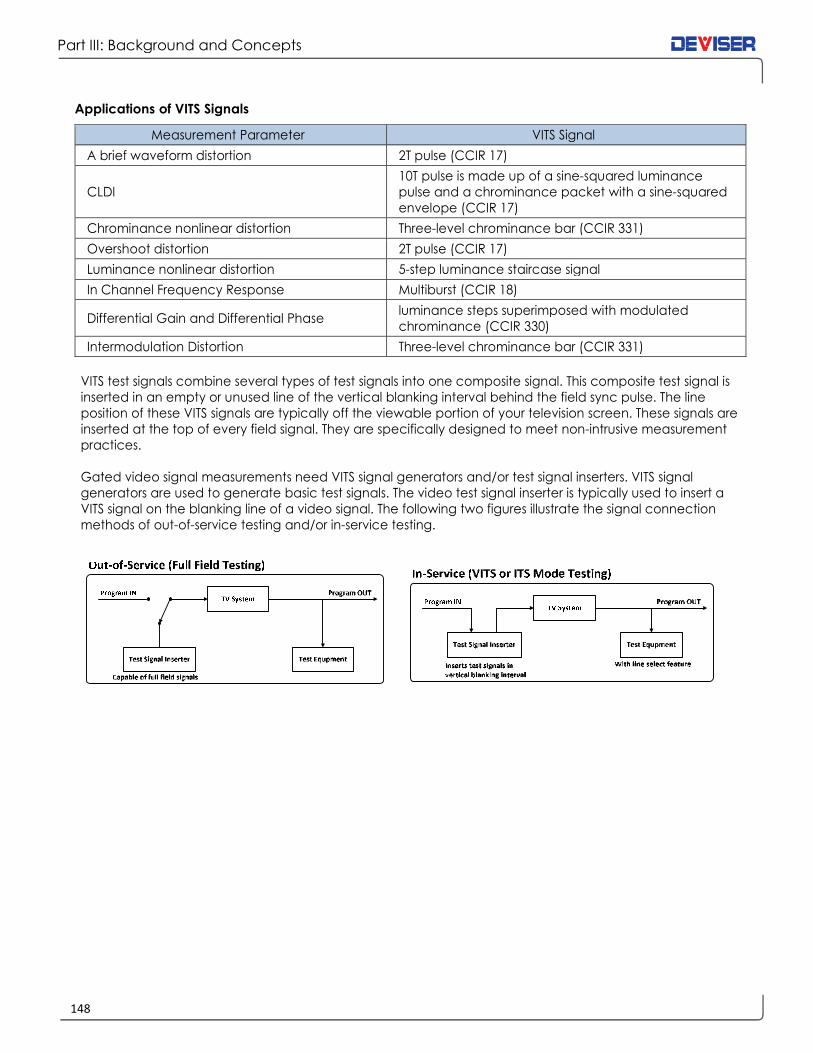
Part III: Background and Concepts
148
Applications of VITS Signals
Measurement Parameter VITS Signal
A brief waveform distortion 2T pulse (CCIR 17)
CLDI
10T pulse is made up of a sine-squared luminance
pulse and a chrominance packet with a sine-squared
envelope (CCIR 17)
Chrominance nonlinear distortion Three-level chrominance bar (CCIR 331)
Overshoot distortion 2T pulse (CCIR 17)
Luminance nonlinear distortion 5-step luminance staircase signal
In Channel Frequency Response Multiburst (CCIR 18)
Differential Gain and Differential Phase luminance steps superimposed with modulated
chrominance (CCIR 330)
Intermodulation Distortion Three-level chrominance bar (CCIR 331)
VITS test signals combine several types of test signals into one composite signal. This composite test signal is
inserted in an empty or unused line of the vertical blanking interval behind the field sync pulse. The line
position of these VITS signals are typically off the viewable portion of your television screen. These signals are
inserted at the top of every field signal. They are specifically designed to meet non-intrusive measurement
practices.
Gated video signal measurements need VITS signal generators and/or test signal inserters. VITS signal
generators are used to generate basic test signals. The video test signal inserter is typically used to insert a
VITS signal on the blanking line of a video signal. The following two figures illustrate the signal connection
methods of out-of-service testing and/or in-service testing.

149
Part III: Background and Concepts
Chapter 27: Resolution and Video Bandwidth
27-1 Resolution Bandwidth filter (RBW)
The frequency resolution is the ability to clearly distinguish 2 input sine wave signal responses of a spectrum
analyzer. The ability of a spectrum analyzer to distinguish signals is generally described within 3dB of the
available bandwidth IF filter.
For analog intermediate frequency: The bandwidth of the smallest intermediate frequency filter generally determines the resolution bandwidth
capability of an instrument.
Switching from one filter to another offers a different resolution of the measurement. Wide resolution
bandwidth filters require less time to scan, are more stable when the sweep time is shorter (faster), require
less time for the signal to reach full amplitude within the filter shape as it is scanning through. However, they
offer less resolution, dynamic range and lower S/N range. Narrower bandwidth filters requires more time, or
slower sweep time setting to allow the full amplitude of the signal to be measured, to be reached within the
filter as it is scanning, but it does offer a much higher resolution, better dynamic range and better S/N.
The DS2831 offers automatic or manual RBW selection depending on frequency/span/sweep time selection
and/or what the user is looking for. The DS2831 uses digital IF and leverages DSP (Digital Signal Processing)
techniques of implementation, so the digital filters won’t drift as analog filters would in older spectrum
analyzers. Digital IF technology provides VERY good measurement stability with a much wider selection of
Frequency/Span/Sweep times, and still provide a very stable and accurate measurement.
27-2 Video Bandwidth filter (VBW)
In order to reduce the influence of noise variations in the display of signal amplitude, Spectrum Analyzers
typically smooth or average the trace display. The selectable video bandwidth filter in a spectrum analyzer
is used for that purpose.
It is a low-pass video filter, which determines the bandwidth of the video signal located behind the
envelope detector. The value of this video filter is typically lower than the RBW selected. The intended
purpose is to average or smooth the displayed signal.

Part III: Background and Concepts
150
Chapter 28: Detector Mode
When measuring and analyzing different types of signals with a spectrum analyzer, the detector mode
should be set correctly. “Pixel point” is an important concept related to the detector mode of a spectrum
analyzer. Suppose the spectrum curve is divided into “n” pixel points. When the span of the spectrum is
large, each pixel point contains a relatively large frequency range of information (acquired data or
acquisitions).
Screen size and resolution limits the amount of pixels that can be displayed on the screen, and since each
pixel point can only show one value, each pixel may represent multiple measurement (or sample or
acquisition) points. It is clear that not all data points can be displayed on the screen of a small portable
piece of equipment so each displayed pixel on the screen must be processed to reduce the number of
displayed pixels.
Detector modes & applications
Detector Mode Recommended Applications
Positive peak detection
CW signal and peak signal level measurements.
Effective for detecting the maximum value from all
sample points of a pixel point to display.
Sample detection
Noise signal measurements. Randomly selects a
sample point from all acquisitions (or sample) points. It
represents random noise fluctuations very well.
Negative peak detection
Small-resolution signal measurements. Effective for
detecting the minimum value from all sample points
of a pixel point to display.
Average detection
ACPR and channel power measurements. Each pixel
point represents multiple sample points & amplitude
data. Average detection uses each sample point’s
data for each pixel point, averaging the linear value
of all sample points dedicated to each pixel point.
RMS (Root-Mean-Square) detection
Total power measurements or noise-like signals (e.g.,
CDMA, QAM). Calculates value of all sample points
allocated to each pixel point; the result corresponds
to the signal power in the selected bandwidth. In RMS
detection mode, it is recommended that the VBW
filter be ≥3 times the RBW filter.
The number of trace points saved in memory is based on detector algorithm Principle of Average Detector

151
Part III: Background and Concepts
Chapter 29: International CATV Standards
System and Standards by Country
Country System Standard Country System Standard
Afghanistan
Albania
Algeria
Argentina
Angola
Australia
Antigua & Barbuda
Austria
Azores (Portugal)
Bahamas
Bahrain
Bangladesh
Barbados
Belgium
Belize
Bermuda
Bolivia
Brazil
Bosnia
Brunei
Bulgaria
Burma (Myanmar)
Cambodia
Cameroon
Canada
Canary Islands
Central African Rep.
Chad
Chile
China
Colombia
Congo
Costa Rica
Cuba
Cyprus
Czech Republic
Denmark
Dominican Rep.
Ecuador
Egypt
Eire (Ireland)
Libya
Lithuania
Luxembourg
Malaysia
Mali
Malta
Martinique
Mauritius
PAL
PAL
PAL
PAL
PAL
PAL
NTSC
PAL
PAL
NTSC
PAL
PAL
NTSC
PAL
NTSC
NTSC
NTSC
PAL
PAL
PAL
SECAM
NTSC
SECAM
PAL
NTSC
PAL
SECAM
SECAM
NTSC
PAL
NTSC
SECAM
NTSC
NTSC
PAL
SECAM
PAL
NTSC
NTSC
SECAM
PAL
PAL
PAL
PAL
PAL
SECAM
PAL
SECAM
SECAM
D
B/G
B
N
I
B
M
B/G
B
M
B
B
M
B/G
M
M
N
M
B/H
B
D
N
M
B
M
B
K
K
M
D
M
D
M
M
B/G
D/K
B/G
M
M
B
I
B
B/G
B/G
B
K
B/G
K
B
El Salvador
Equatorial Guinea
Estonia
Ethiopia
Finland
France
French Guiana
Gabon
Germany
Ghana
Gibraltar
Greece
Greenland
Granada
Guadeloup
Guam
Guatemala
Haiti
Honduras
Hong Kong
Hungary
Iceland
India
Indonesia
Iran
Iraq
Ireland (Republic of)
Israel
Italy
Ivory Coast
Jamaica
Japan
Jordan
Kenya
Korea (P.D.R.)
Korea (South)
Kuwait
Laos
Latvia
Lebanon
Liberia
Sierra Leone
Singapore
Slovakia
Slovenia
Somalia
South Africa
Spain
Sri Lanka
NTSC
PAL
PAL
PAL
PAL
SECAM
SECAM
SECAM
PAL
PAL
PAL
SECAM
NTSC
NTSC
SECAM
NTSC
NTSC
SECAM
NTSC
PAL
PAL
PAL
PAL
PAL
SECAM
SECAM
PAL
PAL
PAL
SECAM
NTSC
NTSC
PAL
PAL
PAL
NTSC
PAL
PAL
PAL
PAL
PAL
PAL
PAL
SECAM
PAL
PAL
PAL
PAL
PAL
M
B
B/G
B
B/G
L
K
K
B/G
B
B
B/G
M
M
K
M
M
M
M
I
B/G
B
B
B
B
B
I
B/G
B/G
K
M
M
B
B
D
M
B/G
M
B/G
B/G
B
B
B
D/K
B/G
B
I
B/G
B
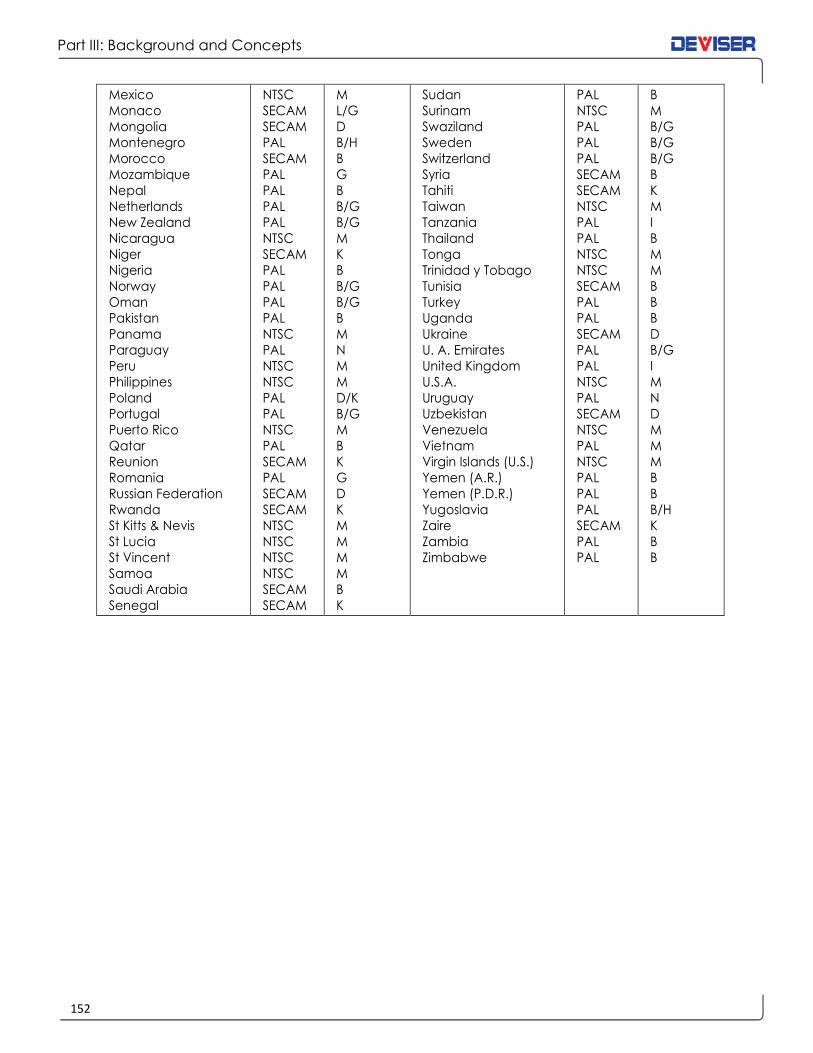
Part III: Background and Concepts
152
Mexico
Monaco
Mongolia
Montenegro
Morocco
Mozambique
Nepal
Netherlands
New Zealand
Nicaragua
Niger
Nigeria
Norway
Oman
Pakistan
Panama
Paraguay
Peru
Philippines
Poland
Portugal
Puerto Rico
Qatar
Reunion
Romania
Russian Federation
Rwanda
St Kitts & Nevis
St Lucia
St Vincent
Samoa
Saudi Arabia
Senegal
NTSC
SECAM
SECAM
PAL
SECAM
PAL
PAL
PAL
PAL
NTSC
SECAM
PAL
PAL
PAL
PAL
NTSC
PAL
NTSC
NTSC
PAL
PAL
NTSC
PAL
SECAM
PAL
SECAM
SECAM
NTSC
NTSC
NTSC
NTSC
SECAM
SECAM
M
L/G
D
B/H
B
G
B
B/G
B/G
M
K
B
B/G
B/G
B
M
N
M
M
D/K
B/G
M
B
K
G
D
K
M
M
M
M
B
K
Sudan
Surinam
Swaziland
Sweden
Switzerland
Syria
Tahiti
Taiwan
Tanzania
Thailand
Tonga
Trinidad y Tobago
Tunisia
Turkey
Uganda
Ukraine
U. A. Emirates
United Kingdom
U.S.A.
Uruguay
Uzbekistan
Venezuela
Vietnam
Virgin Islands (U.S.)
Yemen (A.R.)
Yemen (P.D.R.)
Yugoslavia
Zaire
Zambia
Zimbabwe
PAL
NTSC
PAL
PAL
PAL
SECAM
SECAM
NTSC
PAL
PAL
NTSC
NTSC
SECAM
PAL
PAL
SECAM
PAL
PAL
NTSC
PAL
SECAM
NTSC
PAL
NTSC
PAL
PAL
PAL
SECAM
PAL
PAL
B
M
B/G
B/G
B/G
B
K
M
I
B
M
M
B
B
B
D
B/G
I
M
N
D
M
M
M
B
B
B/H
K
B
B

153
Part III: Background and Concepts
Common CATV Channel Plans: North America
EIA channel Standard Incremental Harmonic
new old Video Audio Video Audio Video Audio
T7
T8
T9
T10
T11
T12
T13
2
3
4
1
5
6
95
96
97
98
99
14
15
16
17
18
19
20
21
22
7
8
9
10
11
12
13
23
24
25
26
27
28
29
30
31
32
33
34
35
36
37
38
39
none
none
none
none
none
none
none
2
3
4
A-8
5
6
A-5
A-4
A-3
A-2
A-1
A
B
C
D
E
F
G
H
I
7
8
9
10
11
12
13
J
K
L
M
N
O
P
Q
R
S
T
U
V
W
AA
BB
CC
7.0000 11.5000
13.0000 17.5000
19.0000 23.5000
25.0000 29.5000
31.0000 35.5000
37.0000 41.5000
43.0000 47.5000
55.2500 59.7500
61.2500 65.7500
67.2500 71.7500
NA NA
77.2500 81.7500
83.2500 87.7500
91.2500 95.7500
97.2500 101.7500
103.2500 107.7500
109.2750 113.7750
115.2750 119.7750
121.2625 125.7625
127.2625 131.7625
133.2625 137.7625
139.2500 143.7500
145.2500 149.7500
151.2500 155.7500
157.2500 161.7500
163.2500 167.7500
169.2500 173.7500
175.2500 179.7500
181.2500 185.7500
187.2500 191.7500
193.2500 197.7500
199.2500 203.7500
205.2500 209.7500
211.2500 215.7500
217.2500 221.7500
223.2500 227.7500
229.2625 233.7625
235.2625 239.7625
241.2625 245.7625
247.2625 251.7625
253.2625 257.7625
259.2625 263.7625
265.2625 269.7625
271.2625 275.7625
277.2625 281.7625
283.2625 287.7625
289.2625 293.7625
295.2625 299.7625
301.2625 305.7625
307.2625 311.7625
313.2625 317.7625
NA NA
NA NA
NA NA
NA NA
NA NA
NA NA
NA NA
55.2625 59.7625
61.2625 65.7625
67.2625 71.7625
73.2625 77.7625
79.2625 83.7625
85.2625 89.7625
91.2625 95.7625
97.2625 101.7625
103.2625 107.7625
109.2750 113.7750
115.2750 119.7750
121.2625 125.7625
127.2625 131.7625
133.2625 137.7625
139.2625 143.7625
145.2625 149.7625
151.2625 155.7625
157.2625 161.7625
163.2625 167.7625
169.2625 173.7625
175.2625 179.7625
181.2625 185.7625
187.2625 191.7625
193.2625 197.7625
199.2625 203.7625
205.2625 209.7625
211.2625 215.7625
217.2625 221.7625
223.2625 227.7625
229.2625 233.7625
235.2625 239.7625
241.2625 245.7625
247.2625 251.7625
253.2625 257.7625
259.2625 263.7625
265.2625 269.7625
271.2625 275.7625
277.2625 281.7625
283.2625 287.7625
289.2625 293.7625
295.2625 299.7625
301.2625 305.7625
307.2625 311.7625
313.2625 317.7625
NA NA
NA NA
NA NA
NA NA
NA NA
NA NA
NA NA
54.0027 58.5027
60.0030 64.5030
66.0033 70.5033
72.0036 76.5036
78.0039 82.5039
84.0042 88.5042
90.0045 94.5045
96.0048 100.5048
102.0051 106.5051
Cannot lock to comb
ref: refer to FCC regs.
120.0060 124.5060
126.0063 130.5063
132.0066 136.5066
138.0069 142.5069
144.0072 148.5072
150.0075 154.5075
156.0078 160.5078
162.0081 166.5081
168.0084 172.5084
174.0087 178.5087
180.0090 184.5090
186.0093 190.5093
192.0096 196.5096
198.0099 202.5099
204.0102 208.5102
210.0105 214.5105
216.0108 220.5108
222.0111 226.5111
228.0114 232.5114
234.0117 238.5117
240.0120 244.5120
246.0123 250.5123
252.0126 256.5126
258.0129 262.5129
264.0132 268.5132
270.0135 274.5135
276.0138 280.5138
282.0141 286.5141
288.0144 292.5144
294.0147 298.5147
300.0150 304.5150
306.0153 310.5153
312.0156 316.5156

Part III: Background and Concepts
154
40
41
42
43
44
45
46
47
48
49
50
51
52
53
54
55
56
57
58
59
60
61
62
63
64
65
66
67
68
69
70
71
72
73
74
75
76
77
78
79
80
81
82
83
84
85
86
87
88
89
90
91
92
93
94
100
DD
EE
FF
GG
HH
I I
JJ
KK
LL
MM
NN
OO
PP
RR
SS
TT
UU
VV
WW
XX
YY
ZZ
63
64
65
66
67
68
69
70
71
72
73
74
75
76
77
78
79
80
81
82
83
84
85
86
87
88
89
90
91
92
93
94
100
319.2625 323.7625
325.2625 329.7625
331.2750 335.7750
337.2625 341.7625
343.2625 347.7625
349.2625 353.7625
355.2625 359.7625
361.2625 365.7625
367.2625 371.7625
373.2625 377.7625
379.2625 383.7625
385.2625 389.7625
391.2625 395.7625
397.2625 401.7625
403.2500 407.7500
409.2500 413.7500
415.2500 419.7500
421.2500 425.7500
427.2500 431.7500
433.2500 437.7500
439.2500 443.7500
445.2500 449.7500
451.2500 455.7500
457.2500 461.7500
463.2500 467.7500
469.2500 473.7500
475.2500 479.7500
481.2500 485.7500
487.2500 491.7500
493.2500 497.7500
499.2500 503.7500
505.2500 509.7500
511.2500 515.7500
517.2500 521.7500
523.2500 527.7500
529.2500 533.7500
535.2500 539.7500
541.2500 545.7500
547.2500 551.7500
553.2500 557.7500
559.2500 563.7500
565.2500 569.7500
571.2500 575.7500
577.2500 581.7500
583.2500 587.7500
589.2500 593.7500
595.2500 599.7500
601.2500 605.7500
607.2500 611.7500
613.2500 617.7500
619.2500 623.7500
625.2500 629.7500
631.2500 635.7500
637.2500 641.7500
643.2500 647.7500
649.2500 653.7500
319.2625 323.7625
325.2625 329.7625
331.2750 335.7750
337.2625 341.7625
343.2625 347.7625
349.2625 353.7625
355.2625 359.7625
361.2625 365.7625
367.2625 371.7625
373.2625 377.7625
379.2625 383.7625
385.2625 389.7625
391.2625 395.7625
397.2625 401.7625
403.2625 407.7625
409.2625 413.7625
415.2625 419.7625
421.2625 425.7625
427.2625 431.7625
433.2625 437.7625
439.2625 443.7625
445.2625 449.7625
451.2625 455.7625
457.2625 461.7625
463.2625 467.7625
469.2625 473.7625
475.2625 479.7625
481.2625 485.7625
487.2625 491.7625
493.2625 497.7625
499.2625 503.7625
505.2625 509.7625
511.2625 515.7625
517.2625 521.7625
523.2625 527.7625
529.2625 533.7625
535.2625 539.7625
541.2625 545.7625
547.2625 551.7625
553.2625 557.7625
559.2625 563.7625
565.2625 569.7625
571.2625 575.7625
577.2625 581.7625
583.2625 587.7625
589.2625 593.7625
595.2625 599.7625
601.2625 605.7625
607.2625 611.7625
613.2625 617.7625
619.2625 623.7625
625.2625 629.7625
631.2625 635.7625
637.2625 641.7625
643.2625 647.7625
649.2625 653.7625
318.0159 322.5159
324.0162 328.5162
330.0165 334.5165
336.0168 340.5168
342.0171 346.5171
348.0174 352.5174
354.0177 358.5177
360.0180 364.5180
366.0183 370.5183
372.0186 376.5186
378.0189 382.5189
384.0192 388.5192
390.0195 394.5195
396.0198 400.5198
402.0201 406.5201
408.0204 412.5204
414.0207 418.5207
420.0210 424.5210
426.0213 430.5213
432.0216 436.5216
438.0219 442.5219
444.0222 448.5222
450.0225 454.5225
456.0228 460.5228
462.0231 466.5231
468.0234 472.5234
474.0237 478.5237
480.0240 484.5240
486.0243 490.5243
492.0246 496.5246
498.0249 502.5249
504.0252 508.5252
510.0255 514.5255
516.0258 520.5258
522.0261 526.5261
528.0264 532.5264
534.0267 538.5267
540.0270 544.5270
546.0273 550.5273
552.0276 556.5276
558.0279 562.5279
564.0282 568.5282
570.0285 574.5285
576.0288 580.5288
582.0291 586.5291
588.0294 592.5294
594.0297 598.5297
600.0300 604.5300
606.0303 610.5303
612.0306 616.5306
618.0309 622.5309
624.0312 628.5312
630.0315 634.5315
636.0318 640.5318
642.0321 646.5321
648.0324 652.5324
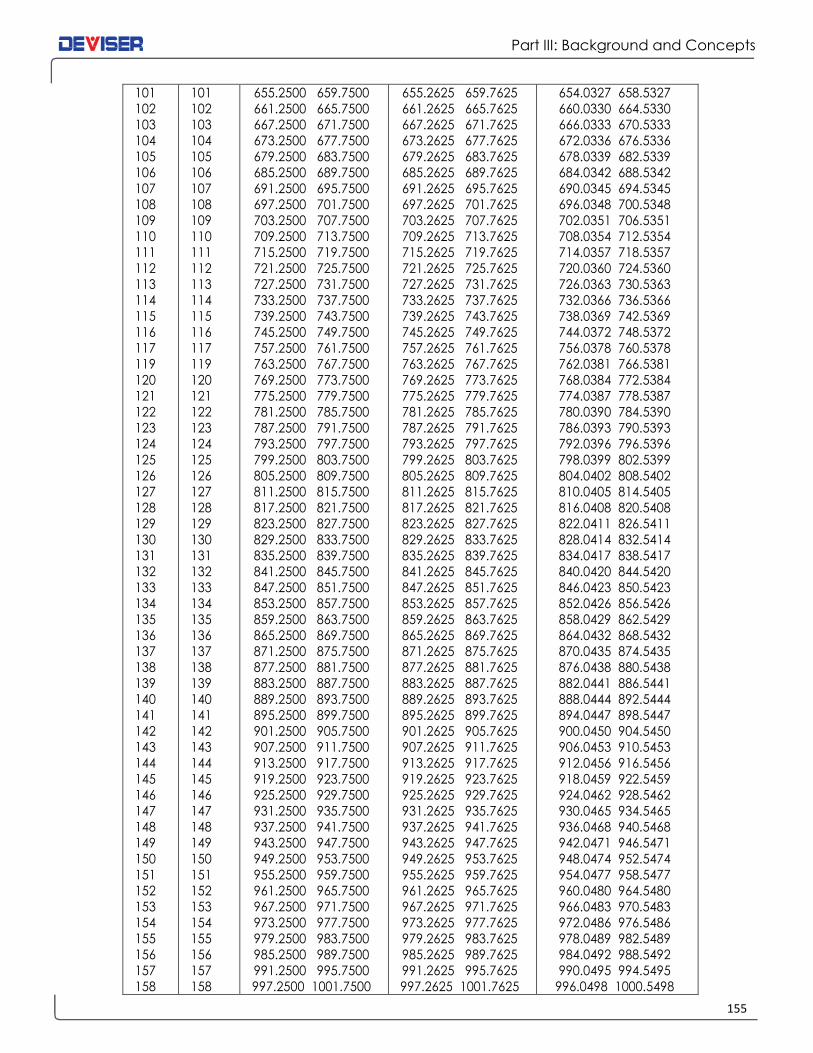
155
Part III: Background and Concepts
101
102
103
104
105
106
107
108
109
110
111
112
113
114
115
116
117
119
120
121
122
123
124
125
126
127
128
129
130
131
132
133
134
135
136
137
138
139
140
141
142
143
144
145
146
147
148
149
150
151
152
153
154
155
156
157
158
101
102
103
104
105
106
107
108
109
110
111
112
113
114
115
116
117
119
120
121
122
123
124
125
126
127
128
129
130
131
132
133
134
135
136
137
138
139
140
141
142
143
144
145
146
147
148
149
150
151
152
153
154
155
156
157
158
655.2500 659.7500
661.2500 665.7500
667.2500 671.7500
673.2500 677.7500
679.2500 683.7500
685.2500 689.7500
691.2500 695.7500
697.2500 701.7500
703.2500 707.7500
709.2500 713.7500
715.2500 719.7500
721.2500 725.7500
727.2500 731.7500
733.2500 737.7500
739.2500 743.7500
745.2500 749.7500
757.2500 761.7500
763.2500 767.7500
769.2500 773.7500
775.2500 779.7500
781.2500 785.7500
787.2500 791.7500
793.2500 797.7500
799.2500 803.7500
805.2500 809.7500
811.2500 815.7500
817.2500 821.7500
823.2500 827.7500
829.2500 833.7500
835.2500 839.7500
841.2500 845.7500
847.2500 851.7500
853.2500 857.7500
859.2500 863.7500
865.2500 869.7500
871.2500 875.7500
877.2500 881.7500
883.2500 887.7500
889.2500 893.7500
895.2500 899.7500
901.2500 905.7500
907.2500 911.7500
913.2500 917.7500
919.2500 923.7500
925.2500 929.7500
931.2500 935.7500
937.2500 941.7500
943.2500 947.7500
949.2500 953.7500
955.2500 959.7500
961.2500 965.7500
967.2500 971.7500
973.2500 977.7500
979.2500 983.7500
985.2500 989.7500
991.2500 995.7500
997.2500 1001.7500
655.2625 659.7625
661.2625 665.7625
667.2625 671.7625
673.2625 677.7625
679.2625 683.7625
685.2625 689.7625
691.2625 695.7625
697.2625 701.7625
703.2625 707.7625
709.2625 713.7625
715.2625 719.7625
721.2625 725.7625
727.2625 731.7625
733.2625 737.7625
739.2625 743.7625
745.2625 749.7625
757.2625 761.7625
763.2625 767.7625
769.2625 773.7625
775.2625 779.7625
781.2625 785.7625
787.2625 791.7625
793.2625 797.7625
799.2625 803.7625
805.2625 809.7625
811.2625 815.7625
817.2625 821.7625
823.2625 827.7625
829.2625 833.7625
835.2625 839.7625
841.2625 845.7625
847.2625 851.7625
853.2625 857.7625
859.2625 863.7625
865.2625 869.7625
871.2625 875.7625
877.2625 881.7625
883.2625 887.7625
889.2625 893.7625
895.2625 899.7625
901.2625 905.7625
907.2625 911.7625
913.2625 917.7625
919.2625 923.7625
925.2625 929.7625
931.2625 935.7625
937.2625 941.7625
943.2625 947.7625
949.2625 953.7625
955.2625 959.7625
961.2625 965.7625
967.2625 971.7625
973.2625 977.7625
979.2625 983.7625
985.2625 989.7625
991.2625 995.7625
997.2625 1001.7625
654.0327 658.5327
660.0330 664.5330
666.0333 670.5333
672.0336 676.5336
678.0339 682.5339
684.0342 688.5342
690.0345 694.5345
696.0348 700.5348
702.0351 706.5351
708.0354 712.5354
714.0357 718.5357
720.0360 724.5360
726.0363 730.5363
732.0366 736.5366
738.0369 742.5369
744.0372 748.5372
756.0378 760.5378
762.0381 766.5381
768.0384 772.5384
774.0387 778.5387
780.0390 784.5390
786.0393 790.5393
792.0396 796.5396
798.0399 802.5399
804.0402 808.5402
810.0405 814.5405
816.0408 820.5408
822.0411 826.5411
828.0414 832.5414
834.0417 838.5417
840.0420 844.5420
846.0423 850.5423
852.0426 856.5426
858.0429 862.5429
864.0432 868.5432
870.0435 874.5435
876.0438 880.5438
882.0441 886.5441
888.0444 892.5444
894.0447 898.5447
900.0450 904.5450
906.0453 910.5453
912.0456 916.5456
918.0459 922.5459
924.0462 928.5462
930.0465 934.5465
936.0468 940.5468
942.0471 946.5471
948.0474 952.5474
954.0477 958.5477
960.0480 964.5480
966.0483 970.5483
972.0486 976.5486
978.0489 982.5489
984.0492 988.5492
990.0495 994.5495
996.0498 1000.5498

Part III: Background and Concepts
156
Common CATV Channel Plans: People's Republic of China (PAL; standard D/K)
Channel Bandwidth: 8MHz
Ch. No. Video Audio Ch. No. Video Audio
DS1
DS2
DS3
DS4
DS5
Z1
Z2
Z3
Z4
Z5
Z6
Z7
DS6
DS7
DS8
DS9
DS10
DS11
DS12
Z8
Z9
Z10
Z11
Z12
Z13
Z14
Z15
Z16
Z17
Z18
Z19
Z20
Z21
Z22
Z23
Z24
Z25
Z26
Z27
Z28
Z29
Z30
Z31
Z32
Z33
Z34
Z35
Z36
Z37
49.75
57.75
65.75
77.25
85.25
112.25
120.25
128.25
136.25
144.25
152.25
160.25
168.25
176.25
184.25
192.25
200.25
208.25
216.25
224.25
232.25
240.25
248.25
256.25
264.25
272.25
280.25
288.25
296.25
304.25
312.25
320.25
328.25
336.25
344.25
352.25
360.25
368.25
376.25
384.25
392.25
400.25
408.25
416.25
424.25
432.25
440.25
448.25
456.25
56.25
64.25
72.25
83.75
91.75
118.75
126.75
134.75
142.75
150.75
158.75
166.75
174.75
182.75
190.75
198.75
206.75
214.75
222.75
230.75
238.75
246.75
254.75
262.75
270.75
278.75
286.75
294.75
302.75
310.75
318.75
326.75
334.75
342.75
350.75
358.75
366.75
374.75
382.75
390.75
398.75
406.75
414.75
422.75
430.75
438.75
446.75
454.75
462.75
DS13
DS14
DS15
DS16
DS17
DS18
DS19
DS20
DS21
DS22
DS23
DS24
Z38
Z39
Z40
Z41
Z42
DS25
DS26
DS27
DS28
DS29
DS30
DS31
DS32
DS33
DS34
DS35
DS36
DS37
DS38
DS39
DS40
DS41
DS42
DS43
DS44
DS45
DS46
DS47
DS48
DS49
DS50
DS51
DS52
DS53
DS54
DS55
DS56
471.25
479.25
487.25
495.25
503.25
511.25
519.25
527.25
535.25
543.25
551.25
559.25
567.25
575.25
583.25
591.25
599.25
607.25
615.25
623.25
631.25
639.25
647.25
655.25
663.25
671.25
679.25
687.25
695.25
703.25
711.25
719.25
727.25
735.25
743.25
751.25
759.25
767.25
775.25
783.25
791.25
799.25
807.25
815.25
823.25
831.25
839.25
847.25
855.25
477.75
485.75
493.75
501.75
509.75
517.75
525.75
533.75
541.75
549.75
557.75
565.75
573.75
581.75
589.75
597.75
605.75
613.75
621.75
629.75
637.75
645.75
653.75
661.75
669.75
677.75
685.75
693.75
701.75
709.75
717.75
725.75
733.75
741.75
749.75
757.75
765.75
773.75
781.75
789.75
797.75
805.75
813.75
821.75
829.75
837.75
845.75
853.75
861.75

157
Part III: Background and Concepts
Common CATV Channel Plans: Europe (PAL; standard B/G)
Channel Bandwidth: 7 and 8 MHz
Ch.No. Video Audio Ch.No Video Audio
7MHz channel spacing 8MHz channel spacing
E2
E3
E4
S2
S3
S4
S5
S6
S7
S8
S9
S10
E5
E6
E7
E8
E9
E10
E11
E12
S11
S12
S13
S14
S15
S16
S17
S18
S19
S20
E36
E37
E38
E39
E40
E41
E42
E43
E44
E45
E46
E47
48.25
55.25
62.25
112.25
119.25
126.25
133.25
140.25
147.25
154.25
161.25
168.25
175.25
182.25
189.25
196.25
203.25
210.25
217.25
224.25
231.25
238.25
245.25
252.25
259.25
266.25
273.25
280.25
287.25
294.25
591.25
599.25
607.25
615.25
623.25
631.25
639.25
647.25
655.25
663.25
671.25
679.25
53.75
60.75
67.75
117.75
124.75
131.75
138.75
145.75
152.75
159.75
166.75
173.75
180.75
187.75
194.75
201.75
208.75
215.75
222.75
229.75
236.75
243.75
250.75
257.75
264.75
271.75
278.75
285.75
292.75
299.75
596.75
604.75
612.75
620.75
628.75
636.75
644.75
652.75
660.75
668.75
676.75
684.75
S21
S22
S23
S24
S25
S26
S27
S28
S29
S30
S31
S32
S33
S34
S35
S36
S37
S38
S39
S40
S41
E21
E22
E23
E24
E25
E26
E27
E28
E29
E30
E31
E32
E33
E34
E35
E53
E54
E55
E56
E67
E58
E59
E60
E61
E62
E63
E64
303.25
311.25
319.25
327.25
335.25
343.25
351.25
359.25
367.25
375.25
383.25
391.25
399.25
407.25
415.25
423.25
431.25
439.25
447.25
455.25
463.25
471.25
479.25
487.25
495.25
503.25
511.25
519.25
527.25
535.25
543.25
551.25
559.25
567.25
575.25
583.25
727.25
735.25
743.25
751.25
759.25
767.25
775.25
783.25
791.25
799.25
807.25
815.25
308.75
316.75
324.75
332.75
340.75
348.75
356.75
364.75
372.75
380.75
388.75
396.75
404.75
412.75
420.75
428.75
436.75
444.75
452.75
460.75
468.75
476.75
484.75
492.75
500.75
508.75
516.75
524.75
532.75
540.75
548.75
556.75
564.75
572.75
580.75
588.75
732.75
740.75
748.75
756.75
764.75
772.75
780.75
788.75
796.75
804.75
812.75
820.75
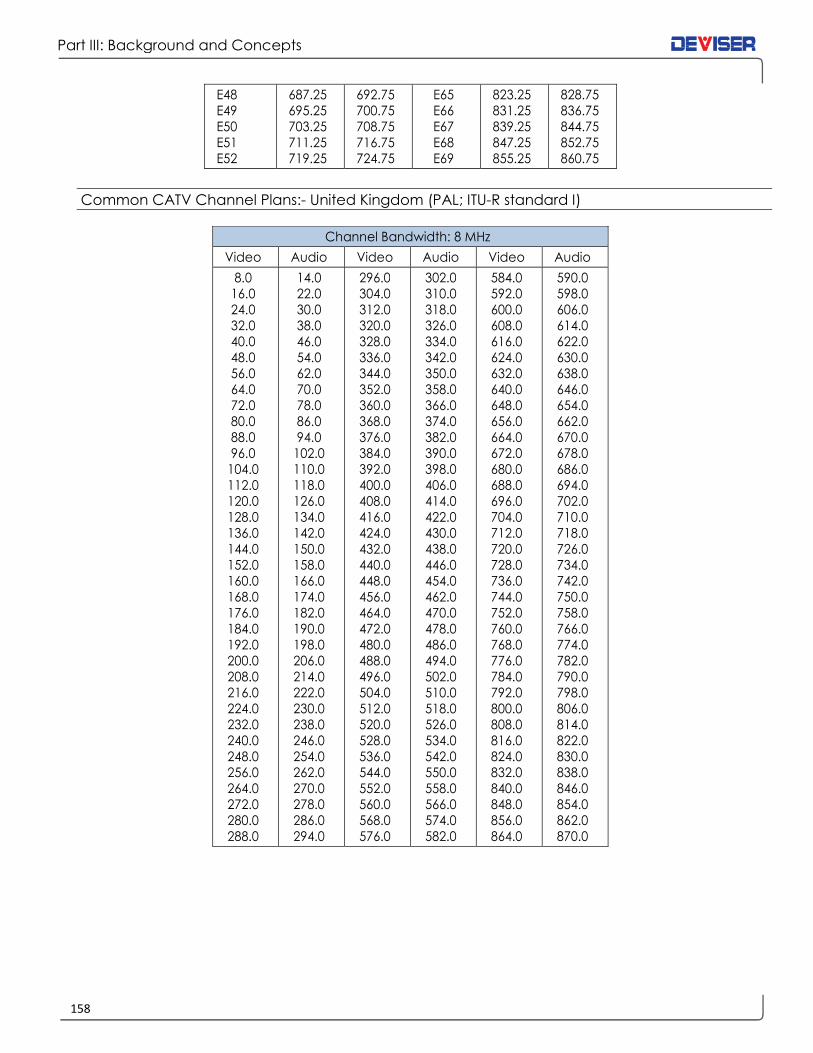
Part III: Background and Concepts
158
E48
E49
E50
E51
E52
687.25
695.25
703.25
711.25
719.25
692.75
700.75
708.75
716.75
724.75
E65
E66
E67
E68
E69
823.25
831.25
839.25
847.25
855.25
828.75
836.75
844.75
852.75
860.75
Common CATV Channel Plans:- United Kingdom (PAL; ITU-R standard I)
Channel Bandwidth: 8 MHz
Video Audio Video Audio Video Audio
8.0
16.0
24.0
32.0
40.0
48.0
56.0
64.0
72.0
80.0
88.0
96.0
104.0
112.0
120.0
128.0
136.0
144.0
152.0
160.0
168.0
176.0
184.0
192.0
200.0
208.0
216.0
224.0
232.0
240.0
248.0
256.0
264.0
272.0
280.0
288.0
14.0
22.0
30.0
38.0
46.0
54.0
62.0
70.0
78.0
86.0
94.0
102.0
110.0
118.0
126.0
134.0
142.0
150.0
158.0
166.0
174.0
182.0
190.0
198.0
206.0
214.0
222.0
230.0
238.0
246.0
254.0
262.0
270.0
278.0
286.0
294.0
296.0
304.0
312.0
320.0
328.0
336.0
344.0
352.0
360.0
368.0
376.0
384.0
392.0
400.0
408.0
416.0
424.0
432.0
440.0
448.0
456.0
464.0
472.0
480.0
488.0
496.0
504.0
512.0
520.0
528.0
536.0
544.0
552.0
560.0
568.0
576.0
302.0
310.0
318.0
326.0
334.0
342.0
350.0
358.0
366.0
374.0
382.0
390.0
398.0
406.0
414.0
422.0
430.0
438.0
446.0
454.0
462.0
470.0
478.0
486.0
494.0
502.0
510.0
518.0
526.0
534.0
542.0
550.0
558.0
566.0
574.0
582.0
584.0
592.0
600.0
608.0
616.0
624.0
632.0
640.0
648.0
656.0
664.0
672.0
680.0
688.0
696.0
704.0
712.0
720.0
728.0
736.0
744.0
752.0
760.0
768.0
776.0
784.0
792.0
800.0
808.0
816.0
824.0
832.0
840.0
848.0
856.0
864.0
590.0
598.0
606.0
614.0
622.0
630.0
638.0
646.0
654.0
662.0
670.0
678.0
686.0
694.0
702.0
710.0
718.0
726.0
734.0
742.0
750.0
758.0
766.0
774.0
782.0
790.0
798.0
806.0
814.0
822.0
830.0
838.0
846.0
854.0
862.0
870.0

159
Part III: Background and Concepts
Application Note: A Study of Digital Persistence Analysis
The DS2831 is a new-generation True Spectrum Analyzer that, among other powerful features and functions,
incorporates “Spectrum Persistence” analysis. This measurement enables in-service detection of undesirable
transient noise and impairments – both linear and non-linear. These impairments often hide under upstream
bursty signal transmissions, like bonded DOCSIS 3 upstream channels or a fully-loaded DOCSIS 3.1 upstream
bursty carrier.†
Traditional troubleshooting methods for upstream interference involve looking at a region of un-occupied
upstream spectrum, placing your spectrum analyzer in peak hold mode, and hoping to capture anything
of significance (or using other features, like minimum hold). But with the introduction of DOCSIS 3.0, the
upstream path has become extremely crowded. This makes it difficult to distinguish interfering signals from
“good” upstream transmission signals. With its easy-to-use features and color-coded display, the DS2831's
spectrum persistence analysis tool greatly simplifies the task of finding linear and non-linear impairments
such as CPD and impulse noise.
Spectrum Persistence testing actually captures undesirable impulse noise (in between upstream bonded
bursty DOCSIS transmissions) by capturing all of the RF energy being transmitted together in a specific,
customizable time period, usually 1000ms to 2000ms long. The instrument examines the RF energy as a
whole, and displays it as a series of bitmap points rather than a trace. In other words, it is a graphical
representation of RF energy: a bitmap where the color of each pixel indicates the amount of RF signal
occupation there. Greater signal presence indicates heavier RF density over that location, translated into
“hot” colors (red and yellow). “Cool” colors (blue) mark areas of lower signal presence.
The figure above represents a loaded Upstream DOCSIS 3.1 transmission. The difference in signal presence is
clear. The colors assigned to bitmap points across the captures band are “hotter” as more signal presence
is detected. (Up to 200 MHz can be set to capture in this mode.) Note that, in this example, the internal pre-
amplifier is off, and the noise floor is at about -45dBmV (+15dBuV). Turning on the pre-amp would provide
an additional 18dB of sensitivity. You can also see how easily the DS2831 will pick up a coherent distortion
hiding under this large transmission.
† This chapter originally written and edited by Bernie Cadieux, North American Sales, Deviser Instruments.

Part III: Background and Concepts
160
The DS2831 is a True Spectrum analyzer with 80dB of dynamic range, allowing for a much more sensitive
capture and acquisition during persistence testing. The unit’s sensitivity can reach -63.5dBmV (@ 300kHz
RBW). This allows users to identify issues much sooner, potentially preventing impacts on customer services.
The figures below compare a typical Spectrum Analyzer screen capture, 4 simultaneous traces processed
(Peak Hold, Neg Hold, Avg & normal), to the same test frequency as seen through the DPS application. The
spectrum trace reveals no particular distortions at the Optical Upstream Receiver test point. (-20dB) In the
righthand figure, we can clearly see 3 distinct interference signals “hiding” under US signaling. We can also
confirm that the only carrier not being affected by any distortions at the moment is transmitting more data
then its close bonded neighbors.
Both instances use the following settings (except where noted):
Center frequency = 28 MHz Detector mode = Avg
Span = 22 MHz (to narrow down viewability) RBW = 300kHz
Ref level = 20dBmV Sweep time = 200ms (left), 500ms (right)
Trace display at the Upstream Optical receiver test point Persistence acquisition made at the same location and settings
To understand these results, we must first explore the DPS technology in greater depth. Notice that the
above captures were taken in FFT (Fast Fourier Transform) mode. In this mode, the DS2831 will capture
complete user-defined spans and lay each new capture over the previous ones in subsequent single
acquisitions. The following table indicates how many such FFT captures the DS2831 will make, based on
Span settings.
In the persistence spectrum example from before, the span was set to 22 MHz. Thus the DS2831 captured
each FFT in 4.5ms. The sweep took 500ms to complete, creating the image above: an accumulation of
111.11 overlaid trace.

161
Part III: Background and Concepts
To better understand how the sum of all captures is not a peak hold, imagine that each acquisition is
“superimposed” over the previous accumulated traces. To illustrate:
Capture 1: Capture 2:
Capture 3: Capture 4:
Overlaying each capture produces their sum:
The larger the span setting, the longer the FFT capture time to ensure 100% POI (Probability Of Interception).
This is because the FFT times (in the table above) have been calculated to ensure that the DS2831 will not
only capture while the modems are up and transmitting data up to the CMTS, but also during those quiet
times (time ticks equal to 6.25us) when the CMTS requires all modems to keep quiet so that it may listen for
any new potential modems wanting to register.
The table below is extracted from page 175 of a DOCSIS white paper document, CM-SP-MULPIv3.0-I25-
140729. It shows how Time Ticks are calculated based on modulation type.
In our discussion, we have seen the technology in use; but we have not yet explored how it relates to the
day-to-day task of troubleshooting ingress in the field.
Traditional techniques for locating service distortions are no longer the best approach for maintaining
customer services. In most cases, a field engineer refers to their MSO monitoring platform and is notified that
a particular node shows signs of issues. (For example, the HE or Hub monitoring system may detect coherent
distortions in that node).
Problems occur, however, when the network engineer reaches the node. He or she must determine which
of the node’s 4 legs is malfunctioning. Common practice is to pull the return pads and view the Upstream
RF monitoring system signature, which – in theory - should include the distortion in question) If the signature
goes away after pulling the pad, the field engineer will know that the distortion comes from that leg. If not,
he (she) will replace the pad and pull another until he finds the culprit.

Part III: Background and Concepts
162
Then, the common troubleshooting method prevails, hunting down the impairment going down a specific
leg of a node. The figure below (left) shows the impairment at the node return test point, (without having
pulled any return pads). Although this impairment was not customer-impacting, the engineer faces an
opportunity cost in pursuing distortions at the expense of other tasks.
After chasing this impairment, it was found to have been injected through a multi-tap port – in fact, from a
non-paying connected home. After installing a filter, the impairment almost completely disappeared, as
shown (below, right).
Return path test point of an optical node Multi-tap port of a non-paying home, passed after filter was installed
However, going 100% digital does not eliminate
CPD. This capture (left) shows a rare event in
the field (Input test point, 2nd active after the
node). Here, there are 3 upstream DOCSIS 3.0
bursty transmissions at 6.4 MHz wide each – and
a clear look at, the reflected Downstream DVB-
C 6 MHz carriers sitting well below, suggesting
Digital CPD. This phenomenon is difficult to see
during field operation, simply because it is too
low for most lower-end equipment (usually SLM-
based, which offers less sensitivity than a True
Spectrum Analyzer). It might also not visibly
impact customer service.
Based on this scenario, the Deviser R&D team developed algorithms that provide consistent measurement
results – with few metrics to control in order to provide optimal results.
You can access the Spectrum Persistence analysis from the Upstream main menu. Once in the persistence
mode, you will first need to select the bandwidth of interest for your test. Depending on your location in the
network, some level adjustments – like reference level, attenuation, and activating the internal pre-amplifier
– may also be necessary. RF traffic conditions may also require speeding up or slowing down the sweep
time to extend the accumulated capture time. A sweep time of ~1000ms is ideal for capturing transient
noise under the DOCSIS carriers.
To adjust these parameters, refer to the instructions and menu map in Chapter 12: Persistence Analysis.
For further information, please contact Deviser Instruments.

163
Part IV: System Functions
Part IV System Functions
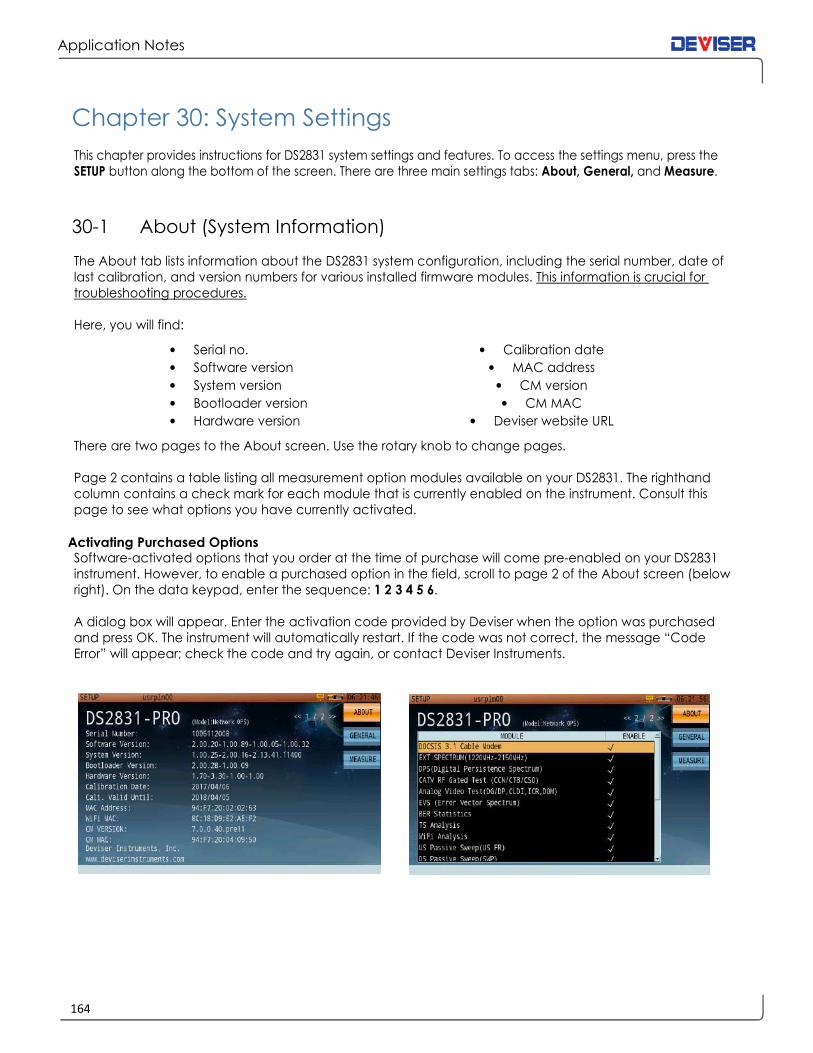
Application Notes
164
Chapter 30: System Settings
This chapter provides instructions for DS2831 system settings and features. To access the settings menu, press the
SETUP button along the bottom of the screen. There are three main settings tabs: About, General, and Measure.
30-1 About (System Information)
The About tab lists information about the DS2831 system configuration, including the serial number, date of
last calibration, and version numbers for various installed firmware modules. This information is crucial for
troubleshooting procedures.
Here, you will find:
• Serial no. • Calibration date
• Software version • MAC address
• System version • CM version
• Bootloader version • CM MAC
• Hardware version • Deviser website URL
There are two pages to the About screen. Use the rotary knob to change pages.
Page 2 contains a table listing all measurement option modules available on your DS2831. The righthand
column contains a check mark for each module that is currently enabled on the instrument. Consult this
page to see what options you have currently activated.
Activating Purchased Options Software-activated options that you order at the time of purchase will come pre-enabled on your DS2831
instrument. However, to enable a purchased option in the field, scroll to page 2 of the About screen (below
right). On the data keypad, enter the sequence: 1 2 3 4 5 6.
A dialog box will appear. Enter the activation code provided by Deviser when the option was purchased
and press OK. The instrument will automatically restart. If the code was not correct, the message “Code
Error” will appear; check the code and try again, or contact Deviser Instruments.

165
Part IV: System Functions
30-2 General Settings
The General tab contains general system settings that do not apply to particular measurement functions. This
tab is divided into different categories, listed on the left-hand side of the screen; turn the rotary knob to
change pages, and press the knob to select a page and begin editing settings. Press Esc to go back.
30-2.1 Network Settings
This page contains settings for allowing the DS2831 to interact with other networked devices via Ethernet LAN
cable or Wi-Fi. This includes the Local IP, Net Mask, Gateway, and DNS addresses and the DHCP option.
Highlight DHCP and press the rotary knob to activate it, or deactivate to keep the static IP settings.
To change an address, turn the rotary knob to highlight one of its bytes and enter up to 3 digits using the
keypad. Continue as needed until the address is complete.
Using Wi-Fi The Wi-Fi feature is only available if enabled on your DS2831
unit. To activate it, check the Wi-Fi Client box in the Network
Settings menu. If DHCP is checked, the unit will automatically
connect to the wireless network. Otherwise, you can set up
a static IP configuration.
Using Ethernet In Network Settings, when the WiFi Client box is empty, the
default connection is through the Ethernet port on the top
panel. Connect an Ethernet cable from an active network
to the DS2831 and set up the static IP information to
connect. (If DHCP is checked, the unit will auto-set a
network address and configuration.)
Wi-Fi Access Point (Hotspot) Setup The DS2831 offers a Wi-Fi AP (Access Point) function, which
allows connection from a mobile device. Technicians can
use this function to have the DS2831 access public networks
during field operations. You can record/measure data even
if no suitable networks are present. Note that this tool is
currently available only on Android devices; future firmware
releases will include other mobile OSs.
Select WLAN AP setup parameters to open a settings dialog (shown above). This includes:
• SSID: Service Set Identifier. User selects the correct name.
• Password: User-defined.
• IP Address: This is a fixed IP address; users cannot modify it.
If a wi-fi connection is successful, a yellow wi-fi icon will appear in the status bar.
If the hotspot is set up correctly and is ready to receive connections, a blue wi-fi icon will appear.

Application Notes
166
IPv6 Address Setup The DS2831 is IPv6 compatible. Select IPv6 Setup to
open a dialog window. If you wish to input an address
manually, check Enable; otherwise, check Auto and
the system will auto-configure the IP. (You will need to
enter the prefix, gateway, and DNS according to your
network configuration – shown, right).
More on IPv6 Where IPv4 uses 32-bit (4-byte) source and destination
addresses, IPv6 has 128 bits (16 bytes). IPv6 addresses
have eight groups, with as many as four hexadecimal
digits in each group (separated by colons).
For example:
2001:0da8:0001:0100:0000:0000:0000:0080
Groups of digits that begin with one or more zeros don’t need to be padded to four places, so you can
shorten this address according to the following rules.
(1) The first zero at the beginning of each group can be omitted. So you can also write this address as:
2001:0da8:0001:0100:0000:0000:0000:0080
2001:da8:1:100:0000:0000:0000:80
(2) If a group of digits are all zeroes, a single “0” can replace them. So you can also write this address as:
2001:0da8:0001:0100:0000:0000:0000:0080
2001:da8:1:100:0:0:0:80
(3) If a group or continuous groups are all zeroes, the “::” (double colon) notation can replace them. In this
way, you can abbreviate sequential groups of zeros. So you can also write this address as:
2001:da8:1:100:0:0:0:80
2001:da8:1:100::80
Note that you can only use the “::” notation once in an address.
For example, the IPv6 address [2001:250:f004:0000:0000:8e00:0000:ef01] can be rewritten as either of these:
2001:250:f004::8e00:0:ef01
2001:250:f004:0:0:8e00::ef01
IPv6 prefixes are specified similarly to IPv4. As many bits of the prefix as are significant are expressed in the
standard IPv6 notation, followed by a slash and a decimal; the decimal count show how many address
prefixs bits there are.
For example, the prefix of the IPv6 address [2001:250:f004:f001:e150:b95:f71e:ccb6] is 64-bit. You can rewrite
the address as [2001:250:f004:f001:e150:b95:f71e:ccb6/64].

167
Part IV: System Functions
30-2.2 Display & Battery
This page contains power-saving settings to extend battery life on a charge. It also displays the current
internal temperature of the instrument in degrees centigrade/Celsius and Fahrenheit.
Auto Power Off If the device remains on for a certain amount of time (3, 5, 10, or 30min) without input, it will automatically
shut down to preserve power. Highlight this setting with the rotary knob and use the arrow keys to select a
time period, or set to DISABLE to disable automatic shutdown.
Backlight Off If the device remains on for a certain amount of time (3, 5, 10, or 30min) without input, it will automatically
dim the backlit screen to preserve power. Highlight this setting with the rotary knob and use the arrow keys to
select a time period, or set to DISABLE to disable auto-dim.
30-2.3 Date & Time
This page allows you to set the instrument’s internal clock. Highlight each entry field with the rotary knob, and
use the arrow keys or data keypad to set the current year, month, day, hour, minute, and second.
The topmost field allows you to change the date display format:
• Y/M/D (ex.: 2016 Mar 31)
• D/M/Y (ex. 31 Mar 2016)
• or M/D/Y (ex. Mar 31 2016)
30-2.4 Language
On this page, you may set the system language. Once set, all system text, instructions, and data will appear in
the selected language. English, French, German, Korean, and Chinese (simplified) are currently supported.
30-2.5 User Management
This page allows you to view information and make changes to the user account you are currently logged
into. (See Section 2-2.) It displays your user ID number, user name, and listed company. The UserID list shows a
persistent ID number for each user, in cases when multiple users share the same instrument.
Toggle the Multi-User feature to enable or disable multiple user profiles. If disabled, the instrument will treat
every operator as the same user, and will bypass the multi-user startup menu and go directly to the main
measurement menu. You must restart the system for changes to take effect.
After making changes, press Save to record the current user configuration.

Application Notes
168
30-2.6 GPS
If the GPS functionality is enabled, and a USB GPS antenna is connected to the instrument’s top panel, this
page will display the current longitude and latitude coordinates of the device. This is useful in measurement
applications like pinpointing interference. If GPS is disabled, the page will display zeroes.
An animated dish icon (left) indicates that the
GPS module is searching for a satellite signal. When it stops
on a full dish icon , the module has successfully locked
on to the signal and acquired the user’s location info. The
status will appear in the “GpsStatus” field. “LOCK(6)”
indicates that the GPS module has located 6 satellites.
Once signal location is successful, latitude and longitude
information will be added to any measurement operation
data saved by the user.
GPS coordinates are recorded at all times when a clear GPS positioning antenna has clear line of sight to
the skies. The GPS coordinates are saved when a measurement is saved in "DATA" format, however, the GPS
coordinates will not be displayed on a "Picture" file format.
30-2.7 Asset Management
Deviser ARGOSYNC can be installed on a single PC or on a networked server. See the ARGOSYNC user guide
for complete setup instructions.
The option-enabled asset management tab allows you to synchronize your device’s information (including
saved data, firmware version, and system clock) with data stored on ARGOSYNC. Enter the server IP address
and port number, then select OK to sync.

169
Part IV: System Functions
30-2.8 Factory Reset
Here, you can reset all parameters and return the instrument to initial factory settings for a fresh start. Use this
feature with caution to avoid erasing a preferred configuration. User profiles, saved measurement data, and
current firmware version are not affected.
When you highlight this page, a confirmation prompt will appear. Press the rotary knob button to confirm the
factory reset process. The instrument will reboot.
30-3 Measure Settings
The third settings menu, Measure, includes miscellaneous settings for various measurement functions.
30-3.1 Level Unit
On this page, you can select the default unit in which signal magnitude measurements are displayed. Use
the arrow keys or rotary knob to select one of the radio buttons: dBµV, dBmV, or dBm.
30-3.2 Test Point Compensation
Test Point compensation can be edited and applied only
if TP Compensation box is checked.
The typical optical receiver test point loss is 20dB. Older
CATV active equipment, however, may have down test
points of 30dB; if so, the user can input the required
compensation here. (20dB in this example.) Some probes,
along with specific cable lengths, may account for 1.5dB
loss (in this example). The user can input that loss value in
the probe correction box.
In this example, the total correction value is 21.5dB. In the
measurement interface, the unit will display TP=21.5dB in
the status bar at the lower right corner of the screen. After
total compensation, the test result will display the true
network measurement values.
DS2831 users can set up a maximum of five groups of TP
compensation values. At different positions, user can
active different TP compensation values.

Application Notes
170
30-3.3 Limit Edit
Limits are user-designated signal thresholds; when a measurement breaks an established limit, the DS2831 will
alert the user by displaying test results in a Pass/Fail format.
From the Limit Edit menu, you can set and modify limit plans on various points of measurement data. The
“Enable Limit” box must be checked for limits to take effect.
The instrument offers 9 default groups of limit settings:
Amplifier, End-of-Line, Ground-Block, Headend, High-
Speed-Data, Line-Extender, Node, Set-Top and Tap-
Check. In addition, there are 7 customizable groups
(titled UserLimit01 – 07) that can be edited to suit your
test threshold needs. Default groups cannot be edited.
Users may activate or deactivate any group or any
individual metric of any limit file. Threshold values of
individual metrics are also customizable. Users can
create new limit files with the Toolbox PC software
included with each unit, and copy them to the DS2831.
Note that new limit files names cannot use the same
names as the 9 default groups; thus, only custom
filenames can be copied to other units.
When modifying limit values, use the function keys on the right to access the following tools:
• Reset: reverts current limit settings to default values.
• Ena All: enables all individual metrics in the current limit file.
• Dis All: disables all individual metrics in the current limit files.
• Edit: Opens the highlighted metric for editing. Use the keypad, arrow keys, or rotary knob.

171
Part IV: System Functions
30-3.4 Remote Assist
The DS2831 offers a PC-based remote control networking function, allowing users to conduct measurements
and check test data from any computer or tablet connected to the same network. For full setup instructions,
see the WiFi Hotspot and Remote Assist application note on page 182.
Select the Remote Assist checkbox to activate it. If connected to the network, the DS2831 will display the
icon in the status bar.
On a PC (or other device), open the internet browser of your choice. In the URL bar, enter the DS2831’s local
IP address (as found in General > Network Settings) and the port number 1080. Ex.: <192.168.63.23:1080>.
Browser-based Remote Control Interface: Panorama mode (left) and Lite mode (right)
In the remote assist interface, you can use a computer mouse and keyboard to navigate menus and
change settings. There are two display modes: Panorama and Lite. Panorama is designed to simulate the
DS2831 operation console, while Lite is designed for optimum visibility and text size. Swap modes by clicking
the LCD/Shrink icon (depending on the current view mode) located on the bottom-right.
30-3.5 Cable Modem Diplexer
Diplexers are key components in multiplex RF communication systems. A diplexer insulates the transmitted
and received signals from interference, allowing them both to send at the same time.
To ensure compatibility with the latest DOCSIS standards, the DS2831 cable modem provides two kinds of
selectable power divider: 85 / 108MHz, and 204 / 258MHz. You can select the setting of your choice in the
CM page. Note that this setting may affect cable modem measurement results; set as needed according to
your system configuration.
A list of current major DOCSIS standards is included below.
Standard Uplink Frequency (MHz) Downlink Frequency (MHz)
DOCSIS 2.0 5 ~ 42 >88
EURO-DOCSIS 2.0 5 ~ 65 >108
EURO-DOCSIS 3.0 5 ~ 85 >108
DOCSIS 3.0 5 ~ 85 >108
DOCSIS 3.1 5 ~ 204 >258

Application Notes
172
Chapter 31: File Management
The ability to save and manipulate data is a key feature of using the DS2831 Digital TV Spectrum Analyzer.
From the File Management utility – accessible by pressing the File ( ) key under the display – you can
delete, view, move, and sort data files saved to the system’s internal 1GB hard drive.
Files can also be transferred to a USB storage device. Simply connect the drive to the Type-A USB port on the
DS2831’s top panel, and look for the USB icon to appear in the status bar.
31-1 File Operations
In the file management menu, you can view all readable files currently saved to the DS2831’s internal hard
drive. These files are separated by type. Image files appear in one list, data files in another, and so on.
File Management Menu: Pictures File Management Menu: Open Data
31-1.1 Open
In the above image, the top function key (F1) is labeled [PICTURE]. This indicates that the user is viewing a list
of all picture files saved to the instrument. Press F1 to cycle through picture, data, and work order files.
By default, files are listed alphabetically by name in ascending order, and bear timestamps according to
when the data was recorded. (See subsection 31-1.2.) Use the rotary knob or arrow keys to scroll up and
down, highlighting files.
Press Open (F2) to view the highlighted file. This means different things for different filetypes. If available, use
the function keys to shift between tabs.
• Pictures will be displayed on the DS2831’s screen. Turn the rotary knob to cycle through other
saved images.
• Data will display a summary of the time, GPS location, associated work order, and system serial #
on which the data was taken. Press F2 to view additional data about the captured measurement,
including testing parameters, data points, and a screenshot of the measurement trace. Auto test
results show channel level/frequency, chan-scan, tilt, and spectrum measurements separately.
• Work orders will display a list of their component projects and measurements. Work orders that
have been initiated by an Auto Test setup may be exported in .csv format.
You may only open one file at a time. When you have finished viewing files, press the Esc key to go back.

173
Part IV: System Functions
Viewing Auto Test Results: Digital Channel, Constellation, and Analog TV Channel (left to right)
31-1.2 Sort
As discussed, files are listed alphabetically by name in
ascending order. This is the default setting. If you wish
to list files in a different order, press Sort (F3) to open the
Sort dialog (shown, right).
Highlight and select options with the rotary knob. Place
a check next to “File Name” to sort files alphabetically,
“File Date” to sort by timestamp, or “File Type” to sort
by format. Use the radio button to select Ascending or
Descending order.
When you have finished changing settings, press OK to
sort files as specified.
31-1.3 Rename
To rename a particular file, highlight it with the rotary knob and press Rename (F7). Use the alphanumeric
keypad to enter the new filename. (Only letters and numbers may be used. Special characters, including
hyphens, slashes, periods, and spaces, are not recognized. Uppercase and lowercase letters are valid.)
When finished, press the rotary knob to confirm. Press Esc once to recall the previous filename, or again to
cancel the operation.
31-1.4 Delete
When you no longer need one or more files, you can erase them from the DS2831’s internal hard drive.
Highlight files with the rotary knob and press the knob to select them. Delete (F5) will become available.
When you press Delete, you will be prompted to confirm the deletion. Press OK to erase the data, or Cancel
to go back. You may also wish to export existing data to an external USB storage drive first; see Section 31-2
for details.

Application Notes
174
31-2 Importing and Exporting Data
To export files to a USB storage device, first ensure the device is connected via the DS2831’s top panel. The
USB icon will appear in the status bar. Turn the rotary knob to highlight the desired file, press the knob to
select files to export, and then press the Export (F6) button.
Upon transfer to USB, new directories will be automatically
created on the storage device. (If these folders already exist,
files will be copied to them as normal.) Measurement data
files will be placed in “DS2831_file” and screenshot / image
files in “DS2831_bmp”. Data files will export in CSV format,
which can be opened with Microsoft Excel or another
spreadsheet software. The Toolbox PC software can also
review and analyze DS2831 exported files.
Work order test results can only be uploaded to the asset and test data management platform Deviser
ARGOSYNC through a network connection. They can, however, be viewed on the DS2831. (See subsection
31-1.1.)
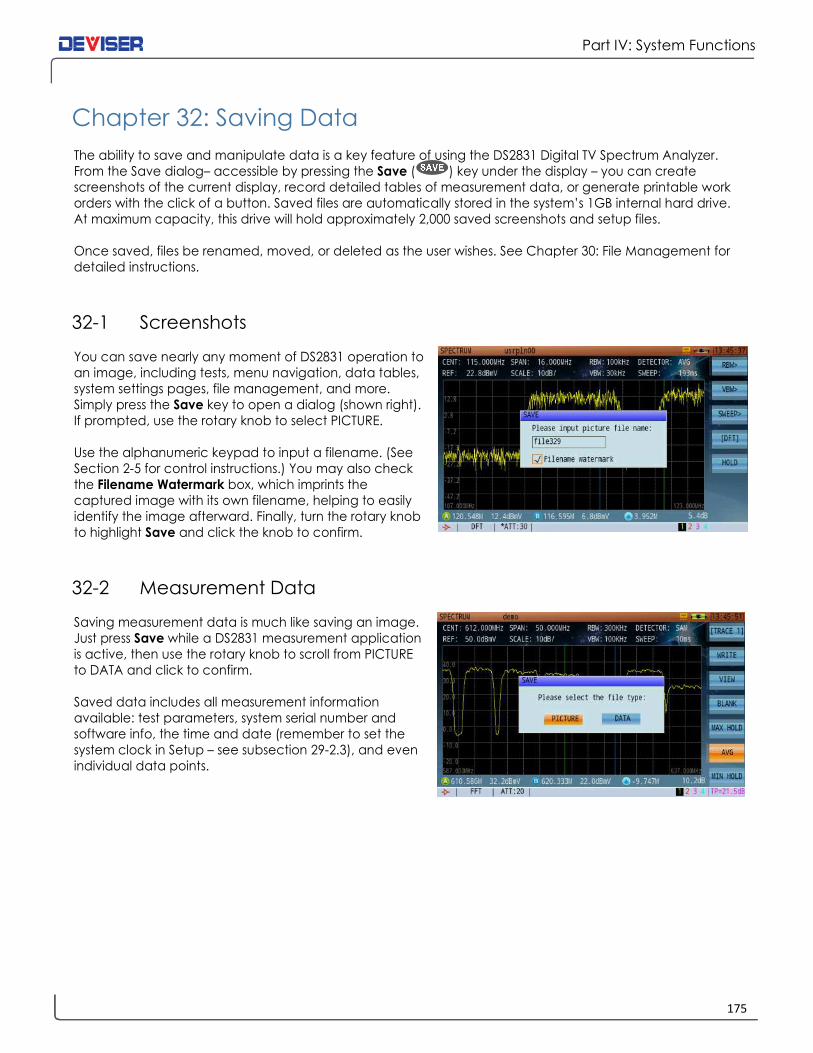
175
Part IV: System Functions
Chapter 32: Saving Data
The ability to save and manipulate data is a key feature of using the DS2831 Digital TV Spectrum Analyzer.
From the Save dialog– accessible by pressing the Save ( ) key under the display – you can create
screenshots of the current display, record detailed tables of measurement data, or generate printable work
orders with the click of a button. Saved files are automatically stored in the system’s 1GB internal hard drive.
At maximum capacity, this drive will hold approximately 2,000 saved screenshots and setup files.
Once saved, files be renamed, moved, or deleted as the user wishes. See Chapter 30: File Management for
detailed instructions.
32-1 Screenshots
You can save nearly any moment of DS2831 operation to
an image, including tests, menu navigation, data tables,
system settings pages, file management, and more.
Simply press the Save key to open a dialog (shown right).
If prompted, use the rotary knob to select PICTURE.
Use the alphanumeric keypad to input a filename. (See
Section 2-5 for control instructions.) You may also check
the Filename Watermark box, which imprints the
captured image with its own filename, helping to easily
identify the image afterward. Finally, turn the rotary knob
to highlight Save and click the knob to confirm.
32-2 Measurement Data
Saving measurement data is much like saving an image.
Just press Save while a DS2831 measurement application
is active, then use the rotary knob to scroll from PICTURE
to DATA and click to confirm.
Saved data includes all measurement information
available: test parameters, system serial number and
software info, the time and date (remember to set the
system clock in Setup – see subsection 29-2.3), and even
individual data points.

Application Notes
176
Chapter 33: Auto Test
Press the Auto ( ) key below the display to enter the Auto Test menu. Auto Test allows users to design
and run custom measurement plans.3 You can select the measurements to perform, as well as the channels
and test settings for each one, in advance. Auto tests rely on pre-defined User Channel Plans and Limit Plans.
There are two types of auto-test: projects and work orders. Projects are tasks created with the DS2831, while
work orders are tasks created by the asset and test-data management platform, Deviser ARGOSYNC. Work
orders can contain multiple projects.
33-1 Creating a Project
In the Auto Test menu, the F1 key allows you to cycle between auto test types. Cycle to [Project] and press
New (F2) to open the auto test design screen (below, left).
In the Project and Location fields, you can name the auto test project and the physical test address using
the alphanumeric keypad. Highlight and click the Plan Name and Limit fields to select the desired channel
plan and test point location for this project. (If you plan to import the output file into a pre-configured TWC
Workbook, you may choose any arbitrary test point location.)
Under the Location field are two panes. Move to a panel with the rotary knob, then use the arrow keys to
scroll up and down within it. In the left panel, you can select measurement functions to perform (by clicking
the rotary knob). In the right panel, you can modify the settings that each measurement will take. Press the
Item (F2) and Limit (F3) keys to toggle between different available settings.
• Example: Place a check next to “Spectrum” on the left, then change “CENT” to 500 MHz on the
right. The auto test will now include a spectrum analysis test centered on the 500 MHz frequency.
• Example: Place a check next to “Ch Meas” on the left, then place checks next to 101-115 on the
right. The auto test will now include MER and Pre-Post BER tests for the selected channels.
When you have finished designing your auto test project, press Save (F1) to save the project. It will appear
on the auto test main screen (above, right). Note that you must save a project if you wish to export it later.
3 Content, reference materials, and technical consultation for this chapter provided by Bernie Cadieux,
Deviser Instruments. <[email protected]>
NOTE: Before setting up an auto test, you must set up your active user channel plan and limit plan for
testing. The channel plan determines the channels you can select for individual testing, and the limit
plan adds pass/fail results to the test data depending on the limit lines you have previously specified. See Chapter 4 and subsection 29-3.3, respectively, for details on creating channel and limit plans.
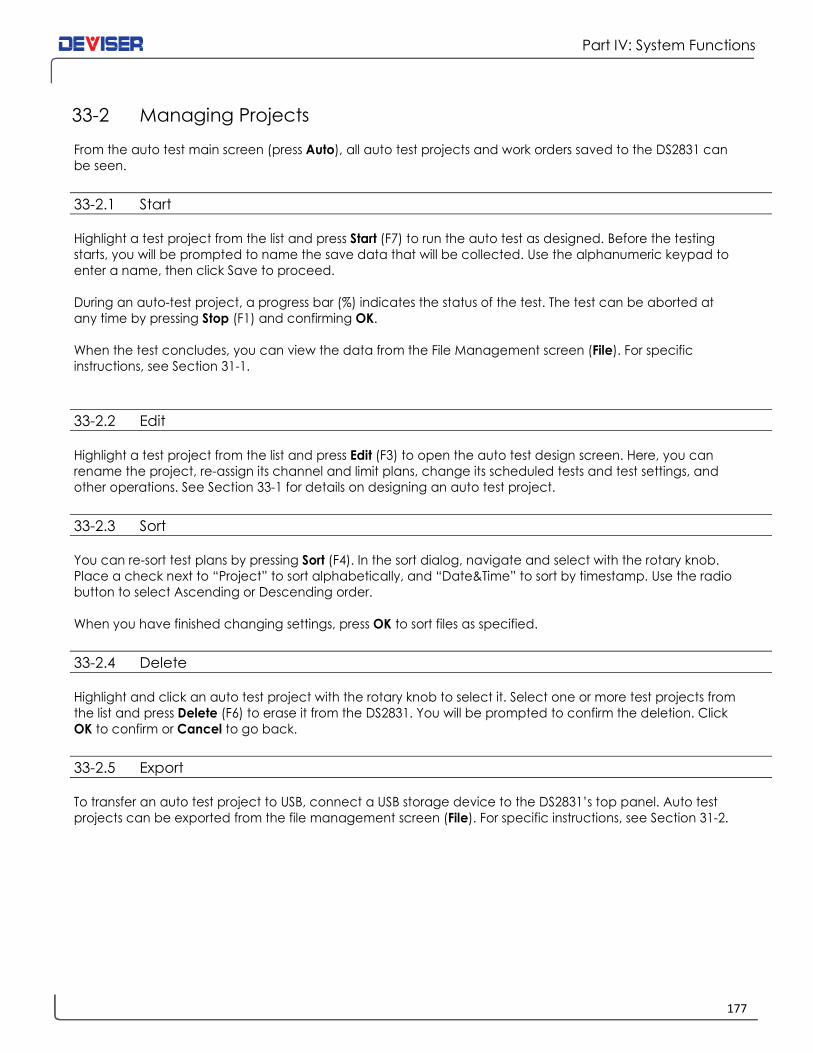
177
Part IV: System Functions
33-2 Managing Projects
From the auto test main screen (press Auto), all auto test projects and work orders saved to the DS2831 can
be seen.
33-2.1 Start
Highlight a test project from the list and press Start (F7) to run the auto test as designed. Before the testing
starts, you will be prompted to name the save data that will be collected. Use the alphanumeric keypad to
enter a name, then click Save to proceed.
During an auto-test project, a progress bar (%) indicates the status of the test. The test can be aborted at
any time by pressing Stop (F1) and confirming OK.
When the test concludes, you can view the data from the File Management screen (File). For specific
instructions, see Section 31-1.
33-2.2 Edit
Highlight a test project from the list and press Edit (F3) to open the auto test design screen. Here, you can
rename the project, re-assign its channel and limit plans, change its scheduled tests and test settings, and
other operations. See Section 33-1 for details on designing an auto test project.
33-2.3 Sort
You can re-sort test plans by pressing Sort (F4). In the sort dialog, navigate and select with the rotary knob.
Place a check next to “Project” to sort alphabetically, and “Date&Time” to sort by timestamp. Use the radio
button to select Ascending or Descending order.
When you have finished changing settings, press OK to sort files as specified.
33-2.4 Delete
Highlight and click an auto test project with the rotary knob to select it. Select one or more test projects from
the list and press Delete (F6) to erase it from the DS2831. You will be prompted to confirm the deletion. Click
OK to confirm or Cancel to go back.
33-2.5 Export
To transfer an auto test project to USB, connect a USB storage device to the DS2831’s top panel. Auto test
projects can be exported from the file management screen (File). For specific instructions, see Section 31-2.
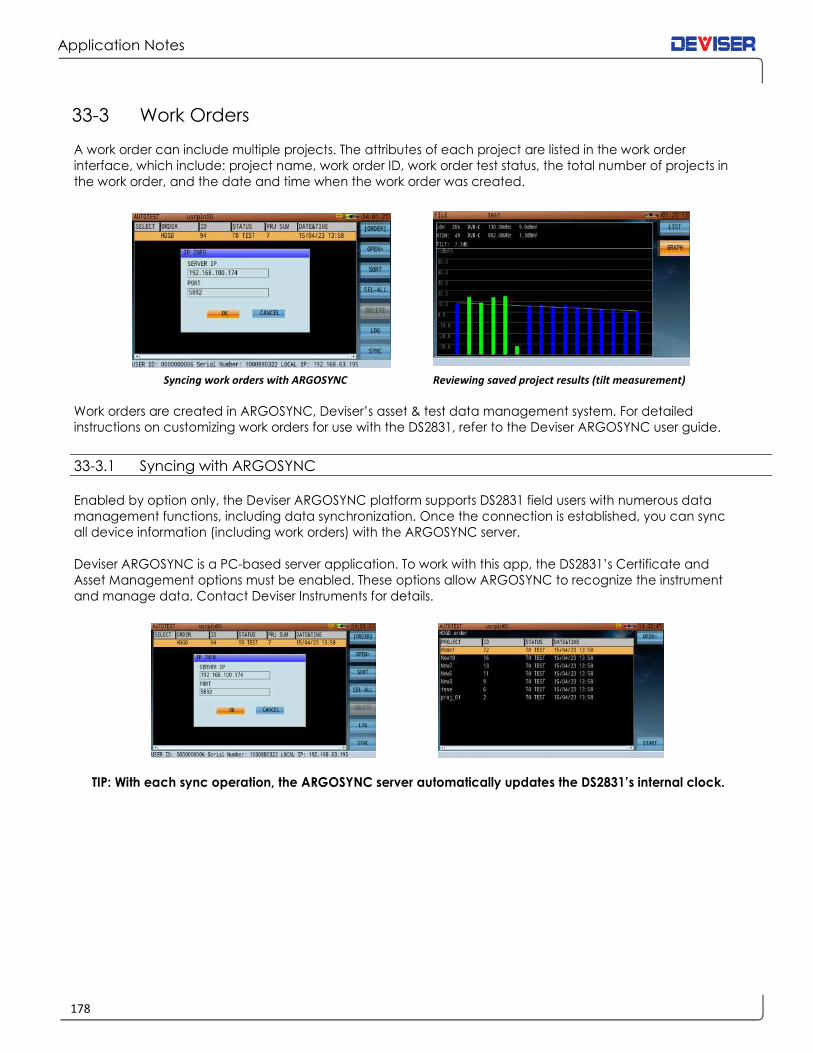
Application Notes
178
33-3 Work Orders
A work order can include multiple projects. The attributes of each project are listed in the work order
interface, which include: project name, work order ID, work order test status, the total number of projects in
the work order, and the date and time when the work order was created.
Syncing work orders with ARGOSYNC Reviewing saved project results (tilt measurement)
Work orders are created in ARGOSYNC, Deviser’s asset & test data management system. For detailed
instructions on customizing work orders for use with the DS2831, refer to the Deviser ARGOSYNC user guide.
33-3.1 Syncing with ARGOSYNC
Enabled by option only, the Deviser ARGOSYNC platform supports DS2831 field users with numerous data
management functions, including data synchronization. Once the connection is established, you can sync
all device information (including work orders) with the ARGOSYNC server.
Deviser ARGOSYNC is a PC-based server application. To work with this app, the DS2831’s Certificate and
Asset Management options must be enabled. These options allow ARGOSYNC to recognize the instrument
and manage data. Contact Deviser Instruments for details.
TIP: With each sync operation, the ARGOSYNC server automatically updates the DS2831’s internal clock.

179
DS2831 Digital TV Spectrum Analyzer
Specifications
Downstream Spectrum Analysis
Frequency Range 4 ~ 1220 MHz
4 ~ 2150 MHz (by option)
Frequency Stability ±1 PPM (0 °C ~50 °C / 32-122°F)
Frequency Step 1 kHz
Frequency Span 0 MHz ~ full span
Resolution Bandwidth (-3dB) 1kHz, 3kHz, 10kHz, 30kHz, 100kHz,
300kHz, 1 MHz, 3 MHz
Video Bandwidth
30 Hz, 100 Hz, 300 Hz, 1kHz,
3kHz, 10kHz, 30kHz, 100kHz,
300kHz, 1 MHz, 3 MHz
Display Scale / Range 1, 2, 5, 10, 20dB/div;
8 vertical divisions
Sweep Time 20ms ~ 25s
Input Level Range -60 ~ +60dBmV
Dynamic Range 80dB (30kHz RBW)
Sensitivity (preamp on) -60dBmV (100kHz RBW)
Attenuation 0 ~ 40dB in 1dB steps
Measurement Accuracy < ±1.0dB @ 25 ±5°C (typical)
Detector Modes Positive Peak; Negative Peak;
Sample; Average; RMS
Reference Level -80 ~ +70dBmV
Markers 2 vertical markers
Persistence
0 ~ 7 MHz 100% POI; minimum signal
duration 2.5ms
4 ~ 46 MHz 100% POI; minimum signal
duration 4.5ms
4 ~ 68 MHz 100% POI; minimum signal
duration 4.64ms
4 ~ 88 MHz 100% POI; minimum signal
duration 5.3ms
4 ~ 120 MHz 100% POI; minimum signal
duration 6.3ms
4 ~ 210 MHz 100% POI; minimum signal
duration 10.6ms
Upstream Spectrum Analysis
Frequency Range 4 ~ 210 MHz
Frequency Span 42/64/84/116/206 MHz, zero span
Resolution Bandwidth (-3dB) 300kHz fixed
Video Bandwidth 300kHz fixed
Display Scale / Range 1, 2, 5, 10, 20dB/div
Sweep Time 20ms ~ 25s
Input Level Range -60 ~ +60dBmV
Attenuation Auto/manual, 0 ~ 40dB
Pre-Amplifier Manual, 18dB gain
Measurement Accuracy < ±1.0dB @ 25 ±5°C (typical)
Detector Modes Positive Peak; Negative Peak;
Sample; Average
Markers 2 vertical markers

Application Notes
180
Analog TV Measurements
Frequency Range 7 ~ 1220 MHz
Standards B/G, I, D/K, L/L’, M/N
Color Standards NTSC, PAL, SECAM
Frequency Steps 10kHz
Level Measurement Range -40 ~ +60dBmV
Accuracy <±1.0dB @ 25±5°C (S/N>30dB)
Level Resolution 0.1dB
Resolution Bandwidth 300kHz
C/N
(>53dB, 0dB
attenuation)
Optim. input (preamp on/off)
32 ~ 37dBmV
12 ~ 17dBmV
Max input (preamp on/off)
60dB ±1.0dB
65dB ±3.0dB
CTB/CSO
(>53dB, 0dB
attenuation)
Optim. input (preamp on/off)
22~67dBmV
2~7dBmV
Max input (preamp on/off)
63dB @ ±1.5dB acc., 78 channels
70dB @ ±4.0dB acc., 78 channels
HUM Measurement 1~15%; ±0.5% (1~5%); ±1.0% (5~15%)
Depth of Modulation Range 40~95%, ±1.5% (C/N>40dB)
Tilt Up to 16 channels
Pre-Amplifier Automatic, 18dB gain
Attenuator Automatic, 40dB
Digital TV Measurement
Frequency Range 7 ~ 1220 MHz
Power Level Range -30 ~ +50dBmV
Accuracy <±1.5dB @ 25±5°C (C/N>20dB)
Level Resolution 0.1dB
Pre-Amplifier Automatic, 18dB gain
Attenuator Automatic, 40dB
Modulation Type
16, 32, 64, 128, 256 QAM
(J.83 Annex A and C);
64, 256 QAM (J.83 Annex B)
Interleave Depth 128 x 1 ~ 128 x 4 (J.83B);
12 x 17 (J.83A/C)
Symbol Rate 1.0 ~ 7.0 MS/s
SNR >47dB; Accuracy ±2.0dB
MER >47dB; Accuracy ±2.0dB
EVM >0.36%
BER 1E-3 ~ 1E-9
Constellation 16, 32, 64, 128, 256 QAM
Cable Modem Measurements (Downstream)
Supported Standards DOCSIS 3.0; 3.1
Frequency Range 108~1218 MHz; 258~1218 MHz
Demodulation DOCSIS 3.0 64 QAM, 256 QAM
DOCSIS 3.1 OFDM 16~4096 QAM
Maximum
Speed
DOCSIS 3.0 1.2 Gbps (32 DS channel bonding)
DOCSIS 3.1 1.97 Gbps (2 OFDM 192 MHz chan.)
Channel
Bonding
DOCSIS 3.0 Up to 32 SCQAM
DOCSIS 3.1 2 OFDM, 192 MHz + 32 SCQAM
Bandwidth DOCSIS 3.0 6 MHz / 8 MHz
DOCSIS 3.1 OFDM 192 MHz, SCQAM 6/8 MHz
Input Signal Level -15 ~ +15dBmV
Cable Modem Measurements (Upstream)
Frequency Range 5~85 MHz; 5~204 MHz
Signal
Bandwidth
TDMA 200/400/800/1600/3200/6400kHz
S-CDMA 1600/3200/6400kHz
OFDMA 96 MHz (3.1, BPSK~4096QAM)
Output
Signal Level
TDMA
+8 ~ +54 dBmV (32, 64QAM);
+8 ~ +55 dBmV (8, 16QAM)
+8 ~ +58 dBmV (QPSK)
S-CDMA +8 ~ +53 dBmV (all modulations)
OFDMA +11 ~ +65 dBmV
Channel
Bonding
DOCSIS 3.0 Up to 8 channels
DOCSIS 3.1 Up to 2 OFDMA channels
Maximum
Speed
DOCSIS 3.0 320 Mbps (8-channel bonding)
DOCSIS 3.1 720 Mbps (1 OFDMA 96 MHz chan)
Advanced Upstream Signal Generator (Option)
Signal
Modulation
J.83 Annex A CW, QPSK, 16/64/256QAM
J.83 Annex B CW, 64/256 QAM
FEC J.83 Annex A RS (204,188)
J.83 Annex B RS (128,122)
Symbol Rate 1.0~7.0 MS/s
MER >40dB; accuracy ±2.0dB
BER <1E-9
Frequency Range 5~120 MHz
Frequency Step 10kHz
Phase Noise (CW @ 50 MHz) 100dBc@10kHz; 115dBc@100kHz
Frequency Accuracy 2ppm
Settling Time 2ms
Signal Level Range 0~60dBmV
Level Accuracy ±1.5dB (CW); ±2.0dB (QAM)
Level Adjustable Step 0.1dB

181
DS2831 Digital TV Spectrum Analyzer
For a list of DS2831-compatible accessories and
software-enabled measurement options available
from Deviser, please see Section 1-2.
Transport Stream Analysis
Real-Time Analysis
Real-time transport stream info,
including service name, ID, provider
info, video/audio PIDs. Audio/video
details on unencrypted programs.
TR 101 290 Priority 1,2,3 TR 101 290 Priority 1, 2, 3 real-time
testing & monitoring.
Basic Information
Various TS details, including data
type % breakdown; transmission
speed; packet length; network info.
PID List Displays PIDs in current stream w/
type, symbol rate, and % of each.
PCR Monitor
Calculates PCR interval / accuracy;
real-time dynamic graph of results;
max/min interval / accuracy data.
PSI/SI List Displays PSI/SI info (PAT, PMT, CAT,
NIT, SDT, TDT, EIT) in tree view.
Program List (EPG Info)
Transport stream EPG, including
program #, service name & ID,
carrier frequency, provider info,
modulation type & symbol rate.
Upstream Active Sweep
FSK Tx Frequency 5 ~ 210MHz
FSK Tx Amplitude 10 ~ 50dBmV
FSK Rx Frequency 42 ~ 300 MHz
FSK Rx Sensitivity -40dBmV
Pilot Frequency 5 ~ 210 MHz
Pilot Freq. Amplitude 10 ~ 50dBmV
Tx Test Amplitude 0 ~ 60dBmV
Tx Test Frequency 5 ~ 210 MHz
Tx Test Freq. Point 1 ~ 16 frequency points
Head-end Support DS1610 supports up to 4 units
Optical Power Meter (by option only)
Accuracy ±0.17dB (± 3%)
Detector Type InGaAs Φ2000μm
Dynamic Range -50dBm ~ +27dBm
Linearity 0.07db/10dB
Resolution 0.01dBm, mW, μW, nW
Wavelengths 850, 980, 1300, 1310, 1490, 1550,
1610nm
Interface FC/SC/ST universal connector
WiFi
Frequency 2.4G, 5G
Supported Standards 802.11 a/b/g/n
Security Mode WPA / WPA2 / WPA-PSK / WPA2-PSK
Encryption WEP / AES / TKIP
Test Parameters SSID, Level, Channel
Visual Fault Locator (by option only)
Output Wavelength 650 ± 10nm
Output Power 1mW
Safety Standard IEC 60825-1: 2007
Interface FC/PC
Fiber Inspection Scope (by option only)
Resolution 0.5μm
Field of View 425μm × 320μm
Interface USB 2.0
Focus Manual adjust, 2mm max travel
Dimensions 175mm ×Φ3500 (probe without cap)
Light Source Blue LED
Operating Temp. 0 ~ 50°C
Storage Temp. -20 ~ +70°C
Miscellaneous
RF Input 75Ω F
USB USB 2.0
Ethernet RJ45, 10/100T Ethernet
Display 7” capacitive TFT LCD touchscreen,
800×480 pixels
AC/DC Adapter AC 100~240 V / 50~60 Hz DC 12V / 5A
Battery Li-ion, 7.4 V / 10Ah
Charge Time ~4 hrs.
Working Time 8 hrs.
Dimensions (WxHxL) 245mm × 155 mm × 60 mm
(9.6” x 6.1” x 2.4”)
Weight ~2.2kg (4.9 lbs)
Work Temperature -10 ~ +50 °C
Storage Temperature -20 ~ +60 °C

DS2831 WiFi Hotspot & Remote Assist
Application Note

DS2831 App Note – Throughput Testing
183
Remotely Controlling the Deviser DS2831
The DS2831 Digital TV Spectrum Analyzer can be operated remotely from a PC or other internet-capable
device, allowing you to securely conduct spectrum measurements anywhere, anytime.
In this application note, you will learn how to set up the DS2831’s wireless hotspot function and activate
remote control mode.
Starting the Wi-Fi Hotspot
1. Boot up the DS2831 and press the Setup button below the screen. Using the touchscreen, tap the
General tab and choose Network Setting.
2. Tap the WiFi AP checkbox to fill it. Then tap WiFi AP Setup to open a dialog.
3. Fill out the dialog according to your network preferences. Recommended settings are shown in the figure below.
a. SSID: custom name for the DS2831’s hotspot.
b. Password: minimum 8 characters. Use the alphanumeric keypad to enter a password required to
log in to the hotspot. Upper and lowercase letters, numbers, and special characters (such as %,
^, @, !, etc.) are permitted. Press the “0” and “.” keys repeatedly to access special characters.
c. Channel: select 2.4G or 5G, and set a channel from the active channel plan.
d. Max connections: determine how many users may log into the hotspot at once. For security
purposes, a max of 1 is recommended.
e. IP: this field should be pre-set. Make note of this IP address for later. If it is blank, enter an address
in the range [192.168.x.x].
4. Tap OK to confirm your settings, then Save.
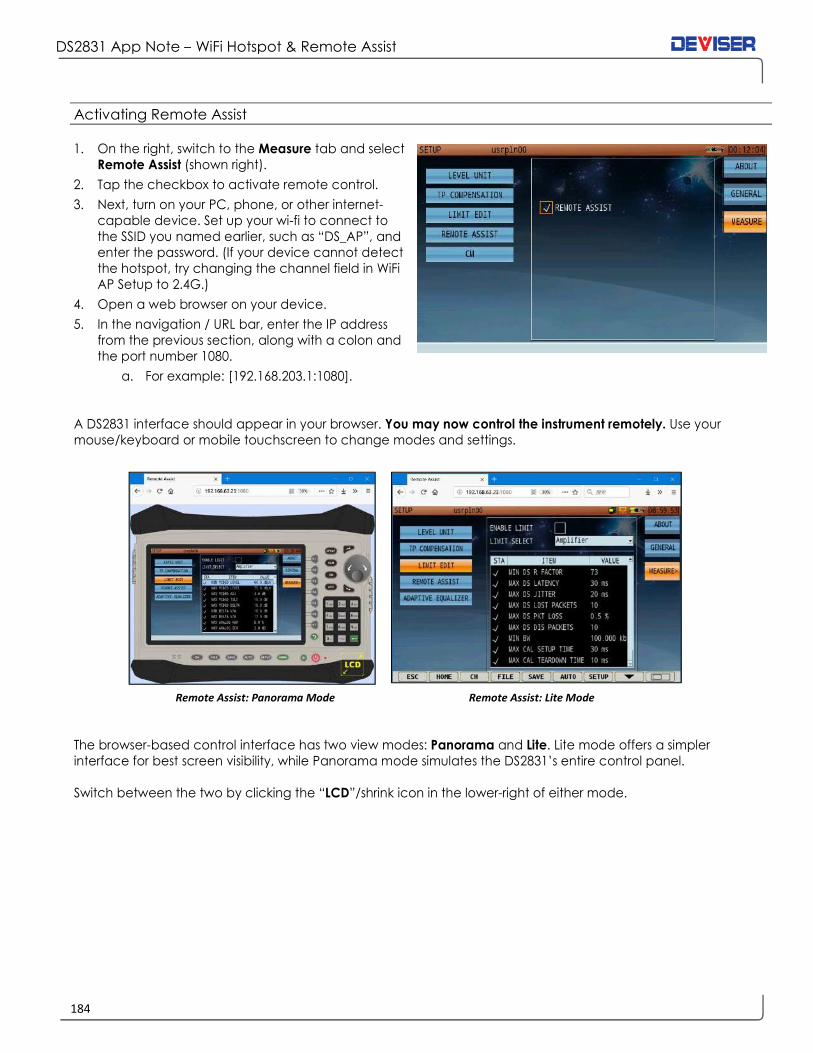
DS2831 App Note – WiFi Hotspot & Remote Assist
184
Activating Remote Assist
1. On the right, switch to the Measure tab and select
Remote Assist (shown right).
2. Tap the checkbox to activate remote control.
3. Next, turn on your PC, phone, or other internet-capable device. Set up your wi-fi to connect to
the SSID you named earlier, such as “DS_AP”, and
enter the password. (If your device cannot detect
the hotspot, try changing the channel field in WiFi
AP Setup to 2.4G.)
4. Open a web browser on your device.
5. In the navigation / URL bar, enter the IP address from the previous section, along with a colon and
the port number 1080.
a. For example: [192.168.203.1:1080].
A DS2831 interface should appear in your browser. You may now control the instrument remotely. Use your
mouse/keyboard or mobile touchscreen to change modes and settings.
Remote Assist: Panorama Mode Remote Assist: Lite Mode
The browser-based control interface has two view modes: Panorama and Lite. Lite mode offers a simpler
interface for best screen visibility, while Panorama mode simulates the DS2831’s entire control panel.
Switch between the two by clicking the “LCD”/shrink icon in the lower-right of either mode.

DS2831 Error Vector Spectrum
Application Note

DS2831 App Note – Error Vector Spectrum
186
Using the EVS Function to Measure LTE Interference
The EVS (Error Vector Spectrum) function is a powerful tool for finding in-service signal interference under a
DOCSIS QAM carrier. Users can quickly detect and identify interference from, for example, fast-growing LTE
networks. Frequency domain measurements typically cannot measure LTE interference, as the interfering
signal is usually too weak; but the DS2831’s EVS option has a time-domain mode that easily detects it.
You can access the EVS test from the Constellation mode in the CATV main menu. Once locked on the
digital carrier (the observed channel must be included in the active channel plan), touch the EVS tab. Once
in that mode, press Measure (F1) key to measure in time- or frequency-domain. The time domain is preferred.
Please see Section 8-6: Error Vector Spectrum on page 62 for more information about this mode.
In this application note, you will learn how to identify LTE interference under your QAM carriers with EVS.
Side-By-Side
First, let’s compare a normal QAM signal – without LTE signals lurking below – to one with interference.
QAM carriers (no LTE interference) QAM carriers (LTE interference present)
In a standard spectrum analysis trace, the difference appears minimal. This is because LTE signals are also
digital, noise-like signals. LTE interference is broadband in nature; so when we add LTE interference signals to
a system loaded with QAM carriers, the noise floor does increase, but not to a degree detectable to the
untrained eye.
But in Constellation and EVS tests, the situation changes completely.
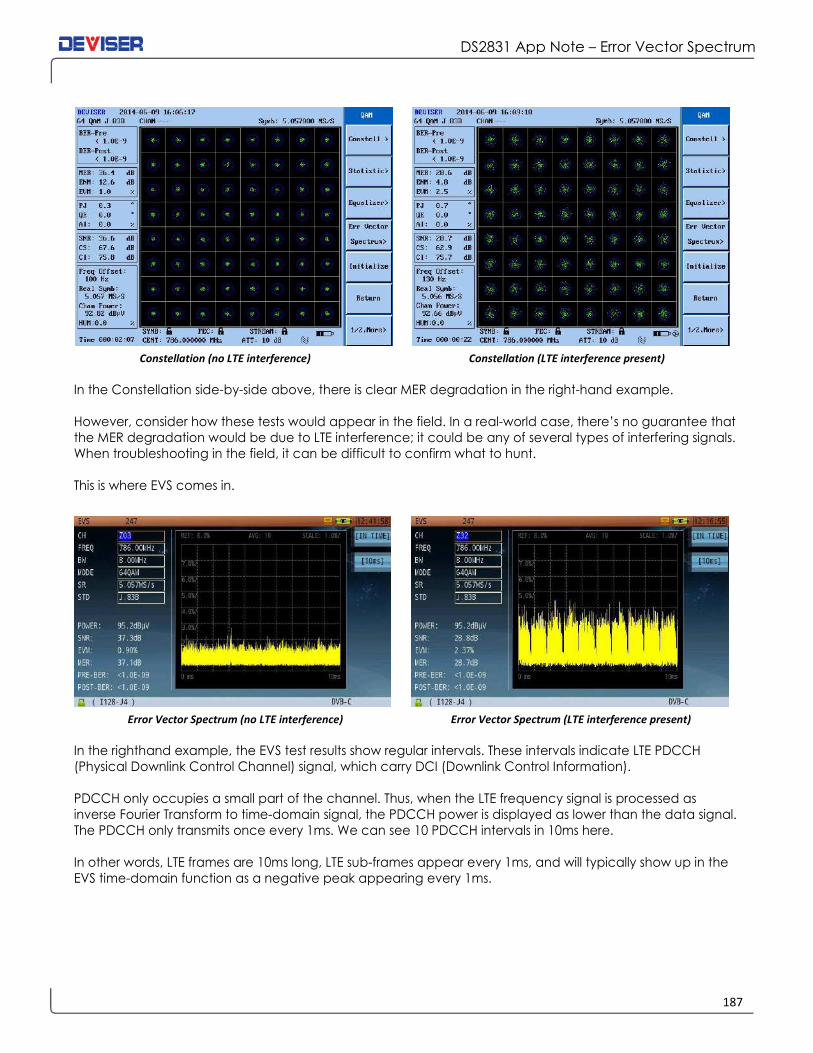
DS2831 App Note – Error Vector Spectrum
187
Constellation (no LTE interference) Constellation (LTE interference present)
In the Constellation side-by-side above, there is clear MER degradation in the right-hand example.
However, consider how these tests would appear in the field. In a real-world case, there’s no guarantee that
the MER degradation would be due to LTE interference; it could be any of several types of interfering signals.
When troubleshooting in the field, it can be difficult to confirm what to hunt.
This is where EVS comes in.
Error Vector Spectrum (no LTE interference) Error Vector Spectrum (LTE interference present)
In the righthand example, the EVS test results show regular intervals. These intervals indicate LTE PDCCH
(Physical Downlink Control Channel) signal, which carry DCI (Downlink Control Information).
PDCCH only occupies a small part of the channel. Thus, when the LTE frequency signal is processed as
inverse Fourier Transform to time-domain signal, the PDCCH power is displayed as lower than the data signal.
The PDCCH only transmits once every 1ms. We can see 10 PDCCH intervals in 10ms here.
In other words, LTE frames are 10ms long, LTE sub-frames appear every 1ms, and will typically show up in the
EVS time-domain function as a negative peak appearing every 1ms.

DS2831 App Note – Error Vector Spectrum
188
Note that this should not be confused with apparent QAM carriers on the screen. When using the EVS time-
domain function, users should bear in mind that the horizontal axis at the bottom charts time, not frequency.
In this context, it is clear that these negative peaks appear every 1ms.

Version 181214. ©2018 Deviser Instruments Incorporated.
780 Montague Expressway, Suite 701, San Jose, CA 95131.
[email protected] • +1.408.955.0938 • www.deviserinstruments.com
Related Documents