Los Angeles Region Report CALIFORNIA’S FOURTH CLIMATE CHANGE ASSESSMENT Coordinating Agencies:

Welcome message from author
This document is posted to help you gain knowledge. Please leave a comment to let me know what you think about it! Share it to your friends and learn new things together.
Transcript

Los Angeles Region Report
CALIFORNIA’S FOURTH
CLIMATE CHANGE ASSESSMENT
Coordinating Agencies:
Fourth Climate Change Assessment Los Angeles Region | 2
CALIFORNIA’S FOURTH
CLIMATE CHANGE ASSESSMENT
CALIFORNIA’S FOURTH
CLIMATE CHANGE ASSESSMENT
C
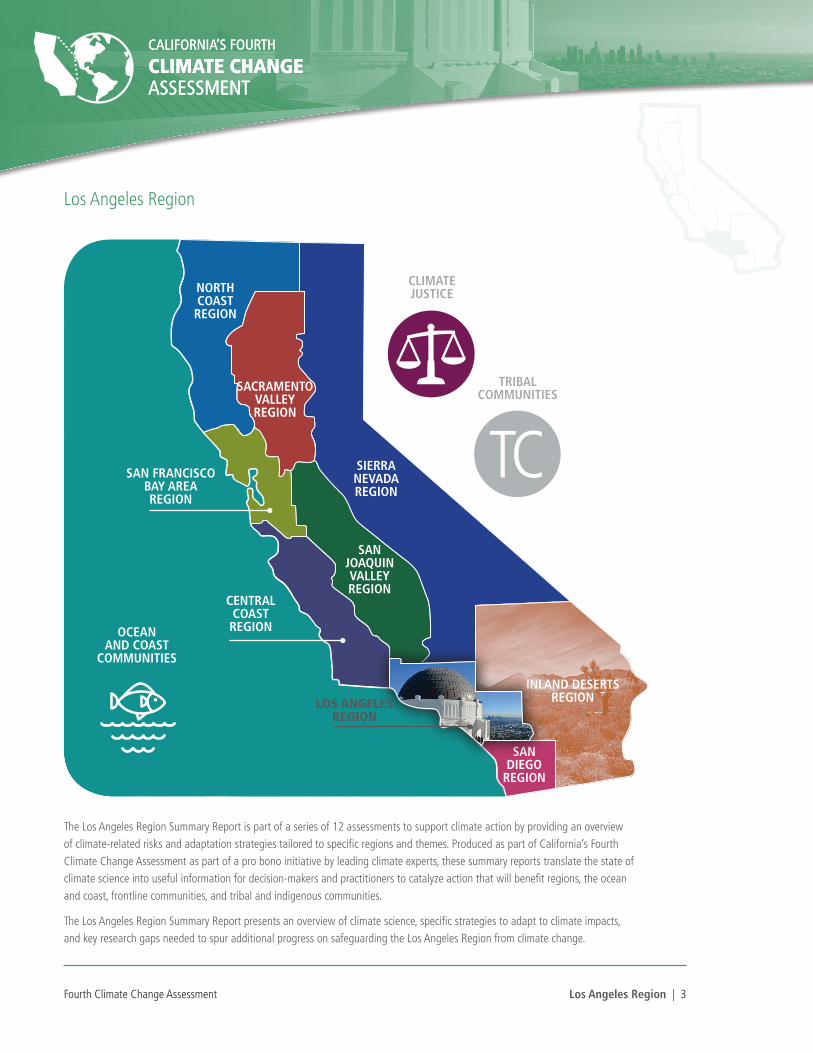
• A concise summary of the Fourth Assessment’s most important findings and conclusions.
• An in-depth report on how California’s people, built environment, and ecosystems will be impacted by climate change and how we can proactively adapt, based on the Fourth Assessment’s findings.
• Reports summarizing Fourth Assessment findings to provide a state of the science for nine regions, the ocean and coast, tribal communities, and climate justice in California.
• Academic research that provides robust and detailed results on resilience and vulnerability to climate change.
• A shared foundation of updated climate change projections, data and ecosystem models developed for use by Assessment authors to permit cross-comparability of results and ensure the findings consider a robust range of future climate conditions. These data are available to the public via Cal-Adapt.org.
All research contributing to the Fourth Assessment was peer-reviewed to ensure scientific rigor as well as, where applicable, appropriate representation of the practitioners and stakeholders to whom each report applies.
For the full suite of Fourth Assessment research products, please visit: www.ClimateAssessment.ca.gov
KEY FINDINGS
ASSESSMENT FOUNDATION: UPDATED CLIMATE PROJECTIONS AND DATA
SUMMARIES FOR REGIONS AND COMMUNITIES
STATEWIDE SUMMARY
ORIGINAL RESEARCH TO INFORM POLICY AND ACTION
Introduction to California’s Fourth Climate Change Assessment
alifornia is a global leader in using, investing in, and advancing research to set proactive climate change policy, and its Climate Change Assessments provide the scientific foundation for understanding climate-related vulnerability at the local scale and informing resilience actions. The Climate Change Assessments directly inform State policies, plans, programs, and guidance to promote effective and integrated action to
safeguard California from climate change.
California’s Fourth Climate Change Assessment (Fourth Assessment) advances actionable science that serves the growing needs of state and local-level decision-makers from a variety of sectors. This cutting-edge research initiative is comprised of a wide-ranging body of technical reports, including rigorous, comprehensive climate change scenarios at a scale suitable for illuminating regional vulnerabilities and localized adaptation strategies in California; datasets and tools that improve integration of observed and projected knowledge about climate change into decision-making; and recommendations and information to directly inform vulnerability assessments and adaptation strategies for California’s energy sector, water resources and management, oceans and coasts, forests, wildfires, agriculture, biodiversity and habitat, and public health. In addition, these technical reports have been distilled into summary reports and a brochure, allowing the public and decision-makers to easily access relevant findings from the Fourth Assessment.
Fourth Climate Change Assessment Los Angeles Region | 3
CALIFORNIA’S FOURTH
CLIMATE CHANGE ASSESSMENT
CALIFORNIA’S FOURTH
CLIMATE CHANGE ASSESSMENT
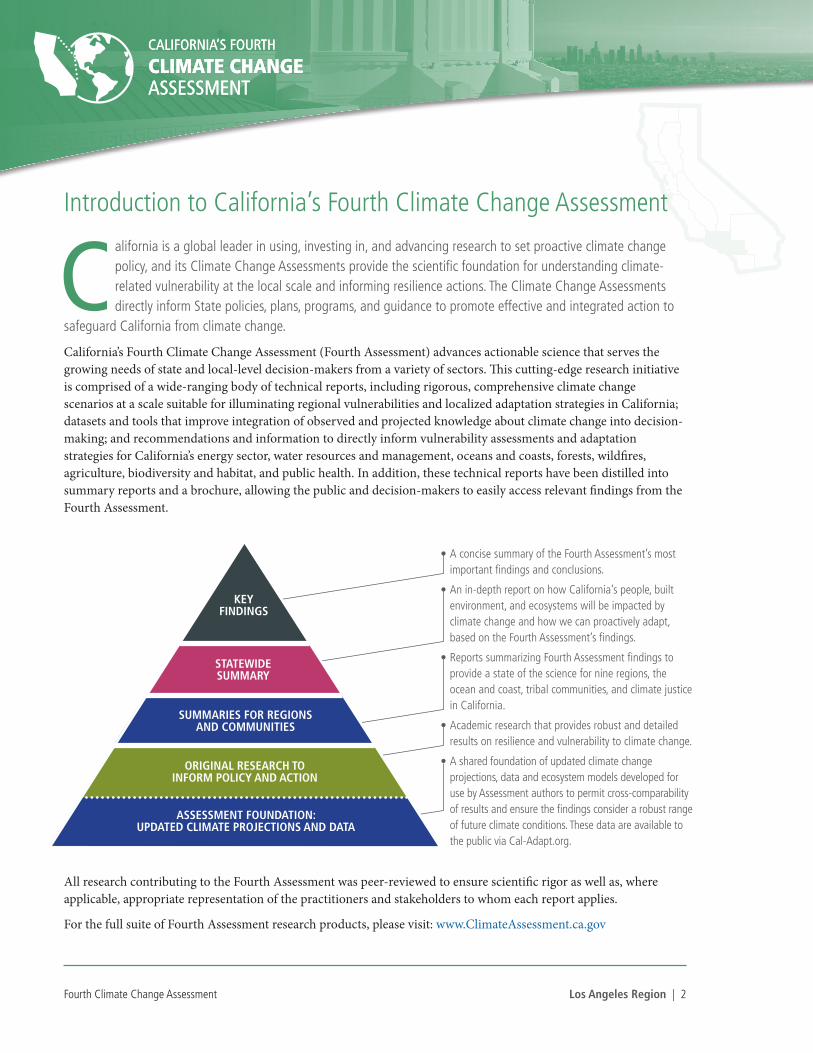
The Los Angeles Region Summary Report is part of a series of 12 assessments to support climate action by providing an overview of climate-related risks and adaptation strategies tailored to specific regions and themes. Produced as part of California’s Fourth Climate Change Assessment as part of a pro bono initiative by leading climate experts, these summary reports translate the state of climate science into useful information for decision-makers and practitioners to catalyze action that will benefit regions, the ocean and coast, frontline communities, and tribal and indigenous communities.
The Los Angeles Region Summary Report presents an overview of climate science, specific strategies to adapt to climate impacts, and key research gaps needed to spur additional progress on safeguarding the Los Angeles Region from climate change.
Los Angeles Region
SAN DIEGO
REGION
SAN FRANCISCO BAY AREA REGION
NORTH COAST REGION
CLIMATE JUSTICE
OCEAN AND COAST
COMMUNITIES
TRIBAL COMMUNITIES
SACRAMENTO VALLEY REGION
SAN JOAQUIN VALLEY REGION
SIERRA NEVADA REGION
LOS ANGELES REGION
CENTRAL COAST REGION
INLAND DESERTS REGIONLOS ANGELES
REGION

Fourth Climate Change Assessment Los Angeles Region | 4
CALIFORNIA’S FOURTH
CLIMATE CHANGE ASSESSMENT
CALIFORNIA’S FOURTH
CLIMATE CHANGE ASSESSMENT
Los Angeles Region Authors
COORDINATING LEAD AUTHOR
Alex Hall, University of California, Los Angeles
LEAD AUTHORS
Neil Berg, University of California, Los Angeles
Katharine Reich, University of California, Los Angeles
CONTRIBUTING AUTHORS
Mike Antos Santa Ana Watershed Project AuthorityGeorge Ban-Weiss University of Southern CaliforniaAndre Biscaro University of California, DavisSabrina Bornstein City of Los AngelesJ. Mijin Cha Occidental CollegeOleg Daugovish University of California Cooperative Extension, Ventura CountyBen Faber University of California Cooperative Extension, Ventura CountyEric Fournier University of California, Los AngelesTimu Gallien University of California, Los AngelesTom Gillespie University of California, Los AngelesDarren Haver University of California Cooperative Extension, Orange County
Amber Kerr University of California, Davis Jaimee S. Lederman University of California, Los AngelesCaryn Mandelbaum Environment NowMartha Matsuoka Occidental CollegeJuan Matute University of California, Los Angeles Fern Nueno City of Long BeachJonathan Parfrey Climate Resolve Tapan Pathak University of California, MercedStephanie Pincetl University of California, Los Angeles Erik Porse University of California, Los AngelesElizabeth Rhoades County of Los AngelesJames Sadd Occidental College, and Pablo Saide University of California, Los AngelesJerry Schubel Aquarium of the Pacific
Bhavna Shamasunder Occidental CollegeKristen Torres Pawling County of Los AngelesAlisa Williams County of Los Angeles
STAKEHOLDER ADVISORY COMMITTEE
Marissa Aho City of Los AngelesLee Alexanderson Los Angeles County Department of Public Works Fernando Cazares Trust for Public Land Juliette Finzi Hart U.S. Geological SurveyJason Greenspan Southern California Association of Governments Laurel Hunt Los Angeles Regional Collaborative for Climate Action and Sustainability Gregory Lopez Leonardo DiCaprio Foundation Tanya Peacock Southern California Gas Company
ADDITIONAL REVIEW
Mark Gold University of California, Los Angeles
Disclaimer: This report summarizes recent climate research, including work sponsored by the California Natural Resources Agency and California Energy Commission. The information presented here does not necessarily represent the views of the funding agencies or the State of California.
CITATION: Hall, Alex, Neil Berg, Katharine Reich. (University of California, Los Angeles). 2018. Los Angeles Summary Report. California’s Fourth Climate Change Assessment. Publication number: SUM-CCCA4-2018-007.

Fourth Climate Change Assessment Los Angeles Region | 5
CALIFORNIA’S FOURTH
CLIMATE CHANGE ASSESSMENT
CALIFORNIA’S FOURTH
CLIMATE CHANGE ASSESSMENT
Table of Contents
Highlights .......................................................................................................................................................................................6
Introduction to the Region and Report .......................................................................................................................................7
Regional Climate Science ..............................................................................................................................................................9
Climate and Sea Level Rise Datasets .................................................................................................................................9
Temperature ..........................................................................................................................................................................9
Precipitation .......................................................................................................................................................................12
Extreme Storms ..................................................................................................................................................................14
Santa Ana Winds ................................................................................................................................................................14
Sea Level Rise .....................................................................................................................................................................15
Wildfire ...............................................................................................................................................................................18
Drought ...............................................................................................................................................................................19
Clouds..................................................................................................................................................................................19
Humidity .............................................................................................................................................................................19
Air Quality .........................................................................................................................................................................20
Impacts on the Region .................................................................................................................................................................21
Human Systems ..................................................................................................................................................................21
Economic Systems .............................................................................................................................................................35
Natural and Managed Resource Systems ........................................................................................................................52
Conclusion ....................................................................................................................................................................................69
References ......................................................................................................................................................................................70
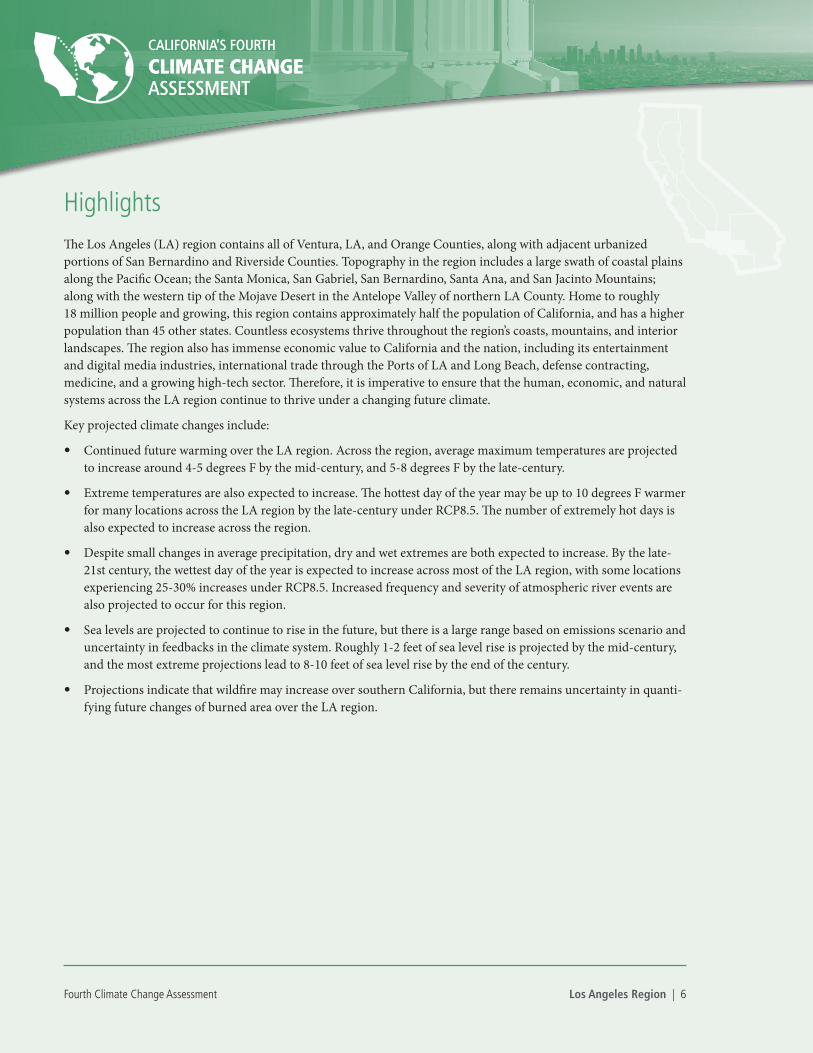
Highlights The Los Angeles (LA) region contains all of Ventura, LA, and Orange Counties, along with adjacent urbanized portions of San Bernardino and Riverside Counties. Topography in the region includes a large swath of coastal plains along the Pacific Ocean; the Santa Monica, San Gabriel, San Bernardino, Santa Ana, and San Jacinto Mountains; along with the western tip of the Mojave Desert in the Antelope Valley of northern LA County. Home to roughly 18 million people and growing, this region contains approximately half the population of California, and has a higher population than 45 other states. Countless ecosystems thrive throughout the region’s coasts, mountains, and interior landscapes. The region also has immense economic value to California and the nation, including its entertainment and digital media industries, international trade through the Ports of LA and Long Beach, defense contracting, medicine, and a growing high-tech sector. Therefore, it is imperative to ensure that the human, economic, and natural systems across the LA region continue to thrive under a changing future climate.
Key projected climate changes include:
• Continued future warming over the LA region. Across the region, average maximum temperatures are projected to increase around 4-5 degrees F by the mid-century, and 5-8 degrees F by the late-century.
• Extreme temperatures are also expected to increase. The hottest day of the year may be up to 10 degrees F warmer for many locations across the LA region by the late-century under RCP8.5. The number of extremely hot days is also expected to increase across the region.
• Despite small changes in average precipitation, dry and wet extremes are both expected to increase. By the late-21st century, the wettest day of the year is expected to increase across most of the LA region, with some locations experiencing 25-30% increases under RCP8.5. Increased frequency and severity of atmospheric river events are also projected to occur for this region.
• Sea levels are projected to continue to rise in the future, but there is a large range based on emissions scenario and uncertainty in feedbacks in the climate system. Roughly 1-2 feet of sea level rise is projected by the mid-century, and the most extreme projections lead to 8-10 feet of sea level rise by the end of the century.
• Projections indicate that wildfire may increase over southern California, but there remains uncertainty in quanti-fying future changes of burned area over the LA region.
Fourth Climate Change Assessment Los Angeles Region | 6
CALIFORNIA’S FOURTH
CLIMATE CHANGE ASSESSMENT
CALIFORNIA’S FOURTH
CLIMATE CHANGE ASSESSMENT

Fourth Climate Change Assessment Los Angeles Region | 7
CALIFORNIA’S FOURTH
CLIMATE CHANGE ASSESSMENT
CALIFORNIA’S FOURTH
CLIMATE CHANGE ASSESSMENT
Introduction to the Region and Report
he Los Angeles (LA) region contains all of Ventura, LA, and Orange Counties, along with adjacent urbanized portions of San Bernardino and Riverside Counties (Figure 1). Topography in the region includes a large swath of coastal plains along the Pacific Ocean; the Santa Monica, San Gabriel, San Bernardino, Santa Ana, and San Jacinto Mountains; along with the western tip of the Mojave Desert in the Antelope
Valley of northern LA County. Home to roughly 18 million people and growing, this region approximately contains half the population of California, and has a greater population than 45 other states. The region also has immense economic value to California and the nation, including its entertainment and digital media industries, international trade through the Ports of LA and Long Beach, defense contracting, medicine, and a growing high-tech sector.
The region is characterized by a Mediterranean climate with hot, dry summers and cool, wet winters. This famously pleasant climate influences all aspects of life in the LA region. Countless ecosystems thrive throughout the region’s coasts, mountains, and interior landscapes. Substantial agricultural production occurs here, taking advantage of the bountiful sunshine and generally warm temperatures. Snow-based water from the Sierra Nevada (and Colorado Rockies) have, to date, largely satisfied the region’s huge residential, industrial, agricultural, and ecological freshwater demands. A complex web of generation and transmission systems has also provided enough energy to power to the region’s vast population. Cars, and especially solo driver traveling, remain the primary mode of transportation, leading to notoriously congested roadways with related problems of poor air quality blanketing the region.
Despite the region’s overall prosperity, there remain significant environmental injustices. Large vulnerable communities, notably those that are economically disadvantaged – including racial and ethnic minorities, the elderly, and the homeless – are currently exposed to harmful environmental conditions. These include polluted air, water sources, and landscapes, in addition to heat stress.
T
FIGURE 1
Los Angeles region topography and boundary definition as a solid red line, which encompasses Los Angeles, Ventura, and Orange Counties, and adjacent urbanized portions of San Bernardino and Riverside Counties.

Fourth Climate Change Assessment Los Angeles Region | 8
CALIFORNIA’S FOURTH
CLIMATE CHANGE ASSESSMENT
CALIFORNIA’S FOURTH
CLIMATE CHANGE ASSESSMENT
In fact, the region contains some of the most vulnerable neighborhoods in all of California, including much of East and South LA, Pomona, and Ontario. Future climate changes, especially increases in extreme heat, are expected to disproportionately burden low-income residents and communities of color across the region.
It is imperative to ensure that the human, economic, and natural systems across the LA region continue to thrive under a changing future climate. The LA Regional Collaborative for Climate Action and Sustainability (http://www.laregionalcollaborative.com/) and a handful of climate action plans within the region have already begun to organize and plan for these changes. Alongside these frameworks, this report summarizes the current understanding of projected local climate changes, and their impacts to public health, energy, transportation, land use, emergency management, vegetation and flora, oceans and coasts, agriculture, and water in the region. Examples of how the region has already adapted, or is planning to adapt, to new climate conditions are also included where available in certain sections of the report. They serve as clear examples that increasing the resiliency and sustainability of the LA region under a changing climate is a challenging yet achievable task. Overall, we intend for this report to serve as a summary of the latest science and impacts of regional climate change for stakeholders, policymakers, local officials, and others to consider in their decisions to help mitigate and adapt to these changes.

Fourth Climate Change Assessment Los Angeles Region | 9
CALIFORNIA’S FOURTH
CLIMATE CHANGE ASSESSMENT
CALIFORNIA’S FOURTH
CLIMATE CHANGE ASSESSMENT
Regional Climate Science
n this section, we begin by briefly describing the climate and sea level projections developed for the Fourth Assessment that are examined for the LA region in this report. We then synthesize literature on observed changes and projected future changes to key aspects of the region’s climate: temperature, precipitation, extreme storms, Santa Ana winds, sea level, wildfire, drought, clouds, humidity, and air quality.
Climate and Sea Level Rise Datasets
For the Fourth Assessment, Cayan et al. (2018) downscaled daily temperature and precipitation projections from 32 global climate models (GCMs) over California to a spatial resolution of 1/16° (around 6 km, or 3.7 miles) using a method called Localized Constructed Analogues (Pierce et al. 2014). 10 of the 32 downscaled GCMs were found to best simulate important aspects of California’s climate and this subset of GCMs are used for analyses and figures in this report. The dataset includes a historical period of 1950-2005 and then two future projections spanning 2006-2100 based on two greenhouse gas emissions scenarios - Representative Concentration Pathways (RCP) 4.5 and 8.5. RCP4.5 represents a mitigation scenario where global CO2 emissions peak by 2040, while RCP8.5 represents a “business-as-usual” scenario where CO2 emissions continue to rise throughout the 21st century (van Vuuren et al. 2011). Public access to the downscaled data, along with mapping and other visualization tools, can be found at www.cal-adapt.org. Some caveats must be applied when interpreting the LOCA projections. The LOCA statistical downscaling procedure assumes persistence in the fundamental physics that drive spatial gradients across the region. Thus, future changes in sea breeze, clouds, and other local processes that could have important implications for spatial patterns of changes in temperature and precipitation are not captured in these projections.
California-specific sea level rise projections were also developed for the Fourth Assessment (Cayan et al. 2018). Projections were generated under RCP4.5 and RCP8.5 scenarios using a probabilistic approach to estimate components that contribute to global and regional sea level rise, including possible contributions from Antarctica. Hourly sea level rise projections were also developed for selected coastal locations that include tides, regional and local weather influences, and short period Pacific climate fluctuations, along with the statewide sea level rise scenarios.
Temperature
Observations over the past century indicate that temperature has increased across southern California. Based on 1896-2015 temperature records for the California South Coast NOAA Climate Division, which encompasses the LA region, He and Gautam (2016) found significant trends in annual average, maximum, and minimum temperature around 0.16°C per decade. Every month has experienced significant positive trends in monthly average, maximum, and minimum temperature. Monthly average and minimum temperatures have increased the most in September and monthly maximum temperatures have increased the most in January, with each trend exceeding 0.2°C per decade. Recently, the California South Coast Climate Division has experienced sustained record warmth. The top 5 warmest years in terms of annual average temperature have all occurred since 2012: 2014 was the warmest, followed by 2015, 2017, 2016, and 2012 (data can be accessed at https://www.ncdc.noaa.gov/temp-and-precip/climatological-rankings/).
I

Fourth Climate Change Assessment Los Angeles Region | 10
CALIFORNIA’S FOURTH
CLIMATE CHANGE ASSESSMENT
CALIFORNIA’S FOURTH
CLIMATE CHANGE ASSESSMENT
Warming is expected to increase across the LA region in the coming decades (Cayan et al. 2008; Horton et al. 2015; Swain et al. 2016; Maurer 2007; Hayhoe et al. 2004; Sun, Walton, and Hall 2015). Figure 2 shows projected changes in annual average daily maximum temperature using data sets developed for the Assessment. Figure 2a displays the annual averages for 1960-2005 using historical observations and model simulations, alongside 2006-2100 annual averages based on 10 downscaled GCM projections under RCP4.5 and 8.5. Figure 2b summarizes the continuous time series in Fig. 2a by noting the average annual-mean, along with the maximum and minimum annual-mean, across four time periods: 1976-2005 (historical), 2006-2039 (early-21st century), 2040-2069 (mid-21st century), and 2070-2100 (late 21st century). Projections are similar during the early-21st century regardless of emissions scenario. Only later in the 21st century do the projections diverge, as emissions continue to rise under RCP8.5, while they plateau in the mid-century under RCP4.5. Specifically, compared to the modeled historical annual average maximum temperature of 72.5°F, future model-average values are projected to increase to 74.8°F (model range of 69.5 - 79.1°F) by the early-21st century, 76.7°F (73.3 - 81.2°F) by the mid-21st century, and 77.8°F (74.0 - 83.1°F) by the late-21st century under RCP4.5 (blue dots and lines, Figure 2b). Corresponding model-average projections under RCP8.5 are 75.1°F (70.7 - 80.7°F) by the early-21st century, 78.2°F (74.4 - 84.8°F) by the mid-21st century, and 80.9°F (76.9 - 87.8°F) by the late-21st century (red dots and lines, Fig. 2b). Note that the data in Figure 2 combines inter-annual variability and model variability, resulting in apparent increases in future variability over the region.
FIGURE 2
Historical-observed (black), historical-modeled (grey), and projected future (RCP4.5 - blue, RCP8.5 - red) annual average maximum temperature over the LA region. (a) Annual time series of data (future projections begin in 2006), with solid lines representing model-averages and shading representing model spread. (b) Summary of model-average (circles) and spread (vertical lines) across four time periods: 1976-2005 (historical), 2006-2039 (early-21st century), 2040-2069 (mid-21st century), and 2070-2100 (late-21st century). Unit is °F.
Fourth Climate Change Assessment Los Angeles Region | 11
CALIFORNIA’S FOURTH
CLIMATE CHANGE ASSESSMENT
CALIFORNIA’S FOURTH
CLIMATE CHANGE ASSESSMENT
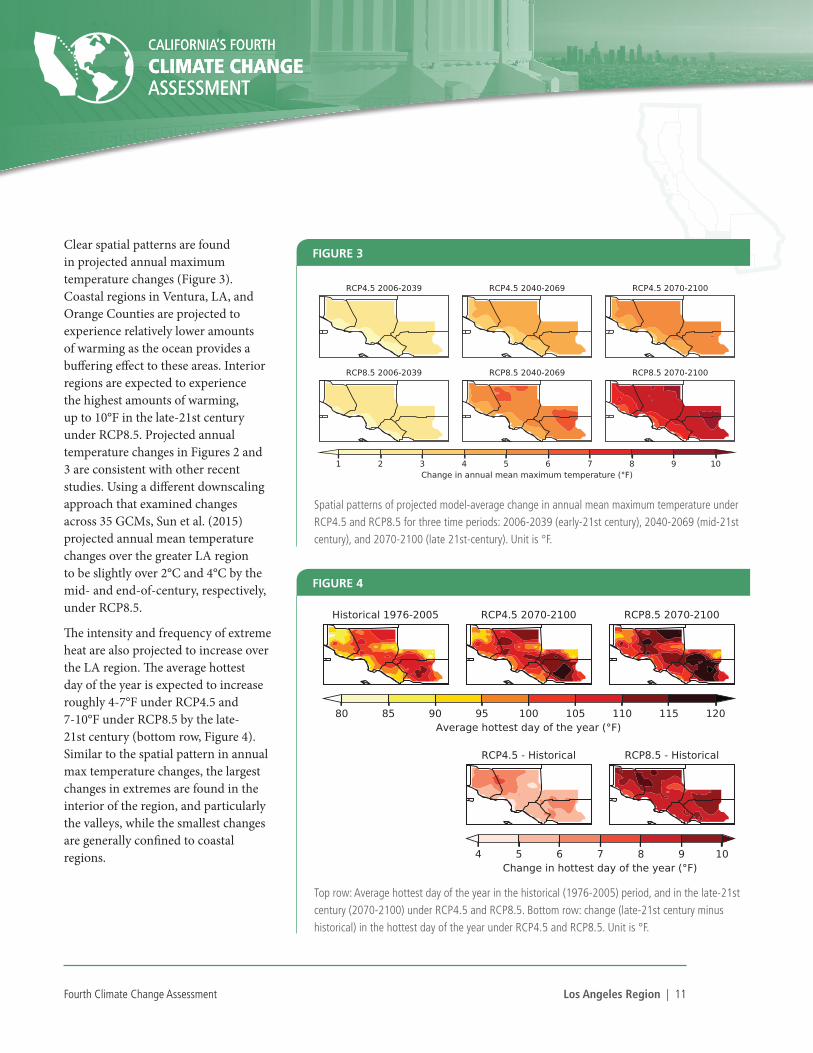
Clear spatial patterns are found in projected annual maximum temperature changes (Figure 3). Coastal regions in Ventura, LA, and Orange Counties are projected to experience relatively lower amounts of warming as the ocean provides a buffering effect to these areas. Interior regions are expected to experience the highest amounts of warming, up to 10°F in the late-21st century under RCP8.5. Projected annual temperature changes in Figures 2 and 3 are consistent with other recent studies. Using a different downscaling approach that examined changes across 35 GCMs, Sun et al. (2015) projected annual mean temperature changes over the greater LA region to be slightly over 2°C and 4°C by the mid- and end-of-century, respectively, under RCP8.5.
The intensity and frequency of extreme heat are also projected to increase over the LA region. The average hottest day of the year is expected to increase roughly 4-7°F under RCP4.5 and 7-10°F under RCP8.5 by the late-21st century (bottom row, Figure 4). Similar to the spatial pattern in annual max temperature changes, the largest changes in extremes are found in the interior of the region, and particularly the valleys, while the smallest changes are generally confined to coastal regions.
FIGURE 3
Spatial patterns of projected model-average change in annual mean maximum temperature under RCP4.5 and RCP8.5 for three time periods: 2006-2039 (early-21st century), 2040-2069 (mid-21st century), and 2070-2100 (late 21st-century). Unit is °F.
FIGURE 4
Top row: Average hottest day of the year in the historical (1976-2005) period, and in the late-21st century (2070-2100) under RCP4.5 and RCP8.5. Bottom row: change (late-21st century minus historical) in the hottest day of the year under RCP4.5 and RCP8.5. Unit is °F.

Fourth Climate Change Assessment Los Angeles Region | 12
CALIFORNIA’S FOURTH
CLIMATE CHANGE ASSESSMENT
CALIFORNIA’S FOURTH
CLIMATE CHANGE ASSESSMENT
The number of extremely hot days is expected to increase in the future. For instance, LA International Airport (LAX) historically experiences less than 15 days per year with temperatures equal to or greater than 90°F (Cayan et al. 2018). By the end of the century under RCP8.5, LAX is projected to experience 50–90 such days per year (Pierce et al. 2018). Sun et al. (2015) similarly found that land locations are projected to experience 60–90 additional extremely hot days (greater than or equal to 95°F) per year by the end of the century, with the exception of the highest elevations and regions along the coast, where increases are only a few days.
Precipitation
Precipitation over the LA region is highly variable from year to year (black line in Figure 5a, Dettinger et al. 2011; Mitchell and Blier 1997) and only about five storms each year make up 50% of the annual precipitation total. Natural climate variability phenomena, such as the El Niño-Southern Oscillation, can influence the amount of precipitation that the region receives (Hoell et al. 2016), but there are no clear trends in historical precipitation for this region (Fig. 5a, He and Gautam 2016; Seager et al. 2014).
FIGURE 5
Historical observed (black), historical modeled (grey), and projected future (RCP4.5 - blue, RCP8.5 - red) annual average precipitation over the LA region. (a) Annual time series (historical: 1960-2005, RCP4.5/RCP8.5: 2006-2100), with solid lines representing model averages and shading representing spread across models. (b) Summary of model averages (circles) and spread (vertical lines) across four time periods: 1976-2005 (historical), 2006-2039 (early-21st century), 2040-2069 (mid-21st century), and 2070-2100 (late-21st century). Unit is inches.

Fourth Climate Change Assessment Los Angeles Region | 13
CALIFORNIA’S FOURTH
CLIMATE CHANGE ASSESSMENT
CALIFORNIA’S FOURTH
CLIMATE CHANGE ASSESSMENT
Southern California lies between two large-scale zones of opposing projected precipitation change: general wetting in the northern mid-latitudes versus general drying in the southern sub-tropics (Guzman-Morales et al. 2016a; Hughes and Hall 2009a; Held and Soden 2006; Chou and David Neelin 2004; Trenberth 2011). Consequently, model projections disagree on the sign of future precipitation change over southern California, but generally project small mean changes (either positive or negative) compared to the region’s large historical variability (Figure 6, Berg et al. 2015; Neelin et al. 2013; Pierce et al. 2012; Maurer 2007; Hayhoe et al. 2004).
Despite small changes in average precipitation, dry and wet extremes are both expected to increase in the future (Polade et al. 2014; Swain et al. 2018). By the late-21st century, the wettest day of the year is expected to increase across most of the LA region, with some locations experiencing 25-30% increases under RCP8.5 (Figure 6, lower panel). Extreme precipitation often arrives via “atmospheric rivers”, and possible changes to these and other extreme storms are discussed further in the subsequent section. Extremely dry years are also projected to increase over southern California, potentially a doubling or more in frequency by the late-21st century (Swain et al. 2018).
FIGURE 6
Top row: Average wettest day of the year in the historical (1976-2005) period and in the late-21st century (2070-2100) under RCP4.5 and RCP8.5. Unit is inches. Bottom row: change (late-21st century minus historical) in the wettest day of the year under RCP4.5 and RCP8.5. Unit is percent.

Fourth Climate Change Assessment Los Angeles Region | 14
CALIFORNIA’S FOURTH
CLIMATE CHANGE ASSESSMENT
CALIFORNIA’S FOURTH
CLIMATE CHANGE ASSESSMENT
Extreme Storms
Atmospheric rivers are regions of high water vapor transport from the tropics to the Pacific Coast of the U.S. that can produce intense topographic-induced precipitation along southern California mountain ranges (Neiman et al. 2008; J. Kim et al. 2012; Harris and Carvalho 2017; Guan et al. 2013; Payne and Magnusdottir 2014). Such events have helped pull the region out of droughts, although they are also responsible for devastating floods and mudslides (Ralph et al. 2006; Guan et al. 2013; M. D. Dettinger 2013). Between 1979-2013, 72 atmospheric rivers were identified as landfalling along the coast of southern California, approximately 2-3 events each year, though significant interannual variability exists. The frequency of atmospheric rivers over southern California has a potential connection to some natural climate variability patterns (Neiman et al. 2008; J. Kim et al. 2012; Harris and Carvalho 2017; Guan et al. 2013; Payne and Magnusdottir 2014).
Analysis of several previous-generation GCMs by (Dettinger 2011a) suggest that the frequency of atmospheric river events may increase in the future, and that the storms themselves will be associated with higher water vapor transport rates compared to historical conditions. Moreover, the peak season of atmospheric rivers may also lengthen, which could extend the flood-hazard season in California. The current generation of GCMs project a nearly 40% increase in precipitation during atmospheric river events over southern California by the late-21st century under RCP8.5. The number of atmospheric river events is also projected to increase in the future, possibly around a doubling of days by the end of the century (Warner et al. 2015; Hagos et al. 2016; Gao et al. 2015). Understanding future characteristics of atmospheric rivers, particularly over local spatial scales in California, remains an active area of research.
Santa Ana Winds
Characterized by strong northeasterly downslope and offshore flows, Santa Ana winds are a unique climatic feature during October to April in southern California. Very dry air associated with these winds can be catalysts for wildfire outbreaks in the region, notably the recent Thomas Fire in Ventura County in December 2017. Santa Ana winds tend to be most frequent in December, yet strongest in January (Guzman-Morales et al. 2016a; Hughes and Hall 2009a; Hughes, Hall, and Kim 2011a; Conil and Hall 2006). Significant interannual variability exists for these events, and there is evidence that their intensity may be connected with low-frequency climate variability patterns, such as the El Niño-Southern Oscillation and the Pacific Decadal Oscillation. However, no significant trends in intensity, duration, or frequency of Santa Ana winds have been detected during 1948-2010 (Guzman-Morales et al. 2016a; Hughes and Hall 2009a; Hughes et al. 2011a).
There is uncertainty in future changes to Santa Ana events. One study that examined two global climate models found an increase in future Santa Ana events, though others have found that the number of Santa Ana events may decrease around 20% in the future, as relatively greater warming over the interior land masses may weaken the ocean-to-desert temperature gradient that partly drives Santa Ana winds (Guzman-Morales et al. 2016b; Hughes and Hall 2009b; Hughes et al. 2011b; N. L. Miller and Schlegel 2006). Downscaling future wind fields and understanding their response to anthropogenic forcings remains a challenge and requires greater research going forward.
Fourth Climate Change Assessment Los Angeles Region | 15
CALIFORNIA’S FOURTH
CLIMATE CHANGE ASSESSMENT
CALIFORNIA’S FOURTH
CLIMATE CHANGE ASSESSMENT
Sea Level Rise
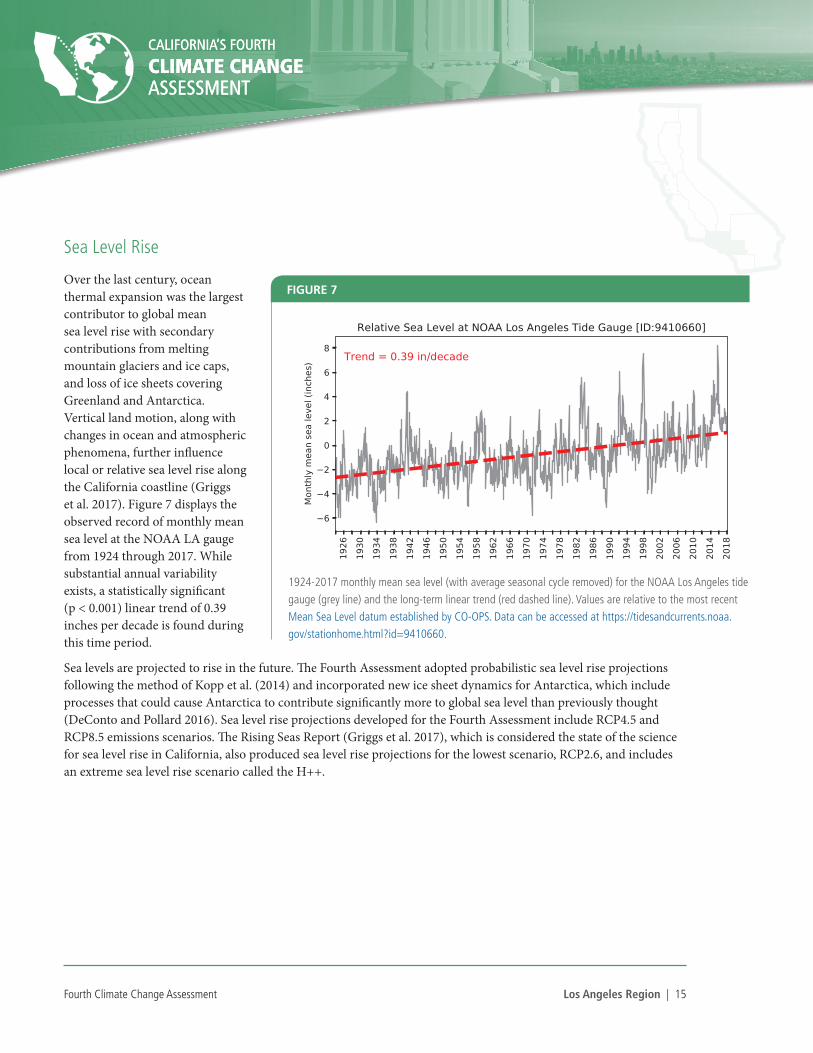
Over the last century, ocean thermal expansion was the largest contributor to global mean sea level rise with secondary contributions from melting mountain glaciers and ice caps, and loss of ice sheets covering Greenland and Antarctica. Vertical land motion, along with changes in ocean and atmospheric phenomena, further influence local or relative sea level rise along the California coastline (Griggs et al. 2017). Figure 7 displays the observed record of monthly mean sea level at the NOAA LA gauge from 1924 through 2017. While substantial annual variability exists, a statistically significant (p < 0.001) linear trend of 0.39 inches per decade is found during this time period.
Sea levels are projected to rise in the future. The Fourth Assessment adopted probabilistic sea level rise projections following the method of Kopp et al. (2014) and incorporated new ice sheet dynamics for Antarctica, which include processes that could cause Antarctica to contribute significantly more to global sea level than previously thought (DeConto and Pollard 2016). Sea level rise projections developed for the Fourth Assessment include RCP4.5 and RCP8.5 emissions scenarios. The Rising Seas Report (Griggs et al. 2017), which is considered the state of the science for sea level rise in California, also produced sea level rise projections for the lowest scenario, RCP2.6, and includes an extreme sea level rise scenario called the H++.
FIGURE 7
1924-2017 monthly mean sea level (with average seasonal cycle removed) for the NOAA Los Angeles tide gauge (grey line) and the long-term linear trend (red dashed line). Values are relative to the most recent Mean Sea Level datum established by CO-OPS. Data can be accessed at https://tidesandcurrents.noaa.gov/stationhome.html?id=9410660.

Fourth Climate Change Assessment Los Angeles Region | 16
CALIFORNIA’S FOURTH
CLIMATE CHANGE ASSESSMENT
CALIFORNIA’S FOURTH
CLIMATE CHANGE ASSESSMENT
Figure 8 displays sea levels for each decade remaining in the 21st century based on the probabilistic projections developed by the Fourth Assessment (“4th RCP4.5” [light blue lines] and “4th RCP8.5” [dark blue lines]), the Rising Seas projections (“RS RCP2.6 [pink lines], “RS RCP8.5” [dark red lines], and “RS H++” [red star in year 2100]). Uncertainty ranges are available for the Fourth Assessment RCP4.5 and 8.5 projections, along with the Rising Seas RCP2.6 and RCP8.5 projections. These uncertainty ranges are summarized by each dataset’s 5th, 50th, 95th, and 99.9th percentiles. For additional reference, sea level rise projections and uncertainty for just the year 2100 according to the National Research Council are also shown (black dot and grey line in year 2100).
Focusing on the Assessment projections, differences between RCP4.5 and RCP8.5 begin to clearly emerge in the second half of the 21st century. Continued emissions and warmer future temperatures under RCP8.5 lead to drastically higher sea level rise projections compared to RCP4.5, especially by the end of the century. Specifically, the Fourth Assessment projects the 5th, 50th, and 95th percentiles of 2050 sea level rise to be 1.1, 5.9, and 11.1 inches under RCP4.5, with corresponding values of 2.3, 7.3, 13.3 inches under RCP8.5. By 2100, the 5th, 50th, and 95th values are 10.2, 25.4, and 51.7 inches under RCP4.5, and 24.8, 50.2, and 90.9 inches under RCP8.5. Differences between the Fourth Assessment and Rising Seas projections are also small until 2050. RCP8.5 projections by the Assessment are generally higher than corresponding projections by Rising Seas, and the ranges of projections for each dataset highlight that large uncertainty remains about how ice sheets and feedbacks in the climate system will respond to much warmer future temperatures.
Wide sandy beaches comprise much of the LA coastline. Therefore, in addition to sea level rise, the impacts of wave events from coastal storms is another important climate change consideration for this region. Recognizing the need to have projections of sea level rise in combination with coastal storms, the Fourth Assessment provided funding to complete the development of the USGS Coastal Storm Modeling System (CoSMos, O’Neill et al. 2018; Erikson et al. 2018) for the South Coast (Pt. Conception to the U.S./Mexico border). CoSMoS is a dynamic
FIGURE 8
Los Angeles 21st-century sea level rise estimates for each decade based on: Fourth Assessment RCP4.5 (light blue) and RCP8.5 (dark blue), Rising Seas RCP2.6 (pink), Rising Seas RCP8.5 (dark red), and Rising Seas H++ in 2100 (red star). NRC is represented by the black dots and grey lines in 2100. Each decade’s estimate is shown as a range from 5th to 95th with the circle representing the 50th percentile and diamond representing the 99.9th percentile. (Figure provided by Julie Kalansky.)

Fourth Climate Change Assessment Los Angeles Region | 17
CALIFORNIA’S FOURTH
CLIMATE CHANGE ASSESSMENT
CALIFORNIA’S FOURTH
CLIMATE CHANGE ASSESSMENT
modeling approach that provides detailed predictions of coastal flooding due to both future sea level rise and storms integrated with long-term coastal evolution (i.e., beach changes and cliff/bluff retreat) over large geographic areas (hundreds of kilometers). CoSMoS models all the relevant physics of a coastal storm (e.g., tides, waves, and storm surge), which are then scaled down to local flood projections for use in community-level coastal planning and decision-making. Rather than relying on historic storm records, CoSMoS uses wind and pressure from global climate models to project coastal storms under changing climatic conditions during the 21st century. 40 different projections of sea level rise (0 - 2 meters and 5 meters at 0.25 m increments) and 4 storm scenarios (no storm, annual storm, 20-year return interval and 100-year return interval) are available for the LA region. One scenario is displayed in Figure 9, showing flooding for Redondo Beach based on projections of 4.9 ft (1.5 m) of sea level rise with a concurrent 100-year coastal storm.
FIGURE 9
Projections of 4.9 ft (1.5 m) of sea level rise with a concurrent 100-year coastal storm for Redondo Beach, CA. These data are publicly-available via the Our Coast, Our Future viewer, also funded by The Fourth Assessment.

Fourth Climate Change Assessment Los Angeles Region | 18
CALIFORNIA’S FOURTH
CLIMATE CHANGE ASSESSMENT
CALIFORNIA’S FOURTH
CLIMATE CHANGE ASSESSMENT
Wildfire
Wildfire in southern California is influenced by a multitude of factors: a dry and warm Mediterranean climate with periodic episodes of Santa Ana winds and droughts, the type and spatial distribution of vegetation (along with dead/dry vegetation caused by pests), varying topography, large urban-wildland interfaces, past fire suppression attempts, and human activities (Jin et al. 2015; Dennison et al. 2014; Faivre et al. 2016; Moritz et al. 2010; Peterson et al. 2013; Parisien and Moritz 2009; Syphard et al. 2007). Nearly 80% of wildfires occur during the summer and fall, with a quarter of annual wildfires occurring during Santa Ana events. On average during 1959-2009, around 40 fires greater than 40 hectares occurred each year (average burned area of 53,300 hectares), though considerable year-to-year variability exists (Jin et al. 2014). Jin et al. (2014) found no significant historical trends in the number, size, or burned area of Santa Ana-driven fires, though the average size of summertime non-Santa Ana based fires significantly increased from approximately 1129 ha in the 1960s to 2121 ha in the 2000s. A significant increasing trend in the 90th percentile of fire size was also found during 1984–2011, though no trend in the number of large fires was detected (Jin et al. 2015; Dennison et al. 2014; Faivre et al. 2016).
Future projections by Jin et al. (2015) using statistical models indicate that southern California may experience a larger number of wildfires and burned area by the mid-21st century under RCP8.5. Overall burned area is projected to increase over 60% for Santa Ana-based fires and over 75% for non-Santa Ana fires. New wildfire projections were developed for the Assessment (Westerling et al. 2018) using different statistical models than those used by Jin et al. (2015), which also incorporated new datasets of future climate data and land use. Compared to the observed 1950-2009 historical average area burned of 53,300 hectares (Jin et al. 2015), the modeled 1976-2005 historical average area burned is roughly 16,000 hectares (Westerling et al. 2018). This discrepancy highlights that large uncertainties remain in current wildfire models, and is an area where further research is required. Based on the projections developed by Westerling et al. (2018), the annual burned area over the LA region may increase over 2000 hectares by the mid-21st century under RCP4.5 or RCP8.5 compared to simulated historical conditions. Similar, yet potentially slightly lower, increases are projected by the late-21st century, as continued warming (even with moderate precipitation increases) could lead to overall fuel declines necessary for wildfire.

Fourth Climate Change Assessment Los Angeles Region | 19
CALIFORNIA’S FOURTH
CLIMATE CHANGE ASSESSMENT
CALIFORNIA’S FOURTH
CLIMATE CHANGE ASSESSMENT
Drought
Southern California is prone to periods of extremely dry conditions (MacDonald 2007; Woodhouse et al. 2010). The region recently experienced an exceptional drought during 2011-2015, with anthropogenic warming contributing to historically warm temperatures, dry soils, precipitation deficits, and low snowpack (Swain 2015; Mote et al. 2016; Margulis et al. 2016; Seager et al. 2015; AghaKouchak et al. 2014; Griffin and Anchukaitis 2014; Belmecheri et al. 2015). Anthropogenic warming has increased the probability that low-precipitation years coincide with warm years, increasing the current risk and severity of droughts and low snowpack in California (Diffenbaugh et al. 2015; Berg and Hall 2017; Williams et al. 2015). Atmospheric conditions conducive to California droughts, such as a persistent region of high pressure in the northeastern Pacific Ocean, may have also become more frequent in recent decades (Swain et al. 2016). GCMs project significantly drier soils in the future over the Southwest (including California), with more than an 80% chance of a multidecadal drought during 2050–2099 under RCP8.5 (Cook et al. 2015). Additional research is needed to better understand the prevalence and characteristics of future droughts on local scales in southern California.
Clouds
Low-elevation marine stratus and stratocumulus clouds are prevalent along the southern California coastline throughout the year and peak in the summer months, comprising more than 80% of all coastal clouds during the months of June through September (Iacobellis and Cayan 2013). These low clouds play an important role in the surface radiation balance and are a critical feature to certain marine ecosystems and vegetation types along the coast (Rastogi et al. 2016). The LA coast has experienced a 23% decline in stratus frequency since 1948, driven by a 63% reduction in fog frequency and potentially attributed to urban heat island effects of the region (Williams et al. 2015). Large uncertainty exists in future projections of low cloud changes, but there is emerging evidence from the GCMs that they will decline in the future (Klein et al. 2017). Further work is needed to reduce these uncertainties and improve low cloud projections along the southern California coastline.
Humidity
GCMs project a decline of relative humidity up to approximately 5% over southern California by the late-21st century under RCP8.5 (Sherwood and Fu 2014). A similar decline is found in the downscaled climate projections developed for the Fourth Assessment, with the largest changes occurring in the springtime (Cayan et al. 2018). This contradicts the finding of potentially fewer Santa Ana events in the future (p. 18), which would tend to increase relative humidity overall (as relative humidity dramatically drops during Santa Ana events (Guzman-Morales et al. 2016a). As such, there is a general lack of understanding behind the physical processes driving potential humidity changes, and more research of this aspect of climate change is needed.

Fourth Climate Change Assessment Los Angeles Region | 20
CALIFORNIA’S FOURTH
CLIMATE CHANGE ASSESSMENT
CALIFORNIA’S FOURTH
CLIMATE CHANGE ASSESSMENT
Air Quality
Despite a persistent growth in population, implemented reductions in emissions have significantly improved air quality in most metropolitan areas across the US, including LA (Figure 10). However, challenges remain as the LA basin is still the smoggiest region in the nation, creating large impacts on human health (Federico et al. 2017, Section 3.1).
Changes in meteorological conditions under climate change will affect future air quality. Regional stagnation conditions may occur more often in the future (Z. Zhao et al. 2011), which would increase pollutant concentrations (Jacob and Winner 2009). Hotter future temperatures (Section 2.2) will act to increase surface ozone concentrations both due to chemistry producing more ozone and higher rates of biogenic emissions, while increases of water vapor also influence chemistry by increasing ozone production in already polluted areas (Steiner et al. 2006). It’s been estimated that ozone could increase up to 5-10 parts per billion (ppb) by 2050 in LA (Jacobson 2008; Pfister et al. 2014), and the number of days with ozone over 90 ppb could increase between 22-33 days (Abdullah Mahmud et al. 2008). While ozone may increase in the future, changes in particulate matter are less certain. Projected changes by 2050 are generally not statistically significant (Kleeman et al. 2012; A. Mahmud et al. 2010).
Assessments of future air quality also need to consider projected changes of emissions and long-range transport of pollutants. While some studies show that local anthropogenic emissions changes are expected to revert the expected ozone increase in LA (Pfister et al. 2014), others postulate that this might not happen under the planned emissions control program for ozone precursors (Rasmussen et al. 2013). Long range transport could also play a role in increased ozone concentrations in the future along the California coast (Steiner et al. 2006). While anthropogenic emission reductions due to climate change legislation are expected to reduce future particulate matter under multiple scenarios (Kleeman et al. 2012), an increase in wildfire activity is predicted to increase particulate matter in the region (Spracklen et al. 2009; Yue et al. 2013).
Top panel: Population and evolution of maximum ozone concentration in Los Angeles (Parrish and Zhu 2009). Bottom panel: PM10 (µg/m3) annual average in the South Coast Air Basin between 1988 and 2016 (www.arb.ca.gov/adam/trends/trends1.php).
FIGURE 10

Fourth Climate Change Assessment Los Angeles Region | 21
CALIFORNIA’S FOURTH
CLIMATE CHANGE ASSESSMENT
CALIFORNIA’S FOURTH
CLIMATE CHANGE ASSESSMENT
Impacts on the Region
he previous section summarized the current scientific understanding about how the physical conditions in the LA region have already changed and how they are projected to change in the coming decades. Here, we discuss how a changing climate is expected to impact public health, energy, transportation, land use and community development, environmental justice, vegetation and flora, oceans and coasts, agriculture, and
water across the region.
Human Systems
PUBLIC HEALTH
Climate change has been called “the biggest global health threat of the 21st century” (Costello et al. 2009). In the LA region, the health impacts of climate change are far-reaching, including direct and indirect impacts related to extreme heat, poor air quality, wildfires, infectious diseases, floods and mudslides, mental health concerns, and increasing disparities caused by disproportionate impacts to vulnerable populations. While some populations will be more severely affected than others, everyone in the LA region will be touched by these changes.
Extreme Heat
The number of extreme heat days in southern California is expected to increase considerably by the middle of the century as a result of climate change (pp. 11–12). Extreme heat is one of the most significant health impacts of climate change and already causes more deaths each year in the United States than floods, storms, and lightning combined (Berko et al. 2014). Exposure to extreme heat can cause direct heat-related illness (heat cramps, heat exhaustion, and heat stroke) and death, and can also exacerbate certain existing medical conditions. Heat waves are associated with increases in the number of people seeking emergency medical care for a variety of health conditions, though the magnitude of this effect depends on many factors, including geographic location, demographics, and availability of adaptive strategies such as air conditioning. During California’s 2006 heat wave, there were 16,166 excess emergency department visits and 1,182 excess hospitalizations across the state, with increases in visits for kidney-related diseases, diabetes, and cardiovascular disease (Knowlton et al. 2009). Excess emergency department visits for respiratory illnesses were also found for certain regions, age groups, and racial/ethnic groups, although these effects were not significant statewide (Knowlton et al. 2009). Overall mortality also increased, with each 10°F increase in apparent temperature are associated with an estimated 9% increase in daily mortality (Ostro et al. 2009). Heat-related emergency department visits increased between 2005 and 2014 in LA County, though not steadily (California Office of Statewide Health Planning and Development 2017). Additionally, LA County may be one of the few locations in the United States that experiences heat-related mortality in the winter, possibly because winter temperatures have been known to exceed 90°F and can be unpredictable (Kalkstein et al. 2018).
Elements of the built environment contribute to heat-related health impacts. Specifically, high concentrations of impervious surfaces such as pavements and roofs and minimal tree canopy and green space create “urban heat islands” in heavily urbanized areas. Urban heat islands in non-tropical regions experience temperatures up to 5.4°F hotter than surrounding rural areas (Taha 2015a), an effect that increases in magnitude during heat waves (Zhao et al. 2018). The LA region experiences the largest urban heat island effect in the state (State of California n.d.). The urban
T

Fourth Climate Change Assessment Los Angeles Region | 22
CALIFORNIA’S FOURTH
CLIMATE CHANGE ASSESSMENT
CALIFORNIA’S FOURTH
CLIMATE CHANGE ASSESSMENT
heat island effect means that populations in affected areas suffer from higher temperatures due simply to the built environment.
Extreme heat is also significant because of how it contributes to other climate impacts: extreme heat increases concentrations of ground-level ozone, contributing to poor air quality. Extreme heat and drought decrease soil moisture and increase plant mortality, factors that contribute to larger wildfires and poorer air quality. Plant die-offs also reduce available shade and evaporative cooling, raising surrounding temperatures and reducing the thermal comfort of pedestrians.
While all residents are affected to some extent by extreme heat, certain populations are more vulnerable to severe impacts. These include (a) low-income communities and communities of color, which often experience a greater urban heat island effect due to a lack of trees and other vegetation, and which have lower access to air conditioning (Reid et al. 2009a); (b) older adults, young children, people with chronic medical conditions, and people taking certain medications, who are physiologically vulnerable to the effects of heat (Kenny et al. 2010; Reid et al. 2009a; Tsuzuki-Hayakawa, Tochihara, and Ohnaka 1995); and (c) outdoor workers (Bethel and Harger 2014), people experiencing homelessness (Harlan et al. 2013), and others who spend a significant amount of time outside and are more exposed to extreme heat.
Unlike cities that have consistently experienced extreme heat in the past, the housing stock in LA is not designed for extreme heat. Approximately 51% of households in the LA-Long Beach area have central air conditioning (American Housing Survey 2015). While California code requires that landlords provide adequate heating facilities in homes, air conditioning is not a requirement. Moreover, the LA region’s affordable housing crisis may prevent many renters from being able to move to air-conditioned homes where they would be less impacted by heat. Access to air-conditioned spaces may be additionally limited by factors such as mobility, vehicle ownership, perceptions of neighborhood safety, and distance to transit. These factors can prevent vulnerable populations from implementing adaptive and health protective strategies, such as getting to cooling centers or other air-conditioned locations.
Air Quality
The LA-Long Beach region already has some of the worst air quality in the country, ranking as the most polluted region in the United States for ozone and among the top 10 most polluted cities for year-round and short-term particle pollution (American Lung Association 2017). While air quality in the region has improved in recent decades, climate change threatens to reverse this trend. Higher future temperatures are likely to increase the production of ground-level ozone, a respiratory irritant that is a component of smog. Ground-level ozone is associated with various negative health outcomes, including reduced lung function, pneumonia, asthma, cardiovascular-related morbidity, and premature death (US EPA 2013). Simulations for the city of Upland, California project that median ozone concentration will increase by 27 ppb between 2011-2020 and 2091-2100 in the A2 climate scenario (Abdullah Mahmud et al. 2008). Ozone pollution may increase the most in places that already experience high levels (Jacobson 2008), suggesting that the LA region may see the greatest increases in ozone pollution in the country. Such increases would be expected to lead to corresponding increases in morbidity and mortality (Bell et al. 2004, 2007; Chang, Zhou, and Fuentes 2010; Ebi and McGregor 2008; Post et al. 2012).

Fourth Climate Change Assessment Los Angeles Region | 23
CALIFORNIA’S FOURTH
CLIMATE CHANGE ASSESSMENT
CALIFORNIA’S FOURTH
CLIMATE CHANGE ASSESSMENT
Many of the same populations that are vulnerable to the effects of extreme heat are also vulnerable to the effects of poor air quality. These include the elderly; young children; people with existing respiratory and cardiovascular conditions such as asthma, chronic obstructive pulmonary disease, and heart disease; and low-income populations and communities of color. These populations are more likely to live in areas with worse air pollution, such as near freeways or industrial facilities, and in neighborhoods without the air filtering benefits of trees, and are also more likely to be exposed to indoor air pollutants from poor housing quality (Bell, Zanobetti, and Dominici 2014; Sacks et al. 2011).
Wildfires
The area burned by wildfires in southern California is projected to increase by the middle of the century (p. 18). Wildfires have various negative consequences for public health (Finlay et al. 2012), including, but not limited to: deaths and injuries; post-traumatic stress and depression due to deaths, injuries, loss of property, displacement, or other trauma (Marshall et al. 2007); and respiratory impacts due to poor air quality. Smoke from wildfires contains particulates and chemicals that are harmful to respiratory health. Consequently, wildfires are associated with increases in hospital admissions for asthma, acute bronchitis, chronic obstructive pulmonary disease, and pneumonia (Delfino et al. 2009; McDermott et al. 2005). An analysis of 11 wildfires in the Western United States between 2002 and 2013 found that air quality in urban areas 50-100 miles away from the fires was frequently 5-15 times worse than usual (Kenward et al. 2013). As with other climate impacts, wildfires often disproportionately impact vulnerable populations. For instance, low-income populations have fewer resources to recover from wildfires (Mazur et al. 2010) and are already more likely to suffer from respiratory illnesses that increase their vulnerability to poor air quality (Wolstein et al. 2010).
Infectious Diseases
VECTOR-BORNE DISEASES
Climate influences the population size, geographic distribution, and reproduction of vectors (rodents, mosquitoes, ticks, fleas, and others) that transmit diseases to humans (Gubler et al. 2001). The many factors that contribute to the incidence of vector-borne diseases—such as land use patterns and human behavior (Gubler et al. 2001)—present challenges in projecting their spread. However, current patterns provide some clues. For instance, reported cases of West Nile Virus increase during warm weather (Hahn et al. 2015). While incidence of West Nile Virus human cases and fatalities fluctuate greatly from year to year, 2017 showed the greatest number of human West Nile Virus deaths ever recorded in LACounty (LA County Department of Public Health 2017). Models for North America project increases in West Nile Virus infections in humans, caused by increasing temperatures and declines in rainfall (Harrigan et al. 2014).
In recent years, invasive Aedes mosquitoes (Aedes albopictus and to a lesser extent Aedes aegyptii) have appeared in LA County (California Department of Public Health 2018). These mosquitoes are known vectors for dengue fever, Zika virus, and chikungunya virus. While there have as yet been no known locally acquired human cases of these diseases, there remains the possibility of local transmission occurring as travelers return from affected regions.

Fourth Climate Change Assessment Los Angeles Region | 24
CALIFORNIA’S FOURTH
CLIMATE CHANGE ASSESSMENT
CALIFORNIA’S FOURTH
CLIMATE CHANGE ASSESSMENT
VALLEY FEVER
Valley Fever is a noncontagious disease arising from a fungus endemic in soils in the Southwest, including parts of southern California. People are most likely to acquire Valley Fever in areas where the fungus spores become airborne and are inhaled during windy, dusty conditions (Schneider et al. 1997). Human cases of Valley Fever in LA County have increased steadily since 2009, with a 37% increase between 2015 and 2016 (Schwartz & Terashita 2017). Although the reasons for this increase are unclear, drought conditions exacerbated by climate change may contribute to higher dust levels, and consequently to increased risk for Valley Fever.
Floods and Mudslides
The projected increase in precipitation extremes, alone and in combination with the projected increase in wildfires, creates increased potential for floods, mudslides, and debris flows. Additionally, sea level rise increases the potential for flooding in coastal areas. Debris flows, such as those seen in Santa Barbara County in early 2018 (Livingston et al. 2018), can result from heavy rains preceded by wildfires that strip the land of vegetation. Flooding and mudslides have direct public health impacts such as deaths, injuries, and other trauma, and indirect impacts resulting from factors such as water contamination, damage to infrastructure, and mold contamination in homes following the subsidence of floodwaters (Riggs et al. 2008).
Mental Health
Climate change may impact mental health through various pathways, including but by no means limited to (a) increases in the frequency and severity of extreme weather events; (b) increasing economic instability; and (c) uncertainty about the future of the planet. Extreme weather events such as fires and floods can have acute mental health impacts. Clear links exist between extreme weather events and anxiety and depression (Kar and Bastia 2006), post-traumatic stress disorder (Neria, Nandi, and Galea 2008; Kar and Bastia 2006), and suicide (Krug et al. 1999).
Climate change can also precipitate chronic impacts. Climate change may negatively impact livelihoods, leading to mental health impacts such as chronic stress, depression, and suicide. Recent research linked high temperatures and associated reduced crop yields in India with nearly 60,000 suicides over a 30-year period (Carleton 2017). Links between drought and farmers’ suicides have also been established elsewhere (Hanigan et al. 2012).
Additionally, people who are concerned about climate change may experience anxiety about the future of the planet. Some researchers and news media have termed this “ecoanxiety” (Albrecht 2011). Ecoanxiety can involve feelings of helplessness, as well as guilt over one’s own contribution to greenhouse gas emissions (Moser 2013).
Disproportionately Impacted Populations and Increasing Disparities
Climate change disproportionately affects those with existing disadvantages. Low-income communities and communities of color often live in areas with conditions that expose them to more severe hazards, such as higher temperatures and worse air quality. These communities also have fewer financial resources to adapt to these hazards. For instance, low-income populations are already disproportionately burdened by energy bills (Drehobl & Ross 2016) and may reduce air conditioning usage out of concerns about cost. People with chronic medical conditions are often more physiologically susceptible to negative health impacts from extreme heat and poor air quality, and those with
Fourth Climate Change Assessment Los Angeles Region | 25
CALIFORNIA’S FOURTH
CLIMATE CHANGE ASSESSMENT
CALIFORNIA’S FOURTH
CLIMATE CHANGE ASSESSMENT
mobility issues are particularly at risk. Many of the above risk factors are often present in older adults, who are more likely to have a limited income, chronic health conditions, and mobility limitations, and are more likely to experience social isolation. Also at heightened risk are people experiencing homelessness, who are most exposed to the hazards of extreme weather and experience barriers to seeking assistance. Likewise, undocumented immigrants and migrant workers often face poverty, linguistic isolation, political disenfranchisement, and fears of being apprehended by immigration officials when accessing government services, which present significant barriers to seeking resources to adapt to extreme weather and other climate impacts.
These disproportionate health impacts act on the social determinants of health (such as income) to further exacerbate existing disparities. For instance, increasingly poor air quality increases the number of impacted days—days in which people must restrict activity or miss work or school—exacerbating gaps in income and educational achievement. Climate effects can negatively impact agriculture, contributing to higher food prices (Chung et al. 2014) and further reducing access to affordable, healthy food options. These are only a few examples of how climate impacts further increase disparities. The Public Health Institute, a prominent California nonprofit focused on health and wellness, notes that “the disproportionate impacts of climate change on individuals with pre-existing conditions and on socially disadvantaged groups threaten to greatly exacerbate existing health and social inequities, globally and within the U.S.” (Rudolph et al. 2015).
Recommendations
It is critical to implement strategies that protect the public from the health impacts of climate change by reducing greenhouse gas emissions and building resilience to climate impacts. Public health professionals are in a uniquely important position to deliver messages about climate change and strategies for addressing it, as health professionals remain highly trusted messengers (Maibach et al. 2015), and research shows that framing climate change in the context of health is the most effective way to elicit support for climate policies (Myers et al. 2012). Local health departments in particular engage directly with impacted communities and are on the front lines of protecting the public from the health impacts of climate change. With additional resources, local health departments can undertake activities such as expanding capacity to model and forecast health impacts and plan for those impacts;,tracking data on climate-related health indicators, improving preparedness and response plans for climate impacts, and training healthcare professionals on best practices for how to teach patients to protect themselves from climate impacts.
As the Lancet Commission on Health and Climate Change notes, climate change presents a “potentially catastrophic risk to human health” but “tackling climate change could be the greatest global health opportunity of the 21st century” (Watts et al. 2015). This is because the actions needed to counter climate impacts—those the Lancet Commission calls “no-regret” options—are exactly those that improve health outcomes and reduce inequities. For instance, using active and public transportation reduces greenhouse gas emissions and promotes public health through increasing physical activity and decreasing air pollution. Improving energy efficiency and transitioning to clean energy reduces air pollution. Changing patterns of food consumption—for example, eating less meat—reduces emissions associated with industrial livestock operations and reduces the risk of cardiovascular disease and other poor health outcomes. Urban heat island reduction—urban greening and transitioning to cool surfaces such as cool roofs and cool pavements—reduces emissions associated with air conditioning use and cools neighborhoods. As outlined in this section, climate change presents myriad threats and challenges. But it also presents opportunities
Fourth Climate Change Assessment Los Angeles Region | 26
CALIFORNIA’S FOURTH
CLIMATE CHANGE ASSESSMENT
CALIFORNIA’S FOURTH
CLIMATE CHANGE ASSESSMENT
to implement “no-regret” options such as those listed here, that help to create healthier, more resilient, and more equitable communities.
EMERGENCY MANAGEMENT
LA County and the surrounding areas of southern California have already seen an increase in the frequency and intensity of emergencies exacerbated by climate change. The challenges brought on by climate change result in hardship for families, businesses, and local governments and demand an evolving response by government agencies tasked with protecting life and property. The research of the First, Second, and Third Assessments has already helped shape the County’s preparedness for climate impacts to infrastructure, public health, and land use decisions, and ongoing research is essential for informing emergency response. As the municipal government for the more than one million residents of the unincorporated County area and as the provider of public safety services and coordinator of emergency response and recovery for nearly nine million more, the County of LA faces an acute urgency to adequately prepare and respond to the new normal of climate-related and climate-exacerbated emergencies.
Climate change will continue to compound the impact of future disasters in scope and severity. The County plays a planning, coordination, operational, training, and public education role in responding to emergencies. As defined by California State Code, the County of LA Office of Emergency Management (OEM) is the lead agency for the “Operational Area”, which includes all of the independent cities and Special Districts in LA County. As the Operation Area Coordinator, LA employs a set of policies, procedures and practices to ensure an effective response to the most prevalent local emergencies driven by climate change – namely wildfires, mudslides in burn areas, drought, heat waves, vector-borne public health emergencies, sea level rise, and urban flooding. The LA County OEM works with County departments, cities, and partner agencies to increase the capability of the region to mitigate, prepare for, respond to, and recover from all hazards impacting the County, including those exacerbated by climate change.
OEM has already seen the direct impact of climate change in its operations. Increased staff hours have been spent on the consequences of climate change, as seen with the most recent drought, in which local water supplies were severely impacted. Specifically, in 2014, a northern LA County community in Bouquet Canyon faced a complete depletion of the local well field, requiring County response. The repercussions of climate change have triggered longer Emergency Operations Center activations and fire recovery efforts, including community outreach and Local Assistance Centers, as well as increased engagement with community partners and governmental agencies. Fire recovery efforts include post-fire hazard mitigation and cleanup. In addition, there has been a significant increase in pre-event planning and response and recovery actions for winter storms to mitigate and avoid the consequences of mud and debris flows on burn scars. OEM also monitors the response to the increase in frequency and severity of wildfires due to the drier conditions of hillside vegetation, and a considerable amount of time and effort is spent addressing the impacts of these events on vulnerable populations, such as children, the homeless, non-English speakers, and people with access and functional needs.
A yearly Threats and Hazards Identification and Risk Assessment is conducted to map out risks to the whole community, which includes individuals and families and those with disabilities and others with access and functional needs, businesses, faith-based and community organizations, nonprofit groups, schools and academia, media outlets, and all levels of government. This assessment includes climate change considerations regarding community

Fourth Climate Change Assessment Los Angeles Region | 27
CALIFORNIA’S FOURTH
CLIMATE CHANGE ASSESSMENT
CALIFORNIA’S FOURTH
CLIMATE CHANGE ASSESSMENT
vulnerabilities and the necessary adjustments to current planning and response efforts due to climate change. For example, due to more extreme drought conditions and flooding, there may be a change to the availability of various foodstuffs or water when a disaster strikes. Planning efforts account for these potentialities in the event of a mass care incident where a disaster may impact distribution plans or the usual way of getting resources to a large number of people.
OEM develops specific plans often based on models for each of the areas within the County of LA impacted by specific disasters such as the coastal communities along the Pacific Ocean. Areas such as Marina Del Rey, Venice, Malibu, Redondo, San Pedro, and Wilmington are threatened by potential sea level rise due to climate change, and mitigation strategies are addressed and outlined within these planning documents. Emergency management will assign a greater focus on mitigation strategies and increase planning and response efforts to address these climate- related inevitabilities.
OEM also collaborates with partners on planning efforts and mitigation actions to promote community resiliency. For example, the Chief Executive Office’s Office of Homeless Initiative, in partnership with OEM, designated County departments, and other agencies, have implemented an Augmented Winter Shelter Program (AWSP) as of 2015 to address increased rainfall and/or cold weather. The AWSP provides increased temporary shelter operations for individuals experiencing homelessness when adverse weather conditions meet an established threshold. Similarly, the Department of Public Health, in partnership with Workforce Development, Aging and Community Services, Parks and Recreation, and Internal Services, has established cooling centers that are open to the public during severe heat waves.
The pervasive nature of climate change impacts manifests in all types of County departments outside of core emergency response departments. The Department of Animal Care and Control has observed impacts of the increased incidence and intensity of wildfires on its emergency operations. The 2016 Sand Fire resulted in the largest animal evacuation and sheltering operation in the Department’s history. Eight hundred domestic and barnyard animals were housed across five sheltering sites in partnership with three of the Department’s thirteen mutual aid partners. Even prior to the Sand Fire, the Department made operational, community outreach, partnership, and leadership modifications to incorporate climate change risks. In an analysis of its preparedness, the Department found that to address climate emergencies, it will likely need to address the gap in the human resources needed to staff incidents with greater intensity to adequately maintain its existing operations.
The County also recognizes the unequal distribution of impact during emergencies. As described in other parts of this chapter, the social and physical impacts of climate change are not distributed equally. As the County develops a Countywide Sustainability Plan throughout 2018 and into 2019, it will further assess and plan for climate-related emergencies with a focus on equity. In January 2018, the County Chief Sustainability Office responded to a request from the Board of Supervisors to outline how the framework of the forthcoming Countywide Sustainability Plan incorporates climate impacts and extreme weather. All of the County departments responsible for emergency management are engaged in the process of developing the Countywide Sustainability Plan, which will articulate regional, long-term goals related to climate mitigation, adaptation, and resilience in a way that prioritizes actions to prevent climate-related emergencies.

Fourth Climate Change Assessment Los Angeles Region | 28
CALIFORNIA’S FOURTH
CLIMATE CHANGE ASSESSMENT
CALIFORNIA’S FOURTH
CLIMATE CHANGE ASSESSMENT
he City of Long Beach began developing a Climate Action and Adaptation Plan (CAAP) in 2017 and anticipates that the CAAP will be completed in 2019. The CAAP is a coordinated, long-range planning effort to address climate change at a local level and promote a healthy and prosperous community. Through the CAAP, Long Beach
will be able to meet regulations regarding greenhouse gas emissions, sea level rise, and the California Environmental Quality Act (CEQA). Other objectives for the CAAP include engaging a wide cross-section of the public in development of the plan with a focus on nontraditional outreach; building a shared commitment to greenhouse gas emissions reductions and adaptation measures across City departments, residents, scientific and educational institutions, and the business community; providing a publicly accessible and engaging method of monitoring and displaying progress of meeting CAAP goals; and improving economic opportunity and quality of life for residents.
The CAAP contains two related components: climate action and climate adaptation. Climate action (also known as climate change mitigation) refers to reducing impacts on the climate system by reducing future carbon emissions. Climate adaptation (also known as climate change resilience) refers to reducing the impacts of climate change by adjusting behaviors, systems, and/or infrastructure. The climate action component of the plan includes a greenhouse gas emissions inventory, forecast of projected emissions, emissions reduction targets, analysis of existing reduction efforts, development and implementation of strategies to reduce emissions, and regular monitoring of the plan. The emissions-generating sectors included in the plan are energy, transportation, wastewater, water, and solid waste. The climate adaptation component of the plan includes identification of climate change hazards, an inventory of City assets and operations, a vulnerability and risk assessment of identified assets and operations, development and implementation of measures to adapt to climate change hazards, and regular monitoring of the plan. The climate change hazards that have the potential to negatively impact Long Beach are sea level rise, extreme heat, precipitation, drought, and poor air quality. Long Beach is already seeing negative impacts of climate change and the CAAP will equip the City to effectively deal with the challenges of a changing future.
The robust and inclusive community engagement process will result in an innovative and actionable plan that reflects the Long Beach community. The process includes working groups with scientific experts, business representatives, and community stakeholders, in addition to open houses, online engagement, and other events for outreach to the general public. Outreach efforts focus on engaging with participants who are traditionally underrepresented in governmental decision making, and bringing together community organizations working towards environmental justice, environmental advocacy, and increasing youth participation. Long Beach is enthusiastic about the many benefits that will result from the CAAP.
CASE STUDY | LONG BEACH CLIMATE ACTION & ADAPTATION PLAN Fern Nueno - City of Long Beach
T

Fourth Climate Change Assessment Los Angeles Region | 29
CALIFORNIA’S FOURTH
CLIMATE CHANGE ASSESSMENT
CALIFORNIA’S FOURTH
CLIMATE CHANGE ASSESSMENT
ENVIRONMENTAL JUSTICE
This section provides a framework for understanding and assessing the unequal and disproportionate impacts of climate change in low-income communities of color in the region. The discussion below draws from the State policy framework of cumulative impacts to assess climate impacts, as well as a benefits and burdens framework to prioritize state actions to address the impacts of climate change in our most vulnerable communities. In earlier sections of this report, research shows that the effects of climate change – as well as approaches for mitigation and resiliency – disproportionately burden and/or diminish the impact of climate change on low-income communities of color leaving these communities vulnerable (English et al. 2016). A cumulative analysis framework considers environmental, social, and economic factors that can play a role in the unequal impacts of climate change and illustrates the limits of individual and group resilience, as well as the uneven ability at the community level to respond and adapt to impacts from climate change. More on the uneven ecological, social, and political impacts climate change is projected to have on California’s vulnerable communities may be found in a companion Fourth Assessment piece (Climate Justice Summary Report 2018).
The concept of cumulative impacts is rooted in the history of disproportionately impacted communities organizing to reframe environmental conditions as everyday lived experiences. The environmental justice movement emerged in the 1980s, with its roots in the civil rights and indigenous peoples movements, and drew attention to the disparate placement of undesirable land uses (as well as unequal policy protections) in native, poor communities and communities of color.1 Efforts by impacted communities to address regulatory inaction and unequal enforcement in communities with multiple polluting sources finally led the Environmental Protection Agency to recognize environmental justice in 1994 and set the federal standard for “the fair treatment and meaningful involvement of all people regardless of race, color, national origin, or income with respect to the development, implementation, and enforcement of environmental laws, regulations, and policies.”
The knowledge and leadership by environmental justice organizations have since forged environmental justice policy at the state, regional, and local levels that sets the basis to address climate change impacts that disproportionately affect low-income communities of color. The environmental justice frameworks presented here make the necessary linkages among climate emissions, co-pollutants, and factors contributing to cumulative impacts and sets forth pathways for equitable policy development and implementation.
Cumulative Impacts Analysis to Guide Identification of Climate Vulnerable Communities
Cal/EPA’s Interagency Working Group on Environmental Justice adopted a framework for identifying cumulatively impacted communities, an integral step to alleviating environmental injustice. The cumulative impacts approach has been operationalized by the CalEnviroscreen method to identify “environmental justice” neighborhoods characterized by multiple sources of environmental pollution and where the residential population is often vulnerable to the effects of this pollution through social vulnerabilities that can include factors such as poverty. The framework defines cumulative impact as “exposures, public health or environmental effects from the combined
1 More information about how already-occurring and projected climate change impacts disproportionately affect California’s Tribal and Indigenous
Communities – both in LA and across the State – may be found in the Fourth Assessment “Tribal and Indigenous Communities Summary Report.”

Fourth Climate Change Assessment Los Angeles Region | 30
CALIFORNIA’S FOURTH
CLIMATE CHANGE ASSESSMENT
CALIFORNIA’S FOURTH
CLIMATE CHANGE ASSESSMENT
emissions and discharges in a geographic area, including environmental pollution from all sources, whether single or multimedia, routinely, accidentally, or otherwise released. Impacts will take into account sensitive populations and socioeconomic factors, where applicable and to the extent data are available.” (CalEPA Environmental Justice Update 2016) CalEnviroscreen aggregates these multiple, cumulative, and synergistic vulnerabilities to locate the most burdened communities statewide, and can thus be a valuable tool to help prioritize neighborhoods that may be most vulnerable to climate impacts. Through CalEnviroscreen v3.0 mapping, it is clear that environmental justice communities are exposed to a disproportionate share of environmental hazards in their neighborhoods. Worsened health outcomes related to environmental exposures can be compounded by various social determinants, including race, low socioeconomic status, linguistic isolation, and lower educational attainment. Screening approaches, such as CalEnviroScreen and the Environmental Justice Screening Method (Figure 11), identify several areas in the greater
FIGURE 11
Distribution of cumulative impact and vulnerability screening scores using the Environmental Justice Screening Method (Sadd et al. 2011) that includes a climate change impacts score. The impact is more concentrated in urban portions of the region. (Map from English, et.al, 2013: https://escholarship.org/uc/item/8h669570)

Fourth Climate Change Assessment Los Angeles Region | 31
CALIFORNIA’S FOURTH
CLIMATE CHANGE ASSESSMENT
CALIFORNIA’S FOURTH
CLIMATE CHANGE ASSESSMENT
LA region as among the most vulnerable and impacted neighborhoods in California. These include Wilmington and Carson near the Port of LA, Pacoima and Sun Valley in the San Fernando Valley, communities surrounding downtown LA, such as East and South LA and Boyle Heights, and the inland valley communities of El Monte, Pomona, and Ontario.
Overlaid on this riskscape of pollution exposure and environmental injustice are the uneven impacts from climate change, often affecting these same communities. Environmental justice communities live closer to large greenhouse gas polluting facilities such as power plants and refineries (Cushing et al. 2016). Climate mitigation efforts typically target these greenhouse gases such as carbon dioxide and methane. However, these efforts typically don’t address co-pollution from these facilities, such as particulate matter that can have significant adverse effects on health (Cushing et al. 2016). Preliminary analysis of California’s cap-and-trade program shows that greenhouse gas emitting facilities tend to be located in communities with higher proportions of poor and residents of color (Cushing et al. 2016). While greenhouse gas emissions are not toxic, the copollutants that accompany greenhouse gas emissions, such as NOx, have significant negative health consequences and proximity to these facilities results in poorer health outcomes. Research by Shonkoff and others (2012) identifies a “climate gap” by documenting that negative impacts of climate change are concentrated in poor communities of color not only in California, but nationwide. Both biological and social factors can be used to predict vulnerability and death during heat waves (Reid et al. 2009a). Low-income communities and communities of color often experience a greater urban heat island effect due to a lack of trees and other vegetation and higher ratios of impervious surfaces, such as pavement and buildings, to tree canopy (Jesdale et al. 2013). Reduced access to air conditioning (Reid et al. 2009b) and disparity in heat-related mortality between blacks and whites may be explained by the prevalence of central AC in homes (Reid et al. 2009a). Sensitive populations such as the very young, elderly, and poor residents are most vulnerable to heat stress. Low income households may be less likely to have air conditioning and may also be less willing to use it to save electricity (English et al. 2007). While landlords are required to provide water and heat, they are not required to provide air conditioning or cooling systems. Residents seeking relief at local cooling centers may be limited by accessible transportation. Screening methods can incorporate a climate impact/vulnerability analytical framework to provide initial identification of areas that deserve further study to identify disparity in climate-related impacts, as well as inform decisions to concentrate resources to alleviate climate impacts most efficiently. The Environmental Justice Screening Method includes some climate vulnerability metrics, and similar variables could be incorporated into a version of CalEnviroscreen.

Fourth Climate Change Assessment Los Angeles Region | 32
CALIFORNIA’S FOURTH
CLIMATE CHANGE ASSESSMENT
CALIFORNIA’S FOURTH
CLIMATE CHANGE ASSESSMENT
Benefits and Burdens
In addition to the Cumulative Impacts framework adopted into policy, a legal approach also frames actions for addressing environmental justice. As defined by California law, environmental justice requires “fair treatment of people of all races, cultures, and incomes with respect to the development, adoption, implementation, and enforcement of environmental laws, regulations, and policies” (Gov. Code, § 65040.12, subd. (e)). Fair treatment has been interpreted to mean that everyone should have access to the benefits of healthy environments and the burdens of pollution should not be borne disproportionately by sensitive populations or marginalized communities (State of California, Department of Justice 2012).
The benefits and burdens analysis studies who bears the burdens of environmental pollution and who is getting the benefit of a cleaner environment. Historically, communities of color and low-income communities have borne a disproportionate environmental burden, as detailed above. Wealthier communities, on the other hand, have more access to and live in healthier communities, and in turn benefit from a cleaner environment. In addition, polluting industries have benefited from fewer environmental regulations that decrease their operating costs while the health and environmental costs of the pollution are passed on to the public and environment.
When applied to climate change impacts and opportunities, the benefits and burdens framework protects sensitive and marginalized communities from higher rates of exposure to greenhouse gases and other harmful pollutants, and ensures they have access to the benefits and opportunities of climate policy. For example, in developing renewable energy projects, a benefits and burdens analysis would ensure that marginalized and sensitive communities did not bear the burden of fossil fuel operations while renewable energy deployment was accessible only to those that could afford it. This analysis would also require marginalized and sensitive communities equal access to renewable energy as other communities.
Community-Engagement and Participation in Climate-Based Decision-Making
Assessing cumulative impacts and evaluating benefits and burdens requires the inclusion of the knowledge and involvement of those bearing the burden of climate change. Building on research showing the positive role of community-engaged research, “citizen scientists” improve research outcomes (Balazs and Morello-Frosch 2013 Minkler and Wallerstein 2003; Corburn 2005) and research on the climate gap suggests that communities most impacted by changing climates can participate in identifying necessary protections in their neighborhoods (Shamasunder et al. 2018; Morello-Frosch et al. 2009; Corburn 2009). Indeed, the scientific enterprise has been improved by citizen science and community-based participatory research efforts that include lay and community knowledge alongside scientific evidence in crafting regulation.

Fourth Climate Change Assessment Los Angeles Region | 33
CALIFORNIA’S FOURTH
CLIMATE CHANGE ASSESSMENT
CALIFORNIA’S FOURTH
CLIMATE CHANGE ASSESSMENT
Recommendations
State actions to address climate change must simultaneously address environmental injustices at state, regional, and local levels. The following recommendations address climate change as well as the factors contributing to the cumulative impacts of climate change in disadvantaged communities.
• Pursue stronger regulatory approaches that address greenhouse gas emissions as well as copollutants. State pol-icies and approaches to address the “climate gap” have yet to address copollutants in environmentally disadvan-taged communities. (Cushing et al. 2016). Environmental justice communities already burdened by air pollution, for example, live closer to large greenhouse gas polluting facilities such as power plants and refineries. Neighbor-hoods with GHG emitting facilities within 2.5 miles have a 22% higher proportion of residents of color and 21 percent higher proportion of residents living in poverty than places that are not within 2.5 miles of such a facility (Cushing et al. 2016).
• Place-based analysis and action at a census-tract scale are necessary to assess and prioritize environmental justice conditions and set goals that address localized impacts. Focusing only on regional targets and metrics misses the local-level impacts, such as in the case of the cap-and-trade program intended to reduce greenhouse gases regionally but which increased pollution and emissions in environmental justice communities (Cushing et al. 2016). Requiring emissions reductions among emitting facilities located in disadvantaged communities would address climate disparities and enhance environmental equity and health.
• Expand the scope and accessibility of research to measure and assess emissions and reductions. More research is necessary to understand the regional and localized impacts of climate change relative to cumulative impacts, as well as measure gains in emissions reductions and cobenefits in health and equity. Cushing et al. (2016) point specifically to the following:
o Build better linkages between state facility-level databases on GHG and copollutant emissions.
o Publicly release data on facility- and company-specific allowance allocations.
o Track and make data available on facility- and company-specific allowance trading patterns.
• Recognize and develop mitigation and adaptation approaches that simultaneously address climate emissions, copollutants, and factors contributing to cumulative impacts facing the most vulnerable. The benefits-and-bur-dens framework establishes the framework for equity; approaches such as Just Transition (see Cha 2017) ensure that community-based organizations and labor unions are involved in defining goals and strategies. Steps include ensuring dedicated funding streams and a strong public sector role to prioritize equity in climate policy devel-opment and implementation (Cha 2017). Increasing the levels of Greenhouse Gas Reduction Funds to target disadvantaged communities identified by CalEnviro Screen has the potential to address cumulative impacts and advance equitable climate approaches. Currently, SB 535 requires a minimum of 25% of benefit disadvantaged communities and 10% funding projects located in these communities. More is needed to address the needs of the most vulnerable.

Fourth Climate Change Assessment Los Angeles Region | 34
CALIFORNIA’S FOURTH
CLIMATE CHANGE ASSESSMENT
CALIFORNIA’S FOURTH
CLIMATE CHANGE ASSESSMENT
he City of LA is taking action to reduce the impact of future climate change, while also preparing for and adapting to the already changing environment. The Office of Mayor Eric Garcetti led stakeholder engagement processes to develop two key documents that address climate resilience: the Sustainable City pLAn and Resilient
Los Angeles. The Sustainable City pLAn was released in April 2015 and set the course for a cleaner environment and a stronger economy, with a commitment to equity as its foundation. The pLAn is made up of short-term targets (by 2017) and long-term targets (by 2025 and 2035) across 14 categories that will advance environment, economy, and equity.
More recently, Angelenos came together to develop Resilient Los Angeles, a strategy released in March 2018 that leverages the city’s strengths and advances new partnerships to address current and future challenges. This strategy focuses on five primary themes: Leadership and Engagement; Disaster Preparedness and Recovery; Economic Security; Climate Adaptation; and Infrastructure Modernization. Some of the key climate resilience targets include:
• Applying resilience criteria for projects that prioritize investments in capital planning and critical infrastructure;
• Developing and implementing urban heat island reduction plans and demonstration projects in the most vulnerable neighborhoods;
• Investing in green infrastructure and stormwater retention to increase the number of projects that capture water for reuse, improve water quality, and reduce flooding risk; and
• Modernizing the power grid to expand renewable energy to 65% of the power source by 2036 while deepening storage capacity and broadening emergency backup systems.
The City of LA is implementing a number of climate resilience initiatives. For example, the City is working to mitigate the urban heat island effect through a residential cool roof ordinance, providing a cool roof rebate, and piloting cool pavement projects. LA has also developed comprehensive solar incentive programs for residents and businesses and has the most installed solar power of any city in America, according to a report by the Environment California Research & Policy Center. The City has begun to pilot solar and battery storage sources at critical facilities, such as fire stations, so that, in the case of a grid outage, the battery and solar system will be able to keep critical equipment at the facility operational.
One of Resilient Los Angeles’ 15 goals is to integrate resilience principles into government to prioritize the most vulnerable people, places, and systems. As one component of this goal, the City of LA will incorporate resilience as a guiding principle into the General Plan. The city is undertaking a comprehensive update to the General Plan. The General Plan update process will consider opportunities to incorporate climate adaptation, hazard mitigation and recovery, as well as efforts to increase equity and to leverage long-range capital planning for infrastructure investment. Combined, these efforts will address immediate needs while also developing a vision that ensures the city is resilient for future generations.
CASE STUDY | CITY OF LOS ANGELES CLIMATE RESILIENCE PLANNING Sabrina Bornstein - City of LA
T

Fourth Climate Change Assessment Los Angeles Region | 35
CALIFORNIA’S FOURTH
CLIMATE CHANGE ASSESSMENT
CALIFORNIA’S FOURTH
CLIMATE CHANGE ASSESSMENT
Economic Systems
ENERGY SYSTEM
Introduction
Energy system planning decisions must be made within the context of multiple sources of uncertainty, including economic growth, technological change, and global resource markets. Recently, the nature and extent of climate variability has emerged as among the most significant sources of uncertainty for regional energy system planners. This is because climate variables drive many heterogenous aspects of the supply and demand for energy services which can also result in cascading impacts to many other teleconnected sectors (Hart and Moser 2018). Conventional energy systems analysis and planning frameworks assume climate variables to be stationary. However, as the information in the “Regional Climate Science” section indicates, this assumption is no longer valid. Nonstationarity in southern California’s regional climate dynamics is likely to influence the operations of the region’s energy system in four fundamental ways:
1. Changes in the availability and/or accessibility of its primary energy resource endowments;
2. Changes in the operational modes and/or efficiency of its energy generation assets;
3. Changes in the capacity and/or reliability of its energy transmission and distribution infrastructure;
4. Changes in the timing and/or volume of its consumers’ energy demand.
Resource Endowments
Primary energy resource endowments can refer to fossil fuels in place (stocks) or the renewability potential of renewable energy sources (flows). Fossil fuel stocks can be readily transported through space and stored over time, thus their availability is largely determined by the dynamics of global energy commodity markets. Alternatively, renewable energy flows cannot be as readily transferred across either space or time and their occurrence can be somewhat unpredictable. As a result, their immediate availability is determined by local climate conditions and other related geographic constraints. This fundamental difference between the two primary energy sources implies that flow-based renewable energy technologies must be supported by energy storage systems in various ways if they are to achieve performance parity with existing fossil fuel stock-based systems.
Southern California’s energy system draws upon a diverse portfolio of primary energy resources as part of its supply side operations. The majority of the fossil energy resources consumed within southern California are sourced from a combination of out-of-state domestic and international producers. Alternatively, the majority of the region’s renewable energy resource consumption consists of flows which have been captured within the state’s local geographic boundaries.
Differences in the locality of procurement of renewable- versus fossil-based primary energy resources are caused by a number of factors. Renewable energy resources are predominately used for the generation of electricity which is ultimately delivered to end use consumers. As such the locality of the region’s renewable energy resource procurement is primarily determined by the cost and technical difficulties associated with transporting electricity

Fourth Climate Change Assessment Los Angeles Region | 36
CALIFORNIA’S FOURTH
CLIMATE CHANGE ASSESSMENT
CALIFORNIA’S FOURTH
CLIMATE CHANGE ASSESSMENT
over large distances. By comparison, fossil fuels-based primary energy sources are often delivered directly to end use consumers. Thus, the locality of the region’s fossil fuel procurement is more significantly impacted by regulatory barriers which restrict regional production of local offshore oil and natural gas reserves for environmental and other reasons.
Table 1 summarizes the distribution of primary energy resources used to supply the average consumer serviced by the four largest electrical utilities operating within southern California as of 2016.
Anticipated future changes in regional climate variables (“Regional Climate Science” section) are likely to affect southern California’s primary energy resource endowments in several ways. Some of these are exogenous to the operational management of the region’s energy system and involve physical differences in the intensity and geographic distribution of renewable energy fluxes such as solar irradiance, surface winds, and surface water flows. Others are endogenous to the operations and management of the energy system and involve the implementation of energy policies, such as renewable portfolio standards, which can influence the dynamics of regional markets for primary energy resources and alter the economic viability of new and existing fossil energy resource reserves.
While southern California continues to consume a significant quantity of fossil fuels both for the generation of electricity and direct end-use in its homes and businesses, it does not produce significant quantities of these fossil energy resources itself. According to the Energy Information Administration, in 2016 California consumed a total of 2,113,847 million cubic feet (Mft^3) of natural gas statewide. However, during this same year its domestic production was only 205,024 Mft^3 (i.e. 9.7% of consumption, https://www.eia.gov/dnav/ng/ng_sum_lsum_dcu_SCA_m.htm). This reliance on out of state production can be a source of vulnerability if local storage assets or out-of-state suppliers become adversely impacted by climate change events.
TABLE 1
PRIMARY ENERGY SOURCE SCE SDG&E LADWP IID
Natural Gas 19% 42% 34% 35%
Coal 0% 0% 19% 14%
Renewable 28% 43% 29% 28%
Hydro 6% 0% 3% 4%
Nuclear 6% 0% 9% 3%
Other 0% 0% 0% 0%
Unspecified* 41% 15% 6% 16%
Primary Energy Sources** by Southern California Utility Provider
Utility Acronyms: SCE - Southern California Edison, SDG&E - San Diego Gas and Electric, LADWP - Los Angeles Department of Water and Power, IID - Imperial Irrigation District
* The category “unspecified sources of power” corresponds to electricity that has been obtained from transactions that are not traceable to specific generation sources.
** Many utility providers provide ratepayers with the option to purchase power that has been produced using a larger fraction of renewable energy resources than which is available in the default grid mix. For simplicity, the energy resource mixes of these optional programs have not been shown.
Source: California Energy Commission, Utility Annual Power Content Labels for 2016 (http://www.energy.ca.gov/pcl/labels/)

Fourth Climate Change Assessment Los Angeles Region | 37
CALIFORNIA’S FOURTH
CLIMATE CHANGE ASSESSMENT
CALIFORNIA’S FOURTH
CLIMATE CHANGE ASSESSMENT
As an example of this vulnerability, in 2016 southern California experienced a four-month, 100,000 metric ton natural gas leak at the Aliso Canyon natural gas storage facility (Fairley 2016). During this period, the Aliso Canyon facility had to be temporarily closed for safety inspections and repairs. The loss of the facility’s storage capacity was unable to be offset by short term increases in the volume of gas deliveries through the regional supply network. In response to this event, a combination of demand mitigation measures and emergency supply side procurement efforts had to be pursued in order to avoid large scale winter electricity blackouts, as electricity generators are among the first customers to be curtailed in the event of major natural gas supply shortages. This event exposed the limitations of the region’s natural gas system to effectively respond to the prolonged disruption to a critical component of its seasonal energy storage infrastructure.
In terms of renewable energy flows, southern California’s most significant primary energy resource endowment is its incident solar radiation. Virtually the entire southern California region experiences average daily solar irradiance intensities in excess of 6,000 Watt-hours per meter squared per day. This makes the region among the most attractive areas in the entire United States for the large-scale development of solar energy generation systems (Simons and McCabe 2005). The two other most significant renewable energy resource endowments possessed by southern California are its hydroelectric and wind power potentials. From year to year, the combined output of small and large hydropower generation station outputs can comprise between 5-15% of California’s total in-state electricity production (Stoms et al. 2013). This significant interannual variability is largely driven by the increasing volatility in seasonal precipitation patterns, which can significantly alter the reservoir operations of hydro generators (Vicuna et al. 2007). Alternatively, the fraction of in-state electricity production coming from wind power has doubled from 3% to 6.8% from 2003 to 2017 (Stoms et al. 2013, AWEA 2018). Wind power resources in the high desert regions of southern California are among the most heavily developed anywhere in the world, with the region’s five largest wind farms (Tule Wind Energy Project, Tehachapi Pass Wind Farm, San Gorgonia Pass Wind Farm, Ocotillo Wind Energy Project, and Alta Wind Energy Center) collectively comprising 3.3 gigawats of installed generating capacity.
There is a high degree of uncertainty in the forecasted changes in climate variables that are likely to impact southern California’s renewable energy resource endowments. Reducing this uncertainty requires more detailed predictions of future cloud cover density, precipitation volumes, and surface wind intensities than the current generation of climate models can as yet accurately produce. More research is needed to determine the extent to which California’s renewable energy resource endowments are likely to be impacted by anticipated changes in its regional climate system.
Generation Systems
As Table 1 indicates, natural gas is the dominant fossil based primary energy source used for electricity generation within southern California. According to CEC data, there are 683 natural gas fired thermal generating facilities currently operating within the state of California. Of these, 246 are located within the five counties encompassing the LA Region. Many of these local generator facilities are nearing the end of their design lifespans; with 53 of them having been in operation for 30 years or more. (CEC Online Generator Database, http://www.energy.ca.gov/almanac/electricity_data/web_qfer/Annual_Generation-Plant_Unit.php) The choice of when these assets are ultimately retired

Fourth Climate Change Assessment Los Angeles Region | 38
CALIFORNIA’S FOURTH
CLIMATE CHANGE ASSESSMENT
CALIFORNIA’S FOURTH
CLIMATE CHANGE ASSESSMENT
and what types of systems are selected to replace them will both be significant factors in determining the rate of progress towards achieving the state’s mandated renewable portfolio standard targets.
Natural gas-fired thermal generators use either water or air for the cooling of turbine exhaust gases. These cooling systems can be either active or passive and involve either once-through or recirculated flows. Most newer thermal generators tend to be air cooled, and those that are water cooled tend to use recirculating flows. In all cases, the lower the temperature of the ambient air or water source that is used for the cooling of these thermal generators, the higher their operational efficiencies. Forecasted temperature increases have the potential to reduce the capacity of California’s existing fleet of thermal generators by as much as 25% (Sathaye et al. 2013). In 2010, the California State Water Resources Control Board approved a policy to progressively phase out the use of once-through cooling technologies at 19 coastal electricity generator stations within the state (http://www.energy.ca.gov/renewables/tracking_progress/documents/once_through_cooling.pdf). Ongoing efforts to comply with this policy will change the technological characteristics of the state’s remaining fossil generator stations and thus their vulnerability to deleterious effects from anticipated regional climate changes (p. 9).
In 2005, a statewide assessment of technical solar photovoltaic (PV) generation potential conducted by the CEC identified LA County’s total capacity potential for flat plate collector technologies as 662,486 MW with an expected daily power output of 3,912,346 megawatt-hours per day (Simons and McCabe 2005). Modeled future climate conditions within the region are likely to negatively impact this potential, as the power efficiency of flat plate solar collectors decreases with increases in ambient air temperatures (p. 9). Working in opposition to this trend, however, are the steady recent improvements in the performance capabilities of new generations of solar PV modules (Simons and McCabe 2005). More research is needed to accurately assess the net effect of climate warming on the future output potential of solar PV systems within southern California.
The impacts of climate change on wind resource availability are likely to be highly spatially variable, with some regions experiencing net increases in available wind energy resources and other undergoing net declines. A major issue in the design of individual wind turbines and collective wind farms is the characteristic range of wind loads at a given site, as these affect component performance and the service lifespan (Pryor and Barthelmie 2010). Sustained exposure to wind speeds considered extreme relative to the design criteria of an individual turbine can necessitate deactivation to protect the structural integrity of the turbine’s blades and sensitive transmission components (Breslow and Sailor 2002). Should southern California experience increased future extreme wind weather events, the region’s existing and potential future fleet of wind generators could potentially suffer from declining capacity factors and increased operations and management costs. More research is needed to ascertain the potential scale and extent of this problem.
Transmission and Distribution Systems
Within southern California, there are two energy transmission and distribution networks. The first conveys fossil-primary energy resource stocks through an integrated connected network of pipelines, shipping conveyances, and storage depots. The second conveys electrical energy through a tightly connected network of transmission lines, substations, and distribution circuits.

Fourth Climate Change Assessment Los Angeles Region | 39
CALIFORNIA’S FOURTH
CLIMATE CHANGE ASSESSMENT
CALIFORNIA’S FOURTH
CLIMATE CHANGE ASSESSMENT
The climate change impacts which are most likely to directly impact fossil fuel distribution infrastructure, and in particular the subsurface pipeline systems used to transport natural gas, are elevated sea levels (p. 15) and corresponding increases in the future rates of coastal land subsidence. While these systemic vulnerabilities have been more extensively studied within California’s Bay Delta Region, where their impacts are expected to be more acute, further study of these issues is necessary to understand the scope of their potential impacts within the southern California context (Shirzaei and Bürgmann 2018).
Compared to fossil fuel conveyance systems, existing infrastructure systems used for the transmission and distribution of electricity are likely to be far more sensitive to perturbation from future climate change impacts. Firstly, forecasted increases in air temperatures (p. 9) will impede the flow of electricity along overhead power lines. This impedance of flow results in the generation of significant quantities of heat which, if not as readily dissipated due to the higher ambient air temperatures, can eventually overload the thermal buffering capacity of system components and lead to cascading failures (Burillo et al 2018). Additionally, forecasted increases in the frequency and intensity of wildfires (p. 18) will increase the probability that transmission and distribution infrastructure components will be physically disturbed. These disturbances can result in widespread system outages due to the geographic remoteness of many key transmission system components. Finally, increases in the penetration of grid-tied renewable generation assets will create endogenous challenges around the need to store energy produced by intermittent sources as well as maintain its consistent quality in terms of voltage, frequency, and reactive power. These challenges will necessitate simultaneous investment in the modernization of electric power grid infrastructure components to support the increasingly bidirectional flow of power through the network.
Consumer Demand
Based upon previous analyses of the sensitivity of the demand for natural gas to climate in the other U.S. states and elsewhere abroad, anticipated shifts towards higher average temperatures during typically cold seasons within southern California will likely lead to aggregate reductions in the demand for natural gas used for both space and water heating applications (Auffhammer and Mansur 2014; Sailor 1997). However, forecasted increases in the frequency and the intensity of extreme high temperature events (p. 9) will likely lead to more extensive air conditioning system usage during historically warm seasons. (Auffhammer and Aroonruengsawat 2011; Sailor 2003). Additionally, as the built environment expands to accommodate future population growth and is simultaneously redeveloped as part of natural turnover cycles, air conditioning penetration levels are also expected to increase.
Both of these trends point to a high likelihood of future increases in the magnitudes of peak electricity demands. This is especially true for the inland regions of southern California that are expected to receive the majority of the region’s future population growth and also experience the most drastic increases in the number and intensity of extreme high heat days (Burillo et al. 2017a). Real world evidence supporting the validity of these conclusions has already begun to appear. For example, in 2015 the weather-adjusted system peak load within the LA Department of Water and Power service territory was 5,674 MW. On August 3, 2017, however, a new record peak load was established at 6,502 MW; an increase of 12% over a period of just two years.

Fourth Climate Change Assessment Los Angeles Region | 40
CALIFORNIA’S FOURTH
CLIMATE CHANGE ASSESSMENT
CALIFORNIA’S FOURTH
CLIMATE CHANGE ASSESSMENT
Interactions between geographic distribution of population growth, urban development, and climate change impacts throughout southern California are likely to stress the region’s energy system nonuniformly in both space and time (Burillo et al. 2017b; Baxter and Calandri 1992). The complex interdependencies between these various elements of the energy system will require the development of more integrated assessment techniques to deliver accurate quantitative forecasts of future energy demand (Chandramowli and Felder 2013; Ciscar and Dowling 2014).
Figure 12 illustrates recent results on the scale and geographic distribution of expected percentage increases in annual electricity demand across California by zip code in the year 2100 under RCP8.5 (Auffhammer 2018). Overall increases in total annual electricity consumption among the state’s coastal communities are anticipated to be more modest than those endured in inland areas due to the moderating influence of the ocean’s thermal storage capacity. Statewide, the largest expected increases (+30-35%) are forecast to occur in inland portions of the LA region. These areas are likely to be subjected to the most significant future growth as well as in the frequency and intensity of climate change-induced high heat events (Auffhammer 2018). These are also areas already facing socio-economic challenges such as poverty, low levels of education, and aging housing and public infrastructure stock.
FIGURE 12
Forecasted percentage increases in total annual electricity consumption by zip code by the year 2100 under RCP8.5 (Auffhammer 2018).

Fourth Climate Change Assessment Los Angeles Region | 41
CALIFORNIA’S FOURTH
CLIMATE CHANGE ASSESSMENT
CALIFORNIA’S FOURTH
CLIMATE CHANGE ASSESSMENT
TRANSPORTATION
Climate change will have both direct and indirect effects on the transportation system in southern California. Direct effects include infrastructure damage, changes to vehicles, and system use. Indirect effects of climate impacts may change trade flows, land use patterns, transportation energy supply and demand, and the institutions, laws, and policies which shape the transportation system.
The Southern California Transportation System
In the National Climate Assessment, Schwartz et al. (2014) assess the transportation system’s vulnerability to climate change through examination of its four components:
1. Fixed node infrastructure, such as ports, airports, and rail terminals;
2. Fixed route infrastructure, such as roads, bridges, pedestrian/ bicycle trails and lanes, locks, canals/channels, light rail, subways, freight and commuter railways, and pipelines;
3. Vehicles, such as cars, transit buses, and trucks; transit and railcars and locomotives; ships and barges; and aircraft (many privately owned); and
4. The people, institutions, laws, policies, and information systems that convert infrastructure and vehicles into working transportation networks.
Each of these system components has its own unique vulnerabilities.
Fixed Node Infrastructure
Nodes are concentrated infrastructure investments, typically at the interface of two or more transportation networks (e.g. ground transportation and aviation interface at airports). In southern California, key fixed nodes are commercial aviation airports, the Ports of LA and Long Beach, intermodal freight rail terminals, large warehousing complexes near the ports and in the Inland Empire, major transit stations in Downtown LA, transit maintenance and storage facilities, and major parking complexes in downtown LA and the Wilshire Corridor (Chester et al. 2015). The most vulnerable of these fixed nodes is the port complex, where sea level rise can affect not only inundation in low-lying areas but also the clearance between vessels and bridges. The Port of LA is planning investments to adapt to climate change (Sriver et al. 2018).
Fixed Route Infrastructure
Fixed routes link major nodes and distributed land uses. Routes are hierarchical: Some land uses are served by local streets or a rail spur, but most mid- and long-distance traffic volume is concentrated onto higher volume corridors: arterials, highways, and main rail lines.
CONCENTRATED VULNERABILITY TO CLIMATE IMPACTS
In southern California, key fixed routes are interstate highways and freeways, major arterials streets, freight rail, passenger transit commuter rail, bikeways, channels and shipping lanes, and links that connect with major fixed node infrastructure. The most vulnerable routes in the LA area are in coastal areas, which can be impacted by sea level
Fourth Climate Change Assessment Los Angeles Region | 42
CALIFORNIA’S FOURTH
CLIMATE CHANGE ASSESSMENT
CALIFORNIA’S FOURTH
CLIMATE CHANGE ASSESSMENT
rise, and also in hillsides, which can be impacted by wildfires (p. 18), debris flows, and erosion from extreme weather events (p. 14).
A coastal 100-year flood event in southern California could damage 530 miles of roadway and rail trackage under current conditions, and 975 miles of roadway with 1.4 meters of sea level rise (see p. 15 for sea level projections). Radke et al. (2018) projects extreme flooding (flood depths exceeding 2 m, or 6.56 ft) to portions of the transportation fuel system located in Long Beach by the mid-21st century, which expands to larger spatial extents in the region by the late-21st century. Minor increases in the intensity of storms can significantly increase coastal erosion of both bluffs and beaches, damaging coastal transportation routes for multiple modes of travel (Hanak and Moreno 2012). Extreme rainfall events can inundate low-lying areas and subgrade infrastructure, such as roadway and rail tunnels. Swift-moving water due to extreme rainfall, inadequate culvert and other drainage capacity, or other causes can lead to washouts of road and rail beds or bridge support piers.
Key links to major fixed nodes that lack redundancy are also vulnerable, such as bridges into rail yards and causeways in the port complex. Cho et al. (2005) estimate the economic effects of a hypothetical tsunami closing the Ports of LA and Long Beach and freeway linkages for one year to be $21 billion in driver delays and $4.2-5 billion in freight delays. Since transportation systems are networks, some resilience is inherent in redundancy: if one segment of one route fails, users can route onto alternative facilities. Ganin et al (2017) found that LA is less prone than other U.S. cities to increases in traffic delay from random losses roadway segments.
BROADER CLIMATE IMPACTS
Expected temperature increases (p. 9) can impact the entirety of fixed route infrastructure. Extreme temperatures can increase risk of failure for transportation infrastructure not designed for high temperatures (Meyer, Amekudzi, and O’Har 2010). Extreme heat can lead to thermal expansion of rail trackage that results in warping or buckling (Smoyer-Tomic, Kuhn, and Hudson 2003), which can cause accidents or slowing or suspending of rail traffic.
There are also links between climate impacts to the transportation system and public health. Particulate matter (PM) from resuspended road dust is comparable to tailpipe emissions (Abu-Allaban et al. 2003). Frequent rain washings reduce the concentration of particulate matter from road dust for a period of up to 2 days after rainfall (Kuhns et al. 2003). In the absence of rainfall during prolonged periods of drought (p. 19), the region could experience increased concentrations of resuspended road particulates, which have adverse respiratory impacts (Tiitanen et al. 1999).
INTENSIFICATION OF CLIMATE IMPACTS
Fixed-route infrastructure in the LA region can act to intensify climate changes. Roadways and parking cover approximately 24% of the incorporated land area of LA County (Chester et al. 2015), and the ubiquity of paved surfaces in LA contributes to increased urban temperatures. Taleghani, Sailor, & Ban-Weiss (2016b), in a case study of El Monte, California, found that the presence of street-level vegetation reduces temperatures by an average of 0.15°C, and direct shade reduces mean temperature 7°C. Cool pavement infrastructure decreased radiant temperature and thermal discomfort in unshaded areas, but increased discomfort in shaded areas. Low-albedo pavement absorbs infrared radiation, contributing to the urban heat island effect (Taha 1997b). This effect can be mitigated by increasing tree cover (Taleghani, Sailor, and Ban-Weiss 2016b; Akbari, Pomerantz, and Taha

Fourth Climate Change Assessment Los Angeles Region | 43
CALIFORNIA’S FOURTH
CLIMATE CHANGE ASSESSMENT
CALIFORNIA’S FOURTH
CLIMATE CHANGE ASSESSMENT
2001) and using high-albedo pavement surfaces (Hashem Akbari, Menon, and Rosenfeld 2009) which have been shown effective in LA (Santamouris 2013). Taha (1997b) calculated that cool pavements and roofs could decrease temperature in Downtown LA by 1.5°C. Non-permeable pavement and concrete surfaces also affect urban hydrology. The prevalence of impervious surfaces in the LA basin can also exacerbate extreme rain events. Urban watersheds in LA lose 90% of storm rainfall to runoff, increasing flood discharge rates and reducing stormwater retention (Sheng and Wilson 2009). Stormwater retention is necessary to recharge aquifers and preserve local water supply.
Vehicles
The third component of the transportation system is vehicles: cars, buses, trucks, railcars, locomotives, ships, and aircraft. In contrast with fixed nodes and routes, most vehicles are privately owned and maintained and have a replacement cycle of between 8 and 39 years (Federal Transit Administration 2016). A shorter replacement cycle means that vehicles are more adaptable than fixed infrastructure: New design requirements can be incorporated into the latest models and within 10 years, most vehicles in use will have the new capabilities. As an example, factory-installed air conditioning was present in 4.6% of all 1958 automobile models, 54% of all 1969 models, 72% of all 1980 models and 94% of all 1990 models (Bhatti 1999). The shorter replacement cycle and the fact that road transportation and petroleum refining emissions comprise 39% of statewide emissions (California Air Resources Board 2017) make transportation electrification an attractive policy option for greenhouse gas reductions (Yang et al. 2015). However, electrification of transportation will increase demand for electricity in California (J. H. Williams et al. 2012).
Operations
Operations of the transportation system include the people, institutions, laws, policies, and information systems that convert infrastructure and vehicles into working transportation networks (Schwartz et al. 2014).
EXTREME HEAT AND PEDESTRIANS
Average temperature increases (p. 9), particularly in the urban heat island, can affect the health, comfort, and behavior of pedestrians, cyclists, and passengers waiting for transit. Reducing exposure to transit users may prevent deaths in extreme heat events, a time when those without air conditioning must travel to a cooled facility (Shonkoff et al. 2011a). A study of officially designated cooling centers in LA found them inaccessible to large portions of the population (Fraser et al. 2016). Fraser and Chester (2017b) find that the heat-related exposures of walking to and waiting for transit vary between LA neighborhoods based on variations in local temperatures, transit service frequency, and the design of the street network. People using transit on the edges of the service network and those whose walking or biking journey to transit bus stops are located in urban heat islands will have the greatest exposure to heat-related impacts.
EXTREME HEAT AND AIRCRAFT REGULATIONS
Extreme heat affects not only the physics but the regulation of aircraft operations. Temperature is inversely proportional to air density, which provides lift. Takeoffs are limited by a combination of air density (a function of temperature and altitude), aircraft weight, and runway length. At high temperatures, aircraft must reduce weight in order to take-off at the same distance and may be grounded in extreme heat. Coffel and Horton (2014) studied

Fourth Climate Change Assessment Los Angeles Region | 44
CALIFORNIA’S FOURTH
CLIMATE CHANGE ASSESSMENT
CALIFORNIA’S FOURTH
CLIMATE CHANGE ASSESSMENT
aircraft operations and runway lengths at four U.S. airports and predict that under RCP8.5, with existing aircraft, the number of takeoffs subject to weight restrictions would increase by 50-200%. Federal Aviation Administration regulations can also prevent aircraft from taking off under extreme temperatures. All aircraft must have maximum takeoff weight data, interpolated from actual test conditions, recorded in an Airplane Flight Manual for combinations of temperature, altitude and runway length (14 CFR § 121.173 (d)). U.S. Commercial Aircraft are restricted from taking off under conditions that are not in an Airplane Flight Manual (14 CFR § 121.189 (a)). Therefore, a manufacturer must test an aircraft at extreme temperatures to allow flight at those temperatures.
Cayan et al. (2018) predict that at the end of the century, under RCP8.5, LAX would experience 50-90 days per year with temperatures at or exceeding 90°F, versus 15 currently experienced. Further research is needed to examine these temperature impacts to airplane operations at southern California’s five major airports.
INSTITUTIONAL RESPONSES TO CLIMATE CHANGE
The complicated and decentralized governance in the LA region limits the agility of governments and institutions to react to climate threats. Pincetl (2010a) found that initiatives to improve tree canopy cover in LA are challenged by the needs to engage and coordinate multiple public agencies and private stakeholders. Barbour and Deakin (2012) further note that California’s strategy to encourage smart growth for adaptation and mitigation to climate change requires coordination by a regional agency to maximize the impact of local actions. Reviews of local climate action plans find that political will limited innovation, as cities often codified changes that market incentives supported (Bassett and Shandas 2010).
Schroeder and Bulkley (2009) found that the decentralization of transportation institutions in LA particularly hampered adaptation, compared to both water infrastructure under LADWP and centralized transportation governance in other states and countries. High reliance on local funding through ballot measures give transit agencies little freedom in changing future planned projects to adapt to climate impacts (Schroeder and Bulkeley 2009).
Indirect Effects from Climate Interventions
TRANSIT-ORIENTED DEVELOPMENT AS AN INTERVENTION
Transit-oriented development is a strategy to both mitigate and adapt to climate change. Transit oriented development can reduce greenhouse gas emissions from shorter trip distances and increased modal share of transportation options with lower greenhouse gas emissions per passenger mile traveled (Nahlik and Chester 2014a; Gallivan et al. 2011; D. Kim, Lee, and Choi 2015; Lund 2006; Gomez-Ibanez et al. 2009). Transit-oriented development also allows for the concentration of future development in areas forecast to have fewer climate change impacts (nearer to coast, away from wildlands) (Stone, Hess, and Frumkin 2010; S. R. Miller 2013; Hamin and Gurran 2009) and, by putting people in closer proximity to frequent transit and their destinations, less exposure to climate impacts for people who use transit, people who bicycle, and people who walk (Cervero and Sullivan 2011; Shonkoff et al. 2011b; 2017b, [c] 2017).
Chester et al. (2013) used life-cycle analysis of greenhouse gas emissions to find that a 20-30% shift of travelers from automobiles to transit is necessary to reduce greenhouse gas emissions. Nahlik and Chester (2014b) evaluated the life-cycle environmental impact of mixed-use infill development near accessible to new light rail and bus rapid transit

Fourth Climate Change Assessment Los Angeles Region | 45
CALIFORNIA’S FOURTH
CLIMATE CHANGE ASSESSMENT
CALIFORNIA’S FOURTH
CLIMATE CHANGE ASSESSMENT
lines in LA over a 60-year forecast. They found that the potential commute mode shift to high quality transit due to transit-oriented development had the most positive environmental impact — greenhouse gas emissions reductions up to 470Gg CO2 per year, a potential 28-35% reduction of larger particle emissions that cause respiratory issues and smog, and overall energy use reduction from multi-unit development.
Glaeser and Kahn (2010) examined current land use patterns in large US cities and trends for future home construction, and found that new construction in denser areas results in comparatively lower energy use and GHG emissions from travel and home utility needs. They also found that the LA metropolitan area has one of the lowest marginal environmental costs of new development.
Boarnet et al. (2017) found that households within ½ mile of the new Expo line light rail in LA reduced vehicle carbon emissions by an average of 305% when the rail line opened. Another examined the variation in transit ridership patterns — and by extension emissions reduction potential—across different types of transit corridors in LA and found that the reduction in vehicle trips is greatest in rail transit corridors in which many stops have transit-oriented developments (Houston et al. 2014).
LAND USE AND COMMUNITY DEVELOPMENT
Overview
The LA region is characterized by a fragmented governmental system with 88 cities, county unincorporated areas, over 200 different water retailers, numerous electricity utilities, and more. Coordinating this large number of local governments for climate action and sustainability is a challenge as, aside from the Southern California Association of Governments (a largely voluntary organization with no regulatory authority), there are few overarching entities that can provide both leadership and regulatory guidance. The South Coast Air Quality Management District does have regulatory authority, but only over stationary sources of air pollution.
As land-use decisions are made incrementally by different local governments, the likelihood of increasing human impacts on local ecosystems and working lands increases, including exacerbating fire incidents, more water extraction, and more land transformation and impacts on ecosystems. These impacts go hand in hand with exposing more people to climate impacts in a feedback loop. These include land development in areas that will experience increased extreme high heat days, more fire incidents, and water uncertainty.
Urban Tree Canopy
Planting trees in cities has been seen as a means to reduce the urban heat island and cleaning the air of particulate matter pollution. Air pollution mitigation and carbon sequestration services have been shown to be minimal and the density and location of tree canopy along streets can cause air to be trapped and increase exposure of pedestrians to particulate matter (Pataki et al 2011 2013). The cooling capacity of trees has been shown to play an important role in remotely sensed land surface temperatures during the day and night, primarily via evapotranspiration and physical shading (Imhoff et al. 2010; Jenerette et al. 2015). However, the role of trees in reducing air temperature is less well understood and linkages between vegetation cover and reduction of air temperature are more variable than land surface temperature relationships. Reductions in air temperature vary in response to weather conditions and locations (Coseo and Larsen 2014; Shiflett et al. 2017; Wang et al. 2015). In addition, for trees to reduce energy

Fourth Climate Change Assessment Los Angeles Region | 46
CALIFORNIA’S FOURTH
CLIMATE CHANGE ASSESSMENT
CALIFORNIA’S FOURTH
CLIMATE CHANGE ASSESSMENT
use they must be maintained to encourage their canopy cover. This often conflicts with other priorities such ease of maintenance (trees in LA city, for example, are on a 40 year pruning cycle), as well as unimpeded traffic flow. Thus, while a promising strategy, for trees to provide shading and cooling they must be cultivated for that end. Further, the magnitude of tree cooling depends on multiple factors, including local meteorological conditions, the extent of vegetation cover, and tree species composition, all of which impact rates of transpiration and latent heat flux (Pataki et al. 2011b). Water use by trees is another consideration in southern California cities and urban cooling by trees may be associated with land surface temperatures in contrast to reducing air temperature. There are techniques for watering trees, such as Tree Gators, but there is no entity that is in charge of systematic distribution of these items nor of ensuring they are well utilized. Trees in the urban environment are also poorly watered as they are often planted in lawns. When there are water use restrictions, trees suffer as their roots are shallow and they depend on surface irrigation rather than deep irrigation. This makes them more susceptible to disease as well. For trees to succeed in the region – one that was not originally forested other than in the mountainous areas and along the foothills – tree maintenance and cover will have to improve dramatically to have an impact in the region.
While trees reflect cultural desires (Muchnick 2007) an emphasis on trees for cooling may preclude exploration of other cooling strategies such as canopy structures and other built environment strategies. Finally, planting and maintaining trees is labor intensive and maintenance is required for trees to grow successfully. For example, watering depends on human labor if it is to be done correctly (that is, independently of sprinklers for lawns). Funding is rarely available for maintenance (Pincetl 2010b), though in the LA region there are active non-profit organizations that help communities plant trees. However, they do not provide any maintenance assistance. For services provided by trees to make a difference in the urban environment, they will need to be at scale and will require dedicated funding. Other strategies need to be implemented alongside planting trees, such as building shade structures and changing urban albedo.

Fourth Climate Change Assessment Los Angeles Region | 47
CALIFORNIA’S FOURTH
CLIMATE CHANGE ASSESSMENT
CALIFORNIA’S FOURTH
CLIMATE CHANGE ASSESSMENT
n the face of urban warming due to the combined effects of urban heat islands and the local impacts of global climate change, local land cover choices can be used as strategies to reduce urban temperatures. Often referred to as “heat mitigation strategies,” these can include two general categories: (1) use of materials that reflect increased
amounts of sunlight and (2) increasing vegetation coverage. Increasing the reflectivity, or “albedo” (defined as the ratio of reflected to downwelling sunlight) of materials reduces their surface temperatures by decreasing sunlight absorption. Use of cool building envelope materials has the additional benefit that it can reduce heat transferred into the building and thus air conditioning energy use. While cool building envelope materials can lead to increases in heating energy use during wintertime, air conditioning energy saved outweighs this “heating penalty” in most climate zones (Levinson and Akbari 2009).
Past research has used numerical climate models to investigate regional temperature changes induced by hypothetical citywide adoption of cool roofs in southern California (Epstein et al. 2017; Taha 1997a; Taha, Konopacki, and Akbari 1998; Taha 2008b, [a] 2008, [b] 2015; Vahmani et al. 2016). Vahmani et al. (2016) found that cool roof adoption reduced the spatial average near-surface air temperatures in the afternoon by 0.9 °C. Nocturnal temperature reductions were smaller in magnitude at 0.5 °C. Cool roof adoption was also found to appreciably offset local warming by mid-century. However, end of century warming overwhelmed the cooling impacts of reflective roofs in most parts of southern California (See Figure 13). This suggests that cool roofs can play a role in adapting to near-term climate change, but long-term regional climate stability can only be achieved through global scale reductions in greenhouse gas emissions. Highly efficient solar PV can also achieve “effective” albedos that are on par with residential cool roofs, and thus can both generate electricity and reduce urban warming relative to standard roofs (Vahmani et al. 2016).
CASE STUDY | ALBEDO MODIFICATION George Ban-Weiss - USC Viterbi School of Engineering
IFIGURE 13
Residual warming in southern California due to global climate change after adopting cool roofs. Values represent simulated changes (relative to current) in diurnal average near-surface air temperature at mid-century (2041-60) and end-century (2081-2100) due to the combined effects of global climate change and cool roof adoption. Simulations assume that cool roofs are adopted on all buildings, and results for both the RCP2.6 (a,c) and RCP 8.5 (b,d) scenario are shown. Figure from (Vahmani et al. 2016).
Fourth Climate Change Assessment Los Angeles Region | 48
CALIFORNIA’S FOURTH
CLIMATE CHANGE ASSESSMENT
CALIFORNIA’S FOURTH
CLIMATE CHANGE ASSESSMENT
CASE STUDY | ALBEDO MODIFICATION George Ban-Weiss - USC Viterbi School of Engineering - Continued
While cool roofs can reduce urban temperatures in LA, their effects on air pollution may be mixed, with both benefits (Epstein et al. 2017; Taha 1997a; Taha, Konopacki, and Akbari 1998; Taha 2008b, [a] 2008, [b] 2015) and penalties (Epstein et al. 2017).
Research on cool pavements and cool walls is not as far along as that of cool roofs. Some recent studies have investigated the effects of cool pavement adoption in California cities on lifecycle greenhouse gas emissions (Gilbert et al. 2017; Pomerantz, Rosado, and Levinson 2015), urban climate (Mohegh et al. 2017), and building energy use (Gilbert et al. 2017; Pomerantz, Rosado, and Levinson 2015). Mohegh et al. (2017) found that widespread cool pavement adoption in LA could lead to daily averaged near-surface air temperature reductions of 0.56°C. While cool pavements reduce air temperatures, they also can lead to increases in sunlight absorbed by pedestrians that has been reflected by the pavement, and thus may decrease human thermal comfort of pedestrians in some cases (Taleghani, Sailor, and Ban-Weiss 2016a). Only one study on climate impacts of cool wall adoption exists, suggesting that daily averaged canyon air temperature reductions attainable from cool walls are slightly lower (0.43°C) than those from cool roofs (0.48°C) given the same albedo increase (Zhang et al. 2018).

Fourth Climate Change Assessment Los Angeles Region | 49
CALIFORNIA’S FOURTH
CLIMATE CHANGE ASSESSMENT
CALIFORNIA’S FOURTH
CLIMATE CHANGE ASSESSMENT
CASE STUDY | COOL ROOFS/COOL STREETS INITIATIVE Lead Author: Jonathan Parfrey, Contributing authors: David Fink, Craig Tranby
he City of LA updated its building code in October 2014 to require “cool roofs” (materials that meet a minimal solar reflectance index value of 75 for low-slope roofs and 16 for steep-slope roofs) on all new and replaced residential roofs. Subsequently, 18,000 residential cool roofs have been installed, covering over 25 million square
feet and saving over 3 million kilowatt-hours annually. The benefits of cool roofs include 1) energy and cost savings for residents, 2) reduced threat of heat-related illness in the home as well as in surrounding community, 3) reduced smog formation, 4) enhanced grid reliability as people use less power to cool during prolonged heat-waves, and 5) a reduction of the greenhouse effect by reducing energy production and by the high albedo roofs directly reflect solar radiation back into space. The cities of Pasadena and Santa Monica, as well as LA County (which sets a more rigorous solar reflectance standard), have recently enacted cool roof policies based on the LA City model.
Despite recent progress, challenges remain. Some people conceive of cool roofs as being made of white material exclusively. Not true. Cool roofs come in a wide spectrum of color. In fact, the Cool Roof Rating Council has evaluated over 3,000 roofing products. The City’s building inspectors are stretched-thin and do not inspect every roofing operation. Moreover, most southern California cities have not yet adopted cool roof regulations, which slows regional adoption and allows old roofing materials to remain stocked in the region’s warehouses.
Statewide, The California Energy Commission has been slow to promulgate new codes on cool roofs, or expand the small number of existing climate zones prescribing residential cool roofs.
Going beyond cool roofs, with assistance from Climate Resolve, the LA Bureau of Street Services created a “cool streets” pilot. Sixteen streets in various neighborhoods throughout the City are currently covered with a sealcoat, CoolSeal (https://www.coolrooftoolkit.org/), and the Bureau recently won a State grant to create a neighborhood-wide cool street project.
T
Fourth Climate Change Assessment Los Angeles Region | 50
CALIFORNIA’S FOURTH
CLIMATE CHANGE ASSESSMENT
CALIFORNIA’S FOURTH
CLIMATE CHANGE ASSESSMENT
Public Transit Infrastructure During Extreme Heat
Transit design can mitigate human exposure to extreme heat (p. 44). Exposure to extreme heat can result in heat-related illnesses such as heat cramps, heat stroke, and heat exhaustion, and can also exacerbate pre-existing conditions. Further, extreme heat may discourage transit use altogether. Environmental exposure results from access and waiting. Transit users from areas with low residential density, limited high capacity roadways, and irregular street networks not located along direct paths between major activity centers, are likely to experience prolonged access and/or waiting times (Fraser and Chester 2017a). In LA, the majority of stops are exposed to the environment and waits can vary depending on the corridor. Average passenger waiting time is between 10 and 15 minutes. The placement of transit stops impacts how long passengers are exposed to the environment, and, coupled with walking, may leave them at risk for negative heat-related outcomes. Walking times can vary significantly by age and physical condition. They can increase by up to 30% for the slowest age group (Bohannon and Williams Andrews 2011). In LA, as in most places, riders in areas where residential density is low (with limited high capacity roadways and irregular street networks and not along direct paths between major activity centers) are likely to experience the greatest total exposure. These are also areas with lower demand (Cervero and Kockelman 1997; Chen, Gong, and Paaswell 2007). In southern California, these may correspond to some of the regions of highest heat gain going forward, such as northern LA County and some of the inland neighborhoods. Cooled waiting stations might provide mitigation in some parts of the county could alleviate some of the impacts of heat on transit riders. Further, in some areas, cooled transit vehicles also provide shelter for the most vulnerable.
Land Use in Wildfire Corridors
Growing urbanization across previously undeveloped areas near existing cities is diminishing the importance of climate in driving fire activity (Syphard et al. 2017). It is important to keep in mind that in southern California there are different types of vegetation, from forests (less than 10% of the vegetation) in the higher elevations of the National Forests to chaparral in the lower elevations. Much of the development pressure takes place in the chaparral-dominated regions. Although shrubland ecosystems are resilient to a wide range of fire regimes and intensities, increased fire can eliminate long-lived woody species that require fire free periods for successful maturity to reproductive age or that must resprout after fire from stored carbohydrates in woody root crowns. Putting homes in highly flammable watersheds expands the urban environment into wildland areas and therefore increases fire hazard because humans are a major source of fire ignitions (J. Keeley and Syphard 2016). This pressure can result in transformed adjacent landscapes. Further, humans can affect wildfire patterns in a unintended ways, including inhibiting prescribed burns due to concerns about air pollution and adjacency to homes (Brotons et al. 2013).
Building standards and fire breaks both contribute to mitigating property damage from fires (Syphard, Keeley, and Brennan 2011; Syphard, Brennan, and Keeley 2017). Between 2000 and 2017, large fires consumed around 3 million acres of southern California vegetation and burned numbers of structures. As land development pressure continues for development at the urban fringe, homes are increasingly in the line of fire. In California, there are nearly a million homes in suburbs adjacent to the wildlands and many of them are in areas with Very High Fire Hazard Severity (http://www.fire.ca.gov/fire_prevention/fire_prevention_wildland_zones_maps). Much of the undeveloped lands in southern California Counties are rated high severity, and yet are planned for more development (Pincetl et al 2008). This includes Tejon Ranch just north of Santa Clarita and the proposed Centennial project for 19,000 homes between

Fourth Climate Change Assessment Los Angeles Region | 51
CALIFORNIA’S FOURTH
CLIMATE CHANGE ASSESSMENT
CALIFORNIA’S FOURTH
CLIMATE CHANGE ASSESSMENT
Gorman and Neenuch, among others. Strategies to curb such developments have been widely discussed for decades in California (Pincetl 2009, LARC Framework 2016), and include transfer of development rights and urban limit lines among others, but in a fragmented governmental system, the issues of assigning rights transfers, competition among jurisdictions and, little precedent make these approaches difficult to implement (Decker et al 2017).
Land development in wildland will incur increased fire, with or without increasing temperatures and changing climate. Mitigation can be practiced with better building practices (increasing both density and structural integrity), avoiding building in canyons where air flows can be intense, and with fire breaks as well, although such changes will only affect fire hazard marginally. More frequent fires at higher intensities due to lack of controlled and/or natural burns, will increase landscape transformation to likely more flammable vegetation.
Common wall and denser housing patterns are less energy intensive (Salat 2009; Salat et al. 2012; Burrillo et al. 2018). They also offer more potential for cooling if well-designed and laid out, ensuring that buildings themselves can offer shading and capture cooling breezes. Infill in existing urban areas, including densification of already built areas such as single-family zones through granny flats and enabling existing homes to be subdivided into multiple units, are ways to house many more people in current cities. Concentrating people in the urban core will reduce the need for building new infrastructure, enable better access to public transportation and put people in places where there is less exposure to wildfire, among other benefits.
Coastal Infrastructure and Land Use Along the Coast
Southern California is particularly vulnerable to sea level rise, especially in combination with wave events from coastal storms. Once-a-century water levels are expected to become an annual event (Tebaldi et al. 2012). Numerous transportation assets are located adjacent to sandy beaches which are vulnerable to erosion (LA, 2016). California beaches are a popular destination for both residents and tourists; Pendlelton et al. (2012) reported approximately 18 million annual visits in 2000. However, this is likely an underestimate. Venice Beach’s iconic boardwalk alone hosts approximately 10 million visitors per year (LA Parks, 2018). Annual value for LA and Orange County beaches is estimated at ~$3B (Pendleton et al., 2012). King et al. (2011) studied sea level rise impacts on select California beaches and estimated annual benefits (against a year 2000 baseline) to be $491M and $1B at Zuma and Venice beaches. Financial exposure to the 100-year coastal flood is expected to double and quadruple by 2100 at Zuma and Venice, while sea level rise is expected to decrease benefits (recreation, habitat, spending, and tax revenue) by $100M and $89M in 2100, respectively (King et al., 2011).
Sea level rise will significantly impact roadways and water systems (wastewater, storm water, and potable water). Heberger et al. (2009) estimated 56 miles of LA County roadways are currently exposed to the 100-year coastal flood. Higher sea levels will shoal groundwater tables and increasingly interact with private wastewater treatment (septic systems) found in developed beaches such as Malibu (Hoover et al. 2017). Large scale sewage treatment plants such as Hyperion are not in near-term danger of inundation; however, reduced hydraulic gradients from increased coastal water levels may affect gravity-driven effluent discharge and require additional pumping operations. The Venice Storm Water Pumping Plant and Terminal Island Reclamation Plant are identified as highly sensitive to sea level rise (Grifman et al. 2013, 2016). Generally, storm water outlets to the ocean and bays will be impacted by higher water levels. In low lying areas (e.g., San Pedro, Long Beach), higher high-water levels will require tide valve closure to prevent tidal flooding. However, closed tide valves preclude urban drainage resulting in increasing freshwater

Fourth Climate Change Assessment Los Angeles Region | 52
CALIFORNIA’S FOURTH
CLIMATE CHANGE ASSESSMENT
CALIFORNIA’S FOURTH
CLIMATE CHANGE ASSESSMENT
flooding of low-lying coastal communities because of the inability to operate the stormwater system during high tides. Over 57 km of potable water distribution pipes areas are vulnerable to sea level rise and erosion (Grifman et al. 2013, 2016).
LA and Long Beach port infrastructure is not considered particularly vulnerable to sea level rise because of relatively frequent infrastructure renewal (Grifman et al. 2013, 2016). However, increasing water levels will promote breakwater overtopping and subsequent damage. The breakwater protects all shoreward infrastructure from wave attack. Breakwater damage would increase both cliff and beach erosion, potentially compromising recreational, commercial, private, and transportation infrastructure adjacent to the ports of LA and Long Beach.
Natural and Managed Resource Systems
VEGETATION AND FLORA
California’s Mediterranean ecosystem has been identified as one of the earth’s “biodiversity hotspots,” a region with exceptionally high levels of diversity and endemism that are under an exceptional degree of threat due to humans. The California Floristic Province has over 5500 native plant taxa; 40% of which are endemic or restricted to the Province (Myers et al. 2000). Though this ecosystem is home to a number of endemic flora and fauna species, it is also one of the most highly altered ecosystems on the planet (Newbold et al. 2016). The high degree of rapid urbanization along the southern California coastline has resulted in the loss of significant natural areas and increasing human impacts to the remaining natural systems (Klausmeyer and Shaw 2009; Underwood et al. 2009). Compounding factors of human population increases, urbanization, and agricultural expansion in southern California has forced natural areas into increasingly isolated and smaller geographic areas over the last 100 years (Jongsomjit et al. 2012; Soule et al. n.d.). This makes the remaining natural areas and current protected areas vulnerable to climate change (Klausmeyer and Rebecca Shaw 2009; Loarie et al. 2008).
Changing climate has impacted the distribution of biodiversity of southern California for thousands of years. Currently there is no question that temperatures will continue to increase in the region over the next 50 years (p. 9, Cook, Ault, and Smerdon 2015). Mean precipitation in the region has remained relatively stable over the past century. However, drought has intensified because it has become warmer during periods of precipitation deficit (p. 19, Diffenbaugh, Swain, and Touma 2015; Cayan et al. 2010; Cook, Ault, and Smerdon 2015). This could lead to significantly higher occurrences of extremely wet and extremely dry years, in spite of no change in mean precipitation (pp. 12-14). These changes in temperature and precipitation regimes will have a significant impact on the vegetation and flora in southern California.

Fourth Climate Change Assessment Los Angeles Region | 53
CALIFORNIA’S FOURTH
CLIMATE CHANGE ASSESSMENT
CALIFORNIA’S FOURTH
CLIMATE CHANGE ASSESSMENT
Vegetation
Plant phenology is strongly controlled by climate and has become one of the most reliable bioindicators of ongoing climate change. There is also evidence that climate change has shifted plant phenology in California’s Mediterranean region (Gordo and Sanz 2010). One of the known ecological responses to climate change is a shift in the local phenology of plants such as changes in the start and end of the growing season, duration of growing season, and maximum productivity (Parmesan and Yohe 2003). In particular, spring events, such as start of the growing season and blooming, are changing more than autumn events, as they are more sensitive to climate and are also undergoing the greatest alterations of climate relative to other seasons (Gordo and Sanz 2010).
In Mediterranean regions, changes in vegetation greenness (Normalized Difference Vegetation Index, NDVI) monitored from moderate spectral resolution spaceborne sensors make it possible to measure fine-scale changes in vegetation characteristics and changes in seasonality over time (Gillespie et al. 2018). NDVI represents photosynthetic activity and is associated with biomass, carbon sequestration, plant water stress, and biodiversity. It can be used to track the effects of climate change on natural ecosystem functioning, especially in protected areas which are less impacted by human activities (Pettorelli 2013). Results from southern California show that some vegetation types (e.g., chaparral and coastal sage scrub) have experienced declines in vegetation greenness over the last 17 years, especially during the summer with or without the impacts of fire (Gillespie et al. 2018). However, islands off the coast of southern California have remained relatively stable, possibly due to the maritime climate around the islands which may buffer some of the impacts of the regional climate change and drought (Gillespie et al. 2018).
Another important impact from climate change is that anthropogenic fires are hypothesized to be become more frequent in southern California as the climate warms (Section 2.7, J. E. Keeley, Fotheringham, and Baer-Keeley 2005). These fires are important episodic events, which are unpredictable in time and extent, and can result in rapid and dramatic vegetation change. Projections from extrapolations of observed sensitivity of fire characteristics to temperature and humidity anomalies predict a doubling of area burned by mid-century in southern California (Jin et al. 2015). There is also evidence that the fire season is getting longer in southern California (Jin et al. 2015). Increases in temperature and extremes in precipitation will continue to increase the chances of fire and transform the composition of the native vegetation in select regions. There is evidence that increased fire frequency has the potential for nonnatives to alter fuels in a way that further increases fire frequency, which further increases expansion of nonnative species (Keeley 2000). Short fire-return intervals of less than 10–15 years present an increasing threat to chaparral ecosystems by eliminating shrub regeneration and leading to nonnative annual grasslands (Rundel 2018). Increases in fire ignitions and the extent of grassland can lead to a positive feedback cycle in which grass promotes fire and shortens the fire-return interval, ultimately extirpating native shrub species that are not adapted to short fire intervals (Syphard, Brennan, and Keeley 2018). The recent fires in the San Gabriel and San Jacinto mountains have converted former pine forest areas to drier chaparral after the fire and these pine forests will probably not return to the drier slopes. Other relictual vegetation types that have been around since the last ice age, such as walnut forests in the lowlands and laurel forests on north-facing slopes, may not regrow after fire due to the current and future climate conditions.
Fourth Climate Change Assessment Los Angeles Region | 54
CALIFORNIA’S FOURTH
CLIMATE CHANGE ASSESSMENT
CALIFORNIA’S FOURTH
CLIMATE CHANGE ASSESSMENT
Flora
The flora of California include 2,387 endemic plant taxa, and predicted climate change could drive dramatic range losses for as many as two-thirds of the endemic species that comprise over 25% of the state’s flora (Loarie et al. 2008). Indeed, it has been projected that 66% of California’s endemic species will experience >80% reductions in range size within a century due to anticipated climate change impacts (Loarie et al. 2008).
Modeling of the future distribution of endangered plants from southern California shows that the climatic niches of many species are clearly moving north (Kueppers et al. 2005; Riordan and Rundel 2009; Riordan et al. 2014). Using regional climate model output, Kueppers et al. (2005) found that potential ranges of two California endemic oaks, Quercus douglasii and Quercus lobata, may shrink considerably (59% and 54% of modern potential range sizes, respectively) and shift northward.
Based on regional climate change projections, almost half of protected land area currently containing these species is expected not to contain them under a future mid-range “business-as-usual” path of greenhouse gas emissions (Kueppers et al. 2005).
Species that occur in California’s coastal sage scrub may also be significantly impacted by projected climate change impacts and anthropogenic land use change. Most coastal sage scrub species show potential northern habitat expansion and southern habitat contraction due to projected climate change (Riordan and Rundel 2009). High geographic overlap in habitat losses driven by projected climate change and projected land use in the southern California underscores the potential for compounding negative impacts of both drivers (Riordan and Rundel 2009). Limiting native habitat conversion may be a broadly beneficial strategy under climate change. Indeed, there will be a need to transplant some of these species to appropriate regions to maintain their range (Riordan et al. 2014). Protecting potential future refugia and facilitating species dispersal will be essential to maintain biodiversity in the face of climate change (Loarie et al. 2008).
OCEANS AND COASTS
Sea Level Rise and Coastal Flooding
The most dramatic effects of climate change on the ocean and coast of the greater LA region will be the result of sea level rise and coastal flooding. Ocean acidification will also take a toll. In addition to permanent inundation resulting from global sea level rise (p. 15), southern California will occasionally experience increased temporary short-term flooding, mostly during winter storms. When coupled with high tides and large waves, there may be substantial erosion and damage to coastal property, similar to what happened during the great storm of January 27, 1983. Even a moderate rise of sea level of 35 cm (less than 14 inches) relative to the year 2000, which could happen by the mid-21st century, would increase serious flooding risk to life and property 25-fold (Sweet 2017).

Fourth Climate Change Assessment Los Angeles Region | 55
CALIFORNIA’S FOURTH
CLIMATE CHANGE ASSESSMENT
CALIFORNIA’S FOURTH
CLIMATE CHANGE ASSESSMENT
Effects on Beaches and Wetlands
A rising sea will accelerate coastal erosion, producing more sediment for beaches and wetlands, but both will almost certainly be compressed with a rising sea. Wetlands keep pace with a rising sea either by building vertically or by moving landward. The first requires an adequate supply of sediment; the second requires pathways unimpeded by infrastructure such as highways, railways, ports, airports, coastal parks, and buildings, and also requires land with appropriate low-lying elevation. The heavily urbanized character of southern California’s coast and the relatively small sediment supply strongly suggest that we will lose a significant fraction of our wetlands over the next few decades unless there is intervention. This loss of wetlands will result in a loss of buffering capacity against coastal storms and erosion, loss of habitat, and loss of sequestered CO2. Wetlands are important spawning and nursery grounds for a number of species of fish and invertebrates, and also serve as resting areas for wildfowl migrating along the Pacific Flyway.
Doughty et al. (2017) found that under the 2050 maximum sea level rise scenario (Committee on Sea Level Rise in California, Oregon, and Washington et al. 2012), over the entire Southern California Bight, 12% of vegetated marsh and flats would be lost with an 0.6m rise, and that 48% would be lost under the 2100 maximum sea level rise scenario with a 1.6m rise, without intervention. Given recent higher estimates of sea level rise (p. 15), the projected losses of wetlands in this region could be even greater. Opportunities for intervention could not only reduce these losses, but potentially increase the area of wetlands within the region. They would require some combination of supplementing sediment sources, clearing pathways for migration of wetlands landward into areas of appropriate elevation, and modifying the geometry of the mouths of several of these systems.
An important paper by Thorne et al. (2018) analyzed the resilience and vulnerability of wetlands to sea level rise along the west coast of North America. Their analysis showed that for wetlands along the highly urbanized coast of much of southern California, under a high sea level rise scenario there would likely be a total loss of all marsh habitats by the end of the century without active intervention to allow migration or to supplement sediment supply. This will result in a loss of storm surge protection, wildlife habitat, and a net loss of important ecosystem services including long-term carbon storage. A number of species including the light footed Ridgway’s rail and Belding’s savannah sparrow face extirpation, and perhaps extinction. The increase in mudflat area will increase foraging habitat for shorebirds.
The sandy beaches along much of this segment of the California coastline provide the first line of defense against sea level rise and coastal storms. The landward translation of flooding from sea level rise and coastal wave events also leads to coincident bluff, cliff and beach erosion. In assessing the shoreline erosion for just the southern portion of the CoSMoS modeling (Santa Barbara to San Diego counties), initial analyses project that 1- 2 m of sea level rise by 2100 would result in an average beach loss of 26-41 m, completely eroding up to 67% of the South Coast beaches (Vitousek, Barnard, and Limber 2017). 19 – 30 m of bluff retreat are projected for 1 -2 m of sea level rise by 2100—an increase of 180% for the 2 m sea level rise scenario compared to the historical rates in southern California (Limber et al. 2018); an additional 17-36 m of storm-induced erosion is projected under the various sea level rise and storm scenarios.
The losses of beaches and wetlands will also take a toll on the recreational value of the region, particularly the loss of beaches.

Fourth Climate Change Assessment Los Angeles Region | 56
CALIFORNIA’S FOURTH
CLIMATE CHANGE ASSESSMENT
CALIFORNIA’S FOURTH
CLIMATE CHANGE ASSESSMENT
The Ports of Long Beach and Los Angeles
Sea level rise also poses a threat to the nation’s two largest container ports—the Port of Long Beach and the Port of LA. Both ports have major initiatives to reduce their greenhouse gas emissions and to develop adaptation plans. The Port of Long Beach has developed a Climate Change Adaptation and Coastal Resiliency Plan that is updated as new information becomes available. The Port of Long Beach is elevating piers and shore-based facilities in anticipation of a higher sea level. The movement of goods into and out of the two ports from the land side outside of port properties may also be subject to inundation and flooding.
Effects on Marine Life
Continued warming of the ocean will further stratify the water column the farther we go into the 21st century. This will reduce upwelling, decrease nutrient levels, and decrease primary productivity. The ocean will become more acidic with the continued transfer of CO2 from the atmosphere to the ocean, which will affect both natural populations of shellfish and shellfish mariculture operations (Ekstrom et al. 2015).
Effects of climate change on marine species and marine ecosystems are less well understood than effects on terrestrial species and ecosystems, but several trends are strongly suggested for this region. There will continue to be a poleward shift by many fish species to keep within their preferred temperature ranges. The probability is high that we will see more permanent resident extensions of subtropical fish into this region. There is a high likelihood of declining kelp forests due to rising ocean temperatures (Tegner et al. 1996; Reed et al. 2016). Evidence has shown that abalone populations are adversely affected by ocean warming: cool-water red abalone suffer stronger consequences in warm water compared to green abalone (Ekstrom et al. 2015; Vilchis et al. 2005).
Recruitment of fucoids (brown seaweed) and intertidal invertebrates in the littoral zone will probably decrease as a result of rising temperatures, causing desiccation of propagules and suppressing growth, leaving new recruits more susceptible to grazers (Hoegh-Guldberg and Bruno 2010).
Biodiversity will almost certainly decline well before the end of the century. Large (50-70%) declines of the communities associated with mussel beds are anticipated (Zippay and Helmuth 2012; Smith, Fong, and Ambrose 2006).Over much of the past 50-60 years, the trend has been for a shoaling of low oxygen zones. If that trend continues, it will result in a loss of habitat for rockfish, one of the iconic fish species of this region (McClatchie et al. 2010). In a warm period from 1951-1993 zooplankton biomass in the Southern California Bight decreased by as much as 80% (Smith 1995). If this occurs, the seasonal populations of whales will probably move to other areas where food is more abundant. There is some evidence that algae responsible for harmful algal blooms are favored in a warmer ocean, indicating that they may increase in frequency and intensity in the region (Edwards et al. 2006; Peperzak 2003; Glibert et al. 2005). More on these and the other ecological, social, and political impacts climate change is projected to have on California’s ocean and coast may be found in a companion Fourth Assessment piece (California’s Ocean and Coast Summary Report 2018).

Fourth Climate Change Assessment Los Angeles Region | 57
CALIFORNIA’S FOURTH
CLIMATE CHANGE ASSESSMENT
CALIFORNIA’S FOURTH
CLIMATE CHANGE ASSESSMENT
AGRICULTURE
Climate and Agriculture in the Los Angeles Region
Although the LA region is not primarily known for its agriculture, LA, Orange and Ventura Counties produces an annual agricultural output of $2.5 billion. Ventura County dominates the total ($2.2 billion), but with significant remaining contributions from Orange ($125 million) and LA ($193 million). Agricultural data are generally published at the county scale, so we do not present quantitative data on the fractions of San Bernardino and Riverside Counties that make up the remainder of the LA region, but the estimated regional boundaries include about $300 million of Riverside’s $1.3 billion output.
The bulk of the value in the LA region is specialty crops, defined as fruit and nuts, fresh vegetables, and nursery products. Strawberries are the region’s most valuable crop (Figure 14), with lemons, nursery plants, raspberries, celery, and avocados also figuring prominently (CDFA 2017). The complete list includes dozens of other fruits and vegetables, as well as some alfalfa hay, dairy, beef, and poultry. The region’s Mediterranean climate and low annual rainfall (10”-20”) makes irrigation essential for practically all commercial agriculture.
The climatic changes impacting agriculture in the LA region will be similar to those impacting the state as a whole: Increases in minimum and maximum temperatures (p. 9), increases in the frequency and intensity of extreme events, such as drought (p. 19), heat waves (p. 9), storms (p. 14), and precipitation amounts of single rainfall events (p. 12), and spatial and temporal shifts in precipitation patterns (p. 12). Of these, changes in average temperature are the most straightforward to predict and have received the most attention in the literature on agricultural impacts (Kerr et al. 2017), but changes in precipitation and extreme events may prove to be at least as consequential.
Potential Impacts of Climate Change on Crop Production Factors
WATER DEMAND AND AVAILABILITY
Like the rest of the state, the LA region is expected to face a challenging combination of decreased water supply and increased water demand (p. 61). Greater interannual variability of rainfall (Dettinger, Udall, and Georgakakos 2015) and sharp decreases in snowpack will create surface water limitations for the entire state. Although the effect of climate change on average precipitation in California is still unclear, more frequent occurrences of extreme events similar to the 2011-2016 drought could significantly decrease groundwater recharge, which is essential for the sustainability of agriculture in this region since the vast majority of water used in agriculture in the LA area is groundwater from local wells. Furthermore, higher temperatures mean that dry years will more quickly develop into severe drought conditions (Diffenbaugh, Swain, and Touma 2015). The South Coast’s water demand is about 80% urban (Mount et al. 2014), and competition between water uses may increase in the future.

Fourth Climate Change Assessment Los Angeles Region | 58
CALIFORNIA’S FOURTH
CLIMATE CHANGE ASSESSMENT
CALIFORNIA’S FOURTH
CLIMATE CHANGE ASSESSMENT
Concurrently, temperature increases will increase crop evapotranspiration and water demands. No studies could be found for the South Coast region, but studies for the Central Valley estimate a 4%-9% increase in crop water demand by 2100 (Purkey et al. 2007; Joyce et al. 2011). In southern California, increased frequency and duration of Santa Ana winds (easterly warm and dry winds) could require substantially more water to meet plant demands (p. 14). Since nearly all crops in this area are irrigated to meet demand, actual increases in water stress will be minimized to the extent possible. However, a variety of indirect impacts are likely:
• Increases in water costs will result in increased production costs, potentially causing producers to shift to less water-intensive crops (e.g., from avocados to grapes), fallow land, or (in the absence of adaptation options) leave agriculture altogether.
• Reduced rainfall and increased groundwater withdrawal may lead to more salinity buildup in topsoil and salt-water intrusion in wells, posing problems for the region’s salt-sensitive crops such as strawberries and avocados. Or, if more irrigation water is applied to leach salts accumulated in topsoil, this will exacerbate the problem of increased water demand.
• Increases in extreme precipitation (greater amount and duration of single rainfall events) can adversely impact yield and quality, especially of the region’s more delicate produce such as berries and vegetables, due to the ex-tended exposure to saturated conditions.
PEST AND DISEASE PRESSURE
Higher temperatures can increase pest pressure; insects and mites reproduce at faster rates under warmer climate, resulting in crop production damages (Trumble and Butler 2008) and possibly increased pesticide use. New pests and diseases could also be introduced under future warmer temperatures. However, climate change may reduce pest populations if warmer temperatures exceed a pest’s tolerance. For example, Persea mite pressure in California avocados can be reduced by several consecutive days of 100°F weather (Faber et al. 2016).
These dynamics are even harder to predict when multiple species are involved. For example, controlling spider mites in berry crops (Zalom et al., 2015) may become more challenging because the predatory mites such as Phytoseiulus persimilis (used as biocontrol) have lower optimum temperatures and higher humidity requirements than do the pest mites. Also unclear is how climate change may affect invasive disease vectors, such as the Asian citrus psyllid that spreads HLB bacteria or the polyphagous shot-hole borer that spreads Fusarium dieback affecting avocados. These vectors are already undergoing range expansion in southern California subsequent to their recent introductions in the region (2008 and 2003, respectively), and climate change may or may not exacerbate the spread.
Many diseases affecting southern California crops are likely to increase with increasing temperatures. For example, Fusarium and Macrophomina fungal pathogens affecting strawberry and vegetable crops are particularly troublesome at soil temperatures above 70°F (Daugovish et al. 2016). Conversely, some diseases that thrive in cool, damp conditions, such as powdery mildew, may pose less of a threat in the future. A particular disease may respond not only to temperature but also to humidity, extreme events, and to the exact timing of these changes. In summary, though agriculture in the LA region will likely see shifts in pest and disease pressure, the outcome will greatly depend on the species under consideration.
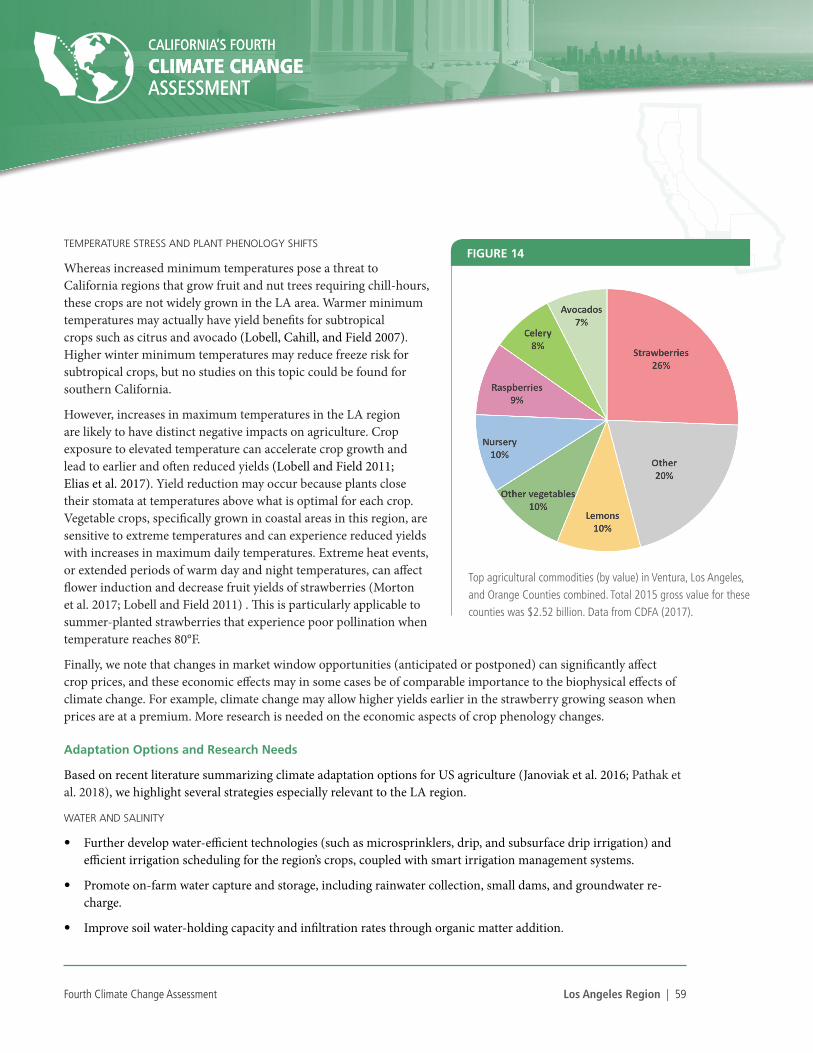
Fourth Climate Change Assessment Los Angeles Region | 59
CALIFORNIA’S FOURTH
CLIMATE CHANGE ASSESSMENT
CALIFORNIA’S FOURTH
CLIMATE CHANGE ASSESSMENT
TEMPERATURE STRESS AND PLANT PHENOLOGY SHIFTS
Whereas increased minimum temperatures pose a threat to California regions that grow fruit and nut trees requiring chill-hours, these crops are not widely grown in the LA area. Warmer minimum temperatures may actually have yield benefits for subtropical crops such as citrus and avocado (Lobell, Cahill, and Field 2007). Higher winter minimum temperatures may reduce freeze risk for subtropical crops, but no studies on this topic could be found for southern California.
However, increases in maximum temperatures in the LA region are likely to have distinct negative impacts on agriculture. Crop exposure to elevated temperature can accelerate crop growth and lead to earlier and often reduced yields (Lobell and Field 2011; Elias et al. 2017). Yield reduction may occur because plants close their stomata at temperatures above what is optimal for each crop. Vegetable crops, specifically grown in coastal areas in this region, are sensitive to extreme temperatures and can experience reduced yields with increases in maximum daily temperatures. Extreme heat events, or extended periods of warm day and night temperatures, can affect flower induction and decrease fruit yields of strawberries (Morton et al. 2017; Lobell and Field 2011) . This is particularly applicable to summer-planted strawberries that experience poor pollination when temperature reaches 80°F.
Finally, we note that changes in market window opportunities (anticipated or postponed) can significantly affect crop prices, and these economic effects may in some cases be of comparable importance to the biophysical effects of climate change. For example, climate change may allow higher yields earlier in the strawberry growing season when prices are at a premium. More research is needed on the economic aspects of crop phenology changes.
Adaptation Options and Research Needs
Based on recent literature summarizing climate adaptation options for US agriculture (Janoviak et al. 2016; Pathak et al. 2018), we highlight several strategies especially relevant to the LA region.
WATER AND SALINITY
• Further develop water-efficient technologies (such as microsprinklers, drip, and subsurface drip irrigation) and efficient irrigation scheduling for the region’s crops, coupled with smart irrigation management systems.
• Promote on-farm water capture and storage, including rainwater collection, small dams, and groundwater re-charge.
• Improve soil water-holding capacity and infiltration rates through organic matter addition.
FIGURE 14
Top agricultural commodities (by value) in Ventura, Los Angeles, and Orange Counties combined. Total 2015 gross value for these counties was $2.52 billion. Data from CDFA (2017).

Fourth Climate Change Assessment Los Angeles Region | 60
CALIFORNIA’S FOURTH
CLIMATE CHANGE ASSESSMENT
CALIFORNIA’S FOURTH
CLIMATE CHANGE ASSESSMENT
• Refine and implement deficit irrigation strategies for citrus (Faber et al., 2015).
• Determine new approaches to avocado spacing, pruning, and plant growth regulators that can enhance avocado yields per unit of water (Rolshausen et al., 2016).
• Develop techniques for more efficient water use in nurseries, includ-ing water recycling.
• Prioritize plant breeding for improved water productivity and salt tolerance in sensitive crops, such as strawberries, raspberries, and avocados.
• Promote improved distribution and use of recycled water
PHENOLOGY AND TEMPERATURE:
• Revise planting, pruning, and harvest schedules to optimize use of a longer growing season.
• Deploy and further develop heat-tolerant varieties of sensitive crops such as strawberries.
• Use practical shade structures, surface mulch, and other cooling techniques.
• Use laboratory, field, and citizen-science studies to anticipate weather- and climate-related dynamics of major pests and diseases.
• Use UC IPM weather-based pest and disease models to reduce pest and disease impacts on crops and potentially reduce number of pesticide applications.
• Analyze economic feasibility of switching to less water intensive crops (e.g., avocados to grapes) or from cool- to warm-season vegetables (e.g., celery to peppers or cucumbers).
FIGURE 15
Strawberries are the highest-valued crop in the Los Angeles region, totaling $644 million in 2015. (Photo by Amber Kerr.)

Fourth Climate Change Assessment Los Angeles Region | 61
CALIFORNIA’S FOURTH
CLIMATE CHANGE ASSESSMENT
CALIFORNIA’S FOURTH
CLIMATE CHANGE ASSESSMENT
WATER
Across southern California and its hundreds of water agencies, future climate impacts to water management operations are likely to occur at multiple geographic scales. This assessment focuses on the metropolitan LAregion and includes LA, Orange, Riverside, San Bernardino, and Ventura counties. First, within these areas, increases in mean surface temperatures will influence water needs that support aquatic habitat, irrigated landscapes, and protected areas, while sea level rise will threaten coastal areas. Second, far outside of the region in the distant watersheds that supply imported water, changes in precipitation and snowpack will affect historic expectations of water availability.
The structure of water management agencies across the region offers unique challenges and opportunities for confronting necessary management changes. Southern California has a diverse, hierarchical network of hundreds of water agencies. In LA County, for instance, there are more than 100 sizeable water supply agencies that acquire, treat, and distribute water throughout 88 cities and additional unincorporated areas, and the total number of community water systems in the county is over two hundred (Pincetl, Porse, and Cheng 2016; DeShazo and McCann 2015). Water importing agencies, primarily the large Metropolitan Water District of Southern California (MWD), built over time a system for acquiring water from northern California, the Sierra Nevada Mountains, and the Colorado River Basin (Erie and Brackman 2006). LA is situated within a hub of pipelines that move water over great distances in support of urban and agricultural needs (Hundley 2001).
Current scientific understanding, summarized below, illustrates the potential effects of climate change on water management in the LA metropolitan megaregion, along with possible options for adapting to expected variability of precipitation.
Within Los Angeles: Local Precipitation, Habitat, and Sea Level Rise
Inside the region’s borders, climate change will likely alter precipitation, streamflows and aquatic habitat, coastal ecosystems, and security of access to water supply for some communities in LA and surrounding cities. In particular, more extreme rainfall events with increased intensity will likely affect local stormwater and water supply availability (Dettinger 2011b). Storms of greater intensity will make local stormwater capture and use more difficult, requiring larger surface storage and infiltration capacity to recharge groundwater basins (LA Basin Study). In addition, average total precipitation in southern California may reduce slightly (Allen and Luptowitz 2017). These two factors combine to challenge a system already seeking to increase capture and use of stormwater for recharging the regional groundwater basins that are critical for supply (Porse et al. 2015).
Urban ecosystems rely on water to supply aquatic habitat and landscapes. For aquatic habitat, the volume of urban streamflow will likely decrease, at least seasonally, due to reduced availability of imported water additions coupled with increased capture and use of in-basin runoff (Manago and Hogue 2017). Regional marshes and wetlands are particularly vulnerable to warming temperatures and sea level rise (Thorne et al. 2016). At the same time, stormwater pollutant loading is a complex process, correlated with the intensity, duration, and frequency of precipitation, land uses, and other factors (Stein et al 2007). Reducing untreated urban runoff through new stormwater control measures and source control actions such as street sweeping can improve water quality in local watersheds and coastal areas (Dwight et al. 2002; Dwight and Semenza 2006; Shuster et al. 2005; Lee et al. 2004).

Fourth Climate Change Assessment Los Angeles Region | 62
CALIFORNIA’S FOURTH
CLIMATE CHANGE ASSESSMENT
CALIFORNIA’S FOURTH
CLIMATE CHANGE ASSESSMENT
Clean Water Act regulations have successfully reduced stormwater contaminant loading in southern California (Lyon and Stein 2009). Within cities, unique ecosystems exist that are highly influenced by human management and decisions (Pickett et al. 2001, 2011). Water conservation driven by reduced imported water availability, coupled with warmer surface air temperatures, will change urban landscapes as lawns reliant on seasonal irrigation are converted to low-water yards of mulch, rock, shrubs, and other ground cover (Pincetl et al., under review). Urban trees, which provide shade and contribute to reducing urban heat island effects, historically relied on significant irrigation but used much less water than turf (E. Litvak et al. 2017a; Elizaveta Litvak, Bijoor, and Pataki 2013; Pataki et al. 2011a). The effects of changing urban landscapes may increase local surface temperatures, but net trends are not clear. Low-water-use landscapes with less irrigation can cause warmer daytime temperatures due to reduced evapotranspiration, but model results show even larger cooling signals at night due from such landscapes to reductions in upward ground heat fluxes related to soil properties (Vahmani and Ban-Weiss 2016).
Finally, more extreme precipitation and increased intensity of rainfall would increase the risks and damages from urban floods. Coastal and inland southern California urban areas use a network of underground storm drains, natural and concrete channels, surface conveyance, and upstream flood control dams to reduce flood risks. The system arose after massive floods devastated LA in its early decades (Orsi 2004; Davis 1993; USGS 1970). Continued urbanization over time has increased flood risk (Sheng and Wilson 2008). Today, water quality regulations increasingly require on-site management of runoff from storms up to a key design storm from historic hydrology. While this assists in reducing runoff from smaller storms that can improve surface water quality, it does not address large-scale flooding that may result from more extreme rainfall events. Analysis from urban areas throughout the globe indicates the potential increased risks that may result from such changes (Willems et al. 2012; Zhou et al. 2013), serving as examples of peer-reviewed studies that can inform infrastructure planning in the LA region.
Beyond Los Angeles: Imported Water Availability
The LA region is intimately connected to other Western U.S. watersheds. Water supply agencies rely on imported water for a majority of regional water supply (Gold et al 2015; Porse et al. 2017). Three main water sources supply metropolitan LA water agencies: the California Aqueduct as part of the State Water Project, the Colorado River Aqueduct that supplies southern California’s allocation of Colorado River water, and the LA Aqueduct that imports water from the Owens Valley. Imported sources comprise a majority of water demands. For instance, in LA County, imported sources meet 55-60% of annual urban water demands, with the remaining amount supplied by groundwater (35-40%) and recycled water for nonpotable uses such as irrigation. From 2000-2010, these water agencies received an annual average of 810,000 acre-ft from MWD’s imported sources, through in recent years averaging closer to 700,000 acre-ft.
The entire American Southwest is expected to see increased drought and reduced availability of future water for agriculture and growth (MacDonald 2010). Such large-scale changes across a broad geography, which includes California, will pose unique risks for each of the massive infrastructure systems that import water to LA. The LA Aqueduct diverts alpine water from the Owens Valley and Mono Lake in the Eastern Sierra Nevada, which constitutes approximately a quarter of the supply for the City of LA, although little water has flowed from Mono Lake in the recent decade. Below the Owens Valley, the LA Aqueduct includes a series of reservoirs with limited storage capacity. In recent years, environmental restoration commitments by the LA Department of Water and Power

Fourth Climate Change Assessment Los Angeles Region | 63
CALIFORNIA’S FOURTH
CLIMATE CHANGE ASSESSMENT
CALIFORNIA’S FOURTH
CLIMATE CHANGE ASSESSMENT
(LADWP) have reduced flows from the LA Aqueduct, whose costs and volumes fluctuate significantly across water years (LADWP 2015). Studies indicate that Eastern Sierra snowpack in the region may fluctuate towards wetter or drier conditions, but snowpack is expected to decrease. This increases spring runoff volumes and, without additional surface storage or groundwater recharge, reduces availability of imported water during the late summer and early fall months (Costa-Cabral et al. 2012; Musselman, Molotch, and Margulis 2017).
The State Water Project of California brings water from the northern and western Sierra Nevada mountains south through the Sacramento-San Joaquin Delta to urban and agricultural users in southern California. Historically, the State Water Project contributed the majority of water supply to MWD’s sources (53% from 1976-2010). Numerous studies have documented the likely shifts in precipitation regimes that will result from climate change in California, including reductions in snowpack, advances in the timing of runoff leading to reduced seasonal capture and storage capacity, and hotter coastal and inland temperatures increasing demand (Anderson et al. 2007; Brekke et al. 2004; N. L. Miller, Bashford, and Strem 2003; Tanaka et al. 2006; Vicuna and Dracup 2007; Dracup and Vicuna 2005). Additionally, the system of reservoirs will face increasing operational risks in managing more extreme rainfall events and preventing floods (Brekke et al. 2009). Applying such projections in planning can be challenging, given long-term uncertainties and sunk costs in current infrastructure (Groves, Yates, and Tebaldi 2008). Given these long-term likelihoods, the reliability of water deliveries from northern California will likely stir significant continued political debate and uncertainties, especially regarding future management alternatives for critical habitat and conveyance areas of the California Delta (Madani and Lund 2010).
The Colorado River Basin supplies water to farms and cities for a region of the Southwest stretching from Colorado through Baja, Mexico. Through the Colorado River Compact of 1922 and agreement among the Lower Colorado River Basin states signed in 1928, California receives allocations of 4.4 million acre-feet per year. This is diverted through the Colorado River Aqueduct at the Arizona-California border, which was built by MWD and opened in 1939. Agricultural and urban growth throughout the region, along with contemporary understanding that the river’s allocations are based on an historically wet-period, mean that coastal and inland southern California will likely face increasing variability of Colorado River Aqueduct supplies. Reservoirs are already lower, spurring recent efforts to renegotiate long-term allocations and drought restriction policies. Climate change will likely exacerbate these already-present shortages, with reduced precipitation leading to reductions in runoff of 10% or more (Hamlet and Lettenmaier 1999; Christensen and Lettenmaier 2006). Historically, the Colorado River Aqueduct has supplied MWD with 46% of its imported supplies, but continued growth in irrigated suburban development and agriculture will likely strain this water availability (MacDonald 2010).
Mitigation and Adaptation: Research and Assessments
Adapting the complex water management systems of LA, Orange, Ventura, and Riverside counties to adequately face evolving risks from climate change involves actions currently underway, as well as actions that must be undertaken in the future. Regional water managers must identify how to increase water conservation and promote reliability and resiliency of supplies.
For the goal of increasing conservation, outdoor water use is a key target. Residential lawns in particular constitute half of all urban water use throughout much of California, including the LA metropolitan area (Hanak and Davis 2006; Mini, Hogue, and Pincetl 2014a). Some coastal communities, notably areas with high-density

Fourth Climate Change Assessment Los Angeles Region | 64
CALIFORNIA’S FOURTH
CLIMATE CHANGE ASSESSMENT
CALIFORNIA’S FOURTH
CLIMATE CHANGE ASSESSMENT
urban development and small yards, have much lower use, while other parts, especially inland areas and affluent neighborhoods with sizable well-irrigated yards, use more (Porse et al. 2017; Mini, Hogue, and Pincetl 2014c; Litvak et al. 2017a).
A key goal to address this opportunity involves better supporting public and community driven programs for replacing lawns (see the “Improved Landscaping Practices” sidebar for more information). Water supply portfolios much less dependent on imported water can still support urban life and trees, but converting to low-water landscapes is critical for progress (Porse et al. 2017).
CASE STUDY | IMPROVED LANDSCAPING PRACTICES Stephanie Pincetl - UCLA IoES
n 2014, the Metropolitan Water District of Southern California (MWD) undertook an unprecedented investment to incentivize turf replacement throughout southern California in response to the state’s serious drought. MWD devoted $350 million to the program, resulting in more than 46,000 rebate payments to remove 15.3 million square meters
of turf.
Results from an MWD-commissioned study showed that program participation corresponded to wealthier socioeconomic neighborhoods, and the City of LA showed the highest numbers of program participants (more than 80% of program participants), likely due to the additional funding provided per square foot by the LA Department of Water and Power (Pincetl et al. 2017). Since outdoor landscaping accounts for over 50% of domestic water use, and residential water use is the highest proportion of overall water use in the region, reducing outdoor water use through turf replacement is the most effective way of reducing overall water use in the region (Mini, Hogue, and Pincetl 2014b). Litvak et al. (2017b) show that turf can be replaced with less water-intensive landscaping while maintaining tree canopy cover, although this will require shifting irrigation to more deliberately irrigating the trees themselves. This is important for ensuring the shading attributes of trees to cool the urban atmosphere are maintained. However, the longitudinal effects of short-term turf replacement incentives are unknown, and analysis to date has only encompassed examining changes in front yards (Pincetl et al. 2017).
Google Street View examination of a random sample of 1,000 front yard turf replacements showed several categories of plants, including shrubs, trees, succulents, perennial herbs, and grasses. Shrubby plants consisted in 14.6% of the new land cover and 9.6% of the front yard was covered by artificial turf. Woodchips, gravel dirt, and lawn were also found. Street View revealed a high diversity of plantings, but to understand how such turf replacement programs may affect urban landscaping and water use over the long term, longitudinal studies are needed, as well as backyard visits. Further, little to no work has been done on water-use reduction analysis that may result from the programs. Overall, MWD and other such entities will need to conduct assessments and evaluations to understand if, and how, such turf replacement programs affect urban landscapes and water use.
I

Fourth Climate Change Assessment Los Angeles Region | 65
CALIFORNIA’S FOURTH
CLIMATE CHANGE ASSESSMENT
CALIFORNIA’S FOURTH
CLIMATE CHANGE ASSESSMENT
Developing more reliable water supplies involves enhancing capacity for alternative sources along with improving system performance. Many local water agencies in southern California are investing in local and alternative water supply resources, including groundwater, stormwater capture and reuse, and water recycling (Porse et al. 2017). The City of LA has outlined plans for integrating water management (OneWater strategy) and reducing purchased water imports to 50% of total supplies by 2025, which is a significant achievement for a city that relies on imported water for 90% of supplies (L.A. Office of the Mayor 2015). Other localities, too, are outlining integrated planning efforts, such as Santa Monica, which adopted a water neutrality ordinance and is undertaking sustainable groundwater management planning. Water districts in Orange County continue to operate and enhance water recycling and groundwater recharge facilities, which have buffered critical local groundwater basins for decades (Allen and Elser 1979; Mills 1998). Throughout the region, MWD is investigating the feasibility of a regional system for distributing recycled water from one or more of the region’s existing large wastewater treatment plants, such as the LA County Joint Water Pollution Control Plant (MWD 2016). Finally, MWD has committed to funding a majority of the costs for the large new infrastructure project to build water supply conveyance tunnels in the Sacramento-San Joaquin Delta (California WaterFix), which would increase the system’s operational reliability to climate-induced sea level rise at the intake valves in the northern Delta.
These alternatives all help diversify and reduce the dependence of agencies on a single supply such as imported water, while also making the system more resilient to water shortages in distant watersheds. Alternative actions and local sources can have additional habitat, energy, and water quality benefits (Spang, Holguin, and Loge 2018; Spang and Loge 2015; Mika et al. 2017). Given currently planned and discussed system improvements, it is unlikely the region would entirely wean off of imported water, but it could significantly reduce imports and even import water during only wetter years (Pincetl et al., under review). Moreover, the rising costs of imported water are making local and alternative sources more cost-effective (Porse, Mika, Litvak, et al. 2018).

Fourth Climate Change Assessment Los Angeles Region | 66
CALIFORNIA’S FOURTH
CLIMATE CHANGE ASSESSMENT
CALIFORNIA’S FOURTH
CLIMATE CHANGE ASSESSMENT
CASE STUDY | MANAGING FOR SCARCITY TO WEATHER THE DROUGHT Caryn Mandelbaum
he Inland Empire Utilities Agency (IEUA) water and energy optimization is a great example of climate resiliency in one of the hottest areas of southern California. The IEUA’s service area covers 242 square miles where Riverside and San Bernardino Counties meet and where summer temperatures soar to over 110°F (43°C). The
IEUA distributes imported and regionally-produced water and provides industrial/municipal wastewater collection and treatment services to more than 830,000 people throughout its nine member agencies.
How, you might ask, did they manage to have surplus water during the state’s worst-ever drought? The short answer is they had been managing for scarcity for the past 20 years. Leadership had the foresight to establish a grant writing department that matched every dollar spent with grants for efficiency projects. They invested nearly $500 million in developing regional water supplies, including state-of-the-art recycled water and groundwater recharge facilities, water use efficiency programs, and infrastructure improvements that avoided leaks.
They also developed close ties with their customers through public affairs staff and communications campaigns. This allowed the water agencies to enforce water budgets for each ratepayer. The budget provided a specific monthly allowance of water, depending on the number of occupants and outdoor footprint. The outdoor space was measured aerially to the square foot. They learned about how their consumption patterns measured up to prior use and that of their neighbors. When customers exceeded their budget, they were penalized and provided with tools for conservation. Armed with information and tools, ratepayers were able to better control their water consumption.
Remarkably, while the IEUA developed surplus water during California’s historic drought, they were also becoming one of the most energy-efficient utilities in the state. In 2010, the agency installed the world’s largest fuel cell system powered by renewable biogas and reduced energy consumption by nearly 25% upgrading operations. In 2017, they launched an advanced energy storage system designed by Tesla that integrates solar, wind, biogas, and grid resources to optimize renewable generation, reduce demand, and lower energy costs. Together with dynamically controlling consumption, IEUA is on track to go gridless by 2020 with almost no capital investment by the Agency.
T

Fourth Climate Change Assessment Los Angeles Region | 67
CALIFORNIA’S FOURTH
CLIMATE CHANGE ASSESSMENT
CALIFORNIA’S FOURTH
CLIMATE CHANGE ASSESSMENT
Finally, shifting water supply and management in metropolitan LA and surrounding cities to reduce reliance on imported water will have effects on the current governance system and likely requires governance innovations. For instance, in the absence of imported water, the networks of water agencies that interact to buy, sell, and distribute water would likely grow more decentralized. Wholesaler agencies and special districts will likely take on more responsibilities. The Water Replenishment District of Southern California, which began as an agency for managing water replenishment actions in the Central and West Coast Basins of LA, recently took on new duties as the groundwater master for these critical aquifers (Porse 2018, under review). Other agencies, such as the LA County Department of Public Works, have already taken emerging leadership roles to reoperate and expand existing systems for capturing and recharging more runoff (LACDPW 2016). But additional governance actions could increase regional capacity to respond to climate change uncertainties. For instance, reconsidering and reallocating the current system of groundwater pumping rights for LA County groundwater basins would provide additional flexibility to agencies for meeting demands and potentially offer critical new sources of water supply for agencies that have no pumping rights and are entirely reliant on imports (Porse, Mika, Williams, et al. 2018). In addition, changing financial and accounting schemes to reflect the life-cycle costs of water management, including acquisition, treatment, use, and disposal, can spur agencies to reconsider their current array of supply sources and give further reason for reaching out to agencies, including those from other sectors such as wastewater or water supply. To date, some of these agreements are taking place, but further opportunities exist and most regional management documentation still compare retail prices of current sources of water supply with long-term costs of new infrastructure without considering likely future increases to imports or all of the stages of water management. Comparative estimates of benefits and costs will change significantly with reduced imported water availability (Porse, Mika, Litvak, et al. 2018).

Fourth Climate Change Assessment Los Angeles Region | 68
CALIFORNIA’S FOURTH
CLIMATE CHANGE ASSESSMENT
CALIFORNIA’S FOURTH
CLIMATE CHANGE ASSESSMENT
CASE STUDY | RIGHT-SIZING DECISION MAKING Mike Antos, SAWPA
ow we make decisions and administer the choices we make needs to be adapted with as much deliberation as any of the other sectors considered in this report. We speak of adaptation as being a local challenge, and inherent in that local scale is our existing local decision-making institutions (cities, counties). Climate adaptation
challenges, however, will often resolve at scales which confound our local decision-making bodies, instead requiring regional decision-making processes that match the scale of the challenge.
The Santa Ana Watershed Project Authority (SAWPA) can be viewed as a model for this idea. Created in the late 1960’s, it is a joint-powers agency whose members are Eastern Municipal Water District, Inland Empire Utilities Agency, Orange County Water District, San Bernardino Valley Municipal Water District, and Western Municipal Water District. SAWPA was created to protect and maintain water quality and quantity in the Santa Ana River in response to the challenges of salt accumulation due to increased imported water from the State Water Project, and increased development of first agriculture and now urban and suburban landscapes. SAWPA has authority to plan and implement projects across the entire Santa Ana River watershed and undertakes three primary roles in service to its mission. The first is the Inland Empire Brine Line, a separate and specialized wastewater discharge system that currently supports groundwater desalting and private industry salty discharges, removing about 500,000 pounds of salt per day from the watershed. Second, SAWPA facilitates multiple roundtable task forces and workgroups in support of multi-party regulatory compliance activity, or activity and research of broad interest within the watershed. Third, SAWPA is the watershed’s approved regional water management group within California’s Integrated Regional Water Management Program. The resulting One Water One Watershed (OWOW) Plan is written by stakeholders and governed by a steering committee of representatives from across the watershed. Implementing the OWOW Plan helps the entire watershed move towards sustainability.
The many local communities of the watershed benefit from the governance and management capacity achieved by the creation of SAWPA. The member agencies, each a special district water agency, together support the regional capacity SAWPA provides, both for their own benefit but also to the benefit of all in the watershed. SAWPA is a government entity that can plan and act at the watershed scale, and therefore is able to confront challenges that resolve at that same scale. The three lines of activity described above rely on authority at a regional scale to support collaborative and multi-party activity at that regional scale. SAWPA is an example of a governance adaptation to face the challenges of local- and regional-scale climate impacts.
Using SAWPA as a model, other legal partnerships or collaborative institutions can be formed to provide critical decision-making and project or program implementation in support of climate adaptation. Having this capacity is most critical when an adaptation effort is best resolved at a scale beyond that of existing local institutions. Collaborative institutions don’t replace existing authority or autonomy; rather, they support and ease the shared activity at scales demanded by adaptation challenges. Integrated management requires specialized skills, authorities, and budgets, and having institutions that support effective integration and regionalization, when needed, will be an important mechanism for right-sizing our decision-making.
H

Fourth Climate Change Assessment Los Angeles Region | 69
CALIFORNIA’S FOURTH
CLIMATE CHANGE ASSESSMENT
CALIFORNIA’S FOURTH
CLIMATE CHANGE ASSESSMENT
Conclusion
limate change is expected to significantly impact the LA region. Warmer average and extreme temperatures, increased precipitation extremes, and rising sea levels are expected to occur. Future changes in Santa Ana winds, wildfire, coastal clouds, and air quality are less certain, but new integrated models and observational datasets are expected to advance our understanding of these aspects of climate change.
The LA region has already taken steps to prepare for a changing climate, but deeper understanding, smart planning, and ample financial and human resources will be needed to fully cope with these changes. Increased resources are needed for local health departments to model and respond to climate-related public health impacts and to train healthcare professionals on best practices for how to teach patients to protect themselves from climate impacts. Community vulnerabilities to climate change must be considered as local and regional agencies update emergency response plans and operations. Continued growth in renewable energy and investment in new energy infrastructure will be needed to handle projected increases in electricity consumption for many locations in the LA region. Reducing the region’s carbon emissions and increasing mobility for its residents can be accomplished through targeted upgrades and new infrastructure to LA’s transportation system. Planting trees can reduce the urban heat island and improve air quality for the region, but dedicated funding to increase the planting of new trees and maintenance of existing ones is needed to realize their full benefits. Longitudinal studies of changes in urban landscaping will need to be conducted to understand if, and how, turf replacement programs affect water use and other aspects in the region. Numerous ecosystems will be impacted by a range of climate changes, and refined projections of wildfire, in particular, and better integration of climate and species models will help inform how to best manage and preserve LA’s magnificent ecological web. Advances in water-efficient irrigation systems, alongside shifts towards more water- and energy-sustainable farming practices, are needed to ensure that the region’s profitable crops can thrive in a warmer future. Climate change will further complicate the challenging task of satisfying freshwater demands across the LA region. Improved integration of climate change into water management models, along with significant infrastructural investments to augment local water supplies and shifts, will help to maintain water resources for residential, commercial, and agricultural, and recreational purposes.
While models are a valuable tool for decision-making, the importance of building capacity within communities to engage in climate adaptation decisions cannot be overstated. Creating opportunities for robust stakeholder participation in planning processes and development decisions helps to raise awareness of climate impacts, builds a common understanding of key vulnerabilities, and allows local perceptions and preferences to guide the selection of adaptation strategies. Climate change is only one of many issues that threaten the health and prosperity of communities of the LA region, but as described above, it will affect nearly all aspects of life in the region, including ecosystems, the built environment, and public health. Therefore, greater effort should be invested in integrating climate change into existing planning and decision-making processes that traditionally have excluded climate change considerations. The more climate change is taken into account in long-term decisions, especially those regarding infrastructure and development projects, the better communities will be prepared to cope with climate change impacts in the future.
C

Fourth Climate Change Assessment Los Angeles Region | 70
CALIFORNIA’S FOURTH
CLIMATE CHANGE ASSESSMENT
CALIFORNIA’S FOURTH
CLIMATE CHANGE ASSESSMENT
ReferencesAbu-Allaban, Mahmoud, John A. Gillies, Alan W. Gertler, Russ Clayton, and David Proffitt. 2003. “Tailpipe,
Resuspended Road Dust, and Brake-Wear Emission Factors from on-Road Vehicles.” Atmospheric Environment 37 (37): 5283–93.
AdaptLA, 2013. Physical Vulnerability Assessment Findings Final Report, https://dornsife.usc.edu/assets/sites/291/docs/AdaptLA_Physical_Vulnerability_Assessment_FINAL_05-03-13.pdf
AghaKouchak, Amir, Linyin Cheng, Omid Mazdiyasni, and Alireza Farahmand. 2014. “Global Warming and Changes in Risk of Concurrent Climate Extremes: Insights from the 2014 California Drought.” Geophysical Research Letters 41 (24): 8847–52.
Akbari, Hashem, Surabi Menon, and Arthur Rosenfeld. 2009. “Global Cooling: Increasing World-Wide Urban Albedos to Offset CO2.” Climatic Change 94 (3-4): 275–86.
Akbari, H., M. Pomerantz, and H. Taha. 2001. “Cool Surfaces and Shade Trees to Reduce Energy Use and Improve Air Quality in Urban Areas.” Solar Energy 70 (3): 295–310.
Albrecht G. 2011. Chronic environmental change: Emerging “psychoterratic” syndromes. In: Weissbecker I (ed.). Climate change and human well-being: Global challenges and opportunities. New York, NY: Springer. pp. 43–56.
Allen, Preston K., and Gordon L. Elser. 1979. “They Said It Couldn’t Be Done - the Orange County, California Experience.” Desalination 30 (1): 23–38.
Allen, Robert J., and Rainer Luptowitz. 2017. “El Niño-like Teleconnection Increases California Precipitation in Response to Warming.” Nature Communications 8 (July): 16055.
American Housing Survey. 2015. 2015 Los Angeles-Long Beach - Heating, Air Conditioning, and Appliances - All Occupied Units (data table). Retrieved from https://www.census.gov/programs-surveys/ahs/data/interactive/ahstablecreator.html#?s_areas=a31080&s_year=m2015&s_tableName=Table3&s_byGroup1=a1&s_byGroup2=a1&s_filterGroup1=t1&s_filterGroup2=g1&s_show=S
American Lung Association. 2017. State of the Air 2017: Most Polluted Cities. Retrieved from http://www.lung.org/our-initiatives/healthy-air/sota/city-rankings/most-polluted-cities.html
American Wind Energy Association (AWEA) 2018: Wind Energy in California, http://awea.files.cms-plus.com/FileDownloads/pdfs/California.pdf.
Anderson, Jamie, Francis Chung, Michael Anderson, Levi Brekke, Daniel Easton, Messele Ejeta, Roy Peterson, and Richard Snyder. 2007. “Progress on Incorporating Climate Change into Management of California’s Water Resources.” Climatic Change 87 (S1): 91–108.
Fourth Climate Change Assessment Los Angeles Region | 71
CALIFORNIA’S FOURTH
CLIMATE CHANGE ASSESSMENT
CALIFORNIA’S FOURTH
CLIMATE CHANGE ASSESSMENT
Auffhammer, Maximilian. (University of California, Berkeley and NBER). 2018. Climate Adaptative Response Estimation: Short and Long Run Impacts of Climate Change on Residential Electricity and Natural Gas Consumption Using Big Data. California’s Fourth Climate Change Assessment, California Energy Commission. Publication number: CCCA4-EXT-2018-005.
Auffhammer, Maximilian, and Anin Aroonruengsawat. 2011. “Simulating the Impacts of Climate Change, Prices and Population on California’s Residential Electricity Consumption.” Climatic Change 109 (S1): 191–210.
Auffhammer, Maximilian, and Erin T. Mansur. 2014. “Measuring Climatic Impacts on Energy Consumption: A Review of the Empirical Literature.” Energy Economics 46: 522–30.
Balazs, Carolina L., and Rachel Morello-Frosch. 2013. “The Three R’s: How Community Based Participatory Research Strengthens the Rigor, Relevance and Reach of Science.” Environmental Justice 6 (1). https://doi.org/10.1089/env.2012.0017.
Barbour, Elisa, and Elizabeth A. Deakin. 2012. “Smart Growth Planning for Climate Protection: Evaluating California’s Senate Bill 375.” Journal of the American Planning Association. American Planning Association 78 (1): 70–86.
Bassett, Ellen, and Vivek Shandas. 2010. “Innovation and Climate Action Planning: Perspectives from Municipal Plans.” Journal of the American Planning Association. American Planning Association 76 (4): 435–50.
Baxter, Lester W., and Kevin Calandri. 1992. “Global Warming and Electricity Demand.” Energy Policy 20 (3): 233–44.
Bell, Michelle L., Richard Goldberg, Christian Hogrefe, Patrick L. Kinney, Kim Knowlton, Barry Lynn, Joyce Rosenthal, Cynthia Rosenzweig, and Jonathan A. Patz. 2007. “Climate Change, Ambient Ozone, and Health in 50 US Cities.” Climatic Change 82 (1-2): 61–76.
Bell, Michelle L., Aidan McDermott, Scott L. Zeger, Jonathan M. Samet, and Francesca Dominici. 2004. “Ozone and Short-Term Mortality in 95 US Urban Communities, 1987-2000.” JAMA: The Journal of the American Medical Association 292 (19): 2372–78.
Bell, Michelle L., Antonella Zanobetti, and Francesca Dominici. 2014. “Who Is More Affected by Ozone Pollution? A Systematic Review and Meta-Analysis.” American Journal of Epidemiology 180 (1): 15–28.
Belmecheri, Soumaya, Flurin Babst, Eugene R. Wahl, David W. Stahle, and Valerie Trouet. 2015. “Multi-Century Evaluation of Sierra Nevada Snowpack.” Nature Climate Change 6 (1): 2–3.
Berg, Neil, and Alex Hall. 2017. “Anthropogenic Warming Impacts on California Snowpack during Drought.” Geophysical Research Letters 44 (5): 2511–18.
Berg, Neil, Alex Hall, Fengpeng Sun, Scott Capps, Daniel Walton, Baird Langenbrunner, and David Neelin. 2015. “Twenty-First-Century Precipitation Changes over the Los Angeles Region*.” Journal of Climate 28 (2): 401–21.
Berko, Jeffrey, Deborah D. Ingram, Shubhayu Saha, and Jennifer D. Parker. 2014. “Deaths Attributed to Heat, Cold, and Other Weather Events in the United States, 2006-2010.” National Health Statistics Reports, no. 76 (July): 1–15.

Fourth Climate Change Assessment Los Angeles Region | 72
CALIFORNIA’S FOURTH
CLIMATE CHANGE ASSESSMENT
CALIFORNIA’S FOURTH
CLIMATE CHANGE ASSESSMENT
Bethel, Jeffrey W., and Renee Harger. 2014. “Heat-Related Illness among Oregon Farmworkers.” International Journal of Environmental Research and Public Health 11 (9): 9273–85.
Bhatti, Mohinder S. 1999. “Riding in Comfort: Part II.” ASHRAE Journal 41: 44–50.
Boarnet, Marlon G., Xize Wang, and Douglas Houston. 2017. “Can New Light Rail Reduce Personal Vehicle Carbon Emissions? A Before-After, Experimental-Control Evaluation in Los Angeles.” Journal of Regional Science 57 (3): 523–39.
Bohannon, Richard W., and A. Williams Andrews. 2011. “Normal Walking Speed: A Descriptive Meta-Analysis.” Physiotherapy 97 (3): 182–89.
Brekke, Levi D., Edwin P. Maurer, Jamie D. Anderson, Michael D. Dettinger, Edwin S. Townsley, Alan Harrison, and Tom Pruitt. 2009. “Assessing Reservoir Operations Risk under Climate Change.” Water Resources Research 45 (4). https://doi.org/10.1029/2008wr006941.
Brekke, Levi D., Norman L. Miller, Kathy E. Bashford, Nigel W. T. Quinn, and John A. Dracup. 2004. “CLIMATE CHANGE IMPACTS UNCERTAINTY FOR WATER RESOURCES IN THE SAN JOAQUIN RIVER BASIN, CALIFORNIA.” Journal of the American Water Resources Association 40 (1): 149–64.
Breslow, Paul B., and David J. Sailor. 2002. “Vulnerability of Wind Power Resources to Climate Change in the Continental United States.” Renewable Energy 27 (4): 585–98.
Brotons, Lluís, Núria Aquilué, Miquel de Cáceres, Marie-Josée Fortin, and Andrew Fall. 2013. “How Fire History, Fire Suppression Practices and Climate Change Affect Wildfire Regimes in Mediterranean Landscapes.” PloS One 8 (5): e62392.
Burillo. 2017b. “Electricity Demand Planning Forecasts Should Consider Climate Non-Stationarity to Maintain Reserve Margins during Heat Waves.” Applied Energy 206: 267–77.
Burillo, Daniel, Mikhail V. Chester, Benjamin Ruddell, and Nathan Johnson. 2017a. “Electricity Demand Planning Forecasts Should Consider Climate Non-Stationarity to Maintain Reserve Margins during Heat Waves.” Applied Energy 206: 267–77.
Burillo, Daniel, Mikhail Chester, Stephanie Pincetl, Eric Fournier, Katharine Reich, Alex Hall. (University of California Los Angeles). 2018. Climate Change in Los Angeles County: Grid Vulnerability to Extreme Heat. California’s Fourth Climate Change Assessment, California Energy Commission. Publication number: CCCA4-CEC-2018-013.
California Air Resources Board. 2017. “California Greenhouse Gas Emission Inventory - 2017 Edition.” https://www.arb.ca.gov/cc/inventory/data/tables/ghg_inventory_scopingplan_sum_2000-15.pdf.
California Department of Food and Agriculture (2017). California Agricultural Statistics Review 2015-2016. https://www.cdfa.ca.gov/statistics/PDFs/2016Report.pdf
California Department of Public Health. 2018. Aedes aegypti and Aedes albopictus mosquitoes in California detection sites by County/City, updated February 2, 2018. Retrieved from https://www.cdph.ca.gov/Programs/CID/DCDC/CDPH%20Document%20Library/AedesDistributionMap.pdf

Fourth Climate Change Assessment Los Angeles Region | 73
CALIFORNIA’S FOURTH
CLIMATE CHANGE ASSESSMENT
CALIFORNIA’S FOURTH
CLIMATE CHANGE ASSESSMENT
California Environmental Protection Agency (Cal/EPA) Environmental Justice Program Update 2016. California Environmental Protection Agency; Sacramento, CA, USA: (accessed March 7, 2018) https://calepa.ca.gov/wp-content/uploads/sites/62/2016/10/EnvJustice-Documents-2016yr-EJReport.pdf
California Office of Statewide Health Planning and Development, Hospital Discharge and Emergency Department Visit Data. 2017.
Carleton, Tamma A. 2017. “Crop-Damaging Temperatures Increase Suicide Rates in India.” Proceedings of the National Academy of Sciences 114 (33): 8746–51.
Cayan, Daniel R., David W. Pierce, Julie F. Kalansky. (Scripps Institution of Oceanography). 2018. Climate, Drought, and Sea Level Rise Scenarios for the Fourth California Climate Assessment. California’s Fourth Climate Change Assessment, California Energy Commission. Publication number: CCCA4-CEC-2018-006.
Cayan, Daniel R., Tapash Das, David W. Pierce, Tim P. Barnett, Mary Tyree, and Alexander Gershunov. 2010. “Future Dryness in the Southwest US and the Hydrology of the Early 21st Century Drought.” Proceedings of the National Academy of Sciences of the United States of America 107 (50): 21271–76.
Cayan, Daniel R., Edwin P. Maurer, Michael D. Dettinger, Mary Tyree, and Katharine Hayhoe. 2008. “Climate Change Scenarios for the California Region.” Climatic Change 87 (S1): 21–42.
Cervero, Robert, and Kara Kockelman. 1997. “Travel Demand and the 3Ds: Density, Diversity, and Design.” Transportation Research Part D: Transport and Environment 2 (3): 199–219.
Cervero, Robert, and Cathleen Sullivan. 2011. “Green TODs: Marrying Transit-Oriented Development and Green Urbanism.” International Journal of Sustainable Development and World Ecology 18 (3): 210–18.
Cha, J. Mijin. “A Just Transition: Why Transitioning Workers into a New Clean Energy Economy Should Be at the Center of Climate Change Policies,” 29 Fordham Envtl. L. Rev. 196 (2017)
Chandramowli, Shankar, and Frank A. Felder. 2013. “Impact of Climate Change on Electricity Systems and Markets - A Review of Models and Forecasts.” SSRN Electronic Journal. https://doi.org/10.2139/ssrn.2251167.
Chang, Howard H., Jingwen Zhou, and Montserrat Fuentes. 2010. “Impact of Climate Change on Ambient Ozone Level and Mortality in Southeastern United States.” International Journal of Environmental Research and Public Health 7 (7): 2866–80.
Chen, Cynthia, Hongmian Gong, and Robert Paaswell. 2007. “Role of the Built Environment on Mode Choice Decisions: Additional Evidence on the Impact of Density.” Transportation 35 (3): 285–99.
Chester, Mikhail, Andrew Fraser, Juan Matute, Carolyn Flower, and Ram Pendyala. 2015. “Parking Infrastructure: A Constraint on or Opportunity for Urban Redevelopment? A Study of Los Angeles County Parking Supply and Growth.” Journal of the American Planning Association. American Planning Association 81 (4): 268–86.
Chester, Mikhail, Stephanie Pincetl, Zoe Elizabeth, William Eisenstein, and Juan Matute. 2013. “Infrastructure and Automobile Shifts: Positioning Transit to Reduce Life-Cycle Environmental Impacts for Urban Sustainability Goals.” Environmental Research Letters: ERL [Web Site] 8 (1): 015041.

Fourth Climate Change Assessment Los Angeles Region | 74
CALIFORNIA’S FOURTH
CLIMATE CHANGE ASSESSMENT
CALIFORNIA’S FOURTH
CLIMATE CHANGE ASSESSMENT
Cho, Sungbin, James E. Moore II, Harry W. Richardson, and Costas Synolakis. 2005. “Could It Happen Here?” Civil Engineering . http://cwis.usc.edu/dept/tsunamis/2005/pdf/2005_03_28_socalTsunami2.pdf.
Chou, Chia, and J. David Neelin. 2004. “Mechanisms of Global Warming Impacts on Regional Tropical Precipitation*.” Journal of Climate 17 (13): 2688–2701.
Christensen, N., and D. P. Lettenmaier. 2006. “A Multimodel Ensemble Approach to Assessment of Climate Change Impacts on the Hydrology and Water Resources of the Colorado River Basin.” Hydrology and Earth System Sciences Discussions 3 (6): 3727–70.
Chung U, Gbegbelegbe S, Shiferaw B, Robertson R, Yunc JI, Tesfaye K, Hoogenboom G, Sonder K. 2014. Modeling the effect of a heat wave on maize production in the USA and its implications on food security in the developing world. Weather and Climate Extremes Volumes 5–6:67-77. Retrieved from https://www.sciencedirect.com/science/article/pii/S2212094714000668.
Ciscar, Juan-Carlos, and Paul Dowling. 2014. “Integrated Assessment of Climate Impacts and Adaptation in the Energy Sector.” Energy Economics 46: 531–38.
Coffel, E., and R. Horton. 2014. “Climate Change and the Impact of Extreme Temperatures on Aviation.” Weather, Climate, and Society 7 (1): 94–102.
Committee on Sea Level Rise in California, Oregon, and Washington, Board on Earth Sciences and Resources, Ocean Studies Board, Division on Earth and Life Studies, and National Research Council. 2012. Sea-Level Rise for the Coasts of California, Oregon, and Washington:: Past, Present, and Future. National Academies Press.
Conil, Sebastien, and Alex Hall. 2006. “Local Regimes of Atmospheric Variability: A Case Study of Southern California.” Journal of Climate 19 (17): 4308–25.
Cook, Benjamin I., Toby R. Ault, and Jason E. Smerdon. 2015. “Unprecedented 21st Century Drought Risk in the American Southwest and Central Plains.” Science Advances 1 (1): e1400082.
Corburn J. 2005. Street Science: Community Knowledge and Environmental Health Justice. MIT Press.
Corburn J. 2009. Cities, Climate Change and Urban Heat Island Mitigation: Localising Global Environmental Science. Urban Studies 46 (2): 413–27.
Coseo, Paul, and Larissa Larsen. 2014. “How Factors of Land Use/land Cover, Building Configuration, and Adjacent Heat Sources and Sinks Explain Urban Heat Islands in Chicago.” Landscape and Urban Planning 125: 117–29.
Costa-Cabral, Mariza, Sujoy B. Roy, Edwin P. Maurer, William B. Mills, and Limin Chen. 2012. “Snowpack and Runoff Response to Climate Change in Owens Valley and Mono Lake Watersheds.” Climatic Change 116 (1): 97–109.
Costello, Anthony, Mustafa Abbas, Adriana Allen, Sarah Ball, Sarah Bell, Richard Bellamy, Sharon Friel, et al. 2009. “Managing the Health Effects of Climate Change: Lancet and University College London Institute for Global Health Commission.” The Lancet 373 (9676): 1693–1733.

Fourth Climate Change Assessment Los Angeles Region | 75
CALIFORNIA’S FOURTH
CLIMATE CHANGE ASSESSMENT
CALIFORNIA’S FOURTH
CLIMATE CHANGE ASSESSMENT
Cushing L, Wander M, Morello-Frosch R, Pastor M, Zhu A, Sadd J. 2016. A Preliminary Environmental Equity Assessment Of California’s Cap-and-Trade Program.
Daugovish, Oleg, Anna Howell, Steven Fennimore, Steven Koike, Thomas Gordon, and Krishna Subbarao. 2016. “Non-Fumigant Treatments and Their Combinations Affect Soil Pathogens and Strawberry Performance in Southern California.” International Journal of Fruit Science 16 (sup1): 37–46.
DeConto, Robert M., and David Pollard. 2016. “Contribution of Antarctica to Past and Future Sea-Level Rise.” Nature 531 (7596): 591–97.
Delfino, R. J., S. Brummel, J. Wu, H. Stern, B. Ostro, M. Lipsett, A. Winer, et al. 2009. “The Relationship of Respiratory and Cardiovascular Hospital Admissions to the Southern California Wildfires of 2003.” Occupational and Environmental Medicine 66 (3): 189–97.
Dennison, Philip E., Simon C. Brewer, James D. Arnold, and Max A. Moritz. 2014. “Large Wildfire Trends in the Western United States, 1984-2011.” Geophysical Research Letters 41 (8): 2928–33.
Dettinger, Michael. 2011a. “Climate Change, Atmospheric Rivers, and Floods in California - A Multimodel Analysis of Storm Frequency and Magnitude Changes1.” JAWRA Journal of the American Water Resources Association 47 (3): 514–23.
———. 2011b. “Climate Change, Atmospheric Rivers, and Floods in California - A Multimodel Analysis of Storm Frequency and Magnitude Changes1.” JAWRA Journal of the American Water Resources Association 47 (3): 514–23.
Dettinger, Michael D. 2013. “Atmospheric Rivers as Drought Busters on the U.S. West Coast.” Journal of Hydrometeorology 14 (6): 1721–32.
Dettinger, Michael D., Fred Martin Ralph, Tapash Das, Paul J. Neiman, and Daniel R. Cayan. 2011. “Atmospheric Rivers, Floods and the Water Resources of California.” WATER 3 (4): 445–78.
Dettinger, Michael, Bradley Udall, and Aris Georgakakos. 2015. “Western Water and Climate Change.” Ecological Applications: A Publication of the Ecological Society of America 25 (8): 2069–93.
Diffenbaugh, Noah S., Daniel L. Swain, and Danielle Touma. 2015. “Anthropogenic Warming Has Increased Drought Risk in California.” Proceedings of the National Academy of Sciences of the United States of America 112 (13): 3931–36.
Doughty, C., Cavanaugh, K., Ambrose, R. and Stein, E., 2016. Assessment of Sea Level Rise Vulnerability for Southern California Coastal Estuaries.
———. Sea Level Rise Impacts to Coastal Habitats in Southern California Estuaries. University of Southern California Sea Grant Traineeship Program Report, 35 p.
Dracup, J. A., and S. Vicuna. 2005. “An Overview of Hydrology and Water Resources Studies on Climate Change: The California Experience.” In Impacts of Global Climate Change. https://doi.org/10.1061/40792(173)483.
Fourth Climate Change Assessment Los Angeles Region | 76
CALIFORNIA’S FOURTH
CLIMATE CHANGE ASSESSMENT
CALIFORNIA’S FOURTH
CLIMATE CHANGE ASSESSMENT
Drehobl A, Ross L. 2016. Lifting the high energy burden in America’s largest cities: How energy efficiency can improve low-income and underserved communities. American Council for Energy Efficiency. Retrieved from http://aceee.org/research-report/u1602
Dwight, Ryan H., and Jan C. Semenza. 2006. “Comment on ‘Coastal Water Quality Impact of Stormwater Runoff from an Urban Watershed in Southern California.’” Environmental Science & Technology 40 (10): 3440–3440.
Dwight, Ryan H., Jan C. Semenza, Dean B. Baker, and Betty H. Olson. 2002. “Association of Urban Runoff with Coastal Water Quality in Orange County, California.” Water Environment Research: A Research Publication of the Water Environment Federation 74 (1): 82–90.
Ebi, Kristie L., and Glenn McGregor. 2008. “Climate Change, Tropospheric Ozone and Particulate Matter, and Health Impacts.” Environmental Health Perspectives 116 (11): 1449–55.
Edwards, M., D. G. Johns, S. C. Leterme, E. Svendsen, and A. J. Richardson. 2006. “Regional Climate Change and Harmful Algal Blooms in the Northeast Atlantic.” Limnology and Oceanography 51 (2): 820–29.
Ekstrom, Julia A., Lisa Suatoni, Sarah R. Cooley, Linwood H. Pendleton, George G. Waldbusser, Josh E. Cinner, Jessica Ritter, et al. 2015. “Vulnerability and Adaptation of US Shellfisheries to Ocean Acidification.” Nature Climate Change 5 (3): 207–14.
Elias, Emile, Alison Marklein, John T. Abatzoglou, Jake Dialesandro, Joel Brown, Caiti Steele, Albert Rango, and Kerri Steenwerth. 2017. “Vulnerability of Field Crops to Midcentury Temperature Changes and Yield Effects in the Southwestern USA.” Climatic Change. https://doi.org/10.1007/s10584-017-2108-8.
English P., K. Fitzsimmons, S. Hoshiko, T. Kim, H. G. Margolis, T. E., McKone, M. Rotkin-Ellman, G. Solomon, R. Trent & Z. Ross. 2007. Public health impacts of climate change in California: Community vulnerability assessments and adaptation strategies. Richmond, California: Climate Change Public Health Impacts Assessment and Response Collaborative, California Department of Public Health and Public Health Institute. Retrieved from http://www.energy.ca.gov/2008publications/DPH-1000-2008-014/DPH-1000-2008-014.PDF (accessed July 9, 2018)
English PB and Richardson MJ. 2016. Components of Population Vulnerability and Their Relationship With Climate-Sensitive Health. Current Environmental Health Report. March 2016. Vol. 3, Issue 1. pg. 91-98.
English, P, M. Richardson, R. Morello-Frosh, M. Pastor, J. Sadd, G. King, W. Jesdale, and M. Jerrett, 2013, Racial and Income Disparities in Relation to a Proposed Climate Change Vulnerability Screening Method for California, International Journal of Climate Change: Impacts and Responses, 4(2), 1-18.
Epstein, Scott A., Sang-Mi Lee, Aaron S. Katzenstein, Marc Carreras-Sospedra, Xinqiu Zhang, Salvatore C. Farina, Pouya Vahmani, Philip M. Fine, and George Ban-Weiss. 2017. “Air-Quality Implications of Widespread Adoption of Cool Roofs on Ozone and Particulate Matter in Southern California.” Proceedings of the National Academy of Sciences of the United States of America 114 (34): 8991–96.
Erie, Steven P., and Harold David Brackman. 2006. Beyond Chinatown: The Metropolitan Water District, Growth, and the Environment in Southern California. Stanford University Press.

Fourth Climate Change Assessment Los Angeles Region | 77
CALIFORNIA’S FOURTH
CLIMATE CHANGE ASSESSMENT
CALIFORNIA’S FOURTH
CLIMATE CHANGE ASSESSMENT
Erikson, Li, Patrick Barnard, Andrea O’Neill, Nathan Wood, Jeanne Jones, Juliette Finzi Hart, Sean Vitousek, et al. 2018. “Projected 21st Century Coastal Flooding in the Southern California Bight. Part 2: Tools for Assessing Climate Change-Driven Coastal Hazards and Socio-Economic Impacts.” Journal of Marine Science and Engineering 6 (3): 76.
Faber, Ben (2015). “Irrigating citrus with limited water.” UC ANR Publication 8549. Oakland, CA. http://anrcatalog.ucanr.edu/pdf/8549.pdf.
Faber, BA, Willen CA, Eskalen A, Morse JG, Hanson B, and Hoddle MS. 2016. “Persea mite.” In UC IPM Pest Management Guidelines: Avocado. UC ANR Publication 3436. http://ipm.ucanr.edu/PMG/r8400211.html
Fairley, Peter. 2016. “The Troubled Link between Gas and Electricity Grids [News].” IEEE Spectrum 53 (6): 11–12.
Faivre, N. R., Y. Jin, M. L. Goulden, and J. T. Randerson. 2016. “Spatial Patterns and Controls on Burned Area for Two Contrasting Fire Regimes in Southern California.” Ecosphere 7 (5): e01210.
Federal Transit Administration. 2016. “Default Useful Life Benchmark (ULB) Cheat Sheet.” October 26, 2016. https://www.transit.dot.gov/sites/fta.dot.gov/files/docs/FTA%20TAM%20ULB%20Cheat%20Sheet%202016-10-26.pdf.
Finlay, Sarah Elise, Andrew Moffat, Rob Gazzard, David Baker, and Virginia Murray. 2012. “Health Impacts of Wildfires.” PLoS Currents. https://doi.org/10.1371/4f959951cce2c.
Fraser, Andrew M., and Mikhail V. Chester. 2017a. “Transit System Design and Vulnerability of Riders to Heat.” Journal of Transport & Health 4: 216–25.
———. 2017b. “Transit System Design and Vulnerability of Riders to Heat.” Journal of Transport & Health 4 (March): 216–25.
———. 2017c. “Transit Planning and Climate Change: Reducing Rider’s Vulnerability to Heat.” In International Conference on Sustainable Infrastructure 2017, 456–64. Reston, VA: American Society of Civil Engineers.
Fraser, Andrew M., Mikhail V. Chester, David Eisenman, David M. Hondula, Stephanie S. Pincetl, Paul English, and Emily Bondank. 2016. “Household Accessibility to Heat Refuges: Residential Air Conditioning, Public Cooled Space, and Walkability.” Environment and Planning B: Urban Analytics and City Science 44 (6): 1036–55.
Gallivan, Frank, Jeff Ang-Olson, Cris Liban, and Alvin Kusumoto. 2011. “Cost-Effective Approaches to Reduce Greenhouse Gas Emissions Through Public Transportation in Los Angeles, California.” Transportation Research Record: Journal of the Transportation Research Board 2217 (December): 19–29.
Ganin, Alexander A., Maksim Kitsak, Dayton Marchese, Jeffrey M. Keisler, Thomas Seager, and Igor Linkov. 2017. “Resilience and Efficiency in Transportation Networks.” Science Advances 3 (12): e1701079.
Gao, Yang, Jian Lu, L. Ruby Leung, Qing Yang, Samson Hagos, and Yun Qian. 2015. “Dynamical and Thermodynamical Modulations on Future Changes of Landfalling Atmospheric Rivers over Western North America.” Geophysical Research Letters 42 (17): 7179–86.

Fourth Climate Change Assessment Los Angeles Region | 78
CALIFORNIA’S FOURTH
CLIMATE CHANGE ASSESSMENT
CALIFORNIA’S FOURTH
CLIMATE CHANGE ASSESSMENT
Gilbert, Haley E., Pablo J. Rosado, George Ban-Weiss, John T. Harvey, Hui Li, Benjamin H. Mandel, Dev Millstein, Arash Mohegh, Arash Saboori, and Ronnen M. Levinson. 2017. “Energy and Environmental Consequences of a Cool Pavement Campaign.” Energy and Buildings 157: 53–77.
Gillespie, Thomas W., Stacey Ostermann-Kelm, Chunyu Dong, Katherine S. Willis, Gregory S. Okin, and Glen M. MacDonald. 2018. “Monitoring Changes of NDVI in Protected Areas of Southern California.” Ecological Indicators 88: 485–94.
Glaeser, Edward L., and Matthew E. Kahn. 2010. “The Greenness of Cities: Carbon Dioxide Emissions and Urban Development.” Journal of Urban Economics 67 (3): 404–18.
Glibert, Patricia, Sybil Seitzinger, Cynthia Heil, Joann Burkholder, Matthew Parrow, Louis Codispoti, and Vince Kelly. 2005. “The Role of Eutrophication in the Global Proliferation of Harmful Algal Blooms.” Oceanography 18 (2): 198–209.
Gomez-Ibanez, Dr Jose, Marlon G. Boarnet, Dianne R. Brake, Robert B. Cervero, Andrew Cotugno, Anthony Downs, Susan Hanson, et al. 2009. “Driving and the Built Environment: The Effects of Compact Development on Motorized Travel, Energy Use, and CO2 Emissions,” January. https://www.osti.gov/scitech/biblio/980706.
Gordo, Oscar, and Juan José Sanz. 2010. “Impact of Climate Change on Plant Phenology in Mediterranean Ecosystems.” Global Change Biology 16 (3): 1082–1106.
Griffin, Daniel, and Kevin J. Anchukaitis. 2014. “How Unusual Is the 2012-2014 California Drought?” Geophysical Research Letters 41 (24): 9017–23.
Grifman, P. M., J. F. Hart, J. Ladwig, A. G. Newton Mann, M. Schulhof. (2013) Sea Level Rise Vulnerability Study for the City of Los Angeles. USCSG-TR-05-2013.
Griggs, G, Árvai, J, Cayan, D, DeConto,. R, Fox, J, Fricker, HA, Kopp, RE,. Tebaldi, C, Whiteman, EA (California. Ocean Protection Council Science. Advisory Team Working Group). Rising Seas in California: An Update on Sea-Level Rise Science. California. Ocean Science Trust, April 2017.
Groves, David G., David Yates, and Claudia Tebaldi. 2008. “Developing and Applying Uncertain Global Climate Change Projections for Regional Water Management Planning.” Water Resources Research 44 (12). https://doi.org/10.1029/2008wr006964.
Guan, Bin, Noah P. Molotch, Duane E. Waliser, Eric J. Fetzer, and Paul J. Neiman. 2013. “The 2010/2011 Snow Season in California’s Sierra Nevada: Role of Atmospheric Rivers and Modes of Large-Scale Variability.” Water Resources Research 49 (10): 6731–43.
Gubler, D. J., P. Reiter, K. L. Ebi, W. Yap, R. Nasci, and J. A. Patz. 2001. “Climate Variability and Change in the United States: Potential Impacts on Vector- and Rodent-Borne Diseases.” Environmental Health Perspectives 109 Suppl 2 (May): 223–33.
Guzman-Morales, Janin, Alexander Gershunov, Jurgen Theiss, Haiqin Li, and Daniel Cayan. 2016a. “Santa Ana Winds of Southern California: Their Climatology, Extremes, and Behavior Spanning Six and a Half Decades.” Geophysical Research Letters 43 (6): 2827–34.

Fourth Climate Change Assessment Los Angeles Region | 79
CALIFORNIA’S FOURTH
CLIMATE CHANGE ASSESSMENT
CALIFORNIA’S FOURTH
CLIMATE CHANGE ASSESSMENT
———. 2016b. “Santa Ana Winds of Southern California: Their Climatology, Extremes, and Behavior Spanning Six and a Half Decades.” Geophysical Research Letters 43 (6): 2827–34.
Hagos, Samson M., L. Ruby Leung, Jin-Ho Yoon, Jian Lu, and Yang Gao. 2016. “A Projection of Changes in Landfalling Atmospheric River Frequency and Extreme Precipitation over Western North America from the Large Ensemble CESM Simulations.” Geophysical Research Letters 43 (3): 1357–63.
Hahn, Micah B., Andrew J. Monaghan, Mary H. Hayden, Rebecca J. Eisen, Mark J. Delorey, Nicole P. Lindsey, Roger S. Nasci, and Marc Fischer. 2015. “Meteorological Conditions Associated with Increased Incidence of West Nile Virus Disease in the United States, 2004-2012.” The American Journal of Tropical Medicine and Hygiene 92 (5): 1013–22.
Hamin, Elisabeth M., and Nicole Gurran. 2009. “Urban Form and Climate Change: Balancing Adaptation and Mitigation in the U.S. and Australia.” Habitat International 33 (3): 238–45.
Hamlet, Alan F., and Dennis P. Lettenmaier. 1999. “EFFECTS OF CLIMATE CHANGE ON HYDROLOGY AND WATER RESOURCES IN THE COLUMBIA RIVER BASIN.” Journal of the American Water Resources Association 35 (6): 1597–1623.
Hanak, Ellen, and Matthew Davis. 2006. Lawns and Water Demand in California.
Hanak, Ellen, and Georgina Moreno. 2012. “California Coastal Management with a Changing Climate.” Climatic Change 111 (1): 45–73.
Hanigan, Ivan C., Colin D. Butler, Philip N. Kokic, and Michael F. Hutchinson. 2012. “Suicide and Drought in New South Wales, Australia, 1970–2007.” Proceedings of the National Academy of Sciences of the United States of America 109 (35): 13950–55.
Harlan, Sharon L., Juan H. Declet-Barreto, William L. Stefanov, and Diana B. Petitti. 2013. “Neighborhood Effects on Heat Deaths: Social and Environmental Predictors of Vulnerability in Maricopa County, Arizona.” Environmental Health Perspectives 121 (2): 197–204.
Harrigan RJ, Thomassen HA, Buermann W, Smith TB. 2014. A continental risk assessment of West Nile virus under climate change. Global Change Biology 20(8):2417-2425.
Harris, Sarah M., and Leila M. V. Carvalho. 2017. “Characteristics of Southern California Atmospheric Rivers.” Theoretical and Applied Climatology. https://doi.org/10.1007/s00704-017-2138-1.
Hart, Juliette Finzi, Susanne Moser. (U.S. Geological Survey and Susanne Moser Research & Consulting). 2018. The Adaptation Blind Spot-Electrical Grid Teleconnected and Cascading Climate Change Impacts on Community Lifelines in Los Angeles. California’s Fourth Climate Change Assessment, California Energy Commission. Publication number: CCCA4-CEC-2018-008.
Hayhoe, Katharine, Daniel Cayan, Christopher B. Field, Peter C. Frumhoff, Edwin P. Maurer, Norman L. Miller, Susanne C. Moser, et al. 2004. “Emissions Pathways, Climate Change, and Impacts on California.” Proceedings of the National Academy of Sciences of the United States of America 101 (34): 12422–27.

Fourth Climate Change Assessment Los Angeles Region | 80
CALIFORNIA’S FOURTH
CLIMATE CHANGE ASSESSMENT
CALIFORNIA’S FOURTH
CLIMATE CHANGE ASSESSMENT
Heberger, M., Cooley, H., Herrera, P., Gleick, P.H., Moore, E., 2009. The impacts of sea level rise on the California coast. California Climate Change Center, Sacramento.
Held, Isaac M., and Brian J. Soden. 2006. “Robust Responses of the Hydrological Cycle to Global Warming.” Journal of Climate 19 (21): 5686–99.
He, Minxue, and Mahesh Gautam. 2016. “Variability and Trends in Precipitation, Temperature and Drought Indices in the State of California.” Hydrology 3 (4): 14.
Hoegh-Guldberg, O., and J. F. Bruno. 2010. “The Impact of Climate Change on the World’s Marine Ecosystems.” Science 328 (5985): 1523–28.
Hoell, Andrew, Martin Hoerling, Jon Eischeid, Klaus Wolter, Randall Dole, Judith Perlwitz, Taiyi Xu, and Linyin Cheng. 2016. “Does El Niño Intensity Matter for California Precipitation?” Geophysical Research Letters 43 (2): 819–25.
Hoover, Daniel J., Kingsley O. Odigie, Peter W. Swarzenski, and Patrick Barnard. 2017. “Sea-Level Rise and Coastal Groundwater Inundation and Shoaling at Select Sites in California, USA.” Journal of Hydrology: Regional Studies 11: 234–49.
Horton, Daniel E., Nathaniel C. Johnson, Deepti Singh, Daniel L. Swain, Bala Rajaratnam, and Noah S. Diffenbaugh. 2015. “Contribution of Changes in Atmospheric Circulation Patterns to Extreme Temperature Trends.” Nature 522 (7557): 465–69.
Houston, Douglas, Marlon G. Boarnet, Gavin Ferguson, and Steven Spears. 2014. “Can Compact Rail Transit Corridors Transform the Automobile City? Planning for More Sustainable Travel in Los Angeles.” Urban Studies 52 (5): 938–59.
Hughes, Mimi, and Alex Hall. 2009a. “Local and Synoptic Mechanisms Causing Southern California’s Santa Ana Winds.” Climate Dynamics 34 (6): 847–57.
———. 2009b. “Local and Synoptic Mechanisms Causing Southern California’s Santa Ana Winds.” Climate Dynamics 34 (6): 847–57.
Hughes, Mimi, Alex Hall, and Jinwon Kim. 2011a. “Human-Induced Changes in Wind, Temperature and Relative Humidity during Santa Ana Events.” Climatic Change 109 (S1): 119–32.
———. 2011b. “Human-Induced Changes in Wind, Temperature and Relative Humidity during Santa Ana Events.” Climatic Change 109 (S1): 119–32.
Hundley, Norris. 2001. The Great Thirst: Californians and Water—A History, Revised Edition. Univ of California Press.
Iacobellis, Sam F., and Daniel R. Cayan. 2013. “The Variability of California Summertime Marine Stratus: Impacts on Surface Air Temperatures.” Journal of Geophysical Research, D: Atmospheres 118 (16): 9105–22.
Imhoff, Marc L., Ping Zhang, Robert E. Wolfe, and Lahouari Bounoua. 2010. “Remote Sensing of the Urban Heat Island Effect across Biomes in the Continental USA.” Remote Sensing of Environment 114 (3): 504–13.

Fourth Climate Change Assessment Los Angeles Region | 81
CALIFORNIA’S FOURTH
CLIMATE CHANGE ASSESSMENT
CALIFORNIA’S FOURTH
CLIMATE CHANGE ASSESSMENT
Jacob, Daniel J., and Darrell A. Winner. 2009. “Effect of Climate Change on Air Quality.” Atmospheric Environment 43 (1): 51–63.
Jacobson, Mark Z. 2008. “On the Causal Link between Carbon Dioxide and Air Pollution Mortality.” Geophysical Research Letters 35 (3). https://doi.org/10.1029/2007gl031101.
Janowiak, Maria K.; Daniel N. Dostie; Michael A. Wilson; Michael J. Kucera; R. Howard Skinner; Jerry L. Hatfield; David Hollinger; and Christopher W. Swanston. 2016. “Adaptation Resources for Agriculture: Responding to Climate Variability and Change in the Midwest and Northeast.” Technical Bulletin 1944. U.S. Department of Agriculture, Washington, DC. October 2016. 72 pp.
Jenerette, G. Darrel, G. Darrel Jenerette, Sharon L. Harlan, Alexander Buyantuev, William L. Stefanov, Juan Declet-Barreto, Benjamin L. Ruddell, Soe Win Myint, Shai Kaplan, and Xiaoxiao Li. 2015. “Micro-Scale Urban Surface Temperatures Are Related to Land-Cover Features and Residential Heat Related Health Impacts in Phoenix, AZ USA.” Landscape Ecology 31 (4): 745–60.
Jesdale B, Morello-Frosch R, and Cushing L. 2013. The Racial/Ethnic Distribution of Heat Risk-Related Land Cover in Relation to Residential Segregation. Environmental Health Perspectives. 121:811–817. https://ehp.niehs.nih.gov/1205919/ (accessed March 7, 2018).
Jin, Yufang, Michael L. Goulden, Nicolas Faivre, Sander Veraverbeke, Fengpeng Sun, Alex Hall, Michael S. Hand, Simon Hook, and James T. Randerson. 2015. “Identification of Two Distinct Fire Regimes in Southern California: Implications for Economic Impact and Future Change.” Environmental Research Letters: ERL [Web Site] 10 (9): 094005.
Jin, Yufang, James T. Randerson, Nicolas Faivre, Scott Capps, Alex Hall, and Michael L. Goulden. 2014. “Contrasting Controls on Wildland Fires in Southern California during Periods with and without Santa Ana Winds.” Journal of Geophysical Research: Biogeosciences 119 (3): 432–50.
Jongsomjit, Dennis, Diana Stralberg, Thomas Gardali, Leonardo Salas, and John Wiens. 2012. “Between a Rock and a Hard Place: The Impacts of Climate Change and Housing Development on Breeding Birds in California.” Landscape Ecology 28 (2): 187–200.
Joyce, Brian A., Vishal K. Mehta, David R. Purkey, Larry L. Dale, and Michael Hanemann. 2011. “Modifying Agricultural Water Management to Adapt to Climate Change in California’s Central Valley.” Climatic Change 109 (S1): 299–316.
Kalkstein, Adam J., Laurence S. Kalkstein, Jennifer K. Vanos, David P. Eisenman, and P. Grady Dixon. 2018. “Heat/mortality Sensitivities in Los Angeles during Winter: A Unique Phenomenon in the United States.” Environmental Health: A Global Access Science Source 17. https://doi.org/10.1186/s12940-018-0389-7.
Kar, Nilamadhab, and Binaya Kumar Bastia. 2006. “Post-Traumatic Stress Disorder, Depression and Generalised Anxiety Disorder in Adolescents after a Natural Disaster: A Study of Comorbidity.” Clinical Practice and Epidemiology in Mental Health: CP & EMH 2 (July): 17.
Fourth Climate Change Assessment Los Angeles Region | 82
CALIFORNIA’S FOURTH
CLIMATE CHANGE ASSESSMENT
CALIFORNIA’S FOURTH
CLIMATE CHANGE ASSESSMENT
Keeley, Jon E. 2000. Fire and invasive species in Mediterranean-climate ecosystems of California. In Proceedings of the invasive species workshop: the role of fire in the control and spread of invasive species. Fire Conference (pp. 81-94).
Keeley, Jon E., C. J. Fotheringham, and Melanie Baer-Keeley. 2005. “DETERMINANTS OF POSTFIRE RECOVERY AND SUCCESSION IN MEDITERRANEAN-CLIMATE SHRUBLANDS OF CALIFORNIA.” Ecological Applications: A Publication of the Ecological Society of America 15 (5): 1515–34.
Keeley, Jon, and Alexandra Syphard. 2016. “Climate Change and Future Fire Regimes: Examples from California.” Geosciences Journal 6 (4): 37.
Kenny, Glen P., Jane Yardley, Candice Brown, Ronald J. Sigal, and Ollie Jay. 2010. “Heat Stress in Older Individuals and Patients with Common Chronic Diseases.” CMAJ: Canadian Medical Association Journal = Journal de l’Association Medicale Canadienne 182 (10): 1053–60.
Kenward A, Adams-Smith D, Raja U. 2013. Wildfires and air pollution: The hidden health hazards of climate change. Climate Central. Retrieved from http://assets.climatecentral.org/pdfs/WildfiresAndAirPollution.pdf
Kerr, Amber, Jake Dialesandro, Kerri Steenwerth, Nathan Lopez-Brody, and Emile Elias. 2017. “Vulnerability of California Specialty Crops to Projected Mid-Century Temperature Changes.” Climatic Change. https://doi.org/10.1007/s10584-017-2011-3.
Kim, Dohyung, Jooil Lee, and Simon Choi. 2015. “Balancing Mobility and CO2 Reduction by a Mode Share Scheme: A Comparison of Los Angeles and Seoul Metropolitan Areas.” International Journal of Urban Sciences 19 (2): 168–81.
Kim, Jinwon, Duane E. Waliser, Paul J. Neiman, Bin Guan, Ju-Mee Ryoo, and Gary A. Wick. 2012. “Effects of Atmospheric River Landfalls on the Cold Season Precipitation in California.” Climate Dynamics 40 (1-2): 465–74.
King et al., 2011. The economic costs of sea-level rise to California beach communities. California Department of Boating and Waterways, 2010, 82 pp.
Klausmeyer, Kirk R., and M. Rebecca Shaw. 2009. “Climate Change, Habitat Loss, Protected Areas and the Climate Adaptation Potential of Species in Mediterranean Ecosystems Worldwide.” PloS One 4 (7): e6392.
Kleeman, Michael J., Christina Zapata, John Stilley, and Mark Hixson. 2012. “PM2.5 Co-Benefits of Climate Change Legislation Part 2: California Governor’s Executive Order S-3-05 Applied to the Transportation Sector.” Climatic Change 117 (1-2): 399–414.
Klein, Stephen A., Alex Hall, Joel R. Norris, and Robert Pincus. 2017. “Low-Cloud Feedbacks from Cloud-Controlling Factors: A Review.” Surveys in Geophysics 38 (6): 1307–29.
Knowlton, Kim, Miriam Rotkin-Ellman, Galatea King, Helene G. Margolis, Daniel Smith, Gina Solomon, Roger Trent, and Paul English. 2009. “The 2006 California Heat Wave: Impacts on Hospitalizations and Emergency Department Visits.” Environmental Health Perspectives 117 (1): 61–67.
Fourth Climate Change Assessment Los Angeles Region | 83
CALIFORNIA’S FOURTH
CLIMATE CHANGE ASSESSMENT
CALIFORNIA’S FOURTH
CLIMATE CHANGE ASSESSMENT
Kopp, Robert E., Radley M. Horton, Christopher M. Little, Jerry X. Mitrovica, Michael Oppenheimer, D. J. Rasmussen, Benjamin H. Strauss, and Claudia Tebaldi. 2014. “Probabilistic 21st and 22nd Century Sea-Level Projections at a Global Network of Tide-Gauge Sites.” Earth’s Future 2 (8): 383–406.
Krug, Etienne G., Marcie-Jo Kresnow, John P. Peddicord, Linda L. Dahlberg, Kenneth E. Powell, Alex E. Crosby, and Joseph L. Annest. 1999. “Retraction: Suicide after Natural Disasters.” The New England Journal of Medicine 340 (2): 148–49.
Kueppers, Lara M., Mark A. Snyder, Lisa C. Sloan, Erika S. Zavaleta, and Brian Fulfrost. 2005. “Modeled Regional Climate Change and California Endemic Oak Ranges.” Proceedings of the National Academy of Sciences of the United States of America 102 (45): 16281–86.
Kuhns, H., V. Etyemezian, M. Green, Karin Hendrickson, Michael McGown, Kevin Barton, and Marc Pitchford. 2003. “Vehicle-Based Road Dust Emission measurement—Part II: Effect of Precipitation, Wintertime Road Sanding, and Street Sweepers on Inferred PM10 Emission Potentials from Paved and Unpaved Roads.” Atmospheric Environment 37 (32): 4573–82.
LA Parks, 2018. Venice Beach. Accessed June 25, 2018 at https://www.laparks.org/venice.
Lee, Haejin, Sim-Lin Lau, Masoud Kayhanian, and Michael K. Stenstrom. 2004. “Seasonal First Flush Phenomenon of Urban Stormwater Discharges.” Water Research 38 (19): 4153–63.
Levinson RM, Gilbert HE, Jin L, Mandel BH, Millstein D, Rosado PJ, Harvey JT, Kendall A, Li H, Saboori A, Lea J, Ban-Weiss G, Mohegh A, Santero N. 2017. Life Cycle Assessment and Co-Benefits of Cool Pavements. Final report for Contract #12-314, California Air Resources Board, Sacramento, CA. https://www.arb.ca.gov/research/apr/past/12-314.pdf
Levinson, Ronnen, and Hashem Akbari. 2009. “Potential Benefits of Cool Roofs on Commercial Buildings: Conserving Energy, Saving Money, and Reducing Emission of Greenhouse Gases and Air Pollutants.” Energy Efficiency 3 (1): 53–109.
Limber, Patrick W., Patrick L. Barnard, Sean Vitousek, and Li H. Erikson. 2018. “A Model Ensemble for Projecting Multi-Decadal Coastal Cliff Retreat during the 21st Century.” Journal of Geophysical Research: Earth Surface. https://doi.org/10.1029/2017jf004401.
Litvak, Elizaveta, Neeta S. Bijoor, and Diane E. Pataki. 2013. “Adding Trees to Irrigated Turfgrass Lawns May Be a Water-Saving Measure in Semi-Arid Environments.” Ecohydrology. https://doi.org/10.1002/eco.1458.
Litvak, E., K. F. Manago, T. S. Hogue, and D. E. Pataki. 2017a. “Evapotranspiration of Urban Landscapes in Los Angeles, California at the Municipal Scale.” Water Resources Research 53 (5): 4236–52.
———. 2017b. “Evapotranspiration of Urban Landscapes in Los Angeles, California at the Municipal Scale.” Water Resources Research 53 (5): 4236–52.
Livingston M, Branson-Potts H, Etehad M, Serna J. 2018, January 10. Deadly flooding on Santa Barbara coast as fire turns to mud. Los Angeles Times. Retrieved from http://www.latimes.com/local/lanow/la-me-mudslide-santa-barbara-20180110-story.html.

Fourth Climate Change Assessment Los Angeles Region | 84
CALIFORNIA’S FOURTH
CLIMATE CHANGE ASSESSMENT
CALIFORNIA’S FOURTH
CLIMATE CHANGE ASSESSMENT
Loarie, Scott R., Benjamin E. Carter, Katharine Hayhoe, Sean McMahon, Richard Moe, Charles A. Knight, and David D. Ackerly. 2008. “Climate Change and the Future of California’s Endemic Flora.” PloS One 3 (6): e2502.
Lobell, David B., Kimberly Nicholas Cahill, and Christopher B. Field. 2007. “Historical Effects of Temperature and Precipitation on California Crop Yields.” Climatic Change 81 (2): 187–203.
Lobell, David B., and Christopher B. Field. 2011. “California Perennial Crops in a Changing Climate.” Climatic Change 109 (S1): 317–33.
Los Angeles (LA) County Department of Beaches and Harbors, 2016. Final Report Los Angeles County Public Beach Facilities Sea-Level Rise Vulnerability Assessment.
Los Angeles County Department of Public Health. 2017. West Nile Virus in Los Angeles County. Retrieved from http://publichealth.lacounty.gov/acd/WNVData.htm
Los Angeles Regional Collaborative for Environmental Health and Justice. Hidden Hazards: A Call to Action for Healthy, Livable Communities. December 2010. https://www.libertyhill.org/sites/libertyhillfoundation/files/hidden-hazards-low-res-version.pdf (accessed March 7, 2018)
Lund, Hollie. 2006. “Reasons for Living in a Transit-Oriented Development, and Associated Transit Use.” Journal of the American Planning Association. American Planning Association 72 (3): 357–66.
Lyon, Greg S., and Eric D. Stein. 2009. “How Effective Has the Clean Water Act Been at Reducing Pollutant Mass Emissions to the Southern California Bight over the Past 35 Years?” Environmental Monitoring and Assessment 154 (1-4): 413–26.
MacDonald, Glen M. 2007. “Severe and Sustained Drought in Southern California and the West: Present Conditions and Insights from the Past on Causes and Impacts.” Quaternary International: The Journal of the International Union for Quaternary Research 173-174: 87–100.
———. 2010. “Climate Change and Water in Southwestern North America Special Feature: Water, Climate Change, and Sustainability in the Southwest.” Proceedings of the National Academy of Sciences of the United States of America 107 (50): 21256–62.
Madani, Kaveh, and Jay R. Lund. 2010. “The Sacramento-San Joaquin Delta Conflict: Chicken or Prisoner’s Dilemma?” In World Environmental and Water Resources Congress 2010. https://doi.org/10.1061/41114(371)259.
Mahmud, Abdullah, Mary Tyree, Dan Cayan, Nehzat Motallebi, and Michael J. Kleeman. 2008. “Statistical Downscaling of Climate Change Impacts on Ozone Concentrations in California.” Journal of Geophysical Research 113 (D21). https://doi.org/10.1029/2007jd009534.
Mahmud, A., M. Hixson, J. Hu, Z. Zhao, S. Chen, and M. J. Kleeman. 2010. “Climate Impact on Airborne Particulate Matter Concentrations in California Using Seven Year Analysis Periods.” Atmospheric Chemistry and Physics Discussions 10 (2): 2985–3020.

Fourth Climate Change Assessment Los Angeles Region | 85
CALIFORNIA’S FOURTH
CLIMATE CHANGE ASSESSMENT
CALIFORNIA’S FOURTH
CLIMATE CHANGE ASSESSMENT
Maibach, Edward W., Jennifer M. Kreslake, Connie Roser-Renouf, Seth Rosenthal, Geoff Feinberg, and Anthony A. Leiserowitz. 2015. “Do Americans Understand That Global Warming Is Harmful to Human Health? Evidence From a National Survey.” Annals of Global Health 81 (3): 396–409.
Manago, Kimberly F., and Terri S. Hogue. 2017. “Urban Streamflow Response to Imported Water and Water Conservation Policies in Los Angeles, California.” JAWRA Journal of the American Water Resources Association 53 (3): 626–40.
Margulis, Steven A., Gonzalo Cortés, Manuela Girotto, Laurie S. Huning, Dongyue Li, and Michael Durand. 2016. “Characterizing the Extreme 2015 Snowpack Deficit in the Sierra Nevada (USA) and the Implications for Drought Recovery.” Geophysical Research Letters 43 (12): 6341–49.
Marshall, Grant N., Terry L. Schell, Marc N. Elliott, Nadine R. Rayburn, and Lisa H. Jaycox. 2007. “Psychiatric Disorders among Adults Seeking Emergency Disaster Assistance after a Wildland-Urban Interface Fire.” Psychiatric Services 58 (4): 509–14.
Maurer, Edwin P. 2007. “Uncertainty in Hydrologic Impacts of Climate Change in the Sierra Nevada, California, under Two Emissions Scenarios.” Climatic Change 82 (3-4): 309–25.
Mazur L, Milanes C, Randles K, Siegel D. 2010. Indicators of climate change in California: Environmental justice impacts. California Office of Environmental Health Hazard Assessment. Retrieved from http://citeseerx.ist.psu.edu/viewdoc/download?doi=10.1.1.432.2142&rep=rep1&type=pdf
McClatchie, S., R. Goericke, R. Cosgrove, G. Auad, and R. Vetter. 2010. “Oxygen in the Southern California Bight: Multidecadal Trends and Implications for Demersal Fisheries.” Geophysical Research Letters 37 (19). https://doi.org/10.1029/2010gl044497.
McDermott, Brett M., Erica M. Lee, Marianne Judd, and Peter Gibbon. 2005. “Posttraumatic Stress Disorder and General Psychopathology in Children and Adolescents Following a Wildfire Disaster.” The Canadian Journal of Psychiatry 50 (3): 137–43.
Meyer, Michael, Adjo Amekudzi, and John O’Har. 2010. “Transportation Asset Management Systems and Climate Change: Adaptive Systems Management Approach.” Transportation Research Record: Journal of the Transportation Research Board, no. 2160: 12–20.
Miller, Norman L., Kathy E. Bashford, and Eric Strem. 2003. “POTENTIAL IMPACTS OF CLIMATE CHANGE ON CALIFORNIA HYDROLOGY.” Journal of the American Water Resources Association 39 (4): 771–84.
Miller, Norman L., and Nicole J. Schlegel. 2006. “Climate Change Projected Fire Weather Sensitivity: California Santa Ana Wind Occurrence.” Geophysical Research Letters 33 (15). https://doi.org/10.1029/2006gl025808.
Miller, Stephen R. 2013. “Sustainable Cities of Tomorrow: A Land Use Response to Climate Change,” July. https://papers.ssrn.com/sol3/papers.cfm?abstract_id=2346405.
Mini, C., T. S. Hogue, and S. Pincetl. 2014a. “Estimation of Residential Outdoor Water Use in Los Angeles, California.” Landscape and Urban Planning 127: 124–35.

Fourth Climate Change Assessment Los Angeles Region | 86
CALIFORNIA’S FOURTH
CLIMATE CHANGE ASSESSMENT
CALIFORNIA’S FOURTH
CLIMATE CHANGE ASSESSMENT
———. 2014b. “Estimation of Residential Outdoor Water Use in Los Angeles, California.” Landscape and Urban Planning 127: 124–35.
———. 2014c. “Patterns and Controlling Factors of Residential Water Use in Los Angeles, California.” Water Policy 16 (6): 1054–69.
Minkler, M., & Wallerstein, N. (2003). Community based participatory research for health. San Francisco, CA : Jossey-Bass. Retrieved from https://trove.nla.gov.au/version/46586587
Mitchell, Todd P., and Warren Blier. 1997. “The Variability of Wintertime Precipitation in the Region of California.” Journal of Climate 10 (9): 2261–76.
Mohegh, Arash, Pablo Rosado, Ling Jin, Dev Millstein, Ronnen Levinson, and George Ban-Weiss. 2017. “Modeling the Climate Impacts of Deploying Solar Reflective Cool Pavements in California Cities.” Journal of Geophysical Research, D: Atmospheres 122 (13): 6798–6817.
Moritz, Max A., Tadashi J. Moody, Meg A. Krawchuk, Mimi Hughes, and Alex Hall. 2010. “Spatial Variation in Extreme Winds Predicts Large Wildfire Locations in Chaparral Ecosystems.” Geophysical Research Letters 37 (4). https://doi.org/10.1029/2009gl041735.
Morton, Lois Wright, Natalia Peres, Clyde Fraisse, and Mark Gleason. 2017. Climate, Weather and Strawberries. Sociology Technical Report 1047. Department of Sociology, Iowa State University, Ames, Iowa. 16 pp.
Moser, S. C. (2013). Navigating the political and emotional terrain of adaptation: Community engagement when climate change comes home. InL Moser SC, Boykoff MT (eds.). Successful adaptation to climate change: Linking science and policy in a rapidly changing world. New York, NY: Routledge. pp. 289–305.
Mote, Philip W., David E. Rupp, Sihan Li, Darrin J. Sharp, Friederike Otto, Peter F. Uhe, Mu Xiao, Dennis P. Lettenmaier, Heidi Cullen, and Myles R. Allen. 2016. “Perspectives on the Causes of Exceptionally Low 2015 Snowpack in the Western United States.” Geophysical Research Letters 43 (20): 10,980–10,988.
Muchnick, Barry Ross. 2007. “Planting Nature: Trees and the Manipulation of Environmental Stewardship in America. By Shaul E. Cohen (Berkeley, University of California Press, 2004) 210 Pp. $34.95.” The Journal of Interdisciplinary History 37 (4): 643–44.
Musselman, Keith N., Noah P. Molotch, and Steven A. Margulis. 2017. “Snowmelt Response to Simulated Warming across a Large Elevation Gradient, Southern Sierra Nevada, California.” The Cryosphere 11 (6): 2847–66.
Myers, Norman, Russell A. Mittermeier, Cristina G. Mittermeier, Gustavo A. B. da Fonseca, and Jennifer Kent. 2000. “Biodiversity Hotspots for Conservation Priorities.” Nature 403 (6772): 853–58.
Nahlik, Matthew J., and Mikhail V. Chester. 2014a. “Transit-Oriented Smart Growth Can Reduce Life-Cycle Environmental Impacts and Household Costs in Los Angeles.” Transport Policy 35 (September): 21–30.
———. 2014b. “Transit-Oriented Smart Growth Can Reduce Life-Cycle Environmental Impacts and Household Costs in Los Angeles.” Transport Policy 35 (September): 21–30.

Fourth Climate Change Assessment Los Angeles Region | 87
CALIFORNIA’S FOURTH
CLIMATE CHANGE ASSESSMENT
CALIFORNIA’S FOURTH
CLIMATE CHANGE ASSESSMENT
Neelin, J. David, J. David Neelin, Baird Langenbrunner, Joyce E. Meyerson, Alex Hall, and Neil Berg. 2013. “California Winter Precipitation Change under Global Warming in the Coupled Model Intercomparison Project Phase 5 Ensemble.” Journal of Climate 26 (17): 6238–56.
Neiman, Paul J., F. Martin Ralph, Gary A. Wick, Jessica D. Lundquist, and Michael D. Dettinger. 2008. “Meteorological Characteristics and Overland Precipitation Impacts of Atmospheric Rivers Affecting the West Coast of North America Based on Eight Years of SSM/I Satellite Observations.” Journal of Hydrometeorology 9 (1): 22–47.
Neria, Y., A. Nandi, and S. Galea. 2008. “Post-Traumatic Stress Disorder Following Disasters: A Systematic Review.” Psychological Medicine 38 (4): 467–80.
Newbold, Tim, Lawrence N. Hudson, Andrew P. Arnell, Sara Contu, Adriana De Palma, Simon Ferrier, Samantha L. L. Hill, et al. 2016. “Has Land Use Pushed Terrestrial Biodiversity beyond the Planetary Boundary? A Global Assessment.” Science 353 (6296): 288–91.
O’Neill, Andrea, Li Erikson, Patrick Barnard, Patrick Limber, Sean Vitousek, Jonathan Warrick, Amy Foxgrover, and Jessica Lovering. 2018. “Projected 21st Century Coastal Flooding in the Southern California Bight. Part 1: Development of the Third Generation CoSMoS Model.” Journal of Marine Science and Engineering 6 (2): 59.
Orsi, Jared. 2004. Hazardous Metropolis: Flooding and Urban Ecology in Los Angeles. Univ of California Press.
Ostro, Bart D., Lindsey A. Roth, Rochelle S. Green, and Rupa Basu. 2009. “Estimating the Mortality Effect of the July 2006 California Heat Wave.” Environmental Research 109 (5): 614–19.
Parisien, Marc-André, and Max A. Moritz. 2009. “Environmental Controls on the Distribution of Wildfire at Multiple Spatial Scales.” Ecological Monographs 79 (1): 127–54.
Parmesan, Camille, and Gary Yohe. 2003. “A Globally Coherent Fingerprint of Climate Change Impacts across Natural Systems.” Nature 421 (6918): 37–42.
Pastor M, and Morello-Frosch R. 2014. Integrating Public Health and Community Development To Tackle Neighborhood Distress And Promote Well-Being. Health Affairs. Chevy Chase 33 (11): 1890–96.
Pataki, Diane E., Heather R. McCarthy, Elizaveta Litvak, and Stephanie Pincetl. 2011a. “Transpiration of Urban Forests in the Los Angeles Metropolitan Area.” Ecological Applications: A Publication of the Ecological Society of America 21 (3): 661–77.
———. 2011b. “Transpiration of Urban Forests in the Los Angeles Metropolitan Area.” Ecological Applications: A Publication of the Ecological Society of America 21 (3): 661–77.
Pathak, Tapan, Mahesh Maskey, Jeffery Dahlberg, Faith Kearns, Khaled Bali, and Daniele Zaccaria. 2018. “Climate Change Trends and Impacts on California Agriculture: A Detailed Review.” Agronomy 8 (3): 25.
Payne, Ashley E., and Gudrun Magnusdottir. 2014. “Dynamics of Landfalling Atmospheric Rivers over the North Pacific in 30 Years of MERRA Reanalysis.” Journal of Climate 27 (18): 7133–50.

Fourth Climate Change Assessment Los Angeles Region | 88
CALIFORNIA’S FOURTH
CLIMATE CHANGE ASSESSMENT
CALIFORNIA’S FOURTH
CLIMATE CHANGE ASSESSMENT
Pendleton, Linwood, et al., 2012. Size matters: The economic value of beach erosion and nourishment in Southern California. Contemporary Economic Policy, 30(2), 223-237.
Peperzak, Louis. 2003. “Climate Change and Harmful Algal Blooms in the North Sea.” Acta Oecologica 24: S139–44.
Peterson, Seth H., Max A. Moritz, Marco E. Morais, Philip E. Dennison, and Jean M. Carlson. 2013. “Modelling Long-Term Fire Regimes of Southern California Shrublands.” International Journal of Wildland Fire 20 (1): 1.
Pettorelli, Nathalie. 2013. The Normalized Difference Vegetation Index.
Pfister, G. G., S. Walters, J-F Lamarque, J. Fast, M. C. Barth, J. Wong, J. Done, G. Holland, and C. L. Bruyère. 2014. “Projections of Future Summertime Ozone over the U.S.” Journal of Geophysical Research, D: Atmospheres 119 (9): 5559–82.
Pickett, S. T. A., M. L. Cadenasso, J. M. Grove, Christopher G. Boone, Peter M. Groffman, Elena Irwin, Sujay S. Kaushal, et al. 2011. “Urban Ecological Systems: Scientific Foundations and a Decade of Progress.” Journal of Environmental Management 92 (3): 331–62.
Pickett, S. T. A., M. L. Cadenasso, J. M. Grove, C. H. Nilon, R. V. Pouyat, W. C. Zipperer, and R. Costanza. 2001. “Urban Ecological Systems: Linking Terrestrial Ecological, Physical, and Socioeconomic Components of Metropolitan Areas.” Annual Review of Ecology and Systematics 32 (1): 127–57.
Pierce, David W., Daniel R. Cayan, and Bridget L. Thrasher. 2014. “Statistical Downscaling Using Localized Constructed Analogs (LOCA)*.” Journal of Hydrometeorology 15 (6): 2558–85.
Pierce, David W., Tapash Das, Daniel R. Cayan, Edwin P. Maurer, Norman L. Miller, Yan Bao, M. Kanamitsu, et al. 2012. “Probabilistic Estimates of Future Changes in California Temperature and Precipitation Using Statistical and Dynamical Downscaling.” Climate Dynamics 40 (3-4): 839–56.
Pincetl, Stephanie. 2010a. “Implementing Municipal Tree Planting: Los Angeles Million-Tree Initiative.” Environmental Management 45 (2): 227–38.
———. 2010b. “Implementing Municipal Tree Planting: Los Angeles Million-Tree Initiative.” Environmental Management 45 (2): 227–38.
Pincetl, Stephanie, Erik Porse, and Deborah Cheng. 2016. “Fragmented Flows: Water Supply in Los Angeles County.” Environmental Management 58 (2): 208–22.
Pincetl S, Gillespie T.W., Pataki D., Porse E., Jia S., Kidera E., Nobles N. Choi DH. 2017. Evaluating the effects of turf-replacement programs in Los Angeles County. The Metropolitan Water District of Southern California’s Incentive Program. 2017. A report to the Metropolitan Water District of Southern California. July. California Center for Sustainable Communities, Institute of the Environment and Sustainability, UCLA.
Pincetl S., Rundel P.W., De Blasio J.C., Silver D., Scott T., Keeley J.E., Halsey R. 2008. Its the land use, not the fuels: Fires and land development in Southern California. Real Estate Review. 37: 25-42.

Fourth Climate Change Assessment Los Angeles Region | 89
CALIFORNIA’S FOURTH
CLIMATE CHANGE ASSESSMENT
CALIFORNIA’S FOURTH
CLIMATE CHANGE ASSESSMENT
Polade, Suraj D., David W. Pierce, Daniel R. Cayan, Alexander Gershunov, and Michael D. Dettinger. 2014. “The Key Role of Dry Days in Changing Regional Climate and Precipitation Regimes.” Scientific Reports 4 (1). https://doi.org/10.1038/srep04364.
Pomerantz, Melvin, Pablo J. Rosado, and Ronnen Levinson. 2015. “A Simple Tool for Estimating City-Wide Annual Electrical Energy Savings from Cooler Surfaces.” Urban Climate 14: 315–25.
Porse, Erik (under review). 2018. “Merging Systems Analysis and Network Governance for Urban Water Resources.” Under Review. Civil Engineering and Environmental Systems.
Porse, Erik, Madelyn Glickfeld, Keith Mertan, and Stephanie Pincetl. 2015. “Pumping for the Masses: Evolution of Groundwater Management in Metropolitan Los Angeles.” GeoJournal 81 (5): 793–809.
Porse, Erik, Kathryn B. Mika, Elizaveta Litvak, Kimberly F. Manago, Terri S. Hogue, Mark Gold, Diane E. Pataki, and Stephanie Pincetl. 2018. “The Economic Value of Local Water Supplies in Los Angeles.” Nature Sustainability 1 (6): 289–97.
Porse, Erik, Kathryn B. Mika, Elizaveta Litvak, Kimberly F. Manago, Kartiki Naik, Madelyn Glickfeld, Terri S. Hogue, Mark Gold, Diane E. Pataki, and Stephanie Pincetl. 2017. “Systems Analysis and Optimization of Local Water Supplies in Los Angeles.” Journal of Water Resources Planning and Management 143 (9): 04017049.
Porse, Erik, Kathryn B. Mika, Rhianna Williams, Mark Gold, William Blomquist, and Stephanie Pincetl. 2018. “Groundwater Exchange Pools and Urban Water Supply Sustainability: Modeling Directed and Undirected Networks.” Journal of Water Resources Planning and Management 144 (8): 04018040.
Post, Ellen S., Anne Grambsch, Chris Weaver, Philip Morefield, Jin Huang, Lai-Yung Leung, Christopher G. Nolte, et al. 2012. “Variation in Estimated Ozone-Related Health Impacts of Climate Change due to Modeling Choices and Assumptions.” Environmental Health Perspectives 120 (11): 1559–64.
Pryor, S. C., and R. J. Barthelmie. 2010. “Climate Change Impacts on Wind Energy: A Review.” Renewable and Sustainable Energy Reviews 14 (1): 430–37.
Purkey, D. R., B. Joyce, S. Vicuna, M. W. Hanemann, L. L. Dale, D. Yates, and J. A. Dracup. 2007. “Robust Analysis of Future Climate Change Impacts on Water for Agriculture and Other Sectors: A Case Study in the Sacramento Valley.” Climatic Change 87 (S1): 109–22.
Radke, J.D, G.S. Biging, K. Roverts, M. Schmidt-Poolman, H. Foster, E. Roe, Y. Ju, S. Lindbergh, T. Beach, L. Maier, Y. He, M. Ashenfarb, P. Norton, M. Wray, A. Alruheil, S. Yi, R. Rau, J. Collins, D. Radke, M. Coufal, S. Marx, D. Moanga, V. Ulyashin, A. Dalal. (University of California, Berkeley). 2018. Assessing Extreme Weather-Related Vulnerability and Identifying Resilience Options for California’s Independent Transportation Fuel Sector. California’s Fourth Climate Change Assessment, California Energy Commission. Publication Number: CCCA4-CEC-2018-012.
Ralph, F. Martin, F. Martin Ralph, Paul J. Neiman, Gary A. Wick, Seth I. Gutman, Michael D. Dettinger, Daniel R. Cayan, and Allen B. White. 2006. “Flooding on California’s Russian River: Role of Atmospheric Rivers.” Geophysical Research Letters 33 (13). https://doi.org/10.1029/2006gl026689.
Fourth Climate Change Assessment Los Angeles Region | 90
CALIFORNIA’S FOURTH
CLIMATE CHANGE ASSESSMENT
CALIFORNIA’S FOURTH
CLIMATE CHANGE ASSESSMENT
Rasmussen, D. J., Jianlin Hu, Abdullah Mahmud, and Michael J. Kleeman. 2013. “The Ozone-Climate Penalty: Past, Present, and Future.” Environmental Science & Technology 47 (24): 14258–66.
Rastogi, Bharat, A. Park Williams, Douglas T. Fischer, Sam F. Iacobellis, Kathryn McEachern, Leila Carvalho, Charles Jones, Sara A. Baguskas, and Christopher J. Still. 2016. “Spatial and Temporal Patterns of Cloud Cover and Fog Inundation in Coastal California: Ecological Implications.” Earth Interactions 20 (15): 1–19.
Reed, Daniel, Libe Washburn, Andrew Rassweiler, Robert Miller, Tom Bell, and Shannon Harrer. 2016. “Extreme Warming Challenges Sentinel Status of Kelp Forests as Indicators of Climate Change.” Nature Communications 7 (December): 13757.
Reid, Colleen E., Marie S. O’Neill, Carina J. Gronlund, Shannon J. Brines, Daniel G. Brown, Ana V. Diez-Roux, and Joel Schwartz. 2009a. “Mapping Community Determinants of Heat Vulnerability.” Environmental Health Perspectives 117 (11): 1730–36.
———. 2009b. “Mapping Community Determinants of Heat Vulnerability.” Environmental Health Perspectives 117 (11): 1730–36.
Riggs, Margaret A., Carol Y. Rao, Clive M. Brown, David Van Sickle, Kristin J. Cummings, Kevin H. Dunn, James A. Deddens, et al. 2008. “Resident Cleanup Activities, Characteristics of Flood-Damaged Homes and Airborne Microbial Concentrations in New Orleans, Louisiana, October 2005.” Environmental Research 106 (3): 401–9.
Riordan, Erin C., Thomas W. Gillespie, Lincoln Pitcher, Stephanie S. Pincetl, G. Darrel Jenerette, and Diane E. Pataki. 2014. “Threats of Future Climate Change and Land Use to Vulnerable Tree Species Native to Southern California.” Environmental Conservation 42 (02): 127–38.
Riordan, Erin C., and Philip W. Rundel. 2009. “Modelling the Distribution of a Threatened Habitat: The California Sage Scrub.” Journal of Biogeography 36 (11): 2176–88.
Rolshausen, Philippe E.; Mary Lu Arpaia; and Ben Faber. 2015. “High Density Planting for Avocado Production: A Chilean Perspective.” From The Grove, Fall 2016. California Avocado Commission. http://ucanr.edu/sites/Rolshausen/files/248917.pdf
Rudolph L, Gould S, Berko J. Climate Change, Health, and Equity: Opportunities for Action. 2015. Public Health Institute, Oakland, CA.
Rundel, Philip W. 2018. “California Chaparral and Its Global Significance.” In Springer Series on Environmental Management, 1–27.
Sacks, Jason D., Lindsay Wichers Stanek, Thomas J. Luben, Douglas O. Johns, Barbara J. Buckley, James S. Brown, and Mary Ross. 2011. “Particulate Matter-Induced Health Effects: Who Is Susceptible?” Environmental Health Perspectives 119 (4): 446–54.
Sadd JL, Pastor M, Morello–Frosch R, Scoggins J, Jesdale B. Playing it Safe: Assessing Cumulative Impact and Social Vulnerability through an Environmental Justice Screening Method in the South Coast Air Basin, California. International Journal of Environmental Research and Public Health. 2011. 8:1441–1159.

Fourth Climate Change Assessment Los Angeles Region | 91
CALIFORNIA’S FOURTH
CLIMATE CHANGE ASSESSMENT
CALIFORNIA’S FOURTH
CLIMATE CHANGE ASSESSMENT
Sailor, D. 1997. “Sensitivity of Electricity and Natural Gas Consumption to Climate in the U.S.A.—Methodology and Results for Eight States.” Energy 22 (10): 987–98.
———. 2003. “Air Conditioning Market Saturation and Long-Term Response of Residential Cooling Energy Demand to Climate Change.” Energy 28 (9): 941–51.
Santamouris, M. 2013. “Using Cool Pavements as a Mitigation Strategy to Fight Urban Heat island—A Review of the Actual Developments.” Renewable and Sustainable Energy Reviews 26 (October): 224–40.
Sathaye, J. A., L. L. Dale, P. H. Larsen, G. A. Fitts, K. Koy, S. M. Lewis, and Andre Frossard Pereira de Lucena. 2013. “Rising Temps, Tides, and Wildfires: Assessing the Risk to California’s Energy Infrastructure from Projected Climate Change.” IEEE Power and Energy Magazine 11 (3): 32–45.
Schneider, E., R. A. Hajjeh, R. A. Spiegel, R. W. Jibson, E. L. Harp, G. A. Marshall, R. A. Gunn, et al. 1997. “A Coccidioidomycosis Outbreak Following the Northridge, Calif, Earthquake.” JAMA: The Journal of the American Medical Association 277 (11): 904–8.
Schroeder, Heike, and Harriet Bulkeley. 2009. “Global Cities and the Governance of Climate Change: What Is the Role of Law in Cities.” Fordham Urb. LJ 36: 313.
Schwartz B, Terashita D. 2017. Increased Coccidioidomycosis (“Valley Fever”) in Los Angeles County. Rx for Prevention, July-August 2017. Retrieved from http://rx.ph.lacounty.gov/RxCocci0717#cocciref1
Schwartz, Henry G., Michael Meyer, Cynthia J. Burbank, Michael Kuby, Clinton Oster, John Posey, Edmond J. Russo, and Arthur Rypinski. 2014. “Ch. 5: Transportation.” In Climate Change Impacts in the United States: The Third National Climate Assessment, edited by Jerry M. Melillo, Terese (T C) Richmond, and Gary W. Yohe, 130–49. U.S. Global Change Research Program.
Shamasunder B, Collier-Oxandale A, Blickley J, Sadd J, Chan M, Navarro S, Hannigan M, Wong Nicole J. 2018. Community-Based Health and Exposure Study around Urban Oil Developments in South Los Angeles. International Journal of Environmental Research and Public Health. January 15, 2018 www.mdpi.com/1660-4601/15/1/138/pdf (accessed March 7, 2018)
Seager, Richard, Martin Hoerling, Siegfried Schubert, Hailan Wang, Bradfield Lyon, Arun Kumar, Jennifer Nakamura, and Naomi Henderson. 2014. Causes and Predictability of the 2011-14 California Drought: Assessment Report.
———. 2015. “Causes of the 2011–14 California Drought*.” Journal of Climate 28 (18): 6997–7024.
Sheng, Jingfen, and John P. Wilson. 2008. “Watershed Urbanization and Changing Flood Behavior across the Los Angeles Metropolitan Region.” Natural Hazards 48 (1): 41–57.
———. 2009. “Watershed Urbanization and Changing Flood Behavior across the Los Angeles Metropolitan Region.” Natural Hazards 48 (1): 41–57.
Sherwood, S., and Q. Fu. 2014. “A Drier Future?” Science 343 (6172): 737–39.

Fourth Climate Change Assessment Los Angeles Region | 92
CALIFORNIA’S FOURTH
CLIMATE CHANGE ASSESSMENT
CALIFORNIA’S FOURTH
CLIMATE CHANGE ASSESSMENT
Shiflett, Sheri A., Liyin L. Liang, Steven M. Crum, Gudina L. Feyisa, Jun Wang, and G. Darrel Jenerette. 2017. “Variation in the Urban Vegetation, Surface Temperature, Air Temperature Nexus.” The Science of the Total Environment 579 (February): 495–505.
Shirzaei, Manoochehr, and Roland Bürgmann. 2018. “Global Climate Change and Local Land Subsidence Exacerbate Inundation Risk to the San Francisco Bay Area.” Science Advances 4 (3): eaap9234.
Shonkoff, Seth B., Rachel Morello-Frosch, Manuel Pastor, and James Sadd. 2011a. “The Climate Gap: Environmental Health and Equity Implications of Climate Change and Mitigation Policies in California—a Review of the Literature.” Climatic Change 109 (1): 485–503.
———. 2011b. “The Climate Gap: Environmental Health and Equity Implications of Climate Change and Mitigation Policies in California—a Review of the Literature.” Climatic Change 109 (1): 485–503.
Shuster, W. D., J. Bonta, H. Thurston, E. Warnemuende, and D. R. Smith. 2005. “Impacts of Impervious Surface on Watershed Hydrology: A Review.” Urban Water Journal 2 (4): 263–75.
Simons, G. and J. McCabe (2005) “California Solar Resources”. CEC-500-2005-072-D, http://www.energy.ca.gov/2005publications/CEC-500-2005-072/CEC-500-2005-072-D.PDF
Smith, Jayson R., Peggy Fong, and Richard F. Ambrose. 2006. “Dramatic Declines in Mussel Bed Community Diversity: Response to Climate Change?” Ecology 87 (5): 1153–61.
Smith, P.E. (1995): A warm decade in the southern California Bight. CalCOFI Report, Vol.36, 1995, pp 120-126. http://calcofi.org/publications/calcofireports/v36/Vol_36_Smith_1.pdf
Smoyer-Tomic, Karen E., Robyn Kuhn, and Alana Hudson. 2003. “Heat Wave Hazards: An Overview of Heat Wave Impacts in Canada.” Natural Hazards 28 (2-3): 465–86.
Soule (et al), M. n.d. Reconstructed Dynamics of Rapid Extinctions of Chaparral-Requiring Birds in Urban Habitat Islands.
Soulé, M. E., Bolger, D. T., Alberts, A. C., Wrights, J., Sorice, M., & Hill, S. 1988. Reconstructed dynamics of rapid extinctions of chaparral‐requiring birds in urban habitat islands. Conservation Biology 2(1): 75-92.
Spang, Edward S., Andrew J. Holguin, and Frank J. Loge. 2018. “The Estimated Impact of California’s Urban Water Conservation Mandate on Electricity Consumption and Greenhouse Gas Emissions.” Environmental Research Letters: ERL [Web Site] 13 (1): 014016.
Spang, Edward S., and Frank J. Loge. 2015. “A High-Resolution Approach to Mapping Energy Flows through Water Infrastructure Systems.” Journal of Industrial Ecology 19 (4): 656–65.
Spracklen, D. V., L. J. Mickley, J. A. Logan, R. C. Hudman, R. Yevich, M. D. Flannigan, and A. L. Westerling. 2009. “Impacts of Climate Change from 2000 to 2050 on Wildfire Activity and Carbonaceous Aerosol Concentrations in the Western United States.” Journal of Geophysical Research 114 (D20). https://doi.org/10.1029/2008jd010966.
Fourth Climate Change Assessment Los Angeles Region | 93
CALIFORNIA’S FOURTH
CLIMATE CHANGE ASSESSMENT
CALIFORNIA’S FOURTH
CLIMATE CHANGE ASSESSMENT
Sriver, Ryan L., Robert J. Lempert, Per Wikman-Svahn, and Klaus Keller. 2018. “Characterizing Uncertain Sea-Level Rise Projections to Support Investment Decisions.” PloS One 13 (2): e0190641.
State of California. n.d. “Urban Heat Island Interactive Maps | CalEPA.” Accessed February 28, 2018. https://calepa.ca.gov/climate/urban-heat-island-index-for-california/urban-heat-island-interactive-maps/.
State of California, Department of Justice, Office of the Attorney General. Environmental Justice at the Local and Regional Level Legal Background Updated July 10, 2012. (https://oag.ca.gov/sites/all/files/agweb/pdfs/environment/ej_fact_sheet.pdf (accessed March 7, 2018)
State of California. Gov. Code, § 65040.12, subd. (e). https://leginfo.legislature.ca.gov/faces/codes_displaySection.xhtml?lawCode=GOV§ionNum=65040.12. (accessed March 7, 2018)
Steiner, Allison L., Shaheen Tonse, Ronald C. Cohen, Allen H. Goldstein, and Robert A. Harley. 2006. “Influence of Future Climate and Emissions on Regional Air Quality in California.” Journal of Geophysical Research 111 (D18). https://doi.org/10.1029/2005jd006935.
Stoms, David, Guido Franco, Heather Raitt, Susan Wilhelm, Sekita Grant. 2013. Climate Change and the California Energy Sector. California Energy Commission. Publication Number CEC‐100‐2013‐002.
Stone, Brian, Jeremy J. Hess, and Howard Frumkin. 2010. “Urban Form and Extreme Heat Events: Are Sprawling Cities More Vulnerable to Climate Change than Compact Cities?” Environmental Health Perspectives 118 (10): 1425–28.
Sun, Fengpeng, Daniel B. Walton, and Alex Hall. 2015. “A Hybrid Dynamical–Statistical Downscaling Technique. Part II: End-of-Century Warming Projections Predict a New Climate State in the Los Angeles Region.” Journal of Climate 28 (12): 4618–36.
Swain, D.L., B. Langenbrunner, J.D. Neelin, and A. Hall, “Increasing precipitation volatility in 21st century California” (in press, Nature Climate Change, 2018).
Swain, Daniel L. 2015. “A Tale of Two California Droughts: Lessons amidst Record Warmth and Dryness in a Region of Complex Physical and Human Geography.” Geophysical Research Letters 42 (22): 9999–10,003.
Swain, Daniel L., Daniel E. Horton, Deepti Singh, and Noah S. Diffenbaugh. 2016. “Trends in Atmospheric Patterns Conducive to Seasonal Precipitation and Temperature Extremes in California.” Science Advances 2 (4): e1501344.
Sweet, William Vanderveer. 2017. Global and Regional Sea Level Rise Scenarios for the United States.
Syphard, Alexandra D., Teresa J. Brennan, and Jon E. Keeley. 2017. “The Importance of Building Construction Materials Relative to Other Factors Affecting Structure Survival during Wildfire.” International Journal of Disaster Risk Reduction 21: 140–47.
———. 2018. “Chaparral Landscape Conversion in Southern California.” In Springer Series on Environmental Management, 323–46.
Fourth Climate Change Assessment Los Angeles Region | 94
CALIFORNIA’S FOURTH
CLIMATE CHANGE ASSESSMENT
CALIFORNIA’S FOURTH
CLIMATE CHANGE ASSESSMENT
Syphard, Alexandra D., Jon E. Keeley, and Teresa J. Brennan. 2011. “Factors Affecting Fuel Break Effectiveness in the Control of Large Fires on the Los Padres National Forest, California.” International Journal of Wildland Fire 20 (6): 764.
Syphard, Alexandra D., Jon E. Keeley, Anne H. Pfaff, and Ken Ferschweiler. 2017. “Human Presence Diminishes the Importance of Climate in Driving Fire Activity across the United States.” Proceedings of the National Academy of Sciences 114 (52): 13750–55.
Syphard, Alexandra D., Volker C. Radeloff, Jon E. Keeley, Todd J. Hawbaker, Murray K. Clayton, Susan I. Stewart, and Roger B. Hammer. 2007. “Human Influence on California Fire Regimes.” Ecological Applications: A Publication of the Ecological Society of America 17 (5): 1388–1402.
Taha, Haider. 1997a. “Modeling the Impacts of Large-Scale Albedo Changes on Ozone Air Quality in the South Coast Air Basin.” Atmospheric Environment 31 (11): 1667–76.
———. 1997b. “Urban Climates and Heat Islands: Albedo, Evapotranspiration, and Anthropogenic Heat.” Energy and Buildings 25 (2): 99–103.
———. 2008a. “Meso-Urban Meteorological and Photochemical Modeling of Heat Island Mitigation.” Atmospheric Environment 42 (38): 8795–8809.
———. 2008b. “Urban Surface Modification as a Potential Ozone Air-Quality Improvement Strategy in California: A Mesoscale Modelling Study.” Boundary-Layer Meteorology 127 (2): 219–39.
———. 2015a. “Cool Cities: Counteracting Potential Climate Change and Its Health Impacts.” Current Climate Change Reports 1 (3): 163–75.
———. 2015b. “Meteorological, Air-Quality, and Emission-Equivalence Impacts of Urban Heat Island Control in California.” Sustainable Cities and Society 19: 207–21.
Taha, Haider, Steven Konopacki, and Hashem Akbari. 1998. “Impacts of Lowered Urban Air Temperatures on Precursor Emission and Ozone Air Quality.” Journal of the Air & Waste Management Association 48 (9): 860–65.
Taleghani, Mohammad, David Sailor, and George A. Ban-Weiss. 2016a. “Micrometeorological Simulations to Predict the Impacts of Heat Mitigation Strategies on Pedestrian Thermal Comfort in a Los Angeles Neighborhood.” Environmental Research Letters: ERL [Web Site] 11 (2): 024003.
———. 2016b. “Micrometeorological Simulations to Predict the Impacts of Heat Mitigation Strategies on Pedestrian Thermal Comfort in a Los Angeles Neighborhood.” Environmental Research Letters: ERL [Web Site] 11 (2): 024003.
Tanaka, Stacy K., Tingju Zhu, Jay R. Lund, Richard E. Howitt, Marion W. Jenkins, Manuel A. Pulido, Mélanie Tauber, Randall S. Ritzema, and Inês C. Ferreira. 2006. “Climate Warming and Water Management Adaptation for California.” Climatic Change 76 (3-4): 361–87.
Tebaldi, C., B. H. Strauss, and C. E. Zervas 2012, Modelling sea level rise impacts on storm surges along US coasts, Environmental Research Letters, 7(1), 014032.

Fourth Climate Change Assessment Los Angeles Region | 95
CALIFORNIA’S FOURTH
CLIMATE CHANGE ASSESSMENT
CALIFORNIA’S FOURTH
CLIMATE CHANGE ASSESSMENT
Tegner, M.J., P. Dayton, P. Edwards, and K. Riser,1996: long-term change in kelp forests. CalCOFl Rep., Vol. 37, pp 111-126. http://calcofi.org/publications/calcofireports/v37/Vol_37_Tegner_etal.pdf
Thorne, Karen, Glen MacDonald, Glenn Guntenspergen, Richard Ambrose, Kevin Buffington, Bruce Dugger, Chase Freeman, et al. 2018. “U.S. Pacific Coastal Wetland Resilience and Vulnerability to Sea-Level Rise.” Science Advances 4 (2): eaao3270.
Thorne, Karen M., Glen M. MacDonald, Rich F. Ambrose, Kevin J. Buffington, Chase M. Freeman, Christopher N. Janousek, Lauren N. Brown, et al. 2016. “Effects of Climate Change on Tidal Marshes along a Latitudinal Gradient in California.” Open-File Report. https://doi.org/10.3133/ofr20161125.
Tiitanen, P., K. l. Timonen, J. J. Ruskanen, A. Mirme, and J. Pekkanen. 1999. “Fine Particulate Air Pollution, Resuspended Road Dust and Respiratory Health among Symptomatic Children.” The European Respiratory Journal: Official Journal of the European Society for Clinical Respiratory Physiology 13 (2): 266–73.
Trenberth, K. E. 2011. “Changes in Precipitation with Climate Change.” Climate Research 47 (1): 123–38.
Trumble, John T., and Casey D. Butler. 2008. “Climate Change Will Exacerbate California’s Insect Pest Problems.” California Agriculture 63 (2): 73–78.
Tsuzuki-Hayakawa, Kazuyo, Yutaka Tochihara, and Tadakatsu Ohnaka. 1995. “Thermoregulation during Heat Exposure of Young Children Compared to Their Mothers.” European Journal of Applied Physiology and Occupational Physiology 72 (1-2): 12–17.
Underwood, Emma C., Joshua H. Viers, Kirk R. Klausmeyer, Robin L. Cox, and M. Rebecca Shaw. 2009. “Threats and Biodiversity in the Mediterranean Biome.” Diversity and Distributions 15 (2): 188–97.
United States Environmental Protection Agency. 2013. Integrated Science Assessment for Ozone and Related Photochemical Oxidants. EPA 600/R-10/076F | February 2013. Retrieved from file:///C:/Users/e526794/Downloads/OZONE_FINAL_ISA_2013.PDF
Vahmani, P., and G. Ban-Weiss. 2016. “Climatic Consequences of Adopting Drought-Tolerant Vegetation over Los Angeles as a Response to California Drought.” Geophysical Research Letters 43 (15): 8240–49.
Vahmani, P., F. Sun, A. Hall, and G. Ban-Weiss. 2016. “Investigating the Climate Impacts of Urbanization and the Potential for Cool Roofs to Counter Future Climate Change in Southern California.” Environmental Research Letters: ERL [Web Site] 11 (12): 124027.
Vallianatos M, Shamasunder B, Gottlieb R. 2013. Metrics for Tracking Climate Change Adaptation: A Report to the Los Angeles County Metropolitan Transportation. April 1, 2013. http://scholar.oxy.edu/cgi/viewcontent.cgi?article=1461&context=uep_faculty (accessed March 7, 2018)
Vicuna, S., and J. A. Dracup. 2007. “The Evolution of Climate Change Impact Studies on Hydrology and Water Resources in California.” Climatic Change 82 (3-4): 327–50.
Vicuna, S., R. Leonardson, M. W. Hanemann, L. L. Dale, and J. A. Dracup. 2007. “Climate Change Impacts on High Elevation Hydropower Generation in California’s Sierra Nevada: A Case Study in the Upper American River.” Climatic Change 87 (S1): 123–37.
Fourth Climate Change Assessment Los Angeles Region | 96
CALIFORNIA’S FOURTH
CLIMATE CHANGE ASSESSMENT
CALIFORNIA’S FOURTH
CLIMATE CHANGE ASSESSMENT
Vilchis, L. Ignacio, L. Ignacio Vilchis, Mia J. Tegner, James D. Moore, Carolyn S. Friedman, Kristin L. Riser, Thea T. Robbins, and Paul K. Dayton. 2005. “OCEAN WARMING EFFECTS ON GROWTH, REPRODUCTION, AND SURVIVORSHIP OF SOUTHERN CALIFORNIA ABALONE.” Ecological Applications: A Publication of the Ecological Society of America 15 (2): 469–80.
Vitousek, Sean, Patrick L. Barnard, and Patrick Limber. 2017. “Can Beaches Survive Climate Change?” Journal of Geophysical Research: Earth Surface 122 (4): 1060–67.
Vuuren, Detlef P. van, Jae Edmonds, Mikiko Kainuma, Keywan Riahi, Allison Thomson, Kathy Hibbard, George C. Hurtt, et al. 2011. “The Representative Concentration Pathways: An Overview.” Climatic Change 109 (1-2): 5–31.
Wang, Yafei, Frank Bakker, Rudolf de Groot, Heinrich Wortche, and Rik Leemans. 2015. “Effects of Urban Trees on Local Outdoor Microclimate: Synthesizing Field Measurements by Numerical Modelling.” Urban Ecosystems 18 (4): 1305–31.
Warner, Michael D., Clifford F. Mass, and Eric P. Salathé. 2015. “Changes in Winter Atmospheric Rivers along the North American West Coast in CMIP5 Climate Models.” Journal of Hydrometeorology 16 (1): 118–28.
Watts N, Adger WN, Agnolucci P, Blackstock J, Byass P, Cai W, Chaytor S, Colbourn R, Collins M,…Costello A. 2015. Health and climate change: policy response to protect public health. The Lancet 386(10006):7-13.
Westerling, Anthony Leroy. (University of California, Merced). 2018. Wildfire Simulations for the Fourth California Climate Assessment: Projecting Changes in Extreme Wildfire Events with a Warming Climate. California’s Fourth Climate Change Assessment, California Energy Commission. Publication number: CCCA4-CEC-2018-014.
Willems, Patrick, Peter Molnar, Thomas Einfalt, Karsten Arnbjerg-Nielsen, Christian Onof, Van-Thanh-Van Nguyen, and Paolo Burlando. 2012. “Rainfall in the Urban Context: Forecasting, Risk and Climate Change.” Atmospheric Research 103: 1–3.
Williams, A. Park, A. Park Williams, Rachel E. Schwartz, Sam Iacobellis, Richard Seager, Benjamin I. Cook, Christopher J. Still, Gregory Husak, and Joel Michaelsen. 2015. “Urbanization Causes Increased Cloud Base Height and Decreased Fog in Coastal Southern California.” Geophysical Research Letters 42 (5): 1527–36.
Williams, A. Park, A. Park Williams, Richard Seager, John T. Abatzoglou, Benjamin I. Cook, Jason E. Smerdon, and Edward R. Cook. 2015. “Contribution of Anthropogenic Warming to California Drought during 2012-2014.” Geophysical Research Letters 42 (16): 6819–28.
Williams, James H., Andrew DeBenedictis, Rebecca Ghanadan, Amber Mahone, Jack Moore, William R. Morrow 3rd, Snuller Price, and Margaret S. Torn. 2012. “The Technology Path to Deep Greenhouse Gas Emissions Cuts by 2050: The Pivotal Role of Electricity.” Science 335 (6064): 53–59.
Wolstein J, Meng Y-Y, Babey S. 2010. Income disparities in asthma burden and care in California. UCLA Center for Health Policy Research. Retrieved from http://healthpolicy.ucla.edu/publications/Documents/PDF/Income%20Disparities%20in%20Asthma%20Burden%20and%20Care%20in%20California.pdf

Fourth Climate Change Assessment Los Angeles Region | 97
CALIFORNIA’S FOURTH
CLIMATE CHANGE ASSESSMENT
CALIFORNIA’S FOURTH
CLIMATE CHANGE ASSESSMENT
Woodhouse, Connie A., David M. Meko, Glen M. MacDonald, Dave W. Stahle, and Edward R. Cook. 2010. “A 1,200-Year Perspective of 21st Century Drought in Southwestern North America.” Proceedings of the National Academy of Sciences of the United States of America 107 (50): 21283–88.
Yang, Christopher, Sonia Yeh, Saleh Zakerinia, Kalai Ramea, and David McCollum. 2015. “Achieving California’s 80% Greenhouse Gas Reduction Target in 2050: Technology, Policy and Scenario Analysis Using CA-TIMES Energy Economic Systems Model.” Energy Policy 77 (February): 118–30.
Yue, Xu, Loretta J. Mickley, Jennifer A. Logan, and Jed O. Kaplan. 2013. “Ensemble Projections of Wildfire Activity and Carbonaceous Aerosol Concentrations over the Western United States in the Mid-21st Century.” Atmospheric Environment 77 (October): 767–80.
Zalom, F.G.; M.P. Bolda; S.K. Dara; and S. Joseph. “Spider Mites”. In UC IPM Pest Management Guidelines: Strawberry. UC ANR Publication 3468. http://ipm.ucanr.edu/PMG/r734400111.html
Zhang J, Mohegh A, Li Y, Levinson R, Ban-Weiss GA 2018 (in review). Systematic comparison of the influence of cool wall versus cool roof adoption on urban climate in the Los Angeles basin.
Zhao, Lei, Michael Oppenheimer, Qing Zhu, Jane W. Baldwin, Kristie L. Ebi, Elie Bou-Zeid, Kaiyu Guan, and Xu Liu. 2018. “Interactions between Urban Heat Islands and Heat Waves.” Environmental Research Letters: ERL [Web Site] 13 (3): 034003.
Zhao, Zhan, Shu-Hua Chen, Michael J. Kleeman, and Abdullah Mahmud. 2011. “The Impact of Climate Change on Air Quality–Related Meteorological Conditions in California. Part II: Present versus Future Time Simulation Analysis.” Journal of Climate 24 (13): 3362–76.
Zhou, Qianqian, Toke Emil Panduro, Bo Jellesmark Thorsen, and Karsten Arnbjerg-Nielsen. 2013. “Adaption to Extreme Rainfall with Open Urban Drainage System: An Integrated Hydrological Cost-Benefit Analysis.” Environmental Management 51 (3): 586–601.
Zippay, Mackenzie L., and Brian Helmuth. 2012. “Effects of Temperature Change on Mussel, Mytilus.” Integrative Zoology 7 (3): 312–27.
Related Documents