1 LIVE NATION ENTERTAINMENT REPORTS SECOND QUARTER 2016 FINANCIAL RESULTS Highlights (year-over-year): Revenue Up 23% for the Quarter to $2.2 Billion Operating Income Up 76% for the Quarter to $74 Million AOI Up 28% for the Quarter to $181 Million Free Cash Flow Up 22% for the Quarter to $113 Million Concert Ticket Sales for Shows in 2016 Up 17% through Mid-July Sponsorship & Advertising Contracted Net Revenue Up 16% through Mid-July Ticketmaster Global GTV Up 19% in the First Half LOS ANGELES – July 28, 2016 – Live Nation Entertainment (NYSE: LYV) today released financial results for the three and six months ended June 30, 2016. Live Nation delivered accelerated growth in the second quarter, with revenue up 23%, operating income up 76%, adjusted operating income, or AOI, up 28%, and free cash flow up 22%. Each of our core divisions - concerts, advertising and ticketing - contributed to this strong performance, with revenue and AOI up double digits in each business. Our concerts business is our flywheel, attracting 19 million fans to shows globally in the quarter, which in turn also drove AOI growth in our ticketing, advertising and on-site businesses. We have built the industry’s most scalable and unparalleled live platform, bringing over 500 million fans in 40 countries to live events each year. With concert and ticketing sales running well ahead of last year, we are confident that 2016 will be another record year of results for Live Nation overall and for each of our core divisions. Concerts Global Platform Growth Starting with the concerts business, through mid-July we have sold over 50 million tickets for our concerts that take place this year, pacing 17% ahead of this point last year. As a result, in the second quarter we grew revenue by 26%, operating income by $25 million and AOI by 61% in our concerts business. We continue to be by far the leading promoter in the world, having created a business model that is effective at attracting artists from the club to the stadium level, enabling us to then make money in our high margin on-site, ticketing and advertising businesses.

Welcome message from author
This document is posted to help you gain knowledge. Please leave a comment to let me know what you think about it! Share it to your friends and learn new things together.
Transcript
1
LIVE NATION ENTERTAINMENT REPORTS SECOND QUARTER 2016 FINANCIAL RESULTS
Highlights (year-over-year):Revenue Up 23% for the Quarter to $2.2 BillionOperating Income Up 76% for the Quarter to $74 MillionAOI Up 28% for the Quarter to $181 MillionFree Cash Flow Up 22% for the Quarter to $113 MillionConcert Ticket Sales for Shows in 2016 Up 17% through Mid-JulySponsorship & Advertising Contracted Net Revenue Up 16% through Mid-JulyTicketmaster Global GTV Up 19% in the First Half
LOS ANGELES – July 28, 2016 – Live Nation Entertainment (NYSE: LYV) today released financial results for
the three and six months ended June 30, 2016.
Live Nation delivered accelerated growth in the second quarter, with revenue up 23%, operating income up 76%,
adjusted operating income, or AOI, up 28%, and free cash flow up 22%. Each of our core divisions - concerts,
advertising and ticketing - contributed to this strong performance, with revenue and AOI up double digits in each
business.
Our concerts business is our flywheel, attracting 19 million fans to shows globally in the quarter, which in turn
also drove AOI growth in our ticketing, advertising and on-site businesses.
We have built the industry’s most scalable and unparalleled live platform, bringing over 500 million fans in 40
countries to live events each year. With concert and ticketing sales running well ahead of last year, we are
confident that 2016 will be another record year of results for Live Nation overall and for each of our core divisions.
Concerts Global Platform Growth
Starting with the concerts business, through mid-July we have sold over 50 million tickets for our concerts that
take place this year, pacing 17% ahead of this point last year. As a result, in the second quarter we grew revenue
by 26%, operating income by $25 million and AOI by 61% in our concerts business. We continue to be by far the
leading promoter in the world, having created a business model that is effective at attracting artists from the club
to the stadium level, enabling us to then make money in our high margin on-site, ticketing and advertising
businesses.
2
This year we are growing our concerts business across all dimensions, with an 18% increase in confirmed stadium,
arena and amphitheater show count for the year, while also adding more festivals to our portfolio and continuing
to expand our club and theater business. This growth is being delivered both in North America and internationally,
with each projecting mid- to high-single digit growth in fan attendance for the full year.
We have continued to expand our global portfolio, and are now promoting concerts in 40 countries globally. In
the past quarter we added The Governors Ball Music Festival in New York, Parklife Festival outside London, and
secured the long-term management of the Palais Theatre in Melbourne, the city's most iconic concert venue.
At the same time we are seeing the benefits from improving the on-site fan experience. For the quarter, we
delivered double-digit growth in net revenue per fan at our amphitheaters, increasing our contribution margin by
over $2 per fan. Coming on top of last year’s growth of 80 cents per fan, we are seeing the results from improving
our food and beverage offering and expanding our products to provide more options for high-end customers.
And our artist managers continue to be strategic to our overall business, providing a strong global pipeline of
shows and supporting our growth initiatives.
Sponsorship & Advertising Delivered Continued Growth
In the sponsorship & advertising business, we continued delivering strong growth for the quarter, with revenue
up 17%, operating income up 9% and AOI up 12%.
Live Nation's ongoing success in growing its high margin sponsorship & advertising business is based on its
unique scale and breadth in the live experience space. No other advertising platform can match our 60 million
on-site engaged fans along with 80 million monthly unique visitors to our websites, and over 500 million direct
connections with fans attending events each year. From festivals to branded content to exclusive access to tickets
and events, the combined Live Nation concerts and Ticketmaster platforms reach an audience at a level no other
league or online company can match.
As a result, through mid-July, contracted net revenue, our key leading indicator for sponsorship & advertising, is
up 16% and we have sold over 85% of our planned sponsorship & advertising for the year. And because of our
platform's unique positioning and demonstrated effectiveness, our major sponsors continue to renew and expand
their commitment to Live Nation and its platform. As of the end of the second quarter, we had roughly 50 sponsors
projected to spend over $1 million with us this year, with a cumulative spend growth of 18% to over $200 million
for the year.
With both sponsorship and online advertising increasing year-on-year, and a strong pipeline of committed business,
at this point we are confident that we will deliver AOI growth this year consistent with the past several years.
3
Ticketmaster Marketplace Continues to Grow
Ticketmaster is the leading global ticketing marketplace, with over $25 billion in total global gross transaction
value, or GTV, annually for all tickets processed, and after adding five more countries this quarter we now operate
in 27 countries worldwide. This quarter we extended our leadership with 14% growth in total global GTV to $5.7
billion. Our secondary product has delivered GTV growth of over 20% for the ninth consecutive quarter, and it is
up 49% year-on-year in the second quarter, to over $300 million. These then drove Ticketmaster revenue growth
of 23%, operating income growth of 28% and AOI growth of 20% for the quarter.
One key component for continuing Ticketmaster’s growth is opening our marketplace to sell tickets on other
distribution platforms, driving increased conversion and tapping into additional fan bases. Through the deployment
of APIs with key partners such as Facebook, BandsinTown and Broadway.com, along with traditional distribution
partners such as Groupon, we increased sales by 30% in the first half to more than 5 million tickets. Going forward,
we see these and other distribution partners, including teams and artists, as a key way to extend our reach and
continue selling more tickets powered by Ticketmaster.
And another key part of our growth has been building out our overall portfolio of ticketing products to super-serve
specialized vertical segments, notably with Front Gate ticketing serving festivals and TicketWeb serving music
clubs. Through these leading platforms in their respective segments, we have been able to deliver the tailored
product of a specialist while leveraging the overall power of the Ticketmaster marketplace, selling more tickets
and better serving our fans. With this strategy, so far this year in North America we have grown the GTV for our
festival segment by 31% and club business by 12%.
Underlying this success is the continued expansion of our venue client base. During the quarter, we added nearly
400 new clients globally, making us confident that for the seventh consecutive year we will have a net renewal
rate of over 100%. With the TM ONE software platform in full rollout, we are delivering an improved workflow for
the venues while at the same time selling more tickets, pricing them better, and reducing Ticketmaster’s cost
base. As a result of all this, in 2016 we have already had five of the top ten GTV months globally in Ticketmaster’s
history.
As well as Ticketmaster has done this year, I have even greater expectations going forward. Every one of our
ticketing verticals has tremendous runway for global growth. We now have a technology platform which enables
us to deploy web and app products faster and more flexibly, and opening our platform is powering even more
sales. This, combined with a strengthening value proposition to our growing base of venue clients, positions
Ticketmaster for ongoing growth.
4
Summary
After our strong performance in the first half of the year, we expect 2016 to be another year of growth and record
results for the company. Based on our leading indicators in concerts, sponsorship & advertising, and ticketing,
we expect revenue and AOI growth in each of these businesses and overall for Live Nation this year.
Michael RapinoPresident and Chief Executive OfficerLive Nation Entertainment, Inc.
Data above listed as "Mid-July" is as of July 18, 2016.
Photos by Getty Images: Beyoncé - Ethan Miller, Coldplay - Viktor Chlad/isifa, Rihanna - Thomas Starke
The company will webcast a teleconference today at 5:00 p.m. Eastern Time to discuss its financial performance. Interested parties should visit the Events & Webcasts section of the company’s website at investors.livenationentertainment.com to listen to the webcast. Supplemental statistical and financial information to be provided on the call, if any, will be available under the Reports section at the same link. A replay of the webcast will also be available on the Live Nation website.
About Live Nation Entertainment: Live Nation Entertainment, Inc. (NYSE: LYV), or Live Nation, is the world’s leading live entertainment companycomprised of global market leaders: Ticketmaster, Live Nation Concerts, Live Nation Media & Sponsorship andArtist Nation Management. For additional information, visit investors.livenationentertainment.com.
Investor Contact: Media Contact:Maili Bergman Carrie Davis(310) 867-7143 (310) [email protected] [email protected]
5
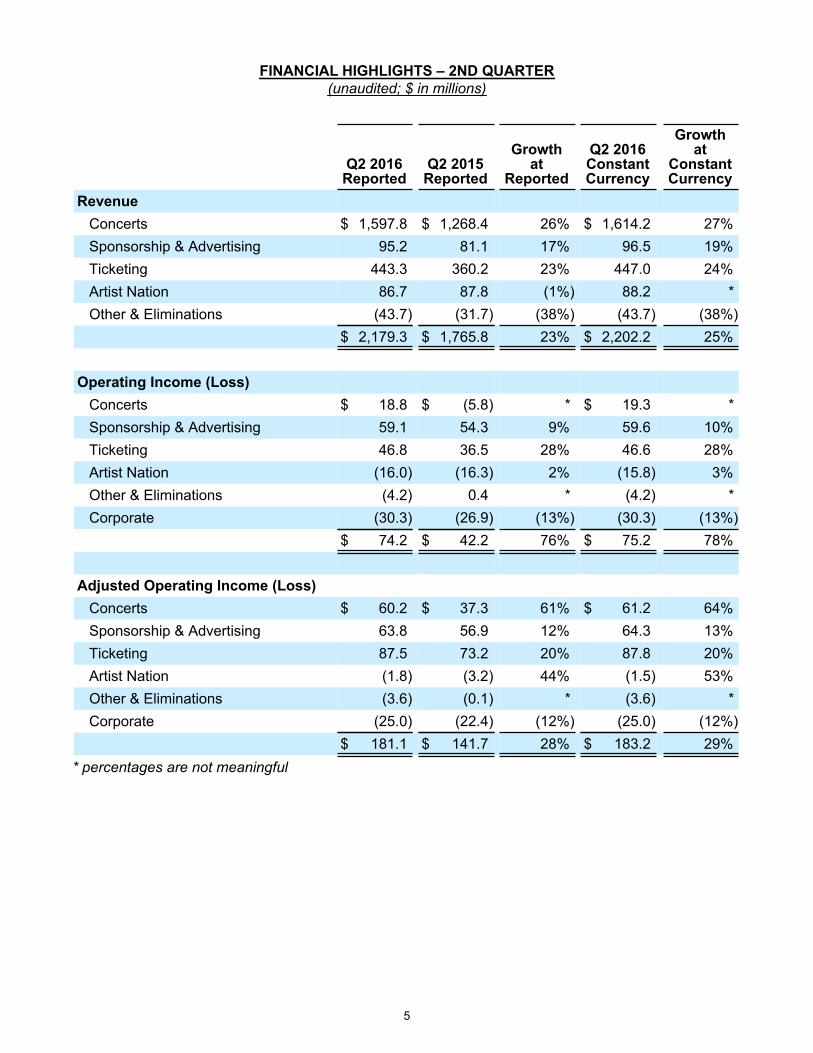
FINANCIAL HIGHLIGHTS – 2ND QUARTER(unaudited; $ in millions)
Q2 2016Reported
Q2 2015Reported
Growthat
Reported
Q2 2016ConstantCurrency
Growthat
ConstantCurrency
RevenueConcerts $ 1,597.8 $ 1,268.4 26% $ 1,614.2 27%Sponsorship & Advertising 95.2 81.1 17% 96.5 19%Ticketing 443.3 360.2 23% 447.0 24%Artist Nation 86.7 87.8 (1%) 88.2 *Other & Eliminations (43.7) (31.7) (38%) (43.7) (38%)
$ 2,179.3 $ 1,765.8 23% $ 2,202.2 25%
Operating Income (Loss)Concerts $ 18.8 $ (5.8) * $ 19.3 *Sponsorship & Advertising 59.1 54.3 9% 59.6 10%Ticketing 46.8 36.5 28% 46.6 28%Artist Nation (16.0) (16.3) 2% (15.8) 3%Other & Eliminations (4.2) 0.4 * (4.2) *Corporate (30.3) (26.9) (13%) (30.3) (13%)
$ 74.2 $ 42.2 76% $ 75.2 78%
Adjusted Operating Income (Loss)Concerts $ 60.2 $ 37.3 61% $ 61.2 64%Sponsorship & Advertising 63.8 56.9 12% 64.3 13%Ticketing 87.5 73.2 20% 87.8 20%Artist Nation (1.8) (3.2) 44% (1.5) 53%Other & Eliminations (3.6) (0.1) * (3.6) *Corporate (25.0) (22.4) (12%) (25.0) (12%)
$ 181.1 $ 141.7 28% $ 183.2 29% * percentages are not meaningful
6
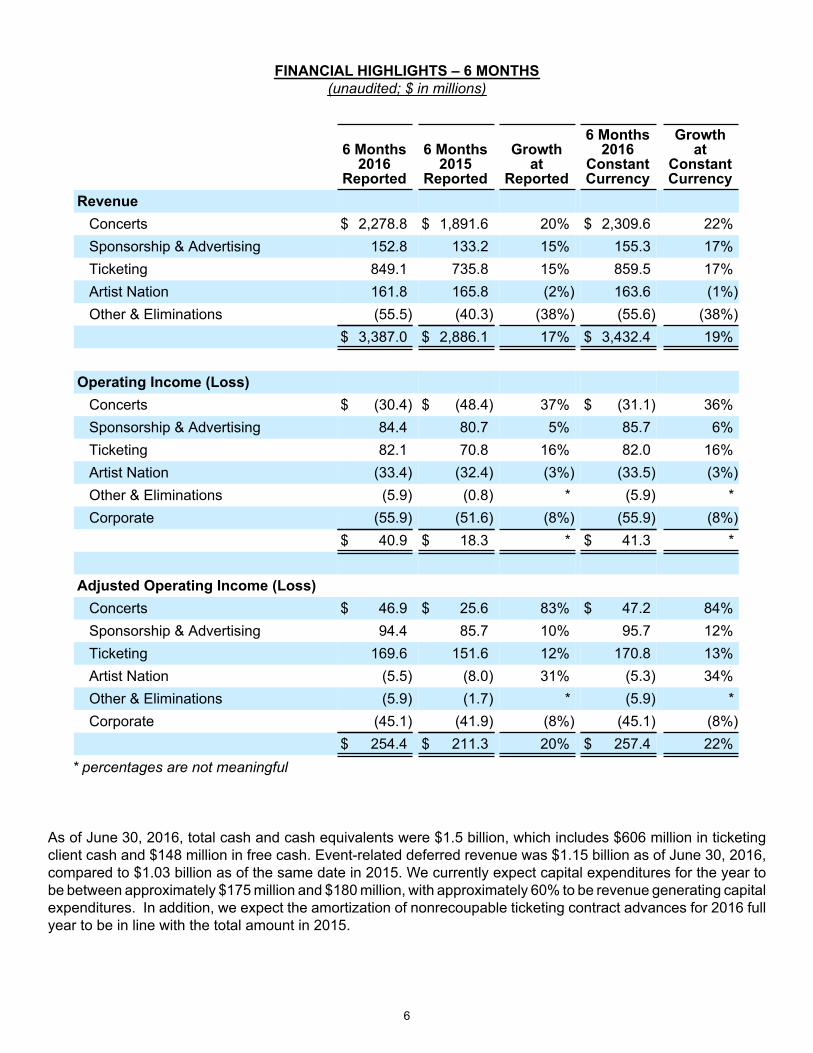
FINANCIAL HIGHLIGHTS – 6 MONTHS(unaudited; $ in millions)
6 Months2016
Reported
6 Months2015
Reported
Growthat
Reported
6 Months2016
ConstantCurrency
Growthat
ConstantCurrency
RevenueConcerts $ 2,278.8 $ 1,891.6 20% $ 2,309.6 22%Sponsorship & Advertising 152.8 133.2 15% 155.3 17%Ticketing 849.1 735.8 15% 859.5 17%Artist Nation 161.8 165.8 (2%) 163.6 (1%)Other & Eliminations (55.5) (40.3) (38%) (55.6) (38%)
$ 3,387.0 $ 2,886.1 17% $ 3,432.4 19%
Operating Income (Loss)Concerts $ (30.4) $ (48.4) 37% $ (31.1) 36%Sponsorship & Advertising 84.4 80.7 5% 85.7 6%Ticketing 82.1 70.8 16% 82.0 16%Artist Nation (33.4) (32.4) (3%) (33.5) (3%)Other & Eliminations (5.9) (0.8) * (5.9) *Corporate (55.9) (51.6) (8%) (55.9) (8%)
$ 40.9 $ 18.3 * $ 41.3 *
Adjusted Operating Income (Loss)Concerts $ 46.9 $ 25.6 83% $ 47.2 84%Sponsorship & Advertising 94.4 85.7 10% 95.7 12%Ticketing 169.6 151.6 12% 170.8 13%Artist Nation (5.5) (8.0) 31% (5.3) 34%Other & Eliminations (5.9) (1.7) * (5.9) *Corporate (45.1) (41.9) (8%) (45.1) (8%)
$ 254.4 $ 211.3 20% $ 257.4 22% * percentages are not meaningful
As of June 30, 2016, total cash and cash equivalents were $1.5 billion, which includes $606 million in ticketing client cash and $148 million in free cash. Event-related deferred revenue was $1.15 billion as of June 30, 2016, compared to $1.03 billion as of the same date in 2015. We currently expect capital expenditures for the year to be between approximately $175 million and $180 million, with approximately 60% to be revenue generating capital expenditures. In addition, we expect the amortization of nonrecoupable ticketing contract advances for 2016 full year to be in line with the total amount in 2015.
7
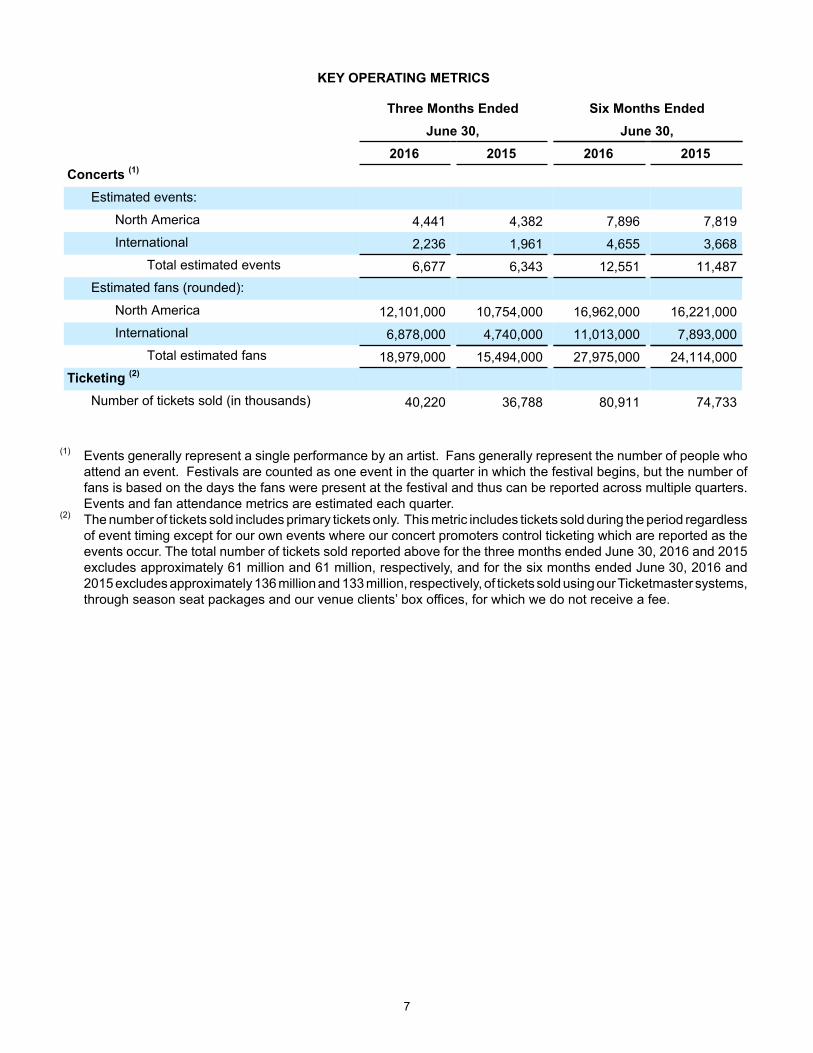
KEY OPERATING METRICS
Three Months Ended Six Months EndedJune 30, June 30,
2016 2015 2016 2015Concerts (1)
Estimated events:
North America 4,441 4,382 7,896 7,819International 2,236 1,961 4,655 3,668
Total estimated events 6,677 6,343 12,551 11,487Estimated fans (rounded):
North America 12,101,000 10,754,000 16,962,000 16,221,000International 6,878,000 4,740,000 11,013,000 7,893,000
Total estimated fans 18,979,000 15,494,000 27,975,000 24,114,000Ticketing (2)
Number of tickets sold (in thousands) 40,220 36,788 80,911 74,733
(1) Events generally represent a single performance by an artist. Fans generally represent the number of people who attend an event. Festivals are counted as one event in the quarter in which the festival begins, but the number of fans is based on the days the fans were present at the festival and thus can be reported across multiple quarters. Events and fan attendance metrics are estimated each quarter.
(2) The number of tickets sold includes primary tickets only. This metric includes tickets sold during the period regardless of event timing except for our own events where our concert promoters control ticketing which are reported as the events occur. The total number of tickets sold reported above for the three months ended June 30, 2016 and 2015excludes approximately 61 million and 61 million, respectively, and for the six months ended June 30, 2016 and 2015 excludes approximately 136 million and 133 million, respectively, of tickets sold using our Ticketmaster systems, through season seat packages and our venue clients’ box offices, for which we do not receive a fee.
8
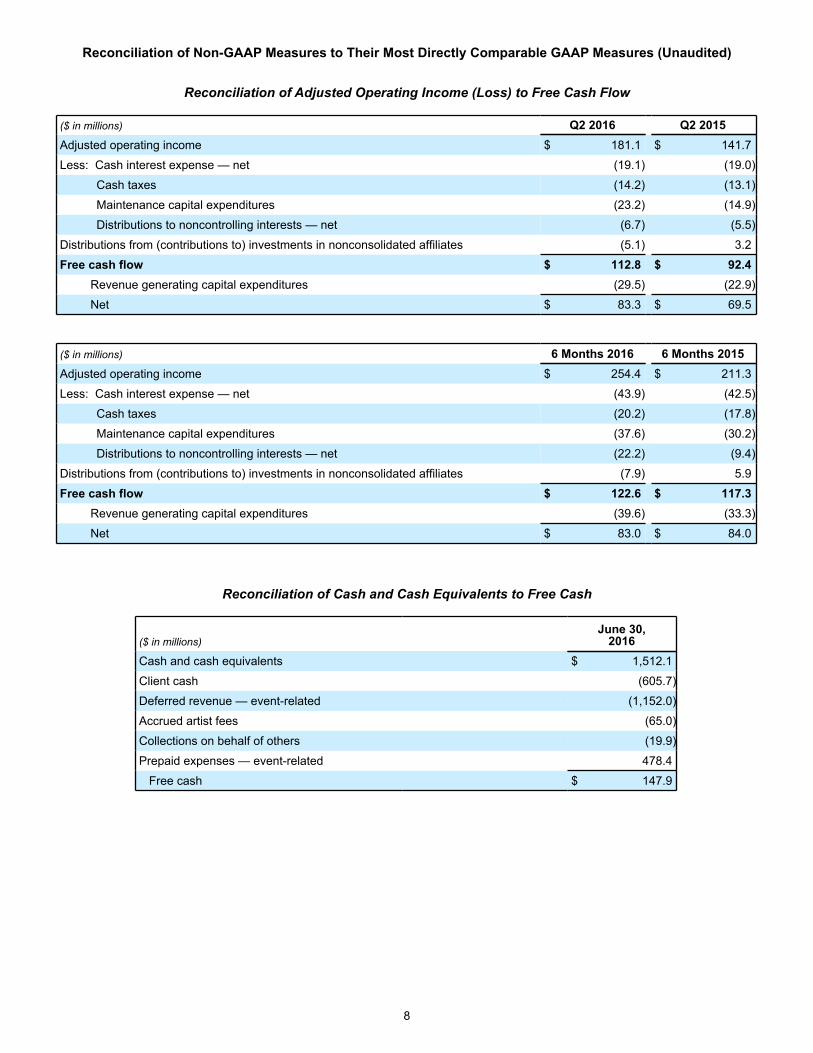
Reconciliation of Non-GAAP Measures to Their Most Directly Comparable GAAP Measures (Unaudited)
Reconciliation of Adjusted Operating Income (Loss) to Free Cash Flow
($ in millions) Q2 2016 Q2 2015Adjusted operating income $ 181.1 $ 141.7
Less: Cash interest expense — net (19.1) (19.0)
Cash taxes (14.2) (13.1)
Maintenance capital expenditures (23.2) (14.9)
Distributions to noncontrolling interests — net (6.7) (5.5)
Distributions from (contributions to) investments in nonconsolidated affiliates (5.1) 3.2
Free cash flow $ 112.8 $ 92.4Revenue generating capital expenditures (29.5) (22.9)
Net $ 83.3 $ 69.5
($ in millions) 6 Months 2016 6 Months 2015Adjusted operating income $ 254.4 $ 211.3
Less: Cash interest expense — net (43.9) (42.5)
Cash taxes (20.2) (17.8)
Maintenance capital expenditures (37.6) (30.2)
Distributions to noncontrolling interests — net (22.2) (9.4)
Distributions from (contributions to) investments in nonconsolidated affiliates (7.9) 5.9
Free cash flow $ 122.6 $ 117.3Revenue generating capital expenditures (39.6) (33.3)
Net $ 83.0 $ 84.0
Reconciliation of Cash and Cash Equivalents to Free Cash
($ in millions)June 30,
2016Cash and cash equivalents $ 1,512.1
Client cash (605.7)
Deferred revenue — event-related (1,152.0)
Accrued artist fees (65.0)
Collections on behalf of others (19.9)
Prepaid expenses — event-related 478.4
Free cash $ 147.9
9
Forward-Looking Statements, Non-GAAP Financial Measures and Reconciliations: Certain statements in this press release constitute "forward-looking statements" within the meaning of the Private Securities Litigation Reform Act of 1995. Such forward-looking statements include, but are not limited to, statements regarding expected revenue and adjusted operating income growth in 2016 for the company overall and for each of its businesses, including anticipated adjusted operating income growth in the company’s sponsorship and advertising business consistent with the past several years; projected mid- to high-single digit growth in concert fan attendance for the full year in North America and internationally; and the company’s future expectations for its Ticketmaster business, including the potential for global growth in all ticketing verticals. Live Nation wishes to caution you that there are some known and unknown factors that could cause actual results to differ materially from any future results, performance or achievements expressed or implied by such forward-looking statements, including but not limited to operational challenges in achieving strategic objectives and executing on the company's plans, the risk that the company's markets do not evolve as anticipated, the potential impact of any economic slowdown and operational challenges associated with selling tickets and staging events.Live Nation refers you to the documents it files from time to time with the U.S. Securities and Exchange Commission, or SEC, specifically the section titled “Item 1A. Risk Factors” of the company’s most recent Annual Report filed on Form 10-K, and Quarterly Reports on Form 10-Q and its Current Reports on Form 8-K, which contain and identify other important factors that could cause actual results to differ materially from those contained in the company’s projections or forward-looking statements. You are cautioned not to place undue reliance on these forward-looking statements which speak only as of the date on which they are made. All subsequent written and oral forward-looking statements by or concerning Live Nation are expressly qualified in their entirety by the cautionary statements above. Live Nation does not undertake any obligation to publicly update or revise any forward-looking statements because of new information, future events or otherwise.This press release contains certain non-GAAP financial measures as defined by SEC Regulation G. A reconciliation of each such measure to its most directly comparable GAAP financial measure, together with an explanation of why management believes that these non-GAAP financial measures provide useful information to investors, is provided herein.Adjusted Operating Income (Loss), or AOI, is a non-GAAP financial measure that we define as operating income (loss) before acquisition expenses (including transaction costs, changes in the fair value of accrued acquisition-related contingent consideration arrangements, acquisition-related severance and compensation), depreciation and amortization (including goodwill impairment), loss (gain) on disposal of operating assets and certain stock-based compensation expense. We use AOI to evaluate the performance of our operating segments. We believe that information about AOI assists investors by allowing them to evaluate changes in the operating results of our portfolio of businesses separate from non-operational factors that affect net income, thus providing insights into both operations and the other factors that affect reported results. AOI is not calculated or presented in accordance with GAAP. A limitation of the use of AOI as a performance measure is that it does not reflect the periodic costs of certain amortizing assets used in generating revenue in our business. Accordingly, AOI should be considered in addition to, and not as a substitute for, operating income (loss), net income (loss), and other measures of financial performance reported in accordance with GAAP. Furthermore, this measure may vary among other companies; thus, AOI as presented herein may not be comparable to similarly titled measures of other companies.Constant Currency is a non-GAAP financial measure. We calculate currency impacts as the difference between current period activity translated using the current period's currency exchange rates and the comparable prior period's currency exchange rates. We present constant currency information to provide a framework for assessing how our underlying businesses performed excluding the effect of foreign currency rate fluctuation.Free Cash Flow is a non-GAAP financial measure that the company defines as AOI less maintenance capital expenditures, less net cash interest expense, less cash taxes, less net distributions to noncontrolling interest partners, plus distributions from investments in nonconsolidated affiliates net of contributions. The company uses free cash flow, among other measures, to evaluate the ability of its operations to generate cash that is available for purposes other than maintenance capital expenditures. The company believes that information about free cash flow provides investors with an important perspective on the cash available to service debt and make acquisitions. Free cash flow is not calculated or presented in accordance with GAAP. A limitation of the use of free cash flow as a performance measure is that it does not necessarily represent funds available for operations and is not necessarily a measure of the company’s ability to fund its cash needs. Accordingly, free cash flow should be considered in addition to, and not as a substitute for, operating income (loss) and other measures of financial performance reported in accordance with GAAP. Furthermore, this measure may vary among other companies; thus, free cash flow as presented herein may not be comparable to similarly titled measures of other companies.Free Cash is a non-GAAP financial measure that the company defines as cash and cash equivalents less ticketing-related client funds, less event-related deferred revenue, less accrued expenses due to artists and cash collected on behalf of others, plus event-related prepaids. The company uses free cash as a proxy for how much cash it has available to, among other things, optionally repay debt balances, make acquisitions and fund revenue generating capital expenditures. Free cash is not calculated or presented in accordance with GAAP. A limitation of the use of free cash as a performance measure is that it does not necessarily represent funds available from operations and it is not necessarily a measure of our ability to fund our cash needs. Accordingly, free cash should be considered in addition to, and not as a substitute for, cash and cash equivalents and other measures of financial performance reported in accordance with GAAP. Furthermore, this measure may vary among other companies; thus, free cash as presented herein may not be comparable to similarly titled measures of other companies.
10
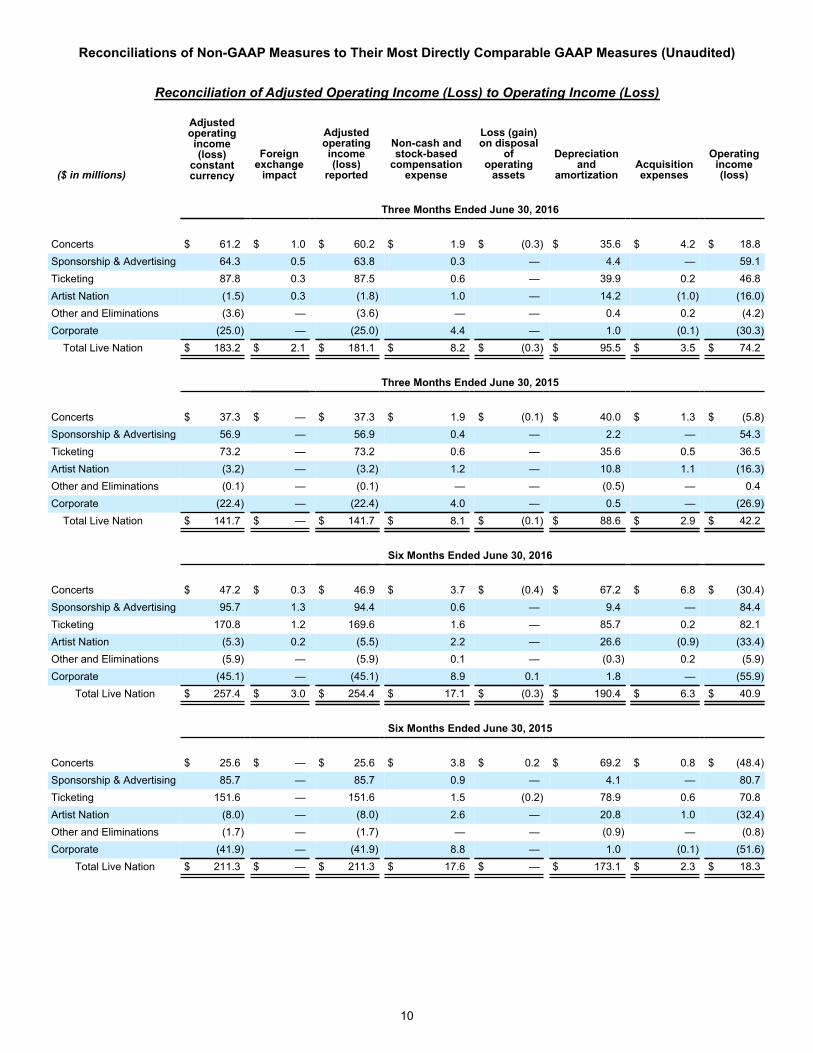
Reconciliations of Non-GAAP Measures to Their Most Directly Comparable GAAP Measures (Unaudited)
Reconciliation of Adjusted Operating Income (Loss) to Operating Income (Loss)
($ in millions)
Adjustedoperatingincome(loss)
constantcurrency
Foreignexchange
impact
Adjustedoperatingincome(loss)
reported
Non-cash andstock-based
compensationexpense
Loss (gain)on disposal
ofoperating
assets
Depreciation and
amortizationAcquisitionexpenses
Operatingincome(loss)
Three Months Ended June 30, 2016
Concerts $ 61.2 $ 1.0 $ 60.2 $ 1.9 $ (0.3) $ 35.6 $ 4.2 $ 18.8Sponsorship & Advertising 64.3 0.5 63.8 0.3 — 4.4 — 59.1Ticketing 87.8 0.3 87.5 0.6 — 39.9 0.2 46.8Artist Nation (1.5) 0.3 (1.8) 1.0 — 14.2 (1.0) (16.0)Other and Eliminations (3.6) — (3.6) — — 0.4 0.2 (4.2)Corporate (25.0) — (25.0) 4.4 — 1.0 (0.1) (30.3) Total Live Nation $ 183.2 $ 2.1 $ 181.1 $ 8.2 $ (0.3) $ 95.5 $ 3.5 $ 74.2
Three Months Ended June 30, 2015
Concerts $ 37.3 $ — $ 37.3 $ 1.9 $ (0.1) $ 40.0 $ 1.3 $ (5.8)Sponsorship & Advertising 56.9 — 56.9 0.4 — 2.2 — 54.3Ticketing 73.2 — 73.2 0.6 — 35.6 0.5 36.5Artist Nation (3.2) — (3.2) 1.2 — 10.8 1.1 (16.3)Other and Eliminations (0.1) — (0.1) — — (0.5) — 0.4Corporate (22.4) — (22.4) 4.0 — 0.5 — (26.9) Total Live Nation $ 141.7 $ — $ 141.7 $ 8.1 $ (0.1) $ 88.6 $ 2.9 $ 42.2
Six Months Ended June 30, 2016
Concerts $ 47.2 $ 0.3 $ 46.9 $ 3.7 $ (0.4) $ 67.2 $ 6.8 $ (30.4)Sponsorship & Advertising 95.7 1.3 94.4 0.6 — 9.4 — 84.4Ticketing 170.8 1.2 169.6 1.6 — 85.7 0.2 82.1Artist Nation (5.3) 0.2 (5.5) 2.2 — 26.6 (0.9) (33.4)Other and Eliminations (5.9) — (5.9) 0.1 — (0.3) 0.2 (5.9)Corporate (45.1) — (45.1) 8.9 0.1 1.8 — (55.9)
Total Live Nation $ 257.4 $ 3.0 $ 254.4 $ 17.1 $ (0.3) $ 190.4 $ 6.3 $ 40.9
Six Months Ended June 30, 2015
Concerts $ 25.6 $ — $ 25.6 $ 3.8 $ 0.2 $ 69.2 $ 0.8 $ (48.4)Sponsorship & Advertising 85.7 — 85.7 0.9 — 4.1 — 80.7Ticketing 151.6 — 151.6 1.5 (0.2) 78.9 0.6 70.8Artist Nation (8.0) — (8.0) 2.6 — 20.8 1.0 (32.4)Other and Eliminations (1.7) — (1.7) — — (0.9) — (0.8)Corporate (41.9) — (41.9) 8.8 — 1.0 (0.1) (51.6)
Total Live Nation $ 211.3 $ — $ 211.3 $ 17.6 $ — $ 173.1 $ 2.3 $ 18.3
11
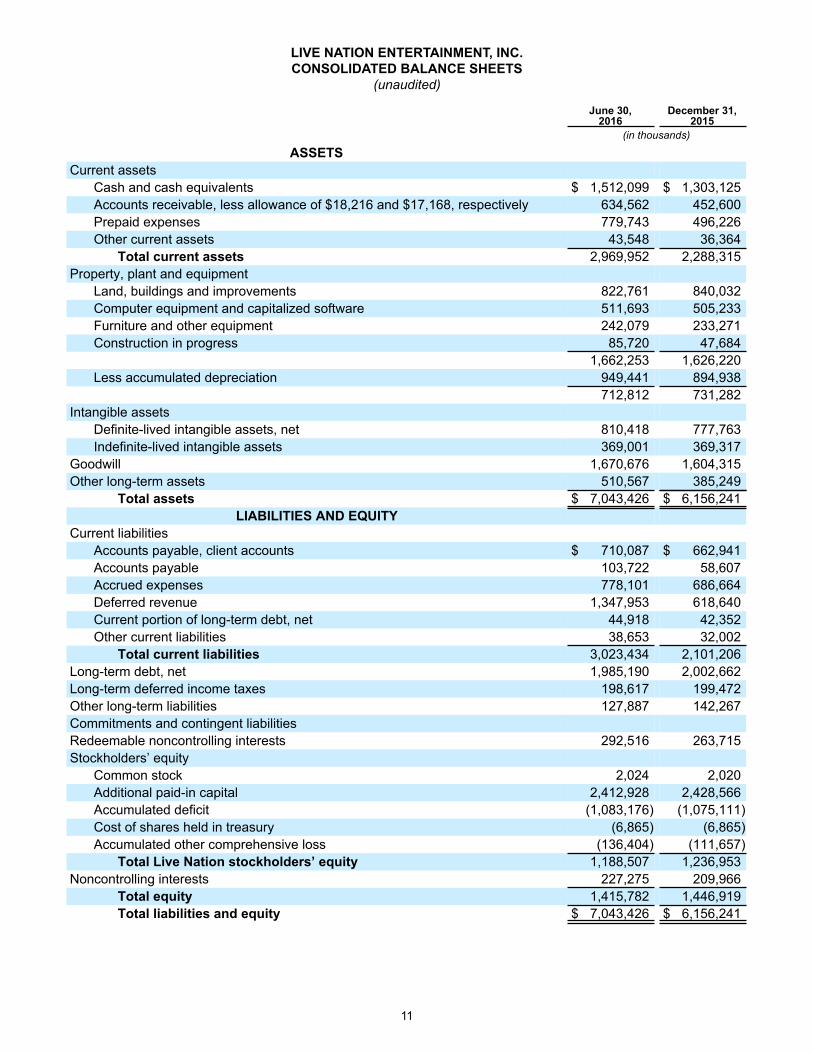
LIVE NATION ENTERTAINMENT, INC.CONSOLIDATED BALANCE SHEETS
(unaudited)
June 30,2016
December 31,2015
(in thousands)
ASSETSCurrent assets
Cash and cash equivalents $ 1,512,099 $ 1,303,125Accounts receivable, less allowance of $18,216 and $17,168, respectively 634,562 452,600Prepaid expenses 779,743 496,226Other current assets 43,548 36,364
Total current assets 2,969,952 2,288,315Property, plant and equipment
Land, buildings and improvements 822,761 840,032Computer equipment and capitalized software 511,693 505,233Furniture and other equipment 242,079 233,271Construction in progress 85,720 47,684
1,662,253 1,626,220Less accumulated depreciation 949,441 894,938
712,812 731,282Intangible assets
Definite-lived intangible assets, net 810,418 777,763Indefinite-lived intangible assets 369,001 369,317
Goodwill 1,670,676 1,604,315Other long-term assets 510,567 385,249
Total assets $ 7,043,426 $ 6,156,241LIABILITIES AND EQUITY
Current liabilitiesAccounts payable, client accounts $ 710,087 $ 662,941Accounts payable 103,722 58,607Accrued expenses 778,101 686,664Deferred revenue 1,347,953 618,640Current portion of long-term debt, net 44,918 42,352Other current liabilities 38,653 32,002
Total current liabilities 3,023,434 2,101,206Long-term debt, net 1,985,190 2,002,662Long-term deferred income taxes 198,617 199,472Other long-term liabilities 127,887 142,267Commitments and contingent liabilitiesRedeemable noncontrolling interests 292,516 263,715Stockholders’ equity
Common stock 2,024 2,020Additional paid-in capital 2,412,928 2,428,566Accumulated deficit (1,083,176) (1,075,111)Cost of shares held in treasury (6,865) (6,865)Accumulated other comprehensive loss (136,404) (111,657)
Total Live Nation stockholders’ equity 1,188,507 1,236,953Noncontrolling interests 227,275 209,966
Total equity 1,415,782 1,446,919Total liabilities and equity $ 7,043,426 $ 6,156,241
12
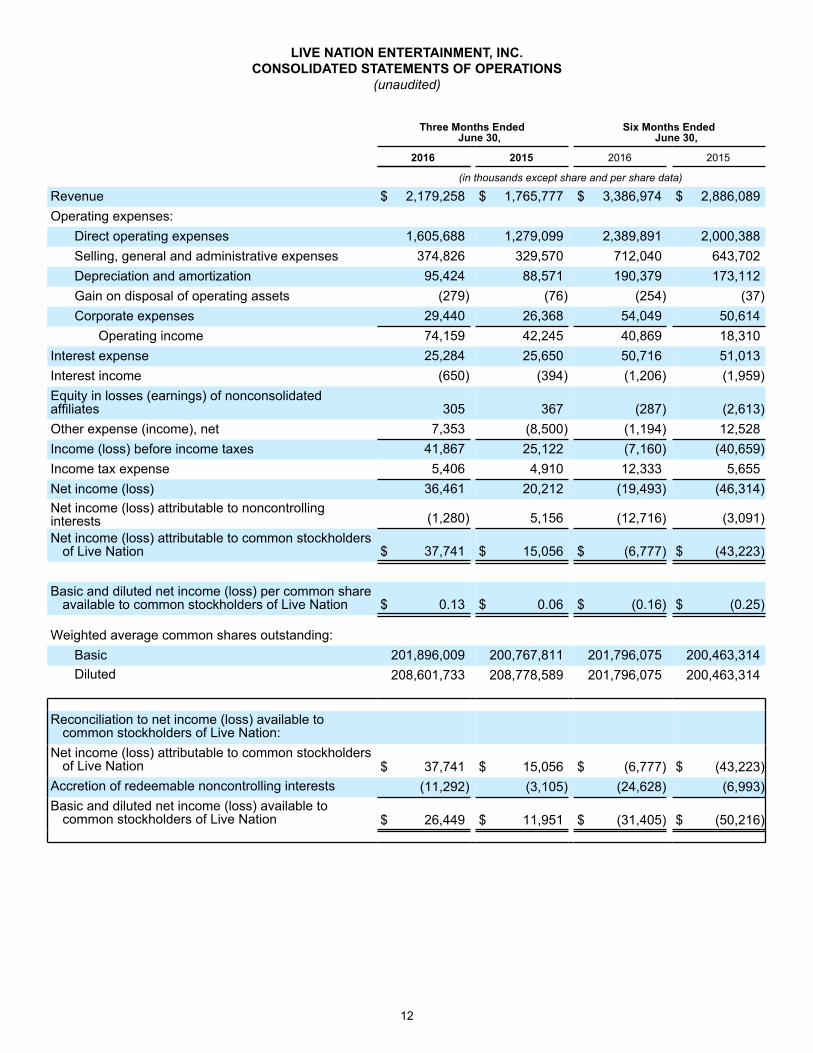
LIVE NATION ENTERTAINMENT, INC.CONSOLIDATED STATEMENTS OF OPERATIONS
(unaudited)
Three Months Ended
June 30,Six Months Ended
June 30,
2016 2015 2016 2015
(in thousands except share and per share data)
Revenue $ 2,179,258 $ 1,765,777 $ 3,386,974 $ 2,886,089Operating expenses:
Direct operating expenses 1,605,688 1,279,099 2,389,891 2,000,388Selling, general and administrative expenses 374,826 329,570 712,040 643,702Depreciation and amortization 95,424 88,571 190,379 173,112Gain on disposal of operating assets (279) (76) (254) (37)Corporate expenses 29,440 26,368 54,049 50,614
Operating income 74,159 42,245 40,869 18,310Interest expense 25,284 25,650 50,716 51,013Interest income (650) (394) (1,206) (1,959)Equity in losses (earnings) of nonconsolidatedaffiliates 305 367 (287) (2,613)Other expense (income), net 7,353 (8,500) (1,194) 12,528Income (loss) before income taxes 41,867 25,122 (7,160) (40,659)Income tax expense 5,406 4,910 12,333 5,655Net income (loss) 36,461 20,212 (19,493) (46,314)Net income (loss) attributable to noncontrollinginterests (1,280) 5,156 (12,716) (3,091)Net income (loss) attributable to common stockholders
of Live Nation $ 37,741 $ 15,056 $ (6,777) $ (43,223)
Basic and diluted net income (loss) per common shareavailable to common stockholders of Live Nation $ 0.13 $ 0.06 $ (0.16) $ (0.25)
Weighted average common shares outstanding:Basic 201,896,009 200,767,811 201,796,075 200,463,314Diluted 208,601,733 208,778,589 201,796,075 200,463,314
Reconciliation to net income (loss) available tocommon stockholders of Live Nation:
Net income (loss) attributable to common stockholdersof Live Nation $ 37,741 $ 15,056 $ (6,777) $ (43,223)
Accretion of redeemable noncontrolling interests (11,292) (3,105) (24,628) (6,993)Basic and diluted net income (loss) available to
common stockholders of Live Nation $ 26,449 $ 11,951 $ (31,405) $ (50,216)
13
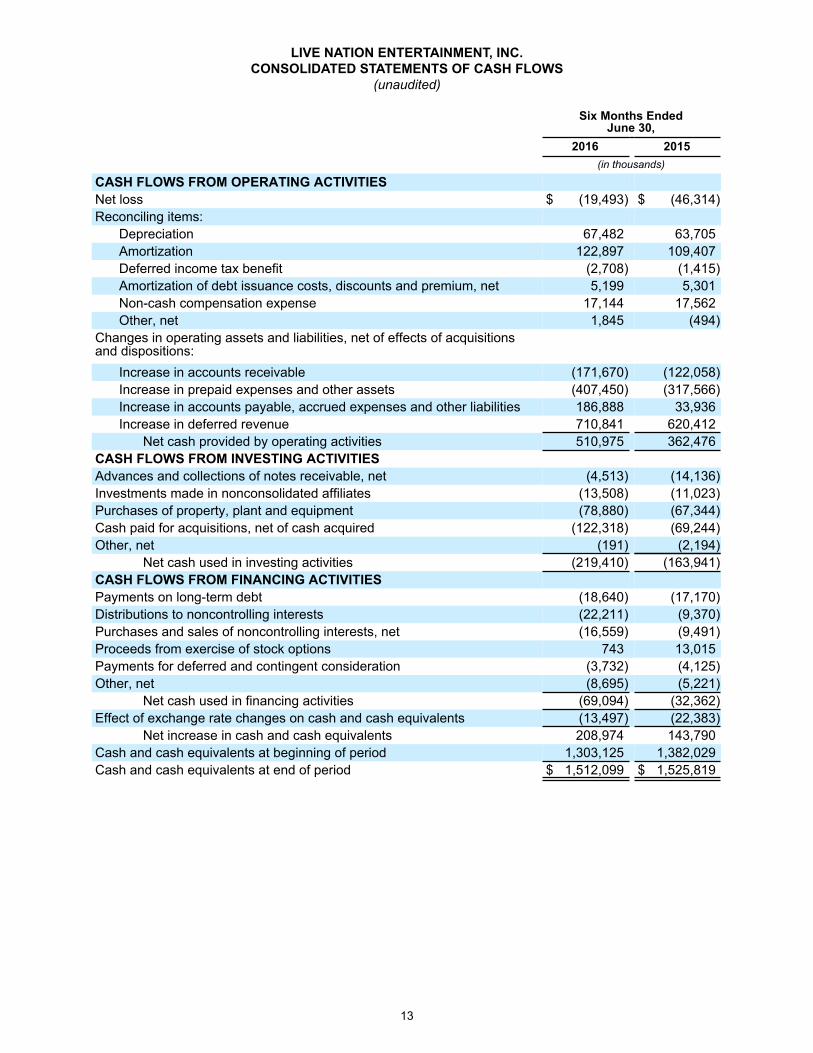
LIVE NATION ENTERTAINMENT, INC.CONSOLIDATED STATEMENTS OF CASH FLOWS
(unaudited)
Six Months EndedJune 30,
2016 2015 (in thousands)
CASH FLOWS FROM OPERATING ACTIVITIESNet loss $ (19,493) $ (46,314)Reconciling items:
Depreciation 67,482 63,705Amortization 122,897 109,407Deferred income tax benefit (2,708) (1,415)Amortization of debt issuance costs, discounts and premium, net 5,199 5,301Non-cash compensation expense 17,144 17,562Other, net 1,845 (494)
Changes in operating assets and liabilities, net of effects of acquisitionsand dispositions:
Increase in accounts receivable (171,670) (122,058)Increase in prepaid expenses and other assets (407,450) (317,566)Increase in accounts payable, accrued expenses and other liabilities 186,888 33,936Increase in deferred revenue 710,841 620,412
Net cash provided by operating activities 510,975 362,476CASH FLOWS FROM INVESTING ACTIVITIESAdvances and collections of notes receivable, net (4,513) (14,136)Investments made in nonconsolidated affiliates (13,508) (11,023)Purchases of property, plant and equipment (78,880) (67,344)Cash paid for acquisitions, net of cash acquired (122,318) (69,244)Other, net (191) (2,194)
Net cash used in investing activities (219,410) (163,941)CASH FLOWS FROM FINANCING ACTIVITIESPayments on long-term debt (18,640) (17,170)Distributions to noncontrolling interests (22,211) (9,370)Purchases and sales of noncontrolling interests, net (16,559) (9,491)Proceeds from exercise of stock options 743 13,015Payments for deferred and contingent consideration (3,732) (4,125)Other, net (8,695) (5,221)
Net cash used in financing activities (69,094) (32,362)Effect of exchange rate changes on cash and cash equivalents (13,497) (22,383)
Net increase in cash and cash equivalents 208,974 143,790Cash and cash equivalents at beginning of period 1,303,125 1,382,029Cash and cash equivalents at end of period $ 1,512,099 $ 1,525,819
Related Documents