Long-term Stock Market Forecasting using Gaussian Processes Anonymous Author(s) 1 Affiliation 2 Address 3 email 4 Abstract 5 Forecasting stock market prices is an attractive topic to researchers from 6 different fields. The accuracy of this forecasting is very critical for market 7 dealers. The existing forecast models show valid results in short-term 8 forecasting; however, the accuracy of these models degrades in long-term 9 forecasting. In this project, the Gaussian processes are applied to forecast 10 the stock market trend. We select three stocks from NASDAQ Stock Market 11 to test the proposed model. The experiment results show worthy findings of 12 the stocks behavior over different periods of time. This model could help 13 investors to make the long-term investment or to validate their investment 14 decisions. 15 16 1 Introduction 17 Nowadays, most of the stock market traders relay on machine learning techniques to analyze 18 and forecast stock prices and index changes. The accuracy of these techniques is still an 19 issue due to several factors such as seasons, political situation and economic conditions that 20 cause fluctuation of stock market movement (Ou & Wang, 2009). Although this movement 21 does not follow exact seasonal cycles all the time, it is highly recommended not to ignore 22 these cycles (Jeffrey & Kass, 2012). This project proposes a new application of long-term 23 forecasting with the Gaussian processes (GP) model in (Chapados & Bengio, 2007) in stock 24 market. 25 In general, there are two methodologies to predict stock prices: Fundamental Analysis and 26 Technical Analysis. The Fundamental Analysis relies on the past performance of the 27 company to make predictions. The Technical Analysis deals with past stock prices to 28 understand its pattern change and predict the future prices. Although, most of machine 29 learning application show more interest in Technical Analysis, hybrid approaches could 30 combine both methodologies to make prediction (Ayodele, et al., 2012). In this paper, 31 Technical Analysis will be used to perform long-term predictions in stock prices. 32 33 1.2 Motivation 34 In stock market, investors need long-term forecasting techniques to choose the right time to 35 buy/sell stocks to maximize their profits or to minimize their loss. The majority of existing 36 stock market forecasting techniques require predictions over a single continuous time series. 37 These techniques perform well in short-term (a day to weeks) time series prediction but the 38 accuracy of these techniques degrades when long-term time series prediction is made. The 39 motivation for this project comes from the presence of large amount of historical data in 40 stock market and the ability to use of GP in long-term time series forecasting (Chapados & 41 Bengio, 2007). The goal of this project is to help investors to choose the right stock to invest 42

Welcome message from author
This document is posted to help you gain knowledge. Please leave a comment to let me know what you think about it! Share it to your friends and learn new things together.
Transcript
Long-term Stock Market Forecasting using Gaussian Processes
Anonymous Author(s) 1
Affiliation 2 Address 3
email 4
Abstract 5
Forecasting stock market prices is an attractive topic to researchers from 6 different fields. The accuracy of this forecasting is very critical for market 7 dealers. The existing forecast models show valid results in short-term 8 forecasting; however, the accuracy of these models degrades in long-term 9 forecasting. In this project, the Gaussian processes are applied to forecast 10 the stock market trend. We select three stocks from NASDAQ Stock Market 11 to test the proposed model. The experiment results show worthy findings of 12 the stocks behavior over different periods of time. This model could help 13 investors to make the long-term investment or to validate their investment 14 decisions. 15
16
1 Introduction 17
Nowadays, most of the stock market traders relay on machine learning techniques to analyze 18 and forecast stock prices and index changes. The accuracy of these techniques is still an 19 issue due to several factors such as seasons, political situation and economic conditions that 20 cause fluctuation of stock market movement (Ou & Wang, 2009). Although this movement 21 does not follow exact seasonal cycles all the time, it is highly recommended not to ignore 22 these cycles (Jeffrey & Kass, 2012). This project proposes a new application of long-term 23 forecasting with the Gaussian processes (GP) model in (Chapados & Bengio, 2007) in stock 24 market. 25
In general, there are two methodologies to predict stock prices: Fundamental Analysis and 26 Technical Analysis. The Fundamental Analysis relies on the past performance of the 27 company to make predictions. The Technical Analysis deals with past stock prices to 28 understand its pattern change and predict the future prices. Although, most of machine 29 learning application show more interest in Technical Analysis, hybrid approaches could 30 combine both methodologies to make prediction (Ayodele, et al., 2012). In this paper, 31 Technical Analysis will be used to perform long-term predictions in stock prices. 32
33 1 . 2 M o t i v a t i o n 34
In stock market, investors need long-term forecasting techniques to choose the right time to 35 buy/sell stocks to maximize their profits or to minimize their loss. The majority of existing 36 stock market forecasting techniques require predictions over a single continuous time series. 37 These techniques perform well in short-term (a day to weeks) time series prediction but the 38 accuracy of these techniques degrades when long-term time series prediction is made. The 39 motivation for this project comes from the presence of large amount of historical data in 40 stock market and the ability to use of GP in long-term time series forecasting (Chapados & 41 Bengio, 2007). The goal of this project is to help investors to choose the right stock to invest 42
in, based on long-term forecasting. Also, this project can assist investors to predict the right 43 time to buy/sell in stock market to maximize the profit. 44
The rest of this paper is organized as follows. Section 2 sheds light on the related work and 45 gives background about stock market and Gaussian processes GP .In Section 3, we present 46 the methodology and the collected data. Section 4 gives a summary of the results obtained 47 and the analysis of these results. Section 5 concludes with future directions of work. 48
49 2 Background and related work 50
Several forecasting models have considered Gaussian processes for time-series forecasting 51 (Chapados & Bengio, 2007; Todd & Correa, 2007; Groot et al., 2011). In this section, we 52 give an overview about some related studies. Also, brief introductions about stock market 53 and Gaussian processes are covered. 54
Stock market trend prediction using Gaussian processes were tackled in (Todd & Correa, 55 2007). This study shows that increasing the size of training data (a long time period) gives 56 more accurate prediction. The drawback of this approach is the high computational time. 57 Multiple-step time series forecasting using sparse Gaussian process was addressed in (Groot 58 et al., 2011). This approach produced more accurate and faster predictions than standard GP 59 approach. Chapados and Bengio (2007), introduced a Long-term forecasting approach using 60 Gaussian processes. This approach used functional representation of time series to perform 61 long-term forecasting. Commodity spread trading data was used as an application for this 62 approach. In this project, the technique in (Chapados & Bengio, 2007) is applied to forecast 63 long-term prices in stock market. 64
65 2 . 1 S t o c k M a r k e t 66
Stock markets are public markets for trading the companies’ stocks (shares) at agreed prices. 67 Investors (companies or individuals) are allowed to buy and sell stocks and these 68 transactions are called trading. The stock prices depend on the demands and supplies; it goes 69 high when there is high demand and falls down at low demand. In stock market, a quarter 70 (Q) refers to one-fourth of a year. The four quarters are: January, February and March (Q1); 71 April, May and June (Q2); July, August and September (Q3); and October, November and 72 December (Q4). Investors use the past several quarters to forecast the future of the stocks 73 (Wikipedia, 2013). 74
Stock markets are considered as one of the economic indicators of countries. The growth of 75 stock prices attracts investors and increases the companies’ values. In general, the growth in 76 stock market reflects the strength and development of countries’ economics so that countries 77 watch and control the behavior of stock market (Preethi & Santhi, 2012). The size of global 78 stock market was estimated at about $54 Trillion in 2010 (anonymous, 2012). 79
80 2 . 2 G a u s s i a n P r o c e s s e s 81
A Gaussian process (GP) is a popular technique in machine learning and is widely used in 82 time series analysis (Mori & Ohmi, 2005). Rasmussen and Williams (2006) defined GP as “a 83 collection of random variables, any finite number of which have a joint Gaussian 84 distribution”. The GP is used to characterize probability distribution over functions by 85 defining two functions: mean function m x and the covariance function mean function 86 k x!, x! (Rasmussen & Nickisch, 2006). To describe a real process f x as a GP, we write: 87
f x ~ 𝒢𝒫 m x , k x!, x! , (1) 88
where, 89
m(x) = 𝔼[f(x)], 90
k x!, x! = E f x! − m x! f x! − m x! .
In regression, given a data set D of N observations; D = x!, y! i = 1, . . . ,N}, with x! ∈ ℝ! 91
and y! ∈ ℝ, the goal is to predict new y∗ given x∗ using f x such that: y! = f x! + δ! where 92 δ! is a Gaussian noise with mean zero and variance σ!. However, we assume that closing 93 prices in stock market are noise free because true prices are evaluated at closing time (Todd 94 & Correa, 2007). The prior distribution of the observed target y is given by 95
y~𝒩(0,K(X, X)), (2) 96
where, K(X, X) is the covariance matrix between all pairs of training points and X is (n×m) 97 matrix of input. In this project, (Gaussian) radial basis function kernel, or RBF kernel is 98 used: 99
k x!, x! = exp (−σ x! − x! !). (3) 100
The predictive distribution of y∗ can be computed by conditioning on the training data to get 101 p(f(x∗)|x∗,D). The joint distribution over y and predictions of x∗ is given by: 102
yf(x∗)
~𝒩 0,K(X, X) K(X, x∗)K(x∗, X) K(x∗, x∗)
. (4) 103
The conditional distribution of (2) allows us to get the predictive distribution of y∗ with the 104 following mean and covariance (Ou & Wang, 2011): 105
f x∗ = K X, x∗ ! K + σ!!I !!y, (5) 106
V! x∗ = K x∗, x∗ − K X, x∗ ! K + σ!!I !!K X, x∗ . (6) 107
108 3 Methodology 109
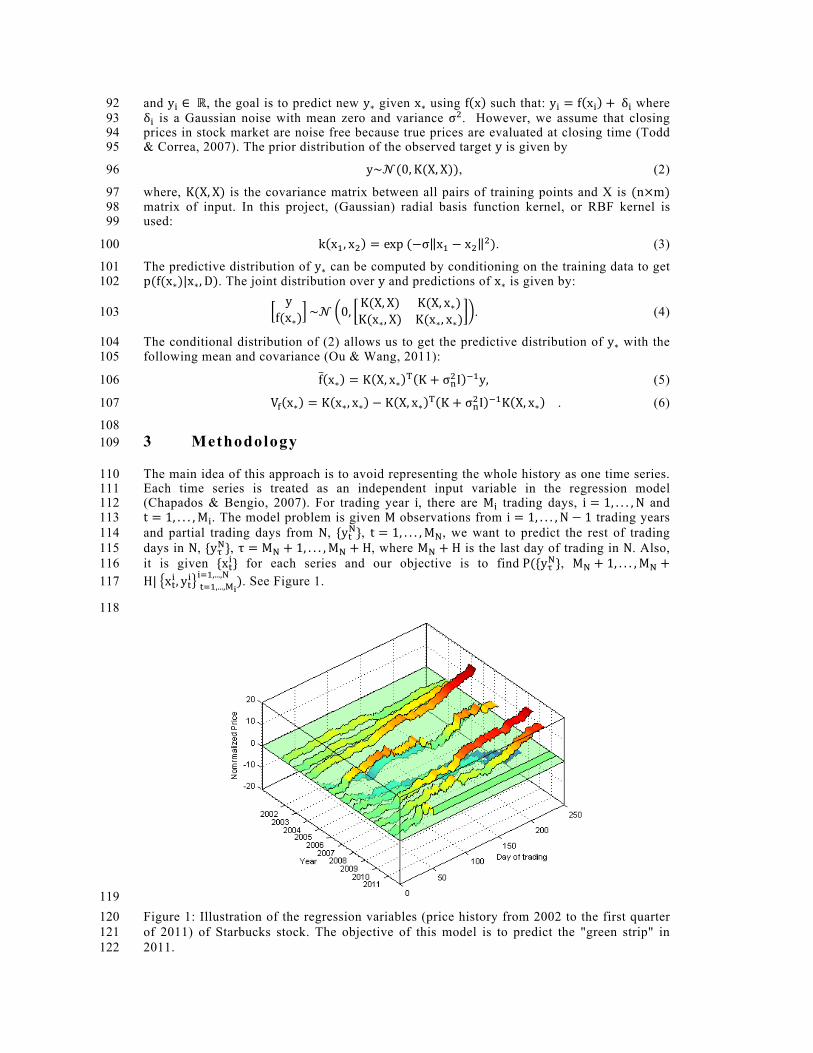
The main idea of this approach is to avoid representing the whole history as one time series. 110 Each time series is treated as an independent input variable in the regression model 111 (Chapados & Bengio, 2007). For trading year i, there are M! trading days, i = 1, . . . ,N and 112 t = 1, . . . ,M!. The model problem is given M observations from i = 1, . . . ,N − 1 trading years 113 and partial trading days from N, {y!!}, t = 1, . . . ,M!, we want to predict the rest of trading 114 days in N, {y!!}, τ = M! + 1, . . . ,M! + H, where M! + H is the last day of trading in N. Also, 115 it is given {x!!} for each series and our objective is to find P({y!!}, M! + 1, . . . ,M! +116 H| x!! , y!! )!!!,...,!!
!!!,...,! . See Figure 1. 117
118
119 Figure 1: Illustration of the regression variables (price history from 2002 to the first quarter 120 of 2011) of Starbucks stock. The objective of this model is to predict the "green strip" in 121 2011. 122
3 . 1 D a t a d e s c r i p t i o n 123
For this project, three random stocks were randomly selected from NASDAQ Stock Market, 124 namely Hewlett-Packard Company (HPQ), Yahoo Inc. (YHOO) and Starbucks Corporation 125 (SBUX). The daily changes of closing prices of these stocks were examined. The historical 126 data was downloaded from the yahoo finance section. 127
The sample period is from Jan 01 2002 to Dec. 31 2011 (N = 10). We have about 250 days 128 of trading per year since no data is observed on weekends. However, some years have more 129 than 250 days of trading (M! = 250), we choose to ignore these days so that the whole 130 sample is of 2500 trading days. 131
We choose to use adjusted close prices because we aim to predict the trend of the stocks not 132 the prices. The adjusted close price is used to avoid the effect of dividends and splits 133 because when stock has a split, its price drop by half. 134
The adjusted close prices are standardized to zero mean and unit standard deviation. We also 135 normalize the prices in each year to avoid the variation from previous years by subtracting 136 the first day to start from zero. 137
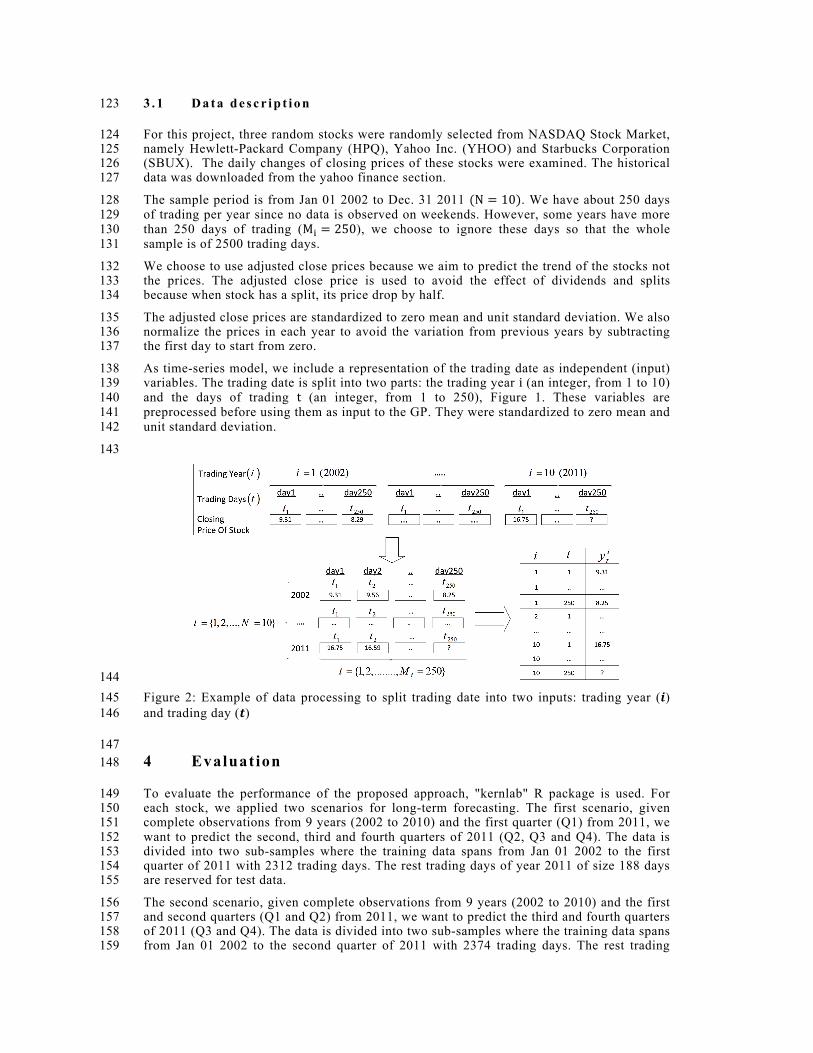
As time-series model, we include a representation of the trading date as independent (input) 138 variables. The trading date is split into two parts: the trading year i (an integer, from 1 to 10) 139 and the days of trading t (an integer, from 1 to 250), Figure 1. These variables are 140 preprocessed before using them as input to the GP. They were standardized to zero mean and 141 unit standard deviation. 142
143
144 Figure 2: Example of data processing to split trading date into two inputs: trading year (𝒊) 145 and trading day (𝒕) 146
147 4 Evaluation 148
To evaluate the performance of the proposed approach, "kernlab" R package is used. For 149 each stock, we applied two scenarios for long-term forecasting. The first scenario, given 150 complete observations from 9 years (2002 to 2010) and the first quarter (Q1) from 2011, we 151 want to predict the second, third and fourth quarters of 2011 (Q2, Q3 and Q4). The data is 152 divided into two sub-samples where the training data spans from Jan 01 2002 to the first 153 quarter of 2011 with 2312 trading days. The rest trading days of year 2011 of size 188 days 154 are reserved for test data. 155
The second scenario, given complete observations from 9 years (2002 to 2010) and the first 156 and second quarters (Q1 and Q2) from 2011, we want to predict the third and fourth quarters 157 of 2011 (Q3 and Q4). The data is divided into two sub-samples where the training data spans 158 from Jan 01 2002 to the second quarter of 2011 with 2374 trading days. The rest trading 159
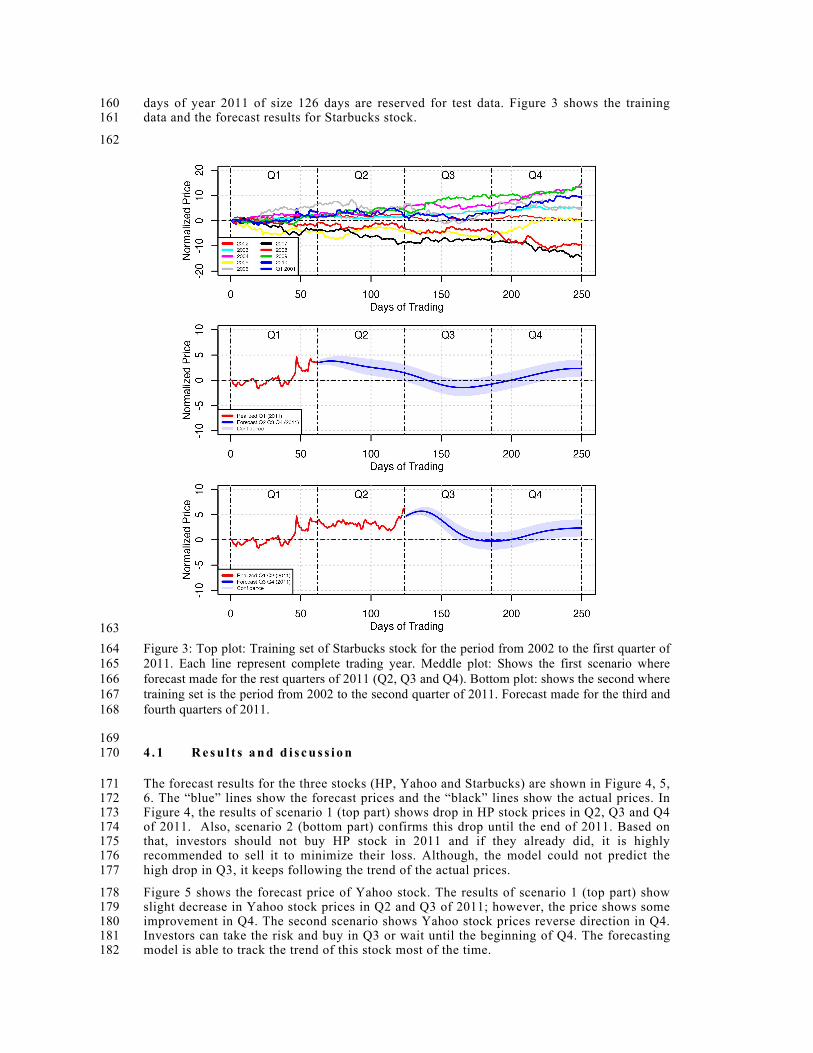
days of year 2011 of size 126 days are reserved for test data. Figure 3 shows the training 160 data and the forecast results for Starbucks stock. 161
162
163 Figure 3: Top plot: Training set of Starbucks stock for the period from 2002 to the first quarter of 164 2011. Each line represent complete trading year. Meddle plot: Shows the first scenario where 165 forecast made for the rest quarters of 2011 (Q2, Q3 and Q4). Bottom plot: shows the second where 166 training set is the period from 2002 to the second quarter of 2011. Forecast made for the third and 167 fourth quarters of 2011. 168
169 4 . 1 R e s u l t s a n d d i s c u s s i o n 170
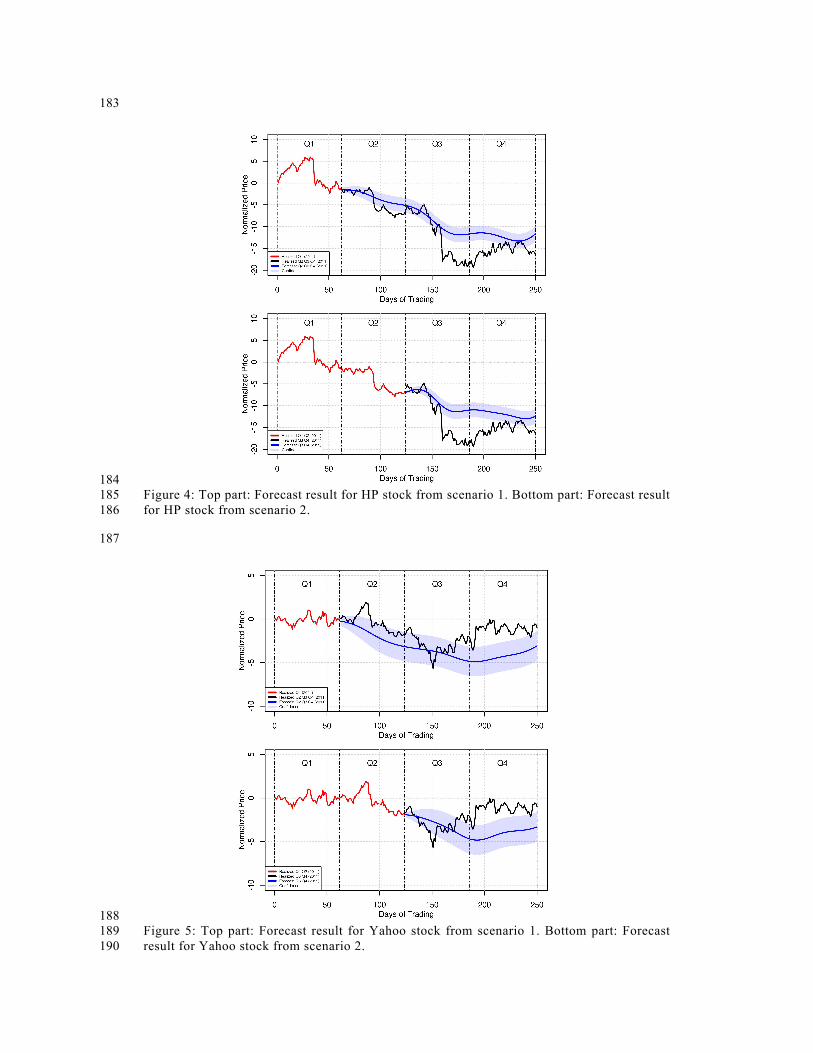
The forecast results for the three stocks (HP, Yahoo and Starbucks) are shown in Figure 4, 5, 171 6. The “blue” lines show the forecast prices and the “black” lines show the actual prices. In 172 Figure 4, the results of scenario 1 (top part) shows drop in HP stock prices in Q2, Q3 and Q4 173 of 2011. Also, scenario 2 (bottom part) confirms this drop until the end of 2011. Based on 174 that, investors should not buy HP stock in 2011 and if they already did, it is highly 175 recommended to sell it to minimize their loss. Although, the model could not predict the 176 high drop in Q3, it keeps following the trend of the actual prices. 177
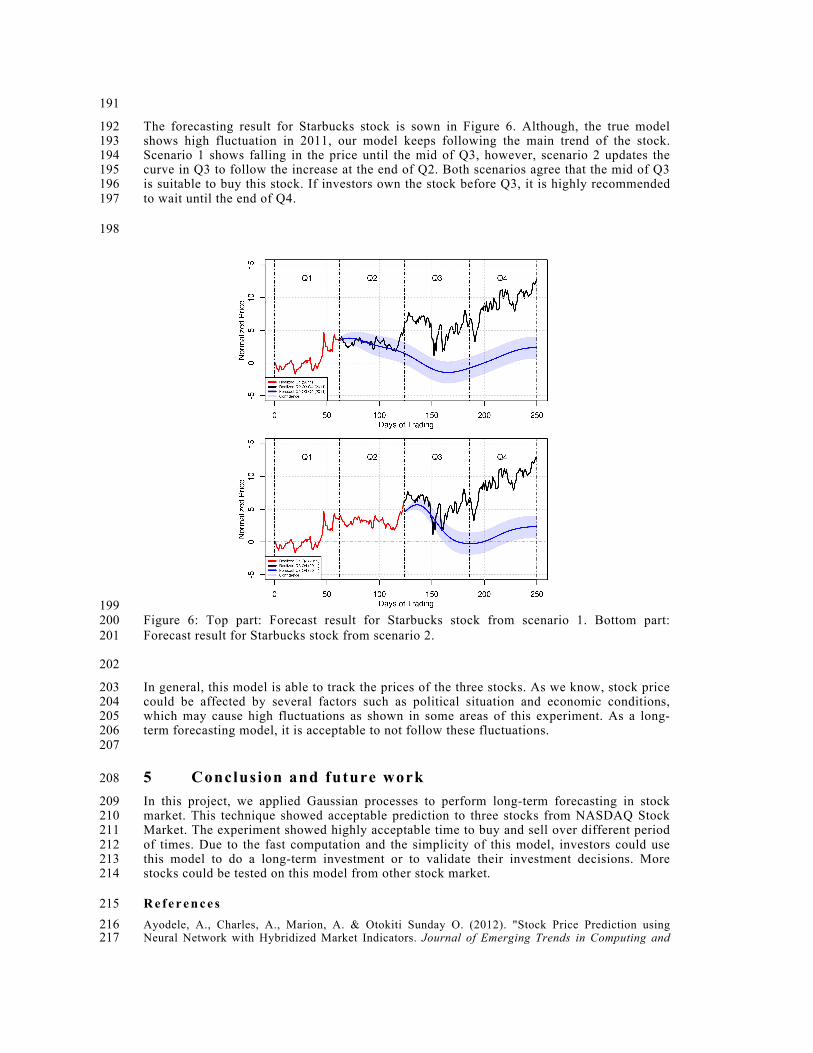
Figure 5 shows the forecast price of Yahoo stock. The results of scenario 1 (top part) show 178 slight decrease in Yahoo stock prices in Q2 and Q3 of 2011; however, the price shows some 179 improvement in Q4. The second scenario shows Yahoo stock prices reverse direction in Q4. 180 Investors can take the risk and buy in Q3 or wait until the beginning of Q4. The forecasting 181 model is able to track the trend of this stock most of the time. 182
183
184 Figure 4: Top part: Forecast result for HP stock from scenario 1. Bottom part: Forecast result 185 for HP stock from scenario 2. 186
187
188 Figure 5: Top part: Forecast result for Yahoo stock from scenario 1. Bottom part: Forecast 189 result for Yahoo stock from scenario 2. 190
191
The forecasting result for Starbucks stock is sown in Figure 6. Although, the true model 192 shows high fluctuation in 2011, our model keeps following the main trend of the stock. 193 Scenario 1 shows falling in the price until the mid of Q3, however, scenario 2 updates the 194 curve in Q3 to follow the increase at the end of Q2. Both scenarios agree that the mid of Q3 195 is suitable to buy this stock. If investors own the stock before Q3, it is highly recommended 196 to wait until the end of Q4. 197
198
199 Figure 6: Top part: Forecast result for Starbucks stock from scenario 1. Bottom part: 200 Forecast result for Starbucks stock from scenario 2. 201
202
In general, this model is able to track the prices of the three stocks. As we know, stock price 203 could be affected by several factors such as political situation and economic conditions, 204 which may cause high fluctuations as shown in some areas of this experiment. As a long-205 term forecasting model, it is acceptable to not follow these fluctuations. 206 207
5 Conclusion and future work 208
In this project, we applied Gaussian processes to perform long-term forecasting in stock 209 market. This technique showed acceptable prediction to three stocks from NASDAQ Stock 210 Market. The experiment showed highly acceptable time to buy and sell over different period 211 of times. Due to the fast computation and the simplicity of this model, investors could use 212 this model to do a long-term investment or to validate their investment decisions. More 213 stocks could be tested on this model from other stock market. 214
R e f e r e n c e s 215 Ayodele, A., Charles, A., Marion, A. & Otokiti Sunday O. (2012). "Stock Price Prediction using 216 Neural Network with Hybridized Market Indicators. Journal of Emerging Trends in Computing and 217

Information Sciences, VOL. 3: 1, 1-9. 218 Chapados, N. & Bengio, Y. (2007). Forecasting Commodity Contract Spreads with Gaussian Process, 219 in 13th International Conference on Computing in Economics and Finance, June 14 - 16, 2007, 220 Montréal, Quebec, Canada. 221 Groot, P., Lucas, P. & Paul van den Bosch. (2011). Multiple-step Time Series Forecasting with Sparse 222 Gaussian Processes, BNAIC, 1-8. 223 Jeffrey, A. & Kass, D. (2012). The Little Book of Stock Market Cycles (Little Books. Big Profits), 224 Wiley. 225 Mori, H. & Ohmi M. (2005).Probabilistic short-term load forecasting with Gaussian processes. 226 Proceedings of the 13th International Conference on Intelligent Systems Application to Power System 227 (ISAP), November 6-10, 2005, Arlington, Virginia, 452-457. 228
Ou, P. & Wang, H. (2009). Prediction of market index movement by ten data mining techniques. 229 Modern Applied Science, 3:12, 28–42. 230 Ou, P. & Wang, H. (2011). Modeling and Forecasting Stock Market Volatility by Gaussian Processes 231 based on GARCH, EGARCH and GJR Models. Proceedings of the World Congress on Engineering, 232 July 6-8, 2011, London, U.K., 338-342. 233 Preethi, G. & Santhi, B. (2012).Stock market forecasting techniques: a survey. Journal of Theoretical 234 and Applied Information Technology, 46:1, 24-30. 235 Rasmussen, C. & Nickisch, H. (2006). Gaussian Processes for Machine Learning (GPML) Toolbox. 236 Journal of Machine Learning Research, 11, 3011-3015. 237 Todd, M. & Correa, A. (2007). Gaussian Process Regression Models for Predicting Stock Trends. 238 Technical Report on MIT University. 239 Wikipedia: The free encyclopedia. (2013) Stock market. Retrieved April 2, 2013, from 240 http://en.wikipedia.org/wiki/Stock_market. 241 World Capital Markets – Size of Global Stock and Bond Markets. Retrieved April 1, 2013, from 242 http://qvmgroup.com/invest/2012/04/02/world-capital-markets-size-of-global-stock-and-bond-243 markets/. 244 245
Related Documents