Long Term Financial Planning and Budget Forecasting Jay Bernas, P.E. Chief Financial Officer

Welcome message from author
This document is posted to help you gain knowledge. Please leave a comment to let me know what you think about it! Share it to your friends and learn new things together.
Transcript
Long Term Financial Planningand Budget Forecasting
Jay Bernas, P.E.Chief Financial Officer
2
Agenda
• Background
• Current Challenges
• Building the Financial Forecast
• Beneficial uses of the Financial Model
HRSD
3

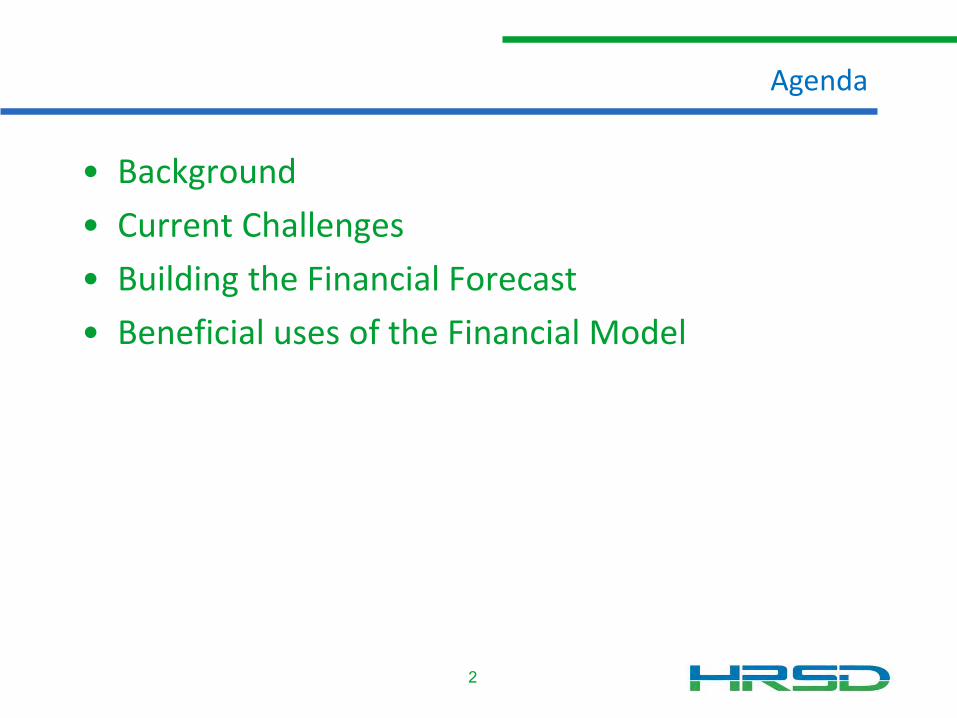
HRSD Overview
4
• Provides wastewater treatment for 18 cities and counties (249 mgdtreatment capacity)
• Serves 1.7 million people (20% of all Virginians)
• Independent political subdivision with rate setting authority
• Governor appointed Commission

5
HRSD by the Numbers
• Accounts 470,000
• FY19 Revenues $310M
• FY19 Opex $160M
• FY19 Capex $134M
• 20 yr CIP $5.2B
• FY19 Rate per CCF $5.37
• FY19 Rate per k-gals $7.18

Current Challenges
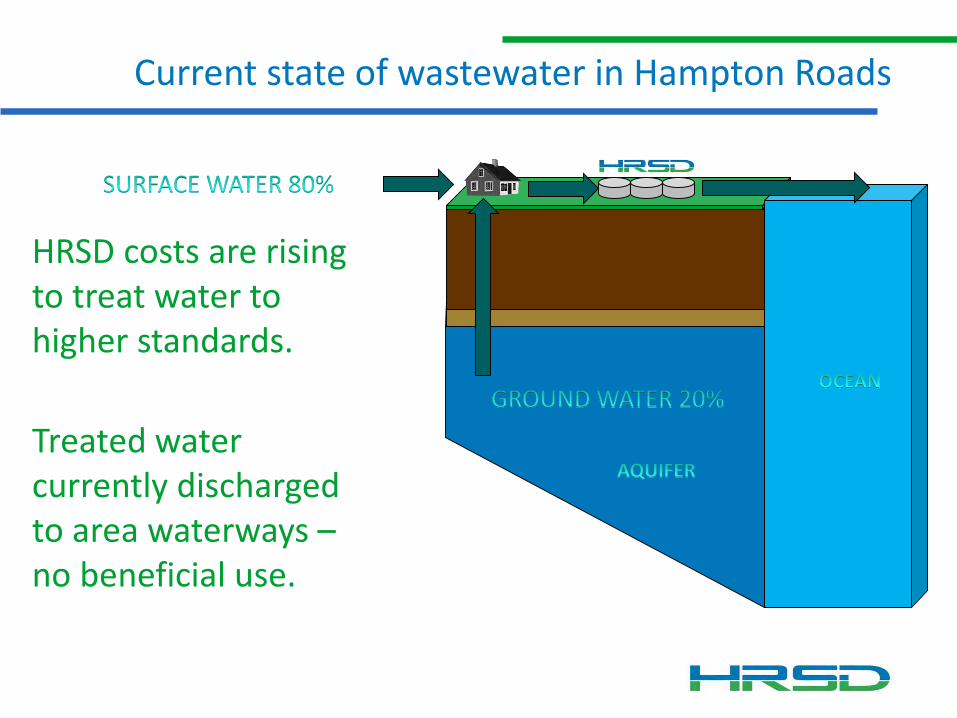
HRSD costs are rising to treat water to higher standards.
Treated water currently discharged to area waterways –no beneficial use.
Current state of wastewater in Hampton Roads

• Water recycling project
• Regulatory stability
• Benefits
– Reduce nutrient discharges to the Bay (90% reduction)
– Provide a sustainable supply of groundwater
– Reduce the rate of land subsidence (sea-level rise)
– Protect the groundwater from saltwater contamination
Sustainable Water Initiative For Tomorrow
8
Advanced
Water
Treatment

9
Research and Demonstration Facility
• Replenishing the aquifer with 1 million gallons per day
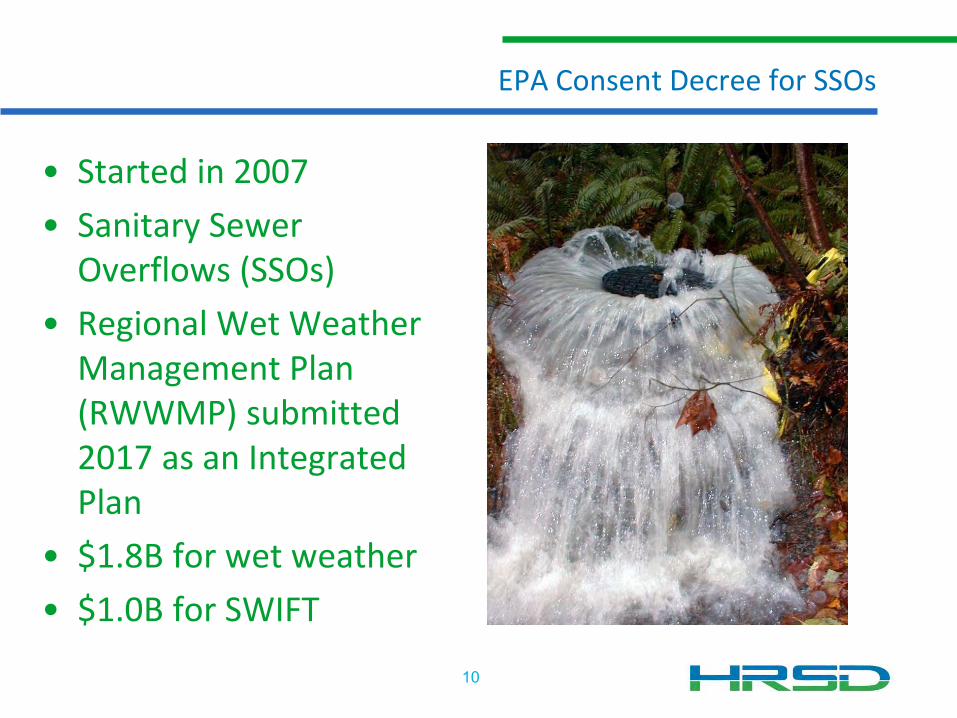
EPA Consent Decree for SSOs
10
• Started in 2007
• Sanitary Sewer Overflows (SSOs)
• Regional Wet Weather Management Plan (RWWMP) submitted 2017 as an Integrated Plan
• $1.8B for wet weather
• $1.0B for SWIFT

11
Adaptive Management Integrated Plan
SWIFT (~$1B)
Plan
Approval
20192030 TBD
Final Measures Plan
($ TBD)
Pathogen Tracking Program
($10M)
2028
High Priority Wet Weather Projects
(~$200 M)
Program Update
Optimization Assessment
Sequence Places the Greatest Water Quality Benefits First
100
105
110
115
120
125
130
1.50
1.55
1.60
1.65
1.70
1.75
1.80
2009 2010 2011 2012 2013 2014 2015 2016 2017
Flo
w, M
GD
Po
pu
lati
on
Mill
ion
s
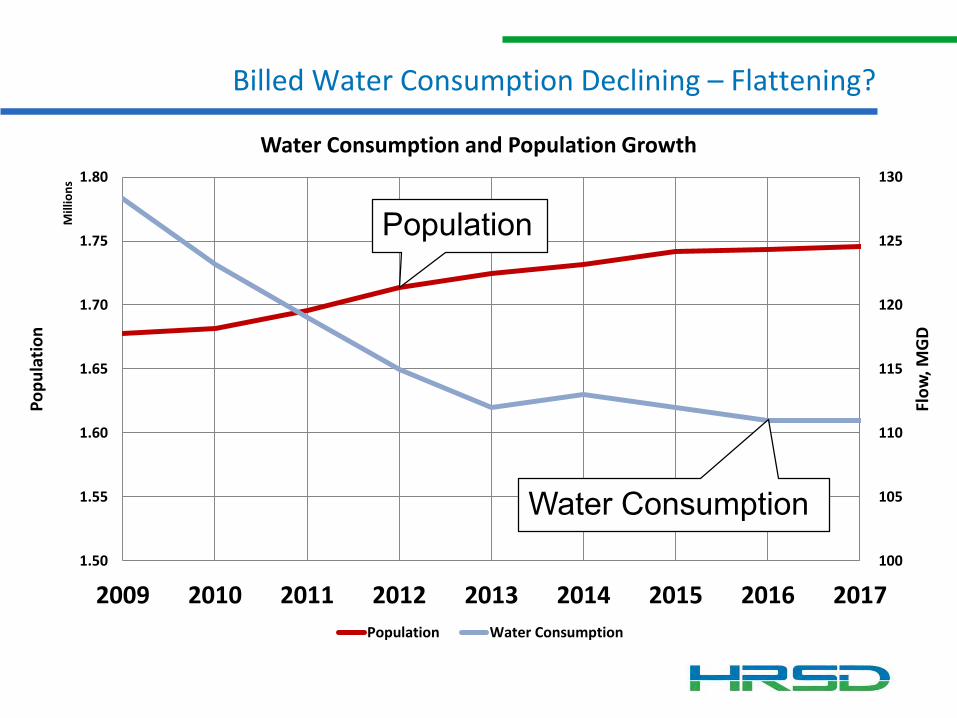
Water Consumption and Population Growth
Population Water Consumption
Billed Water Consumption Declining – Flattening?
Population
Water Consumption

Building the Financial Forecast
(Not a Community Affordability Model)
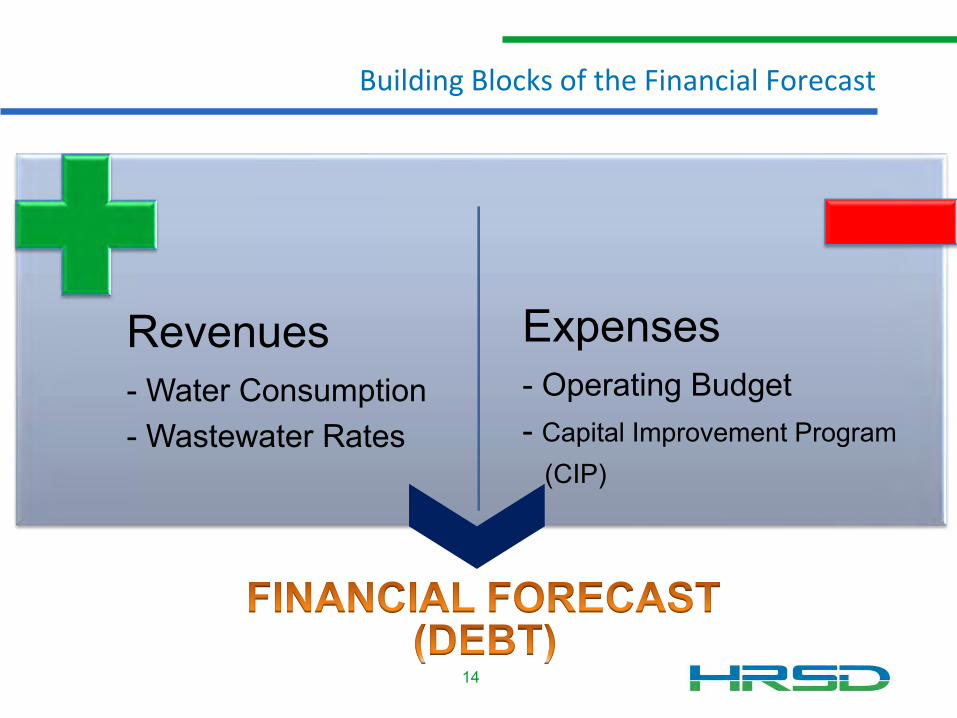
Building Blocks of the Financial Forecast
14
Revenues- Water Consumption- Wastewater Rates
Expenses- Operating Budget- Capital Improvement Program
(CIP)
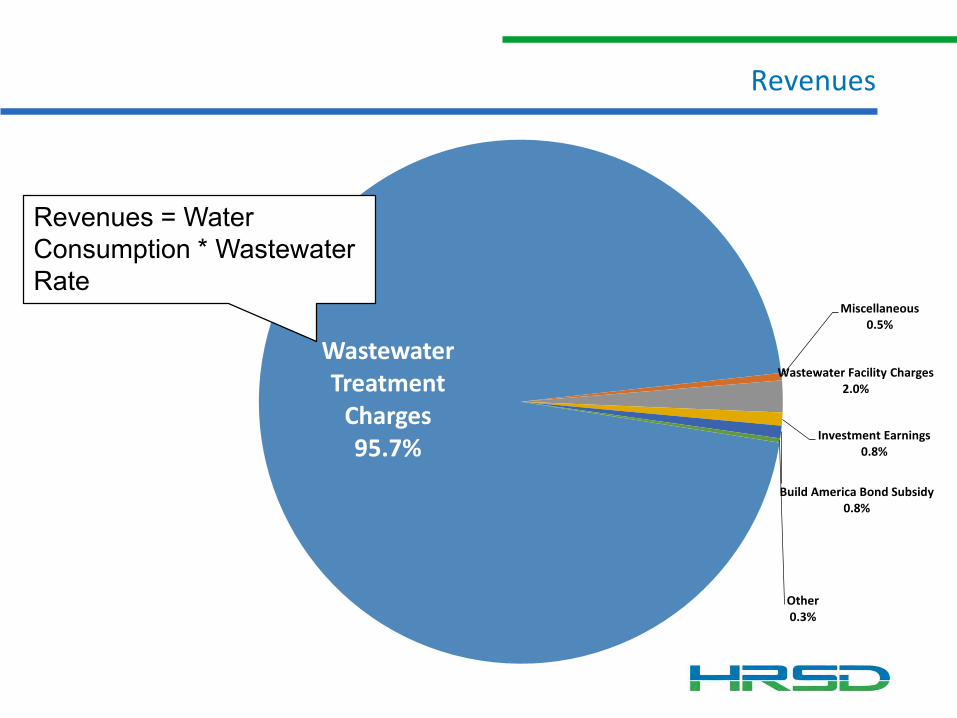
Revenues
Wastewater Treatment
Charges95.7%
Miscellaneous0.5%
Wastewater Facility Charges2.0%
Investment Earnings0.8%
Build America Bond Subsidy0.8%
Other0.3%
Revenues = Water Consumption * Wastewater Rate

Estimating Water Consumption – Assume 1% YOY decline
16
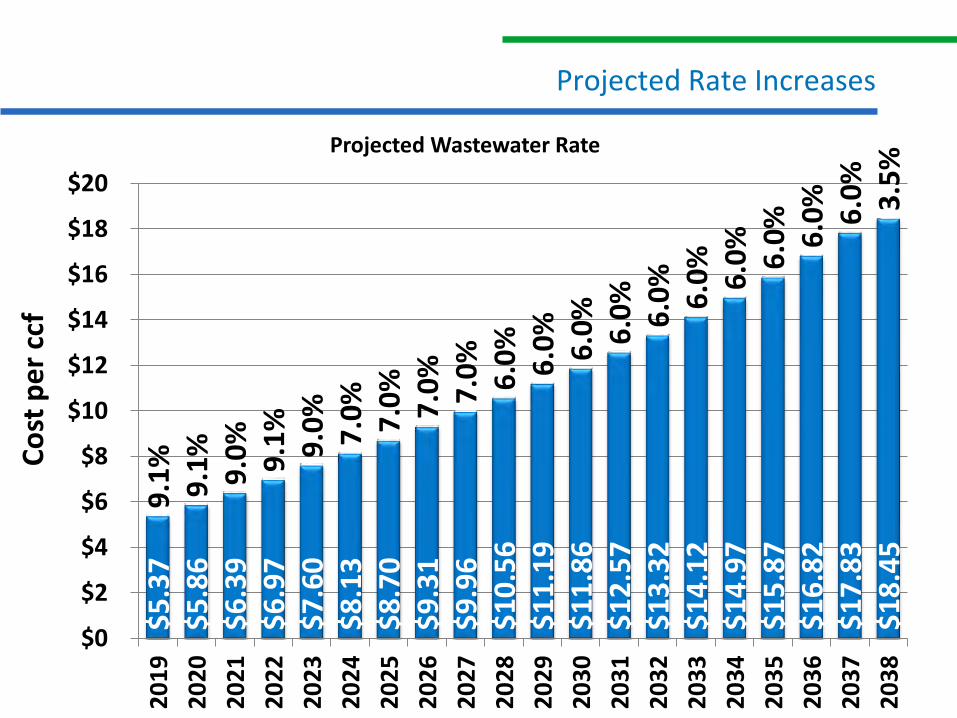
Projected Rate Increases
$5
.37
$
5.8
6
$6
.39
$
6.9
7
$7
.60
$
8.1
3
$8
.70
$
9.3
1
$9
.96
$
10
.56
$
11
.19
$
11
.86
$
12
.57
$
13
.32
$
14
.12
$
14
.97
$
15
.87
$
16
.82
$
17
.83
$
18
.45
9.1
%9
.1%
9.0
%9
.1%
9.0
%7
.0%
7.0
%7
.0%
7.0
%6
.0%
6.0
%6
.0%
6.0
%6
.0%
6.0
%6
.0%
6.0
%6
.0%
6.0
%3
.5%
$0
$2
$4
$6
$8
$10
$12
$14
$16
$18
$202
01
9
20
20
20
21
20
22
20
23
20
24
20
25
20
26
20
27
20
28
20
29
20
30
20
31
20
32
20
33
20
34
20
35
20
36
20
37
20
38
Co
st p
er
ccf
Projected Wastewater Rate
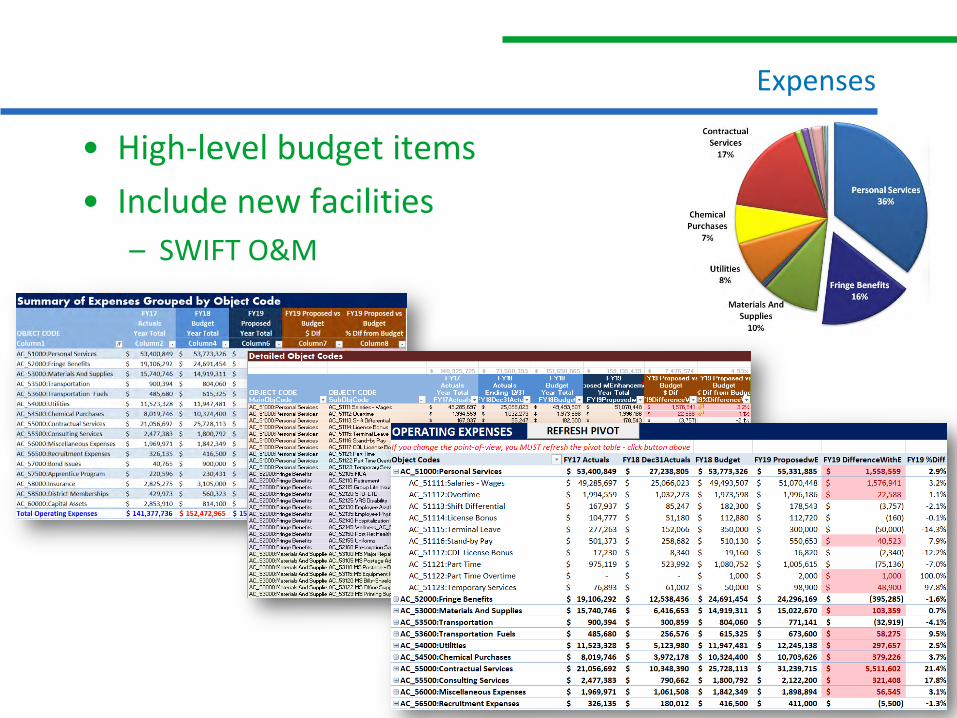
• High-level budget items
• Include new facilities
– SWIFT O&M
Expenses

CAFR Trend Analysis – Line Item Inflation Rates
19
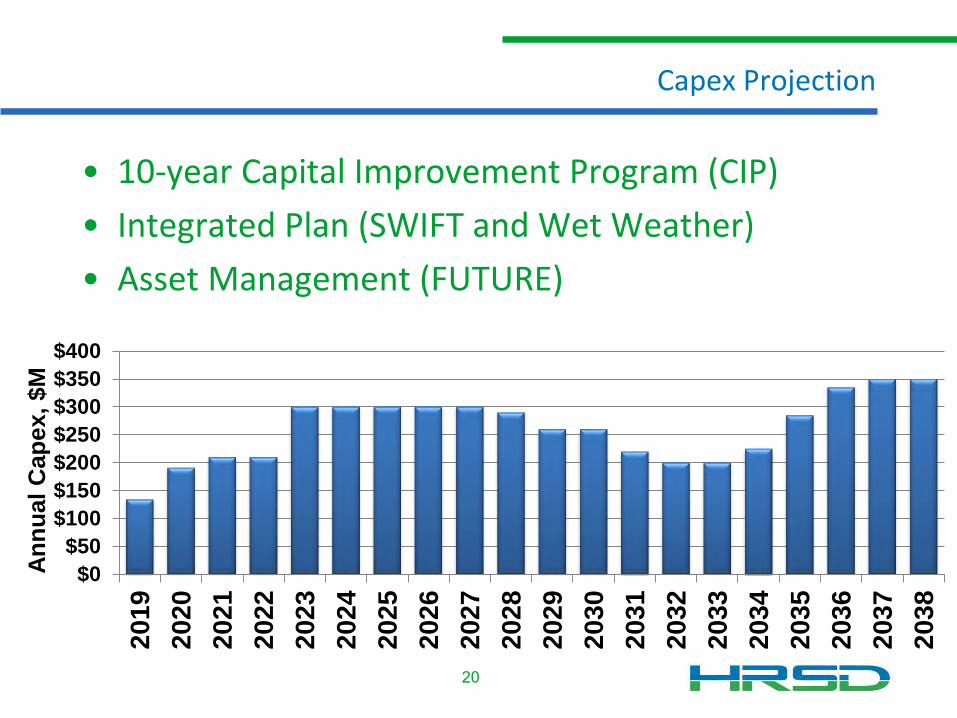
• 10-year Capital Improvement Program (CIP)
• Integrated Plan (SWIFT and Wet Weather)
• Asset Management (FUTURE)
Capex Projection
20
$0
$50
$100
$150
$200
$250
$300
$350
$400
201
9
202
0
202
1
202
2
202
3
202
4
202
5
202
6
202
7
202
8
202
9
203
0
203
1
203
2
203
3
2034
203
5
2036
203
7
2038
An
nu
al
Cap
ex,
$M

– How much income will you generate to pay Debt Service (principal + interest)?
– Will bond investors get paid back?
– Higher is better
Key Ratios
21
Target = 2.0x
Policy = 1.4x
REVENUES - EXPENSESPrincipal + Interest
Debt ServiceCoverage Ratio
=

Liquidity (Days Cash on Hand)
22
• Liquidity indicates financial flexibility to pay near-term obligations and margin of safety
• Days Cash on Hand (DCOH)
• How many days can you operate with available cash if no revenue is coming in?
DCOH =Unrestricted Cash and Investments
Operating Cost per Day
HRSD POLICY
Min = 270 DCOH
Max = 365 DCOH

• Calculate Net Revenues– Revenues assume a 1% decline in water
consumption until 40 gal per capita per day
• Model Calculates Cash Distribution1. Year 1 Debt Service
2. 365 Days Cash on Hand (high-end of policy)
3. Risk Management Reserve (Self-insured)
4. Cash for CIP (PAYGO)
5. Remaining requires DEBT
6. Year 2 Debt Service, etc.
Model Calculations
23
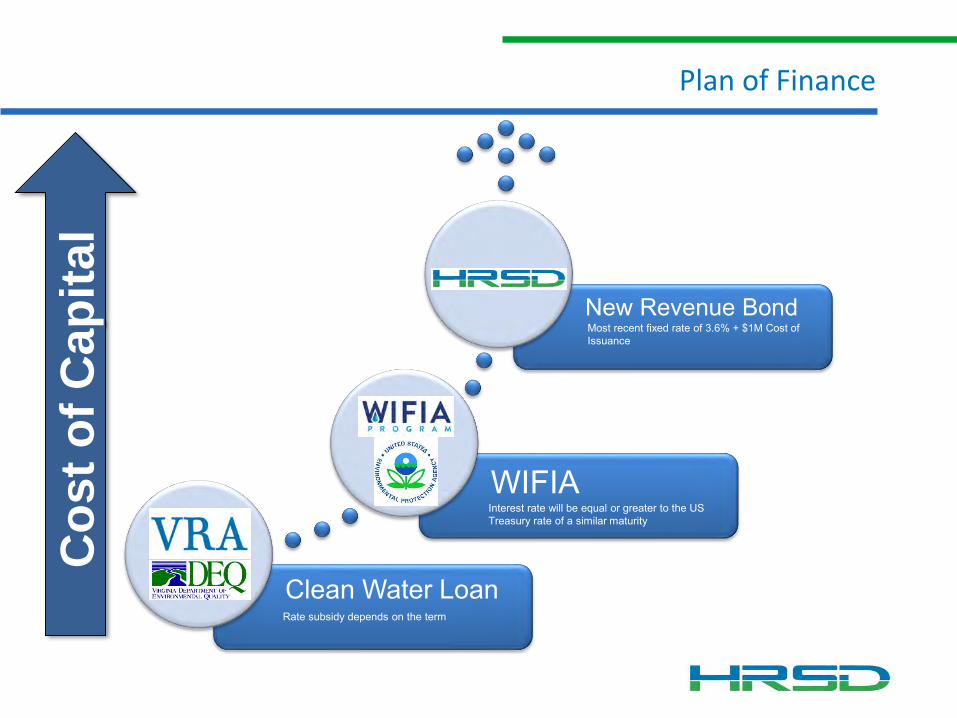
Plan of Finance
24
Clean Water Loan
WIFIA
New Revenue Bond
Co
st
of
Ca
pit
al
Interest rate will be equal or greater to the US Treasury rate of a similar maturity
Rate subsidy depends on the term
Most recent fixed rate of 3.6% + $1M Cost of Issuance
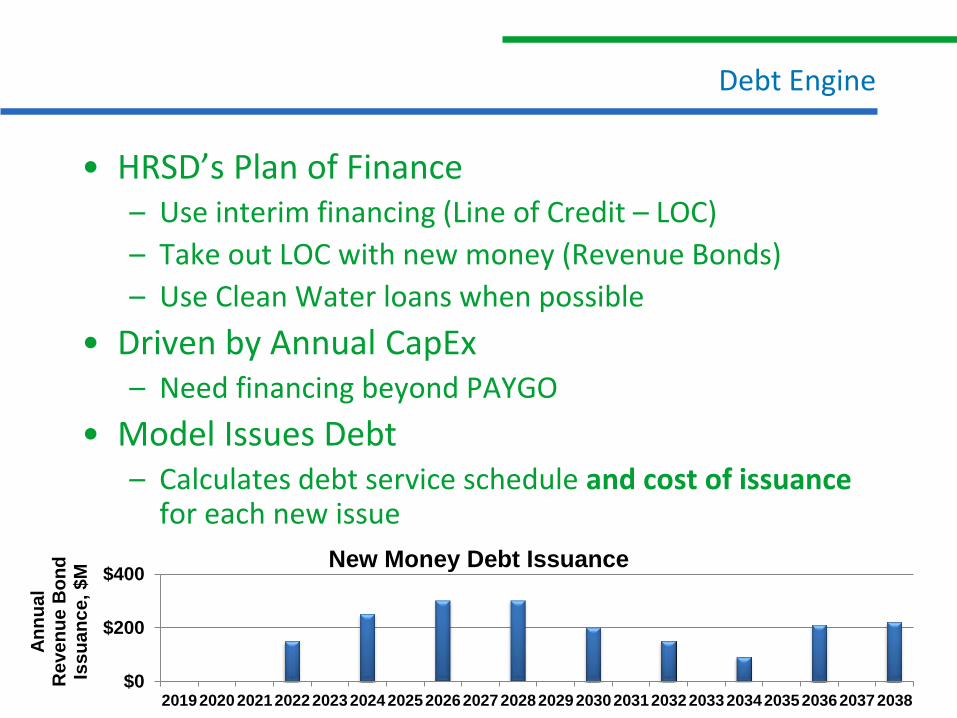
• HRSD’s Plan of Finance– Use interim financing (Line of Credit – LOC)
– Take out LOC with new money (Revenue Bonds)
– Use Clean Water loans when possible
• Driven by Annual CapEx– Need financing beyond PAYGO
• Model Issues Debt– Calculates debt service schedule and cost of issuance
for each new issue
Debt Engine
25$0
$200
$400
20192020202120222023202420252026202720282029203020312032203320342035203620372038
An
nu
al
Re
ve
nu
e B
on
d
Iss
ua
nc
e, $M
New Money Debt Issuance

PFM’s Future Perfect Model Pro Forma
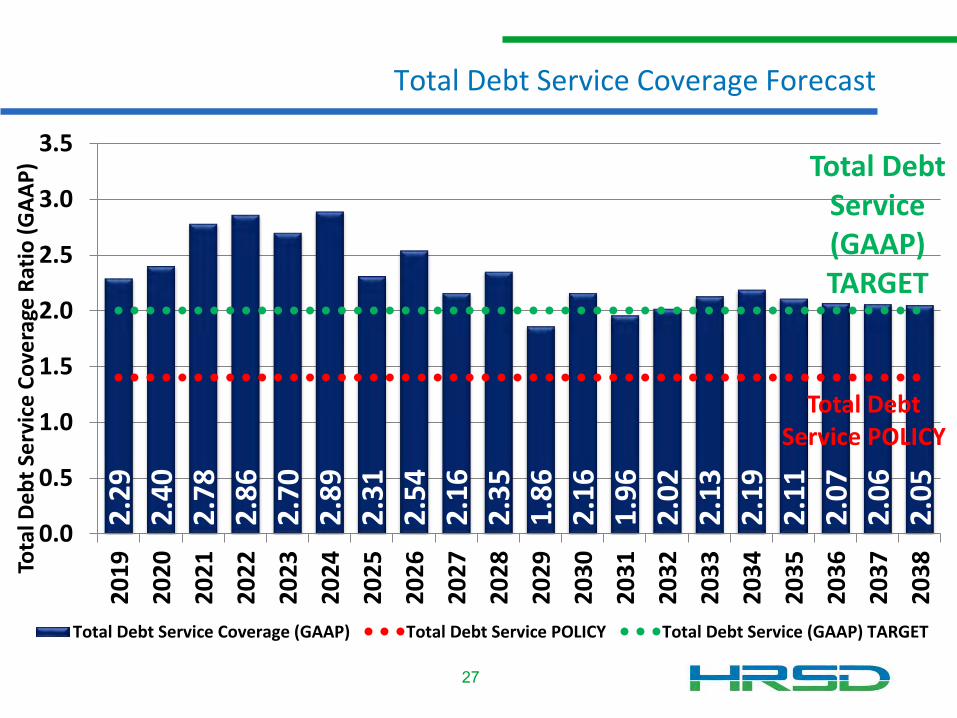
Total Debt Service Coverage Forecast
27
2.2
9
2.4
0
2.7
8
2.8
6
2.7
0
2.8
9
2.3
1
2.5
4
2.1
6
2.3
5
1.8
6
2.1
6
1.9
6
2.0
2
2.1
3
2.1
9
2.1
1
2.0
7
2.0
6
2.0
5
Total Debt Service POLICY
Total Debt Service (GAAP) TARGET
0.0
0.5
1.0
1.5
2.0
2.5
3.0
3.52
01
9
20
20
20
21
20
22
20
23
20
24
20
25
20
26
20
27
20
28
20
29
20
30
20
31
20
32
20
33
20
34
20
35
20
36
20
37
20
38To
tal D
eb
t Se
rvic
e C
ove
rage
Rat
io (
GA
AP
)
Total Debt Service Coverage (GAAP) Total Debt Service POLICY Total Debt Service (GAAP) TARGET
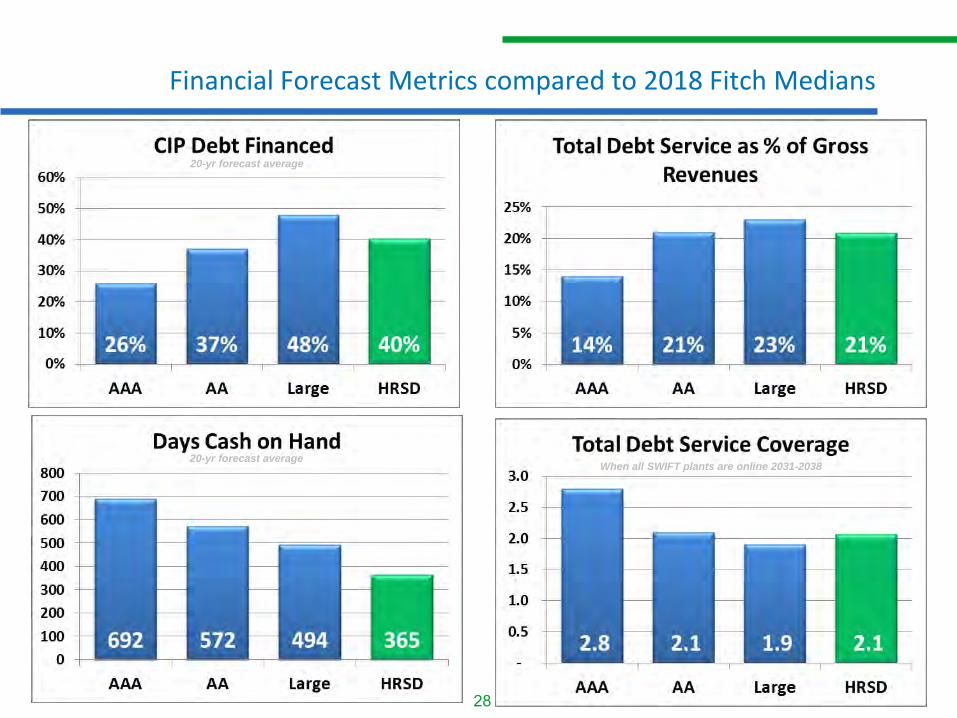
Financial Forecast Metrics compared to 2018 Fitch Medians
28
20-yr forecast averageWhen all SWIFT plants are online 2031-2038
20-yr forecast average
20-yr forecast average

• We underspend the CIP 10% annually for the next 20 years?
– Year 2038 DSCR = 3.11x vs 2.05x
• Water consumption is flat for the next 20 years?
– Year 2038 DSCR = 4.61x vs 2.05x
– Additional $1.3 billion in revenue
• What if inflation is higher (4.3% vs 3.8%)?
– Year 2038 DSCR = 1.62x vs 2.05x
Scenarios
29

• Consent Decree negotiations/deadlines
• Capital Planning – how much can we afford?
• Budgeting – Communicating YOY inflation impacts
• Sensitivity of key variables – Scenario Planning and Risk Management
• Confidence in Financial Sustainability
Power of the Financial Model
30

Historical Total Debt Service Coverage Ratio (DSCR)
31
1.40 1.45 1.85 2.000.0
0.5
1.0
1.5
2.0
2.5
2014 2015 2016 2017
Tota
l De
bt
Serv
ice
Co
vera
ge
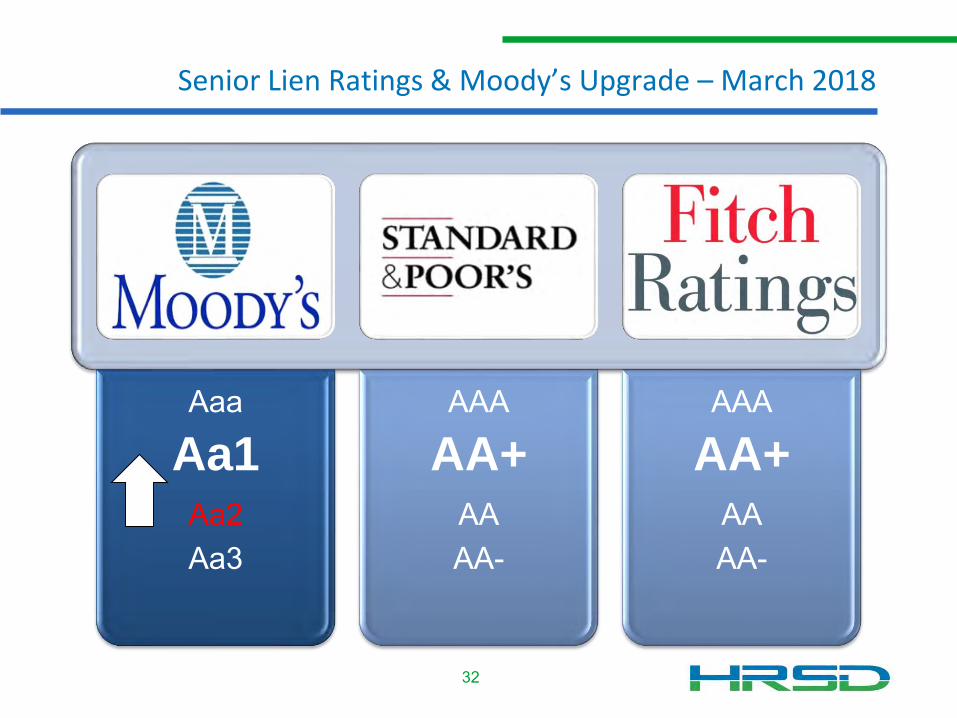
Aaa
Aa1Aa2Aa3
AAA
AA+AAAA-
AAA
AA+AAAA-
Senior Lien Ratings & Moody’s Upgrade – March 2018
32
Related Documents