Long-Term Alterations in Adiposity Affect the Expression of Melanin-Concentrating Hormone and Enkephalin But Not Proopiomelanocortin in the Hypothalamus of Ovariectomized Ewes* BELINDA A. HENRY , ALAN J. TILBROOK, FRANK R. DUNSHEA, ALEXANDRA RAO, DOMINIQUE BLACHE, GRAEME B. MARTIN, AND IAIN J. CLARKE Prince Henry’s Institute of Medical Research (B.A.H., A.R., I.J.C.) and Department of Physiology (A.J.T.), Monash University, Clayton, Victoria 3168, Australia; Agriculture Victoria (F.R.D.), Victorian Institute of Animal Science, Werribee, Victoria 3030, Australia; and Animal Science (D.B., G.B.M.), Faculty of Agriculture, University of Western Australia, Nedlands, Western Australia 6009, Australia ABSTRACT We have developed a ruminant model to study long-term alter- ations in adiposity on the expression of appetite-regulating peptides in the hypothalamus. In this model endocrine and metabolic status are fully defined as well as body composition. The current study sought to define the effects of altered adiposity on the expression of genes for neuropeptide Y (NPY), POMC, enkephalin (ENK), and mel- anin-concentrating hormone (MCH). Ovariectomized ewes with high (60 6 1 kg) (FAT) or low (37 6 3 kg) body weights (THIN) were blood sampled every 10 min for 8 h to determine metabolic and endocrine status. The animals were then killed and the brains perfused for in situ hybridization. Body composition analysis was performed on the carcass using dual energy x-ray absorptiometry; this indicated that the FAT animals were 36 6 1% fat, whereas the THIN animals were 15 6 2% fat. The LH interpulse interval was lower and mean GH concentrations were higher in the THIN animals; cortisol and TSH levels were not different between the two groups but free T 4 and free T 3 levels were lower; the FT 3 :FT 4 ratio was higher in THIN ewes. Levels of insulin, lactate, and nonesterified fatty acids were lower in the THIN group, and plasma glucose and urea concentrations were similar in THIN and FAT animals. Levels of gene expression of NPY and MCH were higher in THIN ewes. POMC expression was similar in the two groups. In the THIN animals, ENK expression was lower in the paraventricular and ventromedial nuclei but higher in the periventricular region. In conclusion, we have shown that alterations in adiposity influence the expression of appetite-regulating peptides in the absence of ovarian steroids. The appetite stimulators, NPY and MCH, appear to be involved in the metabolic response to altered adiposity, whereas ENK in the periventricular region may be linked to the secretion of GH and possibly LH. Our results suggest that altered expression of appetite- regulating peptides can be linked with the endocrine and metabolic adaptations that occur with long-term changes in adiposity. (Endocrinology 141: 1506 –1514, 2000) V ARIOUS PEPTIDES IN the hypothalamus are involved in the regulation of appetite as well as endocrine func- tion. Nutritional status can alter the expression of appetite- regulating peptides but most studies, especially in rodents, have investigated acute changes with fasting, and the effects of long-term changes in body weight or adiposity remain to be fully defined. In this regard, some progress has been made using sheep models, and the expression of neuropeptide Y (NPY) in the arcuate nucleus (ARC) has been shown to in- crease with long-term food restriction of castrated male and female sheep and ewe lambs (1–3). There are, however, some conflicting data since Prasad et al. (4) found no effect of undernutrition on NPY levels using the push-pull perfusion technique. In addition to its role in appetite regulation, NPY subserves other functions and has been implicated in the regulation of LH secretion, particularly the generation of the preovulatory surge of LH (5, 6). Other peptides that may play a role in appetite regulation include the opioids and various ligands for the melanocortin receptors. The neuropeptides b-endorphin (b-end), ACTH, and a-MSH are encoded by the POMC gene, and all are thought to be involved in the regulation of appetite (7–9) and in neuroendocrine function (5, 10). For example, central ad- ministration of b-end has been shown to stimulate food in- take (11) through the m- and d-opioid receptor subtypes (12, 13). Long-term food restriction has been shown to decrease the expression of POMC in the ARC (3) and to reduce b-end secretion in the posterior-lateral median eminence of ewe lambs (4). Enkephalins (ENKs) are also opioid peptides that bind predominantly to the d-subtype of the opioid receptor and stimulate feeding in sheep (11) and rodents (7). Melanin-concentrating hormone (MCH) is a newly iden- tified peptide that appears to be an important regulator of energy homeostasis. Studies investigating the effect of MCH have produced conflicting results, with initial indications of an inhibitory effect on food intake (14), whereas more recent Received September 7, 1999. Address all correspondence and requests for reprints to: Iain J. Clarke, Ph.D., Prince Henry’s Institute, Monash Medical Centre, Level 4, Block E, 246 Clayton Road, P.O. Box 5152, Victoria 3168, Australia. E-mail: [email protected]. * Presented in part at the 81st Annual Meeting of The Endocrine Society, San Diego, California, 1999. This work was supported by the National Health and Medical Research Council of Australia. Supported by a stipend from Prince Henry’s Institute of Medical Research. 0013-7227/00/$03.00/0 Vol. 141, No. 4 Endocrinology Printed in U.S.A. Copyright © 2000 by The Endocrine Society 1506

Welcome message from author
This document is posted to help you gain knowledge. Please leave a comment to let me know what you think about it! Share it to your friends and learn new things together.
Transcript
Long-Term Alterations in Adiposity Affect theExpression of Melanin-Concentrating Hormone andEnkephalin But Not Proopiomelanocortin in theHypothalamus of Ovariectomized Ewes*
BELINDA A. HENRY†, ALAN J. TILBROOK, FRANK R. DUNSHEA,ALEXANDRA RAO, DOMINIQUE BLACHE, GRAEME B. MARTIN, AND
IAIN J. CLARKE
Prince Henry’s Institute of Medical Research (B.A.H., A.R., I.J.C.) and Department of Physiology(A.J.T.), Monash University, Clayton, Victoria 3168, Australia; Agriculture Victoria (F.R.D.), VictorianInstitute of Animal Science, Werribee, Victoria 3030, Australia; and Animal Science (D.B., G.B.M.),Faculty of Agriculture, University of Western Australia, Nedlands, Western Australia 6009, Australia
ABSTRACTWe have developed a ruminant model to study long-term alter-
ations in adiposity on the expression of appetite-regulating peptidesin the hypothalamus. In this model endocrine and metabolic statusare fully defined as well as body composition. The current studysought to define the effects of altered adiposity on the expression ofgenes for neuropeptide Y (NPY), POMC, enkephalin (ENK), and mel-anin-concentrating hormone (MCH). Ovariectomized ewes with high(60 6 1 kg) (FAT) or low (37 6 3 kg) body weights (THIN) were bloodsampled every 10 min for 8 h to determine metabolic and endocrinestatus. The animals were then killed and the brains perfused for insitu hybridization. Body composition analysis was performed on thecarcass using dual energy x-ray absorptiometry; this indicated thatthe FAT animals were 36 6 1% fat, whereas the THIN animals were15 6 2% fat. The LH interpulse interval was lower and mean GHconcentrations were higher in the THIN animals; cortisol and TSHlevels were not different between the two groups but free T4 and free
T3 levels were lower; the FT3:FT4 ratio was higher in THIN ewes.Levels of insulin, lactate, and nonesterified fatty acids were lower inthe THIN group, and plasma glucose and urea concentrations weresimilar in THIN and FAT animals. Levels of gene expression of NPYand MCH were higher in THIN ewes. POMC expression was similarin the two groups. In the THIN animals, ENK expression was lowerin the paraventricular and ventromedial nuclei but higher in theperiventricular region. In conclusion, we have shown that alterationsin adiposity influence the expression of appetite-regulating peptidesin the absence of ovarian steroids. The appetite stimulators, NPY andMCH, appear to be involved in the metabolic response to alteredadiposity, whereas ENK in the periventricular region may be linkedto the secretion of GH and possibly LH. Our results suggest thataltered expression of appetite- regulating peptides can be linked withthe endocrine and metabolic adaptations that occur with long-termchanges in adiposity. (Endocrinology 141: 1506–1514, 2000)
VARIOUS PEPTIDES IN the hypothalamus are involvedin the regulation of appetite as well as endocrine func-
tion. Nutritional status can alter the expression of appetite-regulating peptides but most studies, especially in rodents,have investigated acute changes with fasting, and the effectsof long-term changes in body weight or adiposity remain tobe fully defined. In this regard, some progress has been madeusing sheep models, and the expression of neuropeptide Y(NPY) in the arcuate nucleus (ARC) has been shown to in-crease with long-term food restriction of castrated male andfemale sheep and ewe lambs (1–3). There are, however, someconflicting data since Prasad et al. (4) found no effect ofundernutrition on NPY levels using the push-pull perfusion
technique. In addition to its role in appetite regulation, NPYsubserves other functions and has been implicated in theregulation of LH secretion, particularly the generation of thepreovulatory surge of LH (5, 6).
Other peptides that may play a role in appetite regulationinclude the opioids and various ligands for the melanocortinreceptors. The neuropeptides b-endorphin (b-end), ACTH,and a-MSH are encoded by the POMC gene, and all arethought to be involved in the regulation of appetite (7–9) andin neuroendocrine function (5, 10). For example, central ad-ministration of b-end has been shown to stimulate food in-take (11) through the m- and d-opioid receptor subtypes (12,13). Long-term food restriction has been shown to decreasethe expression of POMC in the ARC (3) and to reduce b-endsecretion in the posterior-lateral median eminence of ewelambs (4). Enkephalins (ENKs) are also opioid peptides thatbind predominantly to the d-subtype of the opioid receptorand stimulate feeding in sheep (11) and rodents (7).
Melanin-concentrating hormone (MCH) is a newly iden-tified peptide that appears to be an important regulator ofenergy homeostasis. Studies investigating the effect of MCHhave produced conflicting results, with initial indications ofan inhibitory effect on food intake (14), whereas more recent
Received September 7, 1999.Address all correspondence and requests for reprints to: Iain J. Clarke,
Ph.D., Prince Henry’s Institute, Monash Medical Centre, Level 4, BlockE, 246 Clayton Road, P.O. Box 5152, Victoria 3168, Australia. E-mail:[email protected].
* Presented in part at the 81st Annual Meeting of The EndocrineSociety, San Diego, California, 1999. This work was supported by theNational Health and Medical Research Council of Australia.
† Supported by a stipend from Prince Henry’s Institute of MedicalResearch.
0013-7227/00/$03.00/0 Vol. 141, No. 4Endocrinology Printed in U.S.A.Copyright © 2000 by The Endocrine Society
1506

studies suggest a stimulatory role (15, 16). MCH gene knock-out mice are hypophagic and lean, supporting the notion thatthe neuropeptide stimulates food intake (17). The POMC-derived peptides, ACTH and a-MSH, bind to the melano-cortin 3-receptor (MC3-R) and melanocortin 4-receptor(MC4-R) and have also been implicated in the regulation offeeding behavior (18, 19). MCH and a-MSH have both beenshown to elicit mutually antagonistic effects on food intakeand the stress axis, although MCH is thought not to act oneither MC3-R or MC4-R (20) but on a novel MCH receptor(21). The POMC-derived neuropeptides, ENK, and MCH allinteract with the neuroendocrine system, having effects onthe reproductive, GH, and stress axes (5, 22- 24).
We have developed a ruminant model to investigate theeffects of long-term alterations in body weight (adiposity) onthe expression of appetite-regulating peptides. This allowsvery accurate definition of endocrine and metabolic param-eters (through serial blood sampling) as well as body com-position. In the present study, we sought to relate all of thesefactors to alterations in the expression of hypothalamic pep-tides involved in opioid and MC signaling, viz. POMC, ENK,and MCH. The expression of NPY was also measured as anindicator of response to altered body weight, since increasedexpression in animals of low body weight is well docu-mented (1–3).
Materials and MethodsEthics
This work was approved in advance by the Animal ExperimentationEthics Committees of Monash University and Victoria Institute of An-imal Science.
Experimental design
Adult Corriedale ewes of mean body weight 55 6 1 kg were ovari-ectomized (to remove possible confounding effects of stage of estrouscycle) and maintained on natural photoperiod. Ten animals were ran-domly divided into two groups (FAT and THIN) and fed, respectively,either a supplemented diet (lucerne hay ad libitum 1 1 kg lupin grain/week) to increase body weight or a restricted diet (lucerne hay, ;400 gper day). The animals were weighed at various time points to monitorthe effect of diet on body weight. Once both groups had reached thedesired weight (after 3 months), the lupin grain was removed from theFAT animals to stabilize their body weight and to standardize the dietarycontent. Sheep were subsequently kept on either an ad libitum lucernehay diet (FAT) or a low nutritional plane (restricted lucerne hay) tomaintain the established differences in body weight for a further 5months. This was achieved by regular weighing of the animals andadjustment of the restricted diet to maintain the body weight differenceof the two groups.
At the time of experimentation the two groups had average bodyweights of 60 6 1 kg (FAT) and 37 6 3 kg (THIN) (P , 0.001). Oneexternal jugular vein was cannulated, and serial blood samples (6 ml)were taken at 10-min intervals for 8 h (0800 h–1600 h). One hundredmicroliters of plasma were pooled to determine the plasma concentra-tions of leptin, cortisol, glucose, lactate, insulin, urea, and nonesterifiedfatty acids. The animals were injected (iv) with an overdose of pento-barbitone (Lethobarb, May and Baker Pty. Ltd., Australia) and decap-itated. Using a peristaltic pump, the heads were perfused via bothcarotid arteries with 2 liters of heparinized (12, 500 U/liter) normalsaline, followed with 2 liters of 4% paraformaldehyde/0.1 m sodiumphosphate buffer (pH 7.4), and finally with 4% paraformaldehyde inbuffer plus 20% sucrose. The brains were then removed and the hypo-thalamus was dissected out and placed into 4% paraformaldehyde inbuffer plus 30% sucrose for 1 month until frozen and then sectioned.
Morphometric analysis
After decapitation, each animal was subjected to body compositionanalysis. The liver, kidney, spleen, abdominal fat, and emptied stomachwere removed and weighed. Body composition on the eviscerated car-cass was determined using dual energy x-ray absorptiometry (DXA)(QDR4500, Hologic, Inc., Waltham, MA). The DXA utilizes an x-raysource located under a flat bed and relies on differential attenuation oflow [38 kiloelectronvolts (keV)] and high (70 keV) x-rays by bone andsoft tissue to determine body composition in sheep (25).
RIAs
LH. Plasma samples (100 ml) were assayed in duplicate using the methodof Lee et al. (26) using NIH-oLH-S18 as a standard. For five assays theaverage sensitivity was 0.2 ng/ml, the intraassay coefficient of variation(CV) was less than 10% over the range 1.2–18.5 ng/ml, and the interassayCV was less than 20%.
GH. Plasma samples (200 ml) were assayed in duplicate using the methodof Thomas et al. (27) and NIDDK-oGH-I-4 as a standard. For three assaysthe average sensitivity was 0.5 ng/ml, the intraassay CV was less than10% over the range 1.4–17.2 ng/ml, and the interassay CV was 13.6%.
TSH. The TSH RIA was performed using ovine thyroid-stimulatingantiserum (rabbit) NIDDK-anti-oTSH-1 (AFP-C33815). Bovine TSH,NIDDK-bTSH-I-2 (AFP-7196A), was used for iodination and as the assaystandard. For five assays the average sensitivity was 108 pg/ml, theintraassay CV was less than 10% between the range 621-1841 pg/ml, andthe interassay CV was 5.1%.
Plasma leptin was assayed in duplicate (100 ml) using a double-antibody RIA developed by Blache et al. (28). The limit of detection was100 pg/ml, and the intraassay CV was 4.3% at 0.74 ng/ml and 7.7% at1.41 ng/ml. In the linear part of the standard curve the amount of bovineleptin recovered was within 2.5% accuracy, and serially diluted sampleswere also measured to within 2.5% accuracy. Plasma cortisol was as-sayed in duplicate (100 ml), using the RIA outlined by Bocking et al. (29).The sensitivity of the assay was 0.2 ng/ml and the intraassay CV was5.3%. Plasma insulin was assayed using a kit (Linco Research, Inc., St.Charles, MO) with human insulin as a standard and validated for ovineinsulin in our laboratory (30). Plasma nonesterified fatty acid (NEFA)levels were measured with an enzymatic kit assay outlined by Sechenet al. (31). Plasma glucose and lactate concentrations were measured in25-ml samples using a YSI2300 STAT glucose/l-lactate analyzer (YSI,Inc., Yellow Springs, OH). The measurable range was between 0–30 mmfor glucose and 0–16 mm for lactate. Plasma urea levels were measuredusing a modified enzymatic kit assay (Sigma, St. Louis, MO; procedurenumber 640). All samples were analyzed in a single assay with anintraassay variation of 2.3%. Quantitative analysis of free T4 (FT4) wasdetermined by the AxSym system (Abbott Laboratories, Diagnostic Di-vision, Abbott Park, IL), which utilized a microparticle enzyme immu-noassay. Analysis of free T3 (FT3) was carried out using the RIA-gnostFT3 kit (CIS-Bio International, Sorgues, France).
In situ hybridization
Frozen 20-mm sections were cut using a cryostat and saved into 2%paraformaldehyde/cryoprotectant solution at 220 C. At least two sec-tions per animal were anatomically matched and mounted onto SuperFrost Plus slides (Menzel-Glaser, Braunschweig, Germany) and dried atroom temperature overnight.
In situ hybridization was performed using 35S-dUTP-labeled (NENLife Science Products, Boston, MA) riboprobes following the method ofSimmons et al. (32). The cDNA and plasmid inserts used were 1) a 400-bpovine POMC insert in pBSSK (33), 2) a 639-bp rat preproenkephalininsert in pGem, 3) a 400-bp rat MCH insert in PCRII, and 4) a 511-bp ratNPY insert in pBSM13. The amplification, purification, and linerariza-tion of plasmid DNA were performed using standard techniques (34).All cRNA probes were synthesized using a Gemini System II kit (Pro-mega Corp., Annandale, New South Wales, Australia). Hybridizationwas carried out at 53 C in a humid chamber for a minimum of 16 h. Afterposthybridization, treatment slides were taped to an x-ray cassette andexposed to BioMax film (Eastman Kodak Co., Rochester, NY) at roomtemperature. ENK and MCH in situ slides were exposed to film for 1
ADIPOSITY AND HYPOTHALAMIC GENE EXPRESSION 1507

week, whereas NPY and POMC were exposed for 5 days. Slides weredipped in Ilford K5 photographic emulsion (Ilford Australia, MountWaverly, Australia) and exposed at 4 C for 3–7 days (depending on theprobe), and then developed using Ilford Phenisol x-ray developer, stopbath and Hypam fixer. For ENK and MCH, the slides were exposed toemulsion for 1 week, NPY for 5 days, and POMC for 3 days. Sectionswere counterstained with 1% cresyl violet, dehydrated, and cover-slipped using DPX. Emulsion-dipped slides were analyzed at a cellularlevel, counting the number of labeled cells and silver grains per cell. Atleast 20 cells per section were randomly selected and analyzed by count-ing silver grains under 4003 magnification using the microcomputerimaging device (MCID) M1 system from the Imaging Research, Inc.(Brock University, St. Catharines, Ontario, Canada). Labeled cells werecounted under 203 magnification.
Data analysis
Pulse analysis was used to study the secretory profile of LH and GH,and mean daily levels of TSH were analyzed without pulse analysis. LHpulses were calculated as previously outlined by Clarke (35). Mean GHconcentration, interpulse interval, pulse amplitude, and baseline con-centration were calculated using the TURBOPULSAR program and pa-rameters outlined by Henry et al. (30).
Statistical analysis
Body composition and organ weight data were corrected for bodyweight and are presented in grams/kg. All data were checked for ho-mogeneity of variance; glucose, NEFA, and GH interpulse interval weresubjected to log transformation. Nontransformed data are presented asmeans 6 sem. Body weight measurements were analyzed by repeatedmeasures ANOVA, and least significant differences were used to test forsignificant differences between the mean values. All other data includ-ing in situ hybridization, hormone, and metabolic data were analyzed bysingle-factor ANOVA.
ResultsBody weight and body composition analysis (Fig. 1 andTable 1)
The body weights of the two groups of animals had sig-nificantly (P , 0.05) diverged within 2 weeks of the pro-grammed diet. At the time of sampling, there was a highlysignificant (P , 0.001) difference in the body weights of thetwo groups. Body composition analysis showed that the FAT
animals had higher (P , 0.001) body fat content with ele-vated percent body fat and fat mass but lower (P , 0.05) leanbody mass. There was no effect of body weight on the bonemineral content. The emptied stomach, heart, kidney, andliver weights were all lower (P , 0.001; P , 0.05; P , 0.01;P ,0.05, respectively) in the FAT animals, whereas the amountof abdominal fat was higher (P , 0.001) in this group. Therewas no effect of body weight on the weight of the spleen.
Plasma hormone levels (Fig. 2 and Table 1)
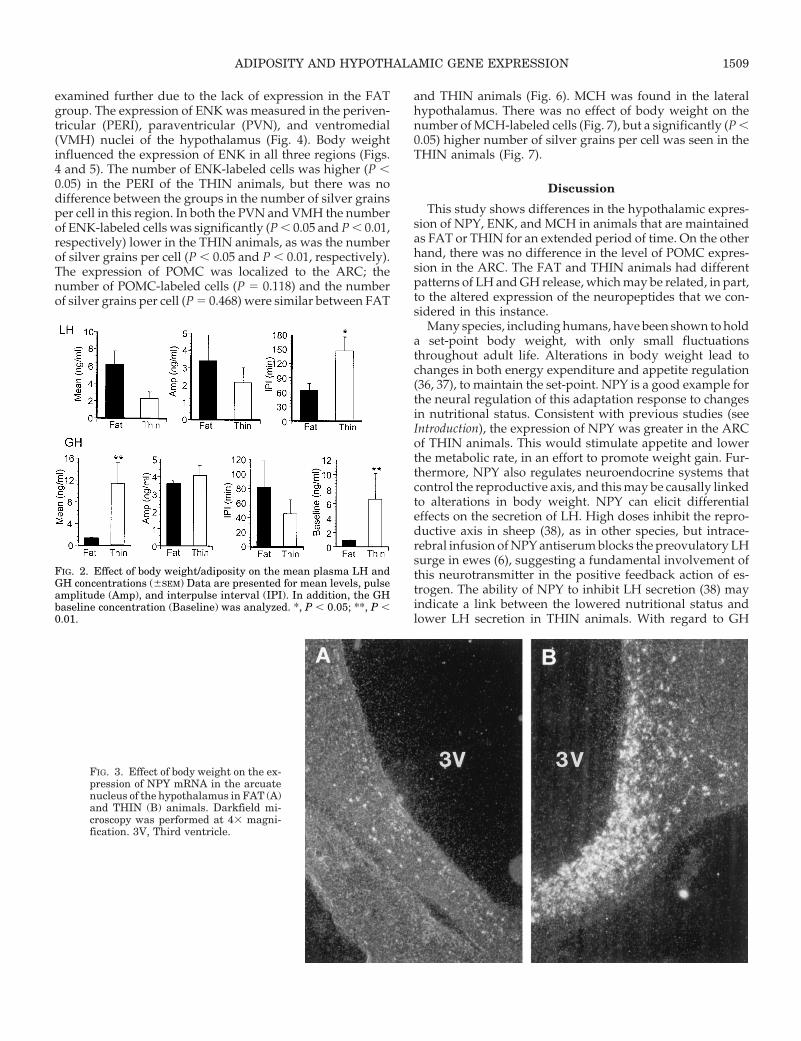
Mean plasma LH concentration and LH pulse amplitudewere similar in FAT and THIN animals, but the interpulseinterval for LH pulses was greater (P , 0.05) in the THINgroup. There were no differences between the groups in GHpulse amplitude or interpulse interval, but the mean plasmaGH concentrations and baseline concentrations were signif-icantly (P , 0.01) higher in the THIN animals. There was nodifference between the groups in the mean plasma concen-trations of cortisol or TSH levels. The plasma concentrationsof FT4 and FT3 were lower (P , 0.05), whereas the FT3:FT4ratio was higher (P , 0.05) in the THIN animals.
Metabolic parameters (Table 1)
Plasma glucose and urea concentrations were similar inFAT and THIN animals, whereas plasma insulin, lactate, andNEFA concentrations were significantly (P , 0.01) lower inthe THIN animals.
Expression of NPY, POMC, ENK, and MCH
The expression of NPY was influenced by body weightwith higher expression in THIN animals (Fig. 3); this was not
FIG. 1. Temporal changes in body weight in FAT and THIN animals.Within 2 weeks of dietary manipulation, the body weights of FAT andTHIN animals (left panel) had significantly (*, P , 0.05) diverged. ByFebruary, both groups had reached their desired body weights (P ,0.001), which were maintained until July (time of experiment). InJuly, body composition analysis (right panel) revealed that THINanimals had significantly (***, P , 0.001) less percent body fat.
TABLE 1. The effects of body weight on plasma hormone andmetabolite levels; in addition, body composition analysis wasachieved by DXA analysis and organ weights
Plasma hormones andmetabolites Fat Thin
Cortisol (ng/ml) 25.18 6 3.98 19.18 6 3.53TSH (ng/ml) 163.49 6 76.75 118.7 6 44.16Free T3 (pM) 3.51 6 0.1 3.05 6 0.14a
Free T4 (pM) 16.76 6 0.27 12.48 6 1.04a
FT3;FT4 0.21 6 0.01 0.25 6 0.01a
Glucose (mM) 3.48 6 0.24 2.96 6 0.06Lactate (mM) 0.74 6 0.06 0.42 6 0.08b
Insulin (mU/ml) 9.76 6 1.84 2.51 6 0.71b
Urea (mM) 6.3 6 0.39 6.03 6 0.36NEFA (mM) 792 6 101.33 516 6 35.5a
Leptin (ng/ml) 1.59 6 0.1 0.31 6 0.06c
Body composition andorgan weights (g/kg)
Lean body mass 266.46 6 3.71 290.49 6 6.04a
Fat mass 155.27 6 6.5 46.3 6 5.37c
Bone mineral content 12.24 6 0.35 12.22 6 1.08Spleen 0.002 6 0.0003 0.002 6 0.0002Abdominal fat 0.08 6 0.009 0.022 6 0.008c
Emptied stomach 0.024 6 0.0001 0.035 6 0.001c
Heart 0.005 6 0.0002 0.006 6 0.0004a
Kidney 0.002 6 0.0001 0.003 6 0.0002b
Liver 0.008 6 0.002 0.013 6 0.0004a
Results from body composition analysis was corrected for bodyweight. All data are presented as mean 6 (SEM); a P , 0.05, b P , 0.01,c P , 0.001.
1508 ADIPOSITY AND HYPOTHALAMIC GENE EXPRESSION Endo • 2000Vol 141 • No 4
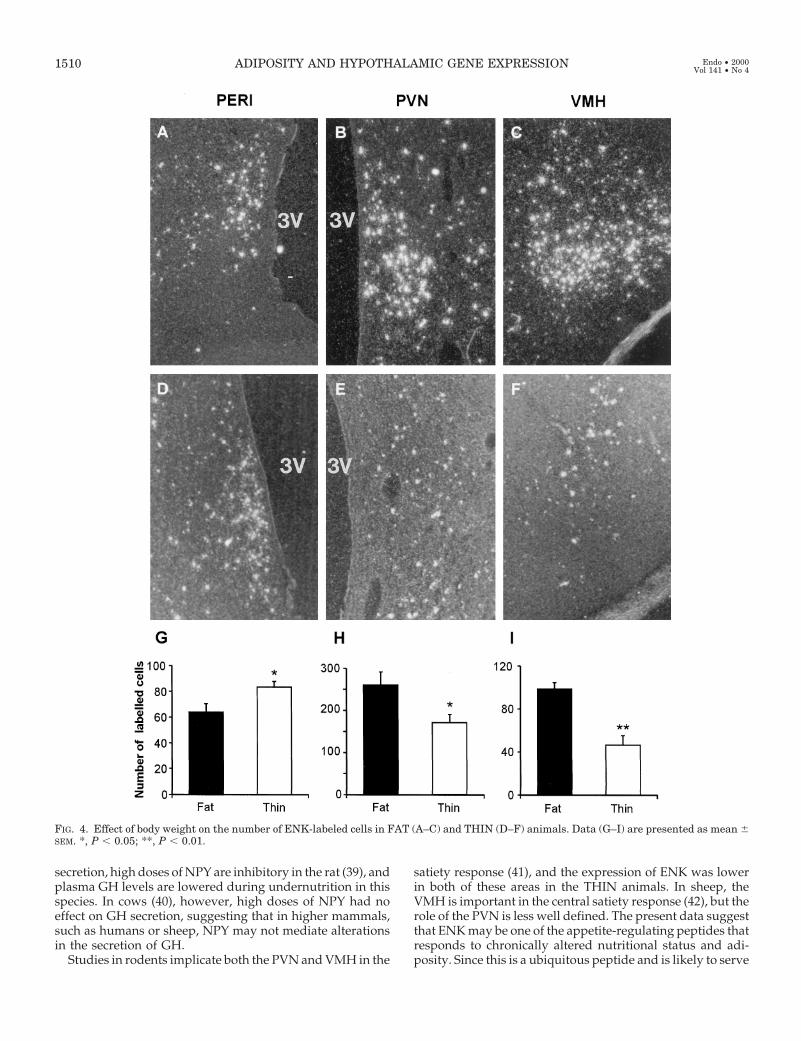
examined further due to the lack of expression in the FATgroup. The expression of ENK was measured in the periven-tricular (PERI), paraventricular (PVN), and ventromedial(VMH) nuclei of the hypothalamus (Fig. 4). Body weightinfluenced the expression of ENK in all three regions (Figs.4 and 5). The number of ENK-labeled cells was higher (P ,0.05) in the PERI of the THIN animals, but there was nodifference between the groups in the number of silver grainsper cell in this region. In both the PVN and VMH the numberof ENK-labeled cells was significantly (P , 0.05 and P , 0.01,respectively) lower in the THIN animals, as was the numberof silver grains per cell (P , 0.05 and P , 0.01, respectively).The expression of POMC was localized to the ARC; thenumber of POMC-labeled cells (P 5 0.118) and the numberof silver grains per cell (P 5 0.468) were similar between FAT
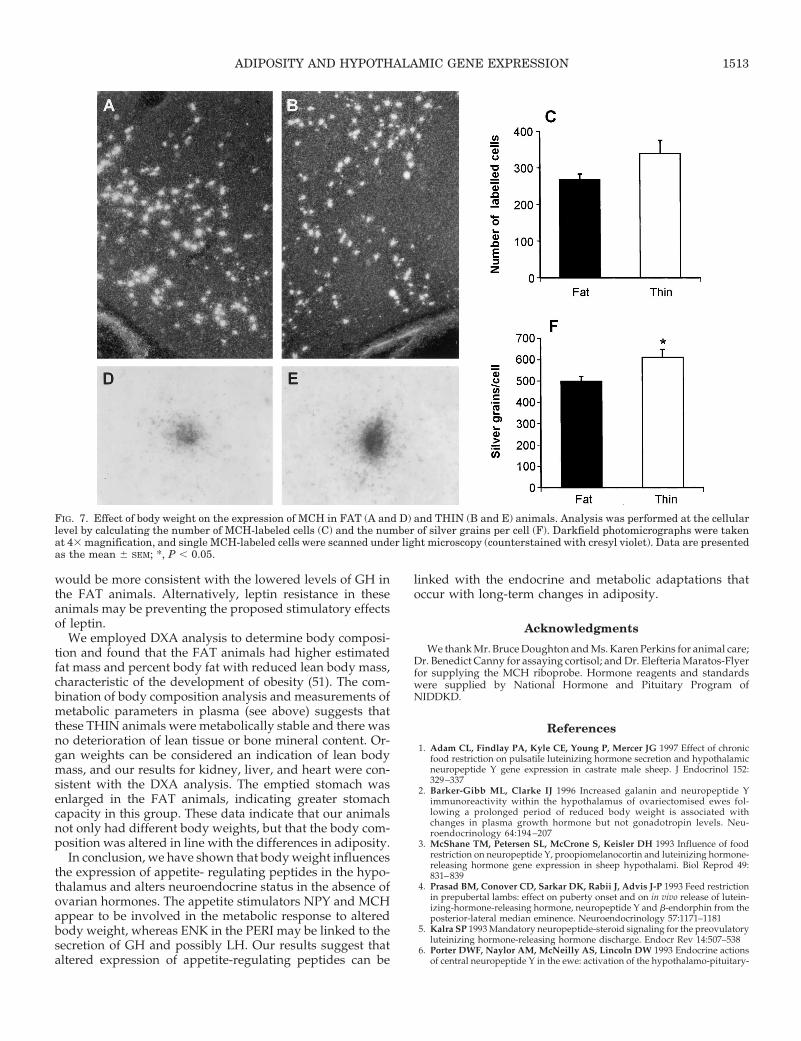
and THIN animals (Fig. 6). MCH was found in the lateralhypothalamus. There was no effect of body weight on thenumber of MCH-labeled cells (Fig. 7), but a significantly (P ,0.05) higher number of silver grains per cell was seen in theTHIN animals (Fig. 7).
Discussion
This study shows differences in the hypothalamic expres-sion of NPY, ENK, and MCH in animals that are maintainedas FAT or THIN for an extended period of time. On the otherhand, there was no difference in the level of POMC expres-sion in the ARC. The FAT and THIN animals had differentpatterns of LH and GH release, which may be related, in part,to the altered expression of the neuropeptides that we con-sidered in this instance.
Many species, including humans, have been shown to holda set-point body weight, with only small fluctuationsthroughout adult life. Alterations in body weight lead tochanges in both energy expenditure and appetite regulation(36, 37), to maintain the set-point. NPY is a good example forthe neural regulation of this adaptation response to changesin nutritional status. Consistent with previous studies (seeIntroduction), the expression of NPY was greater in the ARCof THIN animals. This would stimulate appetite and lowerthe metabolic rate, in an effort to promote weight gain. Fur-thermore, NPY also regulates neuroendocrine systems thatcontrol the reproductive axis, and this may be causally linkedto alterations in body weight. NPY can elicit differentialeffects on the secretion of LH. High doses inhibit the repro-ductive axis in sheep (38), as in other species, but intrace-rebral infusion of NPY antiserum blocks the preovulatory LHsurge in ewes (6), suggesting a fundamental involvement ofthis neurotransmitter in the positive feedback action of es-trogen. The ability of NPY to inhibit LH secretion (38) mayindicate a link between the lowered nutritional status andlower LH secretion in THIN animals. With regard to GH
FIG. 2. Effect of body weight/adiposity on the mean plasma LH andGH concentrations (6SEM) Data are presented for mean levels, pulseamplitude (Amp), and interpulse interval (IPI). In addition, the GHbaseline concentration (Baseline) was analyzed. *, P , 0.05; **, P ,0.01.
FIG. 3. Effect of body weight on the ex-pression of NPY mRNA in the arcuatenucleus of the hypothalamus in FAT (A)and THIN (B) animals. Darkfield mi-croscopy was performed at 43 magni-fication. 3V, Third ventricle.
ADIPOSITY AND HYPOTHALAMIC GENE EXPRESSION 1509
secretion, high doses of NPY are inhibitory in the rat (39), andplasma GH levels are lowered during undernutrition in thisspecies. In cows (40), however, high doses of NPY had noeffect on GH secretion, suggesting that in higher mammals,such as humans or sheep, NPY may not mediate alterationsin the secretion of GH.
Studies in rodents implicate both the PVN and VMH in the
satiety response (41), and the expression of ENK was lowerin both of these areas in the THIN animals. In sheep, theVMH is important in the central satiety response (42), but therole of the PVN is less well defined. The present data suggestthat ENK may be one of the appetite-regulating peptides thatresponds to chronically altered nutritional status and adi-posity. Since this is a ubiquitous peptide and is likely to serve
FIG. 4. Effect of body weight on the number of ENK-labeled cells in FAT (A–C) and THIN (D–F) animals. Data (G–I) are presented as mean 6SEM. *, P , 0.05; **, P , 0.01.
1510 ADIPOSITY AND HYPOTHALAMIC GENE EXPRESSION Endo • 2000Vol 141 • No 4

a number of functions, it is perhaps not surprising that therewere differential effects of adiposity in different regions ofthe hypothalamus. Since the VMH is important in the reg-ulation of energy expenditure, alterations in ENK expressionat this level may be directly involved in appetite and energyhomeostasis.
In the PERI, the expression of ENK was higher in THINanimals, an effect that may be relevant to the secretion of LHvia the GnRH system. Expression is greater in this nucleusduring the luteal phase (43) (when LH levels are low) thanduring the follicular phase, consistent with our result inTHIN animals. ENK expression in this region may also berelevant to changes in GH secretion due to altered adiposity.ENK stimulates GH secretion (44) by modulating soma-totropin release-inhibiting factor (SRIF), and one could in-voke a mechanism whereby ENK inhibits SRIF in the PERIto enhance GH secretion in THIN animals.
MCH is a peptide that stimulates appetite (see Introduction)and is found in neurons of the lateral hypothalamus (45). Thisregion has been deemed the feeding center and lesions resultin hypophagia and weight loss (7, 42). MCH expression washigher throughout this area in THIN animals and couldindicate a move toward a lower metabolic rate and increasedappetite to promote weight gain, as in the case of NPY. MCH
has been shown to stimulate the GnRH/LH system (22), butconnections between the lateral hypothalamus and otherneuroendocrine systems remain to be identified for this spe-cies. The elevated expression of MCH in THIN animals,however, is not consistent with the reported (22) stimulatoryeffect on the reproductive axis.
Previous reports in sheep have shown that undernutritiondecreases the expression (3) of the POMC gene and reducesthe levels of b-end (measured by push-pull perfusion) (4) inewe lambs. The results of the current study conflict with thisdata, although there was a trend toward a reduction in theexpression of mRNA for POMC in thin animals, which wasnot found to be significant. One possible explanation for thismay be the greater degree of undernutrition imposed on theanimals in the previous two studies (20–30% of maintenancediet). On the other hand, our results are consistent with arecent study in adult castrated rams showing that POMCexpression was not altered with changes in nutrition (46). Inaddition, diet-induced obesity had no effect on the hypo-thalamic concentrations of a-MSH or POMC in male rats (47).We therefore conclude that, with alterations in adiposityunder metabolically stable conditions, there is no alterationin the expression of the gene for POMC-derived peptides.
There was no effect of adiposity on plasma concentrations
FIG. 5. Effect of body weight on the expression of ENK mRNA in FAT (A–C) and THIN (D–F) animals. Representative ENK-labeled cells werescanned at 4003 magnification under lightfield microscopy, and the number of silver grains per cell were calculated (G–I). Data are presentedas mean 6 SEM. *, P . 0.05; **, P . 0.01.
ADIPOSITY AND HYPOTHALAMIC GENE EXPRESSION 1511

of cortisol, a result that is consistent with previous studies inthe ruminant (48). This is also consistent with our observa-tion (30) that leptin does not affect the HPA axis in ovari-ectomized ewes, suggesting that under metabolically stableconditions cortisol levels are unchanged. In the human (49)and the rodent (50), reduced food intake causes an increasein cortisol levels, but this may be due to fluctuations in caloricintake and may not be related to body weight or adiposity.
It is extremely difficult to discriminate between the effectsof body weight and caloric intake with respect to thyroidstatus, and many studies produce equivocal results. Consis-tent with a previous study (51), the plasma concentrations ofFT4 and FT3 were lower in THIN sheep. We found that theFT3:FT4 ratio was higher in THIN animals. Changes in thehypothalamo-pituitary-thyroid axis due to altered bodyweight appear to manifest within the thyroid gland withlowered T4 and altered conversion to T3; there does not seemto be any effect at the hypothalamic level as plasma TSHlevels were similar in FAT and THIN animals. The secretionof thyroid hormones in THIN sheep (lower FT3) indicates amove toward lower metabolic rate, which is reflected in thedata on metabolic parameters (see below).
Neuroendocrine function was altered with adiposity, butplasma glucose and urea levels were similar in the FAT andTHIN animals. This demonstrates that the animals of bothgroups were metabolically stable and suggests that neither ofthese metabolites is involved in conveying information re-
garding adiposity to the appetite-regulating and neuroen-docrine systems of the brain. The plasma NEFA levels werelower in THIN animals, reflecting a reduction in fat stores,either as adipose tissue or circulating triglycerides. Whetherthis metabolite signals to the brain is not known, but it doesnot seem likely, since NEFA levels are increased with obesityas well as during negative energy balance (42). Sustainedhyperinsulinemia can, however, reduce NPY mRNA levelsin the ARC and reduce NPY secretion in the PVN of the rat(52). This may explain, in part, the lowered NPY expressionin FAT animals. Our model will allow the study of the effectsof altered insulin status in the face of normoglycemia.
The newly identified hormone leptin, which is producedby adipocytes, is thought to signal to the brain as a satietyfactor (10). Plasma leptin levels were 5-fold higher in the FATanimals, and this may be a primary cause of alterations ingene expression of appetite-regulating peptides. It must benoted, however, that obesity may be associated with thedevelopment of leptin resistance (53). Whether the alteredleptin status of the animals is related to the alteration in GHsecretion is a matter that needs to be addressed. In rodents,it has been found that leptin stimulates GH secretion (54),and a single intracerebral injection of leptin stimulated GHsecretion in pigs (55). On the other hand, we found no effectof intracerebral leptin infusion on GH secretion in normallyfed sheep (30), and leptin inhibited GHRH-stimulated GHsecretion from cultured ovine pituitary cells (56). The latter
FIG. 6. Effect of body weight on the expression of POMC in FAT (A and D) and THIN (B and E) animals. Analysis was preformed at the cellularlevel by calculating the number of POMC-labeled cells (C) and the number of silver grains per cell (F). Darkfield photomicrographs were takenat 43 magnification, and single POMC-labeled cells were scanned under light microscopy (counterstained with cresyl violet). Data are presentedas the mean 6 SEM. 3V, Third ventricle.
1512 ADIPOSITY AND HYPOTHALAMIC GENE EXPRESSION Endo • 2000Vol 141 • No 4
would be more consistent with the lowered levels of GH inthe FAT animals. Alternatively, leptin resistance in theseanimals may be preventing the proposed stimulatory effectsof leptin.
We employed DXA analysis to determine body composi-tion and found that the FAT animals had higher estimatedfat mass and percent body fat with reduced lean body mass,characteristic of the development of obesity (51). The com-bination of body composition analysis and measurements ofmetabolic parameters in plasma (see above) suggests thatthese THIN animals were metabolically stable and there wasno deterioration of lean tissue or bone mineral content. Or-gan weights can be considered an indication of lean bodymass, and our results for kidney, liver, and heart were con-sistent with the DXA analysis. The emptied stomach wasenlarged in the FAT animals, indicating greater stomachcapacity in this group. These data indicate that our animalsnot only had different body weights, but that the body com-position was altered in line with the differences in adiposity.
In conclusion, we have shown that body weight influencesthe expression of appetite- regulating peptides in the hypo-thalamus and alters neuroendocrine status in the absence ofovarian hormones. The appetite stimulators NPY and MCHappear to be involved in the metabolic response to alteredbody weight, whereas ENK in the PERI may be linked to thesecretion of GH and possibly LH. Our results suggest thataltered expression of appetite-regulating peptides can be
linked with the endocrine and metabolic adaptations thatoccur with long-term changes in adiposity.
Acknowledgments
We thank Mr. Bruce Doughton and Ms. Karen Perkins for animal care;Dr. Benedict Canny for assaying cortisol; and Dr. Elefteria Maratos-Flyerfor supplying the MCH riboprobe. Hormone reagents and standardswere supplied by National Hormone and Pituitary Program ofNIDDKD.
References
1. Adam CL, Findlay PA, Kyle CE, Young P, Mercer JG 1997 Effect of chronicfood restriction on pulsatile luteinizing hormone secretion and hypothalamicneuropeptide Y gene expression in castrate male sheep. J Endocrinol 152:329–337
2. Barker-Gibb ML, Clarke IJ 1996 Increased galanin and neuropeptide Yimmunoreactivity within the hypothalamus of ovariectomised ewes fol-lowing a prolonged period of reduced body weight is associated withchanges in plasma growth hormone but not gonadotropin levels. Neu-roendocrinology 64:194 –207
3. McShane TM, Petersen SL, McCrone S, Keisler DH 1993 Influence of foodrestriction on neuropeptide Y, proopiomelanocortin and luteinizing hormone-releasing hormone gene expression in sheep hypothalami. Biol Reprod 49:831–839
4. Prasad BM, Conover CD, Sarkar DK, Rabii J, Advis J-P 1993 Feed restrictionin prepubertal lambs: effect on puberty onset and on in vivo release of lutein-izing-hormone-releasing hormone, neuropeptide Y and b-endorphin from theposterior-lateral median eminence. Neuroendocrinology 57:1171–1181
5. Kalra SP 1993 Mandatory neuropeptide-steroid signaling for the preovulatoryluteinizing hormone-releasing hormone discharge. Endocr Rev 14:507–538
6. Porter DWF, Naylor AM, McNeilly AS, Lincoln DW 1993 Endocrine actionsof central neuropeptide Y in the ewe: activation of the hypothalamo-pituitary-
FIG. 7. Effect of body weight on the expression of MCH in FAT (A and D) and THIN (B and E) animals. Analysis was performed at the cellularlevel by calculating the number of MCH-labeled cells (C) and the number of silver grains per cell (F). Darkfield photomicrographs were takenat 43 magnification, and single MCH-labeled cells were scanned under light microscopy (counterstained with cresyl violet). Data are presentedas the mean 6 SEM; *, P , 0.05.
ADIPOSITY AND HYPOTHALAMIC GENE EXPRESSION 1513

adrenal axis by exogenous neuropeptide Y in the secretion of luteinisinghormone during the oestrous cycle. J Neuroendocrinol 5:163–174
7. Morley JE 1987 Neuropeptide regulation of appetite and weight. Endocr Rev8:256–286
8. Mountjoy KG, Wong J 1996 Obesity, diabetes and functions for proopiomel-anocortin-derived peptides. Mol Cell Endocrinol 128:171–177
9. Poggioli R, Vergoni AV, Bertolini A 1986 ACTH (1–24) and a-MSH antagonizefeeding behaviour stimulated by kappa opiate agonists. Peptides 7:843–848
10. Kalra SP, Dube MG, Pu S, Xu B, Horvath TL, Kalra PS 1999 Interactingappetite-regulating pathways in hypothalamic regulation of body weight.Endocr Rev 20:68–100
11. Baile CA, McLaughlin CL, Buonomo FC, Lauterio TJ, Marson L, Della-FeraMA 1987 Opioid peptides and the control of feeding in sheep. Fed Proc46:173–177
12. Bicknell RJ 1985 Endogenous opioid peptides and hypothalamic neuroendo-crine neurones. J Endocrinol 107:437–446
13. Jenkins PJ, Grossman A 1993 The control of gonadotrophin releasing hormonepulse generator in relation to opioid and nutritional cues. Hum Reprod 8[Suppl 2]:154–161
14. Presse F, Sorokovosky I, Max J-P, Nicolaidis S, Nahon J-L 1996 Melanin-concentrating hormone is a potent anorectic peptide regulated by food-dep-rivation and glucopenia in the rat. Neuroscience 71:735–745
15. Qu D, Ludwig DS, Gammeltoft S, Piper M, Pelleymounter MA, Cullen MJ,Mathes WF, Pryzpek J, Kanarek R, Maratos-Flier E 1996 A role for melanin-concentrating hormone in the central regulation of feeding behaviour. Nature380:243–247
16. Rossi M, Choi SJ, O’Shea D, Miyoshi T, Ghatei MA, Bloom SR 1997 Melanin-concentrating hormone acutely stimulates feeding, but chronic administrationhas no effect on body weight. Endocrinology 138:351–355
17. Shimada M, Tritos NA, Lowell BB, Flier JS, Maratos-Flier E 1998 Mice lackingmelanin-concentrating hormone are hypophagic and lean. Nature 396:670–674
18. Fan W, Boston BA, Kesterson RA, Hruby VJ, Cone RD 1997 Role of mela-nocortinergic neurons in feeding and the agouti obesity syndrome. Nature385:165–168
19. Huszar D, Lynch CA, Fairchild-Huntress V, Dunmore JH, Fang Q, Berke-meier LR, Gu W, Kesterson RA, Boston BA, Cone RD, Smith FJ, CampfieldLA, Burn P, Lee F 1997 Targeted disruption of the melanocortin-4 receptorresults in obesity in mice. Cell 88:131–141
20. Ludwig DS, Mountjoy KG, Tatro JB, Gillette JA, Frederich RC, Flier JS,Maratos-Flier E 1998 Melanin-concentrating hormone: a functional melano-cortin antagonist in the hypothalamus. Am J Physiol 274:E627–E633
21. Chambers J, Ames RS, Bergsma D, Muir A, Fitzgerald LR, Hervieus G, DytkoGM, Foley JJ, Martin J, Liu W-S, Park J, Ellis C, Ganguly S, Konchar S,Cluderays J, Leslie R, Wilson S, Sarau HM 1999 Melanin-concentrating hor-mone is the cognate ligand for the orphan G-protein-coupled receptor SLC-1.Nature 400:261–265
22. Gonzales MI, Baker BI, Wilson CA 1997 Stimulatory effect of melanin-con-centrating hormone of luteinising hormone release. Neuroendocrinology66:254–262
23. Bluet-Pajot M-T, Presse F, Voko Z, Hoegers C, Mounier E, Epelbaum J,Nahon J-L 1995 Neuropeptide E-I antagonizes the action of melanin-concen-trating hormone on stress-induced release of adrenocorticotropin in the rat.J Neuroendocrinol 7:297–303
24. Liu J-P, Clarke IJ, Funder JW, Engler D 1994 Studies of the secretion ofcorticotropin-releasing factor and arginine vasopressin into the hypophysialportal circulation of the conscious sheep II. The central noradrenergic andneuropeptide Y pathways cause immediate and prolonged hypothalamic-pituitary-adrenal activation. Potential involvement in the pseudo-Cushing’ssyndrome of endogenous depression and anorexia nervosa. J Clin Invest93:1439–1450
25. Pritchard JE, Leury BJ, Kaymakci B, Saul ALF, Ponnampalam EN, Wark JD1996 Comparison of DXA with chemical analysis for body composition mea-surement. Proceedings of the Annual Meeting of the Nutr Soc Aust, Sydney,Australia 20:111
26. Lee VWK, Cumming IA, deKretser DM, Findlay JK, Hudson B, Keogh EJ1976 Regulation of gonadotropin secretion in rams from birth to sexual mat-uration. I. Plasma LH, FSH, testosterone levels. J Reprod Fertil 46:1–6
27. Thomas GB, Mercer JE, Karalis T, Rao A, Cummins JT, Clarke IJ 1990 Effectof restricted feeding on the concentrations of growth hormone (GH), gona-dotrophins, and prolactin (PRL) in plasma and on the amounts of messengerribonucleic acid or GH, gonadotrophin subunits and PRL in the pituitaryglands of adult ovariectomised ewes. Endocrinology 126:1361–1367
28. Blache D, Tellam RL, Chagas LM, Blackberry MA, Vercoe PE, Martin GM,Level of nutrition affects leptin concentration in plasma and cerebrospinal fluidin sheep. J Endocrinol, in press
29. Bocking AB, McMillan IC, Harding R, Thornburn GD 1986 Effect of reducedblood flow on fetal and maternal cortisol. J Dev Physiol 8:237–245
30. Henry BA, Goding JW, Alexander WS, Tilbrook AJ, Canny BJ, Dunshea F,Rao A, Mansell A, Clarke IJ 1999 Central administration of leptin to ovari-ectomized ewes inhibits food intake without affecting the secretion of hor-mones from the pituitary gland: evidence for a dissociation of effects onappetite and neuroendocrine function. Endocrinology 140:1175–1182
31. Sechen SJ, Dunshea FR, Bauman DE 1990 Mechanisms of bovine soma-totropin in lactating cows: effect on response to epinephrine and insulin. Am JPhysiol 258:E582–E588
32. Simmons DM, Arrizas JL, Swanson LW 1989 A complete protocol for in situhybridization of messenger RNAs in brain and other tissues with radio-la-belled single-stranded RNA probes. J Histotechnol 12:169–181
33. van der Pavert SA, Clarke IJ, Rao A, Vrana KE 1997 Effects of vasopressin andelimination of corticotropin-releasing hormone-target cells on proopiomela-nocortin mRNA levels and adrenocorticotropin secretion in ovine anteriorpituitary cells. J Endocrinol 154:139–147
34. Sambrook J, Fritsch EF, Maniatis T 1989 Molecular Cloning: A LaboratoryManual, ed. 2. Cold Spring Harbor Laboratory Press. Cold Spring Harbor, NY
35. Clarke IJ 1993 Variable patterns of gonadotropin-releasing hormone secretionduring the estrogen-induced luteinizing hormone surge in ovariectomizedewes. Endocrinology 133:1624–1632
36. Leibel RL, Rosenbaum M, Hirsch J 1995 Changes in energy expenditureresulting from altered body weight. N Engl J Med 332:621–62
37. Keesey RE, Powley TL 1986 The regulation of body weight. Am Rev Psychol37:109–33
38. Barker-Gibb ML, Scott CJ, Boublik JH, Clarke IJ 1995 The role of neuropep-tide Y (NPY) in the control of LH secretion in the ewe with respect to season,NPY receptor type and the site of action in the hypothalamus. J Endocrinol147:565–579
39. Aubert ML, Pierroz DD, Gruaz NM, d’Alleves, Vuagnat BAM, Pralong FP,Blum WF, Sizenko PC 1998 Metabolic control of sexual function and growth:role of neuropeptide Y and leptin. Mol Cell Endocrinol 140:107–113
40. Thomas MG, Gazal OS, Williams GL, Stanko RL, Keisler DH 1999 Injectionof neuropeptide Y into the third cerebroventricle differentially influencespituitary secretion of luteinizing hormone and growth hormone in ovariec-tomised cows. Domest Anim Endocrinol 16:159–169
41. Bray GA, Fisler J, York DA 1990 Neuroendocrine control of the developmentof obesity: understanding gained from studies of experimental animal models.Front Neuroendocrinol 11:128–181
42. Baile CA, Forbes MJ 1974 Control of feed intake and regulation of energybalance in ruminants. Physiol Rev 54:160–214
43. Walsh JP, Rao A, Thompson RC, Clarke IJ, Anatomical distribution of cellsexpressing proenkephalin mRNA in ovine hypothalamus. Program of the 81st
annual meeting of The Endocrine Society, San Diego CA, 1999, p 238 (AbstractP1–490)
44. Shaar CJ, Frederickson RCA, Dininger NB, Jackson L 1977 Enkephalin an-alogues and naloxone modulate the release of growth hormone and prolactin–evidence for regulation by an endogenous opioid peptide in brain. Life Sci21:853–860
45. Tillet Y, Batailler M, Fellmann D 1996 Distribution of melanin-concentratinghormone (MCH)-like immunoreactivity in neurons of the diencephalon ofsheep. J Chem Neuroanat 12:135–145
46. Archer ZA, Rhind SM, Findlay PA, McMillen S, Adam CL 1999 Effects of foodrestriction on gonadotrophin secretion and hypothalamic NPY and POMCgene expression in castrate male sheep. J Reprod 23:25–26
47. Harrold JA, Williams G, Widdowson PS 1999 Changes in hypothalamicagouti-related protein (AGRP), but not a-MSH or pro-opiomelanocortin con-centrations in dietary-obese and food-restricted rats. Biochem Biophys ResCommun 258:574–577
48. I’Anson H, Quint EH, Wood RI, England BG, Foster DL 1994 Adrenal axisand hypogonadotropism in the growth restricted female lamb. Biol Reprod50:137–143
49. Boyar RM, Hellman LD, Roffwarg H, Katz J, Zumoff B, O’Connor J, BradlowHL, Fukushima DK 1977 Cortisol secretion and metabolism in anorexia ner-vosa. N Engl J Med 296:190–193
50. Chowers I, Einat R, Feldman S 1969 Effects of starvation on levels of corti-cotrophin releasing factor, corticotrophin and plasma corticosterone in rats.Acta Endocrinol (Copenh) 61:687–694
51. McCann JP, Bergman EN, Beerman DH 1992 Dynamic and static phases ofsevere dietary obesity in sheep: food intakes, endocrinology and carcass andorgan chemical composition. J Nutr 122:496–505
52. Cusin I, Dryden S, Wang Q, Rohner-Jeanrenaud B, Williams G 1995 Effectof sustained physiological hyperinsulinemia on hypothalamic neuropeptide Yand NPY mRNA levels in the rat. J Neuroendocrinol 7:193–197
53. Arch JRS, Stock MJ, Trayhurn P 1998 Leptin resistance in obese humans: doesit exist and what does it mean? Int J Obes 22:1159–1163
54. Tannenbaum GS, Gurd W, Lapointe M 1998 Leptin is a potent simulator ofspontaneous pulsatile growth hormone (GH) secretion and the GH responseto GH-releasing hormone. Endocrinology 139:3871–3875
55. Barb CR, Yan X, Azain MJ, Kraeling RR, Rampacek GB. Ramsay TG 1998Recombinant porcine leptin reduces feed intake and stimulates growth hor-mone secretion in swine. Domest Anim Endocrinol 15:77–86
56. Roh S-G, Clarke IJ, Goding JW, Chen C 1999 The effect of leptin in growthhormone secretion in primary cultured ovine pituitary cells. Neuroendocri-nology 68:361–364
1514 ADIPOSITY AND HYPOTHALAMIC GENE EXPRESSION Endo • 2000Vol 141 • No 4
Related Documents


![BMC Biology BioMed Central - Springer[D-ala2,D-leU5]enkephalin (DADLE) reduFigure 2ces necrotic and apoptotic (panel B) cell death associated with ischemia [D-ala2,D-leU5]enkephalin](https://static.cupdf.com/doc/110x72/5e396225173d974deb7f955c/bmc-biology-biomed-central-springer-d-ala2d-leu5enkephalin-dadle-redufigure.jpg)