18A Volume 53, Number 1, 1999 focal point BY SARAH A. LORENZ , E. PETER MAZIARZ III, and TROY D. WOOD* DEPARTMENT OF CHEMISTRY, NATURAL SCIENCES COMPLEX STATE UNIVERSITY OF NEW YORK AT BUFFALO BUFFALO,NEW YORK 14260-3000 Electrospray Ionization Fourier Transform Mass Spectrometry of Macromolecules: The First Decade INTRODUCTION T he limited volatility and/or thermal stability of macro- molecules (i.e., species with molecular masses in excess of 1 kDa) long prevented their analysis as ions by mass spectrometry. The de- velopment of ionization techniques such as matrix-assisted laser desorp- tion ionization (MALDI) and elec- trospray ionization (ESI) 1 in recent years has made possible the analysis of intact ions generated from con- densed-phase macromolecules, in- cluding biopolymers (peptides, pro- teins, oligonucleotides, and oligosac- charides) and synthetic polymers. * Also Department of Molecular and Cellular Biophysics, Roswell Park Cancer Institute, Elm and Carlton Streets, Buffalo, NY 14263. Au- thor to whom correspondence should be sent. The development of MALDI and ESI has lead directly to a strong growth period for mass spectrometry in the areas of biochemistry, phar- maceutical drug development, and polymer chemistry. Simultaneously with develop- ments in ionization methods, ad- vances in mass analyzer technology have also been achieved to facilitate mass spectrometry of large mole- cules. Notable are the development of trapped ion mass analyzers: quad- rupole ion trap mass spectrometry and Fourier transform mass spec- trometry (FTMS). The quadrupole ion trap (which will not be discussed in detail here), like the more widely used quadrupole, uses a quadrupolar electric ® eld, which is produced from superimposed dc and radio-fre- quency (rf) potentials by two ``cap’’ electrodes and one ``ring’’ electrode, con® ning ions in three dimensions. In contrast, ion trapping in FTMS is achieved through the combination of a dc electric ® eld and a magnetic ® eld, and is based upon the principle of ion cyclotron resonance (ICR); consequently, the technique is some- times known in the literature as FT- ICRMS. The unique trapping and detection methods of FTMS, to be described in detail here, have drawn great attention because they provide ultrahigh mass resolving power and accuracy measurements while simul- taneously providing multichannel detection and the ¯ exibility of a trapped ion instrument for tandem mass spectrometry (MS/MS) exper- iments. In combination with ESI, FTMS has become a valuable tool in the characterization of macromolecules. The combined ESI-FTMS technique

Welcome message from author
This document is posted to help you gain knowledge. Please leave a comment to let me know what you think about it! Share it to your friends and learn new things together.
Transcript
18A Volume 53, Number 1, 1999
focal pointBY SARAH A. LORENZ, E. PETER MAZIARZ III, and TROY D. WOOD*
DEPARTMENT OF CHEMISTRY,NATURAL SCIENCES COMPLEX
STATE UNIVERSITY OF NEW YORK AT BUFFALO
BUFFALO, NEW YORK 14260-3000
Electrospray IonizationFourier Transform Mass
Spectrometry ofMacromolecules:The First Decade
INTRODUCTION
The lim ited volati li ty and/orthermal stability of macro-molecules (i.e., species with
molecular masses in excess of 1kDa) long prevented their analysis asions by mass spectrometry. The de-velopment of ionization techniquessuch as matrix-assisted laser desorp-tion ionization (MALDI) and elec-trospray ionization (ESI)1 in recentyears has made possible the analysisof intact ions generated from con-densed-phase macromolecules, in-cluding biopolymers (peptides, pro-teins, oligonucleotides, and oligosac-charides) and synthetic polymers.
* Also Department of Molecular and CellularBiophysics, Roswell Park Cancer Institute, Elmand Carlton Streets, Buffalo, NY 14263. Au-thor to whom correspondence should be sent.
The development of MALDI andESI has lead directly to a stronggrowth period for mass spectrometryin the areas of biochemistry, phar-maceutical drug development, andpolymer chemistry.
Simultaneously with develop-ments in ionization methods, ad-vances in mass analyzer technologyhave also been achieved to facilitatemass spectrometry of large mole-cules. Notable are the developmentof trapped ion mass analyzers: quad-rupole ion trap mass spectrometryand Fourier transform mass spec-trometry (FTMS). The quadrupoleion trap (which will not be discussedin detail here), like the more widelyused quadrupole, uses a quadrupolarelectric ® e ld , which is producedfrom superimposed dc and radio-fre-quency (rf) potentials by two ``cap’ ’electrodes and one ``ring’ ’ electrode,
con® ning ions in three dimensions.In contrast, ion trapping in FTMS isachieved through the combination ofa dc electric ® eld and a magnetic® eld, and is based upon the principleof ion cyclotron resonance (ICR);consequently, the technique is some-times known in the literature as FT-ICRMS. The unique trapping anddetection methods of FTMS, to bedescribed in detail here, have drawngreat attention because they provideultrahigh mass resolving power andaccuracy measurements while simul-taneously providing multichanneldetection and the ¯ exibility of atrapped ion instrument for tandemmass spectrometry (MS/MS) exper-iments.
In combination with ESI, FTMShas become a valuable tool in thecharacterization of macromolecules.The combined ESI-FTMS technique
APPLIED SPECTROSCOPY 19A
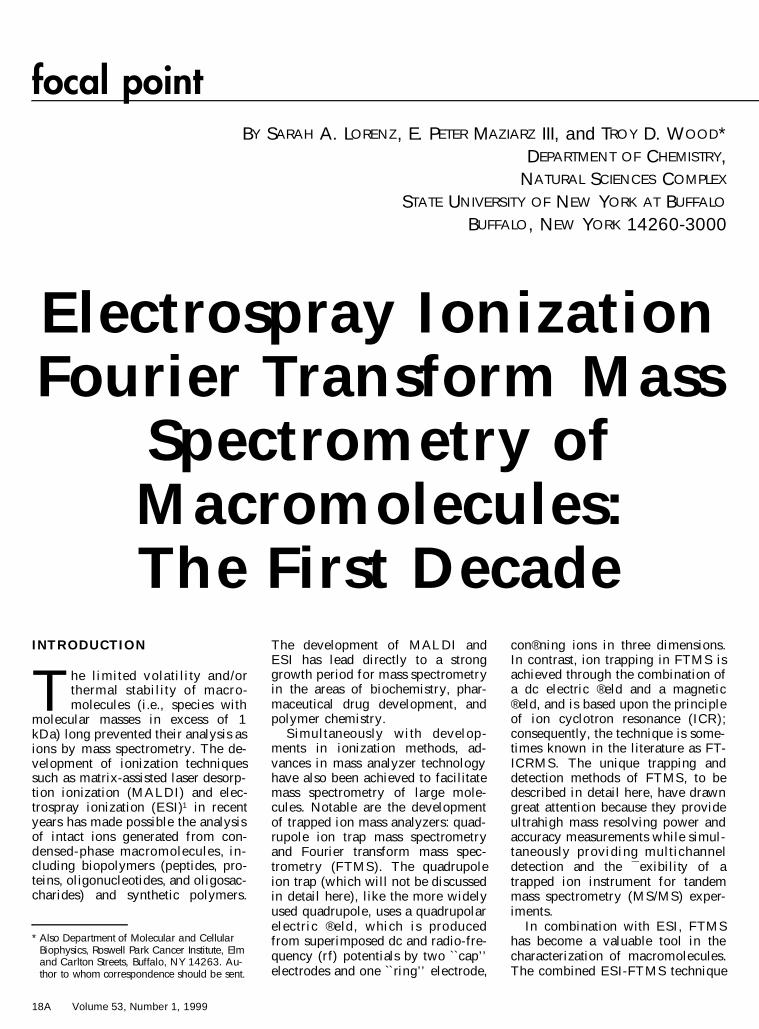
FIG. 1. Schematic diagram of a typical electrospray ionization source, including the interface region into the vacuum of a massspectrometer.
is approaching its tenth anniversary,with the ® rst report being publishedin 1989.2 This Focal Point article isintended as a tribute that covers the® rst decade of ESI-FTMS. It is struc-tured as follows: First, we describesome of the fundamentals of ESI asan ionization technique and FTMSas a mass analyzer. Then, develop-ments in instrumentation necessaryto perform ESI-FTMS are describedin detail. Selected examples of theunique strengths and applications ofESI-FTMS as an analytical tool forcharacterizing macromolecules arediscussed. Technique developmentsin tandem ESI-FTMS and ion±mol-ecule reactions for character izinggaseous biomolecule conformerstructure are well covered in a recentreview and will not be discussedhere.3
FUNDAMENTALS OF ELEC-TROSPRAY IONIZATION
Use of ESI in the analysis of largemolecules such as proteins has be-come commonplace since initial ef-forts of the Fenn group in the 1980s.1
A generic ESI source is depicted inFig. 1. In ESI, a solution containingthe sample is admitted into the massspectrometer through a needle to-ward a capillary inlet; the sample so-lution is typically delivered to theneedle by an infusion pump or a liq-uid chromatography (LC) pump. As
a consequence of a large potentialdifference between the needle andthe capillary, highly charged liquiddroplets are formed at the needle tipand are accelerated to the capillaryinlet, which serves as a counter-elec-trode. Note: in some ESI source con-® gurations, the needle is groundedwhile a large potential ( ; 6 3 kV) isplaced on the counter-electrode, andin other designs, the large potentialis on the needle and the counter-elec-trode is grounded. Just before thedroplets are accelerated into the vac-uum chamber, a perpendicular ¯ owof hot drying gas (usually N2) is ap-plied, assisting in droplet desolva-tion. The droplets further desolvatevia collisions with neutrals in thesource region as they are acceleratedthrough a nozzle, a skimmer, and theion optics toward the mass analyzer.After desolvation, multiply chargedions are transported into the mass an-alyzer, which itself resides within ahigh vacuum. One reason for thewidespread use of ESI is associatedwith its ability to generate ions oflow m /z, within the usable massrange of most mass spectrometers.Furthermore, ESI can be coupledreadily to liquid separation tech-niques, such as LC and capillaryelectrophoresis (CE), providing highutility in the analysis of samplesfrom complex biological milieu.
FUNDAMENTALS OF FTMS
Ion Motions. Any discussion ofFTMS should begin with the prin-ciple of ion cyclotron motion. An ionmoving in the presence of spatiallyuniform electric (E, in V m 2 1) andmagnetic (B, in Tesla) ® elds in anICR ion trap (Fig. 2) is subjected toa Lorentz force, as shown by Eq. 1:
Force 5 (mass) 3 (acceleration) 5qE 1 qv 3 B (1)
in which m is ionic mass (kg), q isionic electrostatic charge (C), v ision velocity (m s 2 1), and the mag-netic ® eld is directed toward the pos-itive z direction: B 5 B0k. If r is theion cyclotron orbital radius, then an-gular acceleration about the z axis,dv /dt, is equal to v and Eq. 1 be-2 /rxy
comes
2vdv xym 5 5 m
d t r
5 qE 1 qv 3 B. (2)
In the absence of an electric ® eld, E,Eq. 2 can be simpli® ed to
m B r05 . (3)
q vxy
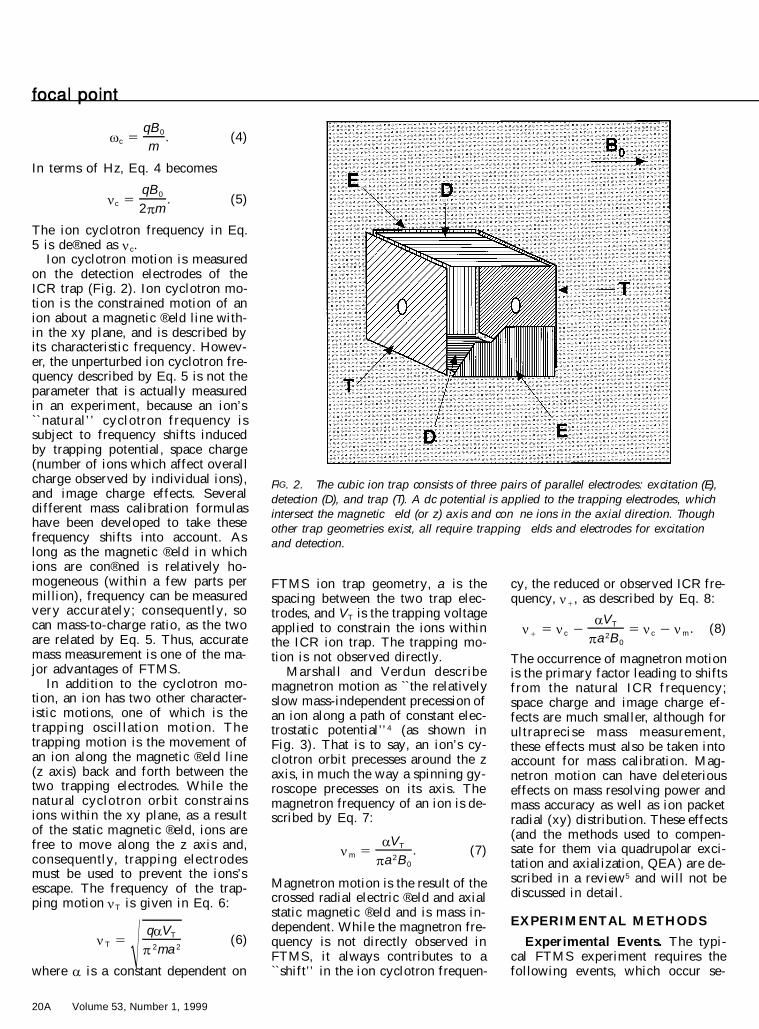
Cyclotron motion is illustrated inFig. 3. Because the angular frequen-cy, v , can be expressed as v 5
Eq. 3 may be rearranged andv /r,xy
simpli ® ed in to the ion cyclotronequation given in Eq. 4
20A Volume 53, Number 1, 1999
focal point
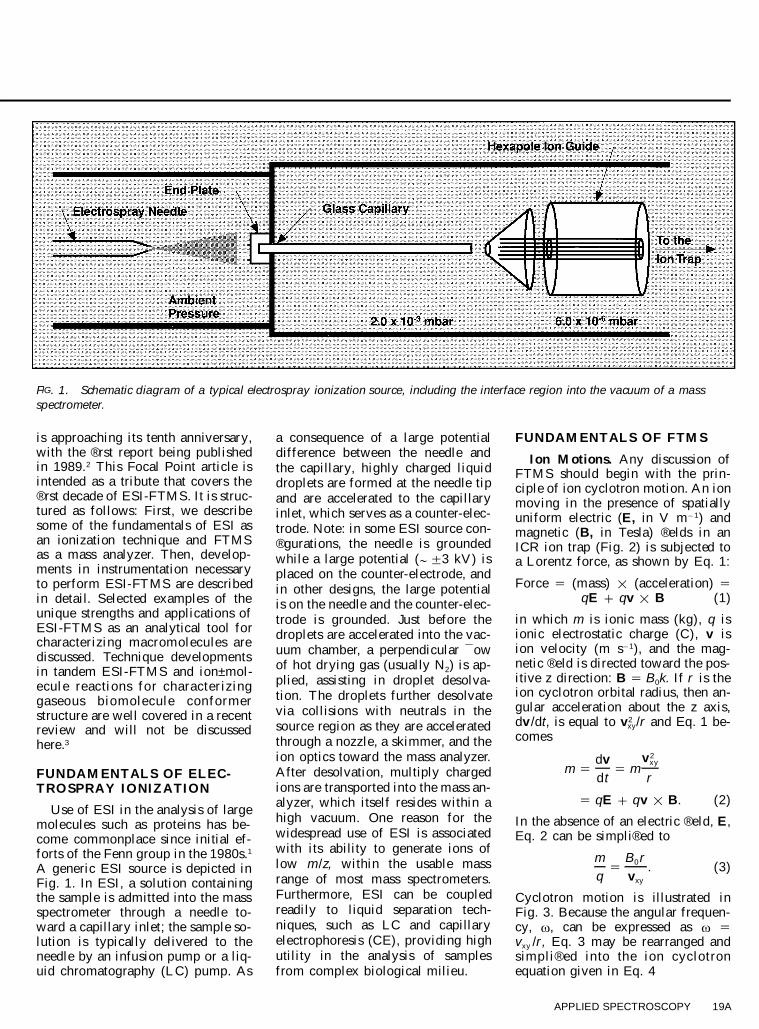
FIG. 2. The cubic ion trap consists of three pairs of parallel electrodes: excitation (E),detection (D), and trap (T). A dc potential is applied to the trapping electrodes, whichintersect the magnetic �eld (or z) axis and con�ne ions in the axial direction. Thoughother trap geometries exist, all require trapping �elds and electrodes for excitationand detection.
qB 0v 5 . (4)c
m
In terms of Hz, Eq. 4 becomes
qB 0n 5 . (5)c
2 p m
The ion cyclotron frequency in Eq.5 is de® ned as n c.
Ion cyclotron motion is measuredon the detection electrodes of theICR trap (Fig. 2). Ion cyclotron mo-tion is the constrained motion of anion about a magnetic ® eld line with-in the xy plane, and is described byits characteristic frequency. Howev-er, the unperturbed ion cyclotron fre-quency described by Eq. 5 is not theparameter that is actually measuredin an experiment, because an ion’ s``natural’ ’ cyclotron frequency issubject to frequency shifts inducedby trapping potential, space charge(number of ions which affect overallcharge observed by individual ions),and image charge effects. Severaldifferent mass calibration formulashave been developed to take thesefrequency shifts into account. Aslong as the magnetic ® eld in whichions are con® ned is relatively ho-mogeneous (within a few parts permillion), frequency can be measuredvery accurately; consequently, socan mass-to-charge ratio, as the twoare related by Eq. 5. Thus, accuratemass measurement is one of the ma-jor advantages of FTMS.
In addition to the cyclotron mo-tion, an ion has two other character-istic motions, one of which is thetrapping oscillation motion. Thetrapping motion is the movement ofan ion along the magnetic ® eld line(z axis) back and forth between thetwo trapping electrodes. While thenatural cyclo tron orb it constrainsions within the xy plane, as a resultof the static magnetic ® eld, ions arefree to move along the z axis and,consequently, trapping electrodesmust be used to prevent the ions’sescape. The frequency of the trap-ping motion n T is given in Eq. 6:
q a VTn 5 (6)T 2 2! p ma
where a is a constant dependent on
FTMS ion trap geometry, a is thespacing between the two trap elec-trodes, and VT is the trapping voltageapplied to constrain the ions withinthe ICR ion trap. The trapping mo-tion is not observed directly.
Marshall and Verdun describemagnetron motion as ``the relativelyslow mass-independent precession ofan ion along a path of constant elec-trostatic potential’ ’ 4 (as shown inFig. 3). That is to say, an ion’ s cy-clotron orbit precesses around the zaxis, in much the way a spinning gy-roscope precesses on its axis. Themagnetron frequency of an ion is de-scribed by Eq. 7:
a VTn 5 . (7)m 2p a B 0
Magnetron motion is the result of thecrossed radial electric ® eld and axialstatic magnetic ® eld and is mass in-dependent. While the magnetron fre-quency is not directly observed inFTMS, it always contributes to a``shift’ ’ in the ion cyclotron frequen-
cy, the reduced or observed ICR fre-quency, n 1 , as described by Eq. 8:
a VTn 5 n 2 5 n 2 n . (8)1 c c m2p a B 0
The occurrence of magnetron motionis the primary factor leading to shiftsfrom the natural ICR frequency;space charge and image charge ef-fects are much smaller, although forultraprecise mass measurement,these effects must also be taken intoaccount for mass calibration. Mag-netron motion can have deleteriouseffects on mass resolving power andmass accuracy as well as ion packetradial (xy) distribution. These effects(and the methods used to compen-sate for them via quadrupolar exci-tation and axialization, QEA) are de-scribed in a review5 and will not bediscussed in detail.
EXPERIMENTAL METHODS
Experimental Events. The typi-cal FTMS experiment requires thefollowing events, which occur se-
APPLIED SPECTROSCOPY 21A
FIG. 3. Illustration of ion cyclotron and magnetron orbits about the magnetic �eldaxis (which points into the plane of the paper). The trajectory of an ion moving in thexy plane is ‘‘bent’’ into a circle by the Lorentz magnetic force. The resulting cyclotronorbit (with radius r1 ) precesses about the magnetic �eld axis, which is magnetron mo-tion (with radius r 2 ).
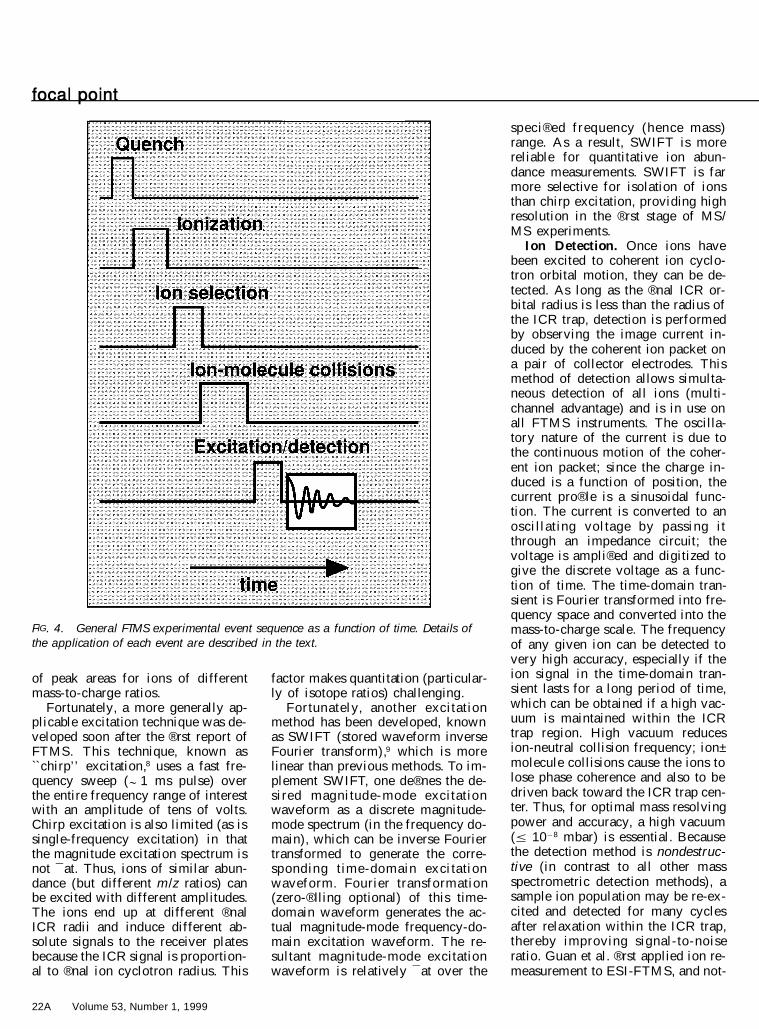
quentially in time (shown in Fig. 4):ion quench (in which ions are re-moved from the ion trap), ion for-mation, ion excitation, and ion de-tection. Various delay periods arealso used to permit rapid electronicswitching between events or to allowion-neutral collisions for dissociationor reaction . These experimentalevents take place in the ICR ion trap.Figure 2 depicts the most commonICR trap, the cubic trap. The cubictrap consists of two trapping elec-trodes and a pair of both excitationand detection electrodes. The impor-tance of trapping electrodes has al-ready been mentioned. The require-ment of excitation and detectionelectrodes will become apparent inthe following sections, which de-scribe in more detail the nature ofeach event of an ICR experiment.
Ion Quench. At the beginning of
an FTMS experiment, all the ionsthat remain within the trap are re-moved to empty it of unwanted ionsfrom previous experiments. This isdone in a nonselective manner byapplication of a large potential dif-ference between the trapping elec-trodes for a few milliseconds. Typi-cally, a potential of 1 10 V is appliedto one trapping electrode and a po-tential of 2 10 V is applied to theother trapping electrode to simulta-neously remove both positive andnegative ions from the ICR trap.
Ion Formation. Ion formation isthe second event in an FTMS exper-iment. FTMS has shown great ver-satility in that virtually all ionizationsources have been interfaced to it.For ESI-FTMS, the ESI source maybe located far from the ICR trap (ex-ternal source) 2 or close to the trap(internal source).6 Details of these
two different approaches are de-scribed in the ESI-FTMS instrumen-tation section which follows.
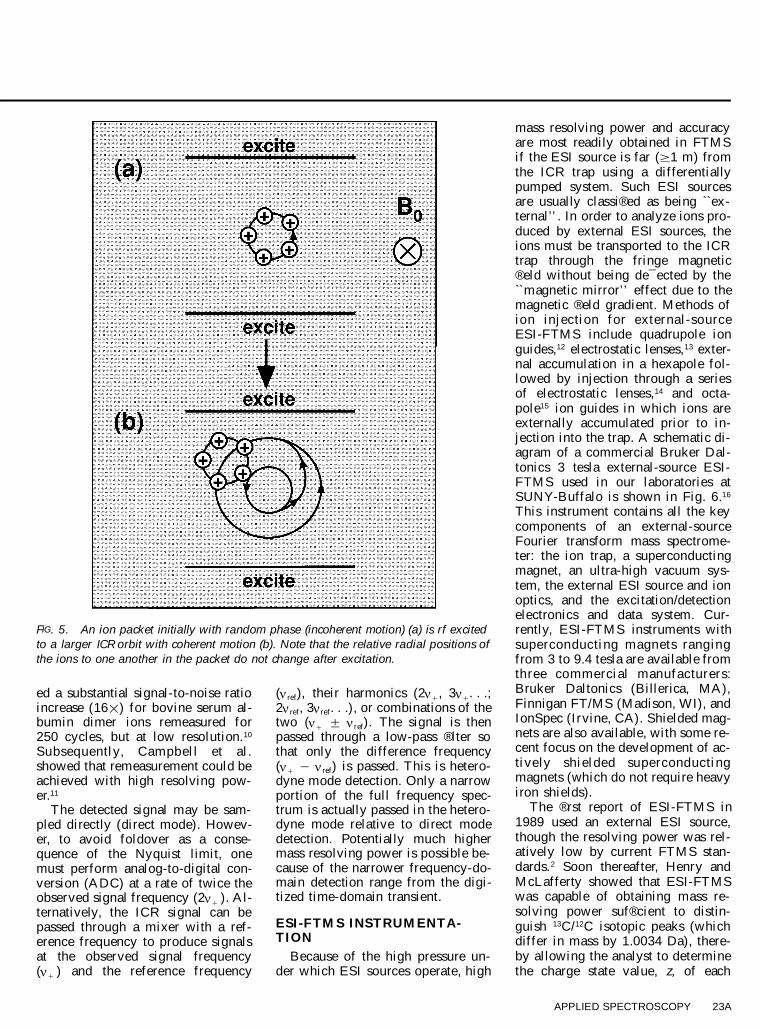
Ion Excitation. Once form ed,ions need to be detected. As a con-sequence of being formed at randomtime intervals and with different ini-tial velocities (even for ions of thesame mass-to-charge ratio), ions areat random points along their circularion cyclotron orbits. Under this con-dition, ions have random phase withincoherent motion. Thus, these in-coherent ions cannot produce a de-tectable signal to generate an imagecurrent (described below) unlessthey are ® rst moved off-center into acoherent ICR motion. This proce-dure is accomplished by applicationof a phase-coherent rf electric ® eldoscillating at v c to the excitationelectrodes of an ICR ion trap, suchas the standard cubic ICR ion trapdepicted in Fig. 2. As shown in Fig.5, the rf electric ® eld effectivelypushes the ions forward in their cy-clotron orbits to larger radii. As theapplied excitation pulse ceases, theions stop absorbing power and reachtheir ® nal ion cyclotron radii. Oncethey begin to undergo coherent mo-tion, the ions can produce a detect-able signal.
There are three primary modes ofion excitation in FTMS experiments.The most conceptually simple ofthese is known as single-frequencyexcitation, used in the ® rst FTMSexperiment by Comisarow and Mar-shall.7 In this excitation mode, a res-onant electric ® eld is applied for ashort period of time (on the order ofhundreds of milliseconds) at one fre-quency. Any ion whose natural fre-quency matches the excitation fre-quency is excited to a larger orbit,thereby achieving coherent motion.The chief shortcoming with single-frequency excitation is that the ex-citation magnitude is not ¯ at withfrequency. This is an importan tdrawback for broad-band analyticalpurposes, because only a ¯ at exci-tation magnitude over the frequencyrange of interest will give the sameexcitation to ions of different fre-quencies and an accurate depiction
22A Volume 53, Number 1, 1999
focal point
FIG. 4. General FTMS experimental event sequence as a function of time. Details ofthe application of each event are described in the text.
of peak areas for ions of differentmass-to-charge ratios.
Fortunately, a more generally ap-plicable excitation technique was de-veloped soon after the ® rst report ofFTMS. This technique, known as``chirp’ ’ excitation,8 uses a fast fre-quency sweep ( ; 1 ms pulse) overthe entire frequency range of interestwith an amplitude of tens of volts.Chirp excitation is also limited (as issingle-frequency excitation) in thatthe magnitude excitation spectrum isnot ¯ at. Thus, ions of similar abun-dance (but different m /z ratios) canbe excited with different amplitudes.The ions end up at different ® nalICR radii and induce different ab-solute signals to the receiver platesbecause the ICR signal is proportion-al to ® nal ion cyclotron radius. This
factor makes quantitation (particular-ly of isotope ratios) challenging.
For tunately, another excitationmethod has been developed, knownas SWIFT (stored waveform inverseFourier transform),9 which is morelinear than previous methods. To im-plement SWIFT, one de® nes the de-sired magnitude-mode excitationwaveform as a discrete magnitude-mode spectrum (in the frequency do-main), which can be inverse Fouriertransformed to generate the corre-sponding time-domain excitationwaveform. Fourier transformation(zero-® lling optional) of this time-domain waveform generates the ac-tual magnitude-mode frequency-do-main excitation waveform. The re-sultant magnitude-mode excitationwaveform is relatively ¯ at over the
speci ® ed frequency (hence mass)range. As a result, SWIFT is morereliable for quantitative ion abun-dance measurements. SWIFT is farmore selective for isolation of ionsthan chirp excitation, providing highresolution in the ® rst stage of MS/MS experiments.
Ion Detection. Once ions havebeen excited to coherent ion cyclo-tron orbital motion, they can be de-tected. As long as the ® nal ICR or-bital radius is less than the radius ofthe ICR trap, detection is performedby observing the image current in-duced by the coherent ion packet ona pair of collector electrodes. Thismethod of detection allows simulta-neous detection of all ions (multi-channel advantage) and is in use onall FTMS instruments. The oscilla-tory nature of the current is due tothe continuous motion of the coher-ent ion packet; since the charge in-duced is a function of position, thecurrent pro® le is a sinusoidal func-tion. The current is converted to anoscillating voltage by passing itthrough an impedance circuit; thevoltage is ampli® ed and digitized togive the discrete voltage as a func-tion of time. The time-domain tran-sient is Fourier transformed into fre-quency space and converted into themass-to-charge scale. The frequencyof any given ion can be detected tovery high accuracy, especially if theion signal in the time-domain tran-sient lasts for a long period of time,which can be obtained if a high vac-uum is maintained within the ICRtrap region. High vacuum reducesion-neutral collision frequency; ion±molecule collisions cause the ions tolose phase coherence and also to bedriven back toward the ICR trap cen-ter. Thus, for optimal mass resolvingpower and accuracy, a high vacuum( # 10 2 8 mbar) is essential. Becausethe detection method is nondestruc-tive (in contrast to all other massspectrometric detection methods), asample ion population may be re-ex-cited and detected for many cyclesafter relaxation within the ICR trap,thereby improving signal-to-noiseratio. Guan et al. ® rst applied ion re-measurement to ESI-FTMS, and not-
APPLIED SPECTROSCOPY 23A
FIG. 5. An ion packet initially with random phase (incoherent motion) (a) is rf excitedto a larger ICR orbit with coherent motion (b). Note that the relative radial positions ofthe ions to one another in the packet do not change after excitation.
ed a substantial signal-to-noise ratioincrease (16 3 ) for bovine serum al-bumin dimer ions remeasured for250 cycles, but at low resolution.10
Subsequently, Campbell et al .showed that remeasurement could beachieved with high resolving pow-er.11
The detected signal may be sam-pled directly (direct mode). Howev-er, to avoid foldover as a conse-quence of the Nyquist limit, onemust perform analog-to-digital con-version (ADC) at a rate of twice theobserved signal frequency (2n 1 ). Al-ternatively, the ICR signal can bepassed through a mixer with a ref-erence frequency to produce signalsat the observed signal frequency(n 1 ) and the reference frequency
(n ref), their harmonics (2n 1 , 3n 1 . . .;2n ref, 3n ref. . .), or combinations of thetwo (n 1 6 n ref). The signal is thenpassed through a low-pass ® lter sothat only the difference frequency(n 1 2 n ref) is passed. This is hetero-dyne mode detection. Only a narrowportion of the full frequency spec-trum is actually passed in the hetero-dyne mode relative to direct modedetection. Potentially much highermass resolving power is possible be-cause of the narrower frequency-do-main detection range from the digi-tized time-domain transient.
ESI-FTMS INSTRUMENTA-TION
Because of the high pressure un-der which ESI sources operate, high
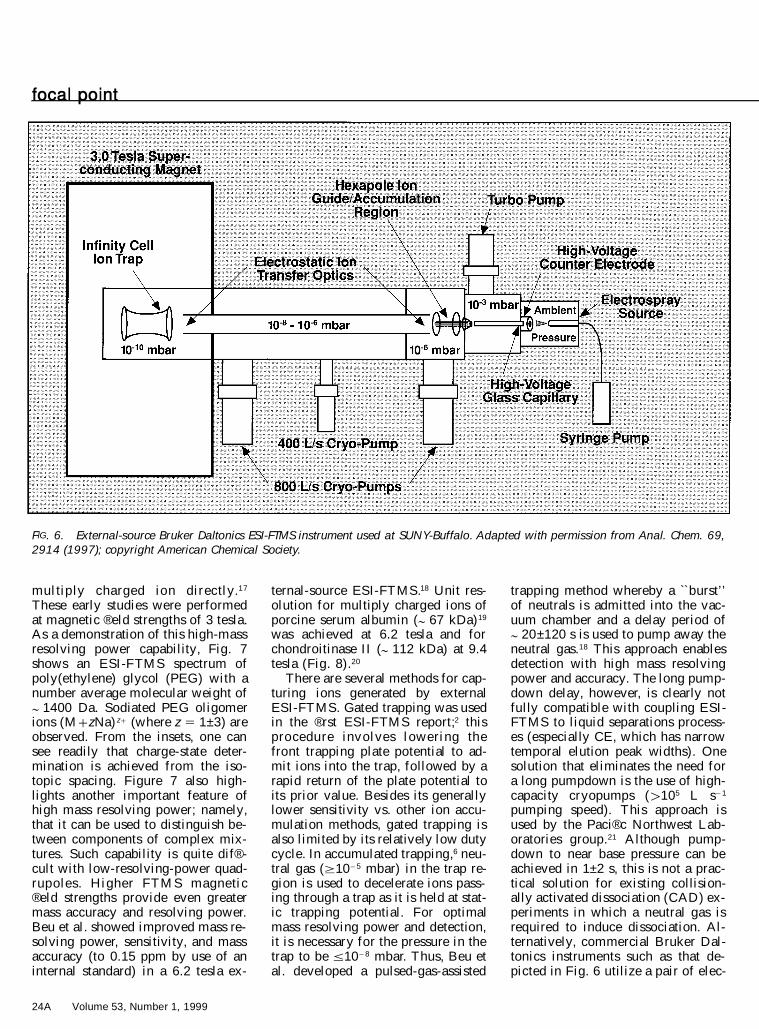
mass resolving power and accuracyare most readily obtained in FTMSif the ESI source is far ( $ 1 m) fromthe ICR trap using a differentiallypumped system. Such ESI sourcesare usually classi® ed as being ``ex-ternal’ ’ . In order to analyze ions pro-duced by external ESI sources, theions must be transported to the ICRtrap through the fringe magnetic® eld without being de¯ ected by the``magnetic mirror’ ’ effect due to themagnetic ® eld gradient. Methods ofion injection for external-sourceESI-FTMS include quadrupole ionguides,12 electrostatic lenses,13 exter-nal accumulation in a hexapole fol-lowed by injection through a seriesof electrostatic lenses,14 and octa-pole15 ion guides in which ions areexternally accumulated prior to in-jection into the trap. A schematic di-agram of a commercial Bruker Dal-tonics 3 tesla external-source ESI-FTMS used in our laboratories atSUNY-Buffalo is shown in Fig. 6.16
This instrument contains all the keycomponents of an external-sourceFourier transform mass spectrome-ter: the ion trap, a superconductingmagnet, an ultra-high vacuum sys-tem, the external ESI source and ionoptics, and the excitation/detectionelectronics and data system. Cur-rently, ESI-FTMS instruments withsuperconducting magnets rangingfrom 3 to 9.4 tesla are available fromthree commercial manufacturers:Bruker Daltonics (Billerica, MA),Finnigan FT/MS (Madison, WI), andIonSpec (Irvine, CA). Shielded mag-nets are also available, with some re-cent focus on the development of ac-tively shielded superconductingmagnets (which do not require heavyiron shields).
The ® rst report of ESI-FTMS in1989 used an external ESI source,though the resolving power was rel-atively low by current FTMS stan-dards.2 Soon thereafter, Henry andMcLafferty showed that ESI-FTMSwas capable of obtaining mass re-solving power suf® cient to distin-guish 13C/12C isotopic peaks (whichdiffer in mass by 1.0034 Da), there-by allowing the analyst to determinethe charge state value, z, of each
24A Volume 53, Number 1, 1999
focal point
FIG. 6. External-source Bruker Daltonics ESI-FTMS instrument used at SUNY-Buffalo. Adapted with permission from Anal. Chem. 69,2914 (1997); copyright American Chemical Society.
multip ly charged ion directly.17
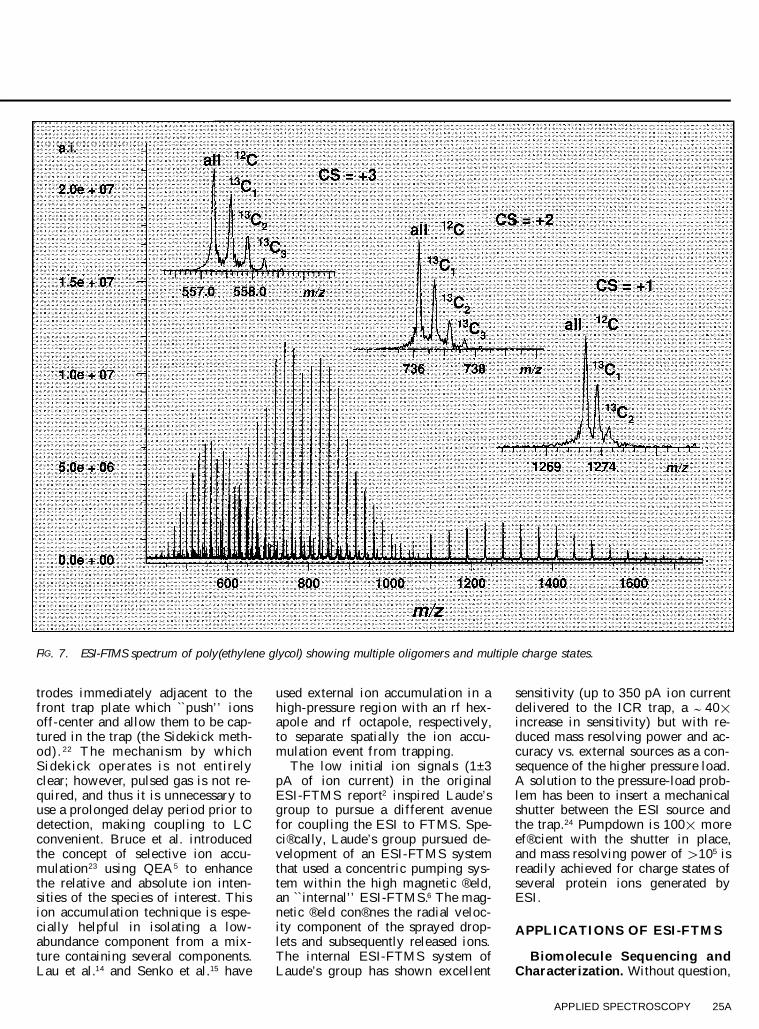
These early studies were performedat magnetic ® eld strengths of 3 tesla.As a demonstration of this high-massresolving power capability, Fig. 7shows an ESI-FTMS spectrum ofpoly(ethylene) glycol (PEG) with anumber average molecular weight of; 1400 Da. Sodiated PEG oligomerions (M 1 zNa) z 1 (where z 5 1±3) areobserved. From the insets, one cansee readily that charge-state deter-mination is achieved from the iso-topic spacing. Figure 7 also high-lights another important feature ofhigh mass resolving power; namely,that it can be used to distinguish be-tween components of complex mix-tures. Such capability is quite dif® -cult with low-resolving-power quad-rupoles. Higher FTMS magnetic® eld strengths provide even greatermass accuracy and resolving power.Beu et al. showed improved mass re-solving power, sensitivity, and massaccuracy (to 0.15 ppm by use of aninternal standard) in a 6.2 tesla ex-
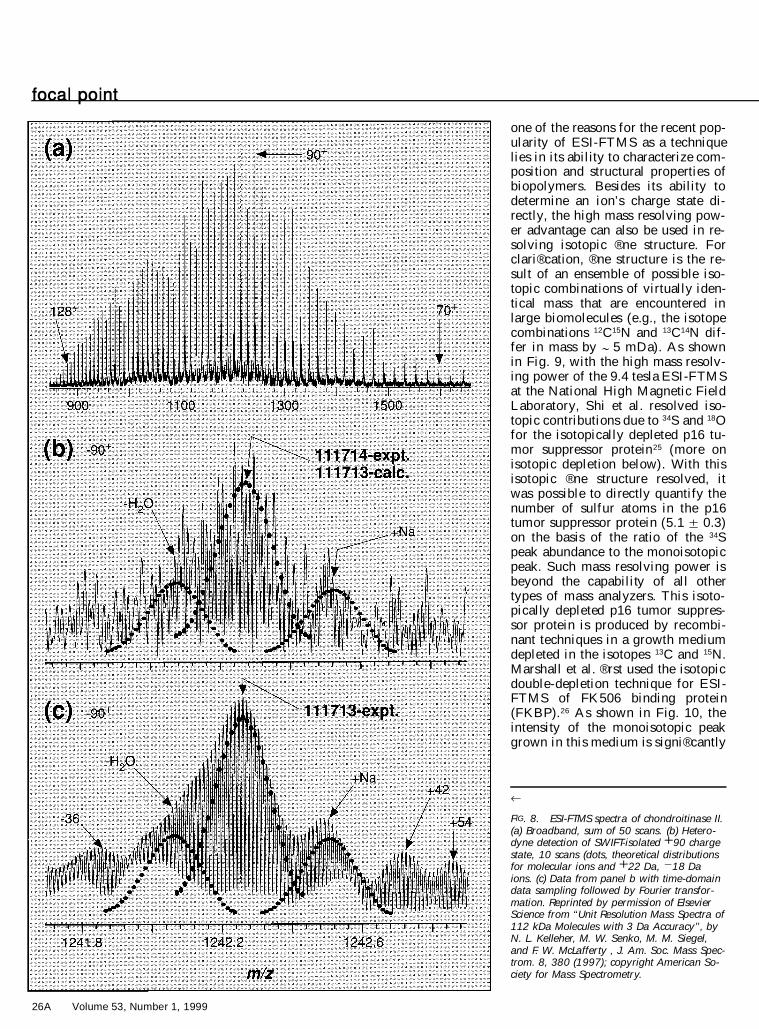
ternal-source ESI-FTMS.18 Unit res-olution for multiply charged ions ofporcine serum albumin ( ; 67 kDa)19
was achieved at 6.2 tesla and forchondroitinase II ( ; 112 kDa) at 9.4tesla (Fig. 8).20
There are several methods for cap-turing ions generated by externalESI-FTMS. Gated trapping was usedin the ® rst ESI-FTMS report;2 thisprocedure involves lowering thefront trapping plate potential to ad-mit ions into the trap, followed by arapid return of the plate potential toits prior value. Besides its generallylower sensitivity vs. other ion accu-mulation methods, gated trapping isalso limited by its relatively low dutycycle. In accumulated trapping,6 neu-tral gas ( $ 10 2 5 mbar) in the trap re-gion is used to decelerate ions pass-ing through a trap as it is held at stat-ic trapping potential. For optimalmass resolving power and detection,it is necessary for the pressure in thetrap to be # 10 2 8 mbar. Thus, Beu etal. developed a pulsed-gas-assisted
trapping method whereby a ``burst’ ’of neutrals is admitted into the vac-uum chamber and a delay period of; 20±120 s is used to pump away theneutral gas.18 This approach enablesdetection with high mass resolvingpower and accuracy. The long pump-down delay, however, is clearly notfully compatible with coupling ESI-FTMS to liquid separations process-es (especially CE, which has narrowtemporal elution peak widths). Onesolution that eliminates the need fora long pumpdown is the use of high-capacity cryopumps ( . 105 L s 2 1
pumping speed). This approach isused by the Paci® c Northwest Lab-oratories group.21 Although pump-down to near base pressure can beachieved in 1±2 s, this is not a prac-tical solution for existing collision-ally activated dissociation (CAD) ex-periments in which a neutral gas isrequired to induce dissociation. Al-ternatively, commercial Bruker Dal-tonics instruments such as that de-picted in Fig. 6 utilize a pair of elec-
APPLIED SPECTROSCOPY 25A
FIG. 7. ESI-FTMS spectrum of poly(ethylene glycol) showing multiple oligomers and multiple charge states.
trodes immediately adjacent to thefront trap plate which ``push’ ’ ionsoff-center and allow them to be cap-tured in the trap (the Sidekick meth-od). 22 T he mechanism by whichSidekick operates is not entirelyclear; however, pulsed gas is not re-quired, and thus it is unnecessary touse a prolonged delay period prior todetection, making coupling to LCconvenient. Bruce et al. introducedthe concept of selective ion accu-mulation23 using QEA5 to enhancethe relative and absolute ion inten-sities of the species of interest. Thision accumulation technique is espe-cially helpful in isolating a low-abundance component from a mix-ture containing several components.Lau et al.14 and Senko et al.15 have
used external ion accumulation in ahigh-pressure region with an rf hex-apole and rf octapole, respectively,to separate spatially the ion accu-mulation event from trapping.
The low initial ion signals (1±3pA of ion current) in the originalESI-FTMS report2 inspired Laude’ sgroup to pursue a different avenuefor coupling the ESI to FTMS. Spe-ci® cally, Laude’s group pursued de-velopment of an ESI-FTMS systemthat used a concentric pumping sys-tem within the high magnetic ® eld,an ``internal’ ’ ESI-FTMS.6 The mag-netic ® eld con® nes the radial veloc-ity component of the sprayed drop-lets and subsequently released ions.The internal ESI-FTMS system ofLaude’s group has shown excellent
sensitivity (up to 350 pA ion currentdelivered to the ICR trap, a ; 40 3increase in sensitivity) but with re-duced mass resolving power and ac-curacy vs. external sources as a con-sequence of the higher pressure load.A solution to the pressure-load prob-lem has been to insert a mechanicalshutter between the ESI source andthe trap.24 Pumpdown is 100 3 moreef® cient with the shutter in place,and mass resolving power of . 105 isreadily achieved for charge states ofseveral protein ions generated byESI.
APPLICATIONS OF ESI-FTMS
Biom olecule Sequencing andCharacterization. Without question,
26A Volume 53, Number 1, 1999
focal point
¬
FIG. 8. ESI-FTMS spectra of chondroitinase II.(a) Broadband, sum of 50 scans. (b) Hetero-dyne detection of SWIFT-isolated 1 90 chargestate, 10 scans (dots, theoretical distributionsfor molecular ions and 1 22 Da, 2 18 Daions. (c) Data from panel b with time-domaindata sampling followed by Fourier transfor-mation. Reprinted by permission of ElsevierScience from ‘‘Unit Resolution Mass Spectra of112 kDa Molecules with 3 Da Accuracy’’, byN. L. Kelleher, M. W. Senko, M. M. Siegel,and F. W. McLafferty , J. Am. Soc. Mass Spec-trom. 8, 380 (1997); copyright American So-ciety for Mass Spectrometry.
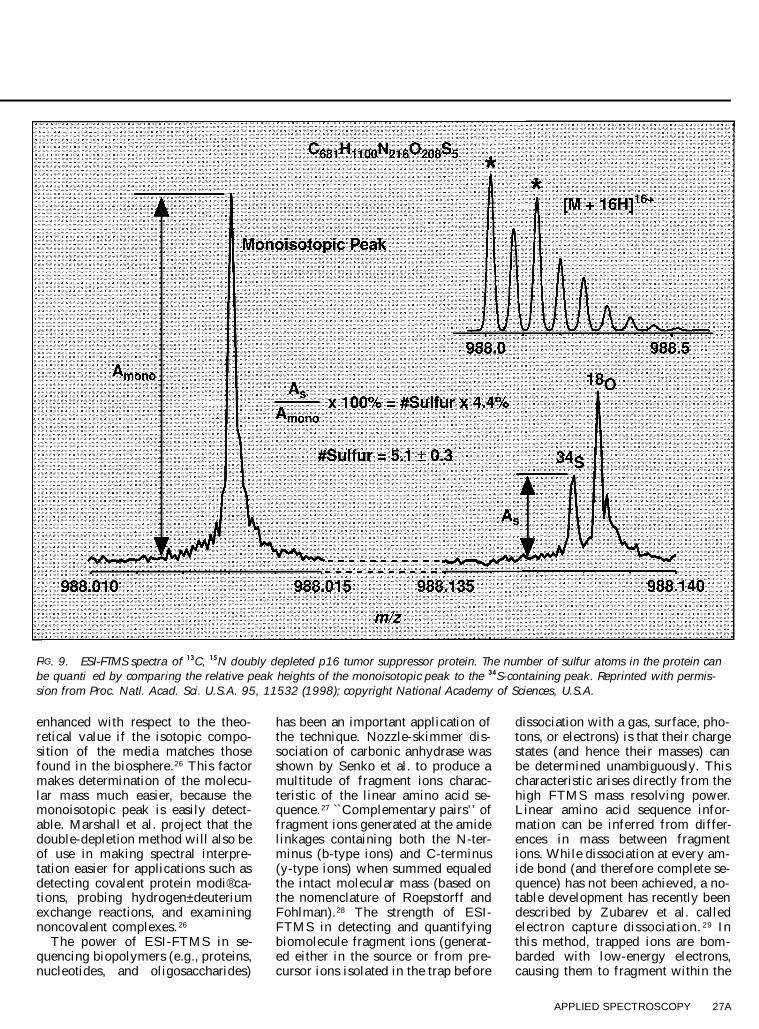
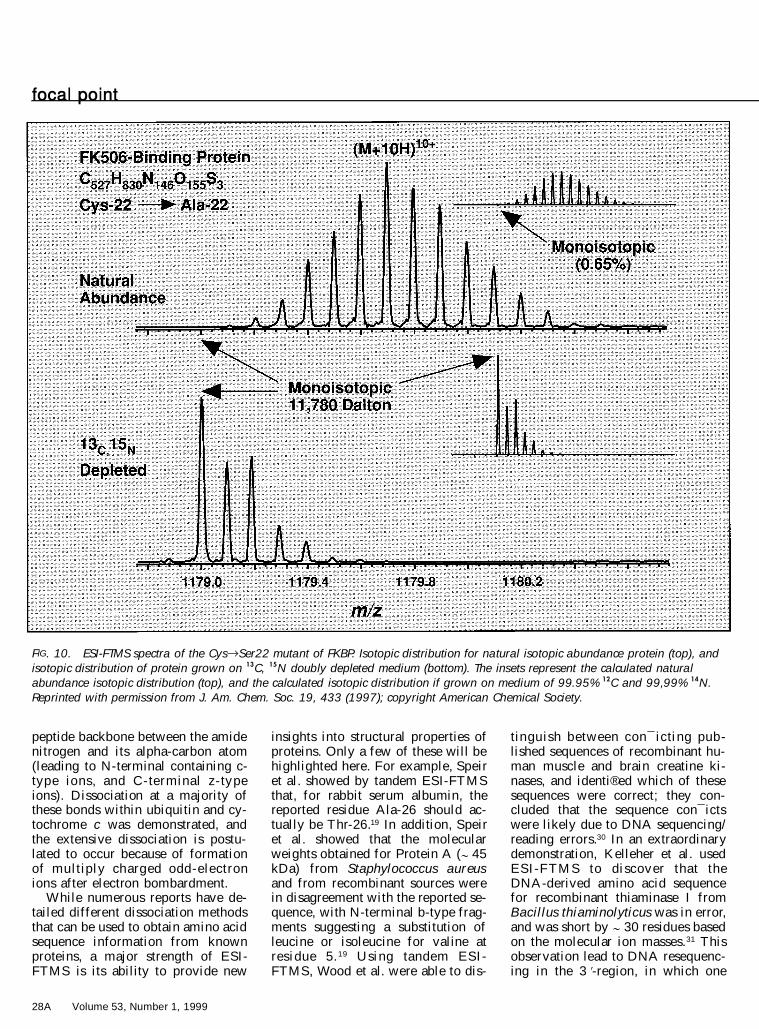
one of the reasons for the recent pop-ularity of ESI-FTMS as a techniquelies in its ability to characterize com-position and structural properties ofbiopolymers. Besides its ability todetermine an ion’s charge state di-rectly, the high mass resolving pow-er advantage can also be used in re-solving isotopic ® ne structure. Forclari® cation, ® ne structure is the re-sult of an ensemble of possible iso-topic combinations of virtually iden-tical mass that are encountered inlarge biomolecules (e.g., the isotopecombinations 12C15N and 13C14N dif-fer in mass by ; 5 mDa). As shownin Fig. 9, with the high mass resolv-ing power of the 9.4 tesla ESI-FTMSat the National High Magnetic FieldLaboratory, Shi et al. resolved iso-topic contributions due to 34S and 18Ofor the isotopically depleted p16 tu-mor suppressor protein 25 (more onisotopic depletion below). With thisisotopic ® ne structure resolved, itwas possible to directly quantify thenumber of sulfur atoms in the p16tumor suppressor protein (5.1 6 0.3)on the basis of the ratio of the 34Speak abundance to the monoisotopicpeak. Such mass resolving power isbeyond the capability of all othertypes of mass analyzers. This isoto-pically depleted p16 tumor suppres-sor protein is produced by recombi-nant techniques in a growth mediumdepleted in the isotopes 13C and 15N.Marshall et al. ® rst used the isotopicdouble-depletion technique for ESI-FTMS of FK506 binding protein(FKBP).26 As shown in Fig. 10, theintensity of the monoisotopic peakgrown in this medium is signi® cantly
APPLIED SPECTROSCOPY 27A
FIG. 9. ESI-FTMS spectra of 13C, 15N doubly depleted p16 tumor suppressor protein. The number of sulfur atoms in the protein canbe quanti�ed by comparing the relative peak heights of the monoisotopic peak to the 34S-containing peak. Reprinted with permis-sion from Proc. Natl. Acad. Sci. U.S.A. 95, 11532 (1998); copyright National Academy of Sciences, U.S.A.
enhanced with respect to the theo-retical value if the isotopic compo-sition of the media matches thosefound in the biosphere.26 This factormakes determination of the molecu-lar mass much easier, because themonoisotopic peak is easily detect-able. Marshall et al. project that thedouble-depletion method will also beof use in making spectral interpre-tation easier for applications such asdetecting covalent protein modi® ca-tions, probing hydrogen±deuteriumexchange reactions, and examiningnoncovalent complexes. 26
The power of ESI-FTMS in se-quencing biopolymers (e.g., proteins,nucleotides, and oligosaccharides)
has been an important application ofthe technique. Nozzle-skimmer dis-sociation of carbonic anhydrase wasshown by Senko et al. to produce amultitude of fragment ions charac-teristic of the linear amino acid se-quence.27 ``Complementary pairs’ ’ offragment ions generated at the amidelinkages containing both the N-ter-minus (b-type ions) and C-terminus(y-type ions) when summed equaledthe intact molecular mass (based onthe nomenclature of Roepstorff andFohlman).28 The strength of ESI-FTMS in detecting and quantifyingbiomolecule fragment ions (generat-ed either in the source or from pre-cursor ions isolated in the trap before
dissociation with a gas, surface, pho-tons, or electrons) is that their chargestates (and hence their masses) canbe determined unambiguously. Thischaracteristic arises directly from thehigh FTMS mass resolving power.Linear amino acid sequence infor-mation can be inferred from differ-ences in mass between fragmentions. While dissociation at every am-ide bond (and therefore complete se-quence) has not been achieved, a no-table development has recently beendescribed by Zubarev et al. calledelectron capture dissociation. 29 Inthis method, trapped ions are bom-barded with low-energy electrons,causing them to fragment within the
28A Volume 53, Number 1, 1999
focal point
FIG. 10. ESI-FTMS spectra of the Cys®Ser22 mutant of FKBP. Isotopic distribution for natural isotopic abundance protein (top), andisotopic distribution of protein grown on 13C, 15N doubly depleted medium (bottom). The insets represent the calculated naturalabundance isotopic distribution (top), and the calculated isotopic distribution if grown on medium of 99.95% 12C and 99,99% 14N.Reprinted with permission from J. Am. Chem. Soc. 19, 433 (1997); copyright American Chemical Society.
peptide backbone between the amidenitrogen and its alpha-carbon atom(leading to N-terminal containing c-type ions, and C-terminal z-typeions). Dissociation at a majority ofthese bonds within ubiquitin and cy-tochrome c was demonstrated, andthe extensive dissociation is postu-lated to occur because of formationof multiply charged odd-electronions after electron bombardment.
While numerous reports have de-tailed different dissociation methodsthat can be used to obtain amino acidsequence information from knownproteins, a major strength of ESI-FTMS is its ability to provide new
insights into structural properties ofproteins. Only a few of these will behighlighted here. For example, Speiret al. showed by tandem ESI-FTMSthat, for rabbit serum albumin, thereported residue Ala-26 should ac-tually be Thr-26.19 In addition, Speiret al. showed that the molecularweights obtained for Protein A ( ; 45kDa) from Staphylococcus aureusand from recombinant sources werein disagreement with the reported se-quence, with N-terminal b-type frag-ments suggesting a substitution ofleucine or isoleucine for valine atresidue 5. 19 Using tandem ESI-FTMS, Wood et al. were able to dis-
tinguish between con¯ icting pub-lished sequences of recombinant hu-man muscle and brain creatine ki-nases, and identi® ed which of thesesequences were correct; they con-cluded that the sequence con¯ ictswere likely due to DNA sequencing/reading errors.30 In an extraordinarydemonstration, Kelleher et al. usedESI-FTMS to discover that theDNA-derived amino acid sequencefor recombinant thiaminase I fromBacillus thiaminolyticus was in error,and was short by ; 30 residues basedon the molecular ion masses.31 Thisobservation lead to DNA resequenc-ing in the 3 9 -region, in which one
APPLIED SPECTROSCOPY 29A
additional base was found at the co-don for residue 334, causing aframeshift reading error in the C-ter-minal portion of the enzyme. Theseauthors also determined that a 28amino acid signal peptide had notbeen cleaved, as was previously be-lieved.31 They also noted unexpectedmass heterogeneity for thiaminase Icontaining three species with molec-ular weights of 42 127, 42 197, and42 254 Da.31 Nozzle-skimmer dis-sociation revealed that this hetero-geneity arose from species contain-ing an extra alanine and an extra al-anine 1 glycine at the N-terminus; theheterogeneity was attributed to non-speci® c removal of a signal pep-tide.31
Other questions of protein hetero-geneity have been addressed by us-ing ESI-FTMS. For example, por-cine serum albumin was shown toexhibit different heterogeneous dis-tributions for ``fatty-acid free’ ’ and``fatty-acid and globulin free’ ’ iso-lates.19 Bruce et al. examined the het-erogeneous ribonuclease B and iden-ti ® ed glycosylated forms of the pro-tein.32 ESI-FTMS in concert withprior isoelectric focusing electropho-resis of rabbit muscle creatine kinaserevealed that of the many proposedsources of heterogeneity, only de-amidation could explain the isotopicdistributions observed for the molec-ular ions.33
ESI-FTMS has also been used toidentify covalent modi® cations with-in proteins. Guan et al. showed that,by addition of acetone prior to ESI,a protein could be modi® ed to formSchiff bases. This capability existsbecause aldehydes and ketones reactwith amine groups on lysine sidechains and the free N-termini.34 Apromising application of such meth-odology is that it could be used tolocate accessib le lysine residueswithin a protein structure. An ex-tremely exciting application of ESI-FTMS is in identifying amino acidresidues at the active site within en-zymes. For this approach to work, itis necessary to ® rst inactivate the en-zyme with a mechanism-based in-hibitor, which binds to the enzymecovalently and causes an upward
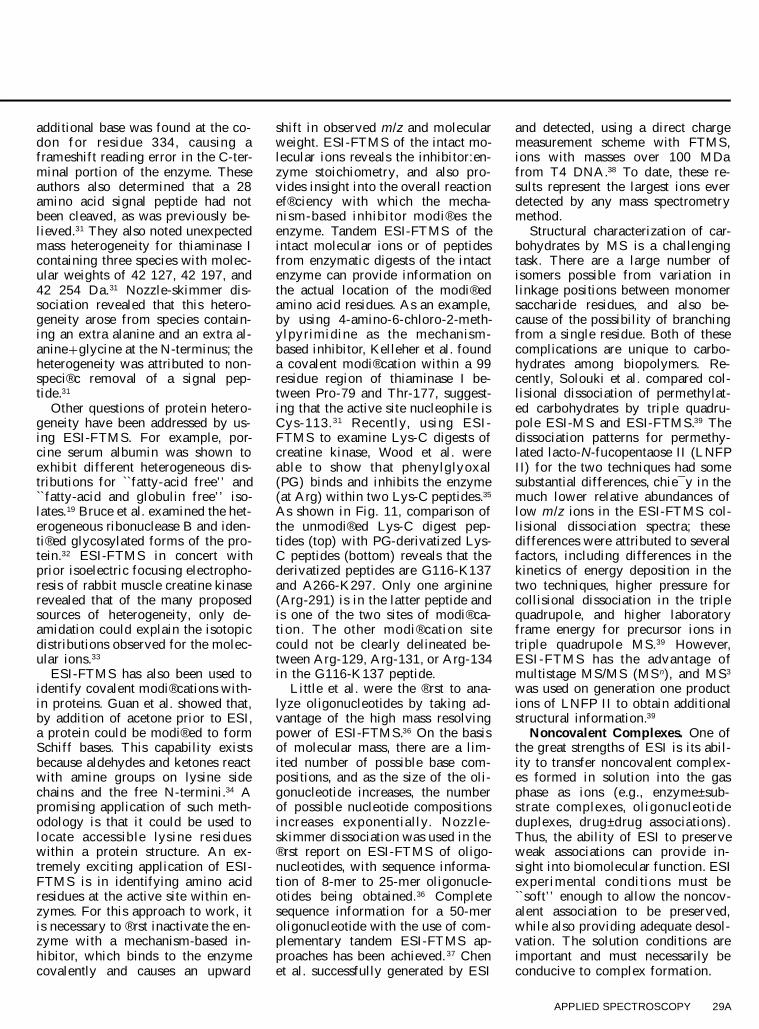
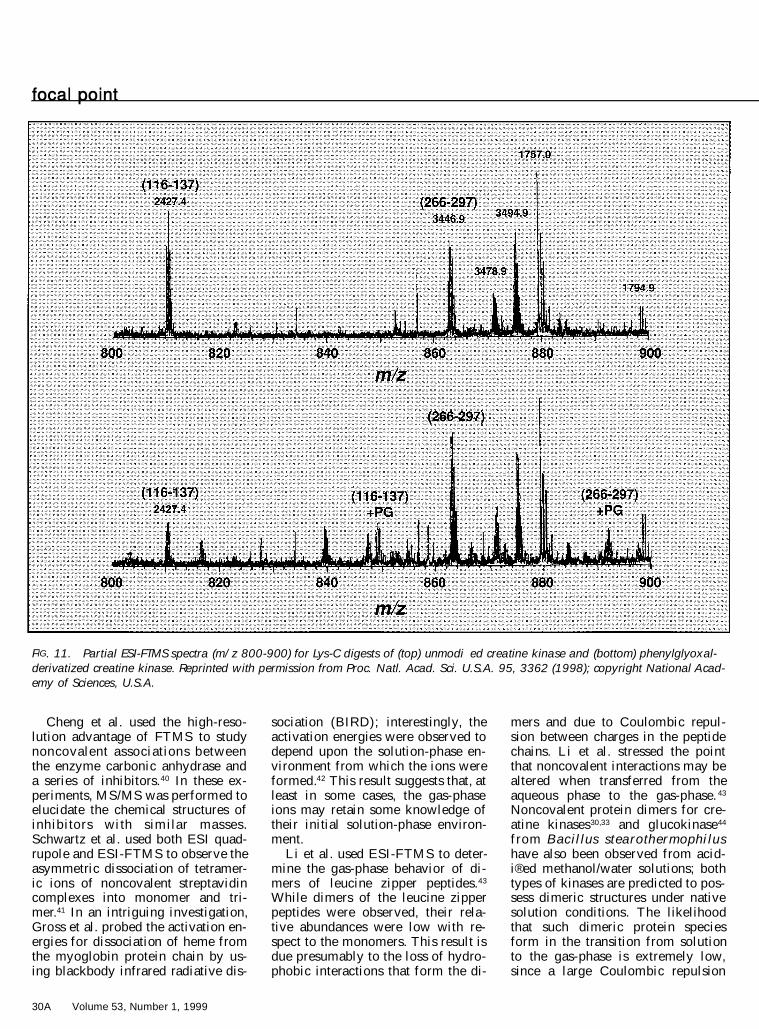
shift in observed m /z and molecularweight. ESI-FTMS of the intact mo-lecular ions reveals the inhibitor:en-zyme stoichiometry, and also pro-vides insight into the overall reactionef® ciency with which the mecha-nism-based inhib itor modi ® es theenzyme. Tandem ESI-FTMS of theintact molecular ions or of peptidesfrom enzymatic digests of the intactenzyme can provide information onthe actual location of the modi® edamino acid residues. As an example,by using 4-amino-6-chloro-2-meth-ylpyrim idine as the mechanism-based inhibitor, Kelleher et al. founda covalent modi® cation within a 99residue region of thiaminase I be-tween Pro-79 and Thr-177, suggest-ing that the active site nucleophile isCys-113. 31 Recently, using ESI-FTMS to examine Lys-C digests ofcreatine kinase, Wood et al. wereable to show that phenylg lyoxal(PG) binds and inhibits the enzyme(at Arg) within two Lys-C peptides.35
As shown in Fig. 11, comparison ofthe unmodi® ed Lys-C digest pep-tides (top) with PG-derivatized Lys-C peptides (bottom) reveals that thederivatized peptides are G116-K137and A266-K297. Only one arginine(Arg-291) is in the latter peptide andis one of the two sites of modi® ca-tion . The other modi ® cation sitecould not be clearly delineated be-tween Arg-129, Arg-131, or Arg-134in the G116-K137 peptide.
Little et al. were the ® rst to ana-lyze oligonucleotides by taking ad-vantage of the high mass resolvingpower of ESI-FTMS.36 On the basisof molecular mass, there are a lim-ited number of possible base com-positions, and as the size of the oli-gonucleotide increases, the numberof possible nucleotide compositionsincreases exponentially. Nozzle-skimmer dissociation was used in the® rst report on ESI-FTMS of oligo-nucleotides, with sequence informa-tion of 8-mer to 25-mer oligonucle-otides being obtained.36 Completesequence information for a 50-meroligonucleotide with the use of com-plementary tandem ESI-FTMS ap-proaches has been achieved. 37 Chenet al. successfully generated by ESI
and detected, using a direct chargemeasurement scheme with FTMS,ions with masses over 100 MDafrom T4 DNA.38 To date, these re-sults represent the largest ions everdetected by any mass spectrometrymethod.
Structural characterization of car-bohydrates by MS is a challengingtask. There are a large number ofisomers possible from variation inlinkage positions between monomersaccharide residues, and also be-cause of the possibility of branchingfrom a single residue. Both of thesecomplications are unique to carbo-hydrates among biopolymers. Re-cently, Solouki et al. compared col-lisional dissociation of permethylat-ed carbohydrates by triple quadru-pole ESI-MS and ESI-FTMS.39 Thedissociation patterns for permethy-lated lacto-N-fucopentaose II (LNFPII) for the two techniques had somesubstantial differences, chie¯ y in themuch lower relative abundances oflow m /z ions in the ESI-FTMS col-lisional dissociation spectra; thesedifferences were attributed to severalfactors, including differences in thekinetics of energy deposition in thetwo techniques, higher pressure forcollisional dissociation in the triplequadrupole, and higher laboratoryframe energy for precursor ions intriple quadrupole MS.39 However,ESI-FTMS has the advantage ofmultistage MS/MS (MS n), and MS3
was used on generation one productions of LNFP II to obtain additionalstructural information.39
Noncovalent Complexes. One ofthe great strengths of ESI is its abil-ity to transfer noncovalent complex-es formed in solution into the gasphase as ions (e.g., enzyme±sub-strate complexes, oligonucleotideduplexes, drug±drug associations).Thus, the ability of ESI to preserveweak associations can provide in-sight into biomolecular function. ESIexperimental conditions must be``soft’ ’ enough to allow the noncov-alent association to be preserved,while also providing adequate desol-vation. The solution conditions areimportant and must necessarily beconducive to complex formation.
30A Volume 53, Number 1, 1999
focal point
FIG. 11. Partial ESI-FTMS spectra (m/z 800-900) for Lys-C digests of (top) unmodi�ed creatine kinase and (bottom) phenylglyoxal-derivatized creatine kinase. Reprinted with permission from Proc. Natl. Acad. Sci. U.S.A. 95, 3362 (1998); copyright National Acad-emy of Sciences, U.S.A.
Cheng et al. used the high-reso-lution advantage of FTMS to studynoncovalent associations betweenthe enzyme carbonic anhydrase anda series of inhibitors.40 In these ex-periments, MS/MS was performed toelucidate the chemical structures ofinhib itors with sim ilar masses.Schwartz et al. used both ESI quad-rupole and ESI-FTMS to observe theasymmetric dissociation of tetramer-ic ions of noncovalent streptavidincomplexes into monomer and tri-mer.41 In an intriguing investigation,Gross et al. probed the activation en-ergies for dissociation of heme fromthe myoglobin protein chain by us-ing blackbody infrared radiative dis-
sociation (BIRD); interestingly, theactivation energies were observed todepend upon the solution-phase en-vironment from which the ions wereformed.42 This result suggests that, atleast in some cases, the gas-phaseions may retain some knowledge oftheir initial solution-phase environ-ment.
Li et al. used ESI-FTMS to deter-mine the gas-phase behavior of di-mers of leucine zipper peptides.43
While dimers of the leucine zipperpeptides were observed, their rela-tive abundances were low with re-spect to the monomers. This result isdue presumably to the loss of hydro-phobic interactions that form the di-
mers and due to Coulombic repul-sion between charges in the peptidechains. Li et al. stressed the pointthat noncovalent interactions may bealtered when transferred from theaqueous phase to the gas-phase. 43
Noncovalent protein dimers for cre-atine kinases30,33 and glucokinase44
from Bacillus stearo thermophilushave also been observed from acid-i® ed methanol/water solutions; bothtypes of kinases are predicted to pos-sess dimeric structures under nativesolution conditions. The likelihoodthat such dimeric protein speciesform in the transition from solutionto the gas-phase is extremely low,since a large Coulombic repulsion
APPLIED SPECTROSCOPY 31A
energy barrier would have to beovercome for unsolvated or partiallysolvated multiply charged ions to as-sociate.
Wunschel et al. demonstrated thatESI-FTMS was capable of detectingdouble-stranded DNA products of apolymerase chain reaction (PCR)from Bacillus cereus.45 Characteriza-tion of PCR products by ESI-FTMS(minutes) vs. gel electrophoresis(hours) is an important time-savingadvantage, with the added bene® t ofhigh mass accuracy from FTMS. Us-ing ESI-FTMS in this manner couldhave important applications in bio-medicine and forensics. These dou-ble-stranded DNA duplexes werestable even when selected ion accu-mulation by QEA was used. How-ever, noncovalent complex stabilityis very sensitive to QEA conditions,and hence must be used with somecaution.46 McLafferty et al. have alsodetected double-stranded DNA mol-ecules, and ® nd that the abundanceof the double-stranded DNA com-ponents is much higher than that ofthe single-stranded DNA compo-nents in the same sample.47 This fac-tor makes double-stranded DNAhighly amenable to sequencing bytandem ESI-FTMS.
Recently, L orenz et al. haveshown ESI-FTMS detection of non-covalent drug±drug complexes of theanticancer drug paclitaxel, whichforms aggregates in solution.48 Hex-apole ion accumulation experimentsand solution-phase hydrogen/deute-rium (H /D) exchange were per-formed to verify that the observeddimers were representative of solu-tion-phase phenomena, and not a re-sult of the ESI process. Such a resulthighlights the potential of ESI ingeneral to examine noncovalentdrug±drug interactions.
Synthetic Polymer Analysis. Apolydisperse synthetic polymer con-sists of an ensemble of oligomerchains that results in a distribution ofmolecular weights. Two statisticallybased average-molecular-weight pa-rameters shown in Eqs. 9 and 10 canbe used to calculate the extent ofpolydispersity (D ) (Eq. 11):
m aO i iM 5 (9)n
aO i
2m aO i iM 5 (10)w
m aO i i
M wD 5 (11)
M n
where m i is the mass of the ith olig-omer and a i is its abundance. Thenumber average molecular weight(M n) is dependent on the total num-ber of particles in the mass distri-bution. Evaluation of M n supplies in-formation regarding the thermody-namics and colligative properties ofthe polymer. The weight averagemolecular weight (M w) is determinedin such a way that each molecule inthe m ass distr ibution m akes aweighted contribution to the overallmeasured result relative to its size.Evaluation of M w yields informationregarding the bulk or macroscopicproperties of the polymer such astensile strength and toughness. Be-cause of these correlations, evalua-tion of the oligomeric distribution ishelpful for understanding the physi-cochemical and mechanical proper-ties of a particular polymer. The tra-ditional techniques used to deter-mine M n (osmometry) and M w (low-angle light scattering) are based onsome indirect property of the poly-mer species that requires correlationsto known standards.
The advent of soft ionization tech-niques, which generate gas-phaseions directly from nonvolatile sam-ples, has increased the in terestamong research groups to exploitmass spectrometry as a technique tomeasure polymeric distributions.This innovation is attractive becausemass spectrometry determines themolecular mass of oligomers direct-ly, therefore allowing evaluation ofM n and M w from a single experimen-tal measurement. In addition to av-erage mass values (M n, M w), one canalso obtain repeat unit and end groupcomposition from analysis of themass spectrum. This information canprovide evidence for the existence ofco-polymers, additives, and impuri-ties, and, as a QC protocol, can be
used to verify batch-to-batch com-positional variation.
ESI is an attractive ionizationchoice for synthetic polymers thatare soluble in protic or semiproticsolvents, which is the required me-dium for charge droplet formation tobe successful. The advantages of ESIionization include minimal fragmen-tation (compared to other soft ioni-zation techniques) and high ioniza-tion ef® ciency, and the multiplicityof charges (z) placed on each ion re-sults in a high mass range even forlimited m /z analyzers. However syn-thetic polymer analysis by ESI isvery prone to yield complex massspectra that result from overlappedcharge-state distributions. As a gen-eral rule of thumb, the propensity formultiple charging increases with in-creasing oligomer mass, and there-fore the complexity of the massspectrum also increases. Deconvo-lution of each charge-state distribu-tion is required to form a compositemolecular weight distribution thatcan then be used to calculate M n, M w,and D. This process requires that theoverlapped charge-state distributionpeaks be well resolved from one an-other. The high resolution of FTMSmake it well suited for combinationwith ESI for analysis of syntheticpolymers.
McLafferty and co-workers haveused ESI-FTMS to analyze 4.5, 14,and 23 kDa poly(ethylene glycol)(PE G) samples.4 9 Mass resolv ingpower (RP) in the range of 104±105
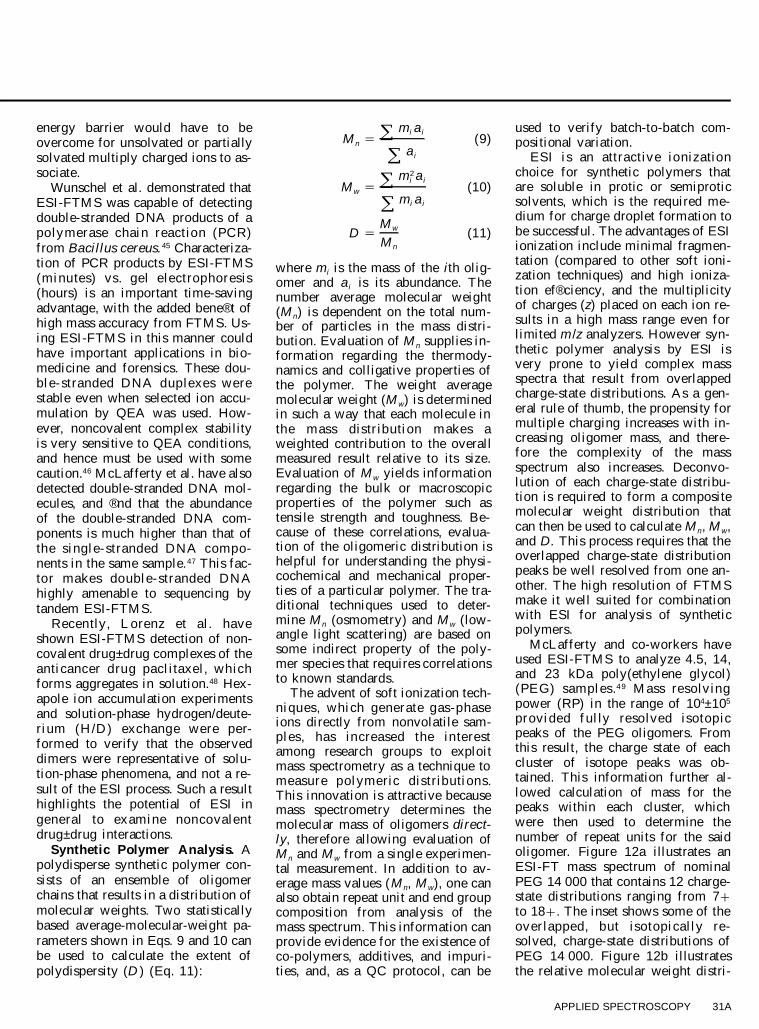
provided fully reso lved isotopicpeaks of the PEG oligomers. Fromthis result, the charge state of eachcluster of isotope peaks was ob-tained. This information further al-lowed calculation of mass for thepeaks within each cluster, whichwere then used to determine thenumber of repeat units for the saidoligomer. Figure 12a illustrates anESI-FT mass spectrum of nominalPEG 14 000 that contains 12 charge-state distributions ranging from 7 1to 18 1 . The inset shows some of theover lapped, but isotopically re-solved, charge-state distributions ofPEG 14 000. Figure 12b illustratesthe relative molecular weight distri-
32A Volume 53, Number 1, 1999
focal point
FIG. 12. (a) ESI-FTMS spectrum of PEG 14 000 (inset: several isotopically resolved oligomers and their charge states); (b) deconvolu-tion of data in panel a show relative oligomer distribution as a function of charge state. Reprinted with permission from J. Am.Chem. Soc. 117, 12826 (1995); copyright American Chemical Society.
bution (M r) obtained from deconvo-lution of all charge-state distribu-tions that yielded values for M w, M n,and D of 12 661 Da, 12 663 Da, and1.002, respectively. Similar dataanalysis for the 4.5 and 23 kDa PEGvarieties yielded values of M w 54349 Da, M n 5 4312 Da, and D 51.009; and M w 5 23 174 Da, M n 523 165 Da, and D 5 1.0004, respec-tively. In addition to the measure-ment of average mass values, trace
amounts of impurities were also de-tected in the PEG mass spectra thatwere attributed to heteropolymericoligomers consisting of ethylene ox-ide (PEG) and propylene oxide(PPG) repeat units.
Copolymers of glycidyl methac-rylate (GMA) and butyl methacry-late (BMA) are used as high-perfor-mance coatings in the automotive in-dustry. GMA and BMA differ inmass by only 0.036 Da, and there-
fore a mass analyzer capable of highmass resolving power ( $ 14 000) isrequired in order to distinguish be-tween the two monomers. Shi et al.capitalized on the high mass resolv-ing power capabilities of FTMS toascertain the formation processes of® ve different GMA/BMA copolymerproducts.50 With a resolving powerof 500 000, isobaric resolution en-abled different GMA/BMA ratios fora given n-mer to be determined with
APPLIED SPECTROSCOPY 33A
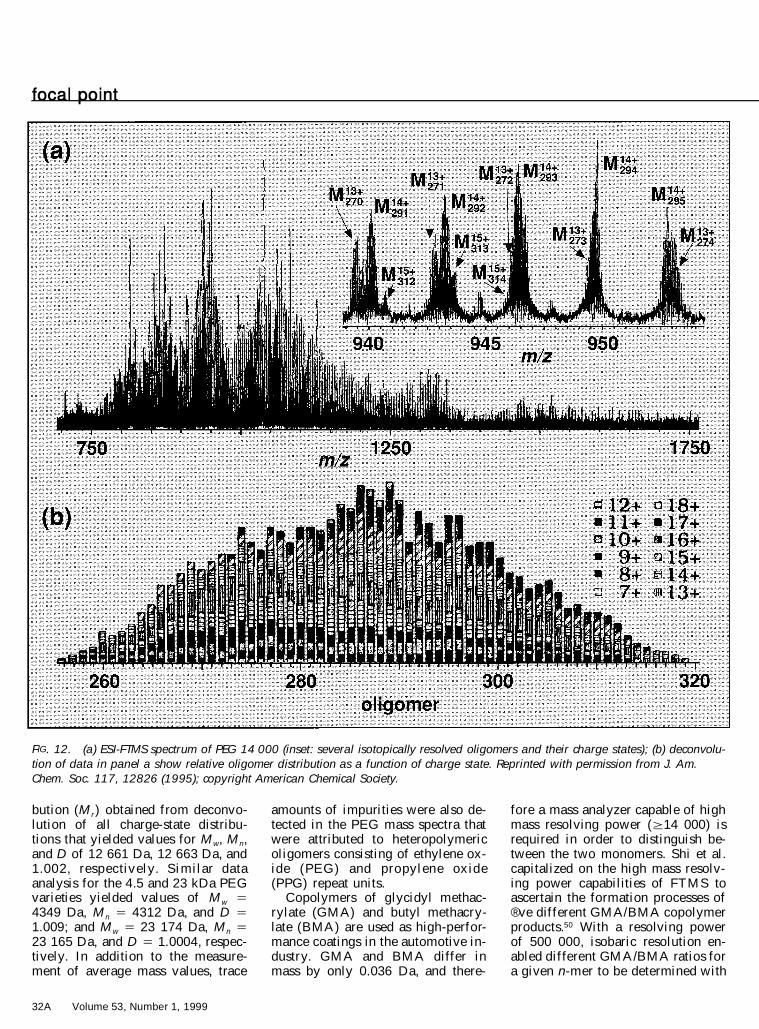
FIG. 13. Gel permeation chromatographic (GPC) separation of GMA/BMA copolymers. Insets: Ultrahigh mass resolving power ofGPC fractions 4, 5, and 6. Reprinted with permission from Anal. Chem. 70, 3220 (1998); copyright American Chemical Society.
mass accuracy better than 0.2 ppm.This analysis revealed that the BMAmonomer is more reactive in the po-lymerization process, as evidencedfrom the higher abundance peaks at-tributed to co-oligomers that con-tained more BMA than GMA mono-mer, within the isobaric distribution.In an effort to minimize spectralcomplexity, GPC fractionation wasused to separate high- and low-mo-lecular-weight copolymer products.Figure 13 illustrates ESI-FT massspectra for selected mass ranges ofGPC fractions 4±6. The lower spec-trum in each set corresponds to theisotopic peak distribution, while the
upper insets represent isobaric distri-butions of selected isotopic clusters.The high-resolution attr ibu tes ofFTMS were maintained for massvalues of GMA/BMA copolymersup to 7000 Da. This range is withinthe practical mass range for poly-mers used to make high-performancecoatings, and therefore this tech-nique can be used as a quality-con-trol protocol to verify batch-to-batchcomposition of such polymers.
On-line hyphenation of GPC-ESI-FTMS can offer rapid characteriza-tion of synthetic polymers. The ad-vent of external ion accumulation re-sults in improved effective duty cy-
cle or time spent analyzing thecontinuous ion beam and makes thehyphenation of such chromatograph-ic methods more attractive. Maziarzet al. investigated mass discrimina-tion as a function of accumulationtime for a series of low-molecular-weight (1.0±3.5 kDa) PEGs.51 Under``nonideal’ ’ empirically determinedoperating conditions, gas-phase re-activities between charged analyteand background gas, within the ac-cumulation region, resulted in massdiscrimination effects that altered av-erage mass values (M n, M w) at dif-ferent accumulation times. A multi-dimensional tuning process, which
34A Volume 53, Number 1, 1999
focal point
involved careful control of electrodepotentials within the accumulationregion, was able to minimize the del-eterious effects of mass bias as afunction of accumulation time. Useof the proposed tuning process en-abled discrim ination to be mini-mized for values of M n or M w, whichamounted to less than 1.5 oligomericunits for external accumulation timesup to 5.0 s. This observation dem-onstrates that reliable informationcan be obtained by minimizing themechanisms that cause mass dis-crimination. This criterion will bemost useful when external ion ac-cumulation is used in combinationwith GPC-ESI to analyze syntheticpolymers.
Separations and ESI-FTM S.The ® rst liquid separations techniqueto be coupled to ESI-FTMS was CE,pioneered by the Smith group.52 CE-ESI-FTMS takes simultaneous ad-vantage of the high resolution of CEand the high mass resolving powerand accuracy of FTMS. Hofstadler etal. showed detection of hemoglobina and b chains from human redblood cells down to the hemoglobinlevel found in ® ve cells (2.3 fmol).53
Valaskovic et al. demonstrated evenlower detection limits at the 7 atto-mole (10 2 18 mol) level for carbonicanhydrase extracted from human redblood cells.54 In order to quantifysuch low levels of protein, CE iscoupled to ``nanospray’ ’ emitters,silica or glass substrates pulled to® ne tips and sputter-coated with con-ductive metal layers, usually gold.Nanospray emitters produce stableelectrospray at nL/min ¯ ow rates be-cause of the small inner diameters ofthe emitters ( ; 2±5 m m), which inturn produce smaller initial dropletsthat result in increased ion transferef® ciency from source to detector.One of the drawbacks of nanosprayis the limited lifetime of emitters,which are destroyed by electricaldischarge in the ESI source, strip-ping the conductive layer off theemitter substrate. Valaskovic andMcLafferty have developed nano-spray emitters with long stability (2±3 h) by sputtering an overcoating ofSiO x on the conductive gold layer.55
Nanospray emitters with such stabil-ity should prove an excellent matchwith CE-ESI-FTMS for high-sensi-tivity applications.
ESI-FTMS has also been coupledto reversed-phase LC. In the ® rstLC-ESI-FTMS report, Stacey et al.showed high reproducibility of ionabundances and high mass accura-cies for peptides separated by gra-dient elution.56 Because of the ef® -cient Sidekick ion trapping method 22
used in this study (in which pulsedgas is not required), rapid duty cy-cles could be achieved, compatiblewith LC. Dramatically improvedsensit iv ity compared to that forlarge-bore LC-ESI-FTMS (2 3 106)was achieved by Emmet et al. withthe use of nanoscale LC coupled tomicro-ESI-FTMS; in these studies,an rf octapole was employed for ex-ternal ion accumulation with rapidduty cycle (0.5±1 scan s 2 1).57
One current limitation of LC cou-pled to ESI-FTMS is that in order toobtain high mass accuracy, one mustcollect time-domain transients withlarge data sets ( $ 128 K) for eachscan throughout the course of theseparation, fo llowed by Four iertransformation into frequency spaceand conversion into mass-to-charge.Even for a relatively short separa-tion, this approach can lead to datasets of $ 100 MB and considerableprocessing time, preventing LC-ESI-FTMS from becoming a routine tool.As computer processor speeds in-crease and hard drive memory formicrocomputers increases, theseproblems will become far less lim-iting.
Pharm aceutical App licat ionsand Quantitation. While most stud-ies involving ESI-FTMS have in-volved biomolecules with masses . 1kDa, some investigations have takenadvantage of the high mass accuracycapability of FTMS for characteriz-ing molecules , 1 kDa. Nawrocki etal. demonstrated that it is possible todistinguish up to 103±104 peptides ina combinatorial library of small pep-tides using the high mass resolvingpower advantage of FTMS;58 whencompared with computer simulation,
the diversity and degeneracy of thelibraries can be assessed.
Only recently has the utility ofESI-FTMS for quanti® cation beenexplored. Developments in linear-ized rf excitation and linearized de-tection have improved the potentialof FTMS for quanti® cation in gen-eral. For example, Padley et al.showed that, with the use of a line-arized trap for detection, a linear re-lationship between solution-phaseanalyte concentration and observedion signal could be obtained over 2±3 orders of magnitude concentrationwith coef® cients of variation gener-ally below 10%.16 In addition, cali-bration curves generated from exter-nal standards (methionine enkepha-lin) could be used to quantify struc-turally sim ilar analytes (leucineenkephalin) with relative errors be-low 4%. However, a signi® cant lim-itation of the external standard ap-proach is that it is not particularlyuseful for inter-day quanti® cation as-says. Thus, our group has been eval-uating the use of internal standardsin ESI-FTMS for quanti® cation. Dueto its capability of simultaneous highmass resolving power and accuracy,the use of ESI-FTMS for quanti® -cation is likely to develop consider-ably in the next decade.
FUTURE DIRECTIONS
With the attributes of ESI for ion-izing large biomolecules and the ad-vantages of FTMS for high mass re-solving power and accuracy, multi-channel detection, and MS/MS ca-pabilities, the coupling of ESI andFTMS holds bright promise as ananalytical tool of the future. Furtherapplications of ESI-FTMS in bio-molecule structural characterizationand examination of noncovalentcomplexes will continue in the ``nextdecade’ ’ , especially as increasingnumbers of high-® eld magnets be-come operational, expanding therange and dif® culty of bioanalyticalproblems that ESI-FTMS can ad-dress. Measurement of activation en-ergies for dissociation of noncova-lent complexes by BIRD is an excit-ing prospect that is certain to becomea valuable tool in comparing behav-
APPLIED SPECTROSCOPY 35A
ior of biomolecules in the gas-phasevs. solution-phase.
Increased application and devel-opment of capillary separations withESI-FTMS is expected as improve-ments in nanospray continue. Rapidgrowth for ESI-FTMS in the phar-maceutical sciences is expected be-cause of its compatibility with LCand its ability to achieve high massaccuracy determination, especiallyfor molecules , 1000 Da. As effortsto develop ESI-FTMS for quanti® -cation progress, this developmentmay have a further impact in thepharmaceutical sciences. Increaseduse of ESI-FTMS in synthetic poly-mer analysis is likely as the powerof high mass accuracy and MS/MSin identifying endgroup identity andcharacterizing copolymer structure isrealized. Indeed, the ``voyage’ ’ ofESI with FTMS has only begun, andthe next decade promises to be evenmore productive than the ® rst as thenumber of ESI-FTMS instrumentsand personnel propagates world-wide.
ACKNOWLEDGMENTS
We thank our past and present group mem-bers for their helpful input and suggestions:Sajid Bashir, Giesela D. Cymes, Craig P. Duf-resne, Xuling Gao, Henry R. Padley, MichaelJ. Cieslak, Anthony R. Dolan, and Meagan A.Doody. T.D.W. wishes to acknowledge thegracious support and training provided to himover the years from Alan G. Marshall andFred W. McLafferty. We would like to ac-knowledge ® nancial support from the follow-ing: the American Society for Mass Spectrom-etry for a Research Award to T.D.W. (spon-sored by the Exxon Education Foundation);the donors of the Petroleum Research Fund,administered by the American Chemical So-ciety; the Center for Biotechnology (StateUniversity of New York at Stony Brook) In-novative Technology Grants program; and theState University of New York at Buffalo for® nancial support of this work. Typographicalassistance in preparation of this manuscript byMichelle Murray is greatly appreciated.
1. C. M. Whitehouse, R. N. Dreyer, M. Ya-mashita, and J. B. Fenn, Anal. Chem. 57,675 (1985).
2. K. D. Henry, E. R. Williams, B. H. Wang,F. W. McLafferty, J. Shabanowitz, and D.F. Hunt, Proc. Natl. Acad. Sci. U.S.A. 86,9075 (1989).
3. E. R. Williams, Anal. Chem. 70, 179A(1998).
4. A. G. Marshall and F. R. Verdun, FourierTransforms in NMR, Optical, and Mass
Spectrometry: A User’ s Handbook (El-sevier, Amsterdam, 1990), p. 230.
5. S. Guan, H. S. Kim, A. G. Marshall, M.C. Wahl, T. D. Wood, and X. Xiang,Chem. Rev. 94, 2161 (1994).
6. S. Hofstadler and D. A. Laude, Jr., Anal.Chem. 64, 569 (1992).
7. M. B. Comisarow and A. G. Marshall,Chem. Phys. Lett. 25, 282 (1974).
8. M. B. Comisarow and A. G. Marshall,Chem. Phys. Lett. 26, 489 (1974).
9. A. G. Marshall, T.-C. L. Wang, and T. L.Ricca, J. Am. Chem. Soc. 107, 7893(1985).
10. Z. Guan, S. A. Hofstadler, and D. A. Laude,Jr., Anal. Chem. 65, 1588 (1993).
11. V. L. Campbell, Z. Guan, and D. A. Laude,Jr., J. Am. Soc. Mass Spectrom. 6, 564(1995).
12. S. C. Beu, M. W. Senko, J. P. Quinn, F.M. Wampler III, and F. W. McLafferty, J.Am. Soc. Mass Spectrom. 4, 557 (1993).
13. L. Tang, R. L. Hettich, G. B. Hurst, andM. V. Buchanan, Rapid Commun. MassSpectrom. 9, 731 (1995).
14. R. L. C. Lau, J. Jiang, D. K. P. Ng, andT.-W. D. Chan, J. Am. Soc. Mass Spec-trom. 8, 161 (1997).
15. M. W. Senko, C. L. Hendrickson, L. Pasa-Tolic, J. A. Marto, F. M. White, S. Guan,and A. G. Marshall, Rapid Commun.Mass Spectrom. 10, 1824 (1996).
16. H. R. Padley, S. Bashir, and T. D. Wood,Anal. Chem. 69, 2914 (1997).
17. K. D. Henry and F. W. McLafferty, Org.Mass Spectrom. 25, 490 (1990).
18. S. C. Beu, M. W. Senko, J. P. Quinn, andF. W. McLafferty, J. Am. Soc. Mass Spec-trom. 4, 190 (1993).
19. J. P. Speir, M. W. Senko, D. P. Little, J.A. Loo, and F. W. McLafferty, J. MassSpectrom. 30, 39 (1995).
20. N. L. Kelleher, M. W. Senko, M. M. Sie-gel, and F. W. McLafferty, J. Am. Soc.Mass Spectrom. 8, 380 (1997).
21. B. E. Winger, S. A. Hofstadler, J. E.Bruce, H. R. Udseth, and R. D. Smith, J.Am. Soc. Mass Spectrom. 4, 566 (1993).
22. P. Caravatti, U.S.A. Patent No. 4,924,089(1990).
23. J. E. Bruce, G. A. Anderson, S. A. Hof-stadler, S. L. Van Orden, M. S. Sherman,A. L. Rockwood, and R. D. Smith, RapidCommun. Mass Spectrom. 7, 914 (1993).
24. Z. Guan, V. L. Campbell, J. J. Drader, C.L. Hendrickson, and D. A. Laude, Jr.,Rev. Sci. Instrum. 66, 4507 (1995).
25. S.D.-H. Shi, C. L. Hendrickson, and A.G. Marshall, Proc. Natl. Acad. Sci. U.S.A.95, 11532 (1998).
26. A. G. Marshall, M. W. Senko, W. Li, M.Li, S. Dillon, S. Guan, and T. M. Logan,J. Am. Chem. Soc. 119, 433 (1997).
27. M. W. Senko, S. C. Beu, and F. W.McLafferty, Anal. Chem . 66, 2801(1994).
28. P. Roepstorff and J. Fohlman, Biomed.Mass Spectrom. 11, 601 (1984).
29. R. A. Zubarev, N. L. Kelleher, and F. W.McLafferty, J. Am. Chem. Soc. 120, 3265(1998).
30. T. D. Wood, L. H. Chen, C. B. White, P.C. Babbitt, G. L. Kenyon, and F. W.McLafferty, Proc. Natl. Acad. Sci. U.S.A.92, 11451 (1995).
31. N. L. Kelleher, C. A. Costello, T. P. Beg-ley, and F. W. McLafferty, J. Am. Soc.Mass Spectrom. 6, 981 (1995).
32. J. E. Bruce, S. A. Hofstadler, B. E. Wing-er, and R. D. Smith, Int. J. Mass Spec-trom. Ion Processes 132, 97 (1994).
33. T. D. Wood, L. H. Chen, N. L. Kelleher,D. P. Little, G. L. Kenyon, and F. W.McLafferty, Biochem istry 34, 16251(1995).
34. Z. Guan, V. L. Campbell, and D. A. Laude,Jr., J. Mass Spectrom. 30, 119 (1995).
35. T. D. Wood, Z. Guan, C. L. Borders, Jr.,L. H. Chen, G. L. Kenyon, and F. W.McLafferty, Proc. Natl. Acad. Sci. U.S.A.95, 3362 (1998).
36. D. P. Little, R. A. Chorush, J. P. Speir, M.W. Senko, N. L. Kelleher, and F. W.McLafferty, J. Am. Chem. Soc. 116, 4893(1994).
37. D. P. Little, D. J. Aaserud, G. A. Valas-kovic, and F. W. McLafferty, J. Am.Chem. Soc. 118, 9352 (1996).
38. R. Chen, W. Cheng, D. W. Mitchell, S. A.Hofstadler, Q. Wu, A. L. Rockwood, M.G. Sherman, and R. D. Smith, Anal.Chem. 67, 1159 (1995).
39. T. Solouki, B. B. Reinhold, C. E. Costel-lo, M. O’ Malley, S. Guan, and A. G. Mar-shall, Anal. Chem. 70, 857 (1998).
40. X. Cheng, R. Chen, J. E. Bruce, B. L.Schwartz, G. A. Anderson, S. A. Hofstad-ler, D. C. Gale, R. D. Smith, J. Gao, G.B. Sigal, M. Mammen, and G. M. White-sides, J. Am. Chem. Soc. 117, 8859(1995).
41. B. L. Schwartz, J. E. Bruce, G. A. An-derson, S. A. Hofstadler, A. L. Rock-wood, R. D. Smith, A. Chilkoti, and P. S.Stayton, J. Am. Soc. Mass Spectrom. 6,459 (1995).
42. D. S. Gross, Y. Zhao, and E. R. Williams,J. Am. Soc. Mass Spectrom. 8, 519(1997).
43. Y.-T. Li, Y.-L. Hsieh, J. D. Henion, M. W.Senko, F. W. McLafferty, and B. Ganem,J. Am. Chem. Soc. 115, 8409 (1997).
44. C. P. Dufresne, C. L. Hendrickson, and T.D. Wood, J. Am. Soc. Mass Spectrom. 9,1222 (1998).
45. D. S. Wunschel, K. F. Fox, A. Fox, J. E.Bruce, D. C. Muddiman, and R. D. Smith,Rapid Commun. Mass Spectrom. 10, 29(1996).
46. J. E. Bruce, S. L. Van Orden, G. A. An-derson, S. A. Hofstadler, M. S. Sherman,A. L. Rockwood, and R. D. Smith, J.Mass Spectrom. 30, 124 (1995).
47. F. W. McLafferty, D. J. Aaserud, Z. Guan,D. P. Little, and N. L. Kelleher, Int. J.Mass Spectrom. Ion Processes 165, 457(1997).
48. S. A. Lorenz, G. J. Fetterly, R. M. Strau-binger, and T. D. Wood, Proceedings ofthe 46th ASMS Conference on MassSpectrometry and Allied Topics, Orlando,Florida (1998), p. 722.

36A Volume 53, Number 1, 1999
focal point
49. P. B. O’ Connor and F. W. McLafferty, J.Am. Chem. Soc. 117, 12826 (1995).
50. S.D.-H. Shi, C. L. Hendrickson, A. G.Marshall, W. J. Simonsick, Jr., and D. J.Aaserud, Anal. Chem. 70, 3220 (1998).
51. E. P. Maziarz III, G. A. Baker, S. A. Lo-renz, and T. D. Wood, Anal. Chem., papersubmitted.
52. R. D. Smith, J. H. Wahl, D. R. Goodlett,and S. A. Hofstadler, Anal. Chem. 65,574A (1993).
53. S. A. Hofstadler, F. D. Swanek, D. C.Gale, A. G. Ewing, and R. D. Smith,
Anal. Chem. 67, 1477 (1995).
54. G. A. Valaskovic, N. L. Kelleher, and F.
W. McLafferty, Science 273, 1199 (1996).
55. G. A. Valaskovic and F. W. McLafferty,
J. Am. Soc. Mass Spectrom. 7, 1270
(1996).
56. C. C. Stacey, G. H. Kruppa, C. H. Wat-
son, J. Wronka, F. H. Laukien, J. F. Banks,
and C. M. Whitehouse, Rapid Commun.Mass Spectrom. 8, 514 (1994).
57. M. R. Emmett, F. M. White, C. L. Hen-
drickson, S.D.-H. Shi, and A. G. Mar-
shall, J. Am. Soc. Mass Spectrom. 9, 333
(1998).
58. J. P. Nawrocki, M. Wigger, C. H. Watson,
T. W. Hayes, M. W. Senko, S. A. Benner,
and J. R. Eyler, Rapid Commun. Mass
Spectrom. 10, 1860 (1996).
Related Documents