Line Balancing in Assembly Line Automotive Carrosserie (Body of a Car) Production Process at PT. XYZ Melynia Novita Pratama and Lina Gozali Department of Industrial Engineering, Faculty of Engineering, Universitas Tarumanagara, Jl. S. Parman No 1, Jakarta, 11440, Indonesia [email protected], [email protected] Abstract PT. XYZ wants to increase production efficiency, achieve optimal production capacity, and calculate the right amount of operator at the work station, so line balancing analysis is carried out. Line balancing method used is Rank Positional Weight, Largest Candidate Rules, Kilbridge-Wester, and Moodie Young, and identify performance line before and after the line balancing are carried out using the software ProModel. The data collection technique used is a time study using a stopwatch. The beginning balance efficiency is 42.79%, 6 work station and smoothness index 115.15 minutes, with Rank Positional Weight, Largest Candidate Rules, Kilbridge-Wester, and Moodie Young method, the balance efficiency is 82.98%, 3 work station, and smoothness index 77.02 minutes. The final result of the simulation using ProModel is a product output of 7 units, which indicates that the simulation results on the new planning line exceed the specified target of 3 units in 8 hours without the need for overtime work. There was a reduction of operators from 4 to 3 people. Keywords Line Balancing, Rank Positional Weight, Largest Candidate Rules, Kilbridge-Wester, Moodie Young 1. Introduction In this 4.0 industrial era, many companies are growing rapidly, one of which is a manufacturing company, namely PT. XYZ. PT. XYZ is a company engaged in manufacturing and producing cargo boxes, flatbeds, and tubs of transportation according to the needs and desires of consumers. PT. XZY also offers for maintenance and repair of cargo boxes for the PT. XYZ brand itself and other brands. PT. XYZ implements a make to order system in which to produce cargo boxes according to consumer desires. PT. XYZ wants to increase production efficiency, achieve optimal production capacity and calculate the right amount of operator at the work station. Therefore, this research is needed to solve this problem. To produce a balanced production line and improve workstation efficiency, the line balancing method can analyze the problem. This method is expected to provide a solution as an alternative to improve the balance performance of the production line by minimizing the balance delay, optimizing the balance efficiency, smoothness index, and optimizing the number of work stations. Production PT. XYZ in the last year was 862 units, due to the pandemic, PT. XYZ uses only 2 production lines. The time-motion study data for this research use a stopwatch on the assembly line. 2. Literature Review 2.1 Cycle Time Cycle time measurement using a stopwatch to calculate the time of each movement that occurs. Each operator can produce a different time in each movement so that here can be seen the standard cycle time performed by operators who have good abilities (Wignjosoebroto, 2003). The Cycle time is measured from the average time tested. = ……………………………………………………………………………………………………..……….(1) Proceedings of the Second Asia Pacific International Conference on Industrial Engineering and Operations Management Surakarta, Indonesia, September 14-16, 2021 © IEOM Society International 595

Welcome message from author
This document is posted to help you gain knowledge. Please leave a comment to let me know what you think about it! Share it to your friends and learn new things together.
Transcript
Line Balancing in Assembly Line Automotive Carrosserie (Body of a Car) Production Process at PT. XYZ
Melynia Novita Pratama and Lina Gozali
Department of Industrial Engineering, Faculty of Engineering, Universitas Tarumanagara,
Jl. S. Parman No 1, Jakarta, 11440, Indonesia [email protected], [email protected]
Abstract PT. XYZ wants to increase production efficiency, achieve optimal production capacity, and calculate the right amount of operator at the work station, so line balancing analysis is carried out. Line balancing method used is Rank Positional Weight, Largest Candidate Rules, Kilbridge-Wester, and Moodie Young, and identify performance line before and after the line balancing are carried out using the software ProModel. The data collection technique used is a time study using a stopwatch. The beginning balance efficiency is 42.79%, 6 work station and smoothness index 115.15 minutes, with Rank Positional Weight, Largest Candidate Rules, Kilbridge-Wester, and Moodie Young method, the balance efficiency is 82.98%, 3 work station, and smoothness index 77.02 minutes. The final result of the simulation using ProModel is a product output of 7 units, which indicates that the simulation results on the new planning line exceed the specified target of 3 units in 8 hours without the need for overtime work. There was a reduction of operators from 4 to 3 people. Keywords Line Balancing, Rank Positional Weight, Largest Candidate Rules, Kilbridge-Wester, Moodie Young 1. Introduction In this 4.0 industrial era, many companies are growing rapidly, one of which is a manufacturing company, namely PT. XYZ. PT. XYZ is a company engaged in manufacturing and producing cargo boxes, flatbeds, and tubs of transportation according to the needs and desires of consumers. PT. XZY also offers for maintenance and repair of cargo boxes for the PT. XYZ brand itself and other brands. PT. XYZ implements a make to order system in which to produce cargo boxes according to consumer desires. PT. XYZ wants to increase production efficiency, achieve optimal production capacity and calculate the right amount of operator at the work station. Therefore, this research is needed to solve this problem. To produce a balanced production line and improve workstation efficiency, the line balancing method can analyze the problem. This method is expected to provide a solution as an alternative to improve the balance performance of the production line by minimizing the balance delay, optimizing the balance efficiency, smoothness index, and optimizing the number of work stations. Production PT. XYZ in the last year was 862 units, due to the pandemic, PT. XYZ uses only 2 production lines. The time-motion study data for this research use a stopwatch on the assembly line. 2. Literature Review 2.1 Cycle Time Cycle time measurement using a stopwatch to calculate the time of each movement that occurs. Each operator can produce a different time in each movement so that here can be seen the standard cycle time performed by operators who have good abilities (Wignjosoebroto, 2003). The Cycle time is measured from the average time tested.
𝑊𝑊𝑊𝑊 = 𝛴𝛴𝛴𝛴𝑛𝑛
……………………………………………………………………………………………………..……….(1)
Proceedings of the Second Asia Pacific International Conference on Industrial Engineering and Operations Management Surakarta, Indonesia, September 14-16, 2021
© IEOM Society International 595
Where Ws = Cycle Time x = Observational Data n = Number of Observations 2.2 Adjustment Factor The adjustment is made by multiplying the average cycle time or the average element time by a price P called the adjustment factor. The method of adjustment used is the Westinghouse method. The value of the adjustment factor (rating factor) can be determined by the Westing House System's Rating method, which is a determination of the rating on skills, effort, working conditions, and consistency (Sutalaksana, et, al.,2006). Each factor is then subdivided into super skill, excellent, good, average, fair and poor. Each sub-factors are attached with numeric values. The average time obtained from time study is normalized by applying the sum of the ratings of the four factors. 2.3 Normal Time The Normal time is the time used by a worker to work fairly without excessive effort throughout the working day, in a system and working environment conditions that are reasonable and naturally relatively the easiest to work on, with general procedures and the worker shows seriousness in carrying out his job. 𝑊𝑊𝑊𝑊 = 𝑊𝑊𝑊𝑊 𝑥𝑥 (1 + Σ 𝑊𝑊𝑊𝑊𝑊𝑊𝑊𝑊𝑊𝑊𝑊𝑊𝑊𝑊 ℎ𝑜𝑜𝑜𝑜𝑊𝑊𝑊𝑊 𝑟𝑟𝑟𝑟𝑊𝑊𝑊𝑊𝑊𝑊𝑊𝑊………………………………………………………………………(2) Where Wn = Normal Time Ws = Cycle Time 2.4 Allowance Allowances consist of: first, allowances for personal needs, including personal needs such as drinking, toilets, and work. The amount of allowance granted for such personal needs varies. Second, looseness to relieve fatigue. Third, allowance for obstacles is inevitable (Sutalaksana, et, al.,2006). 2.5 Standard Time Standard time is when a normal worker takes to complete a job carried out in the best work system. (Sutalaksana, et, al.,2006). 𝑊𝑊𝑊𝑊 = 𝑊𝑊𝑊𝑊 𝑥𝑥 (1 + i ) …………………………………………………………………………………...…..……….(3) Where Wb = Standard Time Wn = Normal Time i = Allowance 2.6 Line Balancing Line balancing is a balancing method for assigning task elements from an assembly line to a work station to minimize the number of work stations and minimize the total idle time at all stations for a specific output level (Gaspersz, 2004). In balancing these tasks, the time requirements per unit of product specified for each task and sequential relationships must be considered. There are procedures to apply the line balancing method. The procedures that should be performed include: a. Make the Precedence Diagram
The precedence diagram illustrates the sequence of work operations to facilitate the control and planning of activities related to it (Dilworth, 2013). Precedence diagram is made with:
i. Circle symbol (node) with letters or numbers in it; facilitate the identification of an operating process that distinguishes work elements in a production line.
ii. Arrow; show the sequence and direction of the sequence of operations. Operations at the base of the arrow mean to precede the work operations at the arrow's tip.
iii. Standard time (Wb); is above the circle symbol (node), which is the time needed to complete each operation.
b. Cycle Time
Proceedings of the Second Asia Pacific International Conference on Industrial Engineering and Operations Management Surakarta, Indonesia, September 14-16, 2021
© IEOM Society International 596
Cycle time is the average completion time in an operational process. The cycle time here is only to count the number of work stations. 𝐶𝐶𝐶𝐶𝐶𝐶𝐶𝐶𝑊𝑊 𝑇𝑇𝑊𝑊𝑇𝑇𝑊𝑊 = 𝑝𝑝𝑝𝑝𝑝𝑝𝑝𝑝𝑝𝑝𝑝𝑝𝑝𝑝𝑝𝑝𝑝𝑝𝑛𝑛 𝑝𝑝𝑝𝑝𝑡𝑡𝑡𝑡
𝑝𝑝𝑡𝑡𝑝𝑝𝑡𝑡𝑡𝑡𝑝𝑝 𝑝𝑝𝑝𝑝𝑝𝑝𝑝𝑝𝑝𝑝𝑝𝑝𝑝𝑝𝑝𝑝𝑝𝑝𝑛𝑛…………………………………………………...………………...…..……….(4)
c. Theoretical Minimum Number of Work Station (TM) This calculation shows theoretically the minimum number of work stations needed on a production line. 𝑇𝑇𝑇𝑇 = 𝑇𝑇𝑝𝑝𝑝𝑝𝑡𝑡𝑇𝑇 𝑝𝑝𝑜𝑜 𝑝𝑝𝑡𝑡𝑡𝑡𝑡𝑡 𝑝𝑝𝑝𝑝𝑡𝑡𝑡𝑡
𝐶𝐶𝐶𝐶𝑝𝑝𝑇𝑇𝑡𝑡 𝑇𝑇𝑝𝑝𝑡𝑡𝑡𝑡………………………………..…………………...………………………...…..……….(5)
d. Balance Efficiency (BE) The calculation of line balancing efficiency is intended as a parameter of the success of the line balancing method. 𝐵𝐵𝐵𝐵 = �𝑇𝑇𝑝𝑝𝑝𝑝𝑡𝑡𝑇𝑇 𝑊𝑊𝑝𝑝𝑝𝑝𝑡𝑡 𝑆𝑆𝑝𝑝𝑡𝑡𝑝𝑝𝑝𝑝𝑝𝑝𝑛𝑛 𝑇𝑇𝑝𝑝𝑡𝑡𝑡𝑡
𝑇𝑇𝑇𝑇(𝐶𝐶𝐶𝐶𝑝𝑝𝑇𝑇𝑡𝑡 𝑇𝑇𝑝𝑝𝑡𝑡𝑡𝑡)� 𝑥𝑥 100%…………………………………………………………......…..……….(6)
e. Balance Delay (BD) Balance delay is the percentage of idle time in a production line because the distribution of operations between stations is uneven. 𝐵𝐵𝐵𝐵 = 100% − 𝐵𝐵𝐵𝐵…………………………………………………...……………………………...…..……….(7)
f. Smoothness Index (SI) Smoothness index is a way to measure the relative idle time of a production line. The minimum value of the smoothness index is zero (perfect balance). If the smoothness index value is getting closer to zero, then the production line is getting more balanced. 𝑆𝑆𝑆𝑆 = �𝛴𝛴(𝑆𝑆𝑊𝑊𝑊𝑊𝑡𝑡𝑡𝑡𝛴𝛴 − 𝑆𝑆𝑊𝑊𝑊𝑊)2………………………………………………….………………………...…..……….(8) Where 𝑆𝑆𝑊𝑊𝑊𝑊𝑡𝑡𝑡𝑡𝛴𝛴: Largest Work Station Time, and 𝑆𝑆𝑊𝑊𝑊𝑊: Time of Each Work Station (i=1, 2, …, n)
2.7 Rank Positional Weight This method is a combined method between the Large Candidate Ruler method and the region approach method. The rank positional weight value is a calculation between the work element and the position of each work element in the precedence diagram (Heizer and Render, 2006). The steps of the rank positional weight method are as follows: a. Make a precedence diagram or network diagram from the operation process chart. b. Calculate cycle times. c. Creating a path matrix based on precedence diagrams. d. Calculating the position weight of each operation is calculated based on the number of times the operation and
the operations that follow it. e. Sort operations from the largest to the smallest operating weight. f. Calculate the minimum number of work stations. g. Make a flow diagram for the minimum work station, then load the operation on the work station starting from the
largest to the smallest operating weight. The criteria that the total operating time is smaller than the desired cycle time.
h. Conduct trial and error to get the highest track efficiency. i. Calculate the balance delay. 2.8 Largest Candidate Rules The basic principle of the largest candidate rules method is to combine processes based on sequencing the largest operation processing time to the shortest operation time. Before combining, it must first be determined how many cycle times will be used. This cycle time will be used as a limiter in combining operations in one work station. The steps of the largest candidate rules method are as follows: a. Make a precedence diagram of the production line. b. Sort the work elements from the largest to the shortest completion time. c. Work elements at the first work station are taken from the order that has the largest turnaround time. The work
element moves to the next work station when the number of work elements has exceeded the cycle time. d. Repeat the third step for the other stations until all work elements have been placed in the work station and the
work station time does not exceed the cycle time and meets the requirements for the precedence diagram
Proceedings of the Second Asia Pacific International Conference on Industrial Engineering and Operations Management Surakarta, Indonesia, September 14-16, 2021
© IEOM Society International 597
sequence. 2.9 Kilbridge-Wester The Kilbridge-Wester method is a heuristic procedure that selects work elements for assignment to a work station according to their position in the preferred precedence diagram (regarding work station time and work elements). The steps of the the Kilbridge-Wester method are as follows: a. Make a precedence diagram of the production line. b. Divide the work elements in the precedence diagram into columns from left to right. c. Sort the work elements from the largest operating time to the shortest operating time. d. Grouping work elements starts from the first column by prioritizing the work elements with the largest
completion time in that column. e. If the work elements in the first column have all been grouped into work stations, then move on to the next
column. f. If the workstation time exceeds the cycle time, replace the workstation's existing workstation with the following
work station as long as it does not violate the precedence diagram. g. Repeat steps e and f until all work elements have been placed into the work station. 2.10 Moodie Young According to Baroto (2002), the Moodie Young method is a line balancing method that has two phases (stages) of analysis. Phase one is to group work stations based on a matrix of relationships between elements. Phase two was revised on the results of phase one. In phase one, a precedence diagram is made for the matrix P and the matrix (which depicts the predecessor work elements and the following work elements. For example, the F matrix shows the relationship between the predecessor work elements and the matrix (shows the relationship between the work elements that follow. Then the work elements are placed on the work station. Which is sequential in the production line with the rule, if two work elements can be selected, then the work element which has the largest time is placed first. Phase two is carried out to distribute idle time evenly for each station resulting from phase one. Step in phase two: a. Identifies the time of the largest work station time and the shortest work station time. b. Determine half of the difference between the two-goal values (GOAL) with the formula:
𝐺𝐺𝐺𝐺𝐺𝐺𝐺𝐺 = 𝑇𝑇𝑡𝑡𝑝𝑝(𝑡𝑡𝑡𝑡𝛴𝛴)−𝑇𝑇𝑡𝑡𝑝𝑝(𝑡𝑡𝑝𝑝𝑛𝑛)2
…………………………………………………………………………...…..……….(9) c. Specifies a work element (station time) max that is smaller than the GOAL value and which work element is
moved to the work station with the minimum time but does not violate the precedence diagram rules. d. Move the work element to a workstation with more minimum time if there is a work element at the maximum
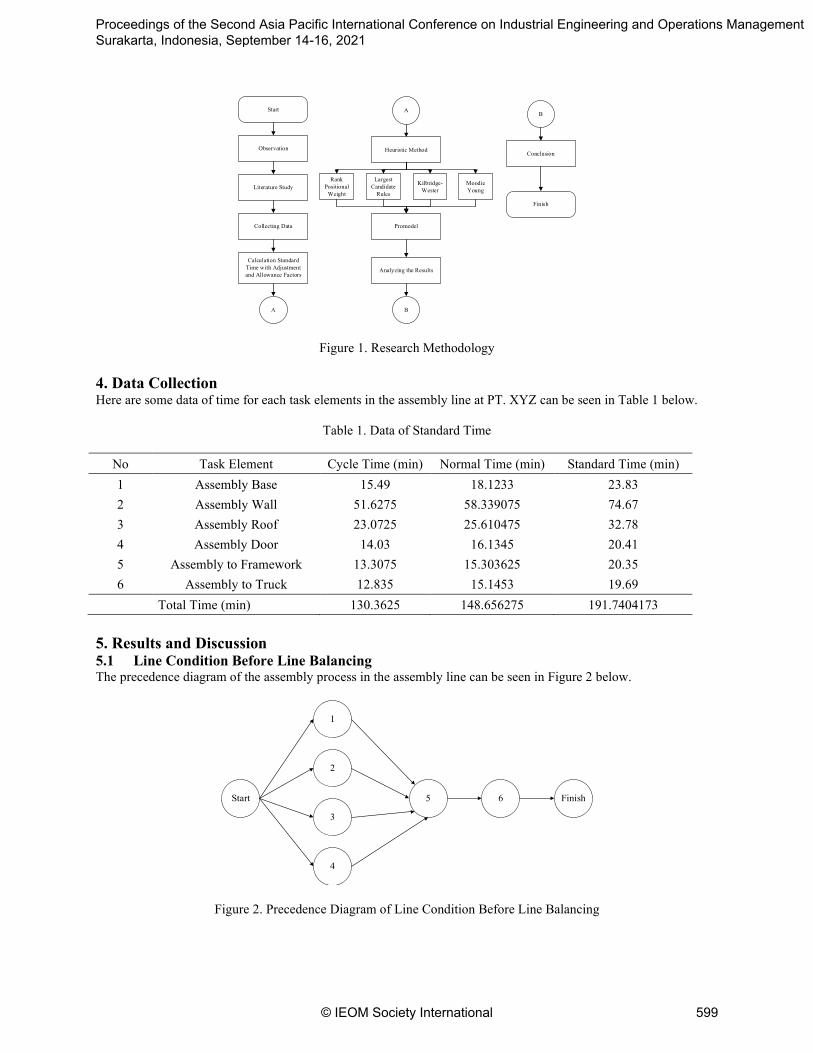
work station that is smaller than the GOAL value. e. Perform steps d and e until there are no work elements that can be moved. 2.11 Promodel Promodel is an application program that is used to simulate a system and analyze the production system. Promodel is a discrete simulation software that sees a production system as a location process arrangement, such as a machine or workstation where entities are processed according to the applied process logic. 3. Methods The flowchart applied in this research can be seen in Figure 1 below.
Proceedings of the Second Asia Pacific International Conference on Industrial Engineering and Operations Management Surakarta, Indonesia, September 14-16, 2021
© IEOM Society International 598
Start
Observation
Literature Study
Collecting Data
Calculation Standard Time with Adjustment and Allowance Factors
A
Heuristic Method
Analyzing the Results
B
B
Conclusion
Finish
A
Rank Positional
Weight
Largest Candidate
Rules
Kilbridge-Wester
Moodie Young
Promodel
Figure 1. Research Methodology 4. Data Collection Here are some data of time for each task elements in the assembly line at PT. XYZ can be seen in Table 1 below.
Table 1. Data of Standard Time
No Task Element Cycle Time (min) Normal Time (min) Standard Time (min) 1 Assembly Base 15.49 18.1233 23.83 2 Assembly Wall 51.6275 58.339075 74.67 3 Assembly Roof 23.0725 25.610475 32.78 4 Assembly Door 14.03 16.1345 20.41 5 Assembly to Framework 13.3075 15.303625 20.35 6 Assembly to Truck 12.835 15.1453 19.69
Total Time (min) 130.3625 148.656275 191.7404173 5. Results and Discussion 5.1 Line Condition Before Line Balancing The precedence diagram of the assembly process in the assembly line can be seen in Figure 2 below.
Start
1
2
3
4
5 6 Finish
Figure 2. Precedence Diagram of Line Condition Before Line Balancing
Proceedings of the Second Asia Pacific International Conference on Industrial Engineering and Operations Management Surakarta, Indonesia, September 14-16, 2021
© IEOM Society International 599
It is known that the cargo box assembly has a cycle time which is assumed to use the longest processing time on the assembly line. It is 74.67 minutes on the wall assembly work element with 6 work stations. Then it can calculate the balance efficiency and balance delay.
𝐵𝐵𝐵𝐵 = �191.74
6𝑥𝑥74.67� 𝑥𝑥 100% = 42.79%
𝐵𝐵𝑟𝑟𝐶𝐶𝑟𝑟𝑊𝑊𝐶𝐶𝑊𝑊 𝐵𝐵𝑊𝑊𝐶𝐶𝑟𝑟𝐶𝐶 = 100% − 42.79% = 57.21% 𝑆𝑆𝑆𝑆 = �(74.67 − 74.67)2 + (74.67 − 23.83)2 + ⋯ (74.67 − 19.69)2 = 115.15 𝑇𝑇𝑊𝑊𝑊𝑊
After that, an initial calculation will be performed to determine the cycle time and minimum theoretical number of work stations.
𝐶𝐶𝐶𝐶𝐶𝐶𝐶𝐶𝑊𝑊 𝑇𝑇𝑊𝑊𝑇𝑇𝑊𝑊 = 8 ℎ𝑜𝑜𝑜𝑜𝑟𝑟𝑊𝑊𝑊𝑊ℎ𝑊𝑊𝑖𝑖𝑊𝑊 𝑥𝑥 60𝑇𝑇𝑊𝑊𝑊𝑊𝑜𝑜𝑊𝑊𝑊𝑊𝑊𝑊ℎ𝑜𝑜𝑜𝑜𝑟𝑟𝑊𝑊
3 𝑜𝑜𝑊𝑊𝑊𝑊𝑊𝑊/𝑊𝑊ℎ𝑊𝑊𝑖𝑖𝑊𝑊= 160 𝑇𝑇𝑊𝑊𝑊𝑊𝑜𝑜𝑊𝑊𝑊𝑊𝑊𝑊/𝑜𝑜𝑊𝑊𝑊𝑊𝑊𝑊
The total processing time obtained from observations and the previous standard time calculation was 191.74 minutes/unit. Then the minimum theoretical calculation is:
𝑇𝑇𝑇𝑇 = 191.74 𝑇𝑇𝑊𝑊𝑊𝑊𝑜𝑜𝑊𝑊𝑊𝑊𝑊𝑊
160 𝑇𝑇𝑊𝑊𝑊𝑊𝑜𝑜𝑊𝑊𝑊𝑊𝑊𝑊= 1.20 𝑊𝑊𝑊𝑊𝑟𝑟𝑊𝑊𝑊𝑊𝑜𝑜𝑊𝑊 = 2 𝑊𝑊𝑊𝑊𝑟𝑟𝑊𝑊𝑊𝑊𝑜𝑜𝑊𝑊
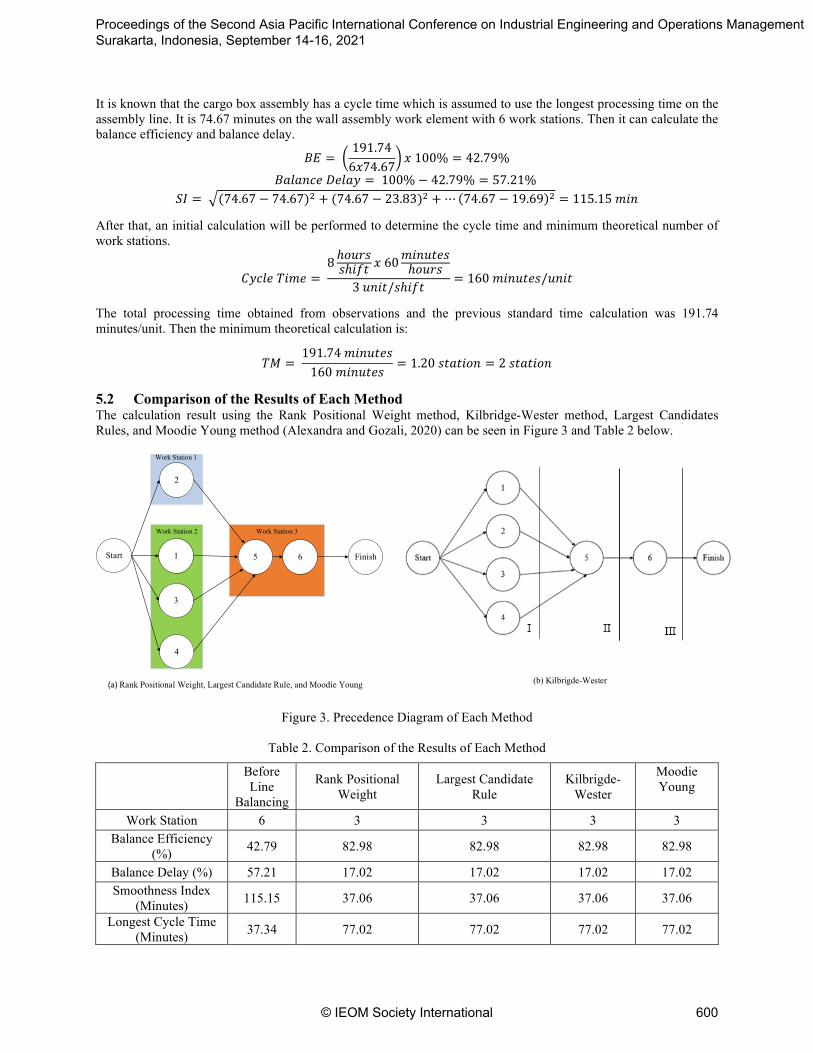
5.2 Comparison of the Results of Each Method The calculation result using the Rank Positional Weight method, Kilbridge-Wester method, Largest Candidates Rules, and Moodie Young method (Alexandra and Gozali, 2020) can be seen in Figure 3 and Table 2 below.
Work Station 1
Start
2
1
3
4
5 6 Finish
Work Station 2 Work Station 3
(a) Rank Positional Weight, Largest Candidate Rule, and Moodie Young (b) Kilbrigde-Wester
Figure 3. Precedence Diagram of Each Method
Table 2. Comparison of the Results of Each Method
Before Line
Balancing
Rank Positional Weight
Largest Candidate Rule
Kilbrigde-Wester
Moodie Young
Work Station 6 3 3 3 3 Balance Efficiency
(%) 42.79 82.98 82.98 82.98 82.98
Balance Delay (%) 57.21 17.02 17.02 17.02 17.02 Smoothness Index
(Minutes) 115.15 37.06 37.06 37.06 37.06
Longest Cycle Time (Minutes) 37.34 77.02 77.02 77.02 77.02
Proceedings of the Second Asia Pacific International Conference on Industrial Engineering and Operations Management Surakarta, Indonesia, September 14-16, 2021
© IEOM Society International 600
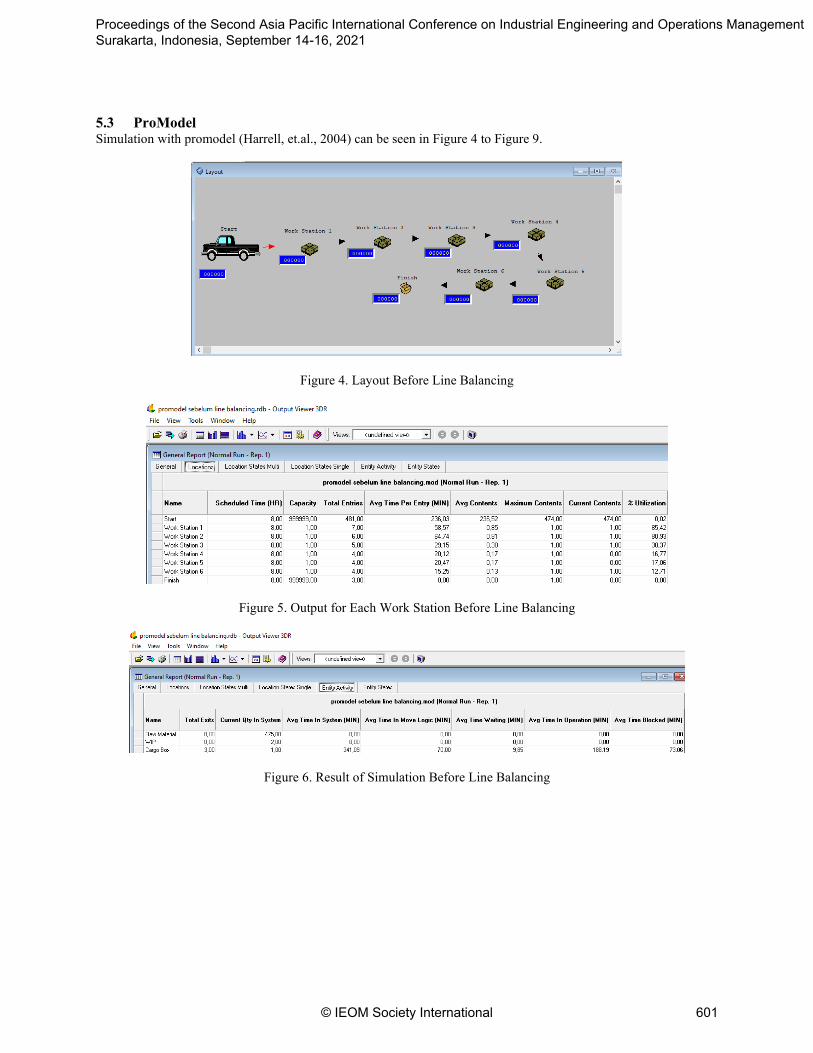
5.3 ProModel Simulation with promodel (Harrell, et.al., 2004) can be seen in Figure 4 to Figure 9.
Figure 4. Layout Before Line Balancing
Figure 5. Output for Each Work Station Before Line Balancing
Figure 6. Result of Simulation Before Line Balancing
Proceedings of the Second Asia Pacific International Conference on Industrial Engineering and Operations Management Surakarta, Indonesia, September 14-16, 2021
© IEOM Society International 601
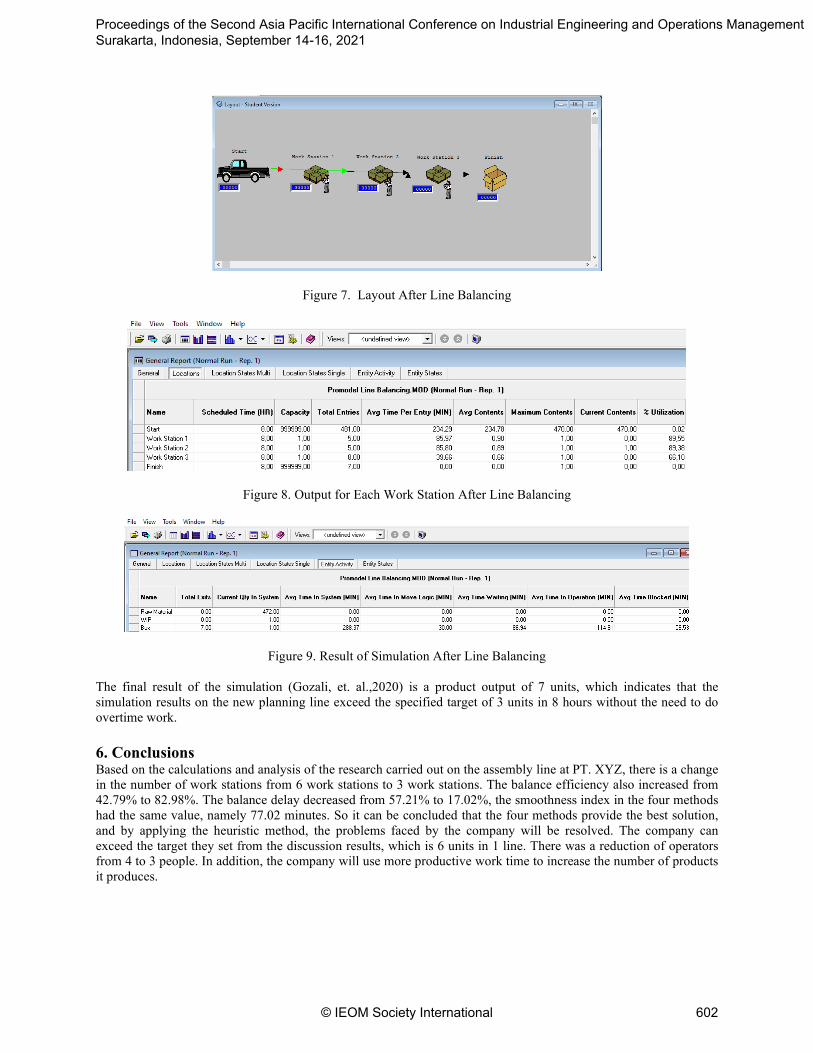
Figure 7. Layout After Line Balancing
Figure 8. Output for Each Work Station After Line Balancing
Figure 9. Result of Simulation After Line Balancing
The final result of the simulation (Gozali, et. al.,2020) is a product output of 7 units, which indicates that the simulation results on the new planning line exceed the specified target of 3 units in 8 hours without the need to do overtime work. 6. Conclusions Based on the calculations and analysis of the research carried out on the assembly line at PT. XYZ, there is a change in the number of work stations from 6 work stations to 3 work stations. The balance efficiency also increased from 42.79% to 82.98%. The balance delay decreased from 57.21% to 17.02%, the smoothness index in the four methods had the same value, namely 77.02 minutes. So it can be concluded that the four methods provide the best solution, and by applying the heuristic method, the problems faced by the company will be resolved. The company can exceed the target they set from the discussion results, which is 6 units in 1 line. There was a reduction of operators from 4 to 3 people. In addition, the company will use more productive work time to increase the number of products it produces.
Proceedings of the Second Asia Pacific International Conference on Industrial Engineering and Operations Management Surakarta, Indonesia, September 14-16, 2021
© IEOM Society International 602
References Alexandra, S., & Gozali, L, “Line Balancing Analysis on Finishing Line Dabbing Soap at PT. XYZ”. In IOP
Conference Series: Materials Science and Engineering, Vol. 1007, No. 1, p. 012030, 2020. Baroto, T, Perencanaan dan Pengendalian Produksi. Jakarta: Ghalia Indonesia, 2002. Dilworth J. B. Production and Operation Management 5th ed. Singapore: McGraw-Hill, 2013. Gaspersz, Vincent, Operation Planning and Inventory Control. Jakarta: PT. Gramedia Pustaka Utama, 2004. Gozali, L., Daywin, F. J., & Jestinus, A, “Calculation of Labor Amount with Theory of Constraints and Line
Balancing Method in PT. XYZ Fish Crackers Factory”. In IOP Conference Series: Materials Science and Engineering, Vol. 852, No. 1, p. 012092, 2020.
Harrell, C., Ghosh, B. K., & Bowden, R, Simulation Using ProModel. Singapore: The McGraw-Hill, 2004. Heizer, Jay dan Barry Render, Operations Management, Buku 2 Edisi 7. Jakarta: Salemba Empat, 2006. Iftikar Z. Sutalaksana, Ruhana Anggawisastra, Jann H. Tjakraatmadja, Teknik Perancangan Sistem Kerja. Bandung:
Institut Teknologi Bandung, 2006. Pratama, M, N., Line Balancing pada Assembly Line Proses Produksi Karoseri di PT. Indosaluyu Primajaya,
Laporan Kerja Praktek, Universitas Tarumanagara, 2021 Wignjosoebroto, S, Ergonomi Studi Gerak dan Waktu. Surabaya: Guna Widya, 2003.
Biographies Melynia Novita Pratama is a student majoring in Industrial Engineering at Tarumanagara University. She entered Tarumanagara University in 2018. She was born in Jakarta 7th January 2000. She graduated from Saint Christopher 1 Senior High School with the fifth highest grade point average in the school in 2018. She has dreams of becoming a project manager in a leading company. Lina Gozali is a Lecturer in the Industrial Engineering Department of Universitas Tarumangara since 2006 and a freelance lecturer at Universitas Trisakti since 1995. She graduated with her Bachelor's degree at Trisakti University, Jakarta - Indonesia, then she got her Master's Degree at STIE IBII, Jakarta – Indonesia, and she recently got her Ph.D. at Universiti Teknologi Malaysia, Kuala Lumpur – Malaysia in 2018. Her apprentice college experience was in paper industry at Kertas Bekasi Teguh, shoes industry at PT Jaya Harapan Barutama, and automotive chain drive industry at Federal Superior Chain Manufacturing. She teaches Production System and Supply Chain Management Subjects. She did a research about Indonesian Business Incubator for her Ph.D. She has written almost 70 publications since 2008 in the Industrial Engineering research sector, such as Production Scheduling, Plant Layout, Maintenance, Line Balancing, Supply Chain Management, Production Planning, and Inventory Control. She had worked at PT. Astra Otoparts Tbk before she became a lecturer.
Proceedings of the Second Asia Pacific International Conference on Industrial Engineering and Operations Management Surakarta, Indonesia, September 14-16, 2021
© IEOM Society International 603
Related Documents