Erscheint in Fuel Cell Handbook, Volume 3 – Fuel Cell Technology and Applications, J. Wiley, 2002 Life Cycle Assessment of Fuel Cell Systems Martin Pehnt Institute for Energy and Environmental Research IFEU GmbH Wilckensstraße 3, D-69120 Heidelberg Fon: +49 (0) 6221 / 47 67 – 0, Fax: +49 (0) 6221 / 47 67 -19 www.ifeu.de , e- mail: [email protected] Acknowledgement . A large part of the work presented here was carried out at the author's previous employer, the German Aerospace Center (DLR). The author would like to thank the many people at DLR who have – directly or indirectly – contributed to this work, namely Dr. Joachim Nitsch, Dr. Werner Schnurnberger and Anke Schrogl for their continuous support. 1 Abstract Due to the efficient and (almost) zero emission operation of fuel cells, they are particularly attractive for application in the transportation sector and in stationary power conversion. For an environmental evaluation of new technologies, however, an investigation of the complete life-cycle is necessary to ensure that no environmental aspect is neglected. In this "cradle-to- grave approach", not only the use phase, but also the supply of the fuel and the production and disposal/recycling of the vehicle or power plant have to be considered. The appropriate instrument for this task is Life Cycle Assessment (LCA). This chapter presents LCAs of fuel cells in mobile and stationary applications with different fuel options and compares them to conventional power train or plant options focussing on different environmental aspects such as use of resources, global warming, acidification and emission of carcinogenic substances. For this purpose, the future developments of the fuel cell competitors, e. g. internal combustion engines, gas turbines, combined cycle plants etc., have to be taken into account as well.

Welcome message from author
This document is posted to help you gain knowledge. Please leave a comment to let me know what you think about it! Share it to your friends and learn new things together.
Transcript

Erscheint in Fuel Cell Handbook, Volume 3 – Fuel Cell Technology and Applications, J. Wiley, 2002
Life Cycle Assessment of Fuel Cell Systems Martin Pehnt
Institute for Energy and Environmental Research IFEU GmbH
Wilckensstraße 3, D-69120 Heidelberg
Fon: +49 (0) 6221 / 47 67 – 0, Fax: +49 (0) 6221 / 47 67 -19
www.ifeu.de, e-mail: [email protected]
Acknowledgement . A large part of the work presented here was carried out at the author's previous employer, the German Aerospace Center (DLR). The author would like to thank the many people at DLR who have – directly or indirectly – contributed to this work, namely Dr. Joachim Nitsch, Dr. Werner Schnurnberger and Anke Schrogl for their continuous support.
1 Abstract
Due to the efficient and (almost) zero emission operation of fuel cells, they are particularly
attractive for application in the transportation sector and in stationary power conversion. For
an environmental evaluation of new technologies, however, an investigation of the complete
life-cycle is necessary to ensure that no environmental aspect is neglected. In this "cradle-to-
grave approach", not only the use phase, but also the supply of the fuel and the production and
disposal/recycling of the vehicle or power plant have to be considered. The appropriate
instrument for this task is Life Cycle Assessment (LCA).
This chapter presents LCAs of fuel cells in mobile and stationary applications with different
fuel options and compares them to conventional power train or plant options focussing on
different environmental aspects such as use of resources, global warming, acidification and
emission of carcinogenic substances. For this purpose, the future developments of the fuel cell
competitors, e. g. internal combustion engines, gas turbines, combined cycle plants etc., have
to be taken into account as well.

2
In vehicle applications, special focus is paid to the question of the best fuel which is of high
importance for the performance of fuel cell vehicles. Also the production of the required
materials, e. g. catalyst materials, and system components will be described and assessed.
In stationary systems, cogeneration applications using low and high-temperature fuel cells are
investigated thoroughly.
2 Introduction: The Life Cycle of Fuel Cells
Fuel cells are a future energy system with a high potential for environmentally-friendly
energy conversion. They can be used in stationary and mobile applications. Depending on the
type of fuel cells, stationary applications include small residential, medium sized cogeneration
or large power plant applications. In the mobile sector, fuel cells, particularly low-temperature
fuel cells, can be used for heavy-duty and passenger vehicles, for trains, boats or auxiliary
power units for air planes. Mobile applications also include portable low power systems for
various uses.
The high efficiency can lead to a significant reduction of fossil fuel use and of greenhouse gas
(GHG) emissions. In addition, the electrochemical nature of the reaction, the low temperature
in reforming steps and the necessity to remove impurities in the fuel (such as sulfur) result in
extremely low local emissions – an important feature especially in highly populated areas. In
vehicle applications, particularly at low speed, reductions in noise emissions are to be
expected. Other context specific advantages include the elimination of gear shifts, the higher
potential reliability, the compatibility with other eletric or electronic devices and new options
with respect to the safety design of vehicles.
Thus, clear environmental advantages can be expected in the various application areas of fuel
cells. For an environmental evaluation of the different service supply options, an investigation

3
of the complete life-cycle of these options is necessary to ensure that no environmental aspect
is neglected. The appropriate instrument for this task is Life Cycle Assessment (LCA).
In the typical "cradle-to-grave approach" of LCAs, the investigated life-cycle stages involve
the exploration of materials and fuels, the production and operation of the investigated objects
and their disposal/recycling (Figure 1).
Figure 1 next to here
With the increasing environmental operation standards of modern energy conversion systems,
the up- and downstream processes, e. g. fuel supply or system production, become
increasingly relevant. While, for instance, in conventional road vehicles, the production of the
vehicle only contributes 10 % to the life cycle greenhouse gas emissions, this share can
increase to 30 % in modern fuel saving vehicles. More important than the relative
contribution of the production is the absolute impact of production. Very often, technologies
exhibiting good characteristics in the use phase lead to higher absolute environmental impacts
in the production phase because of the use of more "sophisticated" materials and components.
For fuel cells, this implies that the LCA of producing the systems will be of higher
importance.
2.1 Brief Introduction to LCA
The instrument to assess these environmental impacts is called life cycle assessment (LCA).
In the past ten years, the use of LCA has grown rapidly. Parallel to this development, an
international standardisation process was started with ISO norms structuring this instrument
and giving guidelines for the practitioner. The two key elements of an LCA are
• the assessment of the entire life cycle of the investigated system and
• the assessment of a variety of environmental impacts.
4
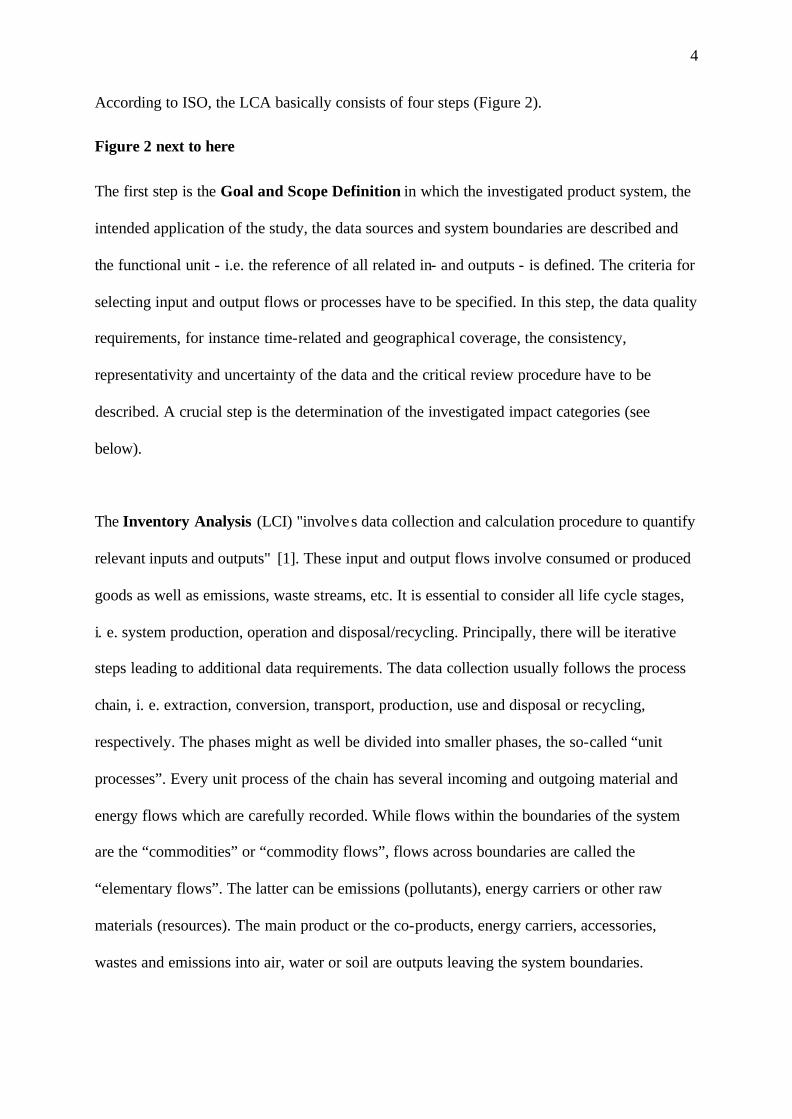
According to ISO, the LCA basically consists of four steps (Figure 2).
Figure 2 next to here
The first step is the Goal and Scope Definition in which the investigated product system, the
intended application of the study, the data sources and system boundaries are described and
the functional unit - i.e. the reference of all related in- and outputs - is defined. The criteria for
selecting input and output flows or processes have to be specified. In this step, the data quality
requirements, for instance time-related and geographical coverage, the consistency,
representativity and uncertainty of the data and the critical review procedure have to be
described. A crucial step is the determination of the investigated impact categories (see
below).
The Inventory Analysis (LCI) "involves data collection and calculation procedure to quantify
relevant inputs and outputs" [1]. These input and output flows involve consumed or produced
goods as well as emissions, waste streams, etc. It is essential to consider all life cycle stages,
i. e. system production, operation and disposal/recycling. Principally, there will be iterative
steps leading to additional data requirements. The data collection usually follows the process
chain, i. e. extraction, conversion, transport, production, use and disposal or recycling,
respectively. The phases might as well be divided into smaller phases, the so-called “unit
processes”. Every unit process of the chain has several incoming and outgoing material and
energy flows which are carefully recorded. While flows within the boundaries of the system
are the “commodities” or “commodity flows”, flows across boundaries are called the
“elementary flows”. The latter can be emissions (pollutants), energy carriers or other raw
materials (resources). The main product or the co-products, energy carriers, accessories,
wastes and emissions into air, water or soil are outputs leaving the system boundaries.

5
The potential impacts of the in- and outputs of the Inventory Analysis are then determined by
the Impact Assessment which categorises and aggregates the in- and output flows to the
biosphere to so-called impact categories, such as the global warming potential, by
multiplication with characterisation factors.
The development of impact categories with relevant characterisation factors has been
discussed intensively in [2] with more recent developments published in the International
Journal of Life Cycle Assessment and other publications. Impact categories include
• the depletion of abiotic resources, for instance fossil energy carriers and uranium, metals
or other materials.
• the depletion of biotic resources as a measure of overexploitation.
• the global warming potential (GWP). The emission of greenhouse gases (GHG)
influences the stability of solar irradiation and adsorption/reflexion at the surface. These
gases, e. g. carbon dioxide, methane, ozone and nitrous oxide, absorb the infrared
radiation emitted by the earth and thus increase the average temperature. A global
warming potential can be attributed to these anthropogenic climate gases which evaluate
the effectivity in increasing the temperature relative to carbon dioxide for a given
reference time. Most recent GWPs are published by the Intergovernmental Panel on
Climate Change.
• the depletion of stratospheric ozone particularly by chlorinated and brominated
compounds, nitrous oxide, and indirectly by the greenhouse effect. The ozone depletion is
quantified using the ozone depletion potential with CFC-11 as reference substance.
• the acidification. Several substances, particularly sulfur dioxide, nitrogen oxide and,
indirectly, ammonia, act as proton sources and acidify soil and water. The impact category
can be operationalised using the acidification potential which is the ratio of the number of

6
potential proton equivalents per mass unit of a substance to the number of potential proton
equivalents per mass unit of sulphur dioxide as a reference [2].
• the eutrophication, i. e. the addition of mineral nutrients to soil and water which results in
shifts in increased algal growth, a reduction in ecological diversity and, in some instances,
in a lack of oxygen. Mainly nitrogen and phosphorus components contribute to
nutrification. The nutrification can be quantified as the ratio between the potential
biomass per emitted substance and the potential biomass per reference substance,
commonly PO43- [2].
• the emission of ecotoxic and human toxic substances, e. g. pesticides, heavy metals,
carcinogenic substances. For these complex impact categories, a number of different
quantifications have been tried [3].
• the emission of radioactive substances [4,5].
• other impact categories, such as land use, noise, waste and odour.
The next, and according to [6] optional elements of the impact assessment include
• a normalisation, i. e. the division of the environmental impacts per functional unit by
reference environmental impacts (e. g. the daily impacts per capita) to gain further
understanding of the magnitude of an environmental problem.
• a grouping, for instance sorting the impact categories on nominal or ordinal scales based
on value choices.
• a weighting, i. e. “converting indicator results by using numerical factors” [6]. It is
unavoidable that these aggregation steps are based on assumptions on the valuesphere,
i. e. the perceived seriousness of ecological damage.

7
The last, fourth step is the interpretation which analyses the results, reaches conclusions and
recommendations while explaining the limitations of the study.
2.2 Goal and Scope of this Article
The goal of this article is to present different LCAs in the field of fuel cells, discuss
parameters used in the studies, show some respective results and conclusions and also identify
knowledge deficits which require further research or practical experience with power plants or
vehicles.
3 Mobile Applications
3.1 Overview
Principally, there is a range of potential applications of fuel cells in the mobile sector.
However, due to the high market expectations, many of the past efforts have focussed on
applications in passenger vehicles. The following chapter will therefore focus on this
application. A few remarks, however, shall be made regarding other possible applications.
Buses. The use of fuel cells in buses is generally considered as the ideal application for the
market introduction of fuel cells. The integration of hydrogen storage systems as well as
potential range limitations are of no signifance. In addition, low noise and air pollutant
emission levels are of higher importance in highly populated urban areas. Due to the typical
driving cycle requirements, higher fuel reductions compared to diesel buses can be expected
than for passenger vehicles. However, in bus applications hybrid diesel buses are already
state-of-the-art. If they are equipped with brake energy recovery, which is particularly
8
attractive in the stop and go city driving pattern, the achievable reduction potential of fuel cell
buses is lower.
Railways. The use of fuel cells in railways is considered particularly for not electrified
railway lines. In electric trains, the use of fuel cells is generally less attractive than in busses
because the power requirements differ completely. The shape of the power demanded as a
function of time is more rectangular than the driving cycle of city busses: full load and zero
load – which are in regions of lower fuel cell system efficiency – occur more frequently.
Therefore, the achievable fuel reduction is considered to be less than 10 % in certain railway
applications.
A range of applications is, however, possible in which fuel cells are competitive not only
because of increased power train efficiency, but because of the low pollutant emissions.
Examples are boats in natural protection areas or locomotives for mining applications .
In the following, results of different LCAs of passenger vehicles are reviewed.
3.2 Production of the Fuel
3.2.1 General Aspects
The question of the "right" fuel is of high importance for the overall assessment of mobile
fuel cells. Not only the questions of storage systems, costs for fuel production or
infrastructure considerations have to be answered – this is beyond the scope of this chapter –
but also the environmental impacts for the different fuels are of importance.
Generally, four factors are of relevance for the LCA of fuels:

9
The primary energy carrier has an especially high impact on the impact categories global
warming and use of abiotic resources. The change from crude oil to natural gas is associated
with a decrease in CO2 intensity due to the higher hydrogen to carbon ratio of natural gas.
Switching to renewable primary energy carriers also reduces these impacts to low inputs of
fossil energy along the production chain.
The efficiencies and impacts of processing are of importance as well. Today's crude-oil based
fuels exhibit an extremely high energetic efficiency of more than 90 %. In contrast, steam or
combined reforming of natural gas for hydrogen and methanol production, respectively, have
comparatively lower efficiencies. In this context, it is important to distinguish between the
production of gasoline in average refineries – the so-called technology mix – and marginal
plants, i. e. new, single plants built to meet an increasing demand of a specific product and
which, thus, exhibit significantly improved performance.
The upstream and downstream processes, e. g. different requirements for transportation or
distribution, are the third important factor for the assessment of the fuel supply. The possible
use of joint products (e. g. carbon black as a joint product of hydrogen production in the
Kværner process or steam from H2 steam reforming) can reduce environmental impacts if
there is a market for the byproduct.
For fuel cell applications, mainly three fuels are of interest for mobile applications: hydrogen,
methanol and gasoline. Specific aspects of their life-cycles are discussed in the subsequent
sections.
Fuel chains have been assessed in a number of different studies focussing on different
environmental impacts, countries and applications [7-20].
3.2.2 Hydrogen
Roughly 48 % of the world wide hydrogen production is accomplished by steam reforming of
natural gas, 30 % by processing crude oil products, 18 % by processing coal and 3 % as a

10
byproduct of the chlor-alkali process. However, a number of more innovative production
paths exists, such as the Carbon black and hydrogen process developed by Kværner AS with
parallel carbon black production, electrolysis from various electricity sources, or gasification
of biomass. In addition, CO2 sequestration or the commercial use of CO2 have been
mentioned as ways to lower GHG emissions from H2 supply.
The various hydrogen supply paths differ in terms of the distribution paths, e. g. pipeline
transport of natural gas with onsite reforming, pipeline transport of gaseous hydrogen (GH2),
transport of liquid hydrogen (LH2) by bargen carriers and road-trailers and high voltage direct
current (HVDC) transportation of electricity with hydrogen conversion close to the end user.
Figure 3 shows a number of supply chains as assessed in [21] using LCA.
Figure 3 next to here
Natural gas steam reforming is one of the most common processes. The efficiency of that
conversion depends on the use of the steam produced as a byproduct. As base case, [22]
assumes extremely optimistic 89 % (HHV; steam exported) whereas [19] assumes 70 %. In
[15], an efficiency of 81 % is used if the coproduct steam is required in further processes.
Gasification of biomass and water electrolysis using renewable electricity are attractive
options for producing hydrogen with renewable primary energy carriers. However, the
potentials of renewable energies have to be taken into accout, because they can be used
alternatively in stationary heat and power generation. Therefore, each option of using
renewable energy should be checked considering cost, "ecoefficiency" and storage
requirements. For instance, one kWh wind electricity, fed into the German electricity grid,
presently avoids 700 g CO2 equivalents by substituting conventionally produced electricity
which is, to a large degree, produced in rather inefficient coal power plants. Substituting
gasoline by hydrogen produced from the same kWh wind power via electrolysis only avoids

11
320 g. In the next decades, with electricity becoming less CO2 intensive and oil extraction
becoming increasingly difficult, this situa tion will eventually change.
In any case, hydrogen should not be regarded as a zero-emission fuel. Instead, also the supply
of hydrogen has to be considered to determine its related emissions and effects to the
environment. As an example, Figure 4 compares different transport scenarios of hydrogen
produced in Norway from renewable electricity and subsequently transported to Germany
[15]. It is interesting to see that in this configuration, liquid H2 (LH2) (transported in a tanker
with H2 as fuel) has a better GHG balance than gaseous H2 (GH2), primarily because the
liquefication takes place at the production facility with renewable electricity and no
conventional electricity is needed as for compressing the GH2 at the filling station. The
acidification, however, is significantly higher due to the NOx emissions of the LH2 tanker and,
if heavy oil is used as fuel for the tankers, the SO2 emissions.
Figure 4 next to here
3.2.3 Methanol
Methanol is under consideration as a "liquid hydrogen storage". If produced from natural gas,
the efficiency of the methanol conversion plant is of main importance for the overall impact,
especially for the primary energy demand and the greenhouse gas (GHG) emissions.
Efficiencies of average plants (LHV methanol/LHV natural gas) are well below 65 % leading
to CO2 emissions in the order of 30 to 40 g CO2/MJ LHV methanol whereas modern plants
will achieve efficiencies higher than 65 % depending on the process layout (e. g. use of
oxygen) and consequently, the investment costs.
Most studies assume efficiencies in the range between 67 and 68 % [15,20,23] which is
consistent with the 66 % of the newly built combined reforming Statoil plant in Norway as

12
well as planned future plants, whereas some studies assume unrealistically high efficiencies of
up to 75 % [24]. It is important that not the efficiency at the optimum operating point is of
interest in LCAs, but the efficiency averaged over the life-time including degradation effects,
start-ups after maintenance, etc. In addition, the marginal efficiency improvements lead to
overproportionally high incremental costs thus making efficiently produced methanol clearly
more expensive.
Methanol can also be produced using biogen synthesis gases, such as from gasification of
wood or biowaste, anaerobic digestion or CO2 absorption from air (with additional H2 input).
Technical data of these supply paths is scarce: efficiency numbers are often in the range of
40 % for biomass gasification [9]. In these cases, GHG emissions as well as the primary
energy demand are very low. Some attention, however, has to be paid to other environmental
impacts, such as carcinogenic emissions from the wood supply (chain saws in the forest, etc.)
or other process specific emissions such as the combustion of purge gases from hydrogen
enrichment of the synthesis gas [15].
3.2.4 Gasoline and Diesel
The life-cycle of gasoline and diesel production is well documented in each country. In
addition to the impacts from oil recovery, crude transportation and storage as well as product
distribution, the refining is of special relevance. Modern refineries have, however, very high
efficiencies with low emission levels and are energetically optimised with respect to possible
coproduct use. Typical German refineries, for instance, consume 5.5 % of the product energy
content for process heat and 0.5 % for electricity supply [8].

13
3.3 Production of the Vehicle
Manufacturing of future car generations can contribute a significant percentage to life-cycle
impacts. In conventional cars, for instance, the production of the car body, the engine, etc. is
responsible for 10 to 25 % of total global warming emissions. In fuel cell vehicles, this
relative contribution will be higher because (1) the absolute total impacts are lower and thus
the relative significance of production is higher and (2) the production of fuel cell vehicles
leads to higher environmental impacts due to the higher weight and the use of catalyst
materials.
However, only limited information is available on the production of vehicles. This life cycle
stage is often assessed by using an average incremental factor or by using materia l profiles of
typical cars for determining the impacts of this phase.
In [15,25], an effort has been made to calculate impacts from fuel cell vehicle production in as
much detail as possible. The LCA of fuel cell stack production in [15,25] was carried out
using industry data for materials (PGM from South Africa, natural and synthetic graphite,
membrane, PTFE and others) and for the stack production (next generation Ballard stacks
with reduced PGM loading) (Figure 5).
Figure 5 next to here
Due to the early stage of development, the balance-of-plant materials could only be roughly
estimated. Of particular importance are the PGM for catalyst materials in the stack, the
reformer and an eventual Pd/Ag membrane for gas clean-up (with methanol as a fuel).
The production of the car body and the conventional vehicle in [25] is taken from [26].
Figure 6 shows the contribution of different components of the vehicle to the total impacts of
producing one vehicle assuming that 75 % of the catalyst materials are recycled. It is obvious
that the car chassis, tires, etc. contribute similar environmental impacts as the production of

14
the stack. The balance of plant is of less importance. However, this is partly due to the fact
that only a streamlined LCA of the balance-of-plant could be carried out.
Analysing the contribution of the stack production further, two components turn out to be of
special relevance. The gas diffusion electrode (GDE) is responsible for a large share of the
total acidification and the global warming gas emissions. The crucial material causing the
high acidification are the platinum group metals (PGM) used as catalysts. PGM are mainly
produced in South Africa (68 % of the world platinum supply and 75 % of the world rhodium
supply [27]) and as a by-product of nickel mining in Russia. Even in the modern African
mines, the mining of PGM results in significant environmental interventions particularly
because of the SO2 emissions along the production chain. Part of the SO2 is emitted during the
pyrometallurgical treatment of the material. The tailings of the mining also act as potential
sulfur sources even though, in arid regions such as South Africa, the tailings are less relevant
with respect to SO2 emissions. Methodological questions associated with the LCA of PGMs
are discussed in [25,28].
Figure 6 next to here
The flow field plate is the second important component particularly because of the electricity
input for resin impregnation of the plate. Higher throughputs for series production have been
assumed in this LCA. Even higher production volumes could half the specific energy
consumption. It is interesting that the graphitic plates, commonly considered as a main
ecological factor, contribute 13 % to the GHG emissions compared to 17 % of the electricity
consumption. This is also a result of the efforts to reduce the weight of the flow plates. These
13 % are partly caused by the graphite production itself and partly by the use of a resin
impregnant.
Improvement potentials as identified in [25] include

15
• The reduction of PGM loading. Compared to earlier stack generations the PGM loading
has already been reduced substantially from 8 mg/cm2 to 1 mg/cm2 and 0.3 mg/cm2 for
future stack generations. The lower limit of the loading is determined by the feasibility of
recycling and the loss in performance. Note that as soon as a rapid, global introduction of
fuel cells occurs, recycling becomes a main issue also because of the ressource situation
(for further information on PGM ressources refer to [29]).
• Maximizing the PGM yield during production. The yield of PGM in the production
process is very high already. Selective deposition of the catalyst ink and waste
minimization (alternative cutting procedures such as laser cutting, optimized GDE
geometries) lead to an increase of PGM yields to up to 99 %.
• Recycling of catalysts. An efficient recycling is necessary for economic and ecological
reasons. An efficient recycling system has already been established in automobile exhaust
catalyst recycling. Recycling catalysts can reduce the environmental impacts for PGM
production by a factor 20 (primary energy demand) to 100 (SO2 emissions) [30]. It has to
be mentioned that the "recycling rate" not only considers the technically feasible platinum
recovery, but also depends on a number of additional factors, such as the economic
incentive (depending on the PGM price), the availability of recycling infrastructure, the
export quota in countries without such infrastructure (e. g. about one third of the German
decommissioned vehicles is exported to Eastern European countries) and the distribution
of PGM in the fuel cell. So far, 52 % of the car catalysts in Germany are recycled [31]. It
is likely, however, that due to the much higher PGM use in fuel cell cars, recycling will be
mandatory. This could be reinforced by measures such as leasing of the stacks to the car
owners or deposits which ensure a high return rate. Thus, higher recycling quotas than for
car catalysts should be assumed. In addition, strong alliances between fuel cell

16
manufacturers and mining companies should secure the supply and environmental
standard of the metals.
• Recycling of components. In addition to PGM recycling, components such as the flow
plates and membranes in stationary stacks can be reused or used in other applications
(e. g. membranes for desalination or heavy-metal removal).
• Maximizing the efficiency. Of course, maximizing the efficiency by improving cell and
balance of plant performance reduces the required PGM loading due to a reduction of the
required active fuel cell area.
• Using "greener electricity" for the production process.
• The elimination of components and their integration into the stack (for instance
humidifiers, air compressors, reformers (Direct Methanol Fuel Cell) and flow
management).
3.4 Operation of Fuel Cell Vehicles
For conventional vehicles based on internal combustion engines, the fuel combustion and the
concomitant CO2 emissions as well as the direct exhaust emissions from incomplete
combustion and nitrogen oxidation are of relevance for the assessment of the use phase along
with other impacts such as tire wear or noise emission.
For fuel cell vehicles, exhaust gas emissions are low (gasoline), almost (methanol) or entirely
(hydrogen) zero with the important assumption that for fuel cell vehicles using gasoline or
methanol as a fuel, cold start and evaporative emissions will be further reduced. Therefore,
the question of the environmental characteristics of the use phase reduces to the question of
the fuel consumption of these vehicles.
Various studies have investigated the fuel consumption (Table 1). Mainly, these studies had to
be based on modelling of the vehicle because little experience from existing cars has been

17
gained so far. A number of parameters determine the fuel economy (Table 1). In Table 2,
main assumptions in various studies are summarised and the environmental aspects
considered are given. Also indicated in the table are the achieved fuel economy ratios (ICE
fuel economy/FC fuel economy) in these reports as indicated in Figure 7.
Table 1 next to here
Table 2 next to here
Figure 7 next to here
Of particular importance is the driving cycle chosen for the evaluation. Thomas has shown
that due to the different efficiency profiles of the power trains as a function of the load, the
fuel economy ratio for the same systems can vary from 3.7 (Japanese city cycle) to 1.8 (EPA
US 06 cycle) [32]. With increasing stop and go or accelaration at high speeds, the fuel
economy ratio decreases due to the lower full load efficiency of fuel cell systems.
For the determination of the fuel economy changes, also the characteristics of the baseline
gasoline vehicles are important. Whereas most of the American studies assume rather high
fuel consumptions due to heavier vehicles and less efficient, oversized engines, gasoline
consumptions assumed in the european studies are well below that. In these studies, mainly
future improved gasoline or diesel vehicle concepts are considered which are demonstrated on
the market already but which have not yet diffused into the market on a large scale. For
instance for a compact sized car, the 3l/100 km (1 MJ/km) vehicle is state of the art but far
from average fuel economies. For the reasons summarised above, most european studies
calculate significantly lower fuel economy ratios.

18
In addition, in Europe mainly compact sized cars are investigated. However, the potential fuel
reduction of fuel cells compared to ICEs for larger cars is higher because the power trains of
these cars typically have a higher mass specific power. Therefore the fuel cell system operates
less frequently in regions of lower system efficiency. Also, the assumptions regarding
additional weight of the fuel cell drive train differ significantly.
The calculated fuel economy ratios show the large bandwidth of results depending on the
circumstances even if the same model is applied. In [33], a change in fuel economy ratio of 2
and 1.85 for H2 and methanol fuel cell vehicles, respectively, is calculated with a 30 mpg
baseline gasoline vehicle, whereas in [34], ratios of 2.8 to 3.15 (H2) and 2.1 to 2.5 (methanol),
respectively, are presented. In the most recent study by General Motors coauthored by
Argonne National Laboratory, economy ratios of 2.13 (H2) and 1.5 (methanol) were
calculated (Table 2) [35].
In conclusion, the reduction of fuel consumption due to the use of fuel cell power trains
remains an open question of very high relevance. First pilot vehicles and fleet operations
should be analysed to support the results of the model calculations. However, the rapid ICE
development is a serious challenge for fuel cell vehicles with fuel economy ratios < 1.5
becoming realistic.
3.5 The Conventional Competitors
Future developments will also focus on optimising conventional vehicles. More stringent
emission levels in many nations lead to intensive research in the optimisation of ICE vehicles.
Catalysts and emission control systems, direct injection, downsizing/supercharging, and valve
control are only a few examples of future ICE development [36]. Therefore, LCAs should
consider this future improvement potential and compare fuel cell vehicles not only to average
ICE vehicles, but also to future car generations.

19
3.6 The Total Picture
In the following, the results from the different life cycle stages are put together to obtain a
complete picture of the performance of the different power train and fuel options.
3.6.1 Greenhouse Gas Emissions (GHG)
The evaluation of GHG emissions in the various studies can principally be divided into two
classes. Studies assuming low or no additional weight of fuel cell drive trains, low fuel
consumption of fuel cells, efficient upstream fuel supply and rather high gasoline
consumption for the competing vehicles result in a significant GHG advantage for all fuel cell
types. An example for this is shown in Figure 8 (right).
For most European studies which also assume clear improvements of future ICE vehicles, the
GHG emissions of hydrogen fuel cell cars are lower than those of future gasoline or diesel
cars in the case of hydrogen. Figure 8 (left) shows an example LCA for this class of studies. If
the production of the vehicle is not considered, (fossil) H2 fuel cell cars are about 30 % more
greenhouse friendly based on the average driving cycle chosen for analysis. However, the
higher production impacts (even assuming PGM recycling) reduce that advantage to 12 %
compared to future improved gasoline vehicles. The fuel cell car shows clear GHG
advantages for innovative H2 production paths, such as the Kværner CB&H process or
electrolysis with electricity from renewable primary energy carriers.
However, the H2 can also be used in ICE vehicles. These vehicles have comparable
efficiencies to gasoline ICE engines, and therefore lower efficiencies than fuel cell vehicles.
The exhaust emissions of these vehicles are – even without any catalyst – significantly lower
(criteria pollutant without NOX) or lower (NOx) than in conventional ICEs. On the other hand,

20
their production is less environmentally "costly". The competition of ICE in this impact
category thus remains a challenge for fuel cell vehicles.
Figure 8 Next to here
Figure 8 (left) also shows that for methanol fuel cell vehicles, the direct emissions are lower
due to a better power train efficiency. Unfortunately, methanol production is less efficient
than todays gasoline and diesel production. Therefore, the share of „fuel supply“ in Figure 8
is higher. In addition, the production of the methanol fuel cell vehicle leads to higher impacts
(higher than for H2 because of additional components, particularly the platinum group metals
for the catalytic refomer burner and an eventual membrane gas clean-up). Methanol produced
from wood avoids the increase in GHG emissions. It should be mentioned that methanol can
also be used in the internal combustion engine.
In conclusion, there is still uncertainty about the degree of GHG reduction fuel cell vehicles
can offer in this market segment. Especially, the fuel consumption is based on model
calculations only. Therefore, it is strongly recommended to accompany the fuel cell
development process with iterative LCAs to account for future developments and verify the
"real" reduction potential of fuel cells.
3.6.2 Other Environmental Impacts
Regarding acidification (and other impact categories dominated by NOx emissions), fuel cells
are zero (H2) or almost zero (methanol) emission cars. For H2, the acidification from the
energy chain and production is well below the gasoline ICE with the exception of the LH2
transported with a heavy oil tanker (Figure 9 left). For methanol, there is no clear advantage.
The acidification of the production of fuel cell cars mainly stems from SO2 from PGM

21
production. For other impact categories, where SO2 is insignificant (e. g. eutrophication and
carcinogenity) the advantages of fuel cell cars are more pronounced.
Carcinogenic emissions mainly occur in the Diesel engine. For the particle emission level, the
Euro 4 emission standard was chosen as a basis. The biomass based fuel chains also show
high impacts. This is due to the wood production (chain saws, further processing) and shows
that it is necessary to base such investigations on the full life cycle. It has to be recognised,
however, that the Euro 4 emission standard is quite strict and that therefore, the absolute
emission level of Figure 9 is not very high.
Figure 9 next to here
3.7 Conclusions
Fuel cells offer advantages in many different impact categories. However, the competition of
conventional ICEs is getting stronger due to the developments of more stringent emission
legislation and strict requirements regarding fuel consumption. Therefore, introducing fuel
cell vehicles in large numbers must be accompanied with an effort to introduce renewable
fuels as well as an efficient recycling system for the ecologically relevant vehicle
components.
In addition, data uncertainty regarding the fuel economy of future vehicle concepts is large.
This leads to quite opposite conclusions in the different studies. To give an idea of the
diverging conclusions, some citations are listed: "Thus the greenhouse gas advantage of FCVs
compared with conventional high efficiency competitors will only be maintained with certain
hydrogen supply options..."[37] "The greatest reduction in GHG would be from the use of
compressed hydrogen manufacture by SMR of natural gas. The next greatest reductions come
from centralized liquid hydrogen plants and from methanol reformed to hydrogen." [24] "In
general, ICE hybrids appear to have advantages over fuel cell hybrids with respect to life

22
cycle GHG emissions, energy efficiency, and vehicle cost, but the differences are within the
uncertainties of our results and depend on the source of fuel energy." [23] "When the total
energy chain is considered, the ICE is still ahead of the fuel cell. This may change, however."
[38]
All future power train systems, including the gasoline and diesel vehicles, possess significant
improvement potentials. Once mass reduction and reduction of rolling and air resistance are
realised, fuel cells, particularly with hydrogen as a fuel, will become more competitive, not
only due to reduced weight, volume and cost problems. The required storage for H2 would be
much lower. In addition, an optimised combination of battery and fuel cell hybrids is
recommended. A battery/fuel cell hybrid would not need to operate at full load during
acceleration; in an urban driving situation, operation at < 20 % partial load is avoided which
is important because the fuel cell system has an optimum efficiency at partial load > 20 %.
Employing a battery also allows easy brake energy recovery and reduces the amount of
catalyst material needed.
It is important to note that fuel cell vehicles offer other advantages promoting the introduction
of this power train, e. g. the simple realisation of brake energy recovery with an adequate
storage device, the compatibility with drive-by-wire or autopilot technologies, innovative
safety concepts that can be realised with electric vehicles, and higher user comfort and
acceleration. In addition, auxiliary power unit (APU) applications, especially in trucks, can be
an extremely attractive option for fuel cell use given the efficiencies of current automobile
electricity generators as low as 5 %.

23
4 Stationary Systems
4.1 Overview
Fuel cells can be applied in various stationary applications, ranging from one kWel systems
for domestic heating, combined heat and power production (CHP) for district heating or large
buildings, up to MW applications for industrial cogeneration and electricity production
without cogeneration. In each of these applications, different conventional systems are already
well established, e. g. gas engine CHP, gas turbines or combined cycle power plants. The
environmental assessment must, therefore, distinguish between the applications and compare
fuel cells to different competitors.
Figure 10 next to here
An early study carried out a streamlined LCA of fuel cell power production [39]. Some data,
like the production of the plants, was not available at that time. In addition, some of the fuel
cell efficiencies were set very optimistically (PAFC (200 kWel) total η 85 %; large SOFC
power plant ηel 74 to 80 %), whereas the parameters of the conventional systems were quite
pessimistic (gas turbine (1 MWel) ηel 26 %; large gas engine (1 MWel) ηel 36 %). [40]
assessed cumulated energy demands of an SOFC power plant. In [15,16], an attempt has been
made to combine LCAs of production, first experimental evidence from existing pilot plants
and performance data.
4.2 Production of the Fuel
4.2.1 Natural gas
In the near and midterm future, natural gas will be the fuel of choice for stationary
applications. The life-cycle of natural gas comprises the exploration and extraction, the

24
processing and transport to the consumer. LCAs of the natural gas supply must be carried out
specifically for each country. Parameters of influence are, for instance,
• the transport mode and distance (pipeline distance, transportation as liquid natural gas,
etc.);
• the specific energy requirements for compression and processing;
• the methane leakages of the long-distance and the local distribution pipelines; this issue
has been raised for Russian natural gas where, due to the extreme climate and the poor
pipeline conditions, leakage rates between 1 and 10 % have been published [41-45]. The
high global warming potential of methane leads to a significant influence of that leakage
rate;
• and the SO2 emission factors for the processing of sour natural gas.
The efficiency of (gaseous) natural gas supply is usually very high. For German industrial
customers, for instance, the efficiency varies between 98 % (Dutch natural gas) and 87 %
(Russian natural gas; lower efficiency due to transportation) [8].
4.2.2 Renewable Fuels
For longterm applications, biogen and other renewable fuels are considered suitable for the
use in fuel cells. Options include gasification of wood and other biomass [9], anaerobic
digestion of biowaste, sewage, manure, etc. [46]. In the latter case, fuel cells are also
attractive because of the low heat to power ratio. In many biogas plants, for instance, part of
the heat produced in the cogeneration plant has to be wasted due to a lack of heat demand.
The electricity, in contrast, can easily be fed into the grid. Generally, in most applications
(household, offices, industries) will have reduced heat consumption in the future due to
energy savings whereas electricity consumption will grow or at least stay constant.

25
4.3 Production of the Power Plant
In the following, the production of PEFC and SOFC power plants will be presented. For other
fuel cell technologies, LCAs of the system production have not yet been carried out.
4.3.1 PEFC
For the production of PEFC power plants, an LCA has been carried out in [15,25].
Principally, the same comments as for mobile systems are applicable. However, although the
environmental impacts of stationary fuel cell stacks per kilowatt are higher than those of
mobile stacks due to the higher weight and catalyst loading, the higher impacts of the
stationary stack per power unit (kW) are more than offset by the longer life-time (40,000
hours instead of 4,000 plus the potential to recycle part of the stacks, e. g. the flow field
plates) when moving towards impacts per energy unit (kWh).
Assuming a similar balance of plant as the phosphoric acid fuel cell, a streamlined LCA was
carried out for the total CHP system fired with natural gas including the periphery of the
system [15]. To most impact categories, the production of the total system, assuming PGM
recycling of 90 % (a higher rate than mobile systems because of the higher loading and the
limited number of systems), contributes less than 8 % of the life-cycle emissions. If no PGM
were recycled, the production would contribute less than 13 %. Therefore, in stationary PEFC
systems, the impacts of stack production are of much less relative importance than in mobile
systems.

26
4.3.2 SOFC
Manufacturing SOFCs involves a number of rather unconventional materials such as ZrO2,
Ni, rare earth compounds and, depending on the concept used, further materials such as
chromium for bipolar plates (in the case of the planar concept).
Manufacturing SOFC has only been assessed in two studies [40] (and [47] mainly based on
[40]) calculates cumulative energy demands for the materials. Due to the early publication
date, only aggregated and preliminary data was available. [47] calculates unusually high
impacts of the manufacturing process. In [15], industrial LCA data on the materials was
available. However, not the current tubular stack design, but a planar stack was evaluated.
The stack production process is shown in detail in Figure 11.
Figure 11 next to here
In Figure 12, the primary energy demand, the global warming potential and the acidification
per kg of SOFC relevant material produced are shown. It can be seen that the materials
exhibit rather different environmental profiles, especially due to differing demands for
processing energy (calcination, etc.) and due to allocation procedures (for instance for
Yttrium and Lanthanum) [15]. In addition, process specific direct emissions, such as the SO2
emissions from processing of sulfidic ores during nickel production, have to be considered
and lead to unproportionally high acidification in that particular case (see also platinum group
metals for PEFCs below).
Figure 12 next to here
Figure 13 shows that the stack is responsible for a large proportion of the total impacts of
system production. This is partly due to the lower lifetime of the stack: it has to be exchanged
during the life-time of the total system.

27
Further analysing the contribution of different processes to the stack production (Figure 13
below) reveals that in this planar design investigated, chromium used for the bipolar plates is
a critical material. But also the electricity used for electrochemical etching, sintering and other
process steps is of relevance, although large-scale series production was considered when
calculating throughputs and energy demands.
Figure 13 next to here
To consider the possibility of recycling, the further assessment in [15] did not assess a system
of first generation, but assumed recycling of 90 % of the bipolar plate material.
4.4 Operation of Fuel Cell Power Plants
4.4.1 Direct Emissions
The operation of fuel cell power plants leads to minimal direct emissions due to relatively low
(compared to combustion engines or turbines) operating temperatures (leading to almost zero
thermal NOx emissions) and gas clean-up requirements (e. g. the required SO2 removal).
The emissions are typically dependent on the load [48]. Only for PAFC, detailed emission
data is available. Averaging over load factors higher than 50 % results in emission factors
from the reformer burner as given in Table 3.
Table 3 next to here
As a first order approximation, these emissions can be applied to all natural gas reforming
stationary plants as long as the fuel, the reformer type and temperature and the fuel utilisation
are comparable. Generally, these emissions are very low in comparison with emissions from
other life cycle stages so that the uncertainty is not very relevant for the total results.
It is important to consider emission developments in the conventional systems as well.
Improved 3-way catalysts for gas engines, low-NOx combustion chambers and other primary

28
and secondary measures for gas turbines as well as NOx and SO2 abatement technologies for
large power plants have drastically reduced the exhaust emissions. Estimates of future power
plant generations are presented, for instance, in [12,15,49,50].
4.4.2 Electrical Efficiency
Essential for the LCA of the systems are the assumed electrical and the rmal efficiencies
which differ very much according to the system and the fuel cell type as described in the
subsequent sections.
The potentially high electrical efficiency of fuel cell power plants is one of the major
advantages of these systems. For each power range, fuel cells offer higher efficiencies than
the conventional competitors (Figure 14). It has to be mentioned that for fuel cells, these
numbers present target values whereas the demonstration plants do not yet reach these
numbers. For conventional systems, future optimisation potentials are also included in Figure
14 as the upper boundaries of the boxes.
Figure 14 next to here
Refering to natural gas as a fuel, in the low power range, PEFC have electrical efficiencies in
the order of 32 to 35 % for house heating systems and 40 % in the 100 kWel range. In a large
number of demonstration projects, these numbers have already been demonstrated with
PAFCs. In some systems, especially of the early generations, however, degradation effects
lowered the "lifetime efficiency".
High-temperature fuel cells offer efficiencies of 50 % when used in lower power regimes.
47 % have already been demonstrated in the Netherlands SOFC demonstration system as well
as in the Bielefeld (Germany) MCFC. In future, coupling fuel cells with gas turbines to use

29
the exhaust heat promises efficiencies of up to 68 % at the beginning of the operation, with
expected degradation to 62-64 % at the end of the life.
However, conventional systems are constantly optimised. In the US advanced turbine
programme, for instance, gas turbines in the MW range have reached electrical efficiencies of
more than 40 %. Also, combined cycle plants reach average efficiencies of 58-60 %, with
65 % (without degradation) being forecast by some researches. This means that the
competition is getting tougher.
It is worth mentioning, however, that even in the 3-10 MW power regime, the efficiencies of
fuel cell systems would exceed those of large 100-400 MW combined cycle power plants. A
detailed investigation of current and future prospects of efficiency development can be found
in [49]. For systems operated not a fixed operation point, but with variable load, the efficiency
as a function of the load is of relevance as well. For instance for a district heating application
in [15], a PEFC was modelled using average load data from a district heating system. As long
as the system does not fall below a certain minimum power, the electrical efficiency increases
with decreasing load. Similar to the driving cycle in the mobile application, therefore, the
application dependent load characteristics should be considered. High-temperature fuel cells
will, however, mainly be operated at fixed operating conditions.
4.4.3 Thermal/total efficiency
For combined heat and power production, the thermal efficiency is of importance as well. The
thermal efficiencies of conventional systems have been a key parameter for past optimisation
of the systems [15]. Gas engines, for instance, can reach total efficiencies of up to 100 %
(LHV) due to use of the condensing heat. In practice, more than 90 % total efficiency are
realistic. Combined cycle CHP plants can also reach thermal efficiencies of 50 % resulting in
total efficiencies of nearly 90 %.

30
The thermal efficiency is, of course, a function of the temperature of the heat medium. If only
steam is needed as in many industrial applications, it will be lower than for a low-temperature
district or house heating system. Also, the thermal efficiency is a function of the load.
Generally, current target values for most fuel cell systems are approximately 80 % total
efficiency. To successfully compete with the conventional systems, future work should also
focus on increasing thermal efficiencies by using the reformer exhaust heat and other heat
sources.
4.5 The Total Picture
In Figure 15, different environmental impacts of fuel cell energy production including all life
cycle stages compared to competitors are represented as assessed in [15]. Note that in order to
present the numbers in one diagram and in order to show the specific importance of the
respective environmental impact, the values were normalised by dividing by the daily
environmental impact per capita ("person equivalents"). Also, the heat produced in
cogeneration systems is credited with a modern natural gas burner. That means that if the
system produces x kWh electricity and y kWh heat simultaneously, the impacts of producing
y kWh heat with a modern natural gas are subtracted from the total impacts because this heat
production is substituted by the cogeneration system.
Figure 15 next to here
It is obvious that high-temperature fuel cells in this application offer significant advantages
compared to the competing technologies. Considering the global warming potential, an SOFC
in cogeneration is 12 % more efficient than a future gas turbine and even 47 % more efficient
than a future German electricity mix. The competition for high efficiencies is, however,
becoming stronger (see above).

31
The advantages of fuel cells are even more obvious in the case of local emissions and related
impact categories (e. g. acidification). On a life-cycle basis, the SOFC produces 70 % less
acidification than a low-NOx gas turbine and 30 % less than a modern natural gas CC. The
acidifying emissions in the case of SOFCs stem almost exclusively from the energy chain and
the production of the system. For gas turbines, in contrast, the direct NOx emissions account
for more than 50 % of total acidification.
At the same time, a gas turbine in the 3 MWel power range produces less greenhouse gases
than an SOFC without cogeneration. Combined heat and power production should therefore
generally be promoted. In addition, not only the electrical, but the total efficiency needs to be
optimised. This is even more important for PEFCs in the 100 kWel range where engine-CHPs
show total effiencies of more than 90 % (LHV) because the heat of condensation is used.
However, the development of high-efficiency centralised electricity production based on fuel
cells decreases the gap between cogeneration and non-cogeneration plants.
As fuel cell plants are in certain limits modular, and thus the specific costs are not so much
dependent on the size of the plant, the optimum size of such plants will be at lower power.
The introduction of fuel cells means the continuation of the process of decentralisation of
power production which started with high-efficiency gas turbines, small CC plants and CHP
engines.
The infrastructure, i. e. the production of the SOFC system, is of almost no significance for
the GWP and contributes less than 20 % to the life-cycle acidification. This can be seen from
Figure 16 where the contribution of the life cycle stages to total life cycle impacts are shown.
For acidification, the relative contribution of production is higher because of the low absolute
emissions contributing to acidification. In addition, these emissions depend on the system
design chosen. In this particular case, the emissions are caused by the electricity for
production (e. g. sintering the membrane-electrode assembly and electro-chemical etching of

32
the interconnects) and the chromium for the planar interconnects. For tubular SOFCs, the
environmental impacts from production are different.
Figure 16 next to here
A second example compares an SOFC using synthesis gas from wood gasification with a gas
turbine using the same gas and the German electricity mix from Figure 13 (Figure 17). It can
be seen that the primary energy demand and the GHG emissions can be drastically reduced by
both the SOFC and the gas turbine. The advantages of fuel cells when coupled with biogen
fuels are on the one hand the more efficient use of the often restricted biomass potentials and,
on the other hand, avoiding an increased emission level which is typical for many other
biomass based energy converting systems. In addition, low heat-to-power ratios are
advantegeous if the external heat demand is limited as is often the case in biogas plants [46].
Additionally, a trend towards higher electricty compared to heat demand can be observed in
industry.
Figure 17 next to here
5 Portable Systems
The environmental benefits from portable applications differ significantly from the other
application areas. Portable systems usually compete with (rechargable) batteries to power
laptops, telecommunication devices and other portable electronic devices or with gasoline or
diesel power generators. The rapidly growing market – in 2006 more than 6 billion portable
devices can be expected [51] – points to a potentially high ecological relevance. However, no
LCA has so far been carried out in this field. Some general remarks can be made nevertheless.
Batteries contain ecologically critically materials such as cadmium, lead or mercury. In many
countries, disposal of batteries is the main source of heavy metal contamination of waste

33
disposal sites. It is estimated that in 2001, 500 million rechargable batteries will be disposed
of. Additionally, the production of batteries consumes up to 500 times the energy contained in
the battery itself. In the life cycle of the fuel cell system, the supply of the production will
play a less important role than the substitution of batteries. As the fuel cell systems will have
longer life times and offer the potential of catalyst recycling the net effect will be clearly
positive.
Portable fuel cell systems also compete with gasoline or diesel generators. These small
systems have an efficiency of typically 10 % compared to fuel cells of similar size with
efficiencies between 20 to 28 % depending on the load factor [52]. In addition, clear
reductions in the noise level can be achieved.
6 Outlook and Summary
Fuel cells are promising energy converters for mobile, portable and stationary applications.
For an environmental evaluation of new technologies, however, an investigation of the
complete life cycle is necessary to ensure that no environmental aspect is neglected (Life
Cycle Assessment LCA).
LCAs of mobile fuel cell applications show that this technology offers advantages in many
different environmental impact categories. However, the competition of conventional power
trains is getting stronger due to the developments of more stringent emission legislation and
strict requirements regarding fuel consumption. In addition, the production of fuel cell
vehicles is more environmentally relevant than the production of internal combustion engine
(ICE) cars, partly due to the large amount of catalyst materials employed in fuel cell vehicles.
Also, data uncertainty regarding weight and fuel economy of future vehicle concepts is large.
For hydrogen fuel cell vehicles, for instance, the calculated fuel economy ratios (= fuel

34
consumption ICE vehicle/fuel consumption fuel cell vehicle) vary between 1.3 and 3.
Consequently, the calculated climate gas reductions differ significantly in the various studies.
A German study, for instance, calculates reductions of greenhouse gas (GHG) emissions by
15 % when hydrogen (from natural gas) fuel cell vehicles replace future improved gasoline
vehicles and when the production of the vehicle is taken into account. In some American
studies, the calculated GHG benefits are higher. The fuel cell car shows clear GHG
advantages for innovative H2 production paths, such as electrolysis with electricity from
renewable primary energy carriers or biomass gasification. However, in this case renewable
hydrogen can also be used in ICE vehicles with similar GHG emission levels.
For fossil methanol fuel cell vehicles, the majority of the studies do not determine a
significant global warming advantage compared to the conventional competitors. To achieve
CO2 reductions, methanol produced from biogen primary energy would be required.
For other environmental impacts, such as acidification or summer smog, the fuel and vehicle
production determine the minimum life cycle impacts. In any case, based on a life cycle
perspective, the fuel cell car is not a zero emission vehicle. Introducing fuel cell vehicles in
large numbers must, therefore, be accompanied with an effort to introduce renewable fuels as
well as an efficient recycling system for the ecologically relevant vehicle components.
In stationary applications, the potentially high electrical efficiency of fuel cell power plants,
especially high-temperature fuel cells, leads to clear ressource and GHG advantages
compared to the competing technologies. An SOFC/gas turbine system in combined heat and
power production (CHP) as calculated in one study emits 12 % less GHG emissions than a
future gas turbine and 47 % less than a future German electricity mix. The advantages of fuel
cells are even more obvious in the case of local emissions and related impact categories (e. g.
acidification). On a life cycle basis, the SOFC produces 70 % less acidification than a low-
NOx gas turbine and 30 % less than a modern natural gas combined cycle plant. The

35
acidifying emissions in the case of SOFCs stem almost exclusively from the energy chain and
the production of the system which is considerably less relevant than in mobile applications
due to the higher life time of the systems.
Further advantages could be achieved if not only the electrical, but the total efficiency were
simultaneously optimised. This is particularly important for low temperature fuel cells in CHP
applications where some engine CHP plants show total effiencies of more than 90 %.
In portable applications, the main environmental benefit will be the elimination of heavy-
metal containing batteries and higher electrical efficiencies compared to gasoline or diesel
generators with drastically reduced noise levels.
The future development will bring some radical changes with respect to materials, concepts
and applications, but also with respect to the framework – deregulated electricity markets,
increasing pressure on climate policy or emission control, etc. – in which fuel cells have to be
established. Therefore, LCAs at such an early stage of the market development can only be
considered preliminary. They help to recognise ecological weak points or bottlenecks and to
gradually improve process and system development. However, it is an essential requirement
to accompany the ongoing research and development with iterative LCAs and help decision
makers as well as companies to make decisions under the constraint of limited information on
power plant and power train technologies, fuel options, materials or operating conditions.
7 References
[1] ISO_14040, 'Environmental Management - Life Cycle Assessment - Principles and
Framework', (1997).

36
[2] CML, R. Heijungs, J. B. Guinee, G. Huppes, R. M. Lankreijer, H. A. U. d. Haes and
A. W. Sleeswijk, 'Environmental Life Cycle Assessment of Products. Guide and
Backgrounds.', Center of Environmental Science, Leiden (1992).
[3] H. Wenzel, M. Hauschild and L. Alting, 'Environmental Assessment of Products.
Volume 1: Methodology, tools and case studies in product development.', Chapman&Hall,
London (1997).
[4] R. Frischknecht, A. Braunschweig, P. Suter and P. Hofstetter, Environmental Impact
Assessment Review, 20 (2000).
[5] B. Solberg-Johansen, R. Clift and A. Jeapes, Int. J. Life Cycle Assessment, 2, 16-19
(1997).
[6] ISO/DIS_14042, 'Environmental Management - Life Cycle Assessment - Life Cycle
Impact Assessment', (1998).
[7] Acurex, 'Evaluation of Fuel-Cycle Emissions on a Reactivity Basis', Acurex
Environmental Corporation, Mountain View (1996).
[8] J. Borken, A. Patyk and G. A. Reinhardt, 'Basisdaten für ökologische Bilanzierungen'
(Data for LCAs, in German), vieweg, Braunschweig, Wiesbaden (1999).
[9] T. Dreier, 'Biogene Kraftstoffe. Energetische, ökologische und ökonomische Analyse.
IfE Schriftenreihe Heft 38', TU München, München (1999).
[10] M. Ekelund, A. Johansson, A. Brandberg and A. Roth, 'The Life of Fuels. Motor Fuels
from Source to End Use', Vattenfall AB, Ecotraffic AB, Stockholm (1992).
[11] R. Frischknecht et. al., 'Ökoinventare von Energiesystemen. Grundlagen für den
ökologischen Vergleich von Energiesystemen und den Einbezug von Energiesystemen in
Ökobilanzen für die Schweiz' (Life Cycle Inventories of Energy Systems), Zürich (1996).

37
[12] GEMIS, 'Gesamt-Emissions-Modell Integrierter Systeme Version 3.08', Öko-Institut e.
V., Darmstadt, Freiburg (1998).
[13] M. P. Gover, S. A. Collins, G. S. Hitchcock, D. P. Moon and G. T. Wilkins,
'Alternative Road Transport Fuels - A Preliminary Life-cycle Study for the UK', ETSU,
Oxon, UK (1996).
[14] A. Patyk and U. Höpfner, 'Ökologischer Vergleich von Kraftfahrzeugen mit
verschiedenen Antriebsenergien unter besonderer Berücksichtigung der Brennstoffzelle'
(Environmental Comparison of Vehicles with Different Power Trains), Report for the Office
of Technology Assessment of the German Parliament, Institut für Energie- und
Umweltforschung, Heidelberg (1999).
[15] M. Pehnt, 'Ganzheitliche Bilanzierung von Brennstoffzellen in der Energie- und
Verkehrstechnik' (Life Cycle Assessment of Fuel Cells in Mobile and Stationary
Applications), Dissertation Thesis, DLR - Institut für Technische Thermodynamik Stuttgart,
VDI-Verlag Fortschrittsberichte, in preparation (2001).
[16] M. Pehnt, 'Life Cycle Assessment of Fuel Cells and Relevant Fuel Chains', Proc.
Hyforum 2000 International Hydrogen Energy Forum, ISSN 0944-6754, ISBN 3-930157-43-
8, pp. 387-396, Munich (Germany) 2000.
[17] G. Reinhardt and G. Zemanek, 'Ökobilanz Bioenergieträger: Basisdaten, Ergebnisse,
Bewertungen' (Life Cycle Assessment of Bioenergy), Erich Schmidt, Berlin (2000).
[18] A. Röder, 'Vergleich regenerativer Energiesysteme bezüglich Kosten,
Treibhausgasemissionen, Ressourcenverbrauch', Diplomarbeit Thesis, Paul-Scherrer-Institut
und ETH Zürich, (1997).

38
[19] U. Wagner, B. Geiger, H. Frey and T. Schedl, 'Untersuchung von Prozeßketten einer
Wasserstoff-Energiewirtschaft' (Analysis of Process Chains of a Hydrogen Economy), TU
München (1995).
[20] M. Q. Wang, 'Greet 1.5 - Transportation Fuel-Cycle Model', Center for Transportation
Research, Energy Systems Division, Argonne National Laboratory, Argonne (USA) (1999).
[21] O. Finkenwirth, M. Pehnt and T. Marheineke, 'Life Cycle Assessment of Innovative
Hydrogen Production Paths', Proc. Hyforum 2000 International Hydrogen Energy Forum,
ISSN 0944-6754, ISBN 3-930157-43-8, pp. 161-171, Munich (Germany) 2000.
[22] P. Spath and M. Mann, 'A Complete Look at the Overall Environmental Impacts of
Hydrogen Production', Hyforum 2000, Munich 2000.
[23] M. A. Weiss, J. B. Heywood, E. M. Drake, A. Schafer and F. F. AuYeung, 'On the
Road in 2020. A life-cycle Analysis of New Automobile Technologies', Massachusetts
Institute of Technology, Cambridge (2000).
[24] S. T. C. Inc., 'Assessment of Emissions of Greenhouse Gases from Fuel Cell Vehicles.
Prepared for Methanex Corporation', Delta BC (Canada) (2000).
[25] M. Pehnt, Int. J. Hydrogen Energy, 26, 91-101 (2001).
[26] G. W. Schweimer, 'Sachbilanz des 3 Liter Lupo', Volkswagen AG, Wolfsburg (1999).
[27] Johnson_Matthey, 'Platinum 1999', Johnson Matthey Public Limited Company,
London (1999).
[28] C. Hochfeld, 'Bilanzierung der Umweltauswirkungen bei der Gewinnung von
Platingruppen-Metallen für PKW-Abgaskatalysatoren' (Environmental Impacts of Platinum
Group Metals for Catalysts), Diploma Thesis, Technische Universität Berlin, (1997).

39
[29] I. Råde, 'Requirement and Availability of Scarce Metals for Fuel-Cell and Battery
Elektric Vehicles', Dissertation Thesis, Chalmers University of Technology and Göteborg
University, (2001).
[30] M. Schuckert, M. Harsch, P. Eyerer, K. Saur and C. Kaniut, 'Optimization of Three-
Way Catalyst Systems by Life-Cycle Engineering Approach', SAE paper 1998.
[31] C. Hagelüken, 'Der Kreislauf der Platinmetalle - Recycling von
Autoabgaskatalysatoren' (The Platinum Cycle), 8. Duisburger Recyclingtage, Duisburg 1998.
[32] C. E. Thomas, 'On Future Fuels: A Comparison of Options' in "On Energies-of-
Change - The Hydrogen Solution', C.-J. Winter (Ed.), Gerling-Akademie Verlag, ISBN 3-
932425-31-6, München, pp. 50-66 (2000).
[33] M. Q. Wang, 'Fuel-Cycle Greenhouse Gas Emissions Impacts of Alternative
Transportation Fuels and Advanced Vehicle Technologies', Presentation on the Annual
Meeting of the Transportation Research Board 1999, Washington D.C. November 1998.
[34] M. Q. Wang and H.-S. Huang, 'A Full Fuel-Cycle Analysis of Energy and Emissions
Impacts of Transportation Fuels Produced from Natural Gas', Argonne National Laboratory,
Argonne (1999).
[35] General Motors, 'Well-to-Wheel Energy Use and Greenhouse Gas Emissions of
Advanced Fuel/Vehicle Systems. North-American Analysis. Report with cooperation of
General Motors Corporation, Argonne National Laboratory, BP Amoco, ExxonMobil, Shell',
(2001).
[36] M. Pehnt, 'Ökologische Nachhaltigkeitspotenziale von Antrieben und Kraftstoffen'
(Ecological Sustainability Potentials of Power Trains and Fuels). Report for the HGF-project
"Global zukunftsfähige Entwicklung. Perspektiven für Deutschland", DLR - Institut für

40
Technische Thermodynamik, Stuttgart (2001). www.dlr.de/TT/system/projects/
nachhaltige_Entwicklung
[37] Pembina, 'Climate-Friendly Hydrogen Fuel: A Comparison of the Life-cycle
Greenhouse Gas Emissions for Selected Fuel Cell Vehicle Hydrogen Production Systems',
Pembina Institute, Drayton Valley (Canada) (2000).
[38] P. Ekdunge and M. Raberg, Int. J. Hydrogen Energy, 23, 381-385 (1998).
[39] D. Hart and A. Bauen, 'Further Assessment of the Environmental Characteristics of
Fuel Cells and Competing Technologies', Department of Trade and Industry, London (1997).
[40] P. Zapp, 'Ganzheitliche Material- und Energieflußanalyse von SOFC
Hochtemperaturbrennstoffzellen' (Life Cycle Material and Energy Analysis of SOFC High
Temperature Fuel Cells), Dissertation Thesis, Universität-Gesamthochschule Essen, (1997).
[41] J. V. Dedikov, G. S. Akopova, N. G. Gladkaja, A. S. Piotrovskij, V. A. Markellov, S.
S. Salichov, H. Kaesler, A. Ramm, A. M. v. Blumencron and J. Lelieveld, Atmospheric
Environment, submitted (1998).
[42] W. Zittel, 'Untersuchung zum Kenntnisstand über Methanemissionen beim Export von
Erdgas aus Rußland nach Deutschland, Endbericht', Ludwig-Bölkow-Systemtechnik,
Ottobrunn (1997).
[43] Methane leakages, IfE, in [44].
[44] P. Biedermann, H. Dienhart, T. Dreier, T. Grube, B. Höhlein, R. Menzer, J. Nitsch, M.
Pehnt and U. Wagner, 'Ganzheitliche Systemuntersuchung zur Energiewandlung durch
Brennstoffzellen. Abschlußbericht des Forschungszentrum Jülich, des Deutschen Zentrums
für Luft- und Raumfahrt und der Technischen Universität München', Forschungsvereinigung
Verbrennungskraftmaschinen e. V., Frankfurt (1998).

41
[45] VDEW, 'VDEW-GEMIS-Datensatz. Energiebedarf und Emissionen von Kraftwerken
und Prozessen', Fichtner Development Engineering, Stuttgart (1996).
[46] M. Pehnt, 'Life Cycle Assessment of Biomass Fuels for Fuel Cell and Engine
Combined Heat and Power (CHP) Production', Biomass for Energy and Industry. 10th
European Conference and Technology Exhibition. 8.-11.6.1998, Würzburg 1998.
[47] P. Olausson, 'Life Cycle Assessment of an SOFC/GT Process', Thesis, Department of
Heat and Power Engineering, Lund Institute of Technology, (1999).
[48] NYSERDA, '200 kW Fuel Cell Monitoring and Evaluation Program. Final Report',
New York (1997).
[49] H. Dienhart, M. Pehnt and J. Nitsch, 'Analyse von Einsatzmöglichkeiten und
Rahmenbedingungen verschiedener Brennstoffzellensysteme in Industrie und zentraler
öffentlicher Stromversorgung' (Analysis of the Framework and the Applications of Fuel Cells
in Industry and Central Electricity Production), Report for the Office for Technology
Assessment of the German Parliament, DLR - Institut für Technische Thermodynamik,
Stuttgart (1999).
[50] R. Dones, U. Gantner, S. Hirschberg, G. Doka and I. Knoepfel, 'Environmental
Inventory for Future Electricity Supply Systems for Switzerland', Paul-Scherrer-Institut, ETH
Zürich, Villigen, CH (1996).
[51] TAB, Technology Assessment Project "Brennstoffzellen-Technologie" (Fuel Cell
Technology), Office for Technology Assessment of the German Parliament, TAB report No.
67, Berlin (2000).
[52] J. Scholta and M. Zedda, Forschungsverbund Sonnenenergie "Zukunftstechnologie
Brennstoffzelle". ISSN 0939-7582, 26-31 (2000).

42
[53] K. G. Duleep, 'Cost and Fuel Efficiency of 2010 Cars.' in "The Costs and Benefits of
Electric Vehicles. Should battery, hybrid and fuel-cell vehicles be publicly supported in
Sweden? Report of the KFB, Department of Economics, Göteborg University", F. Carlsson
and O. Johansson-Stenman (Ed.), Göteborg, (2000).
[54] F. Gossen, 'Der Brennstoffzellenantrieb im Vergleich zu konventionellen Antrieben'
(The Fuel Cell Power Train Compared to Conventional Power Trains), IIR Konferenz
Brennstoffzellen, Stuttgart 2000.
[55] P. Biedermann, K. U. Birnbaum, T. Grube, B. Höhlein, R. Menzer and M. Walbeck,
'Systemvergleich: Einsatz von Brennstoffzellen in Straßenfahrzeugen' (System Comparison:
Application of Fuel Cells in Road Vehicles), Report for the Office for Technology
Assessment of the German Parliament, Forschungszentrum Jülich, Jülich (1999).
[56] C. Carpetis, 'Globale Umweltvorteile bei Nutzung von Elektroantrieben (mit
Brennstoffzellen und/oder Batterien) im Vergleich zu Antrieben mit Verbrennungsmotor'
(Global Environmental Advantages of the Use of Electric Power Trains), STB Report No 22,
Deutsches Zentrum für Luft- und Raumfahrt, Institut für Technische Thermodynamik,
Stuttgart (2000).
[57] Siemens, Personal Communication Mr. L. Blum (1998).
[58] GaBi_3, 'Ganzheitliche Bilanzierung. Software-Plattform zur Ganzheitlichen
Bilanzierung', Institut für Kunststoffprüfung und Kunststoffkunde der Universität Stuttgart,
Stuttgart (1998).
[59] N. Q. Minh and T. Takahashi, 'Science and Technology of Ceramic Fuel Cells',
Elsevier, Amsterdam (1995).
[60] DLR, Personal Communication Mr R Ruckdäschel, Institute for Technical
Thermodynamics, German Aerospace Center Stuttgart (1998).

43
[61] Plansee, Personal Communication Mr M Janousek, Plansee AG Reutte (Austria)
(1998).
[62] GEMIS, 'Gesamt-Emissions-Modell Integrierter Systeme (GEMIS) Version 2.1,
Endbericht', Öko-Institut, Darmstadt u. a. (1994).
[63] Leistritz, Personal Communication Dr. M. Baumgärtner, Leistritz AG Nürnberg
(1998).
[64] LWK, Personal Communication Dr. W Schultze, LWK Plasmakeramik (1998).
[65] R. Hardt, Personal Communication Mr Hardt, Industriekontor Hardt, Düsseldorf
(1999).

44
8 Table and Figure legends
Table 1 Important parameters for calculating fuel cell vehicle fuel economies
Table 2 Review of input parameters, fuel economy ratios and analysed environmental
impacts in various studies
Table 3 Emission factors of a number of ONSI PAFCs per kWhel and per MJ LHV fuel input
[49]
Figure 1 The life cycle of fuel cells
Figure 2 Life Cycle Assessment according to [1]
Figure 3 Selected hydrogen production and supply paths [21]
Figure 4 Comparison of GHG emissions and acidification for different transport
scenarios of renewable hydrogen (normalised to GH2 with high voltage direct current
(HVDC) transmission)
Figure 5 Production process of typical fuel cell stacks at Ballard
Figure 6 Production of a fuel cell vehicle based on methanol: Contribution of
components to primary energy, global warming and acidification. Assumption: 75 % PGM
recycling.
Figure 7 Fuel economy ratio (fuel consumption ICE/fuel consumption FC) in various
studies (references see Table 2)
Figure 8 Greenhouse gas emissions of different power train and fuel options. Data
sources: Left: [15]. H2 ICE according to [14]. Right: Fuel consumption and fuel chains
according to [20], vehicle production from [15].

45
Figure 9 Acidification and carcinogenic emissions of different power train and fuel
options. Data from [15]. High acidification of methanol from wood is caused by purge gas
burnt in an engine CHP; these emissions can be avoided by different process options [15].
High carcinogenic emissions of methanol from wood caused by wood supply (chain saws,
etc.). Negative emissions of Kværner H2 from carbon black credit.
Figure 10 Applications, systems and competitors of stationary fuel cells
Figure 11 SOFC stack production process used for the LCA in [15]
Figure 12 Selected environmental impacts associated with the production of 1 kg of
different SOFC relevant materials
Figure 13 Selected environmental impacts from SOFC system (above) and stack (below)
production (planar Siemens design, 200 kWel system, no recycling, parameters scaled for
large-series production)
Figure 14 Electrical efficiencies of fuel cell power plants and conventional competitors
(fuel: natural gas)
Figure 15 Total environmental impacts of energy production with fuel cells and
conventional competitors. All impacts are related to the functional unit 1 kWhel. If heat is
coproduced it is credited with a modern natural gas burner. All data is normalised to person
equivalents by dividing the impacts by the average per capita impact in Germany. (10*10-3
person equivalents equal 4.93 MJ primary energy; 361 g CO2 eq.; 1.46 g SO2 eq.; 0.153 g
PO43- eq.; 0.625 g NMHC; 2.54 e-6 g*URF carcinogenic emissions
Figure 16 Contribution of life cycle stages to total environmental impacts to the systems
of Figure 15. Bars are scaled in such a way that positive impacts minus heat credit yields
100 %.

46
9 Tables
Table 1
Parameter Subparameter Comments Illustration
Mechanical energy demand
Mass - Leight weight materials
- Weight of power train, incremental weight of fuel cell
system
Rolling resistance
Air resistance
Driving characte-ristics/ driving cycle
- more dynamic driving cycles lead
to shifts in favor of ICEs
0
25
50
75
100
125
150
0 500 1000 1500 2000 2500 3000
Time (s)
Spe
ed [K
m/h
]
Efficiencies of system components
Polarization curve Operation point is important: Offset between maximum efficiency and
maximum power
Reformer (MeOH)
Parasitic loads
0 0,2 0,4 0,6 0,8 10
0,2
0,4
0,6
0,8
1
1,2
Current Density (A/cm^2) fvv-PEM.PRE
system efficiency
max. efficiency
stack efficiency
ideal efficiency
Power management
Battery - avoid full load or idle operation - cold start
Brake energy
recovery

47
Table 2
Time Frame Comments Ref.#
Weight of Body &
Chassis & Driver
Air Drag Rolling Res.
Coeff.
Driving Cycle Gasoline Consumption
Emission Level
Vehicle Production
Considered?
Fuel Chains?
Environmental Impacts
Considered
CH2 MeOH Gasoline cW*A CH2 MeOH Gasoline
kg kg kg m2 MJ LHV/km
Thomas 2000 Ford Sable (Aluminum intensive) faster EPA 2,53 2,2 1.62 (best case)
[32]
Methanex 2000 2020 approx. 0 200 200 faster 55/45 2,90 - 2,2 1,74 1,45 streamlined yes PE, GHG very high MeOH reformer effici. (89,5 %). Almost equal values for production of ICE and FC vehicles. 75 % efficiency of MeOH production.
[24]
Wang 1998 2010 55/45 2,53 2 1,85 - no yes PE, GHG [33]Wang 1999 2010 55/45 3,16 Tier 2 2.8-3.15 2.1-2.5 1.75-2.25 no yes PE, GHG,
VOC, CO, NOx, SOx, PM10
Values represent "incremental" and "leap-forward" scenarios, respectively.
[34]
GM 2001 full size pickup truck. Data proprietory 3,76 Tier 2 Bin 5 2.13 * 1.5 * 1.346 * no yes PE, GHG [35]Pembina 2000 Mercedes A class 55/45 2,36 2,62 1,74 1,12 no yes [37]Ekdunge 1997 1130 260 305 PE, GHG,
some pollut.[38]
ifeu/FZJ 1999 2010 825 42 115 0.6 0.008 NEDC 1,33 Euro 4 1,66 1,25 - no yes PE, GHG, A, E, C, SS, OD
[14], [55]
highway 1,89 Euro 4 1,26 1,05 - no yes PE, GHG, A, E, C, SS, OD
Carpetis 2000 2005-2010 950 370 570 670 0.61 0.01 NEDC + highway 1,78 Euro 4 1,46 1,19 1 no yes PE, GHG, NOx, NMVOC
[56]
Pehnt 2001 2010 825 320 410 - 0.6 0.008 NEDC + highway 1,60 Euro 4 1,55 1,27 - detailed yes PE, GHG, A, E, C, SS, OD
baseline ICE vehicle is an improved gasoline vehicle
[15]
Gossen 2000 longterm 957 (tot) 85 185 - 0.58 0.0095 NEDC 1,52 Euro 4 1,58 1,22 - no no Fuel Consumption
[54]
Hyzem 1,65 Euro 4 1,31 1,13 - no no Fuel Consumption
MIT 2000 2020 892 78 139 222 0.396 0.006 55/45 1,54 2,17 1,32 0,98 streamlined yes PE, GHG compared to advanced ICE, the economy ratios would be 1.92, 1.16 and 0.86 for hydrogen, methanol and gasoline FCV, respectively
[23]
KFB 2000 2010 1418 90 226 - 0.008 55/45 2,20 2,4 1,8 - no no [53]
NEDC: New European Driving Cycle, Hyzem: European Cycle combining dynamic urban, non-urban and highway parts, 55/45: 55 % FUDS, 45 % highway cycle
PE Primary Energy, GHG Greenhouse Gas Emissions, A Acidification, E Eutrophication, C Carcinogenity, SS Sommer smog, OD Ozon Depletion. * higher, if charge sustaining hybrid electric vehicle is assumed
Fuel Economy Ratio from Literature
Incremental Weight of FC compared to ICE
ICE Fuel Consumption/FC Fuel Consumption
General Information on StudyICE Fuel Economy Ratio
Fuel Economy Ratio from Literature
General Vehicle and Study Parameters

48
Table 3
mg/kWhel mg/MJin
CO 15 1.7 NOx 8 0.9
SO2 0 0 NMVOC 2.5 0.3
CH4 75 8.3
Particles 0 0

49
10 Figures
Figure 1
Exploration
Processing
Transport/Distri-bution
Use
Resources
Goods & Services WastesEmissions
Production
Systemboundary
Recycling/Disposal
FuelSupply

50
Figure 2
Goal and scope definition
Inventory analysis
Impact assessment
Inte
rpre
tatio
n
Life Cycle Assessment (LCA)
Direct Applications:
• Product development and
improvement
• Strategic planning
• Public policy making
• Marketing
• Other

51
Figure 3
Natural gas ElectricityNational grid
Hydroelectric power Solar thermal powerplant
Steam Reforming Kværner CB&H Electrolysis
HVDCTElectricity
Combined Cycle
Bargen Carrier(H2 / Diesel engine)
HVDCT
Pipeline
Liquid hydrogen atfilling station
Road trailer
Liquefication
Gaseous hydrogen atfilling station

52
Figure 4
0%
100%
200%
300%
400%
500%
Global Warming Acidification
GH2 HVDC (=100%)GH2 PipelineLH2 heavy oil tankerLH2 H2 tanker
Hydrogen from hydropower/electrolysis. Transport Norway -> Germany (fictive)

53
Figure 5
Gas diffusion electrode
Join MEA
Membrane
Sealing
Bipolar plate Stack hardware
Sealing
Assembly
Testing
Energy Pt .... .... Polymer .... Graphite .... .... .... ....
PEFC stack
Waste

54
Figure 6
Primary Energy
Global Warming
Acidification
0 10 20 30 40 50 60 70 80 90 100
StackBalance of Plant
Car Body, Tires, etc.
Primary Energy
Global Warming
Acidification
0 10 20 30 40 50 60 70 80 90 100
GDE (PGM)GDE (Rest)
MembraneJoin MEA
Flow Field PlateMisc.
(a) Total System
(b) Stack

55
Figure 7
Thomas
KFB
Methanex
Wang 99
Wang 98
FZJ Carpetis Pehnt
Gossen
MIT
1,5 2 2,5 3 3,5
Fuel Consumption ICE (MJ LHV/km)
1
1,5
2
2,5
3
Fuel
Eco
nom
y R
atio
Thomas MethanexKFB
Wang 99
Wang 98
FZJ Carpetis Pehnt
Gossen
MIT
1,5 2 2,5 3 3,5
Fuel Consumption ICE (MJ LHV/km)
1
1,5
2
2,5
3
Fuel
Eco
nom
y R
atio
Hydrogen Fuel Cell Vehicle Methanol Fuel Cell Vehicle

56
Gasoline average
Gasoline advanced
Diesel 2010
Methanol (Natural Gas)
Methanol (Wood)
Hydrogen (GH2, Natural Gas)
Hydrogen (GH2, Kvaerner)
Hydrogen (GH2, Renewable Electr.)
Hydrogen (LH2, Renewable Electr.)
Methanol (Natural Gas)
Methanol (Wood)
Hydrogen (GH2, Natural Gas)
Hydrogen (GH2, Kvaerner)
Hydrogen (GH2, Renewable Electr.)
Hydrogen (LH2, Renewable Electr.)
0 50 100 150 200 250 300 350
Global Warming (g CO2 Eq./km)
Fuel Production Direct Emissions Vehicle Production
Fuel
Cel
l
I
nter
nal C
ombu
stio
n E
ngin
e
050100150200250
Global Warming (g CO2 Eq./km)
Fuel
Cel
l
I
nter
nal C
ombu
stio
n E
ngin
e
Fuel Consumption according to Pehnt 2001 Fuel Consumption according to Wang 1999
Figure 8

57
Gasoline today
Gasoline 2010
Diesel 2010
Methanol (Natural Gas)
Methanol (Wood)
Hydrogen (GH2, Natural Gas)
Hydrogen (GH2, Kvaerner)
Hydrogen (GH2, Renewable Electr.)
Hydrogen (LH2, Renewable Electr.)
Methanol (Natural Gas)
Methanol (Wood)
Hydrogen (GH2, Natural Gas)
Hydrogen (GH2, Kvaerner)
Hydrogen (GH2, Renewable Electr.)
Hydrogen (LH2, Renewable Electr.)
0 0,5 1 1,5 2 2,5
Carcinogenic Emissions (µg*URF/km)
Fuel Production Direct Emissions Vehicle Production
Fuel
Cel
l
I
nter
nal C
ombu
stio
n E
ngin
e
-1000100200300400500600700
Acidification (mg SO2 Eq./km)
Fuel
Cel
l
I
nter
nal C
ombu
stio
n E
ngin
e
Acidification Carcinogenic Emissions
Figure 9
(Line shift only in pdf document)

58
Figure 10
Power Application System Competitor
1 kWel
10 kWel
100 kWel
1 MWel
>1 MWel
House Heating Small Engine CHPs
District Heating Engine CHP
Industrial CHP Gas Turbines
Power Plants Combined Cycle Plants
CHP: Combined Heat and Power Production M. Pehnt

59
Figure 11
ZrO2 MnO2 SrCO3 La2O3
Grinding6,4 kWh 1
Filtration
DryingElectr.320 Wh 1
Cathode
WPS
Tape casting
Sintering
Screen printing
Electrolyte
1440 MEAs
ZrO 2 Y a. Cl.
Anode
NiO YSZ
16 MWh 1
PVB
PEG NMVOC
NMVOC
800 g 1
800 g 1
48 g 1
3,2 kg 1
Ni, YSZ-A.recycl.
liq. waste
NMVOC2,9 kg 1
6,4 kWh 1
320 Wh 1
AssemblyN iNickel mesh
Glas foilGlas foil
NMVOC1,6 kg 1
Heat150 kWh 1
24 kW Stack
163 Bipolar plates
Mem
bran
e E
lect
rode
Ass
embl
y (M
EA
)B
ipol
ar p
late
Process
WPS Wet Powder SprayPVB PolyvinylbutyralPEG Polyethylen glycol-W. -Wasten. neglected
Figure 12.pre
Flow
Amount Reference
352 g 1 992 g 1 336 g 1 1504 g 1
1: Siemens 1998 (57)2: Gabi 1998 (58)3: Minh 1995 (59)4: DLR 1998 (60)5: Plansee 1998 (61)6: GEMIS 1994 (62)7: Leistritz 1998 (63)8: LWK 1998 (64)9: Hardt 1999 (65)
800 g 3
800 g 3
250 kWh 1
1,25 kg 1 768 g 1
Electricity forSintering and Drying
11,8 kg 1
3,8 kg 1
WPS Cont. lay.
Ethanol
Binder
VPS Prot. lay.Helium
Argon
509 kWh 4
ActivationHCl5,2 l 4
Sand Blasting
Wat. Jet Cutting
EC. Etching
Rolling
C r* F e Y2O3 LaCrO 3
GrindingStrom
Ducrolloy Powd.
LSM
16 l 1
1,6 kg 1
19,6 m3 4
36,7 m3 4
6,5 kg 4 32,6 kg 1
Hot Isost. Press.
65 kWh 5
18 kWh 6
1,6 kWh 5
2657 kWh 7Cr, Fe, Y40 kg 7
Cleaning20 kWh 7Cr, etc.
2 kg 7
n.
253 kg 5 11 kg 5 2,6 kg 5
1,6 kWh 5
Al2O38,1 kg 8
MgO0,9 kg 8
TE Gas30 kWh 8
8
14,6 kg 1 1,3 kg 1
SpinelFrame
Binder4,2 kg 1
Clean.9,6 kg 1
100 kWh 9
sol. waste
Grinding
Filtration
Drying
Electr.
Electr.
Electr.
Electr.
Electr.
Electr.
Electr.
Electr.
Acids
Electr.
Electr.
Wat. CuttingElectr.
Electr.
Electr.
Electr.
Sintering

60
Figure 12
mp d:\projekte\tab_bz\material.pre
Yttrium oxide
Chromium(electrol.)
Chromium(alum.)
Zirconia Lanthanum oxide
Strontium carbonate,Manganese oxide
Nickel
500
1.000
1.500
2.000
50
100
150
200
0,5
1
Primary energy (MJ)
Global warming (kg)Acidification (kg)

61
Figure 13
Primary Energy
Global Warming
Acidification
0 20 40 60 80 100
ElectricityHeat Energy
ChromiumNickel
Yttrium OxideMisc.
Primary Energy
Global Warming
Acidification
0 20 40 60 80 100
StackSteel
CopperMisc.
Electroc. Etching
HIP
VPSMisc. Sintering
Join Stack
Electricity Consumption:
HIP: Hot Isostatic PressVPS: Vacuum Plasma Spraying
dr\bilder\Resultate Kapi 7.prz
(a) Total System
(b) Stack(b) Stack

62
Figure 14
T-KW-ETA.PRE
Combined CyclePlant
Gas turbine
Gas engine
PEFC PAFC
SOFC, MCFC
SOFC-, MCFC w/ Gas Turbine
Future: upper lineToday: lower line
0,01 0,1 1 10 100 300 1.0000
10
20
30
40
50
60
70
80
Electrical Power in MW
Ele
ctri
cal E
ffic
ienc
y in
%

63
Figure 15
0
5
10
15
20
25
Primary Energy Global Warming Acidification Eutrophication NMHC CarcinogenicEmissions
Nor
mal
ised
Env
iron
men
tal I
mpa
cts
in 1
0-3
pers
on e
quiv
alen
ts p
er k
Whe
l
SOFC CHP (3 MWel)
Gasturbine CHP (3 MWel)
PEFC CHP (200 kWel)Engine CHP (200 kWel)
SOFC (no CHP) (> 20 MWel)
Natural Gas CC (600 MWel)Future German Electricity Mix
CHP
no cogeneration
Heat credit with natural gas burner.CHP: Combined Heat and Power ProductionCC: Combined Cycle

64
Figure 16
-200% -150% -100% -50% 0% 50% 100% 150% 200% 250% 300%
Primary Energy
Global Warming
Acidification
Eutrophication
NMHC
Carcinogenity
Primary Energy
Global Warming
Acidification
Eutrophication
NMHC
Carcinogenity
Primary Energy
Global Warming
Acidification
Eutrophication
NMHC
Carcinogenity
Primary Energy
Global Warming
Acidification
Eutrophication
NMHC
Carcinogenity
Primary Energy
Global Warming
Acidification
Eutrophication
NMHC
Carcinogenity
Primary Energy
Global Warming
Acidification
Eutrophication
NMHC
Carcinogenity
Fuel supply Operation System production Heat credit
Gas
eng
ine
(dec
. CH
P)
PE
FC (d
ec. C
HP
)N
atur
al g
as C
CS
OFC
(no
CH
P)
Gas
turb
ine
SO
FC (C
HP
)
negative impacts due to heat credit

65
Figure 17
0
5
10
15
20
Primary Energy GlobalWarming
Acidification Eutrophication NMHC CarcinogenicEmissions
Nor
mal
ised
Env
iron
men
tal I
mpa
cts
in 1
0-3
pers
on e
quiv
alen
ts p
er k
Whe
l
Biogen SOFC CHP (3 MWel)
Biogen Gas turbine CHP (3 MWel)
Future German Electricity Mix
Heat credit with biogen synthesis gas burner

66
[23,38,53-56]
Related Documents