1

Welcome message from author
This document is posted to help you gain knowledge. Please leave a comment to let me know what you think about it! Share it to your friends and learn new things together.
Transcript
1
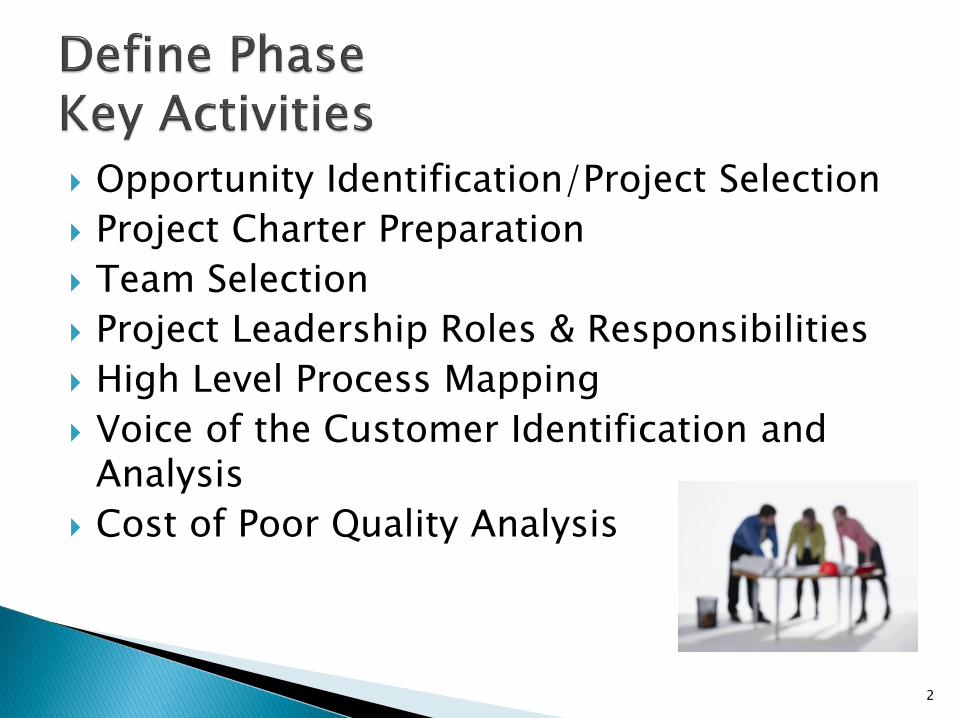
Opportunity Identification/Project Selection
Project Charter Preparation
Team Selection
Project Leadership Roles & Responsibilities
High Level Process Mapping
Voice of the Customer Identification and Analysis
Cost of Poor Quality Analysis
2
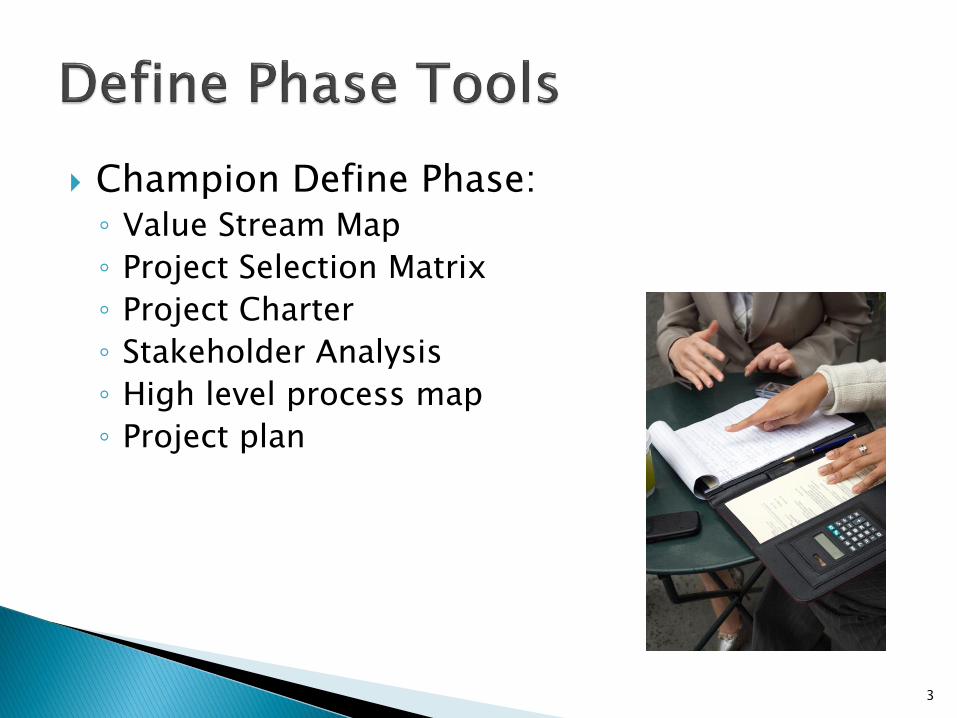
Champion Define Phase:◦ Value Stream Map
◦ Project Selection Matrix
◦ Project Charter
◦ Stakeholder Analysis
◦ High level process map
◦ Project plan
3
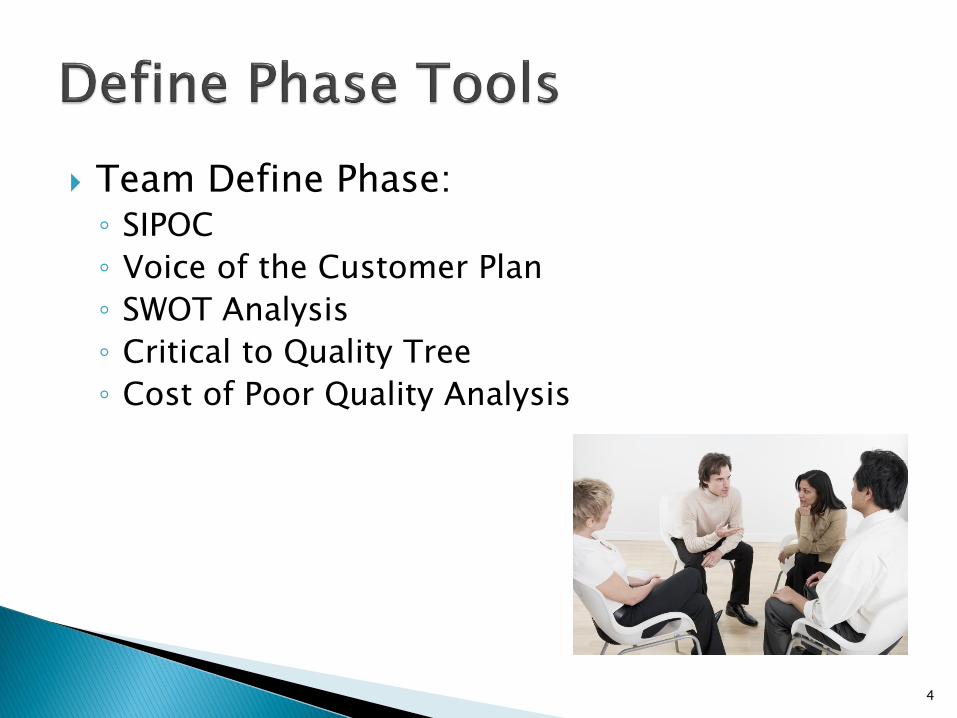
Team Define Phase:◦ SIPOC
◦ Voice of the Customer Plan
◦ SWOT Analysis
◦ Critical to Quality Tree
◦ Cost of Poor Quality Analysis
4
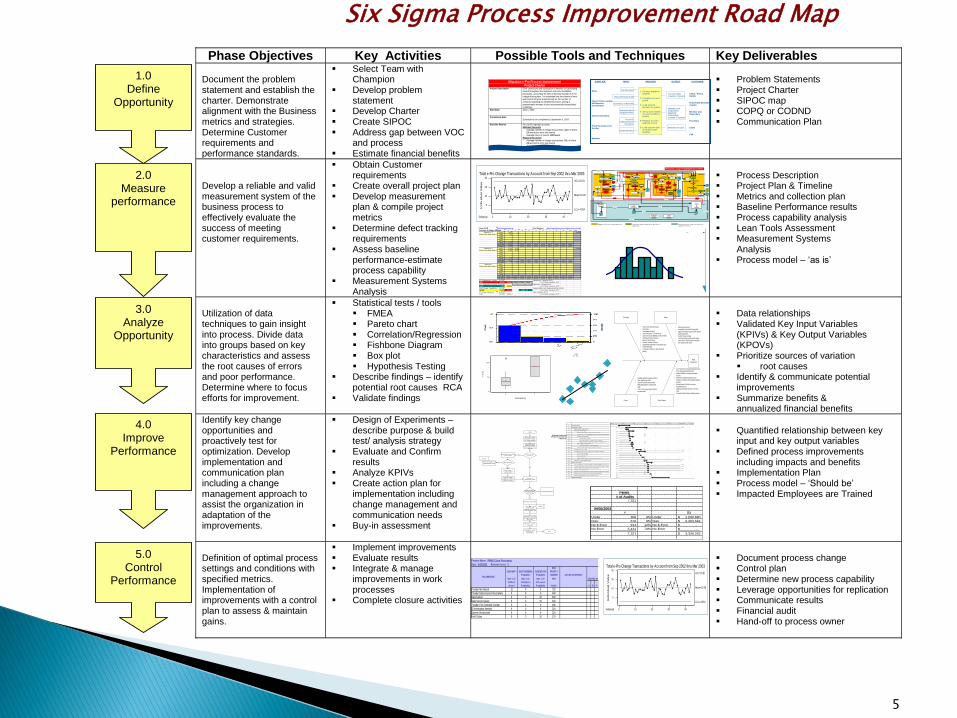
Phase Objectives Key Activities Possible Tools and Techniques Key Deliverables Document the problem statement and establish the charter. Demonstrate alignment with the Business metrics and strategies. Determine Customer requirements and performance standards.
▪ Select Team with Champion
▪ Develop problem statement
▪ Develop Charter ▪ Create SIPOC ▪ Address gap between VOC
and process ▪ Estimate financial benefits
▪ Problem Statements ▪ Project Charter ▪ SIPOC map ▪ COPQ or CODND ▪ Communication Plan
Develop a reliable and valid measurement system of the business process to effectively evaluate the success of meeting customer requirements.
▪ Obtain Customer requirements
▪ Create overall project plan ▪ Develop measurement
plan & compile project metrics
▪ Determine defect tracking requirements
▪ Assess baseline performance-estimate process capability
▪ Measurement Systems Analysis
▪ Process Description ▪ Project Plan & Timeline ▪ Metrics and collection plan ▪ Baseline Performance results ▪ Process capability analysis ▪ Lean Tools Assessment ▪ Measurement Systems
Analysis ▪ Process model – ‘as is’
Utilization of data techniques to gain insight into process. Divide data into groups based on key characteristics and assess the root causes of errors and poor performance. Determine where to focus efforts for improvement.
▪ Statistical tests / tools ▪ FMEA ▪ Pareto chart ▪ Correlation/Regression ▪ Fishbone Diagram ▪ Box plot ▪ Hypothesis Testing
▪ Describe findings – identify potential root causes RCA
▪ Validate findings
▪ Data relationships ▪ Validated Key Input Variables
(KPIVs) & Key Output Variables (KPOVs)
▪ Prioritize sources of variation ▪ root causes
▪ Identify & communicate potential improvements
▪ Summarize benefits & annualized financial benefits
Identify key change opportunities and proactively test for optimization. Develop implementation and communication plan including a change management approach to assist the organization in adaptation of the improvements.
▪ Design of Experiments – describe purpose & build test/ analysis strategy
▪ Evaluate and Confirm results
▪ Analyze KPIVs ▪ Create action plan for
implementation including change management and communication needs
▪ Buy-in assessment
▪ Quantified relationship between key
input and key output variables ▪ Defined process improvements
including impacts and benefits ▪ Implementation Plan ▪ Process model – ‘Should be’ ▪ Impacted Employees are Trained
Definition of optimal process settings and conditions with specified metrics. Implementation of improvements with a control plan to assess & maintain gains.
▪ Implement improvements ▪ Evaluate results ▪ Integrate & manage
improvements in work processes
▪ Complete closure activities
▪ Document process change ▪ Control plan ▪ Determine new process capability ▪ Leverage opportunities for replication ▪ Communicate results ▪ Financial audit ▪ Hand-off to process owner
1.0 Define
Opportunity
2.0 Measure
performance
3.0 Analyze
Opportunity
4.0 Improve
Performance
5.0 Control
Performance
5
Six Sigma Process Improvement Road Map
1
Migration e-Pro Process ImprovementProject Charter
Project Description Error corrections and clarification of benefits are generatingrework throughout the migration and case installationprocesses, accounting for 20% of the total number of e-Prochange transactions. It is estimated that the volume of errorand rework will grow proportionally as the number ofaccounts migrating by 1/1/2004 increases, driving aproportionate increase in cost and potentially dissatisfyingcustomers.
Start Date April 1, 2003
Completion DateScheduled to be completed by September 5, 2003
Baseline Metrics For 1/1/03 migrated accounts:National Accounts- Average number of change transactions: 14.3, of which
2.9 are due to error and rework- Average hours of rework: 309 hoursRegional Accounts- Average number of change transactions: 8.0, of which
1.6 are due to error and rework- Average hours of rework: 137 hours
Primary Metrics 1. Total e-Pro change transactions2. Percentage of change transactions due to error and
benefits clarification3. Average rework hours per error and benefits clarification
Secondary Metrics none
Goal Reduce error and rework in the migration process by 50%starting with 1/1/04 migrating accounts
Customer Customer migration survey results
Financial CODND (Cost of Doing Nothing Differently)4
th Qtr 2003: $500K
Year 2004: $2.5M
Ben
efits
Internal Productivity Estimated cycle time reduction of 18,868 hours (assuming195 accounts migrating 1/1/04).
Define April 1 – April 21, 2003
Plan Projects & Metrics April 14 – April 18, 2003
Baseline Project April 21 – May 2
Consider Lean Tools May12 – May 16, 2003
MSA May 19 – June 2, 2003
Wisdom of the Org. June 2 – June 6, 2003
Passive Analysis June 9 – June 20, 2003
Proactive Testing June 23 – August 4, 2003
Ph
as
e M
ilesto
nes
Control August 4 – September 5, 2003
SUPPLIER INPUT PROCESS OUTPUT CUSTOMER
Sales
Client / Policy HolderHR BenefitsCoordinator
Client Consultant
Third Party BenefitsVendor
Member
GO Decision
Policy Renewal Date
Summary of Benefits
AdministrativeRequirements
AccountOrganizational
Structure
Detail Benefits
Account DataLoaded in System
Member andDependentEligibilityInformationLoaded in System
Member ID Card
Client / PolicyHolder
Third Party BenefitsVendor
Member andDependent
Providers
Claim
Call
1. Conduct migration analysis
2. Complete account profile
3. Load account structure in system
4. Set up and validate account benefits in system
5. Produce account eligibility record
6. Load account data in product claim engines
0Subgroup 10 20 30 40
0
10
20
30
Ind
ivid
ua
l V
alu
e
Mean=10.98
UCL=26.81
LCL=-4.854
0
10
20
Mo
vin
g R
an
ge
1
R=5.952
UCL=19.45
LCL=0
Total e-Pro Change Transactions by Account from Sep 2002 thru Mar 2003Conduct
Analysis
Create Implementation
Guide
Expert Team
Meeting
Draft
EPRO
Draft
e-
PRO
Release e-PRO
Record
e-
PRO
Impl.
Guid
e
Update
EPRO
OK For
Release
to Vendor
Track
Systems
Loads
IMPLEMENTATION
ERW
From
Eligibilit
y
GO
Decisio
n
SALE
S
Set Up Client ID in
End State
Structure
Request
Codes
STRUCTURE
Complete
Structure
Inspection/Verify
with e-PRO
Get
Underwriting
Approval
Yes
No OK? Yes
No
Go back to
Rates
Structur
e in
CDB
No
Yes
Release
ATC
To Vendor
OK?
Review
Draft e-
PRORequest/Receive
Codes
Enrollmen
t File
CLIENT /CUSTOMERClient
Input
To Sales
Run Legislative
Tool
Check vs. e-
PRO
e-PRO
Redo?
Yes
No
YesOK?
Review
Draft
e-PROCreate
Codes
Legislative Tool
Review
BPC &
Class
Codes
To
Structure
BENEFITS
TS
ID Claim
Scenarios
Load Data into
Downstream
Systems
OK?Yes
No
Data
Engines
Loaded
(e.g ATC,
DocGen,
etc)
Test Scenarios
Check vs. e-
PRO
OK?No
Yes
Fix Claim
Errors
No
No
VOB
Yes
EPRO
Rework
CDB
From
Vendor
Member
cancelle
d
in
Legacy
Reformat
Client
Eligibility DataReview
Draft
EPRO
ELIGIBILITY
Receive Enrollment
Data
Match &
Merge
Load data in
CEO
Are
errors
resolve
d?
Fix Errors
YesNo Cancel
Member in
Legacy
Create
ERW
ERW
Eligibility
In CED
VENDO
R(ID
CARDS)
ID
Card
s
From
Benefit
s
Get
Underwriting
Approval
ERW To
Implementatio
n
ERW To
Implementatio
n
Create Client IDClient
ID
To
Structure,
Benefits,
and
Eligibility
Migration
Structure
Mapping Job
Aid
GO
Decision
To
Structure,
Benefits,
and
Eligibility
e-PRO
Rework
EPRO
Rework?
SMT linking
legacy
structure to
end state
To
Eligibility
CAIP
Processes shaded in green are specific to
migration
Processes out of scope, but critical to
Employer Services
Employer Services functional areas
OUT OF SCOPE
PROCESS STEPS
Production
Migration
Support
Cancel
Legacy
Structure
Elig.
Rework
e-Pro
Rework
Rework Loops highlighted in Red
10
100
50
0
Contracting
T4
-T1
PMHS
Overpayment
Process Data / Materials
PeopleTechnology
Ÿ Auth / Referral Info missing/incomplete/incorrect
Ÿ OI Info missing/incomplete/incorrect
Ÿ Member Eligibility Info missing/incomplete/
incorrect
Ÿ Benefit Info missing/incomplete/incorrect
Ÿ Provider Fee Schedule Info missing/incomplete/
incorrect
Ÿ Provider/Vendor TIN/SSN Info missing/
incomplete/incorrect
Ÿ Additional Information Necessary to Process
Claim
Ÿ Transaction/Codeset data excluded at gateway
Ÿ Standard Operating Procedures (SOPs)
Ÿ Claim Audit Process >$5K
Ÿ Second/Third Party Internal Review
(Medical Management, Claim Benefit
Build)
Ÿ iTrack - drives usage of paper reports to
sort older claims
Ÿ Skill Level of Processor
Ÿ Accessiblity of Site Coach/Training Staff
Ÿ Aggressive Productivity goals conflict with low
quality requirements
Ÿ Rushed Training Schedule
Ÿ Lack of up-training / reinforcement training
Ÿ Best Practice / Skill Training not conducted
Ÿ OJT training on SOP usage
Ÿ System Error During Processing
Ÿ Data Fallout
Ÿ Aurhorization Mis-Match
Ÿ System Restrictions - LPI Manual Calc
Ÿ Data Set Up Issues (eligibility, provider, benefits)
Ÿ Timeliness of Batch Processing
Ÿ Bank Acct Set-Up Delays
Ÿ Customer Touchpoints Delays
Ÿ Inappropriate assignment or missing hold codes
Ÿ Provider Mis-Match
Ÿ Transaction Limitations on data collected at
gateway
Manual Adjudication &
PMHS Provider Selection
- Manual
End
Manually check
provider/ vendor
on claim system
Check provider
data and claim
data against iView
image
Mismatch?Manually try to find
correct data
Found data
Correct data &
verify COB
Service request to
appropriate area
YES
NO
YES
iTrack
Verify in claim
screen and follow
COB Checklist
Attempt to
adjudicate claim
NO
Claim processed
Hold codes that
require further
research
NO
Re-open the claim
YES
Process will
depend on Hold
Code & SOP/ Job
Aid
CIRF
Attempt to resolve
all Hold Codes at a
line level
Resolve service
requests
Adjudicate claim
(manual or
systematic)
End
ID Task Name
1 DEFINE PHASE
12 MEASURE PHASE
13 Plan Project and Metrics
22 Baseline the Project
23 Select KPOV metric to track process output
24 Estimate process capability/performance at the 30,000-foot-level
25 Categorical failures
26 Create pareto chart
27 Rescope project to a large Pareto category
28 Repeat Baseline the Project steps 23 through 27
29 Non categorical failures
30 Revise estimate for COPQ/CODND
31 Project status update w ith executive sponsor
32 Consider Lean Tools
39 Conduct Measurement Systems Analysis (MSA)
40 Ensure data integrity
41 Perform Gauge R&R
42 Improve gauge
43 Project status update w ith executive sponsor
44 Wisdom of the Organization
55 ANALYZE PHASE
56 Use visualization of data techniques to gain insight to processes
57 Conduct inferential statistical tests and confidence interval calculations on individual KPOVs
58 Conduct appropriate sample size calculations
59 Conduct hypothesis tests
60 Describe statistical f indings to others using visualization of data techniques
61 Implement agreed-to process improvement findings
62 Project status update w ith executive sponsor
63 IMPROVE PHASE
65 d13 d
18 d
18 d
18 d
20 d
20 d
20 d
23 d
23 d
23 d
27 d
76 d33 d
69 d38 d
38 d
40 d
43 d
69 d48 d
61 d48 d
53 d
60 d53 d
60 d53 d
60 d53 d
60 d53 d
53 d
58 d
62 d
63 d
02 09 16 23 30 06 13 20 27 04 11 18 25 01 08 15 22 29 06 13 20 27 03 10 17 24 31 07 14 21 28 05
March April May June July August September Octob
PMHS
# of Audits
7,321
04/05/2003
# $'s
Under 300 4% Under 1,030,680$
Over 676 9% Over 2,303,562$
No $ Error 914 12% No $ Error -$
No Error 5,431 74% No Error -$
7,321 3,334,243$
A)SEVERITY B)OCCURRENCE
Probability
C)DETECTION
Probability
RISK
PRIORITY
NUMBER ACTION TO IMPROVE
Rate 1-10 Rate 1-10 Rate 1-10 RPN
10=Most
Severe
10=Highest
Probability
10=Lowest
Probability AxBxC A B C
Provider Mis-Match 10 8 9 720
Provider Data Incorrect/Incomplete 9 8 9 648
Data Fallout 9 6 10 540
Data Set Up Issues 9 6 10 540
Provider Fee Schedule Unclear 9 6 9 486
OI Information Needed 9 6 6 324
System Restrictions 6 6 9 324
Hold Codes 9 3 10 270
FAILURE MODE
Process Name: PMHS Claim Processing
Date: 6/30/2003 Revision Level: 3
REVISED VALUES
0Subgroup 10 20 30 40
0
10
20
30
In
div
idu
al
Valu
e
Mean=10.98
UCL=26.81
LCL=-4.854
0
10
20
Mo
vin
g R
an
ge
1
R=5.952
UCL=19.45
LCL=0
Total e-Pro Change Transactions by Account from Sep 2002 thru Mar 2003
Gage R&R http://www.aiag.org/ Part Number http://www.qimacros.com/free-lean-six-sigma-tips/aiag-msa-gage-r&r.html
Average & Range Method 1 2 3 4 5 6 7 8 9 10 Sum
Appraiser 1 Trial 1 0.65 1 3.250
Enter your data here-> Trial2 0.6 1
Trial3
Trial4
Trial 5
Total 1.25 2
Average-Appraiser 10.625 1 #N/A #N/A #N/A #N/A #N/A #N/A #N/A #N/A
Range1 0.05 0 #N/A #N/A #N/A #N/A #N/A #N/A #N/A #N/A
Appraiser 2 Trial 1 0.55 1.05 3.100
Enter your data here-> Trial2 0.55 0.95
Trial3
Trial4
Trial 5
Total 1.1 2
Average-Appraiser 20.55 1 #N/A #N/A #N/A #N/A #N/A #N/A #N/A #N/A
Range2 0 0.1 #N/A #N/A #N/A #N/A #N/A #N/A #N/A #N/A
Appraiser Trial 1
Enter your data here-> Trial2
Trial3
Trial4
Trial 5
Total
Average-Appraiser 3#N/A #N/A #N/A #N/A #N/A #N/A #N/A #N/A #N/A #N/A
Range3 #N/A #N/A #N/A #N/A #N/A #N/A #N/A #N/A #N/A #N/A
EV (Equipment Variation)0.0332 Equipment Variation (EV)
%EV 11.3% 39.9% # Parts #Trials #Ops % of Total Variation (TV)
AV: (Appraiser Variation)0.02066 2 2 2 Appraiser Variation(AV)
%AV 7.0% 24.8% % of Total Variation (TV)
R&R (Gage Capability) 0.0391 Repeatability and Reproducibility (R&R)
%R&R 13.3% 47.0% NDC 11 % of Total Variation (TV)
PV (Part Variation) 0.2917 Part Variation (PV)
%PV 99.1% 350% % of Total Variation (TV)
Skewness0.41Stdev1.670.20Max6.20
The files for each phase are on your zip drive
The list of files for each phase is contained in the Excel file designated as [Phase] 0 – File List for Phases
6
7
Some files to help identify and prioritize projects◦ Define 13 - Generating Six Sigma Project Ideas
◦ Define 1 - Project Selection Matrix or Define 20 -Project Prioritizer
◦ Generic Define 14 - Project Selection Process
8
Develop a project charter around a problem or opportunity that aligns with organizational ◦ priorities
◦ critical performance metrics
◦ strategies
9
Determine customer requirements and performance standards
Living document utilized by the team
Utilize a format which works for your organization
10
Problem Statement ◦ including pain to the organization
Goal Statement ◦ including key improvement measurement and
date
Project Scope
Deliverables
Business Case
Team Members
11
Problem Statement◦ The problem and pain with the current process
A difficulty in writing the problem statement is what is often called supposition of cause.◦ Example: My car wouldn’t start because the battery is dead
and I was late to work.
◦ Problem with that above statement: If an improvement team were assembled, they would start with the battery as the major variable due to the problem statement.
12
A better problem statement is:◦ My car wouldn’t start causing me to be late for work by 2
hours.
Breaking down the above problem statement:◦ Problem: My car wouldn’t start
◦ Pain: causing me to be late for work by 2 hours
◦ If an improvement team were assembled, they would start with the car as a whole and gather some data and do analysis to figure out which component is the critical variable.
13
Be sure you can measure the problem – this
will be the primary measurement to assess the
impact of the improvement!
What is the problem?◦ My car wouldn’t start…
Where does the problem occur?◦ …in my garage… (a clue?)
When does the problem occur?◦ …in the morning… (a clue?)
How big is the problem?◦ …at least twice a week causing me to be 2 hours late to
work.
How do I know it is a problem?◦ My car has started for the last 3.5 years with no
problem. (past reliability record)
14
Goal Statement◦ Describes the teams improvement objective
◦ Begins with words like “reduce”, “eliminate”, “improve” or “control”
◦ Example: Reduce rework in print shop orders by 25% by December 31, 2014.
15
Specific◦ What we want to improve
Measurable ◦ What metric are we using?
Aggressive and Achievable ◦ Is this a stretch goal? Can we realistically
accomplish this?
Relevant ◦ To the problem at hand?
Time-bound◦ By what date?
16
Project Scope◦ Answers the following questions for the team:
Where does the process under investigation start? (List a specific step)
Where does the process stop? (A specific step)
What is inside of the project scope?
What is outside of the project scope?
17
Project Scope Examples:◦ Process Start: When print shop receives a hard copy of
order in hand
◦ Process Stop: When shipping ticket for order is
completed
◦ In-Scope: All internal customer orders
◦ Out of Scope: All external customer orders
18
Project Deliverables◦ Describes the teams long term, end results for
the project
◦ Are “works in progress” and may change over the course of the project
◦ Are not solutions for improvement
19
Ask these questions when developing the Project Deliverables◦ What end result(s) do you expect to achieve from
this project?
◦ What end result(s) does your steering committee and/or champion expect the team to achieve from this project?
◦ How do these expectations match your goal statement?
◦ Example: Documented improved process map for communication tool
20
Business Case◦ A good business case will answer the following
questions:➢ Why is the project worth doing?
➢ Why is it important to do now?
➢ What are the consequences of not doing this project?
➢ What activities have higher or equal priority?
21
Business Case◦ Connects the project to the Strategic Objectives
of the Organization➢ How will this project drive business initiatives and goals?
➢ Impact internal customers? external customers?
shareholders?
➢ What are the expected financial benefits?
• Example: By reducing our rework by 20%, customer satisfaction will increase by an estimated 85%. This will result in increased project demand and an additional $ 1.2 million of margin for 2014.
22
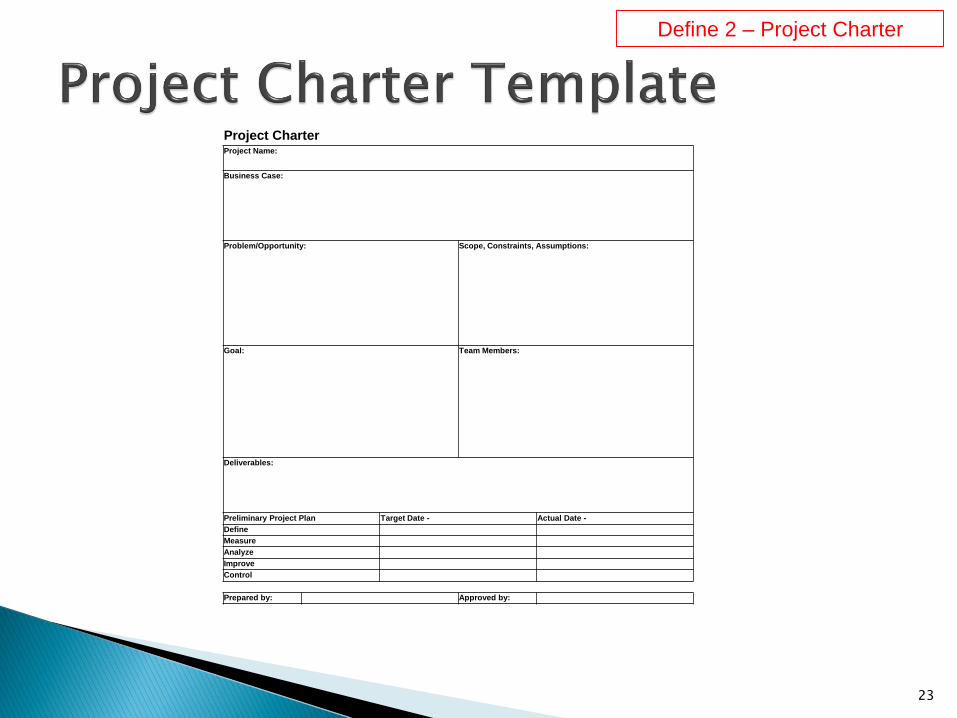
Project CharterProject Name:
Business Case:
Problem/Opportunity: Scope, Constraints, Assumptions:
Goal: Team Members:
Deliverables:
Preliminary Project Plan Target Date - Actual Date -
Define
Measure
Analyze
Improve
Control
Prepared by: Approved by:
23
Define 2 – Project Charter
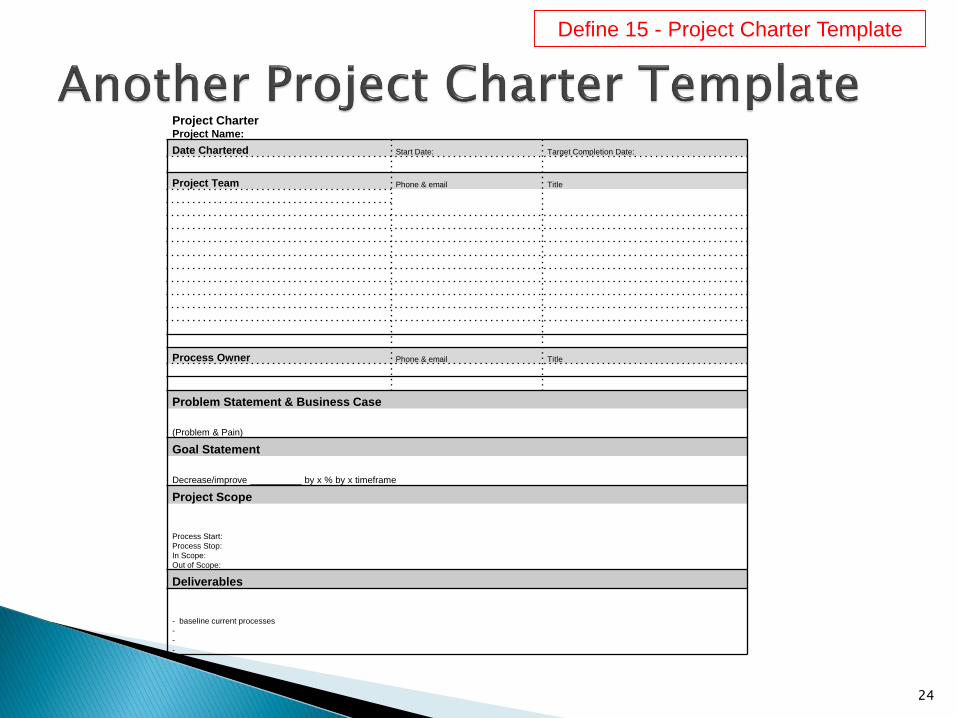
Project CharterProject Name:
Date Chartered Start Date: Target Completion Date:
Project Team Phone & email Title
Process Owner Phone & email Title
Problem Statement & Business Case
(Problem & Pain)
Goal Statement
Decrease/improve __________ by x % by x timeframe
Project Scope
Process Start:
Process Stop:
In Scope:
Out of Scope:
Deliverables
- baseline current processes
-
-
-
24
Define 15 - Project Charter Template

25
Graphical representation of the major steps of the process to be improved
Generally no more than 3 to 6 steps
Helps to determine who is involved in executing the process
Helps to determine who should be on the team as process front-liners
26
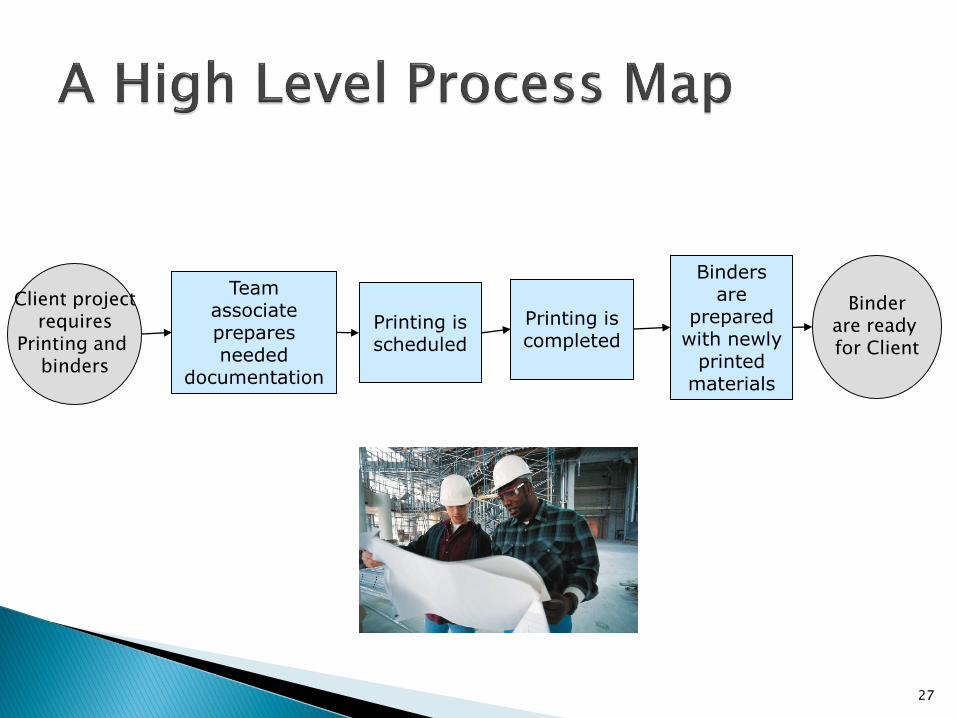
Printing is scheduled
Team associate prepares needed
documentation
Client projectrequires
Printing and binders
Binderare ready for Client
Binders are
prepared with newly
printed materials
Printing is completed
27
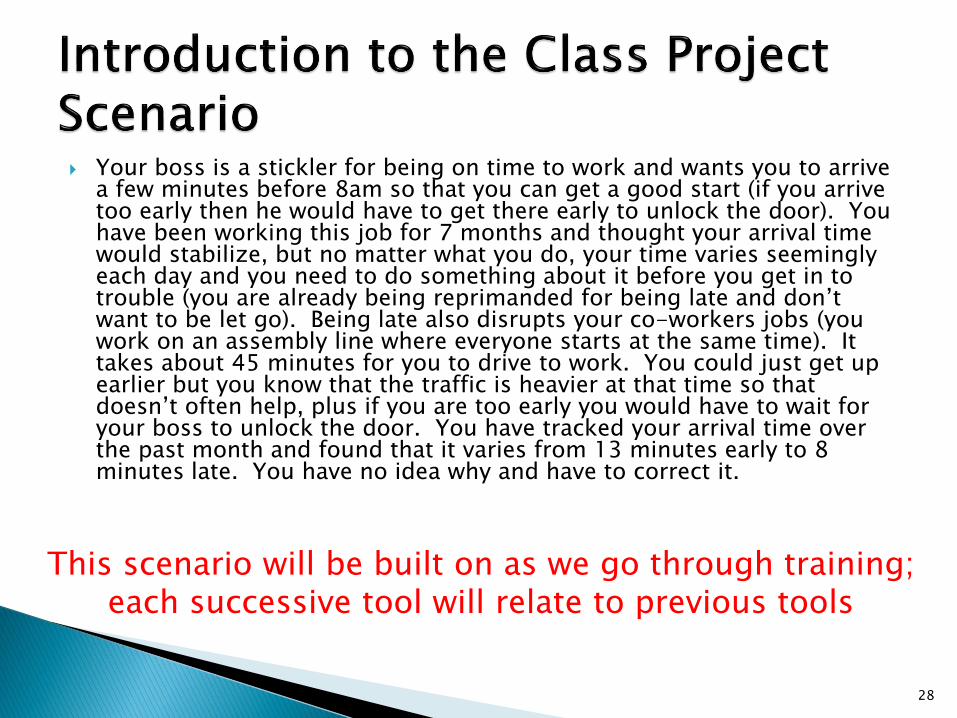
Your boss is a stickler for being on time to work and wants you to arrive a few minutes before 8am so that you can get a good start (if you arrive too early then he would have to get there early to unlock the door). You have been working this job for 7 months and thought your arrival time would stabilize, but no matter what you do, your time varies seemingly each day and you need to do something about it before you get in to trouble (you are already being reprimanded for being late and don’t want to be let go). Being late also disrupts your co-workers jobs (you work on an assembly line where everyone starts at the same time). It takes about 45 minutes for you to drive to work. You could just get up earlier but you know that the traffic is heavier at that time so that doesn’t often help, plus if you are too early you would have to wait for your boss to unlock the door. You have tracked your arrival time over the past month and found that it varies from 13 minutes early to 8 minutes late. You have no idea why and have to correct it.
This scenario will be built on as we go through training; each successive tool will relate to previous tools
28
As a class, develop a 3-6 step Macro Map for the class exercise◦ Be sure to identify the start and finish steps of the
process
◦ This Macro Map will be used later when developing the “SIPOC” to help scope the process and understand the suppliers and customers of the process
◦ Take 5 minutes for this exercise and use sticky notes on the wall or a white board
29
30
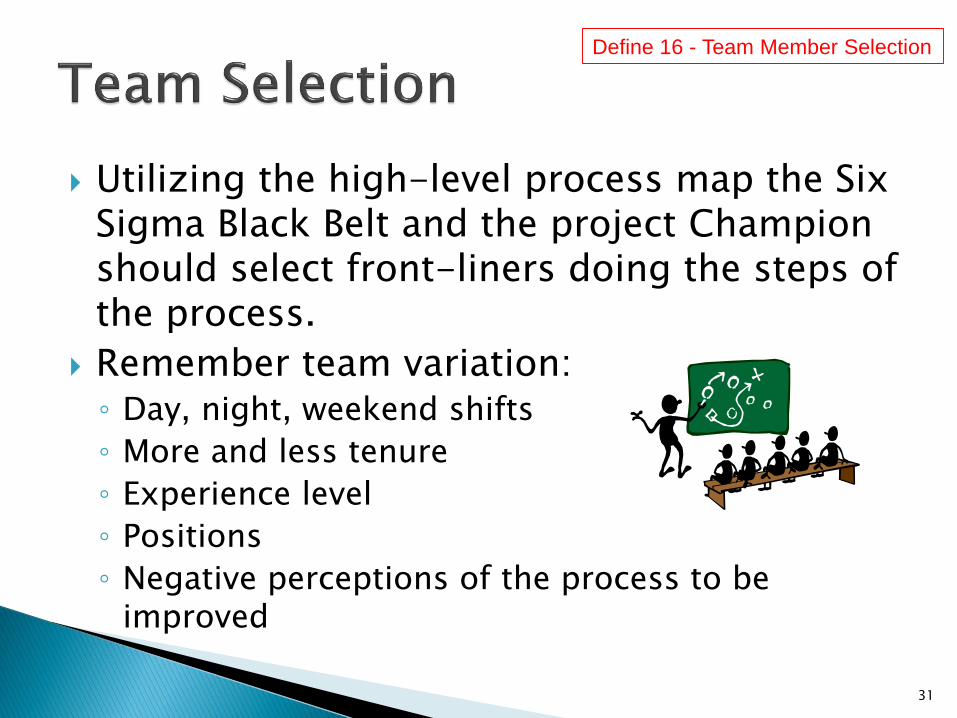
Utilizing the high-level process map the Six Sigma Black Belt and the project Champion should select front-liners doing the steps of the process.
Remember team variation: ◦ Day, night, weekend shifts
◦ More and less tenure
◦ Experience level
◦ Positions
◦ Negative perceptions of the process to be improved
31
Define 16 - Team Member Selection
Team selection invitations should be delivered by the Project Champion to the team members director and receive their approval of the team members participation
Team members should be invited personally by the Project Champion or Black Belt
Have meeting dates and times readily available for the team member
32
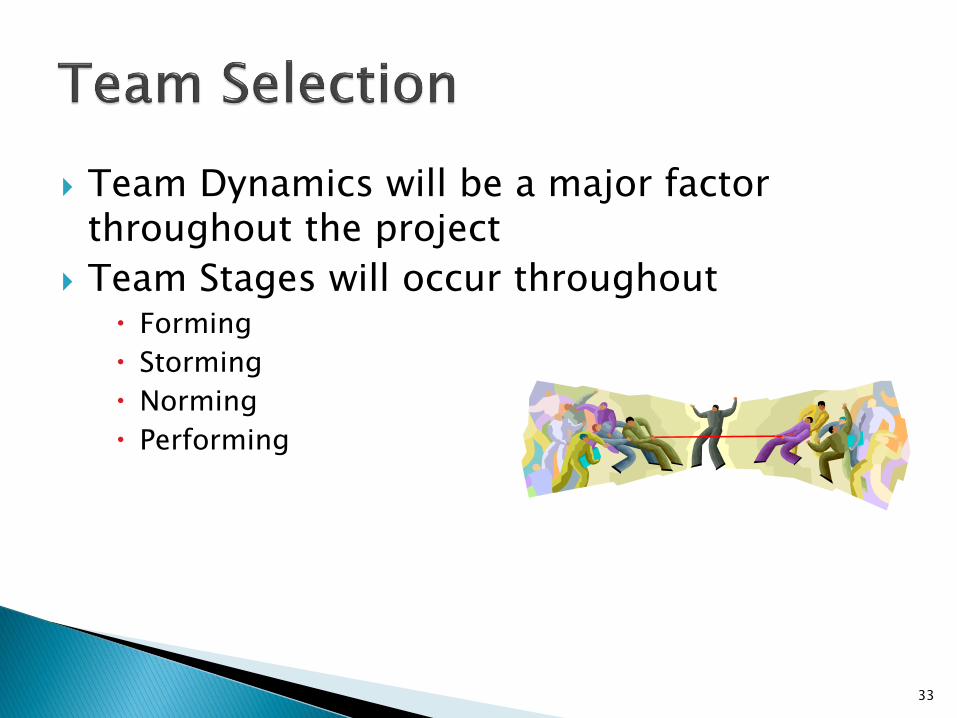
Team Dynamics will be a major factor throughout the project
Team Stages will occur throughout Forming
Storming
Norming
Performing
33

➢ Be sure to identify the Process Owner when selecting team members.
➢ The process owner is responsible for maintaining the improved process once in the control phase.
➢ Start the team with the end in mind with every project
34
From your completed pre-work: Utilize either a paper or Excel version of the Project Charter to list the following critical project components:
1. Problem Statement
2. Goal Statement
3. Scope
4. Business Case
5. Deliverables
6. Team Member Roles
35
We will report out. Don’t be concerned if you don’t have a project
yet – this is a listen and learn exercise
Use the Define 2 – Project Charter Template in your Define Phase Files to complete the Charter on the Class Project Scenario
1. Problem Statement
2. Goal Statement
3. Scope
4. Business Case
5. Deliverables
6. Team Member Roles
Take 10 minutes for this exercise; be prepared to spend 5 minutes in class discussion
36
37
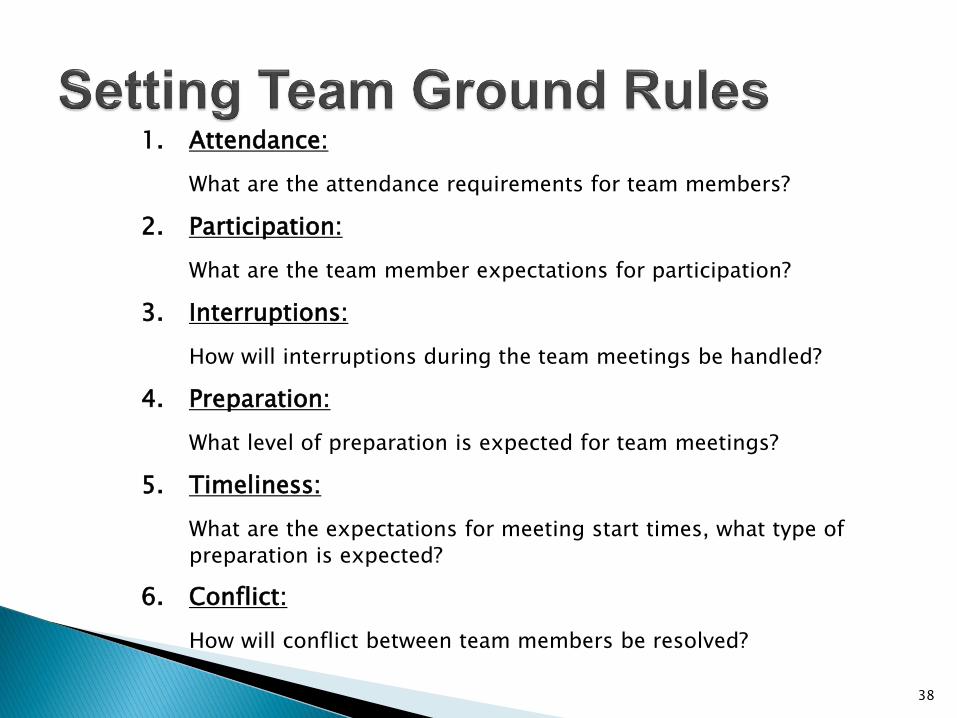
1. Attendance:
What are the attendance requirements for team members?
2. Participation:
What are the team member expectations for participation?
3. Interruptions:
How will interruptions during the team meetings be handled?
4. Preparation:
What level of preparation is expected for team meetings?
5. Timeliness:
What are the expectations for meeting start times, what type of
preparation is expected?
6. Conflict:
How will conflict between team members be resolved?
38
39
Review the Champion prepared Project Charter with the Team
Discuss the purpose of the Project Charter with the team
Allow time to discuss the project charter to make sure everyone is comfortable with the project problem & pain, goal statement, parameters and deliverables
40
Confirm with the team that the project parameters: ◦ process to be improved start step & stop step
◦ in-scope and out of scope variables
Discuss the purpose and that the Project Charter is a living document to be utilized by the team throughout the project
41
Vote on any amendments and communicate changes back to Project Champion for their approval (utilize consensus decision making)
Normally any project changes will involve scoping the process
Be prepared if you scope the project down to address the scoped out items in the full scale implementation
42
43
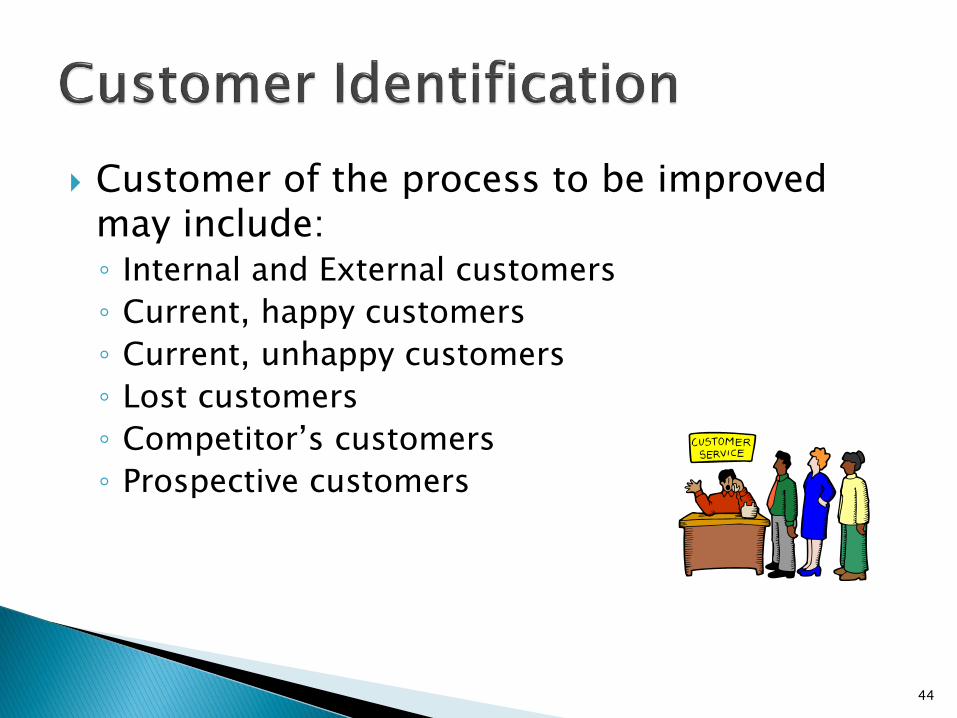
Customer of the process to be improved may include:◦ Internal and External customers
◦ Current, happy customers
◦ Current, unhappy customers
◦ Lost customers
◦ Competitor’s customers
◦ Prospective customers
44
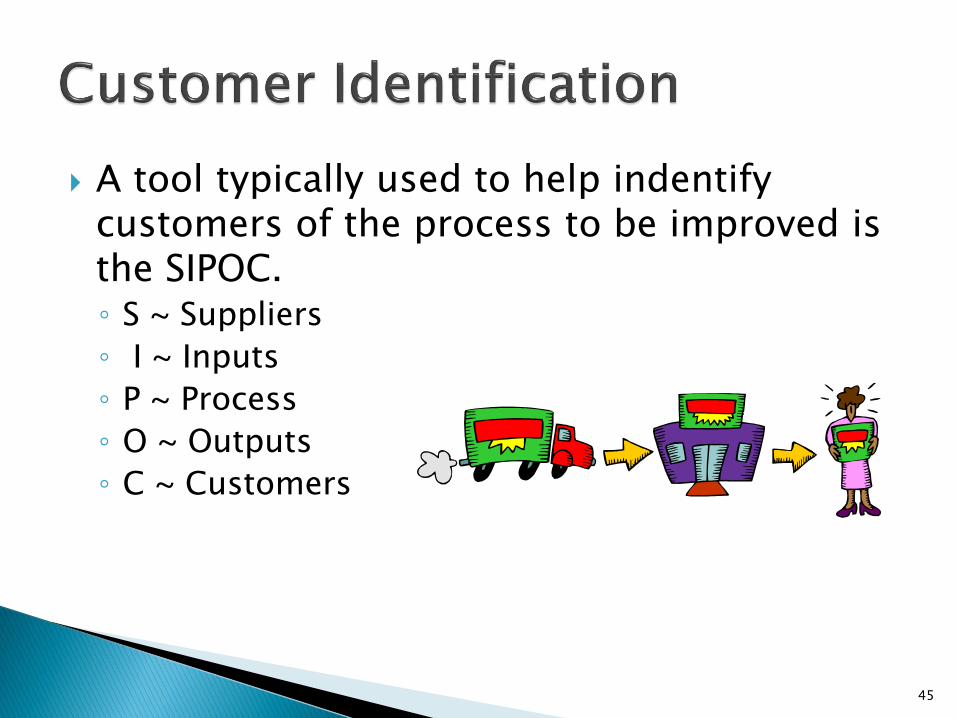
A tool typically used to help indentify customers of the process to be improved is the SIPOC.◦ S ~ Suppliers
◦ I ~ Inputs
◦ P ~ Process
◦ O ~ Outputs
◦ C ~ Customers
45
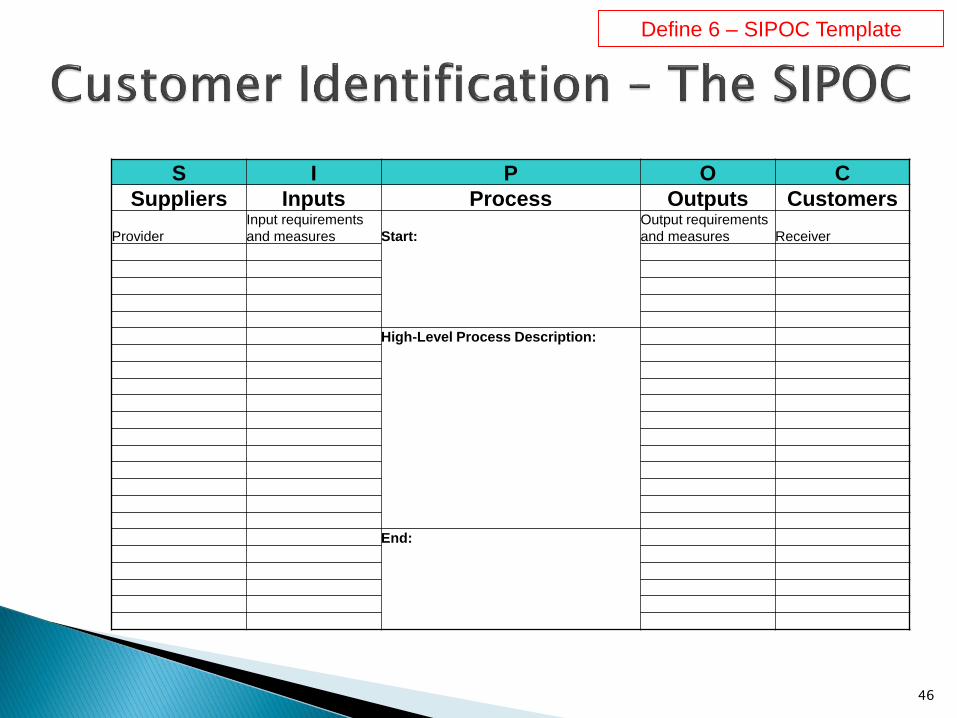
S I P O C
Suppliers Inputs Process Outputs Customers
Provider
Input requirements
and measures Start:
Output requirements
and measures Receiver
High-Level Process Description:
End:
46
Define 6 – SIPOC Template
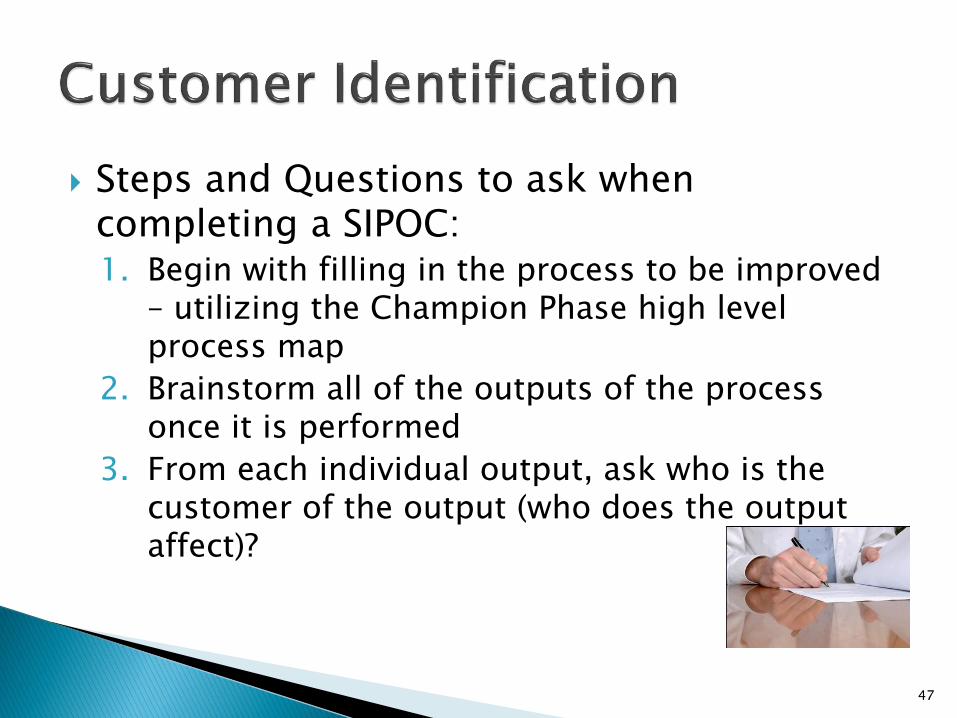
Steps and Questions to ask when completing a SIPOC:1. Begin with filling in the process to be improved
– utilizing the Champion Phase high level process map
2. Brainstorm all of the outputs of the process once it is performed
3. From each individual output, ask who is the customer of the output (who does the output affect)?
47
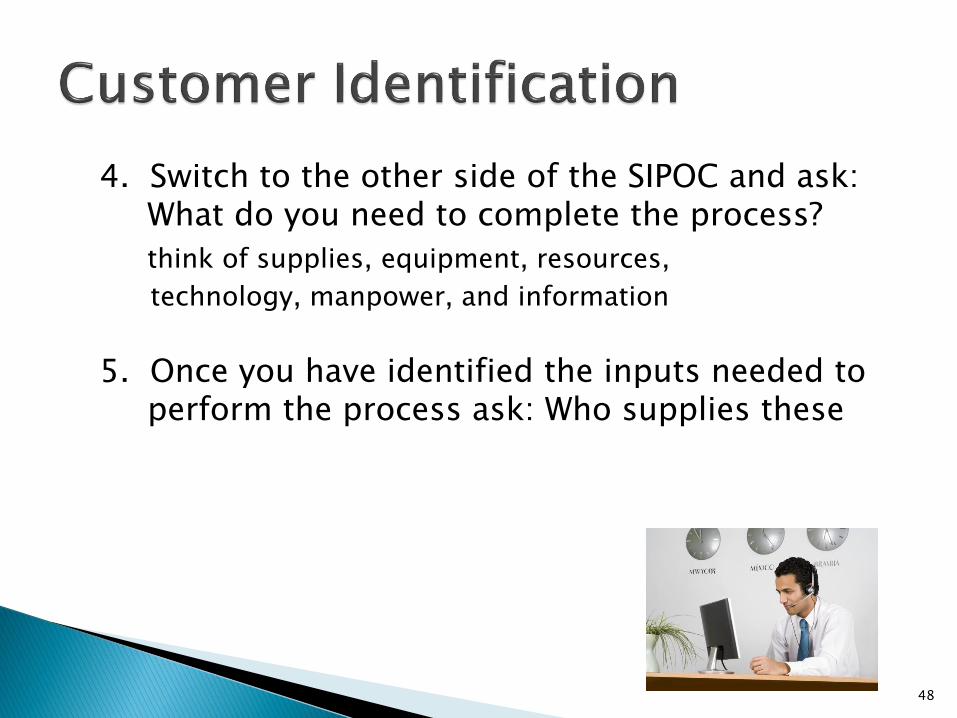
4. Switch to the other side of the SIPOC and ask: What do you need to complete the process?
think of supplies, equipment, resources,
technology, manpower, and information
5. Once you have identified the inputs needed to perform the process ask: Who supplies these
48
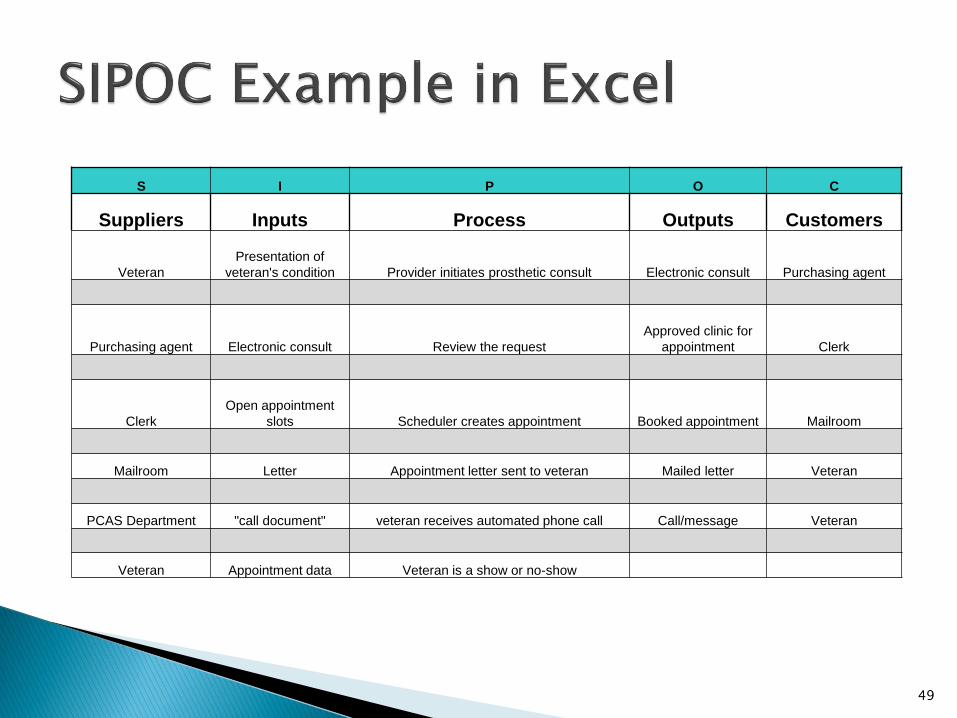
S I P O C
Suppliers Inputs Process Outputs Customers
Veteran
Presentation of
veteran's condition Provider initiates prosthetic consult Electronic consult Purchasing agent
Purchasing agent Electronic consult Review the request
Approved clinic for
appointment Clerk
Clerk
Open appointment
slots Scheduler creates appointment Booked appointment Mailroom
Mailroom Letter Appointment letter sent to veteran Mailed letter Veteran
PCAS Department "call document" veteran receives automated phone call Call/message Veteran
Veteran Appointment data Veteran is a show or no-show
49
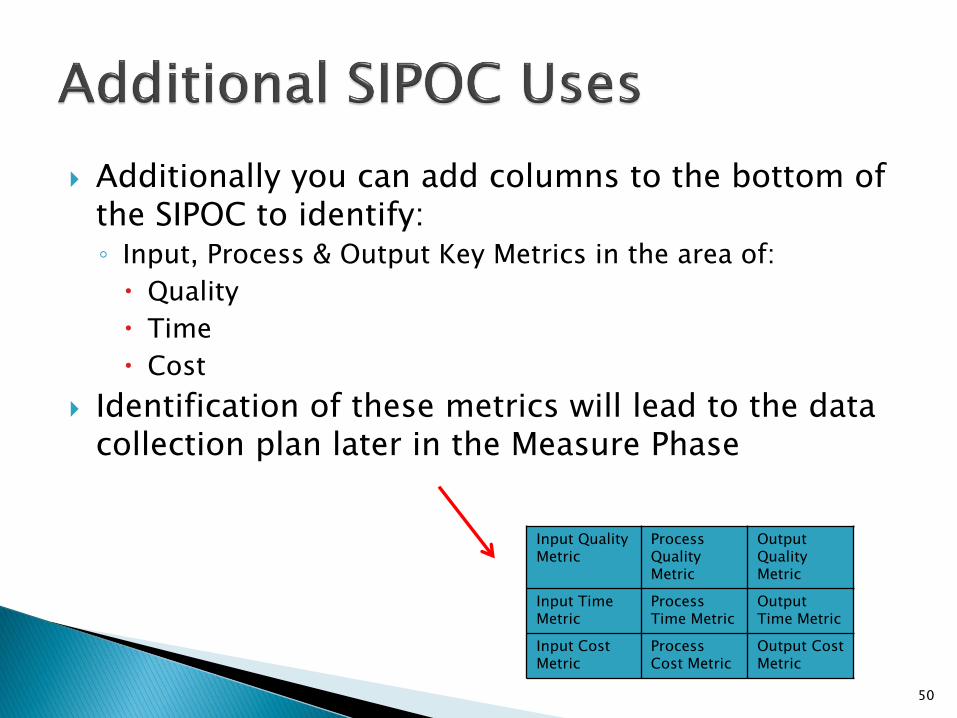
Additionally you can add columns to the bottom of the SIPOC to identify:◦ Input, Process & Output Key Metrics in the area of:
Quality
Time
Cost
Identification of these metrics will lead to the data collection plan later in the Measure Phase
Input QualityMetric
Process QualityMetric
Output QualityMetric
Input Time Metric
Process Time Metric
Output Time Metric
Input Cost Metric
Process Cost Metric
Output Cost Metric
50
Stakeholders consist of any customer or supplier of the process that may be impacted by the improved project implementation
For non-team stakeholders it is recommended that:◦ Communicate with them early and often
◦ Work to get early buy-in on results
◦ Request regular input
51
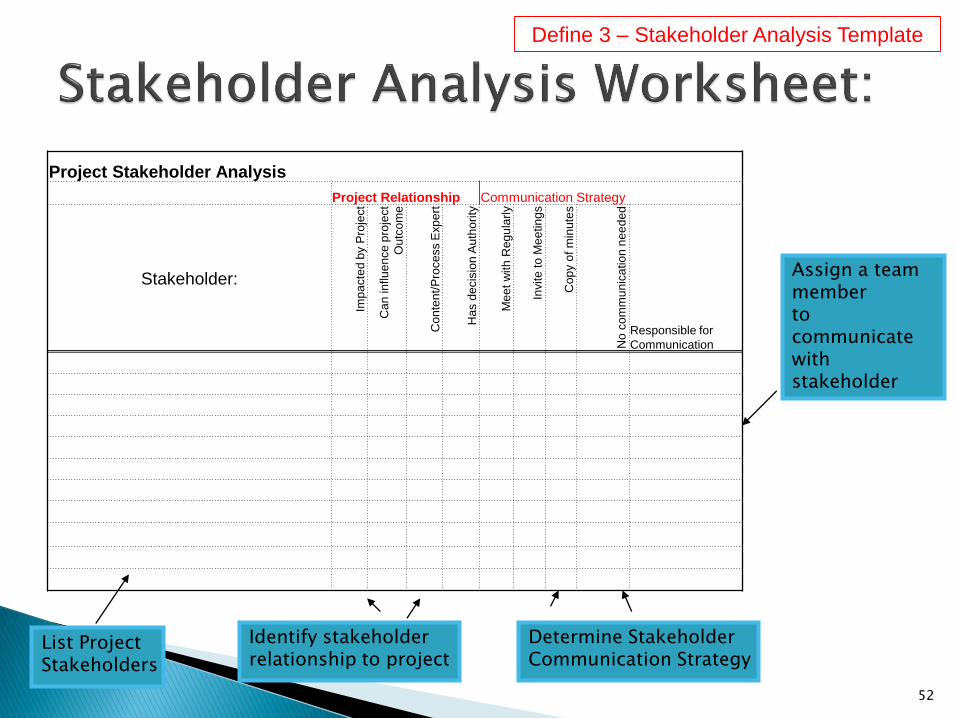
List Project Stakeholders
Identify stakeholder relationship to project
Determine StakeholderCommunication Strategy
Assign a team memberto communicate withstakeholder
Project Stakeholder Analysis
Project Relationship Communication Strategy
Stakeholder:
Imp
acte
d b
y P
roje
ct
Can
in
flu
en
ce
pro
ject
Ou
tco
me
Con
ten
t/P
roce
ss E
xp
ert
Has d
ecis
ion
Au
tho
rity
Me
et
with
Reg
ula
rly
Invite
to
Me
etin
gs
Cop
y o
f m
inu
tes
No c
om
mu
nic
atio
n n
ee
de
d
Responsible for
Communication
52
Define 3 – Stakeholder Analysis Template
Use the stakeholder template (Define 3) as a guide to develop an analysis for the Class Project Scenario as a class (5 minutes)◦ Remember that there are project AND
communication relationships on any improvement effort
53
54
Why?◦ We need to understand how our customers feel or
look at the current process.
◦ It’s strengths, weaknesses, opportunities for improvements and threats to the organization if we don’t improve the process
55
Surveys
Focus Groups
Interviews
Complaint systems
Market research
Shopper programs
56
Customer scorecards
Data warehousing
Customer audits
Quality function deployment
57
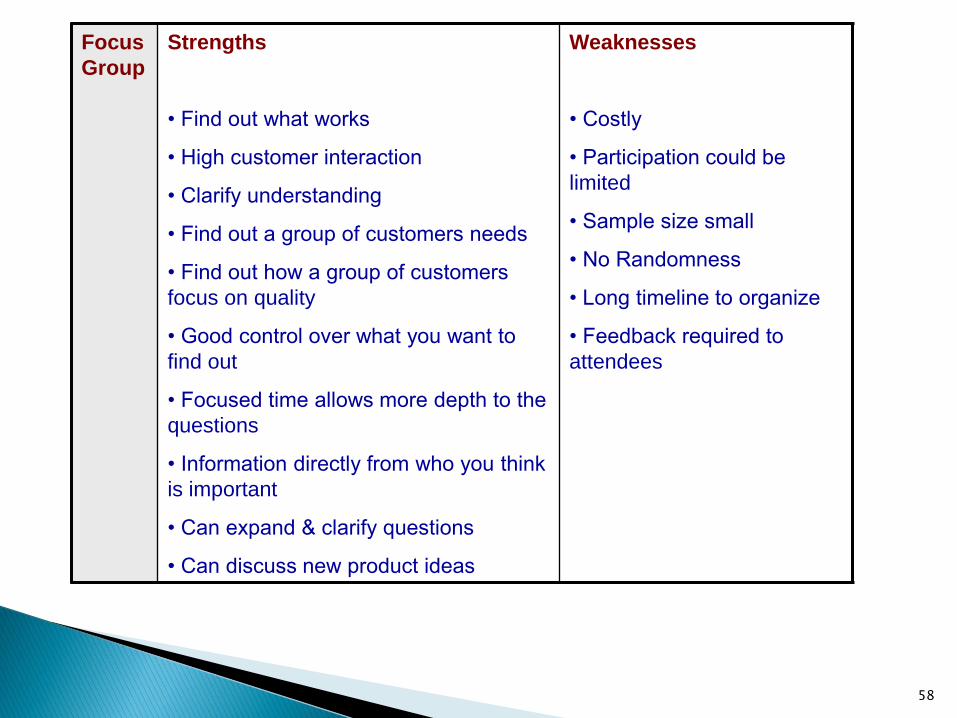
Focus
Group
Strengths
• Find out what works
• High customer interaction
• Clarify understanding
• Find out a group of customers needs
• Find out how a group of customers
focus on quality
• Good control over what you want to
find out
• Focused time allows more depth to the
questions
• Information directly from who you think
is important
• Can expand & clarify questions
• Can discuss new product ideas
Weaknesses
• Costly
• Participation could be
limited
• Sample size small
• No Randomness
• Long timeline to organize
• Feedback required to
attendees
58
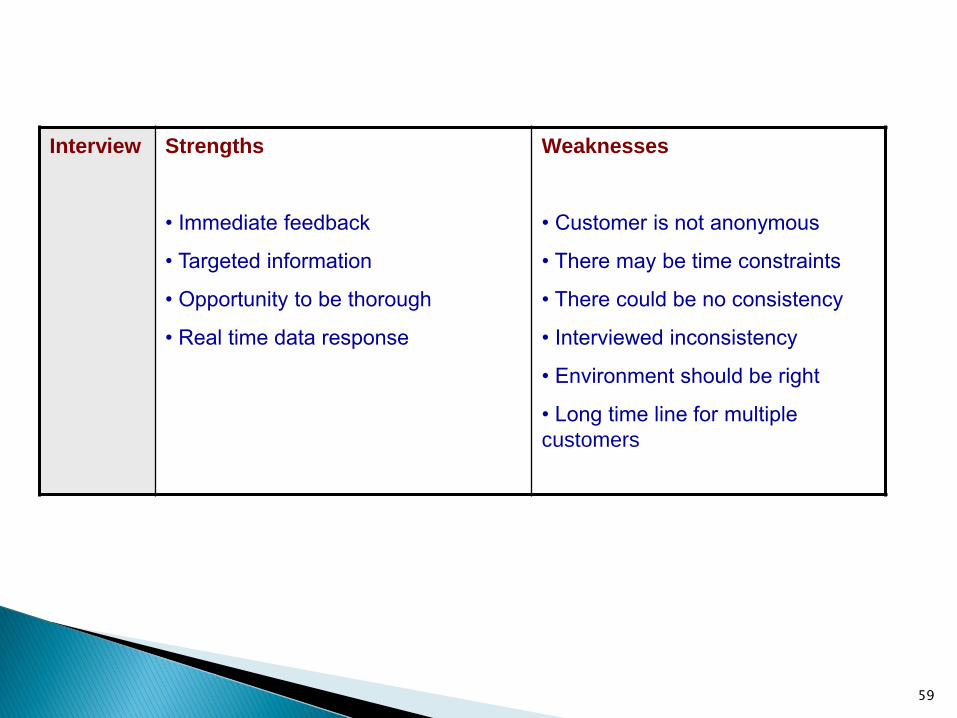
Interview Strengths
• Immediate feedback
• Targeted information
• Opportunity to be thorough
• Real time data response
Weaknesses
• Customer is not anonymous
• There may be time constraints
• There could be no consistency
• Interviewed inconsistency
• Environment should be right
• Long time line for multiple
customers
59

Customer
Observation
Strengths
• Real time
• Leads to new information
• Identify process weaknesses
• Customer part of process
Weaknesses
• Customer time commitment
• May be intrusive to customer
• Observer Biasness
• You could interfere with customer
• Long time line for multiple customers
60
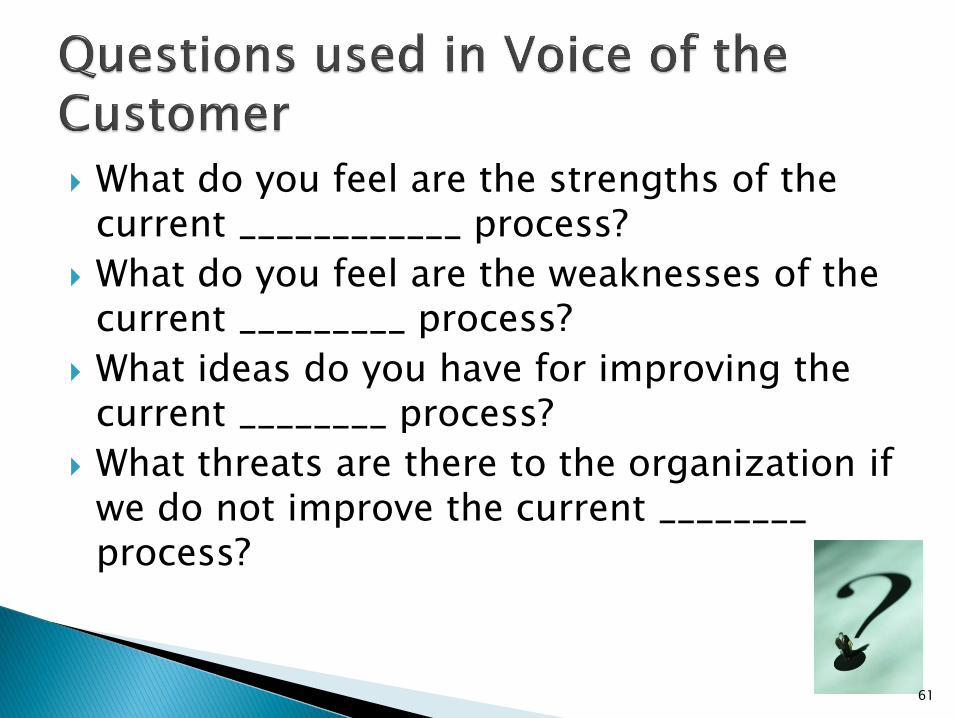
What do you feel are the strengths of the current ____________ process?
What do you feel are the weaknesses of the current _________ process?
What ideas do you have for improving the current ________ process?
What threats are there to the organization if we do not improve the current ________ process?
61
An analysis tool to gather all Voice of the Customer feedback in one place
Allows the team to see trends in Voice of the Customer feedback
Will drive information to the Critical to Quality (CTQ) Tree
62
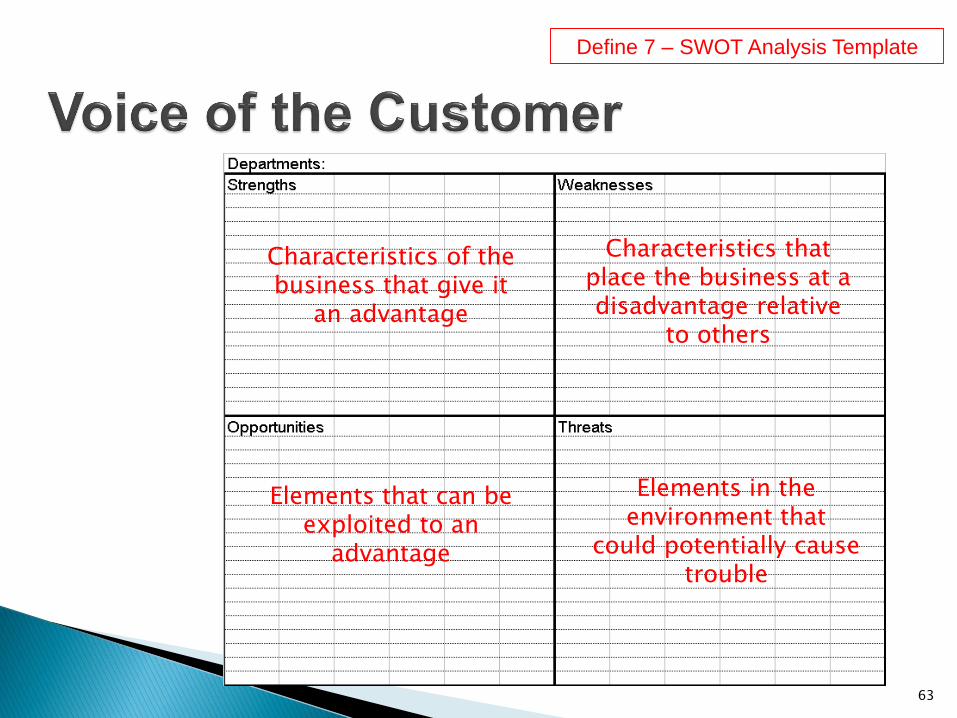
Characteristics of the business that give it
an advantage
Characteristics that place the business at a disadvantage relative
to others
Elements that can be exploited to an
advantage
Elements in the environment that
could potentially cause trouble
63
Define 7 – SWOT Analysis Template
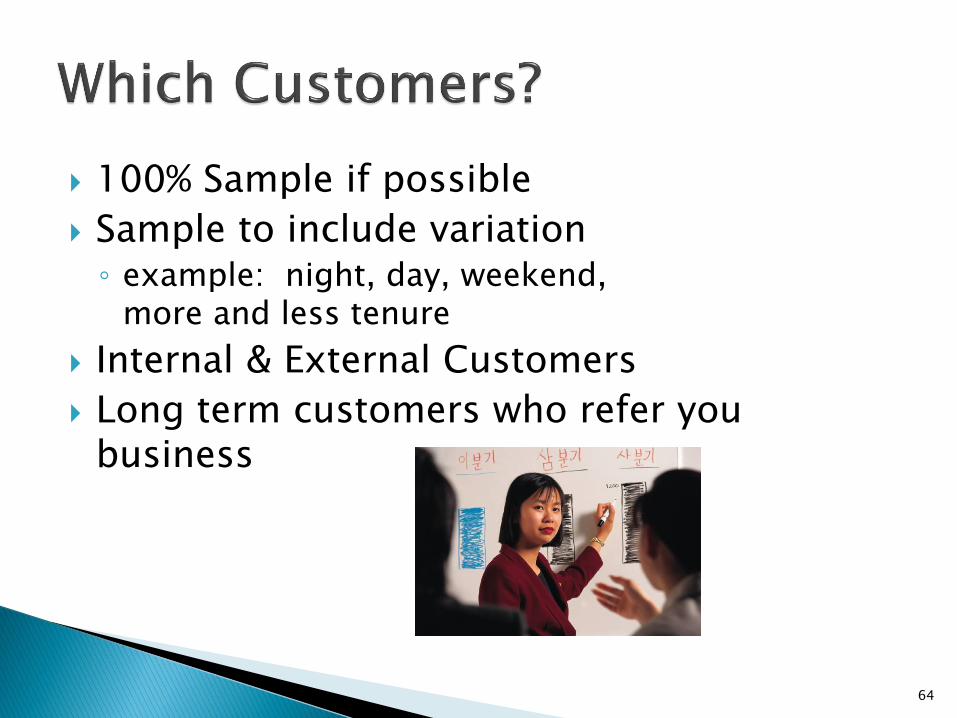
100% Sample if possible
Sample to include variation◦ example: night, day, weekend,
more and less tenure
Internal & External Customers
Long term customers who refer you business
64
65
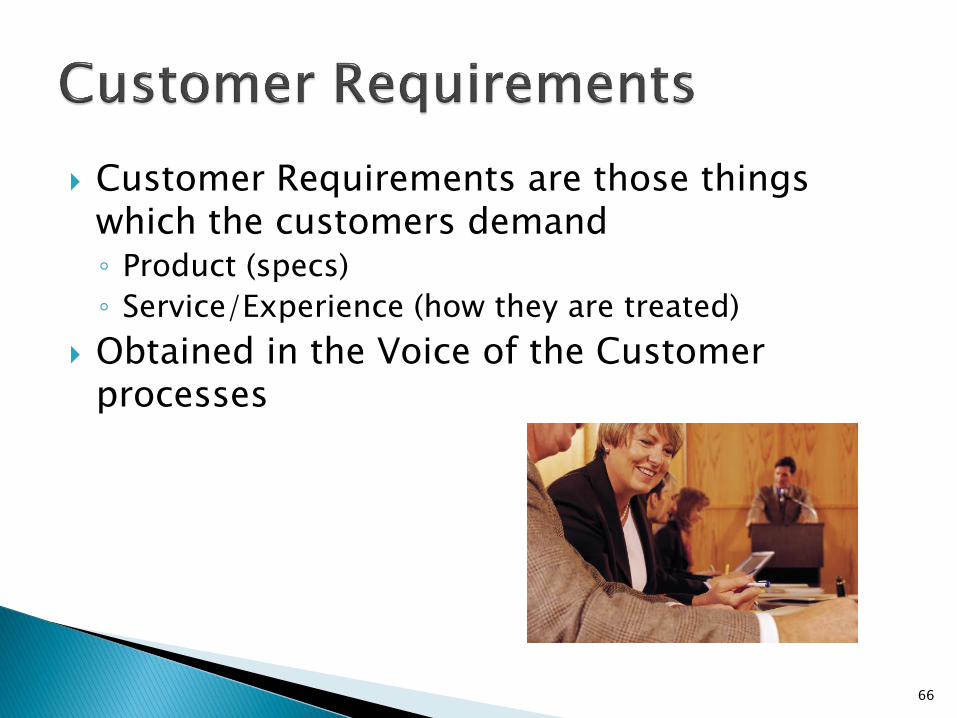
Customer Requirements are those things which the customers demand◦ Product (specs)
◦ Service/Experience (how they are treated)
Obtained in the Voice of the Customer processes
66
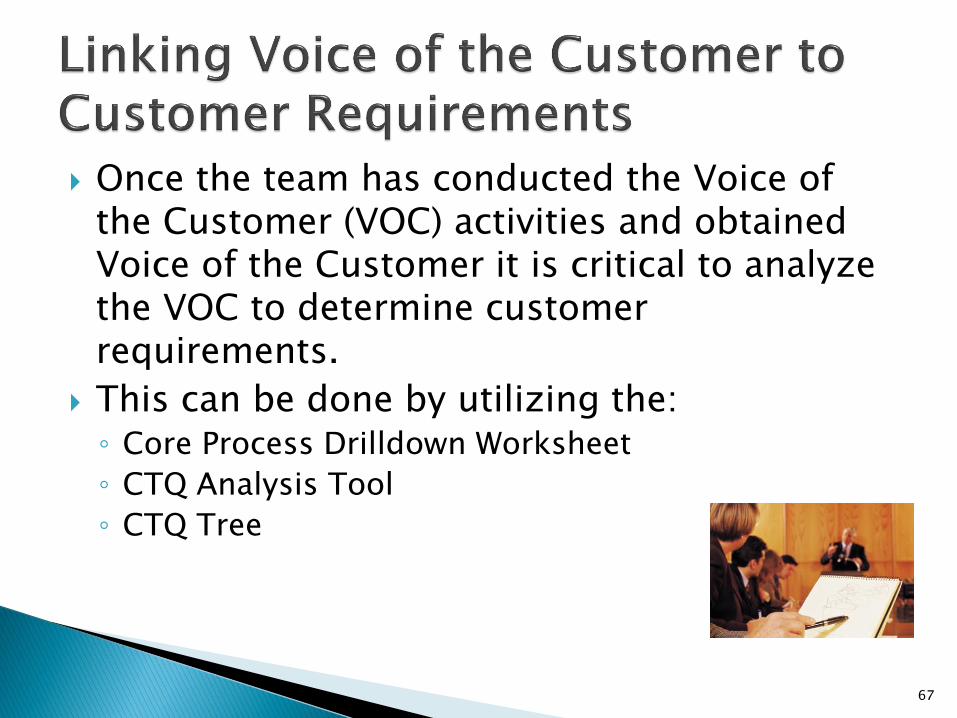
Once the team has conducted the Voice of the Customer (VOC) activities and obtained Voice of the Customer it is critical to analyze the VOC to determine customer requirements.
This can be done by utilizing the:◦ Core Process Drilldown Worksheet
◦ CTQ Analysis Tool
◦ CTQ Tree
67
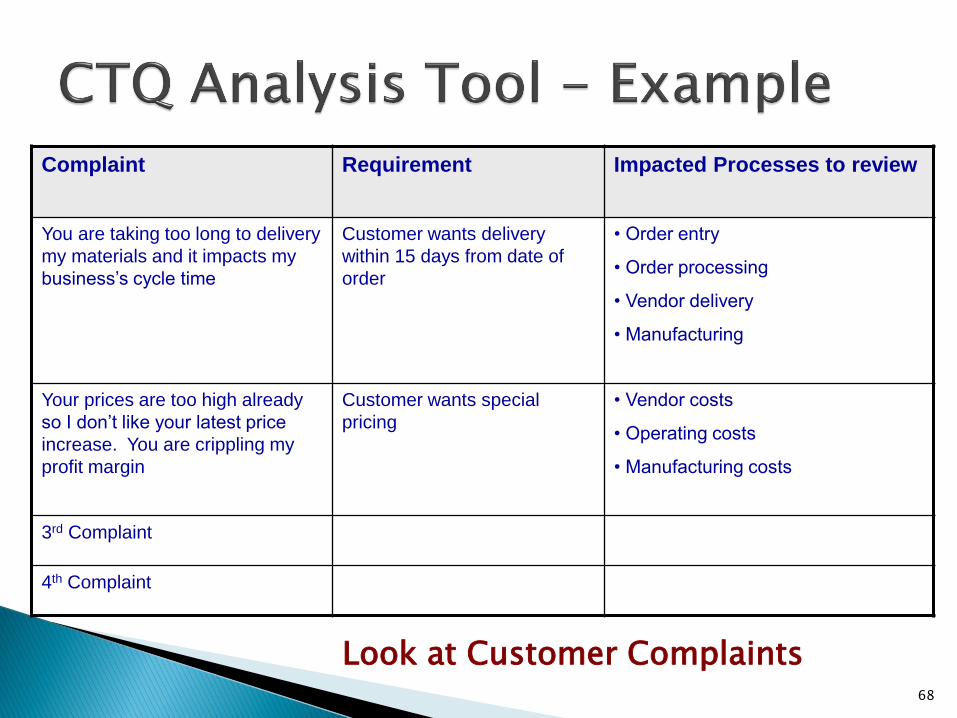
Complaint Requirement Impacted Processes to review
You are taking too long to delivery
my materials and it impacts my
business’s cycle time
Customer wants delivery
within 15 days from date of
order
• Order entry
• Order processing
• Vendor delivery
• Manufacturing
Your prices are too high already
so I don’t like your latest price
increase. You are crippling my
profit margin
Customer wants special
pricing
• Vendor costs
• Operating costs
• Manufacturing costs
3rd Complaint
4th Complaint
Look at Customer Complaints68
Used to link the Customer CTQs from the SIPOC diagram to the KPOVs and KPIVs that will be measured in the process
◦ CTQ = Critical to Quality
◦ KPOV = Key Process Output Variable
◦ KPIV = Key Process Input Variable
69
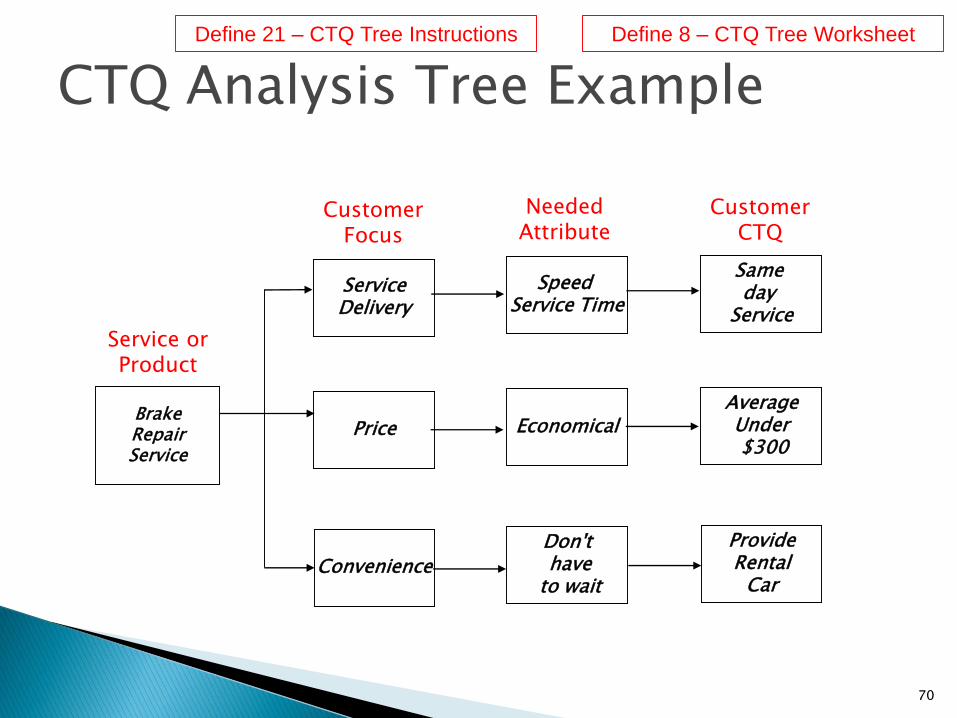
BrakeRepairService
ServiceDelivery
Price
Convenience
Speed Service Time
Economical
Don'thave
to wait
Same day
Service
AverageUnder$300
ProvideRental
Car
CTQ Analysis Tree Example
Service or Product
Customer Focus
Needed Attribute
CustomerCTQ
70
Define 8 – CTQ Tree WorksheetDefine 21 – CTQ Tree Instructions
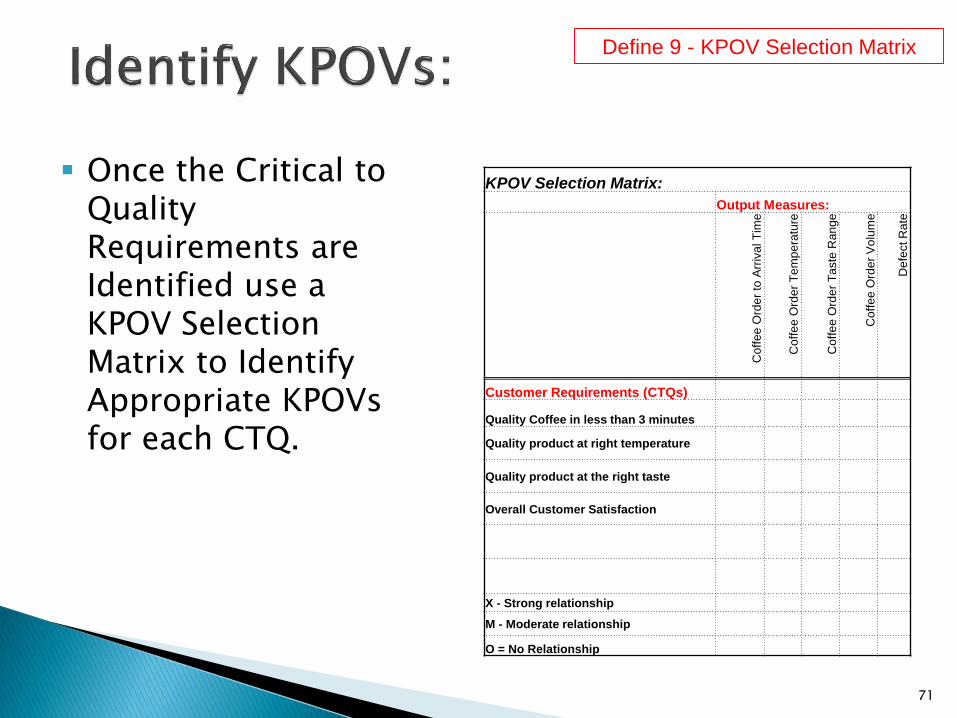
▪ Once the Critical to Quality Requirements are Identified use a KPOV Selection Matrix to Identify Appropriate KPOVs for each CTQ.
KPOV Selection Matrix:
Output Measures:
Coff
ee
Ord
er
to A
rriv
al T
ime
Coff
ee
Ord
er
Te
mp
era
ture
Coff
ee
Ord
er
Ta
ste
Ran
ge
Coff
ee
Ord
er
Vo
lum
e
Defe
ct R
ate
Customer Requirements (CTQs)
Quality Coffee in less than 3 minutes
Quality product at right temperature
Quality product at the right taste
Overall Customer Satisfaction
X - Strong relationship
M - Moderate relationship
O = No Relationship
71
Define 9 - KPOV Selection Matrix
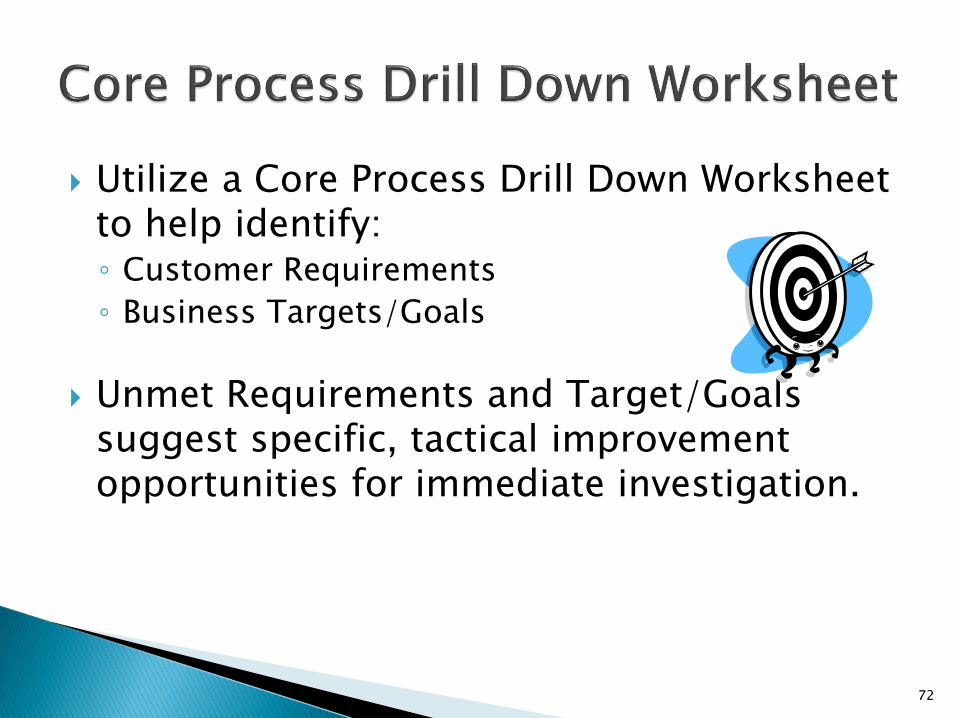
Utilize a Core Process Drill Down Worksheet to help identify:◦ Customer Requirements
◦ Business Targets/Goals
Unmet Requirements and Target/Goals suggest specific, tactical improvement opportunities for immediate investigation.
72
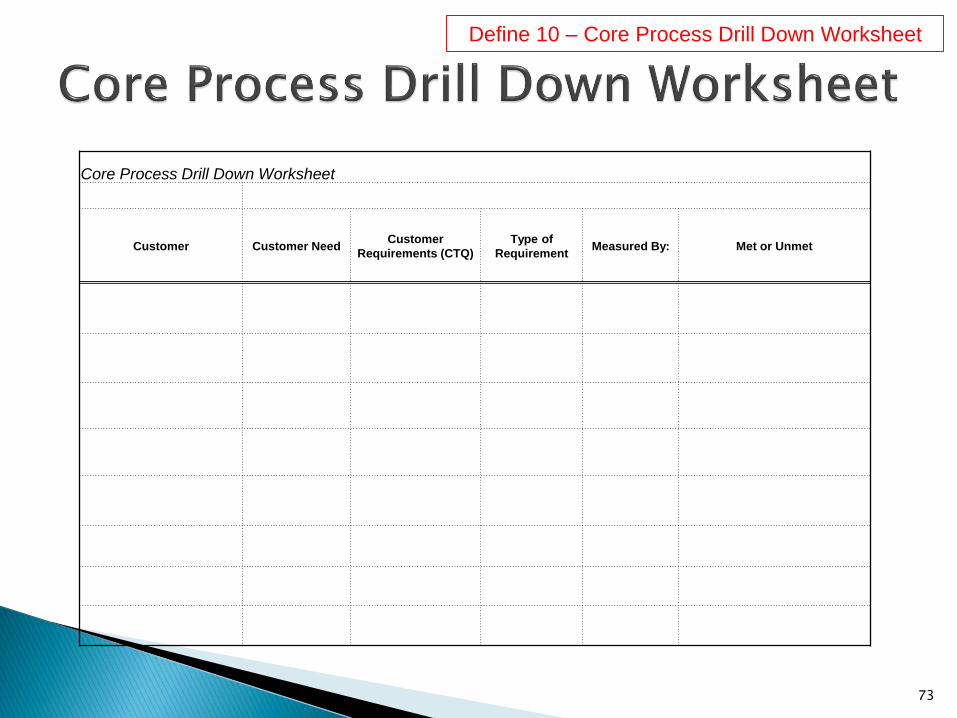
Core Process Drill Down Worksheet
Customer Customer NeedCustomer
Requirements (CTQ)
Type of
RequirementMeasured By: Met or Unmet
73
Define 10 – Core Process Drill Down Worksheet
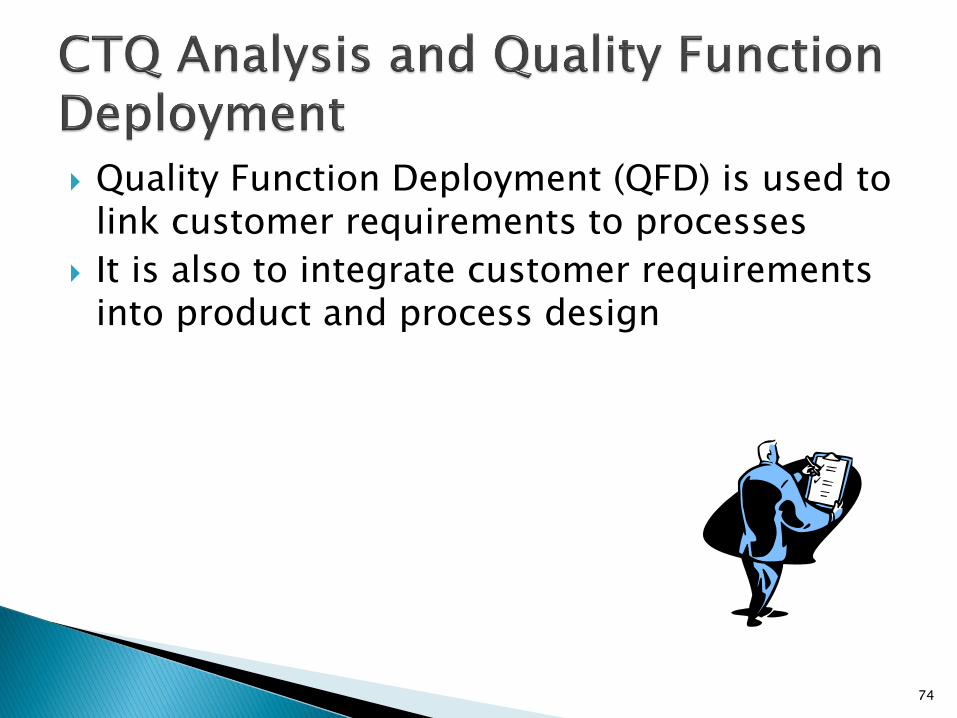
Quality Function Deployment (QFD) is used to link customer requirements to processes
It is also to integrate customer requirements into product and process design
74
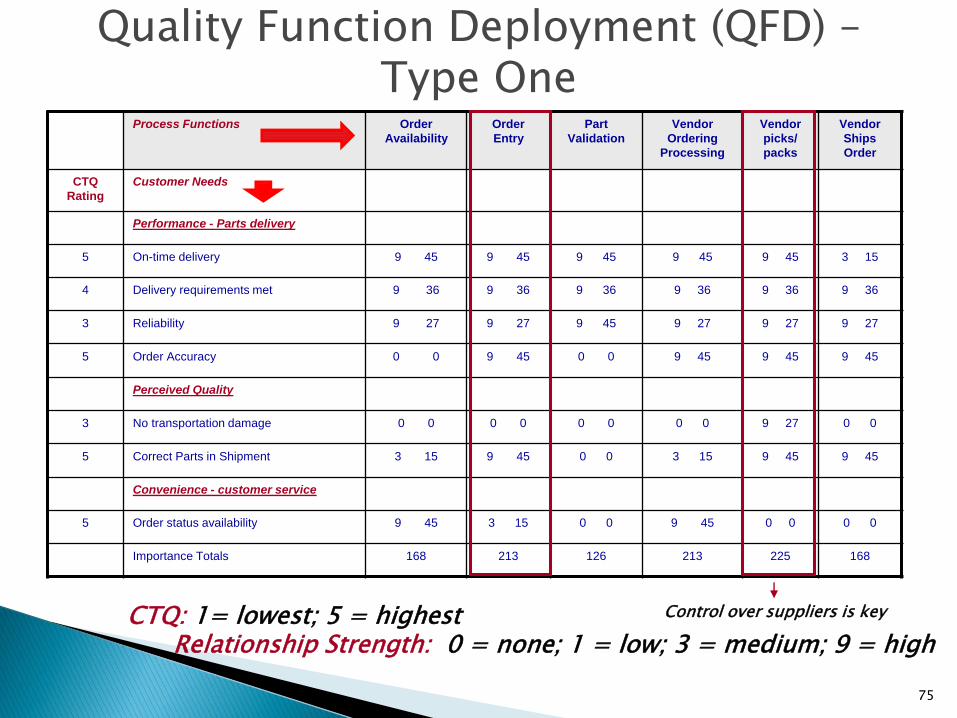
Process Functions Order
Availability
Order
Entry
Part
Validation
Vendor
Ordering
Processing
Vendor
picks/
packs
Vendor
Ships
Order
CTQ
Rating
Customer Needs
Performance - Parts delivery
5 On-time delivery 9 45 9 45 9 45 9 45 9 45 3 15
4 Delivery requirements met 9 36 9 36 9 36 9 36 9 36 9 36
3 Reliability 9 27 9 27 9 45 9 27 9 27 9 27
5 Order Accuracy 0 0 9 45 0 0 9 45 9 45 9 45
Perceived Quality
3 No transportation damage 0 0 0 0 0 0 0 0 9 27 0 0
5 Correct Parts in Shipment 3 15 9 45 0 0 3 15 9 45 9 45
Convenience - customer service
5 Order status availability 9 45 3 15 0 0 9 45 0 0 0 0
Importance Totals 168 213 126 213 225 168
Control over suppliers is keyCTQ: 1= lowest; 5 = highest Relationship Strength: 0 = none; 1 = low; 3 = medium; 9 = high
Quality Function Deployment (QFD) –Type One
75
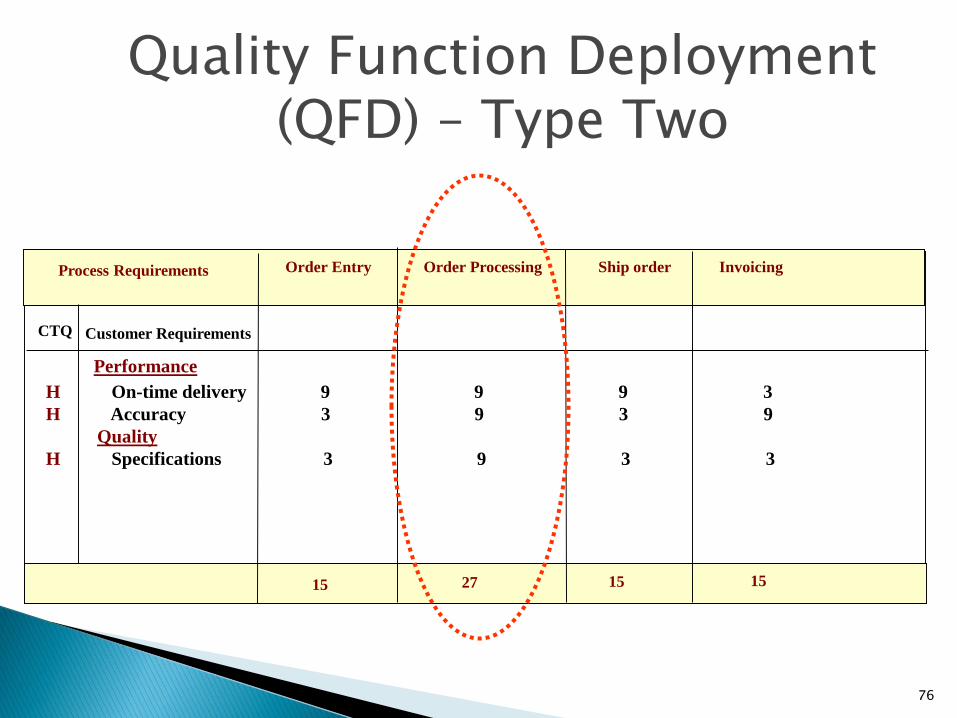
CTQ Customer Requirements
Process Requirements Order Entry Order Processing Ship order Invoicing
Performance
H On-time delivery 9 9 9 3
H Accuracy 3 9 3 9
Quality
H Specifications 3 9 3 3
15 151527
Quality Function Deployment (QFD) – Type Two
76
77
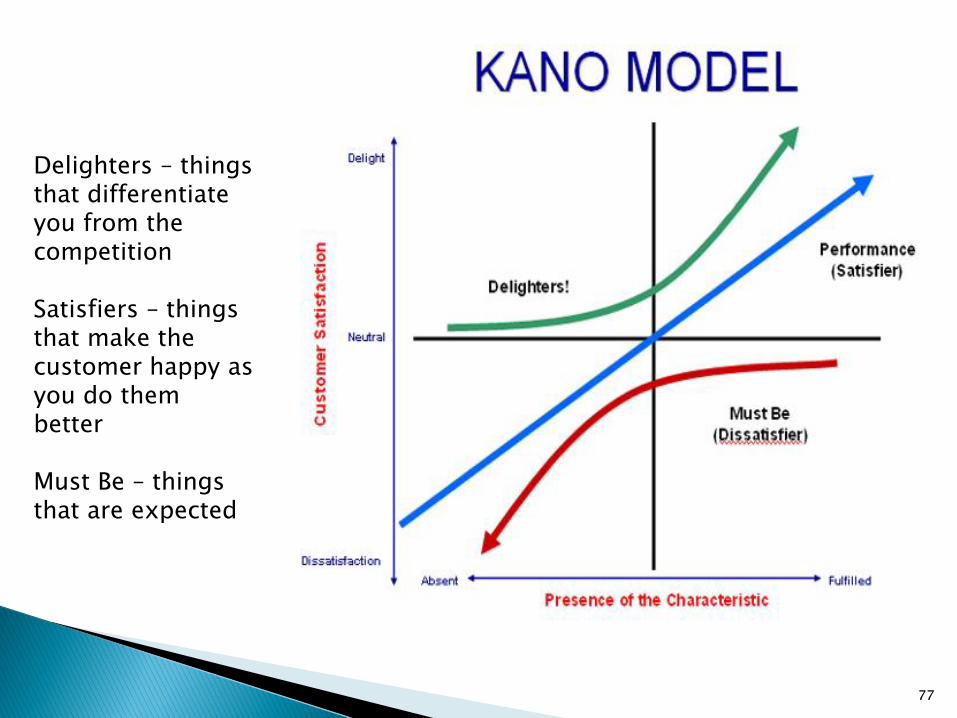
Delighters – things that differentiate you from the competition
Satisfiers – things that make the customer happy as you do them better
Must Be – things that are expected
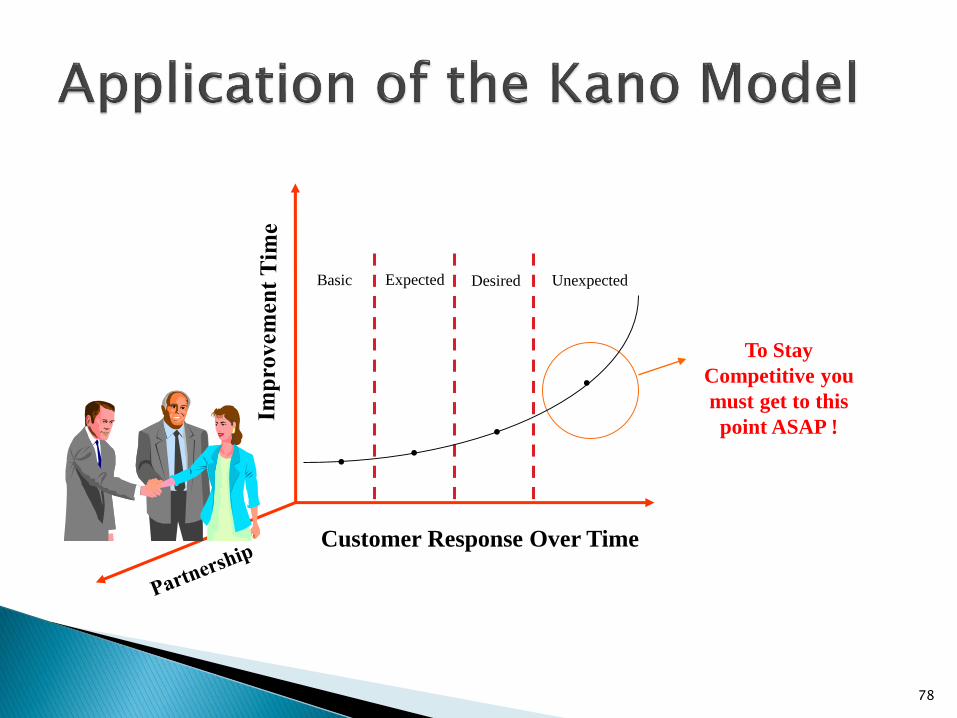
Customer Response Over Time
ExpectedBasic Desired Unexpected
. . ..
To Stay
Competitive you
must get to this
point ASAP !
78
79
• Poor Quality affects many parts of the business• Productivity
• Waste
• Defects
• Purchased services, materials, and equipment
• Revenue
• Risk
80
Define 17 - Benefits Toolkit
• Poor Quality has 2nd and 3rd order effects on the Cost of Poor Quality• Example: Starbucks Coffee received customer
complaints about the quality of their coffee in regards to it tasting burnt
• 1st order of Poor Quality and subsequent cost was lost customers
• After Root Cause Analysis it was determined that retraining was a critical factor to preventing the failure mode in the future
81
• 2nd and 3rd order effects example (cont’d)• During retraining, a customer comes to
Starbucks during the 3 hours that they were closed for retraining across the nation and decides to visit a neighborhood coffee shop for the first time (2nd order effect)
• During the first-time neighborhood coffee shop visit the customer decides they like it better and now are a customer of the neighborhood coffee shop in lieu of Starbucks (3rd order effect)
82
Addit
ional C
ash D
iscounts
on
Accounts
Payable
Adm
in (C
&B)
Costs
of
Cla
ims /
C
redit
/ D
ebit
Tra
nsacti
ons
Benefi
ts N
ot
Easily Q
uanti
fied
Com
pensati
on a
nd B
enefi
ts
Dis
posal C
osts
on S
cra
p M
ate
rial
Expedit
ed F
reig
ht
Headcount
Cost
Avoid
ance
Impro
ved C
ash F
low
fro
m
Reducti
on in S
cra
p /
Rew
ork
In
vento
ry a
nd P
ast
Due R
eceiv
able
Bala
nce
Incre
ased S
ale
s f
rom
Im
pro
ved
Quoti
ng /
Lead G
enera
tion
Incre
ased S
ellin
g P
rice o
n
Corr
ecte
d B
illing
Incre
menta
l C
osts
to E
xecute
Incre
menta
l Revenue f
rom
C
apacit
y
Mate
rial Scra
p o
r Rew
ork
Cost
Oth
er
Manpow
er
Costs
Associa
ted
wit
h D
efe
ct
Resolu
tion
Oth
er
Opera
ting E
xpenses
Additional Cash Discounts on Accounts Payable
Admin (C&B) Costs of Claims / Credit / Debit Transactions x x
Benefits Not Easily Quantified
Compensation and Benefits
Disposal Costs on Scrap Material x xExpedited Freight
Headcount Cost Avoidance
Cost Avoidance from capacity creation (don't have to buy new
equipment)x
Headcount Reduction x
83
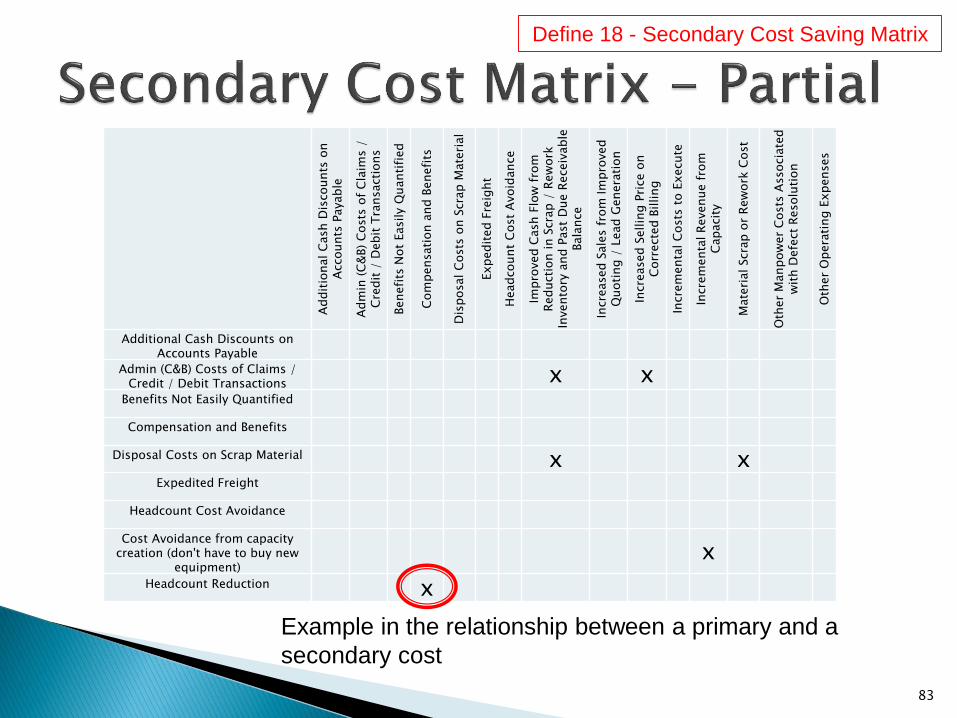
Define 18 - Secondary Cost Saving Matrix
Example in the relationship between a primary and a
secondary cost
• Poor Quality is reflected in:
• Operating & Capital Budgets
• Operating budget :
• Spent on operations to generate revenue
• Employee Wages & Benefits, Supplies and Utilities
• Capital budget:
• Useful life of greater than 1 Year*
• Land, Buildings & Major Equipment
• * organizationally specific
84
• The financial aspects of poor quality are often not investigated as thoroughly as one would think
• The process of understand the “true” cost of poor quality will come after data collection on the Key Process Output Variable and the Key Process Input Variables
• Early in the project we are able to take a “swag” at what we think is the current cost of poor quality
•85
• To take our “swag” we will need to understand the impacts to the organization based on the current process, then annualize it.
• Examples:
• Does the current process poor quality affect profit margins?
• Did we experience lost customers, resulting in lost market share and revenue?
• Did we have employee turnover, hiring costs and training costs due to turnover?
86
• Keep in mind: this early in the project we are simply trying to understand the financial aspects of our processes poor quality.
• Once we collect additional data in the Measure Phase we will fine tune our Cost of Poor Quality (COPQ) estimates and dig much deeper
• The COPQ quantification is a refining process as the project progresses and the team learns more
87
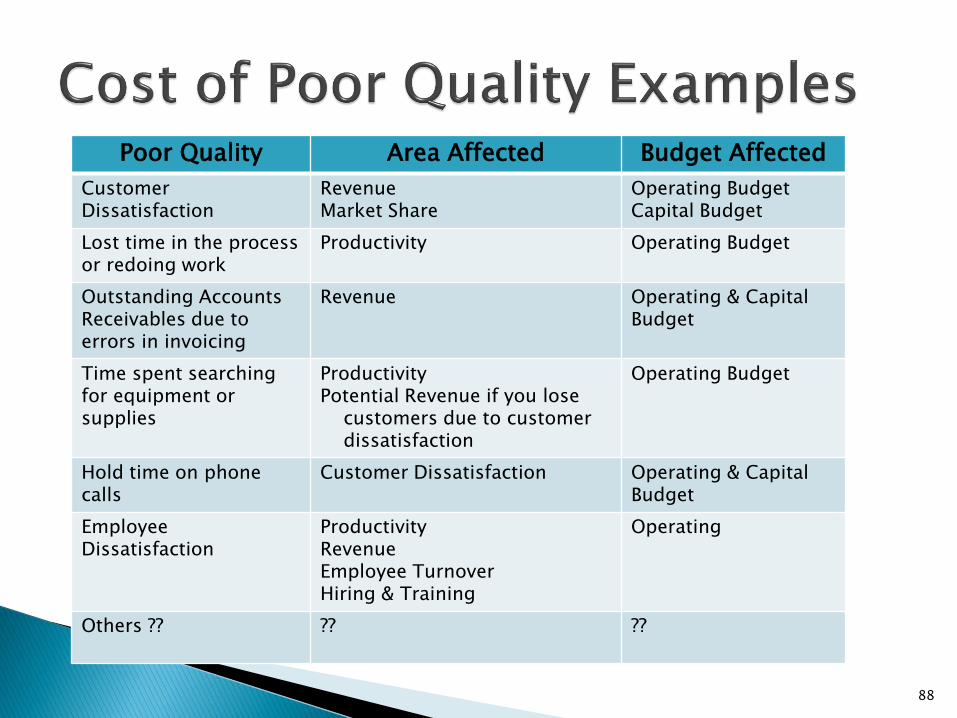
Poor Quality Area Affected Budget Affected
Customer Dissatisfaction
RevenueMarket Share
Operating BudgetCapital Budget
Lost time in the processor redoing work
Productivity Operating Budget
Outstanding Accounts Receivables due to errors in invoicing
Revenue Operating & Capital Budget
Time spent searching for equipment or supplies
ProductivityPotential Revenue if you lose
customers due to customer dissatisfaction
Operating Budget
Hold time on phone calls
Customer Dissatisfaction Operating & Capital Budget
Employee Dissatisfaction
ProductivityRevenueEmployee TurnoverHiring & Training
Operating
Others ?? ?? ??
88

•Known baseline data:•Average company is about 3.5-4 sigma•Defects per million at 3.5 is 22,700
•Example•Cost of defects - $20 each defects - $454,000•Profit margin 10% - Need about $4.5 MILLION in sales to cover the defects•If Sales overhead is an additional 10% - What is the added costs?•What is the cumulative costs? 1, 5 and 10 years•What is the NPV?•What is the FV? •What are the Opportunity Costs?•Based on the Opportunity Costs, what are the opportunities lost?
• What could you do with that in building your company?
89
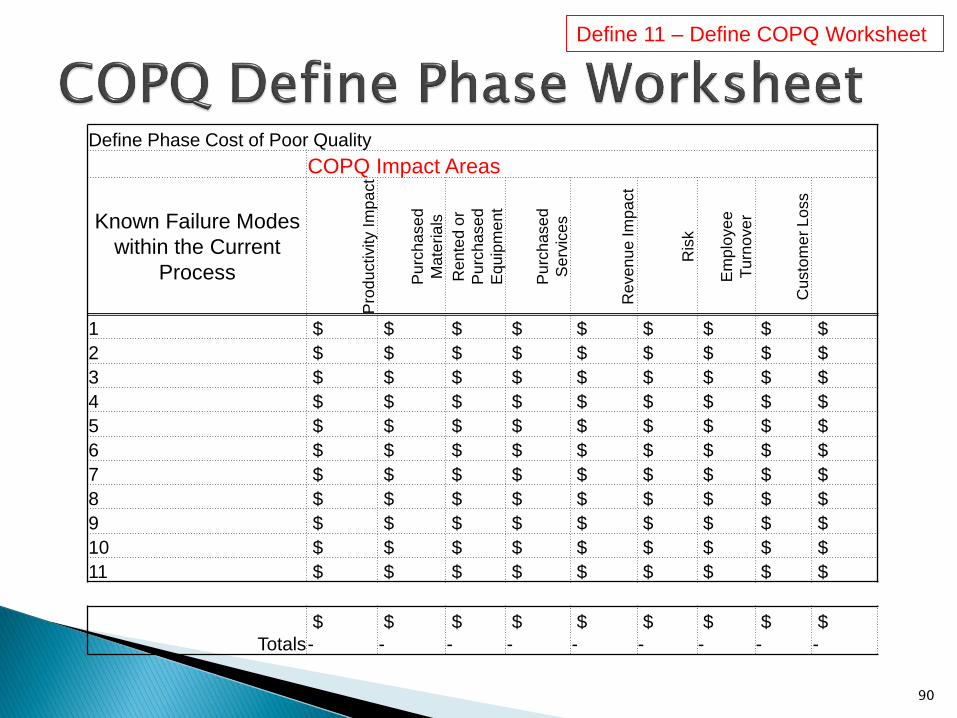
Define Phase Cost of Poor Quality
COPQ Impact Areas
Known Failure Modes
within the Current
Process
Pro
du
ctivity I
mp
act
Pu
rcha
se
d
Ma
teria
ls
Ren
ted
or
Pu
rcha
se
d
Equ
ipm
ent
Pu
rcha
se
d
Se
rvic
es
Reve
nu
e Im
pa
ct
Ris
k
Em
plo
ye
e
Tu
rno
ve
r
Custo
me
r L
oss
1 $ $ $ $ $ $ $ $ $
2 $ $ $ $ $ $ $ $ $
3 $ $ $ $ $ $ $ $ $
4 $ $ $ $ $ $ $ $ $
5 $ $ $ $ $ $ $ $ $
6 $ $ $ $ $ $ $ $ $
7 $ $ $ $ $ $ $ $ $
8 $ $ $ $ $ $ $ $ $
9 $ $ $ $ $ $ $ $ $
10 $ $ $ $ $ $ $ $ $
11 $ $ $ $ $ $ $ $ $
Totals
$
-
$
-
$
-
$
-
$
-
$
-
$
-
$
-
$
-
90
Define 11 – Define COPQ Worksheet
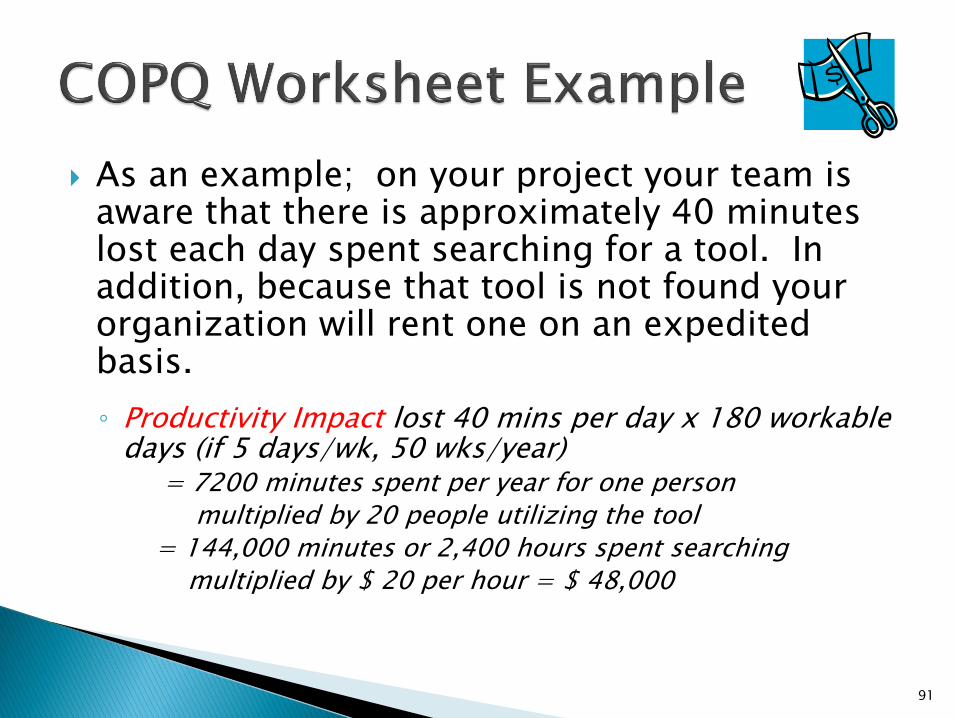
As an example; on your project your team is aware that there is approximately 40 minutes lost each day spent searching for a tool. In addition, because that tool is not found your organization will rent one on an expedited basis.
◦ Productivity Impact lost 40 mins per day x 180 workable days (if 5 days/wk, 50 wks/year)
= 7200 minutes spent per year for one personmultiplied by 20 people utilizing the tool
= 144,000 minutes or 2,400 hours spent searchingmultiplied by $ 20 per hour = $ 48,000
91
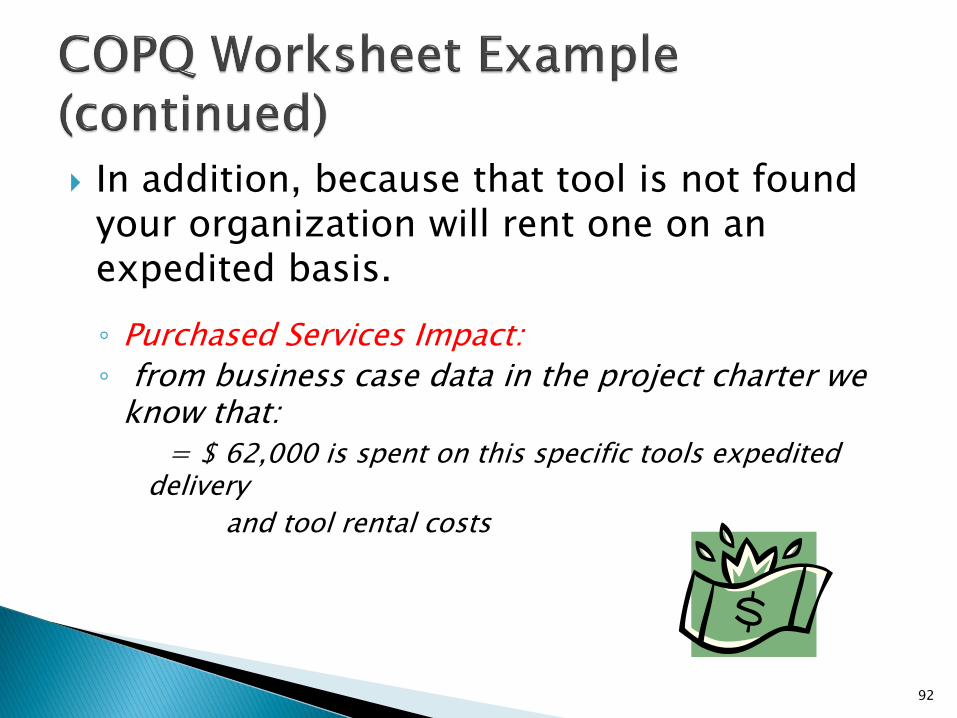
In addition, because that tool is not found your organization will rent one on an expedited basis.
◦ Purchased Services Impact:
◦ from business case data in the project charter we know that:
= $ 62,000 is spent on this specific tools expedited delivery
and tool rental costs
92
From the basic information presented in the project charter before we even gather any measure data here’s what we know:
1. Annual Productivity loss of approximately $ 48,000
◦ due to this particular tool not being in the correct location or available when it is needed in the process
2. Annual Operating Expense of $ 62,000
◦ due to this particular tool not being in the correct location or available when it is needed in the process and an expedited tool rental occurs
93
From the perspective of Hard and Soft Savings and which budgets are affected:
1. Annual Productivity loss of approximately $ 48,000
◦ organizational specific but typically a soft savings
◦ more than likely it is multiple people and only small increments of time spread out over a year
◦ Only hard savings if a person (FTE) is eliminated
2. Annual Operating Expense of $ 62,000
◦ this is a hard savings because you can see a reduction in this item in the operating budget
◦ we will tie this metric to the budget line item number
94
Define 19 - Report Out Template◦ An example of a report out template for the DMAIC
Process
Define 4 – Ground Rules Worksheet◦ A list of ground rules for holding team meetings
Define 5 – Project Schedule Template◦ A Gantt Chart for helping you schedule the phases
of the project
95
96
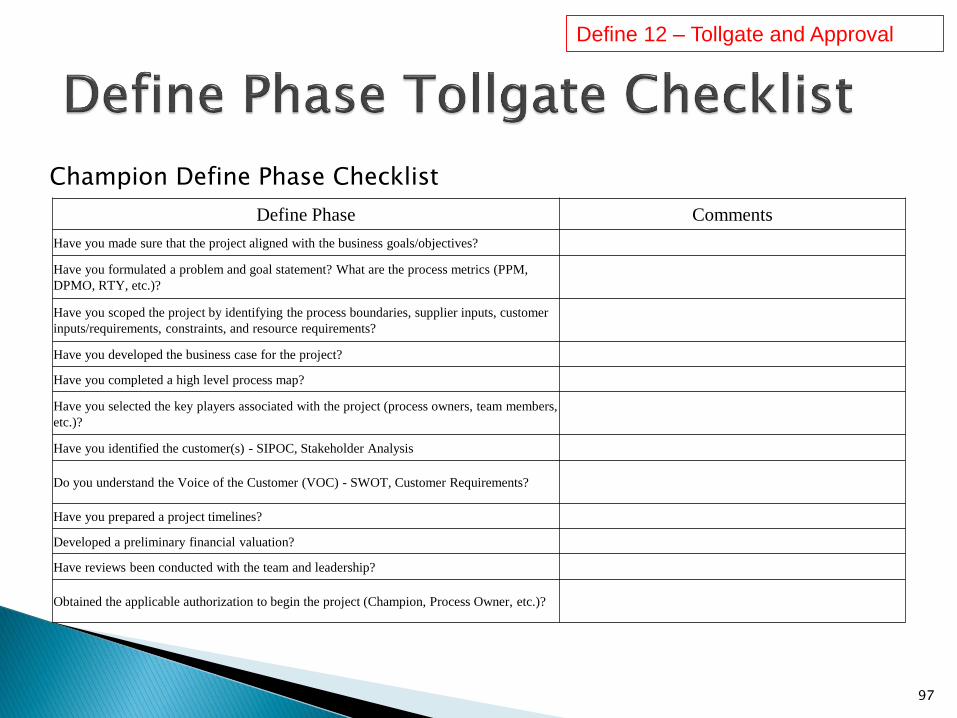
Champion Define Phase Checklist
97
Define 12 – Tollgate and Approval
Define Phase Comments
Have you made sure that the project aligned with the business goals/objectives?
Have you formulated a problem and goal statement? What are the process metrics (PPM,
DPMO, RTY, etc.)?
Have you scoped the project by identifying the process boundaries, supplier inputs, customer
inputs/requirements, constraints, and resource requirements?
Have you developed the business case for the project?
Have you completed a high level process map?
Have you selected the key players associated with the project (process owners, team members,
etc.)?
Have you identified the customer(s) - SIPOC, Stakeholder Analysis
Do you understand the Voice of the Customer (VOC) - SWOT, Customer Requirements?
Have you prepared a project timelines?
Developed a preliminary financial valuation?
Have reviews been conducted with the team and leadership?
Obtained the applicable authorization to begin the project (Champion, Process Owner, etc.)?
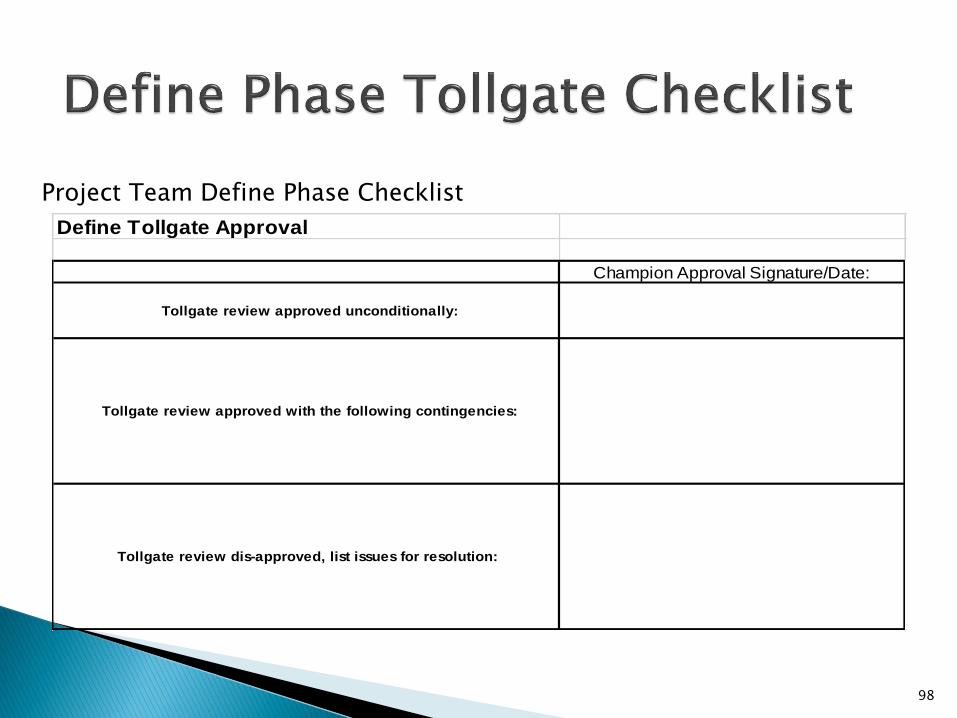
Project Team Define Phase Checklist
98
Define Tollgate Approval
Champion Approval Signature/Date:
Tollgate review approved unconditionally:
Tollgate review approved with the following contingencies:
Tollgate review dis-approved, list issues for resolution:
99
Related Documents