recycling Article LCA of Glass Versus PET Mineral Water Bottles: An Italian Case Study Carmen Ferrara, Giovanni De Feo * and Vincenza Picone Citation: Ferrara, C.; De Feo, G.; Picone, V. LCA of Glass Versus PET Mineral Water Bottles: An Italian Case Study. Recycling 2021, 6, 50. https://doi.org/10.3390/ recycling6030050 Academic Editor: Michele John Received: 12 May 2021 Accepted: 12 July 2021 Published: 15 July 2021 Publisher’s Note: MDPI stays neutral with regard to jurisdictional claims in published maps and institutional affil- iations. Copyright: © 2021 by the authors. Licensee MDPI, Basel, Switzerland. This article is an open access article distributed under the terms and conditions of the Creative Commons Attribution (CC BY) license (https:// creativecommons.org/licenses/by/ 4.0/). Department of Industrial Engineering (DIIN), University of Salerno, via Giovanni Paolo II, 132–84084 Fisciano, Italy; [email protected] (C.F.); [email protected] (V.P.) * Correspondence: [email protected]; Tel.: +39-089-964-113 Abstract: Due to the serious problem of plastic pollution in aquatic environment, many people reject plastic packaging in favour of glass containers which are considered more sustainable. To avoid misjudgements, the sustainability assessment of packaging alternatives should be carried out with a life cycle thinking approach. In this regard, the study presents a comparative Life Cycle Assessment (LCA) of two alternative packaging systems for drinking water: reusable glass bottles and polyethylene (PET) bottles. The case study was performed considering the real data of an Italian mineral water company that bottles and distributes both natural and sparkling water. The environmental impacts of the two packaging systems were estimated with the ReCiPe 2016 (H) evaluation method adopting both midpoint and endpoint approaches. The results showed that the PET bottle is the most sustainable alternative for natural water for many impact categories; while, in the case of sparkling water, the environmental impacts of the two packaging systems are similar and the most environmentally sound solution can vary depending on the impact category. The following are the most significant aspects of the analysis: (1) the number of reuses of a single glass bottle; (2) the distribution distance. Their variation can determine which packaging is the most sustainable. Therefore, a life cycle assessment approach is needed for each specific case. Keywords: sustainability; reusable glass bottle; PET bottle; beverage packaging; bottled water 1. Introduction The serious environmental problem of plastic marine pollution has caused a growing global concern [1]. In this regard, at the European level, the “Single-Use Plastics Directive” (Directive (EU) 2019/904) sets new targets to limit the adoption of single-use plastic packaging (i.e., cups for beverages, including their covers and lids, and food containers) as well as to banish completely specific single-use plastic products (i.e., cotton bud sticks, cutlery, plates, straws, beverage stirrers, sticks to be attached to and to support balloons, food containers made of expanded polystyrene, beverage containers made of expanded polystyrene including their caps and lids, and cups for beverages made of expanded polystyrene including their covers and lids). In response to the “plastic issue”, many people reject plastic packaging for beverages with a preference for other packaging materials, especially glass, which is usually consid- ered the most sustainable alternative [2]. For instance, many people mistakenly think that plastic bottles for mineral water are also among the products banned by the directive and that any plastic object automatically ends up in the oceans. Therefore, in order to avoid a problem shifting issue, the adoption of a holistic ap- proach is needed for the evaluation of the environmental sustainability of systems, using a life cycle thinking perspective [3]. Currently, life cycle assessment (LCA) is the most used methodology for the sustain- ability assessment of alternative systems. LCA allows for the comparison of the potential environmental impacts occurring during all the life cycle phases (e.g., raw material extrac- Recycling 2021, 6, 50. https://doi.org/10.3390/recycling6030050 https://www.mdpi.com/journal/recycling

Welcome message from author
This document is posted to help you gain knowledge. Please leave a comment to let me know what you think about it! Share it to your friends and learn new things together.
Transcript

recycling
Article
LCA of Glass Versus PET Mineral Water Bottles: An ItalianCase Study
Carmen Ferrara, Giovanni De Feo * and Vincenza Picone
�����������������
Citation: Ferrara, C.; De Feo, G.;
Picone, V. LCA of Glass Versus PET
Mineral Water Bottles: An Italian
Case Study. Recycling 2021, 6, 50.
https://doi.org/10.3390/
recycling6030050
Academic Editor: Michele John
Received: 12 May 2021
Accepted: 12 July 2021
Published: 15 July 2021
Publisher’s Note: MDPI stays neutral
with regard to jurisdictional claims in
published maps and institutional affil-
iations.
Copyright: © 2021 by the authors.
Licensee MDPI, Basel, Switzerland.
This article is an open access article
distributed under the terms and
conditions of the Creative Commons
Attribution (CC BY) license (https://
creativecommons.org/licenses/by/
4.0/).
Department of Industrial Engineering (DIIN), University of Salerno, via Giovanni Paolo II,132–84084 Fisciano, Italy; [email protected] (C.F.); [email protected] (V.P.)* Correspondence: [email protected]; Tel.: +39-089-964-113
Abstract: Due to the serious problem of plastic pollution in aquatic environment, many peoplereject plastic packaging in favour of glass containers which are considered more sustainable. Toavoid misjudgements, the sustainability assessment of packaging alternatives should be carriedout with a life cycle thinking approach. In this regard, the study presents a comparative Life CycleAssessment (LCA) of two alternative packaging systems for drinking water: reusable glass bottlesand polyethylene (PET) bottles. The case study was performed considering the real data of anItalian mineral water company that bottles and distributes both natural and sparkling water. Theenvironmental impacts of the two packaging systems were estimated with the ReCiPe 2016 (H)evaluation method adopting both midpoint and endpoint approaches. The results showed that thePET bottle is the most sustainable alternative for natural water for many impact categories; while, inthe case of sparkling water, the environmental impacts of the two packaging systems are similar andthe most environmentally sound solution can vary depending on the impact category. The followingare the most significant aspects of the analysis: (1) the number of reuses of a single glass bottle;(2) the distribution distance. Their variation can determine which packaging is the most sustainable.Therefore, a life cycle assessment approach is needed for each specific case.
Keywords: sustainability; reusable glass bottle; PET bottle; beverage packaging; bottled water
1. Introduction
The serious environmental problem of plastic marine pollution has caused a growingglobal concern [1]. In this regard, at the European level, the “Single-Use Plastics Directive”(Directive (EU) 2019/904) sets new targets to limit the adoption of single-use plasticpackaging (i.e., cups for beverages, including their covers and lids, and food containers)as well as to banish completely specific single-use plastic products (i.e., cotton bud sticks,cutlery, plates, straws, beverage stirrers, sticks to be attached to and to support balloons,food containers made of expanded polystyrene, beverage containers made of expandedpolystyrene including their caps and lids, and cups for beverages made of expandedpolystyrene including their covers and lids).
In response to the “plastic issue”, many people reject plastic packaging for beverageswith a preference for other packaging materials, especially glass, which is usually consid-ered the most sustainable alternative [2]. For instance, many people mistakenly think thatplastic bottles for mineral water are also among the products banned by the directive andthat any plastic object automatically ends up in the oceans.
Therefore, in order to avoid a problem shifting issue, the adoption of a holistic ap-proach is needed for the evaluation of the environmental sustainability of systems, using alife cycle thinking perspective [3].
Currently, life cycle assessment (LCA) is the most used methodology for the sustain-ability assessment of alternative systems. LCA allows for the comparison of the potentialenvironmental impacts occurring during all the life cycle phases (e.g., raw material extrac-
Recycling 2021, 6, 50. https://doi.org/10.3390/recycling6030050 https://www.mdpi.com/journal/recycling

Recycling 2021, 6, 50 2 of 13
tion, manufacturing, processing, packaging, transportation, use, end-of-life) of alternativesystems [4].
In this perspective, Kouloumpis et al. (2020) [5] used the LCA methodology to evaluatethe environmental effects of the potential substitution of polyethylene terephthalate (PET)bottles with glass bottles for beverage in Cornwall and showed that this would lead to asignificant increase in the environmental impact in terms of climate change.
Similar results also emerged from other papers that compared the environmentalperformances of PET and glass bottles for the packaging of beverage through the useof LCA. PET was the most environmentally sound alternative [6,7] not only in terms ofglobal warming but also considering other environmental indicators such as eutrophication,terrestrial acidification, cumulative energy demand, etc. [8,9].
Currently, it is difficult to find effective alternatives to plastic packaging [10]. Com-pared to other types of packaging for beverage, such as polylactic acid (PLA) or aluminiumbottles, the PET bottle seems to be the packaging solution that generates fewer impacts [11].Furthermore, its environmental performances can be improved using recycled PET inthe bottle production process [12]. Nevertheless, looking only at the embodied energyparameter (defined as the sum of all the energies required to produce the packaging),aluminium is the packaging material with the lowest value per L of beverage [13].
An environmentally competitive alternative to the PET bottle could be the reusablepackaging. Indeed, Coelho et al. (2020) [14] pointed out that these alternatives can haveenvironmental end economic benefits rather than single-use packaging. In this regard,some studies applied the LCA methodology to compare the environmental performancesof a PET or HDPE bottles system and a reusable glass bottles system for the bottlingof different types of beverage as mineral water [15], milk [16,17], wine [18] and softdrinks [19,20]. However, the results of the studies differ depending on the case study,the geographic location and the specific assumptions. The best environmental packagingsolutions identified in these papers vary on the basis of three main key factors: the numberof reuses for the glass bottle, the weight of the two types of bottles and the recycling rate ofglass and PET. Nevertheless, these aspects strictly depend on the specific case considered.Therefore, it is very important to carry out further LCA studies on the topic based onoriginal and site-specific inventory data referred to real cases.
In this regard, our study proposes a LCA application to the environmental comparisonof two packaging systems for drinking water: reusable glass bottle (PS1_GLASS) and PETbottle (PS2_PET), using original and site-specific inventory data about the three key factorspointed out, in order to identify the most environmentally sound alternative on the basis ofthe real case of an Italian mineral water company that uses this packaging to commercializeboth natural mineral water (N) and sparkling mineral water (S).
2. Materials and Methods
The LCA study was carried out in compliance to the four LCA phases, as recom-mended by the ISO standard (ISO 14040, 2006; ISO 14044, 2006): (i) Goal and scopedefinition; (ii) Life cycle inventory; (iii) Life cycle impact assessment; (iv) Results interpre-tation [21,22]. The first three phases are reported in the following sub-sections after thedescription of the packaging systems considered, while the last phase is discussed in thenext section (Results and Discussion).
2.1. Description of the Packaging Systems for Mineral Water
The mineral water company under study is in the Campania region of Southern Italy.It uses two packaging systems for water: PET bottles (82%) and single use or reusableglass bottles (16%) in function of the water distribution distance. The study focused on thepackaging systems of reusable glass bottles (PS1_GLASS) and PET bottles (PS2_PET), bothof 1 L size, considering separately natural water and sparkling water.
Recycling 2021, 6, 50 3 of 13
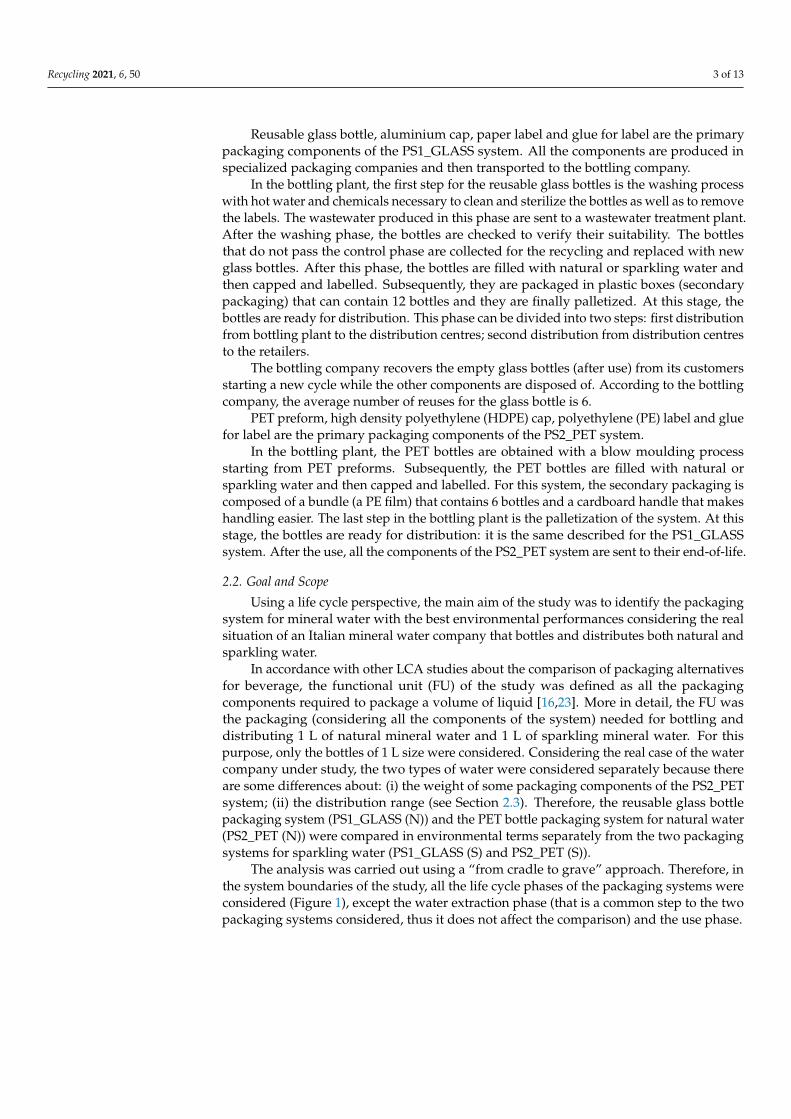
Reusable glass bottle, aluminium cap, paper label and glue for label are the primarypackaging components of the PS1_GLASS system. All the components are produced inspecialized packaging companies and then transported to the bottling company.
In the bottling plant, the first step for the reusable glass bottles is the washing processwith hot water and chemicals necessary to clean and sterilize the bottles as well as to removethe labels. The wastewater produced in this phase are sent to a wastewater treatment plant.After the washing phase, the bottles are checked to verify their suitability. The bottlesthat do not pass the control phase are collected for the recycling and replaced with newglass bottles. After this phase, the bottles are filled with natural or sparkling water andthen capped and labelled. Subsequently, they are packaged in plastic boxes (secondarypackaging) that can contain 12 bottles and they are finally palletized. At this stage, thebottles are ready for distribution. This phase can be divided into two steps: first distributionfrom bottling plant to the distribution centres; second distribution from distribution centresto the retailers.
The bottling company recovers the empty glass bottles (after use) from its customersstarting a new cycle while the other components are disposed of. According to the bottlingcompany, the average number of reuses for the glass bottle is 6.
PET preform, high density polyethylene (HDPE) cap, polyethylene (PE) label and gluefor label are the primary packaging components of the PS2_PET system.
In the bottling plant, the PET bottles are obtained with a blow moulding processstarting from PET preforms. Subsequently, the PET bottles are filled with natural orsparkling water and then capped and labelled. For this system, the secondary packaging iscomposed of a bundle (a PE film) that contains 6 bottles and a cardboard handle that makeshandling easier. The last step in the bottling plant is the palletization of the system. At thisstage, the bottles are ready for distribution: it is the same described for the PS1_GLASSsystem. After the use, all the components of the PS2_PET system are sent to their end-of-life.
2.2. Goal and Scope
Using a life cycle perspective, the main aim of the study was to identify the packagingsystem for mineral water with the best environmental performances considering the realsituation of an Italian mineral water company that bottles and distributes both natural andsparkling water.
In accordance with other LCA studies about the comparison of packaging alternativesfor beverage, the functional unit (FU) of the study was defined as all the packagingcomponents required to package a volume of liquid [16,23]. More in detail, the FU wasthe packaging (considering all the components of the system) needed for bottling anddistributing 1 L of natural mineral water and 1 L of sparkling mineral water. For thispurpose, only the bottles of 1 L size were considered. Considering the real case of the watercompany under study, the two types of water were considered separately because thereare some differences about: (i) the weight of some packaging components of the PS2_PETsystem; (ii) the distribution range (see Section 2.3). Therefore, the reusable glass bottlepackaging system (PS1_GLASS (N)) and the PET bottle packaging system for natural water(PS2_PET (N)) were compared in environmental terms separately from the two packagingsystems for sparkling water (PS1_GLASS (S) and PS2_PET (S)).
The analysis was carried out using a “from cradle to grave” approach. Therefore, inthe system boundaries of the study, all the life cycle phases of the packaging systems wereconsidered (Figure 1), except the water extraction phase (that is a common step to the twopackaging systems considered, thus it does not affect the comparison) and the use phase.

Recycling 2021, 6, 50 4 of 13Recycling 2021, 6, x FOR PEER REVIEW 4 of 13
(a)
(b)
Figure 1. Scheme of system boundaries for the reusable glass bottle packaging system: PS1_GLASS
(a) and for PET bottle packaging system: PS2_PET (N) and PS2_PET (b).
For both systems, the production of all the components of primary, secondary and
tertiary packaging were considered with the following assumptions derived from the data
and information provided by the bottling company:
- About the primary and secondary packaging of the systems, all the components (ex-
cept the glass bottle) were produced with 100% virgin raw materials;
- For the new glass bottles (i.e., those that replace the reusable bottles to be collected
and sent to recycling) a recycled glass content of 70% in the production process of the
bottles was considered because white glass is used and a lower recycled content is
expected for this type of glass rather than for green glass bottles [4,23];
- Regarding to the tertiary packaging components, a recycled fibers content of 80% was
considered in the production process of cardboard sheets while it was assumed that
the PE stretch film was manufactured with only virgin PE.
Bottle washing
Bottling and assembly
(filling, capping, labeling)
Water extraction
Packaging (in box of
12 bottles)
Palletization
Distribution
(1st- 2nd)
Use
End of life of
packaging
system
Cap (Aluminium)
Glue
Label (Paper)
Box (HDPE)
Stretch film (PE)
Raw materials
Water
Fuels
Energy
New glass bottle (14%)
BOTTLING PLANT
PS1_GLASS
System boundaries
Chemicals
Wastewater
Waste
Emissions
Glass bottle (reuse – 86%)
Blow moulding
Bottling and assembly
(filling, capping, labeling)
Water extraction
Packaging (in packs
of 6 bottles)
PalletizationDistribution
(1st- 2nd)
Use
End of life of
packaging
system
Cap (HDPE)
Glue
Label (PE)
Handle
(Cardboard)
Film (PE)
Stretch film (PE)
Cardboard sheets
Raw materials
Water
Fuels
Energy Wastewater
Waste
Emissions
Preform (PET)
BOTTLING PLANT
PS2_PET
System boundaries
Figure 1. Scheme of system boundaries for the reusable glass bottle packaging system: PS1_GLASS (a) and for PET bottlepackaging system: PS2_PET (N) and PS2_PET (b).
For both systems, the production of all the components of primary, secondary andtertiary packaging were considered with the following assumptions derived from the dataand information provided by the bottling company:
- About the primary and secondary packaging of the systems, all the components(except the glass bottle) were produced with 100% virgin raw materials;
- For the new glass bottles (i.e., those that replace the reusable bottles to be collectedand sent to recycling) a recycled glass content of 70% in the production process of thebottles was considered because white glass is used and a lower recycled content isexpected for this type of glass rather than for green glass bottles [4,23];
- Regarding to the tertiary packaging components, a recycled fibers content of 80% wasconsidered in the production process of cardboard sheets while it was assumed thatthe PE stretch film was manufactured with only virgin PE.

Recycling 2021, 6, 50 5 of 13
The distribution phase was modelled considering the real distribution range fornatural water (about 213 km) and for sparkling water (about 186 km) commercialized inreusable glass bottles by the bottling company under study. Therefore, for PS2_PET (N)and for PS2_PET (S), the same distribution values considered for PS1_GLASS (N) andPS1_GLASS (S) were used, respectively. In addition to the first distribution just described,a second distribution was considered for all the packaging systems to also consider thetransportation of the products from the distribution centres to the retailers: 30 km wasassumed. The transport of the products from the retailers to the final customers wasnot considered.
Finally, the end-of-life of each component of the systems was considered. For thispurpose, disposal scenarios composed of incineration, landfilling and recycling weremodelled for all the packaging materials.
2.3. Life Cycle Inventory
The LCA models of all the packaging systems were performed using the SimaPro8 software tool. Primary data regarding the production of the systems’ components, thebottling plant operations and the distribution of natural and sparkling water were providedby the bottling company. Background data, as the Italian energy mix, the extraction andtransportation of raw materials, fuels production, infrastructure and vehicles were takenfrom the processes of Ecoinvent v.3 database.
Tables 1 and 2 show the main inventory data regarding the weight and compositionof all the components of the packaging systems considered. All the data are expressed interms of the functional unit of the study.
Table 1. Weight and composition of all the components of the PS1_GLASS system (the values are thesame for both natural and sparkling water).
PS1_GLASS Weight (g)
Glass bottle (1st Packaging) 450Aluminium Cap (1st Packaging) 2.0
Paper label (1st Packaging) 0.87Glue (1st Packaging) 0.71
HDPE box * (2nd Packaging) 165.8PE stretch film (3rd Packaging) 0.04Wood Pallet * (3rd Packaging) 50
* Component not considered in the production phase because of the high reuse number.
Table 2. Weight and composition of all components of the PS2_PET (N) and PS2_PET (S) systems.
Packaging ComponentPS2_PET (N) PS2_PET (S)
Weight (g) Weight (g)
PET bottle (1st Packaging) 22.8 25.7HDPE Cap (1st Packaging) 1 1.5PE Label (1st Packaging) 0.37 0.37
Glue (1st Packaging) 0.025 0.025PE Film (2nd Packaging) 2.08 2.08
Paper handle (2nd Packaging) 0.26 0.26PE stretch film (3rd Packaging) 0.59 0.59
Cardboard sheet (3rd Packaging) 2.71 2.71Wood Pallet * (3rd Packaging) 27.78 27.78
* Component not considered in the production phase because of the high reuse number.
Table 3 contains the primary inventory data for the washing phase of the reusableglass bottles that occurs in the bottling plant. An electricity consumption of 3.4 Wh perbottle was considered for the other plant operations (bottling, assembly and palletization)required by the PS1_GLASS system after the washing. For the PS2_PET systems, the

Recycling 2021, 6, 50 6 of 13
electric energy required by all the bottling plant operations was about 14 Wh per bottle(also including the blow moulding of the PET preforms). The amount of electricity neededby the company for all the industrial processes was taken from the national grid. Therefore,the Italian energy mix was considered in the analysis. For the reusable glass bottles, sixreuses were considered. This value was provided by the bottling company based on theannual number of bottles that do not pass the control phase and are consequently replacedby new bottles (about 14%). Therefore, the reusable glass bottles were used 7 times (6 reuseplus the first use).
Table 3. Inventory data about the washing phase of reusable glass bottles. The values refer to thefunctional unit of the study.
Item Unit Value
InputElectricity Wh 7.4
Water L 0.25Detergent (caustic soda 50% solution) mL 8.12
OutputWastewater L 0.25
The distribution values in kgkm used for the modelling of this phase are reported inTable 4. Regarding to the return of the empty reusable glass bottles to the bottling company,the same distances of distribution (for both the distribution steps) were considered butwithout the weights of water and other components of the primary packaging.
Table 4. Main primary data of the distribution phase. The data are normalized in function of the FUof the study.
Packaging System1st Distribution 2nd Distribution Empty bottle return
kgkm kgkm kgkm
PS1_GLASS (N) 361.3 50.1 144.1PS2_PET (N) 228.9 31.7 -
PS1_GLASS (S) 255.0 50.1 101.7PS2_PET (S) 162.1 31.7 -
The modelling of the vehicles used for the distribution was performed through Ecoin-vent v.3 database processes considering freight lorries Euro 5 of maximum size (>32 metrictons) for the 1st distribution (from the bottling plant to the distribution centres) and freightlorries Euro 5 of size between 3.5 and 7.5 metric tons for the 2nd distribution (from thedistribution centres to the retailers). The same modelling was performed for the return ofthe empty bottles to the plant. Information about size and category of the vehicles wasprovided by the company.
The end-of-life phase of the packaging systems was modelled, for each packagingmaterial, with disposal scenarios composed of landfilling, incineration and recycling, asshown in Table 5. The percentage contributions of the three treatment processes wereprovided by the National Packaging Consortium for each type of material and refer to theItalian disposal scenario of packaging in 2019.

Recycling 2021, 6, 50 7 of 13
Table 5. Inventory data about the percentage composition of the disposal scenarios for each packaging material.
Packaging Material Landfilling Incineration Recycling Source
Aluminium 23.8% 6.2% 70.0% CiAl (National aluminiumPackaging Consortium) [24]
Glass 22.7% 0% 77.3% CoreVe (National glass PackagingConsortium) [25]
Paper—Cardboard 11.6% 7.6% 80.8% Comieco (National paper—cardb.Packaging Consortium) [26]
PE—HDPE 8.0% 48.6% 43.4% CorePla (National plasticPackaging Consortium) [27]
PET 8.0% 48.6% 43.4% CorePla (National plasticPackaging Consortium) [27]
The treatment processes of landfilling, incineration and recycling were modelled, foreach material, following the same procedures and assumptions of Ferrara and De Feo(2020) [23]. The recycling processes were modelled taking into consideration the avoidedvirgin material, replaced by the secondary raw material produced by the recycling and,in this regard, a specific substitution ratio for each packaging material was considered asreported in Ferrara and De Feo (2020) [23].
2.4. Life Cycle Impact Assessment
The environmental impacts of the packaging systems were estimated with the useof the ReCiPe 2016 evaluation method adopting the hierarchist perspective (H). Thisimpacts calculation method is an updated and extended version of ReCiPe 2008 [28]that allows for the consideration of two approaches: the midpoint (problem oriented)level and the endpoint (damage oriented) level [23]. The midpoint approach consists of18 impact categories: Global Warming Potential (GWP); Stratospheric Ozone Depletion(SOD); Ionizing Radiation (IR); Ozone Formation, Human Health (OF-HH); Fine ParticulateMatter Formation (FPMF); Ozone Formation Terrestrial Ecosystems (OF-TE); TerrestrialAcidification (TA); Freshwater Eutrophication (FE); Marine Eutrophication (ME); TerrestrialEcotoxicity (TEcotox); Freshwater Ecotoxicity (FEcotox); Marine Ecotoxicity (MEcotox);Human Carcinogenic Toxicity (HCTox); Human non-Carcinogenic Toxicity (HnCTox);Land Use (LU); Mineral Resource Scarcity (MRS); Fossil Resource Scarcity (FRS); WaterConsumption (WC) [28]. A detailed description of all categories with the explanation ofthe indicators and the characterization factors for each category is reported in the paper ofHuijbregts et al. (2017) [28].
In the endpoint approach, there are 22 categories that are grouped into three macro-areas of protection: Human health (expressed in terms of disability adjusted life years,DALYs), Ecosystems (expressed in terms of species × year), and Resources (expressed interms of USD 2013) [28].
The impact evaluation was carried out using both levels of the method and the resultsare presented with all the midpoint and endpoint categories. However, a part of theanalysis was focused on the most representative midpoint categories, defined followingthe same approach of Cleary (2013). Such categories were those that provided the highercontribution to the endpoint level of the method:
- Global warming potential (GWP), that quantifies the integrated infrared radiativeforcing increase of a greenhouse gas (GHG) and is expressed in kg CO2-eq. [28].
- Fine particulate matter formation that considers the air pollution that causes primaryand secondary aerosols in the atmosphere. It is expressed in kg PM2.5-eq.
- Terrestrial acidification, that estimates the atmospheric deposition of inorganic sub-stances, such as sulphates, nitrates and phosphates, cause a change in acidity in thesoil and is expressed in n kg SO2-eq.
Recycling 2021, 6, 50 8 of 13
- Fossil resources scarcity, that considers the Fossil Fuel Potential, defined as the ratiobetween the higher heating value of a fossil resource and the energy content of crudeoil. It is expressed in kg oil-eq. [28]
3. Results and Discussion
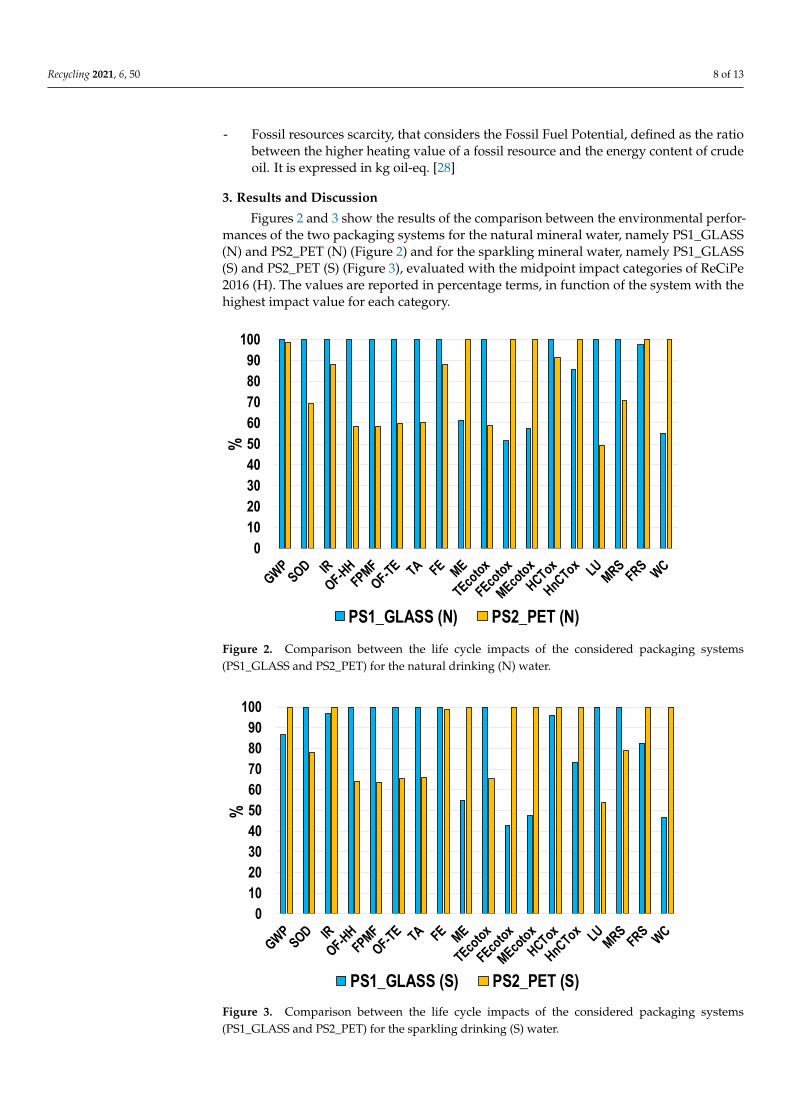
Figures 2 and 3 show the results of the comparison between the environmental perfor-mances of the two packaging systems for the natural mineral water, namely PS1_GLASS(N) and PS2_PET (N) (Figure 2) and for the sparkling mineral water, namely PS1_GLASS(S) and PS2_PET (S) (Figure 3), evaluated with the midpoint impact categories of ReCiPe2016 (H). The values are reported in percentage terms, in function of the system with thehighest impact value for each category.
Recycling 2021, 6, x FOR PEER REVIEW 8 of 13
3. Results and Discussion
Figures 2 and 3 show the results of the comparison between the environmental per-
formances of the two packaging systems for the natural mineral water, namely
PS1_GLASS (N) and PS2_PET (N) (Figure 2) and for the sparkling mineral water, namely
PS1_GLASS (S) and PS2_PET (S) (Figure 3), evaluated with the midpoint impact catego-
ries of ReCiPe 2016 (H). The values are reported in percentage terms, in function of the
system with the highest impact value for each category.
The results highlighted that the PET bottle was the most environmentally sound al-
ternative for the packaging of natural water with the greatest number of impacting cate-
gories, while for the sparkling water the environmental performances of the two packag-
ing systems were similar and the best alternative changed according to the impact cate-
gory considered. Therefore, in this case, it is not possible to uniquely identify the most
sustainable solution.
These results occurred because the weight of the PET bottle and the plastic cap for
the sparkling water is higher than those for the natural water (see Table 2) together with
the high temperature occurring during the glass production process (i.e., about 1500 °C)
and this caused greater impacts for the PS2_PET system. Furthermore, the distribution
distance of the sparkling water is lower (see Table 4) and this aspect mainly benefits the
glass packaging system due to the high weight to be transported [16].
Figure 2. Comparison between the life cycle impacts of the considered packaging systems
(PS1_GLASS and PS2_PET) for the natural drinking (N) water.
0
10
20
30
40
50
60
70
80
90
100
%
PS1_GLASS (N) PS2_PET (N)
Figure 2. Comparison between the life cycle impacts of the considered packaging systems(PS1_GLASS and PS2_PET) for the natural drinking (N) water.
Recycling 2021, 6, x FOR PEER REVIEW 9 of 13
Figure 3. Comparison between the life cycle impacts of the considered packaging systems
(PS1_GLASS and PS2_PET) for the sparkling drinking (S) water.
The results obtained with the endpoint level of the ReCiPe 2016 method highlighted
that the PS1_GLASS system was the most impactful packaging solution for both natural
and sparkling water except in terms of resource consumption (Table 6).
Similar results were discussed in other literature studies. Garfi et al. (2016) [15] high-
lighted that, from an environmental point of view, PET bottle was the preferable packag-
ing alternative for mineral water. In the same way, Stefanini et al. (2020) [16] pointed out
that for milk packaging, the reusable glass bottle had higher impacts compared to PET
bottles. In both studies the authors considered eight uses for glass bottles (seven reuses
plus first use).
Table 6. Potential environmental impacts of the considered packaging systems for natural (N) and sparkling (S) drinking
water estimated with the endpoint categories of ReCiPe 2016.
Endpoint Category Unit PS1_GLASS (N) PS2_PET (N) PS1_GLASS (S) PS2_PET (S)
Human health DALY 4.19 × 10⁻⁷ 3.42 × 10⁻⁷ 3.75 × 10⁻⁷ 3.46 × 10⁻⁷
Ecosystems species × yr 9.18 × 10⁻¹⁰ 7.72 × 10⁻¹⁰ 8.11 × 10⁻¹⁰ 7.81 × 10⁻¹⁰
Resources USD2013 2.37 × 10⁻² 2.38 × 10⁻² 2.00 × 10⁻² 2.39 × 10⁻²
Different results can be obtained considering a higher number of reuses for the glass
bottles. Almeida et al. (2017) [19] compared, in environmental terms, different packaging
for soft drinks and showed that the reusable glass bottles (reused 40 times) were the best
environmental solution. Błazejewski et al. (2021) [17] focused on the milk supply chain
comparing the environmental performances of the single use HDPE bottle and the reusa-
ble glass bottle assuming 283 reuses and pointed out that the latter packaging alternative
could allow one to obtain considerable environmental saving for many impact categories.
In the environmental comparison between PET bottles and reusable glass bottles for wine
packaging, Ferrara et al. (2020) [23] highlighted that the latter had lower life cycle impacts
considering 15 reuses.
More in general, Amienyo et al. (2014) [29] pointed out that the best environmental
alternative for beverage between PET bottles and reusable glass bottles can vary depend-
ing on of the number of reuses for glass bottles.
0
10
20
30
40
50
60
70
80
90
100
%
PS1_GLASS (S) PS2_PET (S)
Figure 3. Comparison between the life cycle impacts of the considered packaging systems(PS1_GLASS and PS2_PET) for the sparkling drinking (S) water.

Recycling 2021, 6, 50 9 of 13
The results highlighted that the PET bottle was the most environmentally soundalternative for the packaging of natural water with the greatest number of impactingcategories, while for the sparkling water the environmental performances of the twopackaging systems were similar and the best alternative changed according to the impactcategory considered. Therefore, in this case, it is not possible to uniquely identify the mostsustainable solution.
These results occurred because the weight of the PET bottle and the plastic cap forthe sparkling water is higher than those for the natural water (see Table 2) together withthe high temperature occurring during the glass production process (i.e., about 1500 ◦C)and this caused greater impacts for the PS2_PET system. Furthermore, the distributiondistance of the sparkling water is lower (see Table 4) and this aspect mainly benefits theglass packaging system due to the high weight to be transported [16].
The results obtained with the endpoint level of the ReCiPe 2016 method highlightedthat the PS1_GLASS system was the most impactful packaging solution for both naturaland sparkling water except in terms of resource consumption (Table 6).
Table 6. Potential environmental impacts of the considered packaging systems for natural (N) and sparkling (S) drinkingwater estimated with the endpoint categories of ReCiPe 2016.
Endpoint Category Unit PS1_GLASS (N) PS2_PET (N) PS1_GLASS (S) PS2_PET (S)
Human health DALY 4.19 × 10⁻⁷ 3.42 × 10⁻⁷ 3.75 × 10⁻⁷ 3.46 × 10⁻⁷
Ecosystems species × yr 9.18 × 10⁻¹⁰ 7.72 × 10⁻¹⁰ 8.11 × 10⁻¹⁰ 7.81 × 10⁻¹⁰
Resources USD2013 2.37 × 10⁻² 2.38 × 10⁻² 2.00 × 10⁻² 2.39 × 10⁻²
Similar results were discussed in other literature studies. Garfi et al. (2016) [15]highlighted that, from an environmental point of view, PET bottle was the preferablepackaging alternative for mineral water. In the same way, Stefanini et al. (2020) [16]pointed out that for milk packaging, the reusable glass bottle had higher impacts comparedto PET bottles. In both studies the authors considered eight uses for glass bottles (sevenreuses plus first use).
Different results can be obtained considering a higher number of reuses for the glassbottles. Almeida et al. (2017) [19] compared, in environmental terms, different packagingfor soft drinks and showed that the reusable glass bottles (reused 40 times) were the bestenvironmental solution. Błazejewski et al. (2021) [17] focused on the milk supply chaincomparing the environmental performances of the single use HDPE bottle and the reusableglass bottle assuming 283 reuses and pointed out that the latter packaging alternative couldallow one to obtain considerable environmental saving for many impact categories. Inthe environmental comparison between PET bottles and reusable glass bottles for winepackaging, Ferrara et al. (2020) [23] highlighted that the latter had lower life cycle impactsconsidering 15 reuses.
More in general, Amienyo et al. (2014) [29] pointed out that the best environmentalalternative for beverage between PET bottles and reusable glass bottles can vary dependingon of the number of reuses for glass bottles.
The importance of the reuses number of glass bottles as a discriminating factor ofthe analysis also emerged from the results shown in Figure 4 regarding the contributionsto the total impacts of the systems provided by each life cycle stage considered. Suchsteps are the following: Packaging production (i.e., the production of all components ofthe systems); Bottling plant operations (namely all activities that occur in the bottlingcompany); Distribution (transportation of bottled water from the bottling company tothe distribution centres and then to the retailers); End of life (disposal scenarios for eachpackaging material of the systems).

Recycling 2021, 6, 50 10 of 13
Recycling 2021, 6, x FOR PEER REVIEW 10 of 13
The importance of the reuses number of glass bottles as a discriminating factor of the
analysis also emerged from the results shown in Figure 4 regarding the contributions to
the total impacts of the systems provided by each life cycle stage considered. Such steps
are the following: Packaging production (i.e., the production of all components of the sys-
tems); Bottling plant operations (namely all activities that occur in the bottling company);
Distribution (transportation of bottled water from the bottling company to the distribu-
tion centres and then to the retailers); End of life (disposal scenarios for each packaging
material of the systems).
(a) (b)
(c) (d)
Figure 4. Environmental impacts of the life cycle stages of the packaging systems for natural and sparkling water calcu-
lated with the most significant midpoint categories for this study: (a) Global warming; (b) Fine particulate matter for-
mation (c) Terrestrial acidification (d) Fossil resources scarcity.
Looking at the PS1_GLASS system, it is worth noting that the highest contribution to
the impacts of the packaging production phase was mainly due to the production of the
glass amount necessary for the new glass bottles replacing the reusable bottles after seven
uses. This amount of glass, normalized in function of the FU of the study was very low
(about 64 g). However, it was responsible for significant environmental burdens because
of its energy-intensive production process [29]. Obviously, the amount of glass to be pro-
duced can be decreased by increasing the number of reuses. Consequently, the packaging
production phase could be responsible for significantly lower impacts. On the other hand,
the environmental benefits (i.e., avoided impacts) due to the end-of-life phase of the
PS1_GLASS system were mainly due to the recycling processes of aluminium and glass
amounts.
Another key aspect of the PS1_GLASS system was the distribution phase that af-
fected the results for all the impact categories providing a high contribution to the total
impacts of the system. This contribution was greater than 50% in terms of global warming
potential and fossil resources scarcity. This aspect emerged even in the study of Tua et al.
(2020) [30], where the authors pointed out that the contribution of the distribution can
reach 80% of the total impacts of the reusable glass bottles.
95.0109.0
95.0122.6
10.76.2
10.7
6.2
109.2
55.5 84.7 43.2
-24.3
17.9
-24.3
19.9
-25
0
25
50
75
100
125
150
175
200
225
PS1_GLASS (N) PS2_PET (N) PS1_GLASS (S) PS2_PET (S)
Glo
bal
War
min
g P
ote
nti
al (g
CO
2eq
.)
Packaging production Bott. Plant operations Distribution End of Life
166.1
190.7
188.5 191.9
201.0
130.5
201.0
146.7
19.1
8.2
19.1
8.2
115.4
60.6
89.3
45.3
-28.7 -19.5 -28.7 -21.8
-50
0
50
100
150
200
250
300
350
PS1_GLASS (N) PS2_PET (N) PS1_GLASS (S) PS2_PET (S)
F. P
. Mat
ter
Fo
rmat
ion
(m
g P
M2.
5 eq
.)
Packaging production Bott. Plant operations Distribution End of Life
280.6306.8
179.8 178.5
535.1
334.5
535.1
376.2
42.3
25.3
42.3
25.3
266.6
138.4
206.7
105.3
-92.1-44.8
-92.1 -50.2
-100
0
100
200
300
400
500
600
700
800
900
PS1_GLASS (N) PS2_PET (N) PS1_GLASS (S) PS2_PET (S)
Terr
estr
ial A
cid
ific
atio
n (m
g S
O2
eq.)
Packaging production Bott. Plant operations Distribution End of Life
692.0
752.0
453.4 456.6
25.2
51.8
25.2
58.4
37.2
18.7
28.8
14.6
-3.9-9.5
-3.9-10.7
-20
-10
0
10
20
30
40
50
60
70
80
PS1_GLASS (N) PS2_PET (N) PS1_GLASS (S) PS2_PET (S)
Fo
ssil
Res
ou
rces
Sca
rcit
y (g
Oil
eq.)
Packaging production Bott. Plant operations Distribution End of Life
52.8
61.2
62.764.0
Figure 4. Environmental impacts of the life cycle stages of the packaging systems for natural and sparkling water calculatedwith the most significant midpoint categories for this study: (a) Global warming; (b) Fine particulate matter formation(c) Terrestrial acidification (d) Fossil resources scarcity.
Looking at the PS1_GLASS system, it is worth noting that the highest contributionto the impacts of the packaging production phase was mainly due to the production ofthe glass amount necessary for the new glass bottles replacing the reusable bottles afterseven uses. This amount of glass, normalized in function of the FU of the study wasvery low (about 64 g). However, it was responsible for significant environmental burdensbecause of its energy-intensive production process [29]. Obviously, the amount of glassto be produced can be decreased by increasing the number of reuses. Consequently, thepackaging production phase could be responsible for significantly lower impacts. On theother hand, the environmental benefits (i.e., avoided impacts) due to the end-of-life phaseof the PS1_GLASS system were mainly due to the recycling processes of aluminium andglass amounts.
Another key aspect of the PS1_GLASS system was the distribution phase that affectedthe results for all the impact categories providing a high contribution to the total impacts ofthe system. This contribution was greater than 50% in terms of global warming potentialand fossil resources scarcity. This aspect emerged even in the study of Tua et al. (2020) [30],where the authors pointed out that the contribution of the distribution can reach 80% ofthe total impacts of the reusable glass bottles.
In the case of sparkling water (PS1_GLASS (S)), the contribution of this phase tothe total impacts was less significant due to the lower distribution distance: this was theonly difference between the life cycle impacts of PS1_GLASS (N) and PS1_GLASS (S).Instead, for all the packaging systems considered, the bottling plant operations provided anegligible contribution compared to those provided by the other phases: this occurred forall the impact categories considered.
Looking at the PS2_PET system, the results highlighted that the production phase ofthe packaging components was the most impactful for all the impact categories and its

Recycling 2021, 6, 50 11 of 13
contribution to the total impacts of the system was between 60% and 90% depending onthe impact category and the type of bottled water (natural or sparkling water).
In the case of sparkling water (PS1_PET (S)), the production phase provided a highercontribution because of the higher weight of PET bottles.
The high impacts of the production phase of the PS2_PET system was mainly due tothe significant environmental burdens derived from the PET granulate production [15,31]especially because, in this case study, the PET bottle was produced with 100% virgin PET.Using an amount of recycled PET in the bottle production could improve the environmentalperformance of the system [12,32]. About the distribution phase, the results showed thatthe contribution of this life cycle step to the impacts of PS2_PET was lower than PS1_GLASSbecause the former is much lighter, and this means lower fuel consumption as well aslower emissions during the transport phase.
Finally, focusing on the end-of-life phase of the two packaging alternatives, it is worthnoting that the glass system registered higher environmental benefits mainly due to therecycling processes of the packaging materials [20]. The end-of-life of the PET system wasless advantageous in environmental terms because of two main factors: the lower recyclingrate and the lower quality of the secondary raw material produced by the recycling processcompared to the virgin material [4].
4. Conclusions
The potential life cycle impacts of reusable glass bottles and PET bottles were com-pared to identify the most sustainable packaging system for the natural and sparklingwater bottled and commercialized by an Italian mineral water company.
The results of the analysis highlighted that the PET bottle packaging system wasglobally the most environmentally sound solution for natural water, while the environmen-tal performances of the two packaging systems for sparkling water were similar and thebest alternative can vary in function of the impact category. The differences in the resultsbetween natural and sparkling water were mainly due to the greater weight of PET bottlesas well as the lower distribution distance occurring in the case of sparkling water. Thenumber of reuses for glass bottles and the distribution distance were the two parametersthat influenced the results of the study the most. As the number of reuses increases andthe distribution distances decrease, the environmental performance of the reusable glassbottle improves significantly. In this sense, a more careful management of the reusableglass bottles would be appropriate to increase the number of reuses. Therefore, the reuseprogram could be improved by the company involving customers with communicationcampaigns on the environmental benefits of the glass reuse.
The bottle production phase was the most impactful life cycle step of the PET bottlepackaging system for all the impact categories: this was mainly due to the production of100% virgin PET granulate used for the bottles. The environmental performances of thePET system could be improved using an amount of recycled PET in the bottle production.In this regard, the bottling company could act by purchasing PET preforms containing apercentage of Recycled PET (R-PET) and accordingly by informing consumers about theenvironmental advantages obtainable using the R-PET bottles.
Finally, the study highlights that currently it is not possible to determine which ofthe two alternative systems is the most sustainable packaging solution since it dependson the variation of the key factors identified in the analysis. Therefore, the adoption ofthe life cycle perspective pointed out that it is wrong to assume a priori that a reusedglass bottle is better than a PET bottle and specific LCA analysis should be conducted on acase-by-case basis.

Recycling 2021, 6, 50 12 of 13
Author Contributions: Conceptualization, G.D.F. and C.F.; methodology, G.D.F. and C.F.; software,G.D.F. and C.F.; validation, G.D.F. and C.F.; formal analysis, G.D.F. and C.F.; investigation, G.D.F.,V.P. and C.F.; resources, G.D.F., V.P. and C.F.; data curation, G.D.F., V.P. and C.F.; writing—originaldraft preparation, G.D.F. and C.F.; writing—review and editing, G.D.F. and C.F.; visualization, G.D.F.and C.F.; supervision, G.D.F. and C.F. All authors have read and agreed to the published version ofthe manuscript.
Funding: This research received no external funding.
Institutional Review Board Statement: Not applicable.
Informed Consent Statement: Not applicable.
Data Availability Statement: The data presented in this study are available on request from thecorresponding author.
Conflicts of Interest: The authors declare no conflict of interest.
References1. Schwarz, A.E.; Ligthart, T.N.; Boukris, E.; van Harmelen, T. Sources, Transport, and Accumulation of Different Types of Plastic
Litter in Aquatic Environments: A Review Study. Mar. Pollut. Bull. 2019, 143, 92–100. [CrossRef]2. Boesen, S.; Bey, N.; Niero, M. Environmental Sustainability of Liquid Food Packaging: Is There a Gap between Danish Consumers’
Perception and Learnings from Life Cycle Assessment? J. Clean. Prod. 2019, 210, 1193–1206. [CrossRef]3. De Feo, G.; Ferrara, C. A Procedure for Evaluating the Most Environmentally Sound Alternative between Two On-Site Small-Scale
Wastewater Treatment Systems. J. Clean. Prod. 2017, 164, 124–136. [CrossRef]4. Sazdovski, I.; Bala, A.; Fullana-i-Palmer, P. Linking LCA Literature with Circular Economy Value Creation: A Review on Beverage
Packaging. Sci. Total Environ. 2021, 771, 145322. [CrossRef]5. Kouloumpis, V.; Pell, R.S.; Correa-Cano, M.E.; Yan, X. Potential Trade-Offs between Eliminating Plastics and Mitigating Climate
Change: An LCA Perspective on Polyethylene Terephthalate (PET) Bottles in Cornwall. Sci. Total Environ. 2020, 727, 138681.[CrossRef]
6. Leivas, R.; Laso, J.; Abejón, R.; Margallo, M.; Aldaco, R. Environmental Assessment of Food and Beverage under a NEXUSWater-Energy-Climate Approach: Application to the Spirit Drinks. Sci. Total Environ. 2020, 720, 137576. [CrossRef] [PubMed]
7. Otto, S.; Strenger, M.; Maier-Nöth, A.; Schmid, M. Food Packaging and Sustainability—Consumer Perception vs. CorrelatedScientific Facts: A Review. J. Clean. Prod. 2021, 298, 126733. [CrossRef]
8. Pasqualino, J.; Meneses, M.; Castells, F. The Carbon Footprint and Energy Consumption of Beverage Packaging Selection andDisposal. J. Food Eng. 2011, 103, 357–365. [CrossRef]
9. Saleh, Y. Comparative Life Cycle Assessment of Beverages Packages in Palestine. J. Clean. Prod. 2016, 131, 28–42. [CrossRef]10. Gardas, B.B.; Raut, R.D.; Narkhede, B. Identifying Critical Success Factors to Facilitate Reusable Plastic Packaging towards
Sustainable Supply Chain Management. J. Environ. Manag. 2019, 236, 81–92. [CrossRef] [PubMed]11. Tamburini, E.; Costa, S.; Summa, D.; Battistella, L.; Fano, E.A.; Castaldelli, G. Plastic (PET) vs Bioplastic (PLA) or Refillable
Aluminium Bottles—What Is the Most Sustainable Choice for Drinking Water? A Life-Cycle (LCA) Analysis. Environ. Res. 2021,196, 110974. [CrossRef] [PubMed]
12. Horowitz, N.; Frago, J.; Mu, D. Life Cycle Assessment of Bottled Water: A Case Study of Green2O Products. Waste Manag. 2018,76, 734–743. [CrossRef]
13. Camaratta, R.; Volkmer, T.M.; Osorio, A.G. Embodied Energy in Beverage Packaging. J. Environ. Manag. 2020, 260, 110172.[CrossRef] [PubMed]
14. Coelho, P.M.; Corona, B.; ten Klooster, R.; Worrell, E. Sustainability of Reusable Packaging–Current Situation and Trends. Resour.Conserv. Recycl. X 2020, 6, 100037. [CrossRef]
15. Garfí, M.; Cadena, E.; Sanchez-Ramos, D.; Ferrer, I. Life Cycle Assessment of Drinking Water: Comparing Conventional WaterTreatment, Reverse Osmosis and Mineral Water in Glass and Plastic Bottles. J. Clean. Prod. 2016, 137, 997–1003. [CrossRef]
16. Stefanini, R.; Borghesi, G.; Ronzano, A.; Vignali, G. Plastic or Glass: A New Environmental Assessment with a Marine LitterIndicator for the Comparison of Pasteurized Milk Bottles. Int. J. Life Cycle Assess. 2021, 26, 767–784. [CrossRef]
17. Błazejewski, T.; Walker, S.R.; Muazu, R.I.; Rothman, R.H. Reimagining the Milk Supply Chain: Reusable Vessels for Bulk Delivery.Sustain. Prod. Consum. 2021, 27, 1030–1046. [CrossRef]
18. Cleary, J. Life Cycle Assessments of Wine and Spirit Packaging at the Product and the Municipal Scale: A Toronto, Canada CaseStudy. J. Clean. Prod. 2013, 44, 143–151. [CrossRef]
19. Almeida, C.M.V.B.; Rodrigues, A.J.M.; Agostinho, F.; Giannetti, B.F. Material Selection for Environmental Responsibility: TheCase of Soft Drinks Packaging in Brazil. J. Clean. Prod. 2017, 142, 173–179. [CrossRef]
20. Simon, B.; Amor, M.B.; Földényi, R. Life Cycle Impact Assessment of Beverage Packaging Systems: Focus on the Collection ofPost-Consumer Bottles. J. Clean. Prod. 2016, 112, 238–248. [CrossRef]

Recycling 2021, 6, 50 13 of 13
21. International Organization for Standardization (ISO 14040). Environmental Management—Life Cycle Assessment—Principles andFramework: International Standard 14040; International Organization for Standardization: Geneva, Switzerland, 2006.
22. International Organization for Standardization (ISO 14044). Environmental Management—Life Cycle Assessment—Requirements andGuidelines; International Organization for Standardization: Geneva, Switzerland, 2006.
23. Ferrara, C.; De Feo, G. Comparative Life Cycle Assessment of Alternative Systems for Wine Packaging in Italy. J. Clean. Prod.2020, 259, 120888. [CrossRef]
24. CiAl. Risultati Raccolta e Riciclo Alluminio 2019 (Results of Collection and Recycling of Aluminium 2019). Available online:http://www.cial.it/risultati-riciclo-alluminio/ (accessed on 3 May 2021).
25. CoReVe. I Dati Della Raccolta del Vetro nel 2019 (Data of Glass Collection in 2019). Available online: https://coreve.it/wp-content/uploads/2020/10/PSP_2019_2020.pdf (accessed on 14 July 2021).
26. Comieco. Raccolta, Riciclo e Recupero Di Carta e Cartone 2019—25 Rapporto (Collection, Recycling and Recovery of Paper andCardboard 2019 e 25th Report). Available online: https://www.comieco.org/downloads/13484/8081/COMIECO_25Rapporto-2020_21x21cm_10_web.pdf (accessed on 3 May 2021).
27. Corepla, 2019. Rapporto Di Sostenibilita 2019 (Sustainability Report 2019). Available online: https://www.corepla.it/documenti/060bbd18-7fbf-4b76-b9b8-d28f4a973607/RELAZIONE+SULLA+GESTIONE+2019.pdf (accessed on 3 May 2021).
28. Huijbregts, M.A.J.; Steinmann, Z.J.N.; Elshout, P.M.F.; Stam, G.; Verones, F.; Vieira, M.; Zijp, M.; Hollander, A.; van Zelm, R.ReCiPe2016: A Harmonised Life Cycle Impact Assessment Method at Midpoint and Endpoint Level. Int. J. Life Cycle Assess. 2017,22, 138–147. [CrossRef]
29. Amienyo, D.; Camilleri, C.; Azapagic, A. Environmental Impacts of Consumption of Australian Red Wine in the UK. J. Clean.Prod. 2014, 72, 110–119. [CrossRef]
30. Tua, C.; Grosso, M.; Rigamonti, L. Reusing Glass Bottles in Italy: A Life Cycle Assessment Evaluation. Procedia CIRP 2020,90, 192–197. [CrossRef]
31. Kang, D.; Auras, R.; Singh, J. Life Cycle Assessment of Non-Alcoholic Single-Serve Polyethylene Terephthalate Beverage Bottlesin the State of California. Resour. Conserv. Recycl. 2017, 116, 45–52. [CrossRef]
32. Fantin, V.; Scalbi, S.; Ottaviano, G.; Masoni, P. A Method for Improving Reliability and Relevance of LCA Reviews: The Case ofLife-Cycle Greenhouse Gas Emissions of Tap and Bottled Water. Sci. Total Environ. 2014, 476–477, 228–241. [CrossRef] [PubMed]
Related Documents