Welcome message from author
This document is posted to help you gain knowledge. Please leave a comment to let me know what you think about it! Share it to your friends and learn new things together.
Transcript
Kolar DistrictHuman Development Report, 2014
Zilla Panchayat, KolarAnd
Planning, Programme Monitoring and Statistics Department,Government of Karnataka
District Human Development Report (Kolar)
Copyright : Planning, Programme Monitoring and Statistics
Department, Government of Karnataka
Published by : Zilla Panchayat Kolar, Government of Karnataka
First Published : 2014
All rights reserved. No part of this publication may be reproduced,
stored or transmitted in any form by any means without the prior
permission by Zilla Panchayat and Planning, Programme Monitoring
and Statistics Department, Government of Karnataka
Printed by : (Sri Raghavendra Art Printers, Kolar)
While every care has been taken to reproduce the accurate data,
oversights/errors may occur. If found convey it to the CEO, Zilla
Panchayat Kolar and Planning, Programme Monitoring and Statis-
tics Department, Government of Karnataka
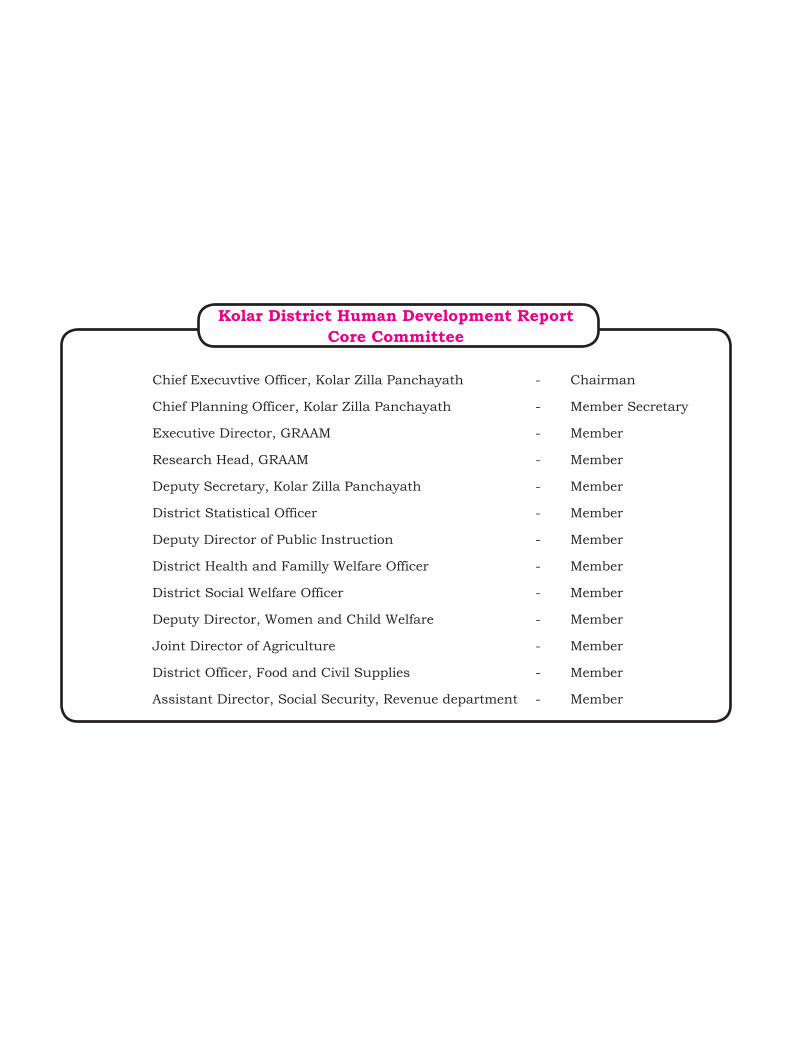
Kolar District Human Development Report Core Committee
Chief Execuvtive Officer, Kolar Zilla Panchayath - Chairman
Chief Planning Officer, Kolar Zilla Panchayath - Member Secretary
Executive Director, GRAAM - Member
Research Head, GRAAM - Member
Deputy Secretary, Kolar Zilla Panchayath - Member
District Statistical Officer - Member
Deputy Director of Public Instruction - Member
District Health and Familly Welfare Officer - Member
District Social Welfare Officer - Member
Deputy Director, Women and Child Welfare - Member
Joint Director of Agriculture - Member
District Officer, Food and Civil Supplies - Member
Assistant Director, Social Security, Revenue department - Member

VIDHANA SOUDHA BANGALORE-560 001
CM/PS/234/2014
Date: 27-10-2014
SIDDARAMAIAH MESSAGE
CHIEF MINISTER
I am delighted to learn that the department of planning programme Monitoring and statistics is bringing out District Human Development Reports for all the 30 districts of the State, simultaneously.
Karnataka is consistently striving to improve human development parameters in education, nutrition and health through many initiatives and well-conceived programmes. However, it is still a matter of concern that certain pockets of the state have not shown as much improvement as desired in the human development parameters. Human resource is the real wealth of any state. Sustainable growth and advancement is not feasible without human development. It is expected that these reports will throw light on the unique development challenges within each district, and would provide necessary pointers for planners and policy makers to address these challenges.
The District Human Development Reports are expected to become guiding documents for planning and implementation of programmers within the districts. I urge the members of parliament, Legislators, Zilla Panchayath, Taluk Panchayath and Gram Panchayath Members, vis-a-vis representatives of Urban Local Bodies to make conscious attempt to understand the analysis that has been provided in the district human development reports and strive hard to ensure that the identified gaps are bridged through effective planning and implementation.
A number of people from many walks of life including administrators, academicians and people representatives have contributed in making of these reports. I commend each and every one associated with the preparation of the District Human Development Reports. I acknowledge the efforts put in by district committees headed by Chief Executive Officers and Officers of the planning Department in completing this challenges task.
It gives me great pride to share with you that Karnataka is the first State in the country to prepare district Human Development Reports for all the districts. I am hopeful that this initiative will spur us to double our efforts to make Karnataka, a more equitable progressive state.
i
MESSAGE
I am happy to learn that the District Human Development Reports (DHDRs) for all the 30 districts in the state are being placed in public domain shortly. A painstaking and massive effort has gone into preparation of these reports. I heartily congratulate the Zilla Panchayaths and the Planning Departments for this commendable work.
The reports, I am sure, would help policy makers, administrators, researchers, social organizations and the public at large to understand the critical concerns of human developments in the Districts and Taluks of our State and also to bridge such deprivations by initiating suitable policy and programme interventions.
Room No 444,4454th floor, Vikasa Soudha
Bangalore-560 001Res. No.080-22343804
22343807
S.R PATILMinister for planning & Statistics, IT & BT,Science & Technologyand Bagalkot District Incharge Minister
ii
U T KHADERMinister for Health & family WelfareGovt of Karnataka andInchage District Minister, Kolar District
MESSAGE BY HONOURABLE DISTRICT MINISTER
The ultimate goal of development is human progress which helps people to constant-ly expand their capabilities to lead better and dignified lives. For this, each individual of a region has to have the opportunity to lead a long and healthy life, be educated and have adequate employment opportunities to earn sufficient income required to lead a decent life. Further, the vulnerable sections of the society –women, marginalized groups and minorities need special attention through appropriate policy interventions.
Kolar District Human Development Report provides an in-depth analysis of the vari-ous dimensions of development of Kolar. It allows us to critically evaluate the present status of development and gives different options available for progressing further in the path of development. The report is hence, a critical input for planning and implementation of various welfare schemes in the district.
I am sure that the findings of the study and the recommendations made will help the district administration considerably in planning the implementation of various state and central government programmes and providing sufficient priority to issues of immediate con-cern.
I congratulate the ZP of Kolar for successfully completing this difficult endeavour. I also thank Grassroots Research And Advocacy Movement (GRAAM), Mysuru who provided the overall technical support in preparing this report. I hope this report serves as a starting point for a broader discussion on development in the Panchayat Raj Institutions and Urban Local Bodies of the district leading to effective implementation of government programmes and schemes.
iii
Room No 344,355 3rd floor, Vikasa Soudha
Bangalore-560 001 Ph. No.080-22034783
22383418
Smt. Rathnamma Nanjegowda Zilla Panchayat,President C.B. Pura Road, KolarZilla Panchayath, Kolar Ph.: 08152-240648,
Mob.: 94818 29999
MESSAGE BY PRESIDENT, ZILLA PANCHAYAT, KOLAR
It is a matter of pride to see the completion of the Kolar District Human Development Report 2014. This Human Development Report is a commendable effortin documenting all aspects of human development including education, health, income, poverty, employment, gender issues and governance. This report is going to strengthen the process of grassroots level planning and implementing the effective programs in future. The DHDR-Kolar has been successful in bringing the basic issues of development in Kolar District and its five taluks to the forefront.
The report is of considerable importance to the local-level planners, policy makers, development administrators and governmental and non-governmental institutions involved in the formulation of grassroots-level development programs. This report is particularly useful to the members of GraamPanchayaths, Taluk Panchayaths and Zilla Panchayaths since the concepts and issues discussed in this report and the wealth of information provided in the report is usually found in one book or report. Thus the report would enable them collectively formulate more meaningful and effective programme for all-round human development in the district. This report will also help the Planning Department of Zilla Panchayat, Kolar in preparing pro people development activities
I congratulate the research team of Grassroots Research And Advocacy Movement, Mysuru led by Dr. R Balasubramaniam, for bringing out this comprehensive developmental report of the district with an extensive focus on the development of five taluks of the district.
iv
Zilla Panchayat, Kolar
The task of preparation Kolar Human Development Report would not have been possible without the active support of many organizations and individuals. The report is an outcome of intensive intellectual processes as well as rigourous data collection and field visits.
We wish to thank the Department of Planning, Programme Monitoring and Statistics Department and its Human Development Division for providing the leadership role in the preparation of this report. We thank UNDP – PCI, under their project HDBI (Human Development: Towards Bridging inequalities) for supporting this initiative.
We thank Shri.Sanjiv Kumar, I.A.S., former Principal Secretary, Planning, Programme Monitoring and Statistics Department, Smt.AnitaKaul,I.A.S., former Additional Chief Secretary, Planning, Programme Monitoring and Statistics Department, Miss. V Manjula, IAS, Principal Secretary, Department of Planning and Statistics Government of Karnataka, Sri.RajivRanjan, I.F.S., Secretary, Planning, Programme monitoring and Statistics Department,Dr H. Shashidhar IAS (Retd), State level Consultant and Coordinator, Shri H. S Ashokanand, IAS, Director Advocacy, KHPT,Dr. G .S. Ganesh Prasad, Faculty, Abdul Nazir Sab State Institute For Rural Development, Prof. T.R. Chandrashekar (Retd). Kannada University,Hampi Prof N NarayanaSastri (Retd), Urban Planning Specialist, Administrative Training Institute, and other consultants and subject specialists who helped us in conceptualizing this report.
This report wouldn’t have been realized without the support of the different line departments of Kolar ZP. Specifically, the roles of the District Statistical Officer, District Health Officer, Deputy Directors of Public Instruction, Women and Child Deputy, Social Welfare, Agriculture, Horticulture, Sericulture, Animal Husbandry, Mines and Geology and other development agencies were crucial in getting the necessary secondary data for the study. We further thank the taluk officers of these line departments and taluk panchayaths.
The small area studies wouldn’t have been possible without the active support of the personnel, elected members and the people of the GraamPanchayaths where these small area studies were conducted. We thank the staff and students of the five schools which facilitated our small area study on SSLC performance. Special thanks to MYRADA and the team at Community Managed Resource Centre in Budhikote for supporting our small area study on Community Radio. We also thank the local media, students, members of self help groups and other citizens who actively participated in the taluk level workshops that enriched our understanding of local issues impacting human development in the district.
Finally, we gratefully acknowledge the support and encouragement of Kolar ZP President, Vice-President, elected members and CEO.
Dr.R BalasubramanianGrassroots Research and Advocacy Movement, Mysore
ACKNOWLEDGEMENTS
v
N.M PanaliChief Executive OfficerZilla Panchayath, Kolar
FOREWORD
The paradigm of human development has received much attention over the last few decades and has resulted in the regular publication of human development reports at the international levels. These reports help us to understand the status of development in its varied dimensions and figure out areas where individual nations and states need to concentrate on, in order to achieve holistic human development.
Development administration and rural governance in India are principally planned and implemented at the local level, by the Panchayath Raj Institutions. In this context, it is crucial to propagate the idea of human development at the sub-national levels and below for the nation to realistically progress in its human development. For this to happen, the abstract nature of the discussion on human development at the national and international levels have to transcend into contextual and practically visualizable series of local issues concerning the day-today aspects of health, education and livelihoods at the local level.
This kind of initiative will not only help in imbibing the principles of human development at the local level, but also build local capacities to address local problems with holistic and equitable interventions that aid in the rapid attainment of human development, through a bottom up process.
In this regard, the current endeavour of publishing the Kolar District Human Development Report is a significant milestone and we are happy to note that the report dillegently documents the status of progress achieved in various aspects that affect human development in the district. This report will be of great use in the design of district and taluk action plans as well as setting departmental targets and objectives.
vi
Zilla Panchayat, C.B. Pura Road, Kolar Ph.: 08152-240649,
Mob.: 94808 70000E-Mail: [email protected]
Zilla Panchayat, Kolar
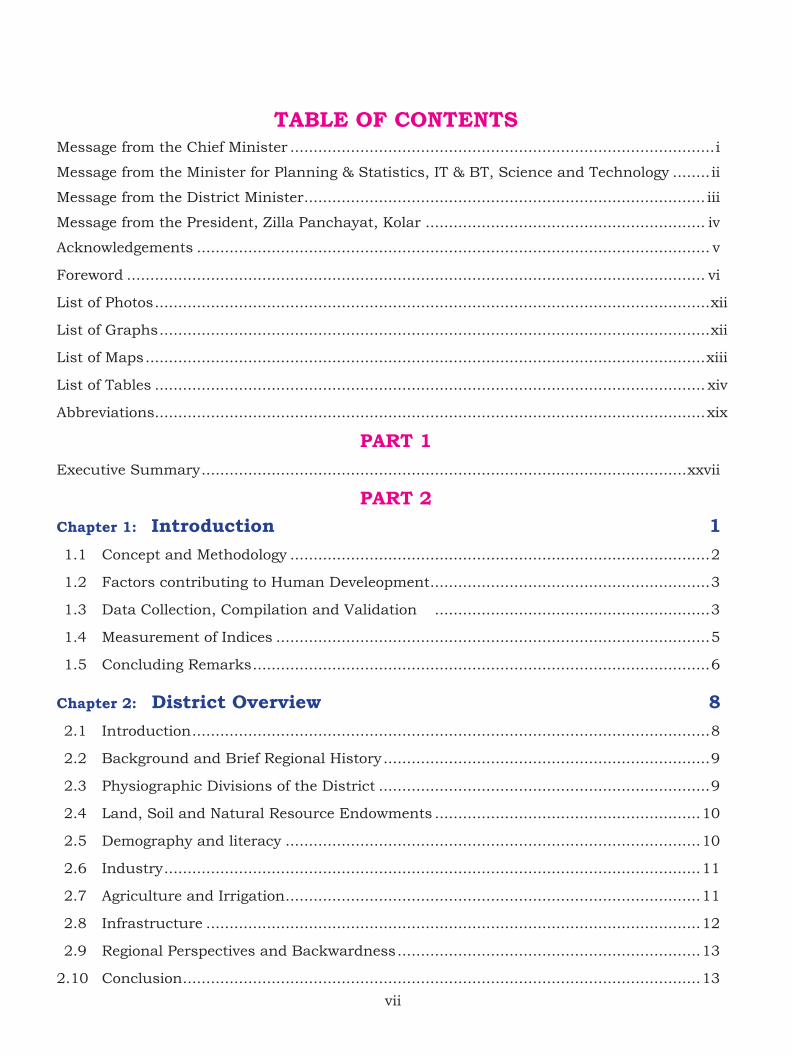
TABLE OF CONTENTSMessage from the Chief Minister ...........................................................................................i
Message from the Minister for Planning & Statistics, IT & BT, Science and Technology ........ ii
Message from the District Minister ...................................................................................... iii
Message from the President, Zilla Panchayat, Kolar ............................................................ iv
Acknowledgements .............................................................................................................. v
Foreword ............................................................................................................................ vi
List of Photos .......................................................................................................................xii
List of Graphs ......................................................................................................................xii
List of Maps ........................................................................................................................xiii
List of Tables ...................................................................................................................... xiv
Abbreviations ......................................................................................................................xix
PART 1Executive Summary ........................................................................................................xxvii
PART 2Chapter 1: Introduction 1
1.1 Concept and Methodology ..........................................................................................2
1.2 Factors contributing to Human Develeopment ............................................................3
1.3 Data Collection, Compilation and Validation ...........................................................3
1.4 Measurement of Indices .............................................................................................5
1.5 Concluding Remarks ..................................................................................................6
Chapter 2: District Overview 8
2.1 Introduction ...............................................................................................................8
2.2 Background and Brief Regional History ......................................................................9
2.3 Physiographic Divisions of the District .......................................................................9
2.4 Land, Soil and Natural Resource Endowments .........................................................10
2.5 Demography and literacy .........................................................................................10
2.6 Industry ...................................................................................................................11
2.7 Agriculture and Irrigation .........................................................................................11
2.8 Infrastructure ..........................................................................................................12
2.9 Regional Perspectives and Backwardness .................................................................13
2.10 Conclusion ...............................................................................................................13
vii
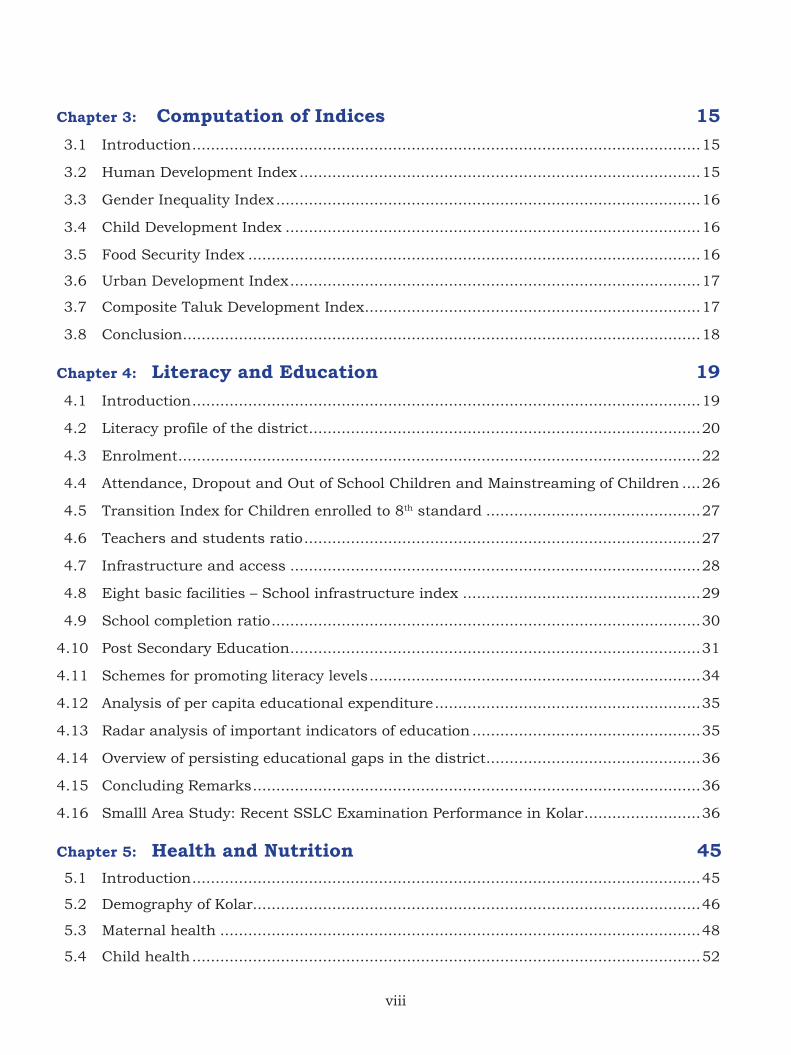
Chapter 3: Computation of Indices 15
3.1 Introduction .............................................................................................................15
3.2 Human Development Index ......................................................................................15
3.3 Gender Inequality Index ...........................................................................................16
3.4 Child Development Index .........................................................................................16
3.5 Food Security Index .................................................................................................16
3.6 Urban Development Index ........................................................................................17
3.7 Composite Taluk Development Index ........................................................................17
3.8 Conclusion ...............................................................................................................18
Chapter 4: Literacy and Education 19 4.1 Introduction .............................................................................................................19
4.2 Literacy profile of the district ....................................................................................20
4.3 Enrolment ................................................................................................................22
4.4 Attendance, Dropout and Out of School Children and Mainstreaming of Children ....26
4.5 Transition Index for Children enrolled to 8th standard ..............................................27
4.6 Teachers and students ratio .....................................................................................27
4.7 Infrastructure and access ........................................................................................28
4.8 Eight basic facilities – School infrastructure index ...................................................29
4.9 School completion ratio ............................................................................................30
4.10 Post Secondary Education ........................................................................................31
4.11 Schemes for promoting literacy levels .......................................................................34
4.12 Analysis of per capita educational expenditure .........................................................35
4.13 Radar analysis of important indicators of education .................................................35
4.14 Overview of persisting educational gaps in the district ..............................................36
4.15 Concluding Remarks ................................................................................................36
4.16 Smalll Area Study: Recent SSLC Examination Performance in Kolar .........................36
Chapter 5: Health and Nutrition 45
5.1 Introduction .............................................................................................................45
5.2 Demography of Kolar................................................................................................46
5.3 Maternal health .......................................................................................................48
5.4 Child health .............................................................................................................52
viii
5.5 Family Welfare .........................................................................................................55
5.6 Communicable diseases ...........................................................................................56
5.7 Infrastructure and health personnel .........................................................................59
5.8 Performance of various Health Schemes ...................................................................61
5.9 Per-capita expenditure on health..............................................................................62
5.10 Radar analysis of important indicators of health ......................................................62
5.11 Performance and Inadequacies of Health Care System..............................................63
Chapter 6: Income, Poverty and Employment 64
6.1 Introduction .............................................................................................................64
6.2 Measurement of income ...........................................................................................64
6.3 District and Taluk Income ........................................................................................65
6.4 Agriculture: Cropping Pattern, Irrigation, and Livestock ...........................................70
6.5 Industries ................................................................................................................72
6.6 Mining and Minerals ................................................................................................74
6.7 Poverty alleviation ....................................................................................................74
6.8 Employment and Unemployment .............................................................................76
6.9 Child Labour ............................................................................................................79
6.10 Radar analysis of GTDP composition in Kolar ...........................................................80
6.11 Concluding Remarks ................................................................................................80
6.12 Small area study: The precarious situation of Groundwater in Kolar ........................81
Chapter 7: Standard of Living 92
7.1 Introduction .............................................................................................................92
7.2 Housing status.........................................................................................................92
7.3 Households and Asset Status ...................................................................................95
7.4 Schemes for housing facilities ..................................................................................95
7.5 Drinking water .........................................................................................................98
7.6 Electricity ..............................................................................................................101
7.7 Traditional and modern fuels .................................................................................102
7.8 Sanitation ..............................................................................................................102
7.9 Concluding remarks ...............................................................................................104
ix
Chapter 8: Gender and Development 106
8.1 Introduction – Gender as Concept ..........................................................................106
8.2 Patterns in demography and health ........................................................................107
8.3 Patterns of Literacy and Enrolment ........................................................................108
8.4 Work participation trends ......................................................................................110
8.5 Trends in Political Participation ..............................................................................112
8.6 Gender differences in district and Community attitude, Social prejudice ................113
8.7 Crime against Women: Crime Data at District and Taluk Levels .............................113
8.8 Self-help groups and women empowerment ............................................................114
8.9 Govt initiatives to secure, promote and safe guard women ......................................114
8.10 Concluding Remarks .............................................................................................115
8.11 Small area study: Namma Dhwani Community Radio.............................................116
Chapter 9: Schedule Caste and Schedule Tribes 123
9.1 Introduction ...........................................................................................................123
9.2 Demographic profile ...............................................................................................123
9.3 Education profile....................................................................................................124
9.4 Health Profile .........................................................................................................127
9.5 Occupational patterns ............................................................................................127
9.6 Housing, Sanitation and Drinking Water facilities ..................................................128
9.7 Conclusion .............................................................................................................129
9.8 Small area study: Composite Dalit Development Index – A case study of Avani Gram Panchayath ................................................................130
9.9 Small area study: “Differently Abled are differently counted too” .............................136
Chapter 10: Governance and Human Development 145
10.1 Introduction ...........................................................................................................145
10.2 Local governance structure ....................................................................................145
10.3 Urban Local Bodies ................................................................................................147
10.4 Political representation...........................................................................................148
10.5 Stability of political leadership and bureaucracy ....................................................149
10.6 Fiscal trends ..........................................................................................................150
x
10.7 Progress under MGNREGA .....................................................................................152
10.8 Basic public service delivery infrastructure ............................................................153
10.9 E-governance initiatives for improving governance .................................................154
10.10 Role of NGOs and other voluntary groups ..............................................................155
10.11 Conclusion.............................................................................................................155
Chapter 11: Urban Issues in Human Development 157
11.1 Service Delivery Issues ...........................................................................................158
11.2 Water Supply, and Sanitation ................................................................................159
11.3 Solid Waste management .......................................................................................160
11.4 Urban local body expenditures ...............................................................................160
11.5 Urban Development Index ......................................................................................161
11.6 Concluding Remarks ..............................................................................................161
Chapter 12: Way Forward 163
12.1 Introduction ...........................................................................................................163
12.2 Status of Human development in Kolar ..................................................................163
12.3 Way forward ...........................................................................................................166
Annexures 168 Annexure 1: Calculation of indices ...................................................................................168
Annexure 2: Indicators used for the calculation of indices ................................................177
Annexure 3: Note on availability, limitation and quality of data ........................................185
Annexure 4: Data sources and References .......................................................................186
Annexure 5: Note on the preparation of DHDR .................................................................188
Annexure 6: Details on workshops, meetings ...................................................................189
Annexure 7: Kolar District Human Development Report ..................................................190
xi
List of Photos
Photo 1. Kolaramma temple in Kolar city ...................................................................... 11
Photo 2. Someshwara temple in Kolar .......................................................................... 12
Photo 3. Kotilingeshwara temple located in Kammasandra, Kolar ................................. 13
Photo 4. Distribution of notebooks by GP in HPS, Chikkatirupathi .................................. 28
Photo 5. ZP members visiting school in Doddashivaara, Malur ..................................... 34
Photo 6. Nutritious food being provided to mothers in Anganwadi ................................. 52
Photo 7. Pulse Polio drive in Kolar ................................................................................... 54
Photo 8. Children in Anganwadi in Kolar ........................................................................ 55
Photo 9. Health check-ups for senior citizens in Kolar ................................................... 61
Photo 10. Health check-up for Sheep ............................................................................... 72
Photo 11. Villagers collect treated water from a Reverse Osmosis plant in Hebbani ........... 90
Photo 12. Anganwadi worker and ASHAs involved in sensitization towards sanitation....... 103
Photo 13. Unhealthy living conditions in Boinahalli, Bangarpet taluk .............................. 104
Photo 14. MGNREGA works for de-silting of lakes in Kolar .............................................. 112
Photo 15. Disabled people distributed with tri-cycles in Kolar .......................................... 136
Photo 16. Field validation of PwD ................................................................................... 140
Photo 17. Construction of cattle-shed undger MGNREGA in Kolar .................................. 152
List of Graphs
Graph 1. Taluk performance in HDI ............................................................................... 15
Graph 2. Taluk performance in FSI ............................................................................... 17
Graph 3. Taluk performance in CTDI ............................................................................. 18
Graph 4. Taluk performance of Different indices ............................................................ 18
Graph 5. Literacy levels of Kolar district ........................................................................ 21
Graph 6. Radar graph of important education indicators ............................................... 35
Graph 7. Population trends of Kolar .............................................................................. 46
Graph 8. Decadal growth rates in Kolar ......................................................................... 46
Graph 9. Trends in child sex-ratio in Kolar .................................................................... 47
Graph 10. Age Pyramids of Kolar & Karnataka-2011 ....................................................... 48
Graph 11. Major causes of maternal mortality in Kolar (2011) .......................................... 52
xii
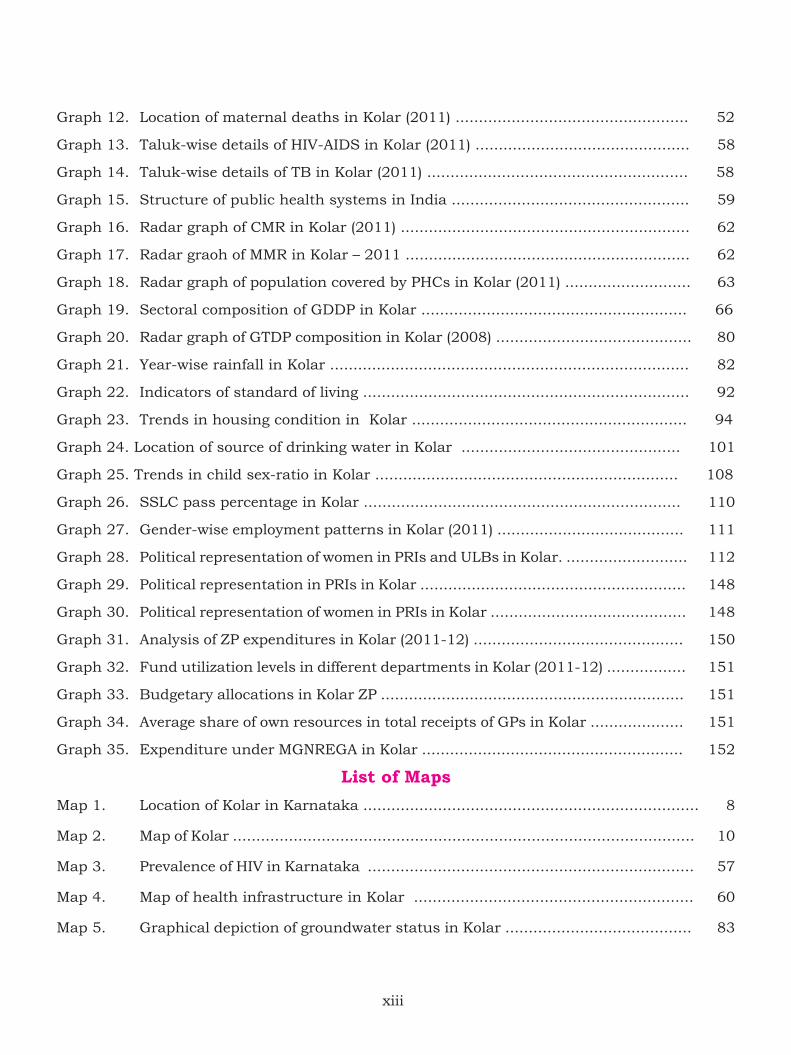
Graph 12. Location of maternal deaths in Kolar (2011) .................................................. 52
Graph 13. Taluk-wise details of HIV-AIDS in Kolar (2011) .............................................. 58
Graph 14. Taluk-wise details of TB in Kolar (2011) ........................................................ 58
Graph 15. Structure of public health systems in India ................................................... 59
Graph 16. Radar graph of CMR in Kolar (2011) .............................................................. 62
Graph 17. Radar graoh of MMR in Kolar – 2011 ............................................................. 62
Graph 18. Radar graph of population covered by PHCs in Kolar (2011) ........................... 63
Graph 19. Sectoral composition of GDDP in Kolar ......................................................... 66
Graph 20. Radar graph of GTDP composition in Kolar (2008) .......................................... 80
Graph 21. Year-wise rainfall in Kolar ............................................................................. 82
Graph 22. Indicators of standard of living ...................................................................... 92
Graph 23. Trends in housing condition in Kolar ........................................................... 94
Graph 24. Location of source of drinking water in Kolar ............................................... 101
Graph 25. Trends in child sex-ratio in Kolar ................................................................. 108
Graph 26. SSLC pass percentage in Kolar .................................................................... 110
Graph 27. Gender-wise employment patterns in Kolar (2011) ........................................ 111
Graph 28. Political representation of women in PRIs and ULBs in Kolar. .......................... 112
Graph 29. Political representation in PRIs in Kolar ......................................................... 148
Graph 30. Political representation of women in PRIs in Kolar .......................................... 148
Graph 31. Analysis of ZP expenditures in Kolar (2011-12) ............................................. 150
Graph 32. Fund utilization levels in different departments in Kolar (2011-12) ................. 151
Graph 33. Budgetary allocations in Kolar ZP ................................................................. 151
Graph 34. Average share of own resources in total receipts of GPs in Kolar .................... 151
Graph 35. Expenditure under MGNREGA in Kolar ........................................................ 152
List of Maps
Map 1. Location of Kolar in Karnataka ........................................................................ 8
Map 2. Map of Kolar ................................................................................................... 10
Map 3. Prevalence of HIV in Karnataka ...................................................................... 57
Map 4. Map of health infrastructure in Kolar ............................................................ 60
Map 5. Graphical depiction of groundwater status in Kolar ........................................ 83
xiii
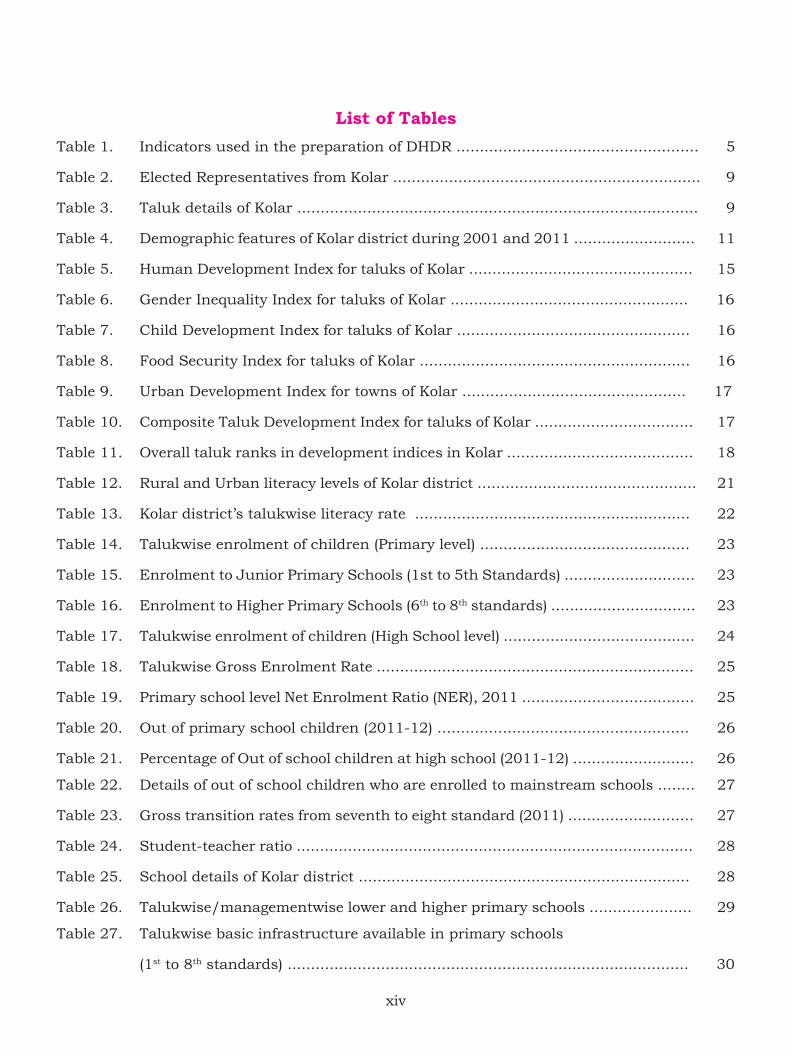
List of Tables
Table 1. Indicators used in the preparation of DHDR .................................................... 5
Table 2. Elected Representatives from Kolar .................................................................. 9
Table 3. Taluk details of Kolar ...................................................................................... 9
Table 4. Demographic features of Kolar district during 2001 and 2011 .......................... 11
Table 5. Human Development Index for taluks of Kolar ................................................ 15
Table 6. Gender Inequality Index for taluks of Kolar ................................................... 16
Table 7. Child Development Index for taluks of Kolar .................................................. 16
Table 8. Food Security Index for taluks of Kolar .......................................................... 16
Table 9. Urban Development Index for towns of Kolar ................................................ 17
Table 10. Composite Taluk Development Index for taluks of Kolar .................................. 17
Table 11. Overall taluk ranks in development indices in Kolar ........................................ 18
Table 12. Rural and Urban literacy levels of Kolar district ............................................... 21
Table 13. Kolar district’s talukwise literacy rate ........................................................... 22
Table 14. Talukwise enrolment of children (Primary level) ............................................. 23
Table 15. Enrolment to Junior Primary Schools (1st to 5th Standards) ............................ 23
Table 16. Enrolment to Higher Primary Schools (6th to 8th standards) ............................... 23
Table 17. Talukwise enrolment of children (High School level) ......................................... 24
Table 18. Talukwise Gross Enrolment Rate .................................................................... 25
Table 19. Primary school level Net Enrolment Ratio (NER), 2011 ..................................... 25
Table 20. Out of primary school children (2011-12) ...................................................... 26
Table 21. Percentage of Out of school children at high school (2011-12) .......................... 26
Table 22. Details of out of school children who are enrolled to mainstream schools ........ 27
Table 23. Gross transition rates from seventh to eight standard (2011) ........................... 27
Table 24. Student-teacher ratio ..................................................................................... 28
Table 25. School details of Kolar district ....................................................................... 28
Table 26. Talukwise/managementwise lower and higher primary schools ...................... 29
Table 27. Talukwise basic infrastructure available in primary schools
(1st to 8th standards) ...................................................................................... 30
xiv
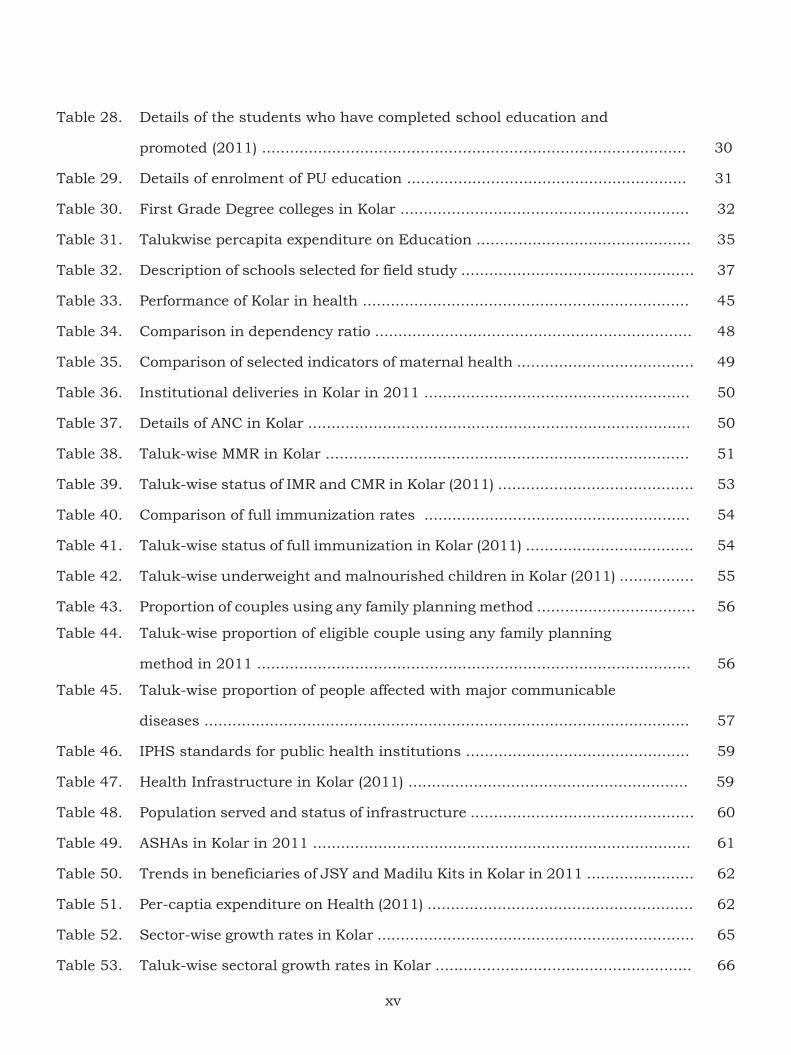
Table 28. Details of the students who have completed school education and
promoted (2011) ........................................................................................... 30
Table 29. Details of enrolment of PU education ............................................................ 31
Table 30. First Grade Degree colleges in Kolar .............................................................. 32
Table 31. Talukwise percapita expenditure on Education .............................................. 35
Table 32. Description of schools selected for field study .................................................. 37
Table 33. Performance of Kolar in health ...................................................................... 45
Table 34. Comparison in dependency ratio .................................................................... 48
Table 35. Comparison of selected indicators of maternal health ...................................... 49
Table 36. Institutional deliveries in Kolar in 2011 ......................................................... 50
Table 37. Details of ANC in Kolar .................................................................................. 50
Table 38. Taluk-wise MMR in Kolar .............................................................................. 51
Table 39. Taluk-wise status of IMR and CMR in Kolar (2011) .......................................... 53
Table 40. Comparison of full immunization rates ......................................................... 54
Table 41. Taluk-wise status of full immunization in Kolar (2011) .................................... 54
Table 42. Taluk-wise underweight and malnourished children in Kolar (2011) ................ 55
Table 43. Proportion of couples using any family planning method .................................. 56
Table 44. Taluk-wise proportion of eligible couple using any family planning
method in 2011 ............................................................................................. 56
Table 45. Taluk-wise proportion of people affected with major communicable
diseases ........................................................................................................ 57
Table 46. IPHS standards for public health institutions ................................................ 59
Table 47. Health Infrastructure in Kolar (2011) ............................................................ 59
Table 48. Population served and status of infrastructure ................................................ 60
Table 49. ASHAs in Kolar in 2011 ................................................................................. 61
Table 50. Trends in beneficiaries of JSY and Madilu Kits in Kolar in 2011 ....................... 62
Table 51. Per-captia expenditure on Health (2011) ......................................................... 62
Table 52. Sector-wise growth rates in Kolar .................................................................... 65
Table 53. Taluk-wise sectoral growth rates in Kolar ....................................................... 66
xv
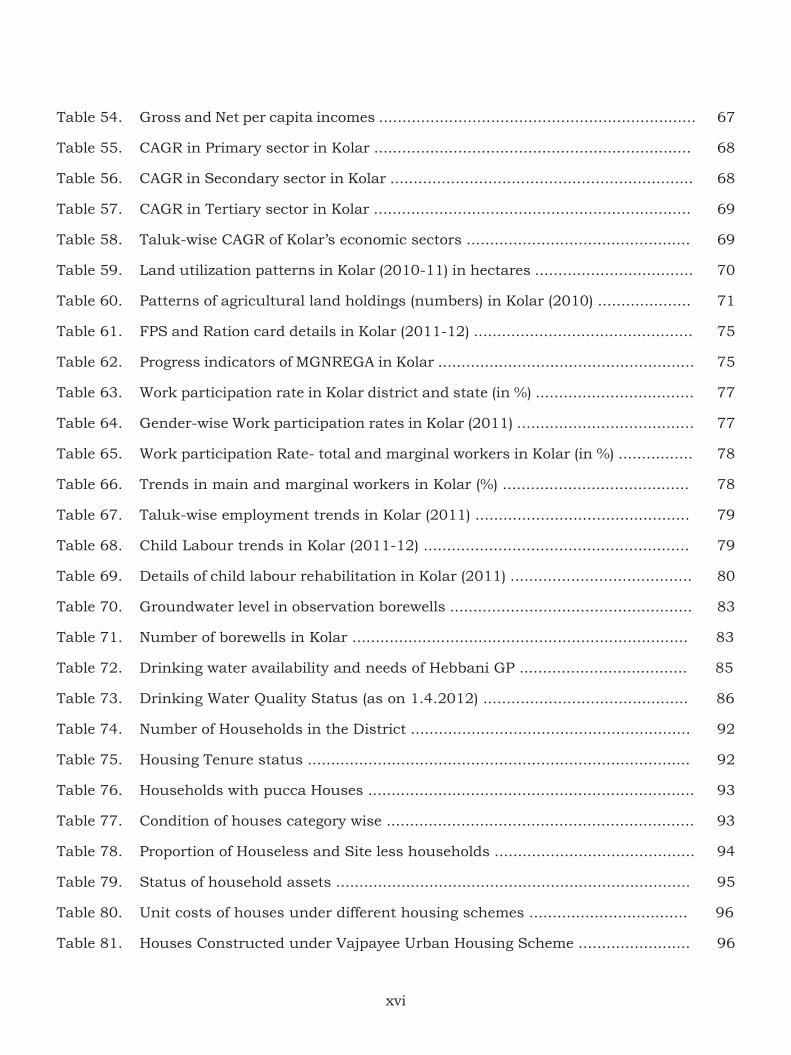
Table 54. Gross and Net per capita incomes .................................................................... 67
Table 55. CAGR in Primary sector in Kolar .................................................................... 68
Table 56. CAGR in Secondary sector in Kolar ................................................................. 68
Table 57. CAGR in Tertiary sector in Kolar .................................................................... 69
Table 58. Taluk-wise CAGR of Kolar’s economic sectors ................................................ 69
Table 59. Land utilization patterns in Kolar (2010-11) in hectares .................................. 70
Table 60. Patterns of agricultural land holdings (numbers) in Kolar (2010) .................... 71
Table 61. FPS and Ration card details in Kolar (2011-12) ............................................... 75
Table 62. Progress indicators of MGNREGA in Kolar ....................................................... 75
Table 63. Work participation rate in Kolar district and state (in %) .................................. 77
Table 64. Gender-wise Work participation rates in Kolar (2011) ...................................... 77
Table 65. Work participation Rate- total and marginal workers in Kolar (in %) ................ 78
Table 66. Trends in main and marginal workers in Kolar (%) ........................................ 78
Table 67. Taluk-wise employment trends in Kolar (2011) .............................................. 79
Table 68. Child Labour trends in Kolar (2011-12) ......................................................... 79
Table 69. Details of child labour rehabilitation in Kolar (2011) ....................................... 80
Table 70. Groundwater level in observation borewells .................................................... 83
Table 71. Number of borewells in Kolar ........................................................................ 83
Table 72. Drinking water availability and needs of Hebbani GP .................................... 85
Table 73. Drinking Water Quality Status (as on 1.4.2012) ............................................ 86
Table 74. Number of Households in the District ............................................................ 92
Table 75. Housing Tenure status .................................................................................. 92
Table 76. Households with pucca Houses ...................................................................... 93
Table 77. Condition of houses category wise .................................................................. 93
Table 78. Proportion of Houseless and Site less households ........................................... 94
Table 79. Status of household assets ............................................................................ 95
Table 80. Unit costs of houses under different housing schemes .................................. 96
Table 81. Houses Constructed under Vajpayee Urban Housing Scheme ........................ 96
xvi
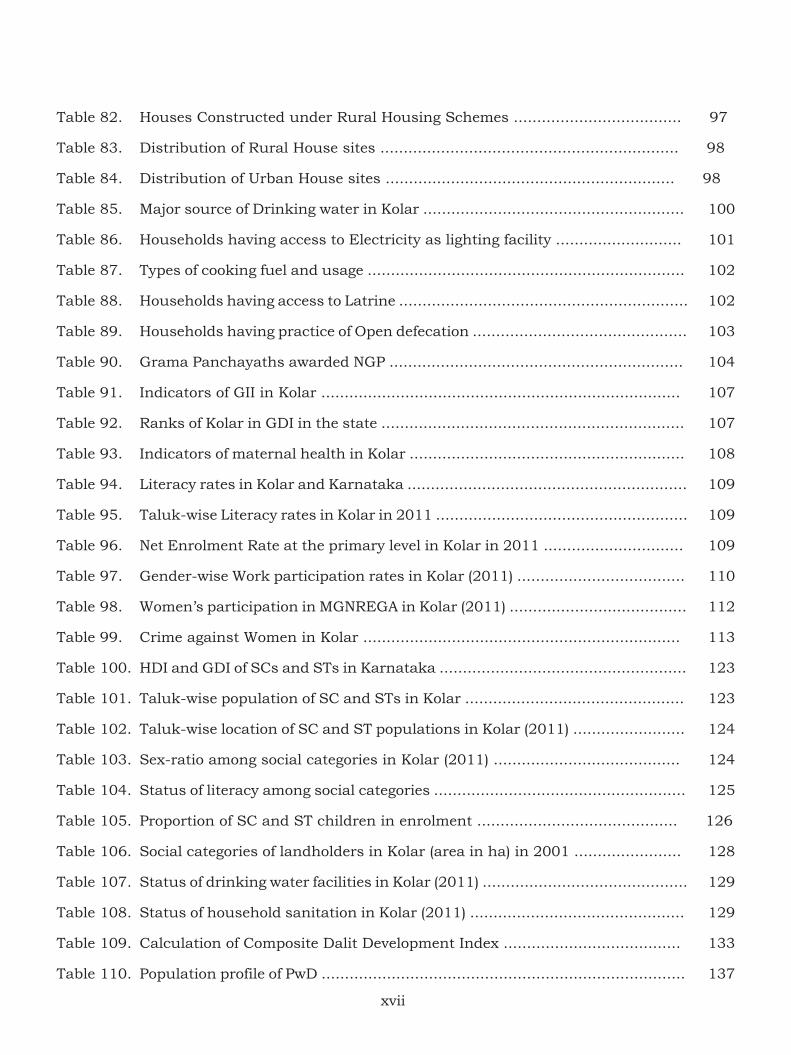
Table 82. Houses Constructed under Rural Housing Schemes .................................... 97
Table 83. Distribution of Rural House sites ................................................................ 98
Table 84. Distribution of Urban House sites .............................................................. 98
Table 85. Major source of Drinking water in Kolar ........................................................ 100
Table 86. Households having access to Electricity as lighting facility ........................... 101
Table 87. Types of cooking fuel and usage .................................................................... 102
Table 88. Households having access to Latrine .............................................................. 102
Table 89. Households having practice of Open defecation .............................................. 103
Table 90. Grama Panchayaths awarded NGP ............................................................... 104
Table 91. Indicators of GII in Kolar ............................................................................. 107
Table 92. Ranks of Kolar in GDI in the state ................................................................. 107
Table 93. Indicators of maternal health in Kolar ........................................................... 108
Table 94. Literacy rates in Kolar and Karnataka ............................................................ 109
Table 95. Taluk-wise Literacy rates in Kolar in 2011 ...................................................... 109
Table 96. Net Enrolment Rate at the primary level in Kolar in 2011 .............................. 109
Table 97. Gender-wise Work participation rates in Kolar (2011) .................................... 110
Table 98. Women’s participation in MGNREGA in Kolar (2011) ...................................... 112
Table 99. Crime against Women in Kolar .................................................................... 113
Table 100. HDI and GDI of SCs and STs in Karnataka ..................................................... 123
Table 101. Taluk-wise population of SC and STs in Kolar ............................................... 123
Table 102. Taluk-wise location of SC and ST populations in Kolar (2011) ........................ 124
Table 103. Sex-ratio among social categories in Kolar (2011) ........................................ 124
Table 104. Status of literacy among social categories ...................................................... 125
Table 105. Proportion of SC and ST children in enrolment ........................................... 126
Table 106. Social categories of landholders in Kolar (area in ha) in 2001 ....................... 128
Table 107. Status of drinking water facilities in Kolar (2011) ............................................ 129
Table 108. Status of household sanitation in Kolar (2011) .............................................. 129
Table 109. Calculation of Composite Dalit Development Index ...................................... 133
Table 110. Population profile of PwD .............................................................................. 137
xvii
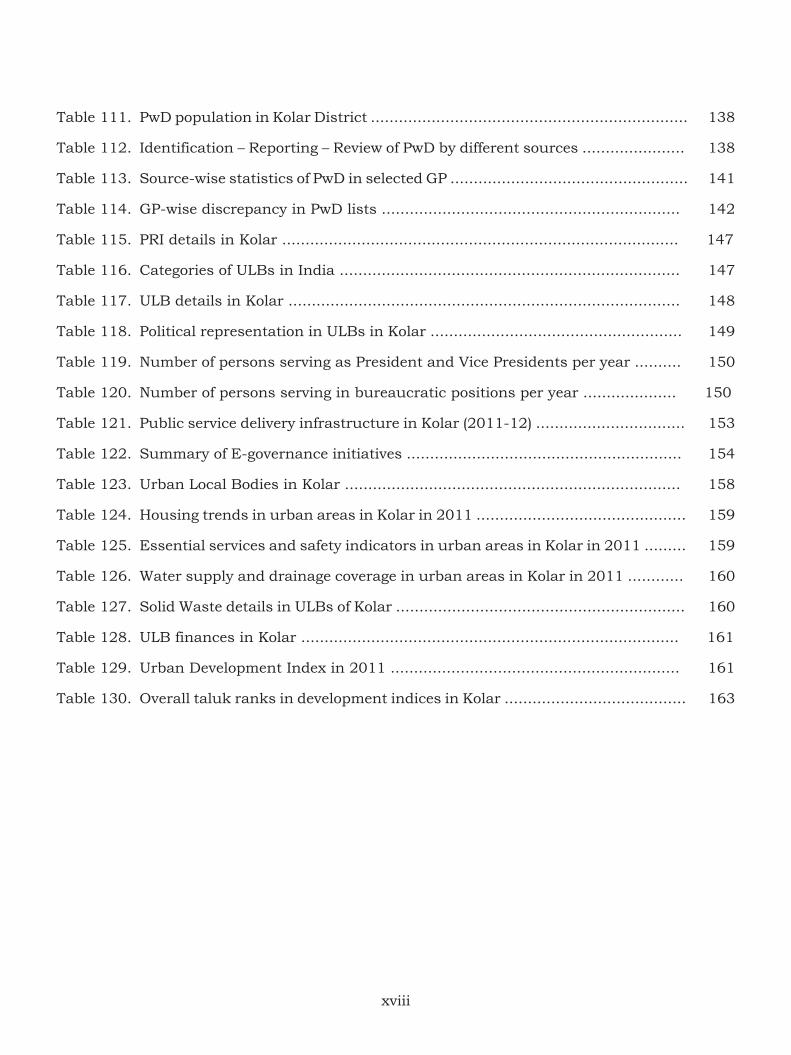
Table 111. PwD population in Kolar District .................................................................... 138
Table 112. Identification – Reporting – Review of PwD by different sources ...................... 138
Table 113. Source-wise statistics of PwD in selected GP ................................................... 141
Table 114. GP-wise discrepancy in PwD lists ................................................................ 142
Table 115. PRI details in Kolar ..................................................................................... 147
Table 116. Categories of ULBs in India ......................................................................... 147
Table 117. ULB details in Kolar .................................................................................... 148
Table 118. Political representation in ULBs in Kolar ...................................................... 149
Table 119. Number of persons serving as President and Vice Presidents per year .......... 150
Table 120. Number of persons serving in bureaucratic positions per year .................... 150
Table 121. Public service delivery infrastructure in Kolar (2011-12) ................................ 153
Table 122. Summary of E-governance initiatives ........................................................... 154
Table 123. Urban Local Bodies in Kolar ........................................................................ 158
Table 124. Housing trends in urban areas in Kolar in 2011 ............................................. 159
Table 125. Essential services and safety indicators in urban areas in Kolar in 2011 ......... 159
Table 126. Water supply and drainage coverage in urban areas in Kolar in 2011 ............ 160
Table 127. Solid Waste details in ULBs of Kolar .............................................................. 160
Table 128. ULB finances in Kolar ................................................................................. 161
Table 129. Urban Development Index in 2011 .............................................................. 161
Table 130. Overall taluk ranks in development indices in Kolar ....................................... 163
xviii
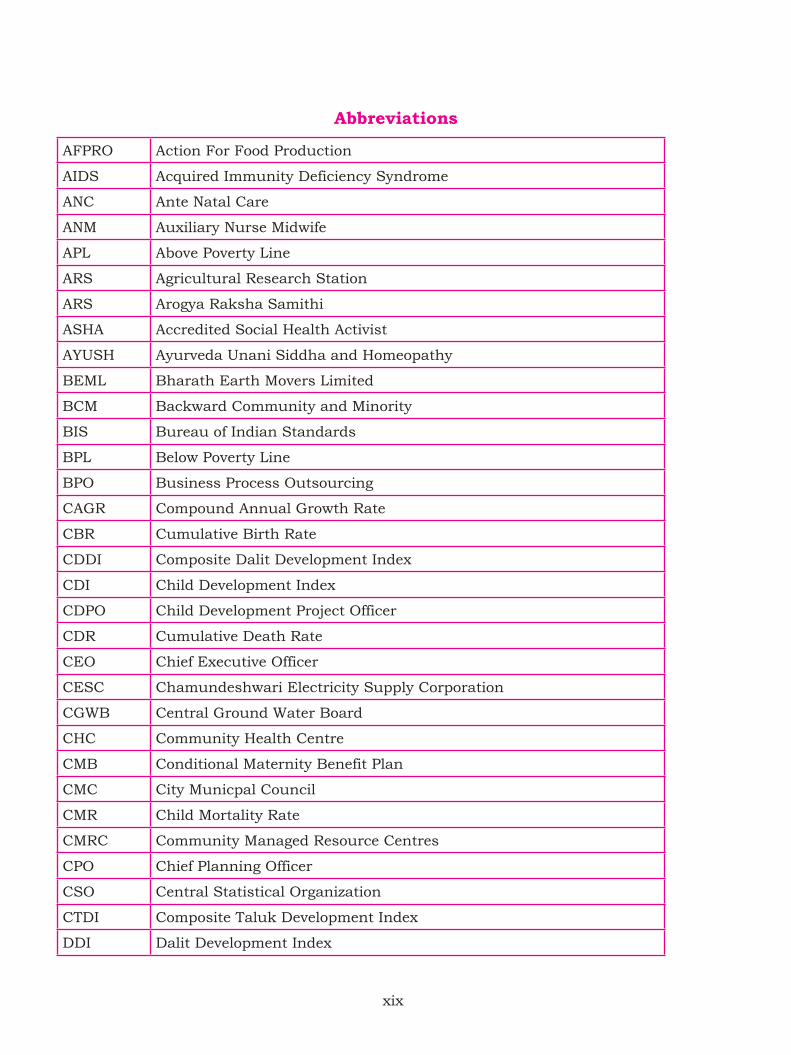
Abbreviations
AFPRO Action For Food Production
AIDS Acquired Immunity Deficiency Syndrome
ANC Ante Natal Care
ANM Auxiliary Nurse Midwife
APL Above Poverty Line
ARS Agricultural Research Station
ARS Arogya Raksha Samithi
ASHA Accredited Social Health Activist
AYUSH Ayurveda Unani Siddha and Homeopathy
BEML Bharath Earth Movers Limited
BCM Backward Community and Minority
BIS Bureau of Indian Standards
BPL Below Poverty Line
BPO Business Process Outsourcing
CAGR Compound Annual Growth Rate
CBR Cumulative Birth Rate
CDDI Composite Dalit Development Index
CDI Child Development Index
CDPO Child Development Project Officer
CDR Cumulative Death Rate
CEO Chief Executive Officer
CESC Chamundeshwari Electricity Supply Corporation
CGWB Central Ground Water Board
CHC Community Health Centre
CMB Conditional Maternity Benefit Plan
CMC City Municpal Council
CMR Child Mortality Rate
CMRC Community Managed Resource Centres
CPO Chief Planning Officer
CSO Central Statistical Organization
CTDI Composite Taluk Development Index
DDI Dalit Development Index
xix
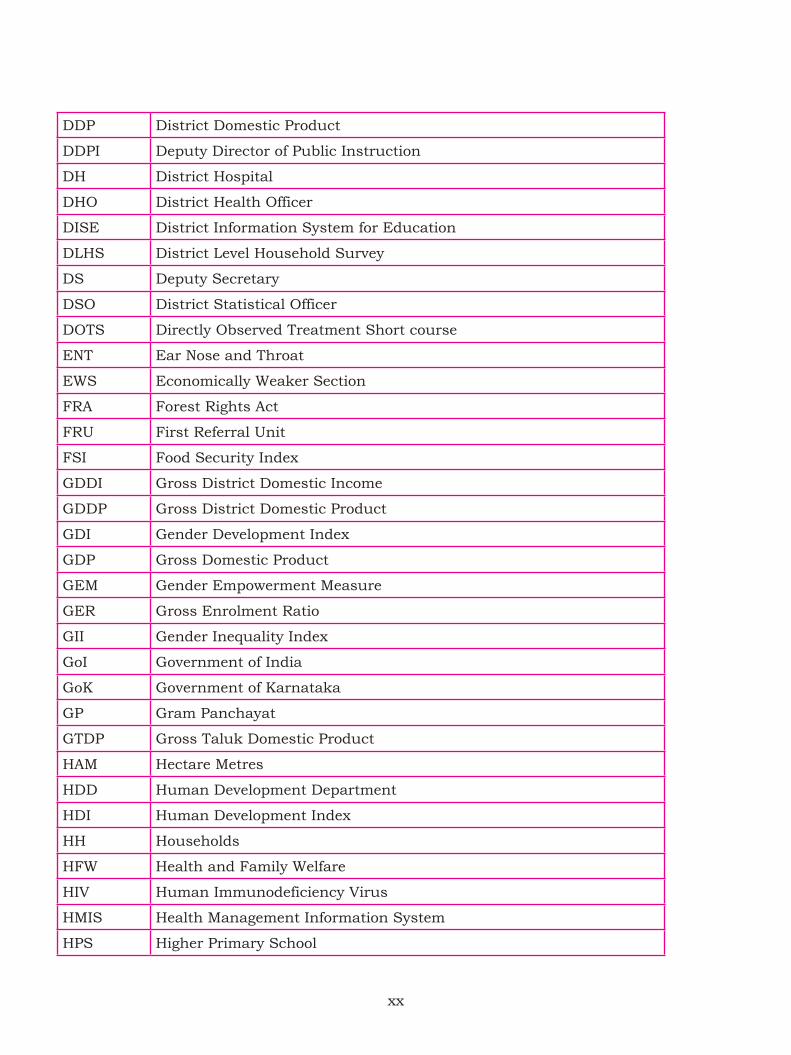
DDP District Domestic Product
DDPI Deputy Director of Public Instruction
DH District Hospital
DHO District Health Officer
DISE District Information System for Education
DLHS District Level Household Survey
DS Deputy Secretary
DSO District Statistical Officer
DOTS Directly Observed Treatment Short course
ENT Ear Nose and Throat
EWS Economically Weaker Section
FRA Forest Rights Act
FRU First Referral Unit
FSI Food Security Index
GDDI Gross District Domestic Income
GDDP Gross District Domestic Product
GDI Gender Development Index
GDP Gross Domestic Product
GEM Gender Empowerment Measure
GER Gross Enrolment Ratio
GII Gender Inequality Index
GoI Government of India
GoK Government of Karnataka
GP Gram Panchayat
GTDP Gross Taluk Domestic Product
HAM Hectare Metres
HDD Human Development Department
HDI Human Development Index
HH Households
HFW Health and Family Welfare
HIV Human Immunodeficiency Virus
HMIS Health Management Information System
HPS Higher Primary School
xx
HR Human Resources
IAY Indira Awaas Yojana
ICDS Integrated child development Services
ICO International Coffee Organization
ID Institutional Delivery
IGNWPS Indira Gandhi National Widow Pension Scheme
IHHLs Individual Household Latrines
IIT Indian Institute of Technology
IMR Infant Moratality Rate
IPHS Indian Public Health standards
IPS Indian Penal Code
ITDP Integrated Tribal Development Programme
IWMP Integrated Watershed Management Program
JE Japanese encephalitis
JFMC Joint Forest Management Committee
JSY Janani Suraksha Yojana
KGF Kolar Gold Fields
KMF Karnataka Milk Federation
KPO Knowledge Process Outsourcing
LLB Bachelor of Laws
LPCD Litres Per Capita per Day
LPG Liquid Petroleum Gas
LPS Lower Primary School
MBBS Bachelor of Medicine/Bachelor of Surgery
MCI Medical Council of India
MCH Maternal and Child Health
MCTS Mother and Child Tracking System
MDG Millenium Development Goals
MGNREGA Mahatma Gandhi National Rural Employment Guarantee Act
MIS Management Information System
MLA Member of Legislative Assembly
MMR Maternal Mortality Ratio
MP Member of Parliament
xxi
MPI Multidimensional Poverty Index
MPLAD Member of Parliament Local Area Development
MRW Multipurpose Rehabilitation Worker
MYRADA Mysore Resettlement and Development Agency
NABARD National Bank for Agriculture and Rural Development
NBA Nirmal Bharath Abhiyan
NDDP Net District Domestic Product
NDWSPP National Drinking Water Security Pilot Project
NER Net Enrolment Ratio
NFHS National Family Health survey
NGO Non Governmental Organization
NGP Nirmal Gram Puraskar
NLM National Literacy Mission
NRDWP National Rural Drinking Water Programme
NRHM National Rural Health Mission
NSSO National Sample Survey Organization
OBC Other Backward Classes
PA Prasuti Araike
PDO Panchayat Development Officer
PDS Public Distribution System
PHC Primary Health Centre
PLD Primary Land Development Bank
PNC Post Natal Care
PRA Participatory Rural Appraisal Method
PRI Panchayat Raj Institution
PPP Purchase Power Parity
PRED Panchayat Raj Engineering Department
PUC Pre-University Course
PWD People With Disabilities
RCH Reproductive and Child Health
RDPR Rural Development and Panchayat Raj
RGHCL Rajiv Gandhi Housing Corporation Limited
RGSEAG Rajiv Gandhi Scheme for Empowerment of Adolescent Girls
xxii
RIDF Rural Infrastructure Development Fund
RMK Rashtriya Mahila Kosh
RMSA Rashtriya Madhyamika Shiksha Abhiyan
SAGs Self-help Affinity Groups
SC Scheduled Caste
SC Sub-Centre
SDP State Domestic Product
SDMC School Development Management committee
SHG Self Help Group
SSA Sarva Shiksha Abhiyan
SSLC Secondary School Leaving Certificate
ST Scheduled Tribe
TB Tuberculosis
TDP Taluk Domestic Product
TFR Total Fertility Rate
TGA Total Geographical Area
TH Taluk Hospital
TMC Town Muncipal Council
TP Taluk Panchayat
TSC Total Sanitation Campaign
UDI Urban Development Index
UIP Universal Immunization Program
ULB Urban Local Body
UN United Nations
UNDP United Nations Development Programme
UNESCO United Nations Educational, Scientific and Cultural Organization
UNICEF United Nations International Children’s Emergency Fund
VHSNC Village Health Sanitation and Nutrition Committee
VRW Village Rehabilitation Workers
VWSC Village Water and Sanitation Committee
WCD Women and Child Development
WSP-SA Water and Sanitation Program for South Asia
ZP Zilla Panchayat
xxiii

Part 1

Executive Summary
The paradigm of human development views
development as the expansion of choices,
capacities and freedoms of people to lead the life
they value to its fullest and thus has caught the
attention of the world. It allows policy makers
to go beyond a few constricted indicators of
economic development and target objectives
that create favourable environment for
sustained overall growth of human population
of a region. Thus, in the last couple of decades,
there is an expansion in the ways with which
development outcomes are measured, and
moving beyond the simplistic measures of
development like the domestic product, into
issues related to rights, equity and social
justice as well as issues related to access
availability and utilization of opportunities,
resources and services, specifically related to
education, health and livelihood.
The United Nations Development Fund (UNDP) is a pioneer in promoting the paradigm of human development across all the countries in the world. The main contribution of UNDP has been the publishing of the annual human development reports at the global, national and sub-national levels. The UNDP has been publishing these annual reports since 1990. The UNDP’s methodology of measuring the quality of human development includes assessing the status of education, health and livelihoods in any given region, in a way that is comparable with other regions, to allow the disaggregated focus on specific issues to be addressed in each of these regions, together with a uniform way of measuring holistically, human development that has been achieved in these regions. Thus, the reports provide
a common platform to assess the relative
performance of nations and regions in various dimensions of human development, while at the
same time, allowing each region to understand and focus on specific development issues and bottlenecks faced by them individually.
Many nations including India have adopted the UNDPs concepts of measuring human development. They bring out national and sub-national reports that document the progress in achieving the various dimensions of development covered under the umbrella of human development. Based on this philosophy of development, the Millennium Development Goals were formed that were agreed by the 189 member nations of the United Nations. Thus, the concept of assessing human development is now being used to drive the focus of development policy onto specific areas that were hitherto considered as issues that would be taken care of, if economic progress was ensured.
The measurement of Human Develop-
ment is now being used, not only for assessing
the status and analysing trends in its three di-
mensions of education, health and livelihoods,
but also to address the gaps, by formulating
new policies, calibrating existing schemes and
changing implementation processes and pro-
cedures of government and civil society inter-
ventions, to maximize the effectiveness of such
activities.
India has experimented with sub-national human development report initiatives and two such reports have been prepared for the state of Karnataka in 1999 and 2005. These reports compiled enough empirical evidences to suggest the magnitude and the diversity of regional and social imbalances that exist in the state, resulting in considerable shifts in how these issues were addressed by policy and implementation at the state level. Similar
xxvii
experiments were carried out at the district levels in 4 districts of Karnataka (Vijayapura, Kalaburagi, Mysuru and Udupi) in 2008, which provided a micro-level, disaggregated status of human development that also inherently included analysis of various development initiatives taken up in these districts.
The district human development reports provide disaggregated status of human development at the district level and below, which allows for the prioritization of specific communities, taluks and districts in designing development strategies and action plans of various government agencies. These reports also provide a comparative empirical analysis of how different departments and different schemes are performing at the district levels and below, and provide an opportunity to rationally address such gaps.
In identifying the indicators of human development at the district level and below, the following strategy was used. The indicators chosen should be a) reflective of ground realities of human development in the three principle dimensions, b) be reliably available in all districts and c) their nature should be such that district level analysis and addressing gaps should be practically feasible. Further, for gathering the complete picture on the status of human development and its various dimensions, a total of six indices were developed, that allows for multi-dimensional analysis and human development at the district level and below, keeping in mind the realities of gender, class and caste related disparities within and between the districts of the state. These indicators are: Human Development Index (HDI), Gender Inequality Index (GII), Child Development Index (CDI), Food Security Index (FSI), Urban Development Index, Composite Taluk Development Index (CTDI) and in addition Gram Panchayat level is Composite Dalit Development Index (CDDI).
The collection of data, computation of various indices and the analysis and report writing for the district human development reports were split among multiple agencies. At the state level, the Human Development department of the Ministry of Planning, Programme Monitoring and Statistics took the lead in arriving at indicators and the methodologies for computing the indices and provided the overall leadership in developing the reports. This team was helped with subject experts and consultants. The Zilla Panchayats of various districts were responsible for the provision and validation of data and the indicators developed. The data collected for the calculation of the indicators was uniformly set for the year 2011. They also facilitated the data collection for the small area studies. For each district, a lead agency (academic and non-governmental institutions working the areas of social science research) was responsible for the compilation of all the data, calculation of different indices, analysis and report writing. The lead agencies also conducted the small area studies that provide analysis of the characteristics unique to the district. The lead agencies and the Zilla Panchayats together conducted workshops at the district and taluk levels for line departments and public representatives sensitizing them about the need to having the human development approach to planning and decision making at their respective levels.
“All in all, a set of 76 indicators were identified at the taluk level, that were used for the calculation of 6 indices computed as part of the human development report. The year 2011’s data was used for formulating the indicators. Additionally the Composite Dalit Development Index was calculated based on primary data collected from one Grama Panchayat of the district”. The taluk level indicators used in the study can be grouped in
the following categories:
xxviii
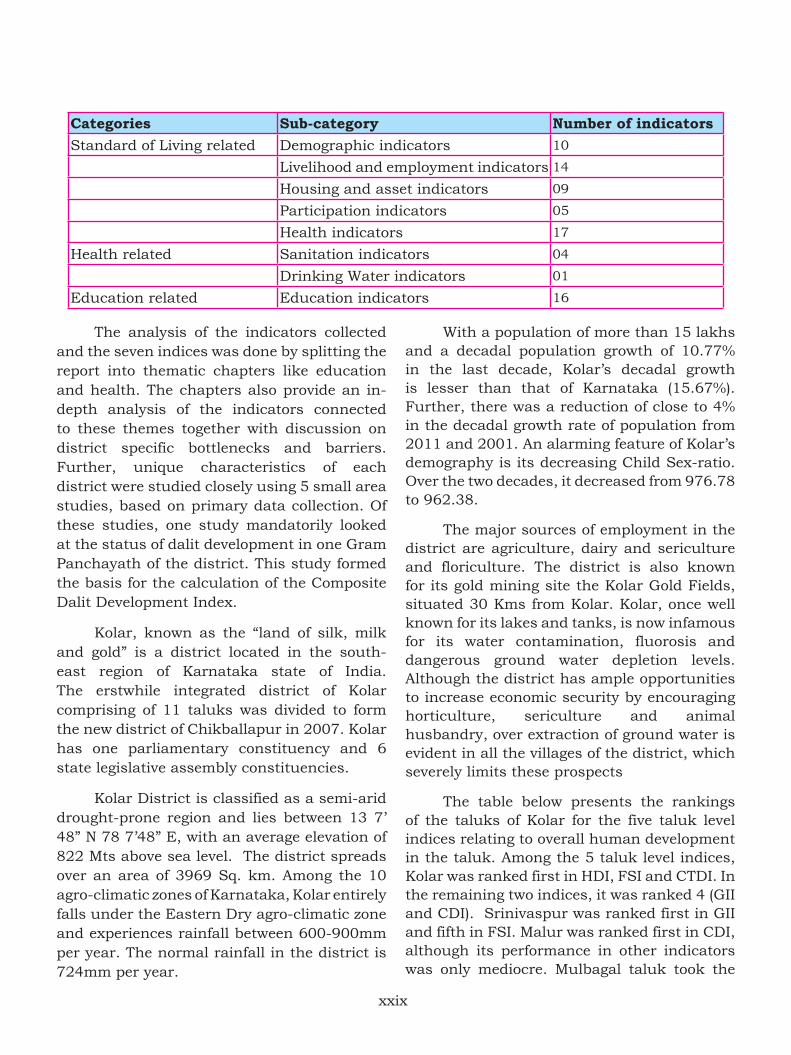
Categories Sub-category Number of indicatorsStandard of Living related Demographic indicators 10
Livelihood and employment indicators 14
Housing and asset indicators 09
Participation indicators 05
Health indicators 17
Health related Sanitation indicators 04
Drinking Water indicators 01
Education related Education indicators 16
The analysis of the indicators collected and the seven indices was done by splitting the report into thematic chapters like education and health. The chapters also provide an in-depth analysis of the indicators connected to these themes together with discussion on district specific bottlenecks and barriers. Further, unique characteristics of each district were studied closely using 5 small area studies, based on primary data collection. Of these studies, one study mandatorily looked at the status of dalit development in one Gram Panchayath of the district. This study formed the basis for the calculation of the Composite Dalit Development Index.
Kolar, known as the “land of silk, milk and gold” is a district located in the south-east region of Karnataka state of India. The erstwhile integrated district of Kolar comprising of 11 taluks was divided to form the new district of Chikballapur in 2007. Kolar has one parliamentary constituency and 6 state legislative assembly constituencies.
Kolar District is classified as a semi-arid drought-prone region and lies between 13 7’ 48” N 78 7’48” E, with an average elevation of 822 Mts above sea level. The district spreads over an area of 3969 Sq. km. Among the 10 agro-climatic zones of Karnataka, Kolar entirely falls under the Eastern Dry agro-climatic zone and experiences rainfall between 600-900mm per year. The normal rainfall in the district is 724mm per year.
With a population of more than 15 lakhs and a decadal population growth of 10.77% in the last decade, Kolar’s decadal growth is lesser than that of Karnataka (15.67%). Further, there was a reduction of close to 4% in the decadal growth rate of population from 2011 and 2001. An alarming feature of Kolar’s demography is its decreasing Child Sex-ratio. Over the two decades, it decreased from 976.78 to 962.38.
The major sources of employment in the district are agriculture, dairy and sericulture and floriculture. The district is also known for its gold mining site the Kolar Gold Fields, situated 30 Kms from Kolar. Kolar, once well known for its lakes and tanks, is now infamous for its water contamination, fluorosis and dangerous ground water depletion levels. Although the district has ample opportunities to increase economic security by encouraging horticulture, sericulture and animal husbandry, over extraction of ground water is evident in all the villages of the district, which severely limits these prospects
The table below presents the rankings of the taluks of Kolar for the five taluk level indices relating to overall human development in the taluk. Among the 5 taluk level indices, Kolar was ranked first in HDI, FSI and CTDI. In the remaining two indices, it was ranked 4 (GII and CDI). Srinivaspur was ranked first in GII and fifth in FSI. Malur was ranked first in CDI, although its performance in other indicators was only mediocre. Mulbagal taluk took the
xxix
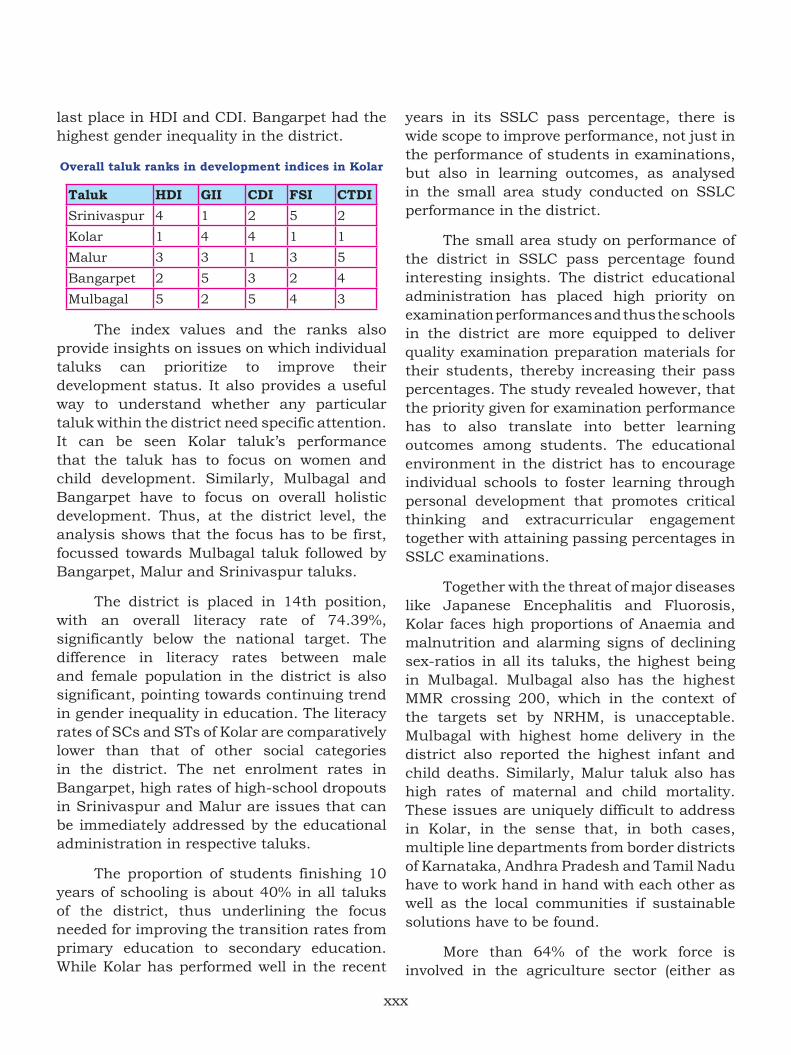
last place in HDI and CDI. Bangarpet had the highest gender inequality in the district.
Overall taluk ranks in development indices in Kolar
Taluk HDI GII CDI FSI CTDISrinivaspur 4 1 2 5 2
Kolar 1 4 4 1 1
Malur 3 3 1 3 5
Bangarpet 2 5 3 2 4
Mulbagal 5 2 5 4 3
The index values and the ranks also provide insights on issues on which individual taluks can prioritize to improve their development status. It also provides a useful way to understand whether any particular taluk within the district need specific attention. It can be seen Kolar taluk’s performance that the taluk has to focus on women and child development. Similarly, Mulbagal and Bangarpet have to focus on overall holistic development. Thus, at the district level, the analysis shows that the focus has to be first, focussed towards Mulbagal taluk followed by Bangarpet, Malur and Srinivaspur taluks.
The district is placed in 14th position, with an overall literacy rate of 74.39%, significantly below the national target. The difference in literacy rates between male and female population in the district is also significant, pointing towards continuing trend in gender inequality in education. The literacy rates of SCs and STs of Kolar are comparatively lower than that of other social categories in the district. The net enrolment rates in Bangarpet, high rates of high-school dropouts in Srinivaspur and Malur are issues that can be immediately addressed by the educational administration in respective taluks.
The proportion of students finishing 10 years of schooling is about 40% in all taluks of the district, thus underlining the focus needed for improving the transition rates from primary education to secondary education. While Kolar has performed well in the recent
years in its SSLC pass percentage, there is wide scope to improve performance, not just in the performance of students in examinations, but also in learning outcomes, as analysed in the small area study conducted on SSLC performance in the district.
The small area study on performance of the district in SSLC pass percentage found interesting insights. The district educational administration has placed high priority on examination performances and thus the schools in the district are more equipped to deliver quality examination preparation materials for their students, thereby increasing their pass percentages. The study revealed however, that the priority given for examination performance has to also translate into better learning outcomes among students. The educational environment in the district has to encourage individual schools to foster learning through personal development that promotes critical thinking and extracurricular engagement together with attaining passing percentages in SSLC examinations.
Together with the threat of major diseases like Japanese Encephalitis and Fluorosis, Kolar faces high proportions of Anaemia and malnutrition and alarming signs of declining sex-ratios in all its taluks, the highest being in Mulbagal. Mulbagal also has the highest MMR crossing 200, which in the context of the targets set by NRHM, is unacceptable. Mulbagal with highest home delivery in the district also reported the highest infant and child deaths. Similarly, Malur taluk also has high rates of maternal and child mortality. These issues are uniquely difficult to address in Kolar, in the sense that, in both cases, multiple line departments from border districts of Karnataka, Andhra Pradesh and Tamil Nadu have to work hand in hand with each other as well as the local communities if sustainable solutions have to be found.
More than 64% of the work force is involved in the agriculture sector (either as
xxx
cultivators or as agricultural labourers). However, the actual growth of agriculture and allied activities was just 3.43%, with 3 out of the 5 taluks (Kolar, Malur and Bangarpet) registering negative growth rates. The average landholding per landholder in the entire district is just under one hectare, thus largely limiting the choices of agricultural diversification thus exposing the small farmers to the risk of crop/price failure and related uncertainties associated with that crop. Asset distribution, in terms of land ownership is clearly skewed against the SC population of the district, with a disproportionately low percentage of SC households owning land in the district.
The small area study on situation of water scarcity in the district found that groundwater depletion in the district had reached a precarious situation and is visibly most likely to affect the sustenance of agriculture as a primary occupation in the district. At the same time, the health of people as a result of groundwater contamination is also a matter of concern and is only likely to worsen if not addressed immediately. Incidents of fluorosis among children are visible and interactions with the community bring to light health issues faced by them such as joint pains, etc.
While it can be argued that the ecological problems faced by the district, in terms of its alarmingly fast rates of water table depletion and ground water contamination are a result of unregulated water extraction, it is also true that this model of agricultural development triggered the growth of agriculture and horticulture sectors, on which, the majority of the people of the district are primarily dependent for their livelihoods. Immediate ways to lessen the dependence on groundwater for drinking purposes in the district is the widespread adoption of sustainable and useful rain water harvesting mechanisms. Efforts are needed to develop these rainwater harvesting systems that are suited to the needs of the district and provide both immediate and long term relief.
The presence of poverty prevents accumulation of assets and this is visible in the proportion of households in the districts not having the basic basket of assets (telephone, TV, phone/mobile two wheeler/four wheelers). This proportion is highest in Srinivaspur and Mulbagal and denotes the low standard of living in these taluks.Access to individual household latrines is only 42% in the district. Special attention is required in implementation of NGP/NBA programmes; with focus on Srinivaspur which has the least coverage. Significantly low proportion of SC and ST households were covered in the provision of drinking water (within their premises) and access to individual household latrines that shows that even with the low coverage of basic amenities in the district, vulnerable groups are worse off than others.
The small area study on Composite Dalit Development Index conducted in Avani GP of Kolar showed that caste discrimination is still prevalent and may in general be prevalent throughout the district. Some practices of discrimination were even accepted to be continuance of tradition. However, the study also found that comparatively better educated dalits (like dalit ASHAs) are making in-roads in attaining the socio-economic status that enhances their acceptability and results in lesser discrimination for them. The small area study on discrepancies in registering PwD indicates that the neglect in information collection can be attributed to the neglect of the development of PwD itself. The case study analysed the cause of this discrepancy and found that the institutional structures for catering to the overall development of PwD was ineffective and unaccountable.
Gender based disparities distinctly exist in the district and is visible in the areas of literacy, work participation (specifically under the categories of cultivators and other employments) and political representation in PRIs and ULBs. Further, Kolar also faces
xxxi
the alarming signs of declining sex-ratios in all its taluks, and very high rates of Maternal Mortality. The small area study on ‘NammaDhwani’ a Community Radio station in Budikote, provides a successful example of how a locally managed radio station can play a role in sustaining community empowerment. However, it also has a challenge in keeping itself relevant in the face of rapid advances in technology that give people more options to access information.
Bureaucratic and political stability in the ZP are issues of concern in Kolar since every single year seems to have multiple teams of bureaucratic and political leadership. Kolar requires stable leadership in guiding the district’s development efforts towards long term economic and environmental sustainability. The analysis of fiscal trends in Kolar shows that planned expenditures in the district form 37% to 43% of the overall expenditures. Increase in planned expenditures allow the district the flexibility to prioritize issues and taluks of immediate importance. Further, the analysis of resource mobilization levels of GPs in Kolar show that there are large disparities in GPs of different taluks, with Mulbagal lagging behind significantly. MGNREGA in the district shows declining trends in expenditure as well as man-days generated till 2012-13. These trends have to be analysed keeping in view the dynamics of agricultural labour and the actual labour demanded through MGNREGA in the district.
Urbanization in the district hasn’t progressed in the speed at which it has been witnessed in other districts. However, urban areas in the district haven’t been able to guarantee quality infrastructure and amenities to its citizens. The problem of water, which the entire district faces also troubles the urban areas of the district. Further, the size of two urban areas: Robertsonpet and Kolar over-rides the importance of urban infrastructure in
other towns of the district. Urbanization efforts in the district cannot ignore the disparities between different social categories.
Based on the detailed analysis of these issues, the report identifies crucial areas where the district can focus for immediate and long term strategies to increase the overall status of human development in the district. These issues are listed below
1. Attaining higher literacy rates and reducing gender disparities in literacy rates.
2. Improving the effectiveness in guaranteeing universal primary education, with special focus on Malur taluk.
3. Addressing the issue of declining sex-ratio and lagging indicators of maternal and child health, specifically in Mulbagal and Malur taluks.
4. A detailed study of ground water contamination’s impact on health and possible intervention strategies to mitigate the damages.
5. Sustainable agricultural growth in all taluks of the state, with immediate interventions to minimize water intensive agriculture, regulation of groundwater extraction and adoption rainwater harvesting mechanisms
6. Better provisioning of basic amenities like drinking water (within their premises) and access to individual household latrines for SC and ST households.
7. Conduct scientific surveys that adopt universal definitions and criterion to identify exact number of PwD and integrate the efforts of various government agencies aimed towards
development of PwD in the district.
* * * *xxxii
Part 2

1
Introduction Chapter 1
Economic development provides a narrow vision of human progress and thus, as societies evolve, there is a need for a broader paradigm to measure and understand human progress1. The human development paradigm views development as the expansion of choices, capacities and freedoms of people to lead the life they value to its fullest and thus has caught the attention of the world. It allows policy makers to go beyond a few constricted indicators of economic development and target objectives that create favourable environment for sustained overall growth of human population of a region.
This thinking has led to exploring different dimensions of development and devising new ways of measuring development through indicators developed to understand these dimensions. Thus, in the last couple of decades, there is an expansion in the ways with which development outcomes are measured, and moving beyond the simplistic measures of development like the domestic product, into issues related to rights, equity and social justice as well as issues related to access availability and utilization of opportunities, resources and services.
The United Nations Development Fund (UNDP) is a pioneer in promoting the paradigm of human development across all the countries in the world. The main contribution of UNDP has been the publishing of the annual human development reports at the global, national and sub-national levels. The UNDP has been publishing these annual reports since 1990.
1 Anand, S., & Sen, A. (2000). Human development and economic sustainability. World Development, 28(12), 2029–2049
Ranis, G., Stewart, F., & Ramirez, A. (2000). Economic growth and human development. World Development, 28(2), 197–219.
The UNDP’s methodology of measuring the quality of human development includes assessing the status of education, health and livelihoods in any given region, in a way that is comparable with other regions, to allow the disaggregated focus on specific issues to be addressed in each of these regions, together with a uniform way of measuring holistically, human development that has been achieved in these regions. Thus, the reports provide a common platform to assess the relative performance of nations and regions in various dimensions of human development, while at the same time, allowing each region to understand and focus on specific development issues and bottlenecks faced by them individually.
The concept of Human Development is now being used to measure development in a holistic sense and using this to categorize nations/regions based on status of development in different parameters of development. Moving further, based on these findings, design, implementation and monitoring of development/welfare interventions to address these specific shortfalls would be the logical closure of thinking in this holistic paradigm. Further, the concept can be used to identify and focus on targeting specific communities and populations that may be deprived of the development related interventions being implemented in an area that other communities seem to have utilized effectively2.
Many nations including India have adopted the UNDPs concepts of measuring human development. They bring out national and sub-national reports that document the progress in achieving the various dimensions
2 Planning and Statistics Department. (2005). Karnataka Human Development Report - 2005. Bengaluru: Government of Karnataka.
2
of development covered under the umbrella of human development. Based on this philosophy of development, the Millennium Development Goals were formed that were agreed by the 189 member nations of the United Nations. Thus, the concept of assessing human development is now being used to drive the focus of development policy onto specific areas that were hitherto considered as issues that would be taken care of, if economic progress was ensured.
1.1 Concept and Methodology
Since its seminal report in 1990, UNDP’s methodology for assessing human development have evolved considerably. Currently, the methodology not only includes measurement of outcome indicators of the three dimensions (education, health and livelihoods) but also consider several other indicators that provide a broad basis for the understanding and addressing of gaps in development of the particular areas of human development. Further, the methods adopted include not only the measurement of human development using the Human Development Index (HDI), but also with other indices that measure specific aspects of development like the Multi-dimensional Poverty Index (MPI), Gender Inequality Index (GDI).
The measurement of Human Development is now being used, not only for assessing the status and analysing trends in its three dimensions, but also to address the gaps, by formulating new policies, calibrating existing schemes and changing implementation processes and procedures of government and civil society interventions, to maximize the effectiveness of such activities.
Thus, sub-national human develop-ment report initiatives have been con-ducted and two such reports have been prepared for the state of Karnataka in 1999 and 2005. These reports compiled enough empirical evidences to suggest the magnitude and the diversity of re-gional and social imbalances that exist in the state, resulting in considerable shifts in how these issues were addressed by policy and implementation at the state level. Similar experiments were carried out at the district levels in 4 districts of Karnataka (Vijayapura, Kalaburagi, My-suru and Udupi), which provided a mi-cro-level, disaggregated status of human development that also inherently includ-ed analysis of various development initia-tives taken up in these districts.
The district human development reports provide disaggregated status of human development at the district level and below, which allows for the prioritization of specific communities, taluks and districts in designing development strategies and action plans of various government agencies. These reports also provide a comparative empirical analysis of how different departments and different schemes are performing at the district levels and below, and provide an opportunity to rationally address such gaps.
However, preparation of district level human development reports also comes with its own set of challenges and bottlenecks. Due to the lack of scientific management of data, the availability and reliability of disaggregated data is problematic at the district/taluk and village levels, about indicators that are traditionally used in the calculation of
3
human development at the state and national levels. For countries like India, at national and sub-national level, sample surveys allow the estimation of critical population indicators (like malnutrition, prevalence of diseases), where the estimated figures are valid at national and sub-national levels, but may not necessarily statistically be reflective of districts’ characteristics. Similarly, the analysis of human development based on broad based indicators of development (like life expectancy at birth, gini coefficient) at the micro level has the limitation of not being effectively internalized locally or have a mechanism to address these issues through policies at the district level and below.
Thus, the methodology for preparation of state-wide district human development reports has to undergo a considerable amount of tinkering with the traditional concepts of measuring and analysing human development. The indicators chosen should be a) reflective of ground realities of human development in the three principle dimensions, b) be reliably available in all districts and c) their nature should be such that district level analysis and addressing gaps should be practically feasible. Further, for gathering the complete picture on the status of human development and its various dimensions, a total of seven indices were developed, that allows for multi-dimensional analysis and human development at the district level and below, keeping in mind the realities of gender, class and caste related disparities within and between the districts of the
state.
1.2 Factors contributing to Human Develeopment
In the human development approach, the basic and critical capabilities of citizens in various dimensions of day-today living are considered. These capabilities are required for living a long and health life of dignity, to be educated to understand and utilize the opportunities the world provides and to be able to access resources needed to maintain a decent standard of living3. While these issues form the core of the human development approach, other features of the society, like treatment of women, marginalized communities and the disabled, the equality of socio-economic opportunities, equitable access to natural and social resources, effective and transparent governance mechanisms and active participation of women, minorities and vulberablie communities in political processes act as complimentary forces that affect the overall human development of a region. Creation and maintenance of infrastructure that ensures access to quality health care and safe living standards, education and employment opportunities also play a key role in contributing to human development.
1.3 Data Collection, Compilation and Validation
The collection of data, computation of various indices and the analysis and report writing for the district human development reports were split among multiple agencies. At the state level, the Human Development department of the Ministry of Planning, Programme Monitoring and Statistics took the
3 Haq, M. ul. (1996). Reflections on Human Development (OUP Catalogue). Oxford University Press.
4
lead in arriving at indicators and the
methodologies for computing the indices
and provided the overall leadership
in developing the reports. This team
was helped with subject experts and
consultants. The Zilla Panchayats of
various districts were responsible for the
provision and validation of data and the
indicators developed. The data collected
for the calculation of the indicators was
uniformly set for the year 2011. They also
facilitated the data collection for the small
area studies. For each district, a lead
agency (academic and non-governmental
institutions working the areas of social
science research) were responsible
for the compilation of all the data,
calculation of different indices, analysis
and report writing. The lead agencies also
conducted the small area studies that
provides analysis of the characteristics
unique to the district. The lead agencies
and the Zilla Panchayats together
conducted workshops at the district and
taluk levels for line departments and
public representatives sensitizing them
about the need to having the human
development approach to planning and
decision making at their respective
levels. GRAAM acted as the lead agency
in preparing the Kolar district human
development report.
The data for preparation of the seven
indices mentioned above came from a
variety of sources. As discussed earlier,
the indicators chosen for calculation of
indices had to be a) reflective of ground
realities of human development in the
three principle dimensions, b) be reliably
available in all districts and c) their
nature should be such that district level
analysis and addressing gaps should be
practically feasible.
An iterative process of the selection
of indicators was used in Kolar to arrive
at the final set of indicators for the
measurement of the indices discussed
above. At different stages of this process,
the Zilla Panchayat and the respective
line departments were involved. Line
departments were primarily responsible
for the collection and provision of data.
GRAAM compiled the data and presented
them back to the respective line
departments. The Zilla Panchayat and the
line departments validated the compiled
data, based on which the indices were
calculated. Further, the Zilla Panchayat
and line departments helped GRAAM
in selection of issues to be studied
under the small area studies for the
report and facilitated the field visits for
these studies. In some cases, specifically
related to maternal and child health
and nutrition, reliable taluk level data
weren’t available in all districts of the
state. In these cases, alternative data
sources were used. “The taluk-wise
figures for Infant, Maternal and Child
Mortality rates were based on estimated
from SRS 2011 data”
“All in all, a set of 76 indicators were
identified at the taluk level, that were used
for the calculation of 6 indices computed
as part of the human development
report. The year 2011’s data was used for
formulating the indicators. Additionally
the Composite Dalit Development Index
was calculated based on primary data
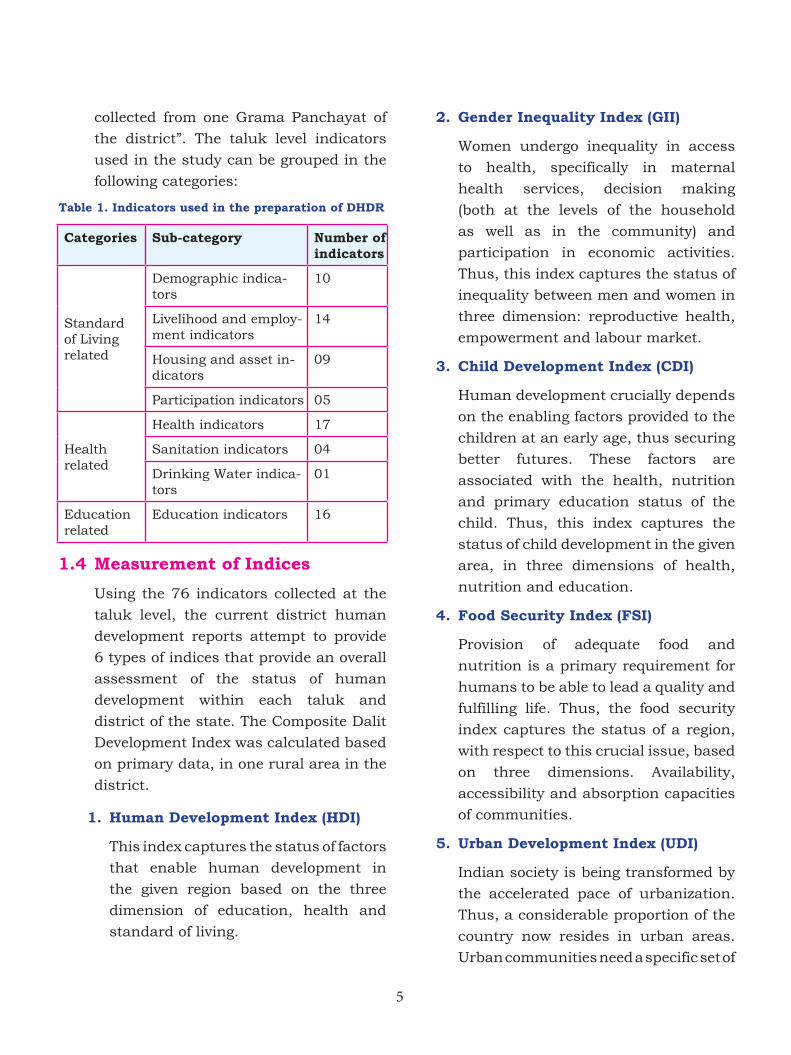
5
collected from one Grama Panchayat of
the district”. The taluk level indicators
used in the study can be grouped in the
following categories:
Table 1. Indicators used in the preparation of DHDR
Categories Sub-category Number of indicators
Standard of Living related
Demographic indica-tors
10
Livelihood and employ-ment indicators
14
Housing and asset in-dicators
09
Participation indicators 05
Health related
Health indicators 17
Sanitation indicators 04
Drinking Water indica-tors
01
Education related
Education indicators 16
1.4 Measurement of Indices
Using the 76 indicators collected at the
taluk level, the current district human
development reports attempt to provide
6 types of indices that provide an overall
assessment of the status of human
development within each taluk and
district of the state. The Composite Dalit
Development Index was calculated based
on primary data, in one rural area in the
district.
1. Human Development Index (HDI)
This index captures the status of factors
that enable human development in
the given region based on the three
dimension of education, health and
standard of living.
2. Gender Inequality Index (GII)
Women undergo inequality in access
to health, specifically in maternal
health services, decision making
(both at the levels of the household
as well as in the community) and
participation in economic activities.
Thus, this index captures the status of
inequality between men and women in
three dimension: reproductive health,
empowerment and labour market.
3. Child Development Index (CDI)
Human development crucially depends
on the enabling factors provided to the
children at an early age, thus securing
better futures. These factors are
associated with the health, nutrition
and primary education status of the
child. Thus, this index captures the
status of child development in the given
area, in three dimensions of health,
nutrition and education.
4. Food Security Index (FSI)
Provision of adequate food and
nutrition is a primary requirement for
humans to be able to lead a quality and
fulfilling life. Thus, the food security
index captures the status of a region,
with respect to this crucial issue, based
on three dimensions. Availability,
accessibility and absorption capacities
of communities.
5. Urban Development Index (UDI)
Indian society is being transformed by
the accelerated pace of urbanization.
Thus, a considerable proportion of the
country now resides in urban areas.
Urban communities need a specific set of
6
basic amenities, crucial for their overall
development. These include status of
provision of safe drinking water, solid
and liquid waste management, access
to health facilities and status of civic
security. These issues are captured in
the Urban Development Index.
6. Composite Dalit Development Index (CDDI)
Depravity of vulnerable groups
continues to be a persistent vexing
problem in development, especially in
a hierarchical society like ours. Hence,
understanding of these deprivations,
through a set of qualitative and
quantitative indicators, that provide
an understanding of the existing
seclusion and discrimination against
dalit communities is a crucial part of
analyzing human development. Thus,
the CDDI tries to capture these issues
through a mixture of quantitative and
perception based indicators, based on
a study conducted in one rural area of
the district.
7. Composite Taluk Development Index (CTDI)
The CTDI captures the overall status
of all the enabling factors and status
indicators in the dimensions of
education, health and livelihoods in the
taluk, with specific focus on existing
infrastructure in these dimensions.
It also provides interesting insights
that correlates and often contradicts
with a taluk’s position in human
development.
The technical details on the computation of
these indices is provided in Annexure 1. The
analysis of the indicators collected and the
indices was done by splitting the report into
thematic chapters like education and health.
The chapters also provide an in-depth analysis
of the indicators connected to these themes
together with discussion on district specific
bottlenecks and barriers. Further, unique
characteristics of each district were studied
closely using 5 small area studies, based on
primary data collection. Of these studies, one
study mandatorily looked at the status of dalit
development in one Gram Panchayath of the
district. This study formed the basis for the
calculation of the Composite Dalit Development
Index.
1.5 Concluding Remarks
The human development paradigm has
now gained widespread acceptance as
a standard way of understanding and
measuring development outcomes of a
region. Together with the measurement of
human development index, other related
indices of development, that focus on
specific enabling factors (like status of
gender disparity and child development,
food security etc.) are also considered as
useful tools for analysing development
status of a given region. This paradigm’s
full utility would be realized if national,
state and local governments not only
use these indices as monitoring tools
for tracking their progress, but also
use the analysis to derive focus and
priority issues and address specific
policy and implementation gaps. In this
regard, the district human development
reports would contribute significantly,
by providing intra-district patterns of
human development in such a way that
they are comparable with the status of
7
development in other districts of the state
as well.
The current chapter provides the
rationale for developing the district
human development reports and the
summary of the process of developing
these reports. The chapterization of
the report is arranged as follows. The
second chapter provides an overall
information about the district, covering
its history, geographical, socio-economic
characteristics and unique aspects
linked to the district. The third chapter
presents the index values and ranks of
the taluks of the district with respect to
the 7 indices discussed above. The later
chapters present the status of human
development in the district by exploring
its current status in areas of education,
health, income and poverty, standard of
living, gender development, development
of marginalized and vulnerable
communities, governance and urban
development. The conclusion chapter
summarizes the findings of individual
chapters and presents the suggestions
for the way forward for policy and
implementation of various interventions
of the government. Annexure 1 details
the indicators used for the study, their
sources of data and the technical details
of the calculation of the 7 indices.
Annexure 2 provides the taluk and
district values of the all the indicators
used for the computation of the indices.
* * * *
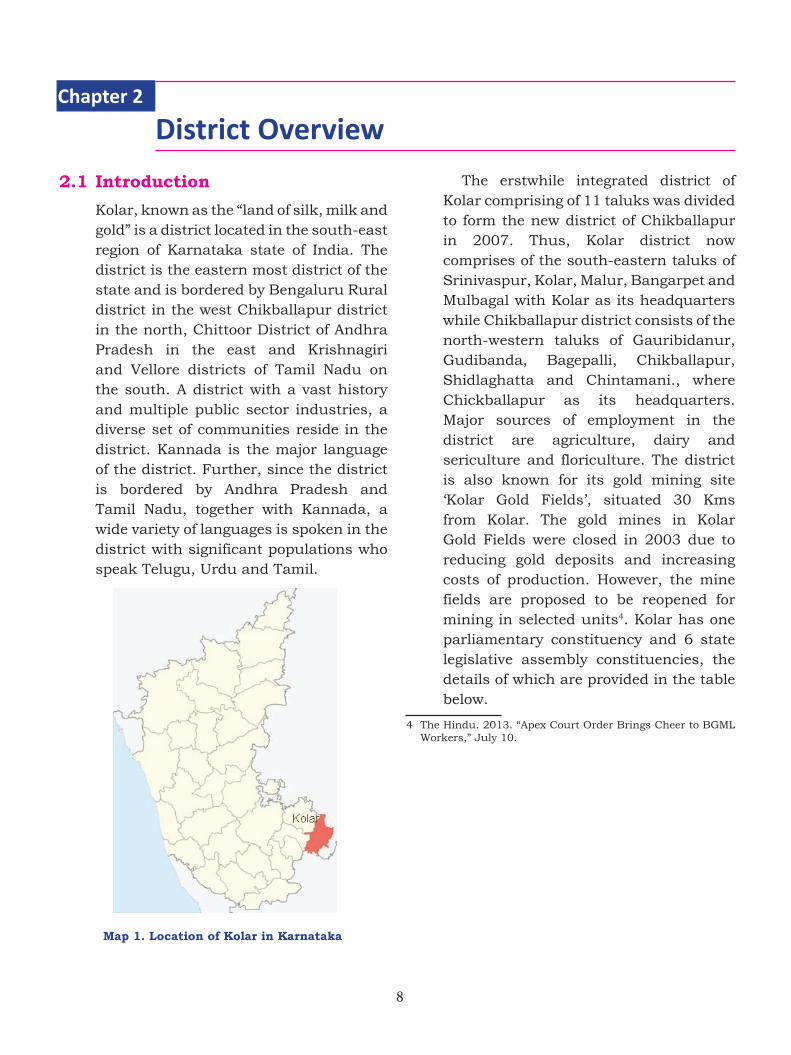
8
2.1 Introduction
Kolar, known as the “land of silk, milk and gold” is a district located in the south-east region of Karnataka state of India. The district is the eastern most district of the state and is bordered by Bengaluru Rural district in the west Chikballapur district in the north, Chittoor District of Andhra Pradesh in the east and Krishnagiri and Vellore districts of Tamil Nadu on the south. A district with a vast history and multiple public sector industries, a diverse set of communities reside in the district. Kannada is the major language of the district. Further, since the district is bordered by Andhra Pradesh and Tamil Nadu, together with Kannada, a wide variety of languages is spoken in the district with significant populations who speak Telugu, Urdu and Tamil.
Map 1. Location of Kolar in Karnataka
District Overview Chapter 2
The erstwhile integrated district of Kolar comprising of 11 taluks was divided to form the new district of Chikballapur in 2007. Thus, Kolar district now comprises of the south-eastern taluks of Srinivaspur, Kolar, Malur, Bangarpet and Mulbagal with Kolar as its headquarters while Chikballapur district consists of the north-western taluks of Gauribidanur, Gudibanda, Bagepalli, Chikballapur, Shidlaghatta and Chintamani., where Chickballapur as its headquarters. Major sources of employment in the district are agriculture, dairy and sericulture and floriculture. The district is also known for its gold mining site ‘Kolar Gold Fields’, situated 30 Kms from Kolar. The gold mines in Kolar Gold Fields were closed in 2003 due to reducing gold deposits and increasing costs of production. However, the mine fields are proposed to be reopened for mining in selected units4. Kolar has one parliamentary constituency and 6 state legislative assembly constituencies, the details of which are provided in the table below.
4 The Hindu. 2013. “Apex Court Order Brings Cheer to BGML Workers,” July 10.
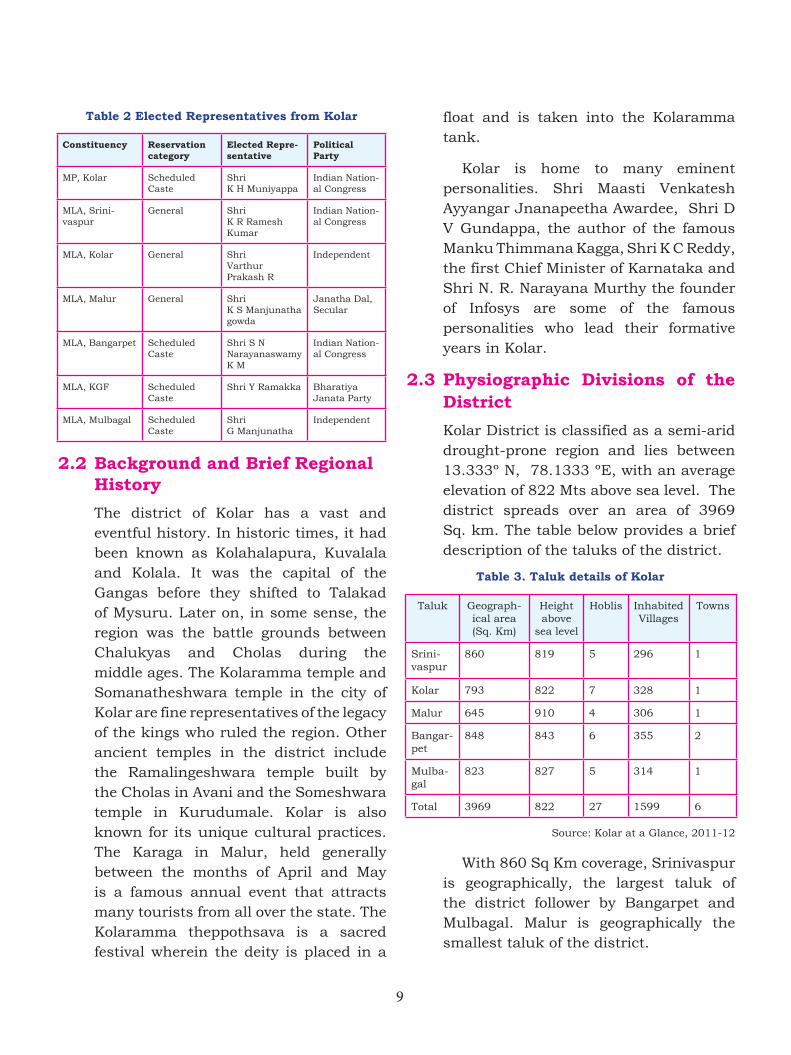
9
Table 2 Elected Representatives from Kolar
Constituency Reservation category
Elected Repre-sentative
Political Party
MP, Kolar Scheduled Caste
Shri K H Muniyappa
Indian Nation-al Congress
MLA, Srini-vaspur
General Shri K R Ramesh Kumar
Indian Nation-al Congress
MLA, Kolar General Shri Varthur Prakash R
Independent
MLA, Malur General Shri K S Manjunatha gowda
Janatha Dal, Secular
MLA, Bangarpet Scheduled Caste
Shri S N Narayanaswamy K M
Indian Nation-al Congress
MLA, KGF Scheduled Caste
Shri Y Ramakka Bharatiya Janata Party
MLA, Mulbagal Scheduled Caste
Shri G Manjunatha
Independent
2.2 Background and Brief Regional History
The district of Kolar has a vast and eventful history. In historic times, it had been known as Kolahalapura, Kuvalala and Kolala. It was the capital of the Gangas before they shifted to Talakad of Mysuru. Later on, in some sense, the region was the battle grounds between Chalukyas and Cholas during the middle ages. The Kolaramma temple and Somanatheshwara temple in the city of Kolar are fine representatives of the legacy of the kings who ruled the region. Other ancient temples in the district include the Ramalingeshwara temple built by the Cholas in Avani and the Someshwara temple in Kurudumale. Kolar is also known for its unique cultural practices. The Karaga in Malur, held generally between the months of April and May is a famous annual event that attracts many tourists from all over the state. The Kolaramma theppothsava is a sacred festival wherein the deity is placed in a
float and is taken into the Kolaramma tank.
Kolar is home to many eminent personalities. Shri Maasti Venkatesh Ayyangar Jnanapeetha Awardee, Shri D V Gundappa, the author of the famous Manku Thimmana Kagga, Shri K C Reddy, the first Chief Minister of Karnataka and Shri N. R. Narayana Murthy the founder of Infosys are some of the famous personalities who lead their formative years in Kolar.
2.3 Physiographic Divisions of the District
Kolar District is classified as a semi-arid drought-prone region and lies between 13.333º N, 78.1333 ºE, with an average elevation of 822 Mts above sea level. The district spreads over an area of 3969 Sq. km. The table below provides a brief description of the taluks of the district.
Table 3. Taluk details of Kolar
Taluk Geograph-ical area (Sq. Km)
Height above
sea level
Hoblis Inhabited Villages
Towns
Srini-vaspur
860 819 5 296 1
Kolar 793 822 7 328 1
Malur 645 910 4 306 1
Bangar-pet
848 843 6 355 2
Mulba-gal
823 827 5 314 1
Total 3969 822 27 1599 6
Source: Kolar at a Glance, 2011-12
With 860 Sq Km coverage, Srinivaspur is geographically, the largest taluk of the district follower by Bangarpet and Mulbagal. Malur is geographically the smallest taluk of the district.
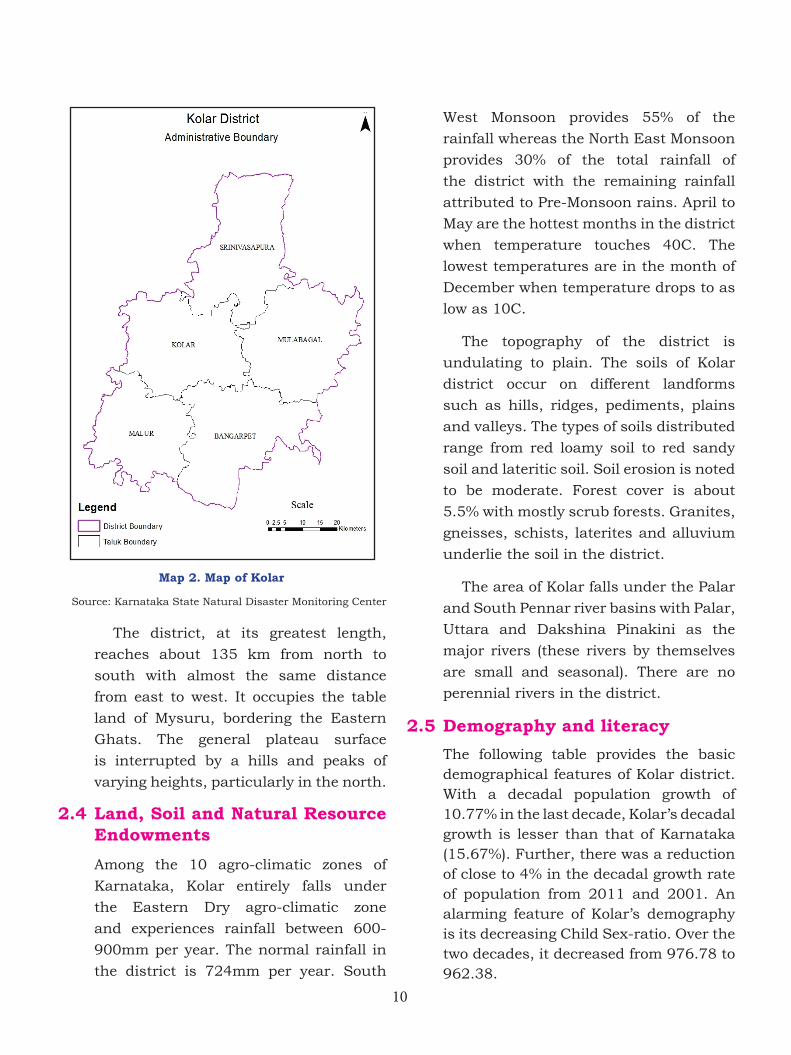
10
Map 2. Map of Kolar
Source: Karnataka State Natural Disaster Monitoring Center
The district, at its greatest length,
reaches about 135 km from north to
south with almost the same distance
from east to west. It occupies the table
land of Mysuru, bordering the Eastern
Ghats. The general plateau surface
is interrupted by a hills and peaks of
varying heights, particularly in the north.
2.4 Land, Soil and Natural Resource Endowments
Among the 10 agro-climatic zones of
Karnataka, Kolar entirely falls under
the Eastern Dry agro-climatic zone
and experiences rainfall between 600-
900mm per year. The normal rainfall in
the district is 724mm per year. South
West Monsoon provides 55% of the
rainfall whereas the North East Monsoon
provides 30% of the total rainfall of
the district with the remaining rainfall
attributed to Pre-Monsoon rains. April to
May are the hottest months in the district
when temperature touches 40C. The
lowest temperatures are in the month of
December when temperature drops to as
low as 10C.
The topography of the district is
undulating to plain. The soils of Kolar
district occur on different landforms
such as hills, ridges, pediments, plains
and valleys. The types of soils distributed
range from red loamy soil to red sandy
soil and lateritic soil. Soil erosion is noted
to be moderate. Forest cover is about
5.5% with mostly scrub forests. Granites,
gneisses, schists, laterites and alluvium
underlie the soil in the district.
The area of Kolar falls under the Palar
and South Pennar river basins with Palar,
Uttara and Dakshina Pinakini as the
major rivers (these rivers by themselves
are small and seasonal). There are no
perennial rivers in the district.
2.5 Demography and literacy
The following table provides the basic demographical features of Kolar district. With a decadal population growth of 10.77% in the last decade, Kolar’s decadal growth is lesser than that of Karnataka (15.67%). Further, there was a reduction of close to 4% in the decadal growth rate of population from 2011 and 2001. An alarming feature of Kolar’s demography is its decreasing Child Sex-ratio. Over the two decades, it decreased from 976.78 to 962.38.
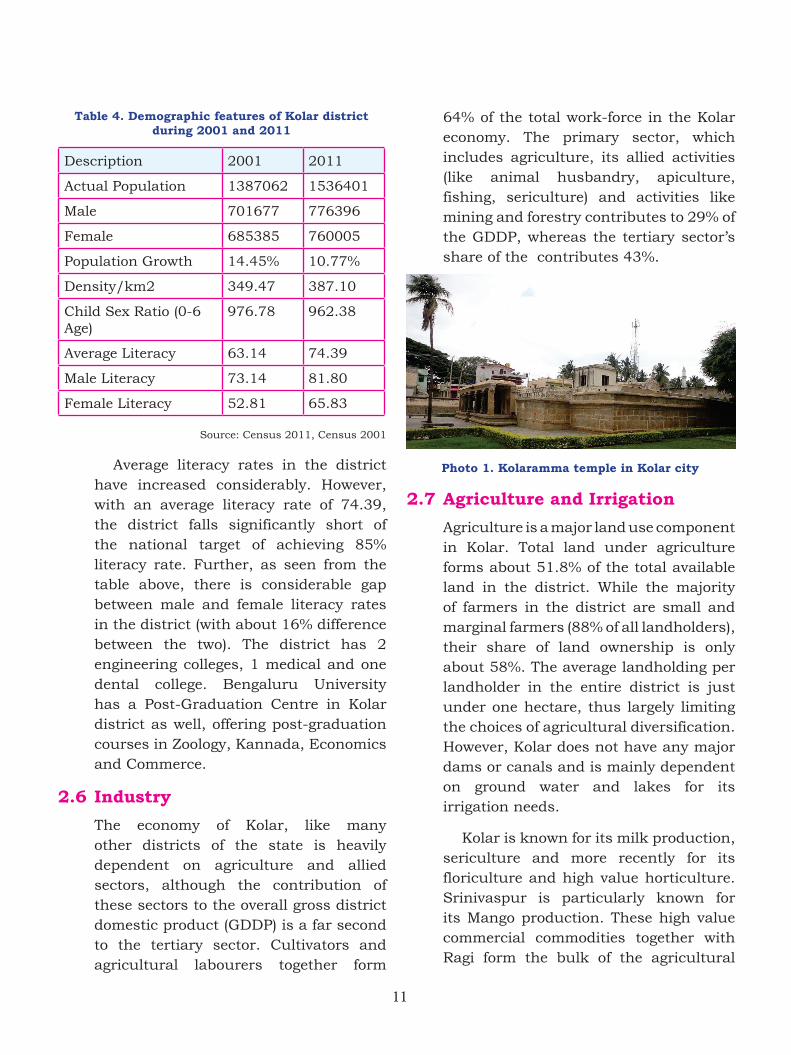
11
Table 4. Demographic features of Kolar district during 2001 and 2011
Description 2001 2011
Actual Population 1387062 1536401
Male 701677 776396
Female 685385 760005
Population Growth 14.45% 10.77%
Density/km2 349.47 387.10
Child Sex Ratio (0-6 Age)
976.78 962.38
Average Literacy 63.14 74.39
Male Literacy 73.14 81.80
Female Literacy 52.81 65.83
Source: Census 2011, Census 2001
Average literacy rates in the district have increased considerably. However, with an average literacy rate of 74.39, the district falls significantly short of the national target of achieving 85% literacy rate. Further, as seen from the table above, there is considerable gap between male and female literacy rates in the district (with about 16% difference between the two). The district has 2 engineering colleges, 1 medical and one dental college. Bengaluru University has a Post-Graduation Centre in Kolar district as well, offering post-graduation courses in Zoology, Kannada, Economics and Commerce.
2.6 Industry
The economy of Kolar, like many other districts of the state is heavily dependent on agriculture and allied sectors, although the contribution of these sectors to the overall gross district domestic product (GDDP) is a far second to the tertiary sector. Cultivators and agricultural labourers together form
64% of the total work-force in the Kolar economy. The primary sector, which includes agriculture, its allied activities (like animal husbandry, apiculture, fishing, sericulture) and activities like mining and forestry contributes to 29% of the GDDP, whereas the tertiary sector’s share of the contributes 43%.
Photo 1. Kolaramma temple in Kolar city
2.7 Agriculture and Irrigation
Agriculture is a major land use component in Kolar. Total land under agriculture forms about 51.8% of the total available land in the district. While the majority of farmers in the district are small and marginal farmers (88% of all landholders), their share of land ownership is only about 58%. The average landholding per landholder in the entire district is just under one hectare, thus largely limiting the choices of agricultural diversification. However, Kolar does not have any major dams or canals and is mainly dependent on ground water and lakes for its irrigation needs.
Kolar is known for its milk production, sericulture and more recently for its floriculture and high value horticulture. Srinivaspur is particularly known for its Mango production. These high value commercial commodities together with Ragi form the bulk of the agricultural
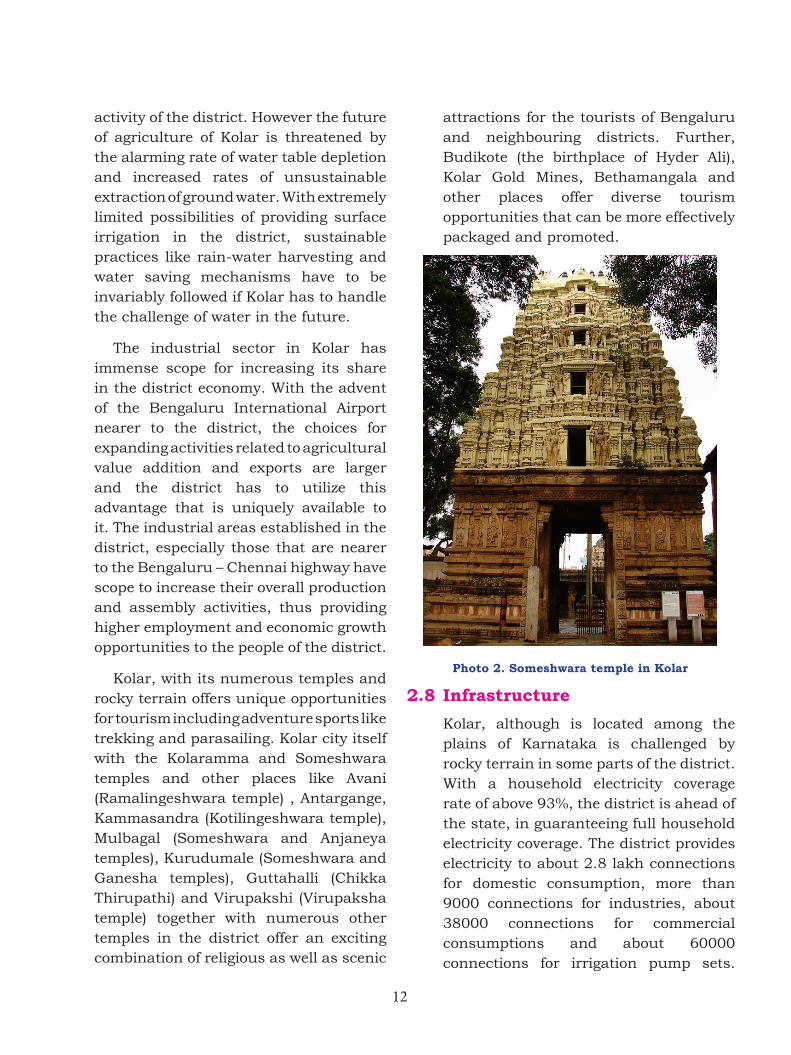
12
activity of the district. However the future of agriculture of Kolar is threatened by the alarming rate of water table depletion and increased rates of unsustainable extraction of ground water. With extremely limited possibilities of providing surface irrigation in the district, sustainable practices like rain-water harvesting and water saving mechanisms have to be invariably followed if Kolar has to handle the challenge of water in the future.
The industrial sector in Kolar has immense scope for increasing its share in the district economy. With the advent of the Bengaluru International Airport nearer to the district, the choices for expanding activities related to agricultural value addition and exports are larger and the district has to utilize this advantage that is uniquely available to it. The industrial areas established in the district, especially those that are nearer to the Bengaluru – Chennai highway have scope to increase their overall production and assembly activities, thus providing higher employment and economic growth opportunities to the people of the district.
Kolar, with its numerous temples and rocky terrain offers unique opportunities for tourism including adventure sports like trekking and parasailing. Kolar city itself with the Kolaramma and Someshwara temples and other places like Avani (Ramalingeshwara temple) , Antargange, Kammasandra (Kotilingeshwara temple), Mulbagal (Someshwara and Anjaneya temples), Kurudumale (Someshwara and Ganesha temples), Guttahalli (Chikka Thirupathi) and Virupakshi (Virupaksha temple) together with numerous other temples in the district offer an exciting combination of religious as well as scenic
attractions for the tourists of Bengaluru and neighbouring districts. Further, Budikote (the birthplace of Hyder Ali), Kolar Gold Mines, Bethamangala and other places offer diverse tourism opportunities that can be more effectively packaged and promoted.
Photo 2. Someshwara temple in Kolar
2.8 Infrastructure
Kolar, although is located among the plains of Karnataka is challenged by rocky terrain in some parts of the district. With a household electricity coverage rate of above 93%, the district is ahead of the state, in guaranteeing full household electricity coverage. The district provides electricity to about 2.8 lakh connections for domestic consumption, more than 9000 connections for industries, about 38000 connections for commercial consumptions and about 60000 connections for irrigation pump sets.
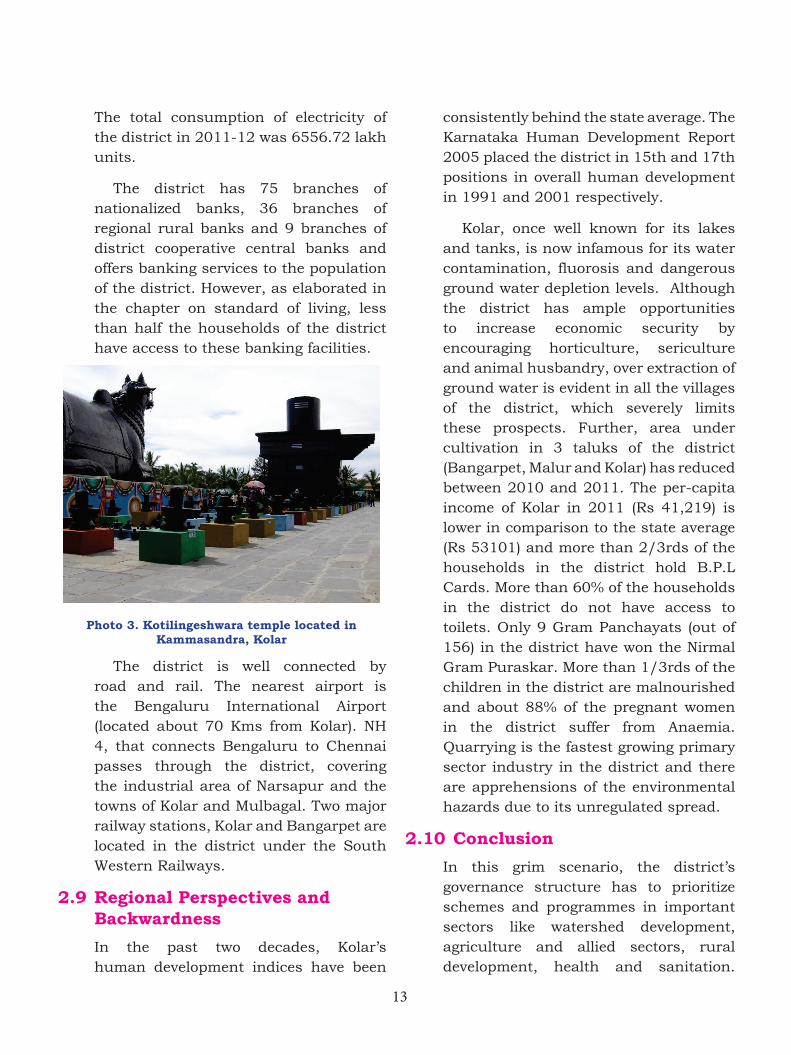
13
The total consumption of electricity of the district in 2011-12 was 6556.72 lakh units.
The district has 75 branches of nationalized banks, 36 branches of regional rural banks and 9 branches of district cooperative central banks and offers banking services to the population of the district. However, as elaborated in the chapter on standard of living, less than half the households of the district have access to these banking facilities.
Photo 3. Kotilingeshwara temple located in Kammasandra, Kolar
The district is well connected by road and rail. The nearest airport is the Bengaluru International Airport (located about 70 Kms from Kolar). NH 4, that connects Bengaluru to Chennai passes through the district, covering the industrial area of Narsapur and the towns of Kolar and Mulbagal. Two major railway stations, Kolar and Bangarpet are located in the district under the South Western Railways.
2.9 Regional Perspectives and Backwardness
In the past two decades, Kolar’s human development indices have been
consistently behind the state average. The Karnataka Human Development Report 2005 placed the district in 15th and 17th positions in overall human development in 1991 and 2001 respectively.
Kolar, once well known for its lakes and tanks, is now infamous for its water contamination, fluorosis and dangerous ground water depletion levels. Although the district has ample opportunities to increase economic security by encouraging horticulture, sericulture and animal husbandry, over extraction of ground water is evident in all the villages of the district, which severely limits these prospects. Further, area under cultivation in 3 taluks of the district (Bangarpet, Malur and Kolar) has reduced between 2010 and 2011. The per-capita income of Kolar in 2011 (Rs 41,219) is lower in comparison to the state average (Rs 53101) and more than 2/3rds of the households in the district hold B.P.L Cards. More than 60% of the households in the district do not have access to toilets. Only 9 Gram Panchayats (out of 156) in the district have won the Nirmal Gram Puraskar. More than 1/3rds of the children in the district are malnourished and about 88% of the pregnant women in the district suffer from Anaemia. Quarrying is the fastest growing primary sector industry in the district and there are apprehensions of the environmental hazards due to its unregulated spread.
2.10 Conclusion
In this grim scenario, the district’s governance structure has to prioritize schemes and programmes in important sectors like watershed development, agriculture and allied sectors, rural development, health and sanitation.
14
Specifically, schemes and programmes related to rejuvenation of traditional water sources like Drought Prone Area Programme, Tank and lake regeneration schemes, Watershed development schemes and water conservation and drought proofing activities MGNREGA have to be specifically prioritized in the district. Since these are projects with considerable finances with geographically distributed activities, district-wide convergence of these schemes would help in achieving the overall objectives, prevention of duplication of efforts and streamlining the diverse processes of ecological restoration activities followed under different schemes and projects.
Further, there is wide scope to link these activities and to boost agricultural activities in the district by planning innovative activities in existing schemes in the departments of Agriculture, Horticulture, Sericulture, Animal Husbandry, Minor irrigation and through schemes related to alternative fuels like National Project on Biogas development.
Health and public sanitation are
other crucial sectors in which Kolar
lags behind. The existing schemes and
programmes in these sectors (NRHM
and NBA) allow for mission mode, need-
based funding and activities which
provide sufficient opportunity for the
district administration to bring drastic
improvement in these sectors as well.
Thus, the need for prioritizing specific
sectors, integrating development activities
in these sectors and amply financing
them becomes critical. Convergent and
inclusive planning, enforcing stricter
environmental regulations and efficient
implementation of such diversified
activities are necessary. Moreover, it
is clear that necessary legislations,
regulatory regimes and specific schemes
already exist to address these challenges.
Thus, the role of governance is crucial
ensure that the district achieves
acceptable levels of human development.
* * * *
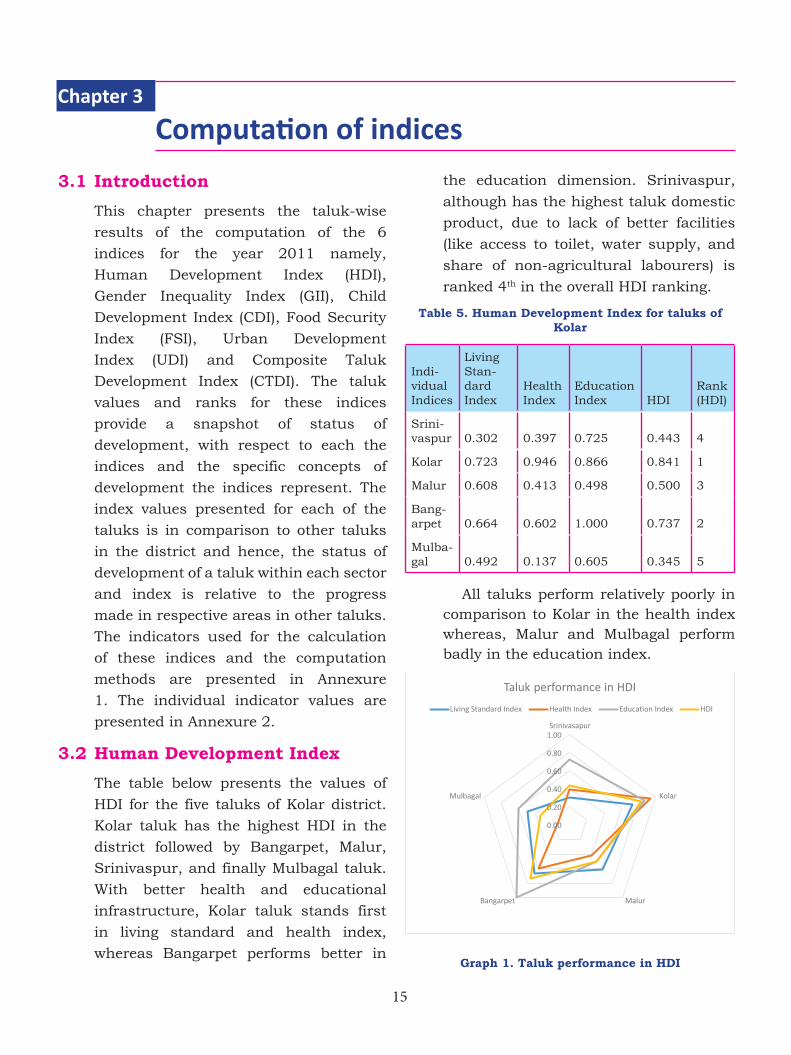
15
3.1 Introduction
This chapter presents the taluk-wise
results of the computation of the 6
indices for the year 2011 namely,
Human Development Index (HDI),
Gender Inequality Index (GII), Child
Development Index (CDI), Food Security
Index (FSI), Urban Development
Index (UDI) and Composite Taluk
Development Index (CTDI). The taluk
values and ranks for these indices
provide a snapshot of status of
development, with respect to each the
indices and the specific concepts of
development the indices represent. The
index values presented for each of the
taluks is in comparison to other taluks
in the district and hence, the status of
development of a taluk within each sector
and index is relative to the progress
made in respective areas in other taluks.
The indicators used for the calculation
of these indices and the computation
methods are presented in Annexure
1. The individual indicator values are
presented in Annexure 2.
3.2 Human Development Index
The table below presents the values of
HDI for the five taluks of Kolar district.
Kolar taluk has the highest HDI in the
district followed by Bangarpet, Malur,
Srinivaspur, and finally Mulbagal taluk.
With better health and educational
infrastructure, Kolar taluk stands first
in living standard and health index,
whereas Bangarpet performs better in
the education dimension. Srinivaspur,
although has the highest taluk domestic
product, due to lack of better facilities
(like access to toilet, water supply, and
share of non-agricultural labourers) is
ranked 4th in the overall HDI ranking.
Table 5. Human Development Index for taluks of Kolar
Indi-vidual Indices
Living Stan-dard Index
Health Index
Education Index HDI
Rank (HDI)
Srini-vaspur 0.302 0.397 0.725 0.443 4
Kolar 0.723 0.946 0.866 0.841 1
Malur 0.608 0.413 0.498 0.500 3
Bang-arpet 0.664 0.602 1.000 0.737 2
Mulba-gal 0.492 0.137 0.605 0.345 5
All taluks perform relatively poorly in comparison to Kolar in the health index whereas, Malur and Mulbagal perform badly in the education index.
Graph 1. Taluk performance in HDI
Computation of indices Chapter 3
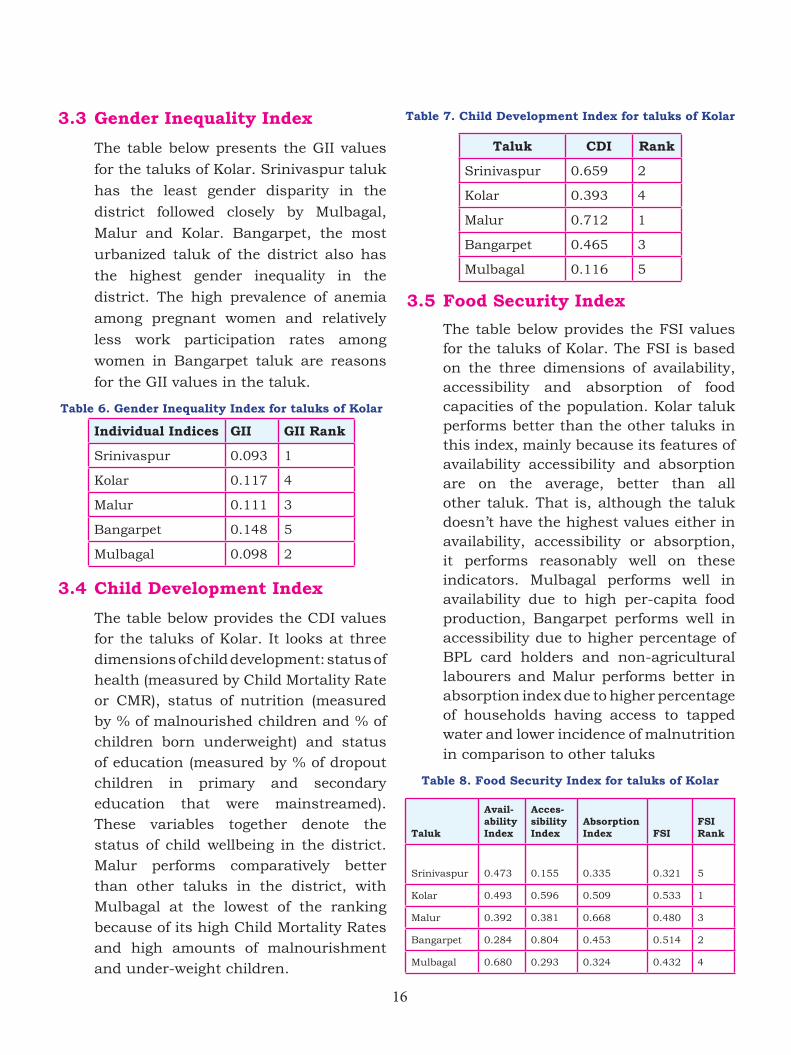
16
3.3 Gender Inequality Index
The table below presents the GII values
for the taluks of Kolar. Srinivaspur taluk
has the least gender disparity in the
district followed closely by Mulbagal,
Malur and Kolar. Bangarpet, the most
urbanized taluk of the district also has
the highest gender inequality in the
district. The high prevalence of anemia
among pregnant women and relatively
less work participation rates among
women in Bangarpet taluk are reasons
for the GII values in the taluk.
Table 6. Gender Inequality Index for taluks of Kolar
Individual Indices GII GII Rank
Srinivaspur 0.093 1
Kolar 0.117 4
Malur 0.111 3
Bangarpet 0.148 5
Mulbagal 0.098 2
3.4 Child Development Index
The table below provides the CDI values
for the taluks of Kolar. It looks at three
dimensions of child development: status of
health (measured by Child Mortality Rate
or CMR), status of nutrition (measured
by % of malnourished children and % of
children born underweight) and status
of education (measured by % of dropout
children in primary and secondary
education that were mainstreamed).
These variables together denote the
status of child wellbeing in the district.
Malur performs comparatively better
than other taluks in the district, with
Mulbagal at the lowest of the ranking
because of its high Child Mortality Rates
and high amounts of malnourishment
and under-weight children.
Table 7. Child Development Index for taluks of Kolar
Taluk CDI Rank
Srinivaspur 0.659 2
Kolar 0.393 4
Malur 0.712 1
Bangarpet 0.465 3
Mulbagal 0.116 5
3.5 Food Security Index
The table below provides the FSI values for the taluks of Kolar. The FSI is based on the three dimensions of availability, accessibility and absorption of food capacities of the population. Kolar taluk performs better than the other taluks in this index, mainly because its features of availability accessibility and absorption are on the average, better than all other taluk. That is, although the taluk doesn’t have the highest values either in availability, accessibility or absorption, it performs reasonably well on these indicators. Mulbagal performs well in availability due to high per-capita food production, Bangarpet performs well in accessibility due to higher percentage of BPL card holders and non-agricultural labourers and Malur performs better in absorption index due to higher percentage of households having access to tapped water and lower incidence of malnutrition in comparison to other taluks
Table 8. Food Security Index for taluks of Kolar
Taluk
Avail-ability Index
Acces-sibility Index
Absorption Index FSI
FSI Rank
Srinivaspur 0.473 0.155 0.335 0.321 5
Kolar 0.493 0.596 0.509 0.533 1
Malur 0.392 0.381 0.668 0.480 3
Bangarpet 0.284 0.804 0.453 0.514 2
Mulbagal 0.680 0.293 0.324 0.432 4
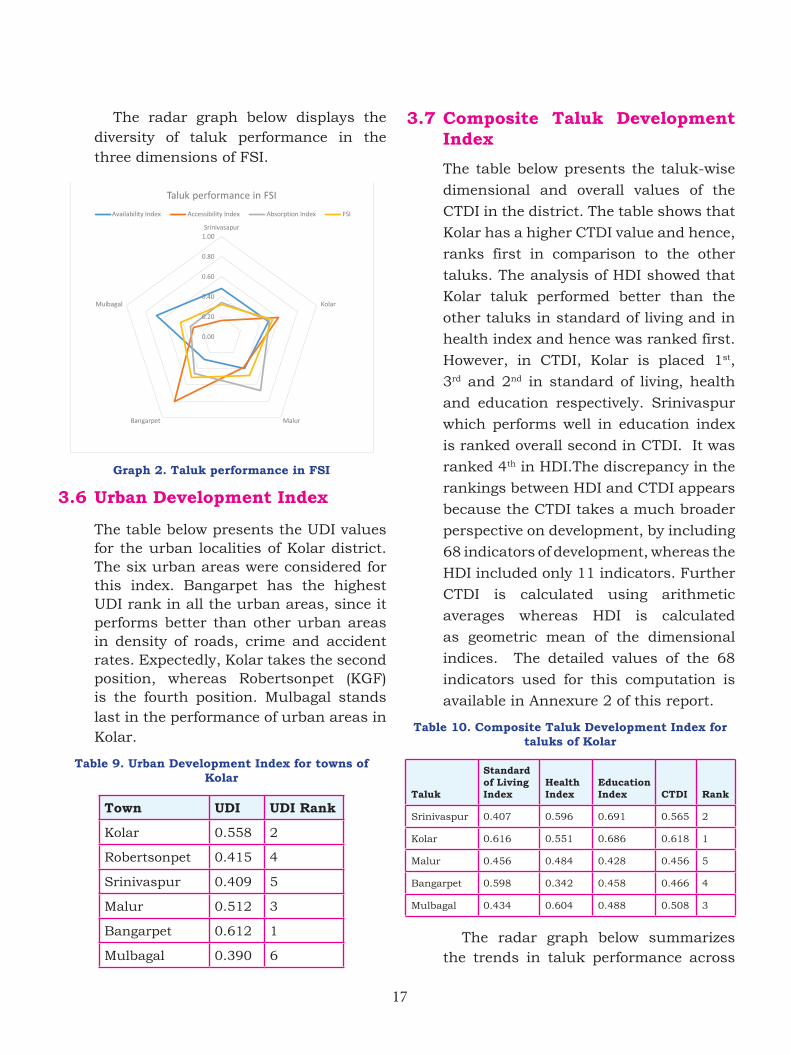
17
The radar graph below displays the diversity of taluk performance in the three dimensions of FSI.
Graph 2. Taluk performance in FSI
3.6 Urban Development Index
The table below presents the UDI values for the urban localities of Kolar district. The six urban areas were considered for this index. Bangarpet has the highest UDI rank in all the urban areas, since it performs better than other urban areas in density of roads, crime and accident rates. Expectedly, Kolar takes the second position, whereas Robertsonpet (KGF) is the fourth position. Mulbagal stands last in the performance of urban areas in Kolar.
Table 9. Urban Development Index for towns of Kolar
Town UDI UDI Rank
Kolar 0.558 2
Robertsonpet 0.415 4
Srinivaspur 0.409 5
Malur 0.512 3
Bangarpet 0.612 1
Mulbagal 0.390 6
3.7 Composite Taluk Development Index
The table below presents the taluk-wise
dimensional and overall values of the
CTDI in the district. The table shows that
Kolar has a higher CTDI value and hence,
ranks first in comparison to the other
taluks. The analysis of HDI showed that
Kolar taluk performed better than the
other taluks in standard of living and in
health index and hence was ranked first.
However, in CTDI, Kolar is placed 1st,
3rd and 2nd in standard of living, health
and education respectively. Srinivaspur
which performs well in education index
is ranked overall second in CTDI. It was
ranked 4th in HDI.The discrepancy in the
rankings between HDI and CTDI appears
because the CTDI takes a much broader
perspective on development, by including
68 indicators of development, whereas the
HDI included only 11 indicators. Further
CTDI is calculated using arithmetic
averages whereas HDI is calculated
as geometric mean of the dimensional
indices. The detailed values of the 68
indicators used for this computation is
available in Annexure 2 of this report.
Table 10. Composite Taluk Development Index for taluks of Kolar
Taluk
Standard of Living Index
Health Index
Education Index CTDI Rank
Srinivaspur 0.407 0.596 0.691 0.565 2
Kolar 0.616 0.551 0.686 0.618 1
Malur 0.456 0.484 0.428 0.456 5
Bangarpet 0.598 0.342 0.458 0.466 4
Mulbagal 0.434 0.604 0.488 0.508 3
The radar graph below summarizes the trends in taluk performance across
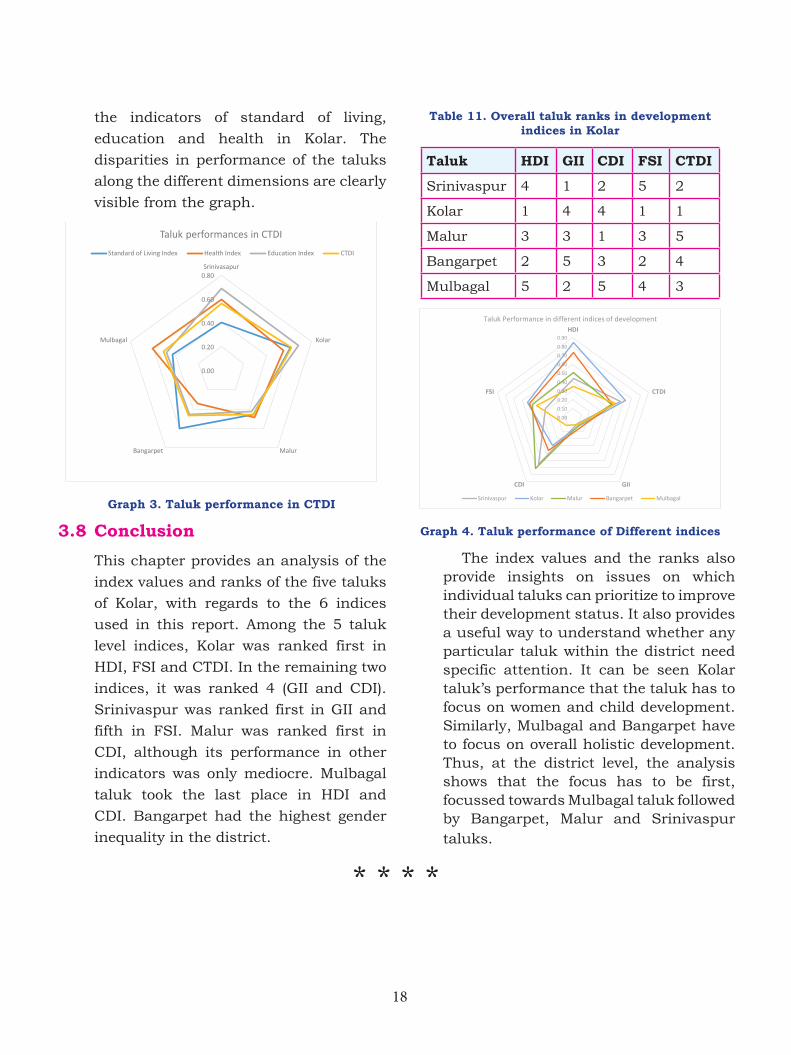
18
the indicators of standard of living,
education and health in Kolar. The
disparities in performance of the taluks
along the different dimensions are clearly
visible from the graph.
Graph 3. Taluk performance in CTDI
3.8 Conclusion
This chapter provides an analysis of the
index values and ranks of the five taluks
of Kolar, with regards to the 6 indices
used in this report. Among the 5 taluk
level indices, Kolar was ranked first in
HDI, FSI and CTDI. In the remaining two
indices, it was ranked 4 (GII and CDI).
Srinivaspur was ranked first in GII and
fifth in FSI. Malur was ranked first in
CDI, although its performance in other
indicators was only mediocre. Mulbagal
taluk took the last place in HDI and
CDI. Bangarpet had the highest gender
inequality in the district.
Table 11. Overall taluk ranks in development indices in Kolar
Taluk HDI GII CDI FSI CTDI
Srinivaspur 4 1 2 5 2
Kolar 1 4 4 1 1
Malur 3 3 1 3 5
Bangarpet 2 5 3 2 4
Mulbagal 5 2 5 4 3
Graph 4. Taluk performance of Different indices
The index values and the ranks also provide insights on issues on which individual taluks can prioritize to improve their development status. It also provides a useful way to understand whether any particular taluk within the district need specific attention. It can be seen Kolar taluk’s performance that the taluk has to focus on women and child development. Similarly, Mulbagal and Bangarpet have to focus on overall holistic development. Thus, at the district level, the analysis shows that the focus has to be first, focussed towards Mulbagal taluk followed by Bangarpet, Malur and Srinivaspur taluks.
* * * *
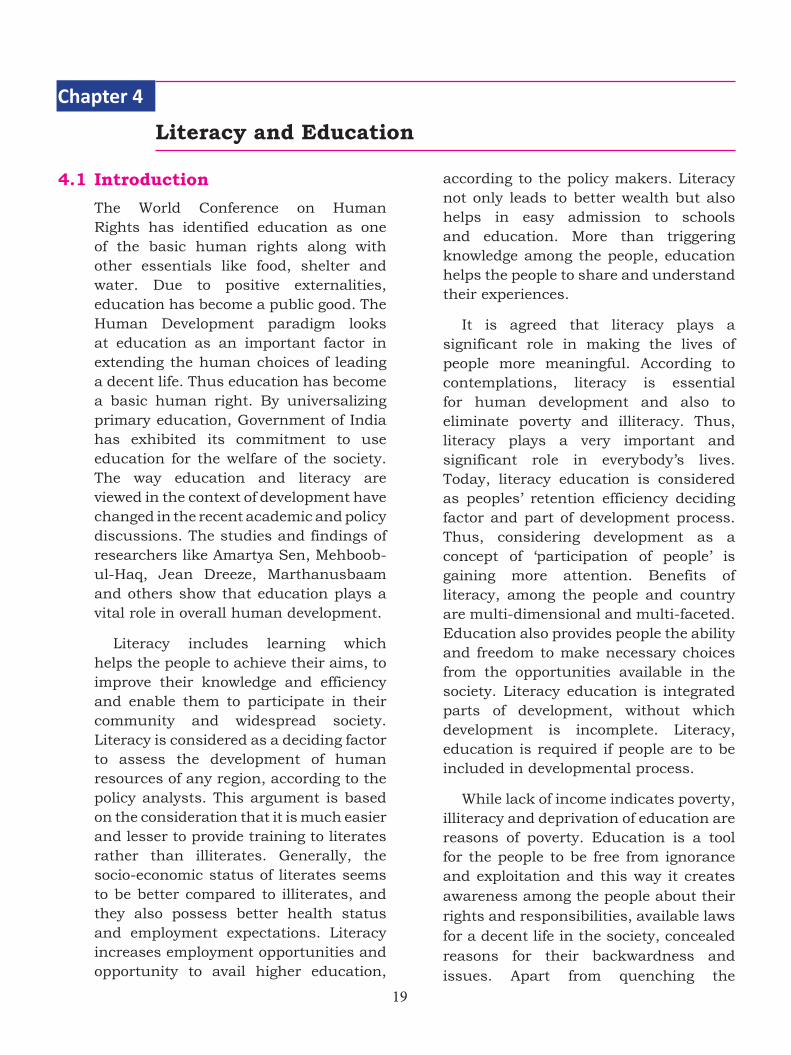
19
4.1 Introduction
The World Conference on Human Rights has identified education as one of the basic human rights along with other essentials like food, shelter and water. Due to positive externalities, education has become a public good. The Human Development paradigm looks at education as an important factor in extending the human choices of leading a decent life. Thus education has become a basic human right. By universalizing primary education, Government of India has exhibited its commitment to use education for the welfare of the society. The way education and literacy are viewed in the context of development have changed in the recent academic and policy discussions. The studies and findings of researchers like Amartya Sen, Mehboob-ul-Haq, Jean Dreeze, Marthanusbaam and others show that education plays a vital role in overall human development.
Literacy includes learning which helps the people to achieve their aims, to improve their knowledge and efficiency and enable them to participate in their community and widespread society. Literacy is considered as a deciding factor to assess the development of human resources of any region, according to the policy analysts. This argument is based on the consideration that it is much easier and lesser to provide training to literates rather than illiterates. Generally, the socio-economic status of literates seems to be better compared to illiterates, and they also possess better health status and employment expectations. Literacy increases employment opportunities and opportunity to avail higher education,
according to the policy makers. Literacy not only leads to better wealth but also helps in easy admission to schools and education. More than triggering knowledge among the people, education helps the people to share and understand their experiences.
It is agreed that literacy plays a significant role in making the lives of people more meaningful. According to contemplations, literacy is essential for human development and also to eliminate poverty and illiteracy. Thus, literacy plays a very important and significant role in everybody’s lives.Today, literacy education is considered as peoples’ retention efficiency deciding factor and part of development process. Thus, considering development as a concept of ‘participation of people’ is gaining more attention. Benefits of literacy, among the people and country are multi-dimensional and multi-faceted. Education also provides people the ability and freedom to make necessary choices from the opportunities available in the society. Literacy education is integrated parts of development, without which development is incomplete. Literacy, education is required if people are to be included in developmental process.
While lack of income indicates poverty, illiteracy and deprivation of education are reasons of poverty. Education is a tool for the people to be free from ignorance and exploitation and this way it creates awareness among the people about their rights and responsibilities, available laws for a decent life in the society, concealed reasons for their backwardness and issues. Apart from quenching the
Literacy and Education Chapter 4
20
knowledge thirst and provide a better position in the society, education also provides a dignified life. It leads to increased productivity by providing basic and special skills and enables economical growth by confirming increased per capita income. It increases the employment opportunities to the people and provide them capability to utilize the available opportunities, which leads to improved livelihood, resulting in better understanding, human relationship, good civilization and makes education universalized resulting in establishing equality and human development based on social justice. Education provides people the strength to make proper choices of their lives and their rights by being citizens of democracy. Education makes women aware of their work capabilities and increases their self-respect, which in turn provides proper justice to gender inequality. Increased educational status assures progress in health status of the people. It prevents child mortality and leads to women development through achieving self help and self-dependency. Above this, education opens the ways of knowledge and awareness, which is a very strong aspect compared to others. The outcome of this is considered to be very valuable.
When the educational progress of pre and post independence period of Kolar district is analyzed with other districts of the State, though it appears that Kolar district has not achieved complete educational development, it has achieved considerable progress in the educational sector in recent decades. The contribution of the district in this sector is noticeable. The literacy and educational levels has progressed and the district also enjoys
the pride of providing several State and National level intellectuals. The district has also set a good example of being multi-linguistic as it shares its borders with Andhra Pradesh and Tamil Nadu States. Achievement of the district in literacy and educational sectors and its probable outcomes on human development is discussed in this chapter.
4.2Literacyprofileofthedistrict
As literacy enjoys a positive relation with the social, economic development growth index and population related indices, it proves that it plays a vital role in human development process. By being literates, knowledge and skill foundations of the people become strong, which increases their income and improves their productivity. The literacy levels of Kolar district appears to be low till the year 1941. A literacy level of 8.1% can be noticed during 1941, which gained considerable progress between the years 1941-51 and 1951-61. The literacy level of Kolar district is 74.39% as per 2011 census, out of which the male and women literacy levels are 81.8% and 66.83% respectively. The average literacy levels of the state is 75.60% out of which male and literacy levels is 82.85% and 68.13% respectively. While, at the national level the total literacy level is 74.04%, the male literacy level is 82.14% and women literacy level is at 65.46%.
When the literacy level of Kolar district is compared to the State-level literacy level, it shows 1.21% less. The difference of literacy level among males is 1.05% and 1.3% among women. The literacy level of the district is 0.35% more than national average. It is 0.34% less among males and 1.37% more among women.
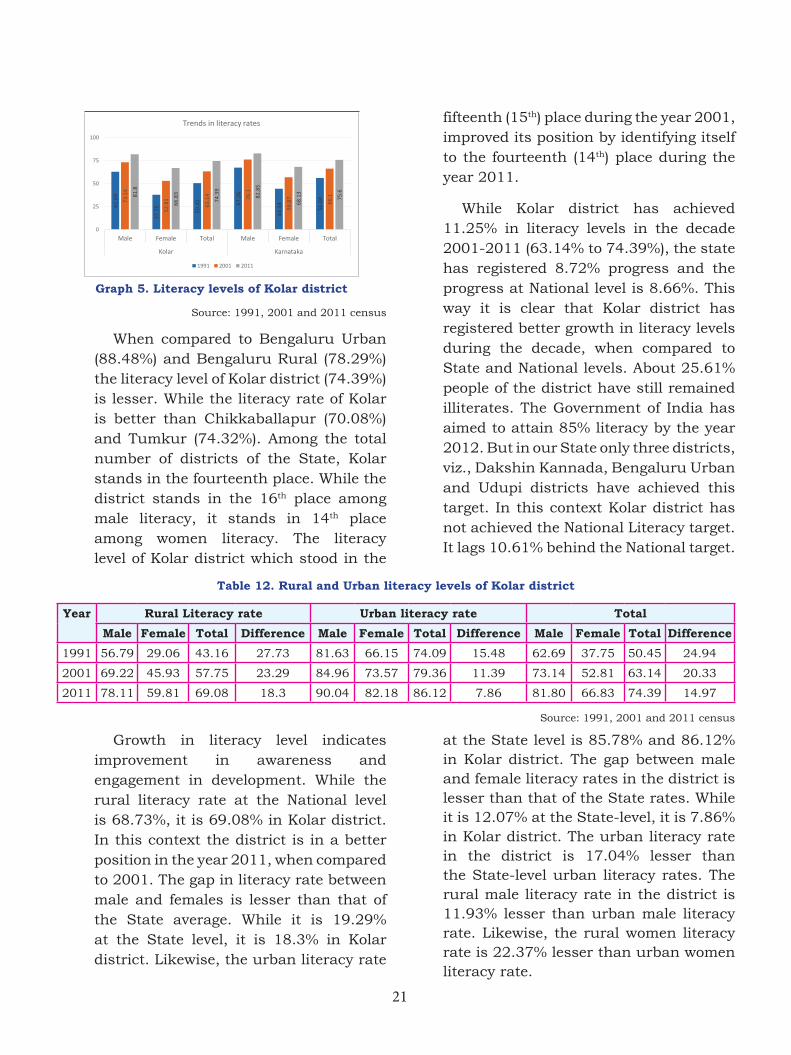
21
Graph 5. Literacy levels of Kolar district
Source: 1991, 2001 and 2011 census
When compared to Bengaluru Urban (88.48%) and Bengaluru Rural (78.29%) the literacy level of Kolar district (74.39%) is lesser. While the literacy rate of Kolar is better than Chikkaballapur (70.08%) and Tumkur (74.32%). Among the total number of districts of the State, Kolar stands in the fourteenth place. While the district stands in the 16th place among male literacy, it stands in 14th place among women literacy. The literacy level of Kolar district which stood in the
fifteenth (15th) place during the year 2001, improved its position by identifying itself to the fourteenth (14th) place during the year 2011.
While Kolar district has achieved 11.25% in literacy levels in the decade 2001-2011 (63.14% to 74.39%), the state has registered 8.72% progress and the progress at National level is 8.66%. This way it is clear that Kolar district has registered better growth in literacy levels during the decade, when compared to State and National levels. About 25.61% people of the district have still remained illiterates. The Government of India has aimed to attain 85% literacy by the year 2012. But in our State only three districts, viz., Dakshin Kannada, Bengaluru Urban and Udupi districts have achieved this target. In this context Kolar district has not achieved the National Literacy target. It lags 10.61% behind the National target.
Growth in literacy level indicates improvement in awareness and engagement in development. While the rural literacy rate at the National level is 68.73%, it is 69.08% in Kolar district. In this context the district is in a better position in the year 2011, when compared to 2001. The gap in literacy rate between male and females is lesser than that of the State average. While it is 19.29% at the State level, it is 18.3% in Kolar district. Likewise, the urban literacy rate
Table 12. Rural and Urban literacy levels of Kolar district
Year Rural Literacy rate Urban literacy rate Total
Male Female Total Difference Male Female Total Difference Male Female Total Difference
1991 56.79 29.06 43.16 27.73 81.63 66.15 74.09 15.48 62.69 37.75 50.45 24.94
2001 69.22 45.93 57.75 23.29 84.96 73.57 79.36 11.39 73.14 52.81 63.14 20.33
2011 78.11 59.81 69.08 18.3 90.04 82.18 86.12 7.86 81.80 66.83 74.39 14.97
Source: 1991, 2001 and 2011 census
at the State level is 85.78% and 86.12% in Kolar district. The gap between male and female literacy rates in the district is lesser than that of the State rates. While it is 12.07% at the State-level, it is 7.86% in Kolar district. The urban literacy rate in the district is 17.04% lesser than the State-level urban literacy rates. The rural male literacy rate in the district is 11.93% lesser than urban male literacy rate. Likewise, the rural women literacy rate is 22.37% lesser than urban women literacy rate.
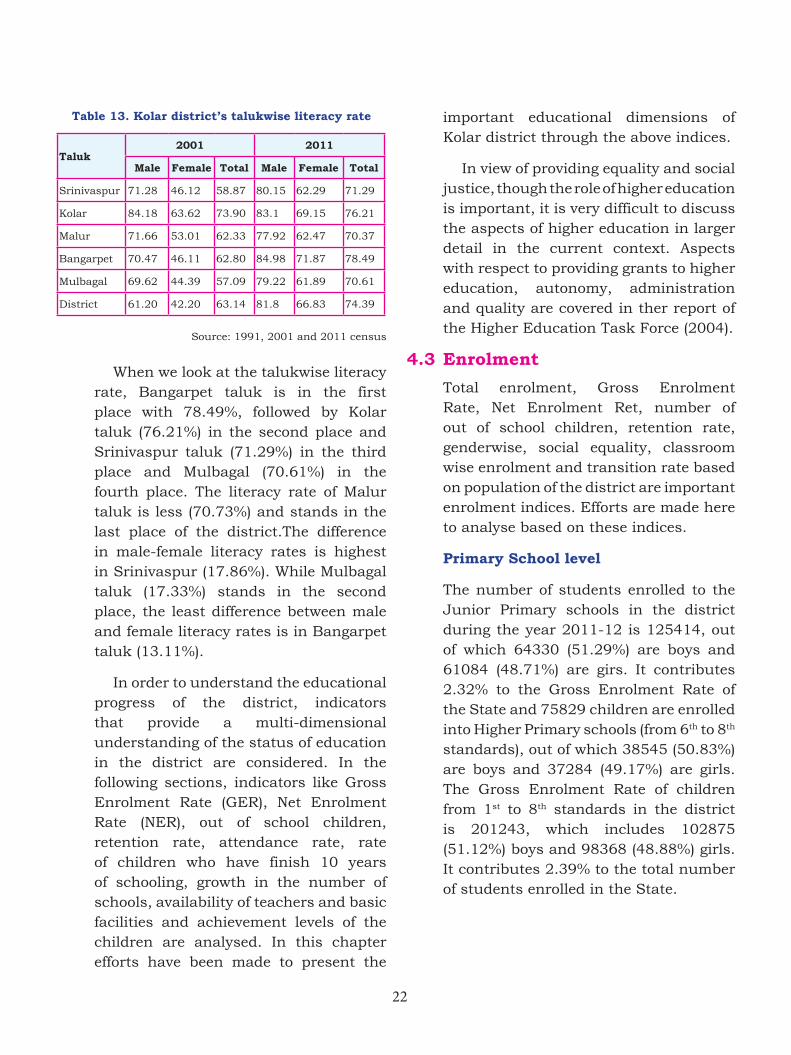
22
Table 13. Kolar district’s talukwise literacy rate
Taluk2001 2011
Male Female Total Male Female Total
Srinivaspur 71.28 46.12 58.87 80.15 62.29 71.29
Kolar 84.18 63.62 73.90 83.1 69.15 76.21
Malur 71.66 53.01 62.33 77.92 62.47 70.37
Bangarpet 70.47 46.11 62.80 84.98 71.87 78.49
Mulbagal 69.62 44.39 57.09 79.22 61.89 70.61
District 61.20 42.20 63.14 81.8 66.83 74.39
Source: 1991, 2001 and 2011 census
When we look at the talukwise literacy rate, Bangarpet taluk is in the first place with 78.49%, followed by Kolar taluk (76.21%) in the second place and Srinivaspur taluk (71.29%) in the third place and Mulbagal (70.61%) in the fourth place. The literacy rate of Malur taluk is less (70.73%) and stands in the last place of the district.The difference in male-female literacy rates is highest in Srinivaspur (17.86%). While Mulbagal taluk (17.33%) stands in the second place, the least difference between male and female literacy rates is in Bangarpet taluk (13.11%).
In order to understand the educational progress of the district, indicators that provide a multi-dimensional understanding of the status of education in the district are considered. In the following sections, indicators like Gross Enrolment Rate (GER), Net Enrolment Rate (NER), out of school children, retention rate, attendance rate, rate of children who have finish 10 years of schooling, growth in the number of schools, availability of teachers and basic facilities and achievement levels of the children are analysed. In this chapter efforts have been made to present the
important educational dimensions of Kolar district through the above indices.
In view of providing equality and social justice, though the role of higher education is important, it is very difficult to discuss the aspects of higher education in larger detail in the current context. Aspects with respect to providing grants to higher education, autonomy, administration and quality are covered in ther report of the Higher Education Task Force (2004).
4.3 Enrolment
Total enrolment, Gross Enrolment Rate, Net Enrolment Ret, number of out of school children, retention rate, genderwise, social equality, classroom wise enrolment and transition rate based on population of the district are important enrolment indices. Efforts are made here to analyse based on these indices.
Primary School level
The number of students enrolled to the Junior Primary schools in the district during the year 2011-12 is 125414, out of which 64330 (51.29%) are boys and 61084 (48.71%) are girs. It contributes 2.32% to the Gross Enrolment Rate of the State and 75829 children are enrolled into Higher Primary schools (from 6th to 8th standards), out of which 38545 (50.83%) are boys and 37284 (49.17%) are girls. The Gross Enrolment Rate of children from 1st to 8th standards in the district is 201243, which includes 102875 (51.12%) boys and 98368 (48.88%) girls. It contributes 2.39% to the total number of students enrolled in the State.
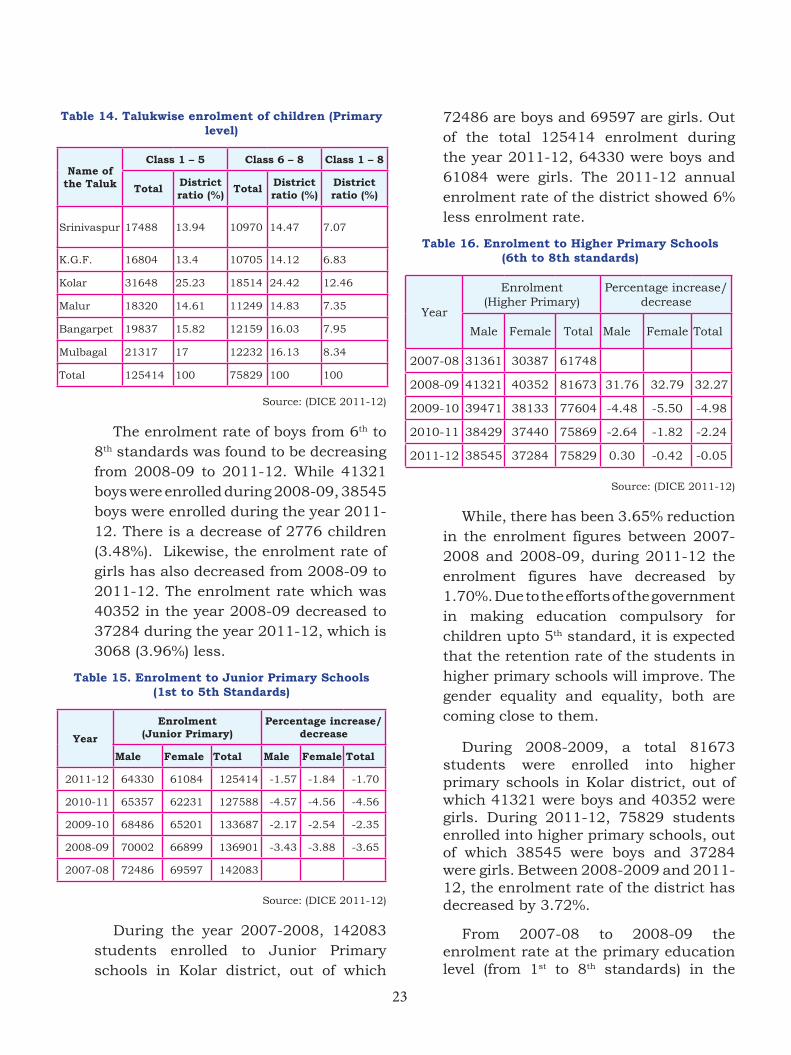
23
Table 14. Talukwise enrolment of children (Primary level)
Name of the Taluk
Class 1 – 5 Class 6 – 8 Class 1 – 8
Total District ratio (%) Total District
ratio (%)District ratio (%)
Srinivaspur 17488 13.94 10970 14.47 7.07
K.G.F. 16804 13.4 10705 14.12 6.83
Kolar 31648 25.23 18514 24.42 12.46
Malur 18320 14.61 11249 14.83 7.35
Bangarpet 19837 15.82 12159 16.03 7.95
Mulbagal 21317 17 12232 16.13 8.34
Total 125414 100 75829 100 100
Source: (DICE 2011-12)
The enrolment rate of boys from 6th to 8th standards was found to be decreasing from 2008-09 to 2011-12. While 41321 boys were enrolled during 2008-09, 38545 boys were enrolled during the year 2011-12. There is a decrease of 2776 children (3.48%). Likewise, the enrolment rate of girls has also decreased from 2008-09 to 2011-12. The enrolment rate which was 40352 in the year 2008-09 decreased to 37284 during the year 2011-12, which is 3068 (3.96%) less.
Table 15. Enrolment to Junior Primary Schools (1st to 5th Standards)
Year
Enrolment (Junior Primary)
Percentage increase/decrease
Male Female Total Male Female Total
2011-12 64330 61084 125414 -1.57 -1.84 -1.70
2010-11 65357 62231 127588 -4.57 -4.56 -4.56
2009-10 68486 65201 133687 -2.17 -2.54 -2.35
2008-09 70002 66899 136901 -3.43 -3.88 -3.65
2007-08 72486 69597 142083
Source: (DICE 2011-12)
During the year 2007-2008, 142083 students enrolled to Junior Primary schools in Kolar district, out of which
72486 are boys and 69597 are girls. Out of the total 125414 enrolment during the year 2011-12, 64330 were boys and 61084 were girls. The 2011-12 annual enrolment rate of the district showed 6% less enrolment rate.
Table 16. Enrolment to Higher Primary Schools (6th to 8th standards)
Year
Enrolment (Higher Primary)
Percentage increase/decrease
Male Female Total Male Female Total
2007-08 31361 30387 61748
2008-09 41321 40352 81673 31.76 32.79 32.27
2009-10 39471 38133 77604 -4.48 -5.50 -4.98
2010-11 38429 37440 75869 -2.64 -1.82 -2.24
2011-12 38545 37284 75829 0.30 -0.42 -0.05
Source: (DICE 2011-12)
While, there has been 3.65% reduction in the enrolment figures between 2007-2008 and 2008-09, during 2011-12 the enrolment figures have decreased by 1.70%. Due to the efforts of the government in making education compulsory for children upto 5th standard, it is expected that the retention rate of the students in higher primary schools will improve. The gender equality and equality, both are coming close to them.
During 2008-2009, a total 81673 students were enrolled into higher primary schools in Kolar district, out of which 41321 were boys and 40352 were girls. During 2011-12, 75829 students enrolled into higher primary schools, out of which 38545 were boys and 37284 were girls. Between 2008-2009 and 2011-12, the enrolment rate of the district has decreased by 3.72%.
From 2007-08 to 2008-09 the enrolment rate at the primary education level (from 1st to 8th standards) in the
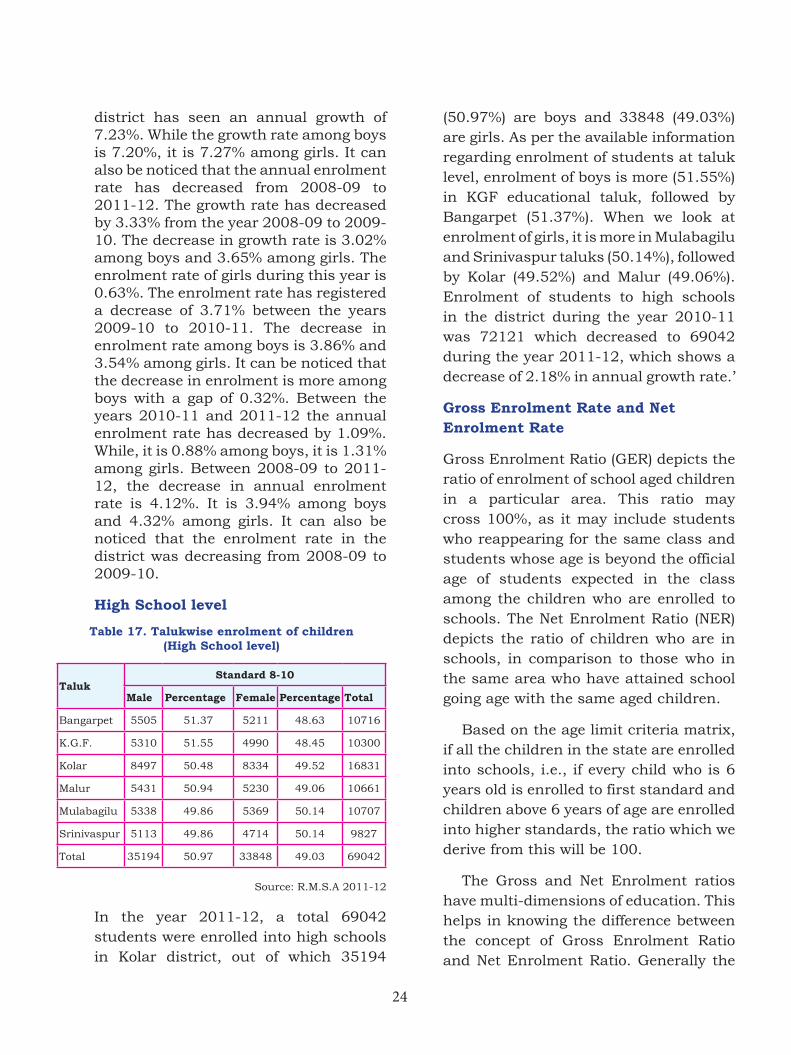
24
district has seen an annual growth of 7.23%. While the growth rate among boys is 7.20%, it is 7.27% among girls. It can also be noticed that the annual enrolment rate has decreased from 2008-09 to 2011-12. The growth rate has decreased by 3.33% from the year 2008-09 to 2009-10. The decrease in growth rate is 3.02% among boys and 3.65% among girls. The enrolment rate of girls during this year is 0.63%. The enrolment rate has registered a decrease of 3.71% between the years 2009-10 to 2010-11. The decrease in enrolment rate among boys is 3.86% and 3.54% among girls. It can be noticed that the decrease in enrolment is more among boys with a gap of 0.32%. Between the years 2010-11 and 2011-12 the annual enrolment rate has decreased by 1.09%. While, it is 0.88% among boys, it is 1.31% among girls. Between 2008-09 to 2011-12, the decrease in annual enrolment rate is 4.12%. It is 3.94% among boys and 4.32% among girls. It can also be noticed that the enrolment rate in the district was decreasing from 2008-09 to 2009-10.
High School level
Table 17. Talukwise enrolment of children (High School level)
TalukStandard 8-10
Male Percentage Female Percentage Total
Bangarpet 5505 51.37 5211 48.63 10716
K.G.F. 5310 51.55 4990 48.45 10300
Kolar 8497 50.48 8334 49.52 16831
Malur 5431 50.94 5230 49.06 10661
Mulabagilu 5338 49.86 5369 50.14 10707
Srinivaspur 5113 49.86 4714 50.14 9827
Total 35194 50.97 33848 49.03 69042
Source: R.M.S.A 2011-12
In the year 2011-12, a total 69042 students were enrolled into high schools in Kolar district, out of which 35194
(50.97%) are boys and 33848 (49.03%) are girls. As per the available information regarding enrolment of students at taluk level, enrolment of boys is more (51.55%) in KGF educational taluk, followed by Bangarpet (51.37%). When we look at enrolment of girls, it is more in Mulabagilu and Srinivaspur taluks (50.14%), followed by Kolar (49.52%) and Malur (49.06%). Enrolment of students to high schools in the district during the year 2010-11 was 72121 which decreased to 69042 during the year 2011-12, which shows a decrease of 2.18% in annual growth rate.’
Gross Enrolment Rate and Net Enrolment Rate
Gross Enrolment Ratio (GER) depicts the ratio of enrolment of school aged children in a particular area. This ratio may cross 100%, as it may include students who reappearing for the same class and students whose age is beyond the official age of students expected in the class among the children who are enrolled to schools. The Net Enrolment Ratio (NER) depicts the ratio of children who are in schools, in comparison to those who in the same area who have attained school going age with the same aged children.
Based on the age limit criteria matrix, if all the children in the state are enrolled into schools, i.e., if every child who is 6 years old is enrolled to first standard and children above 6 years of age are enrolled into higher standards, the ratio which we derive from this will be 100.
The Gross and Net Enrolment ratios have multi-dimensions of education. This helps in knowing the difference between the concept of Gross Enrolment Ratio and Net Enrolment Ratio. Generally the
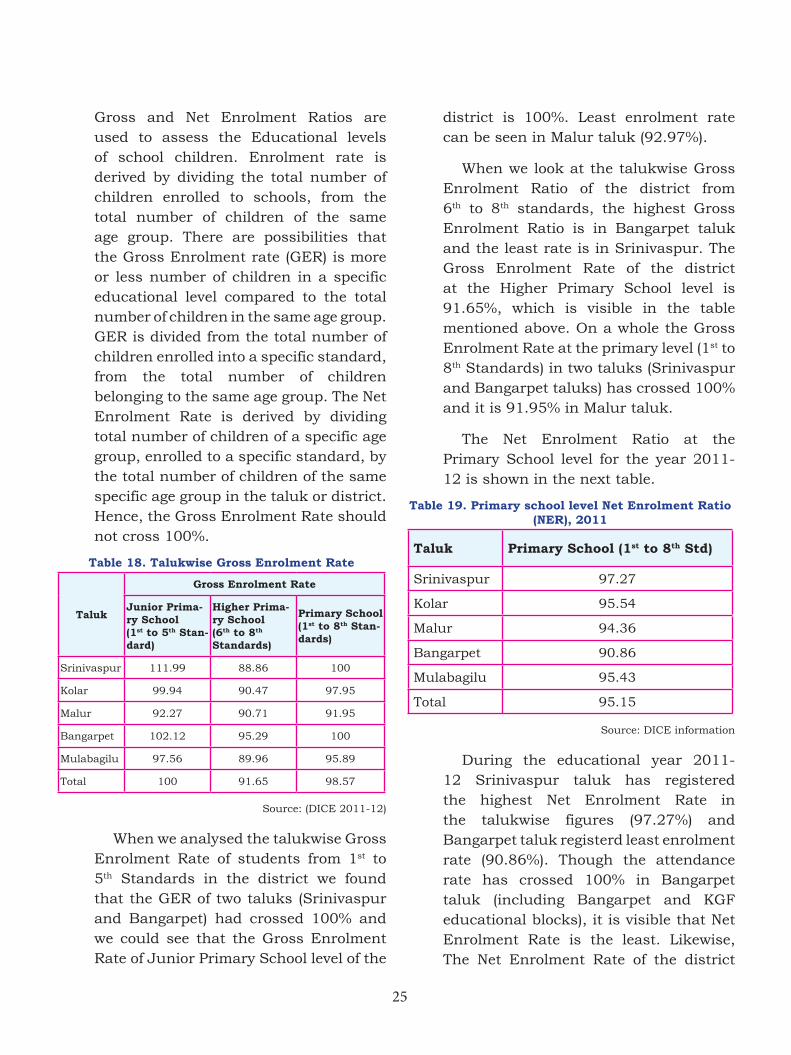
25
Gross and Net Enrolment Ratios are used to assess the Educational levels of school children. Enrolment rate is derived by dividing the total number of children enrolled to schools, from the total number of children of the same age group. There are possibilities that the Gross Enrolment rate (GER) is more or less number of children in a specific educational level compared to the total number of children in the same age group. GER is divided from the total number of children enrolled into a specific standard, from the total number of children belonging to the same age group. The Net Enrolment Rate is derived by dividing total number of children of a specific age group, enrolled to a specific standard, by the total number of children of the same specific age group in the taluk or district. Hence, the Gross Enrolment Rate should not cross 100%.
Table 18. Talukwise Gross Enrolment Rate
Taluk
Gross Enrolment Rate
Junior Prima-ry School (1st to 5th Stan-dard)
Higher Prima-ry School (6th to 8th Standards)
Primary School (1st to 8th Stan-dards)
Srinivaspur 111.99 88.86 100
Kolar 99.94 90.47 97.95
Malur 92.27 90.71 91.95
Bangarpet 102.12 95.29 100
Mulabagilu 97.56 89.96 95.89
Total 100 91.65 98.57
Source: (DICE 2011-12)
When we analysed the talukwise Gross Enrolment Rate of students from 1st to 5th Standards in the district we found that the GER of two taluks (Srinivaspur and Bangarpet) had crossed 100% and we could see that the Gross Enrolment Rate of Junior Primary School level of the
district is 100%. Least enrolment rate can be seen in Malur taluk (92.97%).
When we look at the talukwise Gross Enrolment Ratio of the district from 6th to 8th standards, the highest Gross Enrolment Ratio is in Bangarpet taluk and the least rate is in Srinivaspur. The Gross Enrolment Rate of the district at the Higher Primary School level is 91.65%, which is visible in the table mentioned above. On a whole the Gross Enrolment Rate at the primary level (1st to 8th Standards) in two taluks (Srinivaspur and Bangarpet taluks) has crossed 100% and it is 91.95% in Malur taluk.
The Net Enrolment Ratio at the Primary School level for the year 2011-12 is shown in the next table.
Table 19. Primary school level Net Enrolment Ratio (NER), 2011
Taluk Primary School (1st to 8th Std)
Srinivaspur 97.27
Kolar 95.54
Malur 94.36
Bangarpet 90.86
Mulabagilu 95.43
Total 95.15
Source: DICE information
During the educational year 2011-12 Srinivaspur taluk has registered the highest Net Enrolment Rate in the talukwise figures (97.27%) and Bangarpet taluk registerd least enrolment rate (90.86%). Though the attendance rate has crossed 100% in Bangarpet taluk (including Bangarpet and KGF educational blocks), it is visible that Net Enrolment Rate is the least. Likewise, The Net Enrolment Rate of the district
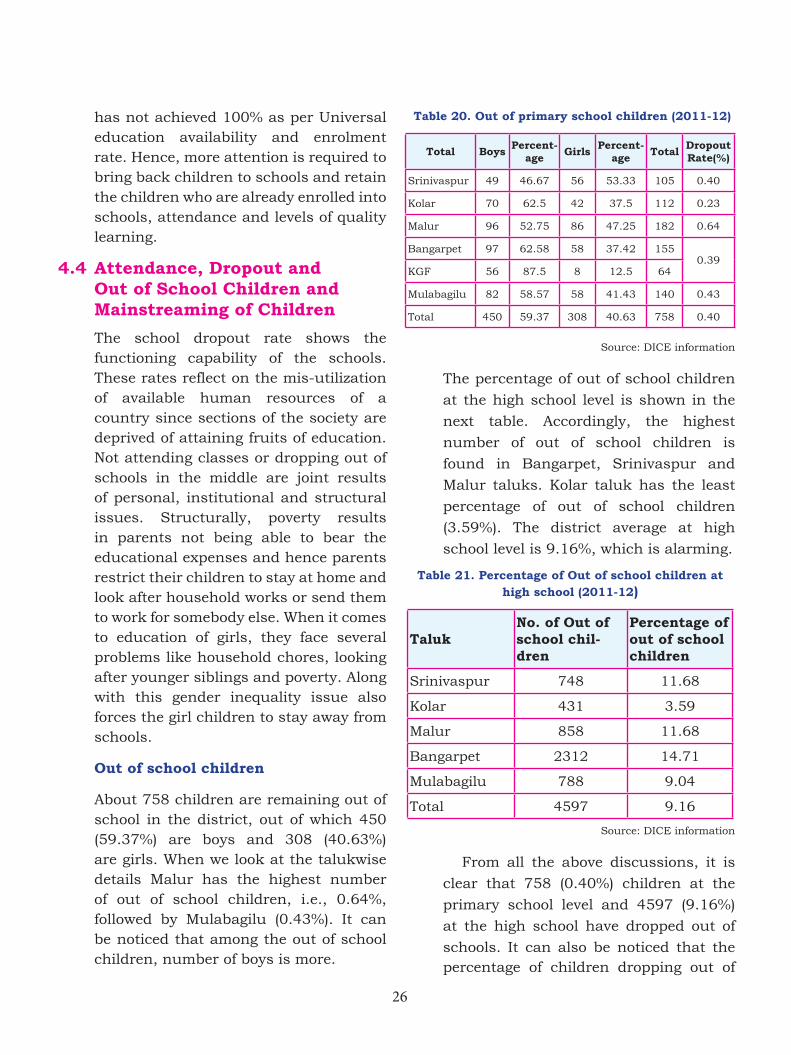
26
has not achieved 100% as per Universal education availability and enrolment rate. Hence, more attention is required to bring back children to schools and retain the children who are already enrolled into schools, attendance and levels of quality learning.
4.4 Attendance, Dropout and Out of School Children and Mainstreaming of Children
The school dropout rate shows the functioning capability of the schools. These rates reflect on the mis-utilization of available human resources of a country since sections of the society are deprived of attaining fruits of education. Not attending classes or dropping out of schools in the middle are joint results of personal, institutional and structural issues. Structurally, poverty results in parents not being able to bear the educational expenses and hence parents restrict their children to stay at home and look after household works or send them to work for somebody else. When it comes to education of girls, they face several problems like household chores, looking after younger siblings and poverty. Along with this gender inequality issue also forces the girl children to stay away from schools.
Out of school children
About 758 children are remaining out of school in the district, out of which 450 (59.37%) are boys and 308 (40.63%) are girls. When we look at the talukwise details Malur has the highest number of out of school children, i.e., 0.64%, followed by Mulabagilu (0.43%). It can be noticed that among the out of school children, number of boys is more.
Table 20. Out of primary school children (2011-12)
Total Boys Percent-age Girls Percent-
age Total Dropout Rate(%)
Srinivaspur 49 46.67 56 53.33 105 0.40
Kolar 70 62.5 42 37.5 112 0.23
Malur 96 52.75 86 47.25 182 0.64
Bangarpet 97 62.58 58 37.42 1550.39
KGF 56 87.5 8 12.5 64
Mulabagilu 82 58.57 58 41.43 140 0.43
Total 450 59.37 308 40.63 758 0.40
Source: DICE information
The percentage of out of school children
at the high school level is shown in the
next table. Accordingly, the highest
number of out of school children is
found in Bangarpet, Srinivaspur and
Malur taluks. Kolar taluk has the least
percentage of out of school children
(3.59%). The district average at high
school level is 9.16%, which is alarming.
Table 21. Percentage of Out of school children at high school (2011-12)
Taluk No. of Out of school chil-dren
Percentage of out of school children
Srinivaspur 748 11.68
Kolar 431 3.59
Malur 858 11.68
Bangarpet 2312 14.71
Mulabagilu 788 9.04
Total 4597 9.16
Source: DICE information
From all the above discussions, it is
clear that 758 (0.40%) children at the
primary school level and 4597 (9.16%)
at the high school have dropped out of
schools. It can also be noticed that the percentage of children dropping out of
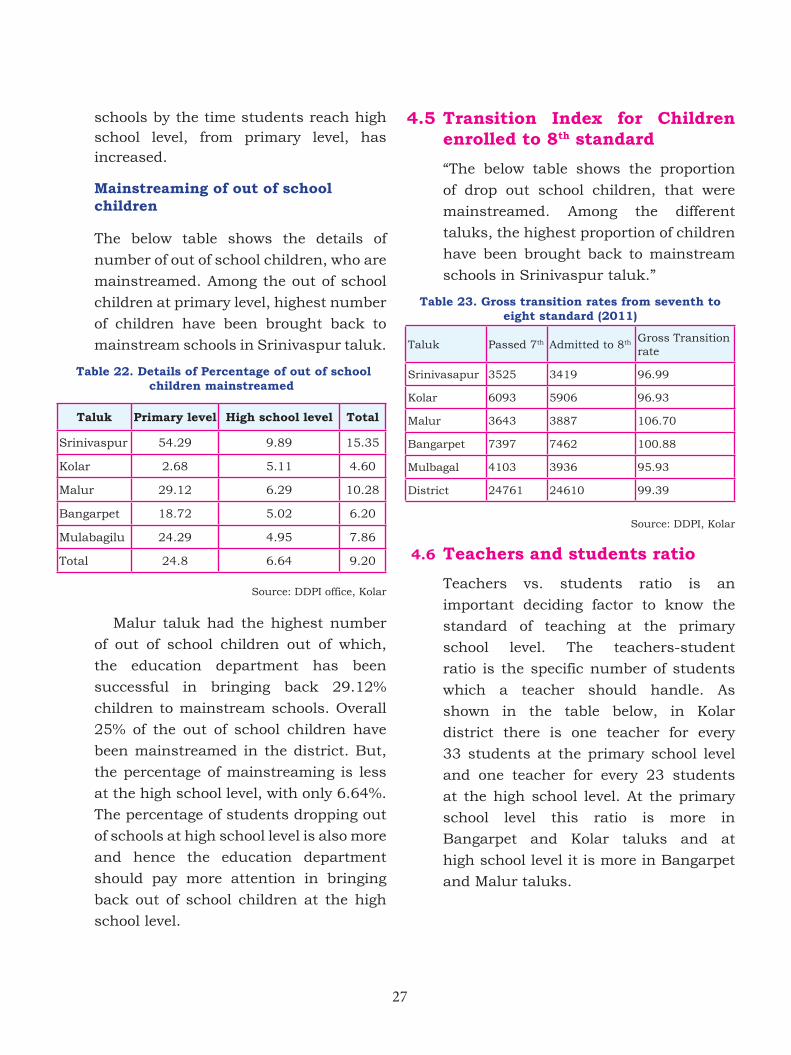
27
schools by the time students reach high school level, from primary level, has increased.
Mainstreaming of out of school children
The below table shows the details of
number of out of school children, who are
mainstreamed. Among the out of school
children at primary level, highest number
of children have been brought back to
mainstream schools in Srinivaspur taluk.
Table 22. Details of Percentage of out of school children mainstreamed
Taluk Primary level High school level Total
Srinivaspur 54.29 9.89 15.35
Kolar 2.68 5.11 4.60
Malur 29.12 6.29 10.28
Bangarpet 18.72 5.02 6.20
Mulabagilu 24.29 4.95 7.86
Total 24.8 6.64 9.20
Source: DDPI office, Kolar
Malur taluk had the highest number
of out of school children out of which,
the education department has been
successful in bringing back 29.12%
children to mainstream schools. Overall
25% of the out of school children have
been mainstreamed in the district. But,
the percentage of mainstreaming is less
at the high school level, with only 6.64%.
The percentage of students dropping out
of schools at high school level is also more
and hence the education department
should pay more attention in bringing
back out of school children at the high
school level.
4.5 Transition Index for Children enrolled to 8th standard
“The below table shows the proportion
of drop out school children, that were
mainstreamed. Among the different
taluks, the highest proportion of children
have been brought back to mainstream
schools in Srinivaspur taluk.”
Table 23. Gross transition rates from seventh to eight standard (2011)
Taluk Passed 7th Admitted to 8th Gross Transition rate
Srinivasapur 3525 3419 96.99
Kolar 6093 5906 96.93
Malur 3643 3887 106.70
Bangarpet 7397 7462 100.88
Mulbagal 4103 3936 95.93
District 24761 24610 99.39
Source: DDPI, Kolar
4.6 Teachers and students ratio
Teachers vs. students ratio is an
important deciding factor to know the
standard of teaching at the primary
school level. The teachers-student
ratio is the specific number of students
which a teacher should handle. As
shown in the table below, in Kolar
district there is one teacher for every
33 students at the primary school level
and one teacher for every 23 students
at the high school level. At the primary
school level this ratio is more in
Bangarpet and Kolar taluks and at
high school level it is more in Bangarpet
and Malur taluks.
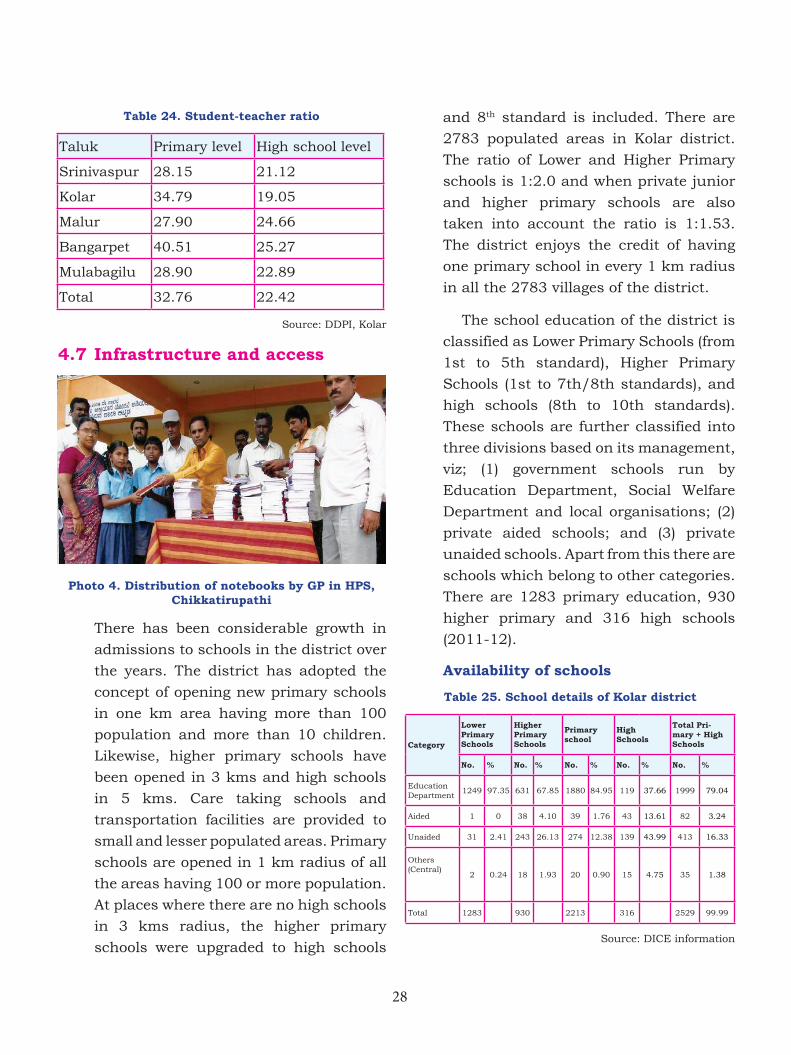
28
Table 24. Student-teacher ratio
Taluk Primary level High school level
Srinivaspur 28.15 21.12
Kolar 34.79 19.05
Malur 27.90 24.66
Bangarpet 40.51 25.27
Mulabagilu 28.90 22.89
Total 32.76 22.42
Source: DDPI, Kolar
4.7 Infrastructure and access
Photo 4. Distribution of notebooks by GP in HPS, Chikkatirupathi
There has been considerable growth in
admissions to schools in the district over
the years. The district has adopted the
concept of opening new primary schools
in one km area having more than 100
population and more than 10 children.
Likewise, higher primary schools have
been opened in 3 kms and high schools
in 5 kms. Care taking schools and
transportation facilities are provided to
small and lesser populated areas. Primary
schools are opened in 1 km radius of all
the areas having 100 or more population.
At places where there are no high schools
in 3 kms radius, the higher primary
schools were upgraded to high schools
and 8th standard is included. There are
2783 populated areas in Kolar district.
The ratio of Lower and Higher Primary
schools is 1:2.0 and when private junior
and higher primary schools are also
taken into account the ratio is 1:1.53.
The district enjoys the credit of having
one primary school in every 1 km radius
in all the 2783 villages of the district.
The school education of the district is
classified as Lower Primary Schools (from
1st to 5th standard), Higher Primary
Schools (1st to 7th/8th standards), and
high schools (8th to 10th standards).
These schools are further classified into
three divisions based on its management,
viz; (1) government schools run by
Education Department, Social Welfare
Department and local organisations; (2)
private aided schools; and (3) private
unaided schools. Apart from this there are
schools which belong to other categories.
There are 1283 primary education, 930
higher primary and 316 high schools
(2011-12).
Availability of schools
Table 25. School details of Kolar district
Category
Lower Primary Schools
Higher Primary Schools
Primary school
High Schools
Total Pri-mary + High Schools
No. % No. % No. % No. % No. %
Education Department
1249 97.35 631 67.85 1880 84.95 119 37.66 1999 79.04
Aided 1 0 38 4.10 39 1.76 43 13.61 82 3.24
Unaided 31 2.41 243 26.13 274 12.38 139 43.99 413 16.33
Others (Central)
2 0.24 18 1.93 20 0.90 15 4.75 35 1.38
Total 1283 930 2213 316 2529 99.99
Source: DICE information
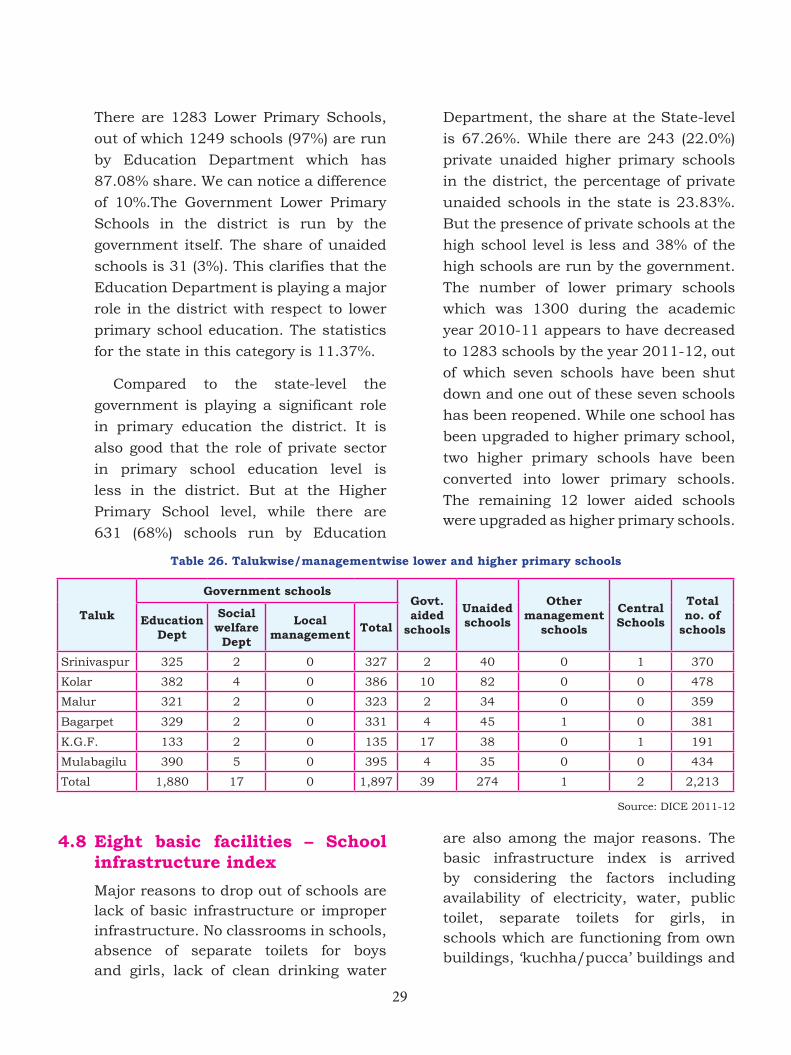
29
There are 1283 Lower Primary Schools,
out of which 1249 schools (97%) are run
by Education Department which has
87.08% share. We can notice a difference
of 10%.The Government Lower Primary
Schools in the district is run by the
government itself. The share of unaided
schools is 31 (3%). This clarifies that the
Education Department is playing a major
role in the district with respect to lower
primary school education. The statistics
for the state in this category is 11.37%.
Compared to the state-level the
government is playing a significant role
in primary education the district. It is
also good that the role of private sector
in primary school education level is
less in the district. But at the Higher
Primary School level, while there are
631 (68%) schools run by Education
Department, the share at the State-level
is 67.26%. While there are 243 (22.0%)
private unaided higher primary schools
in the district, the percentage of private
unaided schools in the state is 23.83%.
But the presence of private schools at the
high school level is less and 38% of the
high schools are run by the government.
The number of lower primary schools
which was 1300 during the academic
year 2010-11 appears to have decreased
to 1283 schools by the year 2011-12, out
of which seven schools have been shut
down and one out of these seven schools
has been reopened. While one school has
been upgraded to higher primary school,
two higher primary schools have been
converted into lower primary schools.
The remaining 12 lower aided schools were upgraded as higher primary schools.
Table 26. Talukwise/managementwise lower and higher primary schools
Taluk
Government schoolsGovt. aided
schools
Unaided schools
Other management
schools
Central Schools
Total no. of
schoolsEducation
Dept
Social welfare Dept
Local management Total
Srinivaspur 325 2 0 327 2 40 0 1 370
Kolar 382 4 0 386 10 82 0 0 478
Malur 321 2 0 323 2 34 0 0 359
Bagarpet 329 2 0 331 4 45 1 0 381
K.G.F. 133 2 0 135 17 38 0 1 191
Mulabagilu 390 5 0 395 4 35 0 0 434
Total 1,880 17 0 1,897 39 274 1 2 2,213
Source: DICE 2011-12
4.8 Eight basic facilities – School infrastructure index
Major reasons to drop out of schools are lack of basic infrastructure or improper infrastructure. No classrooms in schools, absence of separate toilets for boys and girls, lack of clean drinking water
are also among the major reasons. The basic infrastructure index is arrived by considering the factors including availability of electricity, water, public toilet, separate toilets for girls, in schools which are functioning from own buildings, ‘kuchha/pucca’ buildings and
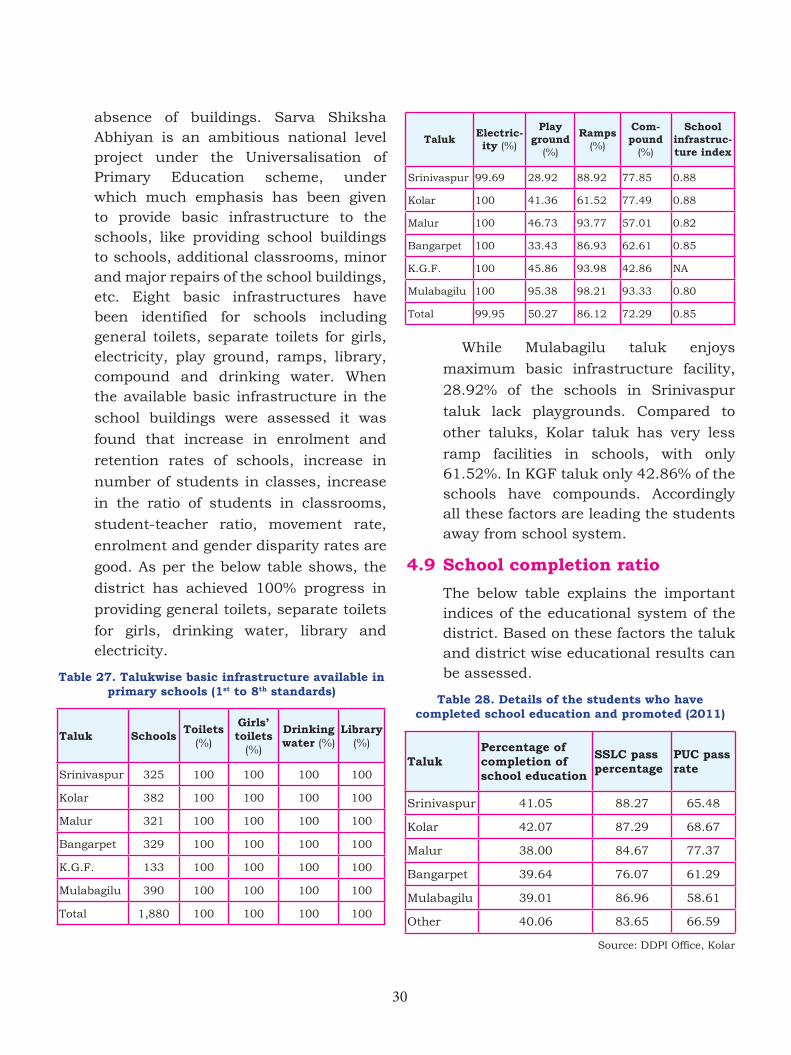
30
absence of buildings. Sarva Shiksha Abhiyan is an ambitious national level project under the Universalisation of Primary Education scheme, under which much emphasis has been given to provide basic infrastructure to the schools, like providing school buildings to schools, additional classrooms, minor and major repairs of the school buildings, etc. Eight basic infrastructures have been identified for schools including general toilets, separate toilets for girls, electricity, play ground, ramps, library, compound and drinking water. When the available basic infrastructure in the
school buildings were assessed it was
found that increase in enrolment and
retention rates of schools, increase in
number of students in classes, increase
in the ratio of students in classrooms,
student-teacher ratio, movement rate,
enrolment and gender disparity rates are
good. As per the below table shows, the
district has achieved 100% progress in
providing general toilets, separate toilets
for girls, drinking water, library and electricity.
Table 27. Talukwise basic infrastructure available in primary schools (1st to 8th standards)
Taluk Schools Toilets (%)
Girls’ toilets
(%)
Drinking water (%)
Library (%)
Srinivaspur 325 100 100 100 100
Kolar 382 100 100 100 100
Malur 321 100 100 100 100
Bangarpet 329 100 100 100 100
K.G.F. 133 100 100 100 100
Mulabagilu 390 100 100 100 100
Total 1,880 100 100 100 100
Taluk Electric-ity (%)
Play ground
(%)
Ramps (%)
Com-pound
(%)
School infrastruc-ture index
Srinivaspur 99.69 28.92 88.92 77.85 0.88
Kolar 100 41.36 61.52 77.49 0.88
Malur 100 46.73 93.77 57.01 0.82
Bangarpet 100 33.43 86.93 62.61 0.85
K.G.F. 100 45.86 93.98 42.86 NA
Mulabagilu 100 95.38 98.21 93.33 0.80
Total 99.95 50.27 86.12 72.29 0.85
While Mulabagilu taluk enjoys
maximum basic infrastructure facility,
28.92% of the schools in Srinivaspur
taluk lack playgrounds. Compared to
other taluks, Kolar taluk has very less
ramp facilities in schools, with only 61.52%. In KGF taluk only 42.86% of the schools have compounds. Accordingly all these factors are leading the students away from school system.
4.9 School completion ratio
The below table explains the important indices of the educational system of the district. Based on these factors the taluk and district wise educational results can be assessed.
Table 28. Details of the students who have completed school education and promoted (2011)
TalukPercentage of completion of school education
SSLC pass percentage
PUC pass rate
Srinivaspur 41.05 88.27 65.48
Kolar 42.07 87.29 68.67
Malur 38.00 84.67 77.37
Bangarpet 39.64 76.07 61.29
Mulabagilu 39.01 86.96 58.61
Other 40.06 83.65 66.59
Source: DDPI Office, Kolar
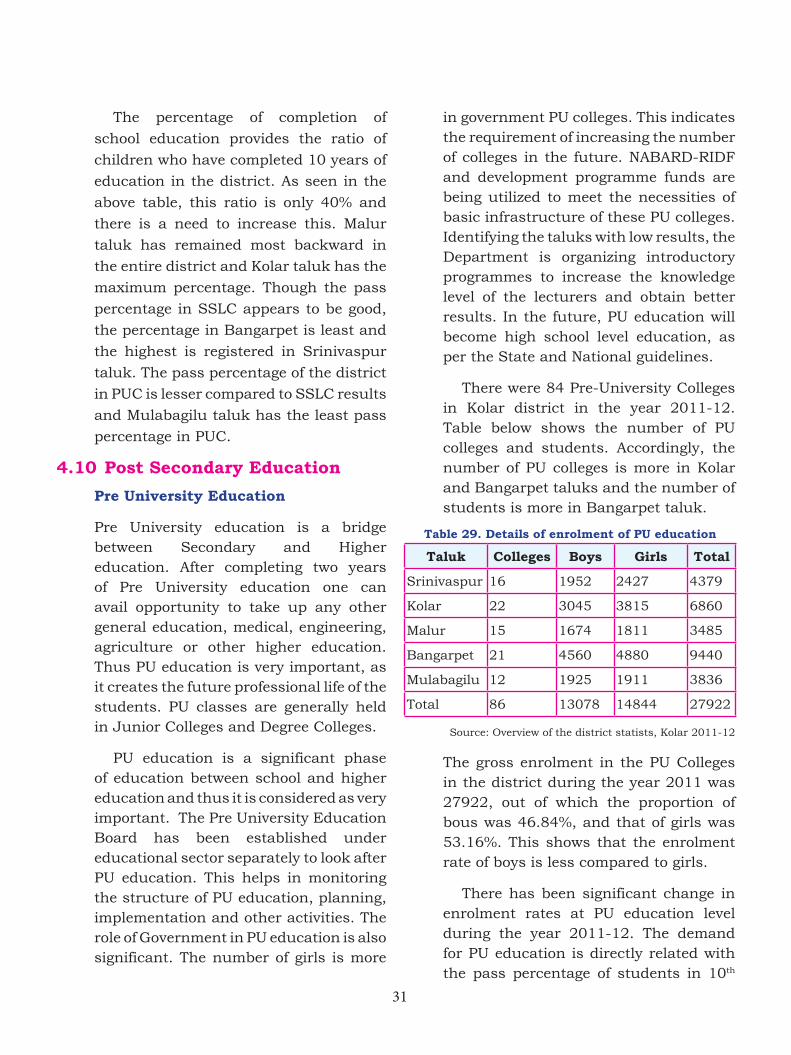
31
The percentage of completion of
school education provides the ratio of
children who have completed 10 years of
education in the district. As seen in the
above table, this ratio is only 40% and
there is a need to increase this. Malur
taluk has remained most backward in
the entire district and Kolar taluk has the
maximum percentage. Though the pass
percentage in SSLC appears to be good,
the percentage in Bangarpet is least and
the highest is registered in Srinivaspur
taluk. The pass percentage of the district
in PUC is lesser compared to SSLC results
and Mulabagilu taluk has the least pass
percentage in PUC.
4.10 Post Secondary Education
Pre University Education
Pre University education is a bridge between Secondary and Higher education. After completing two years of Pre University education one can avail opportunity to take up any other general education, medical, engineering, agriculture or other higher education. Thus PU education is very important, as it creates the future professional life of the students. PU classes are generally held in Junior Colleges and Degree Colleges.
PU education is a significant phase of education between school and higher education and thus it is considered as very important. The Pre University Education Board has been established under educational sector separately to look after PU education. This helps in monitoring the structure of PU education, planning, implementation and other activities. The role of Government in PU education is also significant. The number of girls is more
in government PU colleges. This indicates the requirement of increasing the number of colleges in the future. NABARD-RIDF and development programme funds are being utilized to meet the necessities of basic infrastructure of these PU colleges. Identifying the taluks with low results, the Department is organizing introductory programmes to increase the knowledge level of the lecturers and obtain better results. In the future, PU education will become high school level education, as per the State and National guidelines.
There were 84 Pre-University Colleges in Kolar district in the year 2011-12. Table below shows the number of PU colleges and students. Accordingly, the number of PU colleges is more in Kolar and Bangarpet taluks and the number of students is more in Bangarpet taluk.
Table 29. Details of enrolment of PU education
Taluk Colleges Boys Girls Total
Srinivaspur 16 1952 2427 4379
Kolar 22 3045 3815 6860
Malur 15 1674 1811 3485
Bangarpet 21 4560 4880 9440
Mulabagilu 12 1925 1911 3836
Total 86 13078 14844 27922
Source: Overview of the district statists, Kolar 2011-12
The gross enrolment in the PU Colleges in the district during the year 2011 was 27922, out of which the proportion of bous was 46.84%, and that of girls was 53.16%. This shows that the enrolment rate of boys is less compared to girls.
There has been significant change in enrolment rates at PU education level during the year 2011-12. The demand for PU education is directly related with the pass percentage of students in 10th
32
standard public examinations. By the end of the year 2010, the pass percentage of the district in 10th standard was 57.83%. The pass percentage after 2011 has registered a steep increase with 81.46%. The enrolment rate to PU education can be improved if efforts are made to provide proper guidance and counselling to the students who pass 10th standard. During the year 1966, the Education Commission had limited the enrolment rate to Arts courses to 30-35%. Accordingly, the percentage of enrolment during the year 2011-12 for Arts courses in the district is registered at 34%. There has been no significant change in PU level. This has led to decrease in enrolment for science course. The demand for professional science courses is more. But generally there will be no pressure of demand for Arts and Commerce courses. But in Kolar district 39% of the students have enrolled for Commerce. The percentage of enrolment in science category is 27%. It is noticed that due to demand for professional courses, enrolment rate for science courses is decreasing. The PU level science courses will be the foundation to contribute teachers for high schools in the future. Thus PU science courses are considered as kindergarten, for people who become high school teachers in the future. The post graduation and research courses are foundation for creation of scientists in the district. In order to identify the suitable courses as per demand after completion of PU education and continue them, there is a need to increase the science category.
Graduate Education
The First Grade College in Kolar was commenced in the year 1948, as
intermediate college. In the year 1961 it was upgraded to First Grade College level. There were 224 students at that time. The courses imparted included History, Economics and Philosophy under Arts; Physics, Chemistry and Mathematics (PCM) under Science along with Sanskrit, Kannada, English, Telugu, Tamil, Urdu and other languages. When PU education commenced here during the year 1957-58, History, Economics and Commerce; Chemistry, Botany and Zoology subjects were introduced as optional subjects. There were 370 students during the year 1960-61, out of which 90 students were studying in Arts and 280 in Science subjects. There were only 19 lecturers. The first batch of students for BA, BSc degree courses offered by Mysuru University appeared for the exams in the year 1964. By the year 1967 there were 980 students out of which 141 (106 boys, 35 girls) were in PU Arts, 343 (302 boys, 41 girls) in PU Science and 94 (75 boys, 19 girls) in Arts subjects and 330 (283 boys, 47 girls) were studying in Degree science category. During the same year there were 31 lecturers, four demonstrators along with one principal. There was educational opportunity here till the year 1984. The institution was divided during 1984 and a First Grade College for girls was opened in Kolar was established separately. Karnataka State’s well known poet Thi. Nam Srikantaiah has also served here as a Principal during 1950’s. By the year 2004 August, 1888 students were studying here. The Government First Grade College for girls is functioning in Kolar. In the remaining places aided and unaided first grade colleges are functioning. The details of general graduate colleges in the district are as follows.
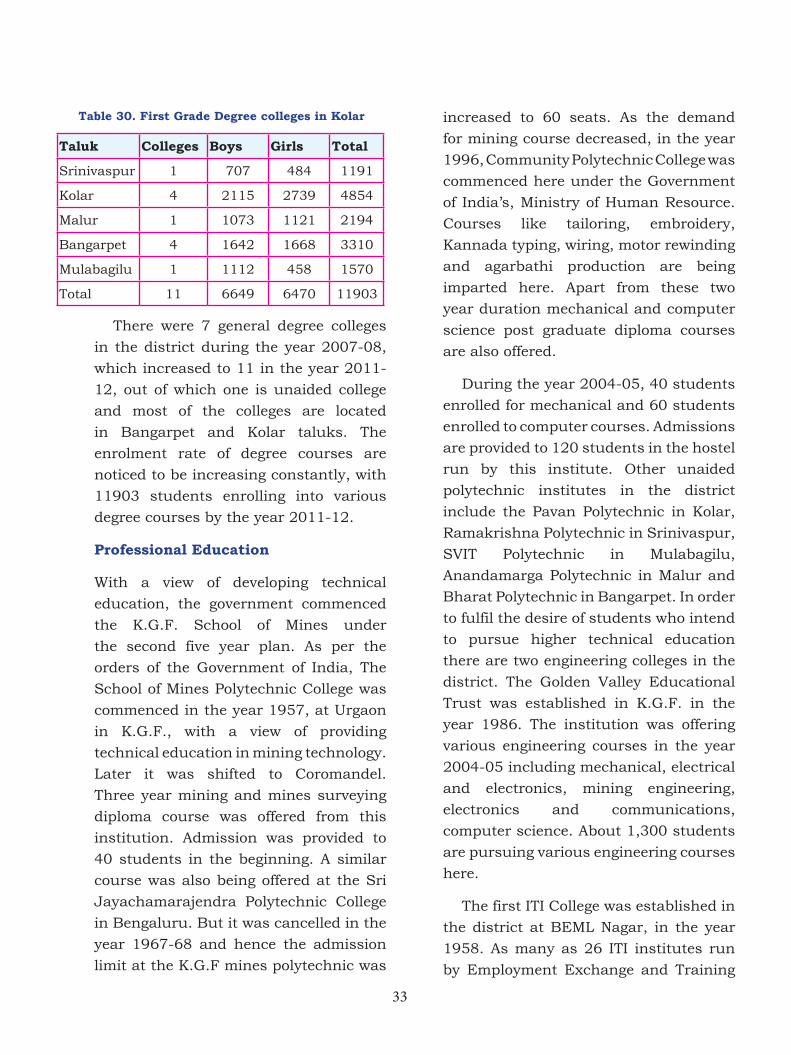
33
Table 30. First Grade Degree colleges in Kolar
Taluk Colleges Boys Girls Total
Srinivaspur 1 707 484 1191
Kolar 4 2115 2739 4854
Malur 1 1073 1121 2194
Bangarpet 4 1642 1668 3310
Mulabagilu 1 1112 458 1570
Total 11 6649 6470 11903
There were 7 general degree colleges
in the district during the year 2007-08,
which increased to 11 in the year 2011-
12, out of which one is unaided college
and most of the colleges are located
in Bangarpet and Kolar taluks. The
enrolment rate of degree courses are
noticed to be increasing constantly, with
11903 students enrolling into various
degree courses by the year 2011-12.
Professional Education
With a view of developing technical
education, the government commenced
the K.G.F. School of Mines under
the second five year plan. As per the
orders of the Government of India, The
School of Mines Polytechnic College was
commenced in the year 1957, at Urgaon
in K.G.F., with a view of providing
technical education in mining technology.
Later it was shifted to Coromandel.
Three year mining and mines surveying
diploma course was offered from this
institution. Admission was provided to
40 students in the beginning. A similar
course was also being offered at the Sri
Jayachamarajendra Polytechnic College
in Bengaluru. But it was cancelled in the
year 1967-68 and hence the admission
limit at the K.G.F mines polytechnic was
increased to 60 seats. As the demand
for mining course decreased, in the year
1996, Community Polytechnic College was
commenced here under the Government
of India’s, Ministry of Human Resource.
Courses like tailoring, embroidery,
Kannada typing, wiring, motor rewinding
and agarbathi production are being
imparted here. Apart from these two
year duration mechanical and computer
science post graduate diploma courses
are also offered.
During the year 2004-05, 40 students
enrolled for mechanical and 60 students
enrolled to computer courses. Admissions
are provided to 120 students in the hostel
run by this institute. Other unaided
polytechnic institutes in the district
include the Pavan Polytechnic in Kolar,
Ramakrishna Polytechnic in Srinivaspur,
SVIT Polytechnic in Mulabagilu,
Anandamarga Polytechnic in Malur and
Bharat Polytechnic in Bangarpet. In order
to fulfil the desire of students who intend
to pursue higher technical education
there are two engineering colleges in the
district. The Golden Valley Educational
Trust was established in K.G.F. in the
year 1986. The institution was offering
various engineering courses in the year
2004-05 including mechanical, electrical
and electronics, mining engineering,
electronics and communications,
computer science. About 1,300 students
are pursuing various engineering courses
here.
The first ITI College was established in
the district at BEML Nagar, in the year
1958. As many as 26 ITI institutes run
by Employment Exchange and Training
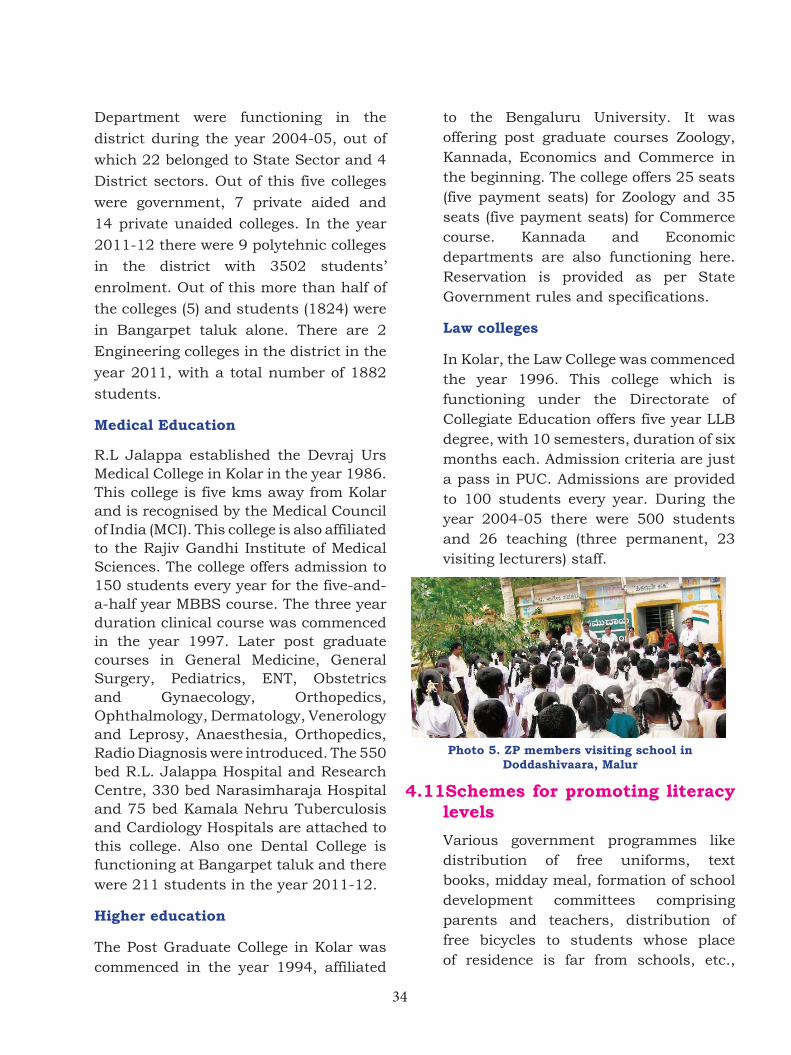
34
Department were functioning in the
district during the year 2004-05, out of
which 22 belonged to State Sector and 4
District sectors. Out of this five colleges
were government, 7 private aided and
14 private unaided colleges. In the year
2011-12 there were 9 polytehnic colleges
in the district with 3502 students’
enrolment. Out of this more than half of
the colleges (5) and students (1824) were
in Bangarpet taluk alone. There are 2
Engineering colleges in the district in the
year 2011, with a total number of 1882
students.
Medical Education
R.L Jalappa established the Devraj Urs Medical College in Kolar in the year 1986. This college is five kms away from Kolar and is recognised by the Medical Council of India (MCI). This college is also affiliated to the Rajiv Gandhi Institute of Medical Sciences. The college offers admission to 150 students every year for the five-and-a-half year MBBS course. The three year duration clinical course was commenced in the year 1997. Later post graduate courses in General Medicine, General Surgery, Pediatrics, ENT, Obstetrics and Gynaecology, Orthopedics, Ophthalmology, Dermatology, Venerology and Leprosy, Anaesthesia, Orthopedics, Radio Diagnosis were introduced. The 550 bed R.L. Jalappa Hospital and Research Centre, 330 bed Narasimharaja Hospital and 75 bed Kamala Nehru Tuberculosis and Cardiology Hospitals are attached to this college. Also one Dental College is functioning at Bangarpet taluk and there were 211 students in the year 2011-12.
Higher education
The Post Graduate College in Kolar was commenced in the year 1994, affiliated
to the Bengaluru University. It was offering post graduate courses Zoology, Kannada, Economics and Commerce in the beginning. The college offers 25 seats (five payment seats) for Zoology and 35 seats (five payment seats) for Commerce course. Kannada and Economic departments are also functioning here. Reservation is provided as per State Government rules and specifications.
Law colleges
In Kolar, the Law College was commenced the year 1996. This college which is functioning under the Directorate of Collegiate Education offers five year LLB degree, with 10 semesters, duration of six months each. Admission criteria are just a pass in PUC. Admissions are provided to 100 students every year. During the year 2004-05 there were 500 students and 26 teaching (three permanent, 23 visiting lecturers) staff.
Photo 5. ZP members visiting school in Doddashivaara, Malur
4.11Schemes for promoting literacy levels
Various government programmes like distribution of free uniforms, text books, midday meal, formation of school development committees comprising parents and teachers, distribution of free bicycles to students whose place of residence is far from schools, etc.,
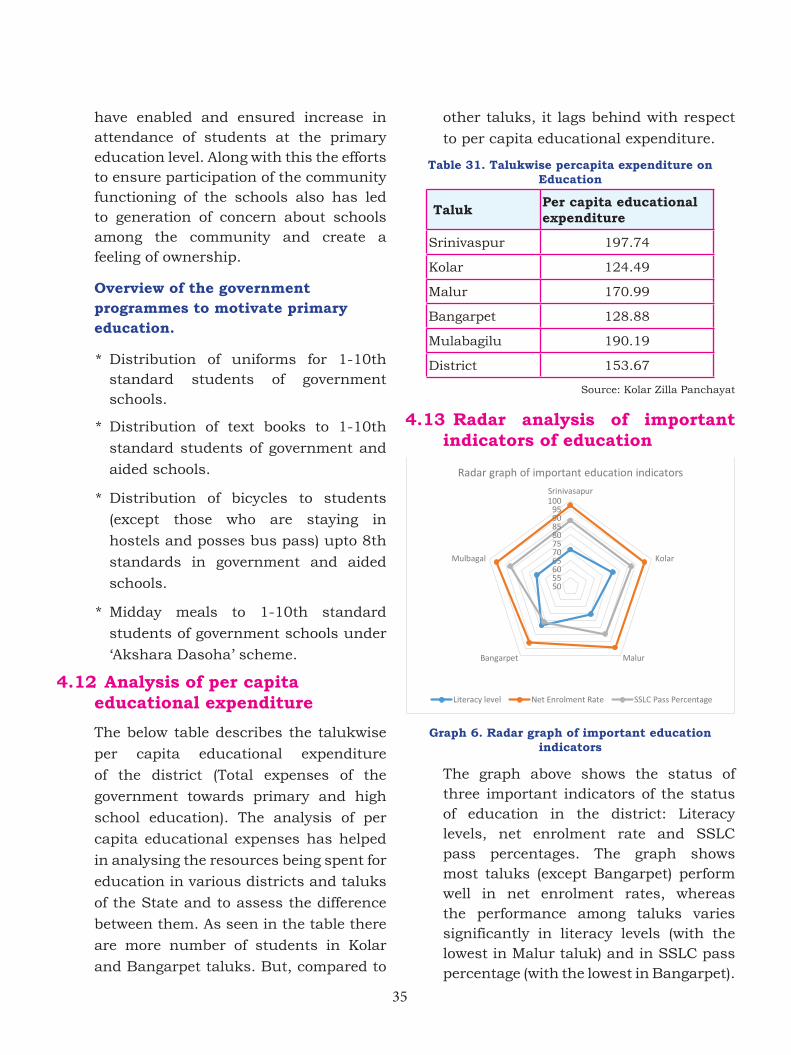
35
have enabled and ensured increase in attendance of students at the primary education level. Along with this the efforts to ensure participation of the community functioning of the schools also has led to generation of concern about schools among the community and create a feeling of ownership.
Overview of the government programmes to motivate primary education.
* Distribution of uniforms for 1-10th standard students of government schools.
* Distribution of text books to 1-10th
standard students of government and
aided schools.
* Distribution of bicycles to students
(except those who are staying in
hostels and posses bus pass) upto 8th
standards in government and aided
schools.
* Midday meals to 1-10th standard
students of government schools under
‘Akshara Dasoha’ scheme.
4.12 Analysis of per capita educational expenditure
The below table describes the talukwise
per capita educational expenditure
of the district (Total expenses of the
government towards primary and high
school education). The analysis of per
capita educational expenses has helped
in analysing the resources being spent for
education in various districts and taluks
of the State and to assess the difference
between them. As seen in the table there
are more number of students in Kolar
and Bangarpet taluks. But, compared to
other taluks, it lags behind with respect
to per capita educational expenditure.
Table 31. Talukwise percapita expenditure on Education
Taluk Per capita educational expenditure
Srinivaspur 197.74
Kolar 124.49
Malur 170.99
Bangarpet 128.88
Mulabagilu 190.19
District 153.67
Source: Kolar Zilla Panchayat
4.13 Radar analysis of important indicators of education
Graph 6. Radar graph of important education indicators
The graph above shows the status of three important indicators of the status of education in the district: Literacy levels, net enrolment rate and SSLC pass percentages. The graph shows most taluks (except Bangarpet) perform well in net enrolment rates, whereas the performance among taluks varies significantly in literacy levels (with the lowest in Malur taluk) and in SSLC pass percentage (with the lowest in Bangarpet).
36
4.14 Overview of persisting educational gaps in the district
The literacy level of the district is lesser than the State average and is in the 14th place in the State. As much as 25.61% people of the district are still illiterates and thus the district has failed in reaching the National target of achieving 85% literacy rate by the year 2012. Malur taluk has remained most backward in this aspect. When we look at the primary school level attendance analysis, though the total attendance percentage has crossed 100 percent in Bangarpet taluk (including Bangarpet and K.G.F. educational block), the Net Enrolment Rate (NER) is the least in the entire district. Likewise, it is also visible that the Net Enrolment Rate has not achieved 100 per cent as per the availability of Universal Education. Though the percentage of children who have remained out of schools at the primary school level in the district is less, the average at the high school level is at 9.16% which is quite disturbing. The district has a long way to go in mainstreaming out of school children. Especially the percentage is low at the high school level at just 6.64%. When we look at the basic infrastructure availability in the schools, the lack of play grounds takes stands out.
The ratio of students who have completed 10 years of school education in the district is 40% and there is a need to increase this ratio. Malur taluk is again in the last place in this aspect. Though the pass percentage of the district in SSLC is good, the percentage in Bangarpet taluk is low. Likewise the pass percentage of the district in PUC is low when compared to the SSLC pass
percentage and Mulabagilu taluk is in the last place.
4.15 Concluding Remarks
This chapter provides an overview of the education system of in Kolar district and its impact on human development. In general, it can be said that in comparison to many other developed districts of the state, Kolar has many areas where to improve upon, within the education sector.
According to this analysis, it is seen that though the position of various taluks of the district varies in various aspects, Malur taluks has generally remained backward in several important aspects, like literacy levels, Gross Enrolment Rate, rate of out of school children, percentage of children who have completed school education, etc. Thus more importance could be given to this taluk.
Likewise, though the number of students is more in Kolar and Bangarpet taluks, they lack basic infrastructure and have poor student and teachers’ ratio and per capita expenditures. Accordingly, more priority is needed to these taluks with respect to providing educational facilities.
4.16 Smalll Area Study: Recent SSLC Examination Performance in Kolar
This study was taken up as a result of the drastic jump in the number of Kolar District schools achieving a 100% pass percentage on the Secondary School Leaving Certificate (SSLC) examination. This state-wide exam is administered at the end of the 10th standard, to determine completion of the secondary
37
level of education and prospects for Pre-University College. Students in the district also participate in three rounds of preparatory tests for the SSLC exam, at the taluk, district, and state levels.
Introduction
In the 2010-11 exam cycle, Kolar District ranked last among the state of Karnataka’s 30 districts with 57.81% of test takers passing the SSLC exam. By 2011-12, Kolar’s rank climbed to 8th in the state with a pass rate of 81.46%. This number dropped to 79.83% in the most recent exam cycle, whereas many other districts boosted test performance, causing Kolar to drop down to 21st in the state.
In order to pass the SSLC exam, a student must receive 35% of the overall 625 marks. Students who achieve 50% or more pass second class, 60% or more pass first class, and 70% or more pass with distinction. In the 2011-12 academic year, 45 of Kolar’s 287 schools, or 16%, had 100% of their SSLC exam takers pass the exam. By contrast, in 2012-13 academic year, 87 of 287 schools, or 30.3%, achieved a 100% pass percentage. The majority of these schools are concentrated in Srinivaspur taluk whereas Kolar taluk houses the greatest number of schools overall*. Additionally, 36 of 287 schools, or 13%, achieved a jump in pass percentage of 20% or more. The highest concentration of schools with a jump of 20% or more is in Bangarpet/KGF taluk (16 schools) whereas the lowest concentration occurs in Malur and Srinivaspur taluks (3 schools each).
Furthermore, among schools achieving 100% pass rates in the 2012-13 exam
cycle, 69 of 87 schools, or 79%, scored in the 35-49% range. In the 2011-12 exam cycle, these same schools had the majority of students at 52 of the 87 schools, or 60% of schools, score in the 60% and above range. This pattern indicates that while more schools were able to get every SSLC exam taker to pass the test in the 2012-13 cycle, the quality of scores declined in the time period. The declining score with which students pass the SSLC exam lends credence to the idea that schools are focusing intensely on the quantity of students who pass the exam, and not the quality of scores individual students achieve.
As seen above, the number of schools with 100% pass percentage in the district almost doubled in one exam cycle. In order to delve deeper into what accounts for the rapid improvement in test performance in Kolar, a field survey was conducted in four secondary schools across the district. Schools that achieved a 100% pass percentage in the 2012-2013 year and did not reduce test enrolment numbers in the same time period were chosen for the study. Furthermore, the schools were filtered out to have diversity in school sizes, management styles, language mediums, and regions. In addition to qualitative information derived from interviewing educators and students, the study evaluates 9th standard final exam scores for the 2012-13 SSLC exam cohort as well as state level preparatory test scores. Finally, interviews were conducted with representatives of Kolar’s Deputy Director of Public Instruction (DDPI) office to get a sense of patterns in the district overall. The individual school profiles are given in the table below
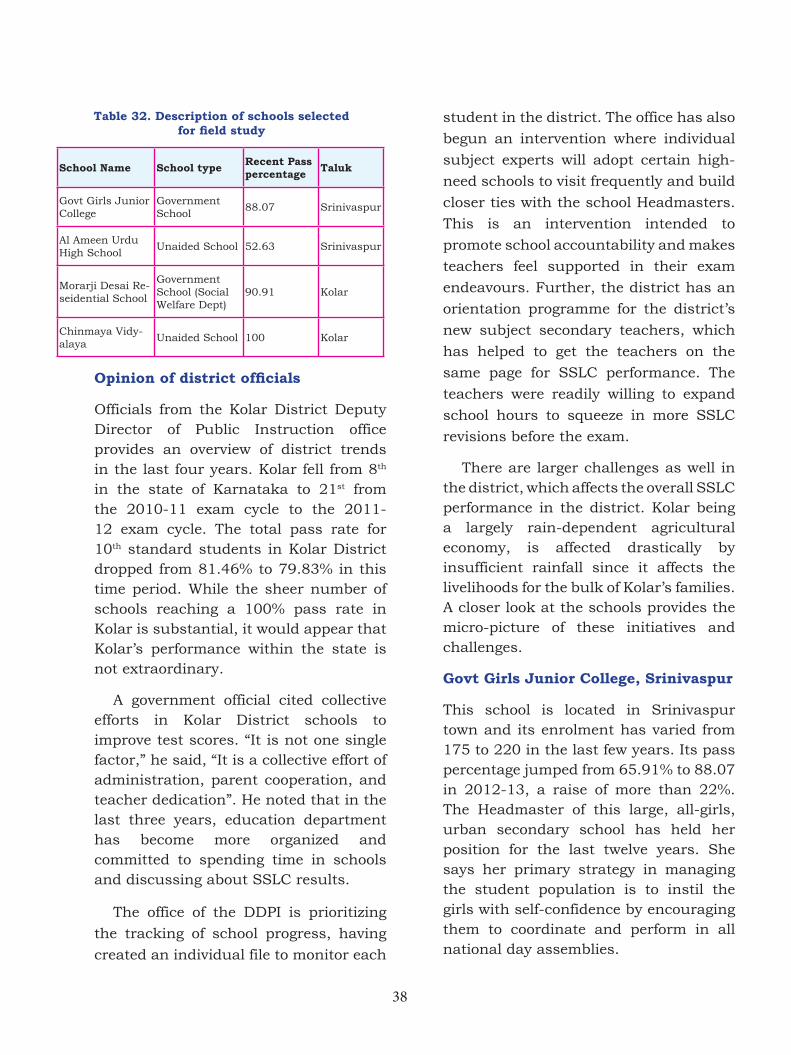
38
Table 32. Description of schools selected forfieldstudy
School Name School type Recent Pass percentage Taluk
Govt Girls Junior College
Government School
88.07 Srinivaspur
Al Ameen Urdu High School
Unaided School 52.63 Srinivaspur
Morarji Desai Re-seidential School
Government School (Social Welfare Dept)
90.91 Kolar
Chinmaya Vidy-alaya
Unaided School 100 Kolar
Opinionofdistrictofficials
Officials from the Kolar District Deputy Director of Public Instruction office provides an overview of district trends in the last four years. Kolar fell from 8th in the state of Karnataka to 21st from the 2010-11 exam cycle to the 2011-12 exam cycle. The total pass rate for 10th standard students in Kolar District dropped from 81.46% to 79.83% in this time period. While the sheer number of schools reaching a 100% pass rate in Kolar is substantial, it would appear that Kolar’s performance within the state is not extraordinary.
A government official cited collective efforts in Kolar District schools to improve test scores. “It is not one single factor,” he said, “It is a collective effort of administration, parent cooperation, and teacher dedication”. He noted that in the last three years, education department has become more organized and committed to spending time in schools and discussing about SSLC results.
The office of the DDPI is prioritizing
the tracking of school progress, having
created an individual file to monitor each
student in the district. The office has also
begun an intervention where individual
subject experts will adopt certain high-
need schools to visit frequently and build
closer ties with the school Headmasters.
This is an intervention intended to
promote school accountability and makes
teachers feel supported in their exam
endeavours. Further, the district has an
orientation programme for the district’s
new subject secondary teachers, which
has helped to get the teachers on the
same page for SSLC performance. The
teachers were readily willing to expand
school hours to squeeze in more SSLC
revisions before the exam.
There are larger challenges as well in the district, which affects the overall SSLC performance in the district. Kolar being a largely rain-dependent agricultural economy, is affected drastically by insufficient rainfall since it affects the livelihoods for the bulk of Kolar’s families. A closer look at the schools provides the micro-picture of these initiatives and challenges.
Govt Girls Junior College, Srinivaspur
This school is located in Srinivaspur town and its enrolment has varied from 175 to 220 in the last few years. Its pass percentage jumped from 65.91% to 88.07 in 2012-13, a raise of more than 22%. The Headmaster of this large, all-girls, urban secondary school has held her position for the last twelve years. She says her primary strategy in managing the student population is to instil the girls with self-confidence by encouraging them to coordinate and perform in all national day assemblies.
39
She feels this helps her students perform well on exams and more importantly, makes education in her school more comprehensive. 89% of the 2011 cohort passed the SSLC exam, generating considerable fluctuation in the pass rate over the years. The Headmaster attributes this in part to general variation in the learning aptitude of some batches compared to others. For three years the school also lacked a specialized First Language teacher, which severely impacted test performance in that subject area. Additionally, the school began using Navya Spoorti guidelines, which include questions and answers from old SSLC exams, to prepare students three years ago. These guidelines are provided to schools by the DDPI and also available online, all preparatory material is transparent and easy to access. She feels that recent efforts by the DDPI to mobilize government schools have been effective. Schools with pass rates below 50% get special attention from the department and feel a sense of competition with peer schools to improve test performance.
In this school, the entire portions of the 10th standard syllabus are covered by December of the academic year, with four unit tests and a midterm throughout the course. From January until April, teachers spend time reviewing the material and administering preparatory exams. This is the general 10th standard schedule followed by all the schools surveyed in this case study.
The school average for the SSLC state level preparatory exam was 75.7%, roughly 13 percentage points lower than the 2012-13 SSLC school average. This disparity indicates a great deal of last-minute preparation for the exam. Of
the 218 students who took the SSLC in 2012-13, 32, or 11%, earned distinction, scoring 70% or above.
As government schools are open to all students, they often face the challenge of educating a wide range of students. The Headmaster notes that many school resources are devoted to differentiated-learning and remedial education for slow learners. The school has designed a bridge course to provide specialized coaching lessons to students before the academic year begins. This also helps norm new students to the school. Furthermore, as test time approaches, the school extends hours until 6 pm to provide extra time for review. These interventions make the government school uniquely dedicated to student performance.
Of the four 10th standard students interviewed, all four take private tuitions outside of school. Two students have just started tuitions for 10th standard while the other two were also taking tuitions in the 9th standard. They explained that many students in the school take advantage of extracurricular tuitions before and after school, while the Headmaster did not encourage this practice. All four shared the sentiment that this school year had more serious implications and they were making efforts to prepare for the SSLC all year and attend school consistently.
A group interview with several staff teachers revealed that in this school, as in many urban government schools, teachers face a host of non-teaching responsibilities, which occupy their attention. In addition to administrative tasks, teachers have 60 to 70 students in each class and feel pressured by the 40-minute class period. Teachers also
40
shared the philosophy that working in such a big school, with limited resources, encourages focusing on the quantity of students who pass the SSLC rather than the quality of test performance. Teachers feel pressured by representatives of the education department to produce quantitative results, generating a common pattern of “teaching to the test” in this school. Indeed, a look at individual student scores shows that the majority of students who pass are scoring in the 35-50% range6.
In sum, the challenges faced in the school are common to many large, government schools. Teachers are overburdened, face large class sizes, inadequate infrastructural facilities, and do not receive much support from the parents’ community. Paired with these internal factors, teachers and administrators must respond to the pressures from education officials to produce results. Competition with neighbouring schools, and poor motivation up to the 9th standard show that students and teachers will have to employ rushed, haphazard study efforts in the SSLC exam year. While this may result in teaching that is primarily oriented towards examinations with low academic standards, resulting in greater quantity of students who pass the examinations, but largely unequipped have deeper insights in the subjects that becomes vital in post-secondary school education. Thus, such examination oriented preparation may compromise the quality of education resulting in rote learning and memorization that replaces critical thinking ability, ultimately hindering students’ prospects for higher education.
Al-Ameen Urdu High School, Srinivaspur
This school is located in Srinivaspur town. The school’s medium of instruction is Urdu and English. The school is an un-aided private school whose SSLC enrolment is low. The enrolment increase from 19 in 2011 to 21 in 2012. Its pass percentage increased from 52.63% to 100% in 2012-13.
Having experienced an exceptionally large jump in the pass rate between the 2011-12 and 2012-13 exam cycle, Al-Ameen High School was a special case in the small area study. While the class size is small, the strength has been growing gradually over time. This is a Muslim private school with four full-time teachers. The In-charge Headmaster, has been working in Al-Ameen for 10 years now and noted that there are no admission standards for children to attend this school. According to her, unlike some other private schools, Al-Ameen welcomes any student who is interested to learn in the school’s religious environment. Monthly school fees are only Rs.100 per student; management contributions and donations make up school costs that fees do not cover. Additionally, she noted that the school pays teachers only 25-50% of what teachers in government schools earn in order to keep fees low for students.
Two of the teachers are young men who have just joined at the start of this academic year. They offered that while the position does not pay much, they feel strongly they should contribute to the education and development of youth within their community. They feel that the public education system in Srinivaspur
41
does not provide sufficient opportunity to minority students, like Muslims and Christians. The teachers noted that the community-at-large faces economic problems, which sometimes compromise student attendance. Male students, in particular, are often expected to work to contribute to family income and their education is placed on the back burner. They hope to make up for this as male role models contributing their own guidance and leadership to the Muslim community of Srinivaspur.
One advantage of the small school size and unaided management is that teachers feel they can focus their attention primarily on instruction and spend all school time with the students. The teachers and students provided compatible information that most 10th standard students in the school engage in private tuitions. One of the four students interviewed is not presently taking tuitions but has an elder sister who is a teacher and works with him daily to review subjects. Two of the teachers in the schools are themselves engaged in private tuitions in math and science to students from several different schools in the evenings.
The 2012-13 SSLC exam cohort also performed well on the preparatory exam and in their 9th standard final exams, indicating consistent academic strength. Only one student failed the SSLC preparatory exam and others scored between 35% and 60%. In 9th standard, all students performed above 37% and 11 out of 21 students achieved 60% or higher marks.
The combination of a tight-knit community, the close attention of teachers to students, and the contribution of
private tuitions all seem to be improving test scores at Al-Ameen High School. The Headmaster also mentioned that programmes from the department of education and initiatives like the Navya Spoorti helped her school to prepare students well for the exam.
Morarji Desai Residential School, Kolar
This is a rural residential Kannada medium school run by the department of Social Welfare. Its SSLC enrolment has decreased from 29 to 15 in 2012-13 and its pass percentage has increased from 90.91% to 100% in 2012-13.
The pass rate in Murarji Desai
Residential School has been steadily
improving over the last three years.
The rate grew from 88.8% in the 2010-
11 academic year to 90.9% in 2011-
12 and reached 100% in 2012-13.
This residential school is designed to
accommodate minority students, usually
Muslim, Christian, Buddhist, and Other
Backwards Caste (OBC) students, and
place them in an immersive, supportive
academic environment.
The principal of this school is also in-
charge of another Morarji Desai school in
Kolar taluk, which takes only Scheduled
Caste (SC) and Scheduled Tribe (ST)
students. In both schools, students must
pass an entrance exam following the 5th
standard and are admitted based on
merit to study from 6th to 10th standard
in the residential schools. The principal
explained that students admitted to
the school tend to come from “socially,
politically, and economically backward
families.” Once admitted, the Social
Welfare Department funds tuition, room
42
and board for these students for all five
years.
The school takes 50 new students
each year, of which 38 must be minorities
and 12 are OBC students to adhere with
the guidelines of the department. There
are a total of nine full-time teachers in
the school, three of whom are minorities
themselves. The principal explained that
teachers in this school earn more than
government school teachers because
they are expected to remain on the school
premises at all times and tend to students
in the mornings and evenings as well.
One major challenge the school faces is retention. The SSLC cohort has reduced from 36 students in the 2010-11 exam cycle to 15 students in the 2012-13 exam cycle. The school’s mathematics teacher explained that many students feel homesick living away from their families and often drop out to go back home. In her opinion, families add pressure especially to Muslim students to return home and contribute to family income. The school is working on raising awareness among minority communities about the value of education and the opportunity to study in a Morarji Desai school. The principal is from a poor socioeconomic background as well and feels strongly about serving communities similar to his own.
Because students are expected to remain in the school, they do not participate in private tuitions. One male 10th standard student, Sheik Sabir, indicated that he participated in special classes for every subject for two hours in the mornings and three hours in the evenings. Manjula, a female 10th standard student, has the same timetable
for special classes wherein the same school teachers teach these classes.
In addition to achieving a school-wide pass rate of 100%, each of Murarji Desai’s 10th standard students in the 2012-13 exam cohort performed well on the district preparatory exam. Seven of 15 students achieved scores of 50% or higher and the remaining eight students achieved scores of 60% or higher. The principal was ready for our visit with a written list of factors that make Morarji Desai schools unique and academically successful. In addition to the immersive academic environment and peer support system cultivated at Morarji Desai school, the school boasts a great deal of individual attention to high need students and encourages debates and seminars for students to gain confidence with public speaking. Furthermore, the school references SSLC exams for the last five years in preparation for the 10th standard exam cycle. The school’s principal made clear that old exams are a useful learning tool for students.
Chinmaya Vidyala, Kolar
This school is located in Chokkahalli of Kolar taluk. It is an un-aided English and Kannada medium school where over the last three years, enrolment has varied between 190 to 200. They have been able to retain 100% pass percentage since 2006. This unaided school prides itself on exceptional academic performance and its unique value-based educational philosophy. Since its inception in 1992-
3 with only seven SSLC students, the
school’s enrolment has been growing
gradually. In addition to achieving a
100% pass rate in 2012-13, 77 or 198
students passed the SSLC exam with
43
distinction, achieving individual scores
of 70% or higher.
Chinmaya Vidyalaya’s principal
has worked in the school for 20 years,
since the school’s inception, and has
been the principal for the last 13 years.
He cites good school management and
teacher-parent cooperation for the
school’s success. The school does not
have admissions standards, but accepts
students from a large pool of applicants
on a first come, first serve basis. The
school charges yearly fees ranging from
Rs. 10,000 to 15,000 to students, with
the higher fees assigned to 10th standard
students, as the SSLC year requires more
resources.
In addition to school fees, the school
receives contributions from the Chinmaya
Trust to fund capital improvements; fees
are designated for teacher salaries and
building maintenance. The principal feels
that in the last two years, officials from
the department of education have been
more active about visiting and following
up with schools. The DDPI holds what
he referred to as “monthly motivational
meetings” with school administrators to
discuss school priorities.
On the SSLC state preparatory round
of exams, one section of Chinmaya
Vidyalaya students produced very strong
results. Of fifty students in the section,
only 13 students scored below 70% and
the lowest score was 38.88%, which is
still passing. This indicates that not a lot
of last-minute preparation is necessary
between the preparatory exam and the
actual SSLC exam. The lowest score on
the actual SSLC exam was 45.76%, which
is over 10 percentage points higher than
the pass requirement.
In this school, test performance did
not seem to be as big of a priority as
in the other schools, or perhaps as big
of a challenge. Students at every grade
level are expected to complete and log
one hour of community service per
day. The school also offers an array
of extracurricular activities including
singing and table tennis, which most
students partake in. Both 10th standard
students interviewed at this school were
active in extracurricular activities and
did not participate in private tuitions.
Both students were also exceptionally conversant in English and confidant speaking with people of all age groups. Given the strong track record of test performance in the school, it seems that the school has been able to move past “teaching to the test” to generate a more well-rounded educational environment. Poojita, a female 10th standard student at the Chinmaya Vidyalaya School, said she feels the school is a “good environment to build up her character and study habits.”
What Chinmaya Vidyalaya does have in common with other schools in Kolar District is the use of Navya Spoorti test preparation guidelines. The school’s principal said they have been using old exam materials for about ten years now.
All information is transparent and easily
accessible for schools by the Deputy Department of Public Instruction (DDPI).
Conclusion
Of late, SSLC scores in Kolar are not exceptional, as districts across the state
44
have been improving test performance. However, spending time in Kolar District’s schools revealed that department officials have made themselves visible and their desire to see strong quantitative results from every school. For every school other than Chinmaya Vidyalaya, where SSLC pass percentage seems to be an obstacle to overcome, test performance being a high priority. 10th standard students across the district expressed that their
current year would be more rigorous and
meaningful for educational prospects
than previous years.
One teacher in Govt Girls Junior
College noted that teachers are
encouraged to pass as many students as possible, and that SSLC performance was about “quantity not quality.” Similarly, the Headmaster at the Al-Ameen school mentioned that in one batch, about six or seven students, roughly one-third of a typical batch, enter the 10th standard with very poor literacy skills. Yet the school is producing a 100% pass percentage. Undoubtedly, this trend is new to the Al-Ameen school and each batch’s aptitude will vary from year to year. Regardless, it is worth contemplating how schools open to all types of students, with a range of intellectual ability, get students to a proficiency level in just one year.
Thus, together with new interventions and high priorities to SSLC performance, the invigilation of SSLC exams must also be prioritized and well monitored across
the district to ensure that students’ test performance is independent and fair.
Initiatives like Navya Spoorti provide teachers and students with useful study material and allow students to prepare well for exams delivered in a similar format. For districts like Kolar, where achievements of good performance in school education haven’t been regular, boost in SSLC performance provides the inspiration as well as drive for better performance. The enthusiasm of the education administration in driving these continuous yearlong initiatives provide a good starting point for building on the successes in examination performance. The challenge now is to cultivate and identify learning outcomes outside of examination performance. That is, to focus on individual school factors which foster learning through personal development that promote critical thinking and extracurricular engagement together with priority for examination. This small area study provides good examples of schools where such holistic learning is necessary as well as schools where character building and non-academic learning activities are also implemented. The case studies of the four schools show that there is requirement as wells as feasibility of delivering this the type of quality education, even at a large scale and relatively low cost, where the pressures of examination performance alone doesn’t become the driving force in secondary education.
* * * *
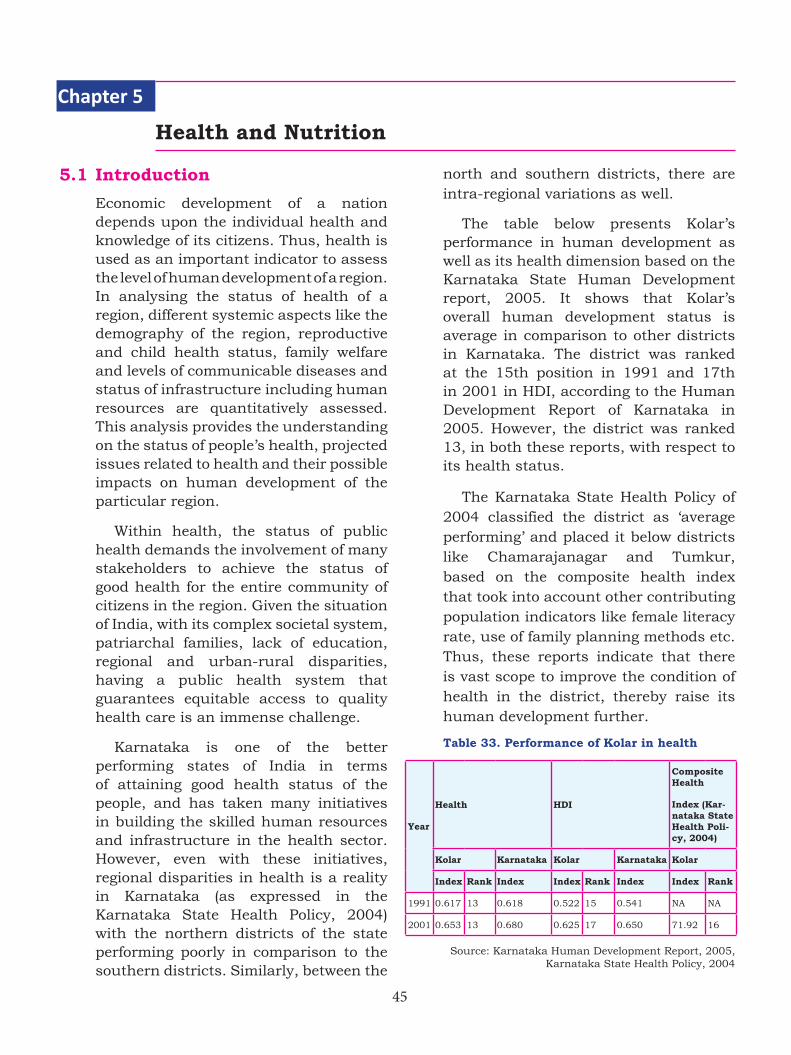
45
5.1 Introduction
Economic development of a nation depends upon the individual health and knowledge of its citizens. Thus, health is used as an important indicator to assess the level of human development of a region. In analysing the status of health of a region, different systemic aspects like the demography of the region, reproductive and child health status, family welfare and levels of communicable diseases and status of infrastructure including human resources are quantitatively assessed. This analysis provides the understanding on the status of people’s health, projected issues related to health and their possible impacts on human development of the particular region.
Within health, the status of public health demands the involvement of many stakeholders to achieve the status of good health for the entire community of citizens in the region. Given the situation of India, with its complex societal system, patriarchal families, lack of education, regional and urban-rural disparities, having a public health system that guarantees equitable access to quality health care is an immense challenge.
Karnataka is one of the better performing states of India in terms of attaining good health status of the people, and has taken many initiatives in building the skilled human resources and infrastructure in the health sector. However, even with these initiatives, regional disparities in health is a reality in Karnataka (as expressed in the Karnataka State Health Policy, 2004) with the northern districts of the state performing poorly in comparison to the southern districts. Similarly, between the
north and southern districts, there are intra-regional variations as well.
The table below presents Kolar’s performance in human development as well as its health dimension based on the Karnataka State Human Development report, 2005. It shows that Kolar’s overall human development status is average in comparison to other districts in Karnataka. The district was ranked at the 15th position in 1991 and 17th in 2001 in HDI, according to the Human Development Report of Karnataka in 2005. However, the district was ranked 13, in both these reports, with respect to its health status.
The Karnataka State Health Policy of 2004 classified the district as ‘average performing’ and placed it below districts like Chamarajanagar and Tumkur, based on the composite health index that took into account other contributing population indicators like female literacy rate, use of family planning methods etc. Thus, these reports indicate that there is vast scope to improve the condition of health in the district, thereby raise its human development further.
Table 33. Performance of Kolar in health
Year
Health HDI
Composite Health
Index (Kar-nataka State Health Poli-cy, 2004)
Kolar Karnataka Kolar Karnataka Kolar
Index Rank Index Index Rank Index Index Rank
1991 0.617 13 0.618 0.522 15 0.541 NA NA
2001 0.653 13 0.680 0.625 17 0.650 71.92 16
Source: Karnataka Human Development Report, 2005, Karnataka State Health Policy, 2004
Health and Nutrition Chapter 5
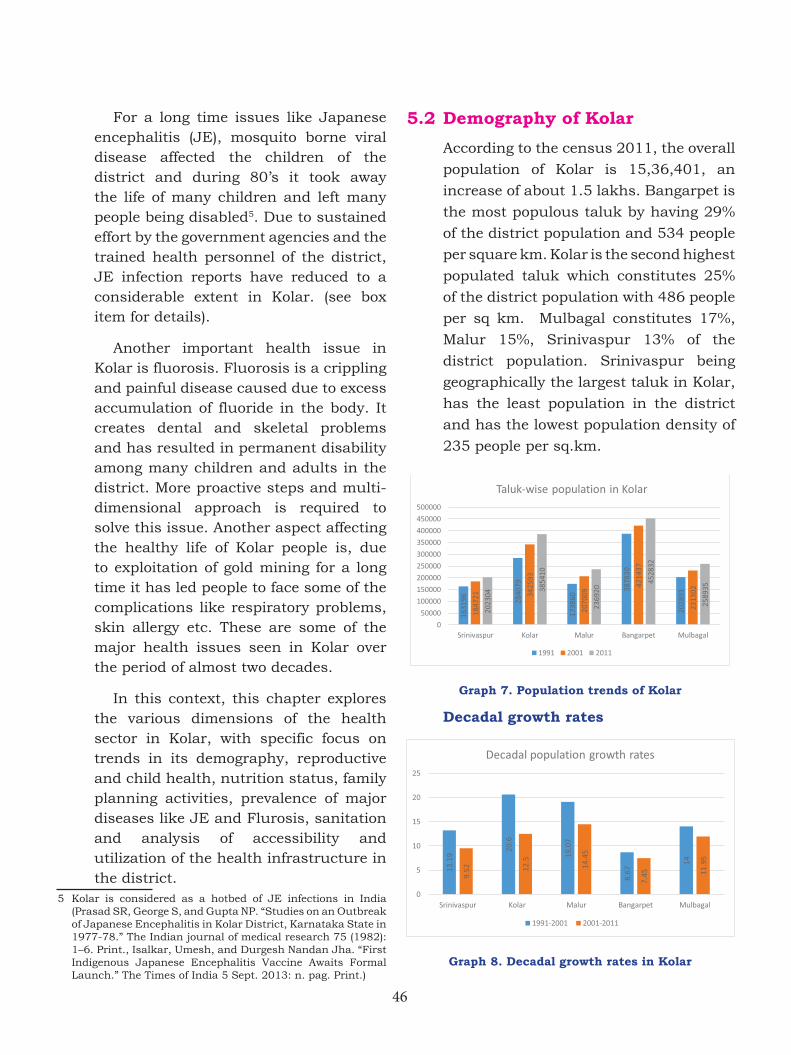
46
For a long time issues like Japanese encephalitis (JE), mosquito borne viral disease affected the children of the district and during 80’s it took away the life of many children and left many people being disabled5. Due to sustained effort by the government agencies and the trained health personnel of the district, JE infection reports have reduced to a considerable extent in Kolar. (see box item for details).
Another important health issue in Kolar is fluorosis. Fluorosis is a crippling and painful disease caused due to excess accumulation of fluoride in the body. It creates dental and skeletal problems and has resulted in permanent disability among many children and adults in the district. More proactive steps and multi-dimensional approach is required to solve this issue. Another aspect affecting the healthy life of Kolar people is, due to exploitation of gold mining for a long time it has led people to face some of the complications like respiratory problems, skin allergy etc. These are some of the major health issues seen in Kolar over the period of almost two decades.
In this context, this chapter explores the various dimensions of the health sector in Kolar, with specific focus on trends in its demography, reproductive and child health, nutrition status, family planning activities, prevalence of major diseases like JE and Flurosis, sanitation and analysis of accessibility and utilization of the health infrastructure in the district.
5 Kolar is considered as a hotbed of JE infections in India (Prasad SR, George S, and Gupta NP. “Studies on an Outbreak of Japanese Encephalitis in Kolar District, Karnataka State in 1977-78.” The Indian journal of medical research 75 (1982): 1–6. Print., Isalkar, Umesh, and Durgesh Nandan Jha. “First Indigenous Japanese Encephalitis Vaccine Awaits Formal Launch.” The Times of India 5 Sept. 2013: n. pag. Print.)
5.2 Demography of Kolar
According to the census 2011, the overall
population of Kolar is 15,36,401, an
increase of about 1.5 lakhs. Bangarpet is
the most populous taluk by having 29%
of the district population and 534 people
per square km. Kolar is the second highest
populated taluk which constitutes 25%
of the district population with 486 people
per sq km. Mulbagal constitutes 17%,
Malur 15%, Srinivaspur 13% of the
district population. Srinivaspur being
geographically the largest taluk in Kolar,
has the least population in the district
and has the lowest population density of
235 people per sq.km.
Graph 7. Population trends of Kolar
Decadal growth rates
Graph 8. Decadal growth rates in Kolar
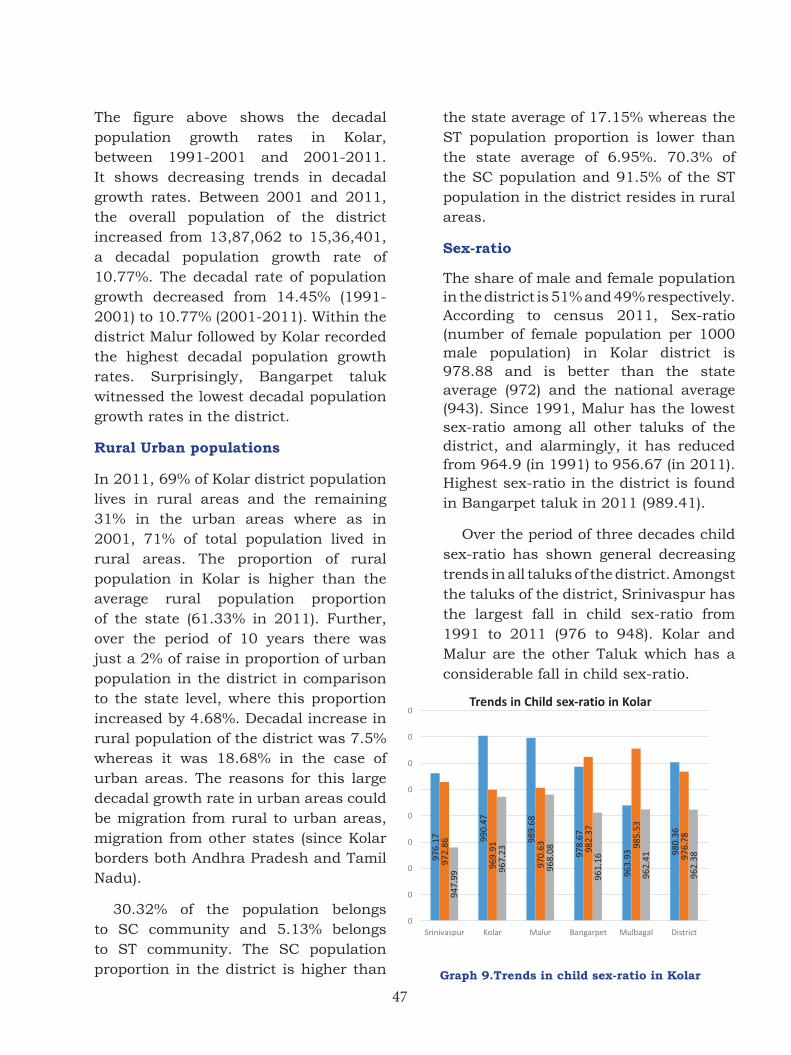
47
The figure above shows the decadal population growth rates in Kolar, between 1991-2001 and 2001-2011. It shows decreasing trends in decadal growth rates. Between 2001 and 2011, the overall population of the district increased from 13,87,062 to 15,36,401, a decadal population growth rate of 10.77%. The decadal rate of population growth decreased from 14.45% (1991-2001) to 10.77% (2001-2011). Within the district Malur followed by Kolar recorded the highest decadal population growth rates. Surprisingly, Bangarpet taluk witnessed the lowest decadal population growth rates in the district.
Rural Urban populations
In 2011, 69% of Kolar district population lives in rural areas and the remaining 31% in the urban areas where as in 2001, 71% of total population lived in rural areas. The proportion of rural population in Kolar is higher than the average rural population proportion of the state (61.33% in 2011). Further, over the period of 10 years there was just a 2% of raise in proportion of urban population in the district in comparison to the state level, where this proportion increased by 4.68%. Decadal increase in rural population of the district was 7.5% whereas it was 18.68% in the case of urban areas. The reasons for this large decadal growth rate in urban areas could be migration from rural to urban areas, migration from other states (since Kolar borders both Andhra Pradesh and Tamil Nadu).
30.32% of the population belongs to SC community and 5.13% belongs to ST community. The SC population proportion in the district is higher than
the state average of 17.15% whereas the ST population proportion is lower than the state average of 6.95%. 70.3% of the SC population and 91.5% of the ST population in the district resides in rural areas.
Sex-ratio
The share of male and female population in the district is 51% and 49% respectively. According to census 2011, Sex-ratio (number of female population per 1000 male population) in Kolar district is 978.88 and is better than the state average (972) and the national average (943). Since 1991, Malur has the lowest sex-ratio among all other taluks of the district, and alarmingly, it has reduced from 964.9 (in 1991) to 956.67 (in 2011). Highest sex-ratio in the district is found in Bangarpet taluk in 2011 (989.41).
Over the period of three decades child sex-ratio has shown general decreasing trends in all taluks of the district. Amongst the taluks of the district, Srinivaspur has the largest fall in child sex-ratio from 1991 to 2011 (976 to 948). Kolar and Malur are the other Taluk which has a considerable fall in child sex-ratio.
Graph 9.Trends in child sex-ratio in Kolar
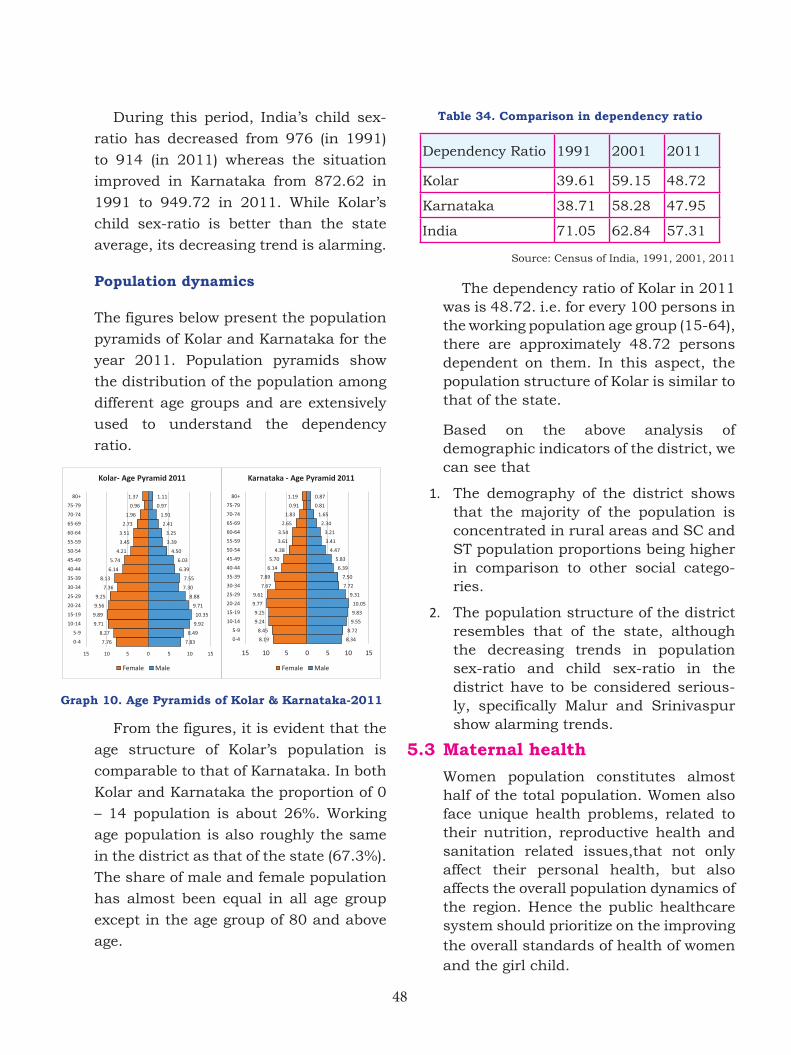
48
During this period, India’s child sex-
ratio has decreased from 976 (in 1991)
to 914 (in 2011) whereas the situation
improved in Karnataka from 872.62 in
1991 to 949.72 in 2011. While Kolar’s
child sex-ratio is better than the state
average, its decreasing trend is alarming.
Population dynamics
The figures below present the population
pyramids of Kolar and Karnataka for the
year 2011. Population pyramids show
the distribution of the population among
different age groups and are extensively
used to understand the dependency
ratio.
Graph 10. Age Pyramids of Kolar & Karnataka-2011
From the figures, it is evident that the
age structure of Kolar’s population is
comparable to that of Karnataka. In both
Kolar and Karnataka the proportion of 0
– 14 population is about 26%. Working
age population is also roughly the same
in the district as that of the state (67.3%).
The share of male and female population
has almost been equal in all age group
except in the age group of 80 and above
age.
Table 34. Comparison in dependency ratio
Dependency Ratio 1991 2001 2011
Kolar 39.61 59.15 48.72
Karnataka 38.71 58.28 47.95
India 71.05 62.84 57.31
Source: Census of India, 1991, 2001, 2011
The dependency ratio of Kolar in 2011 was is 48.72. i.e. for every 100 persons in the working population age group (15-64), there are approximately 48.72 persons dependent on them. In this aspect, the population structure of Kolar is similar to that of the state.
Based on the above analysis of demographic indicators of the district, we can see that
1. The demography of the district shows that the majority of the population is concentrated in rural areas and SC and ST population proportions being higher in comparison to other social catego-ries.
2. The population structure of the district resembles that of the state, although the decreasing trends in population sex-ratio and child sex-ratio in the district have to be considered serious-ly, specifically Malur and Srinivaspur show alarming trends.
5.3 Maternal health Women population constitutes almost
half of the total population. Women also face unique health problems, related to their nutrition, reproductive health and sanitation related issues,that not only affect their personal health, but also affects the overall population dynamics of the region. Hence the public healthcare system should prioritize on the improving the overall standards of health of women and the girl child.
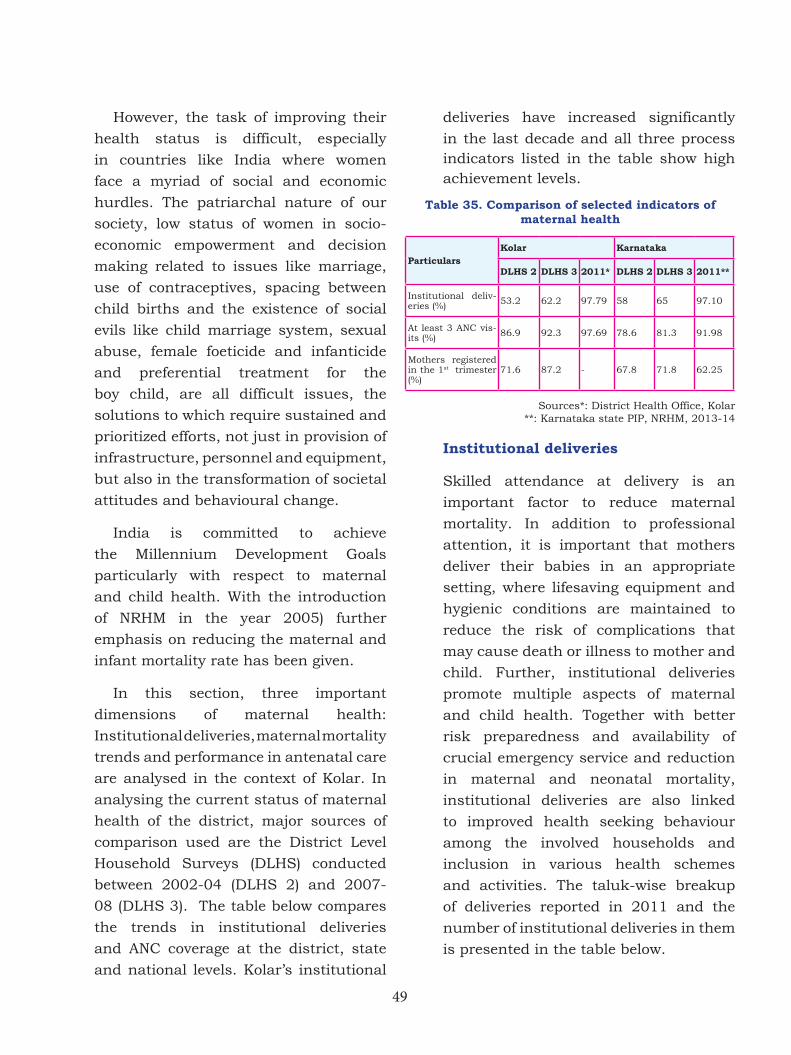
49
However, the task of improving their
health status is difficult, especially
in countries like India where women
face a myriad of social and economic
hurdles. The patriarchal nature of our
society, low status of women in socio-
economic empowerment and decision
making related to issues like marriage,
use of contraceptives, spacing between
child births and the existence of social
evils like child marriage system, sexual
abuse, female foeticide and infanticide
and preferential treatment for the
boy child, are all difficult issues, the
solutions to which require sustained and
prioritized efforts, not just in provision of
infrastructure, personnel and equipment,
but also in the transformation of societal
attitudes and behavioural change.
India is committed to achieve
the Millennium Development Goals
particularly with respect to maternal
and child health. With the introduction
of NRHM in the year 2005) further
emphasis on reducing the maternal and
infant mortality rate has been given.
In this section, three important
dimensions of maternal health:
Institutional deliveries, maternal mortality
trends and performance in antenatal care
are analysed in the context of Kolar. In
analysing the current status of maternal
health of the district, major sources of
comparison used are the District Level
Household Surveys (DLHS) conducted
between 2002-04 (DLHS 2) and 2007-
08 (DLHS 3). The table below compares
the trends in institutional deliveries
and ANC coverage at the district, state
and national levels. Kolar’s institutional
deliveries have increased significantly
in the last decade and all three process indicators listed in the table show high achievement levels.
Table 35. Comparison of selected indicators of maternal health
ParticularsKolar Karnataka
DLHS 2 DLHS 3 2011* DLHS 2 DLHS 3 2011**
Institutional deliv-eries (%) 53.2 62.2 97.79 58 65 97.10
At least 3 ANC vis-its (%) 86.9 92.3 97.69 78.6 81.3 91.98
Mothers registered in the 1st trimester (%)
71.6 87.2 - 67.8 71.8 62.25
Sources*: District Health Office, Kolar**: Karnataka state PIP, NRHM, 2013-14
Institutional deliveries
Skilled attendance at delivery is an
important factor to reduce maternal
mortality. In addition to professional
attention, it is important that mothers
deliver their babies in an appropriate
setting, where lifesaving equipment and
hygienic conditions are maintained to
reduce the risk of complications that
may cause death or illness to mother and
child. Further, institutional deliveries
promote multiple aspects of maternal
and child health. Together with better
risk preparedness and availability of
crucial emergency service and reduction
in maternal and neonatal mortality,
institutional deliveries are also linked
to improved health seeking behaviour
among the involved households and
inclusion in various health schemes
and activities. The taluk-wise breakup
of deliveries reported in 2011 and the
number of institutional deliveries in them
is presented in the table below.
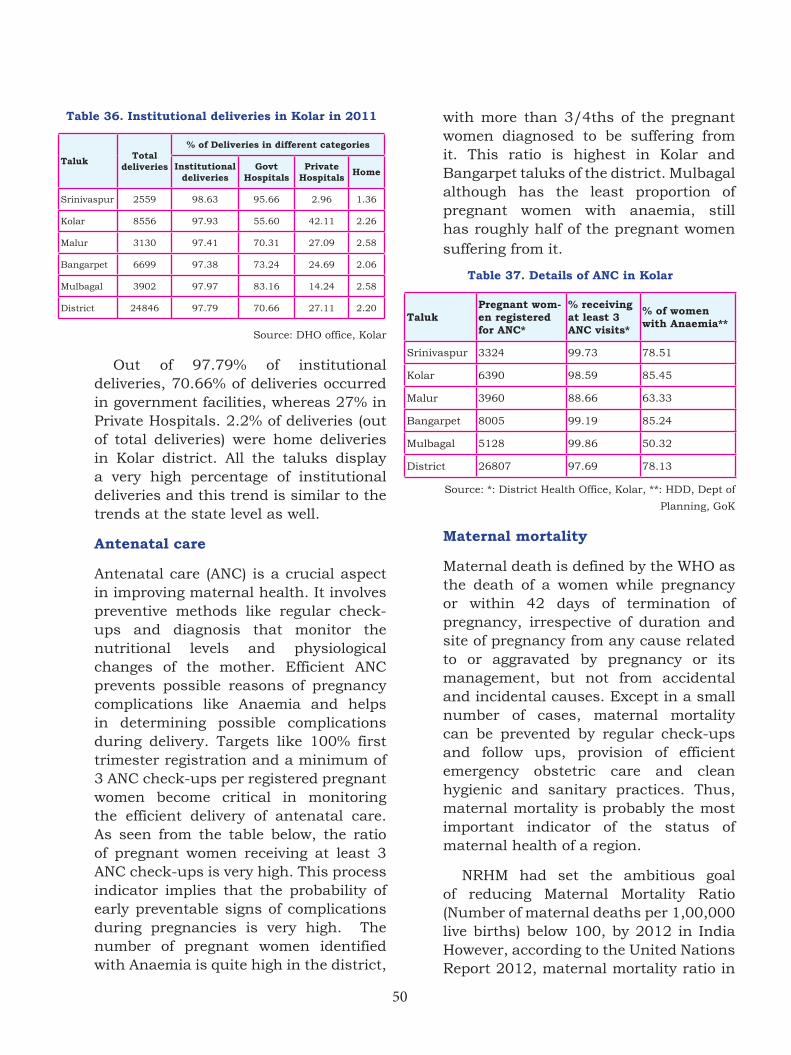
50
Table 36. Institutional deliveries in Kolar in 2011
Taluk Total deliveries
% of Deliveries in different categories
Institutional deliveries
Govt Hospitals
Private Hospitals Home
Srinivaspur 2559 98.63 95.66 2.96 1.36
Kolar 8556 97.93 55.60 42.11 2.26
Malur 3130 97.41 70.31 27.09 2.58
Bangarpet 6699 97.38 73.24 24.69 2.06
Mulbagal 3902 97.97 83.16 14.24 2.58
District 24846 97.79 70.66 27.11 2.20
Source: DHO office, Kolar
Out of 97.79% of institutional deliveries, 70.66% of deliveries occurred in government facilities, whereas 27% in Private Hospitals. 2.2% of deliveries (out of total deliveries) were home deliveries in Kolar district. All the taluks display a very high percentage of institutional deliveries and this trend is similar to the trends at the state level as well.
Antenatal care
Antenatal care (ANC) is a crucial aspect in improving maternal health. It involves preventive methods like regular check-ups and diagnosis that monitor the nutritional levels and physiological changes of the mother. Efficient ANC prevents possible reasons of pregnancy complications like Anaemia and helps in determining possible complications during delivery. Targets like 100% first trimester registration and a minimum of 3 ANC check-ups per registered pregnant women become critical in monitoring the efficient delivery of antenatal care. As seen from the table below, the ratio of pregnant women receiving at least 3 ANC check-ups is very high. This process indicator implies that the probability of early preventable signs of complications during pregnancies is very high. The number of pregnant women identified with Anaemia is quite high in the district,
with more than 3/4ths of the pregnant women diagnosed to be suffering from it. This ratio is highest in Kolar and Bangarpet taluks of the district. Mulbagal although has the least proportion of pregnant women with anaemia, still has roughly half of the pregnant women suffering from it.
Table 37. Details of ANC in Kolar
TalukPregnant wom-en registered for ANC*
% receiving at least 3 ANC visits*
% of women with Anaemia**
Srinivaspur 3324 99.73 78.51
Kolar 6390 98.59 85.45
Malur 3960 88.66 63.33
Bangarpet 8005 99.19 85.24
Mulbagal 5128 99.86 50.32
District 26807 97.69 78.13
Source: *: District Health Office, Kolar, **: HDD, Dept of
Planning, GoK
Maternal mortality
Maternal death is defined by the WHO as the death of a women while pregnancy or within 42 days of termination of pregnancy, irrespective of duration and site of pregnancy from any cause related to or aggravated by pregnancy or its management, but not from accidental and incidental causes. Except in a small number of cases, maternal mortality can be prevented by regular check-ups and follow ups, provision of efficient emergency obstetric care and clean hygienic and sanitary practices. Thus, maternal mortality is probably the most important indicator of the status of maternal health of a region.
NRHM had set the ambitious goal of reducing Maternal Mortality Ratio (Number of maternal deaths per 1,00,000 live births) below 100, by 2012 in India However, according to the United Nations Report 2012, maternal mortality ratio in
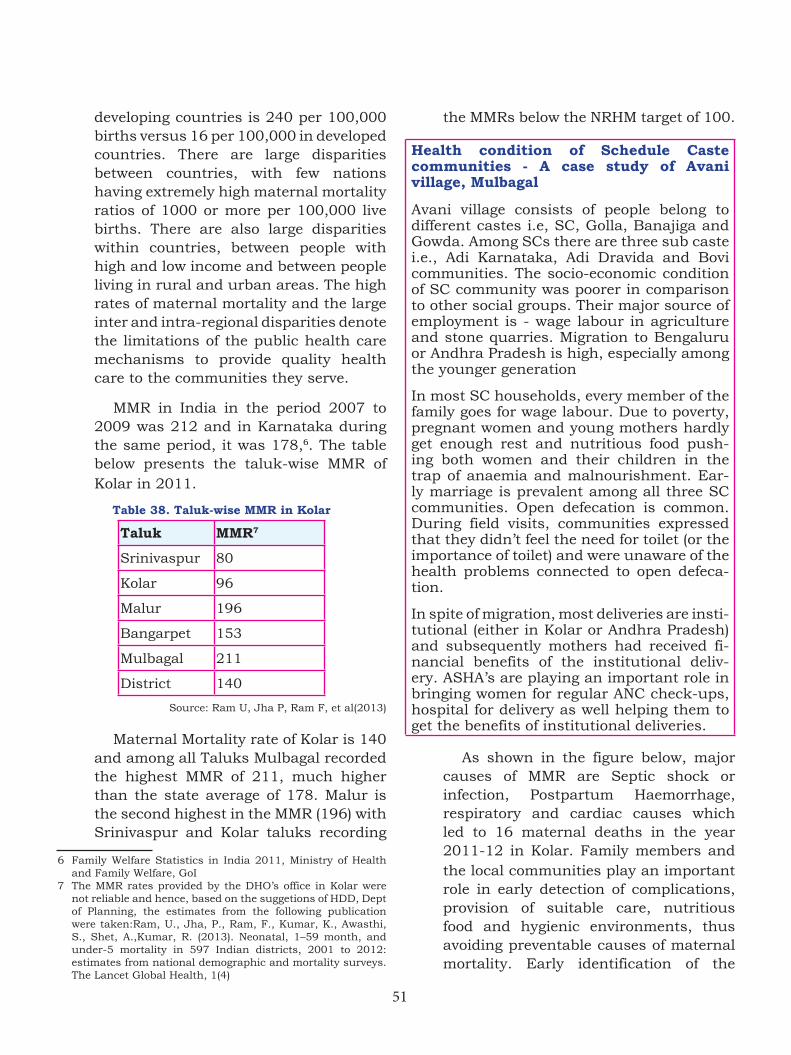
51
developing countries is 240 per 100,000 births versus 16 per 100,000 in developed countries. There are large disparities between countries, with few nations having extremely high maternal mortality ratios of 1000 or more per 100,000 live births. There are also large disparities within countries, between people with high and low income and between people living in rural and urban areas. The high rates of maternal mortality and the large inter and intra-regional disparities denote the limitations of the public health care mechanisms to provide quality health care to the communities they serve.
MMR in India in the period 2007 to 2009 was 212 and in Karnataka during the same period, it was 178,6. The table below presents the taluk-wise MMR of Kolar in 2011.7
Table 38. Taluk-wise MMR in Kolar
Taluk MMR7
Srinivaspur 80
Kolar 96
Malur 196
Bangarpet 153
Mulbagal 211
District 140
Source: Ram U, Jha P, Ram F, et al(2013)
Maternal Mortality rate of Kolar is 140 and among all Taluks Mulbagal recorded the highest MMR of 211, much higher than the state average of 178. Malur is the second highest in the MMR (196) with Srinivaspur and Kolar taluks recording
6 Family Welfare Statistics in India 2011, Ministry of Health and Family Welfare, GoI
7 The MMR rates provided by the DHO’s office in Kolar were not reliable and hence, based on the suggetions of HDD, Dept of Planning, the estimates from the following publication were taken:Ram, U., Jha, P., Ram, F., Kumar, K., Awasthi, S., Shet, A.,Kumar, R. (2013). Neonatal, 1–59 month, and under-5 mortality in 597 Indian districts, 2001 to 2012: estimates from national demographic and mortality surveys. The Lancet Global Health, 1(4)
the MMRs below the NRHM target of 100.
Health condition of Schedule Caste communities - A case study of Avani village, Mulbagal
Avani village consists of people belong to different castes i.e, SC, Golla, Banajiga and Gowda. Among SCs there are three sub caste i.e., Adi Karnataka, Adi Dravida and Bovi communities. The socio-economic condition of SC community was poorer in comparison to other social groups. Their major source of employment is - wage labour in agriculture and stone quarries. Migration to Bengaluru or Andhra Pradesh is high, especially among the younger generation
In most SC households, every member of the family goes for wage labour. Due to poverty, pregnant women and young mothers hardly get enough rest and nutritious food push-ing both women and their children in the trap of anaemia and malnourishment. Ear-ly marriage is prevalent among all three SC communities. Open defecation is common. During field visits, communities expressed that they didn’t feel the need for toilet (or the importance of toilet) and were unaware of the health problems connected to open defeca-tion.
In spite of migration, most deliveries are insti-tutional (either in Kolar or Andhra Pradesh) and subsequently mothers had received fi-nancial benefits of the institutional deliv-ery. ASHA’s are playing an important role in bringing women for regular ANC check-ups, hospital for delivery as well helping them to get the benefits of institutional deliveries.
As shown in the figure below, major causes of MMR are Septic shock or infection, Postpartum Haemorrhage, respiratory and cardiac causes which led to 16 maternal deaths in the year 2011-12 in Kolar. Family members and the local communities play an important role in early detection of complications, provision of suitable care, nutritious food and hygienic environments, thus avoiding preventable causes of maternal mortality. Early identification of the
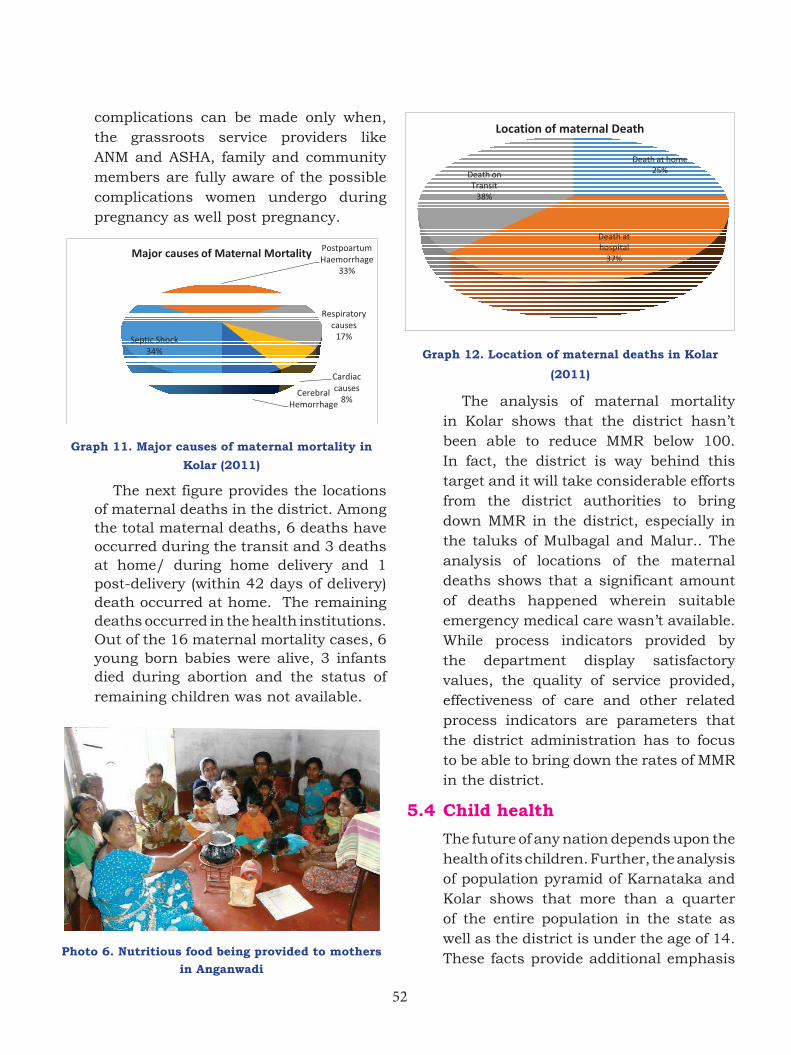
52
complications can be made only when, the grassroots service providers like ANM and ASHA, family and community members are fully aware of the possible complications women undergo during pregnancy as well post pregnancy.
Graph 11. Major causes of maternal mortality in Kolar (2011)
The next figure provides the locations of maternal deaths in the district. Among the total maternal deaths, 6 deaths have occurred during the transit and 3 deaths at home/ during home delivery and 1 post-delivery (within 42 days of delivery) death occurred at home. The remaining deaths occurred in the health institutions. Out of the 16 maternal mortality cases, 6 young born babies were alive, 3 infants died during abortion and the status of remaining children was not available.
Photo 6. Nutritious food being provided to mothers in Anganwadi
Graph 12. Location of maternal deaths in Kolar
(2011)
The analysis of maternal mortality in Kolar shows that the district hasn’t been able to reduce MMR below 100. In fact, the district is way behind this target and it will take considerable efforts from the district authorities to bring down MMR in the district, especially in the taluks of Mulbagal and Malur.. The analysis of locations of the maternal deaths shows that a significant amount of deaths happened wherein suitable emergency medical care wasn’t available. While process indicators provided by the department display satisfactory values, the quality of service provided, effectiveness of care and other related process indicators are parameters that the district administration has to focus to be able to bring down the rates of MMR in the district.
5.4 Child health
The future of any nation depends upon the health of its children. Further, the analysis of population pyramid of Karnataka and Kolar shows that more than a quarter of the entire population in the state as well as the district is under the age of 14. These facts provide additional emphasis
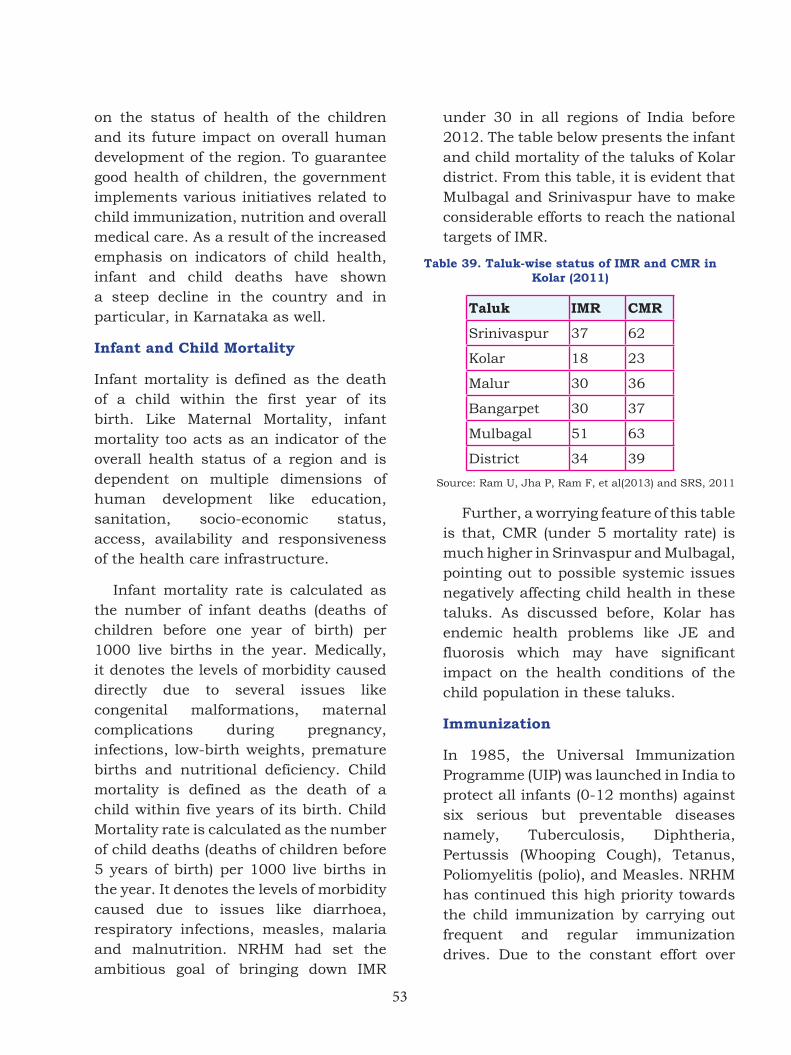
53
on the status of health of the children and its future impact on overall human development of the region. To guarantee good health of children, the government implements various initiatives related to child immunization, nutrition and overall medical care. As a result of the increased emphasis on indicators of child health, infant and child deaths have shown a steep decline in the country and in particular, in Karnataka as well.
Infant and Child Mortality
Infant mortality is defined as the death of a child within the first year of its birth. Like Maternal Mortality, infant mortality too acts as an indicator of the overall health status of a region and is dependent on multiple dimensions of human development like education, sanitation, socio-economic status, access, availability and responsiveness of the health care infrastructure.
Infant mortality rate is calculated as the number of infant deaths (deaths of children before one year of birth) per 1000 live births in the year. Medically, it denotes the levels of morbidity caused directly due to several issues like congenital malformations, maternal complications during pregnancy, infections, low-birth weights, premature births and nutritional deficiency. Child mortality is defined as the death of a child within five years of its birth. Child Mortality rate is calculated as the number of child deaths (deaths of children before 5 years of birth) per 1000 live births in the year. It denotes the levels of morbidity caused due to issues like diarrhoea, respiratory infections, measles, malaria and malnutrition. NRHM had set the ambitious goal of bringing down IMR
under 30 in all regions of India before 2012. The table below presents the infant and child mortality of the taluks of Kolar district. From this table, it is evident that Mulbagal and Srinivaspur have to make considerable efforts to reach the national targets of IMR.
Table 39. Taluk-wise status of IMR and CMR in Kolar (2011)
Taluk IMR CMR
Srinivaspur 37 62
Kolar 18 23
Malur 30 36
Bangarpet 30 37
Mulbagal 51 63
District 34 39
Source: Ram U, Jha P, Ram F, et al(2013) and SRS, 2011
Further, a worrying feature of this table is that, CMR (under 5 mortality rate) is much higher in Srinvaspur and Mulbagal, pointing out to possible systemic issues negatively affecting child health in these taluks. As discussed before, Kolar has endemic health problems like JE and fluorosis which may have significant impact on the health conditions of the child population in these taluks.
Immunization
In 1985, the Universal Immunization Programme (UIP) was launched in India to protect all infants (0-12 months) against six serious but preventable diseases namely, Tuberculosis, Diphtheria, Pertussis (Whooping Cough), Tetanus, Poliomyelitis (polio), and Measles. NRHM has continued this high priority towards the child immunization by carrying out frequent and regular immunization drives. Due to the constant effort over
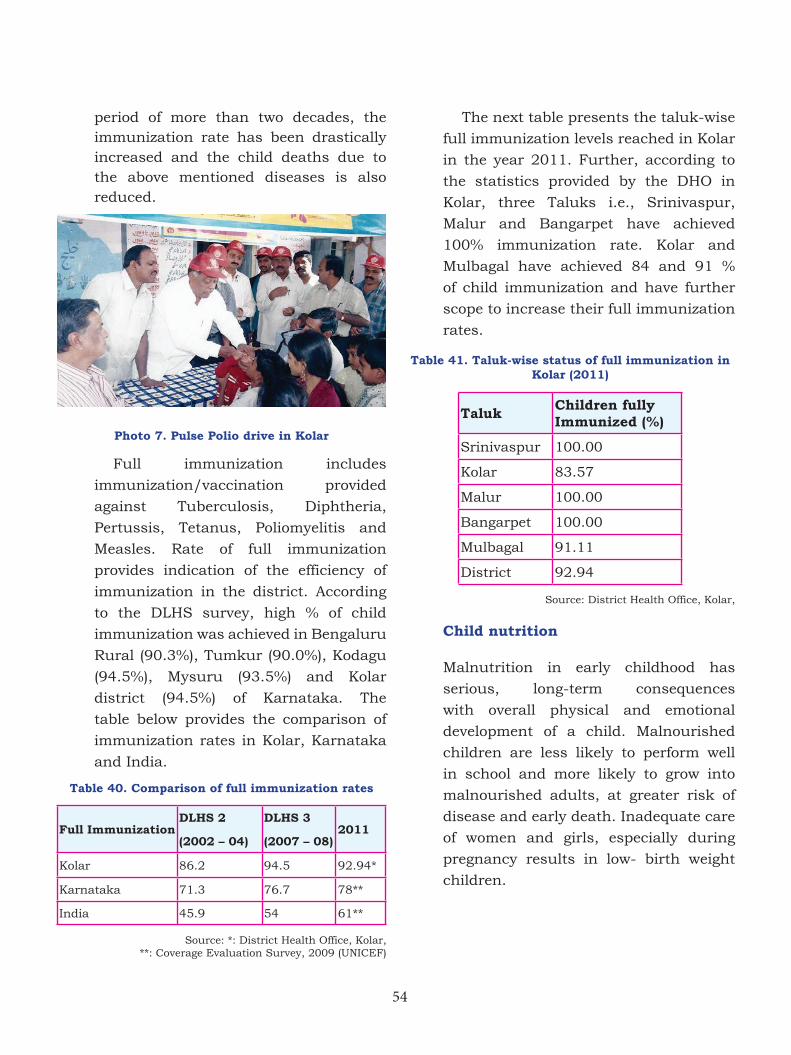
54
period of more than two decades, the immunization rate has been drastically increased and the child deaths due to the above mentioned diseases is also reduced.
Photo 7. Pulse Polio drive in Kolar
Full immunization includes
immunization/vaccination provided
against Tuberculosis, Diphtheria,
Pertussis, Tetanus, Poliomyelitis and
Measles. Rate of full immunization
provides indication of the efficiency of
immunization in the district. According
to the DLHS survey, high % of child
immunization was achieved in Bengaluru
Rural (90.3%), Tumkur (90.0%), Kodagu
(94.5%), Mysuru (93.5%) and Kolar
district (94.5%) of Karnataka. The
table below provides the comparison of
immunization rates in Kolar, Karnataka
and India.
Table 40. Comparison of full immunization rates
Full ImmunizationDLHS 2
(2002 – 04)
DLHS 3
(2007 – 08)2011
Kolar 86.2 94.5 92.94*
Karnataka 71.3 76.7 78**
India 45.9 54 61**
Source: *: District Health Office, Kolar, **: Coverage Evaluation Survey, 2009 (UNICEF)
The next table presents the taluk-wise
full immunization levels reached in Kolar
in the year 2011. Further, according to
the statistics provided by the DHO in
Kolar, three Taluks i.e., Srinivaspur,
Malur and Bangarpet have achieved
100% immunization rate. Kolar and
Mulbagal have achieved 84 and 91 %
of child immunization and have further
scope to increase their full immunization
rates.
Table 41. Taluk-wise status of full immunization in Kolar (2011)
Taluk Children fully Immunized (%)
Srinivaspur 100.00
Kolar 83.57
Malur 100.00
Bangarpet 100.00
Mulbagal 91.11
District 92.94
Source: District Health Office, Kolar,
Child nutrition
Malnutrition in early childhood has
serious, long-term consequences
with overall physical and emotional
development of a child. Malnourished
children are less likely to perform well
in school and more likely to grow into
malnourished adults, at greater risk of
disease and early death. Inadequate care
of women and girls, especially during
pregnancy results in low- birth weight
children.
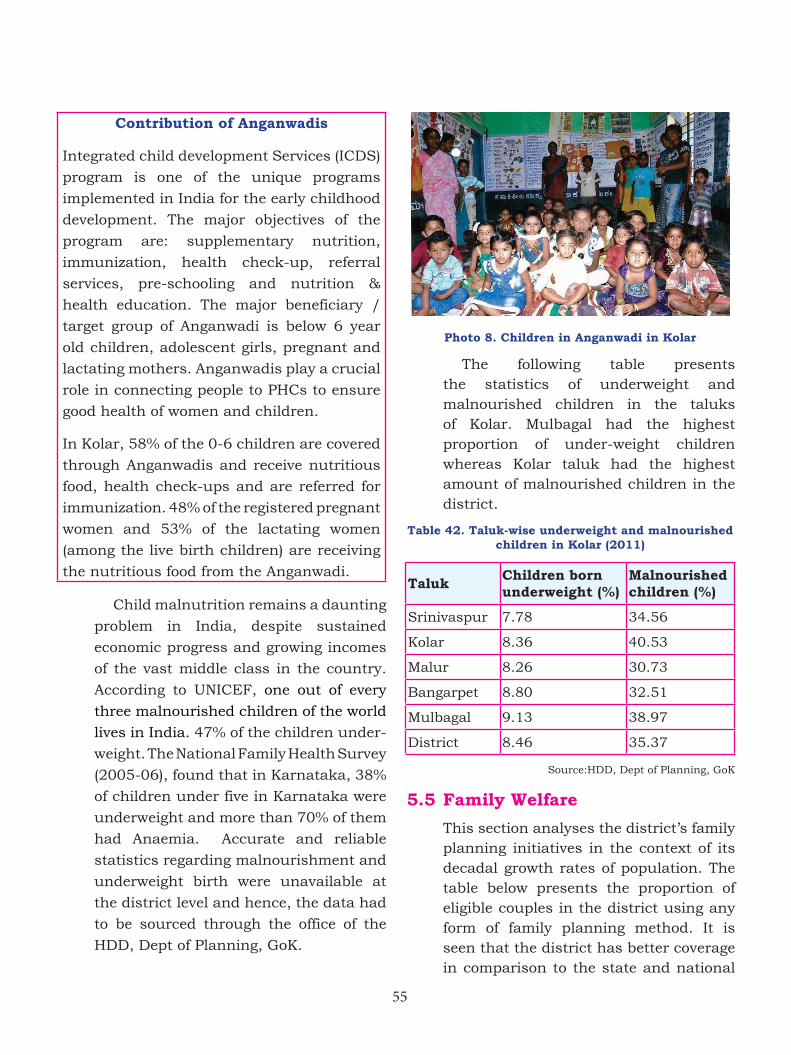
55
Contribution of Anganwadis
Integrated child development Services (ICDS)
program is one of the unique programs
implemented in India for the early childhood
development. The major objectives of the
program are: supplementary nutrition,
immunization, health check-up, referral
services, pre-schooling and nutrition &
health education. The major beneficiary /
target group of Anganwadi is below 6 year
old children, adolescent girls, pregnant and
lactating mothers. Anganwadis play a crucial
role in connecting people to PHCs to ensure
good health of women and children.
In Kolar, 58% of the 0-6 children are covered
through Anganwadis and receive nutritious
food, health check-ups and are referred for
immunization. 48% of the registered pregnant
women and 53% of the lactating women
(among the live birth children) are receiving
the nutritious food from the Anganwadi.
Child malnutrition remains a daunting
problem in India, despite sustained
economic progress and growing incomes
of the vast middle class in the country.
According to UNICEF, one out of every
three malnourished children of the world
lives in India. 47% of the children under-
weight. The National Family Health Survey
(2005-06), found that in Karnataka, 38%
of children under five in Karnataka were
underweight and more than 70% of them
had Anaemia. Accurate and reliable
statistics regarding malnourishment and
underweight birth were unavailable at
the district level and hence, the data had
to be sourced through the office of the
HDD, Dept of Planning, GoK.
Photo 8. Children in Anganwadi in Kolar
The following table presents the statistics of underweight and malnourished children in the taluks of Kolar. Mulbagal had the highest proportion of under-weight children whereas Kolar taluk had the highest amount of malnourished children in the district.
Table 42. Taluk-wise underweight and malnourished children in Kolar (2011)
Taluk Children born underweight (%)
Malnourished children (%)
Srinivaspur 7.78 34.56
Kolar 8.36 40.53
Malur 8.26 30.73
Bangarpet 8.80 32.51
Mulbagal 9.13 38.97
District 8.46 35.37
Source:HDD, Dept of Planning, GoK
5.5 Family Welfare
This section analyses the district’s family planning initiatives in the context of its decadal growth rates of population. The table below presents the proportion of eligible couples in the district using any form of family planning method. It is seen that the district has better coverage in comparison to the state and national
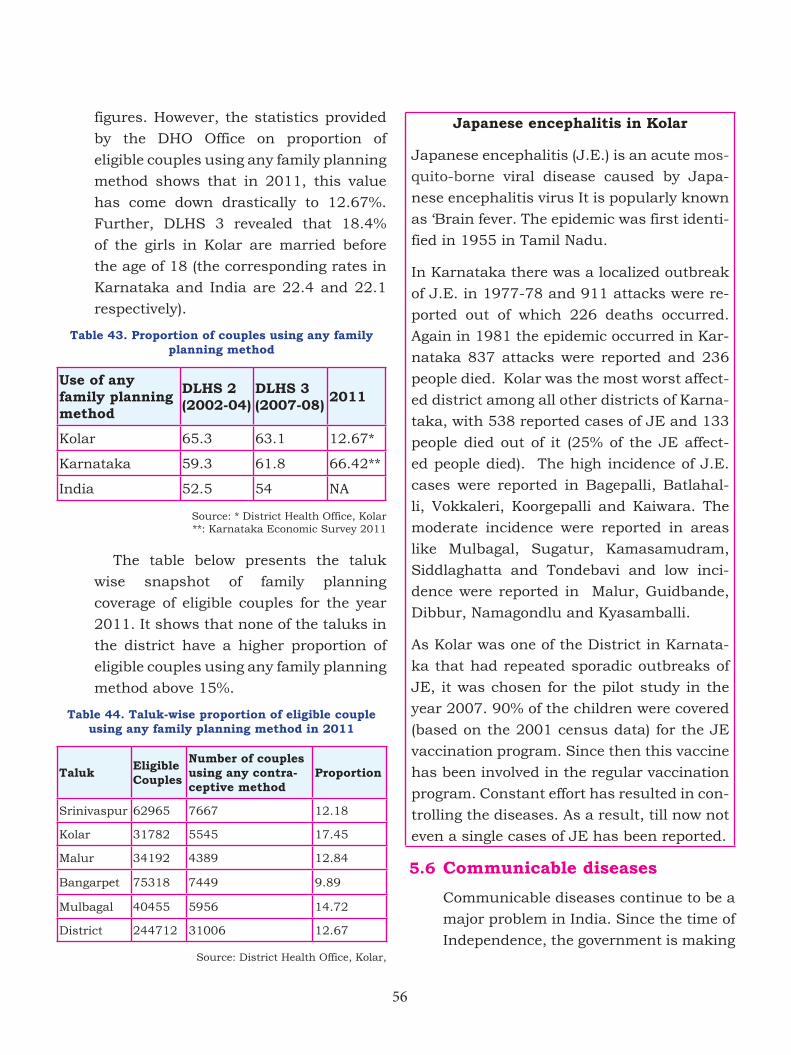
56
figures. However, the statistics provided
by the DHO Office on proportion of
eligible couples using any family planning
method shows that in 2011, this value
has come down drastically to 12.67%.
Further, DLHS 3 revealed that 18.4%
of the girls in Kolar are married before
the age of 18 (the corresponding rates in
Karnataka and India are 22.4 and 22.1
respectively).
Table 43. Proportion of couples using any family planning method
Use of any family planning method
DLHS 2 (2002-04)
DLHS 3 (2007-08) 2011
Kolar 65.3 63.1 12.67*
Karnataka 59.3 61.8 66.42**
India 52.5 54 NA
Source: * District Health Office, Kolar**: Karnataka Economic Survey 2011
The table below presents the taluk
wise snapshot of family planning
coverage of eligible couples for the year
2011. It shows that none of the taluks in
the district have a higher proportion of
eligible couples using any family planning
method above 15%.
Table 44. Taluk-wise proportion of eligible couple using any family planning method in 2011
Taluk Eligible Couples
Number of couples using any contra-ceptive method
Proportion
Srinivaspur 62965 7667 12.18
Kolar 31782 5545 17.45
Malur 34192 4389 12.84
Bangarpet 75318 7449 9.89
Mulbagal 40455 5956 14.72
District 244712 31006 12.67
Source: District Health Office, Kolar,
Japanese encephalitis in Kolar
Japanese encephalitis (J.E.) is an acute mos-
quito-borne viral disease caused by Japa-
nese encephalitis virus It is popularly known
as ‘Brain fever. The epidemic was first identi-
fied in 1955 in Tamil Nadu.
In Karnataka there was a localized outbreak
of J.E. in 1977-78 and 911 attacks were re-
ported out of which 226 deaths occurred.
Again in 1981 the epidemic occurred in Kar-
nataka 837 attacks were reported and 236
people died. Kolar was the most worst affect-
ed district among all other districts of Karna-
taka, with 538 reported cases of JE and 133
people died out of it (25% of the JE affect-
ed people died). The high incidence of J.E.
cases were reported in Bagepalli, Batlahal-
li, Vokkaleri, Koorgepalli and Kaiwara. The
moderate incidence were reported in areas
like Mulbagal, Sugatur, Kamasamudram,
Siddlaghatta and Tondebavi and low inci-
dence were reported in Malur, Guidbande,
Dibbur, Namagondlu and Kyasamballi.
As Kolar was one of the District in Karnata-
ka that had repeated sporadic outbreaks of
JE, it was chosen for the pilot study in the
year 2007. 90% of the children were covered
(based on the 2001 census data) for the JE
vaccination program. Since then this vaccine
has been involved in the regular vaccination
program. Constant effort has resulted in con-
trolling the diseases. As a result, till now not
even a single cases of JE has been reported.
5.6 Communicable diseases
Communicable diseases continue to be a
major problem in India. Since the time of
Independence, the government is making
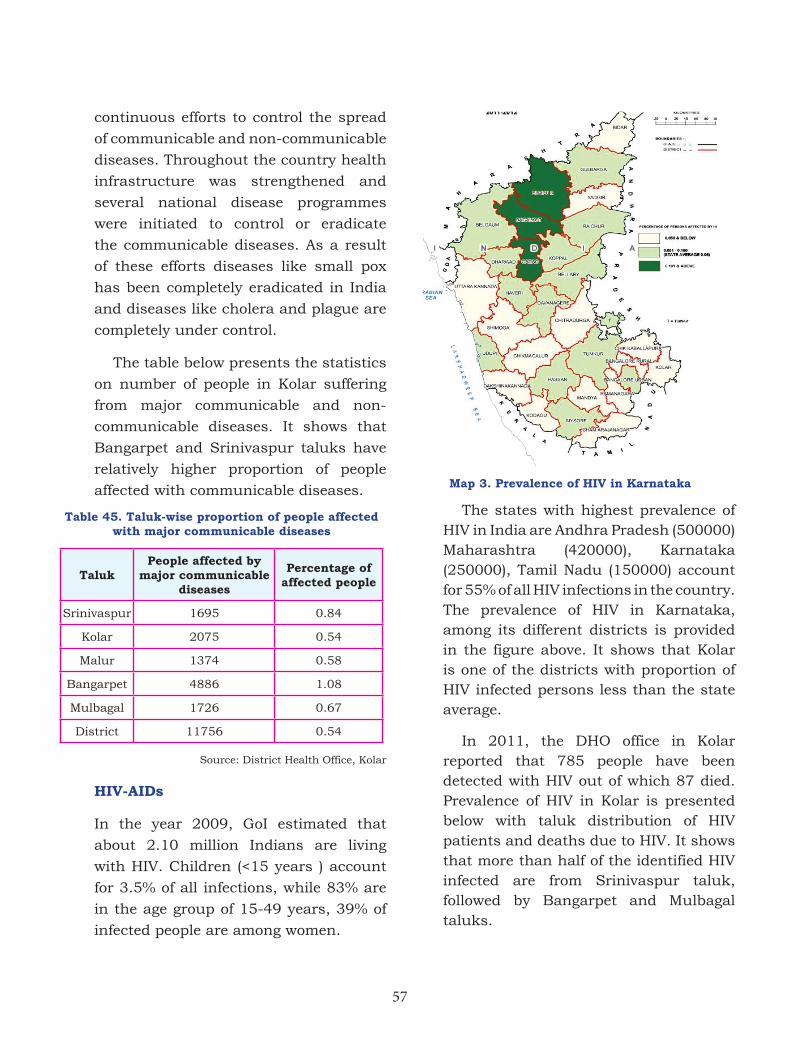
57
continuous efforts to control the spread
of communicable and non-communicable
diseases. Throughout the country health
infrastructure was strengthened and
several national disease programmes
were initiated to control or eradicate
the communicable diseases. As a result
of these efforts diseases like small pox
has been completely eradicated in India
and diseases like cholera and plague are
completely under control.
The table below presents the statistics
on number of people in Kolar suffering
from major communicable and non-
communicable diseases. It shows that
Bangarpet and Srinivaspur taluks have
relatively higher proportion of people
affected with communicable diseases.
Table 45. Taluk-wise proportion of people affected with major communicable diseases
TalukPeople affected by
major communicable diseases
Percentage of affected people
Srinivaspur 1695 0.84
Kolar 2075 0.54
Malur 1374 0.58
Bangarpet 4886 1.08
Mulbagal 1726 0.67
District 11756 0.54
Source: District Health Office, Kolar
HIV-AIDs
In the year 2009, GoI estimated that
about 2.10 million Indians are living
with HIV. Children (<15 years ) account
for 3.5% of all infections, while 83% are
in the age group of 15-49 years, 39% of
infected people are among women.
Map 3. Prevalence of HIV in Karnataka
The states with highest prevalence of HIV in India are Andhra Pradesh (500000) Maharashtra (420000), Karnataka (250000), Tamil Nadu (150000) account for 55% of all HIV infections in the country. The prevalence of HIV in Karnataka, among its different districts is provided in the figure above. It shows that Kolar is one of the districts with proportion of HIV infected persons less than the state average.
In 2011, the DHO office in Kolar reported that 785 people have been detected with HIV out of which 87 died. Prevalence of HIV in Kolar is presented below with taluk distribution of HIV patients and deaths due to HIV. It shows that more than half of the identified HIV infected are from Srinivaspur taluk, followed by Bangarpet and Mulbagal taluks.
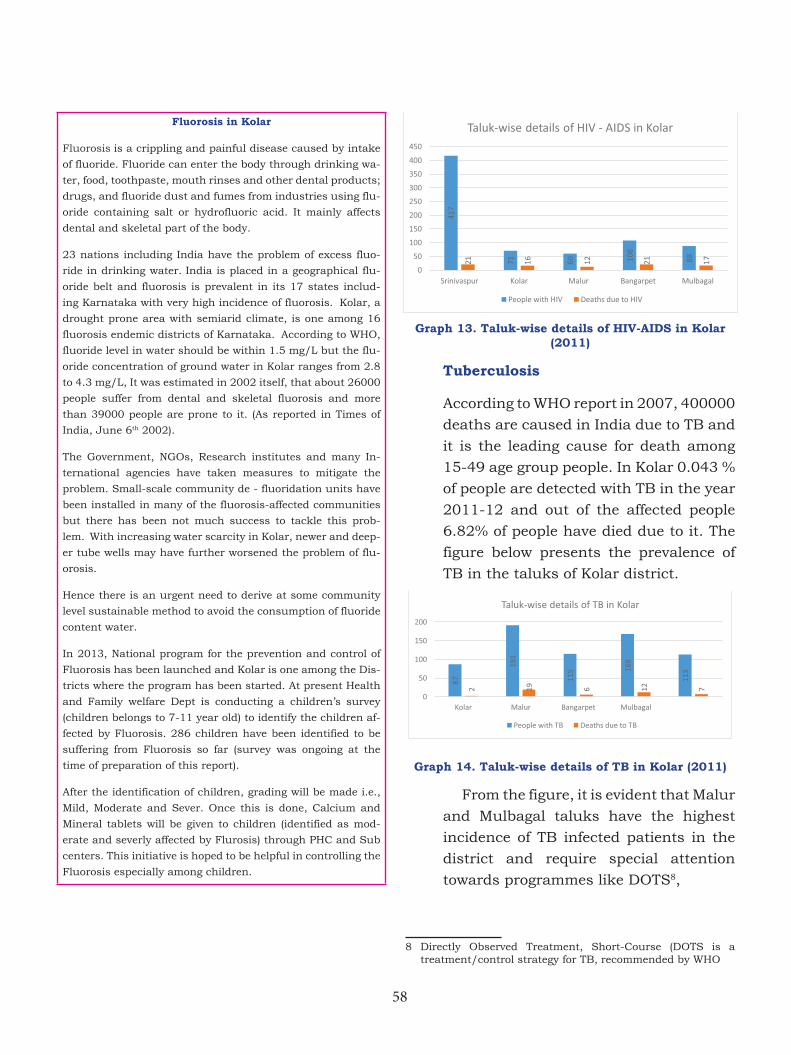
58
Fluorosis in Kolar
Fluorosis is a crippling and painful disease caused by intake
of fluoride. Fluoride can enter the body through drinking wa-
ter, food, toothpaste, mouth rinses and other dental products;
drugs, and fluoride dust and fumes from industries using flu-
oride containing salt or hydrofluoric acid. It mainly affects
dental and skeletal part of the body.
23 nations including India have the problem of excess fluo-
ride in drinking water. India is placed in a geographical flu-
oride belt and fluorosis is prevalent in its 17 states includ-
ing Karnataka with very high incidence of fluorosis. Kolar, a
drought prone area with semiarid climate, is one among 16
fluorosis endemic districts of Karnataka. According to WHO,
fluoride level in water should be within 1.5 mg/L but the flu-
oride concentration of ground water in Kolar ranges from 2.8
to 4.3 mg/L, It was estimated in 2002 itself, that about 26000
people suffer from dental and skeletal fluorosis and more
than 39000 people are prone to it. (As reported in Times of
India, June 6th 2002).
The Government, NGOs, Research institutes and many In-
ternational agencies have taken measures to mitigate the
problem. Small-scale community de - fluoridation units have
been installed in many of the fluorosis-affected communities
but there has been not much success to tackle this prob-
lem. With increasing water scarcity in Kolar, newer and deep-
er tube wells may have further worsened the problem of flu-
orosis.
Hence there is an urgent need to derive at some community
level sustainable method to avoid the consumption of fluoride
content water.
In 2013, National program for the prevention and control of
Fluorosis has been launched and Kolar is one among the Dis-
tricts where the program has been started. At present Health
and Family welfare Dept is conducting a children’s survey
(children belongs to 7-11 year old) to identify the children af-
fected by Fluorosis. 286 children have been identified to be
suffering from Fluorosis so far (survey was ongoing at the
time of preparation of this report).
After the identification of children, grading will be made i.e.,
Mild, Moderate and Sever. Once this is done, Calcium and
Mineral tablets will be given to children (identified as mod-
erate and severly affected by Flurosis) through PHC and Sub
centers. This initiative is hoped to be helpful in controlling the
Fluorosis especially among children.
Graph 13. Taluk-wise details of HIV-AIDS in Kolar (2011)
Tuberculosis
According to WHO report in 2007, 400000
deaths are caused in India due to TB and
it is the leading cause for death among
15-49 age group people. In Kolar 0.043 %
of people are detected with TB in the year
2011-12 and out of the affected people
6.82% of people have died due to it. The
figure below presents the prevalence of
TB in the taluks of Kolar district.
Graph 14. Taluk-wise details of TB in Kolar (2011)
From the figure, it is evident that Malur
and Mulbagal taluks have the highest
incidence of TB infected patients in the
district and require special attention
towards programmes like DOTS8,
8 Directly Observed Treatment, Short-Course (DOTS is a treatment/control strategy for TB, recommended by WHO
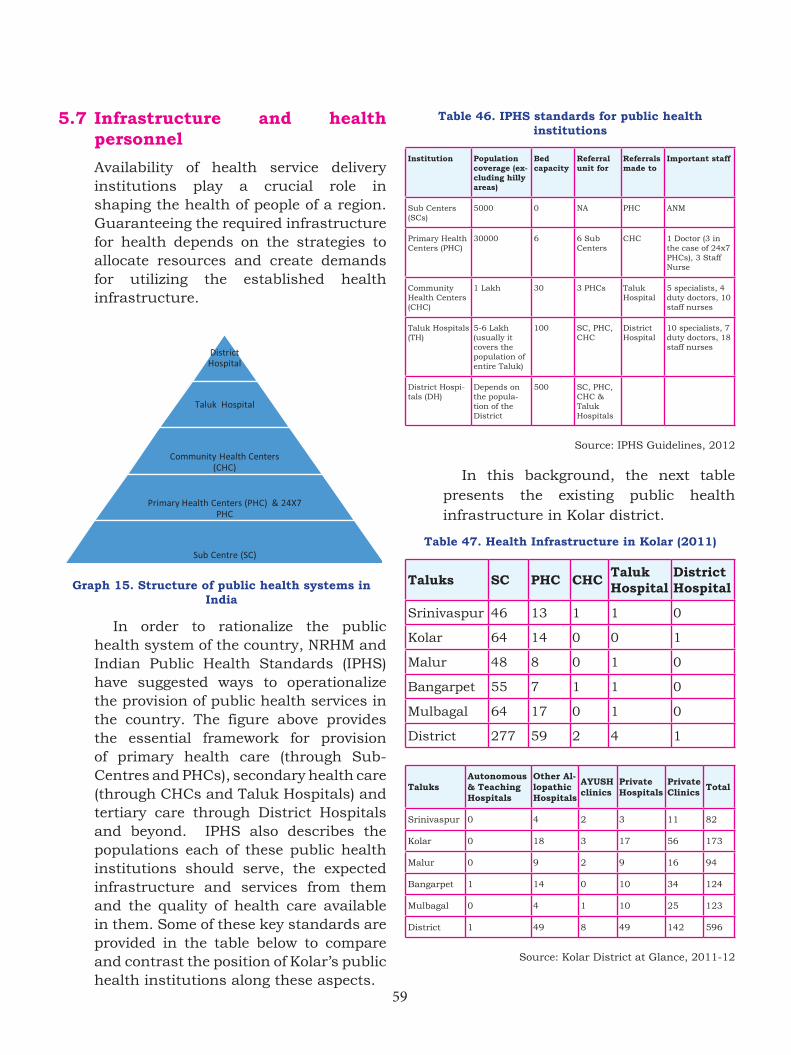
59
5.7 Infrastructure and health personnel
Availability of health service delivery institutions play a crucial role in shaping the health of people of a region. Guaranteeing the required infrastructure for health depends on the strategies to allocate resources and create demands for utilizing the established health infrastructure.
Graph 15. Structure of public health systems in India
In order to rationalize the public health system of the country, NRHM and Indian Public Health Standards (IPHS) have suggested ways to operationalize the provision of public health services in the country. The figure above provides the essential framework for provision of primary health care (through Sub-Centres and PHCs), secondary health care (through CHCs and Taluk Hospitals) and tertiary care through District Hospitals and beyond. IPHS also describes the populations each of these public health institutions should serve, the expected infrastructure and services from them and the quality of health care available in them. Some of these key standards are provided in the table below to compare and contrast the position of Kolar’s public health institutions along these aspects.
Table 46. IPHS standards for public health institutions
Institution Population coverage (ex-cluding hilly areas)
Bed capacity
Referral unit for
Referrals made to
Important staff
Sub Centers (SCs)
5000 0 NA PHC ANM
Primary Health Centers (PHC)
30000 6 6 Sub Centers
CHC 1 Doctor (3 in the case of 24x7 PHCs), 3 Staff Nurse
Community Health Centers (CHC)
1 Lakh 30 3 PHCs Taluk Hospital
5 specialists, 4 duty doctors, 10 staff nurses
Taluk Hospitals (TH)
5-6 Lakh (usually it covers the population of entire Taluk)
100 SC, PHC, CHC
District Hospital
10 specialists, 7 duty doctors, 18 staff nurses
District Hospi-tals (DH)
Depends on the popula-tion of the District
500 SC, PHC, CHC & Taluk Hospitals
Source: IPHS Guidelines, 2012
In this background, the next table presents the existing public health infrastructure in Kolar district.
Table 47. Health Infrastructure in Kolar (2011)
Taluks SC PHC CHC Taluk Hospital
District Hospital
Srinivaspur 46 13 1 1 0
Kolar 64 14 0 0 1
Malur 48 8 0 1 0
Bangarpet 55 7 1 1 0
Mulbagal 64 17 0 1 0
District 277 59 2 4 1
TaluksAutonomous & Teaching Hospitals
Other Al-lopathic Hospitals
AYUSH clinics
Private Hospitals
Private Clinics Total
Srinivaspur 0 4 2 3 11 82
Kolar 0 18 3 17 56 173
Malur 0 9 2 9 16 94
Bangarpet 1 14 0 10 34 124
Mulbagal 0 4 1 10 25 123
District 1 49 8 49 142 596
Source: Kolar District at Glance, 2011-12
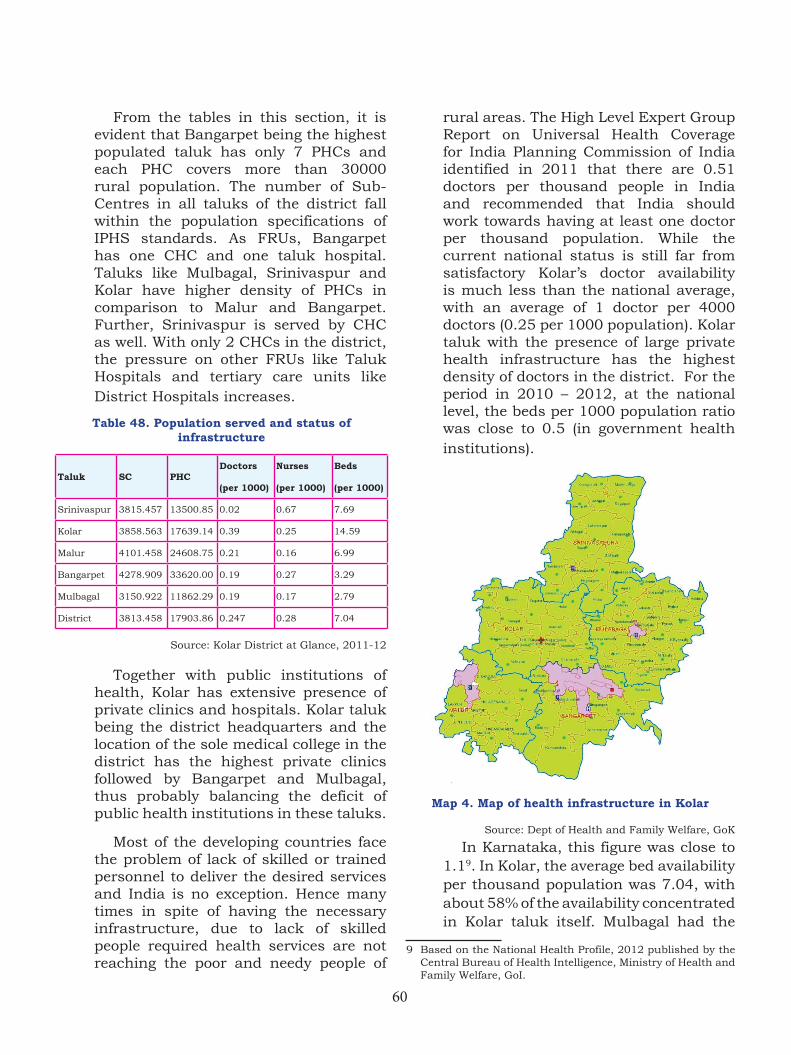
60
From the tables in this section, it is evident that Bangarpet being the highest populated taluk has only 7 PHCs and each PHC covers more than 30000 rural population. The number of Sub-Centres in all taluks of the district fall within the population specifications of IPHS standards. As FRUs, Bangarpet has one CHC and one taluk hospital. Taluks like Mulbagal, Srinivaspur and Kolar have higher density of PHCs in comparison to Malur and Bangarpet. Further, Srinivaspur is served by CHC as well. With only 2 CHCs in the district, the pressure on other FRUs like Taluk Hospitals and tertiary care units like District Hospitals increases.
Table 48. Population served and status of infrastructure
Taluk SC PHCDoctors
(per 1000)
Nurses
(per 1000)
Beds
(per 1000)
Srinivaspur 3815.457 13500.85 0.02 0.67 7.69
Kolar 3858.563 17639.14 0.39 0.25 14.59
Malur 4101.458 24608.75 0.21 0.16 6.99
Bangarpet 4278.909 33620.00 0.19 0.27 3.29
Mulbagal 3150.922 11862.29 0.19 0.17 2.79
District 3813.458 17903.86 0.247 0.28 7.04
Source: Kolar District at Glance, 2011-12
Together with public institutions of health, Kolar has extensive presence of private clinics and hospitals. Kolar taluk being the district headquarters and the location of the sole medical college in the district has the highest private clinics followed by Bangarpet and Mulbagal, thus probably balancing the deficit of public health institutions in these taluks.
Most of the developing countries face the problem of lack of skilled or trained personnel to deliver the desired services and India is no exception. Hence many times in spite of having the necessary infrastructure, due to lack of skilled people required health services are not reaching the poor and needy people of
rural areas. The High Level Expert Group Report on Universal Health Coverage for India Planning Commission of India identified in 2011 that there are 0.51 doctors per thousand people in India and recommended that India should work towards having at least one doctor per thousand population. While the current national status is still far from satisfactory Kolar’s doctor availability is much less than the national average, with an average of 1 doctor per 4000 doctors (0.25 per 1000 population). Kolar taluk with the presence of large private health infrastructure has the highest density of doctors in the district. For the period in 2010 – 2012, at the national level, the beds per 1000 population ratio was close to 0.5 (in government health institutions).
Map 4. Map of health infrastructure in Kolar
Source: Dept of Health and Family Welfare, GoK
In Karnataka, this figure was close to 1.19. In Kolar, the average bed availability per thousand population was 7.04, with about 58% of the availability concentrated in Kolar taluk itself. Mulbagal had the
9 Based on the National Health Profile, 2012 published by the Central Bureau of Health Intelligence, Ministry of Health and Family Welfare, GoI.
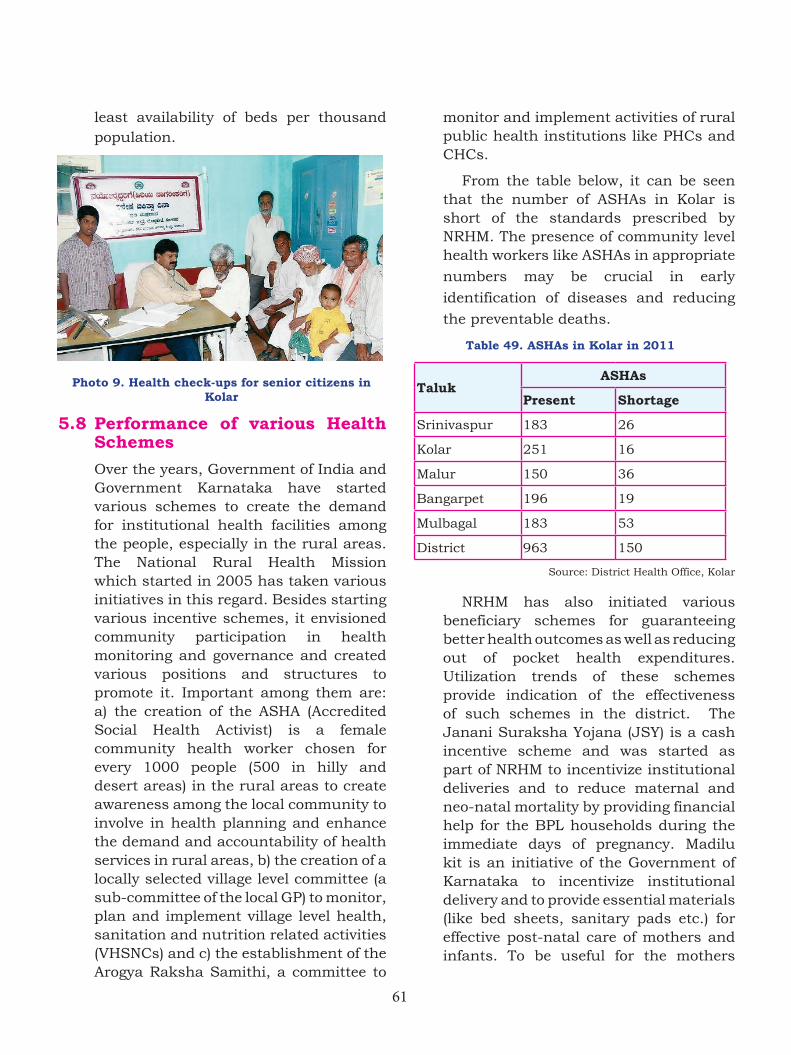
61
least availability of beds per thousand population.
Photo 9. Health check-ups for senior citizens in Kolar
5.8 Performance of various Health Schemes
Over the years, Government of India and Government Karnataka have started various schemes to create the demand for institutional health facilities among the people, especially in the rural areas. The National Rural Health Mission which started in 2005 has taken various initiatives in this regard. Besides starting various incentive schemes, it envisioned community participation in health monitoring and governance and created various positions and structures to promote it. Important among them are: a) the creation of the ASHA (Accredited Social Health Activist) is a female community health worker chosen for every 1000 people (500 in hilly and desert areas) in the rural areas to create awareness among the local community to involve in health planning and enhance the demand and accountability of health services in rural areas, b) the creation of a locally selected village level committee (a sub-committee of the local GP) to monitor, plan and implement village level health, sanitation and nutrition related activities (VHSNCs) and c) the establishment of the Arogya Raksha Samithi, a committee to
monitor and implement activities of rural public health institutions like PHCs and CHCs.
From the table below, it can be seen that the number of ASHAs in Kolar is short of the standards prescribed by NRHM. The presence of community level health workers like ASHAs in appropriate
numbers may be crucial in early
identification of diseases and reducing
the preventable deaths.
Table 49. ASHAs in Kolar in 2011
TalukASHAs
Present Shortage
Srinivaspur 183 26
Kolar 251 16
Malur 150 36
Bangarpet 196 19
Mulbagal 183 53
District 963 150
Source: District Health Office, Kolar
NRHM has also initiated various beneficiary schemes for guaranteeing better health outcomes as well as reducing out of pocket health expenditures. Utilization trends of these schemes provide indication of the effectiveness of such schemes in the district. The Janani Suraksha Yojana (JSY) is a cash incentive scheme and was started as part of NRHM to incentivize institutional deliveries and to reduce maternal and neo-natal mortality by providing financial help for the BPL households during the immediate days of pregnancy. Madilu kit is an initiative of the Government of Karnataka to incentivize institutional delivery and to provide essential materials (like bed sheets, sanitary pads etc.) for effective post-natal care of mothers and infants. To be useful for the mothers
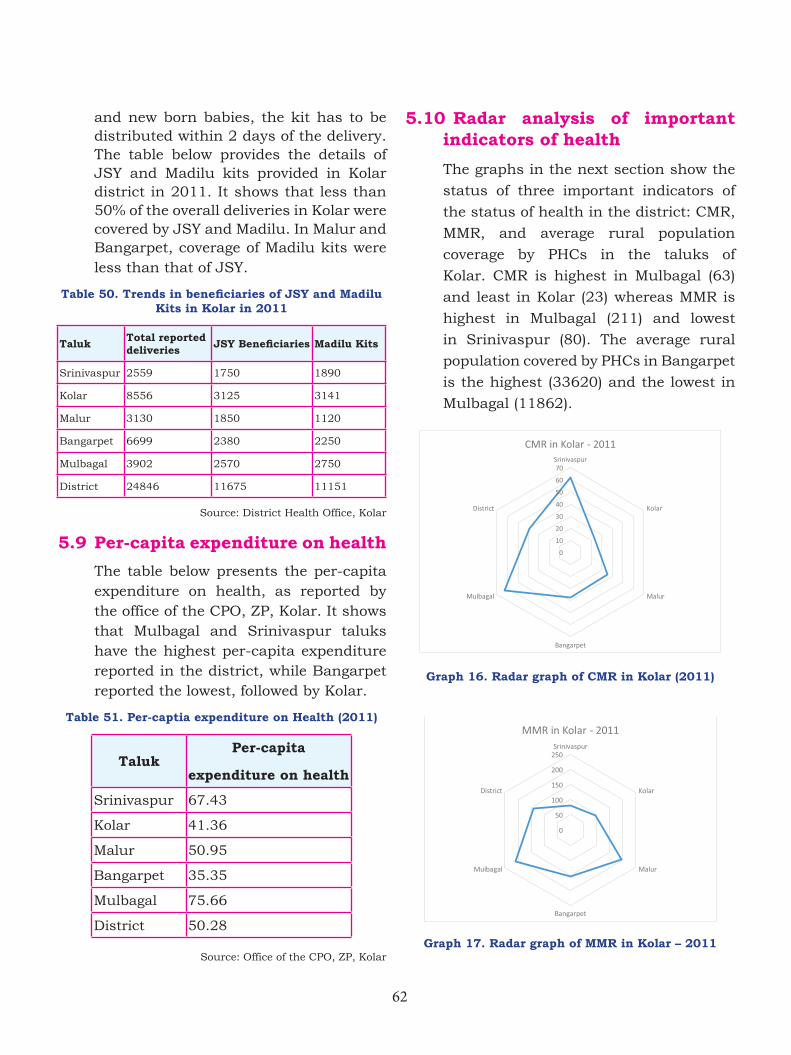
62
and new born babies, the kit has to be distributed within 2 days of the delivery. The table below provides the details of JSY and Madilu kits provided in Kolar district in 2011. It shows that less than 50% of the overall deliveries in Kolar were covered by JSY and Madilu. In Malur and Bangarpet, coverage of Madilu kits were less than that of JSY.
Table50.TrendsinbeneficiariesofJSYandMadiluKits in Kolar in 2011
Taluk Total reported deliveries JSYBeneficiaries Madilu Kits
Srinivaspur 2559 1750 1890
Kolar 8556 3125 3141
Malur 3130 1850 1120
Bangarpet 6699 2380 2250
Mulbagal 3902 2570 2750
District 24846 11675 11151
Source: District Health Office, Kolar
5.9 Per-capita expenditure on health
The table below presents the per-capita expenditure on health, as reported by the office of the CPO, ZP, Kolar. It shows that Mulbagal and Srinivaspur taluks have the highest per-capita expenditure reported in the district, while Bangarpet reported the lowest, followed by Kolar.
Table 51. Per-captia expenditure on Health (2011)
TalukPer-capita
expenditure on health
Srinivaspur 67.43
Kolar 41.36
Malur 50.95
Bangarpet 35.35
Mulbagal 75.66
District 50.28
Source: Office of the CPO, ZP, Kolar
5.10 Radar analysis of important indicators of health
The graphs in the next section show the
status of three important indicators of
the status of health in the district: CMR,
MMR, and average rural population
coverage by PHCs in the taluks of
Kolar. CMR is highest in Mulbagal (63)
and least in Kolar (23) whereas MMR is
highest in Mulbagal (211) and lowest
in Srinivaspur (80). The average rural
population covered by PHCs in Bangarpet
is the highest (33620) and the lowest in
Mulbagal (11862).
Graph 16. Radar graph of CMR in Kolar (2011)
Graph 17. Radar graph of MMR in Kolar – 2011
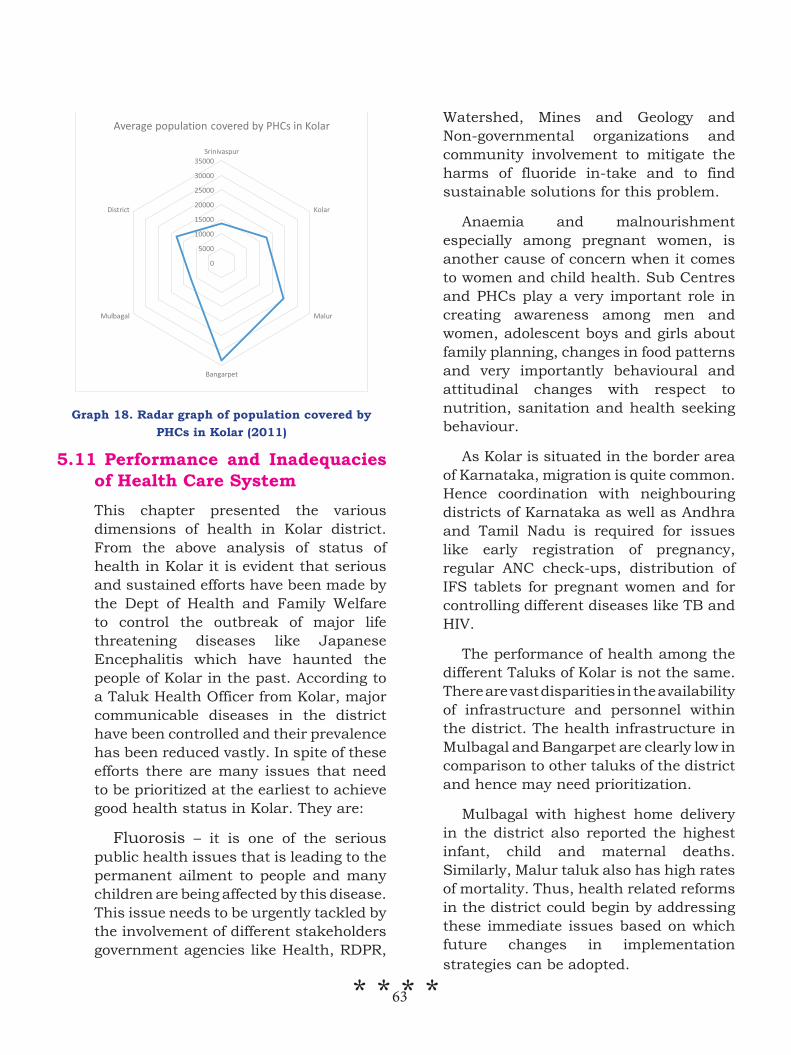
63
Graph 18. Radar graph of population covered by PHCs in Kolar (2011)
5.11 Performance and Inadequacies of Health Care System
This chapter presented the various dimensions of health in Kolar district. From the above analysis of status of health in Kolar it is evident that serious and sustained efforts have been made by the Dept of Health and Family Welfare to control the outbreak of major life threatening diseases like Japanese Encephalitis which have haunted the people of Kolar in the past. According to a Taluk Health Officer from Kolar, major communicable diseases in the district have been controlled and their prevalence has been reduced vastly. In spite of these efforts there are many issues that need to be prioritized at the earliest to achieve good health status in Kolar. They are:
Fluorosis – it is one of the serious public health issues that is leading to the permanent ailment to people and many children are being affected by this disease. This issue needs to be urgently tackled by the involvement of different stakeholders government agencies like Health, RDPR,
Watershed, Mines and Geology and Non-governmental organizations and community involvement to mitigate the harms of fluoride in-take and to find sustainable solutions for this problem.
Anaemia and malnourishment especially among pregnant women, is another cause of concern when it comes to women and child health. Sub Centres and PHCs play a very important role in creating awareness among men and women, adolescent boys and girls about family planning, changes in food patterns and very importantly behavioural and attitudinal changes with respect to nutrition, sanitation and health seeking behaviour.
As Kolar is situated in the border area of Karnataka, migration is quite common. Hence coordination with neighbouring districts of Karnataka as well as Andhra and Tamil Nadu is required for issues like early registration of pregnancy, regular ANC check-ups, distribution of IFS tablets for pregnant women and for controlling different diseases like TB and HIV.
The performance of health among the different Taluks of Kolar is not the same. There are vast disparities in the availability of infrastructure and personnel within the district. The health infrastructure in Mulbagal and Bangarpet are clearly low in comparison to other taluks of the district and hence may need prioritization.
Mulbagal with highest home delivery in the district also reported the highest infant, child and maternal deaths. Similarly, Malur taluk also has high rates of mortality. Thus, health related reforms in the district could begin by addressing these immediate issues based on which future changes in implementation strategies can be adopted.
* * * *
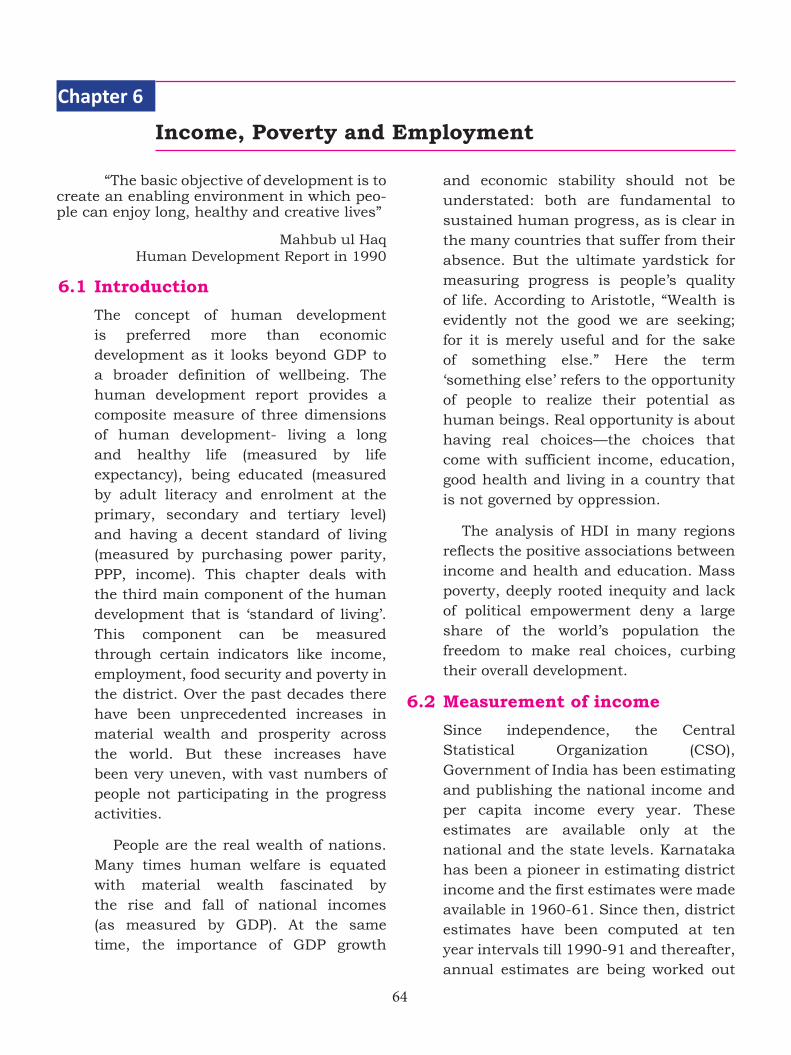
64
“The basic objective of development is to create an enabling environment in which peo-ple can enjoy long, healthy and creative lives”
Mahbub ul HaqHuman Development Report in 1990
6.1 Introduction
The concept of human development is preferred more than economic development as it looks beyond GDP to a broader definition of wellbeing. The human development report provides a composite measure of three dimensions of human development- living a long and healthy life (measured by life expectancy), being educated (measured by adult literacy and enrolment at the primary, secondary and tertiary level) and having a decent standard of living (measured by purchasing power parity, PPP, income). This chapter deals with the third main component of the human development that is ‘standard of living’. This component can be measured through certain indicators like income, employment, food security and poverty in the district. Over the past decades there have been unprecedented increases in material wealth and prosperity across the world. But these increases have been very uneven, with vast numbers of people not participating in the progress activities.
People are the real wealth of nations. Many times human welfare is equated with material wealth fascinated by the rise and fall of national incomes (as measured by GDP). At the same time, the importance of GDP growth
and economic stability should not be understated: both are fundamental to sustained human progress, as is clear in the many countries that suffer from their absence. But the ultimate yardstick for measuring progress is people’s quality of life. According to Aristotle, “Wealth is evidently not the good we are seeking; for it is merely useful and for the sake of something else.” Here the term ‘something else’ refers to the opportunity of people to realize their potential as human beings. Real opportunity is about having real choices—the choices that come with sufficient income, education, good health and living in a country that is not governed by oppression.
The analysis of HDI in many regions reflects the positive associations between income and health and education. Mass poverty, deeply rooted inequity and lack of political empowerment deny a large share of the world’s population the freedom to make real choices, curbing their overall development.
6.2 Measurement of income
Since independence, the Central Statistical Organization (CSO), Government of India has been estimating and publishing the national income and per capita income every year. These estimates are available only at the national and the state levels. Karnataka has been a pioneer in estimating district income and the first estimates were made available in 1960-61. Since then, district estimates have been computed at ten year intervals till 1990-91 and thereafter, annual estimates are being worked out
Income, Poverty and Employment Chapter 6
65
regularly. The district estimates of GDP were, however, based on derivatives from the state GDP estimates. The district domestic product (DDP) estimates at the district-level are, however, derived from the State-level GDP estimates. The State Directorate of Economics and Statistics which collects and publishes these data, has so far not made any attempts to estimate the GDP at the grassroots levels.
The present study has attempted to estimate the GDP for Kolar district at the taluk-level. The data for the same have been gathered from the official records of the Kolar district office of the State Directorate of Economics and Statistics. Continuous time series data on GDP at the taluk-level are not available to examine the trends at the taluk level. However, the compound annual growth rates (CAGR) were computed using the data available for the year 2004-05 and 2008-09. For estimating the taluk-level GDP (TDP) the same conventional classifications as adopted by the CSO and the State Directorate of Economics and Statistics have been adopted.
The taluk economy is classified into three sectors namely 1) primary, 2) secondary and 3) tertiary sectors. The primary sector covers agriculture, animal husbandry, forestry, fishing, mining and quarrying. The secondary sector includes all manufacturing – both registered and unregistered, construction, electricity, gas and water supply. The tertiary or service sector comprises transport, communication, marketing including storage, hotels and restaurants, banking and insurance, real estates, ownership of dwellings and business services, public administrations and other services.
6.3 District and Taluk Income
The growth of the India’s economy is measured in terms of the GDP at current prices10. Likewise, the growth of Karnataka’s economy is measured in terms of State Domestic Product (SDP). Similarly, the growth of Kolar district and its taluk can be measured in terms of District Domestic Product (DDP) and Taluk Domestic Product (TDP) at current prices. The growth of the DDP in Kolar district during the period 2004-05 to 2008-09 is presented in the table below. It presents the sector wise compound annual growth rates (CAGR) of the Gross and Net Domestic Products (in lakhs of rupees) across the years 2004-05 and 2008-09 at current prices.
Table 52. Sector-wise growth rates in Kolar
Sl. No Particulars
GDDP (in Rs. lakhs)CAGR (%)
NDDP (in Rs. lakhs)CAGR (%)
2004-05 2008-09 2004-05 2008-09
1 Primary sector 145662 179491 4.27 134992 166517 4.29
2 Secondary sector 100613 176038 11.28 78533 141706 12.53
3 Tertiary sector 168016 271128 10.04 153038 250440 10.35
4 Total 414291 626657 8.63 366563 558663 8.79
Source: HDD, Dept of Planning, GoK
In Kolar district, the total income namely District Domestic Product (DDP) grew at the annual compound growth rate of 8.63% (GDDP) and 8.79 % (NDDP). Sector-wise, the secondary sector’s income registered the highest CAGR (11.28%) followed by tertiary sector with 10.04 % growth. The district lags behind in primary sector growth with the CAGR of 4.69%. The next table presents the
10 Gross domestic product (GDP) at current prices is GDP at prices of the current reporting period, also known as nominal GDP. Gross domestic product (GDP) at constant prices refers to the volume level of GDP. Constant price estimates of GDP are obtained by expressing values in terms of a base period.
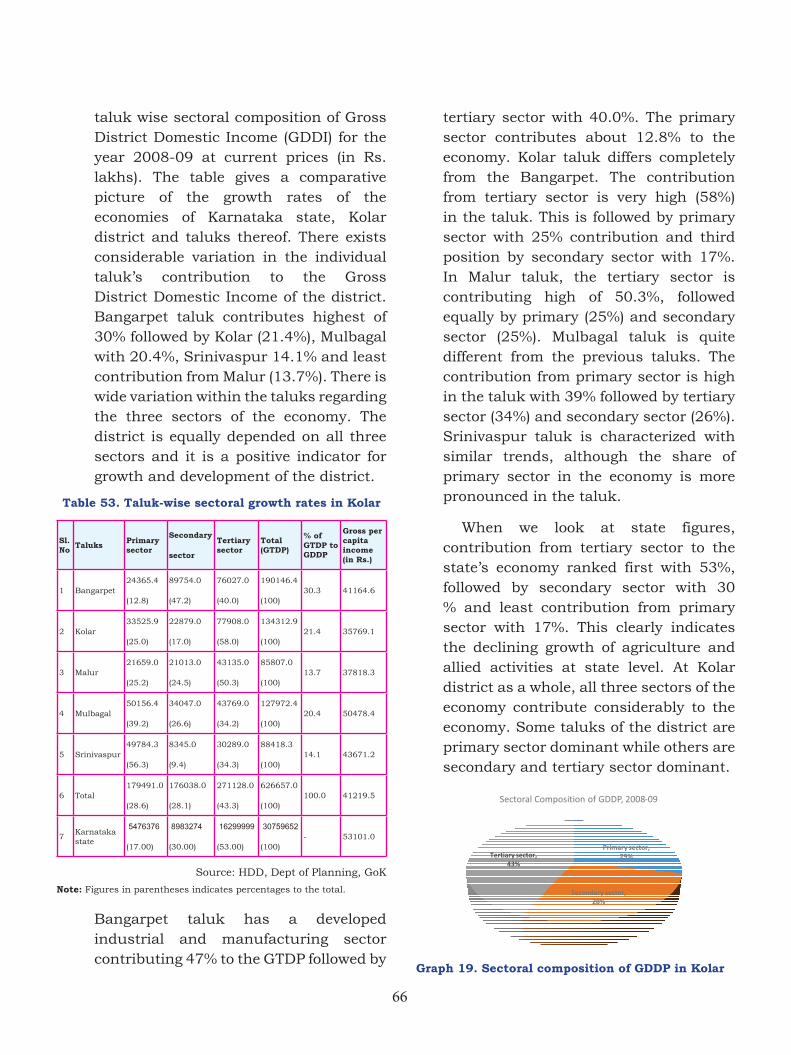
66
taluk wise sectoral composition of Gross District Domestic Income (GDDI) for the year 2008-09 at current prices (in Rs. lakhs). The table gives a comparative picture of the growth rates of the economies of Karnataka state, Kolar district and taluks thereof. There exists considerable variation in the individual taluk’s contribution to the Gross District Domestic Income of the district. Bangarpet taluk contributes highest of 30% followed by Kolar (21.4%), Mulbagal with 20.4%, Srinivaspur 14.1% and least contribution from Malur (13.7%). There is wide variation within the taluks regarding the three sectors of the economy. The district is equally depended on all three sectors and it is a positive indicator for growth and development of the district.
Table 53. Taluk-wise sectoral growth rates in Kolar
Sl. No Taluks Primary
sector
Secondary
sector
Tertiary sector
Total (GTDP)
% of GTDP to GDDP
Gross per capita income (in Rs.)
1 Bangarpet24365.4
(12.8)
89754.0
(47.2)
76027.0
(40.0)
190146.4
(100)30.3 41164.6
2 Kolar33525.9
(25.0)
22879.0
(17.0)
77908.0
(58.0)
134312.9
(100)21.4 35769.1
3 Malur21659.0
(25.2)
21013.0
(24.5)
43135.0
(50.3)
85807.0
(100)13.7 37818.3
4 Mulbagal50156.4
(39.2)
34047.0
(26.6)
43769.0
(34.2)
127972.4
(100)20.4 50478.4
5 Srinivaspur49784.3
(56.3)
8345.0
(9.4)
30289.0
(34.3)
88418.3
(100)14.1 43671.2
6 Total179491.0
(28.6)
176038.0
(28.1)
271128.0
(43.3)
626657.0
(100)100.0 41219.5
7Karnataka state
5476376
(17.00)
8983274
(30.00)
16299999
(53.00)
30759652
(100)- 53101.0
Source: HDD, Dept of Planning, GoK
Note: Figures in parentheses indicates percentages to the total.
Bangarpet taluk has a developed industrial and manufacturing sector contributing 47% to the GTDP followed by
tertiary sector with 40.0%. The primary sector contributes about 12.8% to the economy. Kolar taluk differs completely from the Bangarpet. The contribution from tertiary sector is very high (58%) in the taluk. This is followed by primary sector with 25% contribution and third position by secondary sector with 17%. In Malur taluk, the tertiary sector is contributing high of 50.3%, followed equally by primary (25%) and secondary sector (25%). Mulbagal taluk is quite different from the previous taluks. The contribution from primary sector is high in the taluk with 39% followed by tertiary sector (34%) and secondary sector (26%). Srinivaspur taluk is characterized with similar trends, although the share of primary sector in the economy is more pronounced in the taluk.
When we look at state figures, contribution from tertiary sector to the state’s economy ranked first with 53%, followed by secondary sector with 30 % and least contribution from primary sector with 17%. This clearly indicates the declining growth of agriculture and allied activities at state level. At Kolar district as a whole, all three sectors of the economy contribute considerably to the economy. Some taluks of the district are primary sector dominant while others are secondary and tertiary sector dominant.
Graph 19. Sectoral composition of GDDP in Kolar
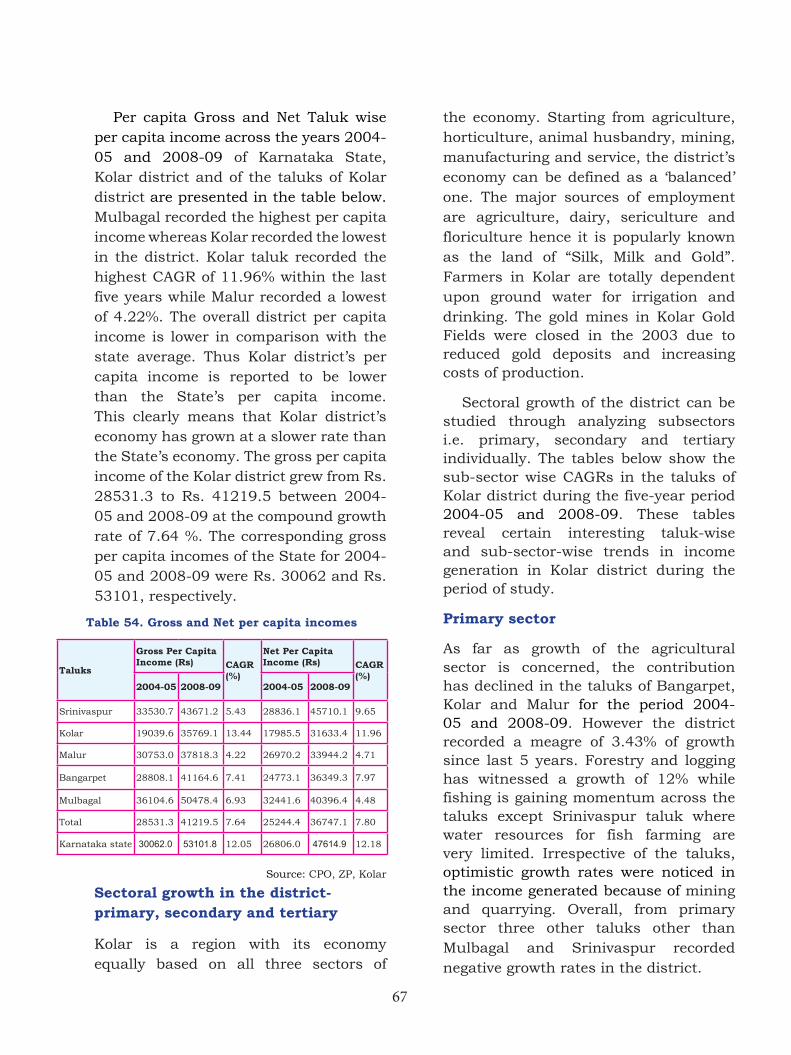
67
Per capita Gross and Net Taluk wise per capita income across the years 2004-05 and 2008-09 of Karnataka State, Kolar district and of the taluks of Kolar district are presented in the table below. Mulbagal recorded the highest per capita income whereas Kolar recorded the lowest in the district. Kolar taluk recorded the highest CAGR of 11.96% within the last five years while Malur recorded a lowest of 4.22%. The overall district per capita income is lower in comparison with the state average. Thus Kolar district’s per capita income is reported to be lower than the State’s per capita income. This clearly means that Kolar district’s economy has grown at a slower rate than the State’s economy. The gross per capita income of the Kolar district grew from Rs. 28531.3 to Rs. 41219.5 between 2004-05 and 2008-09 at the compound growth rate of 7.64 %. The corresponding gross per capita incomes of the State for 2004-05 and 2008-09 were Rs. 30062 and Rs. 53101, respectively.
Table 54. Gross and Net per capita incomes
Taluks
Gross Per Capita Income (Rs) CAGR
(%)
Net Per Capita Income (Rs) CAGR
(%)2004-05 2008-09 2004-05 2008-09
Srinivaspur 33530.7 43671.2 5.43 28836.1 45710.1 9.65
Kolar 19039.6 35769.1 13.44 17985.5 31633.4 11.96
Malur 30753.0 37818.3 4.22 26970.2 33944.2 4.71
Bangarpet 28808.1 41164.6 7.41 24773.1 36349.3 7.97
Mulbagal 36104.6 50478.4 6.93 32441.6 40396.4 4.48
Total 28531.3 41219.5 7.64 25244.4 36747.1 7.80
Karnataka state 30062.0 53101.8 12.05 26806.0 47614.9 12.18
Source: CPO, ZP, Kolar
Sectoral growth in the district- primary, secondary and tertiary
Kolar is a region with its economy equally based on all three sectors of
the economy. Starting from agriculture, horticulture, animal husbandry, mining, manufacturing and service, the district’s economy can be defined as a ‘balanced’ one. The major sources of employment are agriculture, dairy, sericulture and floriculture hence it is popularly known as the land of “Silk, Milk and Gold”. Farmers in Kolar are totally dependent upon ground water for irrigation and drinking. The gold mines in Kolar Gold Fields were closed in the 2003 due to reduced gold deposits and increasing costs of production.
Sectoral growth of the district can be studied through analyzing subsectors i.e. primary, secondary and tertiary individually. The tables below show the sub-sector wise CAGRs in the taluks of Kolar district during the five-year period 2004-05 and 2008-09. These tables reveal certain interesting taluk-wise and sub-sector-wise trends in income generation in Kolar district during the period of study.
Primary sector
As far as growth of the agricultural sector is concerned, the contribution has declined in the taluks of Bangarpet, Kolar and Malur for the period 2004-05 and 2008-09. However the district recorded a meagre of 3.43% of growth since last 5 years. Forestry and logging has witnessed a growth of 12% while fishing is gaining momentum across the taluks except Srinivaspur taluk where water resources for fish farming are very limited. Irrespective of the taluks, optimistic growth rates were noticed in the income generated because of mining and quarrying. Overall, from primary sector three other taluks other than Mulbagal and Srinivaspur recorded negative growth rates in the district.
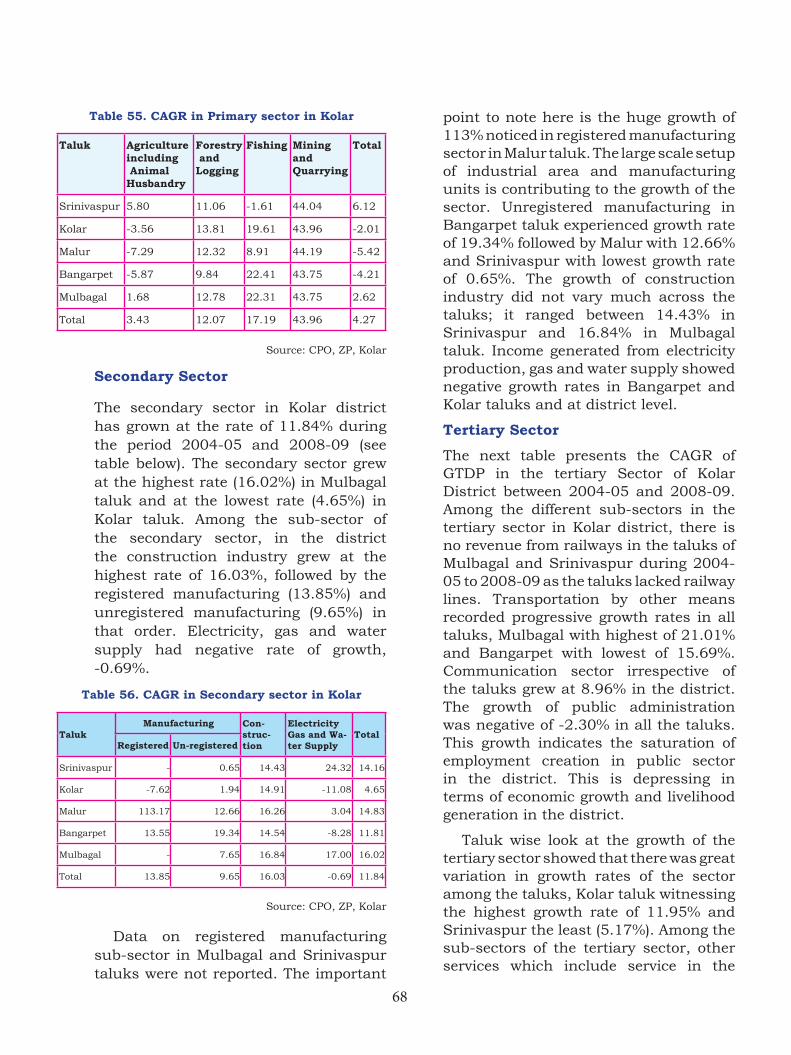
68
Table 55. CAGR in Primary sector in Kolar
Taluk Agriculture including Animal Husbandry
Forestry and Logging
Fishing Mining and Quarrying
Total
Srinivaspur 5.80 11.06 -1.61 44.04 6.12
Kolar -3.56 13.81 19.61 43.96 -2.01
Malur -7.29 12.32 8.91 44.19 -5.42
Bangarpet -5.87 9.84 22.41 43.75 -4.21
Mulbagal 1.68 12.78 22.31 43.75 2.62
Total 3.43 12.07 17.19 43.96 4.27
Source: CPO, ZP, Kolar
Secondary Sector
The secondary sector in Kolar district has grown at the rate of 11.84% during the period 2004-05 and 2008-09 (see table below). The secondary sector grew at the highest rate (16.02%) in Mulbagal taluk and at the lowest rate (4.65%) in Kolar taluk. Among the sub-sector of the secondary sector, in the district the construction industry grew at the highest rate of 16.03%, followed by the registered manufacturing (13.85%) and unregistered manufacturing (9.65%) in that order. Electricity, gas and water supply had negative rate of growth, -0.69%.
Table 56. CAGR in Secondary sector in Kolar
TalukManufacturing Con-
struc-tion
Electricity Gas and Wa-ter Supply
TotalRegistered Un-registered
Srinivaspur - 0.65 14.43 24.32 14.16
Kolar -7.62 1.94 14.91 -11.08 4.65
Malur 113.17 12.66 16.26 3.04 14.83
Bangarpet 13.55 19.34 14.54 -8.28 11.81
Mulbagal - 7.65 16.84 17.00 16.02
Total 13.85 9.65 16.03 -0.69 11.84
Source: CPO, ZP, Kolar
Data on registered manufacturing sub-sector in Mulbagal and Srinivaspur taluks were not reported. The important
point to note here is the huge growth of 113% noticed in registered manufacturing sector in Malur taluk. The large scale setup of industrial area and manufacturing units is contributing to the growth of the sector. Unregistered manufacturing in Bangarpet taluk experienced growth rate of 19.34% followed by Malur with 12.66% and Srinivaspur with lowest growth rate of 0.65%. The growth of construction industry did not vary much across the taluks; it ranged between 14.43% in Srinivaspur and 16.84% in Mulbagal taluk. Income generated from electricity production, gas and water supply showed negative growth rates in Bangarpet and Kolar taluks and at district level.
Tertiary Sector
The next table presents the CAGR of GTDP in the tertiary Sector of Kolar District between 2004-05 and 2008-09. Among the different sub-sectors in the tertiary sector in Kolar district, there is no revenue from railways in the taluks of Mulbagal and Srinivaspur during 2004-05 to 2008-09 as the taluks lacked railway lines. Transportation by other means recorded progressive growth rates in all taluks, Mulbagal with highest of 21.01% and Bangarpet with lowest of 15.69%. Communication sector irrespective of the taluks grew at 8.96% in the district. The growth of public administration was negative of -2.30% in all the taluks. This growth indicates the saturation of employment creation in public sector in the district. This is depressing in terms of economic growth and livelihood generation in the district.
Taluk wise look at the growth of the tertiary sector showed that there was great variation in growth rates of the sector among the taluks, Kolar taluk witnessing the highest growth rate of 11.95% and Srinivaspur the least (5.17%). Among the sub-sectors of the tertiary sector, other services which include service in the
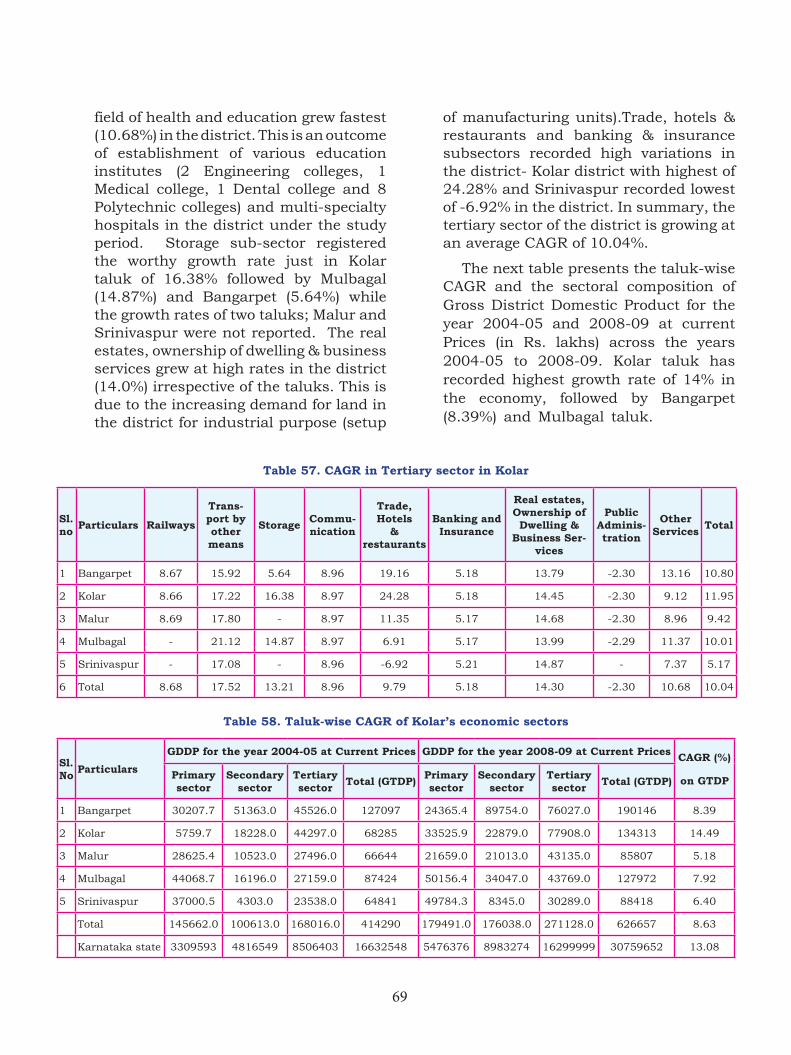
69
field of health and education grew fastest (10.68%) in the district. This is an outcome of establishment of various education institutes (2 Engineering colleges, 1 Medical college, 1 Dental college and 8 Polytechnic colleges) and multi-specialty hospitals in the district under the study period. Storage sub-sector registered the worthy growth rate just in Kolar taluk of 16.38% followed by Mulbagal (14.87%) and Bangarpet (5.64%) while the growth rates of two taluks; Malur and Srinivaspur were not reported. The real estates, ownership of dwelling & business services grew at high rates in the district (14.0%) irrespective of the taluks. This is due to the increasing demand for land in the district for industrial purpose (setup
of manufacturing units).Trade, hotels & restaurants and banking & insurance subsectors recorded high variations in the district- Kolar district with highest of 24.28% and Srinivaspur recorded lowest of -6.92% in the district. In summary, the tertiary sector of the district is growing at an average CAGR of 10.04%.
The next table presents the taluk-wise CAGR and the sectoral composition of Gross District Domestic Product for the year 2004-05 and 2008-09 at current Prices (in Rs. lakhs) across the years 2004-05 to 2008-09. Kolar taluk has recorded highest growth rate of 14% in the economy, followed by Bangarpet (8.39%) and Mulbagal taluk. Table 57. CAGR in Tertiary sector in Kolar
Table 57. CAGR in Tertiary sector in Kolar
Sl. no Particulars Railways
Trans-port by other means
Storage Commu-nication
Trade, Hotels
& restaurants
Banking and Insurance
Real estates, Ownership of Dwelling &
Business Ser-vices
Public Adminis-tration
Other Services Total
1 Bangarpet 8.67 15.92 5.64 8.96 19.16 5.18 13.79 -2.30 13.16 10.80
2 Kolar 8.66 17.22 16.38 8.97 24.28 5.18 14.45 -2.30 9.12 11.95
3 Malur 8.69 17.80 - 8.97 11.35 5.17 14.68 -2.30 8.96 9.42
4 Mulbagal - 21.12 14.87 8.97 6.91 5.17 13.99 -2.29 11.37 10.01
5 Srinivaspur - 17.08 - 8.96 -6.92 5.21 14.87 - 7.37 5.17
6 Total 8.68 17.52 13.21 8.96 9.79 5.18 14.30 -2.30 10.68 10.04
Table 58. Taluk-wise CAGR of Kolar’s economic sectors
Sl. No Particulars
GDDP for the year 2004-05 at Current Prices GDDP for the year 2008-09 at Current Prices CAGR (%)
on GTDPPrimary sector
Secondary sector
Tertiary sector Total (GTDP) Primary
sectorSecondary
sectorTertiary sector Total (GTDP)
1 Bangarpet 30207.7 51363.0 45526.0 127097 24365.4 89754.0 76027.0 190146 8.39
2 Kolar 5759.7 18228.0 44297.0 68285 33525.9 22879.0 77908.0 134313 14.49
3 Malur 28625.4 10523.0 27496.0 66644 21659.0 21013.0 43135.0 85807 5.18
4 Mulbagal 44068.7 16196.0 27159.0 87424 50156.4 34047.0 43769.0 127972 7.92
5 Srinivaspur 37000.5 4303.0 23538.0 64841 49784.3 8345.0 30289.0 88418 6.40
Total 145662.0 100613.0 168016.0 414290 179491.0 176038.0 271128.0 626657 8.63
Karnataka state 3309593 4816549 8506403 16632548 5476376 8983274 16299999 30759652 13.08
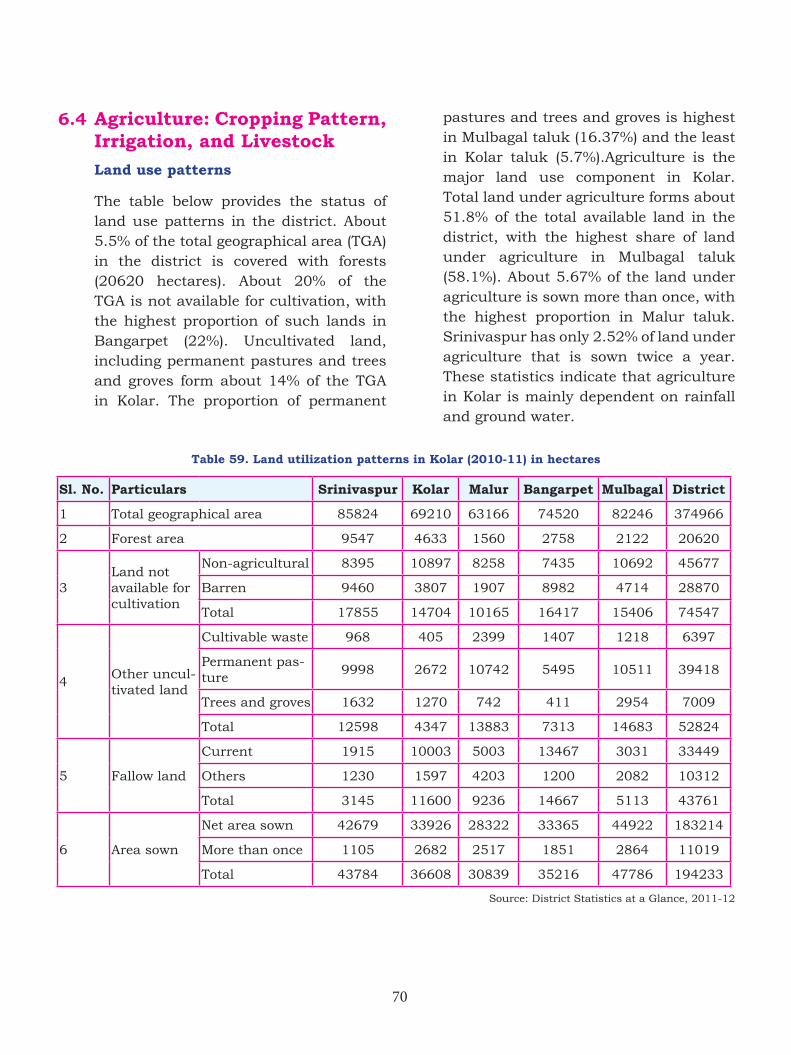
70
6.4 Agriculture: Cropping Pattern, Irrigation, and Livestock
Land use patterns
The table below provides the status of land use patterns in the district. About 5.5% of the total geographical area (TGA) in the district is covered with forests (20620 hectares). About 20% of the TGA is not available for cultivation, with the highest proportion of such lands in Bangarpet (22%). Uncultivated land, including permanent pastures and trees and groves form about 14% of the TGA in Kolar. The proportion of permanent
pastures and trees and groves is highest in Mulbagal taluk (16.37%) and the least in Kolar taluk (5.7%).Agriculture is the major land use component in Kolar. Total land under agriculture forms about 51.8% of the total available land in the district, with the highest share of land under agriculture in Mulbagal taluk (58.1%). About 5.67% of the land under agriculture is sown more than once, with the highest proportion in Malur taluk. Srinivaspur has only 2.52% of land under agriculture that is sown twice a year. These statistics indicate that agriculture in Kolar is mainly dependent on rainfall and ground water.
Table 59. Land utilization patterns in Kolar (2010-11) in hectares
Sl. No. Particulars Srinivaspur Kolar Malur Bangarpet Mulbagal District
1 Total geographical area 85824 69210 63166 74520 82246 374966
2 Forest area 9547 4633 1560 2758 2122 20620
3Land not available for cultivation
Non-agricultural 8395 10897 8258 7435 10692 45677
Barren 9460 3807 1907 8982 4714 28870
Total 17855 14704 10165 16417 15406 74547
4Other uncul-tivated land
Cultivable waste 968 405 2399 1407 1218 6397
Permanent pas-ture
9998 2672 10742 5495 10511 39418
Trees and groves 1632 1270 742 411 2954 7009
Total 12598 4347 13883 7313 14683 52824
5 Fallow land
Current 1915 10003 5003 13467 3031 33449
Others 1230 1597 4203 1200 2082 10312
Total 3145 11600 9236 14667 5113 43761
6 Area sown
Net area sown 42679 33926 28322 33365 44922 183214
More than once 1105 2682 2517 1851 2864 11019
Total 43784 36608 30839 35216 47786 194233
Source: District Statistics at a Glance, 2011-12
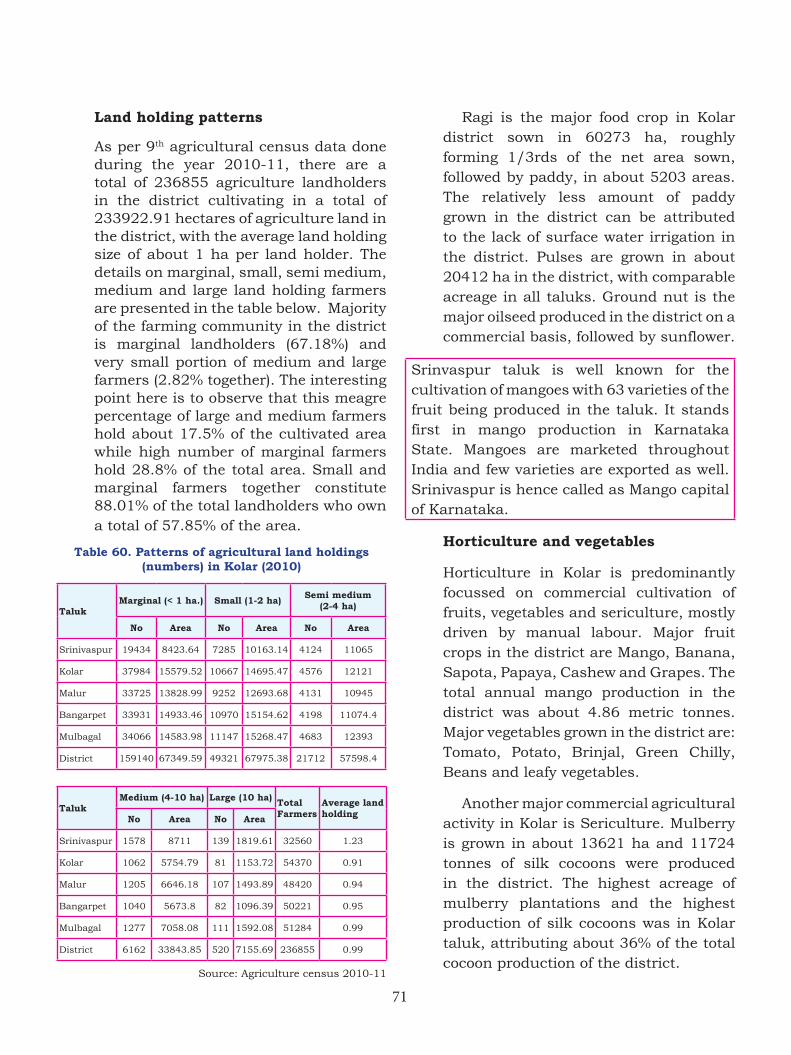
71
Land holding patterns
As per 9th agricultural census data done during the year 2010-11, there are a total of 236855 agriculture landholders in the district cultivating in a total of 233922.91 hectares of agriculture land in the district, with the average land holding size of about 1 ha per land holder. The details on marginal, small, semi medium, medium and large land holding farmers are presented in the table below. Majority of the farming community in the district is marginal landholders (67.18%) and very small portion of medium and large farmers (2.82% together). The interesting point here is to observe that this meagre percentage of large and medium farmers hold about 17.5% of the cultivated area while high number of marginal farmers hold 28.8% of the total area. Small and marginal farmers together constitute 88.01% of the total landholders who own a total of 57.85% of the area.
Table 60. Patterns of agricultural land holdings (numbers) in Kolar (2010)
Taluk Marginal (< 1 ha.) Small (1-2 ha) Semi medium
(2-4 ha)
No Area No Area No Area
Srinivaspur 19434 8423.64 7285 10163.14 4124 11065
Kolar 37984 15579.52 10667 14695.47 4576 12121
Malur 33725 13828.99 9252 12693.68 4131 10945
Bangarpet 33931 14933.46 10970 15154.62 4198 11074.4
Mulbagal 34066 14583.98 11147 15268.47 4683 12393
District 159140 67349.59 49321 67975.38 21712 57598.4
Taluk Medium (4-10 ha) Large (10 ha) Total
FarmersAverage land holdingNo Area No Area
Srinivaspur 1578 8711 139 1819.61 32560 1.23
Kolar 1062 5754.79 81 1153.72 54370 0.91
Malur 1205 6646.18 107 1493.89 48420 0.94
Bangarpet 1040 5673.8 82 1096.39 50221 0.95
Mulbagal 1277 7058.08 111 1592.08 51284 0.99
District 6162 33843.85 520 7155.69 236855 0.99
Source: Agriculture census 2010-11
Ragi is the major food crop in Kolar district sown in 60273 ha, roughly forming 1/3rds of the net area sown, followed by paddy, in about 5203 areas. The relatively less amount of paddy grown in the district can be attributed to the lack of surface water irrigation in the district. Pulses are grown in about 20412 ha in the district, with comparable acreage in all taluks. Ground nut is the major oilseed produced in the district on a commercial basis, followed by sunflower.
Srinvaspur taluk is well known for the cultivation of mangoes with 63 varieties of the fruit being produced in the taluk. It stands first in mango production in Karnataka State. Mangoes are marketed throughout India and few varieties are exported as well. Srinivaspur is hence called as Mango capital of Karnataka.
Horticulture and vegetables
Horticulture in Kolar is predominantly focussed on commercial cultivation of fruits, vegetables and sericulture, mostly driven by manual labour. Major fruit crops in the district are Mango, Banana, Sapota, Papaya, Cashew and Grapes. The total annual mango production in the district was about 4.86 metric tonnes. Major vegetables grown in the district are: Tomato, Potato, Brinjal, Green Chilly, Beans and leafy vegetables.
Another major commercial agricultural activity in Kolar is Sericulture. Mulberry is grown in about 13621 ha and 11724 tonnes of silk cocoons were produced in the district. The highest acreage of mulberry plantations and the highest production of silk cocoons was in Kolar taluk, attributing about 36% of the total cocoon production of the district.
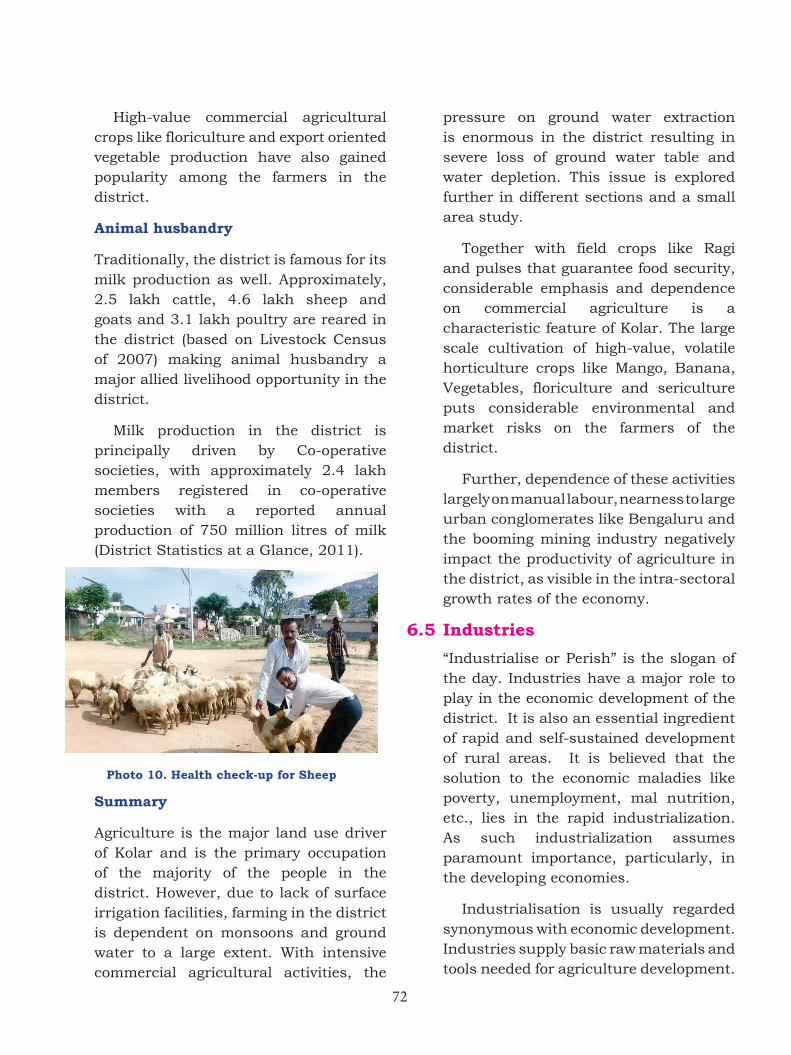
72
High-value commercial agricultural crops like floriculture and export oriented vegetable production have also gained popularity among the farmers in the district.
Animal husbandry
Traditionally, the district is famous for its milk production as well. Approximately, 2.5 lakh cattle, 4.6 lakh sheep and goats and 3.1 lakh poultry are reared in the district (based on Livestock Census of 2007) making animal husbandry a major allied livelihood opportunity in the district.
Milk production in the district is principally driven by Co-operative societies, with approximately 2.4 lakh members registered in co-operative societies with a reported annual production of 750 million litres of milk (District Statistics at a Glance, 2011).
Photo 10. Health check-up for Sheep
Summary
Agriculture is the major land use driver of Kolar and is the primary occupation of the majority of the people in the district. However, due to lack of surface irrigation facilities, farming in the district is dependent on monsoons and ground water to a large extent. With intensive commercial agricultural activities, the
pressure on ground water extraction is enormous in the district resulting in severe loss of ground water table and water depletion. This issue is explored further in different sections and a small area study.
Together with field crops like Ragi and pulses that guarantee food security, considerable emphasis and dependence on commercial agriculture is a characteristic feature of Kolar. The large scale cultivation of high-value, volatile horticulture crops like Mango, Banana, Vegetables, floriculture and sericulture puts considerable environmental and market risks on the farmers of the district.
Further, dependence of these activities largely on manual labour, nearness to large urban conglomerates like Bengaluru and the booming mining industry negatively impact the productivity of agriculture in the district, as visible in the intra-sectoral growth rates of the economy.
6.5 Industries
“Industrialise or Perish” is the slogan of the day. Industries have a major role to play in the economic development of the district. It is also an essential ingredient of rapid and self-sustained development of rural areas. It is believed that the solution to the economic maladies like poverty, unemployment, mal nutrition, etc., lies in the rapid industrialization. As such industrialization assumes paramount importance, particularly, in the developing economies.
Industrialisation is usually regarded synonymous with economic development. Industries supply basic raw materials and tools needed for agriculture development.
73
Agriculture meets the growing needs for raw materials in industries. Therefore, a close collaboration between industry and agriculture is needed for rapid economic development of a region. It helps industry and agriculture take benefit of their mutual existence. The complimentary of the two sectors make the pace of economic development rapid and cumulative. As such the programme of industrialization must give due consideration to the development of rural areas.
Kolar district has not made much headway in industrial development, specifically in comparison to other districts of the state. It lags behind other industrialized districts like Bengaluru (Urban), Mysuru, Dharwar, Dakshina Kannada and Belagavi district. Even though the taluk is endowed with rich agricultural, mineral and horticultural resources, their potentialities have not been properly harnessed for industrial purposes. This slow pace of industrialization is also due to inadequate industrial infrastructural facilities. The other major factors attributed for lack of industrial development in the district is the absence of large and medium scale industries, which are capable of promoting various ancillary and tiny small scale enterprises in the district.
In 2011, 234 registered factories were present in the district, employing 26710 people, the highest density of which was found in Bangarpet taluk. Srinivaspur and Mulbagal had the least amount of registered industries (2 and 7 respectively) in the district. There were only 2 medium scale industries registered in the district. There were no large scale industry registered in the district.A total of 8408 small scale industries have
been registered, providing employment to 52396 people, of which about 64% work in trade, hotel and transportation services. Other industries in the district include silk processing units, flour mills, textiles, general engineering, bricks and tiles, leather processing industries and automobile service units. There are 5 industrial estates in the district, consisting a total of 112 sheds and 118 industrial plots.
Although Kolar is endowed with natural and human resources, industrialization in the district hasn’t progressed at the pace visible in other districts of the state. There is immense scope for development of agriculture based enterprises that can add value to the agricultural products of the district. The presence of international airport at Devanahalli, Bengaluru is a boon for exporting value added agricultural products, which should be utilized to the fullest by the district. The international demand for cut flowers will offer excellent opportunities for establishing floriculture projects in the district. Similarly, Kolar has immense potential for producing value added dairy based products due to its high production of milk
Further, small scale industries like Agarbatthi, decorative candle making and handloom and artistic articles that have higher demand in nearby districts like Bengaluru can assure employment and economic development for several artisans and traditional skilled workers of the district. There is immense scope for setting up of electronic units, mechanical components, software and hardware production centres and bio-technology parks in the district. Good opportunities for post- cocoon activities like reeling, twisting, weaving, dyeing, printing, etc. exist in the district due the largescale
74
cultivation of mulberry and silk worms in the district. The following sections provide a glance of existing industrial areas in Kolar.
Major industries/industrial areas in the district:
1. Bharth Earth Movers Limited (BEML): The government of India started this PSU unit for defense related earth movers, vehicle and Metro coaches manufacturing.
2. Indian Railway: Coach Manufacturing unit granted for Kolar district in railway budget 2012. The government of Karnataka provided two places: in Kurudumale Mulbagal Taluk and Srinivaspur Taluk for setting up the manufacture unit.
3. Power Grid Corporation of India has substation at Arahalli Village, Kolar-Chintamani-State Highway-5, Kolar.
4. All India Mission Tablet Industry at Bangarpet.
Famous trading markets
1. Tomato trading market at Vadahalli, Mulbagal Taluk
2. Kolar Sericulture and Agriculture (tomato and other vegetables) market at Kondarajanahalli (Malur - Bengaluru road), Kolar Taluk
3. Mango trading market at Srinivaspur
4. Jewellery shops at Kolar Gold Fields
Narasapura Industrial Area: Narasapura Industrial Area, Narasapura in Kolar taluk will become a hub for many automobile and aerospace companies setting up their manufacture unit here. Many multinational companies are also expected to establish their units in this industrial area.
6.6 Mining and Minerals
Kolar is rich in mineral resources. Black granite, building stone deposits, curb and rock stones are available in large quantity in the district. There are a few industrial units engaged in the district that prepare these resources for exporting to European countries through Chennai harbour. In view of this, there is immense scope for establishing export oriented curb stone units in the district. As officials agreed informally, curbing illegal quarrying and mining activities will not only restore ecological balance, but also help in building the state exchequer in the district.
The taluk is well connected with bus and train facilities. The nearest sea port is at Mangaluru and Chennai. These Ports provide a gateway for export and import trade throughout the year. The nearest airport to the Taluk is Bengaluru, Mangaluru, Hyderabad and Chennai. The communication facilities in the Taluk through Telephones and mobiles, post and courier services have made an easy access to Industrial Development.
6.7 Poverty alleviation
BPL Households
Large numbers of India’s poorest people live in the country’s semi-arid tropical region. In this area shortages of water and recurrent droughts impede the transformation of agriculture that the Green Revolution has achieved elsewhere. Hence the continued presence of poverty means that creating social security measures is an important aspect of alleviating poverty. Although the number of BPL cards is not an accurate indication of below poverty households in an area
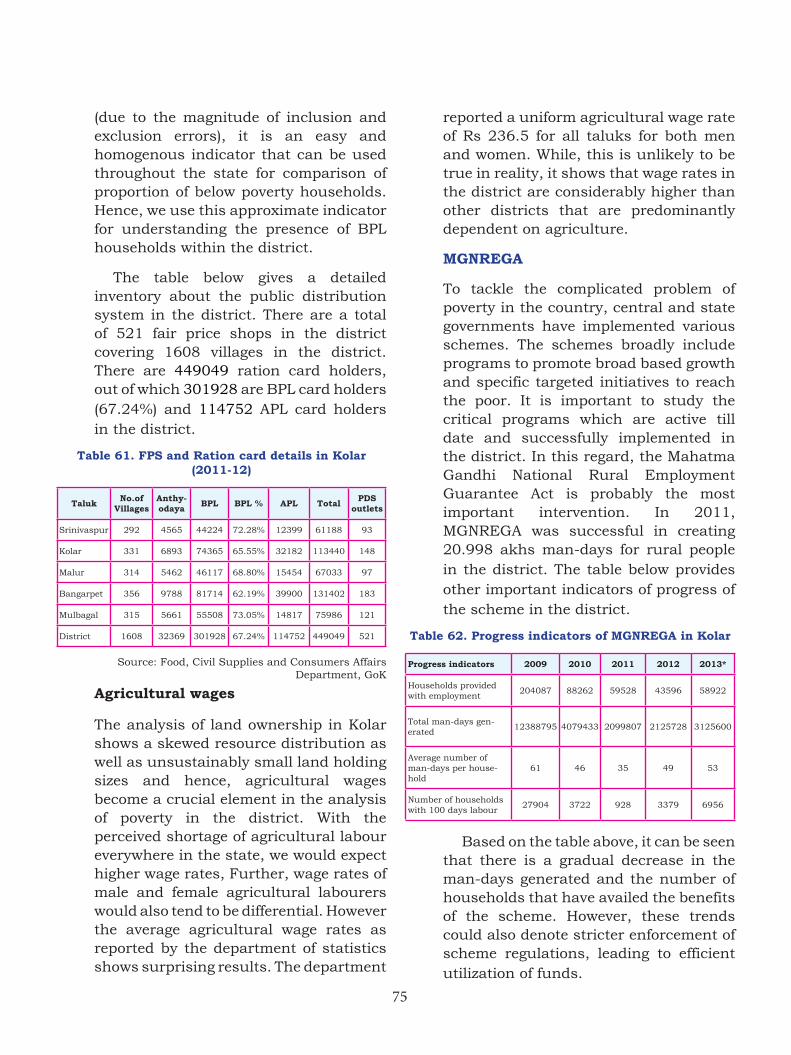
75
(due to the magnitude of inclusion and exclusion errors), it is an easy and homogenous indicator that can be used throughout the state for comparison of proportion of below poverty households. Hence, we use this approximate indicator for understanding the presence of BPL households within the district.
The table below gives a detailed inventory about the public distribution system in the district. There are a total of 521 fair price shops in the district covering 1608 villages in the district. There are 449049 ration card holders, out of which 301928 are BPL card holders (67.24%) and 114752 APL card holders in the district.
Table 61. FPS and Ration card details in Kolar (2011-12)
Taluk No.of Villages
Anthy-odaya BPL BPL % APL Total PDS
outlets
Srinivaspur 292 4565 44224 72.28% 12399 61188 93
Kolar 331 6893 74365 65.55% 32182 113440 148
Malur 314 5462 46117 68.80% 15454 67033 97
Bangarpet 356 9788 81714 62.19% 39900 131402 183
Mulbagal 315 5661 55508 73.05% 14817 75986 121
District 1608 32369 301928 67.24% 114752 449049 521
Source: Food, Civil Supplies and Consumers Affairs Department, GoK
Agricultural wages
The analysis of land ownership in Kolar shows a skewed resource distribution as well as unsustainably small land holding sizes and hence, agricultural wages become a crucial element in the analysis of poverty in the district. With the perceived shortage of agricultural labour everywhere in the state, we would expect higher wage rates, Further, wage rates of male and female agricultural labourers would also tend to be differential. However the average agricultural wage rates as reported by the department of statistics shows surprising results. The department
reported a uniform agricultural wage rate of Rs 236.5 for all taluks for both men and women. While, this is unlikely to be true in reality, it shows that wage rates in the district are considerably higher than other districts that are predominantly dependent on agriculture.
MGNREGA
To tackle the complicated problem of poverty in the country, central and state governments have implemented various schemes. The schemes broadly include programs to promote broad based growth and specific targeted initiatives to reach the poor. It is important to study the critical programs which are active till date and successfully implemented in the district. In this regard, the Mahatma Gandhi National Rural Employment Guarantee Act is probably the most important intervention. In 2011, MGNREGA was successful in creating 20.998 akhs man-days for rural people in the district. The table below provides other important indicators of progress of the scheme in the district.
Table 62. Progress indicators of MGNREGA in Kolar
Progress indicators 2009 2010 2011 2012 2013*
Households provided with employment
204087 88262 59528 43596 58922
Total man-days gen-erated
12388795 4079433 2099807 2125728 3125600
Average number of man-days per house-hold
61 46 35 49 53
Number of households with 100 days labour
27904 3722 928 3379 6956
Based on the table above, it can be seen that there is a gradual decrease in the man-days generated and the number of households that have availed the benefits of the scheme. However, these trends could also denote stricter enforcement of scheme regulations, leading to efficient utilization of funds.
76
6.8 Employment and Unemployment
Employment can be defined as the means to secure livelihood entitlement, a crucial link between the growth and human development. The meaning of the term ‘Growth’ is complete when it gets translated into real employment opportunities and empowerment of people to improve their earning power. Employment has a very important role to play in enhancing human capabilities. In a developing country situation, most poor have access to only asset i.e. labour. Therefore expansion of productive employment is crucial for sustained poverty reduction in the country. Employment not only ensures economic security, but also promotes general participation in society and the economy. Employment is necessary for promoting better health and education not only for those who are employed, but also for those who are dependent on them. The need to attain the objective of inclusive growth through productively and gainfully employing its growing labor force is therefore widely regarded as one
of the challenges of human development.
Therefore, this section of the chapter
deals with investigating the situation of
employment opportunities and to analyze
the magnitude of unemployment in the
district.
Employment is a relationship between
two parties, usually based on a formal or
informal contract, one being the employer
and the other being the employee. There
exist various forms of employment which
deviates from the default definition of
the employment. They can be classified
under four different categories like,
· The paid employees, Employees are those who are in employment and are paid a wage by an employer for the work they do. This category may be further sub-divided into permanent and temporary employees11.
· The self-employed are defined as those who, in their main job, work on their own account, whether or not they have employees.
· Unpaid family workers are those whose work contributes directly to a business, owned or operated either by themselves or by a relative, but who receive no pay or profits for this work.
· Participants in Government-supported training schemes. People on the government-supported training schemes include those getting work experiences with an employer and those wholly engaged in training. The total number of people in employment is analyzed whether they work full or part-time.
Trends in work participation
The most observed universal trend is employment opportunities are created in linear growth thereby leading to a lot of unemployment, under-employment and disguised employment which is opposite to the rate of population growth (logistic growth). The case of Kolar district is no different to this trend. The decadal population growth rate (2001-
11 Temporary workers are those employees who say that their main job is not permanent in one of the following ways: fixed period contract, agency tempting, casual work, seasonal or other temporary work. This is also based on respondents’ self-assessment. Data on people’s reasons for engaging in part-time and temporary work provide information on the number of people who could not find full-time or permanent employment.
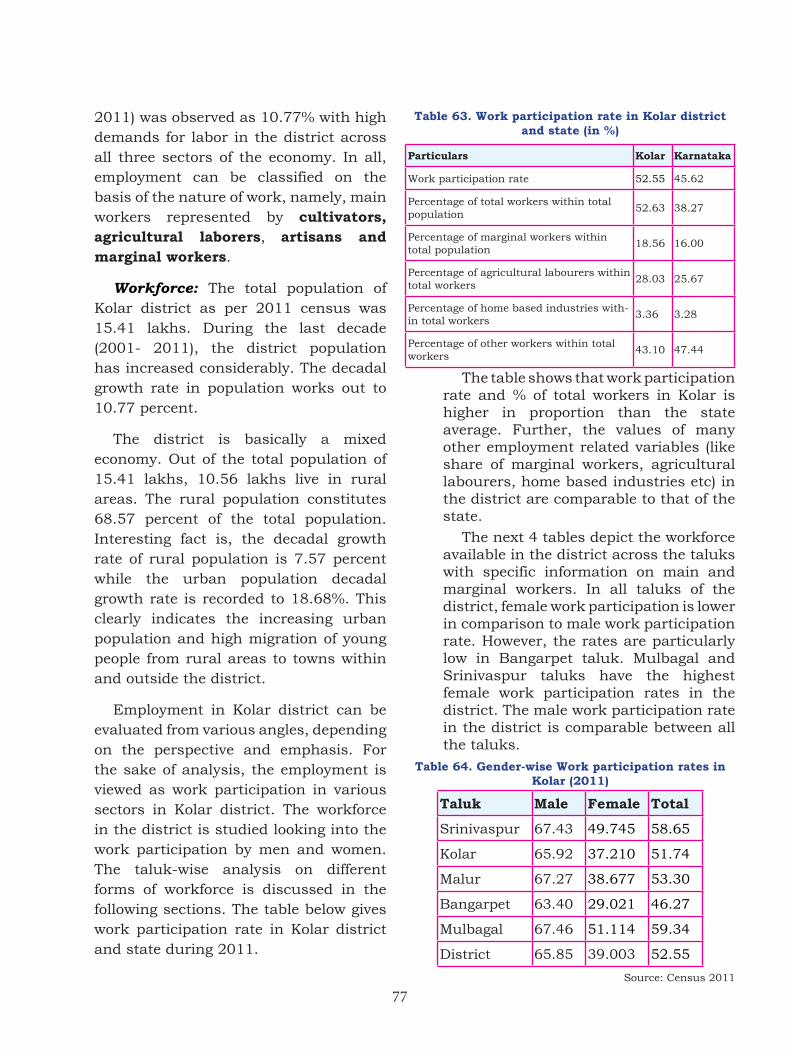
77
2011) was observed as 10.77% with high demands for labor in the district across all three sectors of the economy. In all, employment can be classified on the basis of the nature of work, namely, main workers represented by cultivators, agricultural laborers, artisans and marginal workers.
Workforce: The total population of Kolar district as per 2011 census was 15.41 lakhs. During the last decade (2001- 2011), the district population has increased considerably. The decadal growth rate in population works out to 10.77 percent.
The district is basically a mixed economy. Out of the total population of 15.41 lakhs, 10.56 lakhs live in rural areas. The rural population constitutes 68.57 percent of the total population. Interesting fact is, the decadal growth rate of rural population is 7.57 percent while the urban population decadal growth rate is recorded to 18.68%. This clearly indicates the increasing urban population and high migration of young people from rural areas to towns within and outside the district.
Employment in Kolar district can be evaluated from various angles, depending on the perspective and emphasis. For the sake of analysis, the employment is viewed as work participation in various sectors in Kolar district. The workforce in the district is studied looking into the work participation by men and women. The taluk-wise analysis on different forms of workforce is discussed in the following sections. The table below gives work participation rate in Kolar district and state during 2011.
Table 63. Work participation rate in Kolar district and state (in %)
Particulars Kolar Karnataka
Work participation rate 52.55 45.62
Percentage of total workers within total population
52.63 38.27
Percentage of marginal workers within total population
18.56 16.00
Percentage of agricultural labourers within total workers
28.03 25.67
Percentage of home based industries with-in total workers
3.36 3.28
Percentage of other workers within total workers
43.10 47.44
The table shows that work participation rate and % of total workers in Kolar is higher in proportion than the state average. Further, the values of many other employment related variables (like share of marginal workers, agricultural labourers, home based industries etc) in the district are comparable to that of the state.
The next 4 tables depict the workforce available in the district across the taluks with specific information on main and marginal workers. In all taluks of the district, female work participation is lower in comparison to male work participation rate. However, the rates are particularly low in Bangarpet taluk. Mulbagal and Srinivaspur taluks have the highest female work participation rates in the district. The male work participation rate in the district is comparable between all the taluks.
Table 64. Gender-wise Work participation rates in Kolar (2011)
Taluk Male Female Total
Srinivaspur 67.43 49.745 58.65
Kolar 65.92 37.210 51.74
Malur 67.27 38.677 53.30
Bangarpet 63.40 29.021 46.27
Mulbagal 67.46 51.114 59.34
District 65.85 39.003 52.55
Source: Census 2011
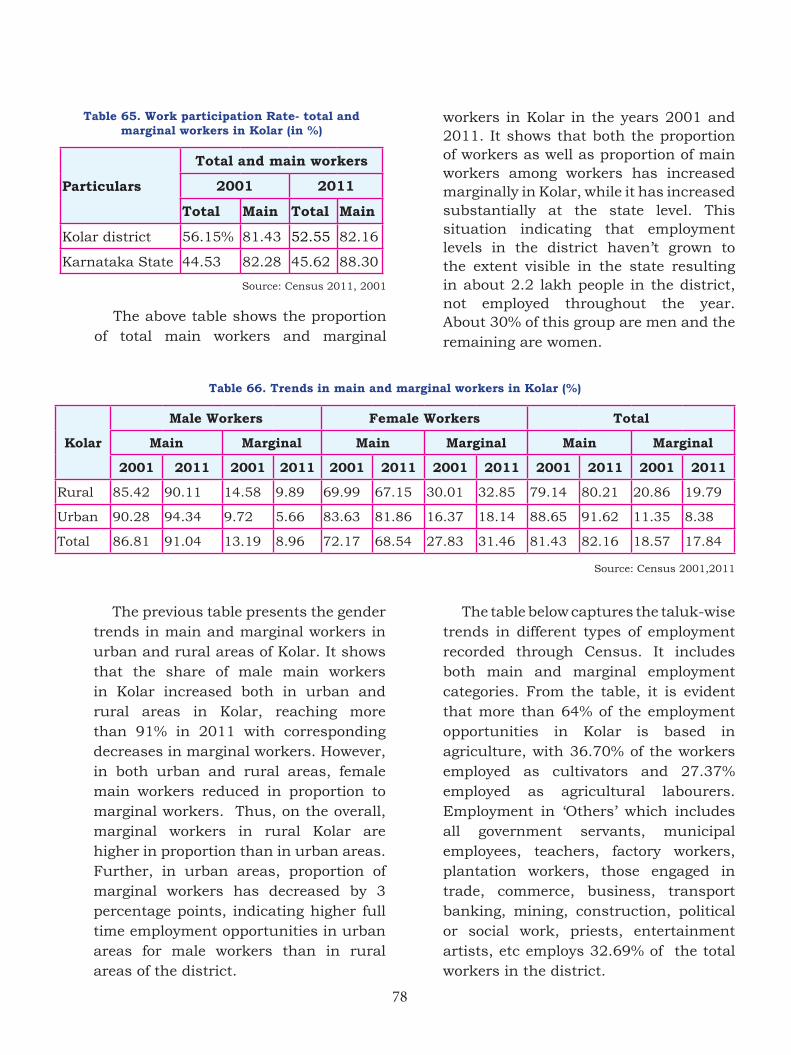
78
Table 65. Work participation Rate- total and marginal workers in Kolar (in %)
Particulars
Total and main workers
2001 2011
Total Main Total Main
Kolar district 56.15% 81.43 52.55 82.16
Karnataka State 44.53 82.28 45.62 88.30
Source: Census 2011, 2001
The above table shows the proportion of total main workers and marginal
workers in Kolar in the years 2001 and 2011. It shows that both the proportion of workers as well as proportion of main workers among workers has increased marginally in Kolar, while it has increased substantially at the state level. This situation indicating that employment levels in the district haven’t grown to the extent visible in the state resulting in about 2.2 lakh people in the district, not employed throughout the year. About 30% of this group are men and the remaining are women.
Table 66. Trends in main and marginal workers in Kolar (%)
Kolar
Male Workers Female Workers Total
Main Marginal Main Marginal Main Marginal
2001 2011 2001 2011 2001 2011 2001 2011 2001 2011 2001 2011
Rural 85.42 90.11 14.58 9.89 69.99 67.15 30.01 32.85 79.14 80.21 20.86 19.79
Urban 90.28 94.34 9.72 5.66 83.63 81.86 16.37 18.14 88.65 91.62 11.35 8.38
Total 86.81 91.04 13.19 8.96 72.17 68.54 27.83 31.46 81.43 82.16 18.57 17.84
Source: Census 2001,2011
The previous table presents the gender trends in main and marginal workers in urban and rural areas of Kolar. It shows that the share of male main workers in Kolar increased both in urban and rural areas in Kolar, reaching more than 91% in 2011 with corresponding decreases in marginal workers. However, in both urban and rural areas, female main workers reduced in proportion to marginal workers. Thus, on the overall, marginal workers in rural Kolar are higher in proportion than in urban areas. Further, in urban areas, proportion of marginal workers has decreased by 3 percentage points, indicating higher full time employment opportunities in urban areas for male workers than in rural areas of the district.
The table below captures the taluk-wise trends in different types of employment recorded through Census. It includes both main and marginal employment categories. From the table, it is evident that more than 64% of the employment opportunities in Kolar is based in agriculture, with 36.70% of the workers employed as cultivators and 27.37% employed as agricultural labourers. Employment in ‘Others’ which includes all government servants, municipal employees, teachers, factory workers, plantation workers, those engaged in trade, commerce, business, transport banking, mining, construction, political or social work, priests, entertainment artists, etc employs 32.69% of the total workers in the district.
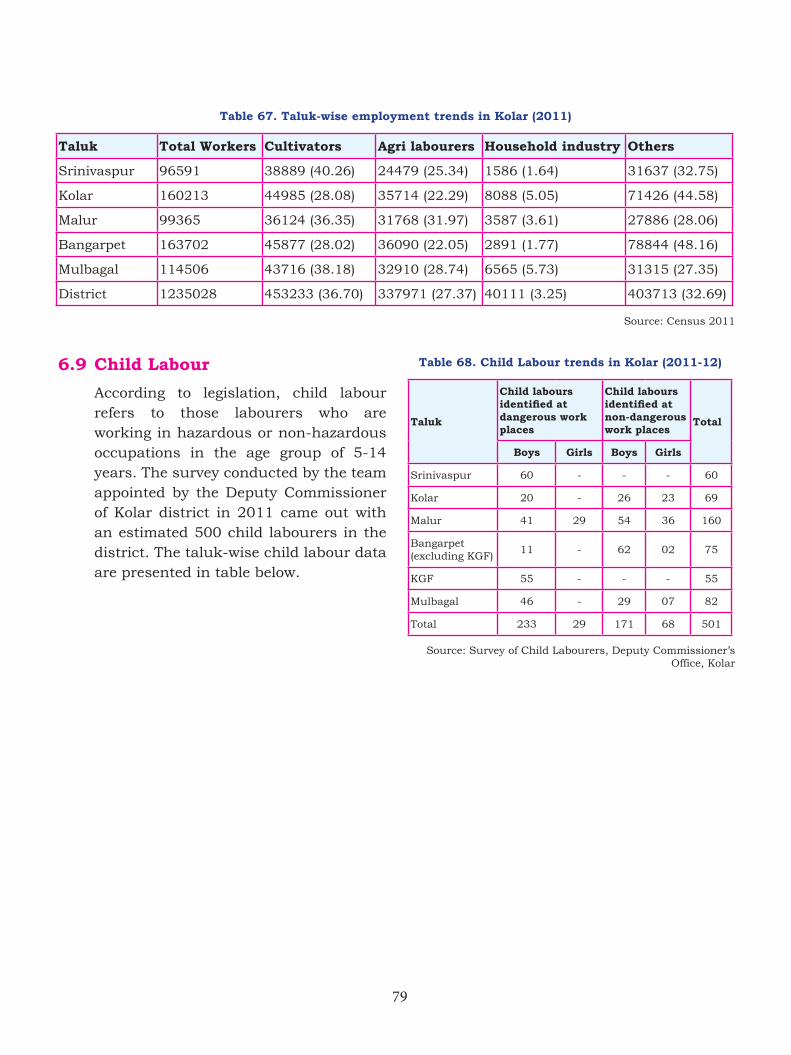
79
6.9 Child Labour
According to legislation, child labour refers to those labourers who are working in hazardous or non-hazardous occupations in the age group of 5-14 years. The survey conducted by the team appointed by the Deputy Commissioner of Kolar district in 2011 came out with an estimated 500 child labourers in the district. The taluk-wise child labour data are presented in table below.
Table 67. Taluk-wise employment trends in Kolar (2011)
Taluk Total Workers Cultivators Agri labourers Household industry Others
Srinivaspur 96591 38889 (40.26) 24479 (25.34) 1586 (1.64) 31637 (32.75)
Kolar 160213 44985 (28.08) 35714 (22.29) 8088 (5.05) 71426 (44.58)
Malur 99365 36124 (36.35) 31768 (31.97) 3587 (3.61) 27886 (28.06)
Bangarpet 163702 45877 (28.02) 36090 (22.05) 2891 (1.77) 78844 (48.16)
Mulbagal 114506 43716 (38.18) 32910 (28.74) 6565 (5.73) 31315 (27.35)
District 1235028 453233 (36.70) 337971 (27.37) 40111 (3.25) 403713 (32.69)
Source: Census 2011
Table 68. Child Labour trends in Kolar (2011-12)
Taluk
Child labours identifiedatdangerous work places
Child labours identifiedatnon-dangerous work places
Total
Boys Girls Boys Girls
Srinivaspur 60 - - - 60
Kolar 20 - 26 23 69
Malur 41 29 54 36 160
Bangarpet (excluding KGF)
11 - 62 02 75
KGF 55 - - - 55
Mulbagal 46 - 29 07 82
Total 233 29 171 68 501
Source: Survey of Child Labourers, Deputy Commissioner’s Office, Kolar
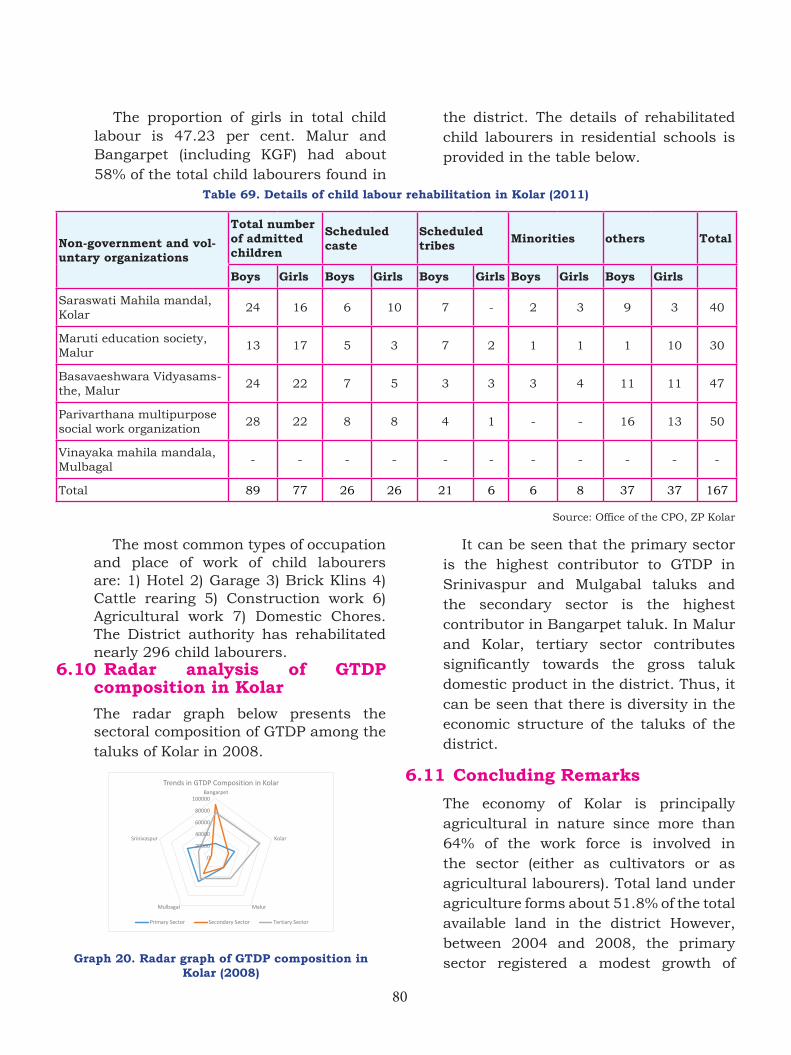
80
The proportion of girls in total child labour is 47.23 per cent. Malur and Bangarpet (including KGF) had about 58% of the total child labourers found in
Table 69. Details of child labour rehabilitation in Kolar (2011)
Non-government and vol-untary organizations
Total number of admitted children
Scheduled caste
Scheduled tribes Minorities others Total
Boys Girls Boys Girls Boys Girls Boys Girls Boys Girls
Saraswati Mahila mandal, Kolar
24 16 6 10 7 - 2 3 9 3 40
Maruti education society, Malur
13 17 5 3 7 2 1 1 1 10 30
Basavaeshwara Vidyasams-the, Malur
24 22 7 5 3 3 3 4 11 11 47
Parivarthana multipurpose social work organization
28 22 8 8 4 1 - - 16 13 50
Vinayaka mahila mandala, Mulbagal
- - - - - - - - - - -
Total 89 77 26 26 21 6 6 8 37 37 167
Source: Office of the CPO, ZP Kolar
the district. The details of rehabilitated child labourers in residential schools is provided in the table below.
The most common types of occupation and place of work of child labourers are: 1) Hotel 2) Garage 3) Brick Klins 4) Cattle rearing 5) Construction work 6) Agricultural work 7) Domestic Chores. The District authority has rehabilitated nearly 296 child labourers.
6.10 Radar analysis of GTDP composition in Kolar
The radar graph below presents the sectoral composition of GTDP among the taluks of Kolar in 2008.
Graph 20. Radar graph of GTDP composition in Kolar (2008)
It can be seen that the primary sector is the highest contributor to GTDP in Srinivaspur and Mulgabal taluks and the secondary sector is the highest contributor in Bangarpet taluk. In Malur and Kolar, tertiary sector contributes significantly towards the gross taluk domestic product in the district. Thus, it can be seen that there is diversity in the economic structure of the taluks of the district.
6.11 Concluding Remarks
The economy of Kolar is principally agricultural in nature since more than 64% of the work force is involved in the sector (either as cultivators or as agricultural labourers). Total land under agriculture forms about 51.8% of the total available land in the district However, between 2004 and 2008, the primary sector registered a modest growth of
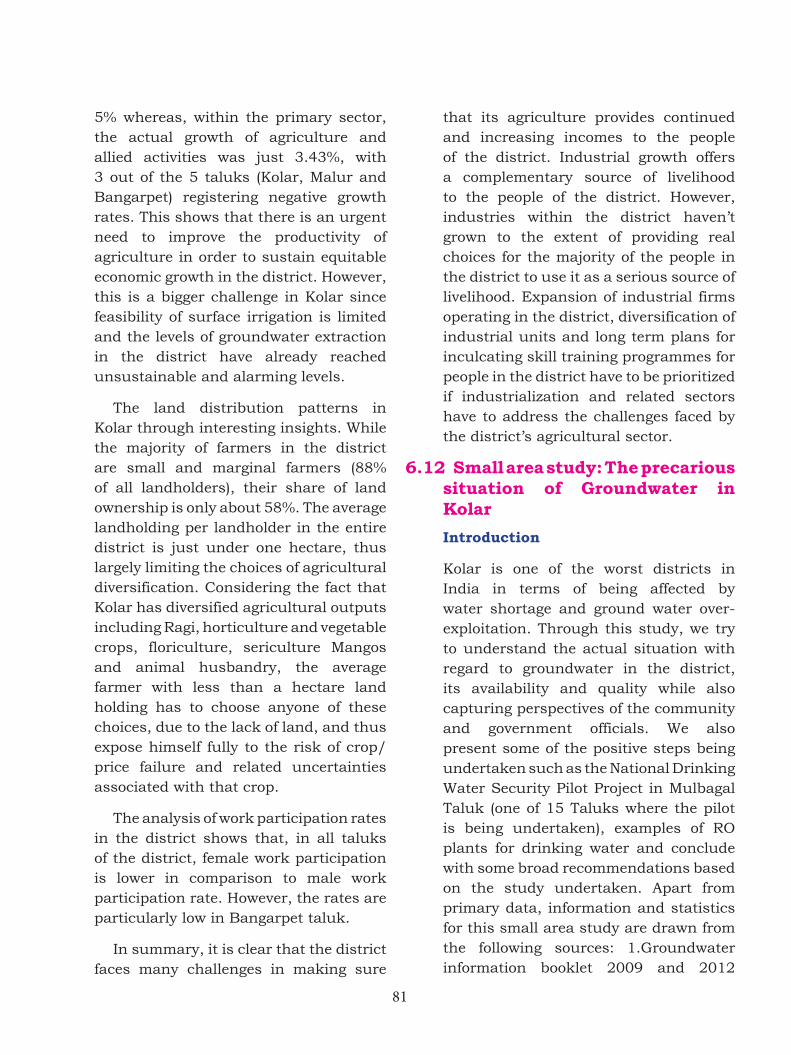
81
5% whereas, within the primary sector, the actual growth of agriculture and allied activities was just 3.43%, with 3 out of the 5 taluks (Kolar, Malur and Bangarpet) registering negative growth rates. This shows that there is an urgent need to improve the productivity of agriculture in order to sustain equitable economic growth in the district. However, this is a bigger challenge in Kolar since feasibility of surface irrigation is limited and the levels of groundwater extraction in the district have already reached unsustainable and alarming levels.
The land distribution patterns in Kolar through interesting insights. While the majority of farmers in the district are small and marginal farmers (88% of all landholders), their share of land ownership is only about 58%. The average landholding per landholder in the entire district is just under one hectare, thus largely limiting the choices of agricultural diversification. Considering the fact that Kolar has diversified agricultural outputs including Ragi, horticulture and vegetable crops, floriculture, sericulture Mangos and animal husbandry, the average farmer with less than a hectare land holding has to choose anyone of these choices, due to the lack of land, and thus expose himself fully to the risk of crop/price failure and related uncertainties associated with that crop.
The analysis of work participation rates in the district shows that, in all taluks of the district, female work participation is lower in comparison to male work participation rate. However, the rates are particularly low in Bangarpet taluk.
In summary, it is clear that the district faces many challenges in making sure
that its agriculture provides continued and increasing incomes to the people of the district. Industrial growth offers a complementary source of livelihood to the people of the district. However, industries within the district haven’t grown to the extent of providing real choices for the majority of the people in the district to use it as a serious source of livelihood. Expansion of industrial firms operating in the district, diversification of industrial units and long term plans for inculcating skill training programmes for people in the district have to be prioritized if industrialization and related sectors have to address the challenges faced by the district’s agricultural sector.
6.12 Small area study: The precarious situation of Groundwater in Kolar
Introduction
Kolar is one of the worst districts in India in terms of being affected by water shortage and ground water over-exploitation. Through this study, we try to understand the actual situation with regard to groundwater in the district, its availability and quality while also capturing perspectives of the community and government officials. We also present some of the positive steps being undertaken such as the National Drinking Water Security Pilot Project in Mulbagal Taluk (one of 15 Taluks where the pilot is being undertaken), examples of RO plants for drinking water and conclude with some broad recommendations based on the study undertaken. Apart from primary data, information and statistics for this small area study are drawn from the following sources: 1.Groundwater information booklet 2009 and 2012
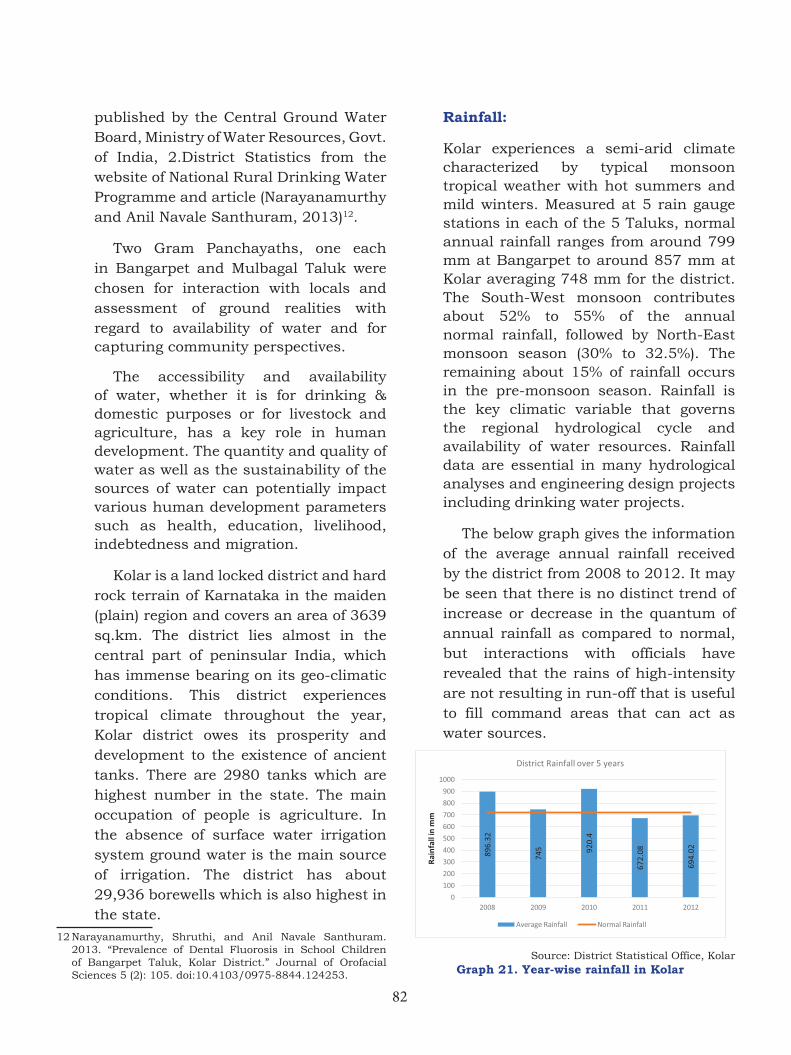
82
published by the Central Ground Water Board, Ministry of Water Resources, Govt. of India, 2.District Statistics from the website of National Rural Drinking Water Programme and article (Narayanamurthy and Anil Navale Santhuram, 2013)12.
Two Gram Panchayaths, one each in Bangarpet and Mulbagal Taluk were chosen for interaction with locals and assessment of ground realities with regard to availability of water and for capturing community perspectives.
The accessibility and availability of water, whether it is for drinking & domestic purposes or for livestock and agriculture, has a key role in human development. The quantity and quality of water as well as the sustainability of the sources of water can potentially impact various human development parameters such as health, education, livelihood, indebtedness and migration.
Kolar is a land locked district and hard rock terrain of Karnataka in the maiden (plain) region and covers an area of 3639 sq.km. The district lies almost in the central part of peninsular India, which has immense bearing on its geo-climatic conditions. This district experiences tropical climate throughout the year, Kolar district owes its prosperity and development to the existence of ancient tanks. There are 2980 tanks which are highest number in the state. The main occupation of people is agriculture. In the absence of surface water irrigation system ground water is the main source of irrigation. The district has about 29,936 borewells which is also highest in the state.
12 Narayanamurthy, Shruthi, and Anil Navale Santhuram. 2013. “Prevalence of Dental Fluorosis in School Children of Bangarpet Taluk, Kolar District.” Journal of Orofacial Sciences 5 (2): 105. doi:10.4103/0975-8844.124253.
Rainfall:
Kolar experiences a semi-arid climate characterized by typical monsoon tropical weather with hot summers and mild winters. Measured at 5 rain gauge stations in each of the 5 Taluks, normal annual rainfall ranges from around 799 mm at Bangarpet to around 857 mm at Kolar averaging 748 mm for the district. The South-West monsoon contributes about 52% to 55% of the annual normal rainfall, followed by North-East monsoon season (30% to 32.5%). The remaining about 15% of rainfall occurs in the pre-monsoon season. Rainfall is the key climatic variable that governs the regional hydrological cycle and availability of water resources. Rainfall data are essential in many hydrological analyses and engineering design projects including drinking water projects.
The below graph gives the information of the average annual rainfall received by the district from 2008 to 2012. It may be seen that there is no distinct trend of increase or decrease in the quantum of annual rainfall as compared to normal, but interactions with officials have revealed that the rains of high-intensity are not resulting in run-off that is useful to fill command areas that can act as water sources.
Source: District Statistical Office, KolarGraph 21. Year-wise rainfall in Kolar
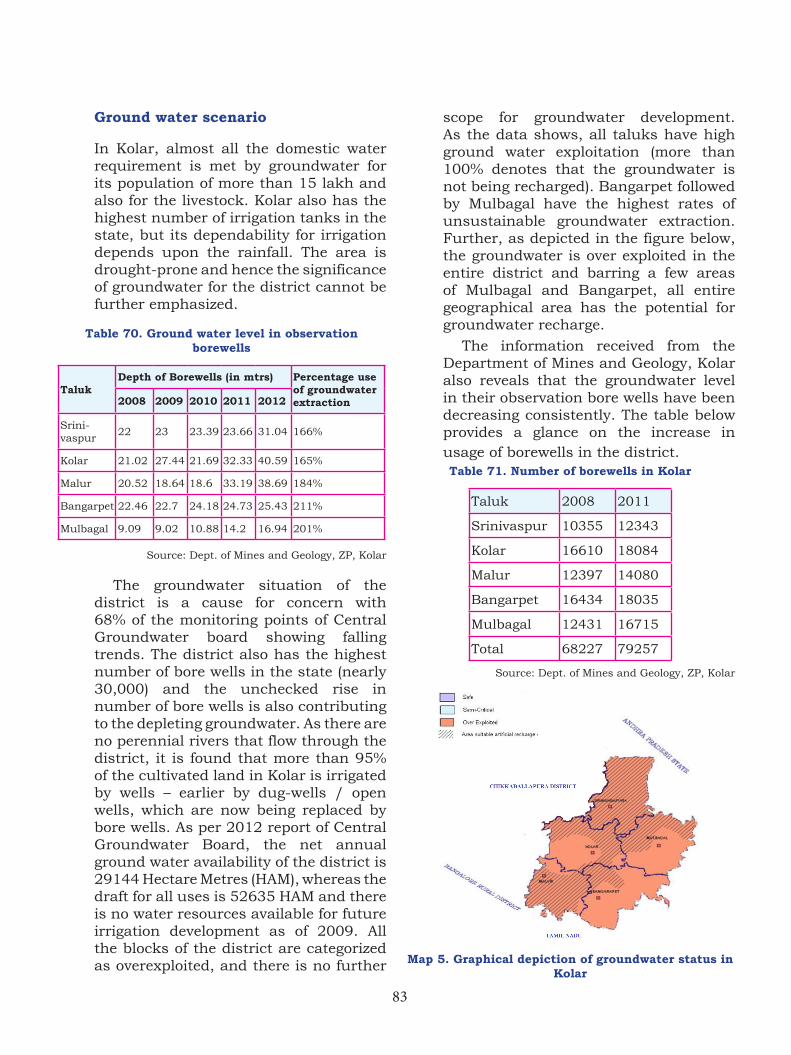
83
Ground water scenario
In Kolar, almost all the domestic water requirement is met by groundwater for its population of more than 15 lakh and also for the livestock. Kolar also has the highest number of irrigation tanks in the state, but its dependability for irrigation depends upon the rainfall. The area is drought-prone and hence the significance of groundwater for the district cannot be further emphasized.
Table 70. Ground water level in observation borewells
TalukDepth of Borewells (in mtrs) Percentage use
of groundwater extraction2008 2009 2010 2011 2012
Srini-vaspur
22 23 23.39 23.66 31.04 166%
Kolar 21.02 27.44 21.69 32.33 40.59 165%
Malur 20.52 18.64 18.6 33.19 38.69 184%
Bangarpet 22.46 22.7 24.18 24.73 25.43 211%
Mulbagal 9.09 9.02 10.88 14.2 16.94 201%
Source: Dept. of Mines and Geology, ZP, Kolar
The groundwater situation of the district is a cause for concern with 68% of the monitoring points of Central Groundwater board showing falling trends. The district also has the highest number of bore wells in the state (nearly 30,000) and the unchecked rise in number of bore wells is also contributing to the depleting groundwater. As there are no perennial rivers that flow through the district, it is found that more than 95% of the cultivated land in Kolar is irrigated by wells – earlier by dug-wells / open wells, which are now being replaced by bore wells. As per 2012 report of Central Groundwater Board, the net annual ground water availability of the district is 29144 Hectare Metres (HAM), whereas the draft for all uses is 52635 HAM and there is no water resources available for future irrigation development as of 2009. All the blocks of the district are categorized as overexploited, and there is no further
scope for groundwater development. As the data shows, all taluks have high ground water exploitation (more than 100% denotes that the groundwater is not being recharged). Bangarpet followed by Mulbagal have the highest rates of unsustainable groundwater extraction. Further, as depicted in the figure below, the groundwater is over exploited in the entire district and barring a few areas of Mulbagal and Bangarpet, all entire geographical area has the potential for groundwater recharge.
The information received from the Department of Mines and Geology, Kolar also reveals that the groundwater level in their observation bore wells have been decreasing consistently. The table below provides a glance on the increase in usage of borewells in the district. Table 71. Number of borewells in Kolar
Taluk 2008 2011
Srinivaspur 10355 12343
Kolar 16610 18084
Malur 12397 14080
Bangarpet 16434 18035
Mulbagal 12431 16715
Total 68227 79257
Source: Dept. of Mines and Geology, ZP, Kolar
Map 5. Graphical depiction of groundwater status in Kolar
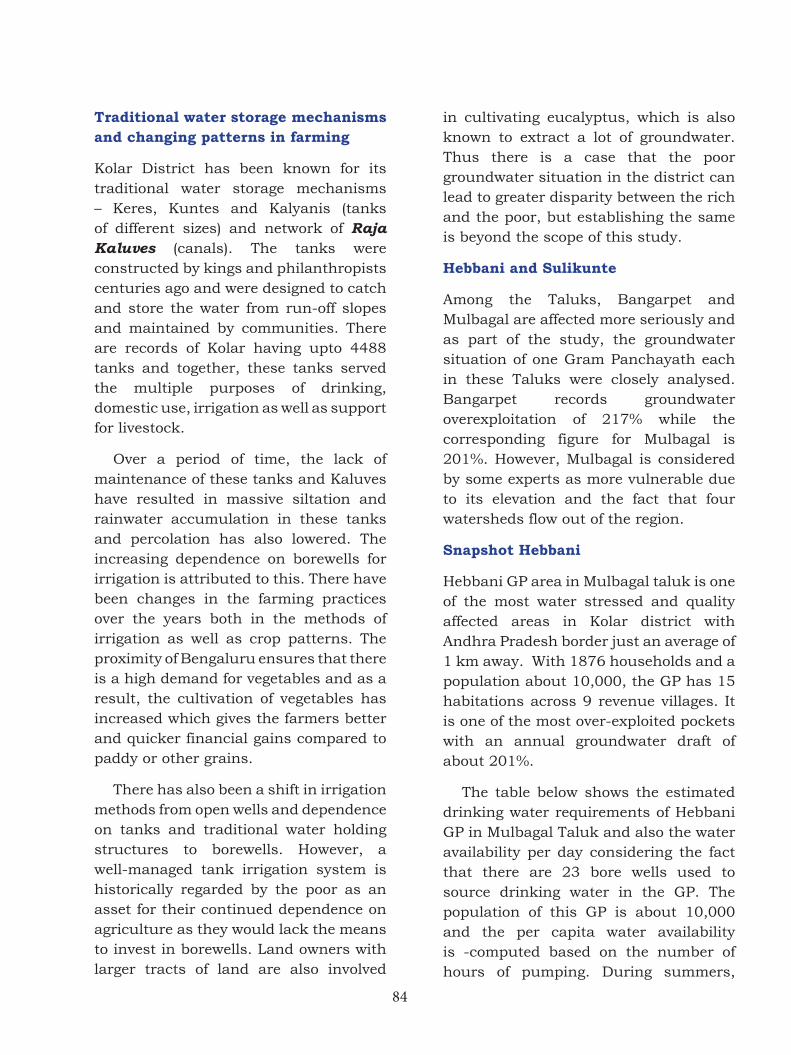
84
Traditional water storage mechanisms and changing patterns in farming
Kolar District has been known for its traditional water storage mechanisms – Keres, Kuntes and Kalyanis (tanks of different sizes) and network of Raja Kaluves (canals). The tanks were constructed by kings and philanthropists centuries ago and were designed to catch and store the water from run-off slopes and maintained by communities. There are records of Kolar having upto 4488 tanks and together, these tanks served the multiple purposes of drinking, domestic use, irrigation as well as support for livestock.
Over a period of time, the lack of maintenance of these tanks and Kaluves have resulted in massive siltation and rainwater accumulation in these tanks and percolation has also lowered. The increasing dependence on borewells for irrigation is attributed to this. There have been changes in the farming practices over the years both in the methods of irrigation as well as crop patterns. The proximity of Bengaluru ensures that there is a high demand for vegetables and as a result, the cultivation of vegetables has increased which gives the farmers better and quicker financial gains compared to paddy or other grains.
There has also been a shift in irrigation methods from open wells and dependence on tanks and traditional water holding structures to borewells. However, a well-managed tank irrigation system is historically regarded by the poor as an asset for their continued dependence on agriculture as they would lack the means to invest in borewells. Land owners with larger tracts of land are also involved
in cultivating eucalyptus, which is also known to extract a lot of groundwater. Thus there is a case that the poor groundwater situation in the district can lead to greater disparity between the rich and the poor, but establishing the same is beyond the scope of this study.
Hebbani and Sulikunte
Among the Taluks, Bangarpet and Mulbagal are affected more seriously and as part of the study, the groundwater situation of one Gram Panchayath each in these Taluks were closely analysed. Bangarpet records groundwater overexploitation of 217% while the corresponding figure for Mulbagal is 201%. However, Mulbagal is considered by some experts as more vulnerable due to its elevation and the fact that four watersheds flow out of the region.
Snapshot Hebbani
Hebbani GP area in Mulbagal taluk is one of the most water stressed and quality affected areas in Kolar district with Andhra Pradesh border just an average of 1 km away. With 1876 households and a population about 10,000, the GP has 15 habitations across 9 revenue villages. It is one of the most over-exploited pockets with an annual groundwater draft of about 201%.
The table below shows the estimated drinking water requirements of Hebbani GP in Mulbagal Taluk and also the water availability per day considering the fact that there are 23 bore wells used to source drinking water in the GP. The population of this GP is about 10,000 and the per capita water availability is -computed based on the number of hours of pumping. During summers,
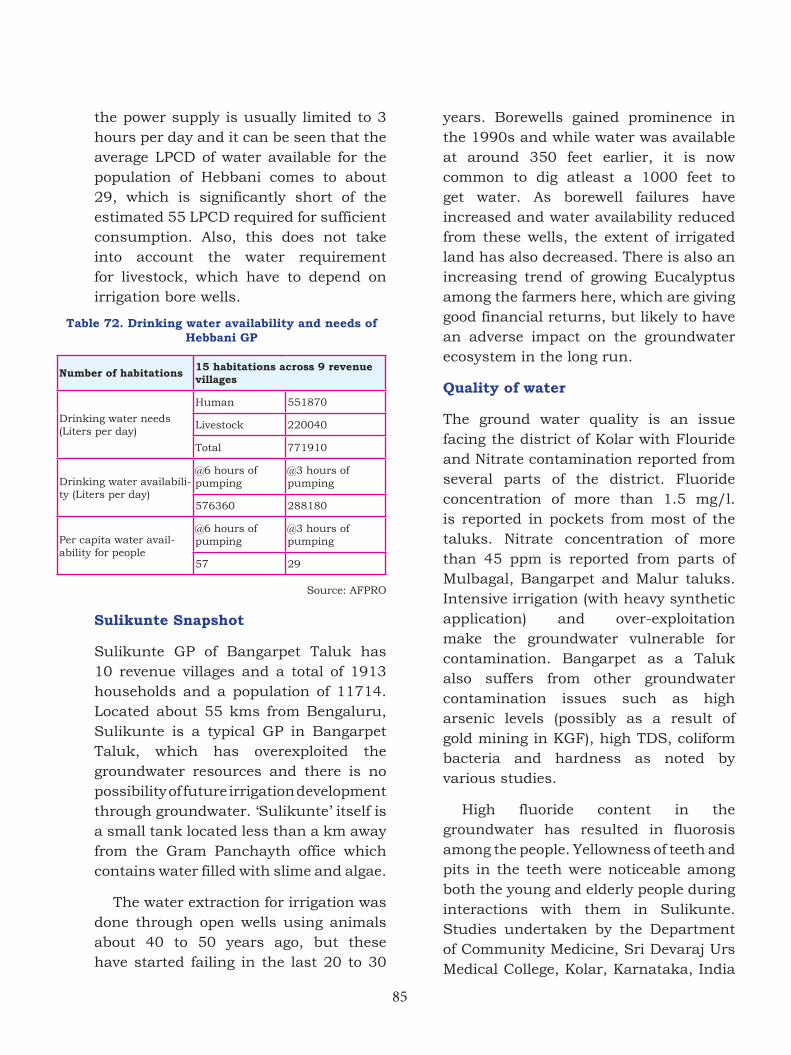
85
the power supply is usually limited to 3 hours per day and it can be seen that the average LPCD of water available for the population of Hebbani comes to about 29, which is significantly short of the estimated 55 LPCD required for sufficient consumption. Also, this does not take into account the water requirement for livestock, which have to depend on irrigation bore wells.
Table 72. Drinking water availability and needs of Hebbani GP
Number of habitations 15 habitations across 9 revenue villages
Drinking water needs (Liters per day)
Human 551870
Livestock 220040
Total 771910
Drinking water availabili-ty (Liters per day)
@6 hours of pumping
@3 hours of pumping
576360 288180
Per capita water avail-ability for people
@6 hours of pumping
@3 hours of pumping
57 29
Source: AFPRO
Sulikunte Snapshot
Sulikunte GP of Bangarpet Taluk has 10 revenue villages and a total of 1913 households and a population of 11714. Located about 55 kms from Bengaluru, Sulikunte is a typical GP in Bangarpet Taluk, which has overexploited the groundwater resources and there is no possibility of future irrigation development through groundwater. ‘Sulikunte’ itself is a small tank located less than a km away from the Gram Panchayth office which contains water filled with slime and algae.
The water extraction for irrigation was done through open wells using animals about 40 to 50 years ago, but these have started failing in the last 20 to 30
years. Borewells gained prominence in the 1990s and while water was available at around 350 feet earlier, it is now common to dig atleast a 1000 feet to get water. As borewell failures have increased and water availability reduced from these wells, the extent of irrigated land has also decreased. There is also an increasing trend of growing Eucalyptus among the farmers here, which are giving good financial returns, but likely to have an adverse impact on the groundwater ecosystem in the long run.
Quality of water
The ground water quality is an issue facing the district of Kolar with Flouride and Nitrate contamination reported from several parts of the district. Fluoride concentration of more than 1.5 mg/l. is reported in pockets from most of the taluks. Nitrate concentration of more than 45 ppm is reported from parts of Mulbagal, Bangarpet and Malur taluks. Intensive irrigation (with heavy synthetic application) and over-exploitation make the groundwater vulnerable for contamination. Bangarpet as a Taluk also suffers from other groundwater contamination issues such as high arsenic levels (possibly as a result of gold mining in KGF), high TDS, coliform bacteria and hardness as noted by various studies.
High fluoride content in the groundwater has resulted in fluorosis among the people. Yellowness of teeth and pits in the teeth were noticeable among both the young and elderly people during interactions with them in Sulikunte. Studies undertaken by the Department of Community Medicine, Sri Devaraj Urs Medical College, Kolar, Karnataka, India
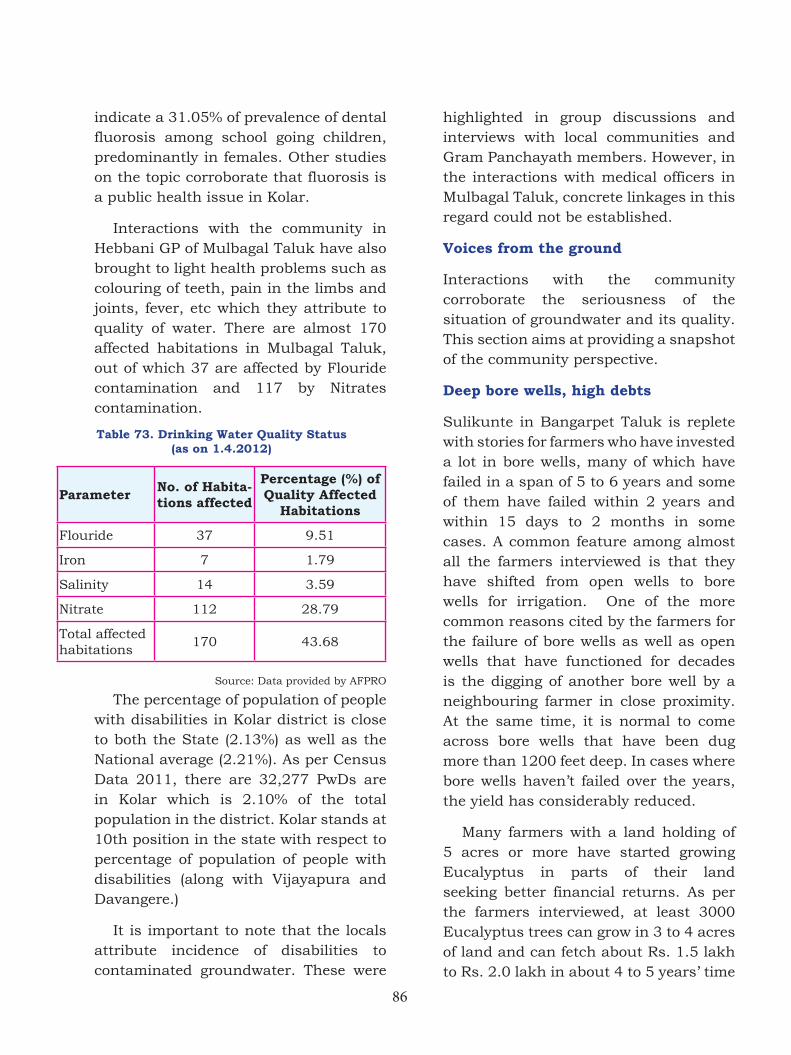
86
indicate a 31.05% of prevalence of dental fluorosis among school going children, predominantly in females. Other studies on the topic corroborate that fluorosis is a public health issue in Kolar.
Interactions with the community in Hebbani GP of Mulbagal Taluk have also brought to light health problems such as colouring of teeth, pain in the limbs and joints, fever, etc which they attribute to quality of water. There are almost 170 affected habitations in Mulbagal Taluk, out of which 37 are affected by Flouride contamination and 117 by Nitrates contamination.
Table 73. Drinking Water Quality Status (as on 1.4.2012)
Parameter No. of Habita-tions affected
Percentage (%) of Quality Affected
Habitations
Flouride 37 9.51
Iron 7 1.79
Salinity 14 3.59
Nitrate 112 28.79
Total affected habitations
170 43.68
Source: Data provided by AFPRO
The percentage of population of people with disabilities in Kolar district is close to both the State (2.13%) as well as the National average (2.21%). As per Census Data 2011, there are 32,277 PwDs are in Kolar which is 2.10% of the total population in the district. Kolar stands at 10th position in the state with respect to percentage of population of people with disabilities (along with Vijayapura and Davangere.)
It is important to note that the locals attribute incidence of disabilities to contaminated groundwater. These were
highlighted in group discussions and interviews with local communities and Gram Panchayath members. However, in the interactions with medical officers in Mulbagal Taluk, concrete linkages in this regard could not be established.
Voices from the ground
Interactions with the community corroborate the seriousness of the situation of groundwater and its quality. This section aims at providing a snapshot of the community perspective.
Deep bore wells, high debts
Sulikunte in Bangarpet Taluk is replete with stories for farmers who have invested a lot in bore wells, many of which have failed in a span of 5 to 6 years and some of them have failed within 2 years and within 15 days to 2 months in some cases. A common feature among almost all the farmers interviewed is that they have shifted from open wells to bore wells for irrigation. One of the more common reasons cited by the farmers for the failure of bore wells as well as open wells that have functioned for decades is the digging of another bore well by a neighbouring farmer in close proximity. At the same time, it is normal to come across bore wells that have been dug more than 1200 feet deep. In cases where bore wells haven’t failed over the years, the yield has considerably reduced.
Many farmers with a land holding of 5 acres or more have started growing Eucalyptus in parts of their land seeking better financial returns. As per the farmers interviewed, at least 3000 Eucalyptus trees can grow in 3 to 4 acres of land and can fetch about Rs. 1.5 lakh to Rs. 2.0 lakh in about 4 to 5 years’ time
87
with negligible investment and minimum maintenance efforts. They feel more assured about this income. However, those farmers with lesser land holding (2 acres or lesser) grow Ragi, Mulberry, Tomato and a few other Vegetables with either low yielding bore wells or depend upon rainfall for the cultivation.
“As of now, there could be around 100 to 200 Persons with Disability in our Gram Pancha-yat limits, but if you come five years later, you may find around 50% of our popula-tion with disability. We know we are living in risky situation. We are inevitably drinking water with high fluoride content and other toxic materials. Malnourishment is common among us, especially in children and adoles-cents. So, certainly there will be more dis-abled people for you to survey in the coming years”
Ex. President of Yerramvaripalli GP,
Srinivasapura Taluk
(Names changed to maintain confidentiality; about 25 farmers were interviewed and discussions were held with Gram Panchayath members)
Ø Papanna owns 6 acres of land in a village in Sulikunte GP irrigated by open well, only 20 feet deep which was dug about 50 years back, with which he cultivated tomato, chilly, cabbage and potato. The water in the well started depleting and ultimately failed in 2007-08. In 2005, a borewell was dug at 600 feet with which about 4 acres of land was irrigated, but it failed in 2008. Now Papanna only grows rain-fed Ragi.
ØMadan has 20 acres of land out of which 18 acres are dry and only 2 acres are irrigated. Two open wells were in use about 50 years back, both of which failed in the 1980s. About 25 years back, a bore well at a depth of
160 feet irrigated about 7 to 8 acres of land and functioned well for 16 years before it was re-bored to 700 feet. The well failed in 2010. Another borewell was dug about 10 years back at 250 feet and after some years re-bored to a depth of 1100 feet. A total of 7 bore wells were dug in the land, out of which 5 have failed after reaching a depth of 1000 feet or more. Madan used to cultivate tomato and other vegetables, but has now grown Eucalyptus in 4 acres of land. After constantly investing in borewells, he is expecting an income of Rs. 1.8 lakh from 3200 Eucalyptus trees in about 5 years’ time.
ØSubbanna has about 3.5 acres land which he used to irrigate with an open well dug at 90 feet. In 1993, he installed a bore well close to a lake at a cost of Rs. 25,000/- and was also in a position to give free water to another farmer. It was re-bored to about 700 feet in 1996/97 at a cost of Rs. 50,000/- but the bore well failed in a few years. In 2009, he invested Rs. 6 lakhs in a bore well at 1050 feet, which was later deepened to 1300 feet. The relentless investment in bore wells, which are eventually failing has left him financially indebted.
ØKumar, who inherited a farm from his parents spent about Rs. 15 lakhs within a month for digging 3 borewells, but all the wells failed and no water could be extracted whatsoever.
The question of sustainability
Through interactions with the farmers and community members in Sulikunte, it was clear that the sustainability of groundwater availability is a serious issue and the continuous depletion from the high number of bore wells that are being dug as well as cultivation of water
88
intensive vegetables and Eucalyptus. The poor existing groundwater situation and the fact that there is little scope of further development of groundwater can potentially cause socio-economic distress. However, these interactions also revealed that the proximity of a metropolitan city such as Bengaluru is providing sources of employment to the people from Sulikunte and nearby GPs. While this may be looked at as a positive option that helps in mitigating economic hardship, the future of agriculture as a primary source of occupation is not guaranteed. There is also a privately owned golf-course in Sulikunte and how the high water requirements of maintaining a golf-course is impacting the groundwater situation could not be estimated.
Farmers’ expectations
Interactions with the farming community across different parts in Kolar revealed that they are expecting a Tank Filling program recommended by the Paramashivah commission to solve their water woes. This program involves diversion of the tributaries of Netravati river eastwards and filling the tanks in Tumkur, Chikkaballapur, Bengaluru Rural, Ramanagar and Kolar districts. At the time of writing this report, the Government is studying the techno-economic and ecological feasibility of the project, but the farmers in Kolar seem to have high hopes of the project.
Positive measures
The National Drinking Water Security Pilot Project
With the objective of accomplishing drinking water security in water-stressed and quality-affected areas in the country, the Government has launched a national
pilot program in 15 blocks of the country
to test and demonstrate the concept of
Drinking Water Security Planning by
addressing various dimensions of water
security. The 15 blocks are spread across
10 states are those with alarming levels
of groundwater and Mulbagal Taluk of
Kolar district has been identified as one
such block.
Drinking Water Security Pilot Projects
are launched with the objective of
achieving drinking water security in a
holistic manner, through a four-pronged
approach of
ØMeasures for source sustainability
through convergence with MNREGS,
IWMP & other Watershed programmes
and NRDWP
ØParticipatory integrated water
resources management led by Gram
Panchayats
ØPreparation of drinking water security
plans by villages
ØMaking the selected villages open
defecation free and ensuring proper
solid and liquid waste management
The project is funded by National
Rural Drinking Water Project and Nirmal
Bharath Abhyan. The organization
structure for the project comprises
agencies at central, state, district and
taluk levels, the core groups and working
committees at various levels. The Central
Groundwater Board and WSP-SA (World
Bank) provide the necessary technical
support to the project. The latter includes
CGWB and WSP-SA (World Bank). The
funding for the project comes from
NRDWP and NBA.
89
Though the state level core committee includes the RDPR, at the district and taluk levels, there is involvement of multiple line departments, with the nodal department being the PRED (Panchayath Raj Engineering Department). The project characteristically depends heavily on convergence action from the departments and community participation through the involvement of Village Water and Sanitation Committees.
In Mulbagal Taluk, AFPRO (Action for Food Production) is the support organization that is implementing the project. AFPRO has reached several milestones of the project beginning with analysis of secondary data to understand the current demographical status, drinking water sources, availability, supply and usage. With the help of Gram Panchayath members and PDOs, the communities have been made aware of NDWSPP and its objectives. Participatory Rural Appraisals (PRA) to map the land use in terms of rain-fed agricultural land, irrigated area, barren land, forest land, water bodies, open defecation sites, etc in the Gram Panchayaths followed by the constitution of VWSCs as per norms. The VWSC members were then the contact points for AFPRO for discussions and capacity building on water & sanitation issues.
Subsequently, water budget estimation workshops were carried out in all the villages wherein the concepts of hydrological cycle, water availability on the earth, measurement of groundwater levels in the borewells, rainfall, discharge of a pump, etc were made known to the villagers and VWSC members in particular. Water budgeting exercises
help the community understand and compute the groundwater availability from rainfall and surface water recharge on the one hand and water usage across sectors viz. drinking and domestic purposes, irrigation, livestock, etc on the other. Once the supply and demand estimation is made, the communities have a greater understanding of the water situation and can start developing the water security plans for their villages.
Water budgeting is a key exercise and has an impact on the effectiveness of NDWSPP. Following this activity, the Village Water Security Plan is developed, which comprises several water management and conservation activities and forms the crux of NDWSPP implementation. The program also stresses on sanitation with a target of making all villages open-defecation free. These activities were yet to commence at the time of writing this report. With good support from the community, the actions under NDWSPP can possibly help address the critical issue of groundwater availability and quality in the water-stressed areas. It is hoped that the pilot programs are successful and can be replicated in other parts of the country as well.
Safe Drinking Water supply through Reverse Osmosis plant
In order to provide safe drinking water at low cost, a reverse osmosis water treatment plant has been installed in the limits of Hebbani Gram Panchayath in Mulbagal Taluk. The plant has been built at a cost of about Rs. 15 to 16 lakhs (including the building) from a convergence of funds for various schemes. Local political leadership has
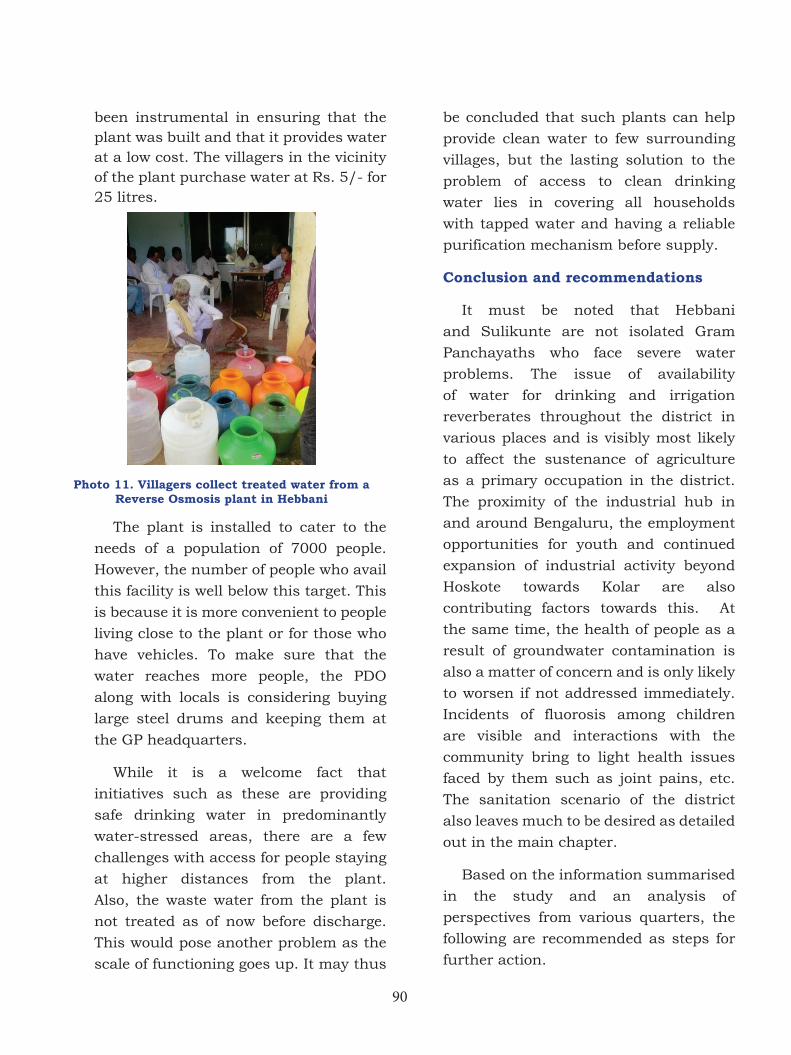
90
been instrumental in ensuring that the plant was built and that it provides water at a low cost. The villagers in the vicinity of the plant purchase water at Rs. 5/- for 25 litres.
Photo 11. Villagers collect treated water from a Reverse Osmosis plant in Hebbani
The plant is installed to cater to the
needs of a population of 7000 people.
However, the number of people who avail
this facility is well below this target. This
is because it is more convenient to people
living close to the plant or for those who
have vehicles. To make sure that the
water reaches more people, the PDO
along with locals is considering buying
large steel drums and keeping them at
the GP headquarters.
While it is a welcome fact that
initiatives such as these are providing
safe drinking water in predominantly
water-stressed areas, there are a few
challenges with access for people staying
at higher distances from the plant.
Also, the waste water from the plant is
not treated as of now before discharge.
This would pose another problem as the
scale of functioning goes up. It may thus
be concluded that such plants can help
provide clean water to few surrounding
villages, but the lasting solution to the
problem of access to clean drinking
water lies in covering all households
with tapped water and having a reliable
purification mechanism before supply.
Conclusion and recommendations
It must be noted that Hebbani
and Sulikunte are not isolated Gram
Panchayaths who face severe water
problems. The issue of availability
of water for drinking and irrigation
reverberates throughout the district in
various places and is visibly most likely
to affect the sustenance of agriculture
as a primary occupation in the district.
The proximity of the industrial hub in
and around Bengaluru, the employment
opportunities for youth and continued
expansion of industrial activity beyond
Hoskote towards Kolar are also
contributing factors towards this. At
the same time, the health of people as a
result of groundwater contamination is
also a matter of concern and is only likely
to worsen if not addressed immediately.
Incidents of fluorosis among children
are visible and interactions with the
community bring to light health issues
faced by them such as joint pains, etc.
The sanitation scenario of the district
also leaves much to be desired as detailed
out in the main chapter.
Based on the information summarised
in the study and an analysis of
perspectives from various quarters, the
following are recommended as steps for
further action.
91
ØA detailed study on groundwater
contamination and its health impact
be carried out and specialized medical
units for treatment of ailments occurring
from groundwater contamination be
set up
ØThough there is evidence of depleting
groundwater levels, consolidation
of the factors contributing to the
same (change in cultivation pattern,
increasing number of borewells,
decline of traditional water storage
and conservation techniques) must be
made.
ØFurther to this, efforts to conserve
water through regulation and
maintenance of tanks, watershed
programs and conservation efforts
to rejuvenate groundwater with
community participation and a check
on the increasing number of bore wells
are necessary. Processes such as ‘water
budgeting’ adopted by the National
Drinking Water Security Pilot project
are a step in the right direction
ØCultivation for commercial gain is
a present day reality, but extensive
cultivation of water intensive crops
including vegetables, expansion of
area for growing Eucalyptus, are also
contributing factors to groundwater
depletion and threat to sustainability
of agriculture in the district. Hence
a district policy on cultivation with
the participation of departments of
agriculture, horticulture and forests
may be prepared to bring in a balance
in land use and conservation of
groundwater.
* * * *
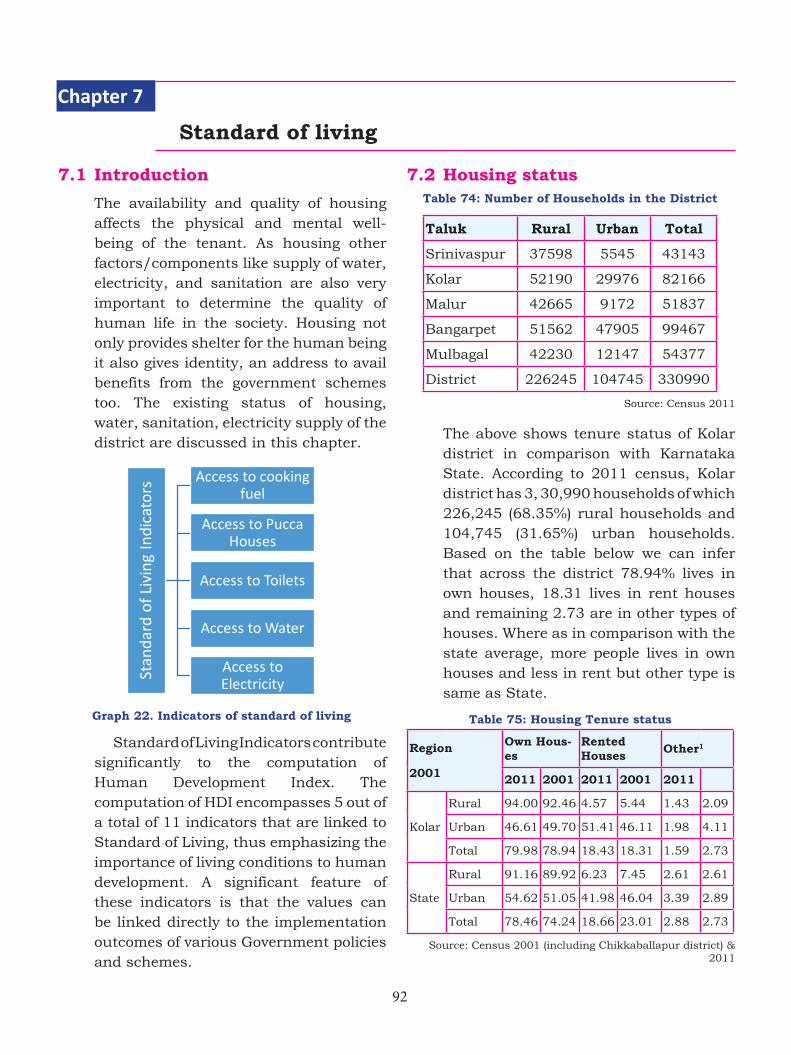
92
7.1 Introduction
The availability and quality of housing affects the physical and mental well-being of the tenant. As housing other factors/components like supply of water, electricity, and sanitation are also very important to determine the quality of human life in the society. Housing not only provides shelter for the human being it also gives identity, an address to avail benefits from the government schemes too. The existing status of housing, water, sanitation, electricity supply of the district are discussed in this chapter.
Graph 22. Indicators of standard of living
Standard of Living Indicators contribute significantly to the computation of Human Development Index. The computation of HDI encompasses 5 out of a total of 11 indicators that are linked to Standard of Living, thus emphasizing the importance of living conditions to human development. A significant feature of these indicators is that the values can be linked directly to the implementation outcomes of various Government policies and schemes.
7.2 Housing statusTable 74: Number of Households in the District
Taluk Rural Urban Total
Srinivaspur 37598 5545 43143
Kolar 52190 29976 82166
Malur 42665 9172 51837
Bangarpet 51562 47905 99467
Mulbagal 42230 12147 54377
District 226245 104745 330990
Source: Census 2011
The above shows tenure status of Kolar district in comparison with Karnataka State. According to 2011 census, Kolar district has 3, 30,990 households of which 226,245 (68.35%) rural households and 104,745 (31.65%) urban households. Based on the table below we can infer that across the district 78.94% lives in own houses, 18.31 lives in rent houses and remaining 2.73 are in other types of houses. Where as in comparison with the state average, more people lives in own houses and less in rent but other type is same as State.
Table 75: Housing Tenure status
Region
2001
Own Hous-es
Rented Houses Other1
2011 2001 2011 2001 2011
Kolar
Rural 94.00 92.46 4.57 5.44 1.43 2.09
Urban 46.61 49.70 51.41 46.11 1.98 4.11
Total 79.98 78.94 18.43 18.31 1.59 2.73
State
Rural 91.16 89.92 6.23 7.45 2.61 2.61
Urban 54.62 51.05 41.98 46.04 3.39 2.89
Total 78.46 74.24 18.66 23.01 2.88 2.73
Source: Census 2001 (including Chikkaballapur district) & 2011
Standard of living
Chapter 7
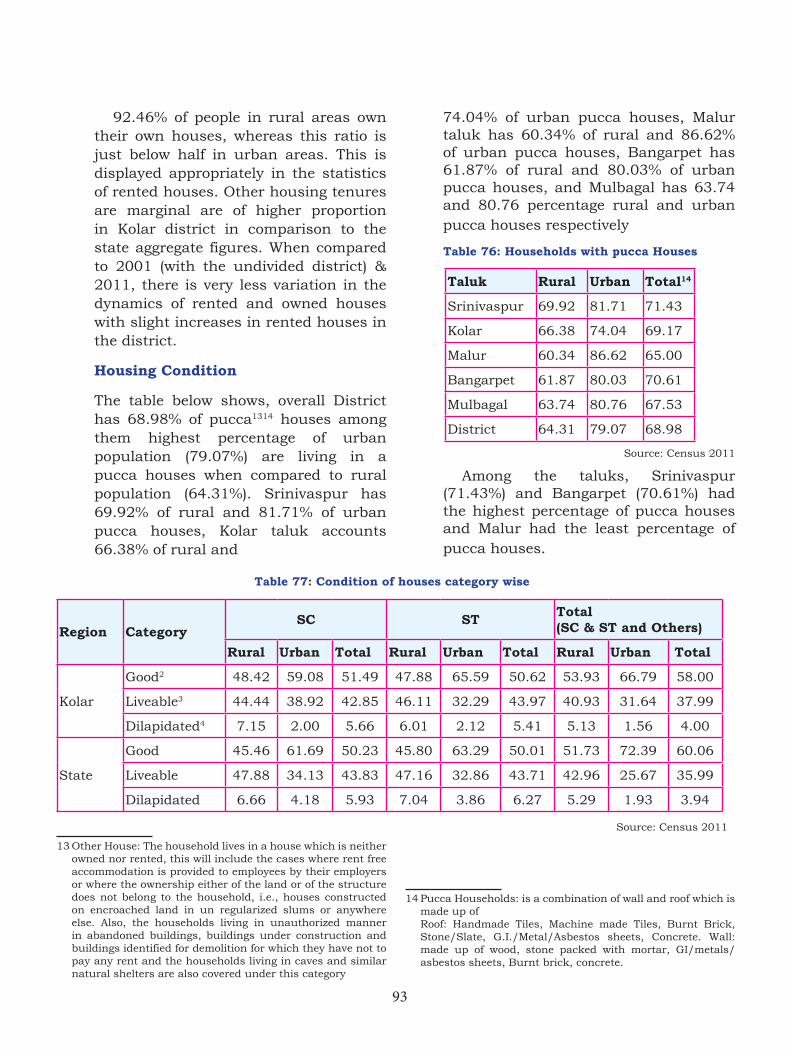
93
92.46% of people in rural areas own their own houses, whereas this ratio is just below half in urban areas. This is displayed appropriately in the statistics of rented houses. Other housing tenures are marginal are of higher proportion in Kolar district in comparison to the state aggregate figures. When compared to 2001 (with the undivided district) & 2011, there is very less variation in the dynamics of rented and owned houses with slight increases in rented houses in the district.
Housing Condition
The table below shows, overall District has 68.98% of pucca1314 houses among them highest percentage of urban population (79.07%) are living in a pucca houses when compared to rural population (64.31%). Srinivaspur has 69.92% of rural and 81.71% of urban pucca houses, Kolar taluk accounts 66.38% of rural and
13 Other House: The household lives in a house which is neither owned nor rented, this will include the cases where rent free accommodation is provided to employees by their employers or where the ownership either of the land or of the structure does not belong to the household, i.e., houses constructed on encroached land in un regularized slums or anywhere else. Also, the households living in unauthorized manner in abandoned buildings, buildings under construction and buildings identified for demolition for which they have not to pay any rent and the households living in caves and similar natural shelters are also covered under this category
74.04% of urban pucca houses, Malur taluk has 60.34% of rural and 86.62% of urban pucca houses, Bangarpet has 61.87% of rural and 80.03% of urban pucca houses, and Mulbagal has 63.74 and 80.76 percentage rural and urban pucca houses respectively
Table 76: Households with pucca Houses
Taluk Rural Urban Total14
Srinivaspur 69.92 81.71 71.43
Kolar 66.38 74.04 69.17
Malur 60.34 86.62 65.00
Bangarpet 61.87 80.03 70.61
Mulbagal 63.74 80.76 67.53
District 64.31 79.07 68.98
Source: Census 2011
Among the taluks, Srinivaspur (71.43%) and Bangarpet (70.61%) had the highest percentage of pucca houses and Malur had the least percentage of pucca houses.
Table 77: Condition of houses category wise
Region CategorySC ST Total
(SC & ST and Others)
Rural Urban Total Rural Urban Total Rural Urban Total
Kolar
Good2 48.42 59.08 51.49 47.88 65.59 50.62 53.93 66.79 58.00
Liveable3 44.44 38.92 42.85 46.11 32.29 43.97 40.93 31.64 37.99
Dilapidated4 7.15 2.00 5.66 6.01 2.12 5.41 5.13 1.56 4.00
State
Good 45.46 61.69 50.23 45.80 63.29 50.01 51.73 72.39 60.06
Liveable 47.88 34.13 43.83 47.16 32.86 43.71 42.96 25.67 35.99
Dilapidated 6.66 4.18 5.93 7.04 3.86 6.27 5.29 1.93 3.94
Source: Census 2011
a1
14 Pucca Households: is a combination of wall and roof which is made up of
Roof: Handmade Tiles, Machine made Tiles, Burnt Brick, Stone/Slate, G.I./Metal/Asbestos sheets, Concrete. Wall: made up of wood, stone packed with mortar, GI/metals/asbestos sheets, Burnt brick, concrete.
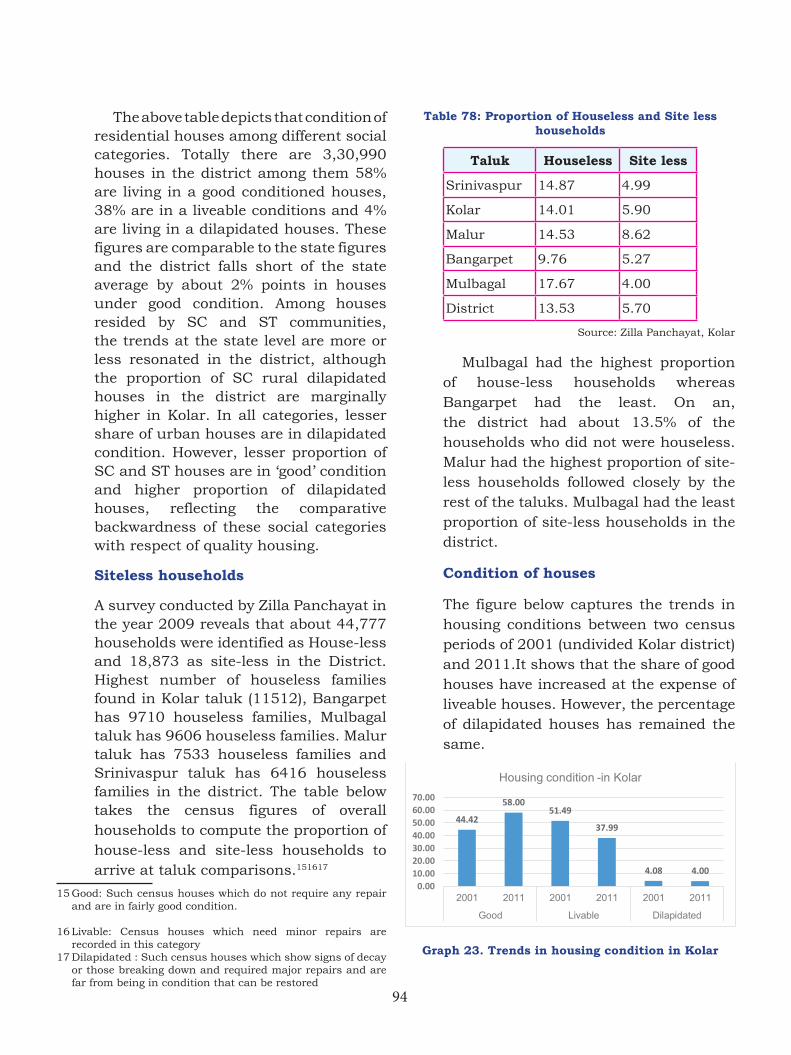
94
The above table depicts that condition of residential houses among different social categories. Totally there are 3,30,990 houses in the district among them 58% are living in a good conditioned houses, 38% are in a liveable conditions and 4% are living in a dilapidated houses. These figures are comparable to the state figures and the district falls short of the state average by about 2% points in houses under good condition. Among houses resided by SC and ST communities, the trends at the state level are more or less resonated in the district, although the proportion of SC rural dilapidated houses in the district are marginally higher in Kolar. In all categories, lesser share of urban houses are in dilapidated condition. However, lesser proportion of SC and ST houses are in ‘good’ condition and higher proportion of dilapidated houses, reflecting the comparative backwardness of these social categories with respect of quality housing.
Siteless households
A survey conducted by Zilla Panchayat in the year 2009 reveals that about 44,777 households were identified as House-less and 18,873 as site-less in the District. Highest number of houseless families found in Kolar taluk (11512), Bangarpet has 9710 houseless families, Mulbagal taluk has 9606 houseless families. Malur taluk has 7533 houseless families and Srinivaspur taluk has 6416 houseless families in the district. The table below takes the census figures of overall households to compute the proportion of house-less and site-less households to arrive at taluk comparisons.151617
15 Good: Such census houses which do not require any repair and are in fairly good condition.
16 Livable: Census houses which need minor repairs are recorded in this category
17 Dilapidated : Such census houses which show signs of decay or those breaking down and required major repairs and are far from being in condition that can be restored
Table 78: Proportion of Houseless and Site less households
Taluk Houseless Site less
Srinivaspur 14.87 4.99
Kolar 14.01 5.90
Malur 14.53 8.62
Bangarpet 9.76 5.27
Mulbagal 17.67 4.00
District 13.53 5.70
Source: Zilla Panchayat, Kolar
Mulbagal had the highest proportion of house-less households whereas Bangarpet had the least. On an, the district had about 13.5% of the households who did not were houseless. Malur had the highest proportion of site-less households followed closely by the rest of the taluks. Mulbagal had the least proportion of site-less households in the district.
Condition of houses
The figure below captures the trends in housing conditions between two census periods of 2001 (undivided Kolar district) and 2011.It shows that the share of good houses have increased at the expense of liveable houses. However, the percentage of dilapidated houses has remained the same.
Graph 23. Trends in housing condition in Kolar
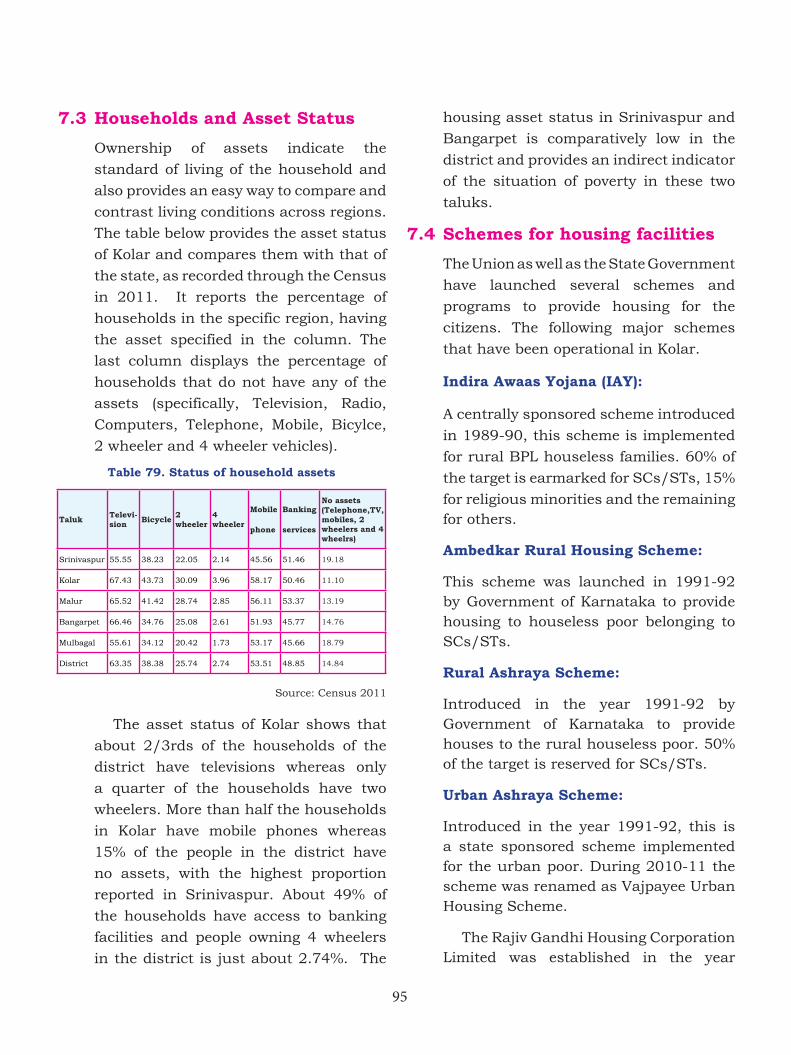
95
7.3 Households and Asset Status
Ownership of assets indicate the
standard of living of the household and
also provides an easy way to compare and
contrast living conditions across regions.
The table below provides the asset status
of Kolar and compares them with that of
the state, as recorded through the Census
in 2011. It reports the percentage of
households in the specific region, having
the asset specified in the column. The
last column displays the percentage of
households that do not have any of the
assets (specifically, Television, Radio,
Computers, Telephone, Mobile, Bicylce,
2 wheeler and 4 wheeler vehicles).
Table 79. Status of household assets
Taluk Televi-sion Bicycle 2
wheeler4 wheeler
Mobile
phone
Banking
services
No assets (Telephone,TV, mobiles, 2 wheelers and 4 wheelrs)
Srinivaspur 55.55 38.23 22.05 2.14 45.56 51.46 19.18
Kolar 67.43 43.73 30.09 3.96 58.17 50.46 11.10
Malur 65.52 41.42 28.74 2.85 56.11 53.37 13.19
Bangarpet 66.46 34.76 25.08 2.61 51.93 45.77 14.76
Mulbagal 55.61 34.12 20.42 1.73 53.17 45.66 18.79
District 63.35 38.38 25.74 2.74 53.51 48.85 14.84
Source: Census 2011
The asset status of Kolar shows that
about 2/3rds of the households of the
district have televisions whereas only
a quarter of the households have two
wheelers. More than half the households
in Kolar have mobile phones whereas
15% of the people in the district have
no assets, with the highest proportion
reported in Srinivaspur. About 49% of
the households have access to banking
facilities and people owning 4 wheelers
in the district is just about 2.74%. The
housing asset status in Srinivaspur and
Bangarpet is comparatively low in the
district and provides an indirect indicator
of the situation of poverty in these two
taluks.
7.4 Schemes for housing facilities
The Union as well as the State Government
have launched several schemes and
programs to provide housing for the
citizens. The following major schemes
that have been operational in Kolar.
Indira Awaas Yojana (IAY):
A centrally sponsored scheme introduced
in 1989-90, this scheme is implemented
for rural BPL houseless families. 60% of
the target is earmarked for SCs/STs, 15%
for religious minorities and the remaining for others.
Ambedkar Rural Housing Scheme:
This scheme was launched in 1991-92 by Government of Karnataka to provide housing to houseless poor belonging to SCs/STs.
Rural Ashraya Scheme:
Introduced in the year 1991-92 by Government of Karnataka to provide houses to the rural houseless poor. 50% of the target is reserved for SCs/STs.
Urban Ashraya Scheme:
Introduced in the year 1991-92, this is a state sponsored scheme implemented for the urban poor. During 2010-11 the scheme was renamed as Vajpayee Urban Housing Scheme.
The Rajiv Gandhi Housing Corporation Limited was established in the year
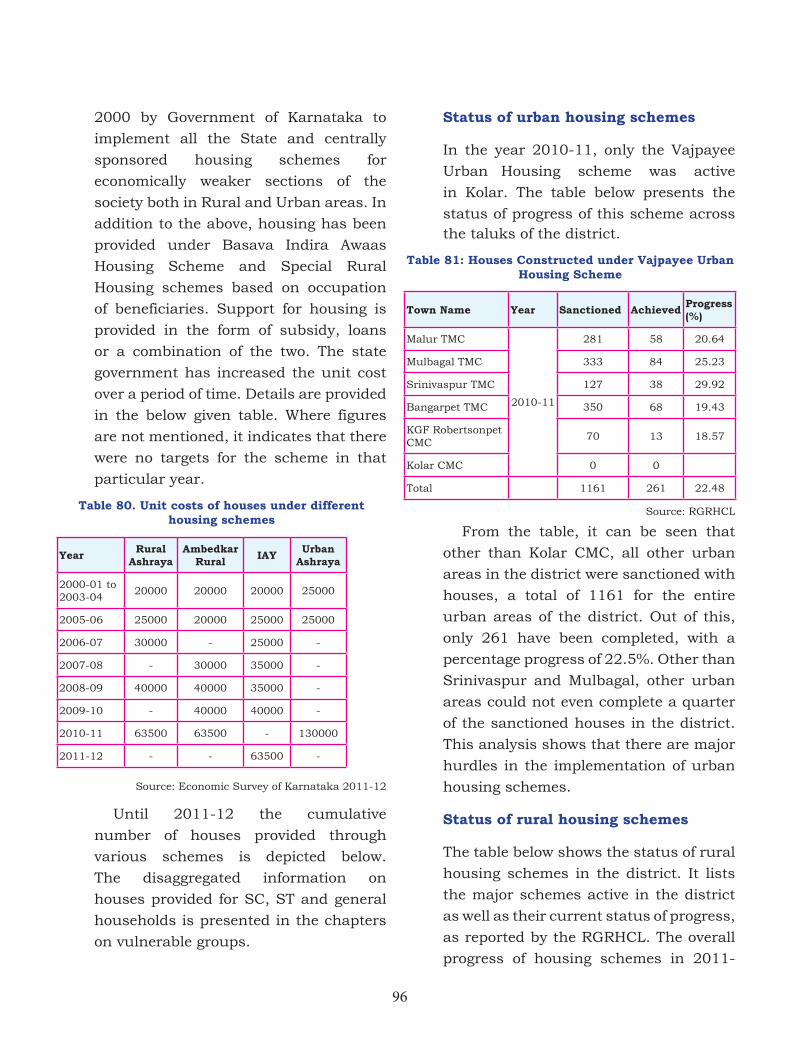
96
2000 by Government of Karnataka to
implement all the State and centrally
sponsored housing schemes for
economically weaker sections of the
society both in Rural and Urban areas. In
addition to the above, housing has been
provided under Basava Indira Awaas
Housing Scheme and Special Rural
Housing schemes based on occupation
of beneficiaries. Support for housing is
provided in the form of subsidy, loans
or a combination of the two. The state
government has increased the unit cost
over a period of time. Details are provided
in the below given table. Where figures
are not mentioned, it indicates that there
were no targets for the scheme in that
particular year.
Table 80. Unit costs of houses under different housing schemes
Year Rural Ashraya
Ambedkar Rural IAY Urban
Ashraya
2000-01 to 2003-04
20000 20000 20000 25000
2005-06 25000 20000 25000 25000
2006-07 30000 - 25000 -
2007-08 - 30000 35000 -
2008-09 40000 40000 35000 -
2009-10 - 40000 40000 -
2010-11 63500 63500 - 130000
2011-12 - - 63500 -
Source: Economic Survey of Karnataka 2011-12
Until 2011-12 the cumulative
number of houses provided through
various schemes is depicted below.
The disaggregated information on
houses provided for SC, ST and general
households is presented in the chapters
on vulnerable groups.
Status of urban housing schemes
In the year 2010-11, only the Vajpayee
Urban Housing scheme was active
in Kolar. The table below presents the
status of progress of this scheme across the taluks of the district.
Table 81: Houses Constructed under Vajpayee Urban Housing Scheme
Town Name Year Sanctioned Achieved Progress (%)
Malur TMC
2010-11
281 58 20.64
Mulbagal TMC 333 84 25.23
Srinivaspur TMC 127 38 29.92
Bangarpet TMC 350 68 19.43
KGF Robertsonpet CMC
70 13 18.57
Kolar CMC 0 0
Total 1161 261 22.48
Source: RGRHCL
From the table, it can be seen that
other than Kolar CMC, all other urban
areas in the district were sanctioned with
houses, a total of 1161 for the entire
urban areas of the district. Out of this,
only 261 have been completed, with a
percentage progress of 22.5%. Other than
Srinivaspur and Mulbagal, other urban
areas could not even complete a quarter
of the sanctioned houses in the district.
This analysis shows that there are major
hurdles in the implementation of urban
housing schemes.
Status of rural housing schemes
The table below shows the status of rural
housing schemes in the district. It lists
the major schemes active in the district
as well as their current status of progress,
as reported by the RGRHCL. The overall
progress of housing schemes in 2011-
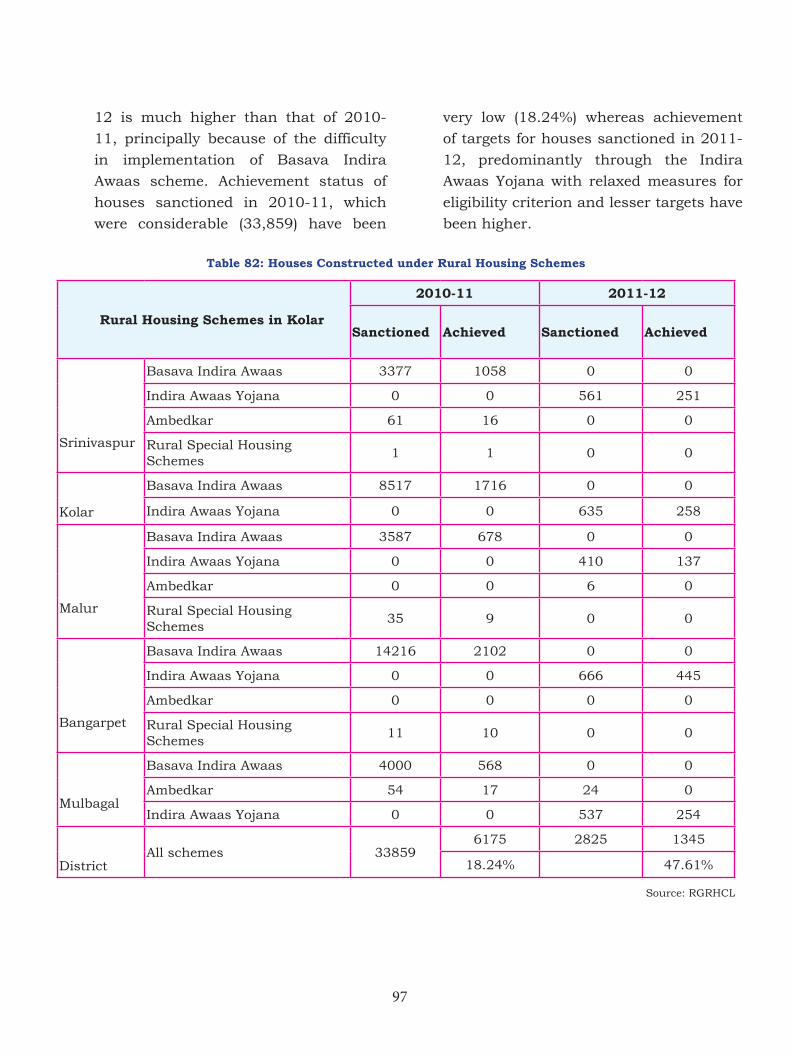
97
12 is much higher than that of 2010-
11, principally because of the difficulty
in implementation of Basava Indira
Awaas scheme. Achievement status of
houses sanctioned in 2010-11, which
were considerable (33,859) have been
Table 82: Houses Constructed under Rural Housing Schemes
Rural Housing Schemes in Kolar
2010-11 2011-12
Sanctioned Achieved Sanctioned Achieved
Srinivaspur
Basava Indira Awaas 3377 1058 0 0
Indira Awaas Yojana 0 0 561 251
Ambedkar 61 16 0 0
Rural Special Housing Schemes
1 1 0 0
Kolar
Basava Indira Awaas 8517 1716 0 0
Indira Awaas Yojana 0 0 635 258
Malur
Basava Indira Awaas 3587 678 0 0
Indira Awaas Yojana 0 0 410 137
Ambedkar 0 0 6 0
Rural Special Housing Schemes
35 9 0 0
Bangarpet
Basava Indira Awaas 14216 2102 0 0
Indira Awaas Yojana 0 0 666 445
Ambedkar 0 0 0 0
Rural Special Housing Schemes
11 10 0 0
Mulbagal
Basava Indira Awaas 4000 568 0 0
Ambedkar 54 17 24 0
Indira Awaas Yojana 0 0 537 254
DistrictAll schemes 33859
6175 2825 1345
18.24% 47.61%
Source: RGRHCL
very low (18.24%) whereas achievement
of targets for houses sanctioned in 2011-
12, predominantly through the Indira
Awaas Yojana with relaxed measures for
eligibility criterion and lesser targets have
been higher.
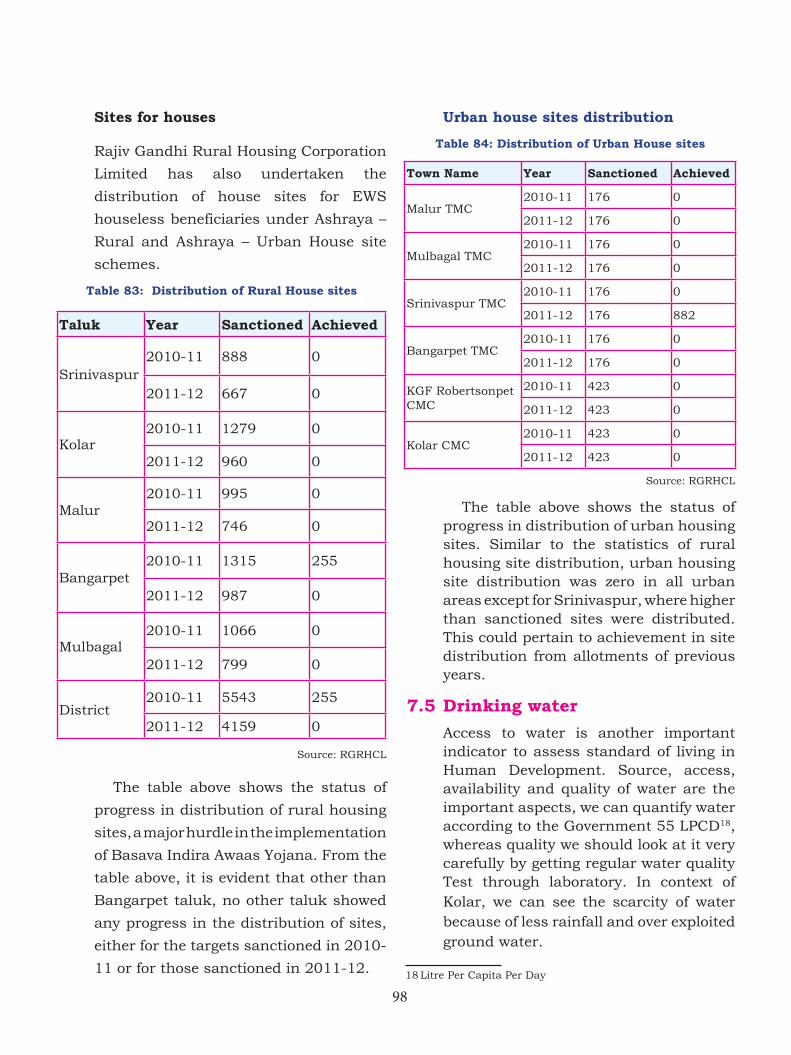
98
Sites for houses
Rajiv Gandhi Rural Housing Corporation
Limited has also undertaken the
distribution of house sites for EWS
houseless beneficiaries under Ashraya –
Rural and Ashraya – Urban House site
schemes.
Table 83: Distribution of Rural House sites
Taluk Year Sanctioned Achieved
Srinivaspur2010-11 888 0
2011-12 667 0
Kolar2010-11 1279 0
2011-12 960 0
Malur2010-11 995 0
2011-12 746 0
Bangarpet2010-11 1315 255
2011-12 987 0
Mulbagal2010-11 1066 0
2011-12 799 0
District2010-11 5543 255
2011-12 4159 0
Source: RGRHCL
The table above shows the status of
progress in distribution of rural housing
sites, a major hurdle in the implementation
of Basava Indira Awaas Yojana. From the
table above, it is evident that other than
Bangarpet taluk, no other taluk showed
any progress in the distribution of sites,
either for the targets sanctioned in 2010-
11 or for those sanctioned in 2011-12.
Urban house sites distribution
Table 84: Distribution of Urban House sites
Town Name Year Sanctioned Achieved
Malur TMC2010-11 176 0
2011-12 176 0
Mulbagal TMC2010-11 176 0
2011-12 176 0
Srinivaspur TMC2010-11 176 0
2011-12 176 882
Bangarpet TMC2010-11 176 0
2011-12 176 0
KGF Robertsonpet CMC
2010-11 423 0
2011-12 423 0
Kolar CMC2010-11 423 0
2011-12 423 0
Source: RGRHCL
The table above shows the status of progress in distribution of urban housing sites. Similar to the statistics of rural housing site distribution, urban housing site distribution was zero in all urban areas except for Srinivaspur, where higher than sanctioned sites were distributed. This could pertain to achievement in site distribution from allotments of previous years.
7.5 Drinking water Access to water is another important
indicator to assess standard of living in Human Development. Source, access, availability and quality of water are the important aspects, we can quantify water according to the Government 55 LPCD18, whereas quality we should look at it very carefully by getting regular water quality Test through laboratory. In context of Kolar, we can see the scarcity of water because of less rainfall and over exploited ground water.
18 Litre Per Capita Per Day
99
According to the National norms for
supply of drinking water (water for all
domestic purposes) a daily supply of 40
litres per capita (40 lpcd) is considered
the minimum requirement of people
in rural areas in Karnataka, the State
Government’s Strategy Paper 2000-05
on Rural Water Supply and Sanitation
adopts 55 lpcd as the norm for rural
water supply throughout the state and
70 lpcd for the DDP districts Fluoride
concentration of more than 1.5 mg/l. is
reported from many parts in the Kolar
district.
However, some of the exploratory
bore wells also have recorded fluoride
concentration of 2mg/l and above.
Nitrate concentration of more than 100
ppm is reported from parts of Mulbagal,
Bangarpet and Malur taluks as reported
by Central Ground Water Board of
Karnataka (2012).As per Bureau of
Indian Standards (BIS), Permissible limit
is 1.5mg/l –fluoride, Nitrate is about 45
ppm. Exposure to high concentration of
fluoride, causes mottling of teeth and, in
severe cases, crippling skeletal fluorosis.
Kolar where more than 80 per cent of the
children in the age-group of 6-14 suffer
from skeletal and severe dental fluorosis19
is only because of the water they consume
has excess fluoride which has weakened
their hands and legs. Worse, in Kolar, all
villages depend on ground water for their
domestic and other requirements. An
epidemiological survey has revealed that
over 26,000 people suffer from dental and
19 Fluorosis playing havoc in Kolar, TNN | Jun 6, 2002, Times of India
skeletal fluorosis and more than 39,000
people are prone to it is reported in Times
of India.
15 blocks were identified as “A National Drinking water Security Pilot Project blocks” in the country. Considering the severity of the drinking water issues in Kolar, Mulbagal taluk is one of the pilot project block among 15 block project blocks (3 from Andhra Pradesh, 1 from Gujarat, 1 from Haryana, 2 from Madhya Pradesh, 2 from Maharashtra, 1 from Punjab, 1 from Rajasthan, 1 from Tamil Nadu, 2 from Uttara Pradesh and 1 from Karnataka. The objective of this pilot project is to understand issues like
1) Unit of management – district, block or panchayat,
2) Rural to Urban transition and disparities – minimum tariffs and standards,
3) Issues of agricultural power subsidies and energy component in drinking water to enable appropriate
4) Pricing and recovery
5) Conjunctive storage in aquifers and rainwater harvesting systems, and
6) Demand and supply side management of water.
The project is currently under implementation in Mulbagal taluk.
In the year 2011-12, Ministry of Drinking water and Sanitation has allocated a total Rs. 2833.72 lakhs for drinking water and sanitation whereas Rs. 1349.21 was from Central government and Rs. 1484.51 lakhs was from State government to the District.
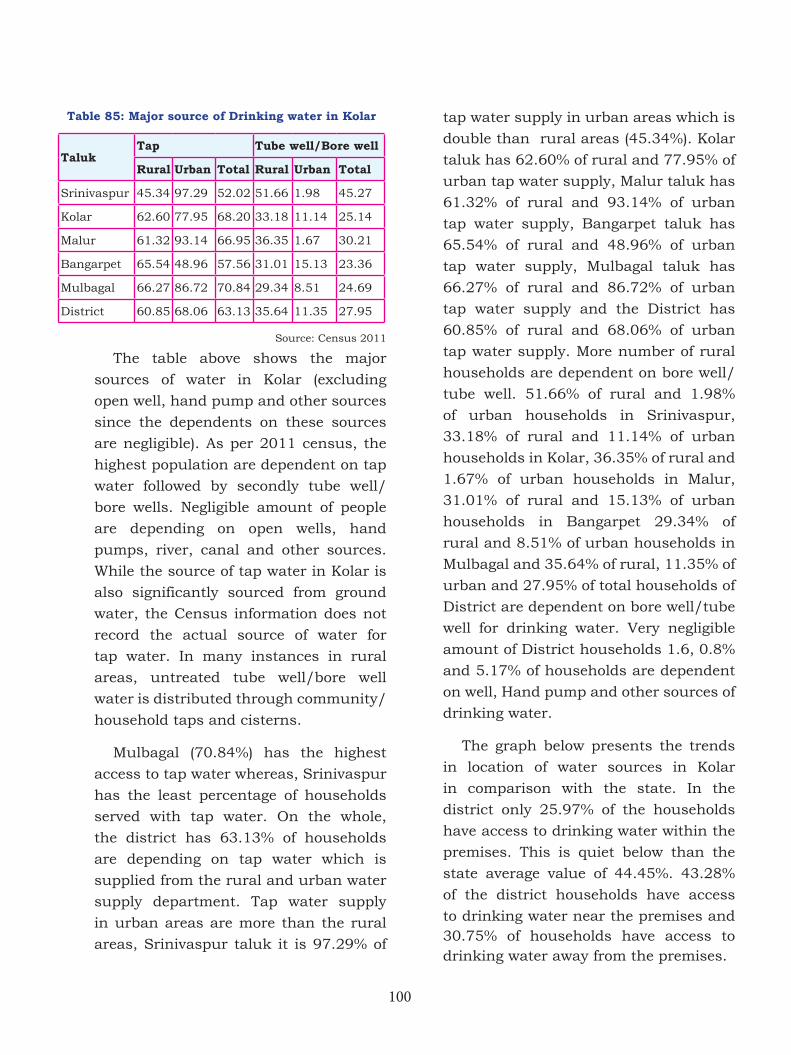
100
Table 85: Major source of Drinking water in Kolar
TalukTap Tube well/Bore well
Rural Urban Total Rural Urban Total
Srinivaspur 45.34 97.29 52.02 51.66 1.98 45.27
Kolar 62.60 77.95 68.20 33.18 11.14 25.14
Malur 61.32 93.14 66.95 36.35 1.67 30.21
Bangarpet 65.54 48.96 57.56 31.01 15.13 23.36
Mulbagal 66.27 86.72 70.84 29.34 8.51 24.69
District 60.85 68.06 63.13 35.64 11.35 27.95
Source: Census 2011
The table above shows the major
sources of water in Kolar (excluding
open well, hand pump and other sources
since the dependents on these sources
are negligible). As per 2011 census, the
highest population are dependent on tap
water followed by secondly tube well/
bore wells. Negligible amount of people
are depending on open wells, hand
pumps, river, canal and other sources.
While the source of tap water in Kolar is
also significantly sourced from ground
water, the Census information does not
record the actual source of water for
tap water. In many instances in rural
areas, untreated tube well/bore well
water is distributed through community/
household taps and cisterns.
Mulbagal (70.84%) has the highest
access to tap water whereas, Srinivaspur
has the least percentage of households
served with tap water. On the whole,
the district has 63.13% of households
are depending on tap water which is
supplied from the rural and urban water
supply department. Tap water supply
in urban areas are more than the rural
areas, Srinivaspur taluk it is 97.29% of
tap water supply in urban areas which is
double than rural areas (45.34%). Kolar
taluk has 62.60% of rural and 77.95% of
urban tap water supply, Malur taluk has
61.32% of rural and 93.14% of urban
tap water supply, Bangarpet taluk has
65.54% of rural and 48.96% of urban
tap water supply, Mulbagal taluk has
66.27% of rural and 86.72% of urban
tap water supply and the District has
60.85% of rural and 68.06% of urban
tap water supply. More number of rural
households are dependent on bore well/
tube well. 51.66% of rural and 1.98%
of urban households in Srinivaspur,
33.18% of rural and 11.14% of urban
households in Kolar, 36.35% of rural and
1.67% of urban households in Malur,
31.01% of rural and 15.13% of urban
households in Bangarpet 29.34% of
rural and 8.51% of urban households in
Mulbagal and 35.64% of rural, 11.35% of
urban and 27.95% of total households of
District are dependent on bore well/tube
well for drinking water. Very negligible
amount of District households 1.6, 0.8%
and 5.17% of households are dependent
on well, Hand pump and other sources of
drinking water.
The graph below presents the trends
in location of water sources in Kolar
in comparison with the state. In the
district only 25.97% of the households
have access to drinking water within the
premises. This is quiet below than the
state average value of 44.45%. 43.28%
of the district households have access
to drinking water near the premises and 30.75% of households have access to drinking water away from the premises.
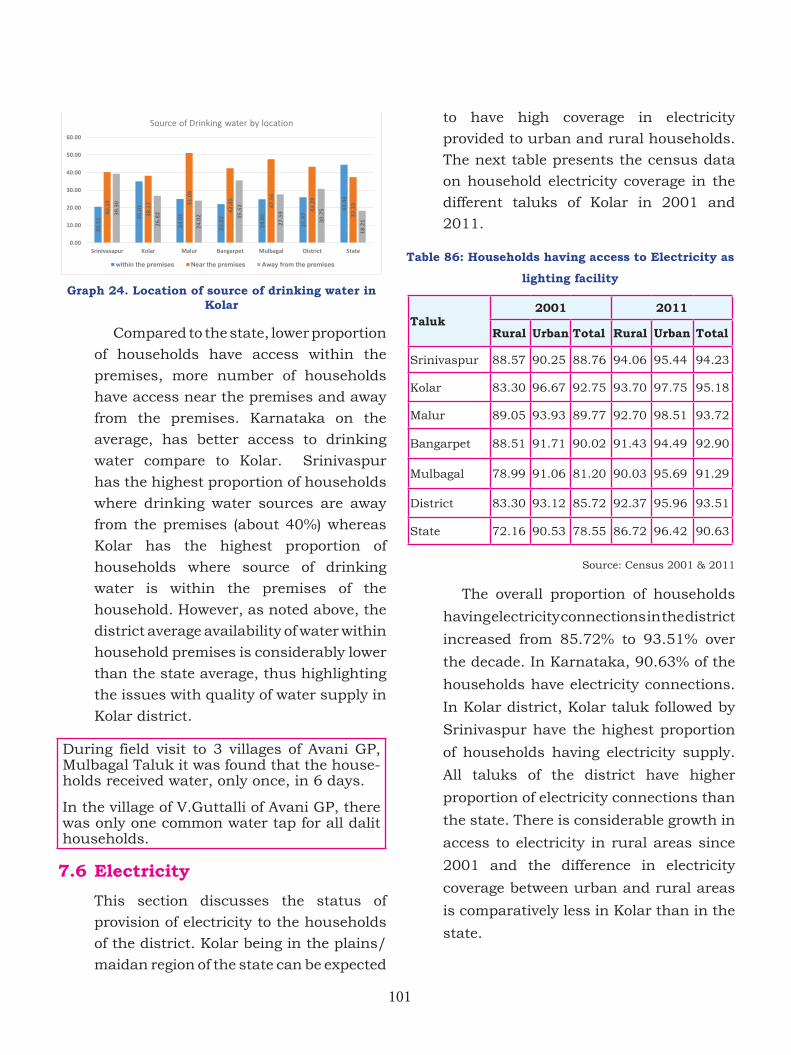
101
Graph 24. Location of source of drinking water in Kolar
Compared to the state, lower proportion
of households have access within the
premises, more number of households
have access near the premises and away
from the premises. Karnataka on the
average, has better access to drinking
water compare to Kolar. Srinivaspur
has the highest proportion of households
where drinking water sources are away
from the premises (about 40%) whereas
Kolar has the highest proportion of
households where source of drinking
water is within the premises of the
household. However, as noted above, the
district average availability of water within
household premises is considerably lower
than the state average, thus highlighting
the issues with quality of water supply in
Kolar district.
During field visit to 3 villages of Avani GP, Mulbagal Taluk it was found that the house-holds received water, only once, in 6 days.
In the village of V.Guttalli of Avani GP, there was only one common water tap for all dalit households.
7.6 Electricity
This section discusses the status of
provision of electricity to the households
of the district. Kolar being in the plains/
maidan region of the state can be expected
to have high coverage in electricity
provided to urban and rural households.
The next table presents the census data
on household electricity coverage in the
different taluks of Kolar in 2001 and
2011.
Table 86: Households having access to Electricity as
lighting facility
Taluk2001 2011
Rural Urban Total Rural Urban Total
Srinivaspur 88.57 90.25 88.76 94.06 95.44 94.23
Kolar 83.30 96.67 92.75 93.70 97.75 95.18
Malur 89.05 93.93 89.77 92.70 98.51 93.72
Bangarpet 88.51 91.71 90.02 91.43 94.49 92.90
Mulbagal 78.99 91.06 81.20 90.03 95.69 91.29
District 83.30 93.12 85.72 92.37 95.96 93.51
State 72.16 90.53 78.55 86.72 96.42 90.63
Source: Census 2001 & 2011
The overall proportion of households
having electricity connections in the district
increased from 85.72% to 93.51% over
the decade. In Karnataka, 90.63% of the
households have electricity connections.
In Kolar district, Kolar taluk followed by
Srinivaspur have the highest proportion
of households having electricity supply.
All taluks of the district have higher
proportion of electricity connections than
the state. There is considerable growth in
access to electricity in rural areas since
2001 and the difference in electricity
coverage between urban and rural areas
is comparatively less in Kolar than in the
state.
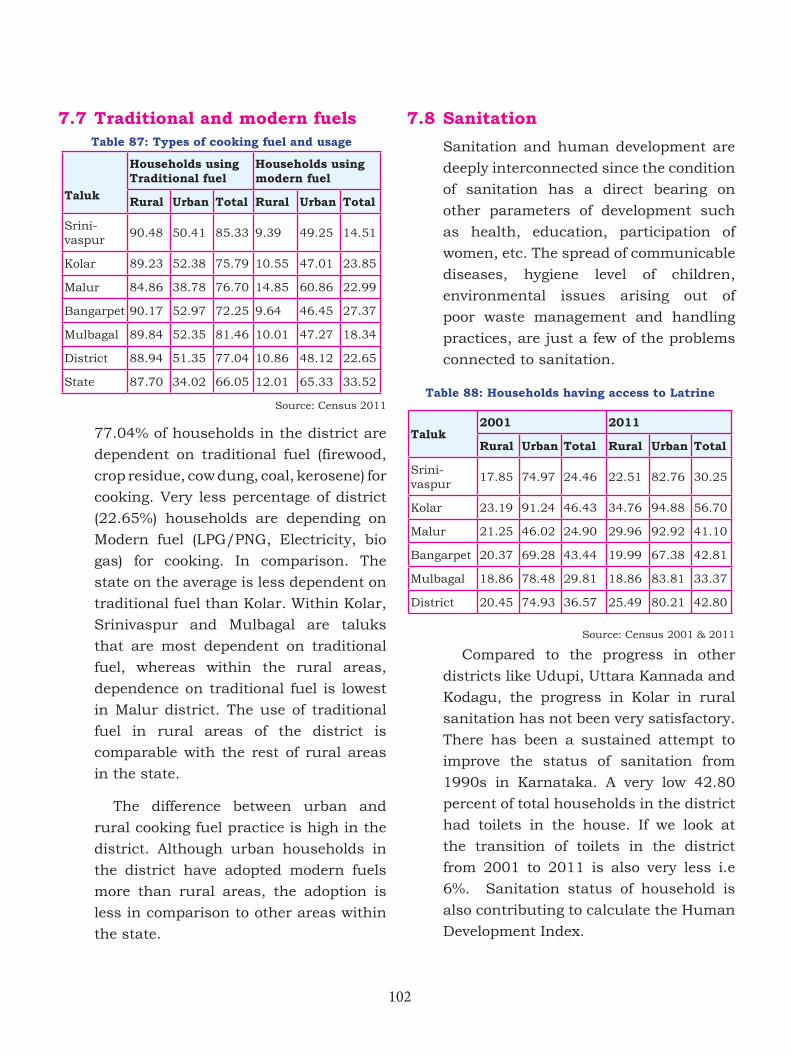
102
7.7 Traditional and modern fuelsTable 87: Types of cooking fuel and usage
Taluk
Households using Traditional fuel
Households using modern fuel
Rural Urban Total Rural Urban Total
Srini-vaspur
90.48 50.41 85.33 9.39 49.25 14.51
Kolar 89.23 52.38 75.79 10.55 47.01 23.85
Malur 84.86 38.78 76.70 14.85 60.86 22.99
Bangarpet 90.17 52.97 72.25 9.64 46.45 27.37
Mulbagal 89.84 52.35 81.46 10.01 47.27 18.34
District 88.94 51.35 77.04 10.86 48.12 22.65
State 87.70 34.02 66.05 12.01 65.33 33.52
Source: Census 2011
77.04% of households in the district are
dependent on traditional fuel (firewood,
crop residue, cow dung, coal, kerosene) for
cooking. Very less percentage of district
(22.65%) households are depending on
Modern fuel (LPG/PNG, Electricity, bio
gas) for cooking. In comparison. The
state on the average is less dependent on
traditional fuel than Kolar. Within Kolar,
Srinivaspur and Mulbagal are taluks
that are most dependent on traditional
fuel, whereas within the rural areas,
dependence on traditional fuel is lowest
in Malur district. The use of traditional
fuel in rural areas of the district is
comparable with the rest of rural areas
in the state.
The difference between urban and
rural cooking fuel practice is high in the
district. Although urban households in
the district have adopted modern fuels
more than rural areas, the adoption is
less in comparison to other areas within
the state.
7.8 Sanitation
Sanitation and human development are
deeply interconnected since the condition
of sanitation has a direct bearing on
other parameters of development such
as health, education, participation of
women, etc. The spread of communicable
diseases, hygiene level of children,
environmental issues arising out of
poor waste management and handling
practices, are just a few of the problems
connected to sanitation.
Table 88: Households having access to Latrine
Taluk2001 2011
Rural Urban Total Rural Urban Total
Srini-vaspur
17.85 74.97 24.46 22.51 82.76 30.25
Kolar 23.19 91.24 46.43 34.76 94.88 56.70
Malur 21.25 46.02 24.90 29.96 92.92 41.10
Bangarpet 20.37 69.28 43.44 19.99 67.38 42.81
Mulbagal 18.86 78.48 29.81 18.86 83.81 33.37
District 20.45 74.93 36.57 25.49 80.21 42.80
Source: Census 2001 & 2011
Compared to the progress in other
districts like Udupi, Uttara Kannada and
Kodagu, the progress in Kolar in rural
sanitation has not been very satisfactory.
There has been a sustained attempt to
improve the status of sanitation from
1990s in Karnataka. A very low 42.80
percent of total households in the district
had toilets in the house. If we look at
the transition of toilets in the district
from 2001 to 2011 is also very less i.e
6%. Sanitation status of household is
also contributing to calculate the Human
Development Index.
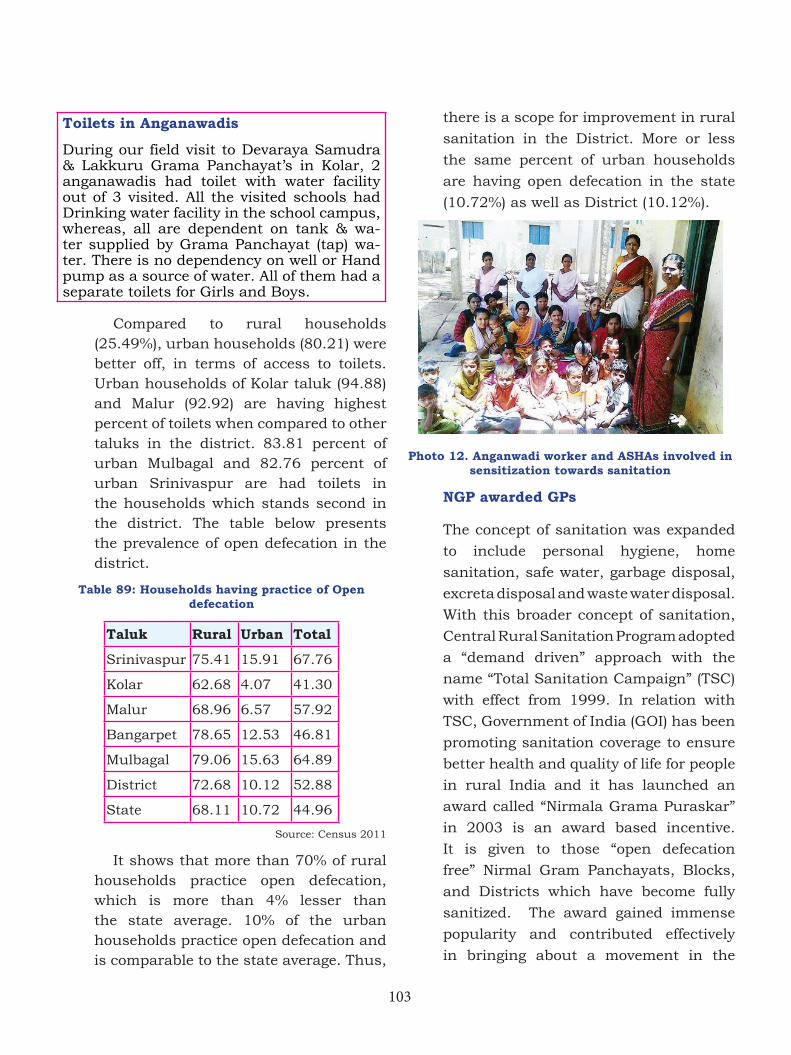
103
Toilets in Anganawadis
During our field visit to Devaraya Samudra & Lakkuru Grama Panchayat’s in Kolar, 2 anganawadis had toilet with water facility out of 3 visited. All the visited schools had Drinking water facility in the school campus, whereas, all are dependent on tank & wa-ter supplied by Grama Panchayat (tap) wa-ter. There is no dependency on well or Hand pump as a source of water. All of them had a separate toilets for Girls and Boys.
Compared to rural households (25.49%), urban households (80.21) were better off, in terms of access to toilets. Urban households of Kolar taluk (94.88) and Malur (92.92) are having highest percent of toilets when compared to other taluks in the district. 83.81 percent of urban Mulbagal and 82.76 percent of urban Srinivaspur are had toilets in the households which stands second in the district. The table below presents the prevalence of open defecation in the district.
Table 89: Households having practice of Open defecation
Taluk Rural Urban Total
Srinivaspur 75.41 15.91 67.76
Kolar 62.68 4.07 41.30
Malur 68.96 6.57 57.92
Bangarpet 78.65 12.53 46.81
Mulbagal 79.06 15.63 64.89
District 72.68 10.12 52.88
State 68.11 10.72 44.96
Source: Census 2011
It shows that more than 70% of rural households practice open defecation, which is more than 4% lesser than the state average. 10% of the urban households practice open defecation and is comparable to the state average. Thus,
there is a scope for improvement in rural
sanitation in the District. More or less
the same percent of urban households
are having open defecation in the state
(10.72%) as well as District (10.12%).
Photo 12. Anganwadi worker and ASHAs involved in sensitization towards sanitation
NGP awarded GPs
The concept of sanitation was expanded
to include personal hygiene, home
sanitation, safe water, garbage disposal,
excreta disposal and waste water disposal.
With this broader concept of sanitation,
Central Rural Sanitation Program adopted
a “demand driven” approach with the
name “Total Sanitation Campaign” (TSC)
with effect from 1999. In relation with
TSC, Government of India (GOI) has been
promoting sanitation coverage to ensure
better health and quality of life for people
in rural India and it has launched an
award called “Nirmala Grama Puraskar”
in 2003 is an award based incentive.
It is given to those “open defecation
free” Nirmal Gram Panchayats, Blocks,
and Districts which have become fully
sanitized. The award gained immense
popularity and contributed effectively
in bringing about a movement in the
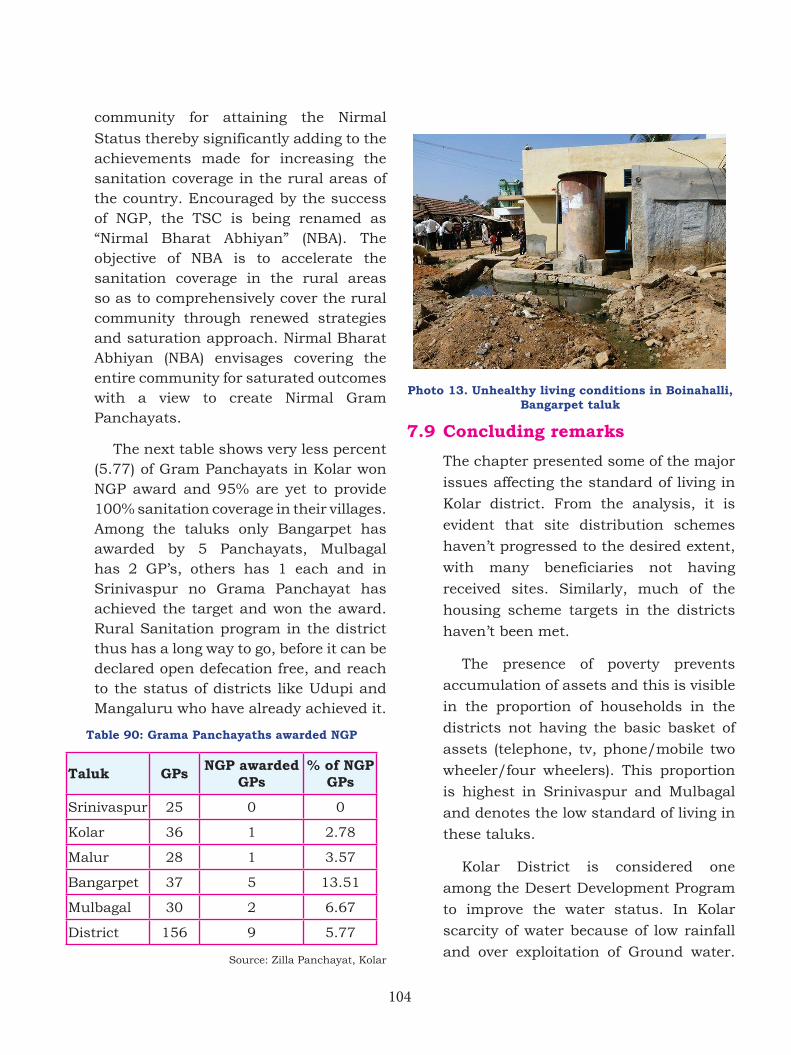
104
community for attaining the Nirmal
Status thereby significantly adding to the achievements made for increasing the sanitation coverage in the rural areas of the country. Encouraged by the success of NGP, the TSC is being renamed as “Nirmal Bharat Abhiyan” (NBA). The objective of NBA is to accelerate the sanitation coverage in the rural areas so as to comprehensively cover the rural community through renewed strategies and saturation approach. Nirmal Bharat Abhiyan (NBA) envisages covering the entire community for saturated outcomes with a view to create Nirmal Gram Panchayats.
The next table shows very less percent (5.77) of Gram Panchayats in Kolar won NGP award and 95% are yet to provide 100% sanitation coverage in their villages. Among the taluks only Bangarpet has awarded by 5 Panchayats, Mulbagal has 2 GP’s, others has 1 each and in Srinivaspur no Grama Panchayat has achieved the target and won the award.Rural Sanitation program in the district thus has a long way to go, before it can be declared open defecation free, and reach to the status of districts like Udupi and Mangaluru who have already achieved it.
Table 90: Grama Panchayaths awarded NGP
Taluk GPs NGP awarded GPs
% of NGP GPs
Srinivaspur 25 0 0
Kolar 36 1 2.78
Malur 28 1 3.57
Bangarpet 37 5 13.51
Mulbagal 30 2 6.67
District 156 9 5.77
Source: Zilla Panchayat, Kolar
Photo 13. Unhealthy living conditions in Boinahalli, Bangarpet taluk
7.9 Concluding remarks
The chapter presented some of the major
issues affecting the standard of living in
Kolar district. From the analysis, it is
evident that site distribution schemes
haven’t progressed to the desired extent,
with many beneficiaries not having
received sites. Similarly, much of the
housing scheme targets in the districts
haven’t been met.
The presence of poverty prevents
accumulation of assets and this is visible
in the proportion of households in the
districts not having the basic basket of
assets (telephone, tv, phone/mobile two
wheeler/four wheelers). This proportion
is highest in Srinivaspur and Mulbagal
and denotes the low standard of living in
these taluks.
Kolar District is considered one
among the Desert Development Program
to improve the water status. In Kolar
scarcity of water because of low rainfall
and over exploitation of Ground water.
105
Recommendations based on the
Government initiation like National water
security Pilot project and Yethinahole
Yojane should be carefully studied
before decisions are taken and further,
continuous monitor of environmental
and ecological impacts have to be carried
out. Further, based on the analysis of
this chapter, the following steps could be
considered for future course of action.
All the taluks of the district have under
over-exploited category. In these taluks
further ground water exploitation should
be strictly regulated and monitored
and governed to avoid further adverse
effects on the ground water system.
Constant monitoring of ground water
quality should be carried out in the
fluoride-contaminated areas (pockets) to
prevent further deterioration and related
problems.
In the Kolar region rooftop rainwater harvesting practices may have to be made mandatory. Awareness has to be created in the creation of sustainable and useful rain water harvesting mechanisms. It will help in reducing stress on water supply systems.
For drinking water and community irrigation shcemes, instead of investing on the creation of new water systems, government can invest on renovation of water supply sources like bore wells/tube wells/tanks etc.
Access to individual household latrines is not very effective in the District, and as per 2011 census only 42% of households are having access to toilets in the District. There is only 6% increase in household access to toilets from 2001 to 2011. Special attention is required in implementation of NGP/NBA programmes in the District. Distinct attention should be given to the
Srinivaspur taluk in terms of Sanitation.
* * * *
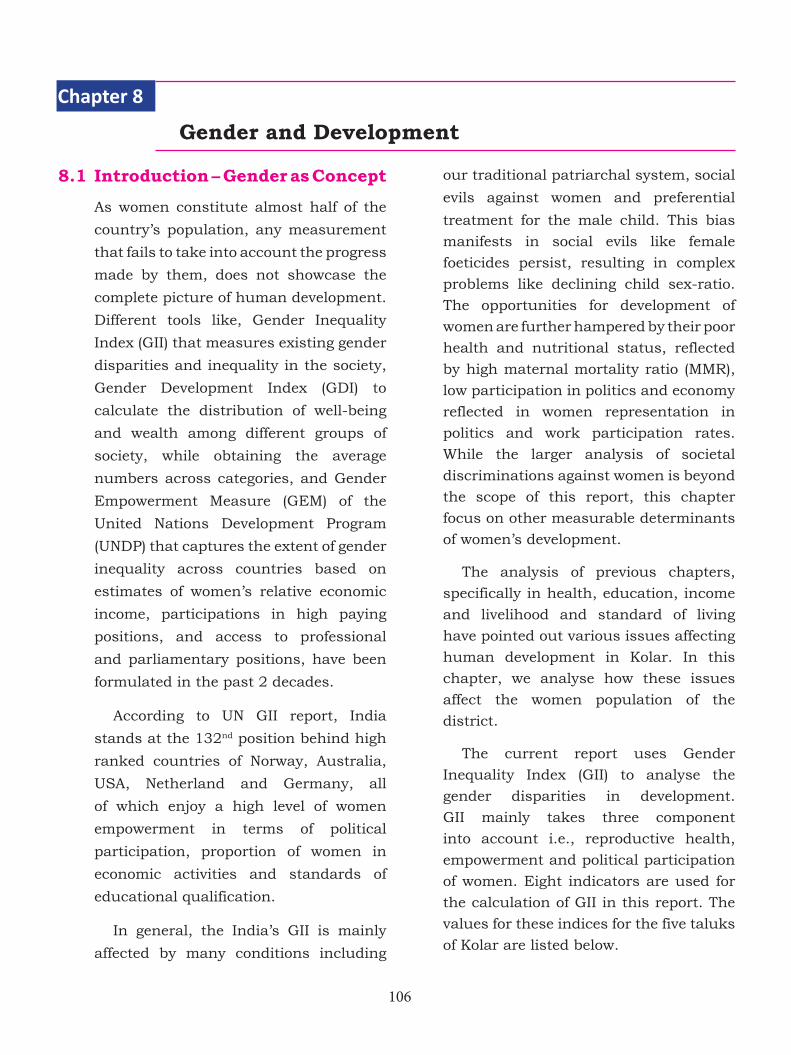
106
8.1 Introduction – Gender as Concept
As women constitute almost half of the
country’s population, any measurement
that fails to take into account the progress
made by them, does not showcase the
complete picture of human development.
Different tools like, Gender Inequality
Index (GII) that measures existing gender
disparities and inequality in the society,
Gender Development Index (GDI) to
calculate the distribution of well-being
and wealth among different groups of
society, while obtaining the average
numbers across categories, and Gender
Empowerment Measure (GEM) of the
United Nations Development Program
(UNDP) that captures the extent of gender
inequality across countries based on
estimates of women’s relative economic
income, participations in high paying
positions, and access to professional
and parliamentary positions, have been
formulated in the past 2 decades.
According to UN GII report, India
stands at the 132nd position behind high
ranked countries of Norway, Australia,
USA, Netherland and Germany, all
of which enjoy a high level of women
empowerment in terms of political
participation, proportion of women in
economic activities and standards of
educational qualification.
In general, the India’s GII is mainly
affected by many conditions including
our traditional patriarchal system, social
evils against women and preferential
treatment for the male child. This bias
manifests in social evils like female
foeticides persist, resulting in complex
problems like declining child sex-ratio.
The opportunities for development of
women are further hampered by their poor
health and nutritional status, reflected
by high maternal mortality ratio (MMR),
low participation in politics and economy
reflected in women representation in
politics and work participation rates.
While the larger analysis of societal
discriminations against women is beyond
the scope of this report, this chapter
focus on other measurable determinants
of women’s development.
The analysis of previous chapters,
specifically in health, education, income
and livelihood and standard of living
have pointed out various issues affecting
human development in Kolar. In this
chapter, we analyse how these issues
affect the women population of the
district.
The current report uses Gender
Inequality Index (GII) to analyse the
gender disparities in development.
GII mainly takes three component
into account i.e., reproductive health,
empowerment and political participation
of women. Eight indicators are used for
the calculation of GII in this report. The
values for these indices for the five taluks
of Kolar are listed below.
Gender and Development
Chapter 8
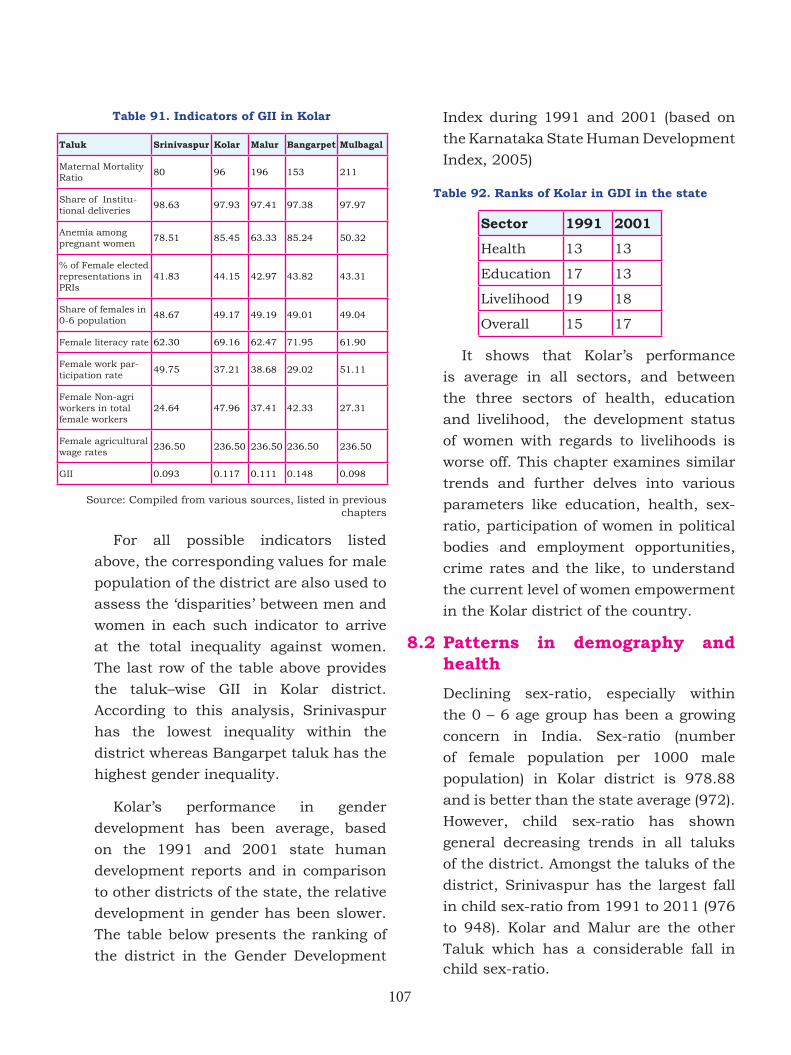
107
Table 91. Indicators of GII in Kolar
Taluk Srinivaspur Kolar Malur Bangarpet Mulbagal
Maternal Mortality Ratio
80 96 196 153 211
Share of Institu-tional deliveries
98.63 97.93 97.41 97.38 97.97
Anemia among pregnant women
78.51 85.45 63.33 85.24 50.32
% of Female elected representations in PRIs
41.83 44.15 42.97 43.82 43.31
Share of females in 0-6 population
48.67 49.17 49.19 49.01 49.04
Female literacy rate 62.30 69.16 62.47 71.95 61.90
Female work par-ticipation rate
49.75 37.21 38.68 29.02 51.11
Female Non-agri workers in total female workers
24.64 47.96 37.41 42.33 27.31
Female agricultural wage rates
236.50 236.50 236.50 236.50 236.50
GII 0.093 0.117 0.111 0.148 0.098
Source: Compiled from various sources, listed in previous chapters
For all possible indicators listed
above, the corresponding values for male
population of the district are also used to
assess the ‘disparities’ between men and
women in each such indicator to arrive
at the total inequality against women.
The last row of the table above provides
the taluk–wise GII in Kolar district.
According to this analysis, Srinivaspur
has the lowest inequality within the
district whereas Bangarpet taluk has the
highest gender inequality.
Kolar’s performance in gender
development has been average, based
on the 1991 and 2001 state human
development reports and in comparison
to other districts of the state, the relative
development in gender has been slower.
The table below presents the ranking of
the district in the Gender Development
Index during 1991 and 2001 (based on
the Karnataka State Human Development
Index, 2005)
Table 92. Ranks of Kolar in GDI in the state
Sector 1991 2001
Health 13 13
Education 17 13
Livelihood 19 18
Overall 15 17
It shows that Kolar’s performance
is average in all sectors, and between
the three sectors of health, education
and livelihood, the development status
of women with regards to livelihoods is
worse off. This chapter examines similar
trends and further delves into various
parameters like education, health, sex-
ratio, participation of women in political
bodies and employment opportunities,
crime rates and the like, to understand
the current level of women empowerment
in the Kolar district of the country.
8.2 Patterns in demography and health
Declining sex-ratio, especially within
the 0 – 6 age group has been a growing
concern in India. Sex-ratio (number
of female population per 1000 male
population) in Kolar district is 978.88
and is better than the state average (972).
However, child sex-ratio has shown
general decreasing trends in all taluks
of the district. Amongst the taluks of the
district, Srinivaspur has the largest fall
in child sex-ratio from 1991 to 2011 (976
to 948). Kolar and Malur are the other
Taluk which has a considerable fall in child sex-ratio.
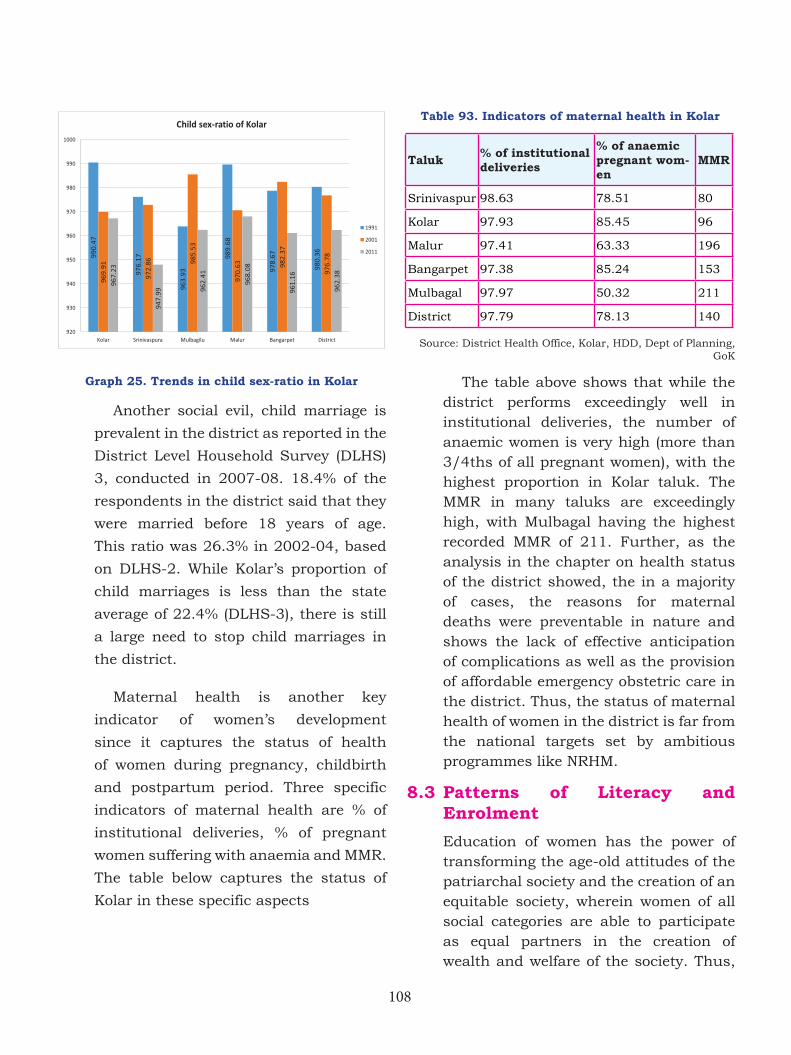
108
Graph 25. Trends in child sex-ratio in Kolar
Another social evil, child marriage is
prevalent in the district as reported in the
District Level Household Survey (DLHS)
3, conducted in 2007-08. 18.4% of the
respondents in the district said that they
were married before 18 years of age.
This ratio was 26.3% in 2002-04, based
on DLHS-2. While Kolar’s proportion of
child marriages is less than the state
average of 22.4% (DLHS-3), there is still
a large need to stop child marriages in
the district.
Maternal health is another key
indicator of women’s development
since it captures the status of health
of women during pregnancy, childbirth
and postpartum period. Three specific
indicators of maternal health are % of
institutional deliveries, % of pregnant
women suffering with anaemia and MMR.
The table below captures the status of
Kolar in these specific aspects
Table 93. Indicators of maternal health in Kolar
Taluk % of institutional deliveries
% of anaemic pregnant wom-en
MMR
Srinivaspur 98.63 78.51 80
Kolar 97.93 85.45 96
Malur 97.41 63.33 196
Bangarpet 97.38 85.24 153
Mulbagal 97.97 50.32 211
District 97.79 78.13 140
Source: District Health Office, Kolar, HDD, Dept of Planning, GoK
The table above shows that while the district performs exceedingly well in institutional deliveries, the number of anaemic women is very high (more than 3/4ths of all pregnant women), with the highest proportion in Kolar taluk. The MMR in many taluks are exceedingly high, with Mulbagal having the highest recorded MMR of 211. Further, as the analysis in the chapter on health status of the district showed, the in a majority of cases, the reasons for maternal deaths were preventable in nature and shows the lack of effective anticipation of complications as well as the provision of affordable emergency obstetric care in the district. Thus, the status of maternal health of women in the district is far from the national targets set by ambitious programmes like NRHM.
8.3 Patterns of Literacy and Enrolment
Education of women has the power of transforming the age-old attitudes of the patriarchal society and the creation of an equitable society, wherein women of all social categories are able to participate as equal partners in the creation of wealth and welfare of the society. Thus,
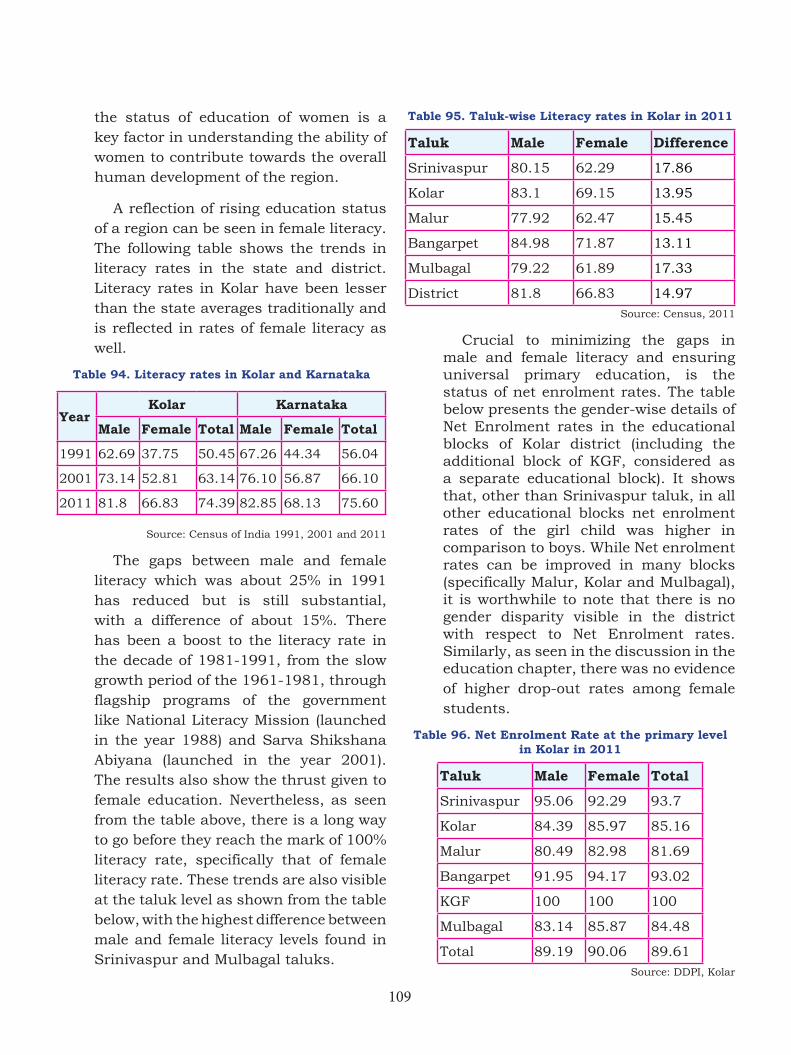
109
the status of education of women is a key factor in understanding the ability of women to contribute towards the overall human development of the region.
A reflection of rising education status of a region can be seen in female literacy. The following table shows the trends in literacy rates in the state and district. Literacy rates in Kolar have been lesser than the state averages traditionally and is reflected in rates of female literacy as well.
Table 94. Literacy rates in Kolar and Karnataka
YearKolar Karnataka
Male Female Total Male Female Total
1991 62.69 37.75 50.45 67.26 44.34 56.04
2001 73.14 52.81 63.14 76.10 56.87 66.10
2011 81.8 66.83 74.39 82.85 68.13 75.60
Source: Census of India 1991, 2001 and 2011
The gaps between male and female literacy which was about 25% in 1991 has reduced but is still substantial, with a difference of about 15%. There has been a boost to the literacy rate in the decade of 1981-1991, from the slow growth period of the 1961-1981, through flagship programs of the government like National Literacy Mission (launched in the year 1988) and Sarva Shikshana Abiyana (launched in the year 2001). The results also show the thrust given to female education. Nevertheless, as seen from the table above, there is a long way to go before they reach the mark of 100% literacy rate, specifically that of female literacy rate. These trends are also visible at the taluk level as shown from the table below, with the highest difference between male and female literacy levels found in Srinivaspur and Mulbagal taluks.
Table 95. Taluk-wise Literacy rates in Kolar in 2011
Taluk Male Female Difference
Srinivaspur 80.15 62.29 17.86
Kolar 83.1 69.15 13.95
Malur 77.92 62.47 15.45
Bangarpet 84.98 71.87 13.11
Mulbagal 79.22 61.89 17.33
District 81.8 66.83 14.97 Source: Census, 2011
Crucial to minimizing the gaps in male and female literacy and ensuring universal primary education, is the status of net enrolment rates. The table below presents the gender-wise details of Net Enrolment rates in the educational blocks of Kolar district (including the additional block of KGF, considered as a separate educational block). It shows that, other than Srinivaspur taluk, in all other educational blocks net enrolment rates of the girl child was higher in comparison to boys. While Net enrolment rates can be improved in many blocks (specifically Malur, Kolar and Mulbagal), it is worthwhile to note that there is no gender disparity visible in the district with respect to Net Enrolment rates. Similarly, as seen in the discussion in the education chapter, there was no evidence of higher drop-out rates among female students.
Table 96. Net Enrolment Rate at the primary level in Kolar in 2011
Taluk Male Female Total
Srinivaspur 95.06 92.29 93.7
Kolar 84.39 85.97 85.16
Malur 80.49 82.98 81.69
Bangarpet 91.95 94.17 93.02
KGF 100 100 100
Mulbagal 83.14 85.87 84.48
Total 89.19 90.06 89.61 Source: DDPI, Kolar
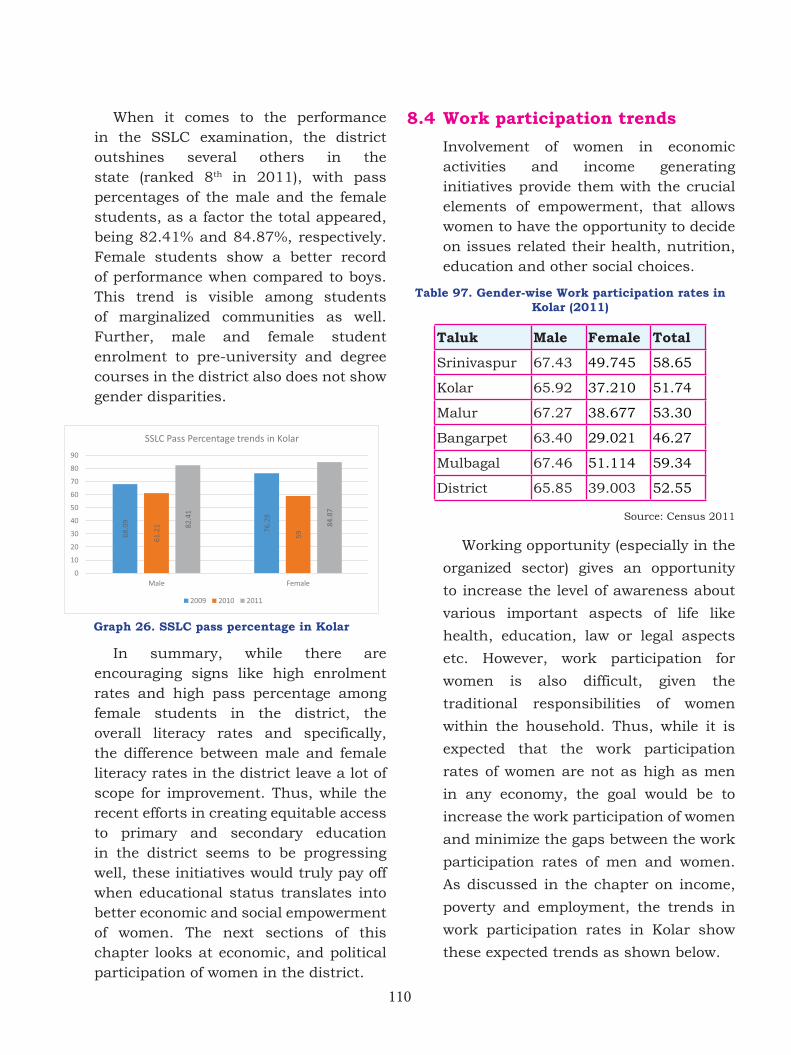
110
When it comes to the performance in the SSLC examination, the district outshines several others in the state (ranked 8th in 2011), with pass percentages of the male and the female students, as a factor the total appeared, being 82.41% and 84.87%, respectively. Female students show a better record of performance when compared to boys. This trend is visible among students of marginalized communities as well. Further, male and female student enrolment to pre-university and degree courses in the district also does not show gender disparities.
Graph 26. SSLC pass percentage in Kolar
In summary, while there are encouraging signs like high enrolment rates and high pass percentage among female students in the district, the overall literacy rates and specifically, the difference between male and female literacy rates in the district leave a lot of scope for improvement. Thus, while the recent efforts in creating equitable access to primary and secondary education in the district seems to be progressing well, these initiatives would truly pay off when educational status translates into better economic and social empowerment of women. The next sections of this chapter looks at economic, and political participation of women in the district.
8.4 Work participation trends
Involvement of women in economic activities and income generating initiatives provide them with the crucial elements of empowerment, that allows women to have the opportunity to decide on issues related their health, nutrition, education and other social choices.
Table 97. Gender-wise Work participation rates in Kolar (2011)
Taluk Male Female Total
Srinivaspur 67.43 49.745 58.65
Kolar 65.92 37.210 51.74
Malur 67.27 38.677 53.30
Bangarpet 63.40 29.021 46.27
Mulbagal 67.46 51.114 59.34
District 65.85 39.003 52.55
Source: Census 2011
Working opportunity (especially in the
organized sector) gives an opportunity
to increase the level of awareness about
various important aspects of life like
health, education, law or legal aspects
etc. However, work participation for
women is also difficult, given the
traditional responsibilities of women
within the household. Thus, while it is
expected that the work participation
rates of women are not as high as men
in any economy, the goal would be to
increase the work participation of women
and minimize the gaps between the work
participation rates of men and women.
As discussed in the chapter on income,
poverty and employment, the trends in
work participation rates in Kolar show
these expected trends as shown below.
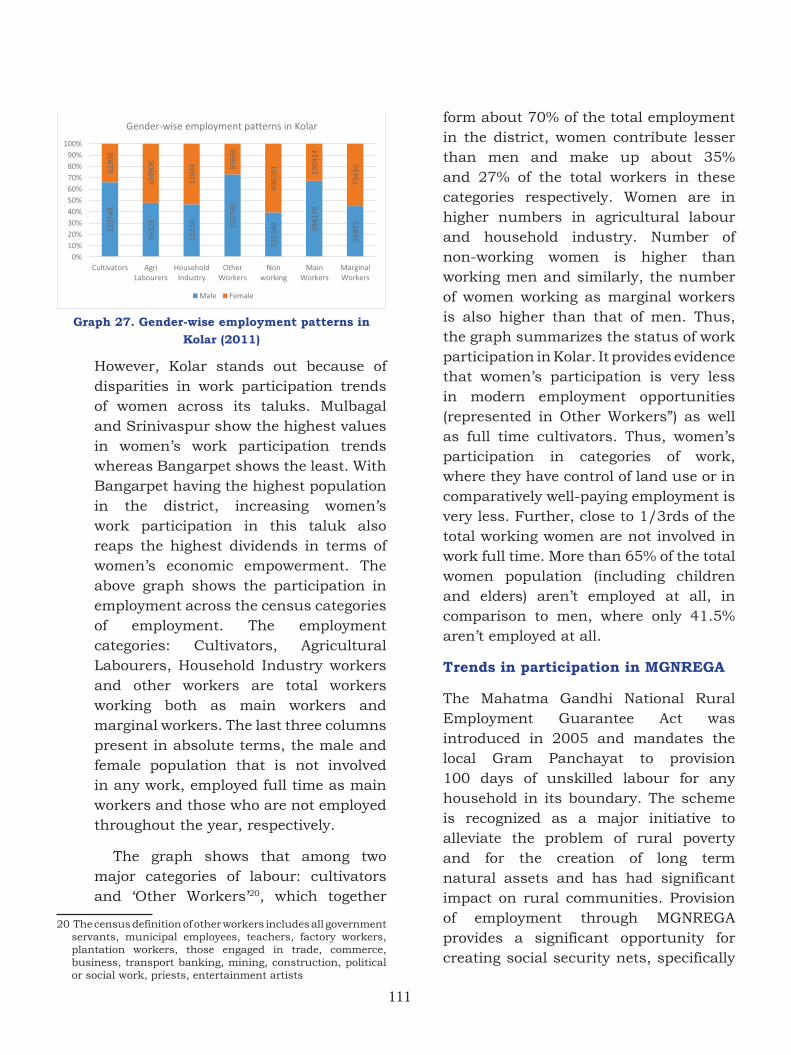
111
Graph 27. Gender-wise employment patterns in Kolar (2011)
However, Kolar stands out because of disparities in work participation trends of women across its taluks. Mulbagal and Srinivaspur show the highest values in women’s work participation trends whereas Bangarpet shows the least. With Bangarpet having the highest population in the district, increasing women’s work participation in this taluk also reaps the highest dividends in terms of women’s economic empowerment. The above graph shows the participation in employment across the census categories of employment. The employment categories: Cultivators, Agricultural Labourers, Household Industry workers and other workers are total workers working both as main workers and marginal workers. The last three columns present in absolute terms, the male and female population that is not involved in any work, employed full time as main workers and those who are not employed throughout the year, respectively.
The graph shows that among two major categories of labour: cultivators and ‘Other Workers’20, which together
20 The census definition of other workers includes all government servants, municipal employees, teachers, factory workers, plantation workers, those engaged in trade, commerce, business, transport banking, mining, construction, political or social work, priests, entertainment artists
form about 70% of the total employment in the district, women contribute lesser than men and make up about 35% and 27% of the total workers in these categories respectively. Women are in higher numbers in agricultural labour and household industry. Number of non-working women is higher than working men and similarly, the number of women working as marginal workers is also higher than that of men. Thus, the graph summarizes the status of work participation in Kolar. It provides evidence that women’s participation is very less in modern employment opportunities (represented in Other Workers”) as well as full time cultivators. Thus, women’s participation in categories of work, where they have control of land use or in comparatively well-paying employment is very less. Further, close to 1/3rds of the total working women are not involved in work full time. More than 65% of the total women population (including children and elders) aren’t employed at all, in comparison to men, where only 41.5% aren’t employed at all.
Trends in participation in MGNREGA
The Mahatma Gandhi National Rural Employment Guarantee Act was introduced in 2005 and mandates the local Gram Panchayat to provision 100 days of unskilled labour for any household in its boundary. The scheme is recognized as a major initiative to alleviate the problem of rural poverty and for the creation of long term natural assets and has had significant impact on rural communities. Provision of employment through MGNREGA provides a significant opportunity for creating social security nets, specifically
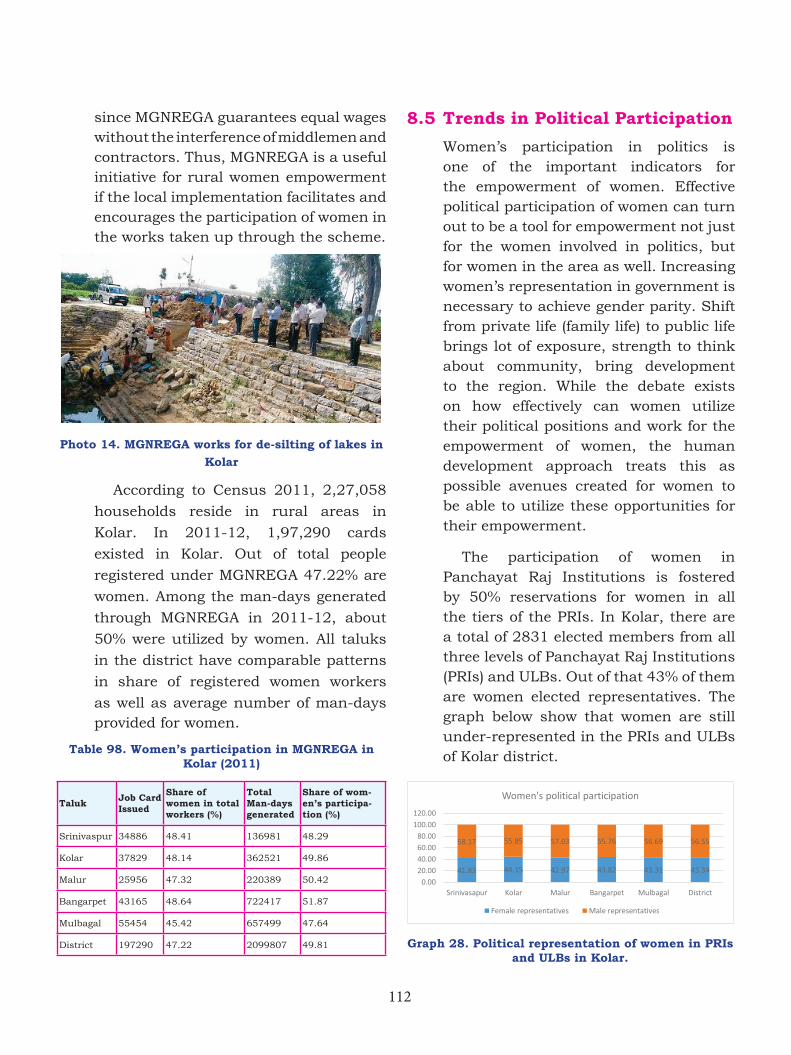
112
since MGNREGA guarantees equal wages without the interference of middlemen and contractors. Thus, MGNREGA is a useful initiative for rural women empowerment if the local implementation facilitates and encourages the participation of women in the works taken up through the scheme.
Photo 14. MGNREGA works for de-silting of lakes in Kolar
According to Census 2011, 2,27,058
households reside in rural areas in
Kolar. In 2011-12, 1,97,290 cards
existed in Kolar. Out of total people
registered under MGNREGA 47.22% are
women. Among the man-days generated
through MGNREGA in 2011-12, about
50% were utilized by women. All taluks
in the district have comparable patterns
in share of registered women workers
as well as average number of man-days provided for women.
Table 98. Women’s participation in MGNREGA in Kolar (2011)
Taluk Job Card Issued
Share of women in total workers (%)
Total Man-days generated
Share of wom-en’s participa-tion (%)
Srinivaspur 34886 48.41 136981 48.29
Kolar 37829 48.14 362521 49.86
Malur 25956 47.32 220389 50.42
Bangarpet 43165 48.64 722417 51.87
Mulbagal 55454 45.42 657499 47.64
District 197290 47.22 2099807 49.81
8.5 Trends in Political Participation
Women’s participation in politics is one of the important indicators for the empowerment of women. Effective political participation of women can turn out to be a tool for empowerment not just for the women involved in politics, but for women in the area as well. Increasing women’s representation in government is necessary to achieve gender parity. Shift from private life (family life) to public life brings lot of exposure, strength to think about community, bring development to the region. While the debate exists on how effectively can women utilize their political positions and work for the empowerment of women, the human development approach treats this as possible avenues created for women to be able to utilize these opportunities for their empowerment.
The participation of women in Panchayat Raj Institutions is fostered by 50% reservations for women in all the tiers of the PRIs. In Kolar, there are a total of 2831 elected members from all three levels of Panchayat Raj Institutions (PRIs) and ULBs. Out of that 43% of them are women elected representatives. The graph below show that women are still under-represented in the PRIs and ULBs of Kolar district.
Graph 28. Political representation of women in PRIs and ULBs in Kolar.
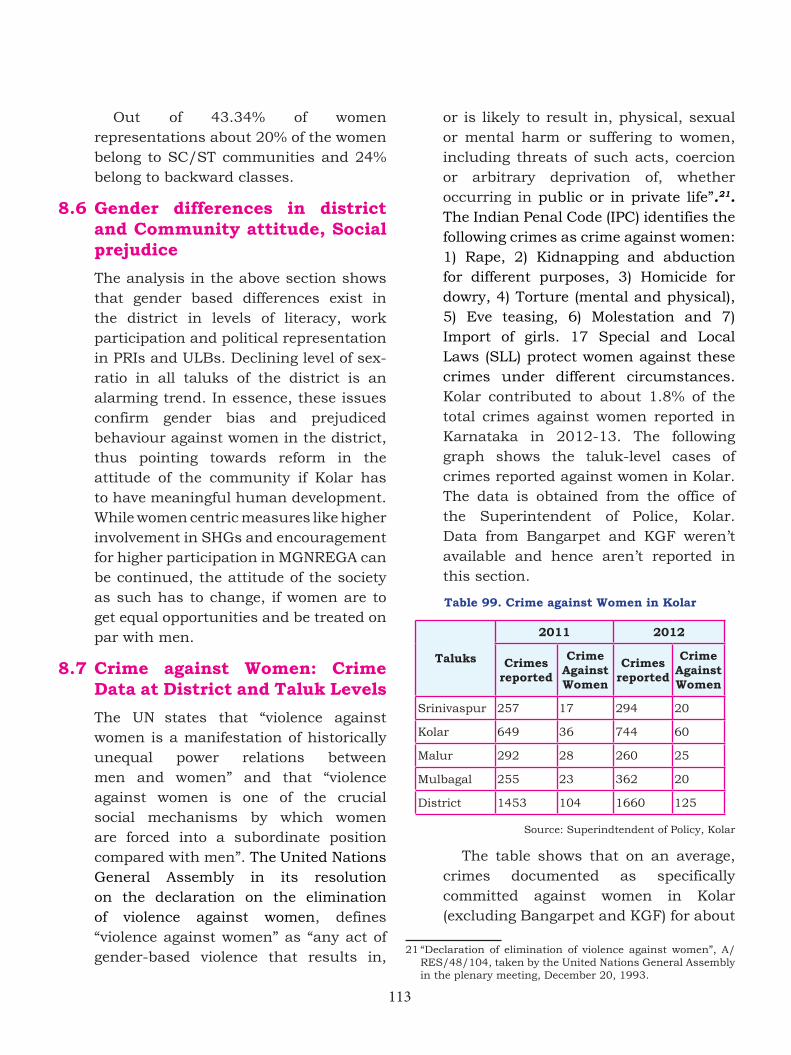
113
Out of 43.34% of women representations about 20% of the women belong to SC/ST communities and 24% belong to backward classes.
8.6 Gender differences in district and Community attitude, Social prejudice
The analysis in the above section shows that gender based differences exist in the district in levels of literacy, work participation and political representation in PRIs and ULBs. Declining level of sex-ratio in all taluks of the district is an alarming trend. In essence, these issues confirm gender bias and prejudiced behaviour against women in the district, thus pointing towards reform in the attitude of the community if Kolar has to have meaningful human development. While women centric measures like higher involvement in SHGs and encouragement for higher participation in MGNREGA can be continued, the attitude of the society as such has to change, if women are to get equal opportunities and be treated on par with men.
8.7 Crime against Women: Crime Data at District and Taluk Levels
The UN states that “violence against women is a manifestation of historically unequal power relations between men and women” and that “violence against women is one of the crucial social mechanisms by which women are forced into a subordinate position compared with men”. The United Nations General Assembly in its resolution on the declaration on the elimination of violence against women, defines “violence against women” as “any act of gender-based violence that results in,
or is likely to result in, physical, sexual or mental harm or suffering to women, including threats of such acts, coercion or arbitrary deprivation of, whether occurring in public or in private life”.21. The Indian Penal Code (IPC) identifies the following crimes as crime against women: 1) Rape, 2) Kidnapping and abduction for different purposes, 3) Homicide for dowry, 4) Torture (mental and physical), 5) Eve teasing, 6) Molestation and 7) Import of girls. 17 Special and Local Laws (SLL) protect women against these crimes under different circumstances. Kolar contributed to about 1.8% of the total crimes against women reported in Karnataka in 2012-13. The following graph shows the taluk-level cases of crimes reported against women in Kolar. The data is obtained from the office of the Superintendent of Police, Kolar. Data from Bangarpet and KGF weren’t available and hence aren’t reported in this section.
Table 99. Crime against Women in Kolar
Taluks
2011 2012
Crimes reported
Crime Against Women
Crimes reported
Crime Against Women
Srinivaspur 257 17 294 20
Kolar 649 36 744 60
Malur 292 28 260 25
Mulbagal 255 23 362 20
District 1453 104 1660 125
Source: Superindtendent of Policy, Kolar
The table shows that on an average, crimes documented as specifically committed against women in Kolar (excluding Bangarpet and KGF) for about
21 “Declaration of elimination of violence against women”, A/RES/48/104, taken by the United Nations General Assembly in the plenary meeting, December 20, 1993.
114
7%-8% of the total crimes committed in the district. Due to societal pressures and fear of exposure, it is difficult for all cases of crime/violence against women to get registered and eventually for the culprits to get implicated.
8.8 Self-help groups and women empowerment
SHGs were developed to reduce poverty, improve skill especially among women and bring equality by reducing the patriarchal, domination of men in a society. As majority of women lack assets that help contribute to their empowerment and well-being, economic independence through self-employment and entrepreneurial development must be paid attention to. So the Government of India started the concept of Self-Help Groups (SHGs). Many research studies, evaluation studies has shown that, SHGs has played an important role in not just reducing the poverty but also empowering the rural women.
SHGs have the other useful effect of empowering women of marginalized classes as well. There are around 1,39,983 women SHGs functioning in Karnataka with 18,52,067 members, out of which 4,05,477 are SC and 1,60,032 are ST women. The total saving of these SHGs in Karnataka is up to Rs 1,080 Crores. In Kolar, there are 4221 SHGs with a total of 70300 women registered under them. 20308 SC women and 5392 ST women ((9% and 10% of the SC and ST women population respectively) of Kolar are engaged in SHGs. A total of Rs 2.84 Crores has been the accumulated savings of the SHGs in the district. Major sectors of activities of these groups include Diary, horticulture and agriculture.
8.9 Govt initiatives to secure, promote and safe guard women
Many schemes have been introduced by the Centre as well by the State Govt to improve the status of women. Schemes like Mother and child tracking system (to improve the health status of pregnant women and children), Indira Gandhi Matritva Sahyog Yojana, Conditional Maternity Benefit plan known as (CMB), and the Rajiv Gandhi Scheme for Empowerment of Adolescent Girls - Sabala or otherwise referred to as (RGSEAG). The Rashtriya Mahila Kosh (The National Credit Fund for Women) referred to as (RMK), Priyadarshini – SHGs development etc was introduced at the National level where as at the State level important programs like Bhagyalakshmi scheme, attendance scholarship for girls from rural areas, crèches for the children of working women, Housing scheme for women (Indira Awas Yojana), widow pension scheme, Ujjawala (for the Prevention of Trafficking and Rescue, Rehabilitation and Re – integration of victims of trafficking and Commercial Sexual Exploitation) are some of the schemes implemented in Karnataka to improve the status of women. Three schemes are briefly described and the status of their implementation is explored in this section
Bhagyalakshmi Scheme
The Bhagyalakshmi Scheme was launched by the State Government in 2006 with the aim of reducing imbalance of sex ratio. The benefits of the scheme are restricted to a maximum of two girl children from below poverty line (BPL) families. Till August 2008, the amount was restricted to 40619 but it was
115
revised again and increased the amount to 100000. At the time of birth, Rs 19300 is deposited in the name of girl child and after girls turn 18, Rs 100000 is given to them
In Kolar, 36783 children have been benefitted by this scheme. Among the taluks of Kolar, Kolar taluk had issued highest number of bonds to children followed by Bangarpet and Mulbagal.
Indira Awaas Yojana
This is a centrally sponsored scheme introduced in 1989-90, this scheme is implemented for rural BPL houseless families. 60% of the target is earmarked for SCs/STs, 15% for religious minorities and the remaining for others. It has now been converted into a women’s social welfare in which, the beneficiaries have to be women. Under the scheme, financial assistance worth Rs.63,500/- in plain areas and Rs.75,000/- in difficult areas (high land area) is provided for construction of houses. The houses are allotted in the name of the woman or jointly between husband and wife. In 2011, 2825 houses were sanctioned to Kolar district, out of which 1345 houses have been completed.
Social Pension schemes
Pension schemes like Indira Gandhi Old age pension scheme, Widow pension schemes are the important programs initiated by the centre and state governments to protect the life of aged and widows in Karnataka. Widow Pension: Indira Gandhi National Widow Pension Scheme (IGNWPS) is implemented by Ministry of Rural Development, Government of India. The pension is given to the widows aged between 45 and 64
years of age and widow belong to below poverty line. The pension amount is Rs. 400, half of equal contribution made by both Central and State Govt. Currently 34,511 women in Kolar are receiving widow pensions
8.10 Concluding Remarks
This chapter presented different facets
of gender development in Kolar. It shows
that gender based disparities distinctly
exist in the district and is visible in the
areas of literacy, work participation
(specifically under the categories of
cultivators and other employments)
and political representation in PRIs and
ULBs. The political scenario of Kolar does
not seem to be very conducive to equal
participation of women since both in PRIs
as well as ULBs, women’s representation
is well below the 50% mark. Further,
Kolar also faces the alarming signs of
declining sex-ratios in all its taluks, the
highest being in Mulbagal. Mulbagal
also has the highest MMR crossing 200,
which in the context of the targets set by
NRHM, is unacceptable.
Specific problems like lower quality of
work allocated to women, higher marginal
labour among women can be handled by
encouraging SHG based livelihood options
in the district, that explore innovative
ideas towards integration with existing
government schemes like MGNREGA and
vocational and skill training programmes
targeted towards rural women that not
only enable women to take up jobs that
aren’t being tapped by them in the labour
market, but also significantly improve
their economic status, thus providing the
impetus for social empowerment as well.
116
8.11 Small area study: Namma Dhwani Community Radio
Introduction
Empowerment of communities so that they are able to undertake initiatives towards their own development is a long drawn process and depends on several socio-economic, political and cultural factors. While effective capacity building of communities and leaders within the community is the key to the success of empowerment efforts, sustaining the empowerment is an even more challenging task. For several decades, NGOs have been engaged in the empowerment efforts, but have been challenged in sustaining the empowerment and handling their own withdrawal from the process. It calls for strategies that involve supporting the communities with minimal external resources and for innovative ways in which community members are engaged.
One such successful initiative is the Namma Dhwani Community Radio station in Budikote Gram Panchayath in Bangarpet Taluk of Kolar District. Housed in a Community Managed Resource Centre (CMRC) in Budikote, the radio-station has been contributing to sustaining community empowerment, especially that of women. This case study examines the various aspects of the initiative including factors contributing to its success, challenges and community perceptions.
About Budikote
Budikote is a small village situated in Bangarpet Taluk of Kolar District and located at a distance of about 15 kilometers from Kolar Gold Fields (KGF). The place is famous for and named after
its “fort of ash”, and has a historical significance of being the birth place of of Nawab Hyder Ali Khan, father of Tippu Sulthan. Budikote has a population of 3347 with 757 households. The people here mainly depend on agriculture and small businesses for their livelihood.
Community Radio – an overview
Community radio is a form of broadcasting which is called the third model, the other two being commercial and public broadcasting. Its content is focused and relevant to people in a limited geography, usually a radius of 10 to 20 kms from the broadcasting tower. Essentially Community radios are non-profit initiatives and are operated, owned, and influenced by the communities they serve. Community radios gained momentum in India in the mid-nineties and currently there are nearly 130 initiatives in India, either promoted by NGOs or Educational Institutions. In Karnataka, there are 11 community radio stations and Namma Dhwani is the first NGO promoted Community Radio in Karnataka and the only one that is fully managed by the community.
The SHG movement and Community Managed Resource Centres (CMRC)
The community radio initiative in Budikote is part of a larger community empowerment movement led by MYRADA – a non-governmental organization established in 1968 and working towards poverty alleviation and community empowerment using a capability building approach in several districts of Karnataka, Andhra Pradesh and Tamil Nadu. Facilitating the creation and growth of self-help groups and
117
support through financial institutions with credit have been key instruments in the direction of empowerment of the poor, especially women. Studies have also shown that the experience of participation and governance of community institutions such as Self-help groups leads to people’s environment. Further, the federation of multiple SHGs and formation of a second tier institution that helps in providing services such as capacity building, audits, linkages to banks, legal awareness, quality checks and following of regulations among others become important in organizing as well as sustaining the SHGs and the empowerment process. These institutions are managed by members of SHGs themselves and are also a resource for multiple activities and information for the SHGs and are appropriately called Community Managed Resource Centres.
Self-help groups – a movement to empower women
The concept of self-help groups emerged in the nineteen eighties when the larger Cooperative Societies organized by MYRADA broke down, but the smaller groups of poorer members of the societies had to be organized so that they could manage credit and leverage economic and social benefits from the collective. These groups were formed based on the affinity existing within its members and were hence also referred to as Self-help Affinity Groups (SAGs), and mutual trust and support among members was recognized as the strength of these groups. By 1986 at least 300 groups were formed by MYRADA and various studies and strategies to link these groups with banks were being worked out.
Beyond providing linkages to the banks, strengthening the institutional capacities of the groups, training members to be change-agents and break social and political barriers, providing opportunities of productive skill-building to members for and advocating for changes in the rules and standards in the official financial system that could be applied to these groups were some of the key activities conducted.
It was in 1992 that NABARD initiated the process of lending to these unregistered groups and over a period of time RBI as well as NABARD came up with policy changes on lending to these groups. The linkages with the banks was a major milestone in the growth of SHGs as a credit system that could be successfully implemented had to be developed based on local contexts. Access to credit to the poor at reasonable and consistent rates is identified as one of the critical tools of empowerment as it helps in mitigating the increasing vulnerability that is associated with the informal money-lenders.
In terms of empowerment of women, studies indicate several areas of impact that include status of the woman SHG member in her family, the increase in participation of women in decision making, attitudinal changes towards girl-child, increased participation of women in spaces such as Grama Sabhas, awareness of rights and procedures, and most importantly attitude of men towards women. In places where women walking up to a bank and handling transactions was unheard of, the SHGs have helped created a semblance of equity in the gender relations in the villages. It must
118
be noted that these changes have taken place over years and they were not without initial hurdles and socio-political challenges.
Emergence of CMRC
By 1996, federations of SHGs, with about 20 to 25 groups in each federation were being organized with the objectives of collection and analysis of data on trends in savings, performance, repayment of loans, etc by the SHGs so that livelihood interventions could be planned and for conflict resolution and also to mobilize support for social and governance issues. However, the federations had limitations in their structure and could not meet the increasing demands because of lack of full-time staff, resources and limited organizational capabilities. At the same time, the role of the promoting NGO also had to be minimised and a process of withdrawal had begun. This paved way for the creation of a structure wherein a larger group of SHGs, numbering 100 to 150 could come together regardless of whether they were promoted by Government programs or NGOs and form a registered body whose key objective is to provide resources for facilitating administrative and accounting functions of SHGs. An experienced staff member would manage this organization along with the support of a team and a Board of directors elected from the community. This centre, known as Community Managed Resource Centre or CMRC would offer a combination of chargeable and free services to the SHGs and CBOs who sign-up members, and the scale of functioning is supposed to generate funds for the sustenance of the Centre including the salaries of the manager and the staff.
Namma Dhwani Sampanmula Samsthe (Namma Dhwani CMRC)
Namma Dhwani CMRC, located in Budikote in Bangarpet Taluk is one of the 9 CMRCs functioning in Kolar District. Currently this resource centre works with 112 SHGs from 48 villages spread across 5 Gram Panchayaths, which includes 58 MYRADA promoted Self-help Affinity Groups and other CBOs including SHGs promoted by the Department of Women and Child Development. The management committee of the CMRC has 7 members, 6 of who are members of the community, who take the major operational decisions. The objective of the CMRC is “to provide day to day information and timely & needy services to the member CBOs and community”.
The centre offers certain services at a fixed annual fee such as updating the books of accounts & preparation of financial statements of the groups, trainings to the member organizations, documentation, and solving problems, if any. It also offers services such as auditing of books, providing linkages with LPG suppliers, insurance, banking, skill-training institutions, etc., offering the centre’s training hall on rent and computer trainings & related services at additional charges. The CMRC also provides free services to the groups that include conducting camps, health referrals, providing basic support with banking procedures, providing daily market prices for vegetables and cocoons, support to new SHGs and also legal awareness and referrals, if necessary.
The CMRC premises serves as a meeting point for members of SHGs besides serving as a knowledge
119
resource/information centre on various issues. It also houses the recording and broadcasting studio of Namma Dhwani Community radio station.
Namma Dhwani Community Radio Station
Namma Dhwani, meaning “our voice” is an initiative was set up with a collaborative effort of three institutions, namely, (i) UNESCO for providing equipment, (ii) MYRADA for providing space/building and (iii) VOICES for the overall coordination and technical support. The Community Radio initiative started in 2002 with cable casting in two villages and by 2007 had extended its service to 40 villages through narrow casting. The broadcasting license was obtained from the Ministry of Information and Broadcasting, Govt. of India in 2008-09 and the project was initially supported by Dr. Kasthurirangan’s MPLAD fund and Novib, a Dutch philanthropic foundation. Since 2010, Namma Dhwani Community Radio functions as a well-equipped radio station and is part of the Community Managed Resource Centre supported by MYRADA.
The community audio production centre was started during September 2001. The centre has a recording studio and an instrument room complete with required mixers and recorders. The programmes are decided and operated by the local communities who are the board members of CMRC. The coverage of the radio extends to 86 villages within a 10km radius across 8 GPs in Bangarpet and Malur Taluks reaching 6617 families. A recent survey estimated that there are 3924 families that are active listeners and most of these are members of SHGs.
Program Details
Namma Dhwani community radio station broadcasts programs in 4 languages viz. Kannada, Telugu, Tamil and Urdu for 8 hours a day. The themes for the programs include agriculture, irrigation, health, education, traditional medicine, devotional songs, cookery, live debates, information on government schemes, local festivals and cultural events related announcements, awareness on legal issues, environment, self-help groups, women and youth, news and other social issues etc. The programs follow the guidelines of the Ministry of Information and Broadcasting as far as the content of the programs are concerned. The members of the CMRC, almost all of who are locals decide on the broadcasting schedule of the programs.
The formats of the programs include interviews both in & outside CR studio, subject based panel discussion, audio skits and plays, awareness songs, public service announcements, success stories CBOs & individuals, folk songs from communities and live programs (questions and answers). The community members contribute actively to the content of the programs mainly in two ways.
• There are resourceful locals who contribute to content that include people with good knowledge on agricultural practices, eloquent speakers on health issues, education, adolescent issues, etc. in addition to people contributing with folk songs, cultural programs, etc.
• Community members also contribute in the form of field recordings and interviews conducted by the station staff on various issues and problems faced by them, community perspectives and ground level information on development schemes.
120
Many of the contributors are women SHG members from in and around Budikote village and they attribute their high levels of awareness to the programs broadcast community radio. Some SHGs make sure that they are contributing consistently by exploring themes and providing content on a rotational basis.
As per the guidelines, at least 50% of the content for community radio should come from the community. In the case of Namma Dhwani Community Radio, a significant amount of content does come from the community, but the technical support for content development, which includes scripting and final program design has to be provided by the station staff.
Impact of the programs
The impact of the programs aired through the radio station goes beyond providing information and awareness to the community. It has also led to the addressing of local issues including health and sanitation and improvement of some basic services. The most distinguishable impact is seen in terms of the confidence and attitude of the women members.
In interviews with the CMRC staff as well as with the community members, it was apparent that the women have come a long way from facing resistance by the men-folk in their homes to participation in SHG activities to confidently talk about women’s health issues, home remedies and other locally relevant contemporary topics on the radio. This has been the result of the effort of many years and the radio programs are providing a platform for such empowerment to sustain.
• The radio has contributed to solving local issues as well. For instance, a water scarcity issue resulting from the failure of many borewells that was unaddressed by local authorities for quite some time was given coverage in the radio. In the radio program, the problems faced by the community were highlighted through interviews with affected people. This put pressure on the local authorities to think about alternative solutions and as a result, water was shared by private well owners till other arrangements are made.
• Though, the study did not capture the exact number of cases recorded, there is a strong perception and belief that crime against women, including domestic violence, has come down over the years. This is attributed to the legal awareness and support provided by CMRC as well as related radio programs.
Most women as well as the CMRC staff felt that participating in a radio program itself is an empowering experience, and while they concede that they were very hesitant initially, the fact that listening to themselves or one of their own community feels very positive. Even the men who were interviewed said that women would not step out of the house earlier and were restricted in many ways. Now the women not only visit Gram Panchayaths, banks, other government offices confidently, but some of them are also entrepreneurs. The women also take the initiative in celebrating national festivals in the village or the school and use the radio as a platform to disseminate information about the same.
Community voices
(Comments from women SHG members
interviewed during the study)
121
“We did not know about SHGs in the
beginning. We started with savings of
rupees 10, 20, 50 and so on. Then we got
loans for Rs. 50,000 from banks and now
we have been able to get loans of Rs. 5
lakhs and subsidy from Taluk Panchayath
of Rs. 1.5 lakh. Despite initial opposition
from family members earlier, now they
are supporting us because of the benefits
of SHG. People are respecting us now
because we have no hesitation in going
to GP, banks or Govt. offices”
“I am a regular listener or a program
called Arogya Bhagya. Recently a
gynaecologist provided awareness on
women’s health issues on the radio. It was
a trigger for further consultation with the
doctor for different problems and some of
the women got due treatment.”
“Because of SHGs, we are empowered
in terms of talking in front of a mass. We
are able to go everywhere like TP, banks,
etc. Earlier I did not even know how to
sign or even to calculate money, but now
I am able to sign and calculate money in
lakhs”
“Programs like songs and skits from
the school children are very interesting
and attractive to children. The radio is
a forum for children to show and shape
their talent. When the listeners praise
the children, more children and parents
will be motivated to give programs in the radio”.
Challenges & the way forward
The Community Radio station also faces its own share of challenges, especially in terms of sustainability and growth. By
its nature, community radio has to serve a defined community within a defined geographical area. With hardly any scope for increasing its subscriber base, there is a lot of pressure to be innovative and creative and at the same time financially viable. One of the main challenges with Community radio is that of paying the spectrum fee which has been hiked up from Rs. 19,700/- to Rs. 91,000/- in April 2012 as per information provided by CMRC management. High operating costs would need support from external sources and hence self-sustenance would be a question.
Community radio also has to compete with newer and conventional forms of media that occupy the subscribers’ time. With television and mobile media content making rapid strides, it is a challenge for community radio to keep up with the pace of transformation. The technical as well as financial support needed towards this can tend to be high, which could also mean restrictions in the level of participation by the community.
Rural community radio stations such as Namma Dhwani also face a challenge of staff turnover. While the training provided by the CMRC in handling the radio operations are proving very useful for the youth to develop their own careers, it also results in staff turnover at Namma Dhwani itself. Though this is a problem, the management at CMRC took it positively as they believed that this is also developing youth who can grab opportunities.
Lastly, it must be strongly underlined that the Community Radio station and Budikote is part of the CMRC and is acting as an extension of its services. It would be very difficult to establish an identity and context for the radio station
122
to sustain without the CMRC. This may not necessarily be a drawback, but an evidence that community radio – though intended to be run by the community with the purpose of empowerment and people’s development can contribute towards its purpose only when it is part of a larger development initiative or a social movement.
The way forward
As a way forward, the Government must look into the sustainability issues of community radios as they are an effective tool to reach out to the community and instrumental in addressing the last mile issues with many Govt. schemes. At the same time, more grassroots NGOs could also work together and use the platform provided by community radio for convergent action on development. It is also important to not just provide technical and financial support to such initiatives, but measures must be taken to create and nurture a talent pool who can contribute creatively to community radio. Towards this training centres must be established and information about careers in this space must also be highlighted.Despite the challenges mentioned above, as long as the content is relevant to the pressing issues that communities face, community radio would definitely have a context and it is up to the stakeholders including district administration, communities and organizations to exploit it and contribute to the human development of the region.
Conclusion
Namma Dhwani Community Radio station provides a successful example of how a locally managed radio station
can play a role in sustaining community empowerment. However, it also has a challenge in keeping itself relevant in the face of rapid advances in technology that give people more options to access information. In a few years, a generation that contributed to it and was impacted most, would have passed by and it remains to be seen how the community radio station caters to the needs of the next generation. While the radio station and the information disseminated through it clearly shows that it can contribute significantly to social change, we must also note the many years of investment in community empowerment by the promoting NGO. The SHG movement has led to empowerment of women in multiple ways and the services provided by the Community Managed Resource Centre at Budikote along with other Community Resource Centres plays an active role in keeping up good practices of the SHGs. Further, it is seen that Namma Dhwani Community Radio station effectively complements the work of the CMRC.
This goes on to establish that in the backdrop of a strong community empowerment movement, Community Radio stations can provide a vital link to sustain it and take it further and it is difficult to envision that such success at the grassroots level can be achieved by a radio station by itself or in isolation. Thus we may conclude that while community radios play an important role in shaping a development discourse amongst people within a particular geography, it would be much more effective if the promoting agencies are also involved at the grassroots level and play an active role in holistic development interventions in that geography.
* * * *
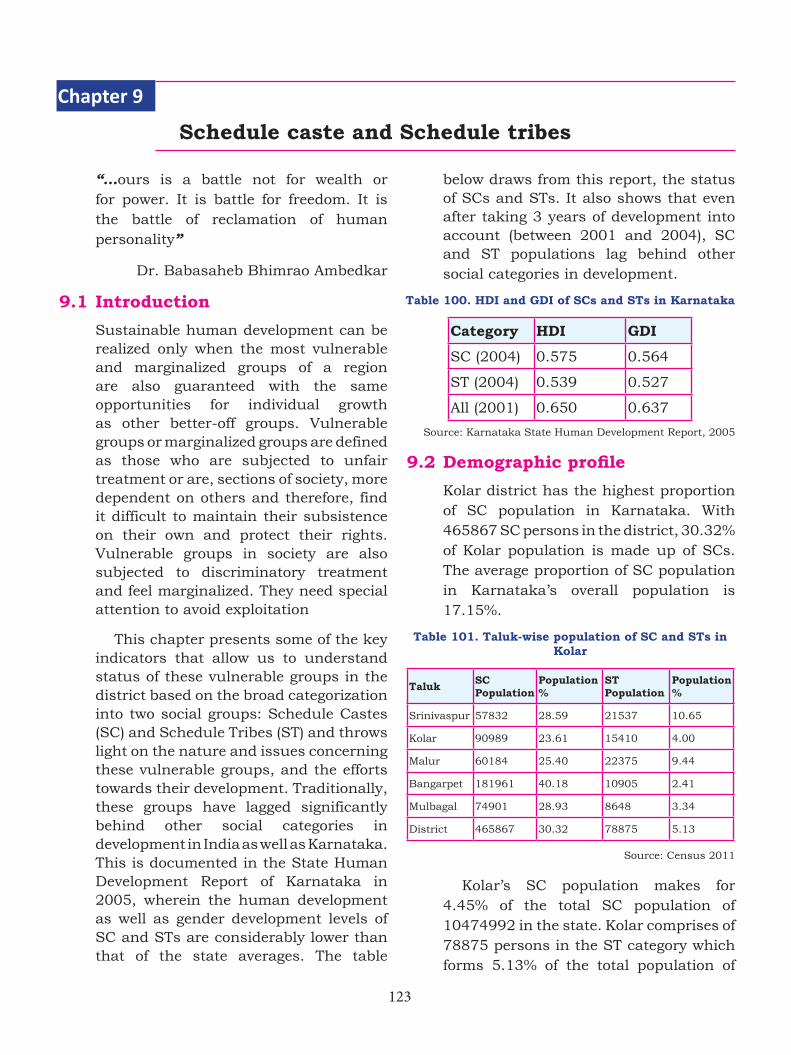
123
“…ours is a battle not for wealth or for power. It is battle for freedom. It is the battle of reclamation of human personality”
Dr. Babasaheb Bhimrao Ambedkar
9.1 Introduction
Sustainable human development can be realized only when the most vulnerable and marginalized groups of a region are also guaranteed with the same opportunities for individual growth as other better-off groups. Vulnerable groups or marginalized groups are defined as those who are subjected to unfair treatment or are, sections of society, more dependent on others and therefore, find it difficult to maintain their subsistence on their own and protect their rights. Vulnerable groups in society are also subjected to discriminatory treatment and feel marginalized. They need special attention to avoid exploitation
This chapter presents some of the key indicators that allow us to understand status of these vulnerable groups in the district based on the broad categorization into two social groups: Schedule Castes (SC) and Schedule Tribes (ST) and throws light on the nature and issues concerning these vulnerable groups, and the efforts towards their development. Traditionally, these groups have lagged significantly behind other social categories in development in India as well as Karnataka. This is documented in the State Human Development Report of Karnataka in 2005, wherein the human development as well as gender development levels of SC and STs are considerably lower than that of the state averages. The table
below draws from this report, the status of SCs and STs. It also shows that even after taking 3 years of development into account (between 2001 and 2004), SC and ST populations lag behind other social categories in development.
Table 100. HDI and GDI of SCs and STs in Karnataka
Category HDI GDI
SC (2004) 0.575 0.564
ST (2004) 0.539 0.527
All (2001) 0.650 0.637
Source: Karnataka State Human Development Report, 2005
9.2Demographicprofile
Kolar district has the highest proportion of SC population in Karnataka. With 465867 SC persons in the district, 30.32% of Kolar population is made up of SCs. The average proportion of SC population in Karnataka’s overall population is 17.15%.
Table 101. Taluk-wise population of SC and STs in Kolar
Taluk SC Population
Population %
ST Population
Population %
Srinivaspur 57832 28.59 21537 10.65
Kolar 90989 23.61 15410 4.00
Malur 60184 25.40 22375 9.44
Bangarpet 181961 40.18 10905 2.41
Mulbagal 74901 28.93 8648 3.34
District 465867 30.32 78875 5.13
Source: Census 2011
Kolar’s SC population makes for 4.45% of the total SC population of 10474992 in the state. Kolar comprises of 78875 persons in the ST category which forms 5.13% of the total population of
Schedule caste and Schedule tribes
Chapter 9
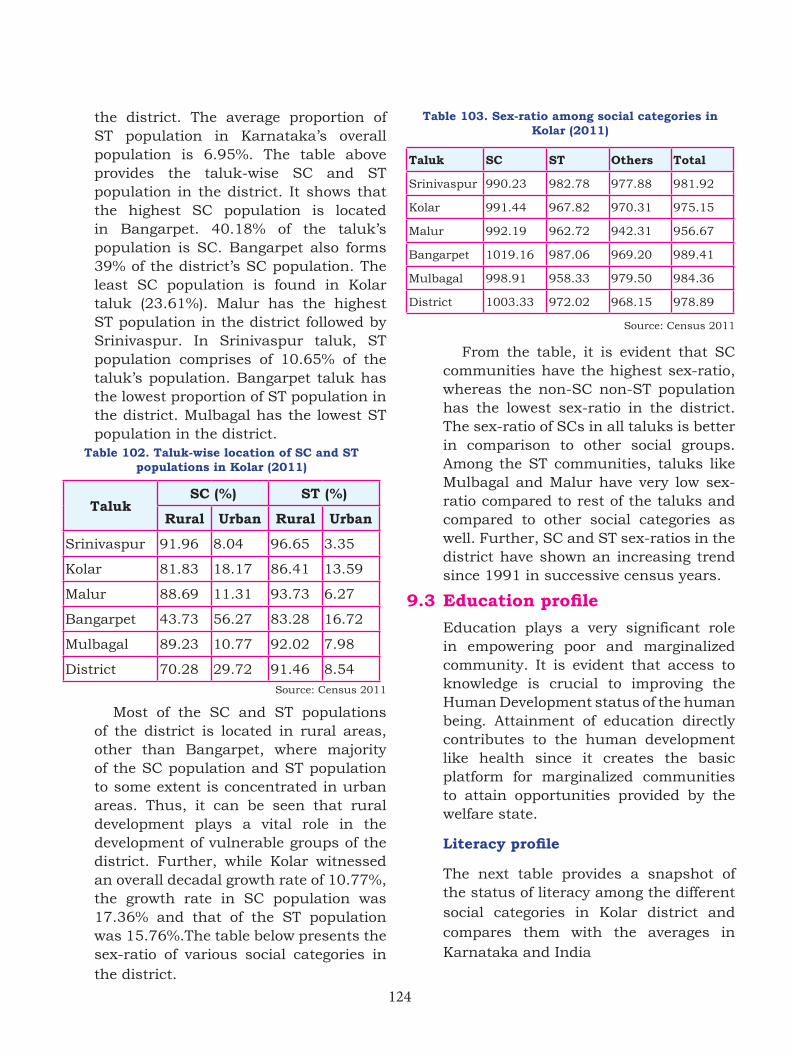
124
the district. The average proportion of ST population in Karnataka’s overall population is 6.95%. The table above provides the taluk-wise SC and ST population in the district. It shows that the highest SC population is located in Bangarpet. 40.18% of the taluk’s population is SC. Bangarpet also forms 39% of the district’s SC population. The least SC population is found in Kolar taluk (23.61%). Malur has the highest ST population in the district followed by Srinivaspur. In Srinivaspur taluk, ST population comprises of 10.65% of the taluk’s population. Bangarpet taluk has the lowest proportion of ST population in the district. Mulbagal has the lowest ST population in the district.
Table 102. Taluk-wise location of SC and ST populations in Kolar (2011)
TalukSC (%) ST (%)
Rural Urban Rural Urban
Srinivaspur 91.96 8.04 96.65 3.35
Kolar 81.83 18.17 86.41 13.59
Malur 88.69 11.31 93.73 6.27
Bangarpet 43.73 56.27 83.28 16.72
Mulbagal 89.23 10.77 92.02 7.98
District 70.28 29.72 91.46 8.54Source: Census 2011
Most of the SC and ST populations of the district is located in rural areas, other than Bangarpet, where majority of the SC population and ST population to some extent is concentrated in urban areas. Thus, it can be seen that rural development plays a vital role in the development of vulnerable groups of the district. Further, while Kolar witnessed an overall decadal growth rate of 10.77%, the growth rate in SC population was 17.36% and that of the ST population was 15.76%.The table below presents the sex-ratio of various social categories in the district.
Table 103. Sex-ratio among social categories in Kolar (2011)
Taluk SC ST Others Total
Srinivaspur 990.23 982.78 977.88 981.92
Kolar 991.44 967.82 970.31 975.15
Malur 992.19 962.72 942.31 956.67
Bangarpet 1019.16 987.06 969.20 989.41
Mulbagal 998.91 958.33 979.50 984.36
District 1003.33 972.02 968.15 978.89
Source: Census 2011
From the table, it is evident that SC communities have the highest sex-ratio, whereas the non-SC non-ST population has the lowest sex-ratio in the district. The sex-ratio of SCs in all taluks is better in comparison to other social groups. Among the ST communities, taluks like Mulbagal and Malur have very low sex-ratio compared to rest of the taluks and compared to other social categories as well. Further, SC and ST sex-ratios in the district have shown an increasing trend since 1991 in successive census years.
9.3Educationprofile Education plays a very significant role
in empowering poor and marginalized community. It is evident that access to knowledge is crucial to improving the Human Development status of the human being. Attainment of education directly contributes to the human development like health since it creates the basic platform for marginalized communities to attain opportunities provided by the welfare state.
Literacyprofile
The next table provides a snapshot of the status of literacy among the different social categories in Kolar district and compares them with the averages in Karnataka and India
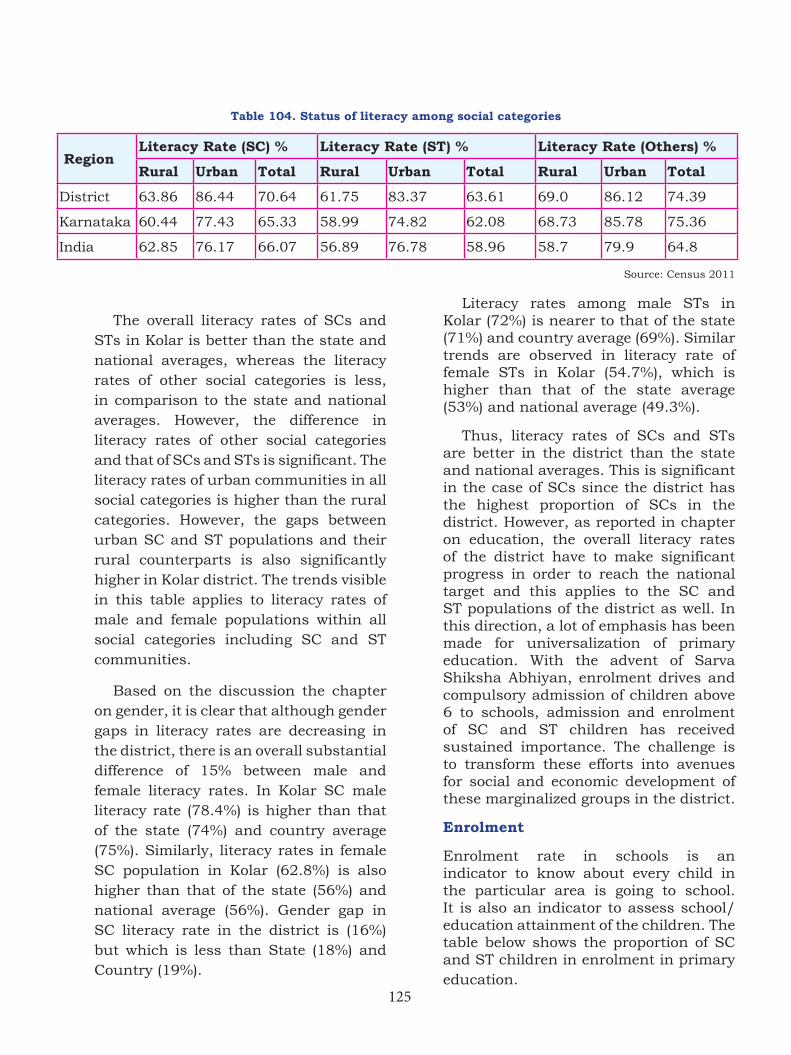
125
The overall literacy rates of SCs and STs in Kolar is better than the state and national averages, whereas the literacy rates of other social categories is less, in comparison to the state and national averages. However, the difference in literacy rates of other social categories and that of SCs and STs is significant. The literacy rates of urban communities in all social categories is higher than the rural categories. However, the gaps between urban SC and ST populations and their rural counterparts is also significantly higher in Kolar district. The trends visible in this table applies to literacy rates of male and female populations within all social categories including SC and ST communities.
Based on the discussion the chapter on gender, it is clear that although gender gaps in literacy rates are decreasing in the district, there is an overall substantial difference of 15% between male and female literacy rates. In Kolar SC male literacy rate (78.4%) is higher than that of the state (74%) and country average (75%). Similarly, literacy rates in female SC population in Kolar (62.8%) is also higher than that of the state (56%) and national average (56%). Gender gap in SC literacy rate in the district is (16%) but which is less than State (18%) and Country (19%).
Literacy rates among male STs in Kolar (72%) is nearer to that of the state (71%) and country average (69%). Similar trends are observed in literacy rate of female STs in Kolar (54.7%), which is higher than that of the state average (53%) and national average (49.3%).
Thus, literacy rates of SCs and STs are better in the district than the state and national averages. This is significant in the case of SCs since the district has the highest proportion of SCs in the district. However, as reported in chapter on education, the overall literacy rates of the district have to make significant progress in order to reach the national target and this applies to the SC and ST populations of the district as well. In this direction, a lot of emphasis has been made for universalization of primary education. With the advent of Sarva Shiksha Abhiyan, enrolment drives and compulsory admission of children above 6 to schools, admission and enrolment of SC and ST children has received sustained importance. The challenge is to transform these efforts into avenues for social and economic development of these marginalized groups in the district.
Enrolment
Enrolment rate in schools is an indicator to know about every child in the particular area is going to school. It is also an indicator to assess school/education attainment of the children. The table below shows the proportion of SC and ST children in enrolment in primary education.
Table 104. Status of literacy among social categories
RegionLiteracy Rate (SC) % Literacy Rate (ST) % Literacy Rate (Others) %
Rural Urban Total Rural Urban Total Rural Urban Total
District 63.86 86.44 70.64 61.75 83.37 63.61 69.0 86.12 74.39
Karnataka 60.44 77.43 65.33 58.99 74.82 62.08 68.73 85.78 75.36
India 62.85 76.17 66.07 56.89 76.78 58.96 58.7 79.9 64.8
Source: Census 2011
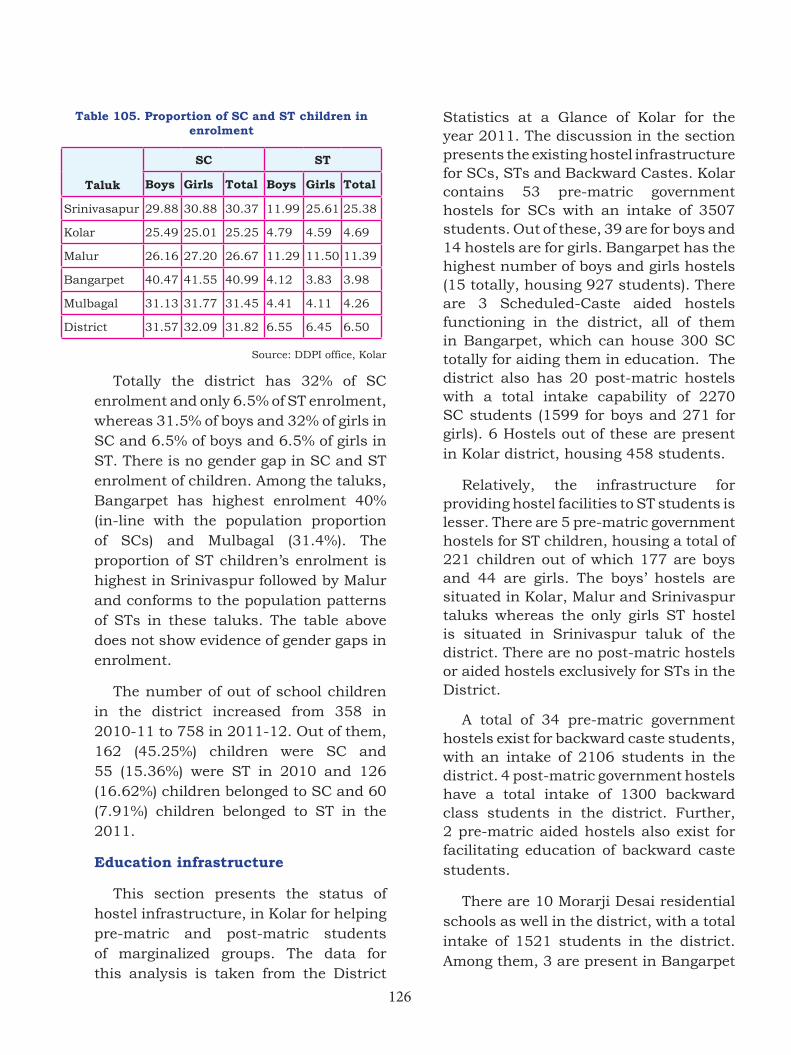
126
Table 105. Proportion of SC and ST children in enrolment
Taluk
SC ST
Boys Girls Total Boys Girls Total
Srinivasapur 29.88 30.88 30.37 11.99 25.61 25.38
Kolar 25.49 25.01 25.25 4.79 4.59 4.69
Malur 26.16 27.20 26.67 11.29 11.50 11.39
Bangarpet 40.47 41.55 40.99 4.12 3.83 3.98
Mulbagal 31.13 31.77 31.45 4.41 4.11 4.26
District 31.57 32.09 31.82 6.55 6.45 6.50
Source: DDPI office, Kolar
Totally the district has 32% of SC enrolment and only 6.5% of ST enrolment, whereas 31.5% of boys and 32% of girls in SC and 6.5% of boys and 6.5% of girls in ST. There is no gender gap in SC and ST enrolment of children. Among the taluks, Bangarpet has highest enrolment 40% (in-line with the population proportion of SCs) and Mulbagal (31.4%). The proportion of ST children’s enrolment is highest in Srinivaspur followed by Malur and conforms to the population patterns of STs in these taluks. The table above does not show evidence of gender gaps in enrolment.
The number of out of school children in the district increased from 358 in 2010-11 to 758 in 2011-12. Out of them, 162 (45.25%) children were SC and 55 (15.36%) were ST in 2010 and 126 (16.62%) children belonged to SC and 60 (7.91%) children belonged to ST in the 2011.
Education infrastructure
This section presents the status of hostel infrastructure, in Kolar for helping pre-matric and post-matric students of marginalized groups. The data for this analysis is taken from the District
Statistics at a Glance of Kolar for the year 2011. The discussion in the section presents the existing hostel infrastructure for SCs, STs and Backward Castes. Kolar contains 53 pre-matric government hostels for SCs with an intake of 3507 students. Out of these, 39 are for boys and 14 hostels are for girls. Bangarpet has the highest number of boys and girls hostels (15 totally, housing 927 students). There are 3 Scheduled-Caste aided hostels functioning in the district, all of them in Bangarpet, which can house 300 SC totally for aiding them in education. The district also has 20 post-matric hostels with a total intake capability of 2270 SC students (1599 for boys and 271 for girls). 6 Hostels out of these are present in Kolar district, housing 458 students.
Relatively, the infrastructure for providing hostel facilities to ST students is lesser. There are 5 pre-matric government hostels for ST children, housing a total of 221 children out of which 177 are boys and 44 are girls. The boys’ hostels are situated in Kolar, Malur and Srinivaspur taluks whereas the only girls ST hostel is situated in Srinivaspur taluk of the district. There are no post-matric hostels or aided hostels exclusively for STs in the District.
A total of 34 pre-matric government hostels exist for backward caste students, with an intake of 2106 students in the district. 4 post-matric government hostels have a total intake of 1300 backward class students in the district. Further, 2 pre-matric aided hostels also exist for facilitating education of backward caste students.
There are 10 Morarji Desai residential schools as well in the district, with a total intake of 1521 students in the district. Among them, 3 are present in Bangarpet
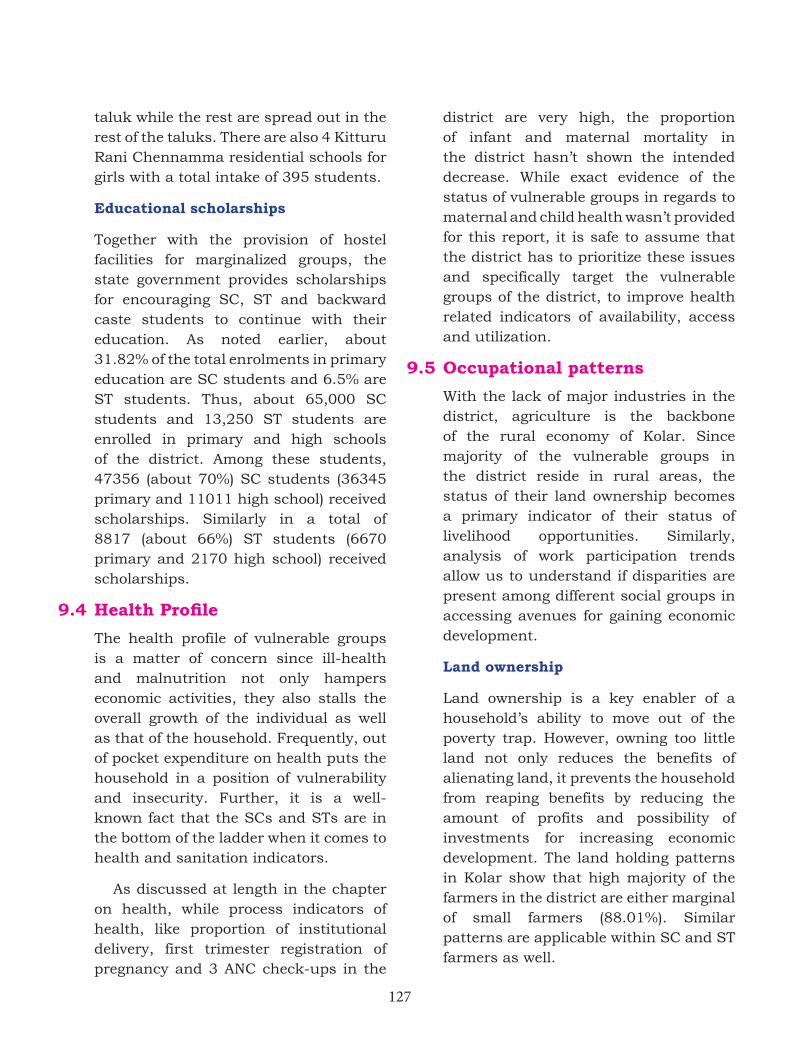
127
taluk while the rest are spread out in the rest of the taluks. There are also 4 Kitturu Rani Chennamma residential schools for girls with a total intake of 395 students.
Educational scholarships
Together with the provision of hostel facilities for marginalized groups, the state government provides scholarships for encouraging SC, ST and backward caste students to continue with their education. As noted earlier, about 31.82% of the total enrolments in primary education are SC students and 6.5% are ST students. Thus, about 65,000 SC students and 13,250 ST students are enrolled in primary and high schools of the district. Among these students, 47356 (about 70%) SC students (36345 primary and 11011 high school) received scholarships. Similarly in a total of 8817 (about 66%) ST students (6670 primary and 2170 high school) received scholarships.
9.4HealthProfile
The health profile of vulnerable groups is a matter of concern since ill-health and malnutrition not only hampers economic activities, they also stalls the overall growth of the individual as well as that of the household. Frequently, out of pocket expenditure on health puts the household in a position of vulnerability and insecurity. Further, it is a well-known fact that the SCs and STs are in the bottom of the ladder when it comes to health and sanitation indicators.
As discussed at length in the chapter on health, while process indicators of health, like proportion of institutional delivery, first trimester registration of pregnancy and 3 ANC check-ups in the
district are very high, the proportion of infant and maternal mortality in the district hasn’t shown the intended decrease. While exact evidence of the status of vulnerable groups in regards to maternal and child health wasn’t provided for this report, it is safe to assume that the district has to prioritize these issues and specifically target the vulnerable groups of the district, to improve health related indicators of availability, access and utilization.
9.5 Occupational patterns
With the lack of major industries in the district, agriculture is the backbone of the rural economy of Kolar. Since majority of the vulnerable groups in the district reside in rural areas, the status of their land ownership becomes a primary indicator of their status of livelihood opportunities. Similarly, analysis of work participation trends allow us to understand if disparities are present among different social groups in accessing avenues for gaining economic development.
Land ownership
Land ownership is a key enabler of a household’s ability to move out of the poverty trap. However, owning too little land not only reduces the benefits of alienating land, it prevents the household from reaping benefits by reducing the amount of profits and possibility of investments for increasing economic development. The land holding patterns in Kolar show that high majority of the farmers in the district are either marginal of small farmers (88.01%). Similar patterns are applicable within SC and ST farmers as well.
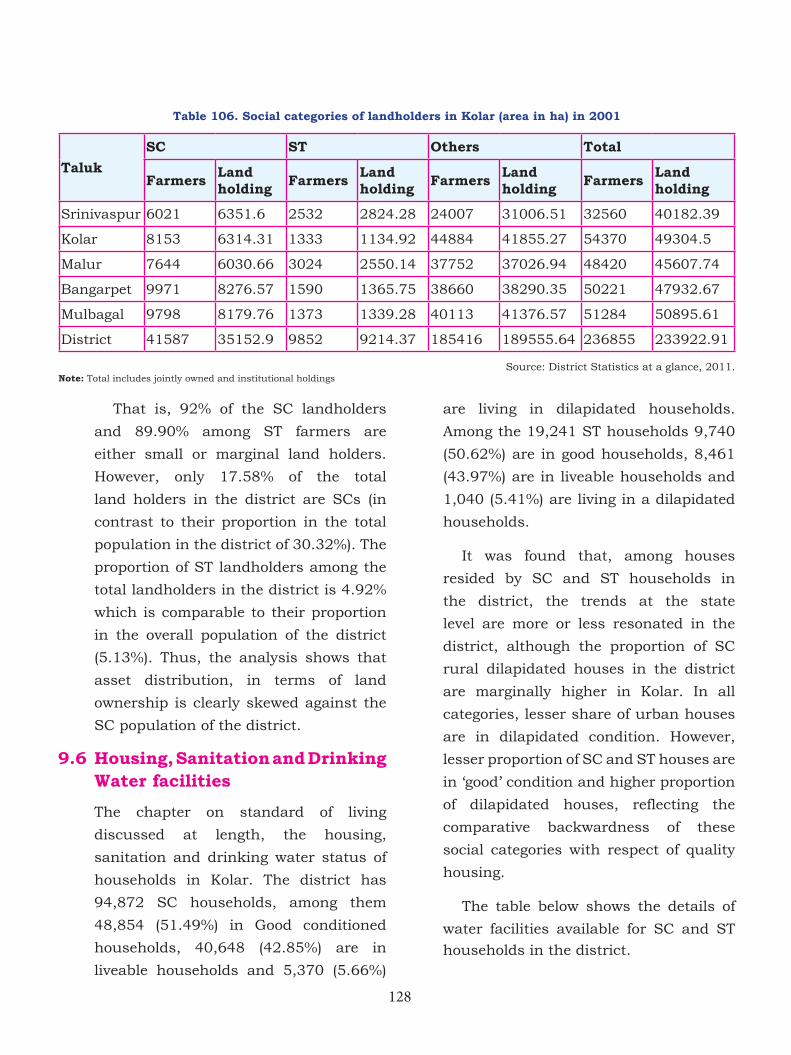
128
That is, 92% of the SC landholders
and 89.90% among ST farmers are
either small or marginal land holders.
However, only 17.58% of the total
land holders in the district are SCs (in
contrast to their proportion in the total
population in the district of 30.32%). The
proportion of ST landholders among the
total landholders in the district is 4.92%
which is comparable to their proportion
in the overall population of the district
(5.13%). Thus, the analysis shows that
asset distribution, in terms of land
ownership is clearly skewed against the
SC population of the district.
9.6 Housing, Sanitation and Drinking Water facilities
The chapter on standard of living
discussed at length, the housing,
sanitation and drinking water status of
households in Kolar. The district has
94,872 SC households, among them
48,854 (51.49%) in Good conditioned
households, 40,648 (42.85%) are in
liveable households and 5,370 (5.66%)
are living in dilapidated households.
Among the 19,241 ST households 9,740
(50.62%) are in good households, 8,461
(43.97%) are in liveable households and
1,040 (5.41%) are living in a dilapidated
households.
It was found that, among houses
resided by SC and ST households in
the district, the trends at the state
level are more or less resonated in the
district, although the proportion of SC
rural dilapidated houses in the district
are marginally higher in Kolar. In all
categories, lesser share of urban houses
are in dilapidated condition. However,
lesser proportion of SC and ST houses are
in ‘good’ condition and higher proportion
of dilapidated houses, reflecting the
comparative backwardness of these
social categories with respect of quality
housing.
The table below shows the details of
water facilities available for SC and ST
households in the district.
Table 106. Social categories of landholders in Kolar (area in ha) in 2001
Taluk SC ST Others Total
Farmers Land holding Farmers Land
holding Farmers Land holding Farmers Land
holding
Srinivaspur 6021 6351.6 2532 2824.28 24007 31006.51 32560 40182.39
Kolar 8153 6314.31 1333 1134.92 44884 41855.27 54370 49304.5
Malur 7644 6030.66 3024 2550.14 37752 37026.94 48420 45607.74
Bangarpet 9971 8276.57 1590 1365.75 38660 38290.35 50221 47932.67
Mulbagal 9798 8179.76 1373 1339.28 40113 41376.57 51284 50895.61
District 41587 35152.9 9852 9214.37 185416 189555.64 236855 233922.91
Source: District Statistics at a glance, 2011. Note: Total includes jointly owned and institutional holdings
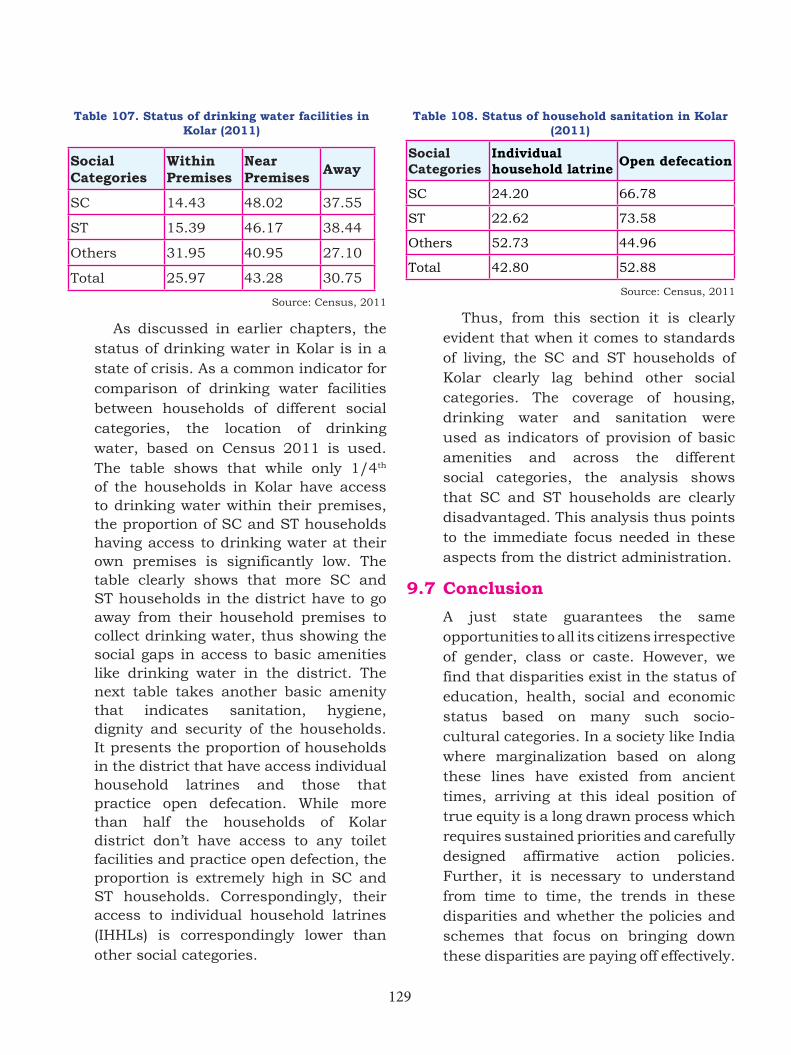
129
Table 107. Status of drinking water facilities in Kolar (2011)
Social Categories
Within Premises
Near Premises Away
SC 14.43 48.02 37.55
ST 15.39 46.17 38.44
Others 31.95 40.95 27.10
Total 25.97 43.28 30.75
Source: Census, 2011
As discussed in earlier chapters, the status of drinking water in Kolar is in a state of crisis. As a common indicator for comparison of drinking water facilities between households of different social categories, the location of drinking water, based on Census 2011 is used. The table shows that while only 1/4th of the households in Kolar have access to drinking water within their premises, the proportion of SC and ST households having access to drinking water at their own premises is significantly low. The table clearly shows that more SC and ST households in the district have to go away from their household premises to collect drinking water, thus showing the social gaps in access to basic amenities like drinking water in the district. The next table takes another basic amenity that indicates sanitation, hygiene, dignity and security of the households. It presents the proportion of households in the district that have access individual household latrines and those that practice open defecation. While more than half the households of Kolar district don’t have access to any toilet facilities and practice open defection, the proportion is extremely high in SC and ST households. Correspondingly, their access to individual household latrines (IHHLs) is correspondingly lower than other social categories.
Table 108. Status of household sanitation in Kolar (2011)
Social Categories
Individual household latrine Open defecation
SC 24.20 66.78
ST 22.62 73.58
Others 52.73 44.96
Total 42.80 52.88
Source: Census, 2011
Thus, from this section it is clearly evident that when it comes to standards of living, the SC and ST households of Kolar clearly lag behind other social categories. The coverage of housing, drinking water and sanitation were used as indicators of provision of basic amenities and across the different social categories, the analysis shows that SC and ST households are clearly disadvantaged. This analysis thus points to the immediate focus needed in these aspects from the district administration.
9.7 Conclusion
A just state guarantees the same opportunities to all its citizens irrespective of gender, class or caste. However, we find that disparities exist in the status of education, health, social and economic status based on many such socio-cultural categories. In a society like India where marginalization based on along these lines have existed from ancient times, arriving at this ideal position of true equity is a long drawn process which requires sustained priorities and carefully designed affirmative action policies. Further, it is necessary to understand from time to time, the trends in these disparities and whether the policies and schemes that focus on bringing down these disparities are paying off effectively.
130
This chapter was such an attempt to understand the status of broad based indicators of human development of the marginalized groups in Kolar. The chapter focussed specifically on two groups: SCs and STs.
A unique feature of Kolar is that the population proportion of SCs in the district is highest in Karnataka. However, this hasn’t translated into the expected improvement in human indicators. While category-wise indicators of human development were hard to collate in the district, there is enough evidence to conclude that much more has to be done in the district to guarantee that such marginalized groups too have the same capabilities and opportunities as that of others, to lead a healthy and fruitful life.
The literacy rates of SCs in the district are comparable to that of others while literacy rates of STs are significantly short of the district averages. However, both the literacy rates of both communities are better off, than the state and national averages of the respective communities. Further, as this chapter shows, within these communities, there are significant differences between urban and rural areas as well as between male and female populations.
The analysis of landholding patterns in district shows that asset distribution, in terms of land ownership is clearly skewed against the SC population of the district, with a disproportionately low percentage of SC households owning land in the district. The analysis of coverage of basic amenities like drinking water and individual household latrines showed that the district has a long way to go in guaranteeing full coverage of the
households. However, the coverage of SC and ST communities in these aspects is even more inferior and thus points to the comparatively lower standards of living of these communities. The analysis in the chapter on governance shows that there is larger scope needed for political participation of SCs, specifically in ZPs and TPs of Kolar.
While disaggregated data on status of health and economic wellbeing of different social categories weren’t available in the district, from the above analysis, it is clear that SC and ST households in communities have attained lower human development status than that of the other social categories in the district. This issue requires the immediate attention of the corresponding implementing departments so that meaningful efforts are taken to address the human development of marginalized communities in the district. The starting steps in this direction could be the provision of basic amenities like drinking water and individual household latrines.
9.8 Small area study: Composite Dalit Development Index – A case study of Avani Gram Panchayath
Introduction
A study of human development in a region is neither complete nor holistic if inquiry is not made into the socio-economic, political and cultural development of those people at the lowest rung of the social ladder. ‘Dalits’ or people belonging to the Scheduled Castes in India have been at the lowest rung of the social ladder for centuries in India and as a result their development whether it is in terms of education, health or economic status remains stunted.
131
The Constitution of India gives a powerful framework with which social, economic and political inclusion of Dalits in the nation’s growth story is made possible. Several schemes and programs from the Government towards the upliftment of the Scheduled Castes are testament to the same. However, there still exist stark differences in the perception of inclusion, liberty, discrimination, equality and equity between Dalits and non-Dalits.
This study aims at capturing the perception of such phenomena qualitatively and quantitatively within the perimeter of a Gram Panchayath in the district. A Composite Dalit Development Index (CDDI) has been constructed to determine the development of Dalits in the one Gram Panchayath of the district. Dalit Deprivation Index (DDI) is further derived from CDDI. Data for the purpose of this calculation and analysis was collected from Avani Gram Panchayath in Mulbagal Taluk of Kolar District.
Avani GP
Located about 13 kms from Mulbagal Taluk Headquarters, Avani is one of 30 Gram Panchayaths in the Taluk. Mulbagal Taluk ranks the lowest among the Taluks of Kolar district in terms of backwardness as per D M Nanjundappa committee’s “Report of the High Power Committee for Redressal of Regional Imbalances in Karnataka” submitted to the Government of Karnataka in 2002.
Avani Gram Panchyath comprises 7 revenue villages with a total population of 7213. Of the 1636 families, there are 886 SC families, making it roughly 54% of
the population. Of the 7 revenue villages, surveys were carried out in 4 villages namely Avani, V. Guttahalli, Ramapura and Virupakshi. In addition to a survey conducted across 50 Dalit households, discussions were held with GP members, ASHA workers, teachers and a group of students. Sources of secondary data collection and analysis include PDO, School HMs, Taluk Panchayath office of Mulbagal, Avani Gram Panchayath office, Census of India 2011 and the website of RDPR, GoK.
Composite Dalit Development Index (CDDI)
Based on the information collected from Avani Gram Panchayath, the Composite Dalit Development Index has been computed taking into account 10 parameters that include perceptions of inclusion, discrimination and the liberty to protest against discrimination, conflict resolution, freedom and gender dimensions. The computation also takes into account standard of living, access to basic facilities and education. These parameters are described in the following paragraphs.
Institutional Inclusion (0.67):
In terms of institutional inclusion, we witness healthy presence of SC members in various committees such as SDMCs, Water Societies, etc. However the number of SC Gram Panchayath members is short of the expected number, if we take into account the percentage of SC population in the GP. We must note here that the Joint Forest Management Committee (JFMC) does not exist in the Gram Panchayath and if we exclude JFMC from the computation, the institutional inclusion is higher. JFMC does not exist.
132
Social Inclusion (0.6):
Social inclusion for Dalits is slightly lower than institutional inclusion; the latter usually being driven by legal norms. Though a high percentage of Dalits expressed that they are treated equally in hotels, addressed with respect and also have opportunities to enter temples and participate in festivals, Dalits having freedom to enter a non-Dalit house is almost non-existent.
Perception of Discrimination (0.7):
The perception of discrimination in terms
of access to education or health services
is quite low, whereas some amount of
discrimination still exists in terms of
access to water facilities. It must be noted
however that though there is visible
difference in the infrastructure for water
supply between Dalits and non-Dalits,
it is not perceived as discrimination by
many families. Economic discrimination
such as differential wages in work places
does not exist nor are Dalits restricted
from entering other vocations. However,
the primary occupation in most of the
households surveyed was some form
of manual labour, which indicates that
Dalits are not in a position to exploit
financially lucrative opportunities, if any.
Protest against Discrimination (0.1) andConflictresolution(0.4):
The percentage of people who have
protested against discrimination is quite
low. This may be attributed to an overall
low perception of discrimination. Further,
the incidence of conflict resolution is also
low in the case of Avani.
Perception of freedom (0.8):
The perception of freedom is quite high among the Dalits in Avani in terms of mobility (freedom to walk in all parts of the village), employment opportunities and in having the opportunity to ask questions and protest, if necessary. But as may be seen above, the incidence of protests have been low in number. The question on freedom to participate in cultural activities of the village yielded mostly positive responses.
Standard of living (0.1):
The standard of living assessed through secondary data is low in the villages surveyed. The number of non-agricultural establishments, land and assets holding among Dalits is lower than the non-Dalits and this fact is corroborated by the officials of the GP. This is further substantiated by the fact that most of the Dalits are engaged in some or the other form of manual labour work, especially in stone quarrying, as revealed in the household survey.
Gender dimension of development (0.4):
Though there is a high percentage of
institutional delivery among Dalits, it is
lesser than the Taluk’s rate of institutional
delivery. About 40% percent of women
do not get adequate rest before delivery,
though almost all women get more than
three months of rest after delivery. With
regard to reproductive health support
and health assistant visits, there is no
strong evidence to believe that Dalits are
positively or negatively discriminated
owing to a wide variation in response.
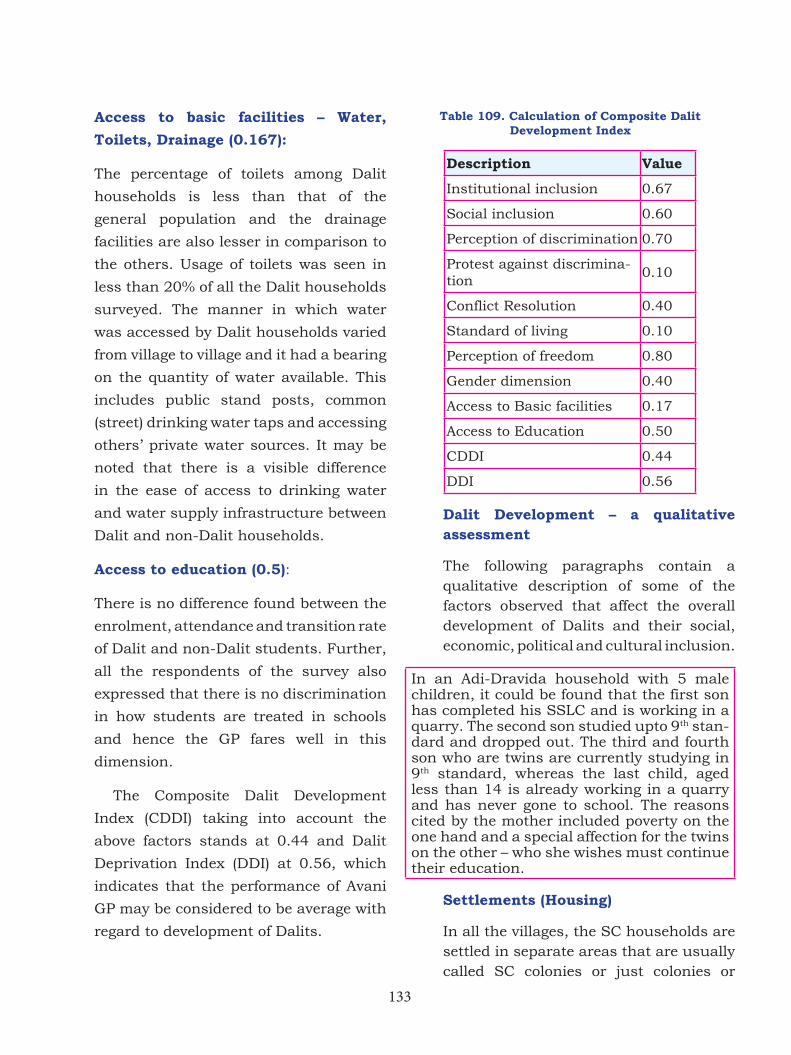
133
Access to basic facilities – Water, Toilets, Drainage (0.167):
The percentage of toilets among Dalit
households is less than that of the
general population and the drainage
facilities are also lesser in comparison to
the others. Usage of toilets was seen in
less than 20% of all the Dalit households
surveyed. The manner in which water
was accessed by Dalit households varied
from village to village and it had a bearing
on the quantity of water available. This
includes public stand posts, common
(street) drinking water taps and accessing
others’ private water sources. It may be
noted that there is a visible difference
in the ease of access to drinking water
and water supply infrastructure between
Dalit and non-Dalit households.
Access to education (0.5):
There is no difference found between the
enrolment, attendance and transition rate
of Dalit and non-Dalit students. Further,
all the respondents of the survey also
expressed that there is no discrimination
in how students are treated in schools
and hence the GP fares well in this
dimension.
The Composite Dalit Development
Index (CDDI) taking into account the
above factors stands at 0.44 and Dalit
Deprivation Index (DDI) at 0.56, which
indicates that the performance of Avani
GP may be considered to be average with
regard to development of Dalits.
Table 109. Calculation of Composite Dalit Development Index
Description Value
Institutional inclusion 0.67
Social inclusion 0.60
Perception of discrimination 0.70
Protest against discrimina-tion
0.10
Conflict Resolution 0.40
Standard of living 0.10
Perception of freedom 0.80
Gender dimension 0.40
Access to Basic facilities 0.17
Access to Education 0.50
CDDI 0.44
DDI 0.56
Dalit Development – a qualitative assessment
The following paragraphs contain a qualitative description of some of the factors observed that affect the overall development of Dalits and their social, economic, political and cultural inclusion.
In an Adi-Dravida household with 5 male children, it could be found that the first son has completed his SSLC and is working in a quarry. The second son studied upto 9th stan-dard and dropped out. The third and fourth son who are twins are currently studying in 9th standard, whereas the last child, aged less than 14 is already working in a quarry and has never gone to school. The reasons cited by the mother included poverty on the one hand and a special affection for the twins on the other – who she wishes must continue their education.
Settlements (Housing)
In all the villages, the SC households are settled in separate areas that are usually called SC colonies or just colonies or
134
named as Ambedkar colony. While there were rare instances of Dalits living outside the ‘colony’, there were no instances of non-Dalits living in the colonies. There were visible differences in the perception of discrimination and awareness levels among those who lived within the colony and those outside. The latter showed not only greater political awareness, but also better understanding about Government Schemes, etc.
Exclusion within the excluded
It is recognized that Dalits face different kinds of exclusion as a result of being at the lowest rung of the social order. However, there are instances where there is discrimination within the people classified as Scheduled Castes. Two stand out examples of social exclusion can be noted among the Scheduled Caste population of Avani Gram Panchayath.
• In V. Guttahalli village, there are approximately 60 families who belong to communities that are classified as Adi Karnataka, while there are 12 families who are classified as Adi Dravida. Being a minority within the Dalits, they do not have access to houses of other Dalit families, leave alone entering the houses of others. The two groups do not have food in each other’s houses. This is one of the villages where Dalits and non-Dalits have their own temples, but Adi Dravidas have had to create their own place of worship, which is a small structure built of stone.
• The differences extend to other areas as well. People belonging to Adi Karnataka have political representation at the GP level, while Adi Dravidas had none. In terms of educational attainment
and employment, there were cases of children dropping out from school and working among Adi Dravidas, while there are examples of Adi Karnataka youth pursuing higher studies and working in pharmaceutical industries, etc. Almost all the Adi Dravidas in the village are employed as daily wage labourers in stone quarrying.
• In Avani village, members of Bovi community constitute a unique case of exclusion among the Dalits. Members of this community are mostly migrant and travel between Andhra Pradesh and Kolar. They are employed as labourers for stone cutting or loading. There are only 25 to 30 Bovi families in this village where the total number of SC families is close to 229.
• While some SC families in Avani have availed benefits from housing schemes, most of the Bovi families live in huts on the outskirts of the village. They do not have electricity connections and use kerosene and firewood for cooking. In the interviews, it was revealed that their children do not go to Anganwadis regularly, the drop-out instances from schools are higher and there were incidences of children as young as 11 and 12 going to work in the stone quarrying industry with their parents and without wages.
• It is clear the asset holding among Bovis is low despite some families living there for a long time. They do not have the freedom to enter the houses of other SCs in the village and also do not mingle with others castes among SCs. It may thus be seen that the Bovis are excluded not only from the fruits of development by lack of access to basic
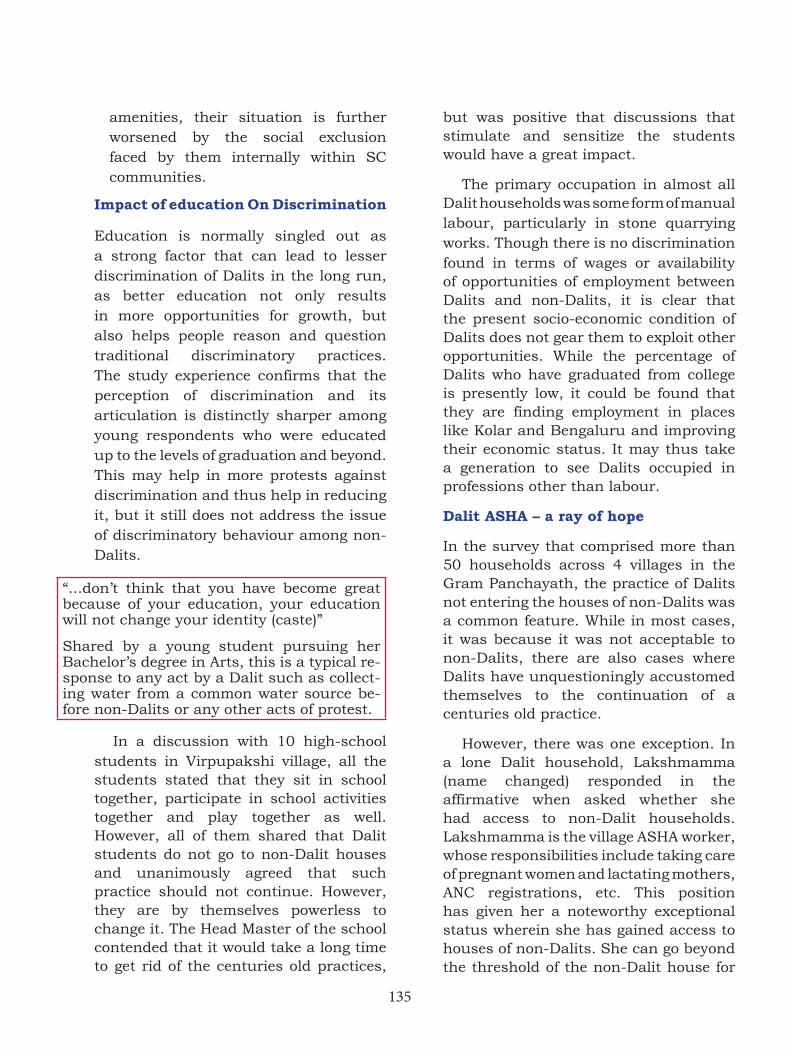
135
amenities, their situation is further worsened by the social exclusion faced by them internally within SC communities.
Impact of education On Discrimination
Education is normally singled out as a strong factor that can lead to lesser discrimination of Dalits in the long run, as better education not only results in more opportunities for growth, but also helps people reason and question traditional discriminatory practices. The study experience confirms that the perception of discrimination and its articulation is distinctly sharper among young respondents who were educated up to the levels of graduation and beyond. This may help in more protests against discrimination and thus help in reducing it, but it still does not address the issue of discriminatory behaviour among non-Dalits.
“...don’t think that you have become great because of your education, your education will not change your identity (caste)”
Shared by a young student pursuing her Bachelor’s degree in Arts, this is a typical re-sponse to any act by a Dalit such as collect-ing water from a common water source be-fore non-Dalits or any other acts of protest.
In a discussion with 10 high-school students in Virpupakshi village, all the students stated that they sit in school together, participate in school activities together and play together as well. However, all of them shared that Dalit students do not go to non-Dalit houses and unanimously agreed that such practice should not continue. However, they are by themselves powerless to change it. The Head Master of the school contended that it would take a long time to get rid of the centuries old practices,
but was positive that discussions that stimulate and sensitize the students would have a great impact.
The primary occupation in almost all Dalit households was some form of manual labour, particularly in stone quarrying works. Though there is no discrimination found in terms of wages or availability of opportunities of employment between Dalits and non-Dalits, it is clear that the present socio-economic condition of Dalits does not gear them to exploit other opportunities. While the percentage of Dalits who have graduated from college is presently low, it could be found that they are finding employment in places like Kolar and Bengaluru and improving their economic status. It may thus take a generation to see Dalits occupied in professions other than labour.
Dalit ASHA – a ray of hope
In the survey that comprised more than 50 households across 4 villages in the Gram Panchayath, the practice of Dalits not entering the houses of non-Dalits was a common feature. While in most cases, it was because it was not acceptable to non-Dalits, there are also cases where Dalits have unquestioningly accustomed themselves to the continuation of a centuries old practice.
However, there was one exception. In a lone Dalit household, Lakshmamma (name changed) responded in the affirmative when asked whether she had access to non-Dalit households. Lakshmamma is the village ASHA worker, whose responsibilities include taking care of pregnant women and lactating mothers, ANC registrations, etc. This position has given her a noteworthy exceptional status wherein she has gained access to houses of non-Dalits. She can go beyond the threshold of the non-Dalit house for
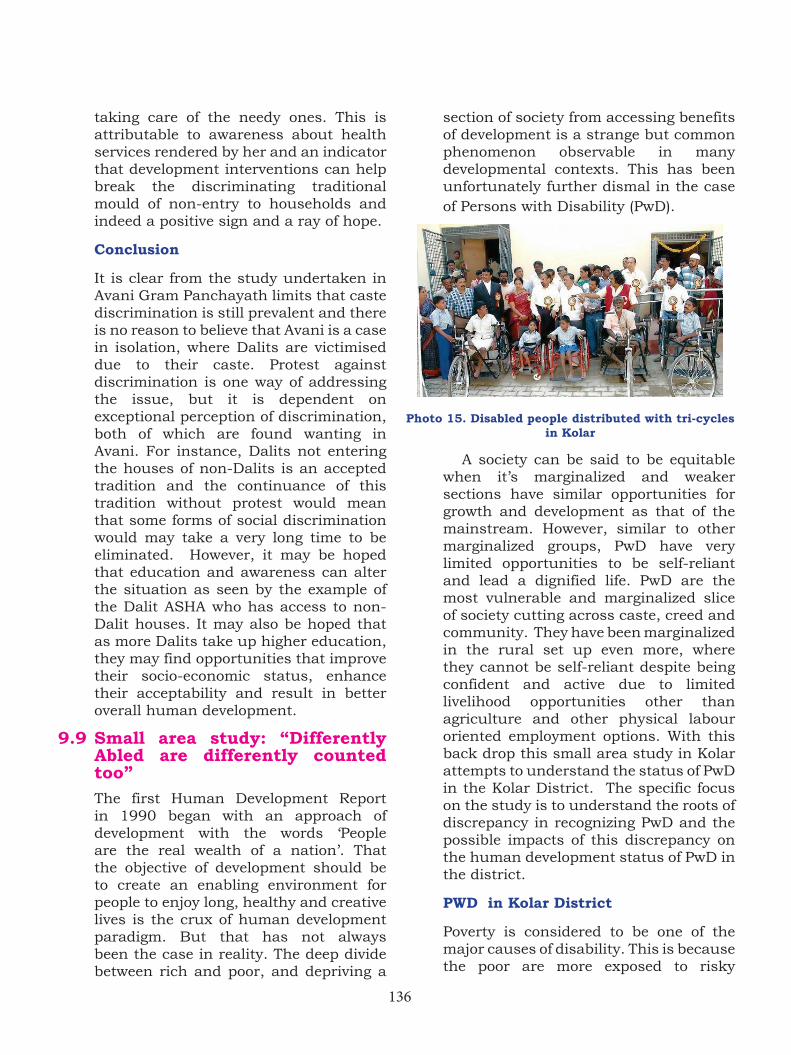
136
taking care of the needy ones. This is attributable to awareness about health services rendered by her and an indicator that development interventions can help break the discriminating traditional mould of non-entry to households and indeed a positive sign and a ray of hope.
Conclusion
It is clear from the study undertaken in Avani Gram Panchayath limits that caste discrimination is still prevalent and there is no reason to believe that Avani is a case in isolation, where Dalits are victimised due to their caste. Protest against discrimination is one way of addressing the issue, but it is dependent on exceptional perception of discrimination, both of which are found wanting in Avani. For instance, Dalits not entering the houses of non-Dalits is an accepted tradition and the continuance of this tradition without protest would mean that some forms of social discrimination would may take a very long time to be eliminated. However, it may be hoped that education and awareness can alter the situation as seen by the example of the Dalit ASHA who has access to non-Dalit houses. It may also be hoped that as more Dalits take up higher education, they may find opportunities that improve their socio-economic status, enhance their acceptability and result in better overall human development.
9.9 Small area study: “Differently Abled are differently counted too”
The first Human Development Report in 1990 began with an approach of development with the words ‘People are the real wealth of a nation’. That the objective of development should be to create an enabling environment for people to enjoy long, healthy and creative lives is the crux of human development paradigm. But that has not always been the case in reality. The deep divide between rich and poor, and depriving a
section of society from accessing benefits of development is a strange but common phenomenon observable in many developmental contexts. This has been unfortunately further dismal in the case of Persons with Disability (PwD).
Photo 15. Disabled people distributed with tri-cycles in Kolar
A society can be said to be equitable when it’s marginalized and weaker sections have similar opportunities for growth and development as that of the mainstream. However, similar to other marginalized groups, PwD have very limited opportunities to be self-reliant and lead a dignified life. PwD are the most vulnerable and marginalized slice of society cutting across caste, creed and community. They have been marginalized in the rural set up even more, where they cannot be self-reliant despite being confident and active due to limited livelihood opportunities other than agriculture and other physical labour oriented employment options. With this back drop this small area study in Kolar attempts to understand the status of PwD in the Kolar District. The specific focus on the study is to understand the roots of discrepancy in recognizing PwD and the possible impacts of this discrepancy on the human development status of PwD in the district.
PWD in Kolar District
Poverty is considered to be one of the major causes of disability. This is because the poor are more exposed to risky
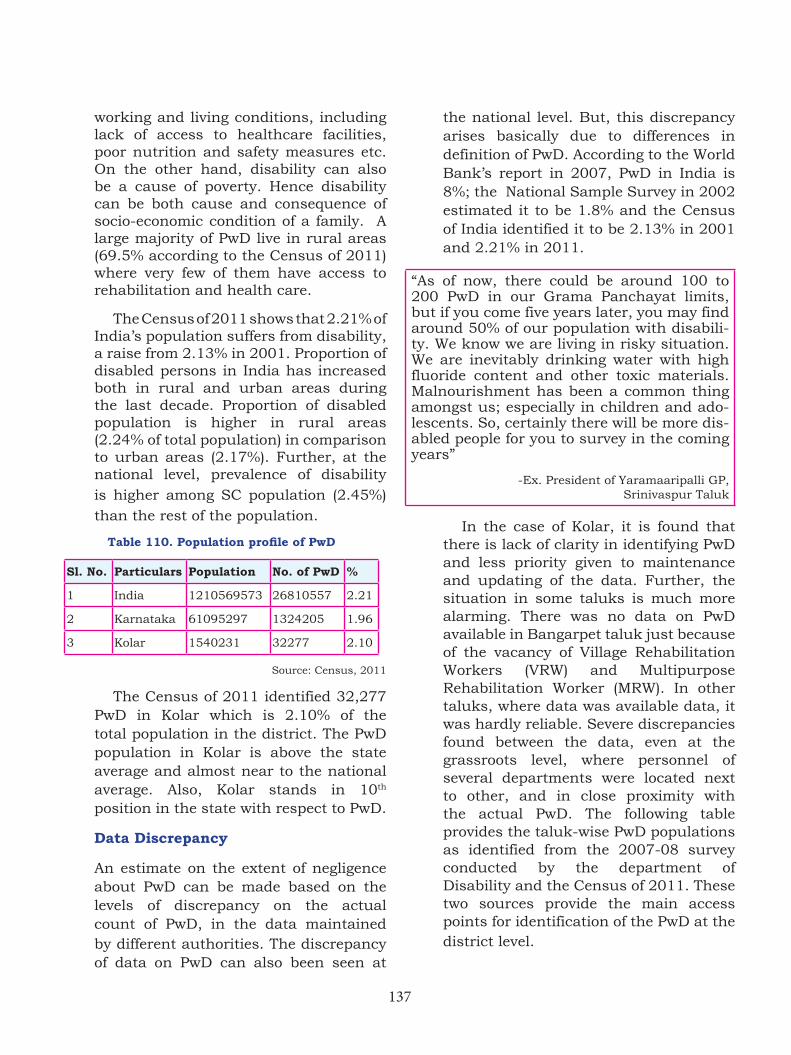
137
working and living conditions, including lack of access to healthcare facilities, poor nutrition and safety measures etc. On the other hand, disability can also be a cause of poverty. Hence disability can be both cause and consequence of socio-economic condition of a family. A large majority of PwD live in rural areas (69.5% according to the Census of 2011) where very few of them have access to rehabilitation and health care.
The Census of 2011 shows that 2.21% of India’s population suffers from disability, a raise from 2.13% in 2001. Proportion of disabled persons in India has increased both in rural and urban areas during the last decade. Proportion of disabled population is higher in rural areas (2.24% of total population) in comparison to urban areas (2.17%). Further, at the national level, prevalence of disability
is higher among SC population (2.45%)
than the rest of the population.
Table110.PopulationprofileofPwD
Sl. No. Particulars Population No. of PwD %
1 India 1210569573 26810557 2.21
2 Karnataka 61095297 1324205 1.96
3 Kolar 1540231 32277 2.10
Source: Census, 2011
The Census of 2011 identified 32,277 PwD in Kolar which is 2.10% of the total population in the district. The PwD population in Kolar is above the state average and almost near to the national average. Also, Kolar stands in 10th position in the state with respect to PwD.
Data Discrepancy
An estimate on the extent of negligence about PwD can be made based on the levels of discrepancy on the actual count of PwD, in the data maintained by different authorities. The discrepancy of data on PwD can also been seen at
the national level. But, this discrepancy arises basically due to differences in definition of PwD. According to the World Bank’s report in 2007, PwD in India is 8%; the National Sample Survey in 2002 estimated it to be 1.8% and the Census of India identified it to be 2.13% in 2001 and 2.21% in 2011.
“As of now, there could be around 100 to 200 PwD in our Grama Panchayat limits, but if you come five years later, you may find around 50% of our population with disabili-ty. We know we are living in risky situation. We are inevitably drinking water with high fluoride content and other toxic materials. Malnourishment has been a common thing amongst us; especially in children and ado-lescents. So, certainly there will be more dis-abled people for you to survey in the coming years”
-Ex. President of Yaramaaripalli GP, Srinivaspur Taluk
In the case of Kolar, it is found that there is lack of clarity in identifying PwD and less priority given to maintenance and updating of the data. Further, the situation in some taluks is much more alarming. There was no data on PwD available in Bangarpet taluk just because of the vacancy of Village Rehabilitation Workers (VRW) and Multipurpose Rehabilitation Worker (MRW). In other taluks, where data was available data, it was hardly reliable. Severe discrepancies found between the data, even at the grassroots level, where personnel of several departments were located next to other, and in close proximity with the actual PwD. The following table provides the taluk-wise PwD populations as identified from the 2007-08 survey conducted by the department of Disability and the Census of 2011. These two sources provide the main access points for identification of the PwD at the district level.
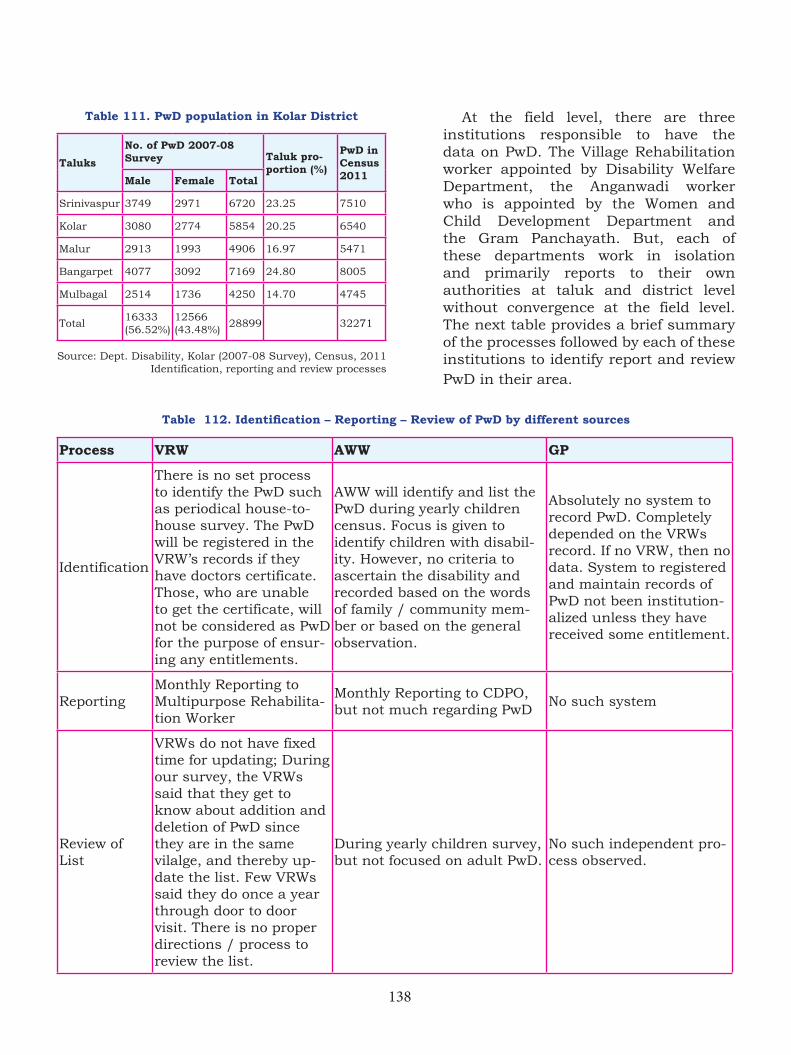
138
Table 111. PwD population in Kolar District
Taluks
No. of PwD 2007-08 Survey Taluk pro-
portion (%)
PwD in Census 2011Male Female Total
Srinivaspur 3749 2971 6720 23.25 7510
Kolar 3080 2774 5854 20.25 6540
Malur 2913 1993 4906 16.97 5471
Bangarpet 4077 3092 7169 24.80 8005
Mulbagal 2514 1736 4250 14.70 4745
Total16333 (56.52%)
12566 (43.48%)
28899 32271
Source: Dept. Disability, Kolar (2007-08 Survey), Census, 2011Identification, reporting and review processes
At the field level, there are three institutions responsible to have the data on PwD. The Village Rehabilitation worker appointed by Disability Welfare Department, the Anganwadi worker who is appointed by the Women and Child Development Department and the Gram Panchayath. But, each of these departments work in isolation and primarily reports to their own authorities at taluk and district level without convergence at the field level. The next table provides a brief summary of the processes followed by each of these institutions to identify report and review PwD in their area.
Table112.Identification–Reporting–ReviewofPwDbydifferentsources
Process VRW AWW GP
Identification
There is no set process to identify the PwD such as periodical house-to-house survey. The PwD will be registered in the VRW’s records if they have doctors certificate. Those, who are unable to get the certificate, will not be considered as PwD for the purpose of ensur-ing any entitlements.
AWW will identify and list the PwD during yearly children census. Focus is given to identify children with disabil-ity. However, no criteria to ascertain the disability and recorded based on the words of family / community mem-ber or based on the general observation.
Absolutely no system to record PwD. Completely depended on the VRWs record. If no VRW, then no data. System to registered and maintain records of PwD not been institution-alized unless they have received some entitlement.
Reporting Monthly Reporting to Multipurpose Rehabilita-tion Worker
Monthly Reporting to CDPO, but not much regarding PwD
No such system
Review of List
VRWs do not have fixed time for updating; During our survey, the VRWs said that they get to know about addition and deletion of PwD since they are in the same vilalge, and thereby up-date the list. Few VRWs said they do once a year through door to door visit. There is no proper directions / process to review the list.
During yearly children survey, but not focused on adult PwD.
No such independent pro-cess observed.
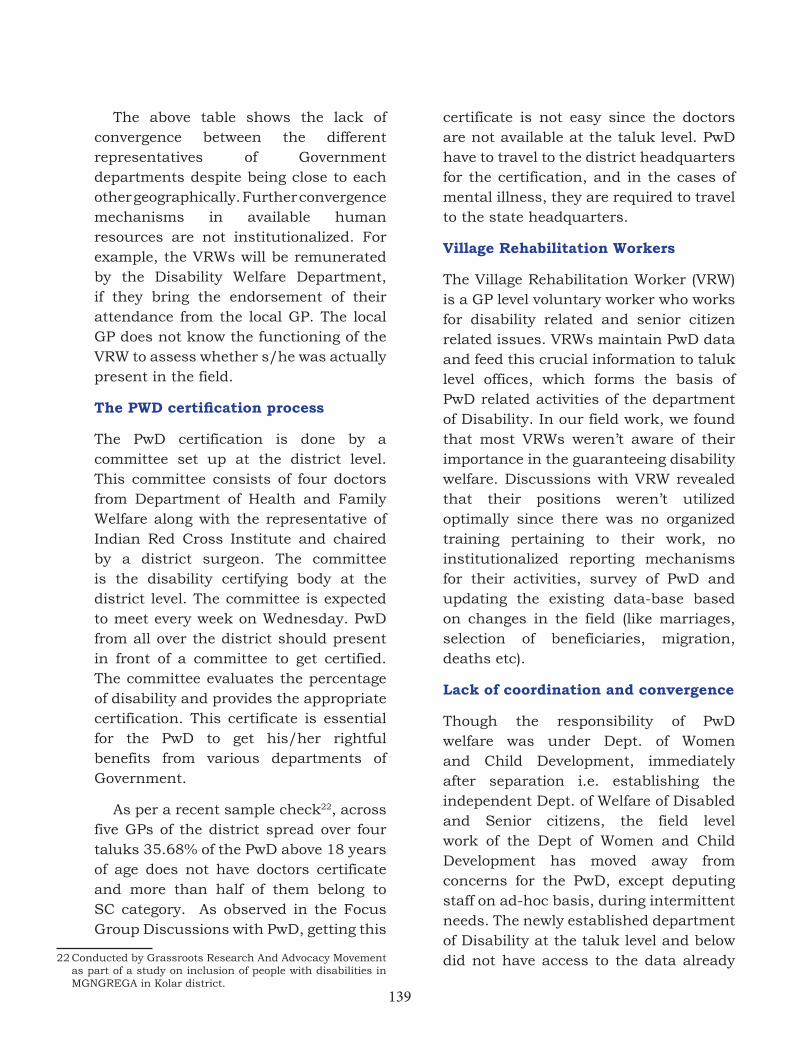
139
The above table shows the lack of convergence between the different representatives of Government departments despite being close to each other geographically. Further convergence mechanisms in available human resources are not institutionalized. For example, the VRWs will be remunerated by the Disability Welfare Department, if they bring the endorsement of their attendance from the local GP. The local GP does not know the functioning of the VRW to assess whether s/he was actually present in the field.
ThePWDcertificationprocess
The PwD certification is done by a committee set up at the district level. This committee consists of four doctors from Department of Health and Family Welfare along with the representative of Indian Red Cross Institute and chaired by a district surgeon. The committee is the disability certifying body at the district level. The committee is expected to meet every week on Wednesday. PwD from all over the district should present in front of a committee to get certified. The committee evaluates the percentage of disability and provides the appropriate certification. This certificate is essential for the PwD to get his/her rightful benefits from various departments of Government.
As per a recent sample check22, across five GPs of the district spread over four taluks 35.68% of the PwD above 18 years of age does not have doctors certificate and more than half of them belong to SC category. As observed in the Focus Group Discussions with PwD, getting this
22 Conducted by Grassroots Research And Advocacy Movement as part of a study on inclusion of people with disabilities in MGNGREGA in Kolar district.
certificate is not easy since the doctors are not available at the taluk level. PwD have to travel to the district headquarters for the certification, and in the cases of mental illness, they are required to travel to the state headquarters.
Village Rehabilitation Workers
The Village Rehabilitation Worker (VRW) is a GP level voluntary worker who works for disability related and senior citizen related issues. VRWs maintain PwD data and feed this crucial information to taluk level offices, which forms the basis of PwD related activities of the department of Disability. In our field work, we found that most VRWs weren’t aware of their importance in the guaranteeing disability welfare. Discussions with VRW revealed that their positions weren’t utilized optimally since there was no organized training pertaining to their work, no institutionalized reporting mechanisms for their activities, survey of PwD and updating the existing data-base based on changes in the field (like marriages, selection of beneficiaries, migration, deaths etc).
Lack of coordination and convergence
Though the responsibility of PwD welfare was under Dept. of Women and Child Development, immediately after separation i.e. establishing the independent Dept. of Welfare of Disabled and Senior citizens, the field level work of the Dept of Women and Child Development has moved away from concerns for the PwD, except deputing staff on ad-hoc basis, during intermittent needs. The newly established department of Disability at the taluk level and below did not have access to the data already
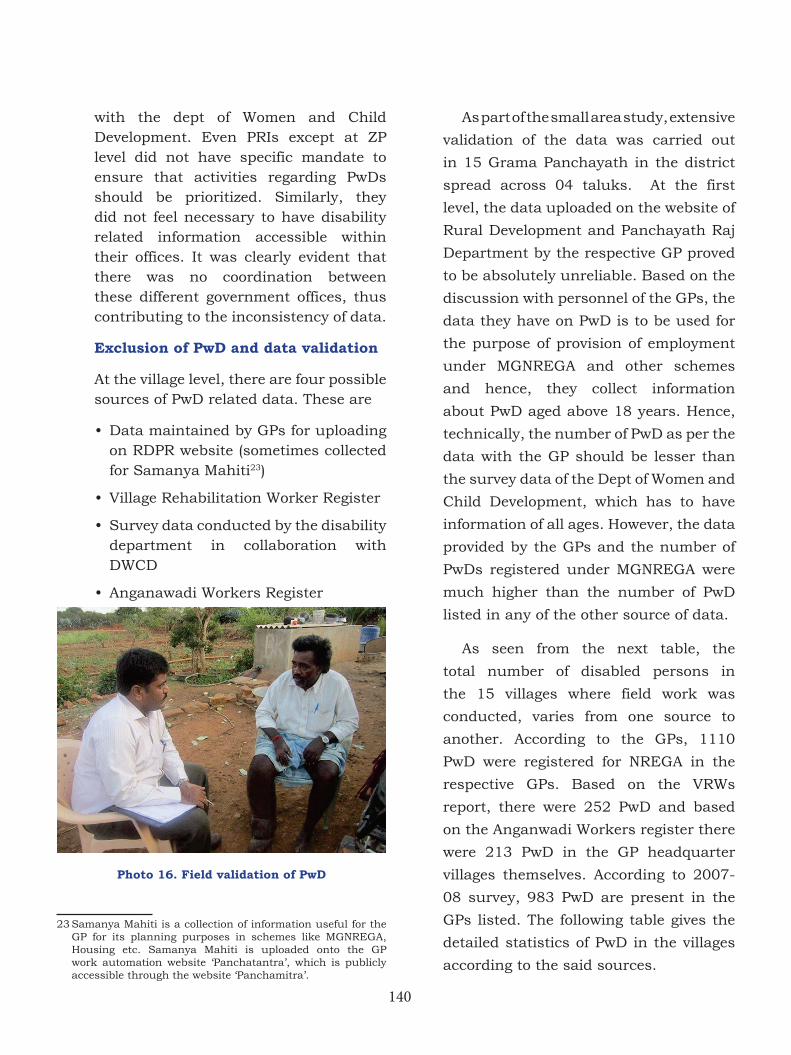
140
with the dept of Women and Child Development. Even PRIs except at ZP level did not have specific mandate to ensure that activities regarding PwDs should be prioritized. Similarly, they did not feel necessary to have disability related information accessible within their offices. It was clearly evident that there was no coordination between these different government offices, thus contributing to the inconsistency of data.
Exclusion of PwD and data validation
At the village level, there are four possible sources of PwD related data. These are
• Data maintained by GPs for uploading on RDPR website (sometimes collected for Samanya Mahiti23)
• Village Rehabilitation Worker Register
• Survey data conducted by the disability department in collaboration with DWCD
• Anganawadi Workers Register
Photo 16. Field validation of PwD
23 Samanya Mahiti is a collection of information useful for the GP for its planning purposes in schemes like MGNREGA, Housing etc. Samanya Mahiti is uploaded onto the GP work automation website ‘Panchatantra’, which is publicly accessible through the website ‘Panchamitra’.
As part of the small area study, extensive
validation of the data was carried out
in 15 Grama Panchayath in the district
spread across 04 taluks. At the first
level, the data uploaded on the website of
Rural Development and Panchayath Raj
Department by the respective GP proved
to be absolutely unreliable. Based on the
discussion with personnel of the GPs, the
data they have on PwD is to be used for
the purpose of provision of employment
under MGNREGA and other schemes
and hence, they collect information
about PwD aged above 18 years. Hence,
technically, the number of PwD as per the
data with the GP should be lesser than
the survey data of the Dept of Women and
Child Development, which has to have
information of all ages. However, the data
provided by the GPs and the number of
PwDs registered under MGNREGA were
much higher than the number of PwD
listed in any of the other source of data.
As seen from the next table, the
total number of disabled persons in
the 15 villages where field work was
conducted, varies from one source to
another. According to the GPs, 1110
PwD were registered for NREGA in the
respective GPs. Based on the VRWs
report, there were 252 PwD and based
on the Anganwadi Workers register there
were 213 PwD in the GP headquarter
villages themselves. According to 2007-
08 survey, 983 PwD are present in the
GPs listed. The following table gives the
detailed statistics of PwD in the villages
according to the said sources.
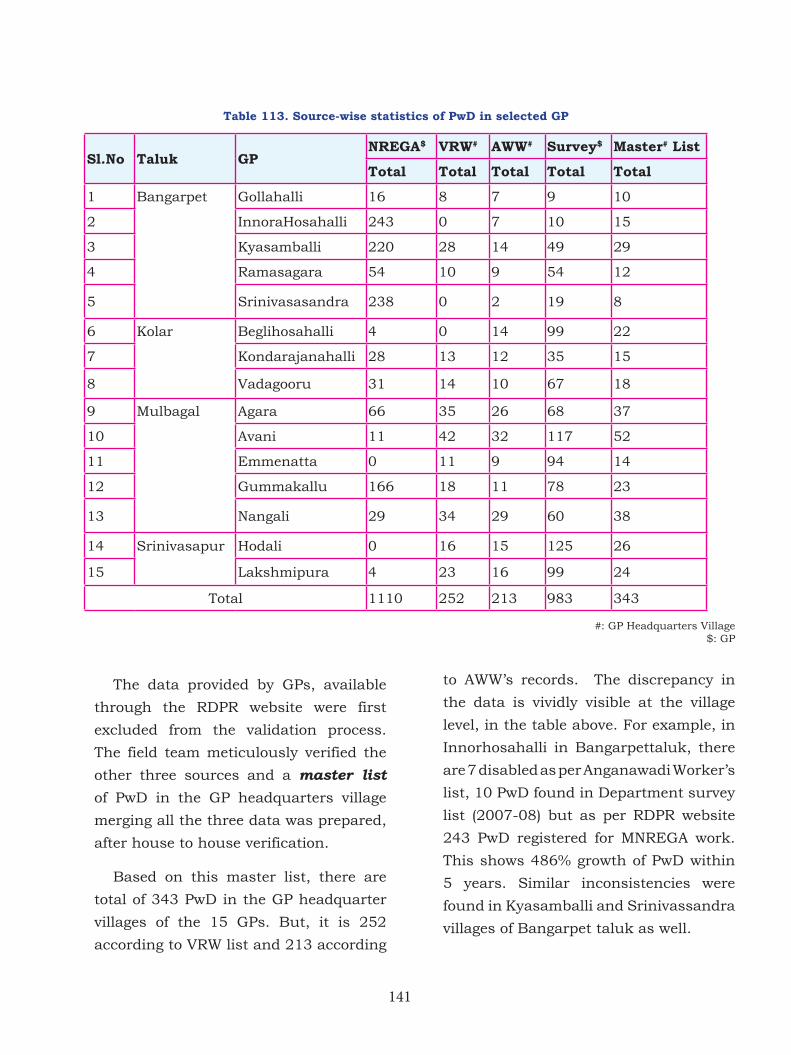
141
The data provided by GPs, available
through the RDPR website were first
excluded from the validation process.
The field team meticulously verified the
other three sources and a master list of PwD in the GP headquarters village
merging all the three data was prepared,
after house to house verification.
Based on this master list, there are
total of 343 PwD in the GP headquarter
villages of the 15 GPs. But, it is 252
according to VRW list and 213 according
Table 113. Source-wise statistics of PwD in selected GP
Sl.No Taluk GPNREGA$ VRW# AWW# Survey$ Master# List
Total Total Total Total Total
1 Bangarpet
Gollahalli 16 8 7 9 10
2 InnoraHosahalli 243 0 7 10 15
3 Kyasamballi 220 28 14 49 29
4 Ramasagara 54 10 9 54 12
5 Srinivasasandra 238 0 2 19 8
6 Kolar
Beglihosahalli 4 0 14 99 22
7 Kondarajanahalli 28 13 12 35 15
8 Vadagooru 31 14 10 67 18
9 Mulbagal
Agara 66 35 26 68 37
10 Avani 11 42 32 117 52
11 Emmenatta 0 11 9 94 14
12 Gummakallu 166 18 11 78 23
13 Nangali 29 34 29 60 38
14 Srinivasapur
Hodali 0 16 15 125 26
15 Lakshmipura 4 23 16 99 24
Total 1110 252 213 983 343
#: GP Headquarters Village $: GP
to AWW’s records. The discrepancy in
the data is vividly visible at the village
level, in the table above. For example, in
Innorhosahalli in Bangarpettaluk, there
are 7 disabled as per Anganawadi Worker’s
list, 10 PwD found in Department survey
list (2007-08) but as per RDPR website
243 PwD registered for MNREGA work.
This shows 486% growth of PwD within
5 years. Similar inconsistencies were
found in Kyasamballi and Srinivassandra
villages of Bangarpet taluk as well.
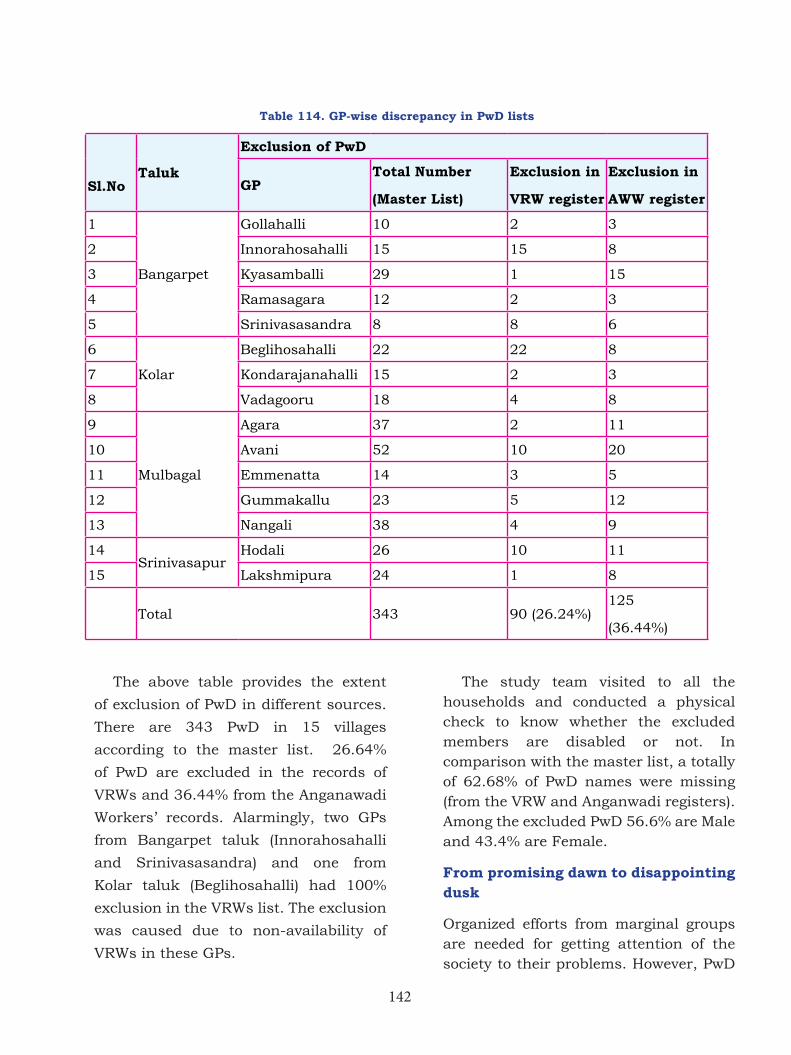
142
The above table provides the extent
of exclusion of PwD in different sources.
There are 343 PwD in 15 villages
according to the master list. 26.64%
of PwD are excluded in the records of
VRWs and 36.44% from the Anganawadi
Workers’ records. Alarmingly, two GPs
from Bangarpet taluk (Innorahosahalli
and Srinivasasandra) and one from
Kolar taluk (Beglihosahalli) had 100%
exclusion in the VRWs list. The exclusion
was caused due to non-availability of
VRWs in these GPs.
The study team visited to all the households and conducted a physical check to know whether the excluded members are disabled or not. In comparison with the master list, a totally of 62.68% of PwD names were missing (from the VRW and Anganwadi registers). Among the excluded PwD 56.6% are Male and 43.4% are Female.
From promising dawn to disappointing dusk
Organized efforts from marginal groups are needed for getting attention of the society to their problems. However, PwD
Table 114. GP-wise discrepancy in PwD lists
Sl.NoTaluk
Exclusion of PwD
GPTotal Number
(Master List)
Exclusion in
VRW register
Exclusion in
AWW register
1
Bangarpet
Gollahalli 10 2 3
2 Innorahosahalli 15 15 8
3 Kyasamballi 29 1 15
4 Ramasagara 12 2 3
5 Srinivasasandra 8 8 6
6
Kolar
Beglihosahalli 22 22 8
7 Kondarajanahalli 15 2 3
8 Vadagooru 18 4 8
9
Mulbagal
Agara 37 2 11
10 Avani 52 10 20
11 Emmenatta 14 3 5
12 Gummakallu 23 5 12
13 Nangali 38 4 9
14Srinivasapur
Hodali 26 10 11
15 Lakshmipura 24 1 8
Total 343 90 (26.24%)125
(36.44%)
143
have hardly organized and never come forward for collective bargaining to get their rights and entitlements. A study conducted by K. P. Kumaran in the year 2013 highlight that organizing PwD into Self-help groups helps them to come out of their shackles and to know about their rights and entitlements. It is interesting to note that one such effort to organize PwD in a Self Help Group (SHG) happened in the Kolar district.
‘Yelichepalli’ is a remote village in Mulbagal taluk of Kolar district which is situated 17.5 kms away from taluk headquarter. This village belongs to Dhoolapalli GP. The village with about 280 households is having about 20 disabled persons. After observing the activities of a local women’s SHGs formed by Ms. Shanthamma, a staff of a local NGO by name ‘KGF Women’s Association’, these PwD asked her to help them as well. With hard work and sustained effort, the PwD were organized as ‘Sri Devaraj Urs Disabled Self Help Group’. The group was formed in the year 2010 with 10 disabled members. After a year, another 2 members joined the group. Among the 12 members, 9 members were male and 3 were female, all belonging to the Marathi community. The two female members in the group were severely disabled, with certification of more than 80 percent. However, disability never reduced their zeal to participate in the group.
Their SHG got the basic training and orientation about the concept of SHGs, savings and self-development, Health and sanitation, environment etc. The group met regularly and had the credit and thrift activities, which helped most of its members to meet their medical expenses.
According to Ms. Shanthamma who helped form this SHG, the group was running well and she felt that it is important to link the group with financial institutions. She said that she went and approached the local nationalized bank to facilitate the financial linkage. But the response from the bank was not encouraging. She also approached various government departments and PRIs. While the officials appreciated her effort, the requirement of ‘proper documentation’ was difficult for Shanthamma. She had to visit these offices many times and spent money out of her pocket for facilitating the linkage, but there was no positive result. After 3-4 months, she expressed her helplessness to the group members. Without institutional support, a group that could have become pioneers in the PwD SHG movement gradually became defunct.
While success stories and best practice models for community based rehabilitation of PwD exist in the neighbouring state of Andhra Pradesh (with which Kolar shares most of its borders), similar initiatives are missing in Karnataka for the upliftment of PwD.
Conclusion
Accurate and dependable data is essential for planning, framing policies, programs and implementing the same in order to address any developmental issue in a focused manner. The statistical information should not only be accurate, it should also be available within a reasonably acceptable time frame before it becomes obsolete. It is also necessary that the data cover wide range of information, such as type of disability, age profile, rural and urban
144
distribution, education, employment status, etc for effective intervention and desired outcomes.
As it normally happens in any developmental intervention ‘something not counted, is not considered at all’. The neglect in information collection can be attributed to the neglect of the development of PwD itself. When the administration and respective program implementation authorities are not sure about number of PwD in the districts, the accuracy in planning, budgeting and designing process to ensure entitlements will miserably fail right at the inception. The focus of human development is to reach the most vulnerable and marginalized section of the community. And, there cannot be any other section more vulnerable than PwD, since they are spread out and hidden among different social categories, castes, gender and other hierarchies. Accurate information
about the number, geographical spread and demographics of PwD, intensity of the disability and their socio-economic profile is the first step towards empowering them for dignified development. This small area study shows that the district has a long way to go, if it has to provide such an environment for its disabled population. Thus, there is an urgent need for data collection relating to PwD of Kolar District to assess their inclusion in various Government welfare schemes. The Department of Disability should take up a leadership role of guiding and integrating the efforts of various government agencies and conduct scientific surveys that adopt universal definitions and criterion to identify exact number of PwD in the district and plan specific development initiatives for this ignored vulnerable group in order to achieve overall human development in the district.
* * * *
145
10.1 Introduction
According to the United Nations Economic and Social Commission for Asia and the Pacific, governance is defined as ‘the process of decision making and the process by which decisions are implemented (or not implemented). Good governance has the following eight major characteristics: it is participatory, consensus oriented, accountable, transparent, responsive, effective and efficient, equitable and inclusive and follows the rule of law. Since the government is a major player involved in governance, good governance in the government assures that societal ills like corruption, violence and oppression are minimized.
The linkages between good governance and human development are evident since governance structures and their performance determine the extent to which policies fostering human development are actually implemented at the grassroots level. While majority of the policy decisions w.r.t to good governance are determined at the state and national levels, the actual planning and direction provided for implementation of these policies and schemes and their impacts can be seen at the district level and below. Thus, governance influences the process of planning and prioritization of issues, decision making and extent of funds made available for these issues and the efficiency of implementation processes. Thus, governance directly influences the development outcomes of the various schemes and programmes of the government.
Thus, the Karnataka Human
Development Report 2005 emphasizes the
links between operational characteristics
of good governance like effectiveness
of fund utilization, patterns of service
delivery, accountability and inclusiveness
to gains in sectors like health, education
and livelihoods and increasing the overall
quality of life of the people.
The discussions in the previous
chapters of this report show that the
current status of human development in
the district is far from satisfactory. In this
context, the role of good governance is
even more critical since the district faces
a multitude of challenges (specifically, in
the sectors of nutrition, sanitation, natural
resource management and livelihoods).
While the previous chapters on health,
education, livelihood and standard of
living focus on sector specific issues in
the district, this chapter analyses the
different aspects of good governance in
the district. The first section focusses on
the local governance structure, including
PRIs and ULBs followed by analysis of
political and bureaucratic stability in the
district. The next section focusses on the
analysis of fiscal trends followed by the
discussion on the physical infrastructure
for delivering public goods and services
in the district.
10.2 Local governance structure
Panchayat Raj Institutions (PRI) and
Urban Local Bodies (ULB) form the major
decentralized governance structures
Governance and Human Development
Chapter 10
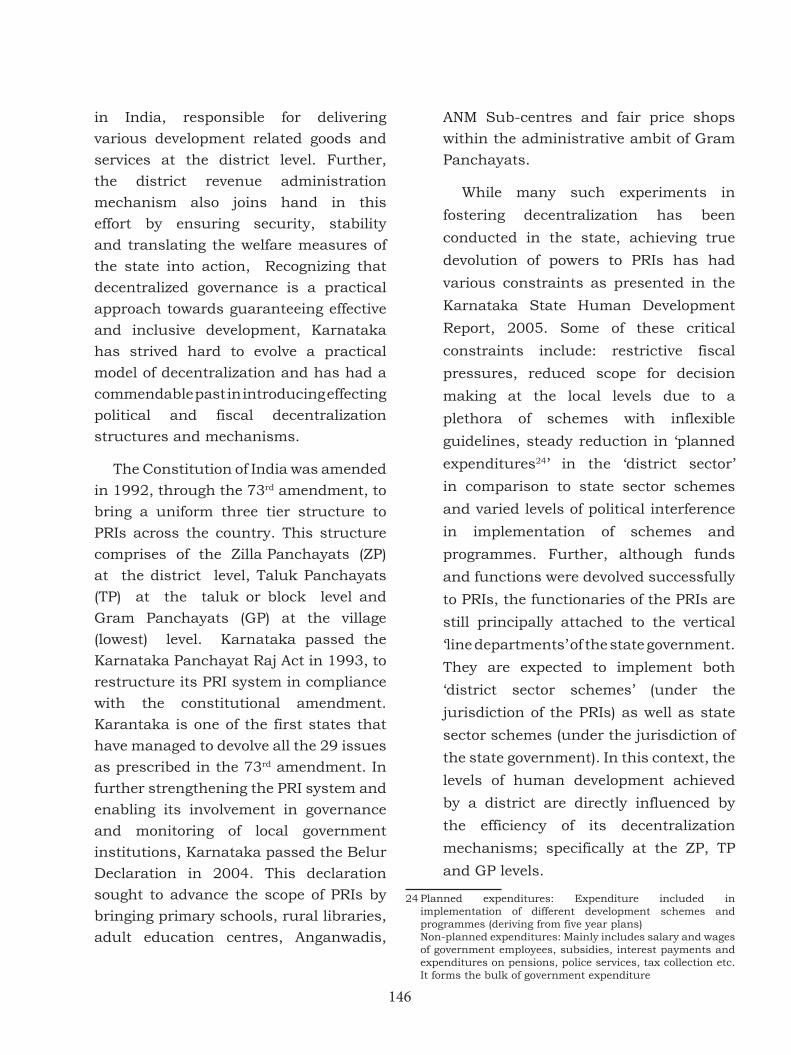
146
in India, responsible for delivering
various development related goods and
services at the district level. Further,
the district revenue administration
mechanism also joins hand in this
effort by ensuring security, stability
and translating the welfare measures of
the state into action, Recognizing that
decentralized governance is a practical
approach towards guaranteeing effective
and inclusive development, Karnataka
has strived hard to evolve a practical
model of decentralization and has had a
commendable past in introducing effecting
political and fiscal decentralization
structures and mechanisms.
The Constitution of India was amended
in 1992, through the 73rd amendment, to
bring a uniform three tier structure to
PRIs across the country. This structure
comprises of the Zilla Panchayats (ZP)
at the district level, Taluk Panchayats
(TP) at the taluk or block level and
Gram Panchayats (GP) at the village
(lowest) level. Karnataka passed the
Karnataka Panchayat Raj Act in 1993, to
restructure its PRI system in compliance
with the constitutional amendment.
Karantaka is one of the first states that
have managed to devolve all the 29 issues
as prescribed in the 73rd amendment. In
further strengthening the PRI system and
enabling its involvement in governance
and monitoring of local government
institutions, Karnataka passed the Belur
Declaration in 2004. This declaration
sought to advance the scope of PRIs by
bringing primary schools, rural libraries,
adult education centres, Anganwadis,
ANM Sub-centres and fair price shops
within the administrative ambit of Gram
Panchayats.
While many such experiments in
fostering decentralization has been
conducted in the state, achieving true
devolution of powers to PRIs has had
various constraints as presented in the
Karnataka State Human Development
Report, 2005. Some of these critical
constraints include: restrictive fiscal
pressures, reduced scope for decision
making at the local levels due to a
plethora of schemes with inflexible
guidelines, steady reduction in ‘planned
expenditures24’ in the ‘district sector’
in comparison to state sector schemes
and varied levels of political interference
in implementation of schemes and
programmes. Further, although funds
and functions were devolved successfully
to PRIs, the functionaries of the PRIs are
still principally attached to the vertical
‘line departments’ of the state government.
They are expected to implement both
‘district sector schemes’ (under the
jurisdiction of the PRIs) as well as state
sector schemes (under the jurisdiction of
the state government). In this context, the
levels of human development achieved
by a district are directly influenced by
the efficiency of its decentralization
mechanisms; specifically at the ZP, TP
and GP levels.
24 Planned expenditures: Expenditure included in implementation of different development schemes and programmes (deriving from five year plans)
Non-planned expenditures: Mainly includes salary and wages of government employees, subsidies, interest payments and expenditures on pensions, police services, tax collection etc. It forms the bulk of government expenditure
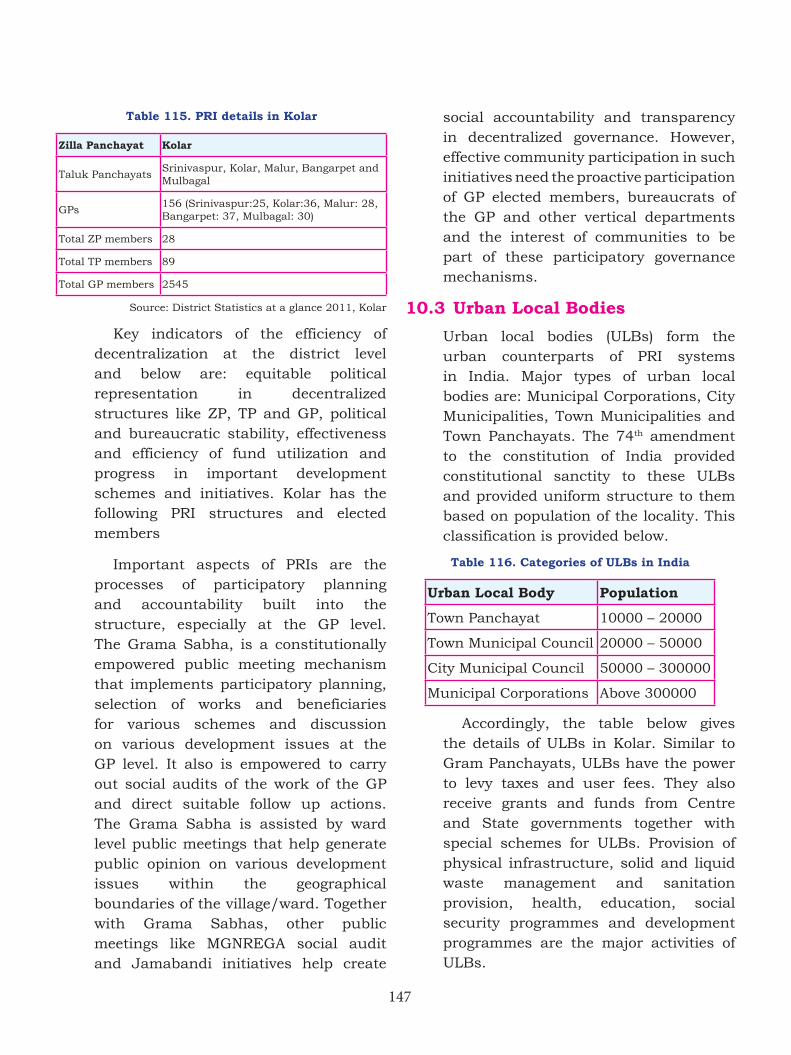
147
Table 115. PRI details in Kolar
Zilla Panchayat Kolar
Taluk PanchayatsSrinivaspur, Kolar, Malur, Bangarpet and Mulbagal
GPs156 (Srinivaspur:25, Kolar:36, Malur: 28, Bangarpet: 37, Mulbagal: 30)
Total ZP members 28
Total TP members 89
Total GP members 2545
Source: District Statistics at a glance 2011, Kolar
Key indicators of the efficiency of decentralization at the district level and below are: equitable political representation in decentralized structures like ZP, TP and GP, political and bureaucratic stability, effectiveness and efficiency of fund utilization and progress in important development schemes and initiatives. Kolar has the following PRI structures and elected members
Important aspects of PRIs are the processes of participatory planning and accountability built into the structure, especially at the GP level. The Grama Sabha, is a constitutionally empowered public meeting mechanism that implements participatory planning, selection of works and beneficiaries for various schemes and discussion on various development issues at the GP level. It also is empowered to carry out social audits of the work of the GP and direct suitable follow up actions. The Grama Sabha is assisted by ward level public meetings that help generate public opinion on various development issues within the geographical boundaries of the village/ward. Together with Grama Sabhas, other public meetings like MGNREGA social audit and Jamabandi initiatives help create
social accountability and transparency in decentralized governance. However, effective community participation in such initiatives need the proactive participation of GP elected members, bureaucrats of the GP and other vertical departments and the interest of communities to be part of these participatory governance mechanisms.
10.3 Urban Local Bodies
Urban local bodies (ULBs) form the urban counterparts of PRI systems in India. Major types of urban local bodies are: Municipal Corporations, City Municipalities, Town Municipalities and Town Panchayats. The 74th amendment to the constitution of India provided constitutional sanctity to these ULBs and provided uniform structure to them based on population of the locality. This classification is provided below.
Table 116. Categories of ULBs in India
Urban Local Body Population
Town Panchayat 10000 – 20000
Town Municipal Council 20000 – 50000
City Municipal Council 50000 – 300000
Municipal Corporations Above 300000
Accordingly, the table below gives the details of ULBs in Kolar. Similar to Gram Panchayats, ULBs have the power to levy taxes and user fees. They also receive grants and funds from Centre and State governments together with special schemes for ULBs. Provision of physical infrastructure, solid and liquid waste management and sanitation provision, health, education, social security programmes and development programmes are the major activities of ULBs.
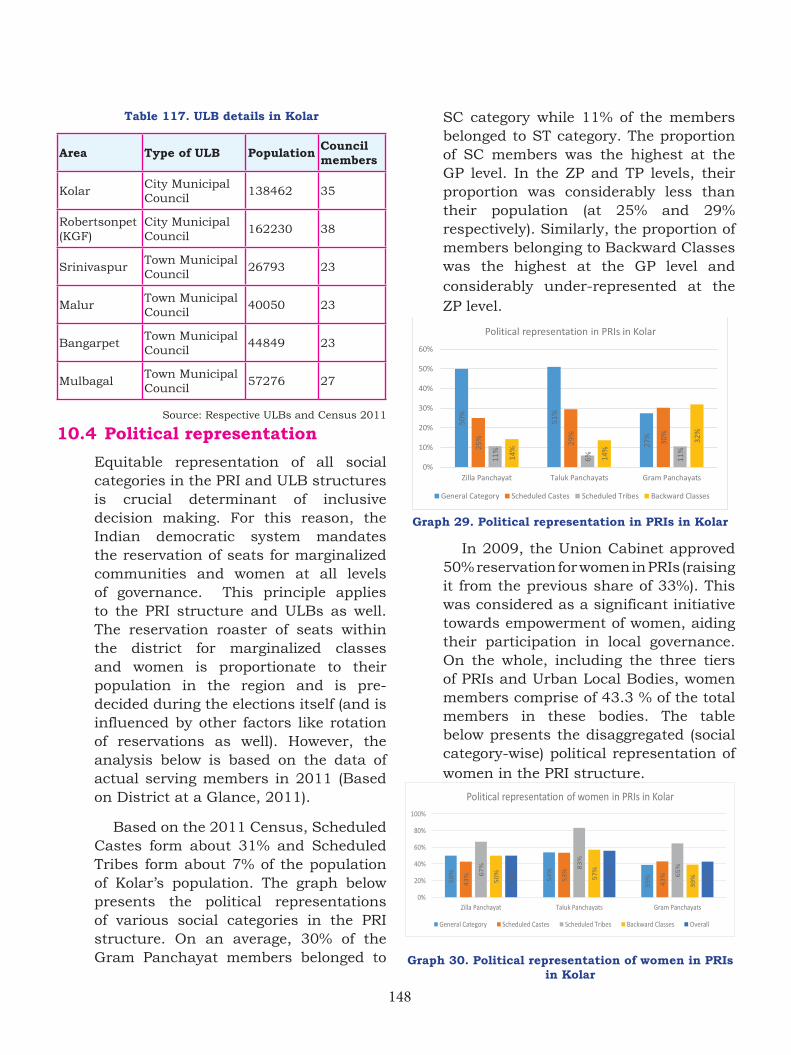
148
Table 117. ULB details in Kolar
Area Type of ULB Population Council members
KolarCity Municipal Council
138462 35
Robertsonpet (KGF)
City Municipal Council
162230 38
SrinivaspurTown Municipal Council
26793 23
MalurTown Municipal Council
40050 23
BangarpetTown Municipal Council
44849 23
MulbagalTown Municipal Council
57276 27
Source: Respective ULBs and Census 2011
10.4 Political representation
Equitable representation of all social categories in the PRI and ULB structures is crucial determinant of inclusive decision making. For this reason, the Indian democratic system mandates the reservation of seats for marginalized communities and women at all levels of governance. This principle applies to the PRI structure and ULBs as well. The reservation roaster of seats within the district for marginalized classes and women is proportionate to their population in the region and is pre-decided during the elections itself (and is influenced by other factors like rotation of reservations as well). However, the analysis below is based on the data of actual serving members in 2011 (Based on District at a Glance, 2011).
Based on the 2011 Census, Scheduled Castes form about 31% and Scheduled Tribes form about 7% of the population of Kolar’s population. The graph below presents the political representations of various social categories in the PRI structure. On an average, 30% of the Gram Panchayat members belonged to
SC category while 11% of the members belonged to ST category. The proportion of SC members was the highest at the GP level. In the ZP and TP levels, their proportion was considerably less than their population (at 25% and 29% respectively). Similarly, the proportion of members belonging to Backward Classes was the highest at the GP level and considerably under-represented at the ZP level.
Graph 29. Political representation in PRIs in Kolar
In 2009, the Union Cabinet approved 50% reservation for women in PRIs (raising it from the previous share of 33%). This was considered as a significant initiative towards empowerment of women, aiding their participation in local governance. On the whole, including the three tiers of PRIs and Urban Local Bodies, women members comprise of 43.3 % of the total members in these bodies. The table below presents the disaggregated (social category-wise) political representation of women in the PRI structure.
Graph 30. Political representation of women in PRIs in Kolar
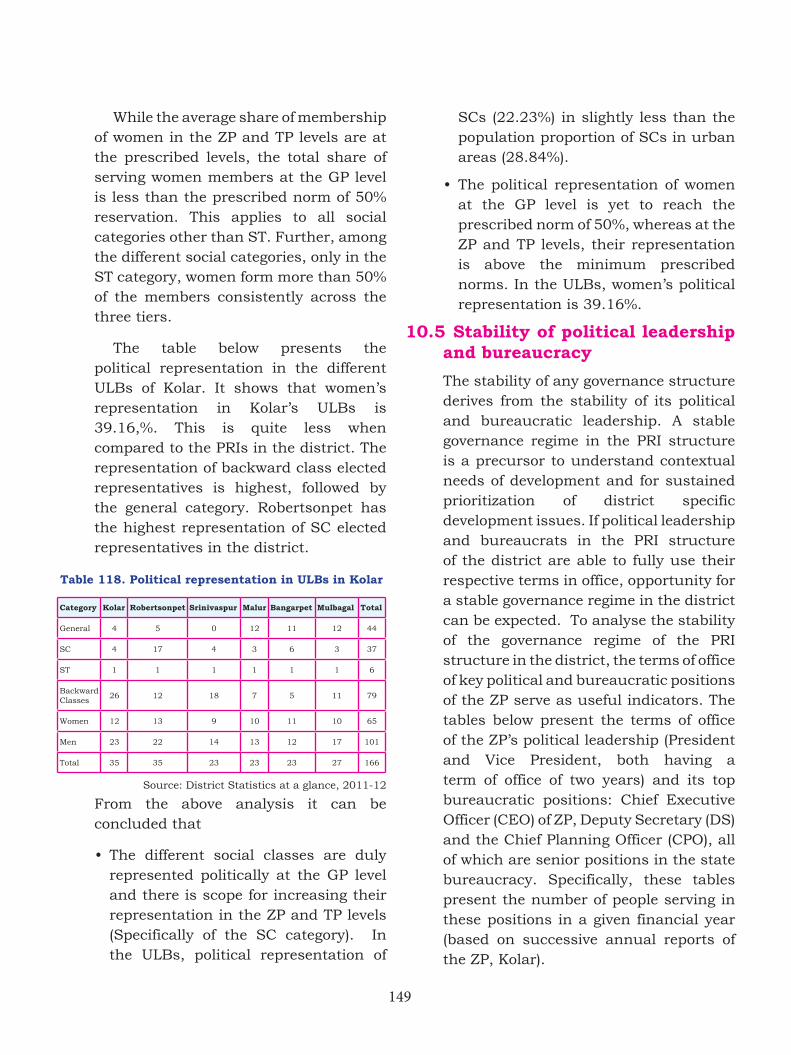
149
While the average share of membership of women in the ZP and TP levels are at the prescribed levels, the total share of serving women members at the GP level is less than the prescribed norm of 50% reservation. This applies to all social categories other than ST. Further, among the different social categories, only in the ST category, women form more than 50% of the members consistently across the three tiers.
The table below presents the political representation in the different ULBs of Kolar. It shows that women’s representation in Kolar’s ULBs is 39.16,%. This is quite less when compared to the PRIs in the district. The representation of backward class elected representatives is highest, followed by the general category. Robertsonpet has the highest representation of SC elected representatives in the district.
Table 118. Political representation in ULBs in Kolar
Category Kolar Robertsonpet Srinivaspur Malur Bangarpet Mulbagal Total
General 4 5 0 12 11 12 44
SC 4 17 4 3 6 3 37
ST 1 1 1 1 1 1 6
Backward Classes
26 12 18 7 5 11 79
Women 12 13 9 10 11 10 65
Men 23 22 14 13 12 17 101
Total 35 35 23 23 23 27 166
Source: District Statistics at a glance, 2011-12
From the above analysis it can be concluded that
• The different social classes are duly represented politically at the GP level and there is scope for increasing their representation in the ZP and TP levels (Specifically of the SC category). In the ULBs, political representation of
SCs (22.23%) in slightly less than the population proportion of SCs in urban areas (28.84%).
• The political representation of women at the GP level is yet to reach the prescribed norm of 50%, whereas at the ZP and TP levels, their representation is above the minimum prescribed norms. In the ULBs, women’s political representation is 39.16%.
10.5 Stability of political leadership and bureaucracy
The stability of any governance structure derives from the stability of its political and bureaucratic leadership. A stable governance regime in the PRI structure is a precursor to understand contextual needs of development and for sustained prioritization of district specific development issues. If political leadership and bureaucrats in the PRI structure of the district are able to fully use their respective terms in office, opportunity for a stable governance regime in the district can be expected. To analyse the stability of the governance regime of the PRI structure in the district, the terms of office of key political and bureaucratic positions of the ZP serve as useful indicators. The tables below present the terms of office of the ZP’s political leadership (President and Vice President, both having a term of office of two years) and its top bureaucratic positions: Chief Executive Officer (CEO) of ZP, Deputy Secretary (DS) and the Chief Planning Officer (CPO), all of which are senior positions in the state bureaucracy. Specifically, these tables present the number of people serving in these positions in a given financial year (based on successive annual reports of the ZP, Kolar).
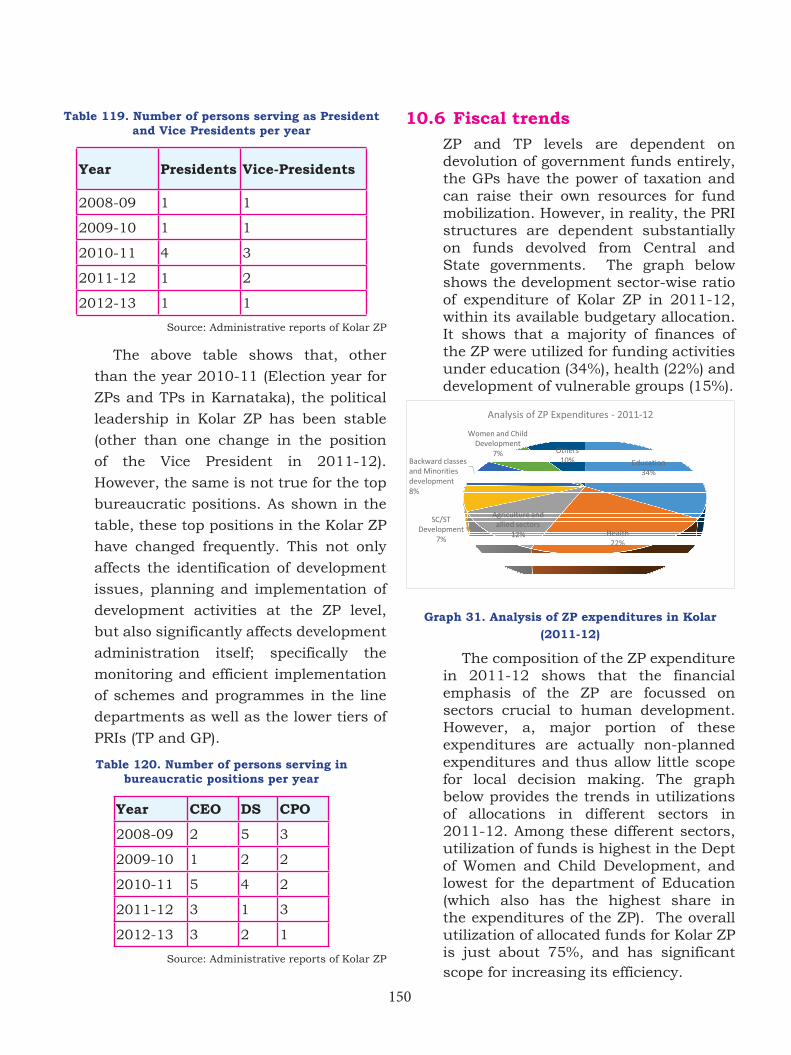
150
Table 119. Number of persons serving as President and Vice Presidents per year
Year Presidents Vice-Presidents
2008-09 1 1
2009-10 1 1
2010-11 4 3
2011-12 1 2
2012-13 1 1
Source: Administrative reports of Kolar ZP
The above table shows that, other
than the year 2010-11 (Election year for
ZPs and TPs in Karnataka), the political
leadership in Kolar ZP has been stable
(other than one change in the position
of the Vice President in 2011-12).
However, the same is not true for the top
bureaucratic positions. As shown in the
table, these top positions in the Kolar ZP
have changed frequently. This not only
affects the identification of development
issues, planning and implementation of
development activities at the ZP level,
but also significantly affects development
administration itself; specifically the
monitoring and efficient implementation
of schemes and programmes in the line
departments as well as the lower tiers of
PRIs (TP and GP).
Table 120. Number of persons serving in bureaucratic positions per year
Year CEO DS CPO
2008-09 2 5 3
2009-10 1 2 2
2010-11 5 4 2
2011-12 3 1 3
2012-13 3 2 1
Source: Administrative reports of Kolar ZP
10.6 Fiscal trends ZP and TP levels are dependent on
devolution of government funds entirely, the GPs have the power of taxation and can raise their own resources for fund mobilization. However, in reality, the PRI structures are dependent substantially on funds devolved from Central and State governments. The graph below shows the development sector-wise ratio of expenditure of Kolar ZP in 2011-12, within its available budgetary allocation. It shows that a majority of finances of the ZP were utilized for funding activities under education (34%), health (22%) and development of vulnerable groups (15%).
Graph 31. Analysis of ZP expenditures in Kolar (2011-12)
The composition of the ZP expenditure in 2011-12 shows that the financial emphasis of the ZP are focussed on sectors crucial to human development. However, a, major portion of these expenditures are actually non-planned expenditures and thus allow little scope for local decision making. The graph below provides the trends in utilizations of allocations in different sectors in 2011-12. Among these different sectors, utilization of funds is highest in the Dept of Women and Child Development, and lowest for the department of Education (which also has the highest share in the expenditures of the ZP). The overall utilization of allocated funds for Kolar ZP is just about 75%, and has significant scope for increasing its efficiency.
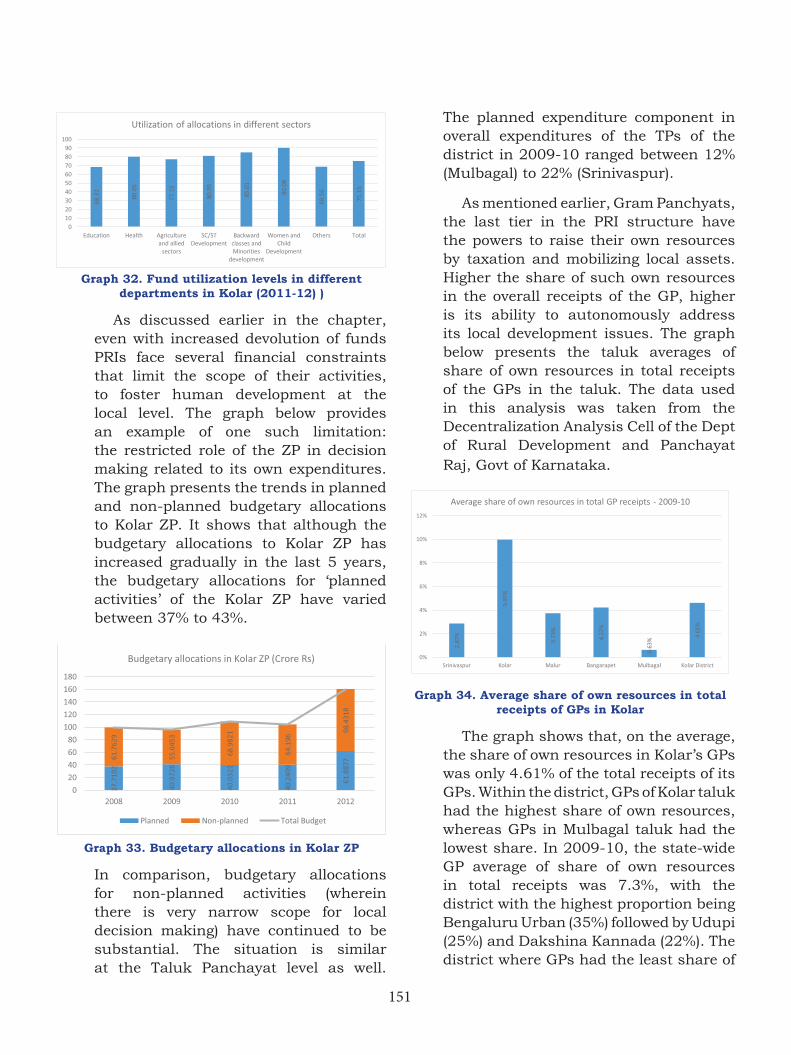
151
Graph 32. Fund utilization levels in different departments in Kolar (2011-12) )
As discussed earlier in the chapter, even with increased devolution of funds PRIs face several financial constraints that limit the scope of their activities, to foster human development at the local level. The graph below provides an example of one such limitation: the restricted role of the ZP in decision making related to its own expenditures. The graph presents the trends in planned and non-planned budgetary allocations to Kolar ZP. It shows that although the budgetary allocations to Kolar ZP has increased gradually in the last 5 years, the budgetary allocations for ‘planned activities’ of the Kolar ZP have varied between 37% to 43%.
Graph 33. Budgetary allocations in Kolar ZP
In comparison, budgetary allocations for non-planned activities (wherein there is very narrow scope for local decision making) have continued to be substantial. The situation is similar at the Taluk Panchayat level as well.
The planned expenditure component in overall expenditures of the TPs of the district in 2009-10 ranged between 12% (Mulbagal) to 22% (Srinivaspur).
As mentioned earlier, Gram Panchyats, the last tier in the PRI structure have the powers to raise their own resources by taxation and mobilizing local assets. Higher the share of such own resources in the overall receipts of the GP, higher is its ability to autonomously address its local development issues. The graph below presents the taluk averages of share of own resources in total receipts of the GPs in the taluk. The data used in this analysis was taken from the Decentralization Analysis Cell of the Dept of Rural Development and Panchayat Raj, Govt of Karnataka.
Graph 34. Average share of own resources in total receipts of GPs in Kolar
The graph shows that, on the average, the share of own resources in Kolar’s GPs was only 4.61% of the total receipts of its GPs. Within the district, GPs of Kolar taluk had the highest share of own resources, whereas GPs in Mulbagal taluk had the lowest share. In 2009-10, the state-wide GP average of share of own resources in total receipts was 7.3%, with the district with the highest proportion being Bengaluru Urban (35%) followed by Udupi (25%) and Dakshina Kannada (22%). The district where GPs had the least share of
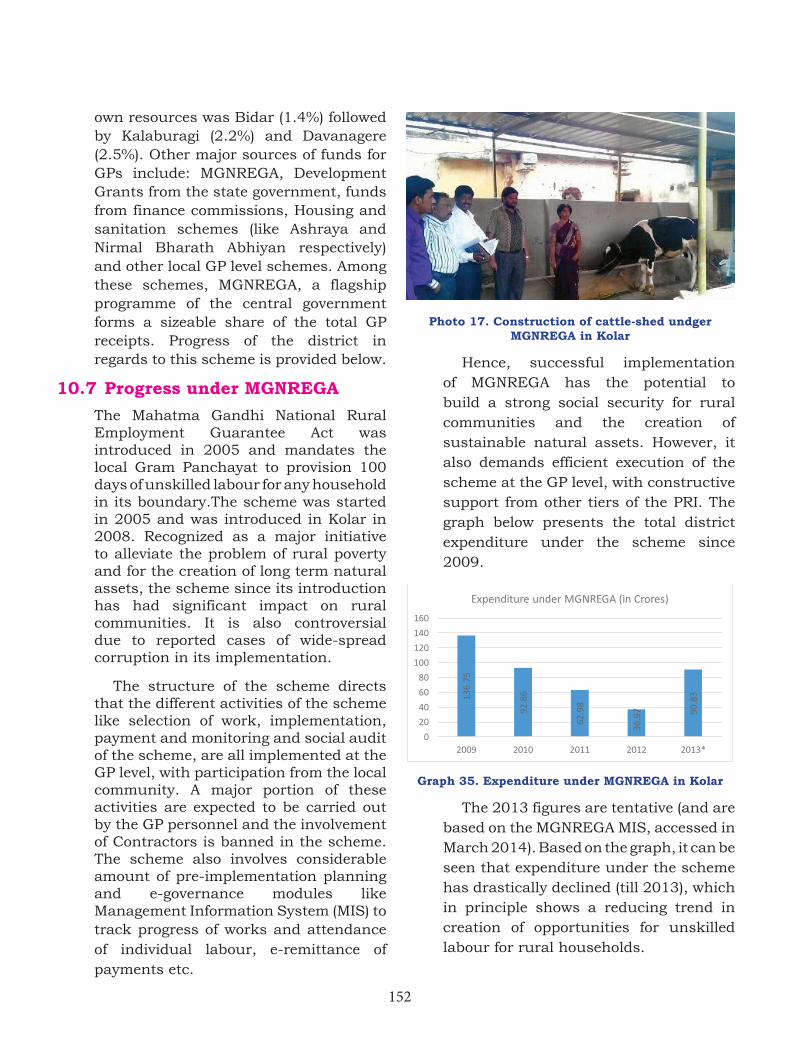
152
own resources was Bidar (1.4%) followed by Kalaburagi (2.2%) and Davanagere (2.5%). Other major sources of funds for GPs include: MGNREGA, Development Grants from the state government, funds from finance commissions, Housing and sanitation schemes (like Ashraya and Nirmal Bharath Abhiyan respectively) and other local GP level schemes. Among these schemes, MGNREGA, a flagship programme of the central government forms a sizeable share of the total GP receipts. Progress of the district in regards to this scheme is provided below.
10.7 Progress under MGNREGA The Mahatma Gandhi National Rural
Employment Guarantee Act was introduced in 2005 and mandates the local Gram Panchayat to provision 100 days of unskilled labour for any household in its boundary.The scheme was started in 2005 and was introduced in Kolar in 2008. Recognized as a major initiative to alleviate the problem of rural poverty and for the creation of long term natural assets, the scheme since its introduction has had significant impact on rural communities. It is also controversial due to reported cases of wide-spread corruption in its implementation.
The structure of the scheme directs that the different activities of the scheme like selection of work, implementation, payment and monitoring and social audit of the scheme, are all implemented at the GP level, with participation from the local community. A major portion of these activities are expected to be carried out by the GP personnel and the involvement of Contractors is banned in the scheme. The scheme also involves considerable amount of pre-implementation planning and e-governance modules like Management Information System (MIS) to track progress of works and attendance of individual labour, e-remittance of payments etc.
Photo 17. Construction of cattle-shed undger MGNREGA in Kolar
Hence, successful implementation of MGNREGA has the potential to build a strong social security for rural communities and the creation of sustainable natural assets. However, it also demands efficient execution of the scheme at the GP level, with constructive support from other tiers of the PRI. The graph below presents the total district expenditure under the scheme since 2009.
Graph 35. Expenditure under MGNREGA in Kolar
The 2013 figures are tentative (and are based on the MGNREGA MIS, accessed in March 2014). Based on the graph, it can be seen that expenditure under the scheme has drastically declined (till 2013), which in principle shows a reducing trend in creation of opportunities for unskilled labour for rural households.
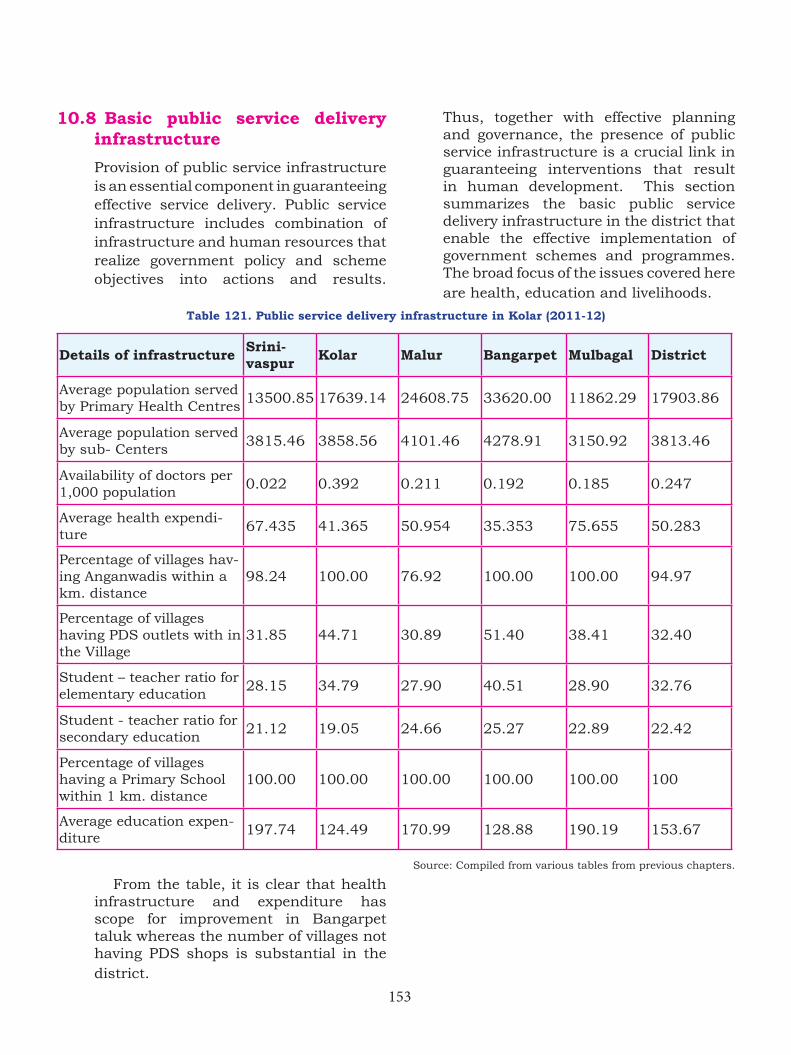
153
10.8 Basic public service delivery infrastructure
Provision of public service infrastructure is an essential component in guaranteeing effective service delivery. Public service infrastructure includes combination of infrastructure and human resources that realize government policy and scheme objectives into actions and results.
Thus, together with effective planning and governance, the presence of public service infrastructure is a crucial link in guaranteeing interventions that result in human development. This section summarizes the basic public service delivery infrastructure in the district that enable the effective implementation of government schemes and programmes. The broad focus of the issues covered here are health, education and livelihoods.
Table 121. Public service delivery infrastructure in Kolar (2011-12)
Details of infrastructure Srini-vaspur Kolar Malur Bangarpet Mulbagal District
Average population served by Primary Health Centres
13500.85 17639.14 24608.75 33620.00 11862.29 17903.86
Average population served by sub- Centers
3815.46 3858.56 4101.46 4278.91 3150.92 3813.46
Availability of doctors per 1,000 population
0.022 0.392 0.211 0.192 0.185 0.247
Average health expendi-ture
67.435 41.365 50.954 35.353 75.655 50.283
Percentage of villages hav-ing Anganwadis within a km. distance
98.24 100.00 76.92 100.00 100.00 94.97
Percentage of villages having PDS outlets with in the Village
31.85 44.71 30.89 51.40 38.41 32.40
Student – teacher ratio for elementary education
28.15 34.79 27.90 40.51 28.90 32.76
Student - teacher ratio for secondary education
21.12 19.05 24.66 25.27 22.89 22.42
Percentage of villages having a Primary School within 1 km. distance
100.00 100.00 100.00 100.00 100.00 100
Average education expen-diture
197.74 124.49 170.99 128.88 190.19 153.67
Source: Compiled from various tables from previous chapters.
From the table, it is clear that health infrastructure and expenditure has scope for improvement in Bangarpet taluk whereas the number of villages not having PDS shops is substantial in the district.
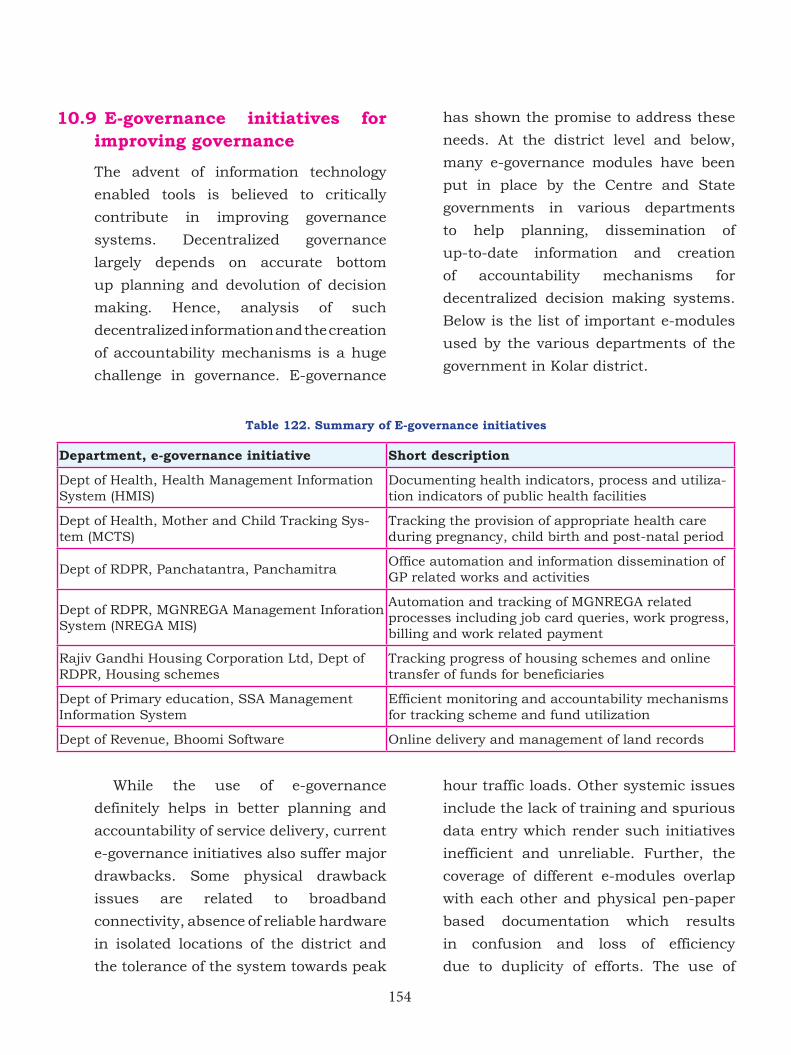
154
10.9 E-governance initiatives for improving governance
The advent of information technology
enabled tools is believed to critically
contribute in improving governance
systems. Decentralized governance
largely depends on accurate bottom
up planning and devolution of decision
making. Hence, analysis of such
decentralized information and the creation
of accountability mechanisms is a huge
challenge in governance. E-governance
has shown the promise to address these
needs. At the district level and below,
many e-governance modules have been
put in place by the Centre and State
governments in various departments
to help planning, dissemination of
up-to-date information and creation
of accountability mechanisms for
decentralized decision making systems.
Below is the list of important e-modules
used by the various departments of the
government in Kolar district.
While the use of e-governance
definitely helps in better planning and
accountability of service delivery, current
e-governance initiatives also suffer major
drawbacks. Some physical drawback
issues are related to broadband
connectivity, absence of reliable hardware
in isolated locations of the district and
the tolerance of the system towards peak
Table 122. Summary of E-governance initiatives
Department, e-governance initiative Short description
Dept of Health, Health Management Information System (HMIS)
Documenting health indicators, process and utiliza-tion indicators of public health facilities
Dept of Health, Mother and Child Tracking Sys-tem (MCTS)
Tracking the provision of appropriate health care during pregnancy, child birth and post-natal period
Dept of RDPR, Panchatantra, PanchamitraOffice automation and information dissemination of GP related works and activities
Dept of RDPR, MGNREGA Management Inforation System (NREGA MIS)
Automation and tracking of MGNREGA related processes including job card queries, work progress, billing and work related payment
Rajiv Gandhi Housing Corporation Ltd, Dept of RDPR, Housing schemes
Tracking progress of housing schemes and online transfer of funds for beneficiaries
Dept of Primary education, SSA Management Information System
Efficient monitoring and accountability mechanisms for tracking scheme and fund utilization
Dept of Revenue, Bhoomi Software Online delivery and management of land records
hour traffic loads. Other systemic issues
include the lack of training and spurious
data entry which render such initiatives
inefficient and unreliable. Further, the
coverage of different e-modules overlap
with each other and physical pen-paper
based documentation which results
in confusion and loss of efficiency
due to duplicity of efforts. The use of
155
vital role in the efforts to further human
development objectives.
In this aspect Kolar has multiple
non-governmental organizations,
working in the areas of agriculture,
water conservation, dalit rights, women,
people with disabilities, governance
and labour issues. Further, networks of
such organizations also exist in Kolar, to
provide umbrella support to communities
on various issues related to development,
transparent governance and prevention
of violence and injustice.
Similarly, community based
organizations like youth and women
groups, cultural groups and farmers
groups also play an important role in
providing a collective voice for individuals.
These organizations need to be carefully
nurtured, to improve the effectiveness of
governance in the district.
10.11 Conclusion
The analysis of governance related issues
in Kolar show that women’s participation
in local bodies, specifically, in ULBs
has scope for further improvement.
The analysis of fiscal trends in Kolar
shows that planned expenditures
in the district form 37% to 43% of
the overall expenditures. Increase in
planned expenditures allow the district
the flexibility to prioritize issues and
taluks of immediate importance and
thus allows the local governance to
contribute significantly in meeting the
development requirements. Further, the
e-governance modules in planning and
decision making still remains untapped
due to the relative novelty of these
systems and the other systemic issues
mentioned earlier.
Thus e-governance policies have to
focus on creating simple, sustainable and
seamless integration of various activities
of government departments.
10.10 Role of NGOs and other voluntary groups
Civil society organizations include
voluntary groups, non-governmental
organizations and community based
organizations and form the ‘third sector’
(as opposed to public and private sectors)
of the society. These organizations play
a vital role in forwarding the interests
of marginalized and opporessed groups
and shed light on unique development
issues that can often be ignored by the
other two sectors. A healthy third sector
in any region indicates a balanced
and equitable view of development,
an established social accountability
framework and multiple stakeholders
involved in the process of translating
development initiatives into fruitful
outcomes. The continuous involvement
of non-governmental organizations
and community based organizations
in planning, implementation and
monitoring is known to improve the
quality and equitable distribution
of benefits of public service delivery
initiatives, especially at the grassroots
level. Thus, these organizations play a
156
analysis of resource mobilization levels of
GPs in Kolar show that there are large
disparities in GPs of different taluks, with
Mulbagal lagging behind significantly.
All of Kolar’s taluks perform poorly and
district administration have to focus on
promoting local resource mobilization
if decentralized governance has to be
fostered. MGNREGA in the district shows
declining trends in expenditure as well as
man-days generated till 2012-13. These
trends have to be analysed keeping in
view the dynamics of agricultural labour
and the actual labour demanded through
MGNREGA in the district.
The chapter summarized various development related issues to be dealt with in the district, which requires long term vision and planning. This requires stable bureaucratic and political regimes in the district. Bureaucratic and political stability in the ZP are issues of concern in Kolar since every single year seems to have multiple teams of bureaucratic and political leadership. Kolar requires stable leadership in guiding the district’s development efforts towards long term economic and environmental sustainability. Hence, improving the effectiveness of governance and simultaneously developing stable and accountable governance mechanisms will be crucial in order to utilize the full potential of the human capability.
* * * *
157
Urbanization is a process in which the population of people living in urban areas grows, through a complex process of migration of population from rural areas, conversion of rural areas to urban areas as well as population growth within existing urban areas. In a developing country like India, urbanization is an inevitable end product of economic growth and modernization. The world has been witnessing increasing rates of urbanization and according to United Nations, since 2008, more people are living in urban areas than rural areas.
Urbanized societies provide more opportunities for diversity of livelihoods. In countries like India where low paying and stagnant agricultural labour forms a major source (and sometimes the only source) of employment, urbanization is seen as a way to diversify livelihood options, provision of better employment opportunities and access to better health and educational facilities, so that households are provided with the opportunity to quickly move up the social and economic ladder. Thus, in many cases, urbanization is seen as a positive sign for human development of a region since it can result in improvements in multiple dimensions of human development. Hence, in the analysis of indicators of development in this report, indicators like proportion of non-agricultural labour (a proxy for urbanization), and share of urban populations in overall population of a district are considered as positive indicators whereas share of agricultural labourers.
However, erratic urbanization may also led to erosion of safety nets, unsafe living conditions leading to poor quality of life, environmental pollution and health hazards. Thus, the impact of urbanization on human development cannot be conclusive unless issues related to health, education, livelihoods and standard of living in the urban context are understood.
India is traditionally seen as a nation made of its villages. The urban population in India was about 11% of its population in 1901 and according to the latest census in 2011, urban population in India forms about 31.16%. Between 2001 and 2011, the proportion of urban population increased by 2.63%. Urbanization in India can be traced mainly after independence, but its pace has increased in the recent years due to increased livelihood opportunities and economic growth in the secondary and tertiary sectors in the urban areas.
Karnataka is comparatively more urbanized than India, with about 38.57% of the population of the state residing in urban centres. In absolute proportions, between 2001 and 2011, the growth rate of urbanization in the state was 4.58% (of the total population of the state). Growth of urbanization in Karnataka is mainly fuelled in the districts of Bengaluru, Mangaluru, Mysuru and Ballary.
In 2011, 31.24% of the population of Kolar lived in the urban areas where as in 2001 this ratio was 29.16%. Thus, it can be said that urbanization in Kolar is less in comparison to that of the state and over the period of 10 years, the absolute growth in urban population proportion
Urban Issues in Human DevelopmentChapter 11
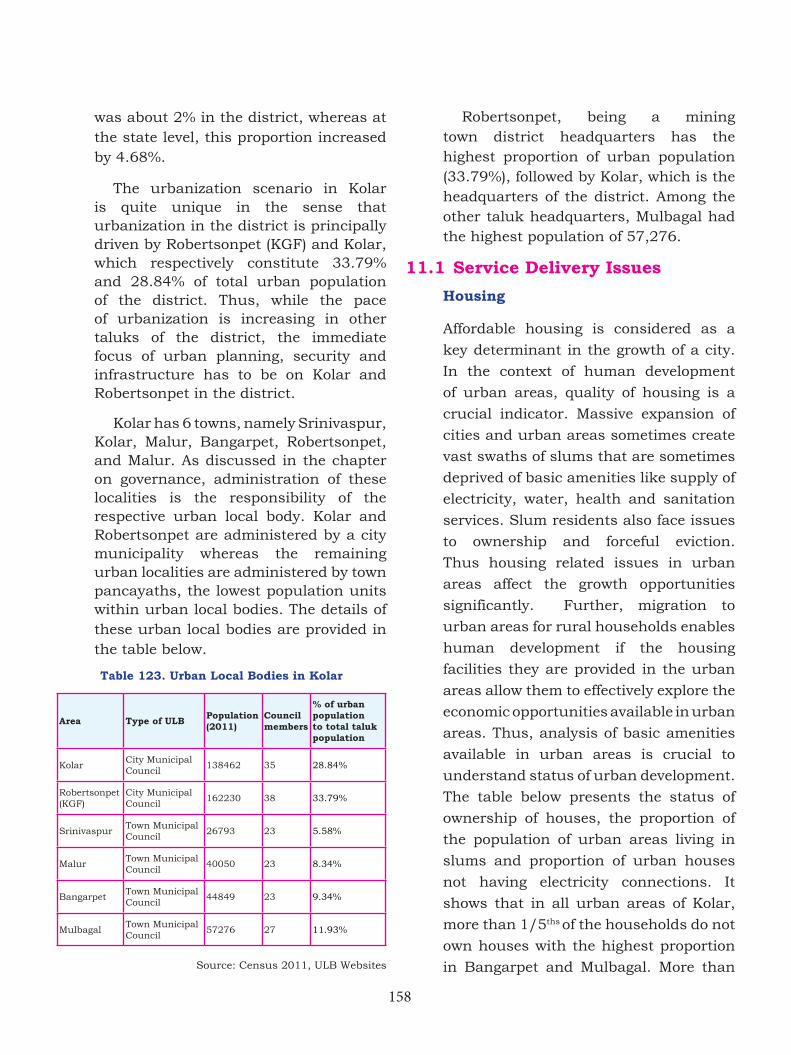
158
was about 2% in the district, whereas at the state level, this proportion increased by 4.68%.
The urbanization scenario in Kolar is quite unique in the sense that urbanization in the district is principally driven by Robertsonpet (KGF) and Kolar, which respectively constitute 33.79% and 28.84% of total urban population of the district. Thus, while the pace of urbanization is increasing in other taluks of the district, the immediate focus of urban planning, security and infrastructure has to be on Kolar and Robertsonpet in the district.
Kolar has 6 towns, namely Srinivaspur, Kolar, Malur, Bangarpet, Robertsonpet, and Malur. As discussed in the chapter on governance, administration of these localities is the responsibility of the respective urban local body. Kolar and Robertsonpet are administered by a city municipality whereas the remaining urban localities are administered by town pancayaths, the lowest population units within urban local bodies. The details of these urban local bodies are provided in the table below.
Table 123. Urban Local Bodies in Kolar
Area Type of ULB Population (2011)
Council members
% of urban population to total taluk population
KolarCity Municipal Council
138462 35 28.84%
Robertsonpet (KGF)
City Municipal Council
162230 38 33.79%
SrinivaspurTown Municipal Council
26793 23 5.58%
MalurTown Municipal Council
40050 23 8.34%
BangarpetTown Municipal Council
44849 23 9.34%
MulbagalTown Municipal Council
57276 27 11.93%
Source: Census 2011, ULB Websites
Robertsonpet, being a mining town district headquarters has the highest proportion of urban population (33.79%), followed by Kolar, which is the headquarters of the district. Among the other taluk headquarters, Mulbagal had the highest population of 57,276.
11.1 Service Delivery Issues
Housing
Affordable housing is considered as a
key determinant in the growth of a city.
In the context of human development
of urban areas, quality of housing is a
crucial indicator. Massive expansion of
cities and urban areas sometimes create
vast swaths of slums that are sometimes
deprived of basic amenities like supply of
electricity, water, health and sanitation
services. Slum residents also face issues
to ownership and forceful eviction.
Thus housing related issues in urban
areas affect the growth opportunities
significantly. Further, migration to
urban areas for rural households enables
human development if the housing
facilities they are provided in the urban
areas allow them to effectively explore the
economic opportunities available in urban
areas. Thus, analysis of basic amenities
available in urban areas is crucial to
understand status of urban development.
The table below presents the status of
ownership of houses, the proportion of
the population of urban areas living in
slums and proportion of urban houses
not having electricity connections. It
shows that in all urban areas of Kolar,
more than 1/5ths of the households do not
own houses with the highest proportion
in Bangarpet and Mulbagal. More than
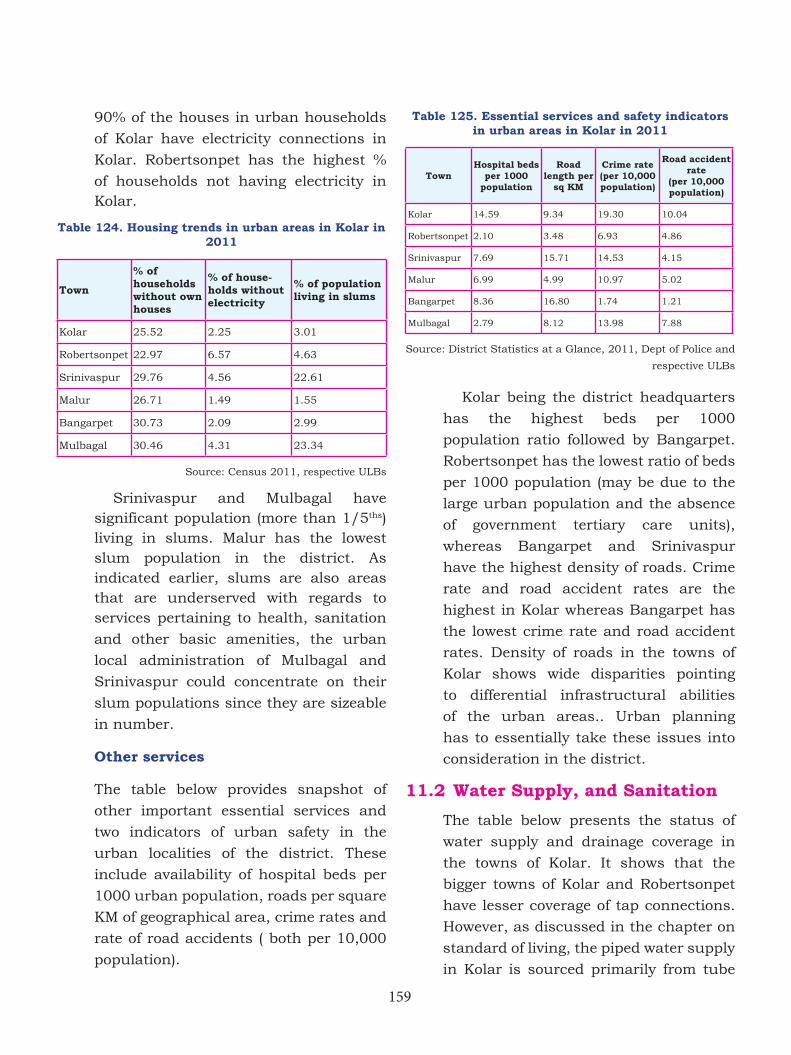
159
90% of the houses in urban households
of Kolar have electricity connections in
Kolar. Robertsonpet has the highest %
of households not having electricity in Kolar.
Table 124. Housing trends in urban areas in Kolar in 2011
Town
% of households without own houses
% of house-holds without electricity
% of population living in slums
Kolar 25.52 2.25 3.01
Robertsonpet 22.97 6.57 4.63
Srinivaspur 29.76 4.56 22.61
Malur 26.71 1.49 1.55
Bangarpet 30.73 2.09 2.99
Mulbagal 30.46 4.31 23.34
Source: Census 2011, respective ULBs
Srinivaspur and Mulbagal have significant population (more than 1/5ths) living in slums. Malur has the lowest slum population in the district. As indicated earlier, slums are also areas that are underserved with regards to services pertaining to health, sanitation
and other basic amenities, the urban
local administration of Mulbagal and
Srinivaspur could concentrate on their
slum populations since they are sizeable
in number.
Other services
The table below provides snapshot of
other important essential services and
two indicators of urban safety in the
urban localities of the district. These
include availability of hospital beds per
1000 urban population, roads per square
KM of geographical area, crime rates and
rate of road accidents ( both per 10,000
population).
Table 125. Essential services and safety indicators in urban areas in Kolar in 2011
TownHospital beds
per 1000 population
Road length per
sq KM
Crime rate (per 10,000 population)
Road accident rate
(per 10,000 population)
Kolar 14.59 9.34 19.30 10.04
Robertsonpet 2.10 3.48 6.93 4.86
Srinivaspur 7.69 15.71 14.53 4.15
Malur 6.99 4.99 10.97 5.02
Bangarpet 8.36 16.80 1.74 1.21
Mulbagal 2.79 8.12 13.98 7.88
Source: District Statistics at a Glance, 2011, Dept of Police and
respective ULBs
Kolar being the district headquarters
has the highest beds per 1000
population ratio followed by Bangarpet.
Robertsonpet has the lowest ratio of beds
per 1000 population (may be due to the
large urban population and the absence
of government tertiary care units),
whereas Bangarpet and Srinivaspur
have the highest density of roads. Crime
rate and road accident rates are the
highest in Kolar whereas Bangarpet has
the lowest crime rate and road accident
rates. Density of roads in the towns of
Kolar shows wide disparities pointing
to differential infrastructural abilities
of the urban areas.. Urban planning
has to essentially take these issues into
consideration in the district.
11.2 Water Supply, and Sanitation
The table below presents the status of
water supply and drainage coverage in
the towns of Kolar. It shows that the
bigger towns of Kolar and Robertsonpet
have lesser coverage of tap connections.
However, as discussed in the chapter on
standard of living, the piped water supply
in Kolar is sourced primarily from tube
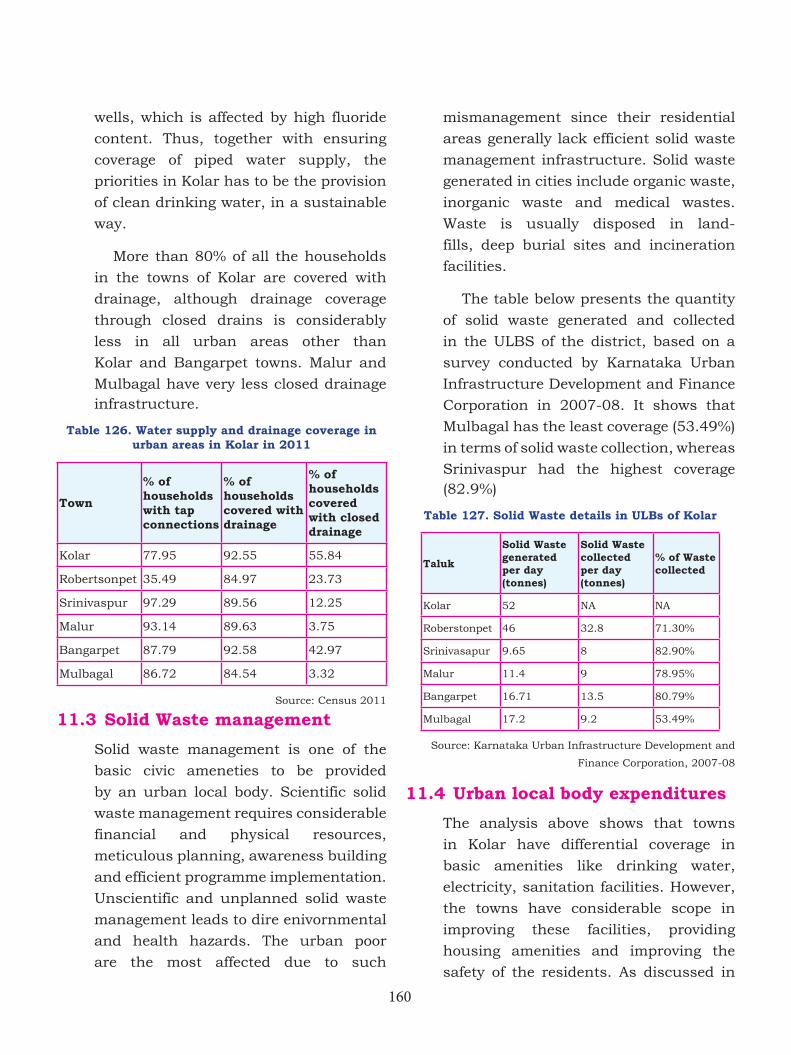
160
wells, which is affected by high fluoride
content. Thus, together with ensuring
coverage of piped water supply, the
priorities in Kolar has to be the provision
of clean drinking water, in a sustainable
way.
More than 80% of all the households
in the towns of Kolar are covered with
drainage, although drainage coverage
through closed drains is considerably
less in all urban areas other than
Kolar and Bangarpet towns. Malur and
Mulbagal have very less closed drainage infrastructure.
Table 126. Water supply and drainage coverage in urban areas in Kolar in 2011
Town
% of households with tap connections
% of households covered with drainage
% of households covered with closed drainage
Kolar 77.95 92.55 55.84
Robertsonpet 35.49 84.97 23.73
Srinivaspur 97.29 89.56 12.25
Malur 93.14 89.63 3.75
Bangarpet 87.79 92.58 42.97
Mulbagal 86.72 84.54 3.32
Source: Census 2011
11.3 Solid Waste management
Solid waste management is one of the
basic civic ameneties to be provided
by an urban local body. Scientific solid
waste management requires considerable
financial and physical resources,
meticulous planning, awareness building
and efficient programme implementation.
Unscientific and unplanned solid waste
management leads to dire enivornmental
and health hazards. The urban poor
are the most affected due to such
mismanagement since their residential
areas generally lack efficient solid waste
management infrastructure. Solid waste
generated in cities include organic waste,
inorganic waste and medical wastes.
Waste is usually disposed in land-
fills, deep burial sites and incineration
facilities.
The table below presents the quantity
of solid waste generated and collected
in the ULBS of the district, based on a
survey conducted by Karnataka Urban
Infrastructure Development and Finance
Corporation in 2007-08. It shows that
Mulbagal has the least coverage (53.49%)
in terms of solid waste collection, whereas
Srinivaspur had the highest coverage (82.9%)
Table 127. Solid Waste details in ULBs of Kolar
Taluk
Solid Waste generated per day (tonnes)
Solid Waste collected per day (tonnes)
% of Waste collected
Kolar 52 NA NA
Roberstonpet 46 32.8 71.30%
Srinivasapur 9.65 8 82.90%
Malur 11.4 9 78.95%
Bangarpet 16.71 13.5 80.79%
Mulbagal 17.2 9.2 53.49%
Source: Karnataka Urban Infrastructure Development and
Finance Corporation, 2007-08
11.4 Urban local body expenditures
The analysis above shows that towns
in Kolar have differential coverage in
basic amenities like drinking water,
electricity, sanitation facilities. However,
the towns have considerable scope in
improving these facilities, providing
housing amenities and improving the
safety of the residents. As discussed in
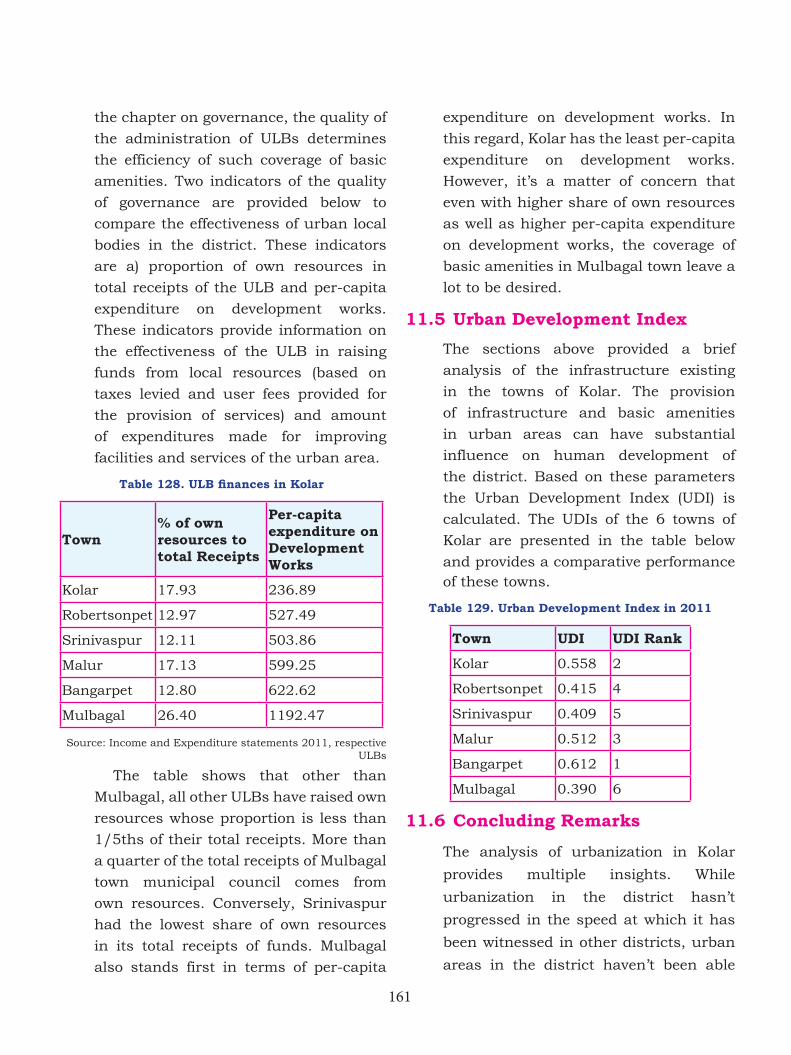
161
the chapter on governance, the quality of
the administration of ULBs determines
the efficiency of such coverage of basic
amenities. Two indicators of the quality
of governance are provided below to
compare the effectiveness of urban local
bodies in the district. These indicators
are a) proportion of own resources in
total receipts of the ULB and per-capita
expenditure on development works.
These indicators provide information on
the effectiveness of the ULB in raising
funds from local resources (based on
taxes levied and user fees provided for
the provision of services) and amount
of expenditures made for improving
facilities and services of the urban area.
Table128.ULBfinancesinKolar
Town% of own resources to total Receipts
Per-capita expenditure on Development Works
Kolar 17.93 236.89
Robertsonpet 12.97 527.49
Srinivaspur 12.11 503.86
Malur 17.13 599.25
Bangarpet 12.80 622.62
Mulbagal 26.40 1192.47
Source: Income and Expenditure statements 2011, respective ULBs
The table shows that other than
Mulbagal, all other ULBs have raised own
resources whose proportion is less than
1/5ths of their total receipts. More than
a quarter of the total receipts of Mulbagal
town municipal council comes from
own resources. Conversely, Srinivaspur
had the lowest share of own resources
in its total receipts of funds. Mulbagal
also stands first in terms of per-capita
expenditure on development works. In
this regard, Kolar has the least per-capita
expenditure on development works.
However, it’s a matter of concern that
even with higher share of own resources
as well as higher per-capita expenditure
on development works, the coverage of
basic amenities in Mulbagal town leave a
lot to be desired.
11.5 Urban Development Index
The sections above provided a brief
analysis of the infrastructure existing
in the towns of Kolar. The provision
of infrastructure and basic amenities
in urban areas can have substantial
influence on human development of
the district. Based on these parameters
the Urban Development Index (UDI) is
calculated. The UDIs of the 6 towns of
Kolar are presented in the table below
and provides a comparative performance of these towns.
Table 129. Urban Development Index in 2011
Town UDI UDI Rank
Kolar 0.558 2
Robertsonpet 0.415 4
Srinivaspur 0.409 5
Malur 0.512 3
Bangarpet 0.612 1
Mulbagal 0.390 6
11.6 Concluding Remarks
The analysis of urbanization in Kolar
provides multiple insights. While
urbanization in the district hasn’t
progressed in the speed at which it has
been witnessed in other districts, urban
areas in the district haven’t been able
162
to guarantee quality infrastructure and
amenities to its citizens. The problem of
water, which the entire district faces also
troubles the urban areas of the district.
Further, the size of two urban areas:
Robertsonpet and Kolar over-rides the
importance of urban infrastructure in
other towns of the district. Urbanization
efforts in the district cannot ignore the
disparities between different social
categories. These disparities are related
to the difference in the status of their
human development and their capacities
to utilize the growth in infrastructure and
access to public and private health and
education facilities, leading to differential
adoption and utilization of diversified
livelihood opportunities.
Thus, managing urbanization and
its preparatory processes (like land
acquisition, conversion of land etc) have
to envision the feasibility of creating
efficient housing, water supply, solid
and liquid waste management, and
their environmental and socio-political
ramifications. Further, governance
and stewardship of urban local bodies
become important if urban areas have
to sustainably grow and encourage
prosperity in the urban area as well as
the neighbouring rural areas.
* * * *
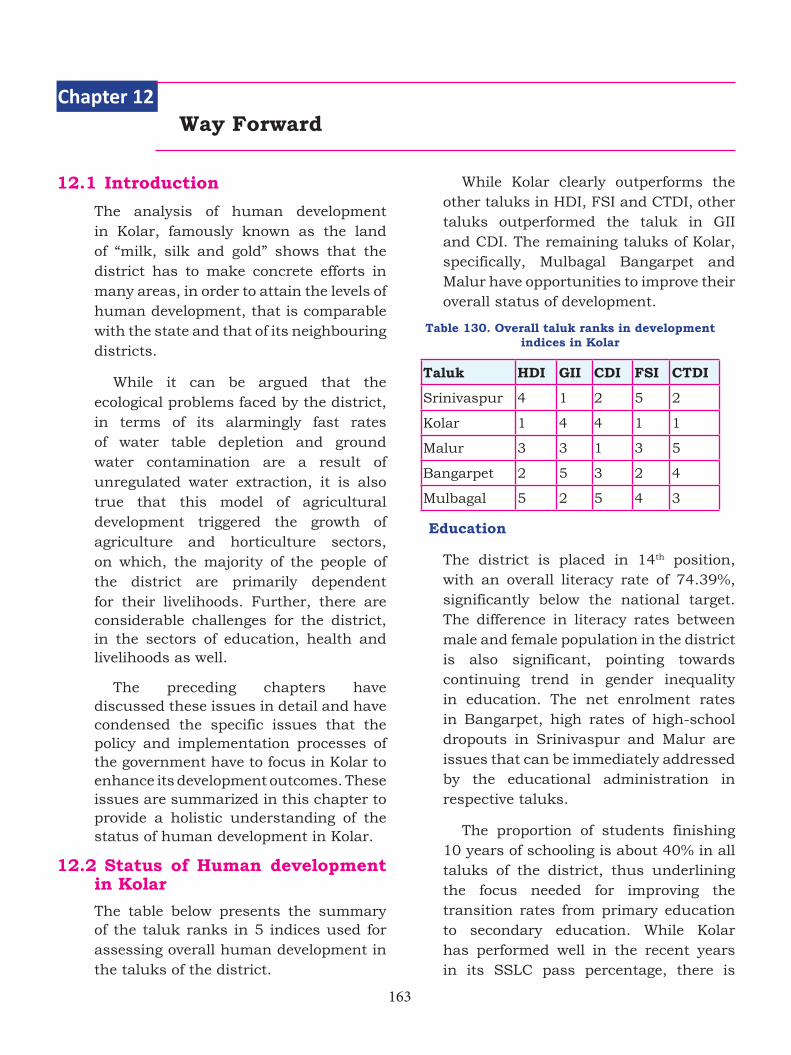
163
12.1 Introduction
The analysis of human development in Kolar, famously known as the land of “milk, silk and gold” shows that the district has to make concrete efforts in many areas, in order to attain the levels of human development, that is comparable with the state and that of its neighbouring districts.
While it can be argued that the ecological problems faced by the district, in terms of its alarmingly fast rates of water table depletion and ground water contamination are a result of unregulated water extraction, it is also true that this model of agricultural development triggered the growth of agriculture and horticulture sectors, on which, the majority of the people of the district are primarily dependent for their livelihoods. Further, there are considerable challenges for the district, in the sectors of education, health and livelihoods as well.
The preceding chapters have discussed these issues in detail and have condensed the specific issues that the policy and implementation processes of the government have to focus in Kolar to enhance its development outcomes. These issues are summarized in this chapter to provide a holistic understanding of the status of human development in Kolar.
12.2 Status of Human development in Kolar
The table below presents the summary of the taluk ranks in 5 indices used for assessing overall human development in the taluks of the district.
While Kolar clearly outperforms the other taluks in HDI, FSI and CTDI, other taluks outperformed the taluk in GII and CDI. The remaining taluks of Kolar, specifically, Mulbagal Bangarpet and Malur have opportunities to improve their overall status of development.
Table 130. Overall taluk ranks in development indices in Kolar
Taluk HDI GII CDI FSI CTDI
Srinivaspur 4 1 2 5 2
Kolar 1 4 4 1 1
Malur 3 3 1 3 5
Bangarpet 2 5 3 2 4
Mulbagal 5 2 5 4 3
Education
The district is placed in 14th position, with an overall literacy rate of 74.39%, significantly below the national target. The difference in literacy rates between male and female population in the district is also significant, pointing towards continuing trend in gender inequality in education. The net enrolment rates in Bangarpet, high rates of high-school dropouts in Srinivaspur and Malur are issues that can be immediately addressed by the educational administration in respective taluks.
The proportion of students finishing 10 years of schooling is about 40% in all taluks of the district, thus underlining the focus needed for improving the transition rates from primary education to secondary education. While Kolar has performed well in the recent years in its SSLC pass percentage, there is
Way ForwardChapter 12
164
wide scope to improve performance, not just in the performance of students in examinations, but also in learning outcomes, as analysed in the small area study conducted on SSLC performance in the district.
The overall analysis of education in Kolar showed that, within the district the focus on Malur needs to be high, in terms of improving its effectiveness in guaranteeing universal primary education.
Health
Due to sustained efforts of the department of health and family welfare, the outbreak of major life threatening diseases like Japanese Encephalitis have been controlled. However, many other challenges, like Fluorosis, widespread presence of anaemia and malnourishment among pregnant women and children continue to negatively affect the health of Kolar’s residents. These issues are uniquely difficult to address in Kolar, in the sense that, in both cases, multiple line departments from border districts of Karnataka, Andhra Pradesh and Tamil Nadu have to work hand in hand with each other as well as the local communities if sustainable solutions have to be found.
Kolar also faces the alarming signs of declining sex-ratios in all its taluks, the highest being in Mulbagal. Mulbagal also has the highest MMR crossing 200, which in the context of the targets set by NRHM, is unacceptable. Mulbagal with highest home delivery in the district also reported the highest infant and child deaths. Similarly, Malur taluk also has high rates of mortality. Thus, health related reforms in the district could begin by addressing these immediate issues in these taluks
Livelihood and standard of living
The economy of Kolar is principally agricultural in nature since more than 64% of the work force is involved in the sector (either as cultivators or as agricultural labourers). However, the actual growth of agriculture and allied activities was just 3.43%, with 3 out of the 5 taluks (Kolar, Malur and Bangarpet) registering negative growth rates. This shows that there is an urgent need to improve the productivity of agriculture in order to sustain equitable economic growth in the district. The average landholding per landholder in the entire district is just under one hectare, thus largely limiting the choices of agricultural diversification thus exposing the small farmers to the risk of crop/price failure and related uncertainties associated with that crop.
The presence of poverty prevents accumulation of assets and this is visible in the proportion of households in the districts not having the basic basket of assets (telephone, tv, phone/mobile two wheeler/four wheelers). This proportion is highest in Srinivaspur and Mulbagal and denotes the low standard of living in these taluks.
The district faces many challenges in making sure that its agriculture provides continued and increasing incomes to the people of the district. Industrial growth offers a complementary source of livelihood to the people of the district. However, industries within the district haven’t grown to the extent of providing real choices for the majority of the people in the district to use it as a serious source of livelihood. Expansion of industrial firms operating in the district, diversification of
165
industrial units and long term plans for inculcating skill training programmes for people in the district have to be prioritized if industrialization and related sectors have to address the challenges faced by the district’s agricultural sector.
The small area study on status of groundwater in the district provided a microscopic view of the issues involved in availability of water for drinking and irrigation purposes. While the precarious situation of groundwater is most likely to affect the sustenance of agriculture as a primary occupation in the district, its effect on the health of people as a result of groundwater contamination is also a matter of concern and is only likely to worsen if not addressed immediately. A detailed study of ground water contamination’s impact and possible interventions has to be conducted to understand the magnitude of the problem as well as possible of intervention strategies to mitigate the damages.
Immediate ways to lessen the dependence on groundwater for drinking purposes in the district is the widespread adoption of sustainable and useful rain water harvesting mechanisms. Efforts are needed to develop these rainwater harvesting systems that are suited to the needs of the district and provide both immediate and long term relief.. Access to individual household latrines is only 42% and hence, special attention is required in implementation of NGP/NBA programmes; with focus on Srinivaspur which has the least coverage.
The sensitivity of the ecological factors affecting agriculture in Kolar is a matter of concern since they have considerable social impacts as well. The intensive
use of natural resources for agriculture
in Kolar has to be regulated through a
holistic cultivation policy with inputs
from all concerned government agencies.
Vulnerable groups
The literacy rates of SCs and STs of Kolar
are comparatively lower than that of other
social categories in the district. Similarly,
the analysis of landholding patterns in
district showed that asset distribution, in
terms of land ownership is clearly skewed
against the SC population of the district,
with a disproportionately low percentage
of SC households owning land in the
district. Significantly low proportion of
SC and ST households were covered in
the provision of drinking water (within
their premises) and access to individual
household latrines.
While disaggregated data on status of
health and economic wellbeing of different
social categories weren’t available in the
district, it was clear from the analysis in
the chapter that SC and ST households
in communities have attained lower
human development status than that of
the other social categories in the district.
The small area study on Composite
Dalit Development Index conducted in
Avani GP of Kolar showed that caste
discrimination is still prevalent and may
in general be prevalent throughout the
district. Some practices of discrimination
were even accepted to be continuance of
tradition. However, the study also found
that comparatively better educated dalits
(like dalit ASHAs) are making in-roads in
attaining the socio-economic status that
enhances their acceptability and results
in lesser discrimination for them.
166
The small area study on discrepancies in registering PwD indicates that the neglect in information collection can be attributed to the neglect of the development of PwD itself. The case study analysed the cause of this discrepancy and found that the institutional structures for catering to the overall development of PwD was ineffective and unaccountable and suggested that the Department of Disability should take up a leadership role of guiding and integrating the efforts of various government agencies and conduct scientific surveys that adopt universal definitions and criterion to identify exact number of PwD in the district and plan specific development initiatives for them.
12.3 Way forward
The findings and analysis of the different dimensions of human development in Kolar have been presented in the preceding chapters. This chapter crystalized the main findings from these chapters and summarized the policy and implementation recommendations for the relevant authorities to consider. The future stratagies in the different sectors of human development are summarized below.
Education Sector
Improving the literacy rates and reducing gender disparities in the district has to be the top priority in the district since it lags considerably behind in this issue. Improving the effectiveness of education, specifically, in guaranteeing universal primary education, by improving retention rates and mainstreaming of out of school children, sustaining the high pass percentages in SSLC results,
converting them into better learning outcomes and translating the same to higher pass percentages in PUC could be the future targets in the education sector.
Malur, Srinivaspur and Bangarpet are the taluks to be prioritized in the educational sector of the district, needing special attention in primary education.
Health Sector
The over all health situation of Kolar needs much to be desired. An issue of concern ins the declining sex ratio in the district that needs immediate attention, in terms of behavioural change strategies and rapid awareness creation among the different communities of the district. The district’s status in maternal and child health, specifically in Mulbagal and Malur taluks needs to be prioritized. Further, the district’s unique predicament of ground water contamination and fluorosis. The impact of these issues on the larger health of the district population has to be studied in detail and suitable long term intervention strategies to mititgate the situation have to be designed. Further Kolar is affected by endemic diseases like Japanese enciphalities, which require the district to be ready with trained man-power to handle such the outbreak of such issues.
Livelihood and standard of living
The challenge for Kolar in the future is going to be sustaining its agricultural growth, on the face of emerging crisis of ground water depletion. In this aspect, all taluks of the district have to prioritize ground water saving strategies together with practical rain-water harvesting solutions.
167
Conclusion
In summary, the report identifies the
following crucial areas about which
the district political and bureaucratic
administration could focus their
immediate attention.
1. Attaining higher literacy rates and
reducing gender disparities in literacy
rates.
2. Improving the effectiveness in guaranteeing universal primary education, with special focus on Malur taluk.
3. Addressing the issue of declining sex-ratio and lagging indicators of maternal and child health, specifically in Mulbagal and Malur taluks.
4. A detailed study of ground water
contamination’s impact on health
and possible intervention strategies to
mitigate the damages.
5. Sustainable agricultural growth in all
taluks of the state, with immediate
interventions to minimize water
intensive agriculture, regulation of
groundwater extraction and adoption
rainwater harvesting mechanisms
6. Better provisioning of basic amenities
like drinking water (within their
premises) and access to individual
household latrines for SC and ST
households.
7. Conduct scientific surveys that adopt
universal definitions and criterion
to identify exact number of PwD
and integrate the efforts of various
government agencies aimed towards
development of PwD in the district.
* * * *
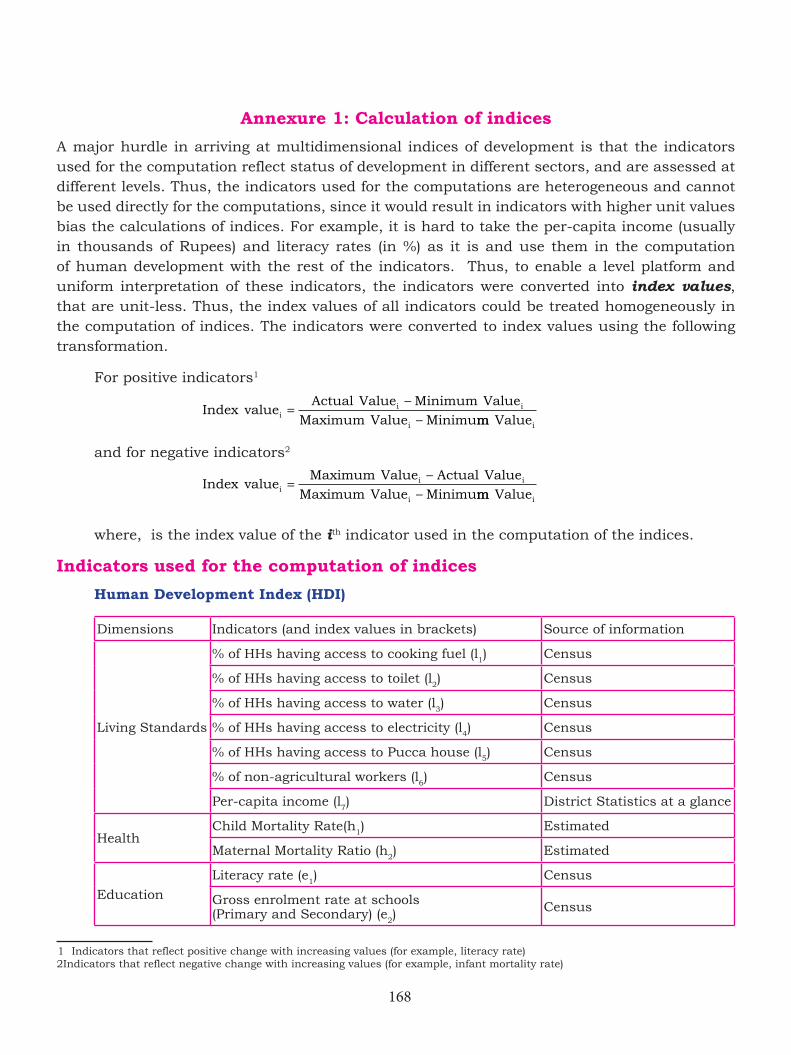
168
Annexure 1: Calculation of indices
A major hurdle in arriving at multidimensional indices of development is that the indicators used for the computation reflect status of development in different sectors, and are assessed at different levels. Thus, the indicators used for the computations are heterogeneous and cannot be used directly for the computations, since it would result in indicators with higher unit values bias the calculations of indices. For example, it is hard to take the per-capita income (usually in thousands of Rupees) and literacy rates (in %) as it is and use them in the computation of human development with the rest of the indicators. Thus, to enable a level platform and uniform interpretation of these indicators, the indicators were converted into index values, that are unit-less. Thus, the index values of all indicators could be treated homogeneously in the computation of indices. The indicators were converted to index values using the following transformation.
For positive indicators1
Index value
Actual Value Minimum Value
Maximum Value Minimuii i
i
=−− mm Valuei
and for negative indicators2
Index valueMaximum Value Actual Value
Maximum Value Minimuii i
i
=−
− mm Valuei
where, is the index value of the ith indicator used in the computation of the indices.
Indicators used for the computation of indices
Human Development Index (HDI)
Dimensions Indicators (and index values in brackets) Source of information
Living Standards
% of HHs having access to cooking fuel (l1) Census
% of HHs having access to toilet (l2) Census
% of HHs having access to water (l3) Census
% of HHs having access to electricity (l4) Census
% of HHs having access to Pucca house (l5) Census
% of non-agricultural workers (l6) Census
Per-capita income (l7) District Statistics at a glance
HealthChild Mortality Rate(h
1) Estimated
Maternal Mortality Ratio (h2) Estimated
Education
Literacy rate (e1) Census
Gross enrolment rate at schools (Primary and Secondary) (e
2) Census
1 Indicators that reflect positive change with increasing values (for example, literacy rate)2 Indicators that reflect negative change with increasing values (for example, infant mortality rate)
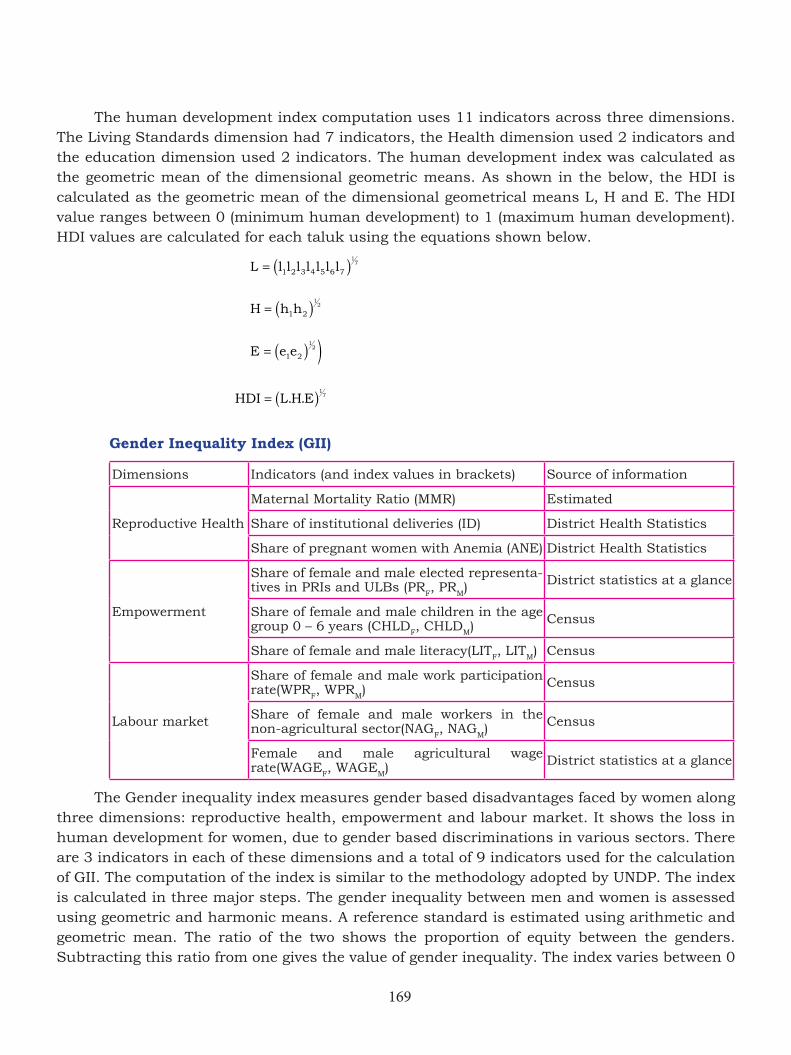
169
The human development index computation uses 11 indicators across three dimensions. The Living Standards dimension had 7 indicators, the Health dimension used 2 indicators and the education dimension used 2 indicators. The human development index was calculated as the geometric mean of the dimensional geometric means. As shown in the below, the HDI is calculated as the geometric mean of the dimensional geometrical means L, H and E. The HDI value ranges between 0 (minimum human development) to 1 (maximum human development). HDI values are calculated for each taluk using the equations shown below.
L l l l l l l= ( )l1 2 3 4 5 6 7
17
H h h= ( )1 2
12
E e e= ( ) )1 2
12
HDI L HE= ( ). .17
Gender Inequality Index (GII)
Dimensions Indicators (and index values in brackets) Source of information
Reproductive Health
Maternal Mortality Ratio (MMR) Estimated
Share of institutional deliveries (ID) District Health Statistics
Share of pregnant women with Anemia (ANE) District Health Statistics
Empowerment
Share of female and male elected representa-tives in PRIs and ULBs (PR
F, PR
M) District statistics at a glance
Share of female and male children in the age group 0 – 6 years (CHLD
F, CHLD
M) Census
Share of female and male literacy(LITF, LIT
M) Census
Labour market
Share of female and male work participation rate(WPR
F, WPR
M) Census
Share of female and male workers in the non-agricultural sector(NAG
F, NAG
M) Census
Female and male agricultural wage rate(WAGE
F, WAGE
M) District statistics at a glance
The Gender inequality index measures gender based disadvantages faced by women along three dimensions: reproductive health, empowerment and labour market. It shows the loss in human development for women, due to gender based discriminations in various sectors. There are 3 indicators in each of these dimensions and a total of 9 indicators used for the calculation of GII. The computation of the index is similar to the methodology adopted by UNDP. The index is calculated in three major steps. The gender inequality between men and women is assessed using geometric and harmonic means. A reference standard is estimated using arithmetic and geometric mean. The ratio of the two shows the proportion of equity between the genders. Subtracting this ratio from one gives the value of gender inequality. The index varies between 0
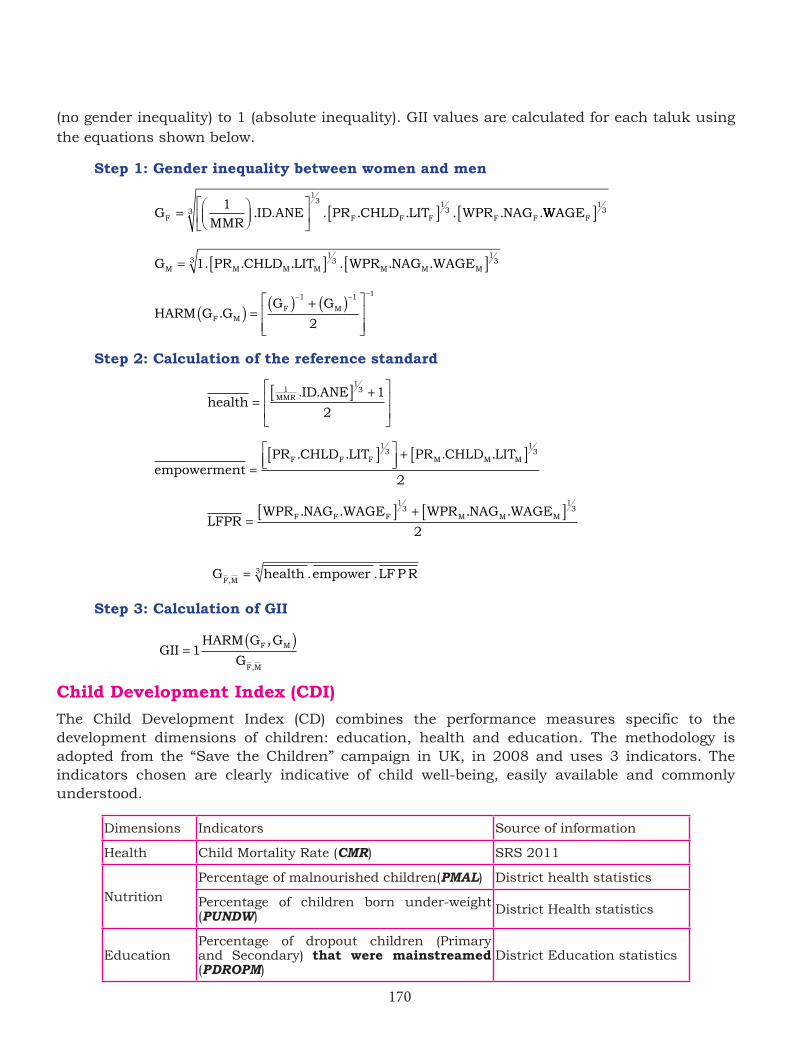
170
(no gender inequality) to 1 (absolute inequality). GII values are calculated for each taluk using the equations shown below.
Step 1: Gender inequality between women and men
GMMR
ID ANE PR CHLD LIT WPR NAGF F F F F F=
[ ]113 1
3. . . . . . . .WWAGEF[ ]133
G PR CHLD LIT WPR NAG WAGEM M M M M M M= [ ] [ ]1
13
133 . . . . . .
HARM G G
G GF M
F M.( ) = ( ) + ( )
− − −1 1 1
2
Step 2: Calculation of the reference standard
health
ID ANEMMR= [ ] +
113 1
2
. .
empowerment
PR CHLD LIT PR CHLD LITF F F M M M
=[ ]
+ [ ]. . . .
13
13
2
LFPR
WPR NAG WAGE WPR NAG WAGEF F F M M M= [ ] + [ ]. . . .13
13
2
G health empower LF RF M,
. . P= 3
Step 3: Calculation of GII
GII
HARM G G
GF M
F M
=( )
1,
,
Child Development Index (CDI)The Child Development Index (CD) combines the performance measures specific to the development dimensions of children: education, health and education. The methodology is adopted from the “Save the Children” campaign in UK, in 2008 and uses 3 indicators. The indicators chosen are clearly indicative of child well-being, easily available and commonly understood.
Dimensions Indicators Source of information
Health Child Mortality Rate (CMR) SRS 2011
Nutrition
Percentage of malnourished children(PMAL) District health statistics
Percentage of children born under-weight (PUNDW) District Health statistics
EducationPercentage of dropout children (Primary and Secondary) that were mainstreamed (PDROPM)
District Education statistics
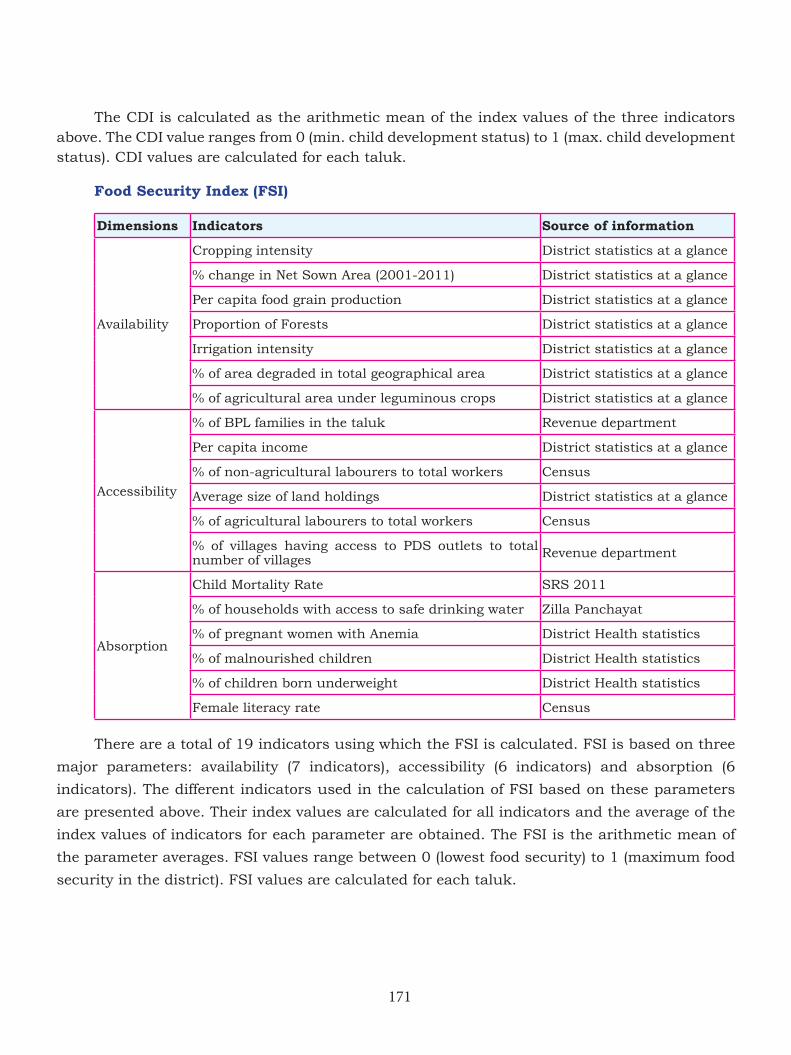
171
The CDI is calculated as the arithmetic mean of the index values of the three indicators above. The CDI value ranges from 0 (min. child development status) to 1 (max. child development status). CDI values are calculated for each taluk.
Food Security Index (FSI)
Dimensions Indicators Source of information
Availability
Cropping intensity District statistics at a glance
% change in Net Sown Area (2001-2011) District statistics at a glance
Per capita food grain production District statistics at a glance
Proportion of Forests District statistics at a glance
Irrigation intensity District statistics at a glance
% of area degraded in total geographical area District statistics at a glance
% of agricultural area under leguminous crops District statistics at a glance
Accessibility
% of BPL families in the taluk Revenue department
Per capita income District statistics at a glance
% of non-agricultural labourers to total workers Census
Average size of land holdings District statistics at a glance
% of agricultural labourers to total workers Census
% of villages having access to PDS outlets to total number of villages Revenue department
Absorption
Child Mortality Rate SRS 2011
% of households with access to safe drinking water Zilla Panchayat
% of pregnant women with Anemia District Health statistics
% of malnourished children District Health statistics
% of children born underweight District Health statistics
Female literacy rate Census
There are a total of 19 indicators using which the FSI is calculated. FSI is based on three
major parameters: availability (7 indicators), accessibility (6 indicators) and absorption (6
indicators). The different indicators used in the calculation of FSI based on these parameters
are presented above. Their index values are calculated for all indicators and the average of the
index values of indicators for each parameter are obtained. The FSI is the arithmetic mean of
the parameter averages. FSI values range between 0 (lowest food security) to 1 (maximum food
security in the district). FSI values are calculated for each taluk.
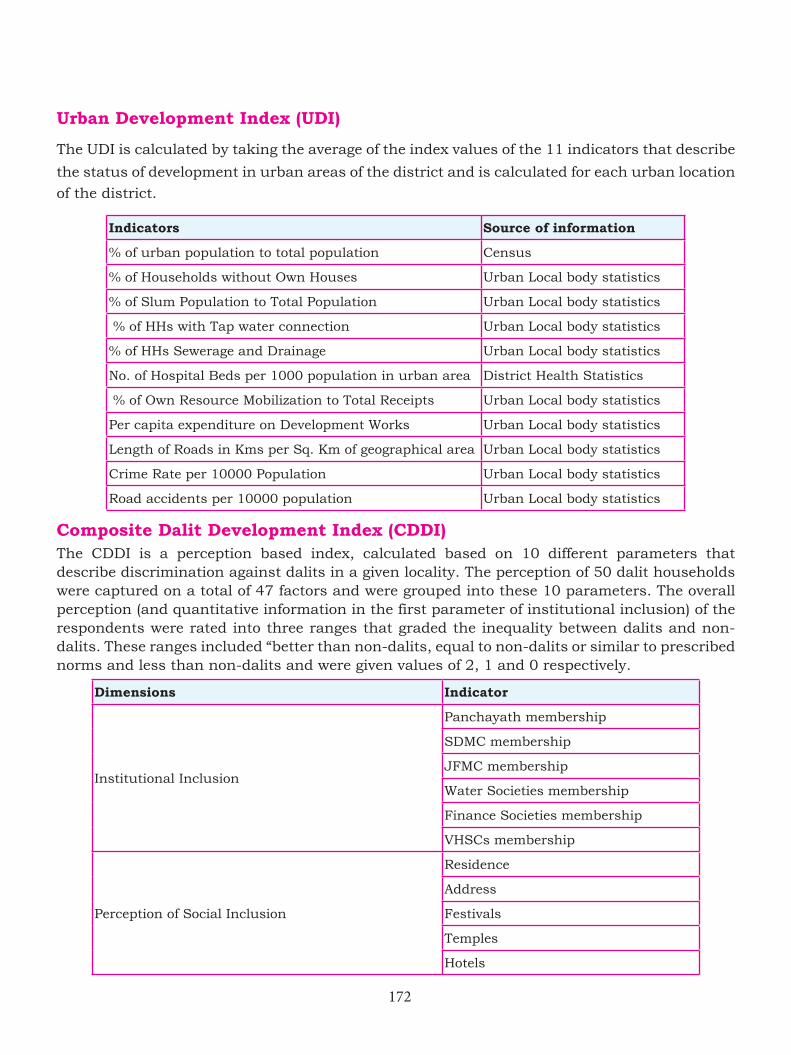
172
Urban Development Index (UDI)
The UDI is calculated by taking the average of the index values of the 11 indicators that describe
the status of development in urban areas of the district and is calculated for each urban location
of the district.
Indicators Source of information
% of urban population to total population Census
% of Households without Own Houses Urban Local body statistics
% of Slum Population to Total Population Urban Local body statistics
% of HHs with Tap water connection Urban Local body statistics
% of HHs Sewerage and Drainage Urban Local body statistics
No. of Hospital Beds per 1000 population in urban area District Health Statistics
% of Own Resource Mobilization to Total Receipts Urban Local body statistics
Per capita expenditure on Development Works Urban Local body statistics
Length of Roads in Kms per Sq. Km of geographical area Urban Local body statistics
Crime Rate per 10000 Population Urban Local body statistics
Road accidents per 10000 population Urban Local body statistics
Composite Dalit Development Index (CDDI)The CDDI is a perception based index, calculated based on 10 different parameters that describe discrimination against dalits in a given locality. The perception of 50 dalit households were captured on a total of 47 factors and were grouped into these 10 parameters. The overall perception (and quantitative information in the first parameter of institutional inclusion) of the respondents were rated into three ranges that graded the inequality between dalits and non-dalits. These ranges included “better than non-dalits, equal to non-dalits or similar to prescribed norms and less than non-dalits and were given values of 2, 1 and 0 respectively.
Dimensions Indicator
Institutional Inclusion
Panchayath membership
SDMC membership
JFMC membership
Water Societies membership
Finance Societies membership
VHSCs membership
Perception of Social Inclusion
Residence
Address
Festivals
Temples
Hotels
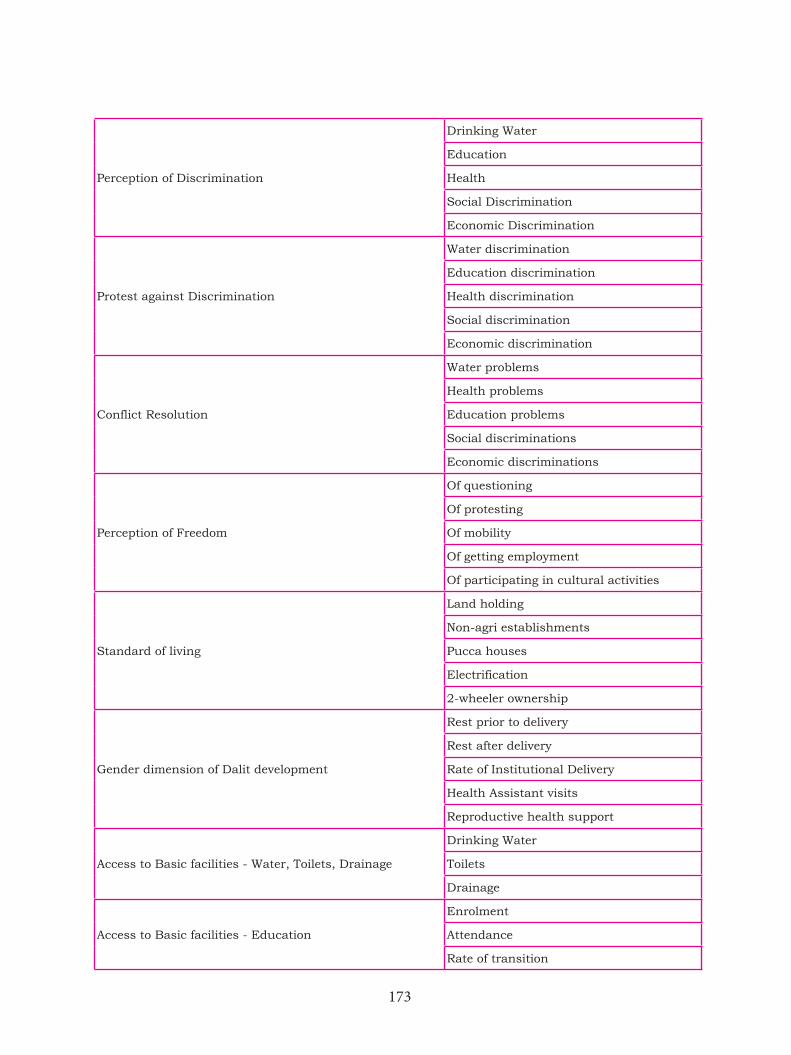
173
Perception of Discrimination
Drinking Water
Education
Health
Social Discrimination
Economic Discrimination
Protest against Discrimination
Water discrimination
Education discrimination
Health discrimination
Social discrimination
Economic discrimination
Conflict Resolution
Water problems
Health problems
Education problems
Social discriminations
Economic discriminations
Perception of Freedom
Of questioning
Of protesting
Of mobility
Of getting employment
Of participating in cultural activities
Standard of living
Land holding
Non-agri establishments
Pucca houses
Electrification
2-wheeler ownership
Gender dimension of Dalit development
Rest prior to delivery
Rest after delivery
Rate of Institutional Delivery
Health Assistant visits
Reproductive health support
Access to Basic facilities - Water, Toilets, Drainage
Drinking Water
Toilets
Drainage
Access to Basic facilities - Education
Enrolment
Attendance
Rate of transition
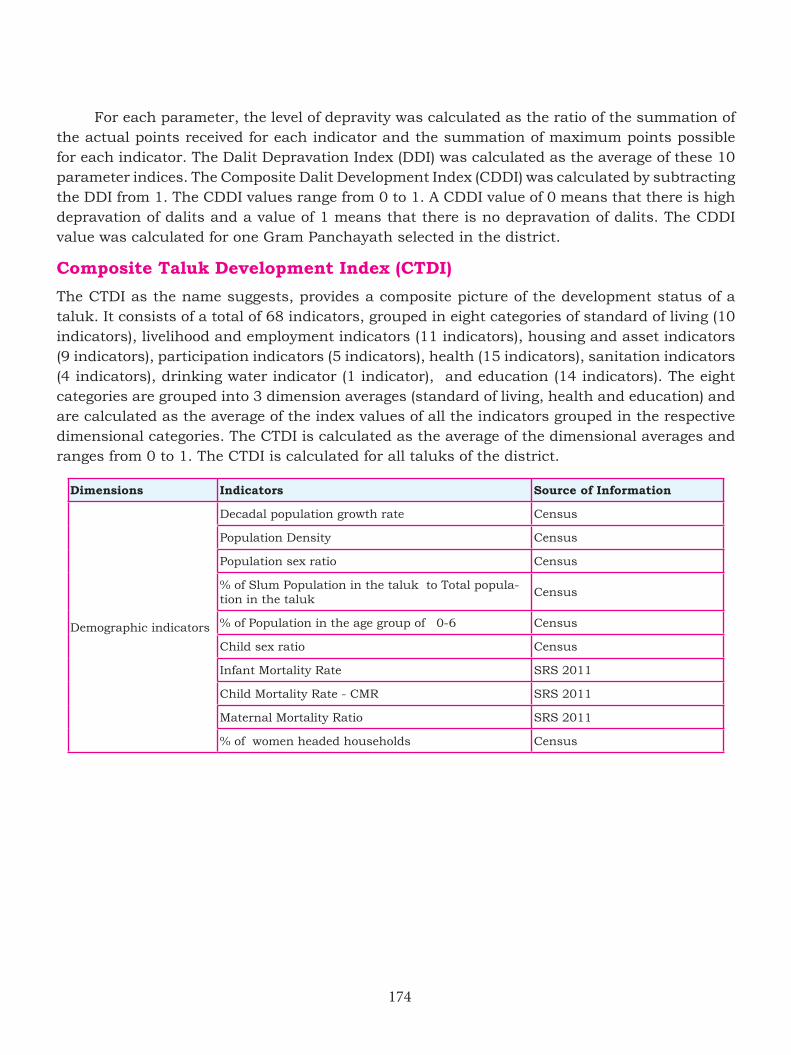
174
For each parameter, the level of depravity was calculated as the ratio of the summation of the actual points received for each indicator and the summation of maximum points possible for each indicator. The Dalit Depravation Index (DDI) was calculated as the average of these 10 parameter indices. The Composite Dalit Development Index (CDDI) was calculated by subtracting the DDI from 1. The CDDI values range from 0 to 1. A CDDI value of 0 means that there is high depravation of dalits and a value of 1 means that there is no depravation of dalits. The CDDI value was calculated for one Gram Panchayath selected in the district.
Composite Taluk Development Index (CTDI)
The CTDI as the name suggests, provides a composite picture of the development status of a taluk. It consists of a total of 68 indicators, grouped in eight categories of standard of living (10 indicators), livelihood and employment indicators (11 indicators), housing and asset indicators (9 indicators), participation indicators (5 indicators), health (15 indicators), sanitation indicators (4 indicators), drinking water indicator (1 indicator), and education (14 indicators). The eight categories are grouped into 3 dimension averages (standard of living, health and education) and are calculated as the average of the index values of all the indicators grouped in the respective dimensional categories. The CTDI is calculated as the average of the dimensional averages and ranges from 0 to 1. The CTDI is calculated for all taluks of the district.
Dimensions Indicators Source of Information
Demographic indicators
Decadal population growth rate Census
Population Density Census
Population sex ratio Census
% of Slum Population in the taluk to Total popula-tion in the taluk
Census
% of Population in the age group of 0-6 Census
Child sex ratio Census
Infant Mortality Rate SRS 2011
Child Mortality Rate - CMR SRS 2011
Maternal Mortality Ratio SRS 2011
% of women headed households Census
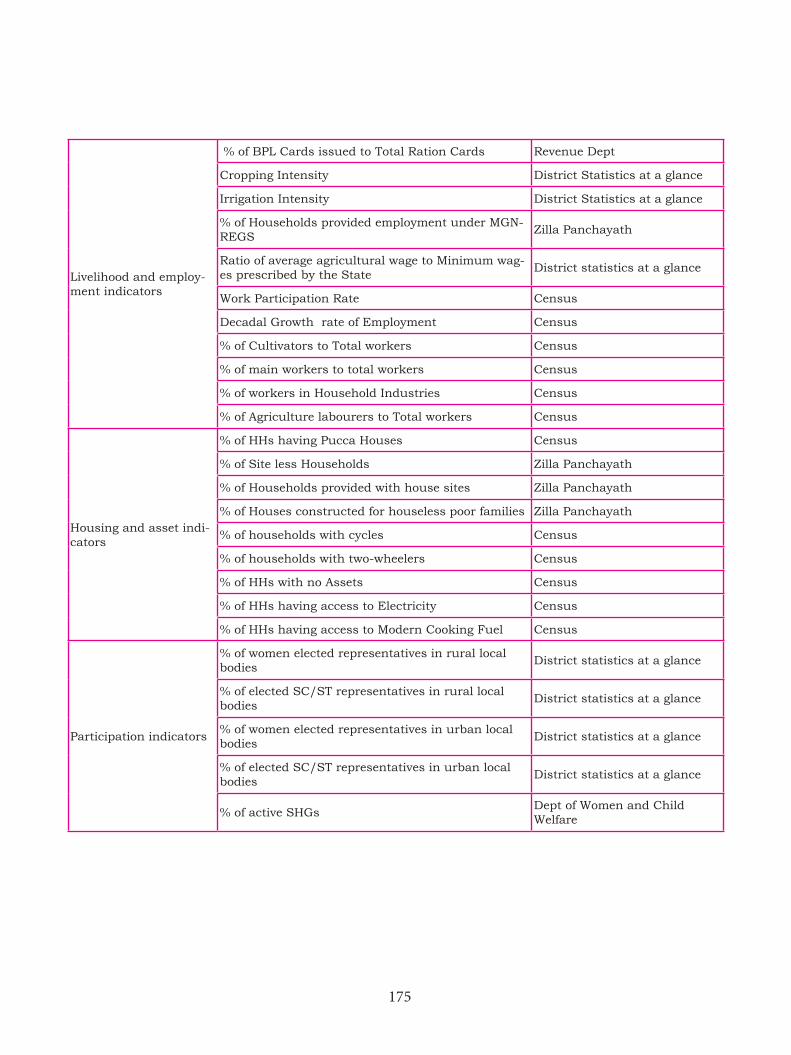
175
Livelihood and employ-ment indicators
% of BPL Cards issued to Total Ration Cards Revenue Dept
Cropping Intensity District Statistics at a glance
Irrigation Intensity District Statistics at a glance
% of Households provided employment under MGN-REGS
Zilla Panchayath
Ratio of average agricultural wage to Minimum wag-es prescribed by the State
District statistics at a glance
Work Participation Rate Census
Decadal Growth rate of Employment Census
% of Cultivators to Total workers Census
% of main workers to total workers Census
% of workers in Household Industries Census
% of Agriculture labourers to Total workers Census
Housing and asset indi-cators
% of HHs having Pucca Houses Census
% of Site less Households Zilla Panchayath
% of Households provided with house sites Zilla Panchayath
% of Houses constructed for houseless poor families Zilla Panchayath
% of households with cycles Census
% of households with two-wheelers Census
% of HHs with no Assets Census
% of HHs having access to Electricity Census
% of HHs having access to Modern Cooking Fuel Census
Participation indicators
% of women elected representatives in rural local bodies
District statistics at a glance
% of elected SC/ST representatives in rural local bodies
District statistics at a glance
% of women elected representatives in urban local bodies
District statistics at a glance
% of elected SC/ST representatives in urban local bodies
District statistics at a glance
% of active SHGs Dept of Women and Child Welfare
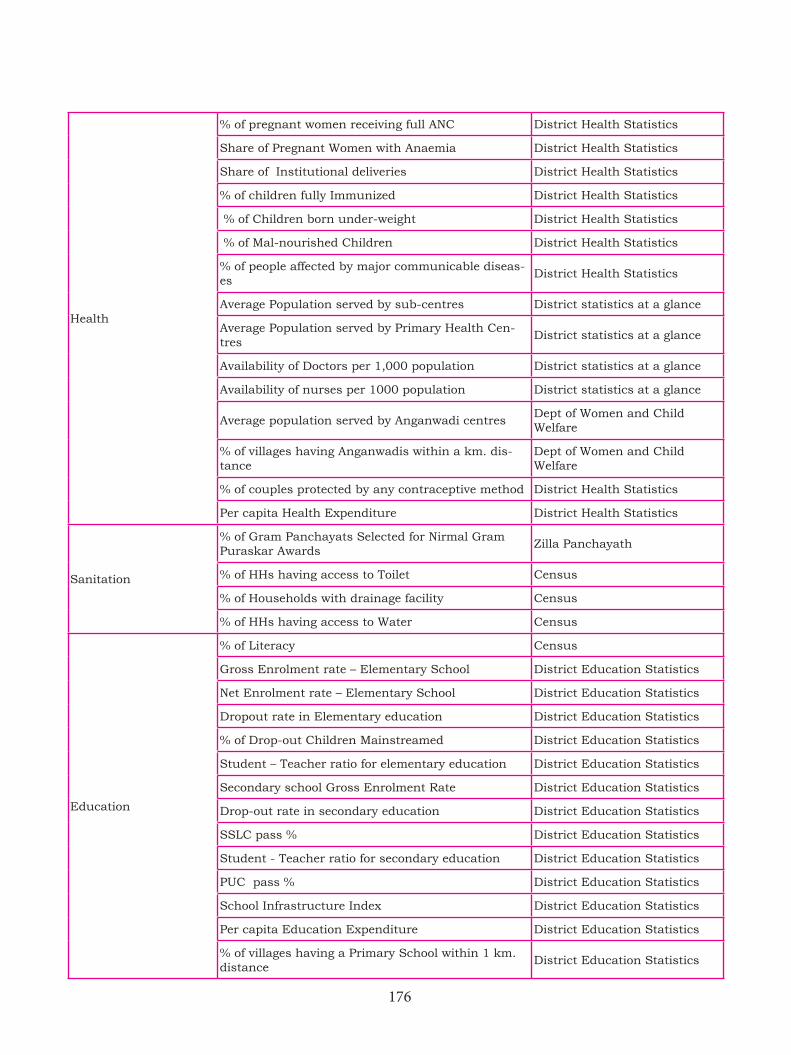
176
Health
% of pregnant women receiving full ANC District Health Statistics
Share of Pregnant Women with Anaemia District Health Statistics
Share of Institutional deliveries District Health Statistics
% of children fully Immunized District Health Statistics
% of Children born under-weight District Health Statistics
% of Mal-nourished Children District Health Statistics
% of people affected by major communicable diseas-es
District Health Statistics
Average Population served by sub-centres District statistics at a glance
Average Population served by Primary Health Cen-tres
District statistics at a glance
Availability of Doctors per 1,000 population District statistics at a glance
Availability of nurses per 1000 population District statistics at a glance
Average population served by Anganwadi centresDept of Women and Child Welfare
% of villages having Anganwadis within a km. dis-tance
Dept of Women and Child Welfare
% of couples protected by any contraceptive method District Health Statistics
Per capita Health Expenditure District Health Statistics
Sanitation
% of Gram Panchayats Selected for Nirmal Gram Puraskar Awards
Zilla Panchayath
% of HHs having access to Toilet Census
% of Households with drainage facility Census
% of HHs having access to Water Census
Education
% of Literacy Census
Gross Enrolment rate – Elementary School District Education Statistics
Net Enrolment rate – Elementary School District Education Statistics
Dropout rate in Elementary education District Education Statistics
% of Drop-out Children Mainstreamed District Education Statistics
Student – Teacher ratio for elementary education District Education Statistics
Secondary school Gross Enrolment Rate District Education Statistics
Drop-out rate in secondary education District Education Statistics
SSLC pass % District Education Statistics
Student - Teacher ratio for secondary education District Education Statistics
PUC pass % District Education Statistics
School Infrastructure Index District Education Statistics
Per capita Education Expenditure District Education Statistics
% of villages having a Primary School within 1 km. distance
District Education Statistics
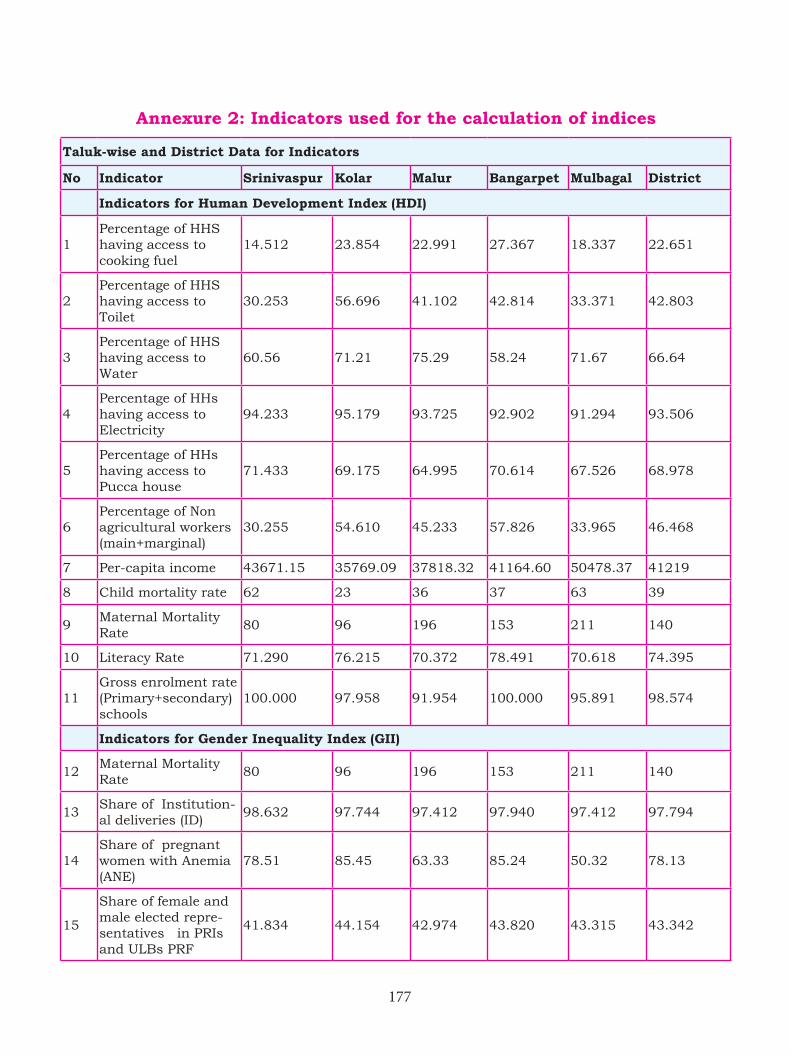
177
Annexure 2: Indicators used for the calculation of indices
Taluk-wise and District Data for Indicators
No Indicator Srinivaspur Kolar Malur Bangarpet Mulbagal District
Indicators for Human Development Index (HDI)
1Percentage of HHS having access to cooking fuel
14.512 23.854 22.991 27.367 18.337 22.651
2Percentage of HHS having access to Toilet
30.253 56.696 41.102 42.814 33.371 42.803
3Percentage of HHS having access to Water
60.56 71.21 75.29 58.24 71.67 66.64
4Percentage of HHs having access to Electricity
94.233 95.179 93.725 92.902 91.294 93.506
5Percentage of HHs having access to Pucca house
71.433 69.175 64.995 70.614 67.526 68.978
6Percentage of Non agricultural workers (main+marginal)
30.255 54.610 45.233 57.826 33.965 46.468
7 Per-capita income 43671.15 35769.09 37818.32 41164.60 50478.37 41219
8 Child mortality rate 62 23 36 37 63 39
9Maternal Mortality Rate
80 96 196 153 211 140
10 Literacy Rate 71.290 76.215 70.372 78.491 70.618 74.395
11Gross enrolment rate (Primary+secondary) schools
100.000 97.958 91.954 100.000 95.891 98.574
Indicators for Gender Inequality Index (GII)
12Maternal Mortality Rate
80 96 196 153 211 140
13Share of Institution-al deliveries (ID)
98.632 97.744 97.412 97.940 97.412 97.794
14Share of pregnant women with Anemia (ANE)
78.51 85.45 63.33 85.24 50.32 78.13
15
Share of female and male elected repre-sentatives in PRIs and ULBs PRF
41.834 44.154 42.974 43.820 43.315 43.342
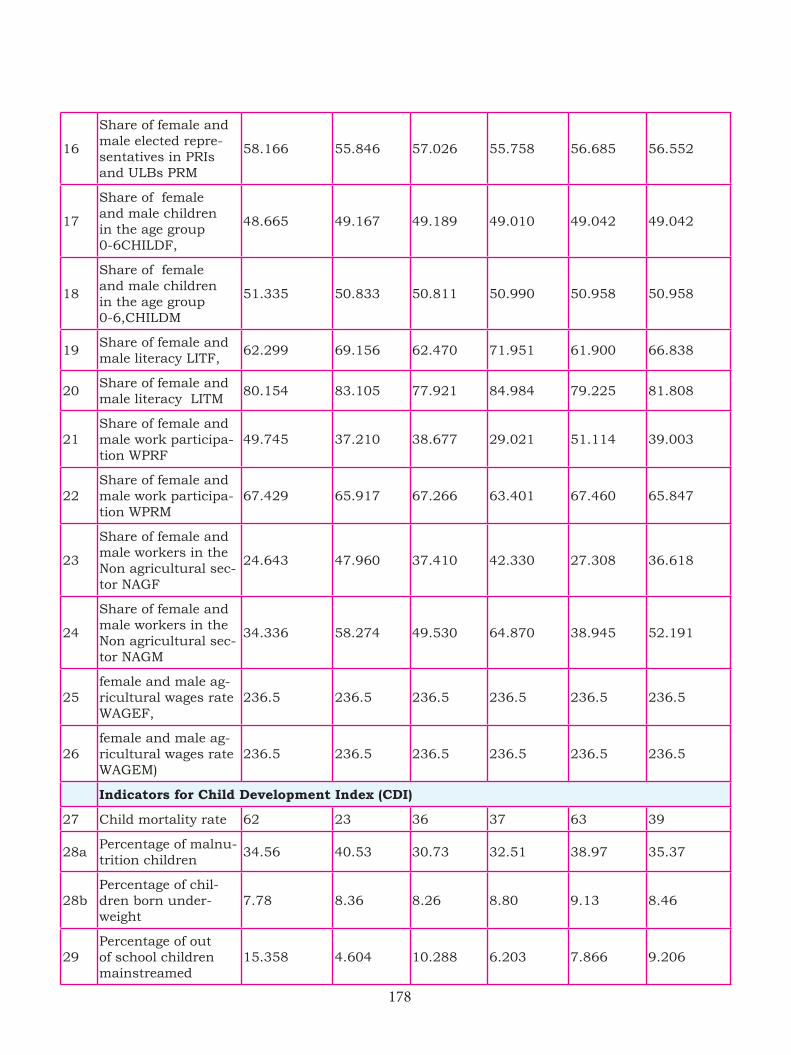
178
16
Share of female and male elected repre-sentatives in PRIs and ULBs PRM
58.166 55.846 57.026 55.758 56.685 56.552
17
Share of female and male children in the age group 0-6CHILDF,
48.665 49.167 49.189 49.010 49.042 49.042
18
Share of female and male children in the age group 0-6,CHILDM
51.335 50.833 50.811 50.990 50.958 50.958
19Share of female and male literacy LITF,
62.299 69.156 62.470 71.951 61.900 66.838
20Share of female and male literacy LITM
80.154 83.105 77.921 84.984 79.225 81.808
21Share of female and male work participa-tion WPRF
49.745 37.210 38.677 29.021 51.114 39.003
22Share of female and male work participa-tion WPRM
67.429 65.917 67.266 63.401 67.460 65.847
23
Share of female and male workers in the Non agricultural sec-tor NAGF
24.643 47.960 37.410 42.330 27.308 36.618
24
Share of female and male workers in the Non agricultural sec-tor NAGM
34.336 58.274 49.530 64.870 38.945 52.191
25female and male ag-ricultural wages rate WAGEF,
236.5 236.5 236.5 236.5 236.5 236.5
26female and male ag-ricultural wages rate WAGEM)
236.5 236.5 236.5 236.5 236.5 236.5
Indicators for Child Development Index (CDI)
27 Child mortality rate 62 23 36 37 63 39
28aPercentage of malnu-trition children
34.56 40.53 30.73 32.51 38.97 35.37
28bPercentage of chil-dren born under-weight
7.78 8.36 8.26 8.80 9.13 8.46
29Percentage of out of school children mainstreamed
15.358 4.604 10.288 6.203 7.866 9.206
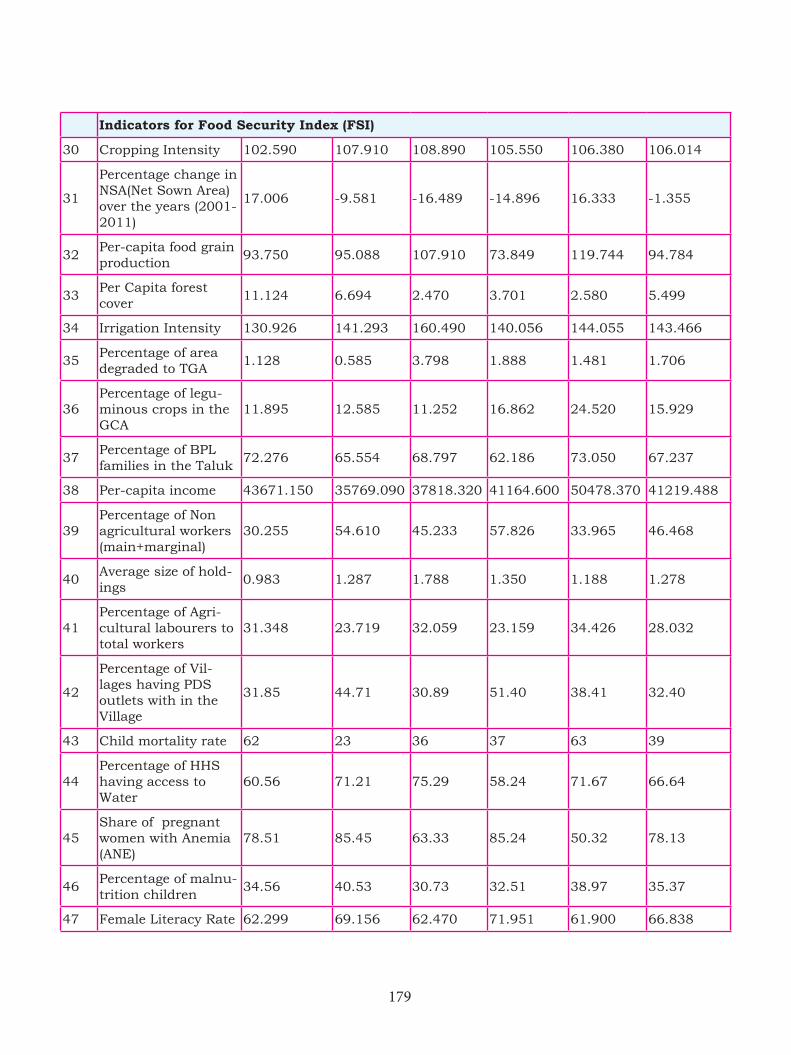
179
Indicators for Food Security Index (FSI)
30 Cropping Intensity 102.590 107.910 108.890 105.550 106.380 106.014
31
Percentage change in NSA(Net Sown Area) over the years (2001-2011)
17.006 -9.581 -16.489 -14.896 16.333 -1.355
32Per-capita food grain production
93.750 95.088 107.910 73.849 119.744 94.784
33Per Capita forest cover
11.124 6.694 2.470 3.701 2.580 5.499
34 Irrigation Intensity 130.926 141.293 160.490 140.056 144.055 143.466
35Percentage of area degraded to TGA
1.128 0.585 3.798 1.888 1.481 1.706
36Percentage of legu-minous crops in the GCA
11.895 12.585 11.252 16.862 24.520 15.929
37Percentage of BPL families in the Taluk
72.276 65.554 68.797 62.186 73.050 67.237
38 Per-capita income 43671.150 35769.090 37818.320 41164.600 50478.370 41219.488
39Percentage of Non agricultural workers (main+marginal)
30.255 54.610 45.233 57.826 33.965 46.468
40Average size of hold-ings
0.983 1.287 1.788 1.350 1.188 1.278
41Percentage of Agri-cultural labourers to total workers
31.348 23.719 32.059 23.159 34.426 28.032
42
Percentage of Vil-lages having PDS outlets with in the Village
31.85 44.71 30.89 51.40 38.41 32.40
43 Child mortality rate 62 23 36 37 63 39
44Percentage of HHS having access to Water
60.56 71.21 75.29 58.24 71.67 66.64
45Share of pregnant women with Anemia (ANE)
78.51 85.45 63.33 85.24 50.32 78.13
46Percentage of malnu-trition children
34.56 40.53 30.73 32.51 38.97 35.37
47 Female Literacy Rate 62.299 69.156 62.470 71.951 61.900 66.838
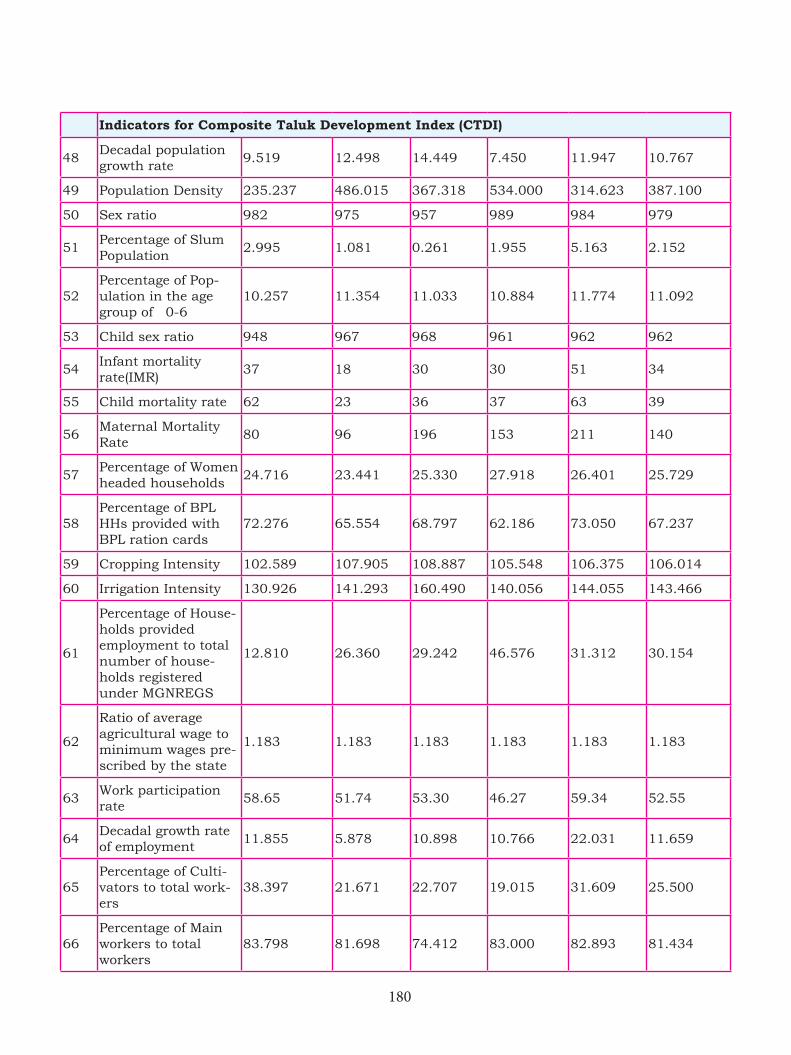
180
Indicators for Composite Taluk Development Index (CTDI)
48Decadal population growth rate
9.519 12.498 14.449 7.450 11.947 10.767
49 Population Density 235.237 486.015 367.318 534.000 314.623 387.100
50 Sex ratio 982 975 957 989 984 979
51Percentage of Slum Population
2.995 1.081 0.261 1.955 5.163 2.152
52Percentage of Pop-ulation in the age group of 0-6
10.257 11.354 11.033 10.884 11.774 11.092
53 Child sex ratio 948 967 968 961 962 962
54Infant mortality rate(IMR)
37 18 30 30 51 34
55 Child mortality rate 62 23 36 37 63 39
56Maternal Mortality Rate
80 96 196 153 211 140
57Percentage of Women headed households
24.716 23.441 25.330 27.918 26.401 25.729
58Percentage of BPL HHs provided with BPL ration cards
72.276 65.554 68.797 62.186 73.050 67.237
59 Cropping Intensity 102.589 107.905 108.887 105.548 106.375 106.014
60 Irrigation Intensity 130.926 141.293 160.490 140.056 144.055 143.466
61
Percentage of House-holds provided employment to total number of house-holds registered under MGNREGS
12.810 26.360 29.242 46.576 31.312 30.154
62
Ratio of average agricultural wage to minimum wages pre-scribed by the state
1.183 1.183 1.183 1.183 1.183 1.183
63Work participation rate
58.65 51.74 53.30 46.27 59.34 52.55
64Decadal growth rate of employment
11.855 5.878 10.898 10.766 22.031 11.659
65Percentage of Culti-vators to total work-ers
38.397 21.671 22.707 19.015 31.609 25.500
66Percentage of Main workers to total workers
83.798 81.698 74.412 83.000 82.893 81.434
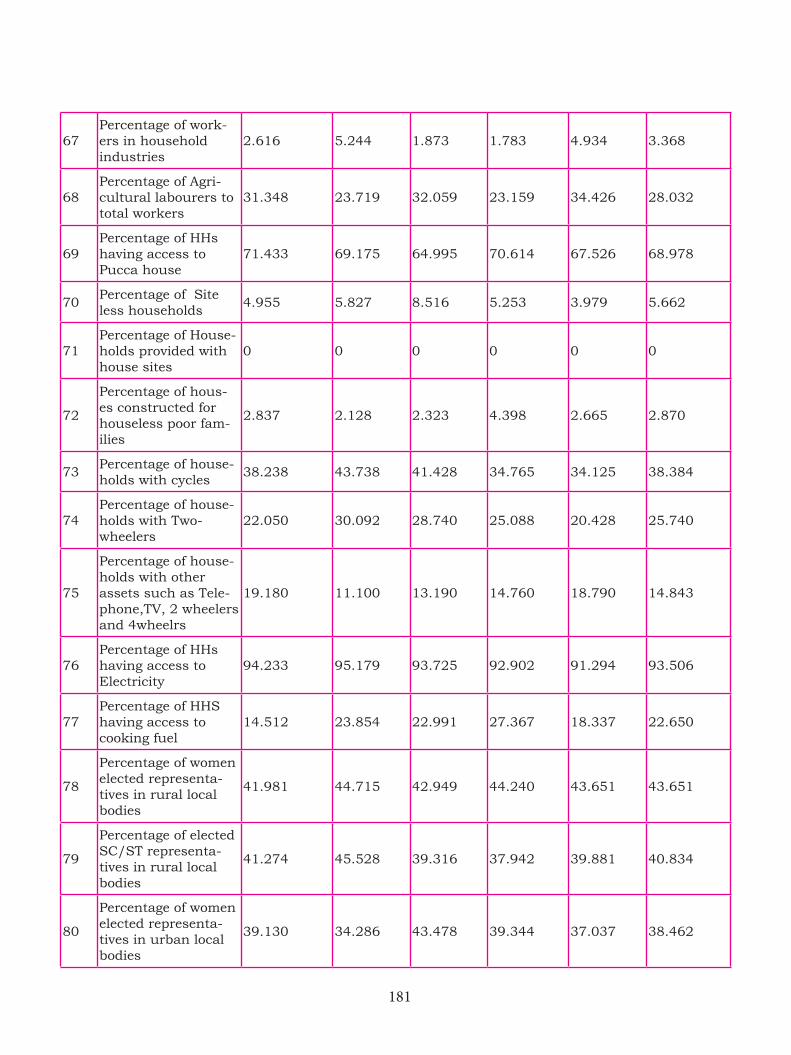
181
67Percentage of work-ers in household industries
2.616 5.244 1.873 1.783 4.934 3.368
68Percentage of Agri-cultural labourers to total workers
31.348 23.719 32.059 23.159 34.426 28.032
69Percentage of HHs having access to Pucca house
71.433 69.175 64.995 70.614 67.526 68.978
70Percentage of Site less households
4.955 5.827 8.516 5.253 3.979 5.662
71Percentage of House-holds provided with house sites
0 0 0 0 0 0
72
Percentage of hous-es constructed for houseless poor fam-ilies
2.837 2.128 2.323 4.398 2.665 2.870
73Percentage of house-holds with cycles
38.238 43.738 41.428 34.765 34.125 38.384
74Percentage of house-holds with Two- wheelers
22.050 30.092 28.740 25.088 20.428 25.740
75
Percentage of house-holds with other assets such as Tele-phone,TV, 2 wheelers and 4wheelrs
19.180 11.100 13.190 14.760 18.790 14.843
76Percentage of HHs having access to Electricity
94.233 95.179 93.725 92.902 91.294 93.506
77Percentage of HHS having access to cooking fuel
14.512 23.854 22.991 27.367 18.337 22.650
78
Percentage of women elected representa-tives in rural local bodies
41.981 44.715 42.949 44.240 43.651 43.651
79
Percentage of elected SC/ST representa-tives in rural local bodies
41.274 45.528 39.316 37.942 39.881 40.834
80
Percentage of women elected representa-tives in urban local bodies
39.130 34.286 43.478 39.344 37.037 38.462
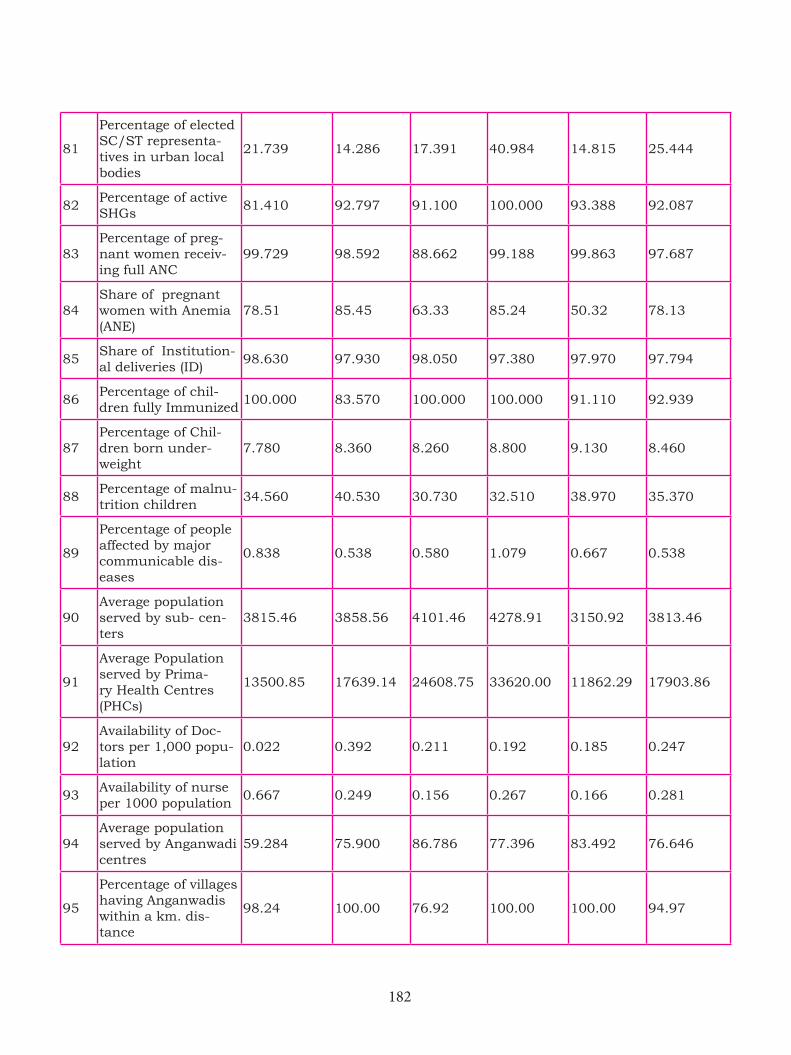
182
81
Percentage of elected SC/ST representa-tives in urban local bodies
21.739 14.286 17.391 40.984 14.815 25.444
82Percentage of active SHGs
81.410 92.797 91.100 100.000 93.388 92.087
83Percentage of preg-nant women receiv-ing full ANC
99.729 98.592 88.662 99.188 99.863 97.687
84Share of pregnant women with Anemia (ANE)
78.51 85.45 63.33 85.24 50.32 78.13
85Share of Institution-al deliveries (ID)
98.630 97.930 98.050 97.380 97.970 97.794
86Percentage of chil-dren fully Immunized
100.000 83.570 100.000 100.000 91.110 92.939
87Percentage of Chil-dren born under-weight
7.780 8.360 8.260 8.800 9.130 8.460
88Percentage of malnu-trition children
34.560 40.530 30.730 32.510 38.970 35.370
89
Percentage of people affected by major communicable dis-eases
0.838 0.538 0.580 1.079 0.667 0.538
90Average population served by sub- cen-ters
3815.46 3858.56 4101.46 4278.91 3150.92 3813.46
91
Average Population served by Prima-ry Health Centres (PHCs)
13500.85 17639.14 24608.75 33620.00 11862.29 17903.86
92Availability of Doc-tors per 1,000 popu-lation
0.022 0.392 0.211 0.192 0.185 0.247
93Availability of nurse per 1000 population
0.667 0.249 0.156 0.267 0.166 0.281
94Average population served by Anganwadi centres
59.284 75.900 86.786 77.396 83.492 76.646
95
Percentage of villages having Anganwadis within a km. dis-tance
98.24 100.00 76.92 100.00 100.00 94.97
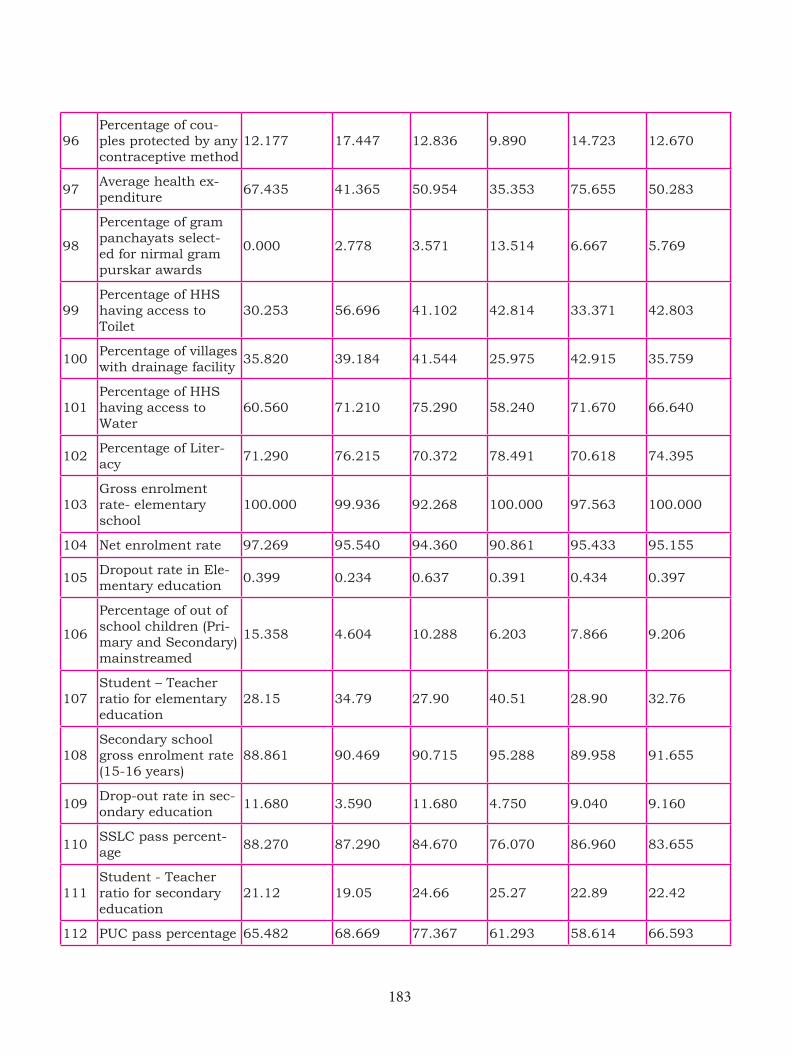
183
96Percentage of cou-ples protected by any contraceptive method
12.177 17.447 12.836 9.890 14.723 12.670
97Average health ex-penditure
67.435 41.365 50.954 35.353 75.655 50.283
98
Percentage of gram panchayats select-ed for nirmal gram purskar awards
0.000 2.778 3.571 13.514 6.667 5.769
99Percentage of HHS having access to Toilet
30.253 56.696 41.102 42.814 33.371 42.803
100Percentage of villages with drainage facility
35.820 39.184 41.544 25.975 42.915 35.759
101Percentage of HHS having access to Water
60.560 71.210 75.290 58.240 71.670 66.640
102Percentage of Liter-acy
71.290 76.215 70.372 78.491 70.618 74.395
103Gross enrolment rate- elementary school
100.000 99.936 92.268 100.000 97.563 100.000
104 Net enrolment rate 97.269 95.540 94.360 90.861 95.433 95.155
105Dropout rate in Ele-mentary education
0.399 0.234 0.637 0.391 0.434 0.397
106
Percentage of out of school children (Pri-mary and Secondary) mainstreamed
15.358 4.604 10.288 6.203 7.866 9.206
107Student – Teacher ratio for elementary education
28.15 34.79 27.90 40.51 28.90 32.76
108Secondary school gross enrolment rate (15-16 years)
88.861 90.469 90.715 95.288 89.958 91.655
109Drop-out rate in sec-ondary education
11.680 3.590 11.680 4.750 9.040 9.160
110SSLC pass percent-age
88.270 87.290 84.670 76.070 86.960 83.655
111Student - Teacher ratio for secondary education
21.12 19.05 24.66 25.27 22.89 22.42
112 PUC pass percentage 65.482 68.669 77.367 61.293 58.614 66.593
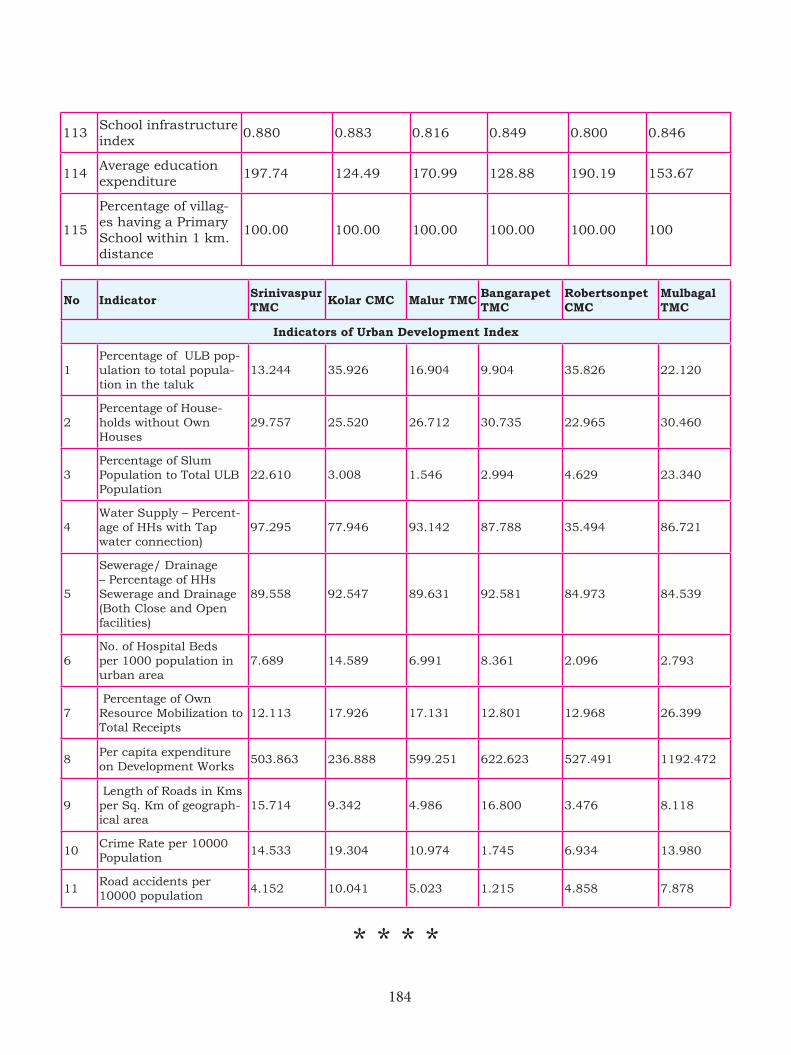
184
* * * *
113School infrastructure index
0.880 0.883 0.816 0.849 0.800 0.846
114Average education expenditure
197.74 124.49 170.99 128.88 190.19 153.67
115
Percentage of villag-es having a Primary School within 1 km. distance
100.00 100.00 100.00 100.00 100.00 100
No Indicator Srinivaspur TMC Kolar CMC Malur TMC Bangarapet
TMCRobertsonpet CMC
Mulbagal TMC
Indicators of Urban Development Index
1Percentage of ULB pop-ulation to total popula-tion in the taluk
13.244 35.926 16.904 9.904 35.826 22.120
2Percentage of House-holds without Own Houses
29.757 25.520 26.712 30.735 22.965 30.460
3Percentage of Slum Population to Total ULB Population
22.610 3.008 1.546 2.994 4.629 23.340
4Water Supply – Percent-age of HHs with Tap water connection)
97.295 77.946 93.142 87.788 35.494 86.721
5
Sewerage/ Drainage – Percentage of HHs Sewerage and Drainage (Both Close and Open facilities)
89.558 92.547 89.631 92.581 84.973 84.539
6No. of Hospital Beds per 1000 population in urban area
7.689 14.589 6.991 8.361 2.096 2.793
7 Percentage of Own Resource Mobilization to Total Receipts
12.113 17.926 17.131 12.801 12.968 26.399
8Per capita expenditure on Development Works
503.863 236.888 599.251 622.623 527.491 1192.472
9 Length of Roads in Kms per Sq. Km of geograph-ical area
15.714 9.342 4.986 16.800 3.476 8.118
10Crime Rate per 10000 Population
14.533 19.304 10.974 1.745 6.934 13.980
11Road accidents per 10000 population
4.152 10.041 5.023 1.215 4.858 7.878
185
* * * *
Annexure 3: Note on availability, limitation and quality of data
The preparation of the District Human Develoment Report critically hinges on the quality of disaggregated data provided by the various government agencies at the district level and below. As discussed in the first chapter, the data and indicators used in the study should be a) reflective of ground realities of human development in the three principle dimensions, b) be reliably available in all districts and c) their nature should be such that district level analysis and addressing gaps should be practically feasible.
The process of data collection for the preparation of the indicators was challenged on two fronts. The first challenge was the availability of the required data and its reliability at the taluk levels. The second and the more problematic issues, was that of relative ease of availability of the same data/indicator at the taluk level in other districts of the state, so that a comparable set of indicators are used for measuring the development status of the districts. These two challenges sufficiently delayed the process of data collection. Further, some of the indicators used in the report, specifically relating to health, nutrition, education and poverty were relatively more difficult to get, due to the sensitive nature of the data and its implcations.
The data on maternal and child health and nutrtion, specifically, that of IMR, CMR and MMR had to be estimated, rather than obtained from government sources and records since the data provided by the department of health and family welfare were unbelievably low in many districts. Further, the department of Women and Child Welfare had vastly differing figures for the same data. Some indicators like share of below poverty households could not be assessed/estimated at taluk levels and hence, had to be reinterpreted as proportion of BPL cardholders to total ration cards, which resulted in high proportion of poor households in the taluks. The data on number of landless households in a taluk, school completion ratios, coverage of Anganwadis had to be dropped in the final calculation of the indicies since uniform availability in all districts was rather difficult. In summary, 9 indicators were dropped from the original set of 135 indicators to be used in the calculation of indices. Further, as indicated above, the sources of data, ways of computation and interpretation of the indicators have changed considerably through the process of preparation of the report.
While state and central governments can rely on sample surveys that provide statistically valid results for measuring the status of development, local agencies have to rely on aggregated information generated from their respective grassroots level offices. The absence of a uniform process of data collection, validation and storage and the lack of coordination between the different government departments at the district level and below is a serious cause of concern, if need based planning has to be meaningfully realized in these government agencies.
186
Annexure 4: Data sources and References
Data soruces
1. Administrative Reports of Kolar Zilla Panchayath
2. Agricultural Census, 2011, GoK
3. Census of India, GoI
4. Coverage Evaluation Survey, 2009 UNICEF
5. District Information System for Education, National University of Educational Planning and Administration, New Delhi
6. District Level Household Survey, International Institute of Population Sciences, Mumbai & GoI
7. District Statistics at a Glance, Kolar Zilla Panchayath
8. Family Welfare Statistics in India, Ministry of Health and Family Welfare, GoI
9. Food, Civil Supplies and Consumers Affairs Department Databases, GoK
10. Health Manangement Information System, Ministry of Health and Family Welfare, GoI
11. Income and Expenditure Statements and Balance Sheets of ULBs
12. Indian Economic Census, GoI
13. Karnataka State Natural Disaster Monitoring Center
14. Karnataka Project Implementation Plan (PIP), National Rural Health Mission, Ministry of Health and Family Welfare, GoI
15. National Health Profile, Ministry of Health and Family Welfare, GoI
16. Office of the Chief Planning Officer, Kolar Zilla Panchayath (Photos and Maps)
17. Office of the Deputy Director of Agriculture, Kolar Zilla Panchayath
18. Office of the Deputy Director of Animal Husbandry, Kolar Zilla Panchayath
19. Office of the Deputy Director of Horticulture, Kolar Zilla Panchayath
20. Office of the Deputy Director of Public Instruction, GoK
21. Office of the District Health Officer, GoK
22. Offices of the Urban Local Bodies
23. Sample Registration System, Census of India, GoI
References
Anand, S., & Sen, A. (2000). Human development and economic sustainability. World Development, 28(12), 2029–2049
187
Chakraborti, D., Rahman, M. M., Murrill, M., Das, R., Siddayya, Patil, S. G., Das, K. K. (2013). Environmental arsenic contamination and its health effects in a historic gold mining area of the Mangalur greenstone belt of Northeastern Karnataka, India. Journal of Hazardous Materials, 262, 1048–1055.
Engberg-Pedersen, Lars. Coping with Poverty and Institutionalised Practices: Tank-irrigated Cultivation in Kolar District, Karnataka. Copenhagen: DIIS, 2011. Print.
Glaeser, E. L. (2013). A World of Cities: The Causes and Consequences of Urbanization in Poorer Countries (Working Paper No. 19745). National Bureau of Economic Research
Haq, M. ul. (1996). Reflections on Human Development (OUP Catalogue). Oxford University Press.
Jayadev, A., Motiram, S., & Vakulabharanam, V. (2007). Patterns of wealth disparities in India during the liberalisation era. Economic and Political Weekly, 42(38), 3853–3863.
Kumar, A. (2008). Paradoxes of paradigm shift: Indian engagement with liberalization and globalization. Futures, 40(8), 762–766.
Kundu, A. (2011). Trends and processes of urbanisation in India. IIED.
Kurian, N. J. (2007). Widening economic & social disparities: Implications for India. Indian Journal of Medical Research, 126(4), 374.
Madheswaran, S., & Attewell, P. (2007). Caste discrimination in the Indian urban labour market: Evidence from the National Sample Survey. Economic and Political Weekly 42 (41), 4146–4153.
Naik, N. T. K., & Rahman, S. M. (2007). Urbanisation Of India. Serials Publications.
Narayanamurthy, Shruthi, and Anil Navale Santhuram. 2013. “Prevalence of Dental Fluorosis in School Children of Bangarpet Taluk, Kolar District.” Journal of Orofacial Sciences 5 (2): 105. doi:10.4103/0975-8844.124253
Planning and Statistics Department. (2005). Karnataka Human Development Report - 2005. Bengaluru: Government of Karnataka.
Prasad SR, George S, and Gupta NP. “Studies on an Outbreak of Japanese Encephalitis in Kolar District, Karnataka State in 1977-78.” The Indian journal of medical research 75 (1982): 1–6. Print.,
Ram, U., Jha, P., Ram, F., Kumar, K., Awasthi, S., Shet, A.,Kumar, R. (2013). Neonatal, 1–59 month, and under-5 mortality in 597 Indian districts, 2001 to 2012: estimates from national demographic and mortality surveys. The Lancet Global Health, 1(4)
Ranis, G., Stewart, F., & Ramirez, A. (2000). Economic growth and human development. World Development, 28(2), 197–219.
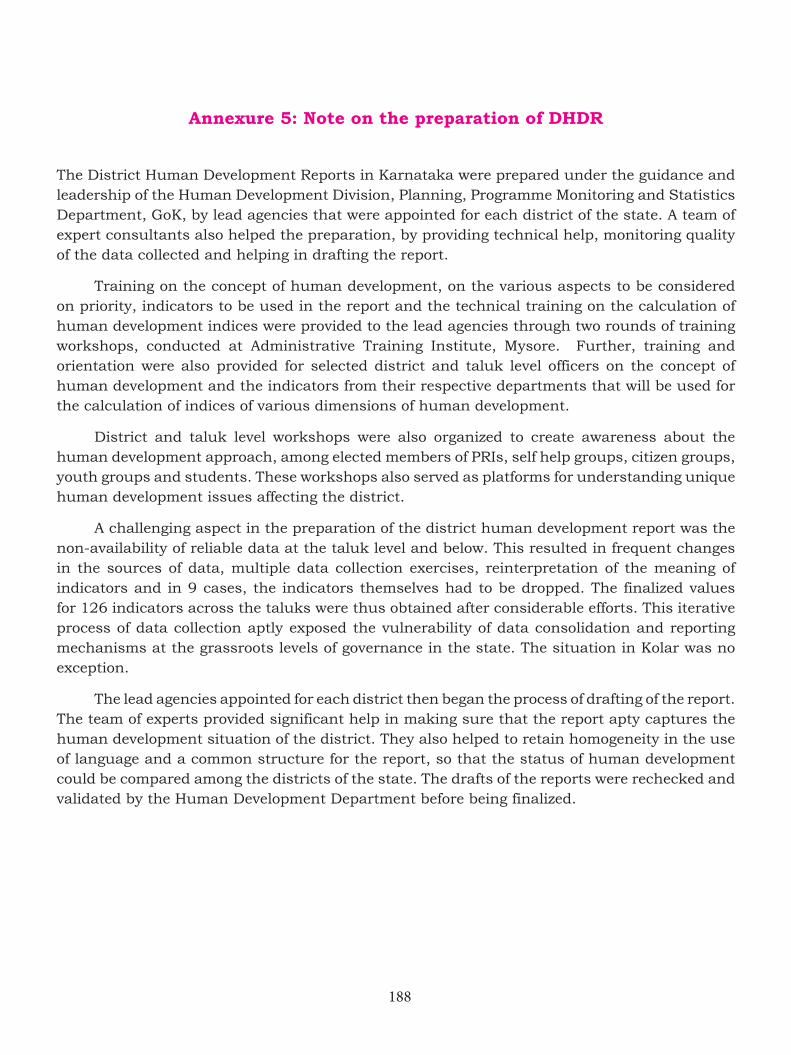
188
Annexure 5: Note on the preparation of DHDR
The District Human Development Reports in Karnataka were prepared under the guidance and leadership of the Human Development Division, Planning, Programme Monitoring and Statistics Department, GoK, by lead agencies that were appointed for each district of the state. A team of expert consultants also helped the preparation, by providing technical help, monitoring quality of the data collected and helping in drafting the report.
Training on the concept of human development, on the various aspects to be considered on priority, indicators to be used in the report and the technical training on the calculation of human development indices were provided to the lead agencies through two rounds of training workshops, conducted at Administrative Training Institute, Mysore. Further, training and orientation were also provided for selected district and taluk level officers on the concept of human development and the indicators from their respective departments that will be used for the calculation of indices of various dimensions of human development.
District and taluk level workshops were also organized to create awareness about the human development approach, among elected members of PRIs, self help groups, citizen groups, youth groups and students. These workshops also served as platforms for understanding unique human development issues affecting the district.
A challenging aspect in the preparation of the district human development report was the non-availability of reliable data at the taluk level and below. This resulted in frequent changes in the sources of data, multiple data collection exercises, reinterpretation of the meaning of indicators and in 9 cases, the indicators themselves had to be dropped. The finalized values for 126 indicators across the taluks were thus obtained after considerable efforts. This iterative process of data collection aptly exposed the vulnerability of data consolidation and reporting mechanisms at the grassroots levels of governance in the state. The situation in Kolar was no exception.
The lead agencies appointed for each district then began the process of drafting of the report. The team of experts provided significant help in making sure that the report apty captures the human development situation of the district. They also helped to retain homogeneity in the use of language and a common structure for the report, so that the status of human development could be compared among the districts of the state. The drafts of the reports were rechecked and validated by the Human Development Department before being finalized.

189
Annexure 6: Details on workshops, meetings
Date Meeting/workshop Venue Participants Discussion points
11.12.2012 – 15.12.2012
Basic training Work-shop
ATI Mysore4 day basic training for prepa-ration of DHDRs for all lead agencies
23.07.2013 – 27.07.2013
Technical training Workshop
ATI Mysore3 day technical training work-shop for calculation of indices
21.01.2013District Level Core Committee meeting
Zilla Pancha-yath, Kolar
CEO ZP Kolar,
CPO ZP Kolar
Deputy Directors of line depart-ments, GRAAM team
Introduction to Hu-man Development report and discussion
07.06.2013District Level Core Committee meeting
Zilla Panchayath Kolar
Core committee members and members of ZP Kolar, GRAAM team
Reviewed progress of the project and the status of data collec-tion.
15.03.2013Subcommittee meet-ing on Housing, Water and Sanitation
Zilla Pancha-yath Kolar
CPO, ZP Kolar, Officials from Health Dept, PRED, Statistical Officer, Local experts and profes-sors and GRAAM team
Discussion about the problems, areas of concern, achievement in water and sanita-tion, housing
20.03.2013Subcommittee meeting on Health, Livelihood and Education
Zilla Pancha-yath Kolar
CPO, ZP Kolar, Officials from different departments, Local experts and professors and GRAAM team
Discussions about formats for data collection and data availability
07.06.2013District level workshop in Kolar
Zilla Pancha-yath, Kolar
ZP officials, ZP members, of-ficials from line departments, NGO representatives, GRAAM team
Introduction to Hu-man development re-port to different Govt department officials.
12.07.2013Taluk Level Workshop – Bangarpet
Taluk Pancha-yath Office, Bangarpet
CPO ZP Kolar, Taluk and Gram Panchayath members Students from local colleges, members of, local NGOs, GRAAM team Presentation about
Human development concept and its objec-tives.
Presentation about Human development concept and its objec-tives.
Presentation about Human development concept and its objec-tives.
15.07.2013Taluk Level Workshop – Mulbagal
Taluk Pancha-yath office Mul-bagal
CPO ZP Kolar, Taluk and Gram Panchayath members Students from local colleges, members of, local NGOs, SHG members, Anganawadi teachers,
GRAAM team
16.07.2013Taluk level workshop – Srinivaspur
Taluk Pancha-yath Office Srini-vaspur
Taluk and Gram Panchayath members Students from lo-cal colleges, members of, local NGOs, SHG members, Anga-nawadi teachers, GRAAM team
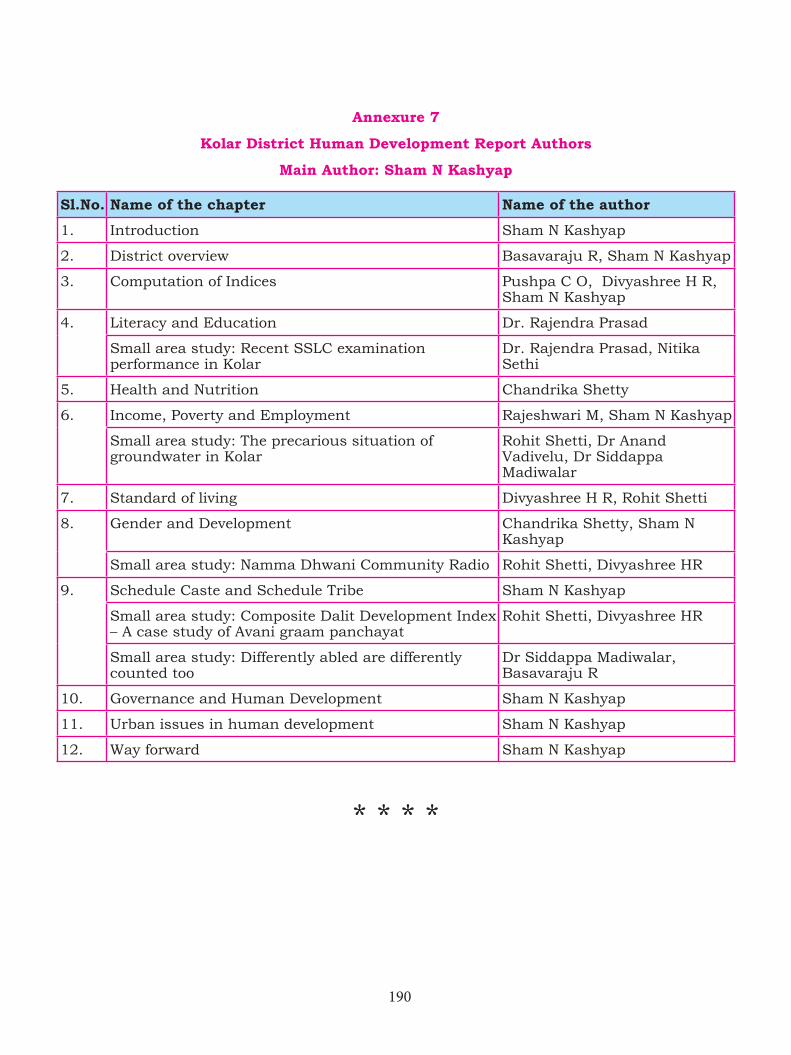
190
Annexure 7
Kolar District Human Development Report Authors
Main Author: Sham N Kashyap
Sl.No. Name of the chapter Name of the author
1. Introduction Sham N Kashyap
2. District overview Basavaraju R, Sham N Kashyap
3. Computation of Indices Pushpa C O, Divyashree H R, Sham N Kashyap
4. Literacy and Education Dr. Rajendra Prasad
Small area study: Recent SSLC examination performance in Kolar
Dr. Rajendra Prasad, Nitika Sethi
5. Health and Nutrition Chandrika Shetty
6. Income, Poverty and Employment Rajeshwari M, Sham N Kashyap
Small area study: The precarious situation of groundwater in Kolar
Rohit Shetti, Dr Anand Vadivelu, Dr Siddappa Madiwalar
7. Standard of living Divyashree H R, Rohit Shetti
8. Gender and Development Chandrika Shetty, Sham N Kashyap
Small area study: Namma Dhwani Community Radio Rohit Shetti, Divyashree HR
9. Schedule Caste and Schedule Tribe Sham N Kashyap
Small area study: Composite Dalit Development Index – A case study of Avani graam panchayat
Rohit Shetti, Divyashree HR
Small area study: Differently abled are differently counted too
Dr Siddappa Madiwalar, Basavaraju R
10. Governance and Human Development Sham N Kashyap
11. Urban issues in human development Sham N Kashyap
12. Way forward Sham N Kashyap
* * * *
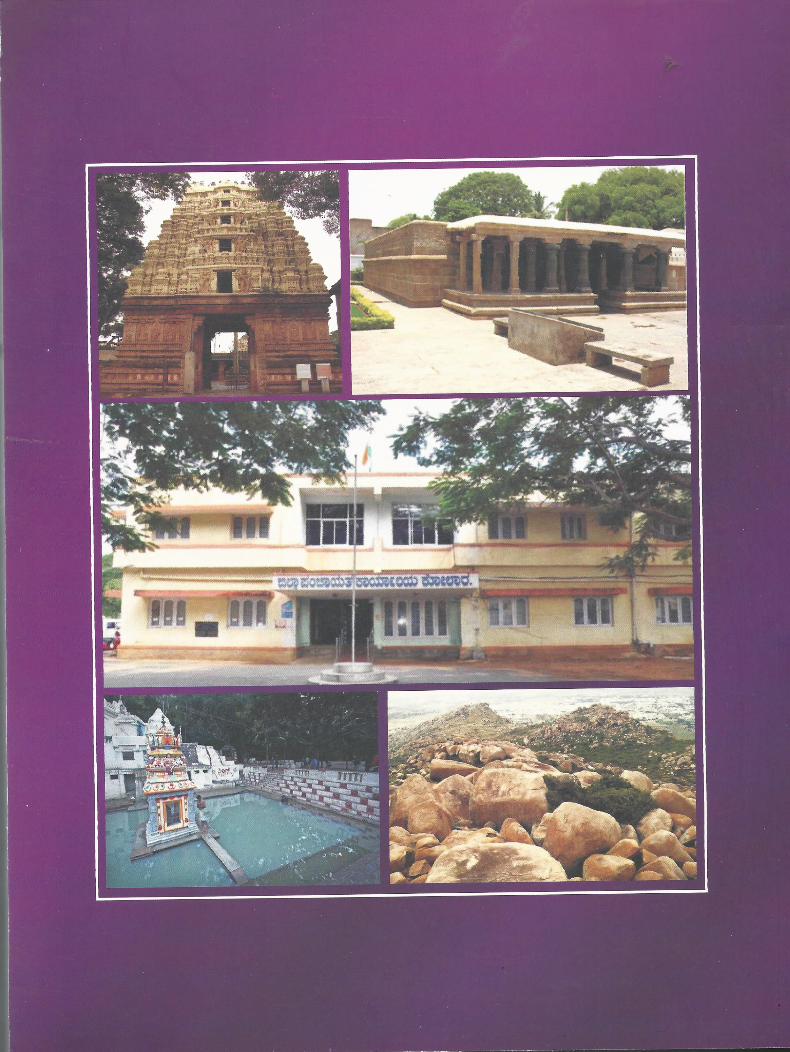
Related Documents