i JULY 2017

Welcome message from author
This document is posted to help you gain knowledge. Please leave a comment to let me know what you think about it! Share it to your friends and learn new things together.
Transcript
i
JULY 2017
1
Table of Contents
SELECTED ECONOMIC INDICATORS ................................................................................. 2
INTERNATIONAL COMMODITY PRICE DEVELOPMENTS ........................................... 3
MERCHANDISE TRADE DEVELOPMENTS........................................................................ 4
MONETARY DEVELOPMENTS .............................................................................................. 6
STOCK MARKET DEVELOPMENTS ..................................................................................... 7
INFLATION OUTTURN ............................................................................................................. 8
NATIONAL PAYMENTS SYSTEM .......................................................................................... 8
2
2017
June
2017
July
Month-on-
Month
Change
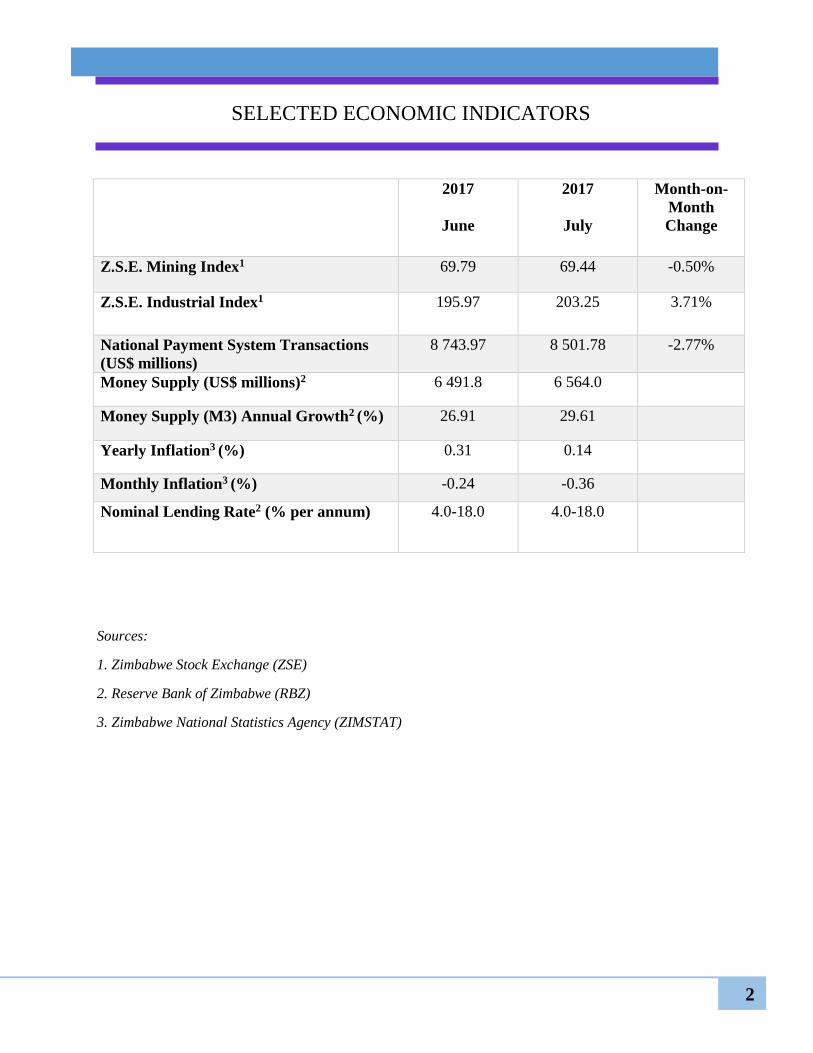
Z.S.E. Mining Index1 69.79 69.44 -0.50%
Z.S.E. Industrial Index1 195.97 203.25 3.71%
National Payment System Transactions
(US$ millions)
8 743.97 8 501.78 -2.77%
Money Supply (US$ millions)2 6 491.8 6 564.0
Money Supply (M3) Annual Growth2 (%) 26.91 29.61
Yearly Inflation3 (%) 0.31 0.14
Monthly Inflation3 (%) -0.24 -0.36
Nominal Lending Rate2 (% per annum) 4.0-18.0 4.0-18.0
Sources:
1. Zimbabwe Stock Exchange (ZSE)
2. Reserve Bank of Zimbabwe (RBZ)
3. Zimbabwe National Statistics Agency (ZIMSTAT)
SELECTED ECONOMIC INDICATORS
3
INTERNATIONAL COMMODITY PRICE
DEVELOPMENTS
International commodity prices for precious
metals retreated, whilst those for base metals
and crude oil firmed during the month of July
2017.
Precious Metals
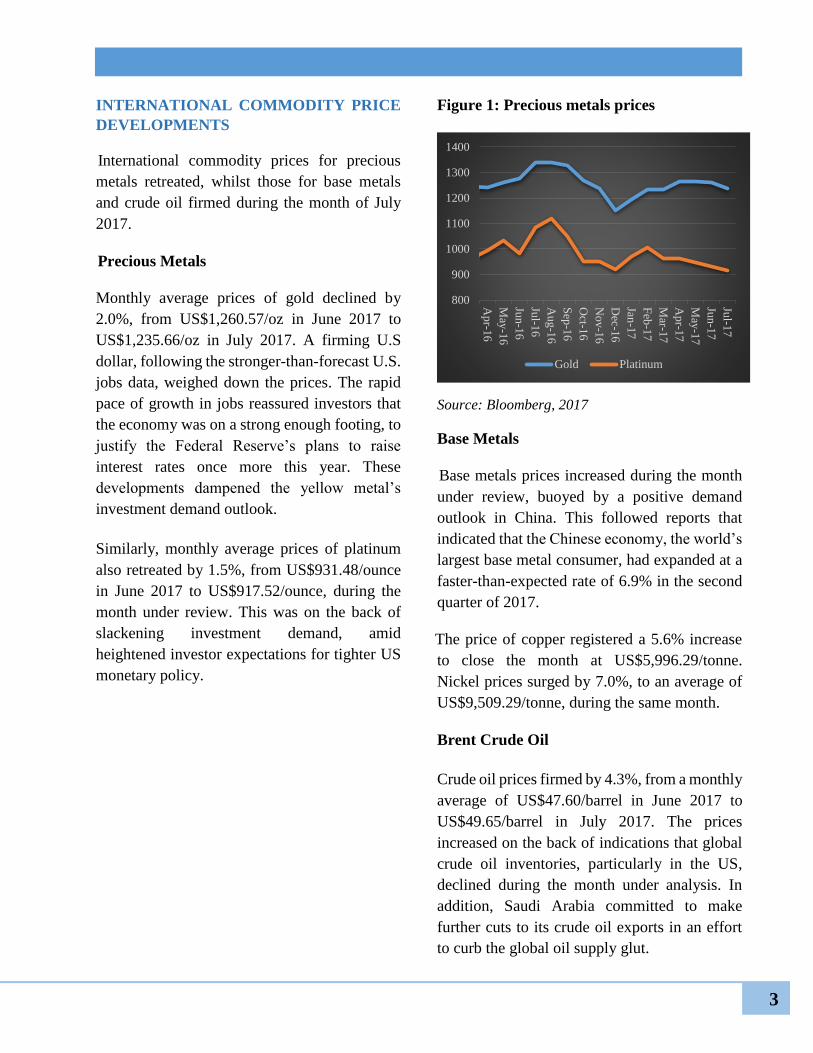
Monthly average prices of gold declined by
2.0%, from US$1,260.57/oz in June 2017 to
US$1,235.66/oz in July 2017. A firming U.S
dollar, following the stronger-than-forecast U.S.
jobs data, weighed down the prices. The rapid
pace of growth in jobs reassured investors that
the economy was on a strong enough footing, to
justify the Federal Reserve’s plans to raise
interest rates once more this year. These
developments dampened the yellow metal’s
investment demand outlook.
Similarly, monthly average prices of platinum
also retreated by 1.5%, from US$931.48/ounce
in June 2017 to US$917.52/ounce, during the
month under review. This was on the back of
slackening investment demand, amid
heightened investor expectations for tighter US
monetary policy.
Figure 1: Precious metals prices
Source: Bloomberg, 2017
Base Metals
Base metals prices increased during the month
under review, buoyed by a positive demand
outlook in China. This followed reports that
indicated that the Chinese economy, the world’s
largest base metal consumer, had expanded at a
faster-than-expected rate of 6.9% in the second
quarter of 2017.
The price of copper registered a 5.6% increase
to close the month at US$5,996.29/tonne.
Nickel prices surged by 7.0%, to an average of
US$9,509.29/tonne, during the same month.
Brent Crude Oil
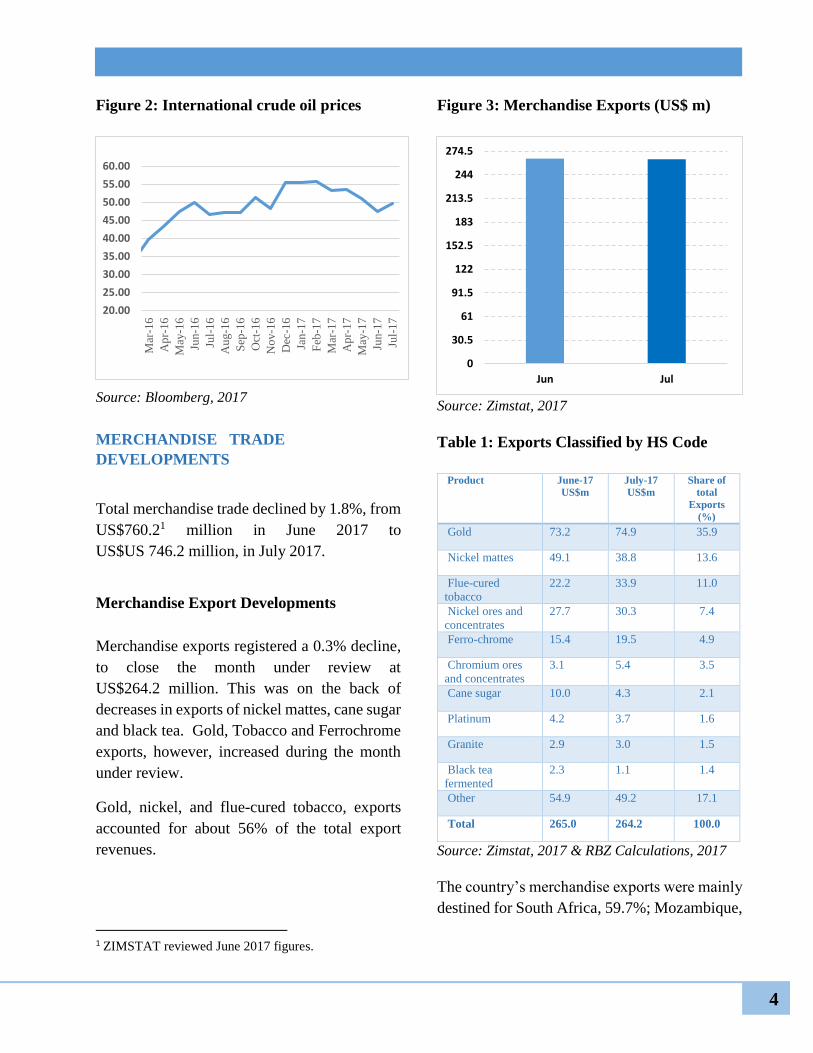
Crude oil prices firmed by 4.3%, from a monthly
average of US$47.60/barrel in June 2017 to
US$49.65/barrel in July 2017. The prices
increased on the back of indications that global
crude oil inventories, particularly in the US,
declined during the month under analysis. In
addition, Saudi Arabia committed to make
further cuts to its crude oil exports in an effort
to curb the global oil supply glut.
800
900
1000
1100
1200
1300
1400
Ap
r-16
May
-16
Jun-1
6
Jul-1
6
Au
g-1
6
Sep
-16
Oct-1
6
No
v-1
6
Dec-1
6
Jan-1
7
Feb
-17
Mar-1
7
Ap
r-17
May
-17
Jun-1
7
Jul-1
7
Gold Platinum
4
Figure 2: International crude oil prices
Source: Bloomberg, 2017
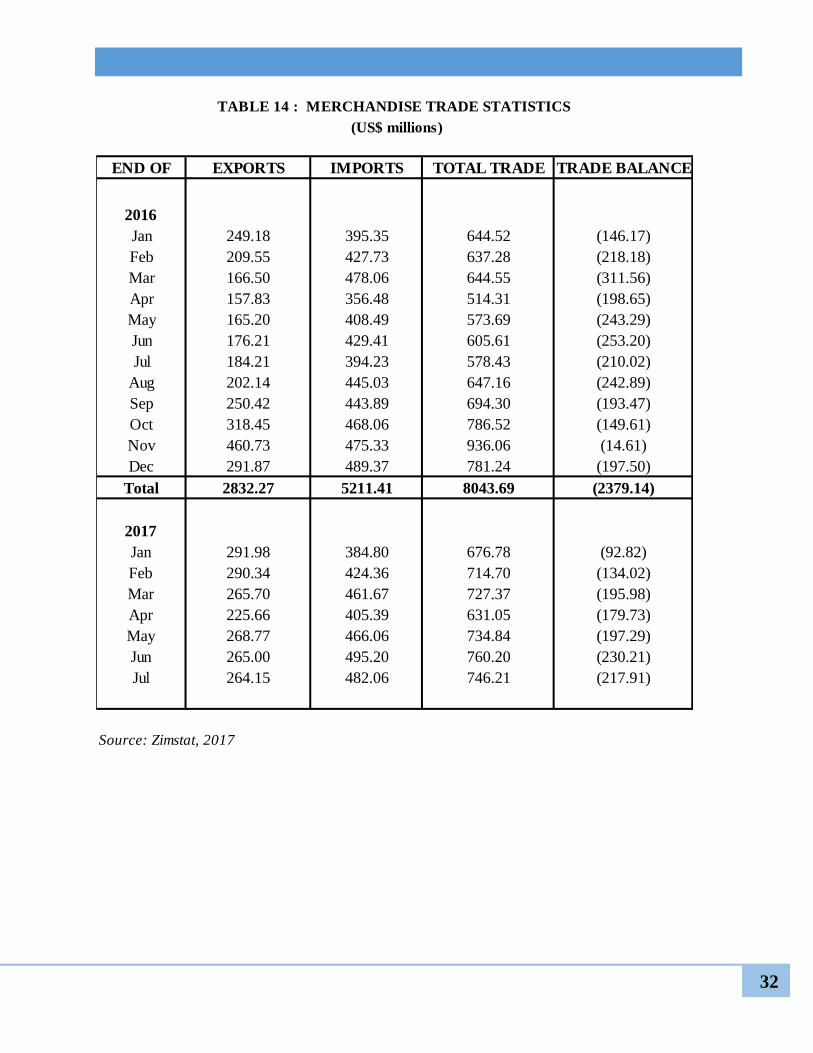
MERCHANDISE TRADE
DEVELOPMENTS
Total merchandise trade declined by 1.8%, from
US$760.21 million in June 2017 to
US$US 746.2 million, in July 2017.
Merchandise Export Developments
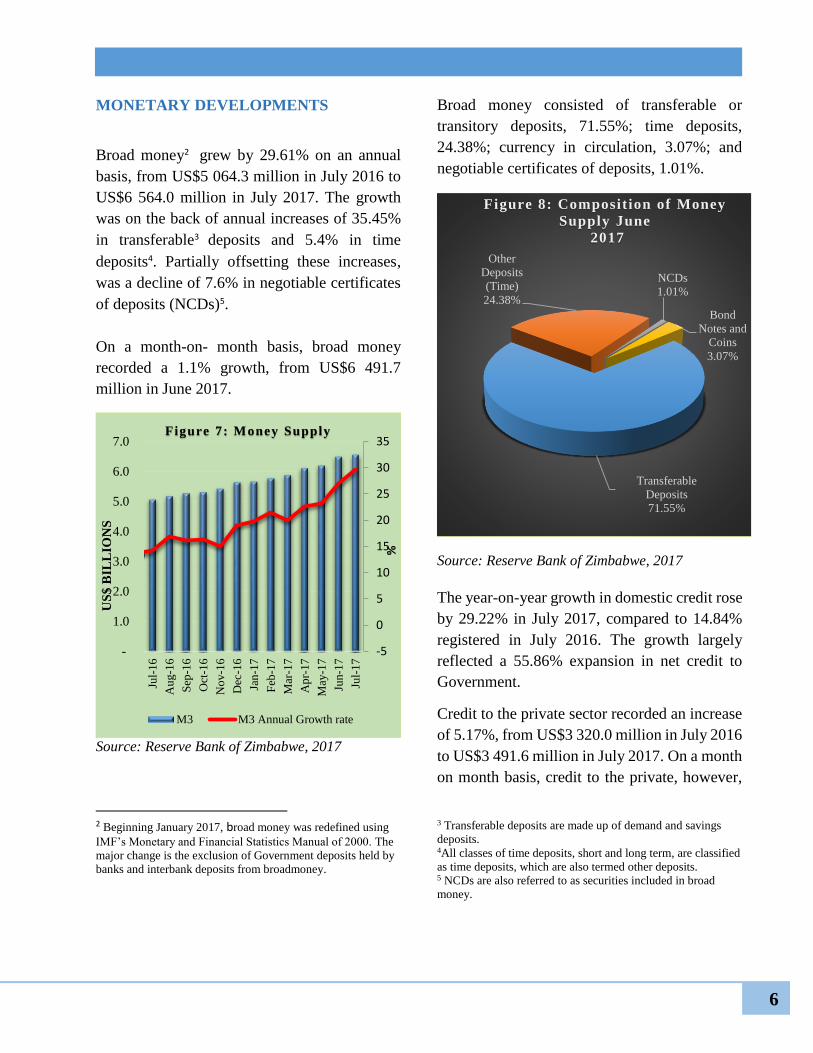
Merchandise exports registered a 0.3% decline,
to close the month under review at
US$264.2 million. This was on the back of
decreases in exports of nickel mattes, cane sugar
and black tea. Gold, Tobacco and Ferrochrome
exports, however, increased during the month
under review.
Gold, nickel, and flue-cured tobacco, exports
accounted for about 56% of the total export
revenues.
1 ZIMSTAT reviewed June 2017 figures.
Figure 3: Merchandise Exports (US$ m)
Source: Zimstat, 2017
Table 1: Exports Classified by HS Code
Product June-17
US$m
July-17
US$m
Share of
total
Exports
(%)
Gold 73.2 74.9 35.9
Nickel mattes 49.1 38.8 13.6
Flue-cured
tobacco
22.2 33.9 11.0
Nickel ores and
concentrates
27.7 30.3 7.4
Ferro-chrome 15.4 19.5 4.9
Chromium ores
and concentrates
3.1 5.4 3.5
Cane sugar 10.0 4.3 2.1
Platinum 4.2 3.7 1.6
Granite 2.9 3.0 1.5
Black tea
fermented
2.3 1.1 1.4
Other 54.9 49.2 17.1
Total 265.0 264.2 100.0
Source: Zimstat, 2017 & RBZ Calculations, 2017
The country’s merchandise exports were mainly
destined for South Africa, 59.7%; Mozambique,
20.00
25.00
30.00
35.00
40.00
45.00
50.00
55.00
60.00
Mar
-16
Ap
r-16
May
-16
Jun-1
6
Jul-
16
Au
g-1
6
Sep
-16
Oct
-16
No
v-1
6
Dec
-16
Jan
-17
Feb
-17
Mar
-17
Ap
r-17
May
-17
Jun-1
7
Jul-
17
0
30.5
61
91.5
122
152.5
183
213.5
244
274.5
Jun Jul

5
13.9%; the United Arab Emirates, 4.9%;
Zambia,2.3.0%; Kenya,1.0%; Malawi, 0.1%,
Madagascar, 0.1%; Singapore,0.1%; Botswana,
0.7%; Namibia, 0.5%; and other
countries, 16.6%.
Source: Zimstat, 2017 & RBZ Calculations, 2017
Merchandise Import Developments
Merchandise imports declined by 2.7%, from
US$495.2 million in June 2017 to US$482.1
million in July 2017. In terms of proportions,
diesel accounted for 14.3%; unleaded petrol,
6.2%; electricity, 4.1%; and aviation spirit,
3.5%, of total imports.
The country sourced imports from
South Africa (43.0%); Singapore (23.0%);
Zambia (3.2%); Japan (2.5%), Mozambique
(2.2%); and India (1.5%), during the month
under analysis, as shown in Figure 5.
Figure 5: Major Merchandise Import
Sources (% Share)
Source: Zimstat, 2017 & RBZ Calculations, 2017
Merchandise Trade Balance
The country’s merchandise trade deficit,
improved from -US$230.2 million in June 2017,
to -US$217.9 million in July 2017. This was on
the back of a decline in the import bill, during
the month under analysis.
Figure 6: Merchandise Exports, Imports and
Trade Balance (US$m)
Source: Zimstat, 2017 & RBZ Computations, 2017
South Africa59.7%
Mozambique13.9%
United Arab
Emirates4.9%
Zambia2.3%
Kenya1.0%
Botswana0.7%
Namibia0.5%
Malawi0.1%
Madagascar0.1%
Singapore0.1%
Other16.6%
Figure 4:Major Merchandise
Export Dest inations
South Africa
Singapore
China
Zambia
Mozambique
Japan
India
Mauritius
U.A.E
U.K
Other
0% 10% 20% 30% 40%
(300.0)
(200.0)
(100.0)
-
100.0
200.0
300.0
400.0
500.0
Jan-1
7
Feb
-17
Mar-1
7
Ap
r-17
May-1
7
Jun
-17
Jul-1
7
Exports Imports Trade balance
6
MONETARY DEVELOPMENTS
Broad money2 grew by 29.61% on an annual
basis, from US$5 064.3 million in July 2016 to
US$6 564.0 million in July 2017. The growth
was on the back of annual increases of 35.45%
in transferable3 deposits and 5.4% in time
deposits4. Partially offsetting these increases,
was a decline of 7.6% in negotiable certificates
of deposits (NCDs)5.
On a month-on- month basis, broad money
recorded a 1.1% growth, from US$6 491.7
million in June 2017.
Source: Reserve Bank of Zimbabwe, 2017
2 Beginning January 2017, broad money was redefined using
IMF’s Monetary and Financial Statistics Manual of 2000. The
major change is the exclusion of Government deposits held by
banks and interbank deposits from broadmoney.
Broad money consisted of transferable or
transitory deposits, 71.55%; time deposits,
24.38%; currency in circulation, 3.07%; and
negotiable certificates of deposits, 1.01%.
Source: Reserve Bank of Zimbabwe, 2017
The year-on-year growth in domestic credit rose
by 29.22% in July 2017, compared to 14.84%
registered in July 2016. The growth largely
reflected a 55.86% expansion in net credit to
Government.
Credit to the private sector recorded an increase
of 5.17%, from US$3 320.0 million in July 2016
to US$3 491.6 million in July 2017. On a month
on month basis, credit to the private, however,
3 Transferable deposits are made up of demand and savings
deposits. 4All classes of time deposits, short and long term, are classified
as time deposits, which are also termed other deposits. 5 NCDs are also referred to as securities included in broad
money.
-5
0
5
10
15
20
25
30
35
-
1.0
2.0
3.0
4.0
5.0
6.0
7.0
Jul-
16
Au
g-1
6
Sep
-16
Oct
-16
No
v-1
6
Dec
-16
Jan
-17
Feb
-17
Mar
-17
Ap
r-17
May
-17
Jun-1
7
Jul-
17
%
US
$ B
ILL
ION
S
F igure 7: Money Supply
M3 M3 Annual Growth rate
Transferable
Deposits
71.55%
Other
Deposits
(Time)
24.38%
NCDs
1.01%
Bond
Notes and
Coins
3.07%
Figure 8: Composition of Money
Supply June
2017

7
declined by 0.88%, from US$ 3 522.9 million in
June 2017 to the July figure of US$3 491.6
million.
Source: Reserve Bank of Zimbabwe, 2017
On a sectoral basis, private sector credit was
distributed as follows: households, 23.6%;
agriculture, 17.8%; services, 16.4%;
manufacturing, 12.1%; financial organisations
and investments, 10.5%; distribution, 9.9%;
mining, 5.1%; transport and communications,
2.0%; construction, 2.0%; and other, 0.6%.
During the month under review, private sector
credit was largely channelled towards:
inventory build-up, 30.9%; consumer durables,
16.3%; and fixed capital investment, 12.7%.
STOCK MARKET DEVELOPMENTS
The Zimbabwe Stock Exchange was bullish for
the fifth consecutive month in July 2017.
Consequently, the mainstream index gained
7.28 points to close the month at 203.25 points.
The resources index, however, declined
marginally by 0.35 points, to close the month
under review at 69.44 points. This was on the
back of subdued investor interest in the
resources counters.
Source: Zimbabwe Stock Exchange, 2017
The ZSE market turnover volume registered a
51.98% decline, to close the month under
review at 149.4 million shares. Similarly, the
turnover value declined by 37.84% to US$24.71
million, in July 2017.
The local bourse registered two block trades
which saw 2.2 million Axia Corporation
Limited shares and 0.98 million CBZ Holdings
Limited shares exchanging hands at US$0.125
and US$0.10, respectively.
Households
23.6%
Agriculture,
17.8%
Manufacturing,
12.1%Services,
16.4%
Distribution,
9.9%
Financial
Organisati
ons,
10.5%
Mining,
5.1%
Transport and
Communication,
2.0%
Construction,
2.0% Other, 0.6%
Figure 9: Sectoral Distribution of
Credit
0
50
100
150
200
31-J
ul-
16
31-A
ug-1
6
30-S
ep-1
6
31-O
ct-1
6
30-N
ov-1
6
31-D
ec-1
6
31-J
an-1
7
28-F
eb-1
7
31-M
ar-1
7
30-A
pr-
17
31-M
ay-1
7
30-J
un-1
7
31-J
ul-
17
Figure 10: ZSE Indices
Industrial Mining
8
Foreign portfolio investment improved in July
2017, with net inflows at US$1.55 million,
compared to net outflows of US$2.38 million in
June 2017.
INFLATION OUTTURN
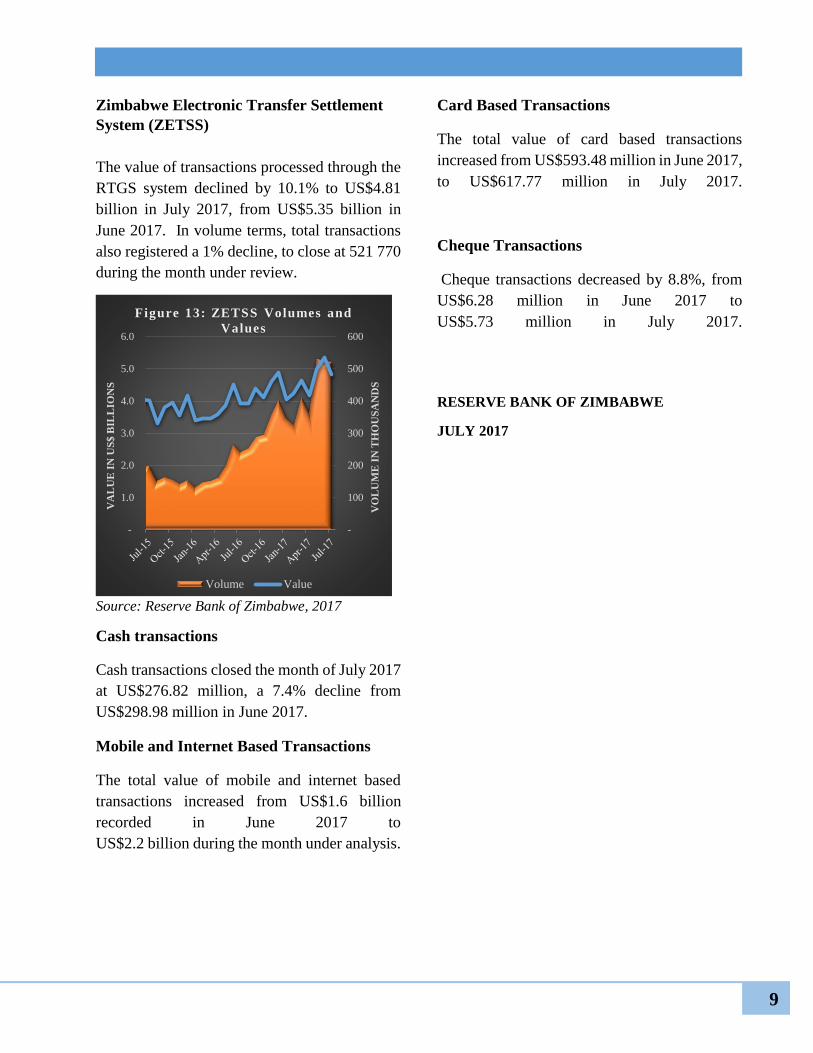
Annual Inflation
Annual headline inflation declined to 0.14% in
July 2017, from 0.31% in June 2017. This was
on account of a decline in non-food inflation.
Annual non-food inflation continued on a
downward trend decelerating further to -0.67%
in July 2017 from -0.37% in June 2017. Annual
food inflation, however, increased from 1.82%
in June 2017, to 1.92% in July 2017.
Source: ZIMSTAT, 2017
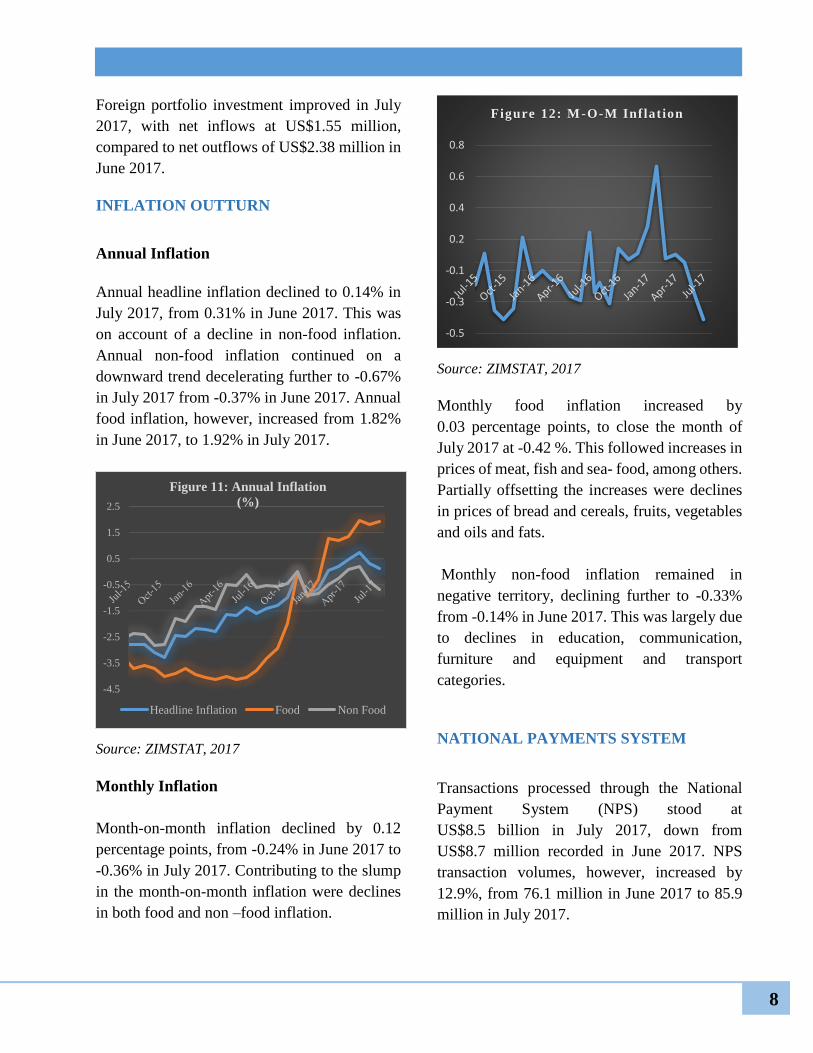
Monthly Inflation
Month-on-month inflation declined by 0.12
percentage points, from -0.24% in June 2017 to
-0.36% in July 2017. Contributing to the slump
in the month-on-month inflation were declines
in both food and non –food inflation.
Source: ZIMSTAT, 2017
Monthly food inflation increased by
0.03 percentage points, to close the month of
July 2017 at -0.42 %. This followed increases in
prices of meat, fish and sea- food, among others.
Partially offsetting the increases were declines
in prices of bread and cereals, fruits, vegetables
and oils and fats.
Monthly non-food inflation remained in
negative territory, declining further to -0.33%
from -0.14% in June 2017. This was largely due
to declines in education, communication,
furniture and equipment and transport
categories.
NATIONAL PAYMENTS SYSTEM
Transactions processed through the National
Payment System (NPS) stood at
US$8.5 billion in July 2017, down from
US$8.7 million recorded in June 2017. NPS
transaction volumes, however, increased by
12.9%, from 76.1 million in June 2017 to 85.9
million in July 2017.
-4.5
-3.5
-2.5
-1.5
-0.5
0.5
1.5
2.5
Figure 11: Annual Inflation
(%)
Headline Inflation Food Non Food
-0.5
-0.3
-0.1
0.2
0.4
0.6
0.8
Figure 12: M -O-M Inflat ion
9
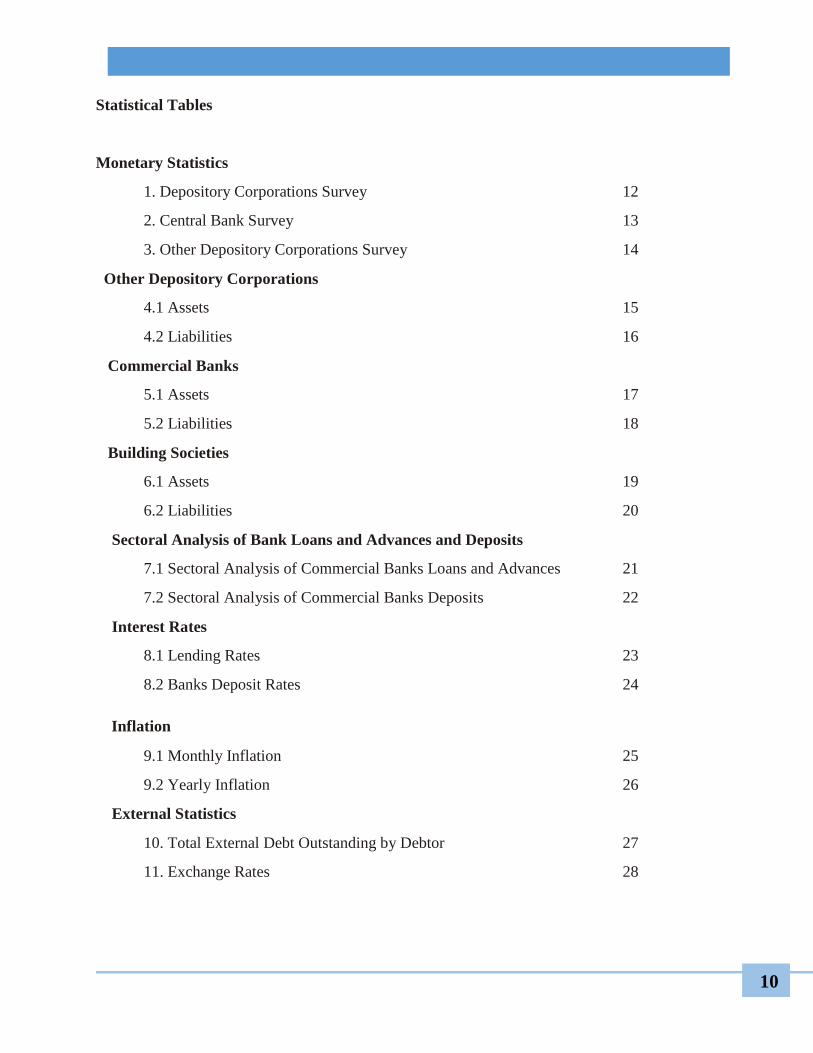
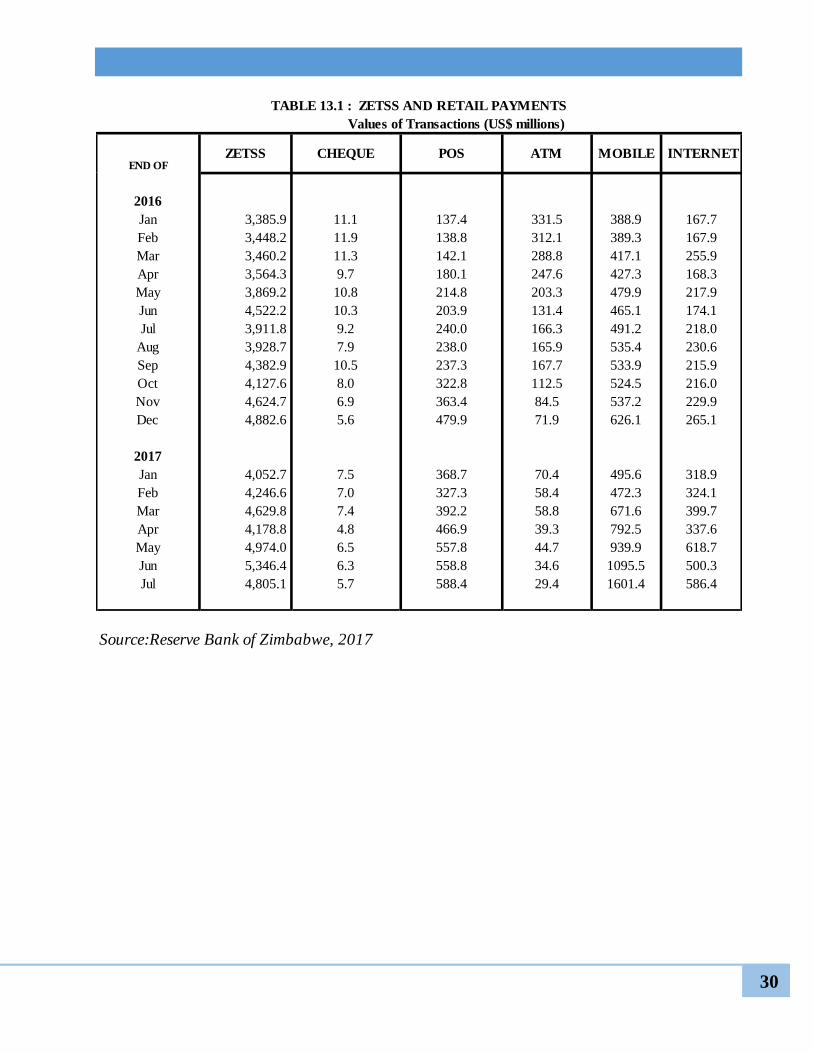
Zimbabwe Electronic Transfer Settlement
System (ZETSS)
The value of transactions processed through the
RTGS system declined by 10.1% to US$4.81
billion in July 2017, from US$5.35 billion in
June 2017. In volume terms, total transactions
also registered a 1% decline, to close at 521 770
during the month under review.
Source: Reserve Bank of Zimbabwe, 2017
Cash transactions
Cash transactions closed the month of July 2017
at US$276.82 million, a 7.4% decline from
US$298.98 million in June 2017.
Mobile and Internet Based Transactions
The total value of mobile and internet based
transactions increased from US$1.6 billion
recorded in June 2017 to
US$2.2 billion during the month under analysis.
Card Based Transactions
The total value of card based transactions
increased from US$593.48 million in June 2017,
to US$617.77 million in July 2017.
Cheque Transactions
Cheque transactions decreased by 8.8%, from
US$6.28 million in June 2017 to
US$5.73 million in July 2017.
RESERVE BANK OF ZIMBABWE
JULY 2017
-
1.0
2.0
3.0
4.0
5.0
6.0
-
100
200
300
400
500
600
VA
LU
E I
N U
S$
BIL
LIO
NS
VO
LU
ME
IN
TH
OU
SA
ND
S
Figure 13: ZETSS Volumes and
Values
Volume Value
10
Statistical Tables
Monetary Statistics
1. Depository Corporations Survey 12
2. Central Bank Survey 13
3. Other Depository Corporations Survey 14
Other Depository Corporations
4.1 Assets 15
4.2 Liabilities 16
Commercial Banks
5.1 Assets 17
5.2 Liabilities 18
Building Societies
6.1 Assets 19
6.2 Liabilities 20
Sectoral Analysis of Bank Loans and Advances and Deposits
7.1 Sectoral Analysis of Commercial Banks Loans and Advances 21
7.2 Sectoral Analysis of Commercial Banks Deposits 22
Interest Rates
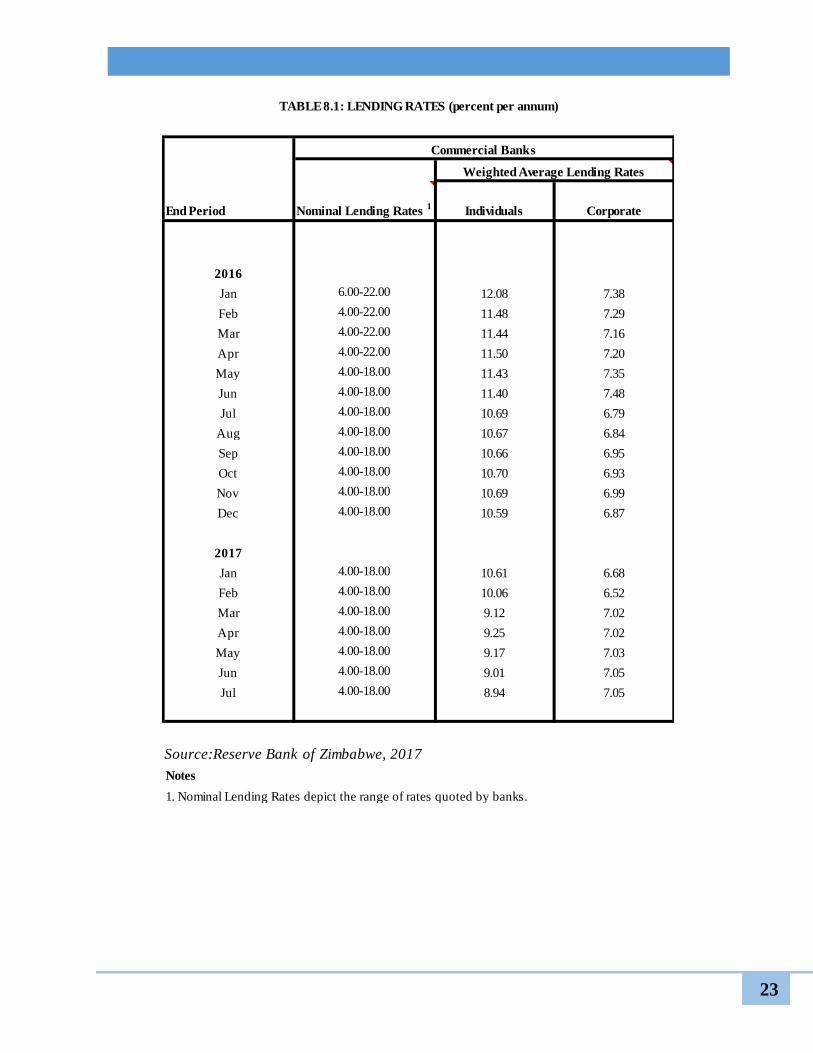
8.1 Lending Rates 23
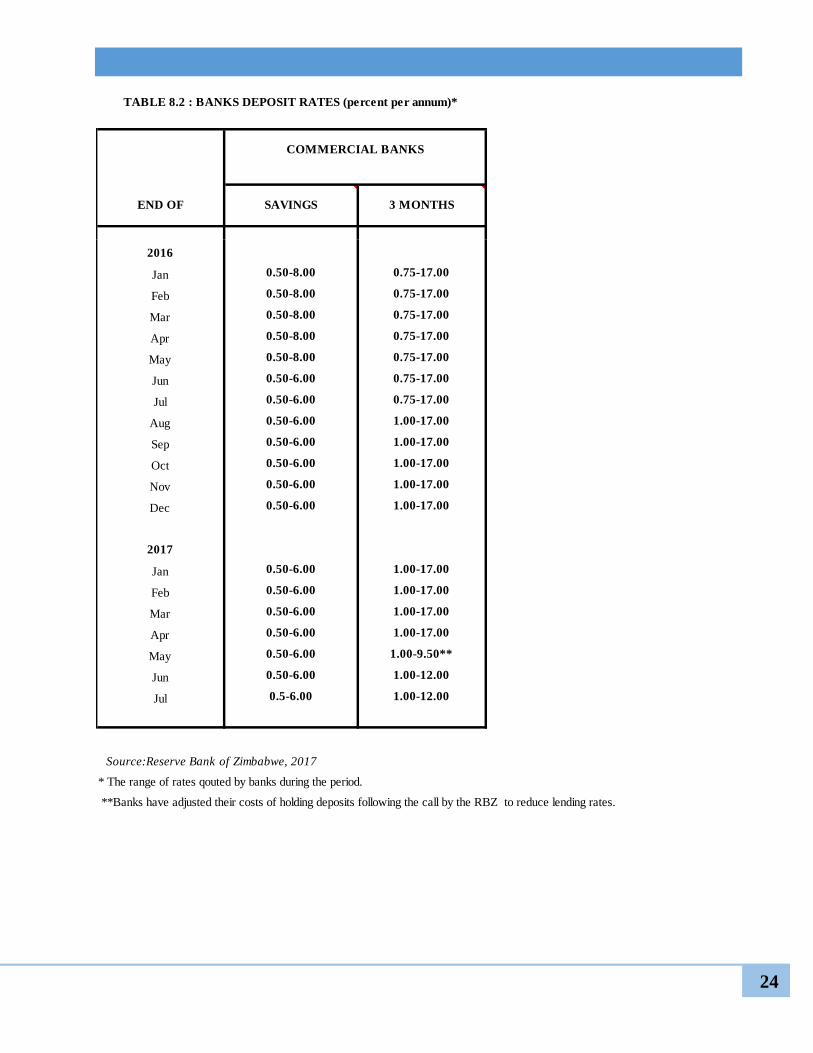
8.2 Banks Deposit Rates 24
Inflation
9.1 Monthly Inflation 25
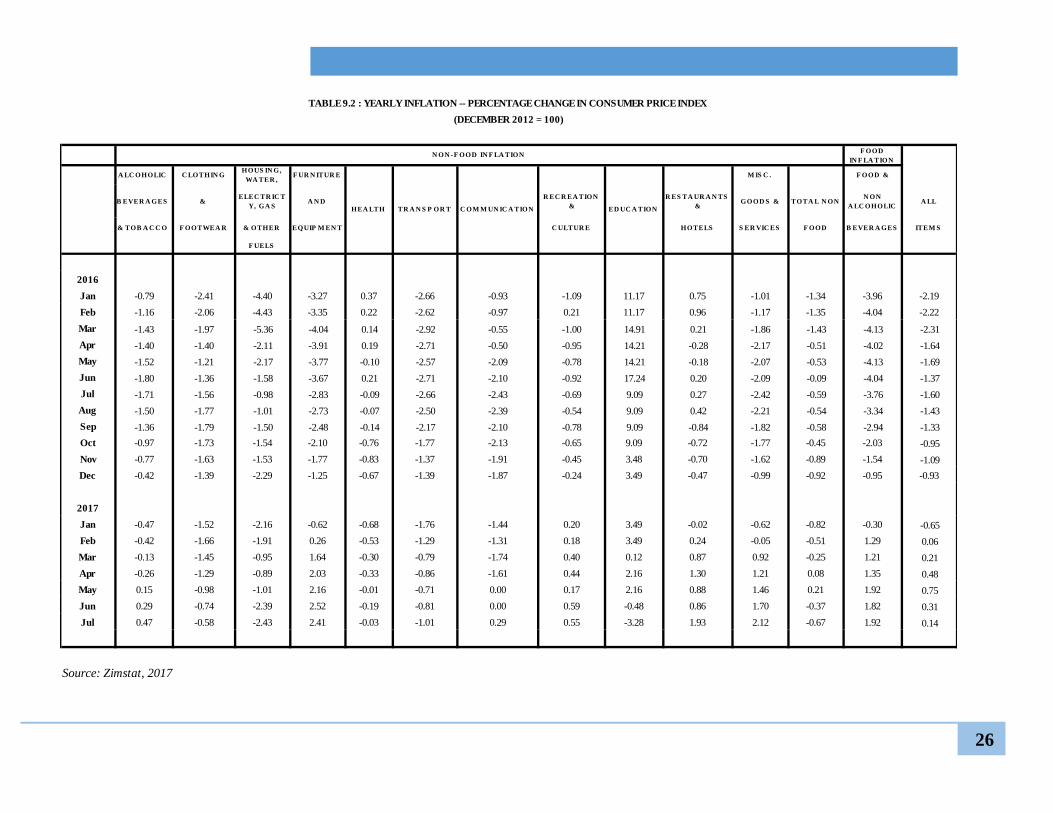
9.2 Yearly Inflation 26
External Statistics
10. Total External Debt Outstanding by Debtor 27
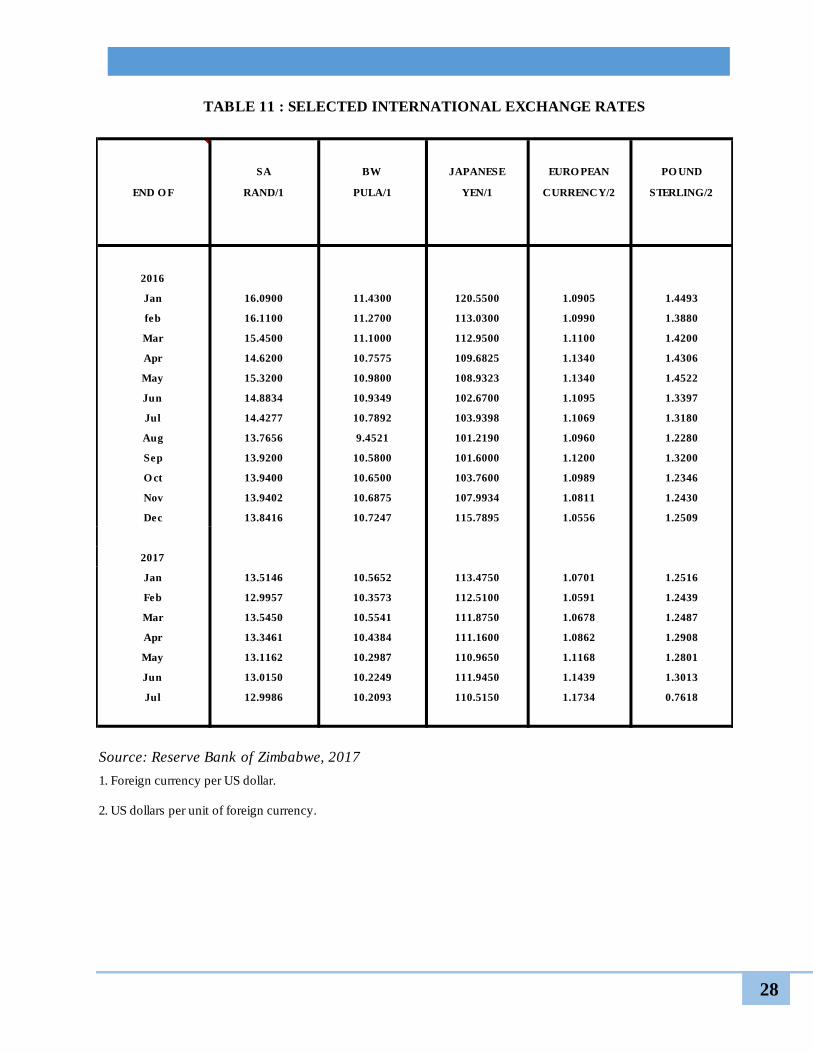
11. Exchange Rates 28

11
12. Zimbabwe Stock Exchange Statistics 29
13. National Payments System Statistics
13.1 Values of Transactions 30
13.2 Volumes of Transactions 31
14. Merchandise Trade Statistics 32

12
Jul-16 Aug-16 Sep-16 Oct-16 Nov-16 Dec-16 Jan-17 Feb-17 Mar-17 Apr-17 May-17 Jun-17 Jul-17
Net Foreign Assets -393,113.03 -371,494.66 -365,714.85 -564,842.79 -636,688.80 -555,620.67 -584,011.92 -574,374.12 -559,959.05 -513,244.32 -567,873.40 -574,972.81 -626,057.81
Central Bank(net) -379,979.17 -390,409.11 -383,854.74 -545,842.19 -591,305.32 -573,721.83 -583,214.44 -588,800.77 -585,362.68 -597,983.99 -624,117.95 -572,451.17 -673,008.44
Foreign Assets 383,799.11 354,937.59 343,840.92 416,996.33 364,866.78 410,827.76 449,211.75 445,565.06 419,948.30 406,334.53 380,372.91 414,622.73 379,556.86
Foreign Liabilities -763,778.28 -745,346.70 -727,695.66 -962,838.52 -956,172.09 -984,549.60 -1,032,426.19 -1,034,365.82 -1,005,310.99 -1,004,318.51 -1,004,490.86 -987,073.90 -1,052,565.30
Other Depository Corporations(net) -13,133.86 18,914.44 18,139.89 -19,000.60 -45,383.48 18,101.16 -797.49 14,426.64 25,403.64 84,739.67 56,244.55 -2,521.64 46,950.63
Foreign Assets 283,718.30 309,754.41 295,146.25 278,185.36 244,421.21 297,836.79 270,935.31 290,763.66 275,104.70 338,839.86 302,736.47 260,090.51 212,254.02
Foreign Liabilities -296,852.16 -290,839.97 -277,006.36 -297,185.96 -289,804.69 -279,735.63 -271,732.80 -276,337.02 -249,701.07 -254,100.19 -246,491.92 -262,612.14 -165,303.39
Net Domestic Assets (NDA) 5,457,438.42 5,552,228.17 5,642,801.47 5,877,742.21 6,056,699.56 6,193,901.69 6,247,448.43 6,346,016.00 6,439,892.69 6,630,026.96 6,768,155.75 7,066,644.43 7,190,083.71
Domestic Claims 6,895,453.88 6,978,485.30 7,059,099.99 7,180,307.48 7,554,069.08 7,669,496.22 7,645,349.84 7,784,284.88 7,922,221.15 8,181,305.42 8,453,437.89 8,775,537.48 8,910,298.85
Claims on Central Government(net) 3,134,575.48 3,227,067.12 3,299,875.31 3,381,436.05 3,679,166.52 3,747,719.59 3,862,282.83 4,003,963.78 4,034,942.83 4,316,258.18 4,466,829.20 4,729,355.59 4,885,665.81
Claims on Central Government 3,267,213.20 3,373,077.05 3,445,300.69 3,516,314.57 3,824,753.66 3,908,493.46 3,941,069.39 4,084,363.34 4,147,553.19 4,414,769.52 4,564,175.79 4,843,590.52 5,004,270.42
Central Bank 1,790,569.21 1,929,962.12 1,954,616.32 1,970,042.75 2,306,454.54 2,337,460.53 2,270,648.89 2,355,433.48 2,337,736.94 2,444,902.59 2,578,541.58 2,781,509.70 2,976,316.77
ODCs 1,476,643.99 1,443,114.93 1,490,684.38 1,546,271.82 1,518,299.12 1,571,032.92 1,670,420.50 1,728,929.86 1,809,816.25 1,969,866.92 1,985,634.21 2,062,080.82 2,027,953.65
Less Liabilities to Central Government -132,637.72 -146,009.93 -145,425.39 -134,878.53 -145,587.14 -160,773.86 -78,786.57 -80,399.57 -112,610.37 -98,511.34 -97,346.59 -114,234.93 -118,604.61
Claims on Other Sectors 3,760,878.40 3,751,418.18 3,759,224.68 3,798,871.43 3,874,902.55 3,921,776.63 3,783,067.01 3,780,321.10 3,887,278.32 3,865,047.24 3,986,608.69 4,046,181.88 4,024,633.04
Other Financial Corporations 134,294.30 130,939.44 132,282.45 124,852.98 128,782.67 119,157.29 117,123.94 79,035.53 80,256.74 82,515.74 96,671.25 150,004.30 98,954.02
State and Local Government 48,803.79 47,676.40 43,554.41 41,728.47 37,784.82 34,237.41 35,909.11 35,006.53 34,312.18 34,732.93 36,595.52 35,573.02 34,059.17
Public Non Financial Corporations 257,749.06 257,736.50 234,348.95 248,965.26 244,277.53 240,007.21 246,102.41 274,898.12 268,976.36 302,761.14 334,495.68 337,668.92 400,050.10
Private Sector 3,320,031.24 3,315,065.84 3,349,038.87 3,383,324.72 3,464,057.53 3,528,374.72 3,383,931.55 3,391,380.92 3,503,733.03 3,445,037.42 3,518,846.25 3,522,935.65 3,491,569.75
Central Bank 29,223.55 25,871.86 28,360.51 28,496.47 28,190.50 31,268.19 28,547.39 34,327.69 34,209.32 31,152.87 32,571.62 33,352.46 34,125.26
ODCs 3,290,807.69 3,289,193.98 3,320,678.35 3,354,828.25 3,435,867.03 3,497,106.53 3,355,384.15 3,357,053.23 3,469,523.72 3,413,884.55 3,486,274.63 3,489,583.19 3,457,444.48
Other Items(Net) 1,438,015.46 1,426,257.14 1,416,298.52 1,302,565.27 1,497,369.51 1,475,594.53 1,397,901.41 1,438,268.87 1,482,328.45 1,551,278.46 1,685,282.14 1,708,893.05 1,720,215.14
Shares and Other Equity 832,720.12 846,025.31 887,795.24 915,505.55 935,291.08 1,470,571.26 1,471,378.30 1,481,807.04 1,505,125.81 1,501,542.86 1,530,318.89 1,547,498.82 1,546,591.56
Liabilities to Other Financial Corporations 49,419.92 44,517.02 39,463.26 31,567.03 32,045.66 52,038.47 44,373.98 46,621.66 45,153.65 45,155.62 45,511.27 49,869.95 38,847.96
Restricted Deposits 149,999.92 149,845.80 153,471.12 166,495.73 180,899.67 60,499.79 66,478.53 66,737.97 67,789.29 68,133.12 84,939.87 84,617.96 84,477.31
Other Items(net) 405,875.51 385,869.01 335,568.90 188,996.96 349,133.11 -107,514.99 -184,329.41 -156,897.79 -135,740.30 -63,553.13 24,512.12 26,906.32 50,298.31
Broad Money-M3 5,064,325.38 5,180,733.50 5,277,086.62 5,312,899.41 5,420,010.76 5,638,281.02 5,663,436.51 5,771,641.88 5,879,933.65 6,116,782.64 6,200,282.35 6,491,671.62 6,564,025.89
Securities Other than Shares Included in Broad Money 71,791.03 80,840.29 74,118.29 73,356.67 43,862.17 62,894.35 50,562.02 59,329.24 60,161.15 63,292.20 61,392.93 65,667.46 66,282.58
Broad Money-M2 4,992,534.36 5,099,893.22 5,202,968.33 5,239,542.75 5,376,148.60 5,575,386.66 5,612,874.49 5,712,312.64 5,819,772.50 6,053,490.44 6,138,889.42 6,426,004.16 6,497,743.31
Other Deposits 1,517,709.33 1,553,347.70 1,534,910.45 1,508,943.19 1,467,582.00 1,471,657.19 1,544,945.66 1,552,644.56 1,529,856.98 1,530,705.58 1,558,418.08 1,538,865.52 1,600,104.76
Narrow Money-M1 3,474,825.02 3,546,545.52 3,668,057.88 3,730,599.56 3,908,566.59 4,103,729.48 4,067,928.83 4,159,668.08 4,289,915.52 4,522,784.87 4,580,471.34 4,887,138.64 4,897,638.55
Transferable Deposits 3,466,614.21 3,537,772.31 3,658,634.63 3,720,917.62 3,889,717.47 4,033,558.66 3,985,443.09 4,046,287.46 4,147,742.43 4,369,406.07 4,404,701.40 4,690,977.34 4,696,301.61
Currency Outside Depository Corporations 8,210.82 8,773.21 9,423.25 9,681.93 18,849.12 70,170.81 82,485.74 113,380.62 142,173.09 153,378.80 175,769.94 196,161.30 201,336.94
Source:Reserve Bank of Zimbabwe,2017
Note:
(i) Depository corporations survey - formerly Monetary Survey.
(ii) Broad money redefined using IMF's Monetary and Financial Statistics Manual of 2000. Major changes include exclusion of Government deposits held by banks from broad money.
(iii) Transferable deposits made up of demand and savings deposits.
(iv) NCDs are also referred to as securities included in broad money.
(v) All classes of time deposits, short and long term are classified as time deposits, which are also termed other deposits.
(vi) Credit to the private sector now excludes claims on other financial corporations, as well as claims on state and local government (local authorities)
(vii) Depository corporations made up of the Central Bank and other depository corporations
(viii) Other depository corporations (ODCs) - Commercial banks, merchant banks, building societies and POSB.
TABLE 1: DEPOSITORY CORPORATIONS SURVEY (US$ '000)
13
Jul-16 Aug-16 Sep-16 Oct-16 Nov-16 Dec-16 Jan-17 Feb-17 Mar-17 Apr-17 May-17 Jun-17 Jul-17
Net Foreign Assets -379,979.17 -390,409.11 -383,854.74 -545,842.19 -591,305.32 -573,721.83 -583,214.44 -588,800.77 -585,362.68 -597,983.99 -624,117.95 -572,451.17 -673,008.44
Claims on Non Residents 383,799.11 354,937.59 343,840.92 416,996.33 364,866.78 410,827.76 449,211.75 445,565.06 419,948.30 406,334.53 380,372.91 414,622.73 379,556.86
Official Reserves Assets 285,543.05 255,805.98 244,677.43 316,461.39 266,511.75 309,331.78 350,427.48 346,696.05 320,526.53 306,195.43 280,743.61 311,434.24 216,563.03
Other Foreign Assets 98,256.06 99,131.61 99,163.49 100,534.95 98,355.02 101,495.99 98,784.27 98,869.01 99,421.78 100,139.10 99,629.30 103,188.49 162,993.84
Less Liabilities to Non Residents 763,778.28 745,346.70 727,695.66 962,838.52 956,172.09 984,549.60 1,032,426.19 1,034,365.82 1,005,310.99 1,004,318.51 1,004,490.86 987,073.90 1,052,565.30
Short Term Liabilities 349,757.38 351,510.63 331,152.07 482,116.69 481,842.04 515,365.90 558,302.10 560,678.78 528,171.18 523,978.67 523,548.11 502,610.47 563,024.67
Other Foreign Liabilities 414,020.90 393,836.06 396,543.59 480,721.84 474,330.06 469,183.69 474,124.08 473,687.04 477,139.81 480,339.84 480,942.76 484,463.43 489,540.63
Net Domestic Assets (NDA) 1,431,538.49 1,528,966.57 1,582,075.13 1,651,349.30 1,910,944.27 2,046,457.01 2,082,987.44 2,193,388.18 2,189,787.86 2,257,730.24 2,349,466.00 2,521,330.28 2,737,213.38
Domestic Claims 1,909,144.81 2,028,462.52 2,036,657.48 2,070,285.42 2,396,766.46 2,420,011.99 2,449,800.81 2,551,097.25 2,545,403.08 2,683,243.81 2,852,123.09 3,029,056.93 3,245,422.59
Net Claims on Central Government 1,708,832.27 1,830,889.20 1,852,931.02 1,878,215.64 2,207,020.45 2,218,852.08 2,244,839.79 2,330,293.56 2,312,027.68 2,422,539.02 2,556,298.97 2,740,989.57 2,935,771.58
Claims on Central Government 1,790,569.21 1,929,962.12 1,954,616.32 1,970,042.75 2,306,454.54 2,337,460.53 2,270,562.63 2,355,433.48 2,337,736.94 2,444,816.34 2,578,541.58 2,781,509.70 2,976,316.77
Of which: Securities Other than Shares 279,010.40 283,933.50 260,822.30 259,945.20 250,270.16 566,328.08 577,431.69 562,535.65 551,741.20 533,407.34 537,150.63 620,541.15 640,269.72
Less Liabilities to Central Government 81,736.94 99,072.93 101,685.30 91,827.11 99,434.09 118,608.45 25,722.84 25,139.92 25,709.26 22,277.32 22,242.61 338,860.92 40,545.19
Of which: Deposits 81,736.94 99,072.93 101,685.30 91,827.11 99,434.09 118,608.45 25,722.84 25,139.92 25,709.26 22,277.32 22,242.61 40,520.14 40,545.19
Claims on Other Sectors 200,312.54 197,573.32 183,726.46 192,069.78 189,746.01 201,159.91 206,874.76 243,242.69 235,375.40 262,618.54 297,824.11 290,067.36 309,651.01
Other Financial Corporations 14,072.39 14,485.45 14,842.27 18,107.69 18,890.01 16,515.86 16,900.44 18,434.72 18,570.34 18,972.27 19,413.25 17,924.43 18,367.00
State and Local Government 0.00 0.00 0.00 0.00 0.00 0.00 0.00 0.00 0.00 0.00 0.00 0.00 0.00
Public Non Financial Corporations 157,016.59 157,216.02 140,523.67 145,465.62 142,665.50 153,375.86 161,426.93 190,480.28 182,595.75 212,493.40 245,839.24 238,790.47 257,158.75
Private Sector 29,223.55 25,871.86 28,360.51 28,496.47 28,190.50 31,268.19 28,547.39 34,327.69 34,209.32 31,152.87 32,571.62 33,352.46 34,125.26
Claims on Other Depository Corporations 224,948.10 203,523.49 199,637.85 145,431.17 164,922.74 140,331.70 110,720.51 93,514.18 104,865.33 85,479.27 50,810.90 52,540.42 43,316.48
Other Liabilities to ODCs 276,345.66 277,697.37 277,611.11 278,881.87 280,278.62 268,568.70 269,925.53 255,446.41 242,394.50 294,200.81 305,898.38 307,589.96 309,366.61
Other Items(Net) 426,208.76 425,322.07 376,609.09 285,485.42 370,466.32 245,317.99 209,608.36 218,215.84 220,086.04 218,792.03 249,569.60 254,677.12 242,159.08
Monetary Base Incl. foreign currency clearing
balances
Monetary Base 1,051,559.320 1,138,557.468 1,198,220.393 1,105,507.110 1,319,638.956 1,472,735.173 1,499,773.004 1,604,587.411 1,604,425.179 1,659,746.254 1,725,348.049 1,948,879.104 2,064,204.942
Bond Coins 9,831.185 10,353.400 11,050.358 11,102.753 13,404.374 13,783.332 13,852.694 13,845.125 20,385.149 23,268.864 25,819.605 27,667.474 28,763.070
Bond Notes 0.000 0.000 0.000 0.000 10,009.774 72,950.552 88,839.102 118,836.703 134,347.604 140,801.342 163,388.941 175,855.752 179,722.240
Liabilities to ODCs 1,032,687.846 1,123,924.446 1,183,078.547 1,093,687.178 1,292,654.095 1,385,011.220 1,395,502.072 1,467,941.594 1,446,635.592 1,492,786.162 1,520,837.740 1,728,301.189 1,838,460.100
Reserve Deposits 0.000 0.000 0.000 0.000 0.000 0.000 0.000 0.000 0.000 0.000 0.000 0.000 0.000
Other 1,032,687.846 1,123,924.446 1,183,078.547 1,093,687.178 1,292,654.095 1,385,011.220 1,395,502.072 1,467,941.594 1,446,635.592 1,492,786.162 1,520,837.740 1,728,301.189 1,838,460.100
Private Deposits 9,040.289 4,279.622 4,091.489 717.178 3,570.712 990.069 1,579.135 3,963.989 3,056.833 2,889.886 15,301.762 17,054.689 17,259.532
Source:Reserve Bank of Zimbabwe,2017
TABLE 2: CENTRAL BANK SURVEY (US$'000)
14
Jul-16 Aug-16 Sep-16 Oct-16 Nov-16 Dec-16 Jan-17 Feb-17 Mar-17 Apr-17 May-17 Jun-17 Jul-17
Net Foreign Assets -13,133.86 18,914.44 18,139.89 -19,000.60 -45,383.48 18,101.16 -797.49 14,426.64 25,403.64 84,739.67 56,244.55 -2,521.64 46,950.63
Claims on Non Residents 283,718.30 309,754.41 295,146.25 278,185.36 244,421.21 297,836.79 270,935.31 290,763.66 275,104.70 338,839.86 302,736.47 260,090.51 212,254.02
Of Which: Foreign Currency 111,032.19 148,463.11 96,321.10 88,598.31 76,252.73 107,687.14 110,979.79 96,836.03 66,426.17 67,822.05 56,944.26 57,084.55 45,185.40
Deposits 172,433.28 161,037.37 198,569.69 189,337.46 167,926.29 189,886.91 159,688.03 193,663.57 208,412.27 270,746.20 245,512.83 202,703.19 166,729.03
Other 252.83 253.93 255.46 249.59 242.19 262.74 267.49 264.07 266.26 271.61 279.38 302.77 339.60
Less Liabilities to Non Residents 296,852.16 290,839.97 277,006.36 297,185.96 289,804.69 279,735.63 271,732.80 276,337.02 249,701.07 254,100.19 246,491.92 262,612.14 165,303.39
Of Which: Deposits 150,944.72 146,501.12 142,949.55 146,422.62 136,426.63 142,073.73 137,945.79 135,779.65 117,026.45 126,179.95 120,578.30 119,073.63 54,731.95
Loans 145,907.44 144,338.85 134,056.82 150,763.34 153,378.06 137,661.90 133,787.01 140,557.37 132,674.61 127,920.24 125,913.62 143,538.51 110,571.44
Other 0.00 0.00 0.00 0.00 0.00 0.00 0.00 0.00 0.00 0.00 0.00 0.00 0.00
Net Domestic Assets (NDA) 5,060,208.14 5,148,766.23 5,245,432.00 5,321,500.90 5,442,974.41 5,549,018.98 5,580,169.12 5,639,870.63 5,709,300.08 5,875,774.29 5,952,966.10 6,280,977.27 6,298,478.80
Domestic Claims 4,986,309.07 4,950,022.79 5,022,442.51 5,110,022.06 5,157,302.61 5,249,484.24 5,193,549.03 5,210,748.62 5,374,818.07 5,496,061.61 5,599,314.81 5,744,480.55 5,664,876.26
Net Claims on Central Government 1,425,743.21 1,396,177.93 1,446,944.29 1,503,220.41 1,472,146.07 1,528,867.51 1,617,356.78 1,673,670.22 1,722,915.15 1,893,632.91 1,910,530.23 1,988,366.03 1,949,894.23
Claims on Central Government 1,476,643.9874 1,443,114.9290 1,490,684.3763 1,546,271.8214 1,518,299.1187 1,571,032.9250 1,670,420.5050 1,728,929.8577 1,809,816.2513 1,969,866.9249 1,985,634.2076 2,062,080.8211 2,027,953.6484
Securities 1,450,083.5207 1,420,220.1988 1,463,404.5297 1,517,535.6764 1,500,671.4257 1,553,239.1020 1,654,534.6290 1,713,961.3077 1,794,113.0553 1,954,045.2049 1,968,887.3446 2,014,158.1741 1,982,771.1424
Loans 26,560.4666 22,894.7303 27,279.8466 28,736.1450 17,627.6930 17,793.8230 15,885.8760 14,968.5500 15,703.1960 15,821.7200 16,746.8630 47,922.6470 45,182.5060
Other - - (0.0000) - (0.0000) 0.0000 (0.0000) 0.0000 - (0.00) (0.00) (0.00) -
Less Liabilities to Central Government (50,900.7775) (46,937.0009) (43,740.0913) (43,051.4118) (46,153.0502) (42,165.4109) (53,063.7244) (55,259.6416) (86,901.1009) (76,234.0149) (75,103.9806) (73,714.7955) (78,059.4171)
Claims on Other Sectors 3,560,565.8611 3,553,844.8587 3,575,498.2216 3,606,801.6478 3,685,156.5434 3,720,616.7211 3,576,192.2507 3,537,078.4083 3,651,902.92 3,602,428.70 3,688,784.58 3,756,114.52 3,714,982.03
Other Financial Corporations 120,221.91 116,453.99 117,440.18 106,745.29 109,892.67 102,641.44 100,223.50 60,600.81 61,686.40 63,543.47 77,258.00 132,079.86 80,587.02
State and Local Government 48,803.79 47,676.40 43,554.41 41,728.47 37,784.82 34,237.41 35,909.11 35,006.53 34,312.18 34,732.93 36,595.52 35,573.02 34,059.17
Public Non Financial Corporations 100,732.47 100,520.49 93,825.28 103,499.64 101,612.03 86,631.35 84,675.48 84,417.84 86,380.62 90,267.74 88,656.44 98,878.45 142,891.35
Private Sector 3,290,807.69 3,289,193.98 3,320,678.35 3,354,828.25 3,435,867.03 3,497,106.53 3,355,384.15 3,357,053.23 3,469,523.72 3,413,884.55 3,486,274.63 3,489,583.19 3,457,444.48
Claims on the Central Bank 1,055,340.530 1,178,684.455 1,209,909.110 1,156,606.119 1,323,120.314 1,435,556.219 1,475,197.651 1,507,778.322 1,498,477.568 1,505,940.672 1,505,814.461 1,682,269.779 1,814,568.562
Bond Notes and Coins 1,620.368 1,580.191 1,627.106 1,420.818 4,565.027 16,563.071 20,206.055 19,301.209 12,559.660 10,691.409 13,438.609 7,361.926 7,148.374
Reserves 1,053,720.162 1,177,104.264 1,208,282.003 1,155,185.301 1,318,555.287 1,418,993.147 1,454,991.597 1,488,477.113 1,485,917.908 1,495,249.263 1,492,375.852 1,674,907.853 1,807,420.188
Liabilities to the Central Bank 2.585 0.242 0.723 0.106 0.219 1750.127 0.244 1.8 1752.651 3.143 0.771 0.694 0
Other Items(Net) 981,438.87 979,940.77 986,918.90 945,127.17 1,037,448.30 1,134,271.35 1,088,577.32 1,078,654.52 1,162,242.90 1,126,224.85 1,152,162.40 1,145,772.36 1,180,966.02
Shares and Other Equity 1,174,877.57 1,188,635.39 1,194,352.25 1,211,644.10 1,228,902.77 1,271,826.05 1,272,987.21 1,279,285.69 1,301,867.36 1,295,023.50 1,310,286.87 1,325,276.01 1,330,874.62
Liabilities to other financial corporations 46,151.88 41,248.99 36,195.23 28,299.00 28,777.63 48,770.44 41,105.95 43,353.63 41,885.62 41,887.59 42,243.24 46,601.91 35,579.93
Other Items(Net) (239,590.58) (249,943.61) (243,628.59) (294,815.93) (220,232.10) (186,325.14) (225,515.85) (243,984.80) (181,510.08) (210,686.24) (200,367.71) (226,105.56) (185,488.52)
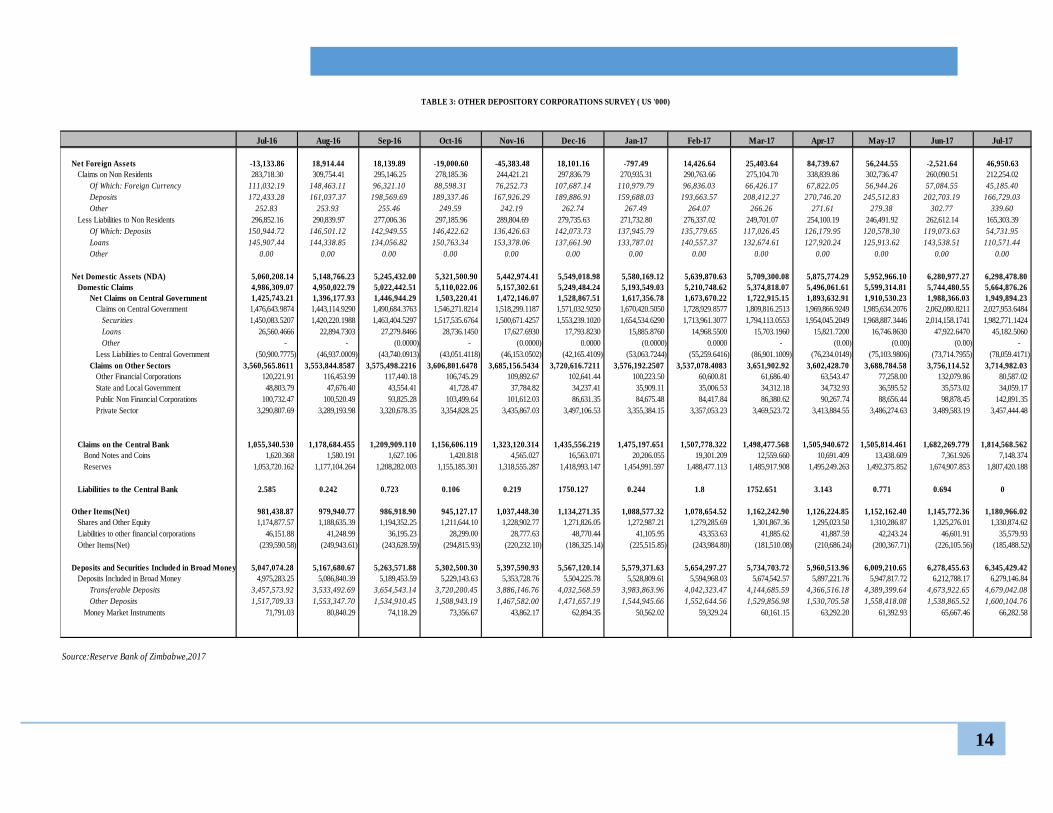
Deposits and Securities Included in Broad Money 5,047,074.28 5,167,680.67 5,263,571.88 5,302,500.30 5,397,590.93 5,567,120.14 5,579,371.63 5,654,297.27 5,734,703.72 5,960,513.96 6,009,210.65 6,278,455.63 6,345,429.42
Deposits Included in Broad Money 4,975,283.25 5,086,840.39 5,189,453.59 5,229,143.63 5,353,728.76 5,504,225.78 5,528,809.61 5,594,968.03 5,674,542.57 5,897,221.76 5,947,817.72 6,212,788.17 6,279,146.84
Transferable Deposits 3,457,573.92 3,533,492.69 3,654,543.14 3,720,200.45 3,886,146.76 4,032,568.59 3,983,863.96 4,042,323.47 4,144,685.59 4,366,516.18 4,389,399.64 4,673,922.65 4,679,042.08
Other Deposits 1,517,709.33 1,553,347.70 1,534,910.45 1,508,943.19 1,467,582.00 1,471,657.19 1,544,945.66 1,552,644.56 1,529,856.98 1,530,705.58 1,558,418.08 1,538,865.52 1,600,104.76
Money Market Instruments 71,791.03 80,840.29 74,118.29 73,356.67 43,862.17 62,894.35 50,562.02 59,329.24 60,161.15 63,292.20 61,392.93 65,667.46 66,282.58
Source:Reserve Bank of Zimbabwe,2017
TABLE 3: OTHER DEPOSITORY CORPORATIONS SURVEY ( US '000)

15
Foreign TOTAL
End of Notes
Bond & Balances Balances with Balances Other Claims
Notes & Coin with Other Depository with on Government1
Local Governemt Public Enterprises Other2
Government Local Public Other Institutional Units3
Other cliams Contigent Assets Other Assets Non Financial
Coins RBZ Corporations Foreign Banks Non-residents Securities securities Government Enterprises Assets
2016
Jan 1.22 193.28 734.58 294.53 116.1 25.0 1,147.0 28.8 5.2 19.1 28.5 15.6 63.6 3,547.4 110.2 582.8 412.8 545.1 7,870.8
Feb 1.44 160.35 763.47 287.06 102.8 25.0 1,228.9 29.2 5.2 19.0 25.0 15.8 61.1 3,472.0 100.5 477.1 427.3 547.6 7,748.9
Mar 1.53 179.00 809.22 286.42 148.6 25.0 1,225.0 28.5 5.1 16.4 22.6 14.2 103.9 3,510.6 59.3 471.0 428.0 552.9 7,887.2
Apr 1.55 146.02 818.74 323.00 111.8 25.0 1,322.7 27.6 5.1 15.8 25.1 15.0 102.4 3,453.7 66.7 413.7 445.5 552.2 7,871.5
May 1.53 100.12 973.06 281.55 91.0 25.0 1,354.1 26.8 5.0 16.6 12.3 14.7 101.1 3,433.4 61.0 397.0 440.2 564.1 7,898.5
Jun 1.61 124.61 1,015.85 287.98 128.5 25.0 1,412.9 25.9 0.0 16.4 28.1 14.6 98.9 3,414.9 66.9 407.7 431.5 578.8 8,080.1
Jul 1.62 111.03 1,053.72 242.57 147.4 25.0 1,450.1 33.4 0.0 16.2 26.6 15.4 100.7 3,320.9 74.2 393.1 416.7 592.4 8,021.1
Aug 1.58 148.46 1,177.10 235.02 136.0 25.0 1,420.2 32.3 0.0 11.3 22.9 15.4 100.5 3,326.8 67.8 390.2 445.0 598.3 8,153.9
Sep 1.63 96.32 1,208.28 310.75 173.6 25.0 1,463.4 29.0 5.4 3.2 27.3 14.5 88.4 3,349.0 86.1 382.3 448.6 606.6 8,319.5
Oct 1.42 88.60 1,155.19 322.05 162.3 27.0 1,517.5 26.3 15.4 3.9 28.7 15.5 88.1 3,389.7 68.2 397.2 427.7 609.0 8,343.8
Nov 4.57 76.25 1,318.56 318.52 140.9 27.0 1,500.7 22.3 15.5 4.6 17.6 15.4 86.1 3,469.5 71.9 350.5 419.0 618.2 8,477.2
Dec 16.56 107.69 1,418.99 378.23 162.9 27.0 1,553.2 21.0 15.3 4.9 17.8 13.2 71.3 3,265.0 330.1 376.7 408.8 626.0 8,814.8
2017
Jan 20.21 110.98 1,454.99 239.82 132.7 27.0 1,654.5 20.8 15.4 3.6 15.9 15.1 69.2 3,394.7 57.5 395.7 383.4 630.4 8,642.1
Feb 19.30 96.84 1,488.48 251.83 145.1 48.6 1,714.0 20.1 15.5 3.2 15.0 14.9 68.9 3,177.9 236.8 398.5 400.0 631.1 8,746.0
Mar 12.56 66.43 1,485.92 260.51 154.9 53.5 1,794.1 18.7 15.7 3.8 15.7 15.7 70.7 3,460.5 67.2 422.4 442.5 635.1 8,995.8
Apr 10.69 67.82 1,495.25 249.41 219.3 51.4 1,954.0 17.8 15.8 3.6 15.8 16.9 74.5 3,449.5 24.6 489.1 398.8 644.6 9,199.0
May 13.44 56.94 1,492.38 272.47 170.2 75.3 1,968.9 20.3 15.7 33.6 16.7 16.3 72.9 3,447.8 82.4 486.1 421.7 644.4 9,307.6
Jun 7.36 57.08 1,674.91 350.26 92.1 110.6 2,014.2 19.0 16.0 35.0 47.9 16.5 82.9 3,494.3 92.8 533.5 408.9 649.6 9,702.8
Jul 7.15 45.19 1,807.42 302.34 63.1 103.6 1,982.8 17.2 26.1 34.4 45.2 16.9 116.8 3,417.1 86.8 513.6 432.9 635.8 9,654.3
Source:Reserve Bank of Zimbabwe,2017
Notes
1.Government securities includes treasuary bills and bonds
2.Includes bankers acceptances, discounted bills and negotiable certificates of deposits.
3.Includes households, other financial corporations,
TABLE 4.1: - OTHER DEPOSITORY CORPORATIONS -ASSETS
US$ millions
Debt Securities Loans and Advances

16
Debt Securities Foreign Liabilities Capital Contigent Other TOTAL
and Liablities Liablities
End of Demand Savings Time Deposits Total Deposits Other Depository Government Total RBZ Other Depository Other Finacial Reserves
from the public Corporations Corporations Corporations
2016
Jan 2,487.3 650.3 1,536.5 4,674.2 388.1 26.4 5,088.7 44.9 356.5 0.0 125.0 86.0 1,189.0 582.8 397.8 7,870.76
Feb 2,466.2 669.7 1,552.9 4,688.8 375.0 20.4 5,084.1 50.3 341.1 0.0 171.7 36.4 1,196.7 477.1 391.3 7,748.89
Mar 2,566.3 676.8 1,592.4 4,835.5 371.0 16.9 5,223.5 55.6 340.1 0.0 181.1 37.3 1,185.3 471.0 393.5 7,887.24
Apr 2,629.9 695.1 1,568.6 4,893.7 332.4 18.5 5,244.6 80.1 322.6 0.0 194.0 36.9 1,188.4 413.7 391.2 7,871.55
May 2,698.3 690.6 1,559.5 4,948.4 309.8 19.5 5,277.7 71.6 336.1 0.0 143.5 36.8 1,238.7 397.0 397.2 7,898.54
Jun 2,792.4 660.9 1,569.2 5,022.5 401.4 25.6 5,449.5 81.0 307.7 0.0 159.4 47.4 1,243.5 407.7 384.0 8,080.12
Jul 2,734.8 722.9 1,517.7 4,975.5 435.1 50.9 5,461.5 71.8 296.6 0.0 129.6 46.2 1,256.6 393.1 365.6 8,021.06
Aug 2,894.5 639.2 1,553.3 5,087.1 412.3 46.9 5,546.3 80.8 290.6 0.0 127.6 41.2 1,271.0 390.2 406.1 8,153.92
Sep 2,974.8 679.9 1,534.9 5,189.6 479.7 43.7 5,713.0 74.1 276.8 0.0 151.7 36.2 1,276.8 382.3 408.4 8,319.46
Oct 3,115.2 605.1 1,508.9 5,229.3 433.8 43.1 5,706.1 73.4 297.0 0.0 162.4 28.3 1,293.5 397.2 385.9 8,343.79
Nov 3,245.5 640.8 1,467.6 5,353.9 471.9 46.2 5,872.0 43.9 289.7 0.0 142.2 28.8 1,313.4 350.5 436.9 8,477.19
Dec 3,329.8 702.9 1,471.7 5,504.4 510.9 42.2 6,057.4 62.9 279.6 1.8 191.5 48.8 1,384.1 376.7 412.1 8,814.81
2017
Jan 3,263.8 720.5 1,544.9 5,529.3 429.8 53.1 6,012.2 50.6 271.2 0.0 104.5 41.1 1,360.2 395.7 406.6 8,642.14
Feb 3,325.9 722.0 1,552.6 5,600.5 426.0 55.3 6,081.7 59.3 270.8 0.0 126.1 43.4 1,365.8 398.5 400.4 8,746.02
Mar 3,429.2 715.7 1,529.9 5,674.7 461.0 86.9 6,222.6 60.2 249.6 1.8 134.9 41.9 1,426.8 422.4 435.7 8,995.81
Apr 3,555.8 813.7 1,530.7 5,900.2 450.9 76.2 6,427.3 63.3 251.1 0.0 117.4 41.9 1,382.2 489.1 426.7 9,199.00
May 3,593.7 798.7 1,558.4 5,950.8 454.6 75.1 6,480.5 61.4 243.5 0.0 95.2 42.2 1,448.6 486.1 450.1 9,307.64
Jun 3,851.4 825.6 1,538.9 6,215.9 497.6 73.7 6,787.2 65.7 259.5 0.0 108.9 46.6 1,455.9 533.5 445.6 9,702.82
Jul 3,845.0 837.2 1,600.1 6,282.3 503.0 78.1 6,863.3 66.3 162.2 0.0 99.5 35.6 1,463.2 513.6 450.7 9,654.29
Source:Reserve Bank of Zimbabwe,2017
TABLE 4.1 : OTHER DEPOSITORY CORPORATIONS - LIABILITIES
Deposits Amounts Owing to
US$millions
17
TOTAL
End of Foreign
Bond Notes Balances Balances with Balances Other Claims Local Public Other Contigent Non Financial
Notes & & with Other Depository with on Government1
Local Governemt Public Enterprises Other2
Government Government Enterprises Institutional Units3
Other claims Assets Other Assets Assets
Coins Coin RBZ Corporations Foreign Banks Non-residents Securities securities
2016
Jan 1.05 171.98 667.53 119.20 105.6 25.0 1,039.4 0.0 5.2 19.1 28.5 15.6 62.6 2,703.9 61.5 582.8 278.8 396.6 6,284.4
Feb 1.21 140.75 702.19 96.28 93.1 25.0 1,128.1 0.0 5.2 19.0 25.0 15.8 60.1 2,615.0 62.1 477.1 292.8 399.3 6,158.2
Mar 1.31 161.90 734.53 96.34 131.7 25.0 1,143.3 0.0 5.1 16.4 22.6 14.2 102.9 2,618.9 62.6 471.0 298.0 405.1 6,311.1
Apr 1.35 135.51 778.19 135.47 108.3 25.0 1,200.9 0.0 5.1 15.8 25.1 15.0 101.5 2,573.6 69.6 413.7 309.7 404.7 6,318.6
May 1.38 89.57 891.44 130.52 85.3 25.0 1,229.5 0.0 5.0 16.6 12.3 14.7 100.1 2,534.2 64.0 397.0 302.2 413.8 6,312.8
Jun 1.42 108.53 934.42 84.65 123.2 25.0 1,279.0 0.0 0.0 16.4 28.1 14.6 97.9 2,523.7 64.1 407.7 299.0 431.6 6,439.3
Jul 1.45 101.74 977.63 79.50 141.3 25.0 1,316.9 0.0 0.0 16.2 26.6 15.4 99.7 2,414.7 65.7 393.1 284.0 440.7 6,399.6
Aug 1.36 140.23 1,074.47 97.53 131.9 25.0 1,297.4 0.0 0.0 11.3 22.9 15.4 99.5 2,414.8 67.3 390.2 313.6 447.3 6,550.2
Sep 1.40 91.63 1,122.67 143.91 169.6 25.0 1,331.9 0.0 5.4 3.2 27.3 14.5 87.3 2,451.9 71.4 382.3 317.3 455.9 6,702.6
Oct 1.27 81.03 1,090.44 130.20 155.1 27.0 1,376.2 0.0 15.4 3.9 28.7 15.5 87.1 2,472.1 66.0 397.2 293.2 458.2 6,698.6
Nov 4.24 69.45 1,242.12 103.17 136.3 27.0 1,349.8 0.0 15.5 4.6 17.6 15.4 85.2 2,511.0 68.5 350.5 285.6 466.2 6,752.2
Dec 14.07 98.95 1,306.91 134.35 156.7 27.0 1,416.0 0.0 15.3 4.9 17.8 13.2 70.4 2,380.1 273.8 376.7 274.2 473.4 7,053.8
2017
Jan 17.72 103.75 1,322.38 81.89 128.2 27.0 1,485.0 0.0 15.4 3.6 15.9 15.1 68.6 2,467.7 53.9 395.7 251.9 479.3 6,933.1
Feb 16.29 89.44 1,396.07 96.11 137.3 48.6 1,502.5 0.0 15.5 3.2 15.0 14.9 68.2 2,238.9 239.7 398.5 266.0 480.1 7,026.4
Mar 10.74 63.27 1,421.43 83.18 150.7 53.5 1,578.7 0.0 15.7 3.8 15.7 15.7 69.9 2,554.3 23.7 422.4 314.5 484.0 7,281.0
Apr 9.82 64.14 1,383.44 75.92 209.0 51.4 1,744.4 0.0 15.8 3.6 15.8 16.9 74.0 2,493.3 26.4 489.1 263.7 492.6 7,429.3
May 12.36 52.63 1,376.30 119.89 159.1 75.3 1,739.8 0.0 15.7 33.6 16.7 16.3 72.4 2,528.3 28.4 486.1 290.7 492.0 7,515.6
Jun 7.01 53.33 1,578.51 141.42 82.2 110.6 1,786.8 0.0 16.0 35.0 47.9 16.5 82.2 2,583.5 23.9 533.5 273.6 497.3 7,869.2
Jul 6.71 40.92 1,684.48 137.62 53.7 103.6 1,752.4 0.0 26.1 34.4 45.2 16.9 116.3 2,495.4 24.2 513.6 295.5 482.1 7,829.0
Source:Reserve Bank of Zimbabwe,2017
Notes
1.Government securities includes treasuary bills and bonds
2.Includes bankers acceptances, discounted bills and negotiable certificates of deposits.
3.Includes households, other financial corporations,
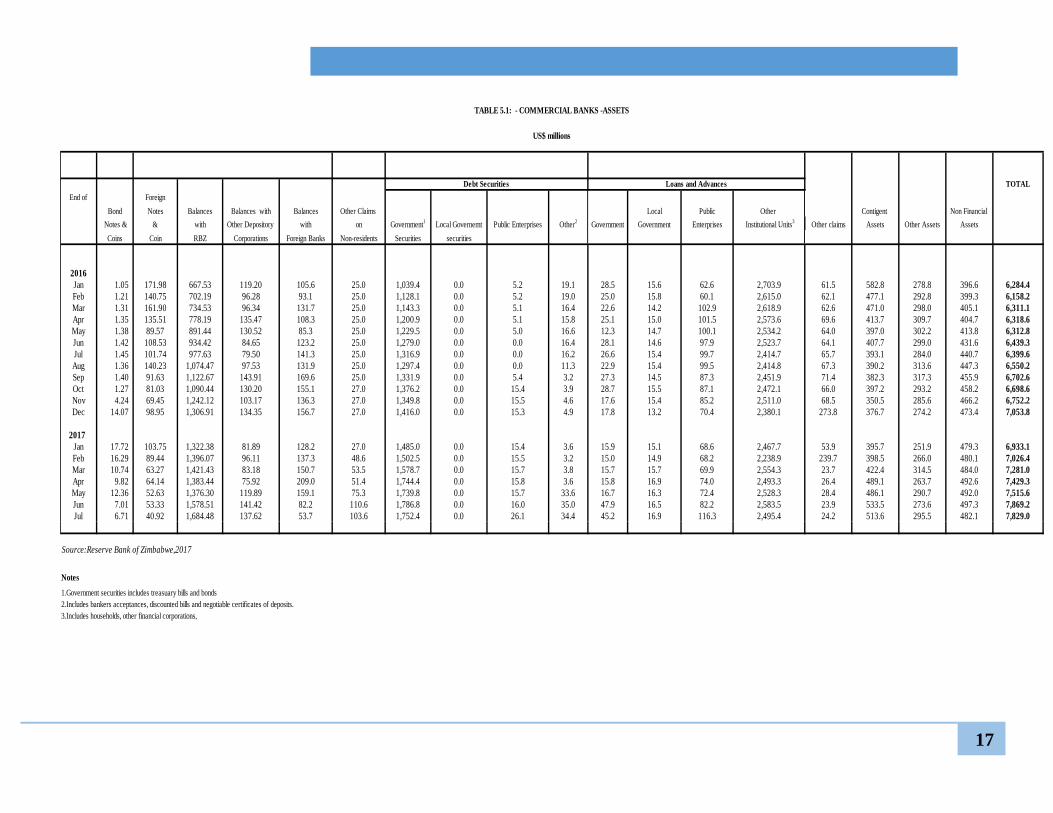
TABLE 5.1: - COMMERCIAL BANKS -ASSETS
US$ millions
Debt Securities Loans and Advances
18
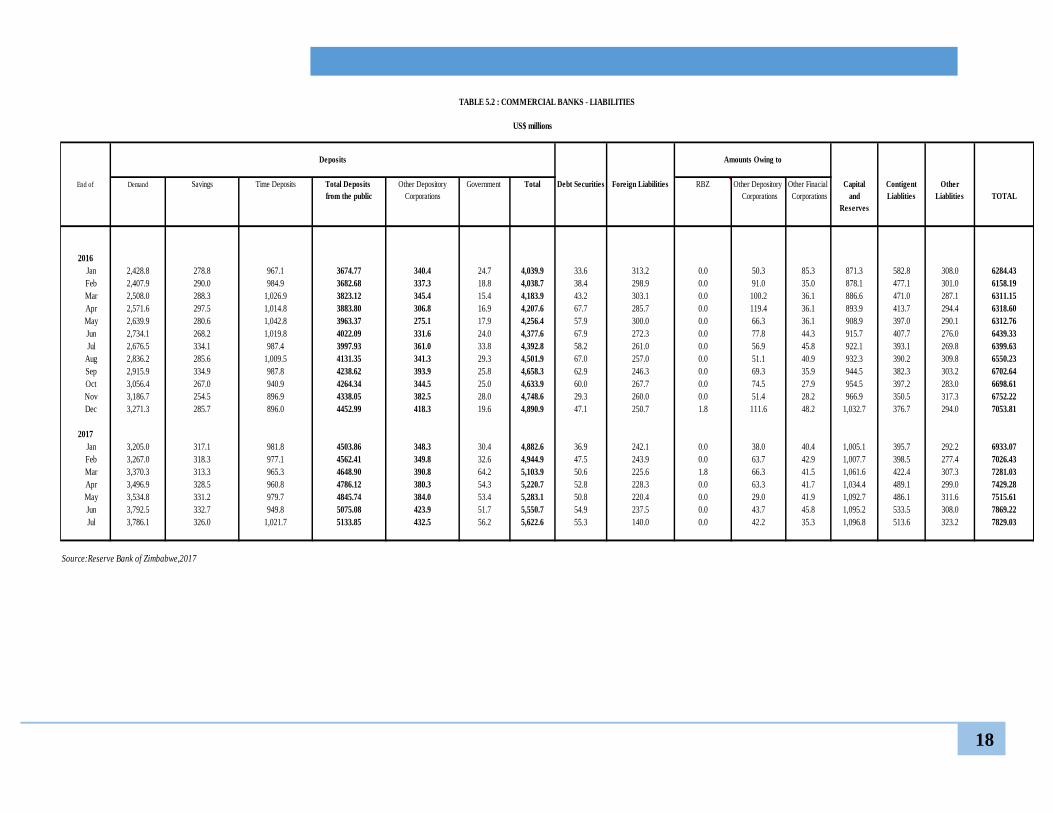
US$ millions
End of Demand Savings Time Deposits Total Deposits Other Depository Government Total Debt Securities Foreign Liabilities RBZ Other Depository Other Finacial Capital Contigent Other
from the public Corporations Corporations Corporations and Liablities Liablities TOTAL
Reserves
2016
Jan 2,428.8 278.8 967.1 3674.77 340.4 24.7 4,039.9 33.6 313.2 0.0 50.3 85.3 871.3 582.8 308.0 6284.43
Feb 2,407.9 290.0 984.9 3682.68 337.3 18.8 4,038.7 38.4 298.9 0.0 91.0 35.0 878.1 477.1 301.0 6158.19
Mar 2,508.0 288.3 1,026.9 3823.12 345.4 15.4 4,183.9 43.2 303.1 0.0 100.2 36.1 886.6 471.0 287.1 6311.15
Apr 2,571.6 297.5 1,014.8 3883.80 306.8 16.9 4,207.6 67.7 285.7 0.0 119.4 36.1 893.9 413.7 294.4 6318.60
May 2,639.9 280.6 1,042.8 3963.37 275.1 17.9 4,256.4 57.9 300.0 0.0 66.3 36.1 908.9 397.0 290.1 6312.76
Jun 2,734.1 268.2 1,019.8 4022.09 331.6 24.0 4,377.6 67.9 272.3 0.0 77.8 44.3 915.7 407.7 276.0 6439.33
Jul 2,676.5 334.1 987.4 3997.93 361.0 33.8 4,392.8 58.2 261.0 0.0 56.9 45.8 922.1 393.1 269.8 6399.63
Aug 2,836.2 285.6 1,009.5 4131.35 341.3 29.3 4,501.9 67.0 257.0 0.0 51.1 40.9 932.3 390.2 309.8 6550.23
Sep 2,915.9 334.9 987.8 4238.62 393.9 25.8 4,658.3 62.9 246.3 0.0 69.3 35.9 944.5 382.3 303.2 6702.64
Oct 3,056.4 267.0 940.9 4264.34 344.5 25.0 4,633.9 60.0 267.7 0.0 74.5 27.9 954.5 397.2 283.0 6698.61
Nov 3,186.7 254.5 896.9 4338.05 382.5 28.0 4,748.6 29.3 260.0 0.0 51.4 28.2 966.9 350.5 317.3 6752.22
Dec 3,271.3 285.7 896.0 4452.99 418.3 19.6 4,890.9 47.1 250.7 1.8 111.6 48.2 1,032.7 376.7 294.0 7053.81
2017
Jan 3,205.0 317.1 981.8 4503.86 348.3 30.4 4,882.6 36.9 242.1 0.0 38.0 40.4 1,005.1 395.7 292.2 6933.07
Feb 3,267.0 318.3 977.1 4562.41 349.8 32.6 4,944.9 47.5 243.9 0.0 63.7 42.9 1,007.7 398.5 277.4 7026.43
Mar 3,370.3 313.3 965.3 4648.90 390.8 64.2 5,103.9 50.6 225.6 1.8 66.3 41.5 1,061.6 422.4 307.3 7281.03
Apr 3,496.9 328.5 960.8 4786.12 380.3 54.3 5,220.7 52.8 228.3 0.0 63.3 41.7 1,034.4 489.1 299.0 7429.28
May 3,534.8 331.2 979.7 4845.74 384.0 53.4 5,283.1 50.8 220.4 0.0 29.0 41.9 1,092.7 486.1 311.6 7515.61
Jun 3,792.5 332.7 949.8 5075.08 423.9 51.7 5,550.7 54.9 237.5 0.0 43.7 45.8 1,095.2 533.5 308.0 7869.22
Jul 3,786.1 326.0 1,021.7 5133.85 432.5 56.2 5,622.6 55.3 140.0 0.0 42.2 35.3 1,096.8 513.6 323.2 7829.03
Source:Reserve Bank of Zimbabwe,2017
TABLE 5.2 : COMMERCIAL BANKS - LIABILITIES
Deposits Amounts Owing to

19
Foreign Other Assets Non Financial TOTAL
End of Notes Assets
Bond & Balances Balances with Balances Other Claims
Notes & Coin with Other Depository with on Government1
Local Governemt Public Enterprises Other2
Mortgages Government Other
Coins RBZ Corporations Foreign Banks Non-residents Securities securities
2016
Jan 0.13 17.39 52.89 174.89 10.0 0.0 76.6 28.8 0.0 0.0 332.8 0.0 424.2 107.9 119.7 1,345.3
Feb 0.20 18.23 51.29 188.70 9.2 0.0 65.6 29.2 0.0 0.0 330.2 0.0 428.9 110.4 119.6 1,351.6
Mar 0.19 15.08 63.72 189.76 16.6 0.0 50.8 28.5 0.0 0.0 345.4 0.0 407.7 105.9 119.4 1,343.1
Apr 0.19 9.46 24.44 186.02 3.4 0.0 90.9 27.6 0.0 0.0 332.5 0.0 406.6 111.4 119.2 1,311.8
May 0.14 7.35 65.79 148.67 5.5 0.0 93.3 26.8 0.0 0.0 339.8 0.0 421.5 114.2 122.3 1,345.3
Jun 0.18 12.92 66.94 200.92 5.2 0.0 103.7 25.9 0.0 0.0 353.3 0.0 402.0 107.4 119.3 1,397.7
Jul 0.16 8.30 63.25 162.33 5.7 0.0 101.6 33.4 0.0 0.0 346.8 0.0 426.1 107.3 123.8 1,378.9
Aug 0.20 7.54 84.78 136.50 4.1 0.0 95.1 32.3 0.0 0.0 353.4 0.0 416.6 105.8 123.4 1,359.7
Sep 0.21 4.16 67.01 165.80 3.8 0.0 95.5 29.0 0.0 0.0 354.4 0.0 417.1 105.4 123.3 1,365.6
Oct 0.12 7.23 52.19 191.21 6.8 0.0 100.9 26.3 0.0 0.0 356.9 0.0 427.0 108.8 123.4 1,400.9
Nov 0.14 6.44 54.76 214.60 3.9 0.0 114.9 22.3 0.0 0.0 381.2 0.0 444.9 108.8 124.7 1,476.7
Dec 1.72 8.05 89.65 243.77 5.1 0.0 91.3 21.0 0.0 0.0 379.8 0.0 430.2 110.0 124.4 1,505.1
2017
Jan 2.35 7.02 109.63 157.70 4.3 0.0 123.7 20.8 0.0 0.0 389.1 0.0 406.1 106.3 124.4 1,451.4
Feb 1.19 7.29 69.26 155.60 7.4 0.0 162.0 20.1 0.0 0.0 394.4 0.0 410.1 109.0 124.2 1,460.4
Mar 1.65 3.07 35.53 177.16 4.0 0.0 164.2 18.7 0.0 0.0 404.4 0.0 413.0 102.8 124.2 1,448.6
Apr 0.74 3.56 73.43 173.28 9.8 0.0 158.6 17.8 0.0 0.0 392.5 0.0 432.3 109.7 125.1 1,496.8
May 0.92 3.94 81.47 152.32 10.8 0.0 168.2 20.3 0.0 0.0 394.4 0.0 451.1 105.9 126.1 1,515.4
Jun 0.34 3.66 65.90 208.75 9.8 0.0 165.3 19.0 0.0 0.0 387.6 0.0 452.9 109.6 126.0 1,548.8
Jul 0.39 3.93 105.83 164.58 9.2 0.0 168.4 17.2 0.0 0.0 391.9 0.0 451.9 110.9 127.3 1,551.5
Source:Reserve Bank of Zimbabwe,2017
Notes
1.Government securities includes treasuary bills and bonds
2.Includes bankers acceptances, discounted bills and negotiable certificates of deposits.
3.Includes households, other financial corporations,
TABLE 6.1: BUILDING SOCIETIES -ASSETS
US$ millions
Debt Securities Loans and Advances

20
Debt Securities Foreign Liabilities Capital Other TOTAL
and Liablities
End of Savings Time Deposits Total Deposits Other Depository Government Total RBZ Other Depository Other Finacial Reserves
from the public Corporations Corporations Corporations
2016
Jan 297.8 534.3 832.14 47.2 0.1 879.4 22.6 43.3 0.0 74.7 0.0 292.9 32.3 1345.27
Feb 305.9 533.4 839.34 37.2 0.1 876.6 23.2 42.3 0.0 80.7 0.9 296.3 31.5 1351.56
Mar 314.1 531.2 845.28 25.1 0.0 870.4 23.6 37.0 0.0 80.9 0.8 284.3 46.0 1343.06
Apr 317.6 520.8 838.41 25.1 0.0 863.5 23.7 36.9 0.0 74.6 0.5 278.8 33.9 1311.79
May 330.8 480.5 811.31 34.1 0.0 845.5 25.0 36.2 0.0 77.2 0.5 315.5 45.5 1345.27
Jun 313.1 511.6 824.71 69.2 0.0 893.9 24.4 35.4 0.0 81.5 3.1 313.1 46.3 1397.68
Jul 313.4 490.8 804.18 74.0 15.5 893.7 24.8 35.7 0.0 72.7 0.4 318.2 33.4 1378.87
Aug 278.7 503.6 782.31 71.0 16.1 869.4 25.1 33.6 0.0 76.5 0.4 321.5 33.3 1359.67
Sep 270.8 507.3 778.11 85.7 16.4 880.2 22.5 30.5 0.0 82.4 0.3 314.1 35.5 1365.62
Oct 267.3 525.9 793.19 89.2 16.4 898.9 24.6 29.4 0.0 87.8 0.4 319.7 40.1 1400.87
Nov 311.8 529.0 840.82 89.4 16.5 946.7 25.8 29.6 0.0 90.8 0.6 326.4 56.8 1476.66
Dec 339.5 532.9 872.41 92.6 16.6 981.6 27.0 28.8 0.0 79.9 0.5 330.3 56.9 1505.10
2017
Jan 326.2 522.1 848.23 81.5 16.6 946.4 25.0 29.1 0.0 66.5 0.7 332.1 51.7 1451.40
Feb 326.1 534.4 860.48 76.2 16.6 953.3 23.1 27.0 0.0 62.4 0.5 334.5 59.7 1460.43
Mar 319.7 523.2 842.91 70.2 16.7 929.9 20.9 24.0 0.0 68.5 0.3 340.7 64.3 1448.62
Apr 399.6 527.1 926.64 70.6 16.0 1,013.2 21.8 22.8 0.0 54.0 0.2 322.5 62.3 1496.83
May 378.0 536.0 914.03 70.7 16.1 1,000.8 21.8 23.0 0.0 66.2 0.4 325.8 77.4 1515.45
Jun 401.8 544.4 946.24 70.7 16.5 1,033.4 22.0 22.0 0.0 65.2 0.8 330.0 75.4 1548.79
Jul 430.3 531.5 961.78 70.4 16.1 1,048.3 22.2 22.2 0.0 57.3 0.3 334.5 66.8 1551.54
Source:Reserve Bank of Zimbabwe,2017
Amounts Owing to
TABLE 6.2: BUILDING SOCIETIES -LIABILITIES
US$ millions

21
AGRICULTURE CO NSTRUCTIO N CO MMUNICATIO N DISTRIBUTIO N FINANCIAL & FINANCIAL MANUFACTURING MINING SERVICES TRANSPO RT INDIVIDUALS CO NGLO MERATES TO TAL
END O F INVESTMENTS O RGANISATIO NS
2016
Jan 577,684.4 35,033.6 35,535.9 379,618.2 13,329.2 68,325.8 476,677.0 158,150.5 410,992.6 40,295.6 535,379.3 380.2 2,731,402.2Feb 539,562.8 35,885.1 37,857.4 374,835.1 13,285.9 63,301.8 473,970.3 155,889.4 415,520.6 40,862.5 531,789.5 365.3 2,683,125.7Mar 586,349.7 39,180.5 41,037.5 371,809.6 13,397.9 63,061.4 444,769.1 156,209.2 402,900.5 44,606.7 588,882.7 410.7 2,752,615.5Apr 527,545.8 46,612.5 40,624.2 379,572.0 13,428.1 69,469.7 437,795.4 142,682.1 421,335.6 43,921.4 645,037.3 9,410.0 2,777,434.0May 522,239.8 40,194.4 38,496.8 358,042.5 13,280.8 65,381.2 439,295.5 145,180.0 401,304.1 41,908.5 651,719.3 9,579.0 2,726,621.9Jun 510,016.8 39,316.9 36,866.1 361,138.1 12,764.5 68,850.3 433,145.3 143,595.6 476,484.5 42,179.6 650,071.4 9,739.2 2,784,168.3Jul 501,744.6 43,266.6 12,746.6 287,960.5 11,403.0 64,344.7 423,354.4 141,639.6 489,050.6 40,059.9 652,366.8 9,804.6 2,677,741.9Aug 498,489.6 43,265.5 26,005.4 295,108.0 11,957.4 69,959.8 423,824.7 139,556.7 458,763.3 44,237.3 636,726.8 10,497.1 2,658,391.5Sep 487,504.2 42,900.7 20,644.2 338,165.8 11,960.4 154,582.0 409,891.0 142,259.6 400,059.8 40,609.7 636,000.8 11,273.3 2,695,851.5Oct 513,303.7 44,348.8 23,814.1 333,709.5 11,968.6 70,984.3 418,465.3 152,571.6 456,867.4 45,511.4 637,546.1 11,122.2 2,720,213.0Nov 526,709.8 42,580.2 22,481.4 338,556.1 11,358.7 72,491.9 413,849.2 152,092.3 464,279.4 42,762.1 641,080.5 10,545.5 2,738,787.0Dec 436,452.3 41,297.5 19,541.4 311,503.1 11,668.9 327,576.0 377,945.5 134,516.0 415,801.6 36,867.2 613,022.6 10,287.7 2,736,479.6
2017
Jan 448,344.7 41,732.8 22,069.3 264,734.2 12,019.3 270,117.2 350,757.1 144,447.3 394,945.0 40,975.0 591,245.7 11,489.3 2,592,877.1Feb 436,206.2 40,112.3 24,467.5 269,358.3 12,146.8 272,314.8 361,416.8 143,990.4 373,445.1 40,250.7 568,686.3 11,227.9 2,553,623.0Mar 425,496.8 54,688.4 25,533.4 275,500.1 12,241.8 290,985.3 349,722.5 159,101.0 359,672.5 37,864.1 572,233.3 13,047.7 2,576,086.9Apr 426,696.6 43,836.6 18,145.2 340,025.3 12,219.1 271,824.0 360,945.8 134,101.0 350,475.1 42,208.4 571,000.5 12,492.9 2,583,970.5May 428,874.0 43,427.0 16,689.0 322,695.4 12,252.6 269,976.3 360,929.9 117,479.9 354,102.7 41,337.5 569,798.9 11,923.7 2,549,487.0Jun 431,677.5 45,018.0 16,989.2 311,641.4 14,435.6 266,917.5 343,590.2 126,542.8 417,469.8 37,849.5 595,749.5 12,001.6 2,619,882.5Jul 459,128.0 52,500.1 11,717.0 255,319.0 14,541.0 255,591.2 311,364.4 131,420.5 422,799.8 39,630.7 609,112.5 14,464.3 2,577,588.5
Source:Reserve Bank of Zimbabwe,2017
/1 Including the only merchant bank still in operation.
TABLE 7.1 : SECTORAL ANALYSIS OF COMMERCIAL BANKS LOANS AND ADVANCES/1
US$ thousands
22
END OF AGRICULTURE CONSTRUCTION COMMUNICATIONS DISTRIBUTION FINANCIAL & FINANCIAL MANUFACTURING MINING SERVICES TRANSPORT INDIVIDUALS CONGLOMERATES TOTAL
INVESTMENTS ORGANISATIONS
2016
Jan 231,827.3 101,724.1 93,544.2 517,089.2 325,203.1 977,272.1 345,812.2 62,026.3 1,083,702.7 61,755.6 618,080.1 58,808.7 4,476,845.6
Feb 226,568.3 105,747.9 97,684.4 525,070.9 339,839.0 896,869.2 326,026.0 59,381.3 1,047,904.6 63,248.3 634,478.3 63,017.8 4,385,835.9
Mar 243,546.9 102,238.4 116,471.1 582,943.5 362,058.8 879,340.8 368,689.6 60,514.0 1,073,567.6 62,839.4 642,779.4 61,037.6 4,556,027.1
Apr 243,151.6 102,234.0 112,219.5 569,660.7 360,299.5 907,855.6 335,068.6 71,721.0 1,156,122.6 63,858.0 628,901.1 61,087.0 4,612,179.4
May 236,180.5 97,008.6 120,726.3 593,284.9 371,034.5 923,580.9 356,500.9 99,176.4 1,107,956.8 61,396.5 607,501.4 64,066.3 4,638,413.9
Jun 218,386.8 103,914.2 134,181.8 596,904.8 362,400.2 973,333.3 316,490.8 58,856.9 1,128,688.7 72,063.3 601,813.8 61,833.2 4,628,867.8
Jul 207,280.2 99,727.9 138,781.2 616,359.8 348,779.7 1,035,697.0 370,456.9 63,986.1 1,114,413.7 65,391.9 622,329.2 69,058.9 4,752,262.6
Aug 233,004.5 97,248.8 153,590.8 578,487.3 365,366.8 997,123.0 356,522.0 64,413.7 1,227,979.0 67,005.8 621,307.8 73,076.2 4,835,125.8
Sep 236,724.3 101,117.1 155,483.5 597,290.0 346,375.9 1,046,195.2 366,312.8 57,885.0 1,365,673.5 73,805.9 595,219.8 70,669.7 5,012,752.7
Oct 239,373.9 107,235.7 160,641.2 593,362.2 344,681.9 988,274.7 363,815.8 63,998.0 1,384,083.2 76,834.0 593,827.7 73,608.8 4,989,737.2
Nov 318,652.7 107,089.5 189,581.3 501,506.5 329,147.3 992,135.7 411,467.8 150,691.6 1,337,295.6 79,405.2 591,639.0 71,016.3 5,079,628.5
Dec 258,814.9 110,009.2 202,260.4 590,595.6 348,457.0 1,020,795.0 382,615.8 81,542.7 1,466,867.2 82,186.5 592,932.5 76,874.9 5,213,951.8
2017
Jan 236,437.3 108,552.5 230,965.4 618,213.5 339,580.3 1,002,775.4 382,746.3 86,115.0 1,393,941.2 82,670.8 589,549.9 85,602.3 5,157,150.0
Feb 254,463.9 112,294.4 226,877.9 613,080.1 312,948.5 997,181.2 393,542.8 121,798.7 1,402,647.6 91,521.7 604,325.0 84,653.3 5,215,335.3
Mar 299,519.0 118,530.1 232,990.6 626,986.6 308,297.9 1,049,255.7 402,864.2 170,835.1 1,400,323.5 102,287.7 610,024.4 91,046.0 5,412,960.9
Apr 281,219.8 117,174.3 235,093.5 687,962.2 307,711.4 1,013,362.6 400,018.9 190,005.8 1,432,953.1 110,258.7 650,595.9 102,681.0 5,529,037.2
May 301,531.2 113,685.5 220,541.8 679,781.4 320,878.2 1,019,941.1 417,418.5 175,383.4 1,454,718.3 108,366.5 667,019.7 71,770.2 5,551,035.8
Jun 295,920.4 109,938.0 248,436.3 712,648.0 334,368.7 1,121,023.5 408,604.0 185,262.3 1,521,876.3 107,327.1 697,997.7 74,195.4 5,817,597.8
Jul 309,864.7 126,628.5 262,827.7 587,617.1 341,371.5 1,143,423.8 423,846.6 191,273.6 1,599,344.4 99,509.8 680,622.6 76,164.4 5,842,494.6
Source: Reserve Bank of Zimbabwe,2017
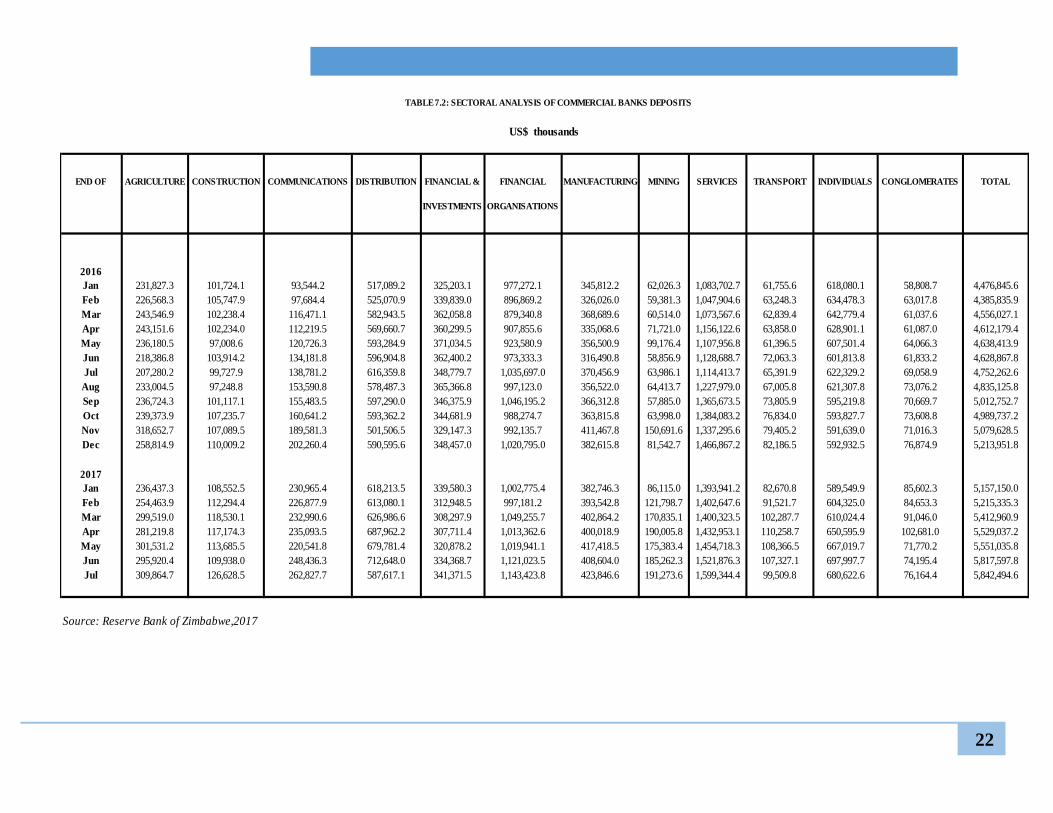
TABLE 7.2: SECTORAL ANALYSIS OF COMMERCIAL BANKS DEPOSITS
US$ thousands
23
End Period Nominal Lending Rates 1
Individuals Corporate
2016
Jan 6.00-22.00 12.08 7.38
Feb 4.00-22.00 11.48 7.29
Mar 4.00-22.00 11.44 7.16
Apr 4.00-22.00 11.50 7.20
May 4.00-18.00 11.43 7.35
Jun 4.00-18.00 11.40 7.48
Jul 4.00-18.00 10.69 6.79
Aug 4.00-18.00 10.67 6.84
Sep 4.00-18.00 10.66 6.95
Oct 4.00-18.00 10.70 6.93
Nov 4.00-18.00 10.69 6.99
Dec 4.00-18.00 10.59 6.87
2017
Jan 4.00-18.00 10.61 6.68
Feb 4.00-18.00 10.06 6.52
Mar 4.00-18.00 9.12 7.02
Apr 4.00-18.00 9.25 7.02
May 4.00-18.00 9.17 7.03
Jun 4.00-18.00 9.01 7.05
Jul 4.00-18.00 8.94 7.05
Source:Reserve Bank of Zimbabwe, 2017
Notes
TABLE 8.1: LENDING RATES (percent per annum)
1. Nominal Lending Rates depict the range of rates quoted by banks.
Commercial Banks
Weighted Average Lending Rates
24
END OF SAVINGS 3 MONTHS
2016
Jan 0.50-8.00 0.75-17.00
Feb 0.50-8.00 0.75-17.00
Mar 0.50-8.00 0.75-17.00
Apr 0.50-8.00 0.75-17.00
May 0.50-8.00 0.75-17.00
Jun 0.50-6.00 0.75-17.00
Jul 0.50-6.00 0.75-17.00
Aug 0.50-6.00 1.00-17.00
Sep 0.50-6.00 1.00-17.00
Oct 0.50-6.00 1.00-17.00
Nov 0.50-6.00 1.00-17.00
Dec 0.50-6.00 1.00-17.00
2017
Jan 0.50-6.00 1.00-17.00
Feb 0.50-6.00 1.00-17.00
Mar 0.50-6.00 1.00-17.00
Apr 0.50-6.00 1.00-17.00
May 0.50-6.00 1.00-9.50**
Jun 0.50-6.00 1.00-12.00
Jul 0.5-6.00 1.00-12.00
Source:Reserve Bank of Zimbabwe, 2017
* The range of rates qouted by banks during the period.
**Banks have adjusted their costs of holding deposits following the call by the RBZ to reduce lending rates.
TABLE 8.2 : BANKS DEPOSIT RATES (percent per annum)*
COMMERCIAL BANKS

25
FOOD
INFLATIONALL
ALCO HO LIC
BEVERAGES CLO THING
HO USING,
WATER,FURNITURE HEALTH TRANSPO RT CO MMUNICATIO N
RECREATIO N
&EDUCATIO N
RESTAURANTS
&MISC. TO TAL NO N FO O D & ITEMS
& TO BACCO FO O TWEARELECTRICTY,
GASAND CULTURE HO TELS GO O DS & FO O D
NO N
ALCO HO LIC
BEVERAGES
& O THER EQ UIPMENT SERVICES
FUELS
WEIGHTS 4.38 6.05 17.74 9.91 2.16 9.76 3.41 2.1 5.67 1.38 3.91 66.47 33.53 100
2016
Jan 0.05 -0.02 -0.04 -0.30 -0.15 -0.37 0.00 -0.18 0.00 -0.16 -0.29 -0.13 0.13 -0.05
Feb -0.14 0.00 -0.12 -0.19 -0.17 -0.37 -0.13 -0.01 0.00 -0.17 0.06 -0.14 -0.03 -0.10
Mar -0.15 -0.17 -1.03 -0.73 -0.13 -0.30 0.42 -0.04 3.36 -0.62 -0.60 -0.11 -0.13 -0.12
Apr 0.03 -0.14 -0.02 -0.32 0.00 0.07 -0.08 -0.02 -0.01 -0.09 -0.35 -0.08 -0.51 -0.21
May -0.29 -0.22 0.12 -0.11 -0.18 -0.11 -1.61 0.06 0.00 0.02 -0.33 -0.12 -0.49 -0.24
Jun 0.07 -0.21 0.58 0.03 0.15 -0.08 -0.01 -0.23 2.65 0.31 0.09 0.44 -0.35 0.19
Jul 0.01 -0.15 0.04 0.05 -0.15 -0.03 -0.36 0.09 0.00 0.04 -0.30 -0.03 -0.52 -0.19
Aug -0.06 -0.22 0.00 -0.03 -0.02 -0.13 -0.02 -0.10 0.00 0.01 0.13 -0.04 -0.31 -0.13
Sep 0.10 -0.03 -1.11 -0.27 -0.03 -0.08 -0.09 -0.26 0.00 0.01 0.10 -0.34 -0.06 -0.26
Oct -0.05 -0.24 -0.13 0.06 -0.03 -0.06 0.00 -0.01 0.00 -0.06 0.17 -0.05 0.40 0.09
Nov 0.06 -0.09 0.00 0.10 -0.07 0.33 0.00 0.18 -2.46 -0.01 0.14 -0.22 0.54 0.02
Dec -0.06 0.09 -0.59 0.46 0.09 -0.27 0.00 0.29 0.00 0.16 0.34 -0.09 0.38 0.06
2017
Jan 0.00 -0.15 0.10 0.34 -0.15 -0.75 0.44 0.27 0.00 0.29 0.08 -0.03 0.80 0.23
Feb -0.09 -0.14 0.13 0.70 -0.03 0.11 0.00 -0.04 0.00 0.18 0.52 0.17 1.56 0.61
Mar 0.15 0.03 -0.07 0.64 0.11 0.21 -0.02 0.18 0.00 0.01 0.36 0.15 -0.21 0.03
Apr -0.11 0.02 0.04 0.06 -0.04 0.00 0.05 0.02 2.02 0.34 -0.07 0.25 -0.36 0.05
May 0.13 0.09 -0.01 0.02 0.13 0.04 0.00 -0.21 0.00 -0.39 -0.09 0.01 0.07 0.03
Jun 0.21 0.03 -0.82 0.38 -0.03 -0.18 0.00 0.18 0.00 0.29 0.33 -0.14 -0.45 -0.24
Jul 0.19 0.01 0.01 -0.06 0.01 -0.23 -0.08 0.05 -2.81 1.10 0.11 -0.33 -0.42 -0.36
Source:Zimstat, 2017
NON-FOOD INFLATION
TABLE 9.1 : MONTHLY INFLATION -- PERCENTAGE CHANGE IN CONSUMER PRICE INDEX
( DECEMBER 2012 = 100)
26
F OOD
IN F LA TION
A LC OHOLIC C LOTHIN GHOUS IN G,
WA TER ,F UR N ITUR E M IS C . F OOD &
B EVER A GES & ELEC TR IC T
Y, GA SA N D
R EC R EA TION
&
R ES TA UR A N TS
&GOOD S & TOTA L N ON
N ON
A LC OHOLIC A LL
& TOB A C C O F OOTWEA R & OTHER EQUIP M EN T C ULTUR E HOTELS S ER VIC ES F OOD B EVER A GES ITEM S
F UELS
2016
Jan -0.79 -2.41 -4.40 -3.27 0.37 -2.66 -0.93 -1.09 11.17 0.75 -1.01 -1.34 -3.96 -2.19
Feb -1.16 -2.06 -4.43 -3.35 0.22 -2.62 -0.97 0.21 11.17 0.96 -1.17 -1.35 -4.04 -2.22
Mar -1.43 -1.97 -5.36 -4.04 0.14 -2.92 -0.55 -1.00 14.91 0.21 -1.86 -1.43 -4.13 -2.31
Apr -1.40 -1.40 -2.11 -3.91 0.19 -2.71 -0.50 -0.95 14.21 -0.28 -2.17 -0.51 -4.02 -1.64
May -1.52 -1.21 -2.17 -3.77 -0.10 -2.57 -2.09 -0.78 14.21 -0.18 -2.07 -0.53 -4.13 -1.69
Jun -1.80 -1.36 -1.58 -3.67 0.21 -2.71 -2.10 -0.92 17.24 0.20 -2.09 -0.09 -4.04 -1.37
Jul -1.71 -1.56 -0.98 -2.83 -0.09 -2.66 -2.43 -0.69 9.09 0.27 -2.42 -0.59 -3.76 -1.60
Aug -1.50 -1.77 -1.01 -2.73 -0.07 -2.50 -2.39 -0.54 9.09 0.42 -2.21 -0.54 -3.34 -1.43
Sep -1.36 -1.79 -1.50 -2.48 -0.14 -2.17 -2.10 -0.78 9.09 -0.84 -1.82 -0.58 -2.94 -1.33
Oct -0.97 -1.73 -1.54 -2.10 -0.76 -1.77 -2.13 -0.65 9.09 -0.72 -1.77 -0.45 -2.03 -0.95
Nov -0.77 -1.63 -1.53 -1.77 -0.83 -1.37 -1.91 -0.45 3.48 -0.70 -1.62 -0.89 -1.54 -1.09
Dec -0.42 -1.39 -2.29 -1.25 -0.67 -1.39 -1.87 -0.24 3.49 -0.47 -0.99 -0.92 -0.95 -0.93
2017
Jan -0.47 -1.52 -2.16 -0.62 -0.68 -1.76 -1.44 0.20 3.49 -0.02 -0.62 -0.82 -0.30 -0.65
Feb -0.42 -1.66 -1.91 0.26 -0.53 -1.29 -1.31 0.18 3.49 0.24 -0.05 -0.51 1.29 0.06
Mar -0.13 -1.45 -0.95 1.64 -0.30 -0.79 -1.74 0.40 0.12 0.87 0.92 -0.25 1.21 0.21
Apr -0.26 -1.29 -0.89 2.03 -0.33 -0.86 -1.61 0.44 2.16 1.30 1.21 0.08 1.35 0.48
May 0.15 -0.98 -1.01 2.16 -0.01 -0.71 0.00 0.17 2.16 0.88 1.46 0.21 1.92 0.75
Jun 0.29 -0.74 -2.39 2.52 -0.19 -0.81 0.00 0.59 -0.48 0.86 1.70 -0.37 1.82 0.31
Jul 0.47 -0.58 -2.43 2.41 -0.03 -1.01 0.29 0.55 -3.28 1.93 2.12 -0.67 1.92 0.14
Source: Zimstat, 2017
C OM M UN IC A TIONTR A N S P OR THEA LTH ED UC A TION
N ON -F OOD IN F LA TION
TABLE 9.2 : YEARLY INFLATION -- PERCENTAGE CHANGE IN CONSUMER PRICE INDEX
(DECEMBER 2012 = 100)

27
(US$ millions)
End Period 2000 2001 2002 2003 2004 2005 2006 2007 2008 2009 2010 2011 2012 2013 2014 2015 2016
Long-Term External Debt 3,227 3,255 3,327 3,644 3,927 3,805 3,965 4,032 4,464 4,951 5,175 6,096 6,607 7,370 8,444 8,426 8,656
Government 2,249 2,328 2,376 2,617 2,844 2,895 3,024 3,054 3,464 4,037 4,095 4,638 4,929 5,012 4,522 5,293 5,365
Bilateral Creditors 1,050 1,115 1,107 1,255 1,455 1,438 1,520 1,520 1,863 2,308 2,325 2,597 2,694 2,928 2,445 3,310 3,479
Multilateral Creditors 1,199 1,213 1,269 1,362 1,389 1,457 1,504 1,524 1,592 1,729 1,770 2,041 2,235 2,084 2,078 1,982 1,886
Private Creditors 0 0 0 0 0 0 0 10 10 0 0 0 0 0 0 0 0
Public Enterprises 534 568 616 698 714 709 766 790 825 857 938 1,092 1,198 1,356 1,661 1,220 1,370
Bilateral Creditors 301 315 351 403 442 439 464 474 497 453 238 711 703 858 1,155 760 779
Multilateral Creditors 233 253 265 295 272 270 302 316 327 403 700 382 495 498 506 460 591
Private Creditors 0 0 0 0 0 0 0 0 0 0 0 0 0 0 0 0 0
Monetary Authorities 292 292 279 288 291 144 130 137 140 140 138 127 125 125 120 110 0
Multilateral Creditors - IMF 292 292 279 288 291 144 130 137 140 140 138 127 125 125 120 110 0
Private 152 67 56 41 78 57 45 51 35 57 142 366 480 1,002 2,261 1,913 1,920
Short-Term External Debt 298 167 183 169 144 173 281 387 226 1,198 1,382 1,289 890 1,564 2,394 2,258 2,304
Supplier's Credits 42 13 26 51 69 107 122 178 41 193 286 134 30 0 0 0 0
Reserve Bank 642 642 618 614 614 587 587 573
Private 256 154 157 118 75 66 159 209 185 363 454 537 246 950 1,807 1,671 1,731
Total External Debt 3,525 3,422 3,510 3,812 4,071 3,978 4,246 4,419 4,690 6,149 6,557 7,385 7,497 8,934 10,838 10,684 10,960
Source: Ministry of Finance & Economic Development, 2017; & Reserve Bank of Zimbabwe, 2017
TABLE 10: ZIMBABWE: EXTERNAL DEBT OUTSTANDING BY DEBTOR (INCLUDING ALL ARREARS)
28
SA BW JAPANESE EURO PEAN PO UND
END O F RAND/1 PULA/1 YEN/1 CURRENCY/2 STERLING/2
2016
Jan 16.0900 11.4300 120.5500 1.0905 1.4493
feb 16.1100 11.2700 113.0300 1.0990 1.3880
Mar 15.4500 11.1000 112.9500 1.1100 1.4200
Apr 14.6200 10.7575 109.6825 1.1340 1.4306
May 15.3200 10.9800 108.9323 1.1340 1.4522
Jun 14.8834 10.9349 102.6700 1.1095 1.3397
Jul 14.4277 10.7892 103.9398 1.1069 1.3180
Aug 13.7656 9.4521 101.2190 1.0960 1.2280
Sep 13.9200 10.5800 101.6000 1.1200 1.3200
O ct 13.9400 10.6500 103.7600 1.0989 1.2346
Nov 13.9402 10.6875 107.9934 1.0811 1.2430
Dec 13.8416 10.7247 115.7895 1.0556 1.2509
2017
Jan 13.5146 10.5652 113.4750 1.0701 1.2516
Feb 12.9957 10.3573 112.5100 1.0591 1.2439
Mar 13.5450 10.5541 111.8750 1.0678 1.2487
Apr 13.3461 10.4384 111.1600 1.0862 1.2908
May 13.1162 10.2987 110.9650 1.1168 1.2801
Jun 13.0150 10.2249 111.9450 1.1439 1.3013
Jul 12.9986 10.2093 110.5150 1.1734 0.7618
Source: Reserve Bank of Zimbabwe, 2017
TABLE 11 : SELECTED INTERNATIONAL EXCHANGE RATES
1. Foreign currency per US dollar.
2. US dollars per unit of foreign currency.

29
Market Capitalisation
END OF
US$ millions
2016
Jan 103.0 19.5 10.4 61,882,757 2,790.4
Feb 99.4 19.1 15.6 95,020,938 2,692.3
Mar 97.6 19.4 16.4 97,601,725 2,645.1
Apr 105.8 20.2 14.0 187,848,946 2,862.6
May 104.7 25.5 13.9 99,055,230 2,881.3
Jun 101.0 24.7 18.1 88,525,472 2,780.9
Jul 98.8 25.7 11.8 57,222,624 2,772.0
Aug 99.5 26.3 7.1 41,264,438 2,734.3
Sep 98.9 26.6 13.0 68,329,516 2,725.1
Oct 120.8 33.8 22.6 177,384,684 3,328.3
Nov 137.1 57.4 23.5 233,749,377 3,804.6
Dec 144.5 58.5 26.0 292,538,969 4,008.0
2017
Jan 140.2 56.3 8.6 31,616,982 3,903.7
Feb 135.3 56.5 11.5 85,314,995 3,770.0
Mar 139.0 58.6 26.9 145,238,255 3,871.3
Apr 143.0 66.3 11.2 75,857,712 4,182.8
May 162.3 69.6 16.8 170,830,515 4,740.1
Jun 196.0 69.8 39.7 311,145,262 5,695.2
Jul 203.3 69.4 24.7 149,425,245 5,759.0
Source:Zimbabwe Stock Exchange (ZSE),2017
Indices
TABLE 12: ZIMBABWE STOCK MARKET STATISTICS
Industrial
Market Turnover
US$ million Volume of SharesMining
30
END OFZETSS CHEQUE POS ATM MOBILE INTERNET
2016
Jan 3,385.9 11.1 137.4 331.5 388.9 167.7
Feb 3,448.2 11.9 138.8 312.1 389.3 167.9
Mar 3,460.2 11.3 142.1 288.8 417.1 255.9
Apr 3,564.3 9.7 180.1 247.6 427.3 168.3
May 3,869.2 10.8 214.8 203.3 479.9 217.9
Jun 4,522.2 10.3 203.9 131.4 465.1 174.1
Jul 3,911.8 9.2 240.0 166.3 491.2 218.0
Aug 3,928.7 7.9 238.0 165.9 535.4 230.6
Sep 4,382.9 10.5 237.3 167.7 533.9 215.9
Oct 4,127.6 8.0 322.8 112.5 524.5 216.0
Nov 4,624.7 6.9 363.4 84.5 537.2 229.9
Dec 4,882.6 5.6 479.9 71.9 626.1 265.1
2017
Jan 4,052.7 7.5 368.7 70.4 495.6 318.9
Feb 4,246.6 7.0 327.3 58.4 472.3 324.1
Mar 4,629.8 7.4 392.2 58.8 671.6 399.7
Apr 4,178.8 4.8 466.9 39.3 792.5 337.6
May 4,974.0 6.5 557.8 44.7 939.9 618.7
Jun 5,346.4 6.3 558.8 34.6 1095.5 500.3
Jul 4,805.1 5.7 588.4 29.4 1601.4 586.4
Source:Reserve Bank of Zimbabwe, 2017
TABLE 13.1 : ZETSS AND RETAIL PAYMENTS
Values of Transactions (US$ millions)

31
END OF ZETSS CHEQUE POS ATM MOBILE INTERNET
2016
Jan 132.3 24.6 1328.9 1104.4 19,956.1 49.9
Feb 148.4 30.3 1289.5 1067.1 19,793.7 54.6
Mar 152.5 29.6 1455.7 962.9 21,731.5 61.9
Apr 161.7 25.0 1962.6 841.3 21,086.6 59.9
May 199.3 29.1 2779.9 675.8 23,293.0 83.2
Jun 268.2 33.5 3203.8 741.9 23,321.2 88.0
Jul 242.4 31.1 3946.3 1052.8 24,538.8 102.7
Aug 253.9 27.8 4038.1 1156.4 26,009.6 109.5
Sep 288.5 32.5 4421.9 1188.5 27,300.0 100.0
Oct 296.0 29.2 6247.4 1106.4 29,801.7 117.9
Nov 353.0 30.6 8691.2 1086,9 28,542.1 128.8
Dec 405.4 24.4 13042.1 1348.0 33,211.8 155.9
Annual Total 2,901.5 347.7 52,407.5 11,245.7 298,586.2 1112.1
2017
Jan 350.0 26.7 12,756.3 1,173.6 27,550.1 191.0
Feb 326.3 27.8 8,952.0 953.5 26,820.1 207.0
May 414.2 31.0 11,124.0 922.2 35,604.1 244.1
Apr 363.7 21.6 13,595.5 652.9 40,089.0 231.0
May 531.8 27.8 16,623.4 820.6 47,019.1 323.3
Jun 525.0 29.3 17,466.2 696.9 53,738.1 342.1
Jul 521.8 30.0 20,013.7 636.1 61,162.4 382.6
Source:Reserve Bank of Zimbabwe, 2017
TABLE 13.2 : ZETSS AND RETAIL PAYMENTS
Volumes of Transactions (000's)
32
END OF EXPORTS IMPORTS TOTAL TRADE TRADE BALANCE
2016
Jan 249.18 395.35 644.52 (146.17)
Feb 209.55 427.73 637.28 (218.18)
Mar 166.50 478.06 644.55 (311.56)
Apr 157.83 356.48 514.31 (198.65)
May 165.20 408.49 573.69 (243.29)
Jun 176.21 429.41 605.61 (253.20)
Jul 184.21 394.23 578.43 (210.02)
Aug 202.14 445.03 647.16 (242.89)
Sep 250.42 443.89 694.30 (193.47)
Oct 318.45 468.06 786.52 (149.61)
Nov 460.73 475.33 936.06 (14.61)
Dec 291.87 489.37 781.24 (197.50)
Total 2832.27 5211.41 8043.69 (2379.14)
2017
Jan 291.98 384.80 676.78 (92.82)
Feb 290.34 424.36 714.70 (134.02)
Mar 265.70 461.67 727.37 (195.98)
Apr 225.66 405.39 631.05 (179.73)
May 268.77 466.06 734.84 (197.29)
Jun 265.00 495.20 760.20 (230.21)
Jul 264.15 482.06 746.21 (217.91)
Source: Zimstat, 2017
TABLE 14 : MERCHANDISE TRADE STATISTICS
(US$ millions)
Related Documents


![TheUcenterandthepoint-ionmethodhalogenuros alcalinos que110 habían sido considerados. Losvalores obtenidos secomparan con los queseoblienen delaleyde¡vey[21]. PACS: 61.70.-r; 71.55.-i;](https://static.cupdf.com/doc/110x72/6010ece791b7fe76ac2f7e13/theucenterandthepoint-ionmethod-halogenuros-alcalinos-que110-haban-sido-considerados.jpg)