JSPL | Quick Take July 05, 2018 1 JSPL is part of OP Jindal Group with presence in steel, power and mining sectors. JSPL has capacity of 10.6 MTPA crude steel and 3,400MW of power generation capacity through its subsidiary Jindal Power Limited (JPL). Capacity expansion done; EBIDTA/Tonne likely to improve: The company has increased its crude steel capacity more than double in last five years from 3.6 MTPA to 8.6 MTPA and currently running at ~50% utilization, However given the current market scenario of steel demand we expect utilization level to improve to 80-85% in next 7-8 months. Further, Jindal Shadeed (OMAN subsidiary) with a crude steel capacity of 2MTPA has ram up significantly in last three years and running at ~ 80% utilization we expect the plant to reach to further utilization level of 85-90% going ahead. On account of this we expect a combined output of crude steel to reach to 8.5-9 MTPA by FY19. Improvement in PLF and PPA going ahead: In FY18 JPL has signed a additional 250MW of PPA which makes it ~30% of installed capacity and it is in further discussions with various utilities for signing of another 300MW PPA. Management expects to generate ~1,700 MW units by FY19 owing to GOI’s effort to improve coal availability with implementation of SHAKTI scheme. Outlook & Valuation: JSPL is currently placed at an inflection point where it is witnessing positive changes like (a) end of capex cycle and equipped with fully operational Angul plant with 5 MTPA capacity, (b) increasing demand of power going forward with expectation of signing new PPA at JPL, (c) monetization of few assets like disinvestment of Tamnar- (EUP-I) 1,000 MW power plant and planning for IPO of OMAN plant. Considering the company’s recent developments and favorable business environment, we believe JSPL is trading at attractive valuation to its peer, hence we recommend ACCUMULATE on the stock with Target Price of `327 based on asset based approach of Steel segment on EV/Tonne basis and Power segment on EV/MW basis. Exhibit 1: Key Financials Y/E March (` cr) FY16 FY17 FY18 FY19E FY20E Net Sales 17,948 20,409 27,069 35,918 44,048 % chg (6) 14 33 33 23 EBIDTA 3,201 4,337 5,882 8,097 10,580 % chg (7) 35 36 38 31 EBITDA (%) 18% 21% 22% 23% 24% EPS (Rs) (32) (26) (17) 1 20 P/E (x) - - - 216 10 P/BV (x) 0.6 0.7 0.7 0.7 0.6 RoE (%) - - - 0.3 5.9 RoCE (%) - 0.6 2.9 5.7 9.5 EV/EBITDA 19.9 13.8 10.1 7.3 5.2 Source: Company, Angel Research; Note: CMP as of July 05, 2018 BUY CMP `212 Target Price `327 Investment Period 12 Months Stock Info Sector Bloomberg Code JNSP IN Shareholding Pattern (%) Promoters 58.7 MF / Banks / Indian Fls 6.9 FII / NRIs / OCBs 19.2 Indian Public / Others 15.3 Abs.(%) 3m 1yr 3yr Sensex 6.0 12.9 26.2 JSPL (7.0) 63.0 156.0 Beta 2.8 Steel & Pow er Market Cap (` cr) 20,520 52 Week High / Low 294/112 Avg. Daily Volume 630,702 Face Value (`) 1 BSE Sensex 35,574 Nif ty 10,750 Reuters Code JNSP.BO 3 years price performance Source: C-line, Angel Research Kripashankar Maurya 022 39357600, Extn: 6004 [email protected] 0 50 100 150 200 250 300 350 Jul-15 Jan-16 Jul-16 Jan-17 Jul-17 Jan-18 Jul-18 Jindal steel & Power July 05, 2018

Welcome message from author
This document is posted to help you gain knowledge. Please leave a comment to let me know what you think about it! Share it to your friends and learn new things together.
Transcript
JSPL | Quick Take
1
July 05, 2018 1
JSPL is part of OP Jindal Group with presence in steel, power and mining
sectors. JSPL has capacity of 10.6 MTPA crude steel and 3,400MW of power
generation capacity through its subsidiary Jindal Power Limited (JPL).
Capacity expansion done; EBIDTA/Tonne likely to improve: The company has
increased its crude steel capacity more than double in last five years from 3.6 MTPA
to 8.6 MTPA and currently running at ~50% utilization, However given the current
market scenario of steel demand we expect utilization level to improve to 80-85% in
next 7-8 months.
Further, Jindal Shadeed (OMAN subsidiary) with a crude steel capacity of 2MTPA
has ram up significantly in last three years and running at ~ 80% utilization we
expect the plant to reach to further utilization level of 85-90% going ahead. On
account of this we expect a combined output of crude steel to reach to 8.5-9 MTPA
by FY19.
Improvement in PLF and PPA going ahead: In FY18 JPL has signed a additional
250MW of PPA which makes it ~30% of installed capacity and it is in further
discussions with various utilities for signing of another 300MW PPA. Management
expects to generate ~1,700 MW units by FY19 owing to GOI’s effort to improve coal
availability with implementation of SHAKTI scheme.
Outlook & Valuation: JSPL is currently placed at an inflection point where it is
witnessing positive changes like (a) end of capex cycle and equipped with fully
operational Angul plant with 5 MTPA capacity, (b) increasing demand of power
going forward with expectation of signing new PPA at JPL, (c) monetization of few
assets like disinvestment of Tamnar- (EUP-I) 1,000 MW power plant and planning
for IPO of OMAN plant. Considering the company’s recent developments and
favorable business environment, we believe JSPL is trading at attractive valuation to
its peer, hence we recommend ACCUMULATE on the stock with Target Price of
`327 based on asset based approach of Steel segment on EV/Tonne basis and
Power segment on EV/MW basis.
Exhibit 1: Key Financials
Y/E March (` cr) FY16 FY17 FY18 FY19E FY20E
Net Sales 17,948 20,409 27,069 35,918 44,048
% chg (6) 14 33 33 23
EBIDTA 3,201 4,337 5,882 8,097 10,580
% chg (7) 35 36 38 31
EBITDA (%) 18% 21% 22% 23% 24%
EPS (Rs) (32) (26) (17) 1 20
P/E (x) - - - 216 10
P/BV (x) 0.6 0.7 0.7 0.7 0.6
RoE (%) - - - 0.3 5.9
RoCE (%) - 0.6 2.9 5.7 9.5
EV/EBITDA 19.9 13.8 10.1 7.3 5.2
Source: Company, Angel Research; Note: CMP as of July 05, 2018
BUY
CMP `212
Target Price `327
Investment Period 12 Months
Stock Info
Sector
Bloomberg Code JNSP IN
Shareholding Pattern (%)
Promoters 58.7
MF / Banks / Indian Fls 6.9
FII / NRIs / OCBs 19.2
Indian Public / Others 15.3
Abs.(%) 3m 1yr 3yr
Sensex 6.0 12.9 26.2
JSPL (7.0) 63.0 156.0
Beta 2.8
Steel & Pow er
Market Cap (` cr) 20,520
52 Week High / Low 294/112
Avg. Daily Volume 630,702
Face Value (`) 1
BSE Sensex 35,574
Nifty 10,750
Reuters Code JNSP.BO
3 years price performance
Source: C-line, Angel Research
Kripashankar Maurya
022 39357600, Extn: 6004
0
50
100
150
200
250
300
350
Jul-
15
Jan-1
6
Jul-
16
Jan-1
7
Jul-
17
Jan-1
8
Jul-
18
Jindal steel & Power
July 05, 2018
JSPL | Quick Take
2
July 05, 2018 2
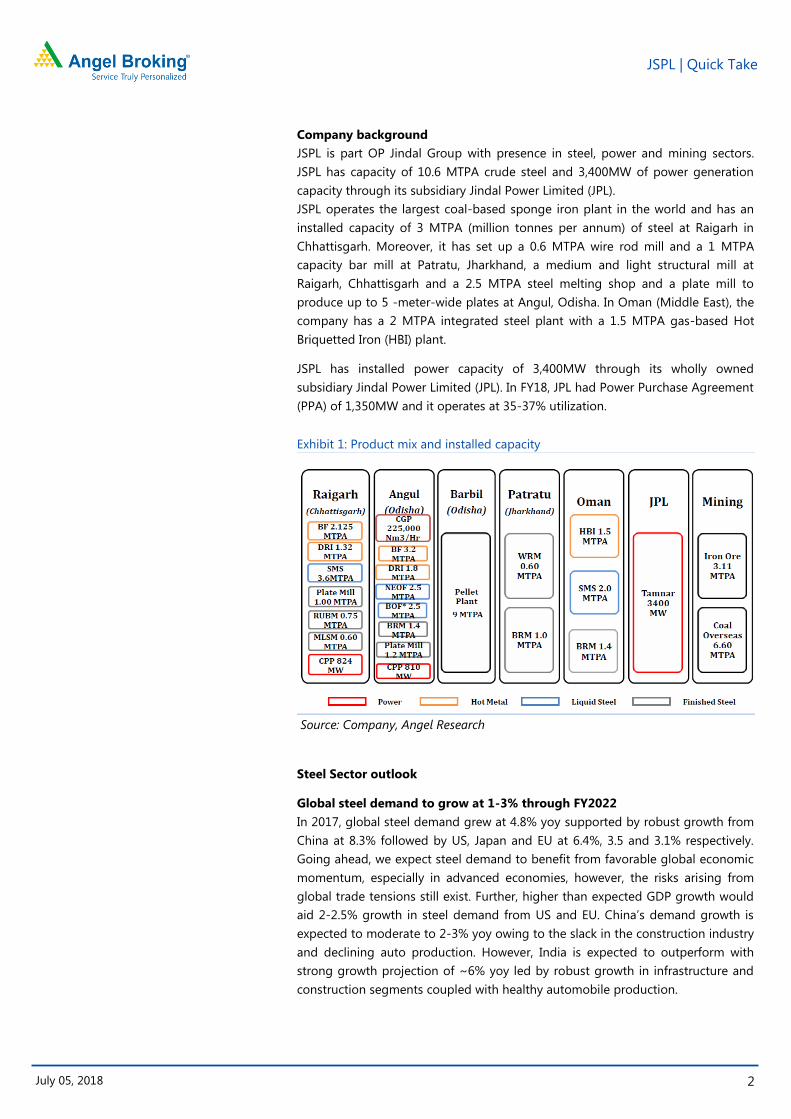
Company background
JSPL is part OP Jindal Group with presence in steel, power and mining sectors.
JSPL has capacity of 10.6 MTPA crude steel and 3,400MW of power generation
capacity through its subsidiary Jindal Power Limited (JPL).
JSPL operates the largest coal-based sponge iron plant in the world and has an
installed capacity of 3 MTPA (million tonnes per annum) of steel at Raigarh in
Chhattisgarh. Moreover, it has set up a 0.6 MTPA wire rod mill and a 1 MTPA
capacity bar mill at Patratu, Jharkhand, a medium and light structural mill at
Raigarh, Chhattisgarh and a 2.5 MTPA steel melting shop and a plate mill to
produce up to 5 -meter-wide plates at Angul, Odisha. In Oman (Middle East), the
company has a 2 MTPA integrated steel plant with a 1.5 MTPA gas-based Hot
Briquetted Iron (HBI) plant.
JSPL has installed power capacity of 3,400MW through its wholly owned
subsidiary Jindal Power Limited (JPL). In FY18, JPL had Power Purchase Agreement
(PPA) of 1,350MW and it operates at 35-37% utilization.
Exhibit 1: Product mix and installed capacity
Source: Company, Angel Research
Steel Sector outlook
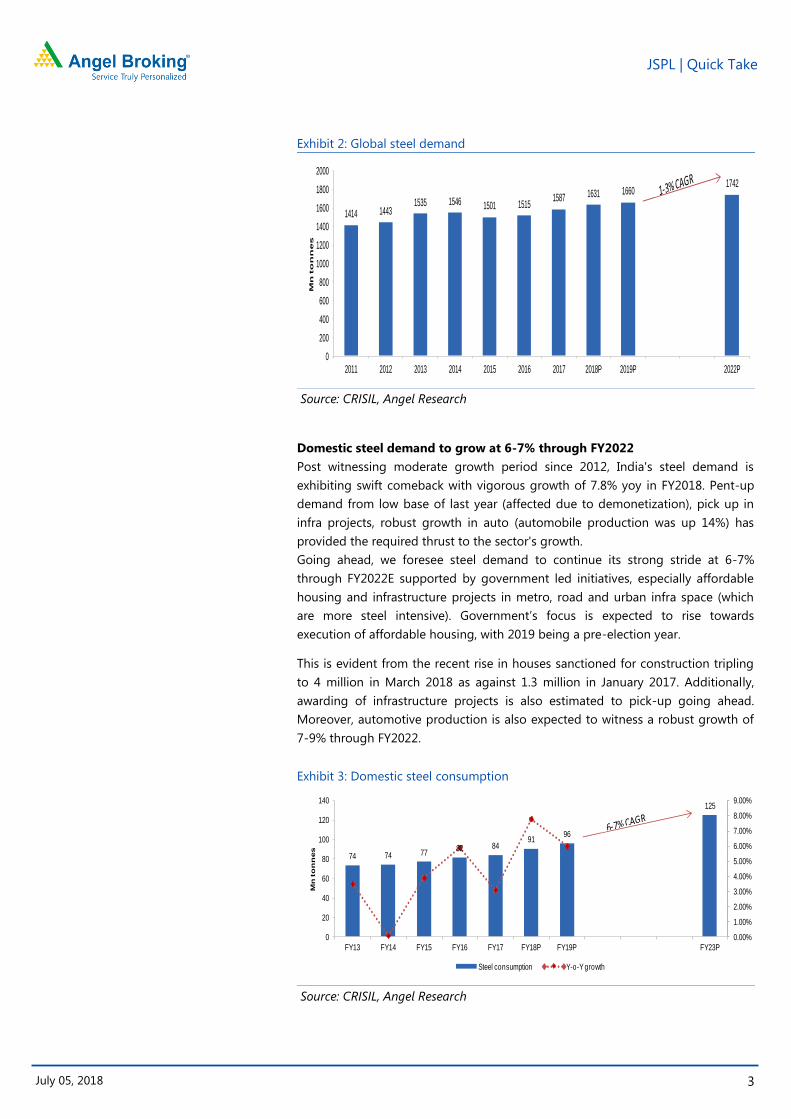
Global steel demand to grow at 1-3% through FY2022
In 2017, global steel demand grew at 4.8% yoy supported by robust growth from
China at 8.3% followed by US, Japan and EU at 6.4%, 3.5 and 3.1% respectively.
Going ahead, we expect steel demand to benefit from favorable global economic
momentum, especially in advanced economies, however, the risks arising from
global trade tensions still exist. Further, higher than expected GDP growth would
aid 2-2.5% growth in steel demand from US and EU. China’s demand growth is
expected to moderate to 2-3% yoy owing to the slack in the construction industry
and declining auto production. However, India is expected to outperform with
strong growth projection of ~6% yoy led by robust growth in infrastructure and
construction segments coupled with healthy automobile production.
JSPL | Quick Take
3
July 05, 2018 3
Exhibit 2: Global steel demand
Source: CRISIL, Angel Research
Domestic steel demand to grow at 6-7% through FY2022
Post witnessing moderate growth period since 2012, India's steel demand is
exhibiting swift comeback with vigorous growth of 7.8% yoy in FY2018. Pent-up
demand from low base of last year (affected due to demonetization), pick up in
infra projects, robust growth in auto (automobile production was up 14%) has
provided the required thrust to the sector's growth.
Going ahead, we foresee steel demand to continue its strong stride at 6-7%
through FY2022E supported by government led initiatives, especially affordable
housing and infrastructure projects in metro, road and urban infra space (which
are more steel intensive). Government’s focus is expected to rise towards
execution of affordable housing, with 2019 being a pre-election year.
This is evident from the recent rise in houses sanctioned for construction tripling
to 4 million in March 2018 as against 1.3 million in January 2017. Additionally,
awarding of infrastructure projects is also estimated to pick-up going ahead.
Moreover, automotive production is also expected to witness a robust growth of
7-9% through FY2022.
Exhibit 3: Domestic steel consumption
Source: CRISIL, Angel Research
1414 14431535 1546 1501 1515
1587 1631 16601742
0
200
400
600
800
1000
1200
1400
1600
1800
2000
2011 2012 2013 2014 2015 2016 2017 2018P 2019P 2022P
Mn
to
nn
es
74 74 7782 84
9196
125
0.00%
1.00%
2.00%
3.00%
4.00%
5.00%
6.00%
7.00%
8.00%
9.00%
0
20
40
60
80
100
120
140
FY13 FY14 FY15 FY16 FY17 FY18P FY19P FY23P
Mn
to
nn
es
Steel consumption Y-o-Y growth
JSPL | Quick Take
4
July 05, 2018 4
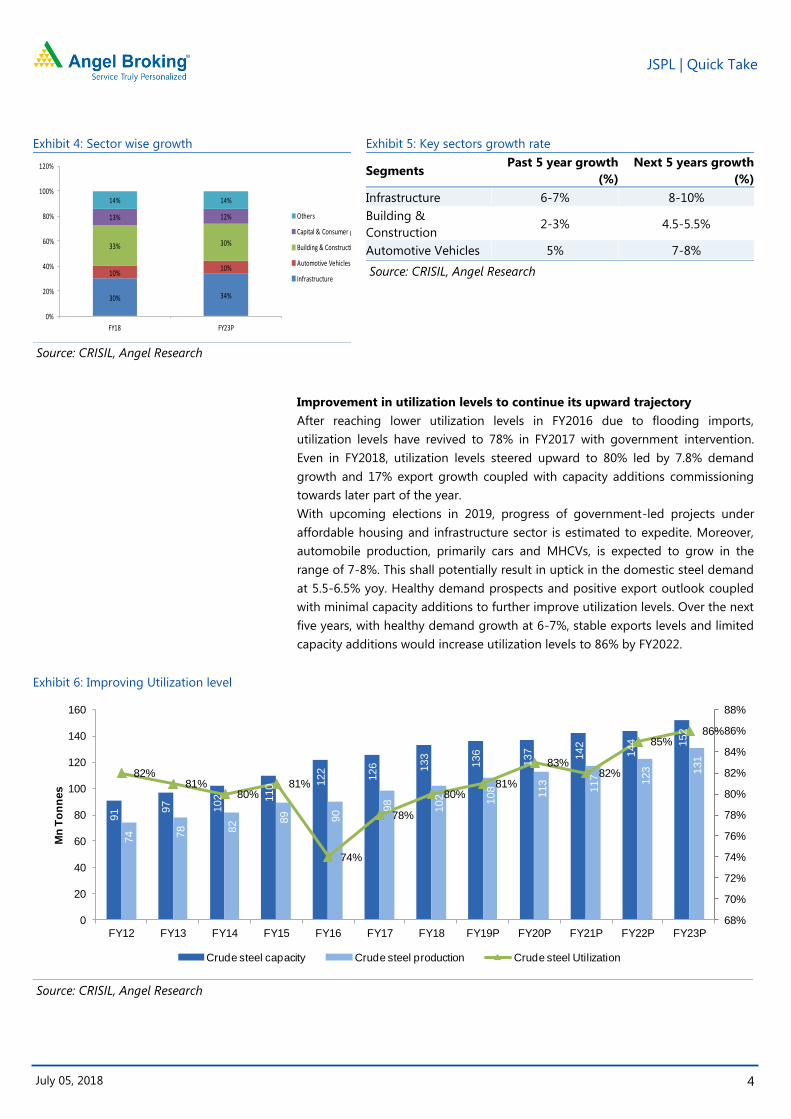
Exhibit 4: Sector wise growth
Source: CRISIL, Angel Research
Exhibit 5: Key sectors growth rate
Segments Past 5 year growth
(%)
Next 5 years growth
(%)
Infrastructure 6-7% 8-10%
Building &
Construction 2-3% 4.5-5.5%
Automotive Vehicles 5% 7-8%
Source: CRISIL, Angel Research
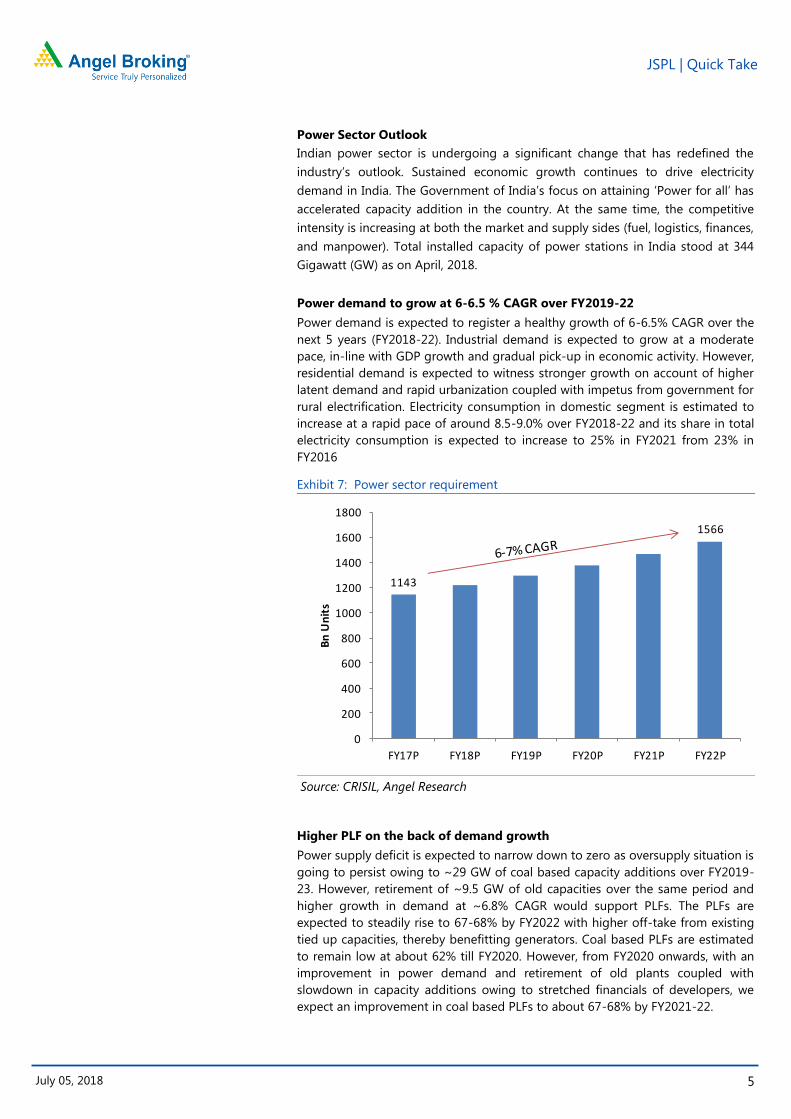
Improvement in utilization levels to continue its upward trajectory
After reaching lower utilization levels in FY2016 due to flooding imports,
utilization levels have revived to 78% in FY2017 with government intervention.
Even in FY2018, utilization levels steered upward to 80% led by 7.8% demand
growth and 17% export growth coupled with capacity additions commissioning
towards later part of the year.
With upcoming elections in 2019, progress of government-led projects under
affordable housing and infrastructure sector is estimated to expedite. Moreover,
automobile production, primarily cars and MHCVs, is expected to grow in the
range of 7-8%. This shall potentially result in uptick in the domestic steel demand
at 5.5-6.5% yoy. Healthy demand prospects and positive export outlook coupled
with minimal capacity additions to further improve utilization levels. Over the next
five years, with healthy demand growth at 6-7%, stable exports levels and limited
capacity additions would increase utilization levels to 86% by FY2022.
Exhibit 6: Improving Utilization level
Source: CRISIL, Angel Research
30% 34%
10%10%
33% 30%
13% 12%
14% 14%
0%
20%
40%
60%
80%
100%
120%
FY18 FY23P
Others
Capital & Consumer goods
Building & Construction
Automotive Vehicles
Infrastructure
91 9
7
102 110 1
22
126 133
136
137
142
144 152
74 78 82 8
9 90 9
8
102 108
113
117 123 131
82%81%
80%81%
74%
78%
80%81%
83%82%
85%86%
68%
70%
72%
74%
76%
78%
80%
82%
84%
86%
88%
0
20
40
60
80
100
120
140
160
FY12 FY13 FY14 FY15 FY16 FY17 FY18 FY19P FY20P FY21P FY22P FY23P
Mn
To
nn
es
Crude steel capacity Crude steel production Crude steel Utilization
JSPL | Quick Take
5
July 05, 2018 5
Power Sector Outlook
Indian power sector is undergoing a significant change that has redefined the
industry’s outlook. Sustained economic growth continues to drive electricity
demand in India. The Government of India’s focus on attaining ‘Power for all’ has
accelerated capacity addition in the country. At the same time, the competitive
intensity is increasing at both the market and supply sides (fuel, logistics, finances,
and manpower). Total installed capacity of power stations in India stood at 344
Gigawatt (GW) as on April, 2018.
Power demand to grow at 6-6.5 % CAGR over FY2019-22
Power demand is expected to register a healthy growth of 6-6.5% CAGR over the
next 5 years (FY2018-22). Industrial demand is expected to grow at a moderate
pace, in-line with GDP growth and gradual pick-up in economic activity. However,
residential demand is expected to witness stronger growth on account of higher
latent demand and rapid urbanization coupled with impetus from government for
rural electrification. Electricity consumption in domestic segment is estimated to
increase at a rapid pace of around 8.5-9.0% over FY2018-22 and its share in total
electricity consumption is expected to increase to 25% in FY2021 from 23% in
FY2016
Exhibit 7: Power sector requirement
Source: CRISIL, Angel Research
Higher PLF on the back of demand growth
Power supply deficit is expected to narrow down to zero as oversupply situation is
going to persist owing to ~29 GW of coal based capacity additions over FY2019-
23. However, retirement of ~9.5 GW of old capacities over the same period and
higher growth in demand at ~6.8% CAGR would support PLFs. The PLFs are
expected to steadily rise to 67-68% by FY2022 with higher off-take from existing
tied up capacities, thereby benefitting generators. Coal based PLFs are estimated
to remain low at about 62% till FY2020. However, from FY2020 onwards, with an
improvement in power demand and retirement of old plants coupled with
slowdown in capacity additions owing to stretched financials of developers, we
expect an improvement in coal based PLFs to about 67-68% by FY2021-22.
1143
1566
0
200
400
600
800
1000
1200
1400
1600
1800
FY17P FY18P FY19P FY20P FY21P FY22P
Bn
Un
its
JSPL | Quick Take
6
July 05, 2018 6
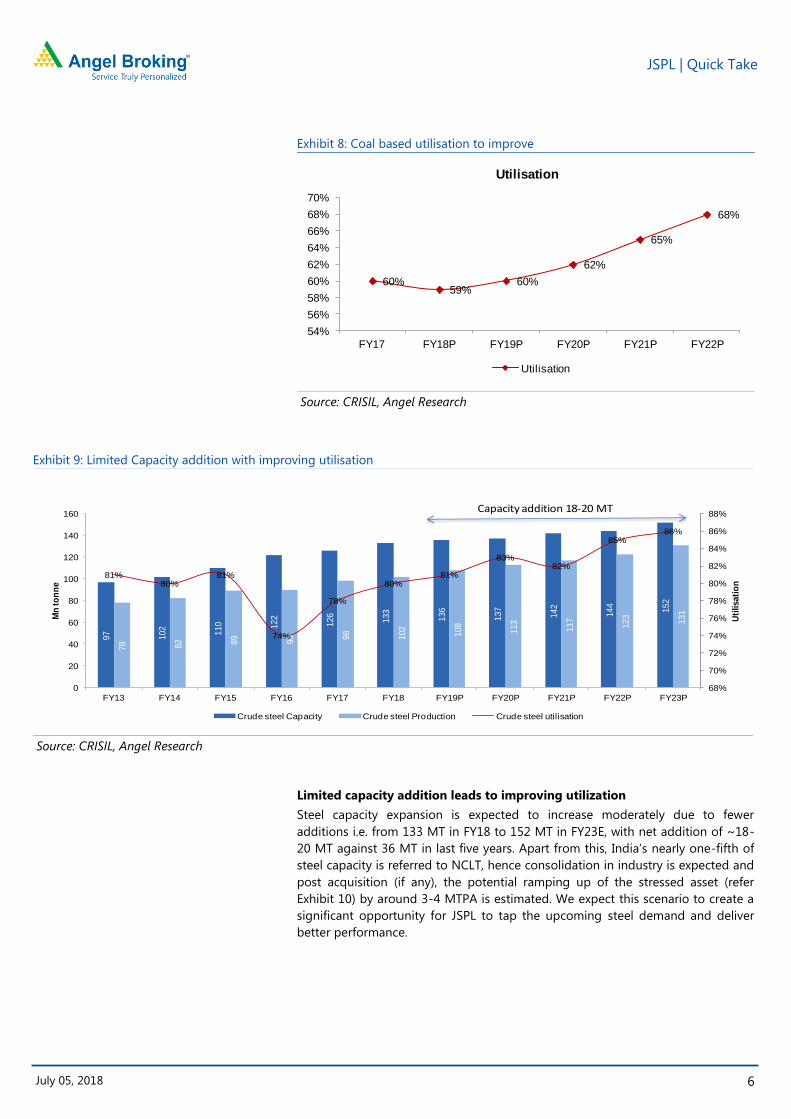
Exhibit 8: Coal based utilisation to improve
Source: CRISIL, Angel Research
Exhibit 9: Limited Capacity addition with improving utilisation
Source: CRISIL, Angel Research
Limited capacity addition leads to improving utilization
Steel capacity expansion is expected to increase moderately due to fewer
additions i.e. from 133 MT in FY18 to 152 MT in FY23E, with net addition of ~18-
20 MT against 36 MT in last five years. Apart from this, India’s nearly one-fifth of
steel capacity is referred to NCLT, hence consolidation in industry is expected and
post acquisition (if any), the potential ramping up of the stressed asset (refer
Exhibit 10) by around 3-4 MTPA is estimated. We expect this scenario to create a
significant opportunity for JSPL to tap the upcoming steel demand and deliver
better performance.
60%59%
60%
62%
65%
68%
54%
56%
58%
60%
62%
64%
66%
68%
70%
FY17 FY18P FY19P FY20P FY21P FY22P
Utilisation
Utilisation
97 102
110 122
126
133
136
137
142
144
152
78 82 89 90 98
102
108
113
117
123
131
81%80%
81%
74%
78%
80%81%
83%82%
85%86%
68%
70%
72%
74%
76%
78%
80%
82%
84%
86%
88%
0
20
40
60
80
100
120
140
160
FY13 FY14 FY15 FY16 FY17 FY18 FY19P FY20P FY21P FY22P FY23P
Uti
lisati
on
Mn
to
nn
e
Crude steel Capacity Crude steel Production Crude steel utilisation
Capacity addition 18-20 MT
JSPL | Quick Take
7
July 05, 2018 7
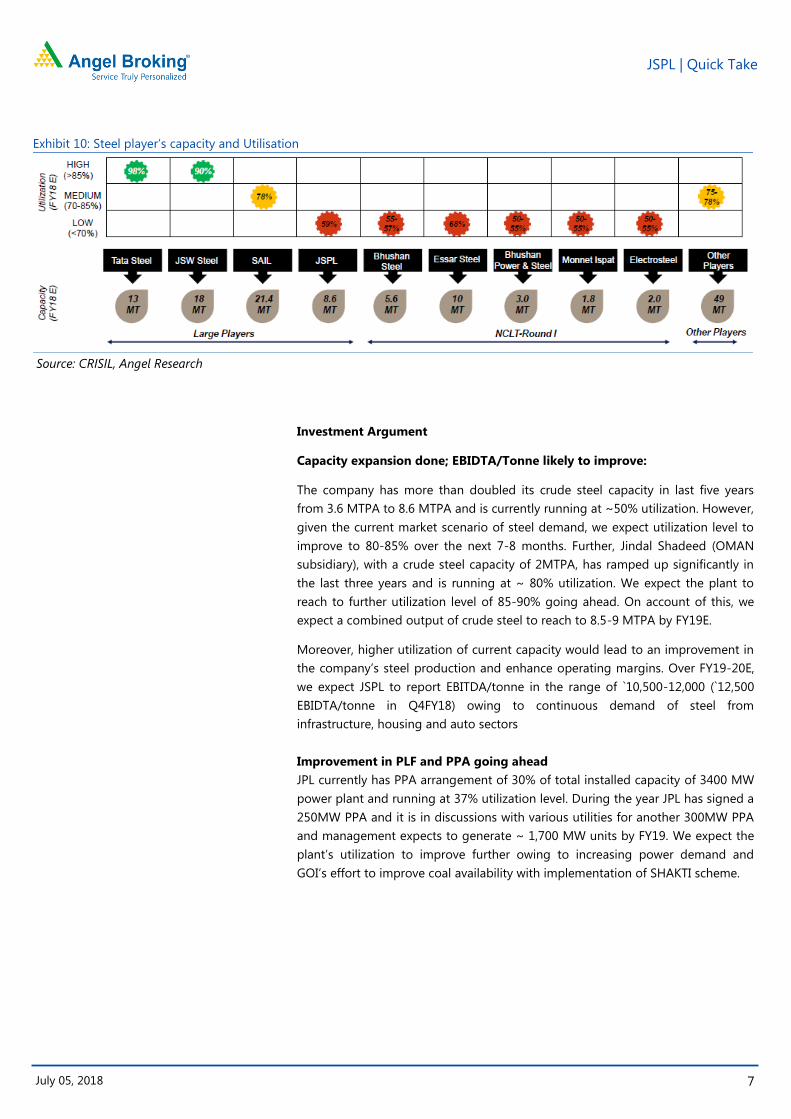
Exhibit 10: Steel player’s capacity and Utilisation
Source: CRISIL, Angel Research
Investment Argument
Capacity expansion done; EBIDTA/Tonne likely to improve:
The company has more than doubled its crude steel capacity in last five years
from 3.6 MTPA to 8.6 MTPA and is currently running at ~50% utilization. However,
given the current market scenario of steel demand, we expect utilization level to
improve to 80-85% over the next 7-8 months. Further, Jindal Shadeed (OMAN
subsidiary), with a crude steel capacity of 2MTPA, has ramped up significantly in
the last three years and is running at ~ 80% utilization. We expect the plant to
reach to further utilization level of 85-90% going ahead. On account of this, we
expect a combined output of crude steel to reach to 8.5-9 MTPA by FY19E.
Moreover, higher utilization of current capacity would lead to an improvement in
the company’s steel production and enhance operating margins. Over FY19-20E,
we expect JSPL to report EBITDA/tonne in the range of `10,500-12,000 (`12,500
EBIDTA/tonne in Q4FY18) owing to continuous demand of steel from
infrastructure, housing and auto sectors
Improvement in PLF and PPA going ahead
JPL currently has PPA arrangement of 30% of total installed capacity of 3400 MW
power plant and running at 37% utilization level. During the year JPL has signed a
250MW PPA and it is in discussions with various utilities for another 300MW PPA
and management expects to generate ~ 1,700 MW units by FY19. We expect the
plant’s utilization to improve further owing to increasing power demand and
GOI’s effort to improve coal availability with implementation of SHAKTI scheme.
JSPL | Quick Take
8
July 05, 2018 8
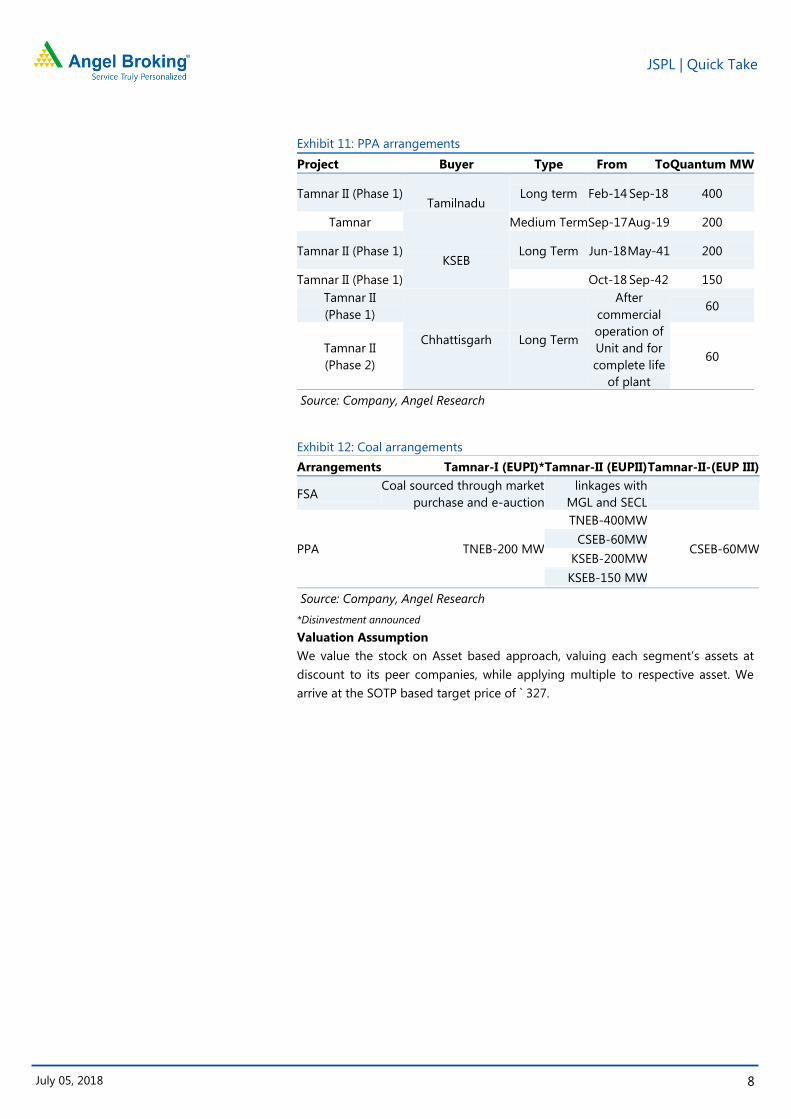
Exhibit 11: PPA arrangements
Project Buyer Type From To Quantum MW
Tamnar II (Phase 1) Tamilnadu
Long term Feb-14 Sep-18 400
Tamnar Medium Term Sep-17 Aug-19 200
Tamnar II (Phase 1) KSEB
Long Term Jun-18 May-41 200
Tamnar II (Phase 1)
Oct-18 Sep-42 150
Tamnar II
(Phase 1)
Chhattisgarh Long Term
After
commercial
operation of
Unit and for
complete life
of plant
60
Tamnar II
(Phase 2) 60
Source: Company, Angel Research
Exhibit 12: Coal arrangements
Arrangements Tamnar-I (EUPI)* Tamnar-II (EUPII) Tamnar-II-(EUP III)
FSA Coal sourced through market
purchase and e-auction
linkages with
MGL and SECL
PPA TNEB-200 MW
TNEB-400MW
CSEB-60MW CSEB-60MW
KSEB-200MW
KSEB-150 MW
Source: Company, Angel Research
*Disinvestment announced
Valuation Assumption
We value the stock on Asset based approach, valuing each segment’s assets at
discount to its peer companies, while applying multiple to respective asset. We
arrive at the SOTP based target price of ` 327.
JSPL | Quick Take
9
July 05, 2018 9
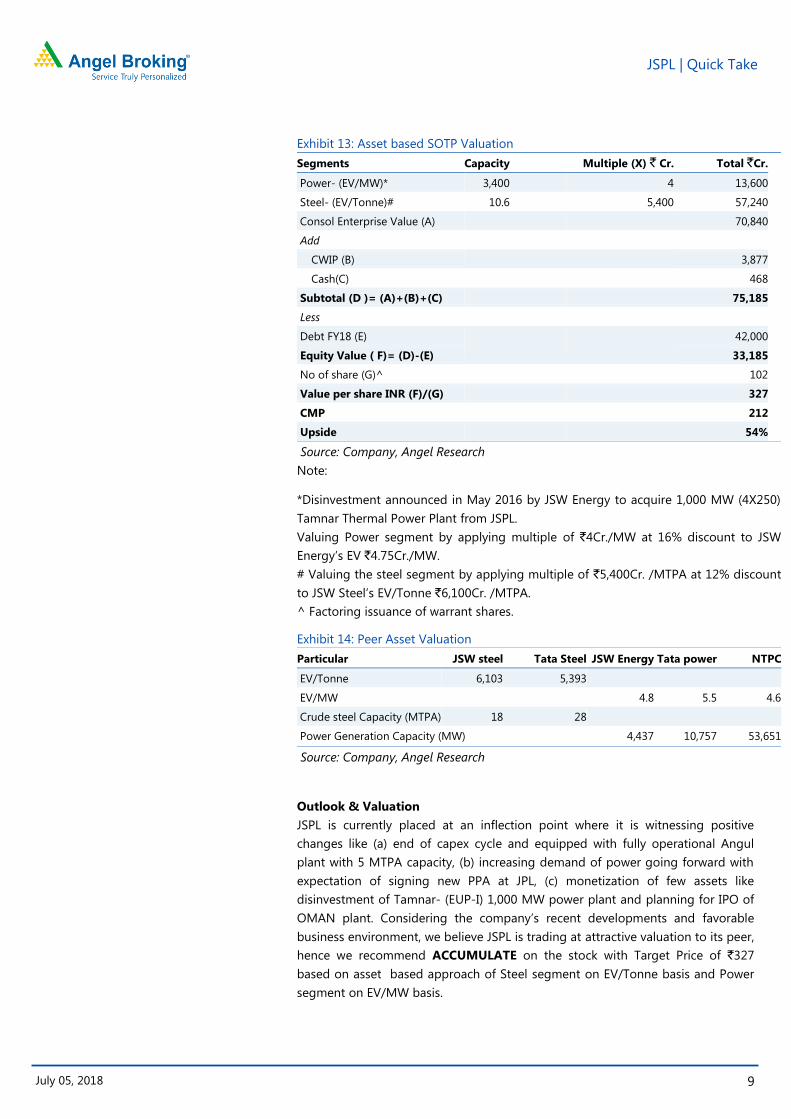
Exhibit 13: Asset based SOTP Valuation
Segments Capacity Multiple (X) ` Cr. Total `Cr.
Power- (EV/MW)* 3,400 4 13,600
Steel- (EV/Tonne)# 10.6 5,400 57,240
Consol Enterprise Value (A) 70,840
Add
CWIP (B)
3,877
Cash(C)
468
Subtotal (D )= (A)+(B)+(C) 75,185
Less
Debt FY18 (E) 42,000
Equity Value ( F)= (D)-(E)
33,185
No of share (G)^
102
Value per share INR (F)/(G) 327
CMP
212
Upside 54%
Source: Company, Angel Research
Note:
*Disinvestment announced in May 2016 by JSW Energy to acquire 1,000 MW (4X250)
Tamnar Thermal Power Plant from JSPL.
Valuing Power segment by applying multiple of `4Cr./MW at 16% discount to JSW
Energy’s EV `4.75Cr./MW.
# Valuing the steel segment by applying multiple of `5,400Cr. /MTPA at 12% discount
to JSW Steel’s EV/Tonne `6,100Cr. /MTPA.
^ Factoring issuance of warrant shares.
Exhibit 14: Peer Asset Valuation
Particular JSW steel Tata Steel JSW Energy Tata power NTPC
EV/Tonne 6,103 5,393
EV/MW
4.8 5.5 4.6
Crude steel Capacity (MTPA) 18 28
Power Generation Capacity (MW) 4,437 10,757 53,651
Source: Company, Angel Research
Outlook & Valuation
JSPL is currently placed at an inflection point where it is witnessing positive
changes like (a) end of capex cycle and equipped with fully operational Angul
plant with 5 MTPA capacity, (b) increasing demand of power going forward with
expectation of signing new PPA at JPL, (c) monetization of few assets like
disinvestment of Tamnar- (EUP-I) 1,000 MW power plant and planning for IPO of
OMAN plant. Considering the company’s recent developments and favorable
business environment, we believe JSPL is trading at attractive valuation to its peer,
hence we recommend ACCUMULATE on the stock with Target Price of `327
based on asset based approach of Steel segment on EV/Tonne basis and Power
segment on EV/MW basis.
JSPL | Quick Take
10
July 05, 2018 10
Key risks
Shortage of coal
The major threat for the company is the shortage and higher coal prices going
forward, which may affect the power segment adversely.
Excess supply of steel
Resolution in NCLT phase I is a key, any material improvement in utilization of this
group company may stabilizes or reduce steel price in future. However, this plant
is already running at 60-70% utilization level.
Softening of steel prices
Any slowdown of investments in key steel consuming sector such as
infrastructure, housing and auto may trigger lower demand of steel, which could
lead to subdued steel prices.
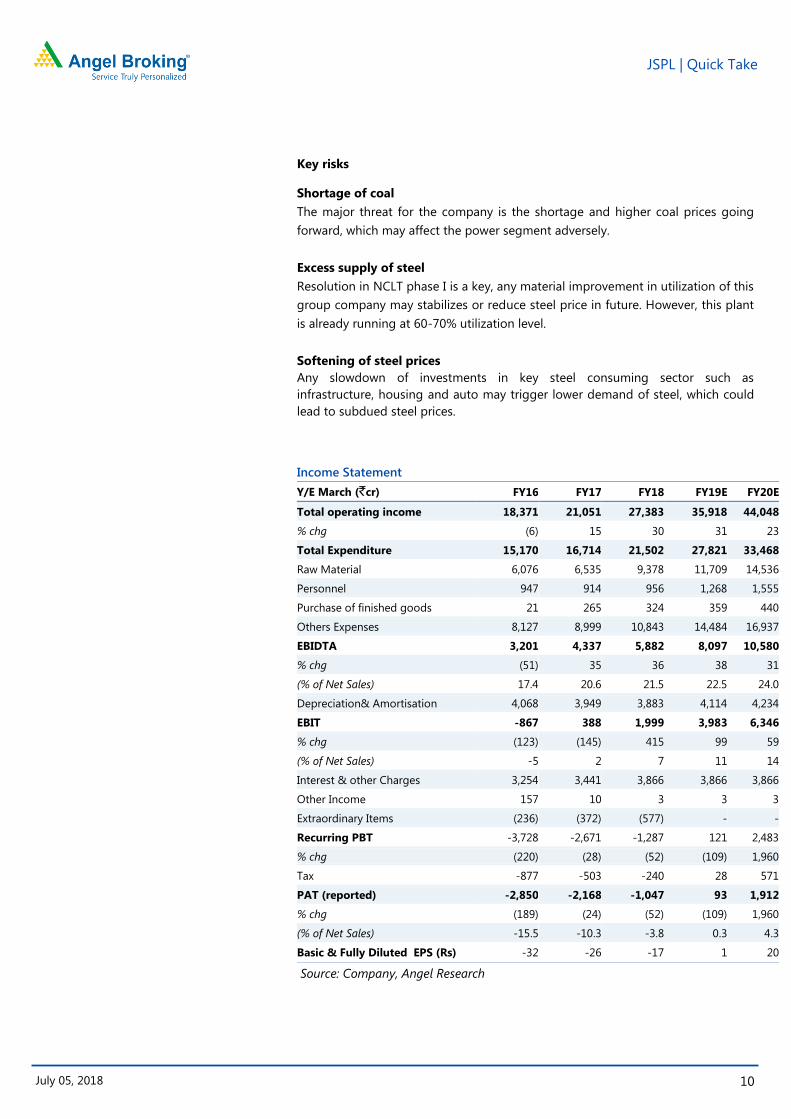
Income Statement
Y/E March (`cr) FY16 FY17 FY18 FY19E FY20E
Total operating income 18,371 21,051 27,383 35,918 44,048
% chg (6) 15 30 31 23
Total Expenditure 15,170 16,714 21,502 27,821 33,468
Raw Material 6,076 6,535 9,378 11,709 14,536
Personnel 947 914 956 1,268 1,555
Purchase of finished goods 21 265 324 359 440
Others Expenses 8,127 8,999 10,843 14,484 16,937
EBIDTA 3,201 4,337 5,882 8,097 10,580
% chg (51) 35 36 38 31
(% of Net Sales) 17.4 20.6 21.5 22.5 24.0
Depreciation& Amortisation 4,068 3,949 3,883 4,114 4,234
EBIT -867 388 1,999 3,983 6,346
% chg (123) (145) 415 99 59
(% of Net Sales) -5 2 7 11 14
Interest & other Charges 3,254 3,441 3,866 3,866 3,866
Other Income 157 10 3 3 3
Extraordinary Items (236) (372) (577) - -
Recurring PBT -3,728 -2,671 -1,287 121 2,483
% chg (220) (28) (52) (109) 1,960
Tax -877 -503 -240 28 571
PAT (reported) -2,850 -2,168 -1,047 93 1,912
% chg (189) (24) (52) (109) 1,960
(% of Net Sales) -15.5 -10.3 -3.8 0.3 4.3
Basic & Fully Diluted EPS (Rs) -32 -26 -17 1 20
Source: Company, Angel Research
JSPL | Quick Take
11
July 05, 2018 11
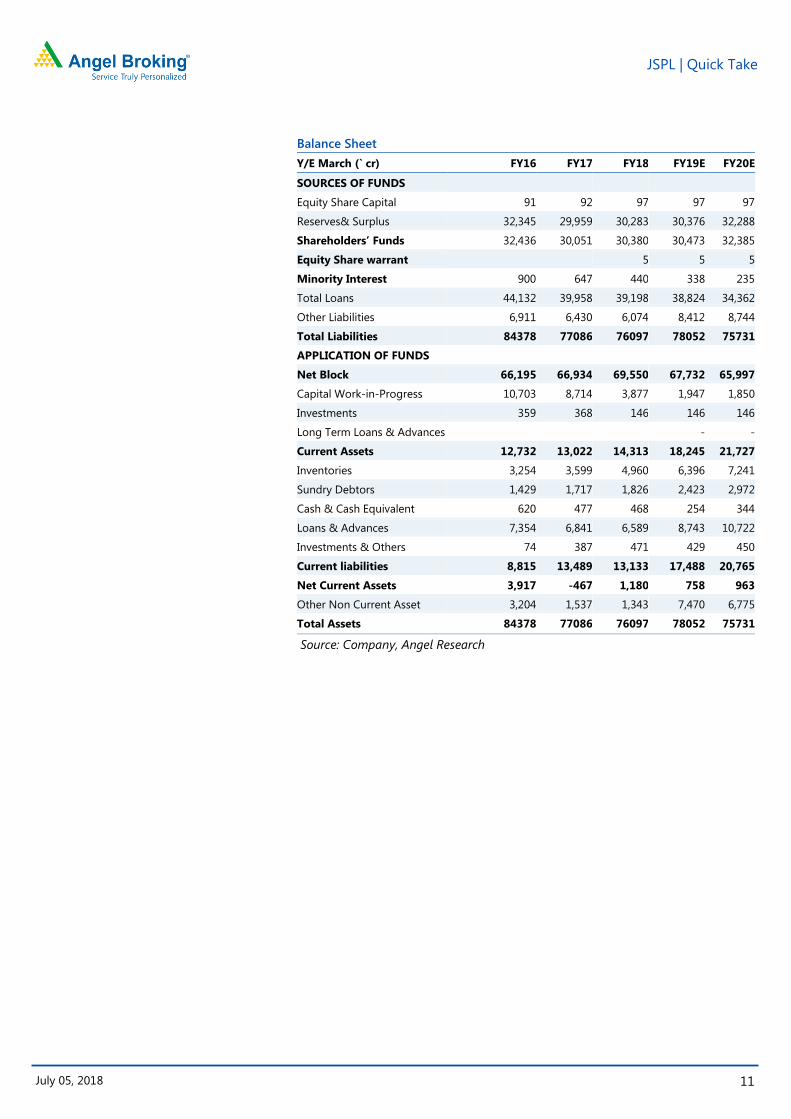
Balance Sheet
Y/E March (` cr) FY16 FY17 FY18 FY19E FY20E
SOURCES OF FUNDS
Equity Share Capital 91 92 97 97 97
Reserves& Surplus 32,345 29,959 30,283 30,376 32,288
Shareholders’ Funds 32,436 30,051 30,380 30,473 32,385
Equity Share warrant
5 5 5
Minority Interest 900 647 440 338 235
Total Loans 44,132 39,958 39,198 38,824 34,362
Other Liabilities 6,911 6,430 6,074 8,412 8,744
Total Liabilities 84378 77086 76097 78052 75731
APPLICATION OF FUNDS
Net Block 66,195 66,934 69,550 67,732 65,997
Capital Work-in-Progress 10,703 8,714 3,877 1,947 1,850
Investments 359 368 146 146 146
Long Term Loans & Advances
- -
Current Assets 12,732 13,022 14,313 18,245 21,727
Inventories 3,254 3,599 4,960 6,396 7,241
Sundry Debtors 1,429 1,717 1,826 2,423 2,972
Cash & Cash Equivalent 620 477 468 254 344
Loans & Advances 7,354 6,841 6,589 8,743 10,722
Investments & Others 74 387 471 429 450
Current liabilities 8,815 13,489 13,133 17,488 20,765
Net Current Assets 3,917 -467 1,180 758 963
Other Non Current Asset 3,204 1,537 1,343 7,470 6,775
Total Assets 84378 77086 76097 78052 75731
Source: Company, Angel Research
JSPL | Quick Take
12
July 05, 2018 12
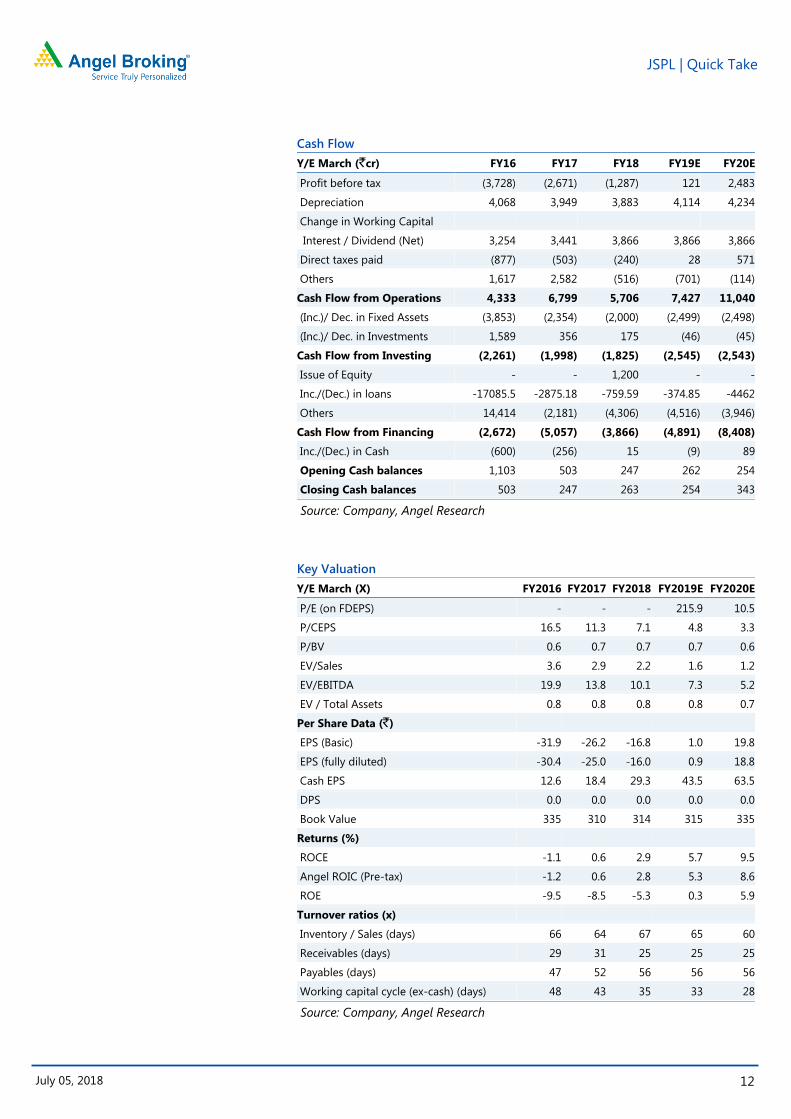
Cash Flow
Y/E March (`cr) FY16 FY17 FY18 FY19E FY20E
Profit before tax (3,728) (2,671) (1,287) 121 2,483
Depreciation 4,068 3,949 3,883 4,114 4,234
Change in Working Capital
Interest / Dividend (Net) 3,254 3,441 3,866 3,866 3,866
Direct taxes paid (877) (503) (240) 28 571
Others 1,617 2,582 (516) (701) (114)
Cash Flow from Operations 4,333 6,799 5,706 7,427 11,040
(Inc.)/ Dec. in Fixed Assets (3,853) (2,354) (2,000) (2,499) (2,498)
(Inc.)/ Dec. in Investments 1,589 356 175 (46) (45)
Cash Flow from Investing (2,261) (1,998) (1,825) (2,545) (2,543)
Issue of Equity - - 1,200 - -
Inc./(Dec.) in loans -17085.5 -2875.18 -759.59 -374.85 -4462
Others 14,414 (2,181) (4,306) (4,516) (3,946)
Cash Flow from Financing (2,672) (5,057) (3,866) (4,891) (8,408)
Inc./(Dec.) in Cash (600) (256) 15 (9) 89
Opening Cash balances 1,103 503 247 262 254
Closing Cash balances 503 247 263 254 343
Source: Company, Angel Research
Key Valuation
Y/E March (X) FY2016 FY2017 FY2018 FY2019E FY2020E
P/E (on FDEPS) - - - 215.9 10.5
P/CEPS 16.5 11.3 7.1 4.8 3.3
P/BV 0.6 0.7 0.7 0.7 0.6
EV/Sales 3.6 2.9 2.2 1.6 1.2
EV/EBITDA 19.9 13.8 10.1 7.3 5.2
EV / Total Assets 0.8 0.8 0.8 0.8 0.7
Per Share Data (`)
EPS (Basic) -31.9 -26.2 -16.8 1.0 19.8
EPS (fully diluted) -30.4 -25.0 -16.0 0.9 18.8
Cash EPS 12.6 18.4 29.3 43.5 63.5
DPS 0.0 0.0 0.0 0.0 0.0
Book Value 335 310 314 315 335
Returns (%)
ROCE -1.1 0.6 2.9 5.7 9.5
Angel ROIC (Pre-tax) -1.2 0.6 2.8 5.3 8.6
ROE -9.5 -8.5 -5.3 0.3 5.9
Turnover ratios (x)
Inventory / Sales (days) 66 64 67 65 60
Receivables (days) 29 31 25 25 25
Payables (days) 47 52 56 56 56
Working capital cycle (ex-cash) (days) 48 43 35 33 28
Source: Company, Angel Research
JSPL | Quick Take
13
July 05, 2018 13
Research Team Tel: 022 - 39357800 E-mail: [email protected] Website: www.angelbroking.com
DISCLAIMER
DISCLAIMER:
Angel Broking Private Limited (hereinafter referred to as “Angel”) is a registered Member of National Stock Exchange of India Limited,
Bombay Stock Exchange Limited and Metropolitan Stock Exchange Limited. It is also registered as a Depository Participant with CDSL
and Portfolio Manager and Investment Adviser with SEBI. It also has registration with AMFI as a Mutual Fund Distributor. Angel
Broking Private Limited is a registered entity with SEBI for Research Analyst in terms of SEBI (Research Analyst) Regulations, 2014
vide registration number INH000000164. Angel or its associates has not been debarred/ suspended by SEBI or any other regulatory
authority for accessing /dealing in securities Market. Angel or its associates/analyst has not received any compensation / managed or
co-managed public offering of securities of the company covered by Analyst during the past twelve months.
This document is solely for the personal information of the recipient, and must not be singularly used as the basis of any investment
decision. Nothing in this document should be construed as investment or financial advice. Each recipient of this document should
make such investigations as they deem necessary to arrive at an independent evaluation of an investment in the securities of the
companies referred to in this document (including the merits and risks involved), and should consult their own advisors to determine
the merits and risks of such an investment.
Reports based on technical and derivative analysis center on studying charts of a stock's price movement, outstanding positions and
trading volume, as opposed to focusing on a company's fundamentals and, as such, may not match with a report on a company's
fundamentals. Investors are advised to refer the Fundamental and Technical Research Reports available on our website to evaluate the
contrary view, if any
The information in this document has been printed on the basis of publicly available information, internal data and other reliable
sources believed to be true, but we do not represent that it is accurate or complete and it should not be relied on as such, as this
document is for general guidance only. Angel Broking Pvt. Limited or any of its affiliates/ group companies shall not be in any way
responsible for any loss or damage that may arise to any person from any inadvertent error in the information contained in this
report. Angel Broking Pvt. Limited has not independently verified all the information contained within this document. Accordingly, we
cannot testify, nor make any representation or warranty, express or implied, to the accuracy, contents or data contained within this
document. While Angel Broking Pvt. Limited endeavors to update on a reasonable basis the information discussed in this material,
there may be regulatory, compliance, or other reasons that prevent us from doing so.
This document is being supplied to you solely for your information, and its contents, information or data may not be reproduced,
redistributed or passed on, directly or indirectly.
Neither Angel Broking Pvt. Limited, nor its directors, employees or affiliates shall be liable for any loss or damage that may arise from
or in connection with the use of this information.
Disclosure of Interest Statement Company Name
1. Financial interest of research analyst or Angel or his Associate or his relative No
2. Ownership of 1% or more of the stock by research analyst or Angel or associates or
relatives
No
3. Served as an officer, director or employee of the company covered under Research No
4. Broking relationship with company covered under Research No
Related Documents