Angel Broking Ltd : BSE Sebi Regn No : INB 010996539 / CDSL Regn No: IN - DP - CDSL - 234 - 2004 / PMS Regn Code: PM/INP000001546 Angel Capital & Debt Market Ltd: INB 231279838 / NSE FNO: INF 231279838 / NSE Member code -12798 Angel Commodities Broking (P) Ltd: MCX Member ID: 12685 / FMC Regn No: MCX / TCM / CORP / 0037 NCDEX : Member ID 00220 / FMC Regn No: NCDEX / TCM / CORP / 0302 Note: Stock Prices are as on Report release date; Refer all Detailed Reports on Angel website Indices Jan Jan. Jan. Weekly YTD 01, 09 16, 09 23, 09 (% chg) BSE 30 9,647 9,324 8,674 (7.0) (10.1) NSE 2,959 2,828 2,679 (5.3) (9.5) Nasdaq 1,577 1,529 1,477 (3.4) (6.3) DOW 8,776 8,281 8,078 (2.5) (8.0) Nikkei 8,860 8,230 7,745 (5.9) (12.6) HangSeng 14,388 13,256 12,579 (5.1) (12.6) Straits Times 1,762 1,730 1,685 (2.6) (4.3) Shanghai Composite 1,821 1,954 1,991 1.9 9.3 KLSE Composite 877 896 873 (2.7) (0.5) Jakarta Composite 1,355 1,364 1,316 (3.5) (2.9) KOSPI Composite 1,125 1,135 1,093 (3.7) (2.8) Sectoral Indices BANKEX 5,455 5,038 4,485 (11.0) (17.8) BSE AUTO 2,445 2,552 2,371 (7.1) (3.0) BSE IT 2,228 2,185 2,069 (5.3) (7.1) BSE PSU 5,280 5,086 4,881 (4.0) (7.6) Angel Broking Service Truly Personalized TM January 24, 2009 Markets continue downslide on weak global cues, mixed Results Amidst highly volatile sessions, markets continued their downslide during the week with the benchmark indices, the BSE Sensex and the S&P CNX Nifty finally ending the week with loses of around 7.0% and 5.3% respectively. The ongoing Result season remained the key focus with several bigwigs including Reliance Industries, Bharti Airtel, Hero Honda, Wipro, Ranbaxy, Dr Reddy's, etc. declaring their results during the week. Though the results were mixed with few large companies beating street expectations, it failed to cheer the broader markets. The Inflation data, which came in higher at 5.60% compared to 5.24% in the previous week, also dragged the Indices further into the red. On Monday, after a positive opening tracking firm Asian markets, the Indian markets traded volatile through the day and finally ended the session with marginal gains of 0.1%. Nevertheless, on Tuesday, the key indices opened weak on concerns that the increasing woes of the global financial markets would deepen the world's economic downturn. Markets were in the red through the day and finally ended 2.5% lower. The power stocks hogged limelight through the session post announcement of the revised Central Electricity Regulatory Commission (CERC) order, which increased the cap on Return on Equity (RoE) of central power utilities from the existing 14% to 15.5-16% range. Negative global cues continued to weigh heavily during Wednesday's trading session as investor confidence waned on renewed worries that the global economic crisis may last longer than expected. US president Barrack Obama's inaugural speech overnight too failed to lift sentiments as investors' appetite for risky equities waned. Nonetheless, markets bucked the falling trend on Thursday on the back of positive global cues. Moreover, market regulator SEBI's directive asking promoters of listed companies to disclose their pledged shares, if any, with lenders also boosted sentiments. However, caution gripped markets after a strong start as key benchmark indices eased from the day's high weighed down by bellwether Reliance Industries (RIL), which slipped into the red, with street anticipating subdued results. Finally, the key benchmark indices ended in the green logging small gains in what was a highly choppy trading session. On Friday, markets were back on losing streak driven largely by weak global cues. Even a good show by RIL was over-weighed by the weak performance of Banking, Metal and Capital Goods stocks. BSE Realty Index- Macro-economic concerns continue to haunt For the week, the BSE Realty Index underperformed the broader markets closing 12.2% lower v/s 7.0% fall in the Sensex. DLF, Indian Bulls Real Estate (IBREL) and Unitech which have maximum weightage in the BSE Realty Index were the major losers. DLF dragged down the index crashing 17.5%. IBREL and Unitech further pulled down the index declining by a substantial 16.1% and 10.5% respectively. Most other companies in the Realty index too fell in line with the larger players barring Akruti City, which was the sole gainer moving up a good 25.5%. This poor performance by the Realty Index was in line with our expectations and we expect the index to be an underperformer until the macro environment improves with the interest rates reverting back to lows of 5-6%, housing prices correcting to affordable levels and the economy bouncing back to higher growth trajectory, among others. FII activity during the Week Rs crore As Cash Stock Index Net on (Equity) Futures Futures Activity Jan 16 (563) 130 646 213 Jan 19 (440) (90) (123) (652) Jan 20 (292) 61 15 (217) Jan 21 (762) 46 (713) (1,429) Jan 22 (251) 202 229 180 Net (2,309) 349 54 (1,905) Mutual Fund activity during the Week Rs crore As on Purchase Sales Net Activity (Equity) Jan 16 611 326 285 Jan 19 238 126 112 Jan 20 281 403 (122) Jan 21 251 505 (254) Jan 22 351 488 (137) Net 1,731 1,848 (116)

Welcome message from author
This document is posted to help you gain knowledge. Please leave a comment to let me know what you think about it! Share it to your friends and learn new things together.
Transcript
Angel Broking Ltd : BSE Sebi Regn No : INB 010996539 / CDSL Regn No: IN - DP - CDSL - 234 - 2004 / PMS Regn Code: PM/INP000001546 Angel Capital & Debt Market Ltd: INB 231279838 / NSE FNO: INF 231279838 / NSE Member code -12798Angel Commodities Broking (P) Ltd: MCX Member ID: 12685 / FMC Regn No: MCX / TCM / CORP / 0037 NCDEX : Member ID 00220 / FMC Regn No: NCDEX / TCM / CORP / 0302
Note: Stock Prices are as on Report release date;Refer all Detailed Reports on Angel website
Indices Jan Jan. Jan. Weekly YTD01, 09 16, 09 23, 09 (% chg)
BSE 30 9,647 9,324 8,674 (7.0) (10.1)NSE 2,959 2,828 2,679 (5.3) (9.5)Nasdaq 1,577 1,529 1,477 (3.4) (6.3)DOW 8,776 8,281 8,078 (2.5) (8.0)Nikkei 8,860 8,230 7,745 (5.9) (12.6)HangSeng 14,388 13,256 12,579 (5.1) (12.6)Straits Times 1,762 1,730 1,685 (2.6) (4.3)Shanghai Composite 1,821 1,954 1,991 1.9 9.3KLSE Composite 877 896 873 (2.7) (0.5)Jakarta Composite 1,355 1,364 1,316 (3.5) (2.9)KOSPI Composite 1,125 1,135 1,093 (3.7) (2.8)Sectoral IndicesBANKEX 5,455 5,038 4,485 (11.0) (17.8)BSE AUTO 2,445 2,552 2,371 (7.1) (3.0)BSE IT 2,228 2,185 2,069 (5.3) (7.1)BSE PSU 5,280 5,086 4,881 (4.0) (7.6)
Angel BrokingService Truly Personalized
TM
January 24, 2009
Markets continue downslide on weak global cues, mixed ResultsAmidst highly volatile sessions, markets continued their downslide during the week with the benchmark indices, the BSE Sensexand the S&P CNX Nifty finally ending the week with loses of around 7.0% and 5.3% respectively. The ongoing Result seasonremained the key focus with several bigwigs including Reliance Industries, Bharti Airtel, Hero Honda, Wipro, Ranbaxy, Dr Reddy's,etc. declaring their results during the week. Though the results were mixed with few large companies beating street expectations,it failed to cheer the broader markets. The Inflation data, which came in higher at 5.60% compared to 5.24% in the previous week,also dragged the Indices further into the red.On Monday, after a positive opening tracking firm Asian markets, the Indian markets traded volatile through the day and finallyended the session with marginal gains of 0.1%. Nevertheless, on Tuesday, the key indices opened weak on concerns that theincreasing woes of the global financial markets would deepen the world's economic downturn. Markets were in the red throughthe day and finally ended 2.5% lower. The power stocks hogged limelight through the session post announcement of the revisedCentral Electricity Regulatory Commission (CERC) order, which increased the cap on Return on Equity (RoE) of central powerutilities from the existing 14% to 15.5-16% range.Negative global cues continued to weigh heavily during Wednesday's trading session as investor confidence waned on renewedworries that the global economic crisis may last longer than expected. US president Barrack Obama's inaugural speech overnighttoo failed to lift sentiments as investors' appetite for risky equities waned. Nonetheless, markets bucked the falling trend onThursday on the back of positive global cues. Moreover, market regulator SEBI's directive asking promoters of listed companiesto disclose their pledged shares, if any, with lenders also boosted sentiments. However, caution gripped markets after a strongstart as key benchmark indices eased from the day's high weighed down by bellwether Reliance Industries (RIL), which slippedinto the red, with street anticipating subdued results. Finally, the key benchmark indices ended in the green logging small gainsin what was a highly choppy trading session. On Friday, markets were back on losing streak driven largely by weak global cues.Even a good show by RIL was over-weighed by the weak performance of Banking, Metal and Capital Goods stocks.BSE Realty Index- Macro-economic concerns continue to hauntFor the week, the BSE Realty Index underperformed the broader markets closing 12.2% lower v/s 7.0% fall in the Sensex. DLF,Indian Bulls Real Estate (IBREL) and Unitech which have maximum weightage in the BSE Realty Index were the major losers.DLF dragged down the index crashing 17.5%. IBREL and Unitech further pulled down the index declining by a substantial 16.1%and 10.5% respectively. Most other companies in the Realty index too fell in line with the larger players barring Akruti City, whichwas the sole gainer moving up a good 25.5%. This poor performance by the Realty Index was in line with our expectations and weexpect the index to be an underperformer until the macro environment improves with the interest rates reverting back to lows of5-6%, housing prices correcting to affordable levels and the economy bouncing back to higher growth trajectory, among others.
FII activity during the Week Rs crore
As Cash Stock Index Neton (Equity) Futures Futures ActivityJan 16 (563) 130 646 213Jan 19 (440) (90) (123) (652)Jan 20 (292) 61 15 (217)Jan 21 (762) 46 (713) (1,429)Jan 22 (251) 202 229 180
Net (2,309) 349 54 (1,905)Mutual Fund activity during the Week Rs croreAs on Purchase Sales Net Activity (Equity)Jan 16 611 326 285Jan 19 238 126 112Jan 20 281 403 (122)Jan 21 251 505 (254)Jan 22 351 488 (137)Net 1,731 1,848 (116)
Angel Broking Ltd : BSE Sebi Regn No : INB 010996539 / CDSL Regn No: IN - DP - CDSL - 234 - 2004 / PMS Regn Code: PM/INP000001546 Angel Capital & Debt Market Ltd: INB 231279838 / NSE FNO: INF 231279838 / NSE Member code -12798
For Private Circulation Only
Angel BrokingService Truly Personalized
TM
2
Fundamental Focus
Event Update
CERC Tariff Regulations for FY2009-14
CERC Tariff Order for FY2009-14 - Marginally positivefor central power utilities
The Central Electricity Regulatory Commission (CERC) hasreleased the Tariff regulations for the central power utilities forFY2009-14. The current Tariff Order has numerous changescompared to the Tariff Order for FY2004-09. The CERC hasstated that the regulations have been framed keeping in mindthe ongoing slowdown in the economy and is aimed atattracting more investments into the Indian Power Sector. Themost important change is the increase in the cap on Return onEquity (RoE) of central power utilities from 14% to 15.5%. Webelieve enhanced RoE will have a positive impact on centralpower utilities. Moreover, the changes in the CERC regulationsare expected to prompt other public and private power utilitiesunder the purview of various state electricity regulations to seekchanges in their respective Tariff structures as well.
Among the stocks under our coverage, NTPC is set to benefitdirectly from the changes in the regulations. However, it may benoted here that NTPC would benefit only in respect to the projectsfor which it is yet to sign the power purchase agreements (PPAs).RoE would continue to be 14% for the projects where it hasalready signed the PPA.
CESC, which falls under the West Bengal Electricity RegulatoryCommission (WBERC) ambit and has secured its multi-yearTariff Order for FY2008-11E will not gain from the new CERCorder. GIPCL, which is not bound by CERC restrictions too willnot be impacted by the new regulations.
Cap on RoE increased to 15.5%
As per the new CERC Tariff Regulations, RoE has been fixed ata base rate of 15.5% raised from the earlier 14%, which is usedto determine Pre-tax RoE (Base rate/1-t). The CERC has alsofixed the RoE cap at 16% for projects completed on time.However, this increase in RoE is expected to be offset byanother new provision wherein power generating companieshave been barred from passing on the tax on unscheduledinter-change charges to customers.
Change in Operational norms
The Normative rate for measuring Operational Efficiencyhas been increased to 85% plant availability factor (PAF) asagainst the earlier 80% PLF. This is expected to result inincentive payment being made on the basis of fixed capacitycharges for projects as against an incentive of Rs0.25/unitearlier.
Research Analyst - Girish Solanki / V. Srinivasan
As per the new norms, Depreciation has been fixed at 5.28%for first 12 years and 2% thereafter compared to the earlierDepreciation rate of 3.6% through the life of the project. Thischange in Depreciation rates has been carried out tocompensate for the scrapping of Advance AgainstDepreciation (AAD) and would hence improve cash flows in theearlier years.
The norms of Gross Station Heat Rate (GSHR) have beenmade slightly stricter for plants having excess of 250MWcapacity. The GSHR for 300/330/350MW sets now stands at2,425Kcal/Kwh as against the earlier 2,450Kcal/KWh. TheGSHR for 600MW sets has been fixed at 2,425Kcal/Kwh. Thismove has been aimed at improving operating efficiency ofplants.
Auxilliary consumption (AUX) for units above 500MW hasbeen fixed at 6.5% as against 7.5% earlier. For 200MW unitsAUX has been fixed at 8.5% as against the earlier 9%. Thismove has been aimed at improving operating efficiency ofplants.
There have been no significant changes to the norms onworking capital although the normative maintenance spares isnow fixed at 20% of normative O&M expenses as against theearlier norm of 1% of capital cost.
Outlook
We believe that the revised CERC Tariff order would positivelyimpact the Utility Sector and improve the implied multiple of thecompanies in the sector. We believe tightening of theOperating norms will reduce savings from operationalefficiencies, though the revised incentive structure which isbased on PAF will compensate for the same.
The companies on which we have a Buy recommendation areregulated by the State Electricity Regulatory Commissions(SERCs), which typically use the CERC regulations asguidance for tariff setting in their respective states, and thesestate utilities will likely approach the SERCs to adopt thechanges in regulations in their next Tariff determinationprocess. In line with this, we maintain a Buy on LancoInfratech, CESC and GIPCL, while we remain Neutral on NTPCand PTC.
Angel Commodities Broking (P) Ltd: MCX Member ID: 12685 / FMC Regn No: MCX / TCM / CORP / 0037 NCDEX : Member ID 00220 / FMC Regn No: NCDEX / TCM / CORP / 0302
For Private Circulation Only
Angel BrokingService Truly Personalized
TM
3
3QFY2009 Result Update
Bharat Forge - Buy
Research Analyst - Vaishali Jajoo/Jaydeep Mavani
Performance Highlights
Standalone Results: Bharat Forge (BFL) recorded 18.6%yoy decline in Net Sales (Standalone) during 3QFY2009 largelyon the back of 39.3% yoy decline in the domestic market whileoutside India operation sales grew 6.3% yoy during the quarter.In 3QFY2009, BFL clocked a decline in Operating Margins by537bp yoy to 19.6% (24.9%). Net Profit at Rs32.6cr (excludingForex losses of Rs28.2cr), declined 46.2% yoy during3QFY2009. Including Exceptional items, BFL reported asubstantial 92.5% yoy decline in Net Profit to Rs4.4cr.
Consolidated Results: BFL reported 11.1% yoy decline inConsolidated Net Sales to Rs959.9cr (Rs1,080cr), which waslower than our estimate of Rs1,077cr, owing to weakeningglobal and domestic demand. OPMs declined by 630bp to 10.1%(16.4%). Consolidated Net Profit, excluding Foreign currencylosses and Exceptional items of Rs23.6cr, fell 86.2% to Rs10.2cr(Rs73.3cr). The company has recognised total Forex loss ofRs40cr (Rs2.3cr in 3QFY2008) on revaluation of loansconsequent to depreciation of the Rupee. Of this, Rs28cr isFCCB debt and Rs12cr forex losses were incurred at ScottishStampings. BFL also debited Rs6.7cr loss due to VRS atScottish Stampings. Thus, the company reported Net Loss ofRs36.6cr (Rs71cr Net Profit in 3QFY2008) including Forex lossand Extraordinary for 3QFY2009. BFL's consolidated numbersdid not include FAW Bharat Forge and its joint venture in China.Higher Depreciation at Rs68.9cr (Rs54.5cr) reflects thecapacity ramp and capex incurred at the Baramati plant.
Diversifying market concentration and capacity additionon track: BFL's Non-Auto facilities at Baramati commencedoperations as per schedule with trial productions in 2QFY2009.The company expects to generate around 35-40% of itsRevenue from its Non-Auto Business in FY2010 on plannedcapex of around Rs350cr. BFL is confident of growing itsNon-Auto business faster, and it would act as a buffer to theprevailing difficult macro environment for its Auto business.
Outlook and Valuation
A substantial portion of the company's Revenue comes fromthe CV segment, where recovery looks unlikely in the next coupleof quarters. Further, a major portion of the company'sconsolidated Revenue comes from the US and Europeanmarkets, which is almost in recessionary mode indicatingfurther stress for the company. The FCCB loans make up amajor portion of the company's loan book. Out of a total of
Price - Rs74Target Price - Rs113
Fundamental Focus
Source: Company, Angel Research; Price as on Jan.22,2009;*Note: EPS adjusted for FCCB interest after tax
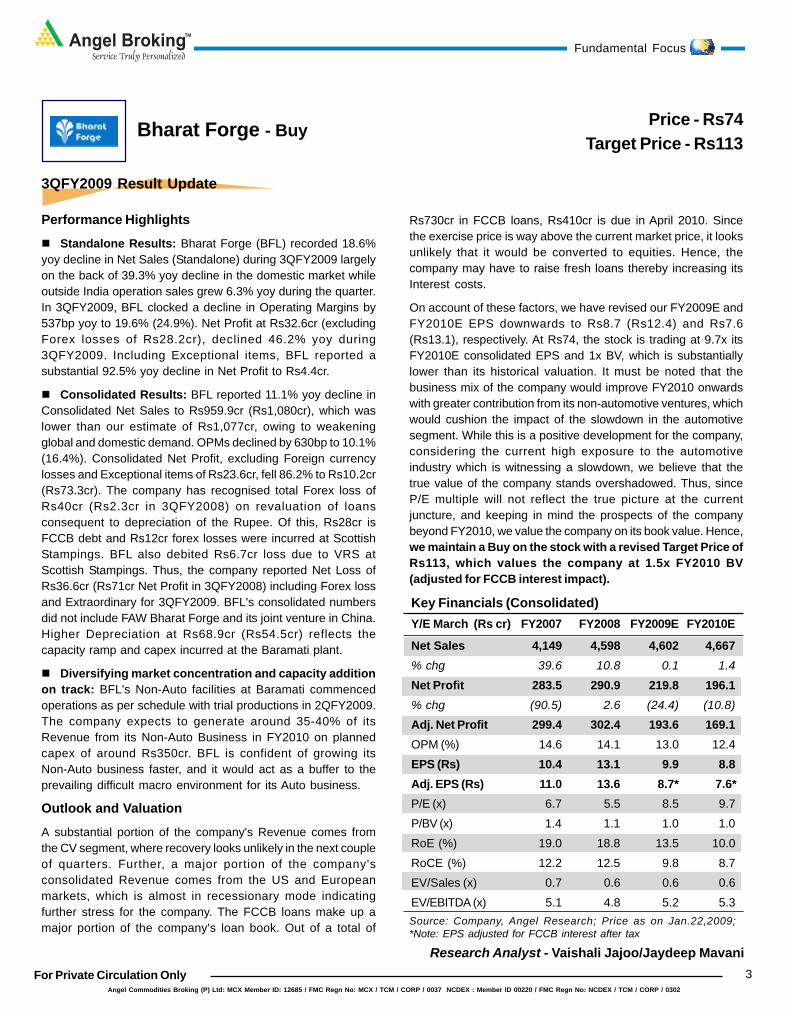
Key Financials (Consolidated)Y/E March (Rs cr) FY2007 FY2008 FY2009E FY2010E
Net Sales 4,149 4,598 4,602 4,667% chg 39.6 10.8 0.1 1.4Net Profit 283.5 290.9 219.8 196.1% chg (90.5) 2.6 (24.4) (10.8)Adj. Net Profit 299.4 302.4 193.6 169.1OPM (%) 14.6 14.1 13.0 12.4EPS (Rs) 10.4 13.1 9.9 8.8Adj. EPS (Rs) 11.0 13.6 8.7* 7.6*P/E (x) 6.7 5.5 8.5 9.7P/BV (x) 1.4 1.1 1.0 1.0RoE (%) 19.0 18.8 13.5 10.0RoCE (%) 12.2 12.5 9.8 8.7EV/Sales (x) 0.7 0.6 0.6 0.6EV/EBITDA (x) 5.1 4.8 5.2 5.3
Rs730cr in FCCB loans, Rs410cr is due in April 2010. Sincethe exercise price is way above the current market price, it looksunlikely that it would be converted to equities. Hence, thecompany may have to raise fresh loans thereby increasing itsInterest costs.
On account of these factors, we have revised our FY2009E andFY2010E EPS downwards to Rs8.7 (Rs12.4) and Rs7.6(Rs13.1), respectively. At Rs74, the stock is trading at 9.7x itsFY2010E consolidated EPS and 1x BV, which is substantiallylower than its historical valuation. It must be noted that thebusiness mix of the company would improve FY2010 onwardswith greater contribution from its non-automotive ventures, whichwould cushion the impact of the slowdown in the automotivesegment. While this is a positive development for the company,considering the current high exposure to the automotiveindustry which is witnessing a slowdown, we believe that thetrue value of the company stands overshadowed. Thus, sinceP/E multiple will not reflect the true picture at the currentjuncture, and keeping in mind the prospects of the companybeyond FY2010, we value the company on its book value. Hence,we maintain a Buy on the stock with a revised Target Price ofRs113, which values the company at 1.5x FY2010 BV(adjusted for FCCB interest impact).
Angel Broking Ltd : BSE Sebi Regn No : INB 010996539 / CDSL Regn No: IN - DP - CDSL - 234 - 2004 / PMS Regn Code: PM/INP000001546 Angel Capital & Debt Market Ltd: INB 231279838 / NSE FNO: INF 231279838 / NSE Member code -12798
For Private Circulation Only
Angel BrokingService Truly Personalized
TM
4
3QFY2009 Result Update
Bharti Airtel - Buy
Research Analyst - Harit Shah
Performance Highlights
Déjà vu again at Top-line level: Bharti Airtel recorded animpressive 38.3% yoy growth in Top-line in 3QFY2009 (6.8%qoq). The company's Mobile Services Business remains themajor contributor to its Top-line growth. This business recordedan excellent 41.5% yoy growth in Gross Revenues during thequarter to Rs7,939cr. On a sequential basis, Gross Revenuesof this segment clocked a strong 9% growth. Bharti's mobilesubscriber base grew by a superb 55.3% yoy and by a strong10.5% qoq to 85.7mn. Net adds over the year crossed 30mn(30.5mn), implying average monthly net additions of over 2.5mn,while over the quarter, net additions crossed 8mn (8.2mn), thesecond consecutive quarter when the company has achievedthis feat. Minutes of usage (MoUs), however, came in lowersequentially at 505 (qoq fall of 4%, yoy growth of 6.5%).Management has attributed this to the phasing out of free MoUsthat were unproductive for the company. Consequently,Revenues per Minute (RPMs) rose for the first time by 2.1% qoqto 64 paise. Gross average revenues per user (ARPUs) fellthough at a slower rate than anticipated by 9.8% yoy and 1.9%qoq to Rs324 per user per month (Rs360 in 3QFY2008, Rs331in 2QFY2009).
As regards the other segments, Telemedia Services grew 15.8%yoy (fall of 0.3% qoq), Enterprise Services (Carriers) 56.3% yoy(4.3% qoq) and Enterprise Services (Corporates) 23.9% yoy(fall of 16.4% qoq). The Passive Infrastructure ServicesBusiness clocked a 6% qoq growth in Revenues, with a highertenancy ratio of 1.34x (1.26x in 2QFY2009). However, key metricsincluding the fall in MoUs in the Mobile Business, ARPU fall inthe Telemedia Business and growth deceleration in theCarriers Business have worsened, which is a concern.
Higher Network expansion costs impact Margins: Bhartirecorded a 160bp yoy contraction in EBIDTA Margins during3QFY2009, while on a sequential basis it fell marginally by 6bp.The main reason for the Margin fall was higher NetworkOperation Costs, which rose as a percentage of Sales by 362bpyoy. Higher License Fees (higher by 37bp yoy as a percentageof Sales) also pressurised Margins. Sequentially also, thesecost items rose as a percentage of Sales.
Lower Margins, higher Interest, Forex losses and higherTaxes reduce Bottom-line growth: On account of lowerMargins, higher Net Interest costs (surged by over 135% yoy),Forex losses of Rs222cr and higher Taxes, Bottom-line for the
Price - Rs620Target Price - Rs781
Fundamental Focus
Source: Company, Angel Research; Price as on Jan.22,2009
quarter grew by 25.4% yoy, slower than Top-line growth.Sequentially, Bottom-line grew by 5.5%.
Outlook and Valuation
Going ahead, we expect Bharti to record CAGRs of 30.9% and22.2% in Top-line and Bottom-line, respectively overFY2008-10E. At Rs620, the stock is trading at 11.8x FY2010EEPS, 6.2x FY2010E EV/EBITDA and an EV/subscriber of US$143.3 on our FY2010E subscriber base. We maintain a Buyon the stock, with a revised Target Price of Rs781 (Rs990),including Rs633 as the core business value (12x P/Emultiple) and Rs148 as the Towerco valuation. We havedowngraded the core business P/E multiple from 14x to 12xon account of the intensifying competition in the sectorfollowing the launch of RCOM's pan-India GSM cellularoperations and pending launch by other operators like Aircel,Tata GSM, Shyam CDMA and newer operators, which couldlead to downward pressure on pricing, Margin pressuresand continuing regulatory risks.
Key Financials (US GAAP Consolidated)Y/E March (Rs cr) FY2007 FY2008 FY2009E FY2010E
Net Sales 18,520 27,025 37,623 46,275% chg 59.4 45.9 39.2 23.0Net Profit 4,257 6,701 8,563 10,011% chg 88.6 57.4 27.8 16.9EBITDA Margin (%) 40.2 42.1 40.1 38.4FDEPS (Rs) 22.4 35.3 45.1 52.7P/E (x) 27.6 17.6 13.7 11.8EV/EBITDA (x) 16.4 10.7 7.8 6.2RoE (%) 37.4 37.4 32.5 28.8RoCE (%) 23.6 22.0 23.5 21.9Sales/GFA (x) 0.7 0.7 0.7 0.8ARPUs (Rs/month) 416 366 321 288
Angel Commodities Broking (P) Ltd: MCX Member ID: 12685 / FMC Regn No: MCX / TCM / CORP / 0037 NCDEX : Member ID 00220 / FMC Regn No: NCDEX / TCM / CORP / 0302
For Private Circulation Only
Angel BrokingService Truly Personalized
TM
5
3QFY2009 Result Update
Dr. Reddy's Laboratories - Buy
Research Analyst - Sarabjit Kour Nangra / Sushant Dalmia
Performance Highlights
Net Sales up 51% yoy: For 3QFY2009, DRL registered a yoygrowth in Net Sales of 51% to Rs1,805cr (Rs1,199cr) primarilydriven by successful launch of authorized generic version ofImitrex (Sumatriptan Succinate) in late November 2008 whichcontributed $73mn to the Revenue. During the quarter US,Europe and Russia & CIS grew by 154.7%, 5.2% and 33.5%yoy respectively while India witnessed a de-growth of 1.7%yoyon account of delay in new launches and a change in supplychain model. In Germany, the company has won 33 contractsacross 8 products under the AOK tender however there is lackof clarity on the execution of these contracts as legal challengespersist. With this for 9MFY2009, the company posted Net Salesof Rs4,862cr, registering a growth of 33.3% yoy and is on trackto beat its full year guidance of 25% growth in FY2009.
Global Generics segment clocks stupendous growth of286% yoy: US was the key growth driver for the Global Genericssegment (75% of Sales), which grew 286% during the period.The growth clocked in the US market was aided by launch ofauthorized version of Imitrex and acquisition of the Shreveportfacility. Excluding the launch, US market posted a growth of80% during the period driven by volume growth in top products.Europe, which contributed 18% of overall Global Generic sales,registered a fall of 2% yoy. Revenue from Betapharm was downon account of pricing pressure and withdrawal of Olanzapinefrom the market. The company also indicated that there can beimpairment charges in future on Betapharm acquisition as ithas not been successful in wining contracts for any of its Top10 products under the AOK tender. Other key regions, Russiaposted a growth of 33% driven by key brands viz Omez, Nise,Ketorol and Cetrine. However India segment witnessed ade-growth of 1% on back of delay in launches of new productsand a change in supply chain model.
Pharmaceutical Services and Active Ingredients (PSAI)segment up 6% yoy: The segment, which contributed 24% oftotal Sales, registered a growth of 6% mainly aided by Europeand RoW which posted a yoy growth of 18% and 55%respectively. Other key markets, US and India, posted a declineof 31% and 24% respectively.
OPM expands by 453bp, Net Profit rises 155.7%: The OPMexpanded during the quarter to 16.9%. The expansion wouldhave been more prominent if SG&A and other expenses won'thave risen by 57% and 115% yoy. The rise in SG&A to Rs 172cr
Price - Rs445Target Price - Rs581
Fundamental Focus
Source: Company, Angel Research; Price as on Jan.21,2009
Key Financials (Indian GAAP Consolidated)Y/E March (Rs cr) FY2007 FY2008 FY2009E FY2010E
Net Sales 6,423 4,914 6,072 6,645% chg 174.6 (23.5) 23.6 9.4Net Profit 965.9 438.0 480.2 540.1% chg 558.3 (54.7) 9.6 12.5EPS 60.9 26.1 28.6 32.2EBITDA Margin (%) 24.5 15.6 15.3 14.5P/E (x) 7.3 17.1 15.6 13.8RoE (%) 31.8 11.3 10.1 10.0RoCE (%) 20.5 8.7 10.0 9.2P/BV (x) 2.0 1.8 1.6 1.4EV/Sales (x) 1.9 2.2 1.7 1.5EV/EBITDA (x) 7.6 12.7 11.4 10.1
(Rs 109cr) can be attributed to additional cost incurred forspecialty business in US and depreciating rupee. The increasein other expenditure to Rs389cr (Rs181cr) was due toprovision of Euro15mn for likely settlement with Eli Lilly onOlanzapine in the German market. However for 9MFY2009,operating margins declined by 94bp to end the period at 14.9%.The rise in Net profit can be attributed to expansion in OPM. For9MFY2009, the Net Profits declined marginally by 6.0% to endthe period at Rs339cr (Rs360cr).
Outlook and Valuation
For 9MFY2009, the company has achieved 80% of our full yearRevenue numbers and 71% of our Net profit numbers. This isprimarily due to the launch of Imitrex in US, where it is the onlyplayer in the market other than the innovator company. Thecompany intends to have at least one such upside every yearfor next five years. Currently we are not changing our numbersas competition over Imitrex in the US market is likely toincrease in the next quarter and the uncertainty over the AOKtender. On the valuation front, the stock is trading at 15.6xFY2009E and 13.8x FY2010E EPS. We maintain our Buyon the stock, with a Target Price of Rs581.
Angel Broking Ltd : BSE Sebi Regn No : INB 010996539 / CDSL Regn No: IN - DP - CDSL - 234 - 2004 / PMS Regn Code: PM/INP000001546 Angel Capital & Debt Market Ltd: INB 231279838 / NSE FNO: INF 231279838 / NSE Member code -12798
For Private Circulation Only
Angel BrokingService Truly Personalized
TM
6
Fundamental Focus
3QFY2009 Result Update
ITC - Neutral
Performance Highlights
Muted Top-line growth, up 11%: For 3QFY2009, ITC postedmuted Top-line growth of 10.9% yoy to Rs3,833cr (Rs3,458cr),which was significantly below our estimate of 18.6% yoy growthto Rs4,101cr. Top-line growth, despite the in-line performanceby ITC's Cigarette Division, was impacted by the decline inRevenues posted by its Hotel (due to economic slowdown andMumbai terror strikes) and Agri businesses (owing to lowersoya volumes). The Cigarette Division, for the quarter,registered 10.5% growth in Gross Revenues on the back ofbetter realisation (price hikes) and improved product mix(up-trading to filter cigarettes from non-filters estimated at70-75%, which is encouraging). In terms of volumes, weestimate ITC registered 3-4% decline for the quarter in line withour expectation.
Earnings growth in line, up 8.7%: ITC posted anotherdisappointing quarter of Earnings growth. It registeredsubdued Earnings growth of 8.7% yoy to Rs903cr (Rs831cr) inline with our expectation of 9.9% yoy growth to Rs913r. DespiteMargin expansion, Earnings growth was muted due to the weakTop-line growth and decline in Other Income by 10.6% yoy toRs123cr (Rs137cr).
Margins surprise positively, expand 60bp: On theOperating front, ITC delivered a positive surprise registeringMargin expansion of 60bp yoy driving an EBITDA growth of 12.8%yoy to Rs1,353cr (Rs1,120cr). Margins expanded despite thesharp drop in profitability of the company's Hotels businessand significantly higher losses in the Non-Cigarette FMCGbusiness, largely driven by an 184bp expansion in its coreCigarette business owing to price hikes and better product mix.The Hotels and Paperboard Divisions registered contraction inEBIT Margins by 1,025bp and 301bp, respectively.
Outlook and Valuation
While we remain enthused by the performance of ITC' coreCigarette business in terms of its resilience to poor regulatoryenvironment, evident slow down in its Non-Cigarette FMCGbusiness (partially due to high base) and weakening macroenvironment for its Hotel business raises issues over ITC'sgrowth drivers in the near term. Hence, we have revised ourTop-line estimates for FY2009E and FY2010E downwards by4.5% and 6.7% respectively, factoring in lower growth in Hotelsand Non-Cigarette FMCG businesses. Hence, during
Price - Rs171
Research Analyst - Anand Shah/ Shweta Boob
Source: Company, Angel Research; Price as on Jan. 19, 2009
Key FinancialsY/E March (Rs cr) FY2007 FY2008 FY2009E FY2010E
Net Sales 12,164 13,948 15,663 17,845
% chg 24.2 14.7 12.3 13.9
Net Profit 2,700 3,120 3,275 3,871
% chg 18.4 15.6 4.9 18.2
OPM (%) 32.5 31.5 30.6 31.6
EPS (Rs) 7.2 8.3 8.7 10.3
P/E (x) 23.8 20.7 19.7 16.7
P/BV (x) 6.2 5.3 4.9 4.3
RoE (%) 25.9 25.9 24.8 25.7
RoCE (%) 32.3 30.9 30.2 31.7
EV/Sales (x) 5.0 4.4 3.9 3.4
EV/EBITDA (x) 15.3 13.9 12.8 10.8
FY2008-10E, we expect ITC to report CAGR of 13.1% inTop-line largely driven by steady performance of its coreCigarette Division, Paperboard and Agri-business. Moreover, adeteriorating regulatory environment for cigarettes (smokingban and pictorial warnings) pose further threat to ITC's corebusiness.
In terms of Earnings, we have revised our estimatesdownwards for FY2009E and FY2010E marginally by 2.2% and1% respectively, impacted by the aggravated losses inNon-Cigarette FMCG business and lower Margins in the Hotelbusiness. Hence, during FY2008-10E, we expect ITC to reportCAGR of 11.4% in Earnings.
While we remain positive on ITC's strong consumer demandprofile, better pricing power, strong cash flows and its abilityto channel these flows into new growth opportunities, weakEarnings growth in FY2009 coupled with evident signs ofslowdown in its key growth drivers - Non-Cigarette FMCG andHotel Businesses, have led us to remain Neutral on the stock.
Angel Commodities Broking (P) Ltd: MCX Member ID: 12685 / FMC Regn No: MCX / TCM / CORP / 0037 NCDEX : Member ID 00220 / FMC Regn No: NCDEX / TCM / CORP / 0302
For Private Circulation Only
Angel BrokingService Truly Personalized
TM
7
2QFY2009 Result Update
Pantaloon Retail - Buy
Research Analyst - Raghav Sehgal
Performance Highlights
Top-line growth disappointing: PRIL posted adisappointing yoy Net Sales growth of 24.4% to Rs1,525.7cr(Rs1,226.8cr) for 2QFY2009 (June Ending company). The NetSales growth was flat 1% on qoq basis on account of marginalde-growth in Sales per sq.ft. by 2% on qoq basis. The Net Salesgrowth trend has been on downside since the past fewquarters. The downward trend in growth in Net Sales is in linewith the downward trend witnessed in the Same-Store salesgrowth. The Net Sales grew 31% yoy for 1HFY2009 to Rs3,037cr(Rs2,313cr). We expect PRIL to post a qoq CAGR of more than17% in the remaining two quarters of FY2009 to end FY2009Ewith Net Sales of Rs6,894cr
Operating Margins expand: On the Operating front, PRILreported an increase in Margins by 140bp in 2QFY2009 to 10.4%(9.0%) yoy and sustained the same on qoq basis. Marginsimproved on account of yoy fall in Employee costs by 140bp in2QFY2009. Notably, the company's EBITDA Margins haveconstantly been on upward trend indicating improvingoperational efficiency and successful implementation ofvarious cost cutting measures. For 1HFY2009, EBITDAmargins improved by 140bp to 10.3% (8.9%) on account ofsavings in operating costs like Employee costs and Otherexpenditure.
Bottom-line growth flat at 6% yoy: PRIL posted flat yoy NetProfit growth of 6% in 2QFY2009 to Rs33.5cr (Rs31.7cr) onaccount of yoy increase in Interest costs and Depreciation by70bp and 50bp respectively that contributed to the 40bpdecrease in Net Margins to 2.2% (2.6%). For 1HFY2009, NetProfit grew a mere 14% yoy to Rs69.7cr (Rs61.3cr), while NetProfit Margin fell to 2.3% (2.7%) on account of increase inInterest costs and Depreciation by 85% and 80%, respectively.
Outlook and Valuation
We are bullish on the long-term growth prospects of the Retailsector though we expect the Organised Retail segment towitness temporary slowdown in FY2009E in wake of the globalfinancial crisis, especially in Lifestyle Retailing.
PRIL is a prime player in the Indian Retail Industry. Despite thecurrent slowdown in the economy, we are positive on PRIL aswe believe it has the right strategy in place driven by goodmanagement to expand and grow at a faster rate once thesituation improves. We believe that the current slowdown has
Price - Rs161Target Price - Rs239
Source: Company, Angel Research; Price as on Jan. 23, 2009
Fundamental Focus
hit all the Retail players, including PRIL and impact of the samewould be witnessed on the Bottom-line too. In wake of thecurrent scenario, we believe that PRIL would be able to meetour FY2009E Net Sales estimates but would fall short of ourFY2010 estimates by around 9%. Hence, we are lowering ourFY2010E Net Sales estimates to Rs8,492cr. We have alsopruned our PAT estimates FY2009 and FY2010 by 14% and19% to Rs155cr and Rs218cr respectively, on account of the200bp increase in Interest costs and Depreciation taking cuesfrom the half-yearly performance.
At Rs161, the stock is trading at 13.0x FY2010E Earnings and1.8x FY2010E P/BV. We have valued PRIL (Standalone) at Rs173.We have valued PRIL's stake in FCH, HSRIL and Future Bazaarat Rs33, Rs13 and Rs20, respectively. PRIL continues to beour Top Pick in the Retail Sector. We maintain a Buy on thestock with SOTP Target Price of Rs239, translating into anupside of 48% from current levels.
Key FinancialsY/E June (Rs. cr) FY2007 FY2008 FY2009E FY2010E
Net Sales 3,237 5,049 6,894 8,492% chg 84.1 56.0 36.5 23.2Net Profit 119.9 126.0 154.6 217.8% chg 89.4 5.1 22.7 40.9EBITDA Margin (%) 6.7 9.1 9.3 9.8EPS (Rs) 7.7 7.9 8.8 12.4P/E (x) 20.8 20.4 18.2 13.0P/BV (x) 3.0 2.0 2.1 1.8RoE (%) 14.8 8.6 8.2 10.7RoCE (%) 9.9 11.5 11.1 12.1EV / Sales (x) 1.2 0.9 0.7 0.7EV/EBITDA 17.2 10.1 8.2 7.0
Angel Broking Ltd : BSE Sebi Regn No : INB 010996539 / CDSL Regn No: IN - DP - CDSL - 234 - 2004 / PMS Regn Code: PM/INP000001546 Angel Capital & Debt Market Ltd: INB 231279838 / NSE FNO: INF 231279838 / NSE Member code -12798
For Private Circulation Only
Angel BrokingService Truly Personalized
TM
8
4QCY2008 Result Update
Ranbaxy Laboratories - Buy
Research Analyst - Sarabjit Nangra / Sushant Dalmia
Performance Highlights
Net Sales rise 7%: For 4QCY2008, Ranbaxy registering ayoy growth of 7% in Net Sales Rs1,905cr (Rs1,785cr), whichwas below our expectations. Emerging markets, whichaccounted for 54% of Total Sales grew yoy 7% and contributedRs1,023cr. Growth of Emerging markets was led by Asia, CISand Middle East markets. Developed markets, whichcontributed 39% of Total Sales grew 4% yoy to Rs749cr. Withthis, for CY2008 the company posted Net Sales of Rs7,221crregistering a yoy growth of 9%. Ranbaxy has not provided anyguidance for CY2009 on account of lack of clarity on the US frontand volatile currency movements.
Core Operating Margins expands by 70bp: During thequarter, the company core Operating Margins (excludingrealised forex gain/losses) expanded by 70bp to 12.6% (11.9%)on account of lower growth in Cost of sales of 5% to Rs1,017cr(Rs965cr) and decline in R&D expenses by 9% to Rs126cr(Rs138cr). For CY2008, the company reported core OperatingMargins of 12.7% (11.0%).
Net Profit plunges into the red: For 4QCY2008, thecompany reported a Net Loss of Rs680cr on account of MTMforex losses on Dollar denominated Debts and huge long-termhedge positions. The company recorded translational forexlosses amounting to Rs192cr and adopted AS-30 during thequarter resulting in non-cash charge of Rs780cr on itslong-term derivatives contract. For CY2008, the companyreported a Net Loss of Rs914cr on account of non-cashexceptional items and write down in inventory in the US.
Developed Markets
For 4QCY2008, North American region comprising of US andCanada posted 14% growth to Rs508cr. The US market grew8% yoy to Rs441cr. Ranbaxy launched two authorisedgenerics, viz. Omeprazole and Feloipine in the US market, whichprovided the upside. The company indicated that no freshdevelopments have taken place on the import alert imposed byUSFDA on two of its manufacturing facilities. The Canadamarket grew 88% yoy to Rs67cr on account of new productlaunches. In the EU, the company registered de-growth of 13%yoy to Rs362cr on account of volatile currency movement anddifficult market conditions as Romania and UK witnessedde-growth of 11% and 13% to Rs111cr and 41cr, respectively.
For CY2008, the North American region grew 11% yoy toRs1,928cr while Europe de-grew 5% to Rs1,428cr.
Price - Rs188Target Price - Rs277
Fundamental Focus
Source: Company, Angel Research; Price as on Jan.23,2009;Note: *Adjusted Net profit excludes unrealized forex gain/lossesand includes interest cost on FCCBs
Key Financials (Consolidated)Y/E Dec (Rs cr) CY2006 CY2007 CY2008E CY2009E
Net Sales 6,012.6 6,641.3 7,221.8 8,125.4% chg 17.9 10.5 8.7 12.5Reported PAT 510.9 786.6 (914.6) 689.8% chg 95.2 54.0 (216.3) -*Adj Net Profit 467.2 525.1 149.0 624.1% chg 78.5 12.4 (71.6) 318.8Reported EPS 13.7 21.1 - 16.1Adjusted EPS 12.5 14.1 3.5 14.5EBITDA Margin (%) 12.4 11.0 12.7 13.0P/E (x) 15.0 13.3 54.1 12.9RoE (%) 18.4 18.5 3.0 8.8RoCE (%) 9.9 7.3 7.7 7.2P/BV (x) 2.6 2.2 1.1 1.0EV/Sales (x) 1.8 1.6 1.1 1.0EV/EBITDA (x) 14.1 14.0 8.7 7.7
Emerging Markets
During 4QCY2008, growth in the Emerging markets was led byAsia, Middle East and CIS nations. Sales in the CIS regionduring 4QCY2008 grew by 19% yoy to Rs146cr which wasbacked by strong traction in Russia and Ukraine. TheAsia-Pacific region clocked 15% yoy growth to Rs117cr. In India,sales during the quarter, stood at Rs374cr, up 9% yoy.
Outlook and Valuation
We are maintaining our CY2009 Sales estimates but we arereducing our core Operating Margin estimate from 14.6% to13.0% bringing in line with the current year numbers followingwhich we are pruning our CY2009 core EPS estimate to Rs.11.1from Rs13.6 earlier. However, we maintain a Buy on the stockwith a 15-month revised SOTP Target Price of Rs277 (Rs316),wherein the Core business is valued at Rs178 giving it a fairP/E of 16x CY2009E Core Earnings of Rs11.1, Rs24 forNon-Core Income and Rs75 NPV is ascribed to the FTF opportunities available to the company.
Angel Commodities Broking (P) Ltd: MCX Member ID: 12685 / FMC Regn No: MCX / TCM / CORP / 0037 NCDEX : Member ID 00220 / FMC Regn No: NCDEX / TCM / CORP / 0302
For Private Circulation Only
Angel BrokingService Truly Personalized
TM
9
3QFY2009 Result Update
Reliance Industries - Buy
Research Analyst - Deepak Pareek / Amit Vora
Performance Highlights
Lower crude, Product prices lead to Net Sales decline:Reliance Industries (RIL) delivered decent set of numbers for3QFY2009, which exceeded our expectations. RIL's Net Salesdeclined 8.8% yoy, while Net Profit (excluding Exceptional items)fell 9.8% yoy. RIL reported a decline in Net Sales to Rs31,563cr(Rs34,590cr) primarily on the back of lower crude oil pricesduring the quarter. Segment-wise, the Refining andPetrochemical segments' Gross Sales fell 16.9% and 0.7% toRs21,740cr and Rs12,623cr respectively, during the quarter.Crude processing during the quarter was 7.87mn tonnes(7.60mn tonnes), which was higher by 3.6% yoy.
Refining Margins surprise; Petrochemical disappoints:During the quarter, RIL reported stronger-than-expected GRMsof US $10.0/bbl (US $15.4/bbl) as against our expectation ofUS $9.0/bbl. Benchmark complex Singapore Margins, duringthe quarter, stood at US $3.6/bbl. Thus, RIL managed to earn aspread of US $6.4/bbl, which was marginally lower than itsprevious performances. Though Petrochemical Marginsimproved qoq, the same were lower than our expectation at13.1% (14.0%). On the core business, blended EBIT Marginsstood at 11.7% (12.0%).
Interest Expense increases, Other Income surges:During 3QFY2009, increase in Gross Debt and 23% yoy Rupeedepreciation resulted in Interest cost increasing by 91.3% toRs484cr (Rs253cr). Other Income during the quarter increasedsignificantly to Rs663cr (Rs241cr) owing to the Interest earnedon money raised through warrant conversion by promoters.Depreciation increased by 8.6% to Rs1,317cr (Rs1,213cr).
PAT above expectation: Reported PAT (incl. RPL stake sale)decreased by 56.7% yoy to Rs3,501cr (Rs8,079cr). However,PAT (excl. RPL stake sale) during the quarter stood at Rs3,501cr(Rs3,882cr) registering de-growth of 9.8% yoy, which exceededour expectation of Rs3,079cr. PAT came in higher than ourestimates due to the higher-than-expected Other Income.
Outlook and Valuation
The current quarter has been a challenging one for RIL. Crudeand product prices saw a significant correction during thequarter, which raised fears of likely substantial inventory losses.However, effective hedging strategies of the company both oncrude and product ensured minimum damages. This reflectsstrong management capability to resiliently manage the tough
Price - Rs1,153Target Price - Rs1,440
Fundamental Focus
Source: Company, Angel Research; Price as on Jan.23,2009
Key Financials (Consolidated)Y/E March (Rs cr) FY2007 FY2008 FY2009E FY2010E
Net Sales 1,13,770 1,37,147 1,63,459 2,06,045 % chg 37.0 20.5 19.2 26.1 Net Profit 12,075 19,521 16,128 20,605 % chg 28.5 61.7 (17.4) 27.8 EPS (Rs) 76.7 124.0 102.5 130.9 EBITDA Margin (%) 17.7 16.9 14.6 15.9 P/E (x) 13.3 8.6 11.3 8.8 RoE (%) 25.4 16.1 16.1 16.7 RoCE (%) 15.4 12.9 12.9 14.6 P/BV (x) 2.4 2.0 1.6 1.4 EV/ Sales (x) 1.7 1.6 1.3 1.0 EV/ EBITDA 9.6 9.2 8.8 6.0
business environment. We believe Singapore RefiningMargins would remain subdued going forward in the range ofUS $3.5-4.0/bbl. However, owing to strong heavy and light crudedifferential in the Asian markets coupled with superior refiningslate and relative strength in middle distillate cracks, RIL islikely to maintain its GRMs in range of US $8.5-9.0/bbl.
The Petrochemical segment witnessed demand collapseduring October to mid of November 2008, raising concernsover future profitability of the segment. However, the scenariohas changed since then and Margins have shownimprovement. We expect the Petrochemical segment to reportbetter performance in 4QFY2009 on the back of betterOperating performance. We maintain that integrated nature ofRIL's operations would mitigate the Margin compression in thePetrochemical segment.
Going forward, we believe growth in RIL's Profitability wouldcontinue following commencement of gas production in the KGbasin and commercial production at RPL's refinery. Moreover,changing Earnings and Profit mix in favour of E&P segment willalso reduce the business risks. Based on our FY2010E EPS ofRs130.9 and Target P/E multiple of 11x, we ascribe Fair Valueof Rs1,440 to the RIL stock. We maintain a Buy on RIL.
Angel Broking Ltd : BSE Sebi Regn No : INB 010996539 / CDSL Regn No: IN - DP - CDSL - 234 - 2004 / PMS Regn Code: PM/INP000001546 Angel Capital & Debt Market Ltd: INB 231279838 / NSE FNO: INF 231279838 / NSE Member code -12798
For Private Circulation Only
Angel BrokingService Truly Personalized
TM
10
3QFY2009 Result Update
Reliance Communications - Buy
Research Analyst - Harit Shah
Performance Highlights
Wireless ARPUs get hammered yet again; Top-line growthdisappointing: Reliance Communications (RCOM) recorded adisappointing 18.8% yoy growth in Top-line in 3QFY2009.Sequentially, Top-line growth came in at just 2.5%. Thedisappointing Top-line performance was on account of the poorperformance recorded by the key Wireless Business Unit. Thisbusiness grew by a mere 11.5% yoy and by 1.8% qoq. This wasthe case even as the mobile subscriber base grew by animpressive 49.8% yoy and by 10% qoq to 61.3mn. Quarterly netadds crossed 5mn for the second consecutive quarter (5.3mn).Yet again, as has been the case in the previous two quarters forRCOM, the chief culprit was the significant fall in averagerevenues per user (ARPUs), which declined by a substantial26.6% yoy and by 7.4% qoq to Rs251 per user per month (gross)v/s Rs341 in 3QFY2008 and Rs271 in 2QFY2009.
As regards the other business segments, the Global Businessgrew by 26.2% yoy (fall of 0.8% qoq) aided by a 39% yoy growthin total minutes of usage (MoUs, 6.9% qoq). However, it shouldbe noted that 2QFY2009 Revenues included Rs91cr receivedfrom an arbitration case against Tata Communications.Excluding this, Global Revenues grew by nearly 5% qoq. TheBroadband Business clocked a 43.3% yoy growth during3QFY2009 powered by a 48.2% yoy increase in Access Lines,which crossed 1.3mn. Sequentially too, the growth wasimpressive at 8.6%, with Access Lines growing by 6%.
Margins fall on higher Network, SG&A costs: RCOMrecorded a 372bp yoy contraction in EBITDA Margins in3QFY2009 mainly due to higher Network Operations Costs,which rose by 917bp yoy, as a percentage of Sales. HigherSG&A costs also led to the Margin fall, which was mitigatedowing to lower Access Charges & Licence Fees (15.3% of Salesv/s 23.4% in 3QFY2008). Sequentially also, Margins dipped by127bp due again to higher Network expenses. Segment-wise,Wireless Margins fell by 232bp yoy, while sequentially, they werelower by 122bp. However, Global Margins were robust, beinglargely stable yoy and expanding by 438bp qoq, whileBroadband Margins fell by 650bp yoy and by 664bp qoq.
Lower Margins, higher Depreciation, Taxes impactBottom-line growth: Owing to lower Margins, higherDepreciation and Taxes paid, RCOM's Bottom-line grew by just2.7% yoy. In fact, Profit before Tax fell nearly 5% yoy. On a qoqbasis, Bottom-line fell 7.9%.
Price - Rs160Target Price - Rs227
Fundamental Focus
Source: Company, Angel Research; Price as on Jan.23,2009
Outlook and Valuation
Going forward, we expect RCOM to post a 19.7% CAGR inTop-line over FY2008-10E, while Bottom-line is expected torecord a CAGR de-growth of 1.6% over the period. At Rs160, thestock is trading at a P/E of 6.6x FY2010E EPS, EV/EBITDA of6.1x FY2010E EBITDA and at an EV/subscriber of US $93.8 onour FY2010 subscriber estimates.
Even as we maintain a Buy on the stock, with a revised TargetPrice of Rs227 (Rs451), including Rs194 as the corebusiness value (8x P/E multiple) and Rs33 as the Towercovalue, we expect stock price performance to remain mutedin the short-term. We have downgraded the multiple given tothe core business from 10x to 8x on account of the significantlyworsening operating metrics being reported each quarter,further ARPU and margin pressures in the medium-termleading to value erosion in spite of higher probable subscriberadds on account of the GSM launch, intensifying competition,ever-present regulatory risks and the disappointing 1.6% CAGRfall expected in Earnings over FY2008-10E. The core businessmultiple accorded is at a 33% discount to the multiple we haveaccorded Bharti Airtel (12x).
Key Financials (Consolidated)Y/E March (Rs cr) FY2007 FY2008 FY2009E FY2010E
Net Sales 14,262 18,827 22,530 26,990% chg 34.2 32.0 19.7 19.8EBITDA Margin (%) 38.7 42.3 40.0 37.0Net Profit 3,168 5,401 5,898 5,227% chg 613.0 70.5 9.2 (11.4)FDEPS (Rs) 14.7 25.0 27.3 24.2P/E (x) 10.9 6.4 5.9 6.6EV/EBITDA (x) 7.9 7.3 6.5 6.1RoE (%) 18.3 20.8 18.6 14.2RoCE (%) 8.0 12.2 8.6 8.6Sales/GFA (x) 0.4 0.4 0.3 0.3ARPUs (Rs/month) 371 344 258 219
Angel Commodities Broking (P) Ltd: MCX Member ID: 12685 / FMC Regn No: MCX / TCM / CORP / 0037 NCDEX : Member ID 00220 / FMC Regn No: NCDEX / TCM / CORP / 0302
For Private Circulation Only
Angel BrokingService Truly Personalized
TM
11
3QFY2009 Result Update
Ultratech Cement - Neutral
Research Analyst - Pawan Burde
Performance Highlights
Top-line growth above estimates: Ultratech Cement (ULTC)posted a yoy Top-line growth of 18.2% to Rs1,631cr (Rs1,380cr)for 3QFY2009, which was above our expectations. Top-linegrowth came primarily driven by higher cement sales volumes,increase in average realisation for cement and the RMCDivision clocking higher Revenues. Cement sales volumes grewby 5.8% yoy to 4.6mn tonnes during the quarter from 4.3mntonnes in 3QFY2008. Volume growth was mainly driven by highersales in the domestic market, which grew 14.4% yoy during thequarter. However, clinker exports declined by a substantial 31%yoy. Average cement realisation for ULTC grew 10.9% yoy toRs3,350/tonne (Rs3,021/tonne). Revenues of the RMCDivision increased by a substantial 60% yoy to Rs100cr.
Margins disappoint: On the Operating front, ULTC reporteda decline in Margins by 750bp to 26.4% (33.9%) mainly due tothe increase in input costs like coal, freight etc. Power and Fuel,which increased by a considerable 63% yoy. Coal, which is amajor input for power and clinker manufacturing, witnessed ayoy increase in prices during the quarter. There was a shortfallin coal supplies as well against existing linkages, which forcedthe company to rely more on imported and open-marketpurchases, resulting in higher costs.
Bottom-line in-line, de-grow 14.7%: Despite reasonableTop-line growth, ULTC's Net Profit de-grew by 14.7% yoy toRs238cr (Rs279cr). This was mainly on account of Marginerosion by 750bp. Higher Interest and Depreciation costs alsoadded to the sluggish Bottomline growth. Interest costs werehigher by 93% yoy to Rs35.9cr while Depreciation chargesincreased by 38% yoy. However, the company's effective tax rateof 28.8% during the quarter was lower on a yoy basis, providingsome cushion to Bottomline.
Realisations higher yoy, flattish qoq, Volumes up
ULTC's average price realisation increased by 10.9% yoy toRs3,350/tonne (Rs3,021/tone) during the quarter. Cementprices which were strong in the Southern markets, where ULTChas a strong presence, helped the company achieve betterrealisations during the quarter. However, realisations werealmost flat on qoq basis. Cement sales volumes increased by5.8% yoy to 4.6mn tonnes (4.3mn tonnes). We believe thatrealisations would be under pressure once incrementalcapacity starts becoming operational and demand slackensowing to the slowdown in Housing and Real Estate sectors,led by slowdown in economy.
Price - Rs381
Fundamental Focus
Source: Company, Angel Research; Price as on Jan.19,2009
Key FinancialsY/E March (Rs cr) FY2007 FY2008 FY2009E FY2010E
Net Sales 4,911 5,509 6,300 6,265% chg 48.8 12.2 14.4 (0.6)Net Profit 782 1,008 908 722% chg 240.5 28.8 (9.9) (20.5)OPM (%) 28.9 31.2 26.4 23.5FDEPS (Rs) 62.8 80.9 72.9 58.0P/E (x) 6.1 4.7 5.2 6.6P/BV (x) 2.7 1.8 1.3 1.1RoE (%) 55.8 45.2 29.1 18.6RoCE (%) 24.1 23.8 16.9 11.2EV/Sales (x) 1.3 1.2 1.1 1.1EV/tonne (US $/t) 86 83 68 65EV/EBITDA (x) 4.4 3.7 4.3 4.7
Outlook and Valuation
We expect the domestic Cement industry to witnesssubstantial bunching up of capacities in FY2009E and FY2010E,as 86.5mn tonnes capacity is expected to come on-streamduring these years. However, even after assuming 20% of theannounced capacity addition plans fail to materialise on timedue to delay in equipment procurement, land acquisitions, fundraising plans, etc. such huge capacity addition (69.2mn tonnes)is bound to create an oversupply situation and exert pressureon cement prices.
We believe that benefits of sharp correction in the coal pricesand lower fuel prices will be completely eaten up by fall inrealisations going forward. We are revising our EPS estimatesupward for FY2009E by 5.5% to factor in for higher-than-estimated Profit for 3QFY2009. However, we downgradeEarning by 5% for FY2010E to factor in lower volumes andrealisations. At Rs381, ULTC is trading at an EV/EBIDTA of 4.3xand 4.7x FY2009E and FY2010E EBIDTA and EV/tonne of US$68/tonne and US $65/tonne on FY2009E and FY2010Ecapacities, respectively. We believe that in view of an imminentdownturn in the cement cycle, ULTC should trade at a 45%discount to the prevailing replacement costs, as suggested byits historical valuations in a down cycle. Hence, we believe thatthe stock is fairly valued and remain Neutral on the stock.
Angel Broking Ltd : BSE Sebi Regn No : INB 010996539 / CDSL Regn No: IN - DP - CDSL - 234 - 2004 / PMS Regn Code: PM/INP000001546 Angel Capital & Debt Market Ltd: INB 231279838 / NSE FNO: INF 231279838 / NSE Member code -12798
For Private Circulation Only
Angel BrokingService Truly Personalized
TM
12
Fundamental Focus
3QFY2009 Result Update
Wipro - Buy
Performance Highlights
Currency depreciation drives Top-line; pricing falls,volumes sluggish: In 3QFY2009, Wipro recorded adisappointing 1% qoq growth in Top-line. The key IT ServicesBusiness clocked a decent 6.9% qoq growth in Revenues, whichwas primarily driven by Rupee depreciation. The realisedRupee rate for Wipro rose by 7.9% qoq to Rs46.17 (Rs42.80 in2QFY2009). Volume growth was sluggish, with onsite volumesgrowing by just 1.4% qoq while offshore volumes grew 2.7%qoq. However, pricing during the quarter fell, with onsite ratesfalling by 3.9% qoq and offshore rates by 1.6% qoq. This wasprimarily on account of the cross-currency headwinds seenduring the quarter, with currencies like the British Pound andEuro depreciating significantly against the US Dollar, leading totheir value in US Dollar terms eroding. Thus, in Dollar terms, ITServices Revenues fell by 0.9% qoq. In constant currency terms,however, Revenues rose by 3.5% qoq.
Segment-wise, Wipro's combined IT Services business clockeda 6.9% qoq growth, with pure IT Services and BPO Servicesboth clocking similar growth rates. The IT Products Businessfell by 16.5% qoq albeit after a seasonally strong quarter. WiproConsumer Care & Lighting (CC&L) Revenues were flat, whilethe 'Others' segment de-grew 22.3% qoq. On a yoy basis,overall Revenues grew 25.2%, with combined IT Servicesgrowing 30.6% (IT Services 30.8%, BPO Services 27.6%), ITProducts 24.6% and CC&L 21.2%, while 'Others' de-grew38.5%.
Margins fall on salary hikes to BPO staff, provision madefor receivables from Nortel: During 3QFY2009, Wipro recordeda 53bp qoq contraction in EBITDA Margins mainly due to thesalary hikes given to its BPO employees. Wipro also made aprovision for receivables from Nortel, which recently filed forbankruptcy. This had an impact of 60bp on Margins. Excludingthis, Margins rose by 10bp qoq. Rupee depreciation, higherutilisation, a higher offshore proportion of Revenues and a higherproportion of fixed price contracts mitigated the impact of theabove-mentioned headwinds. On a yoy basis, EBITDA Marginsfell by a marginal 12bp.
Higher Other Income boosts Bottom-line: Wipro, in spite ofthe Margin contraction, recorded a 2.6% qoq rise in Bottom-linein 3QFY2009, which was achieved mainly on account of higherOther Income (up 60.7% qoq). On a yoy basis, Bottom-line grew17.6%.
Research Analyst - Harit Shah
Price - Rs220Target Price - Rs281
Source: Company, Angel Research; Price as on Jan. 21, 2009
Key Financials (Consolidated)Y/E March (Rs cr) FY2007 FY2008 FY2009E FY2010E
Net Sales 14,998 19,980 25,911 29,148
% chg 41.5 33.2 29.7 12.5
Net Profit 2,942 3,283 3,898 4,117
% chg 42.3 11.6 18.8 5.6
EBITDA Margin (%) 22.9 20.0 20.2 19.5
EPS (Rs) 20.1 22.4 26.6 28.1
P/E (x) 10.9 9.8 8.3 7.8
P/BV (x) 3.4 2.8 2.3 1.9
RoE (%) 36.3 30.8 30.1 26.5
RoACE (%) 33.2 24.0 26.6 25.9
EV/Sales (x) 2.0 1.6 1.2 0.9
EV/EBITDA (x) 8.9 8.2 5.8 4.8
Outlook and Valuation
Over FY2008-10E, we expect Wipro to record 20.8% and 12%CAGRs in Top-line and Bottom-line, respectively. At Rs220, thestock is trading at 7.8x FY2010E EPS. Although valuations seemreasonable with relatively low downside risk, thebusiness outlook remains challenging, as reflected by thecompany's disappointing 4QFY2009 guidance. We believe theoutlook will not improve significantly in the near-term. Lookingforward to FY2010, this fiscal could witness even more difficulttimes for Indian IT vendors. While Infosys continues to be ourpreferred pick in the IT Sector, on account of the recentunder-performance of the Wipro stock, we maintain a Buywith a Target Price of Rs281, implying a P/E of 10x FY2010EEPS (13x earlier). However, stock price upsides in the nearterm could remain capped.
Angel Commodities Broking (P) Ltd: MCX Member ID: 12685 / FMC Regn No: MCX / TCM / CORP / 0037 NCDEX : Member ID 00220 / FMC Regn No: NCDEX / TCM / CORP / 0302
For Private Circulation Only
Angel BrokingService Truly Personalized
TM
13
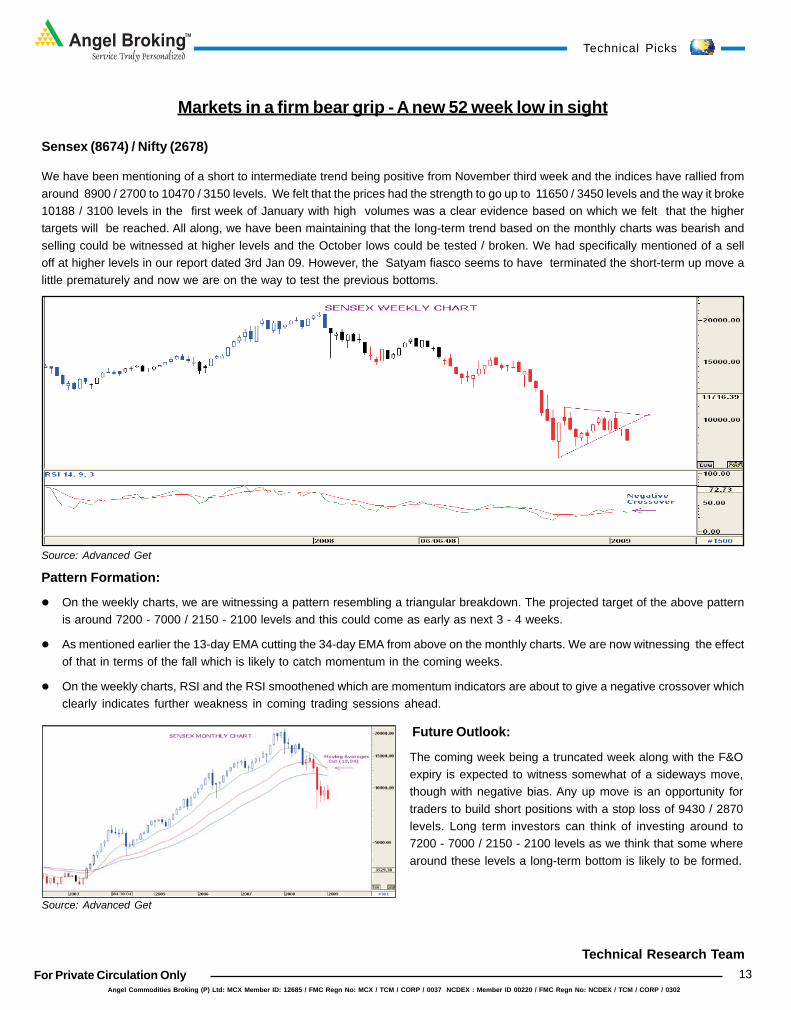
Markets in a firm bear grip - A new 52 week low in sight
Sensex (8674) / Nifty (2678)
We have been mentioning of a short to intermediate trend being positive from November third week and the indices have rallied fromaround 8900 / 2700 to 10470 / 3150 levels. We felt that the prices had the strength to go up to 11650 / 3450 levels and the way it broke10188 / 3100 levels in the first week of January with high volumes was a clear evidence based on which we felt that the highertargets will be reached. All along, we have been maintaining that the long-term trend based on the monthly charts was bearish andselling could be witnessed at higher levels and the October lows could be tested / broken. We had specifically mentioned of a selloff at higher levels in our report dated 3rd Jan 09. However, the Satyam fiasco seems to have terminated the short-term up move alittle prematurely and now we are on the way to test the previous bottoms.
Pattern Formation:
On the weekly charts, we are witnessing a pattern resembling a triangular breakdown. The projected target of the above patternis around 7200 - 7000 / 2150 - 2100 levels and this could come as early as next 3 - 4 weeks.
As mentioned earlier the 13-day EMA cutting the 34-day EMA from above on the monthly charts. We are now witnessing the effectof that in terms of the fall which is likely to catch momentum in the coming weeks.
On the weekly charts, RSI and the RSI smoothened which are momentum indicators are about to give a negative crossover whichclearly indicates further weakness in coming trading sessions ahead.
Technical Picks
Source: Advanced Get
Technical Research Team
Future Outlook:
The coming week being a truncated week along with the F&Oexpiry is expected to witness somewhat of a sideways move,though with negative bias. Any up move is an opportunity fortraders to build short positions with a stop loss of 9430 / 2870levels. Long term investors can think of investing around to7200 - 7000 / 2150 - 2100 levels as we think that some wherearound these levels a long-term bottom is likely to be formed.
Source: Advanced Get
Angel Broking Ltd : BSE Sebi Regn No : INB 010996539 / CDSL Regn No: IN - DP - CDSL - 234 - 2004 / PMS Regn Code: PM/INP000001546 Angel Capital & Debt Market Ltd: INB 231279838 / NSE FNO: INF 231279838 / NSE Member code -12798
For Private Circulation Only
Angel BrokingService Truly Personalized
TM
14
Mutual Fund Focus
Disclaimer: - Angel Capital & Debt Market Ltd is not responsible for any error or inaccuracy or any losses suffered on account of information contained in this report. Mutual Fund investments are subjected to market risk.Please go through offer document before investing.
Monthly Income Plans (MIPs)
Monthly Income Plan is a category of Debt Fund .MIP is launched with the objective -to provide investors with a monthly income.The difference between a debt fund and an MIP is that a debt fund is fully invested in debt securities, whereas an MIP has theflexibility of investing in equity - up to 20 per cent.
Features
Objective Regular Income & Capital Protection
Risk Low
Investment Portfolio Not More than 20% equity &balance in Debt
Who should invest Moderate/Conservative investors
Investment horizon More than 1 Year
Tax Implications Dividend-Tax Free.(01/04/2008) Short term Capital Gain-33.99 %
Long Term Capital Gain-11.33%(22.66 % with Indexation)
Suitable for Salient Features of MIP
MIPs' target segment includes retired people or thosenearing retirement.
The offering could be a good solution for those who wantto invest in safer assets and still want some 'equity icing'.
Those who prefer to have low-risk investment and stillwant to participate in an upside should consider investinginto an MIP.
These funds were launched with the objective of providingregular income to the investor.
The regular income objective could be achieved byinvesting at least 80% of the assets in good quality debtpaper, Fixed-income instruments and the rest in equities.
In Current Market Scenario
Debt Side: In a falling interest rate environment, MIPscould deliver good returns going forward.
Equity Side: When equities are available at attractiveprices, risk averse investors can take the route of MIPs toparticipate in equities.
SIP Analysis of Top MIP Schemes
Equity Portion: - up to 20%
Additional boost toreturns
Benefit from attractivevaluations
Upside marketParticipation
Debt Portion: - up to 80%
Safety
Regular Income
Potential High returnsin falling Interest Rate
Asset Allocation-(MIP)
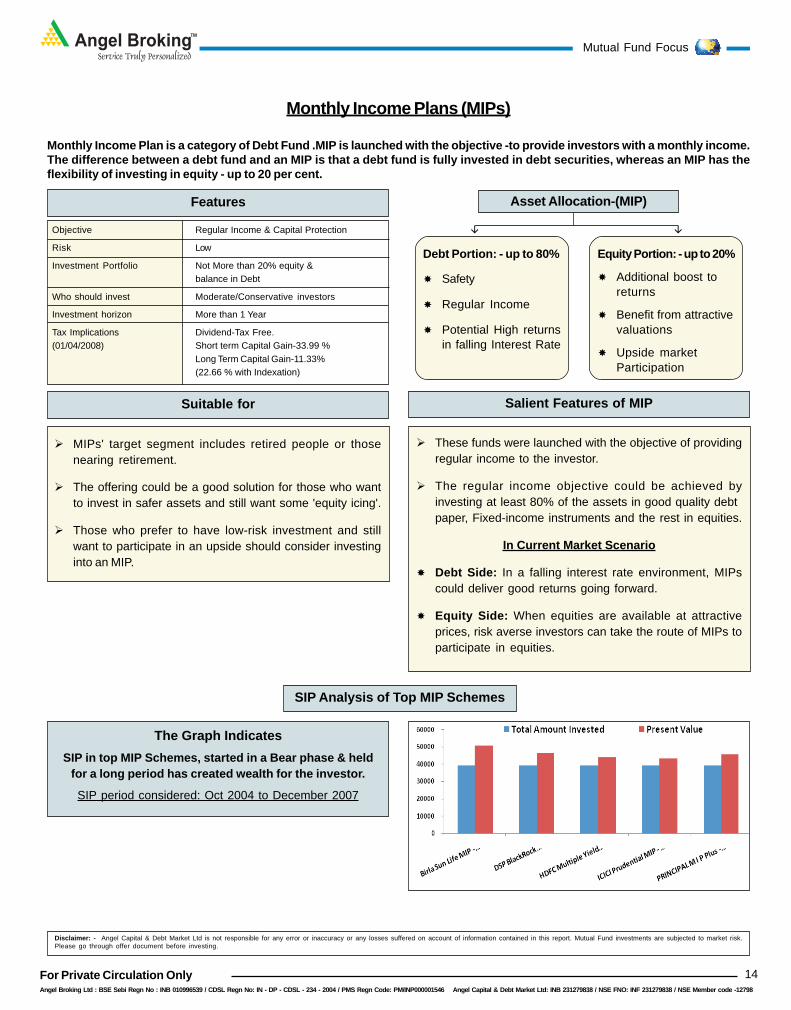
The Graph IndicatesSIP in top MIP Schemes, started in a Bear phase & held
for a long period has created wealth for the investor.
SIP period considered: Oct 2004 to December 2007
Angel Commodities Broking (P) Ltd: MCX Member ID: 12685 / FMC Regn No: MCX / TCM / CORP / 0037 NCDEX : Member ID 00220 / FMC Regn No: NCDEX / TCM / CORP / 0302
For Private Circulation Only
Angel BrokingService Truly Personalized
TM
15
Mutual Fund Focus
Our Pick in MIP Category
AMC Name:
Website:
2008‐2009 2007‐2008 2006‐2007 2005‐2006 2004‐2005*
15.18 12.81 11.64 10.93 10.37
1656.03 6.30 5.92 9.16 16.90
18.48 10.04 6.55 5.33 3.63
‐40.99 23.89 12.31 64.56 11.87
1/(17) 8/(17) 6/(17) 13/(15) 10/(12)
27.64 Q1 Q2 Q3 Q4
15.18 02.19 07.34 14.43 NA
Lump sum 5000.00 02.44 02.51 02.34 02.29Min Investment (Rs )
2007‐2008
NAV as on (20‐Jan‐2009 ) Rs.
Returns (%)
CNX NIFTY Returns (%)
Category Rank
*Returns Since Inception Date
Quarterly Performance ‐ Last 5 years
Financial Year
2008‐2009
AUM As On (31‐Dec‐2008) Rs.Cr
Fund Details
BenchMark
Max.Entry Load (%)
5‐Years History
Financial Year
NAV in Rs.(as on 31st March)
Scheme
Launch Date
Crisil MIP Blended Index
0
0Max.Exit Load (%)
Fund Manager
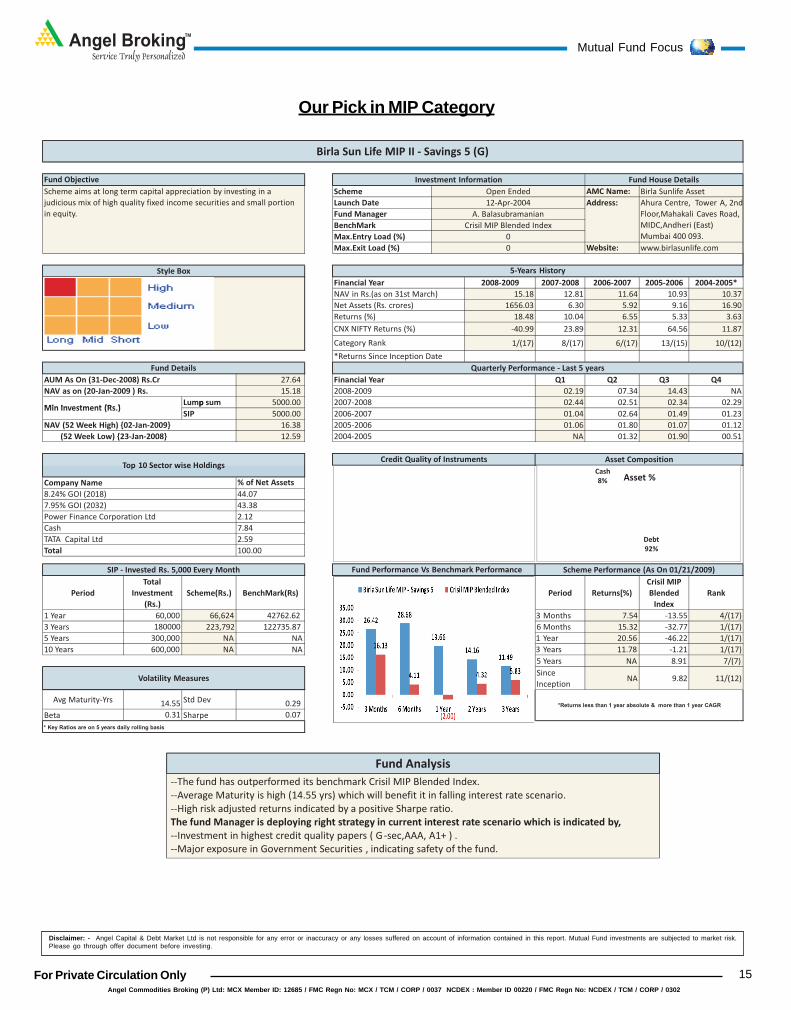
Birla Sun Life MIP II ‐ Savings 5 (G)
Fund Objective Fund House Details
Open Ended
Investment Information
A. Balasubramanian
Birla Sunlife Asset
Address: Ahura Centre, Tower A, 2nd
Floor,Mahakali Caves Road,
MIDC,Andheri (East)
Mumbai 400 093.
www.birlasunlife.com
Net Assets (Rs. crores)
12‐Apr‐2004
Scheme aims at long term capital appreciation by investing in a
judicious mix of high quality fixed income securities and small portion
in equity.
Style Box
p
SIP 5000.00 01.04 02.64 01.49 01.23
16.38 01.06 01.80 01.07 01.12
12.59 NA 01.32 01.90 00.51
% of Net Assets
44.07
43.38
2.12
7.84
2.59
100.00
Period
Total
Investment
(Rs.)
Scheme(Rs.) BenchMark(Rs) Period Returns[%)
Crisil MIP
Blended
Index
Rank
1 Year 60,000 66,624 42762.62 3 Months 7.54 ‐13.55 4/(17)
3 Years 180000 223,792 122735.87 6 Months 15.32 ‐32.77 1/(17)
5 Years 300,000 NA NA 1 Year 20.56 ‐46.22 1/(17)
10 Years 600,000 NA NA 3 Years 11.78 ‐1.21 1/(17)
5 Years NA 8.91 7/(7)
Since
InceptionNA 9.82 11/(12)
Avg Maturity‐Yrs 14.55 Std Dev 0.29
Beta 0.31 Sharpe 0.07
* Key Ratios are on 5 years daily rolling basis
*Returns less than 1 year absolute & more than 1 year CAGR
Volatility Measures
Credit Quality of Instruments
Fund Performance Vs Benchmark PerformanceSIP ‐ Invested Rs. 5,000 Every Month
7.95% GOI (2032)
Power Finance Corporation Ltd
Cash
TATA Capital Ltd
Total
Scheme Performance (As On 01/21/2009)
Asset Composition
Company Name
8.24% GOI (2018)
Min Investment (Rs.)
NAV (52 Week High) {02‐Jan‐2009}
(52 Week Low) {23‐Jan‐2008} 2004‐2005
2006‐2007
2005‐2006
Top 10 Sector wise Holdings
Debt
92%
Cash
8% Asset %
‐‐The fund has outperformed its benchmark Crisil MIP Blended Index.
‐‐Average Maturity is high (14.55 yrs) which will benefit it in falling interest rate scenario.
‐‐High risk adjusted returns indicated by a positive Sharpe ratio.
The fund Manager is deploying right strategy in current interest rate scenario which is indicated by,
‐‐Investment in highest credit quality papers ( G‐sec,AAA, A1+ ) .
‐‐Major exposure in Government Securities , indicating safety of the fund.
Fund Analysis
Disclaimer: - Angel Capital & Debt Market Ltd is not responsible for any error or inaccuracy or any losses suffered on account of information contained in this report. Mutual Fund investments are subjected to market risk.Please go through offer document before investing.
Angel Broking Ltd : BSE Sebi Regn No : INB 010996539 / CDSL Regn No: IN - DP - CDSL - 234 - 2004 / PMS Regn Code: PM/INP000001546 Angel Capital & Debt Market Ltd: INB 231279838 / NSE FNO: INF 231279838 / NSE Member code -12798
For Private Circulation Only
Angel BrokingService Truly Personalized
TM
16
Medium-term trend of Nifty is downward, however avoid short at current levels
Derivatives Review
Nifty spot has closed at 2679 this week against a close of 2828 last week. The Put-Call Ratio is at 0.77 levels against as 0.93 levelslast week and the annualized Cost of Carry (CoC) is negative 52.80%. The Open Interest in Nifty Futures has increased by 20.05%.
PCR-OI has reduced from 0.93 to 0.77 levels week-over-weekmainly due to unwinding in put options. We believed participantwho had written the put options were covering their positions.2600 put option has highest OI. We don't expect market to gosignificantly below 2600 levels. Any move below 2600 levelscan use to cover short. 3000 call option and 2500 put option ofFebruary contract has highest OI. Stocks which are active inoptions of February contract are RELIANCE, RELINFRA, UNITECH,RPL, SBIN and NTPC.
Put Call Ratio Analysis Futures Annual Volatility Analysis
Nifty futures OI increased by 20.05%. Roll over of Nifty futures is39%. FIIs were continuously forming short position in Indexfutures. Stocks which have decent rollover are TATAMOTOR,BHEL, LT, POWERGRID and HINDALCO but discount hasincreased in these counters. Thus it could be rollover on shortside. Long rollover has been witnessed in HINDUNILVR,SUZLON and RPOWER.
Nifty January future is trading at discount of 23.25 points whileFebruary future is at discount of 30.00 points. This discount ismainly dues to formation of short positions. Counters wherecost of carry is positive are NAGARFERT, ANSALINFRA,HINDOILEXP, IVRCLINFRA and KSOILS. Stocks where CoC isnegative are NATIONALUM, DLF, NTPC, POWERGRID andUNITECH.
Open Interest Analysis Cost of Carry Analysis
Derivative Strategy
Nifty futures annual volatility decreased week-over-week from60.02% to 54.55%. Implied volatility decreased from 44% to35% due to expiry. However February contract's IV is at 47%. Atthe money Call option's IV is 35% and put option's IV is at 36%.Put options IV is higher than call option IV due to buying of putoptions but it is noticed that IV is with in the range. Counterswhere HV's have increased are POWERGRID, POLARIS, ZEEL,CANBK and CIPLA. Stocks where HV's has declined are ITC,RPOWER, JSL, HEROHONDA and STERLINBIO.
Scrip : TATA STEEL CMP : Rs. 166/- Lot Size : 382 Exercise Day (F&O) : 29th January, 2009
Expected PayoffView: Mildly Bullish
Closing Price ExpectedProfit/Loss
Rs. 160.00
Rs. 165.00
Rs. 170.00
Rs. 175.00
Rs. 180.00
BEP: Rs. 173/-
Max. Risk: Rs. 1146/- Max. Profit: UnlimitedIf TATA STEEL closes below Rs.170. If TATA STEEL continue to trade above Rs. 173/-
NOTE: Profit can be booked before expiry if TATA STEEL moves in favorable direction.
(Rs. 3.00)
(Rs. 3.00)
(Rs. 3.00)
Rs. 2.00
Rs. 7.00
Strategy: Long Call
Buy/Sell Qty Scrip Strike Series Option MarketPrice Type Price(Rs.)
BUY 382 TATA STEEL 170 January CALL 3.00
Angel Commodities Broking (P) Ltd: MCX Member ID: 12685 / FMC Regn No: MCX / TCM / CORP / 0037 NCDEX : Member ID 00220 / FMC Regn No: NCDEX / TCM / CORP / 0302
For Private Circulation Only
Angel BrokingService Truly Personalized
TM
17
Commodities Center
Soybean
Sr. Research Analyst (Commodities) - Badruddin
Market Commentary:
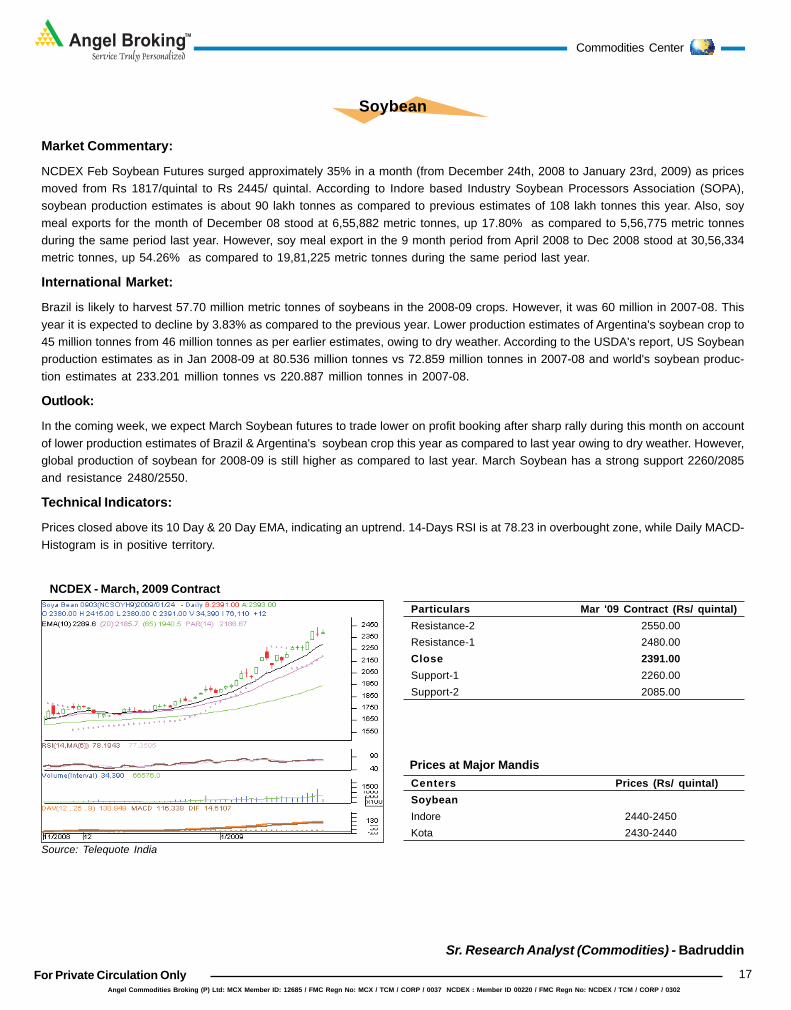
NCDEX Feb Soybean Futures surged approximately 35% in a month (from December 24th, 2008 to January 23rd, 2009) as pricesmoved from Rs 1817/quintal to Rs 2445/ quintal. According to Indore based Industry Soybean Processors Association (SOPA),soybean production estimates is about 90 lakh tonnes as compared to previous estimates of 108 lakh tonnes this year. Also, soymeal exports for the month of December 08 stood at 6,55,882 metric tonnes, up 17.80% as compared to 5,56,775 metric tonnesduring the same period last year. However, soy meal export in the 9 month period from April 2008 to Dec 2008 stood at 30,56,334metric tonnes, up 54.26% as compared to 19,81,225 metric tonnes during the same period last year.
International Market:
Brazil is likely to harvest 57.70 million metric tonnes of soybeans in the 2008-09 crops. However, it was 60 million in 2007-08. Thisyear it is expected to decline by 3.83% as compared to the previous year. Lower production estimates of Argentina's soybean crop to45 million tonnes from 46 million tonnes as per earlier estimates, owing to dry weather. According to the USDA's report, US Soybeanproduction estimates as in Jan 2008-09 at 80.536 million tonnes vs 72.859 million tonnes in 2007-08 and world's soybean produc-tion estimates at 233.201 million tonnes vs 220.887 million tonnes in 2007-08.
Outlook:
In the coming week, we expect March Soybean futures to trade lower on profit booking after sharp rally during this month on accountof lower production estimates of Brazil & Argentina's soybean crop this year as compared to last year owing to dry weather. However,global production of soybean for 2008-09 is still higher as compared to last year. March Soybean has a strong support 2260/2085and resistance 2480/2550.
Technical Indicators:
Prices closed above its 10 Day & 20 Day EMA, indicating an uptrend. 14-Days RSI is at 78.23 in overbought zone, while Daily MACD-Histogram is in positive territory.
NCDEX - March, 2009 Contract
Source: Telequote India
Particulars Mar '09 Contract (Rs/ quintal)Resistance-2 2550.00Resistance-1 2480.00Close 2391.00Support-1 2260.00Support-2 2085.00
Centers Prices (Rs/ quintal)SoybeanIndore 2440-2450Kota 2430-2440
Prices at Major Mandis
Angel Broking Ltd : BSE Sebi Regn No : INB 010996539 / CDSL Regn No: IN - DP - CDSL - 234 - 2004 / PMS Regn Code: PM/INP000001546 Angel Capital & Debt Market Ltd: INB 231279838 / NSE FNO: INF 231279838 / NSE Member code -12798
For Private Circulation Only
Angel BrokingService Truly Personalized
TM
18
Sr Technical Analyst (Commodities) - Samson P
BULLION
Commodities Center
Last week, Gold prices opened the week at 13152 initially movedlower and as expected found good support at 13002 levels.Later prices rallied sharply higher breaking all the resistancesmade a high of 14169 and finally ended the week with a hugegain of Rs.870 to close at 14038.
TREND : BULLISH
TRADING LEVELS:
This week market is expected to find very good Support at13980- 13950 levels. And strong support is seen at 13800-13770 levels.
Trading below 13770 would lead to lower prices initiallytowards 13670 then 13556 and then finally towards the majorsupport at 13400.
Resistance is observed in the range of 14290-14310. Andstrong resistance is seen at 14430-14450.
Trading above 14450 would lead to higher prices initiallytowards 14600 then 14750 and then finally towards 14900.
Recommendation: Buy in the range of 13805-13780 with strictstop-loss below 13600 Targeting 14280 then 14400.
MCX FEBRUARY GOLDLast week, Silver prices opened the week at 18268 initially movedlower and as expected found very good support at 18051 levels.Later prices rallied sharply higher made a high of 19380 andfinally ended the week with a huge gain of Rs.884 to close at19201.
TREND : BULLISH
TRADING LEVELS:
This week market is expected to find good support at 19130-19060 levels. And Strong support is seen at 18960-18900levels.
Trading below 18900 would lead to lower prices initiallytowards 18750 then 18540 and then finally towards 18400levels.
Resistance is observed in the range of 19470-19500. Strongresistance is seen at 19600-19650.
Trading above 19650 would lead to higher prices initiallytowards 19950 then 20040 and then finally towards 20247.
Recommendation: Neutral
MCX MARCH SILVER
Last week, Copper prices opened the week at 166.50 initiallymoved higher and as expected found good resistance at 169.50levels. Later prices fell sharply lower towards breaking all thesupports but finally found good support at 150.85 recoveredtowards 160.0 levels and finally ended the week with a loss ofRs.6.80 to close at 159.30.
TREND: NEUTRAL-BULLISH
TRADING LEVELS:
This week market is expected to find good support in therange of 156.50-154.0 levels. And strong support is seen at149.50-148.30
Trading below 148.0 would lead to lower prices initiallytowards 144.50 then 142.0 and then finally towards 138.0.
Resistance is observed in the range of 162.0-164.0 levelsand then Strong resistance is seen at 168.0-170.0
Trading Above 170.0 would lead to higher prices initiallytowards 174.60 then 179.80 and then finally towards 184.0levels.
Recommendation: Buy in the range of 157.0-155.0 with strictstop-loss below 148.0 Targeting 168.0 then 174.0.
MCX FEBRUARY COPPERLast week, Crude price opened the week at 2070 initially movedsharply lower and as expected found strong support at 1933levels. Later prices recovered sharply higher made a high of2265 and finally ended the week with a gain of Rs.160 to closeat 2238.
TREND : BULLISH
TRADING LEVELS:
This week market is expected to find good support in therange of 2200-2170 levels. And strong support is seen at2090-2060 levels.
Trading below 2050 would lead to lower prices initiallytowards 2010 then 1970 and then finally towards 1900.
Resistance is observed in the range of 2300-2325 levels. Andstrong resistance is seen at 2395-2410.
Trading above 2410 would lead to higher prices initiallytowards 2450 then 2520 and then finally towards 2600.
Recommendation : Buy in the range of 2175-2160 with strictstop-loss below 2050 Targeting 2320 then 2410.
MCX FEBRUARY CRUDE
Angel Commodities Broking (P) Ltd: MCX Member ID: 12685 / FMC Regn No: MCX / TCM / CORP / 0037 NCDEX : Member ID 00220 / FMC Regn No: NCDEX / TCM / CORP / 0302
For Private Circulation Only
Angel BrokingService Truly Personalized
TM
19
Fund Management & Investment Advisory ( 022 - 3952 4568)P. Phani Sekhar Fund Manager - (PMS) [email protected] Bhamre Head - Investment Advisory [email protected] Mehta AVP - Investment Advisory [email protected] Team ( 022 - 3952 4568)Hitesh Agrawal Head - Research [email protected] Kour Nangra VP-Research, Pharmaceutical [email protected] Jajoo Automobile [email protected] Shah IT, Telecom [email protected] Pareek Oil & Gas [email protected] Burde Metals & Mining, Cement [email protected] Agrawal Banking [email protected] Solanki Power, Mid-cap [email protected] Kanani Infrastructure, Real Estate [email protected] Shah FMCG , Media [email protected] Bambha Capital Goods, Engineering [email protected] Dalmia Pharmaceutical [email protected] Sehgal Retail [email protected] Mavani Research Associate (Automobile) [email protected] Vora Research Associate (Oil & Gas) [email protected] Mate Research Associate (Infra, Real Estate) [email protected] Boob Research Associate (FMCG , Media) [email protected] Srinivasan Research Associate (Power, Mid-cap) [email protected] Bagaria PMS [email protected] Idnany Research Associate - (PMS) [email protected] Wagle Chief Technical Analyst [email protected] Joshi AVP Technical Advisory Services [email protected] Ail Manager - Technical Advisory Services [email protected] Jagtap Sr. Technical Analyst [email protected] Sanghvi Sr. Technical Analyst [email protected] Vasudeo Technical Advisor (TAS) [email protected] Dayma Derivative Analyst [email protected] Research TeamAmar Singh Research Head (Commodities) [email protected] P Sr. Technical Analyst [email protected] Gupta Sr. Technical Analyst [email protected] Patki Sr. Technical Analyst [email protected] Research Team (Fundamentals)Badruddin Sr. Research Analyst (Agri) [email protected] Pote Research Analyst (Energy) [email protected] Shetty Research Editor [email protected] Patil Production [email protected]
DisclaimerThis document is not for public distribution and has been furnished to you solely for your information and must not be reproduced or redistributed to any other person. Persons into whosepossession this document may come are required to observe these restrictions.Opinion expressed is our current opinion as of the date appearing on this material only. While we endeavor to update on a reasonable basis the information discussed in this material, there may beregulatory, compliance, or other reasons that prevent us from doing so. Prospective investors and others are cautioned that any forward-looking statements are not predictions and may be subjectto change without notice. Our proprietary trading and investment businesses may make investment decisions that are inconsistent with the recommendations expressed herein.The information in this document has been printed on the basis of publicly available information, internal data and other reliable sources believed to be true and are for general guidance only. Whileevery effort is made to ensure the accuracy and completeness of information contained, the company takes no guarantee and assumes no liability for any errors or omissions of the information. Noone can use the information as the basis for any claim, demand or cause of action.Recipients of this material should rely on their own investigations and take their own professional advice. Each recipient of this document should make such investigations as it deems necessaryto arrive at an independent evaluation of an investment in the securities of companies referred to in this document (including the merits and risks involved), and should consult their own advisorsto determine the merits and risks of such an investment. Price and value of the investments referred to in this material may go up or down. Past performance is not a guide for future performance.Certain transactions - futures, options and other derivatives as well as non-investment grade securities - involve substantial risks and are not suitable for all investors. Reports based on technicalanalysis centers on studying charts of a stock's price movement and trading volume, as opposed to focusing on a company's fundamentals and as such, may not match with a report on a company'sfundamentals.We do not undertake to advise you as to any change of our views expressed in this document. While we would endeavor to update the information herein on a reasonable basis, Angel Broking, itssubsidiaries and associated companies, their directors and employees are under no obligation to update or keep the information current. Also there may be regulatory, compliance, or other reasonsthat may prevent Angel Broking and affiliates from doing so. Prospective investors and others are cautioned that any forward-looking statements are not predictions and may be subject to changewithout notice. Angel Broking Limited and affiliates, including the analyst who has issued this report, may, on the date of this report, and from time to time, have long or short positions in, and buyor sell the securities of the companies mentioned herein or engage in any other transaction involving such securities and earn brokerage or compensation or act as advisor or have other potentialconflict of interest with respect to company/ies mentioned herein or inconsistent with any recommendation and related information and opinions.Angel Broking Limited and affiliates may seek to provide or have engaged in providing corporate finance, investment banking or other advisory services in a merger or specific transaction to thecompanies referred to in this report, as on the date of this report or in the past.
Research & Investment Advisory: Acme Plaza, 3rd Floor ‘A’ wing, M.V. Road, Opp Sangam Cinema, Andheri (E), Mumbai - 400 059
Buy (Upside > 15%) Accumulate (Upside upto 15%) Neutral (5 to -5%)Reduce (Downside upto 15%) Sell (Downside > 15%)
Ratings (Returns) :
Angel Broking Ltd : BSE Sebi Regn No : INB 010996539 / CDSL Regn No: IN - DP - CDSL - 234 - 2004 / PMS Regn Code: PM/INP000001546 Angel Capital & Debt Market Ltd: INB 231279838 / NSE FNO: INF 231279838 / NSE Member code -12798Angel Commodities Broking (P) Ltd: MCX Member ID: 12685 / FMC Regn No: MCX / TCM / CORP / 0037 NCDEX : Member ID 00220 / FMC Regn No: NCDEX / TCM / CORP / 0302
Central Support & Registered Office:G-1, Akruti Trade Centre, Road No. 7, MIDC Marol, Andheri (E), Mumbai - 400 093 Tel : 2835 8800 / 3083 7700
Corporate & Marketing Office : 612, Acme Plaza, M.V. Road, Opp Sangam Cinema, Andheri (E), Mumbai - 400 059 Tel : (022) 3941 3940NRI Helpdesk : e-mail : [email protected] Tel : (022) 4000 3622 / 4026 2700Investment Advisory Helpdesk : e-mail : [email protected] Tel : (022) 3952 4568Commodities : e-mail : [email protected] Tel : (022) 3952 9200PMS : e-mail : [email protected] Tel: (022) 3953 2800Feedback : e-mail : [email protected] Tel : (022) 2835 5000
Regional Offices:
Private Client Group Offices: Sub - Broker Marketing:Ahmedabad (C. G. Road) - Tel: (079) 3982 9934 Rajkot (Race course) - Tel: (0281) 2490 847Surat - Tel: (0261) 3071 600 Powai - Tel: (022) 3952 6500
Branch Offices:
Andheri (W) - Tel: (022) 2635 2345 / 6668 0021
Bandra (W) - Tel: (022) 2655 5560 / 70
Andheri ( L o k h a n d w a l a ) - Te l : ( 0 2 2 ) 3 9 5 2 5 6 7 9
Bandra (W) - Tel: (022) 6643 2694 - 99
Borivali (W) - Tel: (022) 3952 4787
Borivali (Punjabi Lane) - Tel: (022) 3951 5700.
Chembur - (Basant) - Tel:(022) 3267 9114/ 15
Kalbadevi - Tel: (022) 2243 5599 / 2242 5599
Kandivali (W) - Tel: (022) 2867 3800/2867 7032
Chembur - Tel: (022) 6703 0210 / 11 /12
Fort - Tel: (022) 3958 1887
Ghatkopar (E) - Tel: (022) 6799 3185 - 88
Malad (E) - Tel: (022) 2880 4440
Kandivali - Tel: (022) 2846 1654 / 2056 / 2076
Malad (Natraj Market) - Tel:(022) 28803453 / 24
Masjid Bander - Tel: (022) 2345 5130 /1 / 8 / 42 /28
Mulund (W) - Tel: (022) 2562 2282
Nerul - Tel: (022) 2771 9012 - 17
Sion - Tel: (022) 3952 7891
Powai (E) - Tel: (022) 3952 5887
Thane (W) - Tel: (022) 2539 0786 / 0650 / 1
Vashi - Tel: (022) 2765 4749 / 2251
Vile Parle (W) - Tel: (022) 2610 2894 / 95
Wadala - Tel: (022) 2414 0607 / 08
Agra - Tel: (0562) 4037200
Ahmedabad (Kalupur) - Tel: (079) 3041 4000 / 01
Ahmedabad (Maninagar) - Tel: (079) 3981 7430 / 1
Ajmer - Tel: (0145) 3941 3940
Alwar - Tel: (0144) 3941 3940 / 99833 60006
Ahmeda. (Bapu Nagar) - Tel : (079) 3091 6900 - 02
Ahmeda. (Gurukul) - Tel: (079) 3011 0800 / 01
Ahmedabad (C. G. Road) - Tel: (079) 4021 4023
Ahmedabad (Sabarmati) - Tel : (079) 3091 6100 / 01
Ahmedabad (Satellite) - Tel: (079) 4000 1000
Ahmedabad (Shahibaug) -Tel: (079)3091 6800 / 01
Amreli - Tel: (02792) 228 800/231039-42
Anand - Tel : (02692) 398 400 / 3
Amritsar - Tel: (0183) 3941 3940
Indore - Tel: (0731) 4232 100 / 31 / 40
Jaipur - (Rajapark) Tel: (0141) 3057 900 / 99833 40004
Gandhinagar - Tel: (079) 4010 1010 - 31
Gajuwaka - Tel: (0891) 3987 100 - 30
Faridabad - Tel: (0129) 3984 000
Gandhidham - Tel: (02836) 237 135
Gondal - Tel: (02825) 398 200
Ghaziabad - Tel: (0120) 3980 800
Gurgaon - Tel: (0124) 3050 700
Himatnagar - Tel: (02772) 241 008 / 241 346
Hyderabad - A S Rao Nagar Tel: (040) 4222 2070-5
Hubli - Tel: (0836) 4267 500 - 22
Indore - Tel: (0731) 3049 400
Bhopal - Tel :(0755) 3941 3940
Bikaner - Tel: (0151)3941 3940 / 98281 03988
Chandigarh - Tel: (0172) 3092 700
Deesa - Mobile: 97250 01160
Erode - Tel: (0424) 3982 600
Ankleshwar - Tel: (02646) 398 200
Baroda - Tel: (0265) 2226 103-04 / 6624 280
Baroda (Akota) - Tel: (0265) 2355 258 / 6499 286
Baroda (Manjalpur) - Tel: (0265) 6454280-3
Bhavnagar (Shastrinagar)- Mobile: 92275 32302
Bhavnagar - Tel: (0278) 3941 3940
Bengaluru - Tel: (080) 4072 0800 - 29
Ahmeda. (Ramdevnagar) - Tel : (079) 4024 3842 / 43
Jamnagar (Cross Word) - Tel: (0288) 2751 118
Jamnagar(Indraprashta) - Tel: (0288) 3941 3940
Jodhpur - Tel: (0291) 3941 3940 / 99280 24321
Junagadh - Tel : (0285) 3941 3940
Keshod - Tel: (02871) 234 027 / 233 967
Kolkata (N. S. Rd) - Tel: (033) 3982 5050
Kolkata (P. A. Shah Rd) - Tel: (033) 3001 5100
Mehsana - Tel: (02762) 645 291 / 92
Kota - Tel : (0744) 3941 3940
Mansarovar - Tel:(0141) 3057 700/99836 74600
Mysore - Tel: (0821) 4004 200 - 30
Nadiad - Tel : (0268) - 2527 230 / 34
New Delhi (Nehru Place) - Tel: (011) 3982 0900
New Delhi (Preet Vihar) - Tel: (011) 4310 6400
Palanpur - Tel: (02742) 308 060 - 63
Patel Nagar - Tel : (011) 45030 600
Patan - Tel: (02766) 222 306
Porbandar - Tel : (0286) 3941 3940
Noida - Tel : (0120) 4639 900 / 1 / 9
Nashik - Tel: (0253) 3011 500 / 1 / 11
New Delhi (Bhikaji Cama) - Tel: (011) 41659711
New Delhi (Lawrence Rd.) - Tel: (011) 3262 8699 / 8799
New Delhi (Pitampura) - Tel: (011) 47002380 / 84
Porbandar (Kuber Life Style) - Mob.-98242 53737
Pune - Tel: (020) 6640 8300 / 3052 3217
Pune (Camp) - Tel: (020) 3092 1800
Rajamundhry - Tel: (0883) 3982 200
Pune - Tel : (020) 3093 4400 / 3052 3217
Jamnagar (Moti Khawdi) - Tel: (0288) 2846 026
Jamnagar(Madhav Plaza) - Tel: (0288) 2665 708
Jalgaon - Tel: (0257) 2234 832
Pune (Aundh) - Tel: (020) 4104 1900
Rajkot (Ardella) Tel.: (0281) 2926 568
Rajkot (University Rd.) - Tel: (0281) 2331 418
Rajkot - (Bhakti Nagar) Tel: (0281) 2361 935
Rajkot - (Indira circle) Tel : 99258 84848
Rajkot (Orbit Plaza) - Tel: (0281) 3983 485
Rajkot (Pedak Rd) - Tel: (0281) 3985 100
Rajkot (Ring Road)- Mobile: 99245 99393
Surat (Ring Road) - Tel : (0261) 3071 600
Surendranagar - Tel : (02752) 223305
Udaipur - (0294) 3981400
Valsad - Tel - (02632) 645 344 / 45
Vapi - Tel: (0260) 3088 210 / 211 / 2400 214
Varachha - (0261) 3091 500
Secunderabad - Tel : (040) 3093 2600
Surat (Mahidharpura) - Tel: (0261) 3092 900
Surat - (Parle Point) - Tel : (0261) 3091 400
Vijayawada - Tel :(0866) 3984 600
Rajkot (Star Chambers) - Tel : (0281)3981 200
Rajkot - (Star Chambers) - Tel : (0281) 2225 401-3
Salem - Tel: (0427) 3982 810
Warangal - Tel: (0870) 3982 200
Varanasi - Tel: (0542) 2221129, 3262431
Nagaur - Tel: (01582) 244 648
Ahmedabad - Tel: (079) 3982 2300 / 3982 5200
Bengaluru - Tel: (080) 3941 3940
Chennai - Tel: (044) 3941 3940
Hyderabad - Tel: (040) 3091 2222
Coimbatore - Tel: (0422) 3941 3940
Indore - Tel: (0731) 3941 3940
Cochin - Tel: (0484) 3941 3940
Mumbai (Powai) - Tel: (022)3952 6500
Pune - Tel: (020) 3071 0250 / 2551 3143
Surat - Tel: (0261) 3071 600
Rajkot - Tel :(0281) 2490 847
Visakhapatnam - Tel :(0891) 3987 200 - 29
New Delhi - Tel: (011) 3045 1300 / 4077 1300
Jaipur - Tel: (0141) 3941 3940
Kanpur - Tel: (0512) 3017 700
Kolkata - Tel: (033) 3941 3940
Lucknow - Tel: (0522) 3057 700
Nagpur - Tel: (0712) 3041 533
Nashik - Tel: (0253) 3011 400 / 1
Ludhiana - Tel: (0161) 4697 400
Mangalore - Tel: (0824) 3982 140
Related Documents