THIS REPORT CONTAINS ASSESSMENTS OF COMMODITY AND TRADE ISSUES MADE BY USDA STAFF AND NOT NECESSARILY STATEMENTS OF OFFICIAL U.S. GOVERNMENT POLICY Date: GAIN Report Number: Approved By: Prepared By: Report Highlights: Despite a gradual annual decline in Japanese demand for oil, improved crushing margins in marketing year (MY) 2015/16 have made domestically produced soybean meal more competitive, increasing demand for soybean imports. Post estimates imports will reach 3.15 million metric tons (MMT). As the Japanese industry is expected to take advantage of low international soybean prices, Post forecasts that demand for soybean imports will continue at the same level in MY 2016/17. The larger soybean crush is expected to result in a slight decrease in rapeseed imports, and an adjustment to blended oil ratios to utilize the increased volumes of soybean oil. Japan is expected to produce 1.825 MMT of soybean meal in MY 2015/16 and MY 2016/17, and imports of soybean meal are expected to decrease two percent to 1.625 MMT as domestic meal competes with imports from China. Key words: JA6006, soybeans, soybean oil, soybean meal, rapeseed, rapeseed oil, rapeseed meal, palm kernel meal, palm kernel shell, fish meal, palm oil, sunflowerseed oil. Yuichi Hayashi, Agricultural Specialist Jess K. Paulson, Agricultural Attaché 2016 Japan Oilseeds and Products Situation and Outlook Oilseeds and Products Annual Japan JA6006 4/7/2016 Required Report - public distribution

Welcome message from author
This document is posted to help you gain knowledge. Please leave a comment to let me know what you think about it! Share it to your friends and learn new things together.
Transcript
THIS REPORT CONTAINS ASSESSMENTS OF COMMODITY AND TRADE ISSUES MADE BY
USDA STAFF AND NOT NECESSARILY STATEMENTS OF OFFICIAL U.S. GOVERNMENT
POLICY
Date:
GAIN Report Number:
Approved By:
Prepared By:
Report Highlights:
Despite a gradual annual decline in Japanese demand for oil, improved crushing margins in marketing
year (MY) 2015/16 have made domestically produced soybean meal more competitive, increasing
demand for soybean imports. Post estimates imports will reach 3.15 million metric tons (MMT). As
the Japanese industry is expected to take advantage of low international soybean prices, Post forecasts
that demand for soybean imports will continue at the same level in MY 2016/17. The larger soybean
crush is expected to result in a slight decrease in rapeseed imports, and an adjustment to blended oil
ratios to utilize the increased volumes of soybean oil. Japan is expected to produce 1.825 MMT of
soybean meal in MY 2015/16 and MY 2016/17, and imports of soybean meal are expected to decrease
two percent to 1.625 MMT as domestic meal competes with imports from China.
Key words: JA6006, soybeans, soybean oil, soybean meal, rapeseed, rapeseed oil, rapeseed meal, palm
kernel meal, palm kernel shell, fish meal, palm oil, sunflowerseed oil.
Yuichi Hayashi, Agricultural Specialist
Jess K. Paulson, Agricultural Attaché
2016 Japan Oilseeds and Products Situation and Outlook
Oilseeds and Products Annual
Japan
JA6006
4/7/2016
Required Report - public distribution
Executive Summary:
Although Japan’s long-term consumption of soybeans is expected to decrease due to a shrinking and
aging population, the short term per-capita consumption outlook is fairly stable. All domestic soybeans
are used for food and account for roughly a quarter of total soybean consumption. Japan’s domestic
soybean production is driven by a policy to prevent the oversupply of rice. Soybean planted area and
production in MY 2016/17 are forecast to remain at 140,000 hectares (HA) and 240,000 metric ton
(MT) as soybeans continue to offer better profit margins compared to other crops.
Despite a very gradual annual decline in Japanese demand for oil, the price competitiveness of domestic
soybean meal vis-à-vis imported Chinese soybean meal is expect to result in increased soybean crush.
Post forecasts that the 12 percent increase in soybean crush in MY 2015/16 will hold steady in MY
2016/17 at 2.4 MMT. Japan is expected to produce 1.825 MMT of soybean meal in both MY 2015/16
and MY 2016/17, and imports of soybean meal are expected to decrease two percent to 1.625 MMT.
With increasing domestic crush, soybean imports for MY 2015/16 and MY 2016/17 are expected to
remain strong at 3.15 MMT as crushers take advantage of low international soybean prices and profit
from soybean meal production.
The larger soybean crush is expected to result in a slight decrease in rapeseed imports, and an
adjustment to blended oil ratios to utilize the increased volumes of soybean oil. Post forecasts rapeseed
imports and crush will decline two percent from the previous year to 2.45 MMT and 2.40 MMT
respectively in MY 2015/16 and MY 2016/17.
Commodities:
Area harvested:
Some regions of Japan, such as Tokachi in Hokkaido, plant soybeans in dry fields in rotation with
wheat, sugar beets, and potatoes. Farmers plant soybean or azuki beans as the pulse rotation. However,
in the rest of Japan, the government of Japan (GOJ) encourages farmers to plant soybeans in rice
paddies as a way to control the oversupply of rice. Soybean area planted in rice paddies accounted for
83 percent of soybean planted area in MY 2015/16. Farmers in Tokai and Northern Kyushu commonly
plant rice, winter wheat and soybeans as part of a two-year crop rotation. Sources indicate that the
combination of winter wheat and soybeans can be as profitable as rice alone, but farmers in northern
Japan and Hokuriku (Japan Sea side) are unable to do this two-year rotation, because winter wheat
needs longer period to grow there, and they cannot harvest it before soybean planting season.
MY 2015/16 planted area increased eight percent from the previous year and was the largest planted
area since 2009 (145,300 HA). The planted area in Hokkaido increased 19 percent due mainly to
farmers switching from azuki beans, which were offering lower returns. A government program that
encourages farmers to divert rice paddies from table rice production into feed rice, wheat, and soybean
production (among others), combined with a relatively high price for domestic soybeans, resulted in an
Oilseed, Rapeseed
Oilseed, Soybean

increase in soybean planted area in Tohoku of eight percent. The planted area of these two regions
accounts for 48 percent of soybean planted area and for 78 percent of the increase in planted area in MY
2015/16. The subsidy payment for replacing rice production with soybeans improved the prospective
return for soybeans ahead of planting decisions (see the 2013 Oilseeds and Products Annual Report
JA3011 for more details).
Table 1. GOJ Table Rice Diversion Subsidies
Crop/Subsidy (Yen/0.1 hectares) JFY 2013 JFY 2014 - 2016
Wheat, Soybeans, Feed Crop 35,000 35,000
Paddy Rice for WCS* 80,000 80,000
Buckwheat, Rape Seed 20,000 20,000
Rice for Industrial Use 20,000 20,000
Feed Rice, Rice for Flour 80,000 55,000 - 105,000
* WCS: Whole Crop Silage, Approximate Exchange Rate: 113 Yen = $1JFY: Japan fiscal year (April –
March)
Post forecasts MY 2016/17 planted area will remain high at 142,000 HA due to the continuation of
Japan’s rice diversion subsidies and better returns compared to crops such as azuki beans.
Table 2. Planted Area, Production and Yield of Soybeans in Japan
MY Planted Area (Hectares) Production
(MT)
Yield
(MT per hectare)
2011/12 136,700 218,800 1.60
2012/13 131,100 235,900 1.80
2013/14 128,800 198,000 1.55
2014/15 131,600 225,600 1.76
2015/16 142,000 242,400 1.71
Source: MAFF (approximate figures for MY2015/16)
Production:
MY 2015/16 soybean production increased five percent to 242,400 metric tons (MT). The increase in
planted area more than made up for low yields, which were down three percent from the previous year
due to typhoon damage in the Kanto region and also low temperatures and poor sunshine in the western
Tokai region, which retarded growth and grain filling.
As the inherently poor drainage of rice paddy soils results in significantly lower yields, national yield
averages remain stubbornly low, at little more than half of U. S. yields. The average yield for the last
ten years has been 1.65 MT/HA, but yields vary dramatically by region. The Ministry of Agriculture,
Forestry and Fishery (MAFF) began a five-year research project to improve soybean yields beginning in
Japan fiscal year (JFY; April-March) 2015. The project involves approximately 50 organizations,
including 28 prefectures, industry groups, academia and private companies. The project will develop
diagnostic procedures and countermeasure techniques, as well as collect physical, chemical and

biological data from the soil in soybean fields to investigate factors that contribute to low yields.
Another problem for domestic soybeans is unstable quality. The percentage of lower quality soybeans
(“3rd
class” and “specific end-use class”) has been high for the last five years, ranging from 38 to 51
percent of total production. Quality issues include wrinkled or broken skin, cracks, high inclusion of
foreign materials, and rotten or dirty beans. These problems are caused by various factors such as wet
soil, drought in summer, an early or late harvest, inadequate preparation for harvest, and insufficient
pest control.
Though Japan has approved 16 genetically engineered (GE) soybean varieties for commercial
production, potential yield improvements through GE technology remain unattainable as social and
administrative hurdles preclude the technology’s use (see JA5024, the 2015 Japan Agricultural
Biotechnology Annual Report, for more details).
Of note in the Basic Plan for Food, Agriculture, and Farm Villages approved in March 2015, MAFF is
aiming to produce 320,000 MT of soybeans, with a planted area of 150,000 HA and a yield of 2.15
MT/HA, by 2025. To date, only two prefectures (Hokkaido and Saga) have reached the target yield.
Although many high-yielding soybean varieties have been developed, five traditional lower-yielding
soybean varieties account for more than 60 percent of production. Farmers prefer these varieties as
using them avoids the challenge of producing and marketing a new variety. Minimal interest in
introducing yield-improving varieties, combined with limited available land to expand oilseed area,
makes reaching the targets challenging. A concerted effort by the GOJ and JA Zen-Noh to expand
production of rice for feed is expected to further discourage expanded soybean planted area. In MY
2015/16, Japan increased its feed rice production 2.3 times more than the previous year, to 421,000 MT,
and aims to increase feed rice another 30 percent in MY 2016/17 by converting additional land from
table rice production.
Based on the factors described above, Post forecasts soybean planted area and production to remain
unchanged in MY 2016/17 at 140,000 HA and 240,000 MT respectively.
Domestic rapeseed production is primarily for ornamental or small local crushers to make products for
local consumption. MY 2015/16 planted area and production were minimal and negligible, at 1,620 HA
and 3,100 MT (a mere 0.1 percent of imports) respectively.
Consumption
Crush:
Soybean oil historically had the largest share of the vegetable oil market. However, today soybean oil is
the third largest oil consumed in Japan, after rapeseed and palm oil. Japanese consumption of rapeseed
oil exceeded soybean oil in 1989, and then palm oil overtook soybean oil in 2009.

However, in the last two years, demand for soybean meal and oil has been gradually increasing vis-a-vis
rapeseed. Feed manufacturers have been increasing the use of soybean meal in compound feed, as
soybean meal offers several advantages compared to rapeseed meal. (See Meal section below.) In
addition, oil manufacturers are increasing the consumption of soybean oil by changing the ratio of
blended products for food services and processed food manufacturers.
Post forecasts that soybean crush in MY 2015/16 and MY 2016/17 will increase by 12 percent from MY
2014/15 to 2.4 million metric tons (MMT) based on strong soybean meal demand from Japanese feed
millers and low international prices supported by strong production in the United States, a good crop
forecast in Brazil, and low ocean freight costs.
As previously noted, rapeseed oil has the largest share in Japan’s domestic vegetable oil market. Post
estimates that it accounts for 75 percent of the in home-use oil market and for 44 percent of the entire oil
market, including food service use and processed food manufacturing use.
Although demand for in home-use is stable, Post forecasts the crush volume for MY 2015/16 and MY
2016/17 will fall by two percent from the current marketing year to 2.4 MMT due to increasing use of
soybean oil products by professionals and for processed foods. Oil manufacturers decrease the ratio of
rapeseed oil and increase soybean oil in blended oil products.
Post estimates that Japan had 40 crushing plants in 2015 and maintained the same crushing capacity as
the previous year. Of these 40 plants, thirteen were large-scale plants that have a combined crushing
capacity of approximately 90 percent of Japan’s annual oil consumption. Most of those plants were
built in the late 1960’s, and the cost of maintaining and or refurbishing and operating these plants are
high. J-Oil Mills, which is one of the major oil crushing companies, is building a soybean crushing
plant in Okayama prefecture that will begin operations in April 2017, with the capacity to produce
70,000 MT of soybean oil and 300,000 MT of soybean meal. They will close their Kobe plant, which is
48 years old, after the new mill opens. The highly efficient new plant will be more profitable and will
crush soybeans exclusively. The facility will require only half the staff and is forecast to save 700
million to one billion yen (6.1 to 8.8 million USD) in annual operating costs. Zen-Noh silo and JA East
Japan Cooperative Feed are also constructing storage and a feed plant near the new crushing facility.
They will use soybean meal from the new plant to produce 800,000 MT of animal feed annually.
Table 3. Japan’s Oil Crushing Capacity
CY Number of Mills
*
Crushing Capacity*
(1,000 MT)
Materials crushed
(1,000 MT)
Operating Ratio*
(percent)
2011 40 8,587 5,087 59.2
2012 40 8,587 4,977 58.0
2013 40 8,587 4,977 57.5
2014 40 8,587 5,068 59.0
2015 40 8,587 5,335 62.1
Source: MAFF (Vegetable oil production report), * Post estimate
Food Use Consumption:
Although soybeans are typically crushed to produce oil and meal in the rest of the world, soybeans have
historically been a food crop in Japan, used for the production of soy foods such as tofu, natto, boiled
beans, soy sauce, and miso. Although over the long-term consumption is expected to decrease due to
Japan’s shrinking and aging population, in the short term, per capita consumption is fairly stable with
some minor fluctuations. Post forecasts the consumption of soybeans in MY 2015/16 and 2016/17 at
881,000 MT, a marginal decrease from MY 2014/15. Food use consumption accounts for only one-
fourth of total soybean consumption (food, oil, meal). Although there are no official statistics available,
all domestic soybeans are reportedly used for food, and account for roughly 30 percent of food soybean
demand.
Figure 1 depicts the end use of food soybeans in 2014. Tofu continues to dominate the utilization of
food grade soybeans, accounting for almost half of total consumption. The majority of tofu
manufacturers are small, geographically dispersed businesses. The number of tofu shops and companies
decreased by 40 percent over the last ten years as the proprietors of family-run shops retired without
successors. In addition, many tofu companies have gone out of business as the retail price of tofu at
large supermarkets has remained relatively low.
Soy food is gradually regaining its popularity due to the rising health consciousness of Japanese
consumers. Some tofu manufacturers have successfully developed and marketed innovative new
products, including individual serving sized pot dishes with various flavors. The All-Japan Tofu
Federation hosted the first ever tofu competition in Kyoto last year to promote exchanges among and a
deeper appreciation for regional tofu shops. In addition to these efforts to develop the tofu market, two
tofu industry organizations contributed to the creation of a fair competition standard for tofu. A
voluntary standard for some types of tofu that was established in 1980 is out of date and does not cover
all types of tofu. This new standard is meant to improve the value and quality of tofu by setting
production standards for all tofu products. The industry organizations are planning to announce the
standard in October 2017.
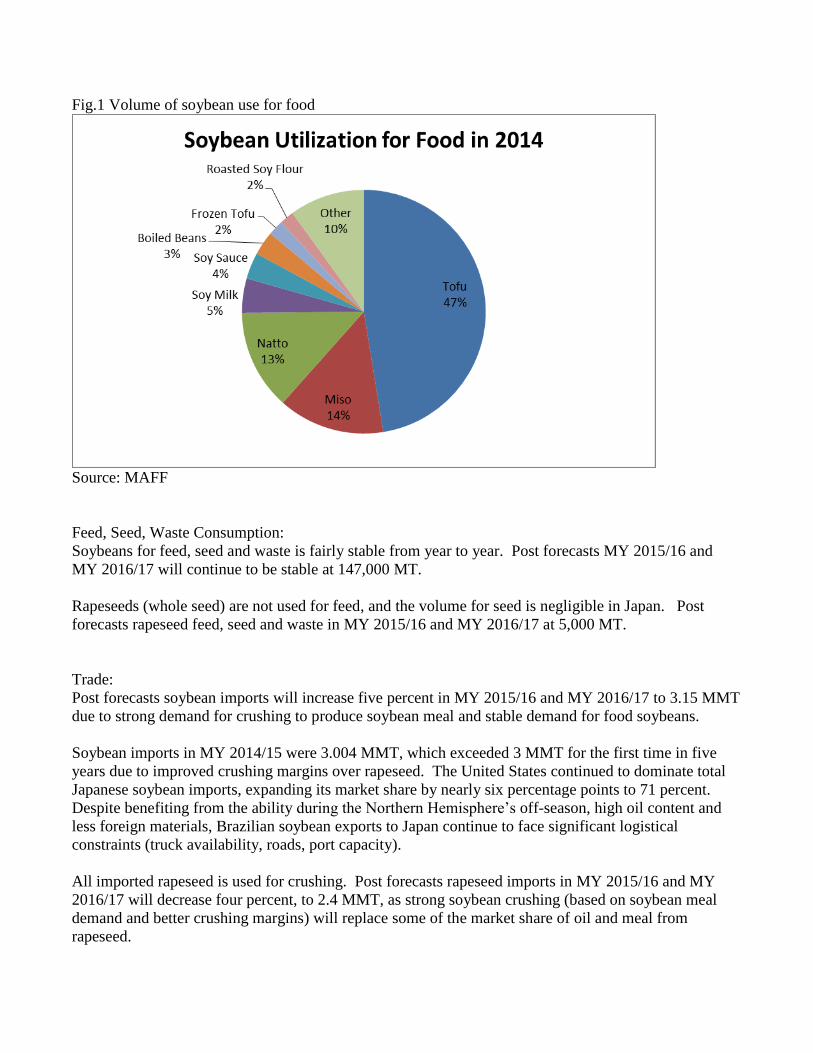
Fig.1 Volume of soybean use for food
Source: MAFF
Feed, Seed, Waste Consumption:
Soybeans for feed, seed and waste is fairly stable from year to year. Post forecasts MY 2015/16 and
MY 2016/17 will continue to be stable at 147,000 MT.
Rapeseeds (whole seed) are not used for feed, and the volume for seed is negligible in Japan. Post
forecasts rapeseed feed, seed and waste in MY 2015/16 and MY 2016/17 at 5,000 MT.
Trade:
Post forecasts soybean imports will increase five percent in MY 2015/16 and MY 2016/17 to 3.15 MMT
due to strong demand for crushing to produce soybean meal and stable demand for food soybeans.
Soybean imports in MY 2014/15 were 3.004 MMT, which exceeded 3 MMT for the first time in five
years due to improved crushing margins over rapeseed. The United States continued to dominate total
Japanese soybean imports, expanding its market share by nearly six percentage points to 71 percent.
Despite benefiting from the ability during the Northern Hemisphere’s off-season, high oil content and
less foreign materials, Brazilian soybean exports to Japan continue to face significant logistical
constraints (truck availability, roads, port capacity).
All imported rapeseed is used for crushing. Post forecasts rapeseed imports in MY 2015/16 and MY
2016/17 will decrease four percent, to 2.4 MMT, as strong soybean crushing (based on soybean meal
demand and better crushing margins) will replace some of the market share of oil and meal from
rapeseed.

Stocks:
The GOJ had a soybean stocks program for 36 years, but discontinued it in 2010. Now Japan has only
private stocks at crushing mills, distributors and feed millers. There is no on-farm stock, because
farmers sell their crop to the local JA (Japan Agriculture cooperative) or other distributors right after
harvesting. All domestic soybeans and imported non-GM soybeans are food soybeans for which there
are no official statistics. According to an industry source, an end month volume of food soybeans varies
depending on the season or market situation, but it is roughly 100,000 MT all year around.
There are no government-held stocks of rapeseed. Rapeseed stocks are held by crushing mills and the
silo companies located next to the mills.
Commodities:
Production:
Post forecasts soybean meal production will increase by 12 percent in MY 2015/16 from the previous
year, to 1.825 MMT, due to the competitive price of domestic meal versus Chinese meal and strong
demand for feed. In the first five months of MY 2015/16, feed manufacturers increased the ratio of
soybean meal in compound feed, as it has the highest protein content among the vegetable proteins and
is cost effective. In order to increase the production of soybean meal, oil manufacturers are increasing
the consumption of soybean oil by changing the ratio of blended products for food services and
processed food manufacturers. As this situation is expected to continue, Post forecasts MY 2016/17
production will remain at 1.825 MMT.
As for rapeseed meal production, Post forecasts the volume for MY 2015/16 and MY 2016/17 will be
two percent lower from the previous marketing year, at 1.34 MMT, due to a lower crushing margin
when compared to soybeans.
Fish meal is used to produce feed primarily for aquaculture and some livestock, and a small volume is
utilized for fertilizer. Ninety percent of fish meal produced in Japan is made from fish residue, and only
ten percent is produced from whole raw fish. The domestic fish processing industry has been shrinking
slowly. Fish meal production and consumption are anticipated to be relatively flat in MY 2015/16 and
MY 2016/17. Post forecasts fish meal production in MY 2015/16 and MY 2016/17 at 180,000 MT,
which is down two percent from last year. Palm kernel meal is all imported, and there is no production
in Japan.
Meal, Palm Kernel
Meal, Fish
Meal, Rapeseed
Meal, Soybean

Consumption: Feed, industrial and food consumption:
Consumption of soybean meal for feed is about 3 MMT every year. Domestic and imported soybean
meals are competing to gain market share.
Table 4 outlines Post’s forecast for Japanese livestock population in CY 2016. Post expects the
population of beef cattle and dairy cows to decrease, while swine are expected to recover from the
Porcine Epidemic Diarrhea (PEDv) virus that devastated the pork industry in 2014. The poultry
population is expected to remain unchanged.
Table 4. Japanese Livestock Population (1,000 heads)
CY Dairy Cows Beef
Cattle Swine Layers Broilers
2011 1,467 2,763 9,768 175,917 NA
2012 1,449 2,723 9,735 174,949 NA
2013 1,423 2,624 9,685 172,238 131,624
2014 1,395 2,567 9,537 172,349 135,747
2015 1,371 2,489 9,440* 176,500* 140,000*
2016 1,343* 2,440* 9,600* 176,500* 140,000*
2016/15 -2.0% -2.0% 1.7% 0% 0%
Source: MAFF Monthly Statistics of Agriculture (as of February each year), *: Post estimate
No survey for swine and poultry was conducted in 2015 due to the agricultural census.
Japanese compound feed products contain about 13 percent soybean meal, which is the second most
used ingredient in Japan after corn. Out of total soybean meal use for compound feed in Japan, 60
percent of soybean meal is used for poultry (layers and broilers), 20 percent is used for swine, 10 percent
for beef and 10 percent for dairy cows. Post anticipates that the increasing swine population and rising
use of soybean meal in compound feed will counterbalance the decline in soybean meal use by dairy
cows and beef cattle. As a result, Post forecasts feed consumption (including waste) of soybean meal
will increase by four percent from the previous year in MY 2015/16, to 3.075 MMT. Post expects this
trend will continue into MY 2016/17.
Japan utilizes soybean meal as a raw material in food products such as soy protein and soy sauce,
estimated at 300,000 MT annually.
Rapeseed meal is the second largest vegetable protein after soybean meal in compound feed products.
Its inclusion rate in compound feed has averaged between 4.2 and 5 percent for the past five years, with
a record high of 5.4 percent from July to September 2015 due mainly to its lower price compared to
soybean meal. Although rapeseed meal has been growing in use as an inexpensive vegetable protein, it
has less desirable features for feed production, including high tannin levels, coarse-grained texture
preventing smooth flow, and dark color compared to soybean meal. In particular, the high tannin
content lowers the metabolic energy of the meal and causes growth inhibition in livestock. As a result,
there is a limit to how much rapeseed meal can be used in compound feed. Out of total rapeseed meal
use for compound feed in Japan, 40 percent of rapeseed meal is used for poultry (layers and broilers), 30

percent for swine, 20 percent for beef cattle, and 10 percent for dairy cows. As the increase in
compound feed production for swine is expected to counterbalance the decline in dairy cows and beef
cattle, Post forecasts feed consumption of rapeseed meal (including waste) will increase two percent in
MY 2015/16, to 1.15 MMT. Following the recovery of the swine population from the PEDv outbreak,
MY 2016/17 rapeseed meal consumption is forecast to be stable at 1.15 MMT.
Fish meal is used primarily for feed for aquaculture, poultry and swine, with small amounts used for
fertilizer. Aquaculture accounts for about 60 percent of volume for feed. As mentioned above, the
domestic fish processing industry has been shrinking slowly. Fish meal consumption is anticipated to be
relatively flat in MY 2015/16 and MY 2016/17, at 345,000 MT.
Palm kernel meal is a common feed ingredient in other countries, such as New Zealand. Trade statistics
show that Japanese palm kernel meal imports have increased significantly in recent years. The
Harmonized schedule (HS) code 230660 includes both palm kernel meal and palm kernel shells that are
used for biomass fuel. Palm kernel meal has been imported for more than 30 years and has historically
been a minor ingredient in feed. The annual import volume of palm meal has consistently been
approximately 5,000 to 7,000 MT over the last five years. The substantial growth in imports under this
HS code is largely the result of palm kernel shells that are imported for use in co-generation biomass
facilities. The number of these facilities has been increasing significantly in the same number of years,
and palm kernel shells are a registered alternative to the forest thinnings that many of these facilities are
designed to utilize.
For information about other ingredients for feed, such as distillers dried grains (DDGs), please refer to
the Japan Grain and Feed Annual, JA-6004.
Trade:
Meal, Soybean
Soybean meal imports dropped 14 percent in MY 2014/15 from the previous year. Domestic soybean
meal had a competitive price advantage compared to imports due to favorable crushing margins. China
and the United States are the major exporters of soybean meal and accounted for 66 and 12 percent,
respectively, in MY 2014/15 (See Figure 2). The price of U. S. meal is more expensive than Chinese
conventional meal. The U. S. soybean meal is loaded on a large vessel such as handy max or panamax
vessel with corn, so the volume of one shipment from the United States is larger (minimum 4,000 to
8,000 MT) than that from China (minimum 2,000 to 3,000 MT). Therefore, Chinese soybean meal is
more affordable and flexible for shipment. Soybean meal from India is non-GE, and the majority of it is
used for food, such as soy protein and soy sauce.
China exports only two to three percent of its soybean meal production. These exports allow Chinese
companies to adjust their inventories. In the first five months of MY 2015/16, Japanese soybean meal
imports were down two percent compared to the same period of last year. Post forecasts soybean meal
imports in MY 2015/16 will decrease two percent to 1.625 MMT and will remain unchanged through
MY 2016/17, due to the competitiveness of domestic soybean meal over imports and limited export
pressure in China due to strong domestic consumption and a weak international soybean price.
Fig. 2 Import volume of soybean meal in Japan

Source: Trade Statistics of Japan
Meal, Rapeseed
Rapeseed meal trade is minimal, and primarily to adjust inventory and meet urgent needs.
Meal, Fish
Post forecasts fish meal imports in MY 2015/16 will decrease five percent from the previous year to
220,000 MT, due to rising global prices and shrinking demand as compound feed manufacturers switch
to other protein sources. Post anticipates this situation will stabilize at 220,000 MT in MY2016/17.
Commodities:
Oil, Palm
Oil, Rapeseed
Oil, Soybean
Production:
Japan’s production of soybean oil and rapeseed oil is protected by high import duties. Japan’s crushing
industry produces all soybean and rapeseed oil from imported materials. MY 2015/16 and 2016/17
soybean oil production is forecast at 475,000 MT, which is up 15 percent from MY 2014/15 based on
stable soybean meal demand from Japanese feed millers and low international prices of soybeans
supported by strong production in the United States, a good crop forecast in Brazil and low ocean freight
costs.
Rapeseed oil demand is steady but has limited expansion potential, since it already has a large market
share. With increasing soybean oil production, some portion of rapeseed oil has been replaced by
soybean oil as they are inter-changeable in some blended products. Post forecasts rapeseed oil
production will decrease four percent in MY 2015/16 and MY 2016/17 from the previous year to 1.03
MMT.
Consumption:
According to MAFF, soybean oil, rapeseed oil and palm oil are the major vegetable oils, accounting for
17, 44 and 23 percent of total domestic vegetable oil consumption (2.32 MMT) respectively in CY 2014.
The remaining 16 percent of domestic vegetable oil consumption include the following: corn oil, rice
oil, olive oil, palm kernel oil, sesame oil and coconut oil.
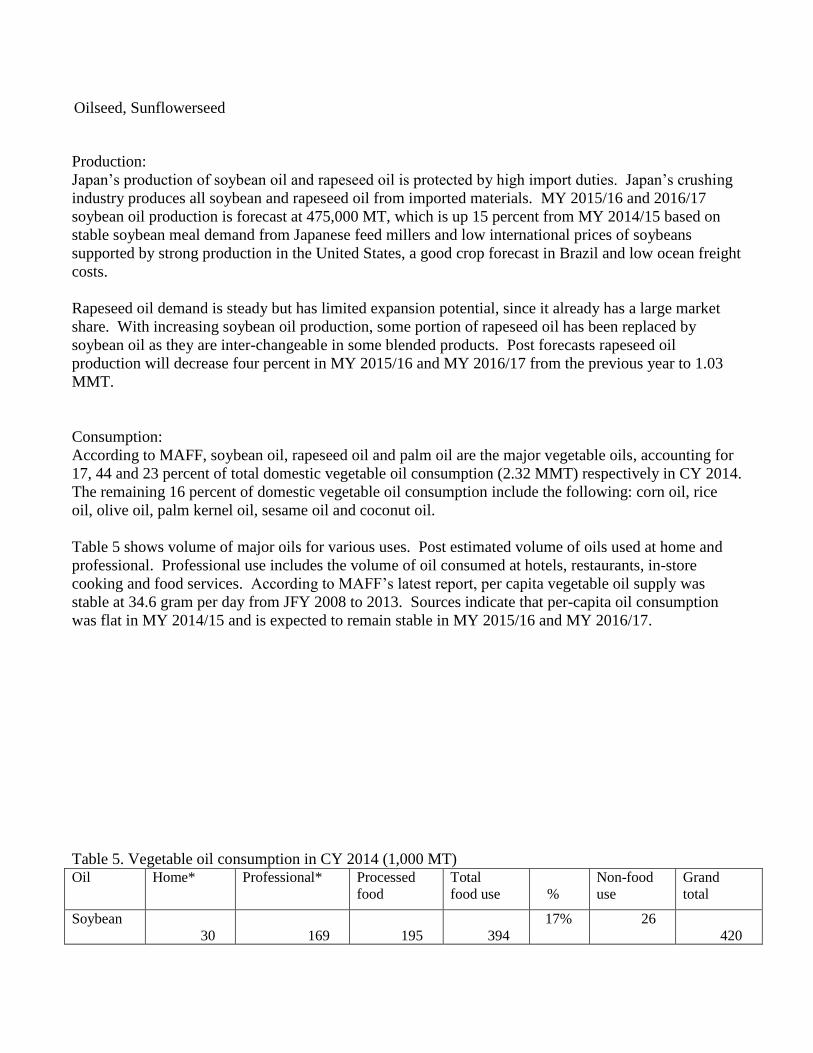
Table 5 shows volume of major oils for various uses. Post estimated volume of oils used at home and
professional. Professional use includes the volume of oil consumed at hotels, restaurants, in-store
cooking and food services. According to MAFF’s latest report, per capita vegetable oil supply was
stable at 34.6 gram per day from JFY 2008 to 2013. Sources indicate that per-capita oil consumption
was flat in MY 2014/15 and is expected to remain stable in MY 2015/16 and MY 2016/17.
Table 5. Vegetable oil consumption in CY 2014 (1,000 MT) Oil Home* Professional* Processed
food
Total
food use
%
Non-food
use
Grand
total
Soybean
30
169
195
394
17% 26
420
Oilseed, Sunflowerseed
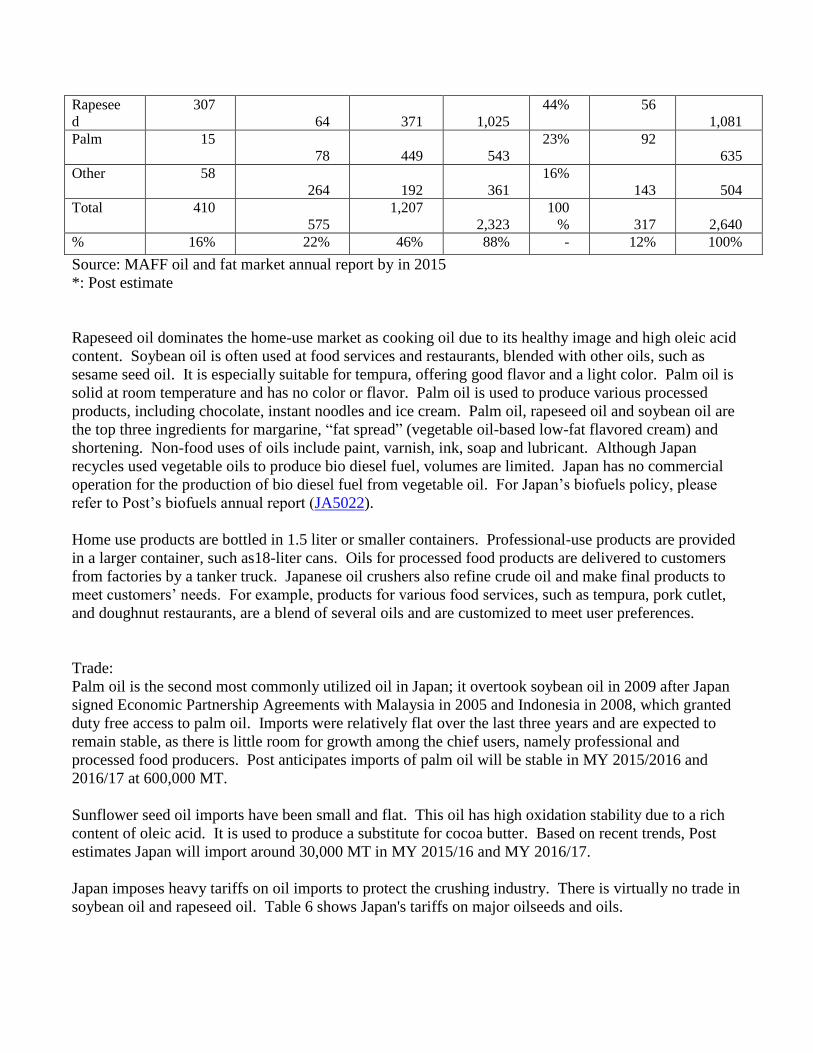
Rapesee
d
307
64
371
1,025
44% 56
1,081
Palm 15
78
449
543
23% 92
635
Other 58
264
192
361
16%
143
504
Total 410
575
1,207
2,323
100
%
317
2,640
% 16% 22% 46% 88% - 12% 100%
Source: MAFF oil and fat market annual report by in 2015
*: Post estimate
Rapeseed oil dominates the home-use market as cooking oil due to its healthy image and high oleic acid
content. Soybean oil is often used at food services and restaurants, blended with other oils, such as
sesame seed oil. It is especially suitable for tempura, offering good flavor and a light color. Palm oil is
solid at room temperature and has no color or flavor. Palm oil is used to produce various processed
products, including chocolate, instant noodles and ice cream. Palm oil, rapeseed oil and soybean oil are
the top three ingredients for margarine, “fat spread” (vegetable oil-based low-fat flavored cream) and
shortening. Non-food uses of oils include paint, varnish, ink, soap and lubricant. Although Japan
recycles used vegetable oils to produce bio diesel fuel, volumes are limited. Japan has no commercial
operation for the production of bio diesel fuel from vegetable oil. For Japan’s biofuels policy, please
refer to Post’s biofuels annual report (JA5022).
Home use products are bottled in 1.5 liter or smaller containers. Professional-use products are provided
in a larger container, such as18-liter cans. Oils for processed food products are delivered to customers
from factories by a tanker truck. Japanese oil crushers also refine crude oil and make final products to
meet customers’ needs. For example, products for various food services, such as tempura, pork cutlet,
and doughnut restaurants, are a blend of several oils and are customized to meet user preferences.
Trade:
Palm oil is the second most commonly utilized oil in Japan; it overtook soybean oil in 2009 after Japan
signed Economic Partnership Agreements with Malaysia in 2005 and Indonesia in 2008, which granted
duty free access to palm oil. Imports were relatively flat over the last three years and are expected to
remain stable, as there is little room for growth among the chief users, namely professional and
processed food producers. Post anticipates imports of palm oil will be stable in MY 2015/2016 and
2016/17 at 600,000 MT.
Sunflower seed oil imports have been small and flat. This oil has high oxidation stability due to a rich
content of oleic acid. It is used to produce a substitute for cocoa butter. Based on recent trends, Post
estimates Japan will import around 30,000 MT in MY 2015/16 and MY 2016/17.
Japan imposes heavy tariffs on oil imports to protect the crushing industry. There is virtually no trade in
soybean oil and rapeseed oil. Table 6 shows Japan's tariffs on major oilseeds and oils.

Table 6. Japan's tariff on major oilseeds and oils (as of January 2016
HS Code Commodity Duty
1201.10,.90 Soybeans Free
1205.10,.90 Rapeseed Free
1507.10-100 Soybean oil, crude, of an acid value exceeding 0.6 10.9 yen/kg
1507.10-200 Soybean oil, crude, other 13.2 yen/kg
1507.90-000 Soybean oil, other 13.2 yen/kg
1508.10-100 Peanut oil, crude, of an acid value exceeding 0.6 8.5 yen/kg
1509 & 1510 Olive oil Free
1511.10-000 Palm oil, crude, EPA preferential rate for Malaysia and Indonesia Free
1511.90-010 Palm stearin, EPA preferential rate for Malaysia and Indonesia Free
1511.90-090 Palm oil, other, EPA preferential rate for Malaysia and Indonesia Free
1512.11-110 Sunflower-seed oil, crude, of an acid value exceeding 0.6 8.5 yen/kg
1512.11-210 Safflower oil, crude, of an acid value exceeding 0.6 8.5 yen/kg
1512.11-120 Sunflower-seed oil, crude, other 10.4 yen/kg
1512.11-220 Safflower-seed oil, crude, other 10.4 yen/kg
1512.19-010 Sunflower-seed oil and its fractions 10.4 yen/kg
1514.11-100 Low erucic acid rapeseed oil, crude, of an acid value exceeding 0.6 10.9 yen/kg
1514.11-200 Low erucic acid rapeseed oil, crude, other 13.2 yen/kg
1514.19-000 Low erucic acid rapeseed oil, other 13.2 yen/kg
1514.91-100 Rapeseed oil, other, crude, of an acid value exceeding 0.6 10.9 yen/kg
1514.99-000 Rapeseed oil, other 13.2 yen/kg
1514.91-200 Rapeseed oil, other, crude, other 13.2 yen/kg
2301.20 Fish meal Free
2304.00 Soybean meal Free
2306.41,.49 Rapeseed meal Free
2306.60 Oil-cake and other solid residues of palm nuts or kernels Free
Source: Japan Tariff Association
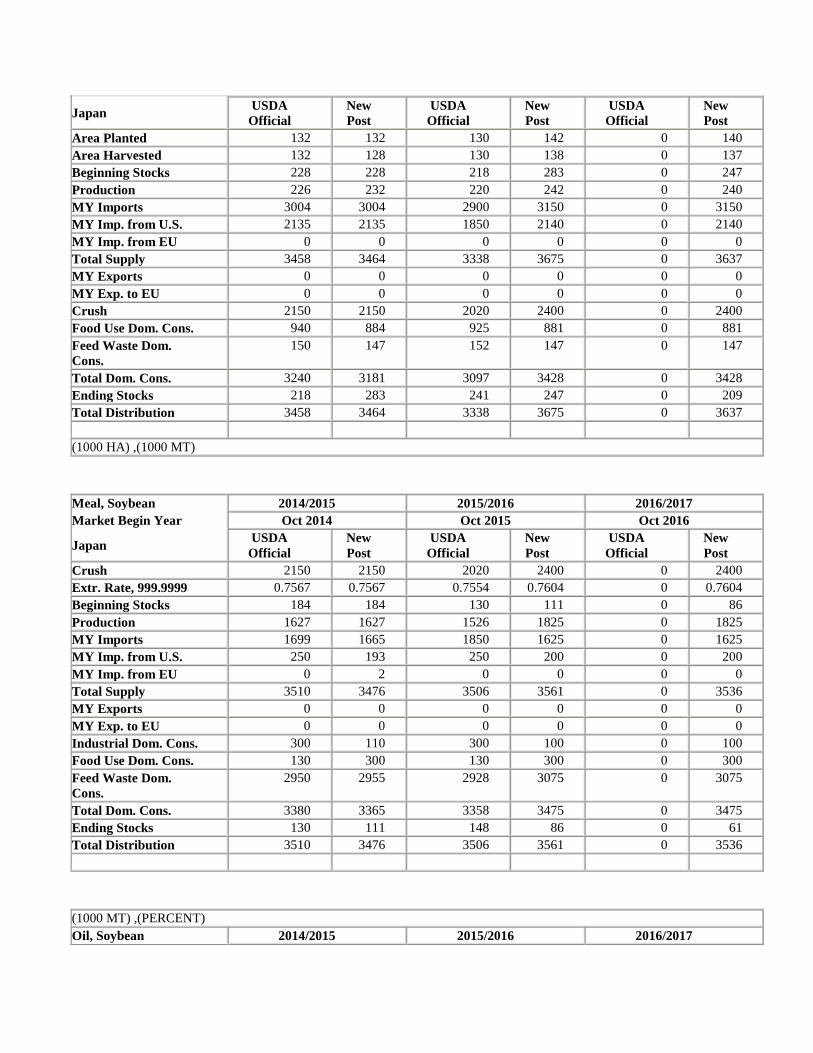
PSD Tables
Oilseed, Soybean 2014/2015 2015/2016 2016/2017
Market Begin Year Oct 2014 Oct 2015 Oct 2016
Japan USDA
Official
New
Post
USDA
Official
New
Post
USDA
Official
New
Post
Area Planted 132 132 130 142 0 140
Area Harvested 132 128 130 138 0 137
Beginning Stocks 228 228 218 283 0 247
Production 226 232 220 242 0 240
MY Imports 3004 3004 2900 3150 0 3150
MY Imp. from U.S. 2135 2135 1850 2140 0 2140
MY Imp. from EU 0 0 0 0 0 0
Total Supply 3458 3464 3338 3675 0 3637
MY Exports 0 0 0 0 0 0
MY Exp. to EU 0 0 0 0 0 0
Crush 2150 2150 2020 2400 0 2400
Food Use Dom. Cons. 940 884 925 881 0 881
Feed Waste Dom.
Cons.
150 147 152 147 0 147
Total Dom. Cons. 3240 3181 3097 3428 0 3428
Ending Stocks 218 283 241 247 0 209
Total Distribution 3458 3464 3338 3675 0 3637
(1000 HA) ,(1000 MT)
Meal, Soybean 2014/2015 2015/2016 2016/2017
Market Begin Year Oct 2014 Oct 2015 Oct 2016
Japan USDA
Official
New
Post
USDA
Official
New
Post
USDA
Official
New
Post
Crush 2150 2150 2020 2400 0 2400
Extr. Rate, 999.9999 0.7567 0.7567 0.7554 0.7604 0 0.7604
Beginning Stocks 184 184 130 111 0 86
Production 1627 1627 1526 1825 0 1825
MY Imports 1699 1665 1850 1625 0 1625
MY Imp. from U.S. 250 193 250 200 0 200
MY Imp. from EU 0 2 0 0 0 0
Total Supply 3510 3476 3506 3561 0 3536
MY Exports 0 0 0 0 0 0
MY Exp. to EU 0 0 0 0 0 0
Industrial Dom. Cons. 300 110 300 100 0 100
Food Use Dom. Cons. 130 300 130 300 0 300
Feed Waste Dom.
Cons.
2950 2955 2928 3075 0 3075
Total Dom. Cons. 3380 3365 3358 3475 0 3475
Ending Stocks 130 111 148 86 0 61
Total Distribution 3510 3476 3506 3561 0 3536
(1000 MT) ,(PERCENT)
Oil, Soybean 2014/2015 2015/2016 2016/2017

Market Begin Year Oct 2014 Oct 2015 Oct 2016
Japan USDA
Official
New
Post
USDA
Official
New
Post
USDA
Official
New
Post
Crush 2150 2150 2020 2400 0 2400
Extr. Rate, 999.9999 0.1953 0.1926 0.195 0.1979 0 0.1979
Beginning Stocks 25 25 33 14 0 15
Production 420 414 394 475 0 475
MY Imports 6 6 15 5 0 5
MY Imp. from U.S. 1 2 1 2 0 2
MY Imp. from EU 0 0 0 0 0 0
Total Supply 451 445 442 494 0 495
MY Exports 3 3 0 0 0 0
MY Exp. to EU 0 0 0 0 0 0
Industrial Dom. Cons. 35 26 35 27 0 28
Food Use Dom. Cons. 380 400 385 450 0 450
Feed Waste Dom.
Cons.
0 2 0 2 0 2
Total Dom. Cons. 415 428 420 479 0 480
Ending Stocks 33 14 22 15 0 15
Total Distribution 451 445 442 494 0 495
(1000 MT) ,(PERCENT)
Oilseed, Rapeseed 2014/2015 2015/2016 2016/2017
Market Begin Year Oct 2014 Oct 2015 Oct 2016
Japan USDA
Official
New
Post
USDA
Official
New
Post
USDA
Official
New
Post
Area Planted 0 2 0 2 0 2
Area Harvested 2 2 2 2 0 2
Beginning Stocks 84 84 99 111 0 159
Production 2 3 2 3 0 3
MY Imports 2489 2489 2450 2450 0 2450
MY Imp. from U.S. 0 0 0 0 0 0
MY Imp. from EU 0 0 0 0 0 0
Total Supply 2575 2576 2551 2564 0 2612
MY Exports 0 0 0 0 0 0
MY Exp. to EU 0 0 0 0 0 0
Crush 2471 2460 2450 2400 0 2400
Food Use Dom. Cons. 0 0 0 0 0 0
Feed Waste Dom.
Cons.
5 5 5 5 0 5
Total Dom. Cons. 2476 2465 2455 2405 0 2405
Ending Stocks 99 111 96 159 0 207
Total Distribution 2575 2576 2551 2564 0 2612
(1000 HA) ,(1000 MT)

Meal, Rapeseed 2014/2015 2015/2016 2016/2017
Market Begin Year Oct 2014 Oct 2015 Oct 2016
Japan USDA
Official
New
Post
USDA
Official
New
Post
USDA
Official
New
Post
Crush 2471 2460 2450 2400 0 2400
Extr. Rate, 999.9999 0.5633 0.5585 0.5551 0.5542 0 0.5542
Beginning Stocks 15 15 26 27 0 32
Production 1392 1374 1360 1330 0 1330
MY Imports 11 11 60 40 0 30
MY Imp. from U.S. 0 0 0 0 0 0
MY Imp. from EU 0 0 0 0 0 0
Total Supply 1418 1400 1446 1397 0 1392
MY Exports 53 53 0 25 0 25
MY Exp. to EU 0 0 0 0 0 0
Industrial Dom. Cons. 260 190 250 190 0 190
Food Use Dom. Cons. 0 0 0 0 0 0
Feed Waste Dom.
Cons.
1079 1130 1170 1150 0 1150
Total Dom. Cons. 1339 1320 1420 1340 0 1340
Ending Stocks 26 27 26 32 0 27
Total Distribution 1418 1400 1446 1397 0 1392
(1000 MT) ,(PERCENT)
Oil, Rapeseed 2014/2015 2015/2016 2016/2017
Market Begin Year Oct 2014 Oct 2015 Oct 2016
Japan USDA
Official
New
Post
USDA
Official
New
Post
USDA
Official
New
Post
Crush 2471 2460 2450 2400 0 2400
Extr. Rate, 999.9999 0.4346 0.4366 0.4388 0.4292 0 0.4292
Beginning Stocks 125 125 160 114 0 72
Production 1074 1074 1075 1030 0 1030
MY Imports 20 20 12 20 0 20
MY Imp. from U.S. 0 1 0 1 0 0
MY Imp. from EU 0 1 0 1 0 0
Total Supply 1219 1219 1247 1164 0 1122
MY Exports 1 1 1 1 0 1
MY Exp. to EU 0 0 0 0 0 0
Industrial Dom. Cons. 60 58 60 60 0 60
Food Use Dom. Cons. 998 1040 1050 1025 0 1025
Feed Waste Dom.
Cons.
0 6 0 6 0 6
Total Dom. Cons. 1058 1104 1110 1091 0 1091
Ending Stocks 160 114 136 72 0 30
Total Distribution 1219 1219 1247 1164 0 1122
(1000 MT) ,(PERCENT)
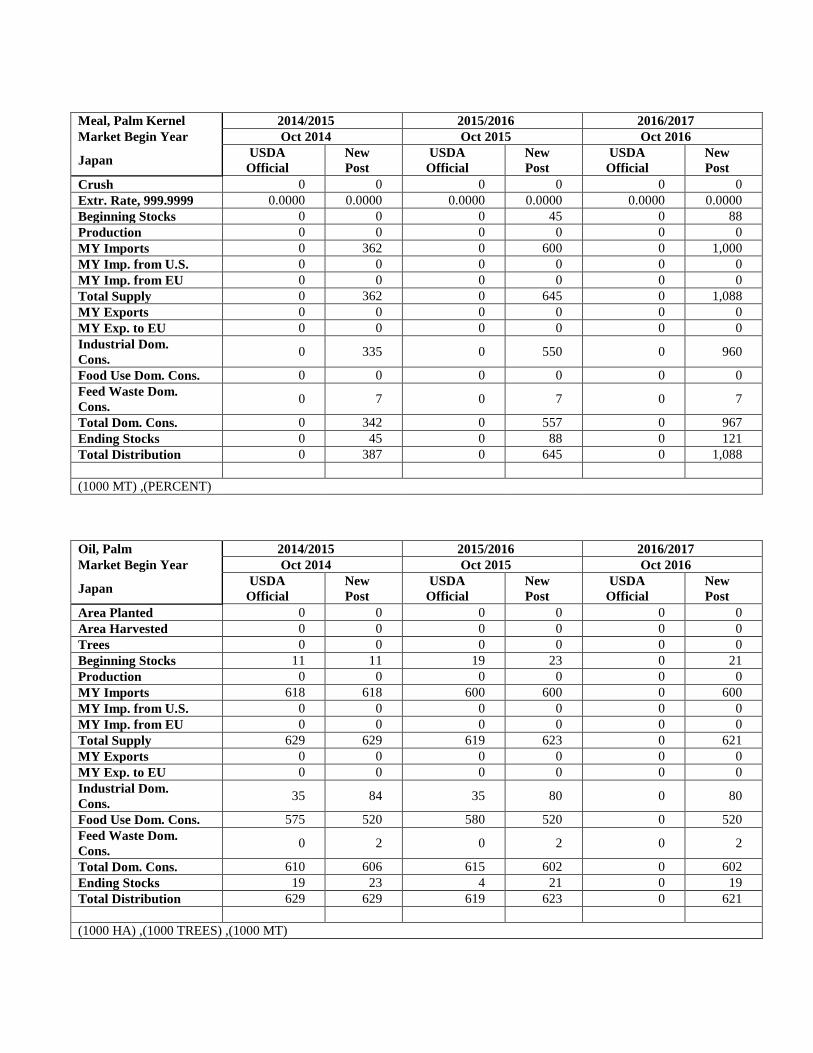
Meal, Palm Kernel 2014/2015 2015/2016 2016/2017
Market Begin Year Oct 2014 Oct 2015 Oct 2016
Japan USDA
Official
New
Post
USDA
Official
New
Post
USDA
Official
New
Post
Crush 0 0 0 0 0 0
Extr. Rate, 999.9999 0.0000 0.0000 0.0000 0.0000 0.0000 0.0000
Beginning Stocks 0 0 0 45 0 88
Production 0 0 0 0 0 0
MY Imports 0 362 0 600 0 1,000
MY Imp. from U.S. 0 0 0 0 0 0
MY Imp. from EU 0 0 0 0 0 0
Total Supply 0 362 0 645 0 1,088
MY Exports 0 0 0 0 0 0
MY Exp. to EU 0 0 0 0 0 0
Industrial Dom.
Cons. 0 335 0 550 0 960
Food Use Dom. Cons. 0 0 0 0 0 0
Feed Waste Dom.
Cons. 0 7 0 7 0 7
Total Dom. Cons. 0 342 0 557 0 967
Ending Stocks 0 45 0 88 0 121
Total Distribution 0 387 0 645 0 1,088
(1000 MT) ,(PERCENT)
Oil, Palm 2014/2015 2015/2016 2016/2017
Market Begin Year Oct 2014 Oct 2015 Oct 2016
Japan USDA
Official
New
Post
USDA
Official
New
Post
USDA
Official
New
Post
Area Planted 0 0 0 0 0 0
Area Harvested 0 0 0 0 0 0
Trees 0 0 0 0 0 0
Beginning Stocks 11 11 19 23 0 21
Production 0 0 0 0 0 0
MY Imports 618 618 600 600 0 600
MY Imp. from U.S. 0 0 0 0 0 0
MY Imp. from EU 0 0 0 0 0 0
Total Supply 629 629 619 623 0 621
MY Exports 0 0 0 0 0 0
MY Exp. to EU 0 0 0 0 0 0
Industrial Dom.
Cons. 35 84 35 80 0 80
Food Use Dom. Cons. 575 520 580 520 0 520
Feed Waste Dom.
Cons. 0 2 0 2 0 2
Total Dom. Cons. 610 606 615 602 0 602
Ending Stocks 19 23 4 21 0 19
Total Distribution 629 629 619 623 0 621
(1000 HA) ,(1000 TREES) ,(1000 MT)
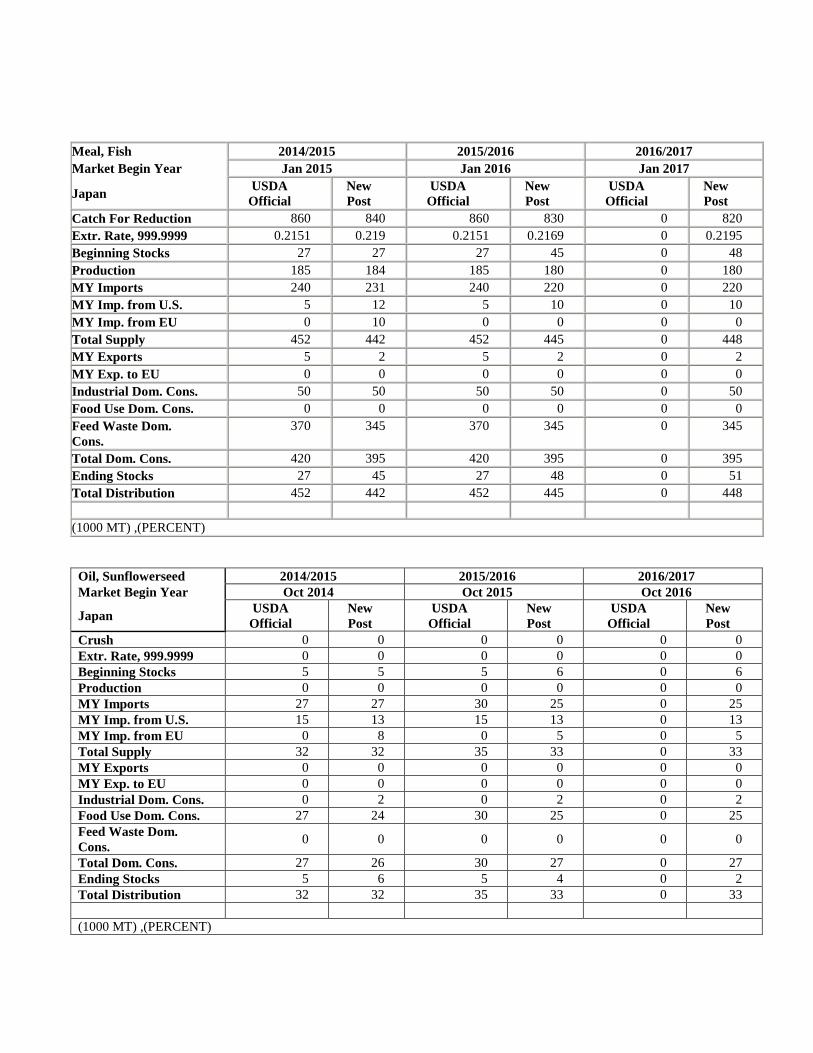
Meal, Fish 2014/2015 2015/2016 2016/2017
Market Begin Year Jan 2015 Jan 2016 Jan 2017
Japan USDA
Official
New
Post
USDA
Official
New
Post
USDA
Official
New
Post
Catch For Reduction 860 840 860 830 0 820
Extr. Rate, 999.9999 0.2151 0.219 0.2151 0.2169 0 0.2195
Beginning Stocks 27 27 27 45 0 48
Production 185 184 185 180 0 180
MY Imports 240 231 240 220 0 220
MY Imp. from U.S. 5 12 5 10 0 10
MY Imp. from EU 0 10 0 0 0 0
Total Supply 452 442 452 445 0 448
MY Exports 5 2 5 2 0 2
MY Exp. to EU 0 0 0 0 0 0
Industrial Dom. Cons. 50 50 50 50 0 50
Food Use Dom. Cons. 0 0 0 0 0 0
Feed Waste Dom.
Cons.
370 345 370 345 0 345
Total Dom. Cons. 420 395 420 395 0 395
Ending Stocks 27 45 27 48 0 51
Total Distribution 452 442 452 445 0 448
(1000 MT) ,(PERCENT)
Oil, Sunflowerseed 2014/2015 2015/2016 2016/2017
Market Begin Year Oct 2014 Oct 2015 Oct 2016
Japan USDA
Official
New
Post
USDA
Official
New
Post
USDA
Official
New
Post
Crush 0 0 0 0 0 0
Extr. Rate, 999.9999 0 0 0 0 0 0
Beginning Stocks 5 5 5 6 0 6
Production 0 0 0 0 0 0
MY Imports 27 27 30 25 0 25
MY Imp. from U.S. 15 13 15 13 0 13
MY Imp. from EU 0 8 0 5 0 5
Total Supply 32 32 35 33 0 33
MY Exports 0 0 0 0 0 0
MY Exp. to EU 0 0 0 0 0 0
Industrial Dom. Cons. 0 2 0 2 0 2
Food Use Dom. Cons. 27 24 30 25 0 25
Feed Waste Dom.
Cons. 0 0 0 0 0 0
Total Dom. Cons. 27 26 30 27 0 27
Ending Stocks 5 6 5 4 0 2
Total Distribution 32 32 35 33 0 33
(1000 MT) ,(PERCENT)

Related Documents