January 1, 2002/ARR 1 1. “Overlap” Design Regions for IFE Dry Wall 2. Scoping Analysis of Condensation for Wetted Wall A. R. Raffray, D. Blair, J. Pulsifer, M. S. Tillack, X. Wang University of California, San Diego ARIES-IFE Meeting UCSD January 10-11, 2002

January 1, 2002/ARR 1 1. “Overlap” Design Regions for IFE Dry Wall 2. Scoping Analysis of Condensation for Wetted Wall A. R. Raffray, D. Blair, J. Pulsifer,
Dec 21, 2015
Welcome message from author
This document is posted to help you gain knowledge. Please leave a comment to let me know what you think about it! Share it to your friends and learn new things together.
Transcript
January 1, 2002/ARR1
1. “Overlap” Design Regions for IFE Dry Wall 2. Scoping Analysis of Condensation for Wetted Wall
A. R. Raffray, D. Blair, J. Pulsifer, M. S. Tillack, X. Wang
University of California, San Diego
ARIES-IFE Meeting
UCSD
January 10-11, 2002
January 1, 2002/ARR2
Overlap Design Regions for IFE Dry Wall
Simple self consistent calculation• Driver/target parameters• Chamber geometry and chamber wall design • Power to chamber wall• Coolant outlet temperature• Cycle efficiency• Thermal-hydraulic parameters• Maximum temperature of chamber wall
- Chamber wall power assumed to be spread over the complete period between successive shots (optimistic assumption)
• Run a few example cases with the goal of maintaining SiCf/SiC Tmax at the wall < 1000°C
- Results will show acceptable combination of parameters (design window)
January 1, 2002/ARR3
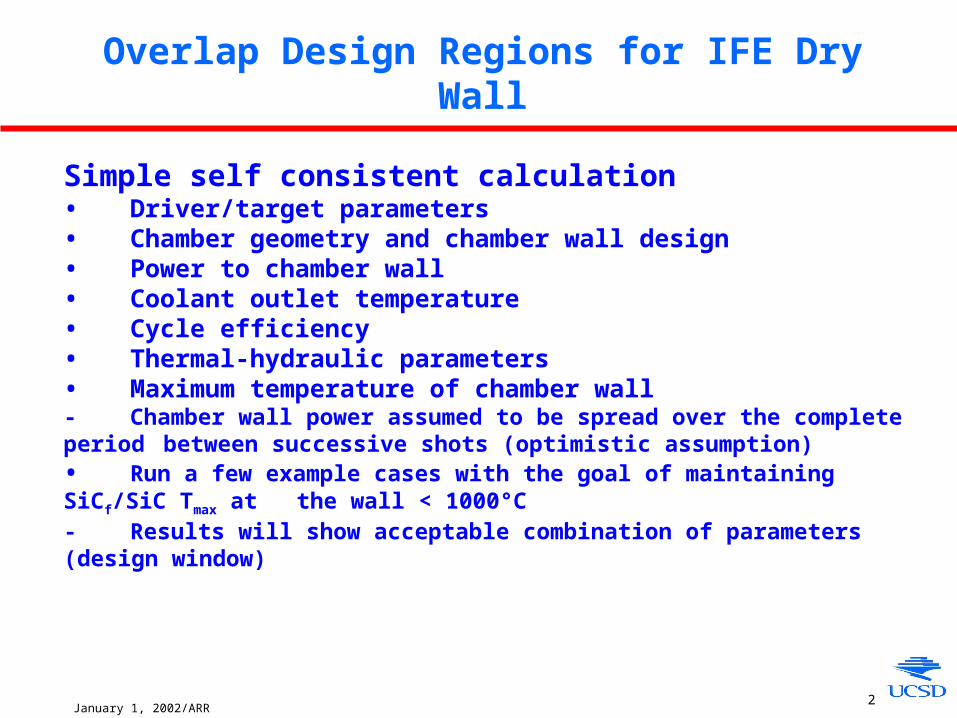
Simple Estimate of Maximum W and SiCf/SiC Temperature Under IFE Energy Deposition for 2 Direct-Drive and 2 Indirect-
Drive Driver/Target Cases
Chamber Wall Coolant Inlet
EnergyFront
Assume Channel L = R
4-mm SiCf/SiCWall
Chamber Wall Coolant Outlet
5-mm Cooling Channel
Max. SiCf/SiCTemp.
1-mm W Armor
Direct Drive LY:Driver Energy = 1.2 MJGain = 128Yield = 153.6 MJDriver Efficiency = 0.07
Indirect Drive 1:Driver Energy = 3.3 MJGain = 139Yield = 458.7 MJDriver Efficiency = 0.25
Direct Drive HY:Driver Energy = 2.9 MJGain = 138Yield = 400 MJDriver Efficiency = 0.07
Indirect Drive 2:Driver Energy = 6 MJGain = 63Yield = 378 MJDriver Efficiency = 0.47
• Maximum temperature estimate based on heat deposition
averaged over time between shots
January 1, 2002/ARR4
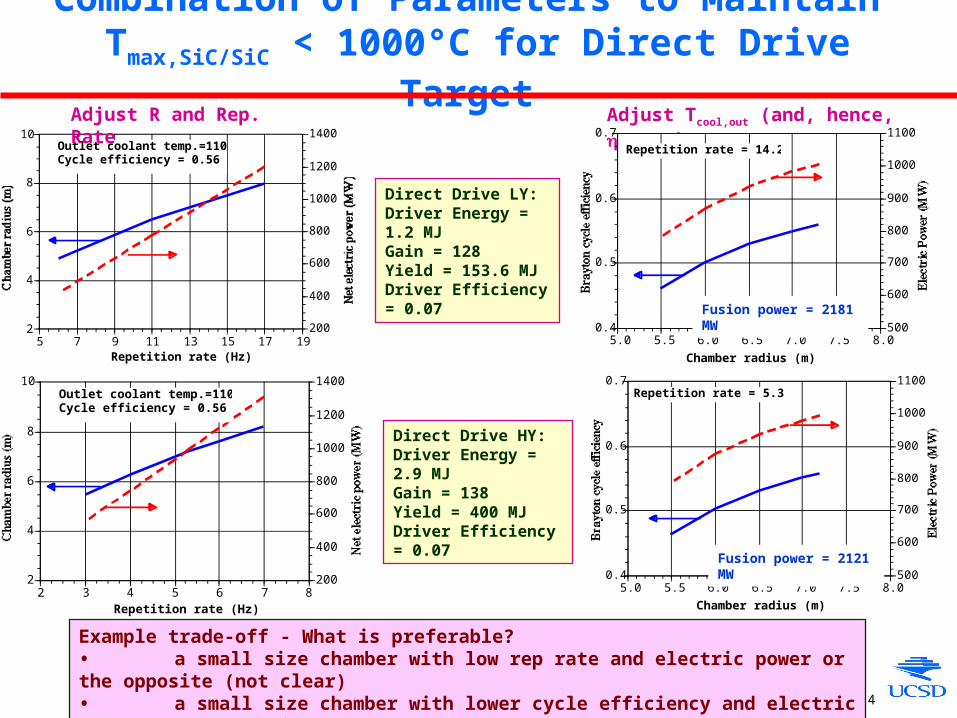
Combination of Parameters to Maintain Tmax,SiC/SiC < 1000°C for Direct Drive Target
2
4
6
8
10
200
400
600
800
1000
1200
1400
5 7 9 11 13 15 17 19Repetition rate (Hz)
Outlet coolant temp.=1100°CCycle efficiency = 0.56
Adjust R and Rep. Rate
Direct Drive LY:Driver Energy = 1.2 MJGain = 128Yield = 153.6 MJDriver Efficiency = 0.07
Example trade-off - What is preferable?• a small size chamber with low rep rate and electric power or the opposite (not clear)• a small size chamber with lower cycle efficiency and electric power or the opposite
0.4
0.5
0.6
0.7
500
600
700
800
900
1000
1100
5.0 5.5 6.0 6.5 7.0 7.5 8.0
Chamber radius (m)
Repetition rate = 5.3 Hz
2
4
6
8
10
200
400
600
800
1000
1200
1400
2 3 4 5 6 7 8Repetition rate (Hz)
Outlet coolant temp.=1100°CCycle efficiency = 0.56
Direct Drive HY:Driver Energy = 2.9 MJGain = 138Yield = 400 MJDriver Efficiency = 0.07
Adjust Tcool,out (and, hence, c) and R
Fusion power = 2121 MW
0.4
0.5
0.6
0.7
500
600
700
800
900
1000
1100
5.0 5.5 6.0 6.5 7.0 7.5 8.0
Chamber radius (m)
Repetition rate = 14.2 Hz
Fusion power = 2181 MW
January 1, 2002/ARR5
2
4
6
8
10
200
400
600
800
1000
1200
1400
0 1 2 3 4 5 6Repetition rate (Hz)
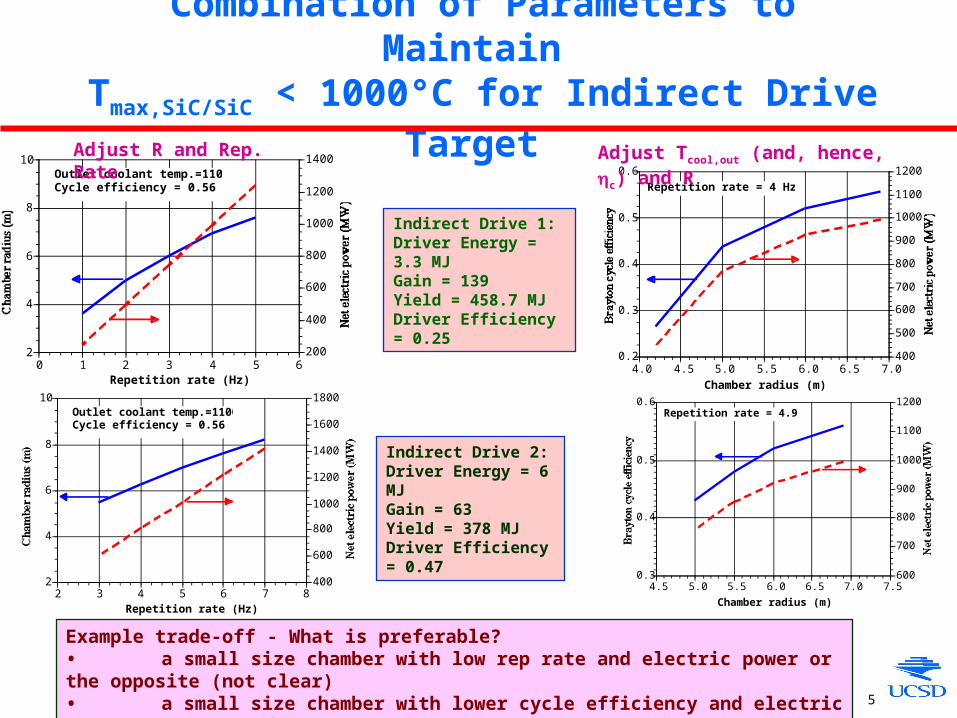
Outlet coolant temp.=1100°CCycle efficiency = 0.56
Combination of Parameters to Maintain Tmax,SiC/SiC < 1000°C for Indirect Drive Target
0.2
0.3
0.4
0.5
0.6
400
500
600
700
800
900
1000
1100
1200
4.0 4.5 5.0 5.5 6.0 6.5 7.0Chamber radius (m)
Repetition rate = 4 Hz
Adjust R and Rep. Rate Adjust Tcool,out (and, hence, c) and R
Indirect Drive 2:Driver Energy = 6 MJGain = 63Yield = 378 MJDriver Efficiency = 0.47
Indirect Drive 1:Driver Energy = 3.3 MJGain = 139Yield = 458.7 MJDriver Efficiency = 0.25
0.3
0.4
0.5
0.6
600
700
800
900
1000
1100
1200
4.5 5.0 5.5 6.0 6.5 7.0 7.5
Chamber radius (m)
Repetition rate = 4.9 Hz
2
4
6
8
10
400
600
800
1000
1200
1400
1600
1800
2 3 4 5 6 7 8Repetition rate (Hz)
Outlet coolant temp.=1100°CCycle efficiency = 0.56
Example trade-off - What is preferable?• a small size chamber with low rep rate and electric power or the opposite (not clear)• a small size chamber with lower cycle efficiency and electric power or the opposite
January 1, 2002/ARR6
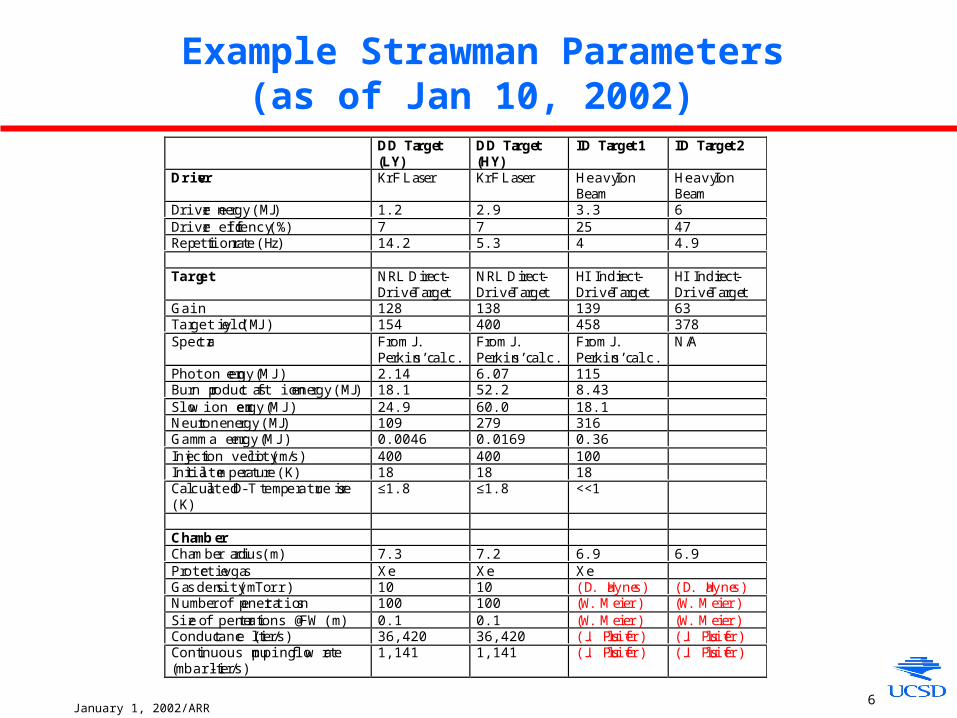
Example Strawman Parameters(as of Jan 10, 2002)
DD Target(LY)
DD Target(HY)
ID Target 1 ID Target 2
Driver KrF Laser KrF Laser Heavy IonBeam
Heavy IonBeam
Driver energy (MJ) 1.2 2.9 3.3 6Driver efficiency (%) 7 7 25 47Repetition rate (Hz) 14.2 5.3 4 4.9
Target NRL Direct-Drive Target
NRL Direct-Drive Target
HI Indirect-Drive Target
HI Indirect-Drive Target
Gain 128 138 139 63Target yield (MJ) 154 400 458 378Spectra From J.
Perkins’ calc.From J.Perkins’ calc.
From J.Perkins’ calc.
N/A
Photon energy (MJ) 2.14 6.07 115Burn product fast ion energy (MJ) 18.1 52.2 8.43Slow ion energy (MJ) 24.9 60.0 18.1Neutron energy (MJ) 109 279 316Gamma energy (MJ) 0.0046 0.0169 0.36Injection velocity (m/s) 400 400 100Initial temperature (K) 18 18 18Calculated D-T temperature rise(K)
≤1.8 ≤1.8 <<1
ChamberChamber radius (m) 7.3 7.2 6.9 6.9Protective gas Xe Xe XeGas density (mTorr) 10 10 (D. Haynes) (D. Haynes)Number of penetrations 100 100 (W. Meier) (W. Meier)Size of penetrations @ FW (m) 0.1 0.1 (W. Meier) (W. Meier)Conductance (liter/s) 36,420 36,420 (J. Pulsifer) (J. Pulsifer)Continuous pumping flow rate(mbar-liter/s)
1,141 1,141 (J. Pulsifer) (J. Pulsifer)
January 1, 2002/ARR7
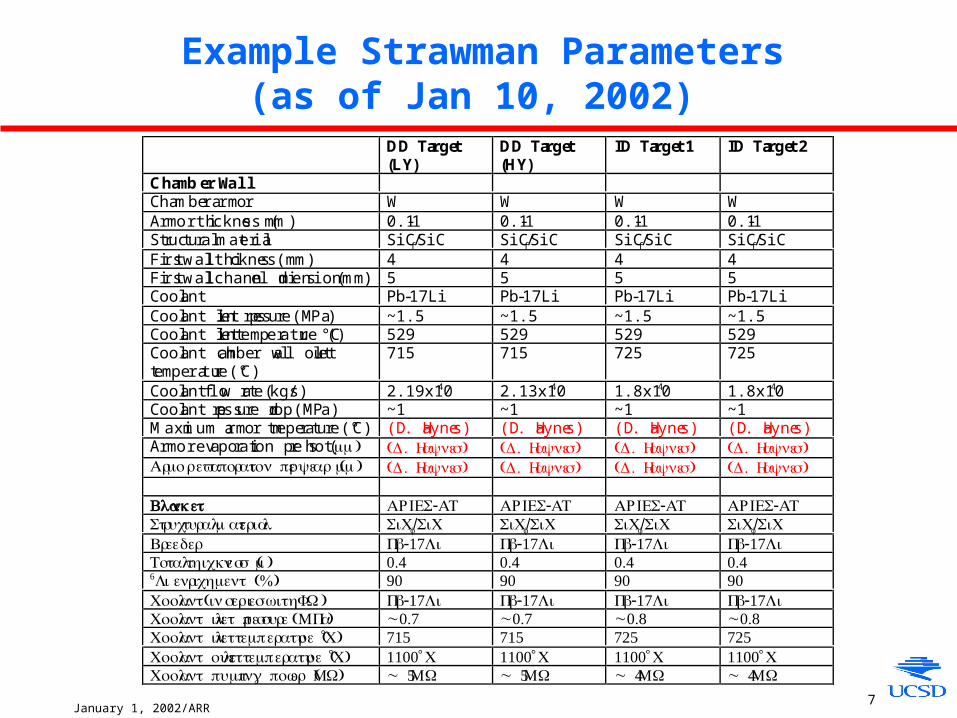
Example Strawman Parameters(as of Jan 10, 2002)
DD Target(LY)
DD Target(HY)
ID Target 1 ID Target 2
Chamber WallChamber armor W W W WArmor thickness (mm) 0.1-1 0.1-1 0.1-1 0.1-1Structural material SiCf/SiC SiCf/SiC SiCf/SiC SiCf/SiCFirst wall thickness (mm) 4 4 4 4First wall channel dimension (mm) 5 5 5 5Coolant Pb-17Li Pb-17Li Pb-17Li Pb-17LiCoolant inlet pressure (MPa) ~1.5 ~1.5 ~1.5 ~1.5Coolant inlet temperature (°C) 529 529 529 529Coolant chamber wall outlettemperature (°C)
715 715 725 725
Coolant flow rate (kg/s) 2.19x10⁴ 2.13x10⁴ 1.8x10⁴ 1.8x10⁴
Coolant pressure drop (MPa) ~1 ~1 ~1 ~1Maximum armor temperature (°C) (D. Haynes) (D. Haynes) (D. Haynes) (D. Haynes)Armor evaporation per shot (μm) (D. Hayne)s (D. Hayne)s (D. Hayne)s (D. Hayne)sArmo r evaporati on pe r ye (ar μm) (D. Hayne)s (D. Hayne)s (D. Hayne)s (D. Hayne)s
Blanket ARIE -S AT ARIE -S AT ARIE -S AT ARIE -S ATStructur almaterial SiCf/SiC SiCf/SiC SiCf/SiC SiCf/SiCBreeder Pb-17Li Pb-17Li Pb-17Li Pb-17LiTot althicknes (s m) 0.4 0.4 0.4 0.46L i enrichmen (%)t 90 90 90 90Coola nt( inserie swi thFW) Pb-17Li Pb-17Li Pb-17Li Pb-17LiCoola nt inl et pressur e(MPa) ~0.7 ~0.7 ~0.8 ~0.8Coola nt inl ettemperatu (re °C) 715 715 725 725Coola nt outl ettemperatu (re °C) 1100°C 1100°C 1100°C 1100°CCoola nt pumpi ng pow (er M )W ~ 5 MW ~ 5 MW ~ 4 MW ~ 4 MW
January 1, 2002/ARR8
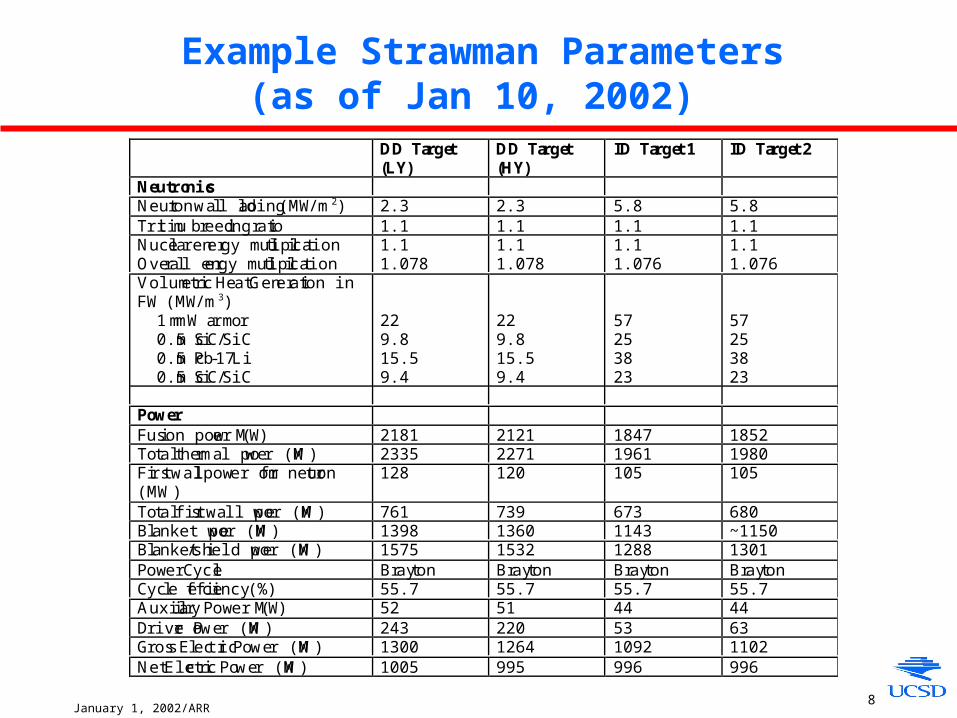
Example Strawman Parameters(as of Jan 10, 2002)
DD Target(LY)
DD Target(HY)
ID Target 1 ID Target 2
NeutronicsNeutron wall loading (MW/m2) 2.3 2.3 5.8 5.8Tritium breeding ratio 1.1 1.1 1.1 1.1Nuclear energy multiplicationOverall energy multiplication
1.11.078
1.11.078
1.11.076
1.11.076
Volumetric Heat Generation inFW (MW/m3) 1 mm W armor 0.5 cm SiC/SiC 0.5 cm Pb-17Li 0.5 cm SiC/SiC
229.815.59.4
229.815.59.4
57253823
57253823
PowerFusion power (MW) 2181 2121 1847 1852Total thermal power (MW) 2335 2271 1961 1980First wall power from neutron(MW)
128 120 105 105
Total first wall power (MW) 761 739 673 680Blanket power (MW) 1398 1360 1143 ~1150Blanket/shield power (MW) 1575 1532 1288 1301Power Cycle Brayton Brayton Brayton BraytonCycle efficiency (%) 55.7 55.7 55.7 55.7Auxiliary Power (MW) 52 51 44 44Driver Power (MW) 243 220 53 63Gross Electric Power (MW) 1300 1264 1092 1102Net Electric Power (MW) 1005 995 996 996
January 1, 2002/ARR9
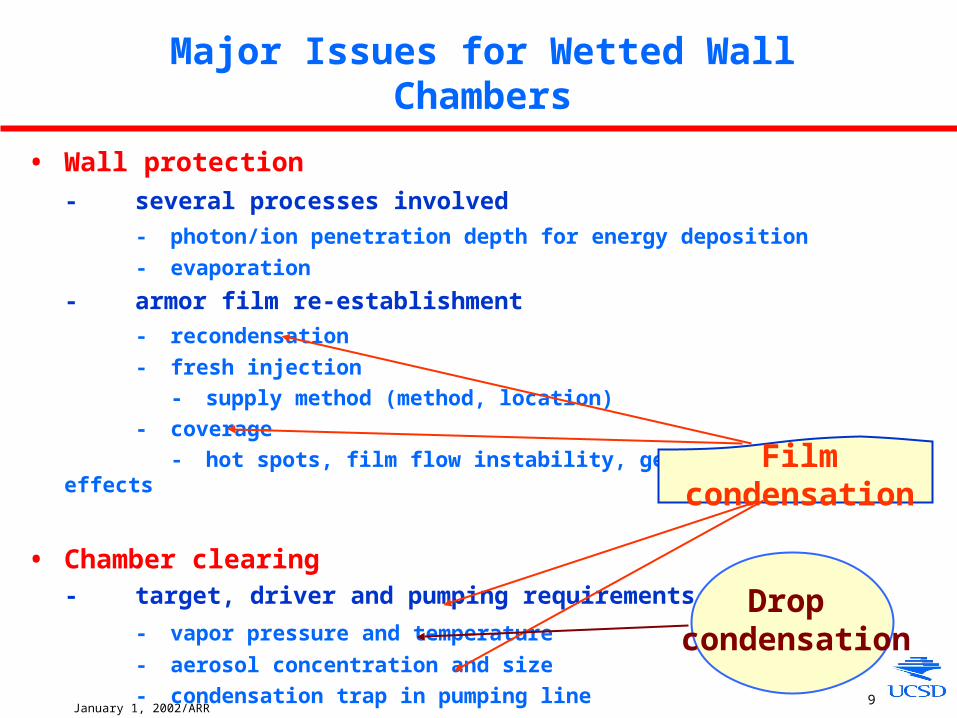
Major Issues for Wetted Wall Chambers
• Wall protection
- several processes involved
- photon/ion penetration depth for energy deposition
- evaporation
- armor film re-establishment
- recondensation
- fresh injection
- supply method (method, location)
- coverage
- hot spots, film flow instability, geometry effects
• Chamber clearing- target, driver and pumping requirements
- vapor pressure and temperature
- aerosol concentration and size
- condensation trap in pumping line
Drop condensation
Film condensation
January 1, 2002/ARR10
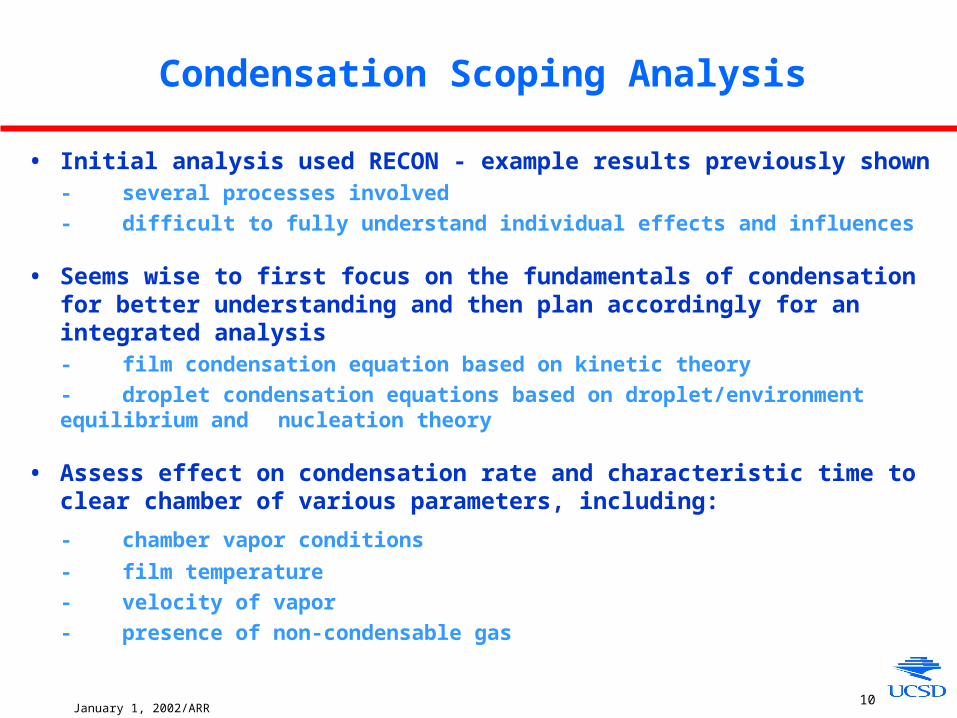
Condensation Scoping Analysis
• Initial analysis used RECON - example results previously shown- several processes involved
- difficult to fully understand individual effects and influences
• Seems wise to first focus on the fundamentals of condensation for better understanding and then plan accordingly for an integrated analysis- film condensation equation based on kinetic theory
- droplet condensation equations based on droplet/environment equilibrium and nucleation theory
• Assess effect on condensation rate and characteristic time to clear chamber of various parameters, including:
- chamber vapor conditions
- film temperature
- velocity of vapor
- presence of non-condensable gas
January 1, 2002/ARR11
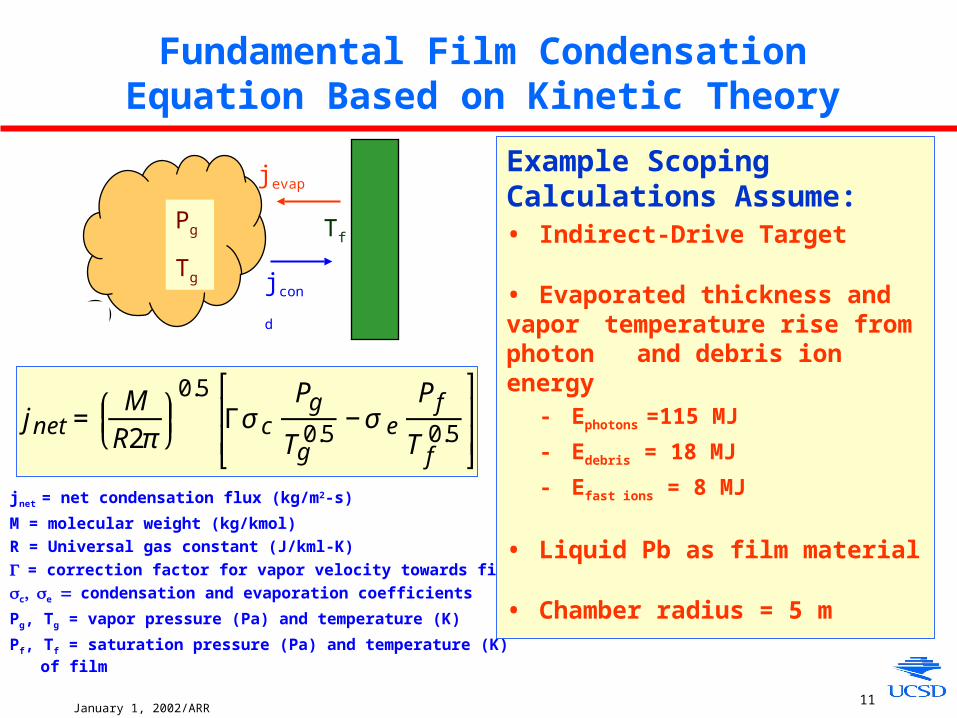
Fundamental Film Condensation Equation Based on Kinetic Theory
jnet = net condensation flux (kg/m2-s)
M = molecular weight (kg/kmol)
R = Universal gas constant (J/kml-K)
= correction factor for vapor velocity towards film
c e condensation and evaporation coefficients
Pg, Tg = vapor pressure (Pa) and temperature (K)
Pf, Tf = saturation pressure (Pa) and temperature (K) of film
Example Scoping Calculations Assume:• Indirect-Drive Target
• Evaporated thickness and vapor temperature rise from photon and debris ion energy- Ephotons =115 MJ
- Edebris = 18 MJ
- Efast ions = 8 MJ
• Liquid Pb as film material
• Chamber radius = 5 m
jcond
jevap
TfPg
Tg
jnet=MR2π
⎛ ⎝ ⎜ ⎞
⎠ ⎟
0.5Γσc
Pg
Tg0.5
−σePf
T f0.5
⎡
⎣
⎢ ⎢
⎤
⎦
⎥ ⎥
January 1, 2002/ARR12
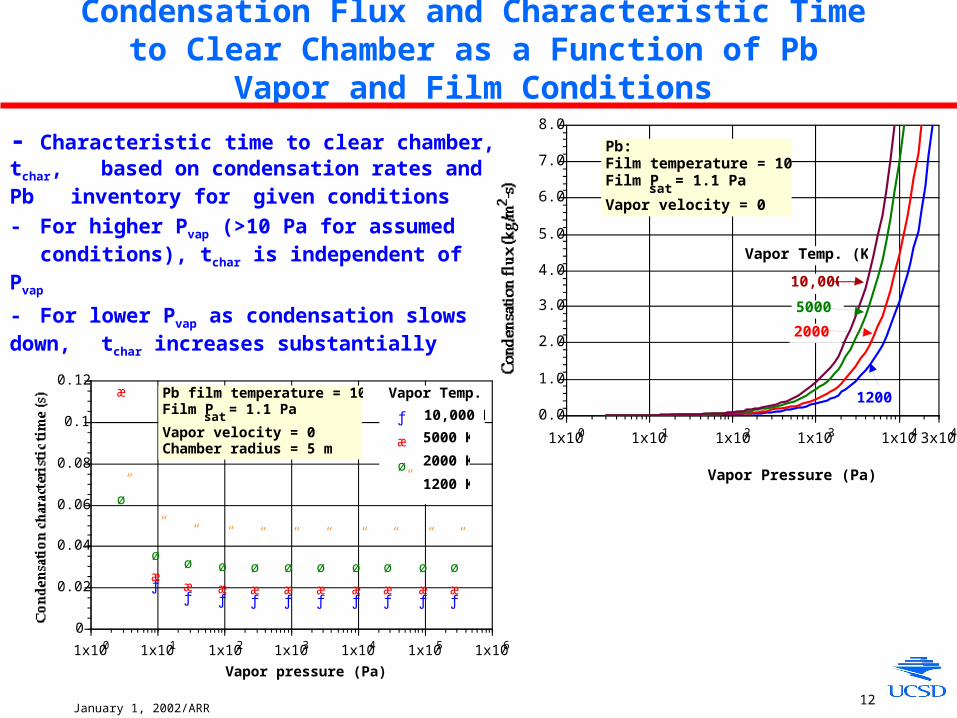
Condensation Flux and Characteristic Time to Clear Chamber as a Function of Pb Vapor and Film Conditions
- Characteristic time to clear chamber, tchar, based on condensation rates and Pb inventory for given conditions
- For higher Pvap (>10 Pa for assumed conditions), tchar is independent of Pvap
- For lower Pvap as condensation slows down, tchar increases substantially
0.0
1.0
2.0
3.0
4.0
5.0
6.0
7.0
8.0
1x100 1x101 1x10² 1x10³ 1x1043x104
Vapor Pressure (Pa)
Pb:Film temperature = 1000KFilm Psat = 1.1 Pa
Vapor velocity = 0
Vapor Temp. (K)
1200
10,000
5000
2000
ƒƒ ƒ ƒ ƒ ƒ ƒ ƒ ƒ ƒ
æ
ææ æ æ æ æ æ æ æ æ
ø
ø ø ø ø ø ø ø ø ø ø
”
” ” ” ” ” ” ” ” ” ”
0
0.02
0.04
0.06
0.08
0.1
0.12
1x100 1x101 1x10² 1x10³ 1x10⁴ 1x10⁵ 1x10⁶
Vapor pressure (Pa)
ƒ
æ
ø
”
Pb film temperature = 1000KFilm Psat = 1.1 Pa
Vapor velocity = 0Chamber radius = 5 m
Vapor Temp.
10,000 K
5000 K
2000 K
1200 K
January 1, 2002/ARR13
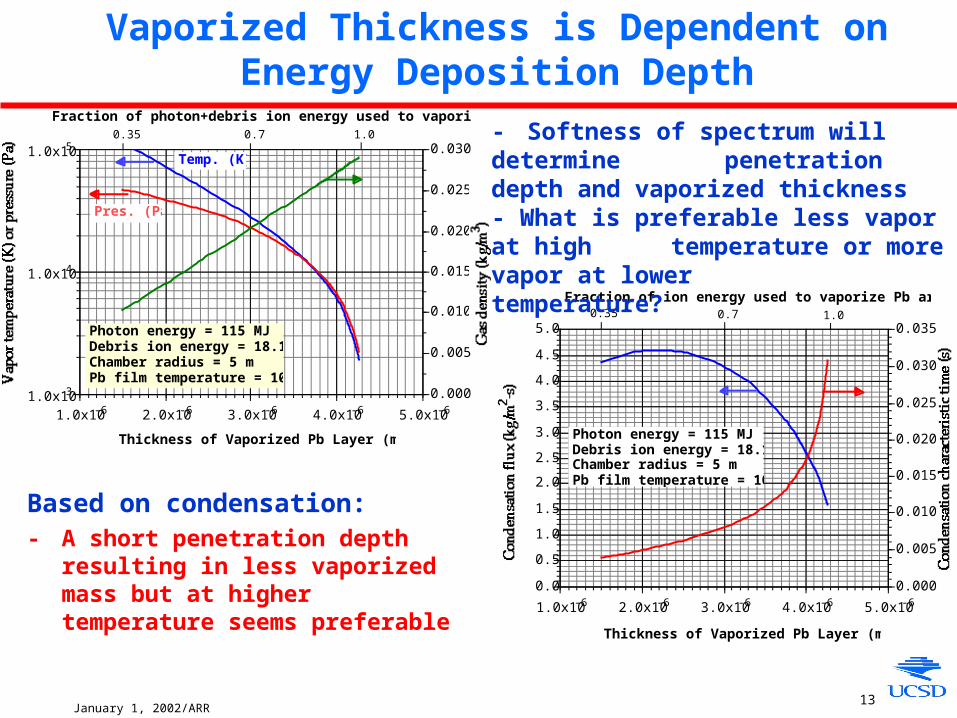
Vaporized Thickness is Dependent on Energy Deposition Depth
Based on condensation:- A short penetration depth resulting in
less vaporized mass but at higher temperature seems preferable
0.0
0.5
1.0
1.5
2.0
2.5
3.0
3.5
4.0
4.5
5.0
0.000
0.005
0.010
0.015
0.020
0.025
0.030
0.035
1.0x10⁻⁶ 2.0x10⁻⁶ 3.0x10⁻⁶ 4.0x10⁻⁶ 5.0x10⁻⁶
Fraction of ion energy used to vaporize Pb armor
Thickness of Vaporized Pb Layer (m)
0.35 0.7 1.0
Photon energy = 115 MJDebris ion energy = 18.1 MJChamber radius = 5 mPb film temperature = 1000 K
1.0x10³
1.0x10⁴
1.0x10⁵
0.000
0.005
0.010
0.015
0.020
0.025
0.030
1.0x10⁻⁶ 2.0x10⁻⁶ 3.0x10⁻⁶ 4.0x10⁻⁶ 5.0x10⁻⁶
Fraction of photon+debris ion energy used to vaporize Pb armor
Pres. (Pa)
Thickness of Vaporized Pb Layer (m)
0.35 0.7 1.0
Photon energy = 115 MJDebris ion energy = 18.1 MJChamber radius = 5 mPb film temperature = 1000 K
Temp. (K)
- Softness of spectrum will determine penetration depth and vaporized
thickness- What is preferable less vapor at high
temperature or more vapor at lower temperature?
January 1, 2002/ARR14
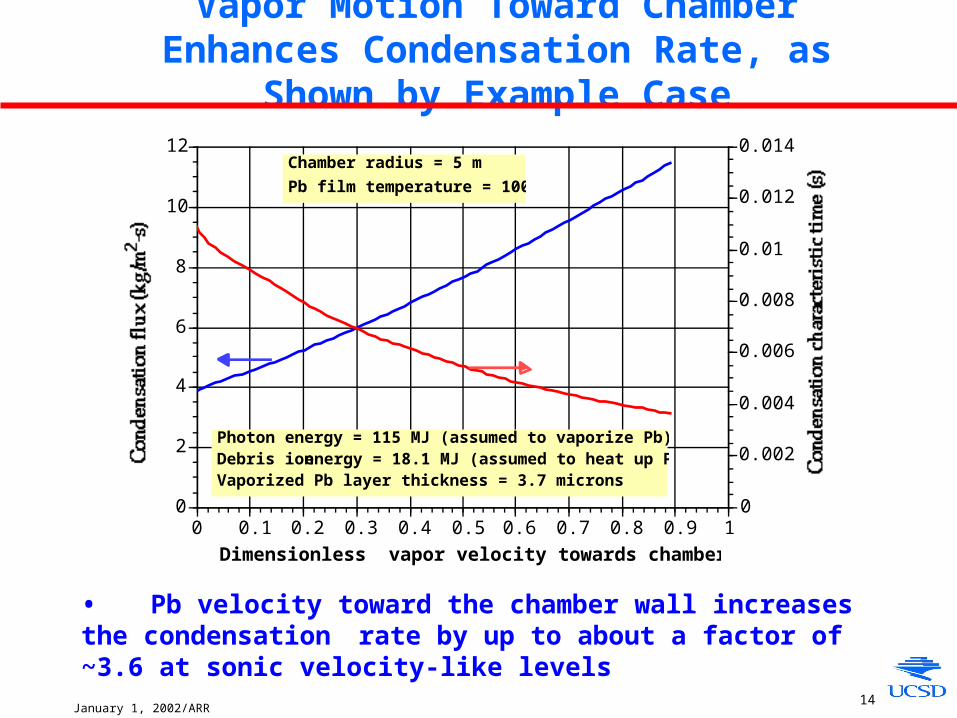
Vapor Motion Toward Chamber Enhances Condensation Rate, as Shown by Example Case
• Pb velocity toward the chamber wall increases the condensation rate by up to about a factor of ~3.6 at sonic velocity-like levels
Dimensionless vapor velocity towards chamber wall
0
2
4
6
8
10
12
0
0.002
0.004
0.006
0.008
0.01
0.012
0.014
0 0.1 0.2 0.3 0.4 0.5 0.6 0.7 0.8 0.9 1
Photon energy = 115 MJ (assumed to vaporize Pb)Debris ion energy = 18.1 MJ (assumed to heat up Pb vapor)Vaporized Pb layer thickness = 3.7 microns
Chamber radius = 5 m
Pb film temperature = 1000K
January 1, 2002/ARR15
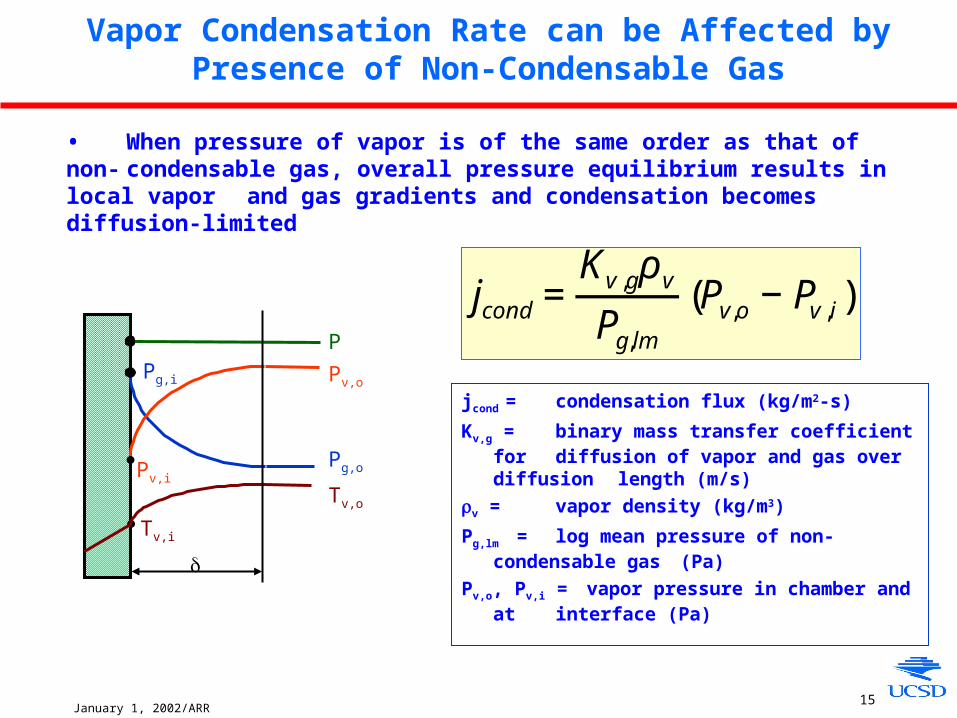
Vapor Condensation Rate can be Affected by Presence of Non-Condensable Gas
• When pressure of vapor is of the same order as that of non-condensable gas, overall pressure equilibrium results in local vapor and gas gradients and condensation becomes diffusion-limited
P
Pv,o
Pg,o
Pg,i
Tv,o
Tv,i
Pv,i
jcond=Kv,gρvPg,lm
(Pv,o −Pv,i)
jcond = condensation flux (kg/m2-s)
Kv,g = binary mass transfer coefficient for diffusion of vapor and gas over
diffusion length (m/s)
v = vapor density (kg/m3)
Pg,lm = log mean pressure of non-condensable gas (Pa)
Pv,o, Pv,i = vapor pressure in chamber and at interface (Pa)
January 1, 2002/ARR16
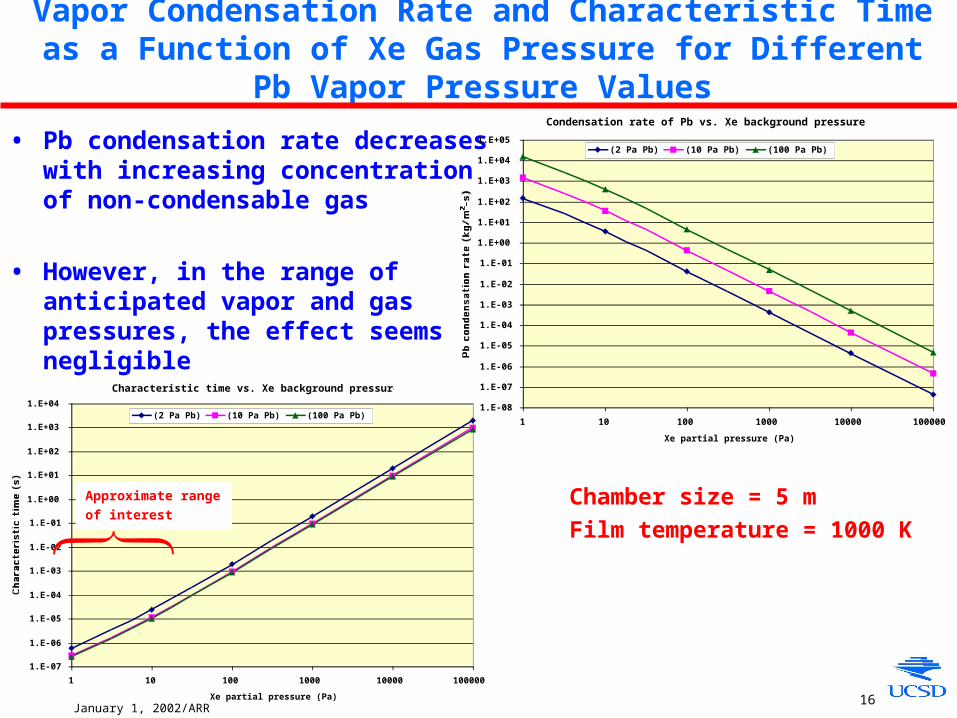
Vapor Condensation Rate and Characteristic Time as a Function of Xe Gas Pressure for Different Pb Vapor Pressure Values
• Pb condensation rate decreases with increasing concentration of non-condensable gas
• However, in the range of anticipated vapor and gas pressures, the effect seems negligible
Condensation rate of Pb vs. Xe background pressure
1.E-08
1.E-07
1.E-06
1.E-05
1.E-04
1.E-03
1.E-02
1.E-01
1.E+00
1.E+01
1.E+02
1.E+03
1.E+04
1.E+05
1 10 100 1000 10000 100000
Xe partial pressure (Pa)
Pb condensation rate (kg/m
2-s)
(2 Pa Pb) (10 Pa Pb) (100 Pa Pb)
Characteristic time vs. Xe background pressure
1.E-07
1.E-06
1.E-05
1.E-04
1.E-03
1.E-02
1.E-01
1.E+00
1.E+01
1.E+02
1.E+03
1.E+04
1 10 100 1000 10000 100000
Xe partial pressure (Pa)
Characteristic time (s)
(2 Pa Pb) (10 Pa Pb) (100 Pa Pb)
Chamber size = 5 m
Film temperature = 1000 K
Approximate range
of interest

January 1, 2002/ARR17
Vapor Condensation Rate and Characteristic Time as a Function of Pb Film Temperature
• Pb condensation rate increases substantially within a short film temperature range at about the local BP.
• Can this be used as a mean of in-situ recoating very thin film or dry spots?
-3
-2
-1
0
1
2
3
4
0.010
0.015
0.020
0.025
0.030
400 500 600 700 800 900 100011001200130014001500
Pb film temperature (K)
Pb:Vapor temperature = 104KVapor P = 104 PaVapor velocity = 0Chamber radius = 5 m
Condensation flux
f,a
f,b
w
Coo
lan
t
PbSiC/SiC
Tfilm,def.
Tfilm
• If Tfilm,def. < Tfilm can deficient film formation be adequately corrected by preferential condensation?
January 1, 2002/ARR18
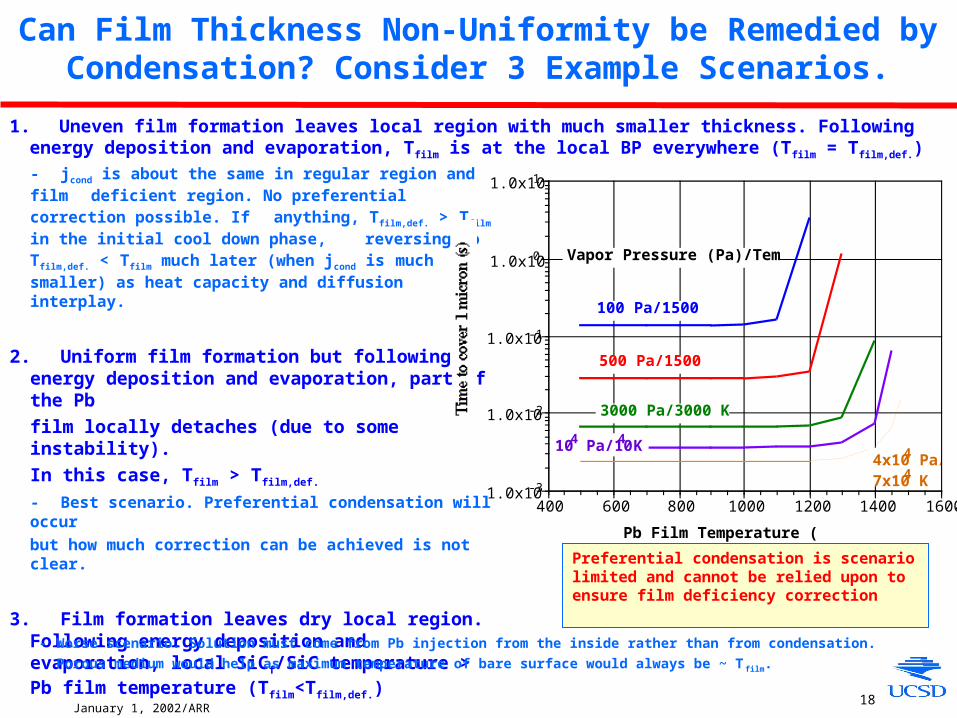
Can Film Thickness Non-Uniformity be Remedied by Condensation? Consider 3 Example Scenarios.
- jcond is about the same in regular region and film deficient region. No preferential correction possible.
If anything, Tfilm,def. > Tfilm in the initial cool down phase,
reversing to Tfilm,def. < Tfilm much later (when jcond is much smaller) as heat capacity and diffusion
interplay.
2. Uniform film formation but following energy deposition and evaporation, part of the Pb
film locally detaches (due to some instability).
In this case, Tfilm > Tfilm,def.
- Best scenario. Preferential condensation will occur
but how much correction can be achieved is not clear.
3. Film formation leaves dry local region. Following energy deposition and evaporation, local SiCf/SiC temperature > Pb film temperature (Tfilm<Tfilm,def.)
1.0x10⁻³
1.0x10⁻²
1.0x10⁻¹
1.0x100
1.0x101
400 600 800 1000 1200 1400 1600
Pb Film Temperature (K)
Vapor Pressure (Pa)/Temp. (K)
100 Pa/1500 K
500 Pa/1500 K
3000 Pa/3000 K
104 Pa/104 K4x104 Pa/7x104 K
1. Uneven film formation leaves local region with much smaller thickness. Following energy deposition and evaporation, Tfilm is at the local BP everywhere (Tfilm = Tfilm,def.)
- Worse scenario. Solution must come from Pb injection from the inside rather than from condensation.
Porous medium would help as maximum temperature of bare surface would always be ~ T film.
Preferential condensation is scenario limited and cannot be relied upon to ensure film deficiency correction
January 1, 2002/ARR19
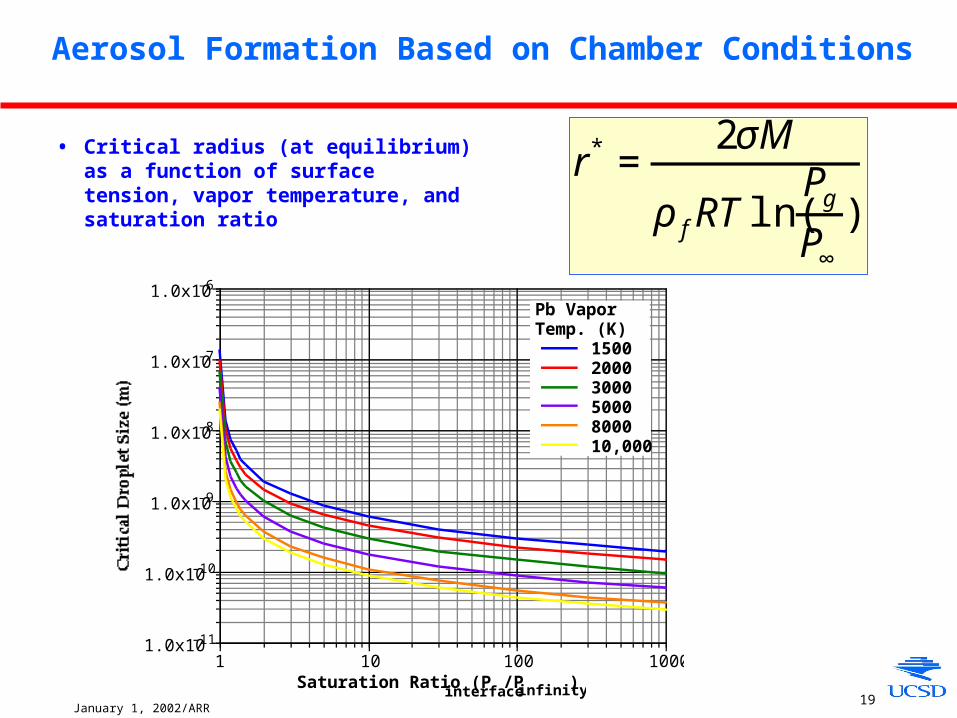
Aerosol Formation Based on Chamber Conditions
• Critical radius (at equilibrium) as a function of surface tension, vapor temperature, and saturation ratio
r* =2σM
ρfRTln(PgP∞
)
1.0x10⁻¹¹
1.0x10⁻¹⁰
1.0x10⁻⁹
1.0x10⁻⁸
1.0x10⁻⁷
1.0x10⁻⁶
1 10 100 1000
Pb VaporTemp. (K)
1500200030005000800010,000
Saturation Ratio (Pinterface/Pinfinity)
January 1, 2002/ARR20
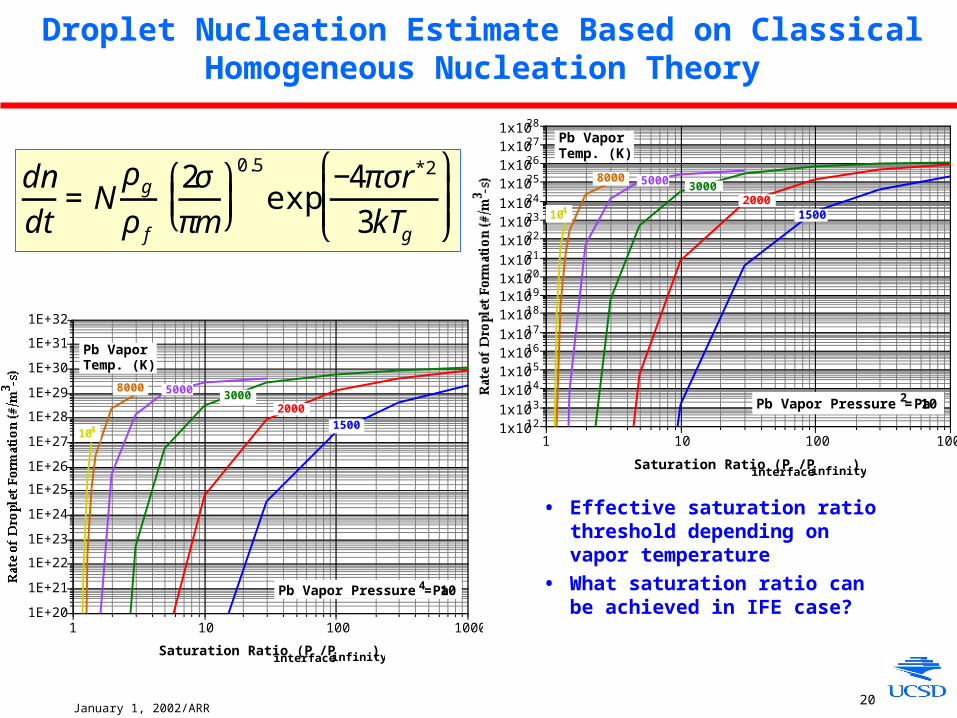
Droplet Nucleation Estimate Based on Classical Homogeneous Nucleation Theory
dndt
=Nρgρf
2σπm
⎛ ⎝ ⎜
⎞ ⎠ ⎟
0.5
exp−4πσr*2
3kTg
⎛
⎝ ⎜ ⎜
⎞
⎠ ⎟ ⎟
1E+20
1E+21
1E+22
1E+23
1E+24
1E+25
1E+26
1E+27
1E+28
1E+29
1E+30
1E+31
1E+32
1 10 100 1000
Saturation Ratio (Pinterface/Pinfinity)
15002000
300050008000
104
Pb Vapor Pressure = 104 Pa
Pb VaporTemp. (K)
1x10121x10131x10141x10151x10161x10171x10181x10191x10201x10211x10221x10231x10241x10251x10261x10271x1028
1 10 100 1000
Saturation Ratio (Pinterface/Pinfinity)
15002000
300050008000
104
Pb Vapor Pressure = 102 Pa
Pb VaporTemp. (K)
• Effective saturation ratio threshold depending on vapor temperature
• What saturation ratio can be achieved in IFE case?
January 1, 2002/ARR21
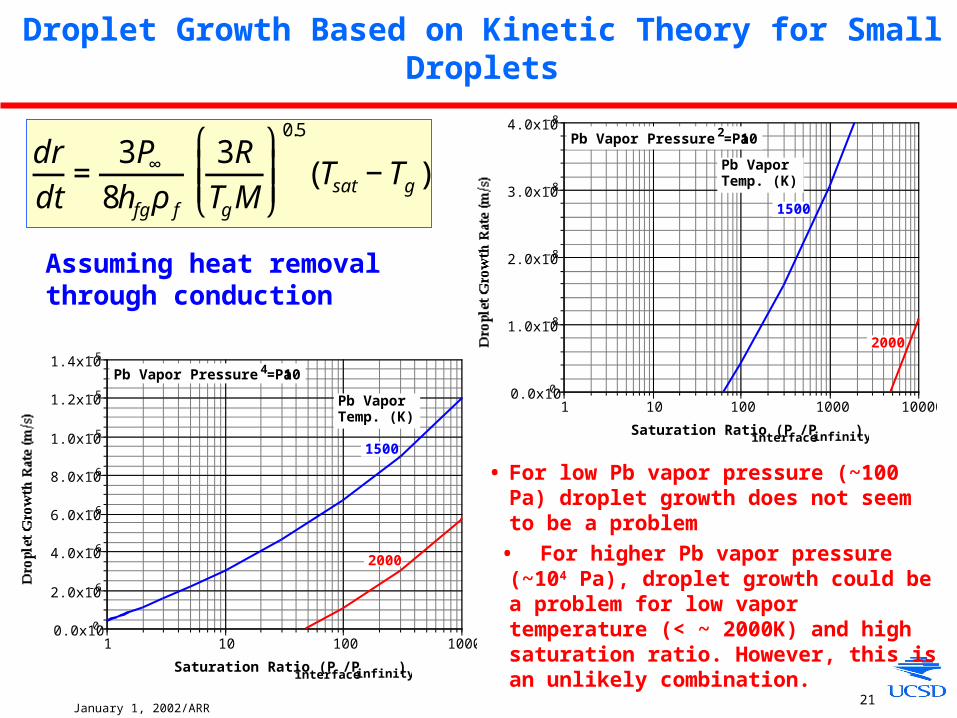
Droplet Growth Based on Kinetic Theory for Small Droplets
drdt
=3P∞
8hfgρf
3RTgM
⎛
⎝ ⎜ ⎜
⎞
⎠ ⎟ ⎟
0.5
(Tsat−Tg)
• For low Pb vapor pressure (~100 Pa) droplet growth does not seem to be a problem
• For higher Pb vapor pressure (~104 Pa), droplet growth could be a problem for low vapor temperature (< ~ 2000K) and high saturation ratio. However, this is an unlikely combination.
0.0x100
1.0x10⁻⁸
2.0x10⁻⁸
3.0x10⁻⁸
4.0x10⁻⁸
1 10 100 1000 10000
Saturation Ratio (Pinterface/Pinfinity)
Pb VaporTemp. (K)
1500
2000
Pb Vapor Pressure = 102 Pa
0.0x100
2.0x10⁻⁶
4.0x10⁻⁶
6.0x10⁻⁶
8.0x10⁻⁶
1.0x10⁻⁵
1.2x10⁻⁵
1.4x10⁻⁵
1 10 100 1000
Saturation Ratio (Pinterface/Pinfinity)
Pb VaporTemp. (K)
1500
2000
Pb Vapor Pressure = 104 Pa
Assuming heat removal through conduction
January 1, 2002/ARR22
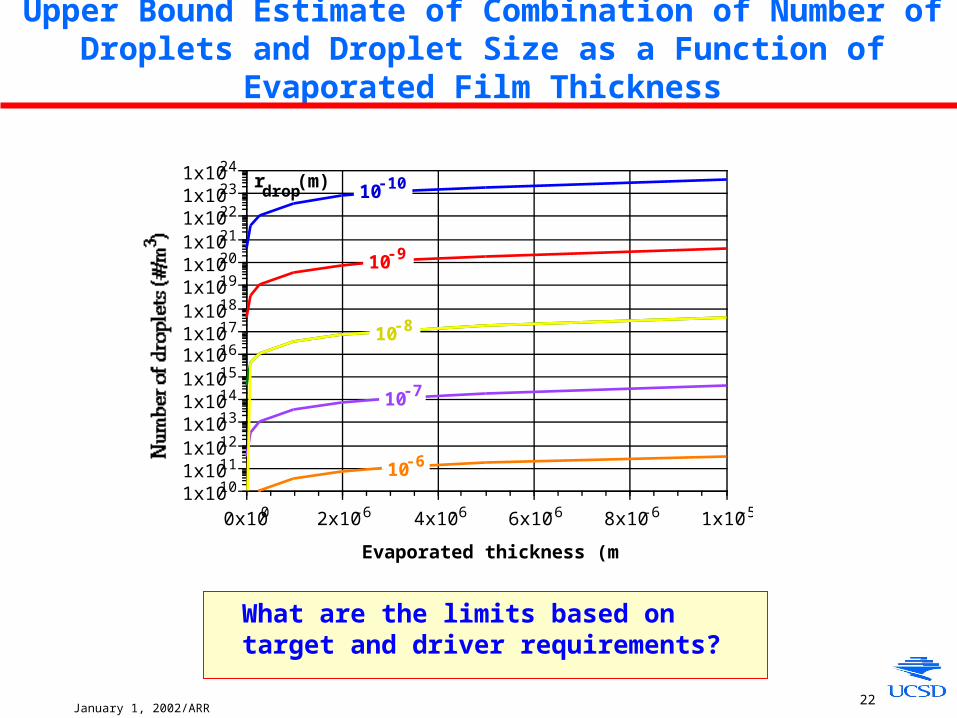
Upper Bound Estimate of Combination of Number of Droplets and Droplet Size as a Function of Evaporated Film Thickness
What are the limits based on target and driver requirements?
1x10101x10111x10121x10131x10141x10151x10161x10171x10181x10191x10201x10211x10221x10231x1024
0x100 2x10⁻⁶ 4x10⁻⁶ 6x10⁻⁶ 8x10⁻⁶ 1x10⁻⁵
10-10
10-9
10-8
rdrop(m)
10-7
10-6
Evaporated thickness (m)
January 1, 2002/ARR23
Several Observations Emerged from the Condensation Scoping Study
• Above a certain “threshold” the condensation characteristic time to clear chamber does not change appreciably with vapor pressure and is much lower than the IFE time between shots
• Normal vapor velocity at the interface enhances condensation rate but by no more than about half an order of magnitude
• The presence of non-condensable gas can slow down condensation but effect important at Pg higher than anticipated for IFE
• Based on condensation, it seems somewhat better to have a shorter penetration depth (softer spectrum) resulting in less vapor at a higher temperature
• Correction on film thickness unevenness by preferential condensation can happen for a given scenario producing the required local film T. However, it cannot be relied upon and other means of correction are required to account for all possible scenarios.
• Aerosol formation could be a problem although it is not clear that IFE conditions would result in droplet growth (at least based on conduction)
What next?
• To shed more light on the evolution of chamber conditions between shots, it would be very useful to run an integrated model including film and drop condensation but also fluid dynamics and heat transfer with the right physics
January 1, 2002/ARR24
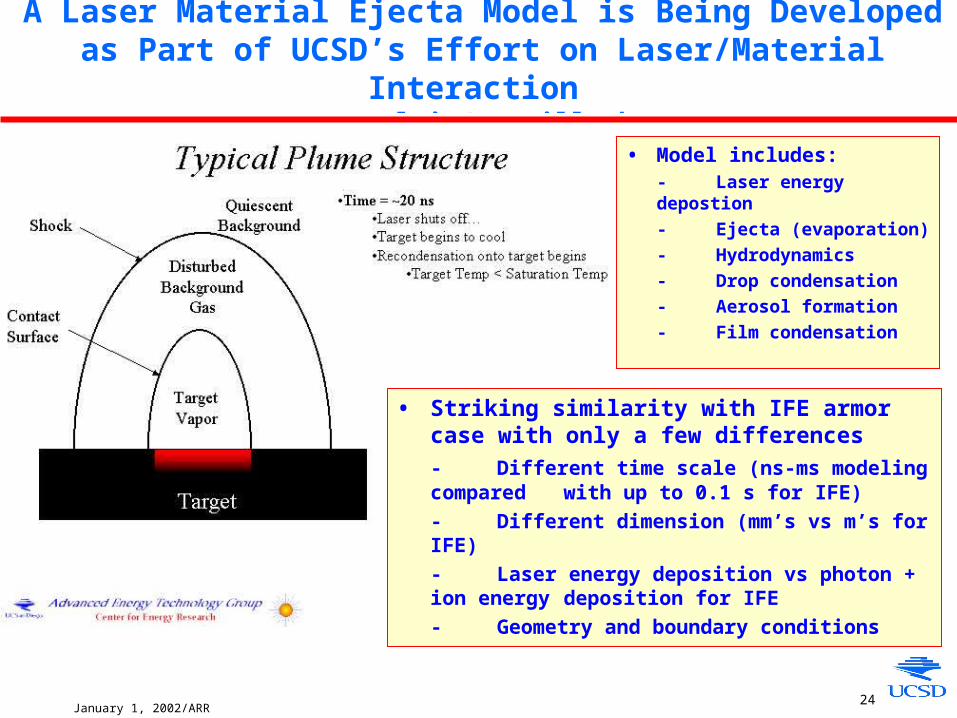
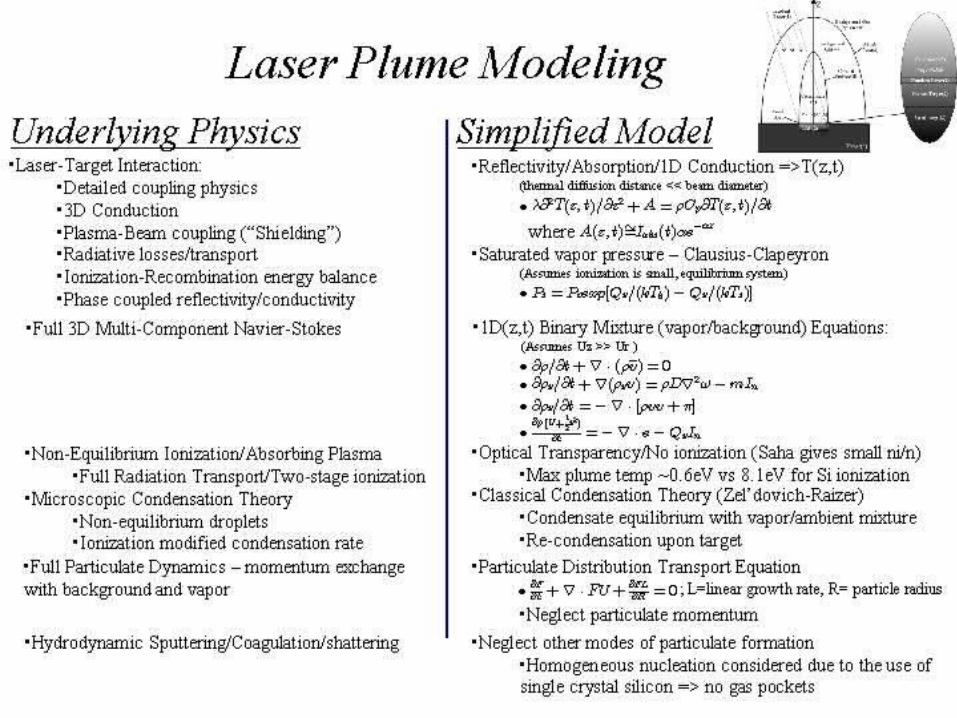
A Laser Material Ejecta Model is Being Developed as Part of UCSD’s Effort on Laser/Material Interaction
(D. Blair/M. Tillack)
• Model includes:- Laser energy depostion
- Ejecta (evaporation)
- Hydrodynamics
- Drop condensation
- Aerosol formation
- Film condensation
• Striking similarity with IFE armor case with only a few differences
- Different time scale (ns-ms modeling compared with up to 0.1 s for IFE)
- Different dimension (mm’s vs m’s for IFE)
- Laser energy deposition vs photon + ion energy deposition for IFE
- Geometry and boundary conditions
January 1, 2002/ARR25
Observations from Condensation Scoping Study
• Normal vapor velocity at the interface enhances condensation rate but by no more than about half an order of magnitude
• The presence of non-condensable gas can slow down condensation but effect important at Pg higher than anticipated for IFE
January 1, 2002/ARR26
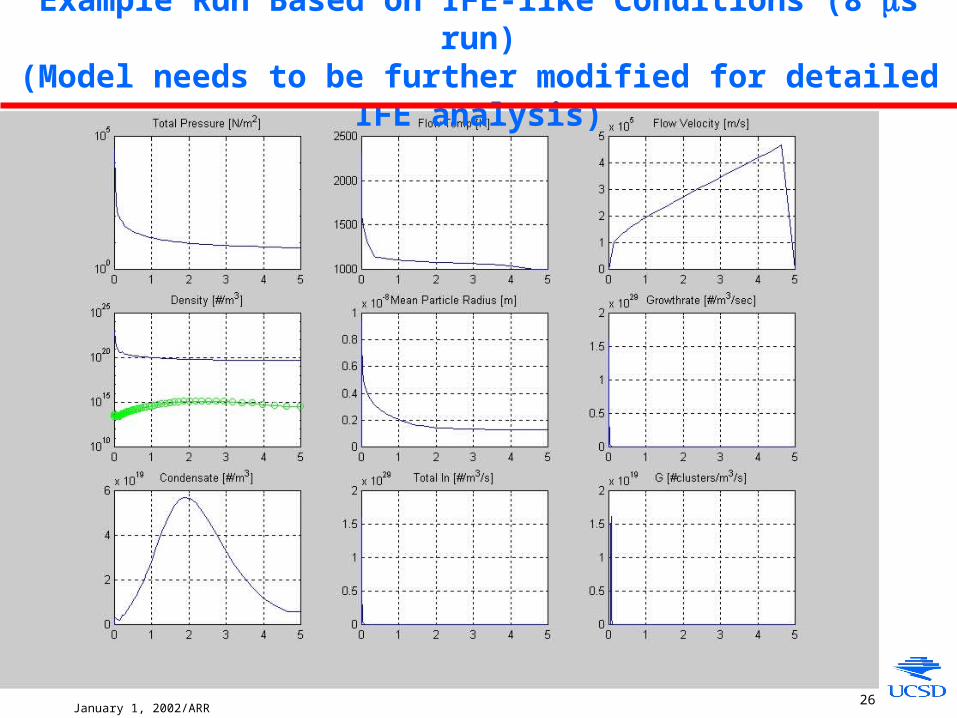
Example Run Based on IFE-like Conditions (8 μs run)(Model needs to be further modified for detailed IFE analysis)
January 1, 2002/ARR27
Future Work
• Run IFE cases with modified laser ejecta code to better understand chamber conditions prior to each shot. E.g.
- Residual aerosol characteristics
- Vapor density, temperature and pressure
- Effect of background gas
- Effect of chamber size
- Effect of penetration depth
• Input on driver and target requirements
• Possibility of self-healing of film thickness deficiency
January 1, 2002/ARR28
Extra Slides
January 1, 2002/ARR29
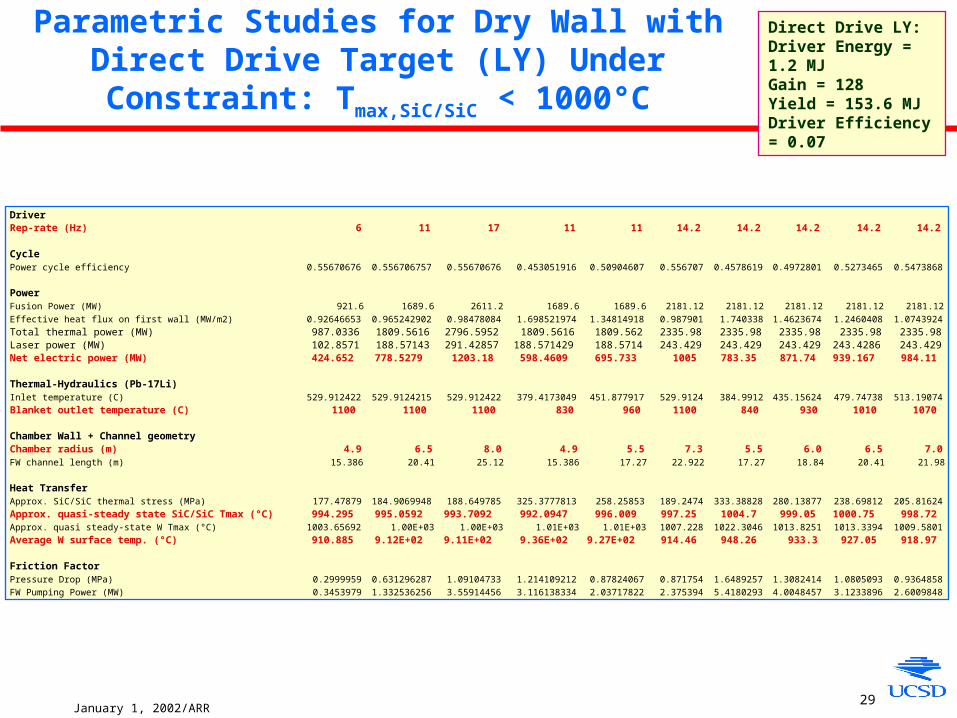
Parametric Studies for Dry Wall with Direct Drive Target (LY) Under Constraint: Tmax,SiC/SiC < 1000°C
Direct Drive LY:Driver Energy = 1.2 MJGain = 128Yield = 153.6 MJDriver Efficiency = 0.07
DriverRep-rate (Hz) 6 11 17 11 11 14.2 14.2 14.2 14.2 14.2
CyclePower cycle efficiency 0.55670676 0.556706757 0.55670676 0.453051916 0.50904607 0.556707 0.4578619 0.4972801 0.5273465 0.5473868
PowerFusion Power (MW) 921.6 1689.6 2611.2 1689.6 1689.6 2181.12 2181.12 2181.12 2181.12 2181.12Effective heat flux on first wall (MW/m2) 0.92646653 0.965242902 0.98478084 1.698521974 1.34814918 0.987901 1.740338 1.4623674 1.2460408 1.0743924Total thermal power (MW) 987.0336 1809.5616 2796.5952 1809.5616 1809.562 2335.98 2335.98 2335.98 2335.98 2335.98Laser power (MW) 102.8571 188.57143 291.42857 188.571429 188.5714 243.429 243.429 243.429 243.4286 243.429Net electric power (MW) 424.652 778.5279 1203.18 598.4609 695.733 1005 783.35 871.74 939.167 984.11
Thermal-Hydraulics (Pb-17Li)Inlet temperature (C) 529.912422 529.9124215 529.912422 379.4173049 451.877917 529.9124 384.9912 435.15624 479.74738 513.19074Blanket outlet temperature (C) 1100 1100 1100 830 960 1100 840 930 1010 1070
Chamber Wall + Channel geometryChamber radius (m) 4.9 6.5 8.0 4.9 5.5 7.3 5.5 6.0 6.5 7.0FW channel length (m) 15.386 20.41 25.12 15.386 17.27 22.922 17.27 18.84 20.41 21.98
Heat TransferApprox. SiC/SiC thermal stress (MPa) 177.47879 184.9069948 188.649785 325.3777813 258.25853 189.2474 333.38828 280.13877 238.69812 205.81624Approx. quasi-steady state SiC/SiC Tmax (°C) 994.295 995.0592 993.7092 992.0947 996.009 997.25 1004.7 999.05 1000.75 998.72Approx. quasi steady-state W Tmax (°C) 1003.65692 1.00E+03 1.00E+03 1.01E+03 1.01E+03 1007.228 1022.3046 1013.8251 1013.3394 1009.5801Average W surface temp. (°C) 910.885 9.12E+02 9.11E+02 9.36E+02 9.27E+02 914.46 948.26 933.3 927.05 918.97
Friction FactorPressure Drop (MPa) 0.2999959 0.631296287 1.09104733 1.214109212 0.87824067 0.871754 1.6489257 1.3082414 1.0805093 0.9364858FW Pumping Power (MW) 0.3453979 1.332536256 3.55914456 3.116138334 2.03717822 2.375394 5.4180293 4.0048457 3.1233896 2.6009848
January 1, 2002/ARR30
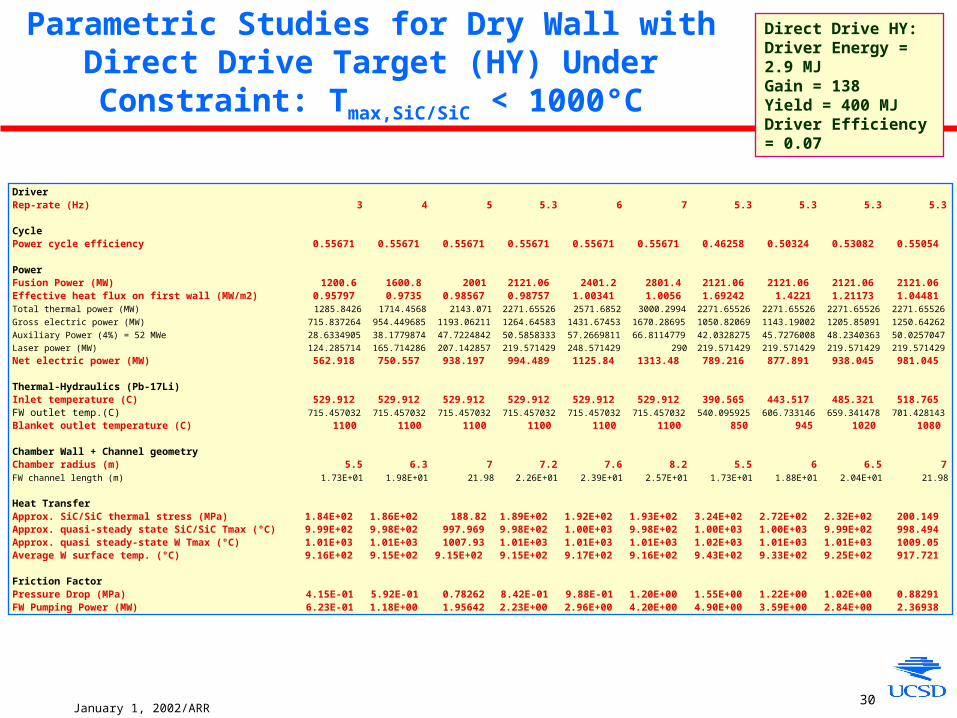
Parametric Studies for Dry Wall with Direct Drive Target (HY) Under Constraint: Tmax,SiC/SiC < 1000°C
Direct Drive HY:Driver Energy = 2.9 MJGain = 138Yield = 400 MJDriver Efficiency = 0.07
DriverRep-rate (Hz) 3 4 5 5.3 6 7 5.3 5.3 5.3 5.3
CyclePower cycle efficiency 0.55671 0.55671 0.55671 0.55671 0.55671 0.55671 0.46258 0.50324 0.53082 0.55054
PowerFusion Power (MW) 1200.6 1600.8 2001 2121.06 2401.2 2801.4 2121.06 2121.06 2121.06 2121.06Effective heat flux on first wall (MW/m2) 0.95797 0.9735 0.98567 0.98757 1.00341 1.0056 1.69242 1.4221 1.21173 1.04481Total thermal power (MW) 1285.8426 1714.4568 2143.071 2271.65526 2571.6852 3000.2994 2271.65526 2271.65526 2271.65526 2271.65526Gross electric power (MW) 715.837264 954.449685 1193.06211 1264.64583 1431.67453 1670.28695 1050.82069 1143.19002 1205.85091 1250.64262Auxiliary Power (4%) = 52 MWe 28.6334905 38.1779874 47.7224842 50.5858333 57.2669811 66.8114779 42.0328275 45.7276008 48.2340363 50.0257047Laser power (MW) 124.285714 165.714286 207.142857 219.571429 248.571429 290 219.571429 219.571429 219.571429 219.571429Net electric power (MW) 562.918 750.557 938.197 994.489 1125.84 1313.48 789.216 877.891 938.045 981.045
Thermal-Hydraulics (Pb-17Li)Inlet temperature (C) 529.912 529.912 529.912 529.912 529.912 529.912 390.565 443.517 485.321 518.765FW outlet temp.(C) 715.457032 715.457032 715.457032 715.457032 715.457032 715.457032 540.095925 606.733146 659.341478 701.428143Blanket outlet temperature (C) 1100 1100 1100 1100 1100 1100 850 945 1020 1080
Chamber Wall + Channel geometryChamber radius (m) 5.5 6.3 7 7.2 7.6 8.2 5.5 6 6.5 7FW channel length (m) 1.73E+01 1.98E+01 21.98 2.26E+01 2.39E+01 2.57E+01 1.73E+01 1.88E+01 2.04E+01 21.98
Heat Transfer Approx. SiC/SiC thermal stress (MPa) 1.84E+02 1.86E+02 188.82 1.89E+02 1.92E+02 1.93E+02 3.24E+02 2.72E+02 2.32E+02 200.149Approx. quasi-steady state SiC/SiC Tmax (°C) 9.99E+02 9.98E+02 997.969 9.98E+02 1.00E+03 9.98E+02 1.00E+03 1.00E+03 9.99E+02 998.494Approx. quasi steady-state W Tmax (°C) 1.01E+03 1.01E+03 1007.93 1.01E+03 1.01E+03 1.01E+03 1.02E+03 1.01E+03 1.01E+03 1009.05Average W surface temp. (°C) 9.16E+02 9.15E+02 9.15E+02 9.15E+02 9.17E+02 9.16E+02 9.43E+02 9.33E+02 9.25E+02 917.721
Friction FactorPressure Drop (MPa) 4.15E-01 5.92E-01 0.78262 8.42E-01 9.88E-01 1.20E+00 1.55E+00 1.22E+00 1.02E+00 0.88291FW Pumping Power (MW) 6.23E-01 1.18E+00 1.95642 2.23E+00 2.96E+00 4.20E+00 4.90E+00 3.59E+00 2.84E+00 2.36938
January 1, 2002/ARR31
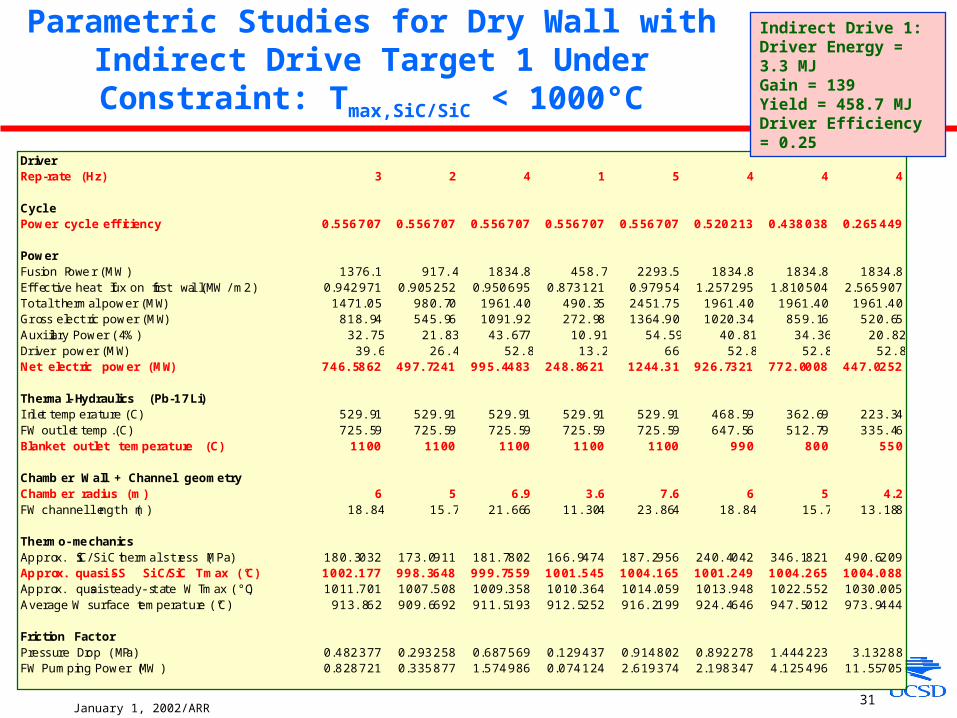
Parametric Studies for Dry Wall with Indirect Drive Target 1 Under Constraint: Tmax,SiC/SiC < 1000°C
DriverRep-rate (Hz) 3 2 4 1 5 4 4 4
CyclePower cycle efficiency 0.556707 0.556707 0.556707 0.556707 0.556707 0.520213 0.438038 0.265449
PowerFusion Power (MW) 1376.1 917.4 1834.8 458.7 2293.5 1834.8 1834.8 1834.8Effective heat f lux on first wall (MW/m2) 0.942971 0.905252 0.950695 0.873121 0.97954 1.257295 1.810504 2.565907Tot al thermal power (MW) 1471.05 980.70 1961.40 490.35 2451.75 1961.40 1961.40 1961.40Gross electric power (MW) 818.94 545.96 1091.92 272.98 1364.90 1020.34 859.16 520.65Auxiliary Power (4%) 32.75 21.83 43.677 10.91 54.59 40.81 34.36 20.82Driver power (MW) 39.6 26.4 52.8 13.2 66 52.8 52.8 52.8Net electric power (MW) 746.5862 497.7241 995.4483 248.8621 1244.31 926.7321 772.0008 447.0252
Thermal-Hydraulics (Pb-17Li)Inlet temperature (C) 529.91 529.91 529.91 529.91 529.91 468.59 362.69 223.34FW outlet temp.(C) 725.59 725.59 725.59 725.59 725.59 647.56 512.79 335.46Blanket outlet temperature (C) 1100 1100 1100 1100 1100 990 800 550
Chamber Wall + Channel geometryChamber radius (m) 6 5 6.9 3.6 7.6 6 5 4.2FW channel length (m) 18.84 15.7 21.666 11.304 23.864 18.84 15.7 13.188
Thermo-mechanicsApprox. SiC/ SiC thermal stress (MPa) 180.3032 173.0911 181.7802 166.9474 187.2956 240.4042 346.1821 490.6209Approx. quasi-SS SiC/SiC Tmax (°C) 1002.177 998.3648 999.7559 1001.545 1004.165 1001.249 1004.265 1004.088Approx. quasi steady-state W Tmax (°C) 1011.701 1007.508 1009.358 1010.364 1014.059 1013.948 1022.552 1030.005Average W surface temperature (°C) 913.862 909.6692 911.5193 912.5252 916.2199 924.4646 947.5012 973.9444
Friction FactorPressure Drop (MPa) 0.482377 0.293258 0.687569 0.129437 0.914802 0.892278 1.444223 3.13288FW Pumping Power (MW) 0.828721 0.335877 1.574986 0.074124 2.619374 2.198347 4.125496 11.55705
Indirect Drive 1:Driver Energy = 3.3 MJGain = 139Yield = 458.7 MJDriver Efficiency = 0.25
January 1, 2002/ARR32
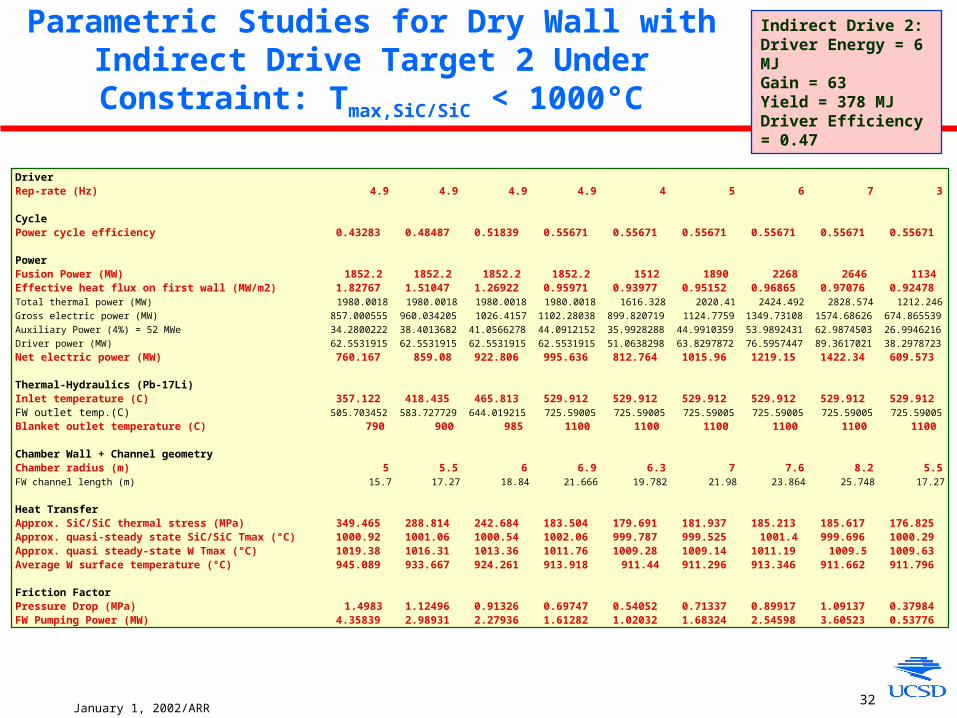
Parametric Studies for Dry Wall with Indirect Drive Target 2 Under Constraint: Tmax,SiC/SiC < 1000°C
Indirect Drive 2:Driver Energy = 6 MJGain = 63Yield = 378 MJDriver Efficiency = 0.47
DriverRep-rate (Hz) 4.9 4.9 4.9 4.9 4 5 6 7 3
CyclePower cycle efficiency 0.43283 0.48487 0.51839 0.55671 0.55671 0.55671 0.55671 0.55671 0.55671
PowerFusion Power (MW) 1852.2 1852.2 1852.2 1852.2 1512 1890 2268 2646 1134Effective heat flux on first wall (MW/m2) 1.82767 1.51047 1.26922 0.95971 0.93977 0.95152 0.96865 0.97076 0.92478Total thermal power (MW) 1980.0018 1980.0018 1980.0018 1980.0018 1616.328 2020.41 2424.492 2828.574 1212.246Gross electric power (MW) 857.000555 960.034205 1026.4157 1102.28038 899.820719 1124.7759 1349.73108 1574.68626 674.865539Auxiliary Power (4%) = 52 MWe 34.2800222 38.4013682 41.0566278 44.0912152 35.9928288 44.9910359 53.9892431 62.9874503 26.9946216Driver power (MW) 62.5531915 62.5531915 62.5531915 62.5531915 51.0638298 63.8297872 76.5957447 89.3617021 38.2978723Net electric power (MW) 760.167 859.08 922.806 995.636 812.764 1015.96 1219.15 1422.34 609.573
Thermal-Hydraulics (Pb-17Li)Inlet temperature (C) 357.122 418.435 465.813 529.912 529.912 529.912 529.912 529.912 529.912FW outlet temp.(C) 505.703452 583.727729 644.019215 725.59005 725.59005 725.59005 725.59005 725.59005 725.59005Blanket outlet temperature (C) 790 900 985 1100 1100 1100 1100 1100 1100
Chamber Wall + Channel geometryChamber radius (m) 5 5.5 6 6.9 6.3 7 7.6 8.2 5.5FW channel length (m) 15.7 17.27 18.84 21.666 19.782 21.98 23.864 25.748 17.27
Heat TransferApprox. SiC/SiC thermal stress (MPa) 349.465 288.814 242.684 183.504 179.691 181.937 185.213 185.617 176.825Approx. quasi-steady state SiC/SiC Tmax (°C) 1000.92 1001.06 1000.54 1002.06 999.787 999.525 1001.4 999.696 1000.29Approx. quasi steady-state W Tmax (°C) 1019.38 1016.31 1013.36 1011.76 1009.28 1009.14 1011.19 1009.5 1009.63Average W surface temperature (°C) 945.089 933.667 924.261 913.918 911.44 911.296 913.346 911.662 911.796
Friction FactorPressure Drop (MPa) 1.4983 1.12496 0.91326 0.69747 0.54052 0.71337 0.89917 1.09137 0.37984FW Pumping Power (MW) 4.35839 2.98931 2.27936 1.61282 1.02032 1.68324 2.54598 3.60523 0.53776
Related Documents