IVIS: Highly customizable framework for visualization and processing of IoT data Lubomír Bulej, Tomáš Bureš, Petr Hnětynka, Václav Čamra, Petr Siegl, Michal Töpfer Charles University, Faculty of Mathematics and Physics, Prague, Czech Republic Email: {bulej, bures, hnetynka}@d3s.mff.cuni.cz Abstract —This tool paper presents the IVIS platform for processing and visualizing IoT and CPS data. The platform provides a web-based interface that allows both definition of complex visualizations and data pro- cessing jobs as well as exploring the data. Compared to the existing open-source and commercial offerings, IVIS follows a different model and focuses on flexibil- ity. Instead of providing a complex administrative UI for creating visualizations by dragging and dropping components onto a dashboard, IVIS provides a set of JavaScript-based visualization components that are glued together using simple JavaScript code. Similarly, the data processing jobs can be defined using code in scripting languages, such as Python, which allows exploiting the wealth of existing libraries for numerical processing. This not only makes the definition of visu- alizations and data processing jobs much more expres- sive, but it also turns out to be significantly easier to use when building complex parametric visualizations— especially when they need to deal with many sensors. This proved to be crucial in deploying IVIS in a number of international research projects, because it enabled us to rapidly setup complex visualizations and data-processing tasks, catering to project- and partner- specific requirements. Index Terms—Visualization; data processing; cus- tomization; IoT. I. Introduction Data processing and visualization have become an increasingly important part of Internet-of-Things (IoT) and Cyber-Physical Systems (CPS) because the insights gained from the data can enable a better understanding of the process being observed and allow taking the right actions. Furthermore, as these systems gradually become self-adaptive, self-optimizing, and self-learning, there is a huge amount of data on the internal working of such systems which is critical for assessing whether they work correctly, and for finding ways for further improvements. However, even in this case, the first step in making sense of a huge amount of data is to visualize it. Data visualization and processing are not new in the IoT and CPS domains—there are several existing and mature frameworks backed by industry, and we provide an overview of the most important ones in Section II. However, we argue that there is still room for a framework that puts flexibility and a developer-oriented approach at the forefront to help with the high degree of customization required in IoT and CPS use cases. This allows developing and sharing common core functionality across different projects and yet allow customizing the framework for each respective project (including various project-specific visualization components, data connectors to import data from project partners, integration to other project partners’ tools, etc.). We also argue that project-level collaborations present a use-case that is somewhat alien to existing data- visualization frameworks, which focus on making it easy for an end-user to create visualizations by dragging/dropping common components onto a dashboard. In collaborative projects, partners typically do not set up visualizations on their own and instead cooperate with a partner responsible for the visualization framework. In such a context, there is little need for sophisticated and, from the development perspective, very costly graphical UI. Instead, it is more important that the partner responsible for visualization can rapidly set up rather complex and very customized dashboards (typically combining and aggregating data from several datasets). It is also necessary to allow these dashboards to be easily cloned and modified because the functionality required by different partners will be similar in its core, but very different on the surface. In this paper, we describe an open-source data visu- alization and processing framework (called IVIS), which we have been developing and employing as the core for visualizations in various projects. In particular, we share our experience with employing IVIS in three different projects— focusing on (i) smart air quality, (ii) smart farming, and (iii) edge-cloud video processing. II. Related work Data visualization is not new, as is evident from the number of available production-level offerings. Grafana [1] is among the most popular ones. It is an open-source visualization and monitoring framework that can be con- nected with a multitude of data sources and provide attractive visualizations. A similar project, Kibana [2], is a visualization dashboard for ElasticSearch [3], a distributed, RESTful search and analytics engine suitable for large amounts of data. Chronograf [4] is yet another solution for visualization and monitoring, designed to visualize data from InfluxDB [5], a database designed for time-series data. The database is typically populated using Telegraf [6], a plugin-based system agent, which can collect data from a large number of different sources, including other databases. This is the authors’ version of the paper: L. Bulej, T. Bureˇ s, P. Hnˇ etynka, V. ˇ Camra, P. Siegl, M. T¨opfer. IVIS: Highly customizable framework for visualization and processing of IoT data. Proceedings of EUROMICRO SEAA 2020, Portoroˇ z, Slovenia, 2020. The final published version can be found at https://doi.org/10.1109/SEAA51224.2020.00095

Welcome message from author
This document is posted to help you gain knowledge. Please leave a comment to let me know what you think about it! Share it to your friends and learn new things together.
Transcript

IVIS: Highly customizable framework forvisualization and processing of IoT data
Lubomír Bulej, Tomáš Bureš, Petr Hnětynka, Václav Čamra, Petr Siegl, Michal TöpferCharles University, Faculty of Mathematics and Physics, Prague, Czech Republic
Email: {bulej, bures, hnetynka}@d3s.mff.cuni.cz
Abstract—This tool paper presents the IVIS platformfor processing and visualizing IoT and CPS data. Theplatform provides a web-based interface that allowsboth definition of complex visualizations and data pro-cessing jobs as well as exploring the data. Comparedto the existing open-source and commercial offerings,IVIS follows a different model and focuses on flexibil-ity. Instead of providing a complex administrative UIfor creating visualizations by dragging and droppingcomponents onto a dashboard, IVIS provides a setof JavaScript-based visualization components that areglued together using simple JavaScript code. Similarly,the data processing jobs can be defined using codein scripting languages, such as Python, which allowsexploiting the wealth of existing libraries for numericalprocessing. This not only makes the definition of visu-alizations and data processing jobs much more expres-sive, but it also turns out to be significantly easier touse when building complex parametric visualizations—especially when they need to deal with many sensors.This proved to be crucial in deploying IVIS in anumber of international research projects, because itenabled us to rapidly setup complex visualizations anddata-processing tasks, catering to project- and partner-specific requirements.
Index Terms—Visualization; data processing; cus-tomization; IoT.
I. IntroductionData processing and visualization have become an
increasingly important part of Internet-of-Things (IoT)and Cyber-Physical Systems (CPS) because the insightsgained from the data can enable a better understandingof the process being observed and allow taking the rightactions. Furthermore, as these systems gradually becomeself-adaptive, self-optimizing, and self-learning, there isa huge amount of data on the internal working of suchsystems which is critical for assessing whether they workcorrectly, and for finding ways for further improvements.However, even in this case, the first step in making senseof a huge amount of data is to visualize it.
Data visualization and processing are not new in the IoTand CPS domains—there are several existing and matureframeworks backed by industry, and we provide an overviewof the most important ones in Section II. However, we arguethat there is still room for a framework that puts flexibilityand a developer-oriented approach at the forefront to helpwith the high degree of customization required in IoTand CPS use cases. This allows developing and sharing
common core functionality across different projects and yetallow customizing the framework for each respective project(including various project-specific visualization components,data connectors to import data from project partners,integration to other project partners’ tools, etc.).
We also argue that project-level collaborations presenta use-case that is somewhat alien to existing data-visualization frameworks, which focus on making it easy foran end-user to create visualizations by dragging/droppingcommon components onto a dashboard. In collaborativeprojects, partners typically do not set up visualizations ontheir own and instead cooperate with a partner responsiblefor the visualization framework. In such a context, thereis little need for sophisticated and, from the developmentperspective, very costly graphical UI. Instead, it is moreimportant that the partner responsible for visualizationcan rapidly set up rather complex and very customizeddashboards (typically combining and aggregating datafrom several datasets). It is also necessary to allow thesedashboards to be easily cloned and modified because thefunctionality required by different partners will be similarin its core, but very different on the surface.
In this paper, we describe an open-source data visu-alization and processing framework (called IVIS), whichwe have been developing and employing as the core forvisualizations in various projects. In particular, we share ourexperience with employing IVIS in three different projects—focusing on (i) smart air quality, (ii) smart farming, and(iii) edge-cloud video processing.
II. Related workData visualization is not new, as is evident from the
number of available production-level offerings. Grafana [1]is among the most popular ones. It is an open-sourcevisualization and monitoring framework that can be con-nected with a multitude of data sources and provideattractive visualizations. A similar project, Kibana [2], is avisualization dashboard for ElasticSearch [3], a distributed,RESTful search and analytics engine suitable for largeamounts of data. Chronograf [4] is yet another solution forvisualization and monitoring, designed to visualize datafrom InfluxDB [5], a database designed for time-series data.The database is typically populated using Telegraf [6], aplugin-based system agent, which can collect data from alarge number of different sources, including other databases.
This is the authors’ version of the paper: L. Bulej, T. Bures, P. Hnetynka, V. Camra, P. Siegl, M. Topfer. IVIS: Highlycustomizable framework for visualization and processing of IoT data. Proceedings of EUROMICRO SEAA 2020, Portoroz,Slovenia, 2020.The final published version can be found at https://doi.org/10.1109/SEAA51224.2020.00095
There are also many smaller projects (such as FreeBoard,ThingsBoard, etc.) which provide similar functionality(custom data processing and visualization) in their scope,however, we do not aim to provide an exhaustive list anddetailed comparison in this short paper. We aim to pointout that in general, these projects allow users to quicklydesign monitoring dashboards using different kinds ofstandardized visualization widgets and charts (histograms,line graphs, pie charts, etc.). The focus of these projectsis to provide users with a user-friendly GUI that enablesinteractive placement and configuration of visualizationwidgets on the dashboard.
While this is very useful for layman users and commonvisualizations, such as system monitoring dashboards, ourexperience from several projects was that when aiming athighly customized expert-grade visualizations, the inter-active design soon becomes a limiting factor. Suddenly,it becomes very difficult to create charts that dynam-ically compute limits, conditionally display data basedon summary statistics, or show min-max bands arounda signal to give information about its fluctuations whendisplaying data aggregated over long periods. It turns outthat there is a need for visualization frameworks that maybe less forthcoming to layman users, but provide muchmore flexibility and enable rapid development of highlycustomized visualizations. The IVIS framework presentedin this paper is one such framework.
III. Main features
A. IVIS architecture
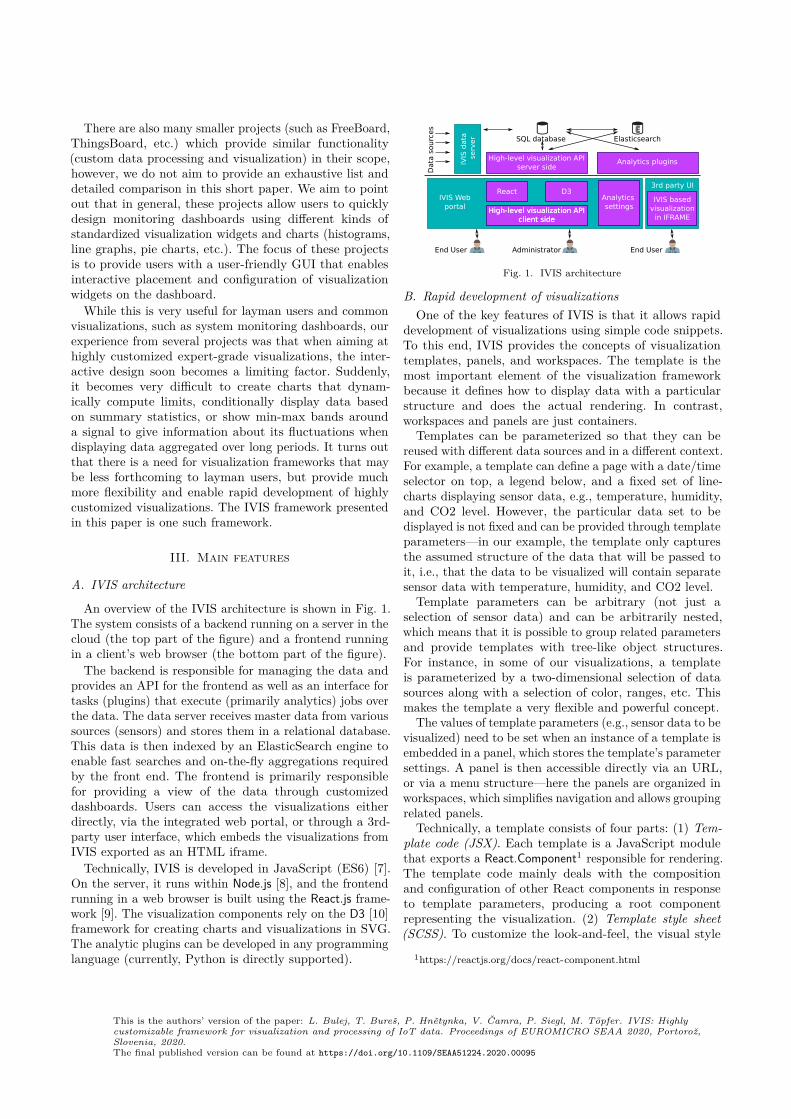
An overview of the IVIS architecture is shown in Fig. 1.The system consists of a backend running on a server in thecloud (the top part of the figure) and a frontend runningin a client’s web browser (the bottom part of the figure).
The backend is responsible for managing the data andprovides an API for the frontend as well as an interface fortasks (plugins) that execute (primarily analytics) jobs overthe data. The data server receives master data from varioussources (sensors) and stores them in a relational database.This data is then indexed by an ElasticSearch engine toenable fast searches and on-the-fly aggregations requiredby the front end. The frontend is primarily responsiblefor providing a view of the data through customizeddashboards. Users can access the visualizations eitherdirectly, via the integrated web portal, or through a 3rd-party user interface, which embeds the visualizations fromIVIS exported as an HTML iframe.
Technically, IVIS is developed in JavaScript (ES6) [7].On the server, it runs within Node.js [8], and the frontendrunning in a web browser is built using the React.js frame-work [9]. The visualization components rely on the D3 [10]framework for creating charts and visualizations in SVG.The analytic plugins can be developed in any programminglanguage (currently, Python is directly supported).
IVIS
data
se
rver
High-level visualization APIserver side
SQL databaseE
Elasticsearch
Analytics plugins
High-level visualization APIclient side
High-level visualization APIclient side
React D3Analytics settings
IVIS Webportal
3rd party UI
IVIS basedvisualization
in IFRAME
End User
Data
sourc
es
Administrator End User
Fig. 1. IVIS architecture
B. Rapid development of visualizationsOne of the key features of IVIS is that it allows rapid
development of visualizations using simple code snippets.To this end, IVIS provides the concepts of visualizationtemplates, panels, and workspaces. The template is themost important element of the visualization frameworkbecause it defines how to display data with a particularstructure and does the actual rendering. In contrast,workspaces and panels are just containers.
Templates can be parameterized so that they can bereused with different data sources and in a different context.For example, a template can define a page with a date/timeselector on top, a legend below, and a fixed set of line-charts displaying sensor data, e.g., temperature, humidity,and CO2 level. However, the particular data set to bedisplayed is not fixed and can be provided through templateparameters—in our example, the template only capturesthe assumed structure of the data that will be passed toit, i.e., that the data to be visualized will contain separatesensor data with temperature, humidity, and CO2 level.
Template parameters can be arbitrary (not just aselection of sensor data) and can be arbitrarily nested,which means that it is possible to group related parametersand provide templates with tree-like object structures.For instance, in some of our visualizations, a templateis parameterized by a two-dimensional selection of datasources along with a selection of color, ranges, etc. Thismakes the template a very flexible and powerful concept.
The values of template parameters (e.g., sensor data to bevisualized) need to be set when an instance of a template isembedded in a panel, which stores the template’s parametersettings. A panel is then accessible directly via an URL,or via a menu structure—here the panels are organized inworkspaces, which simplifies navigation and allows groupingrelated panels.
Technically, a template consists of four parts: (1) Tem-plate code (JSX). Each template is a JavaScript modulethat exports a React.Component1 responsible for rendering.The template code mainly deals with the compositionand configuration of other React components in responseto template parameters, producing a root componentrepresenting the visualization. (2) Template style sheet(SCSS). To customize the look-and-feel, the visual style
1https://reactjs.org/docs/react-component.html
This is the authors’ version of the paper: L. Bulej, T. Bures, P. Hnetynka, V. Camra, P. Siegl, M. Topfer. IVIS: Highlycustomizable framework for visualization and processing of IoT data. Proceedings of EUROMICRO SEAA 2020, Portoroz,Slovenia, 2020.The final published version can be found at https://doi.org/10.1109/SEAA51224.2020.00095
of a template can be defined using Sassy CSS [11], astyle sheet language that is compiled into CSS. Thestyle sheet is loaded along with the template and allowsdefining not only the template-specific styles but alsocompletely customizing the default styles provided by IVIS.(3) Template parameter specification comes in the formof a JSON object capturing the type and cardinality ofparameter values, as well as the structure of the parameterobject passed to a template. When instantiating a template,IVIS interprets the parameter specification and providesthe user with a simple editor for each template parameter.(4) Template assets are images and other files required forthe visualization.
To simplify the template code to the greatest extentpossible (without sacrificing expressiveness), IVIS providesa predefined set of reusable React components which pro-vide support for common types of charts (line/bar/pie/XY,histogram, scatter plot, heatmap, animated SVG) and basicinteraction elements (date/time selector, chart legend).All these components have been specifically developed toseamlessly interact with the IVIS server, and their behaviorcan be customized via properties. This allows, for instance,to partially or fully override the rendering of the legendor the tooltip in a line chart, add fixed or dynamicallycomputed reference lines to a chart, or dynamically changetext and colors in an SVG-based image.
The use of JavaScript for template definition (insteadof a visual UI) allows to easily create visualizations thatwork with many inputs or modify data on the fly (e.g., bycompleting missing values, shifting, rescaling, computingbounds)—all because iteration and conditional executioncan be easily expressed in JavaScript. Also, which is not tobe underestimated, visualizations can be easily cloned andcustomized (or stitched together from other visualizations)by simply copy-pasting fragments of the JavaScript code.
All this makes the development of complex visualiza-tions substantially easier for anyone with a rudimen-tary knowledge of JavaScript, compared to building acomplex parametric visualization using a visual editor.Our experience from several projects is that complexvisualizations always require someone with at least somelevel of technical knowledge and that the requirementof basic understanding of JavaScript and the ability toassemble pieces of JavaScript (from examples of othervisualizations) is typically not an obstacle.
A special feature of IVIS is that these templates aredefined using an integrated web-based editor. Introducing anew template, therefore, does not require any modificationto IVIS codebase and does not require the traditionaldevelopment-test-deployment cycle (which can take hourseven in a continuous integration/delivery pipeline, butinvariably more). This enables very rapid development anddeployment of visualizations.
Technically, to ensure sufficient performance, security,and to minimize the traffic between the server and theclient, the templates are compiled on the server, bundled
with the style sheet and (any) file assets, and servedon-demand as a minified JavaScript to the client, i.e.,only when the client wants to display a panel with theparticular template. This also allows a user to ensure thatthe template is syntactically correct when developing itusing the web-based editor provided by IVIS.
C. Rapid development of data processing tasksIn addition to receiving and storing master data from
sensors, IVIS allows computing synthetic data derived fromthe master data. This enables a variety of data manipula-tion operations ranging from simple data conditioning (e.g.,completing missing values, shifting, scaling) to complexfiltering (e.g., smoothing data with low-pass or band-passfilter, accentuating fluctuations with high-pass filters), dataaggregation, or forecasting and anomaly detection.
The synthetic data can be computed either offline oron-the-fly. On-the-fly computations are typically intendedfor lightweight tasks that do not require significant com-puting resources, i.e., simple aggregations and simple dataconditioning. To this end, IVIS leverages the ElasticSearchbackend which can perform on-the-fly computations veryefficiently and in a very scalable manner. In particular,IVIS allows defining synthetic data fields via its UI, withthe value of the field expressed as a code snippet writtenin the Painless scripting language [12]. IVIS passes thesesnippets to ElasticSearch when initiating a query on behalfof a particular visualization and lets ElasticSearch computethe synthetic data fields during the query.
Complex data processing tasks need to be performedoffline. They can be defined in Python (with the help ofvarious Python data processing libraries such as Numpyand Scipy) using a web-based UI provided by IVIS, similarlyto how visualization templates are defined. This againenables very rapid development and deployment of dataprocessing tasks. Offline data processing tasks are executedincrementally, only processing new data records since theprevious computation. The results of the computation arestored in ElasticSearch, making the computed data readilyavailable for use in visualizations.
IV. Main applicationsWe have successfully applied IVIS in several international
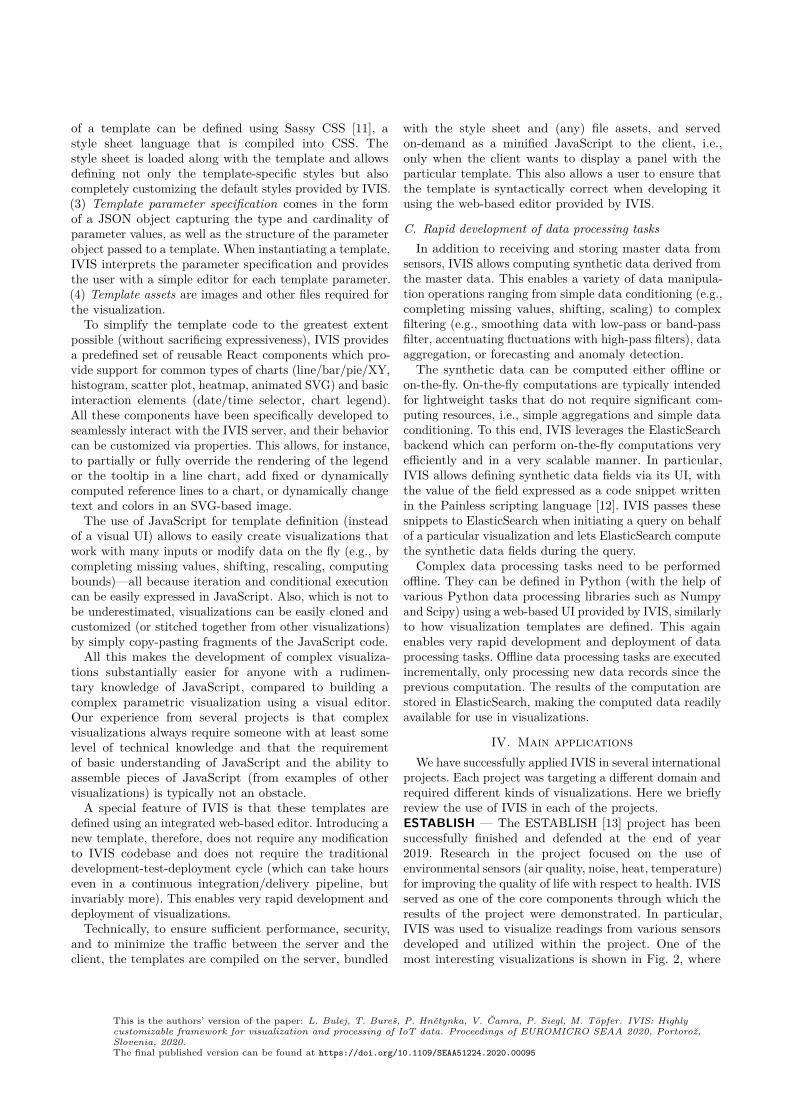
projects. Each project was targeting a different domain andrequired different kinds of visualizations. Here we brieflyreview the use of IVIS in each of the projects.ESTABLISH — The ESTABLISH [13] project has beensuccessfully finished and defended at the end of year2019. Research in the project focused on the use ofenvironmental sensors (air quality, noise, heat, temperature)for improving the quality of life with respect to health. IVISserved as one of the core components through which theresults of the project were demonstrated. In particular,IVIS was used to visualize readings from various sensorsdeveloped and utilized within the project. One of themost interesting visualizations is shown in Fig. 2, where
This is the authors’ version of the paper: L. Bulej, T. Bures, P. Hnetynka, V. Camra, P. Siegl, M. Topfer. IVIS: Highlycustomizable framework for visualization and processing of IoT data. Proceedings of EUROMICRO SEAA 2020, Portoroz,Slovenia, 2020.The final published version can be found at https://doi.org/10.1109/SEAA51224.2020.00095
data from several sensors are combined with user feedbackregarding satisfaction with perceived levels of differentquantities (temperature, humidity, noise).
Fig. 2. IVIS in ESTABLISH
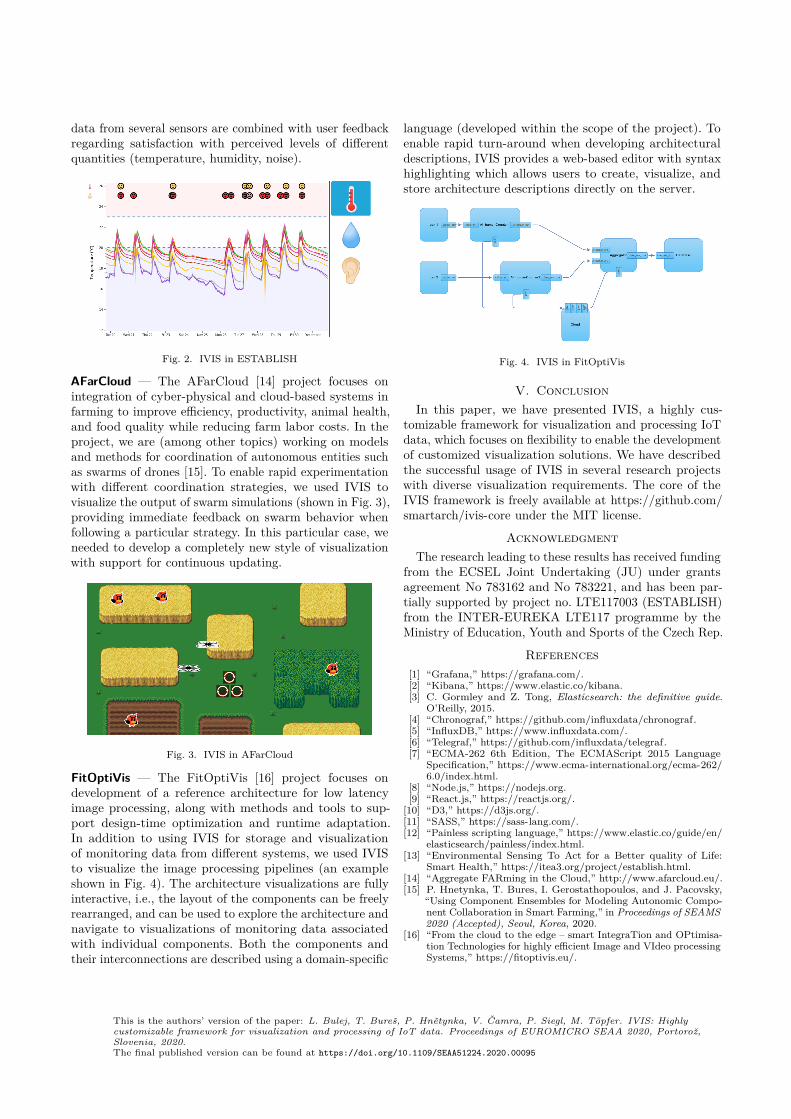
AFarCloud — The AFarCloud [14] project focuses onintegration of cyber-physical and cloud-based systems infarming to improve efficiency, productivity, animal health,and food quality while reducing farm labor costs. In theproject, we are (among other topics) working on modelsand methods for coordination of autonomous entities suchas swarms of drones [15]. To enable rapid experimentationwith different coordination strategies, we used IVIS tovisualize the output of swarm simulations (shown in Fig. 3),providing immediate feedback on swarm behavior whenfollowing a particular strategy. In this particular case, weneeded to develop a completely new style of visualizationwith support for continuous updating.
Fig. 3. IVIS in AFarCloud
FitOptiVis — The FitOptiVis [16] project focuses ondevelopment of a reference architecture for low latencyimage processing, along with methods and tools to sup-port design-time optimization and runtime adaptation.In addition to using IVIS for storage and visualizationof monitoring data from different systems, we used IVISto visualize the image processing pipelines (an exampleshown in Fig. 4). The architecture visualizations are fullyinteractive, i.e., the layout of the components can be freelyrearranged, and can be used to explore the architecture andnavigate to visualizations of monitoring data associatedwith individual components. Both the components andtheir interconnections are described using a domain-specific
language (developed within the scope of the project). Toenable rapid turn-around when developing architecturaldescriptions, IVIS provides a web-based editor with syntaxhighlighting which allows users to create, visualize, andstore architecture descriptions directly on the server.
Fig. 4. IVIS in FitOptiVis
V. ConclusionIn this paper, we have presented IVIS, a highly cus-
tomizable framework for visualization and processing IoTdata, which focuses on flexibility to enable the developmentof customized visualization solutions. We have describedthe successful usage of IVIS in several research projectswith diverse visualization requirements. The core of theIVIS framework is freely available at https://github.com/smartarch/ivis-core under the MIT license.
AcknowledgmentThe research leading to these results has received funding
from the ECSEL Joint Undertaking (JU) under grantsagreement No 783162 and No 783221, and has been par-tially supported by project no. LTE117003 (ESTABLISH)from the INTER-EUREKA LTE117 programme by theMinistry of Education, Youth and Sports of the Czech Rep.
References[1] “Grafana,” https://grafana.com/.[2] “Kibana,” https://www.elastic.co/kibana.[3] C. Gormley and Z. Tong, Elasticsearch: the definitive guide.
O’Reilly, 2015.[4] “Chronograf,” https://github.com/influxdata/chronograf.[5] “InfluxDB,” https://www.influxdata.com/.[6] “Telegraf,” https://github.com/influxdata/telegraf.[7] “ECMA-262 6th Edition, The ECMAScript 2015 Language
Specification,” https://www.ecma-international.org/ecma-262/6.0/index.html.
[8] “Node.js,” https://nodejs.org.[9] “React.js,” https://reactjs.org/.
[10] “D3,” https://d3js.org/.[11] “SASS,” https://sass-lang.com/.[12] “Painless scripting language,” https://www.elastic.co/guide/en/
elasticsearch/painless/index.html.[13] “Environmental Sensing To Act for a Better quality of Life:
Smart Health,” https://itea3.org/project/establish.html.[14] “Aggregate FARming in the Cloud,” http://www.afarcloud.eu/.[15] P. Hnetynka, T. Bures, I. Gerostathopoulos, and J. Pacovsky,
“Using Component Ensembles for Modeling Autonomic Compo-nent Collaboration in Smart Farming,” in Proceedings of SEAMS2020 (Accepted), Seoul, Korea, 2020.
[16] “From the cloud to the edge – smart IntegraTion and OPtimisa-tion Technologies for highly efficient Image and VIdeo processingSystems,” https://fitoptivis.eu/.
This is the authors’ version of the paper: L. Bulej, T. Bures, P. Hnetynka, V. Camra, P. Siegl, M. Topfer. IVIS: Highlycustomizable framework for visualization and processing of IoT data. Proceedings of EUROMICRO SEAA 2020, Portoroz,Slovenia, 2020.The final published version can be found at https://doi.org/10.1109/SEAA51224.2020.00095
Related Documents