Contingency Tables and the Chi Square Statistic Interpreting Computer Printouts and Constructing Tables

Welcome message from author
This document is posted to help you gain knowledge. Please leave a comment to let me know what you think about it! Share it to your friends and learn new things together.
Transcript
Contingency Tables
and the Chi Square
Statistic
Interpreting Computer
Printouts and
Constructing Tables
Contingency Tables/Chi Square
Statistics
• What are they?
A contingency table is a table that shows the
relationship between two categorical variables.
The Chi-square statistic reflects the strength of this
relationship. All else equal, the greater the chi-square
statistic, the stronger the relationship. The chi square
statistic is usually reported at the bottom of a
contingency table.
The probability associated with the chi-square statistic
indicates the probability that you would be incorrect if
you were to assert that there is a relationship between
these same two variables in the population from which
you drew your sample.
Contingency Tables/Chi Square
Statistics
• Why should you be able to interpret a contingency table and chi-square statistic?
If you are submitting an article for publication in a peer
reviewed journal you may use a contingency table. You want to interpret it accurately.
Before you implement a program, you want to review the literature and read about the same or similar programs. These articles may contain contingency tables. You want to be a wise consumer of information.
If you are evaluating your own program, it is likely that you will use contingency tables. Contingency tables can not only help you discern if your program is working, but how effective it is and/or if the effectiveness varies by such factors as gender, race, etc.
Before you make recommendations or engage in political advocacy, you want empirical evidence to substantiate your claims. Contingency tables can be used to provide this evidence.
Contingency Tables/Chi Square
Statistics
• When would you use them?
• Contingency tables and the corresponding chi-square
statistic is very useful for those implementing programs, and should be used BEFORE important decisions are made.
• Any responsible extension employee would use correctly implemented evaluation research to evaluate their programs and measure their objectives. Properly interpreted Chi square statistics can be an important part of that evaluation.
• When applying for grants to support existing programs, it is a good idea to use statistics to validate claims that the program “works.” Chi square can be one of these statistics.
• When justifying grant monies spent on programs, evaluation research should be used. Responsible administrators should use accurate statistics to provide evidence that their objectives were met.
Examples of When to Use Them
• You should use contingency tables and chi
square statistics:
• BEFORE you use any Intervention, so you can determine if
there is evidence that it will work and for whom it will work.
• For instance – You should be able to interpret contingency
tables reported in the literature that have been used to
evaluate similar programs. You want to know if there is
evidence that a program like yours will work, and what factors
could influence its effectiveness.
• BEFORE implementing and/or continuing any program, so you
will know if it’s worth your continued time and effort.
• For instance - Is the percent of students who received an A in
school greater for those who belonged to your 4-H program
relative to those who did not?
• For instance - What factors are most important when
attempting to increase the effectiveness of this intervention?
• For instance - What percent of those involved in intervention 1
saw the program as effective compared to the percent
involved in intervention 2.
Examples of When to Use Them
• BEFORE you report the results of your evaluation and/or make
recommendations, so you can accurately explain the risks and
probabilities.
• For instance – If having access to computers related to scores
on standardized tests, then (1) Are scores on standardized
tests related to academic achievement, and (2) How many
computers must you purchase to see a significant gain in
standardized test scores for this group?
• For instance - What percent of your clients experienced
increased economic stress after paying to participate in your
program? Does this economic stress outweigh benefits?
• For instance, Can you identify the most important factors in
your program? If you were forced to curtail activities which
activities could you eliminate without significantly decreasing
positive outcomes for your participants?
Assumptions of Chi Square
The statistics generated by the computer for chi-
square are only valid if the data meet the following
qualifications:
Both the independent and dependent variables are
categorical.*
Researchers used a random sample to collect data.
Researchers had an adequate sample size.
Generally the sample size should be at least 100.
The number of respondents in each cell should be at
least 5. If not, you can use a Fisher’s Exact or other
tests.
*Generally the number of categories is somewhere between 3 and 7.
More than 7 categories can be overwhelming and confusing to the
reader.
Contingency Tables/Chi Square
Statistics
• How do you interpret them?
• There are two parts of a contingency table that you must
correctly interpret:
• The chi square statistic
• The numbers in the table
Contingency Tables/Chi Square
Statistics
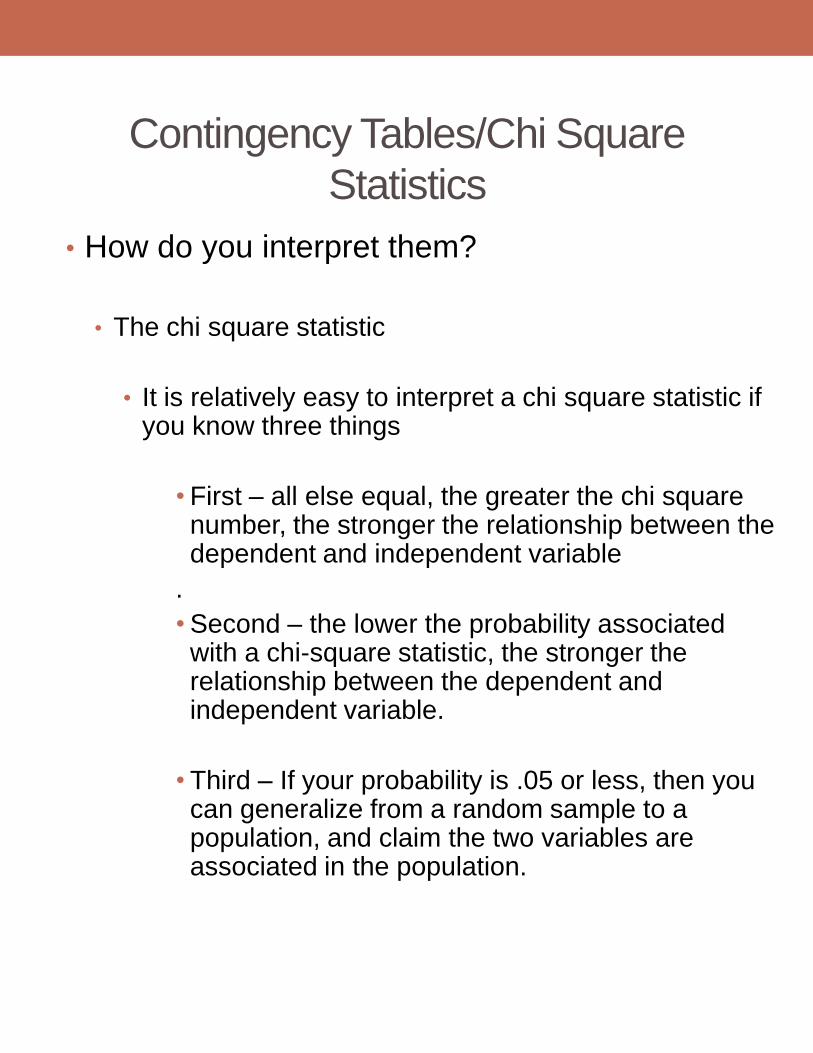
• How do you interpret them?
• The chi square statistic
• It is relatively easy to interpret a chi square statistic if you know three things
• First – all else equal, the greater the chi square number, the stronger the relationship between the dependent and independent variable
.
• Second – the lower the probability associated with a chi-square statistic, the stronger the relationship between the dependent and independent variable.
• Third – If your probability is .05 or less, then you can generalize from a random sample to a population, and claim the two variables are associated in the population.
Contingency Tables/Chi Square
Statistics
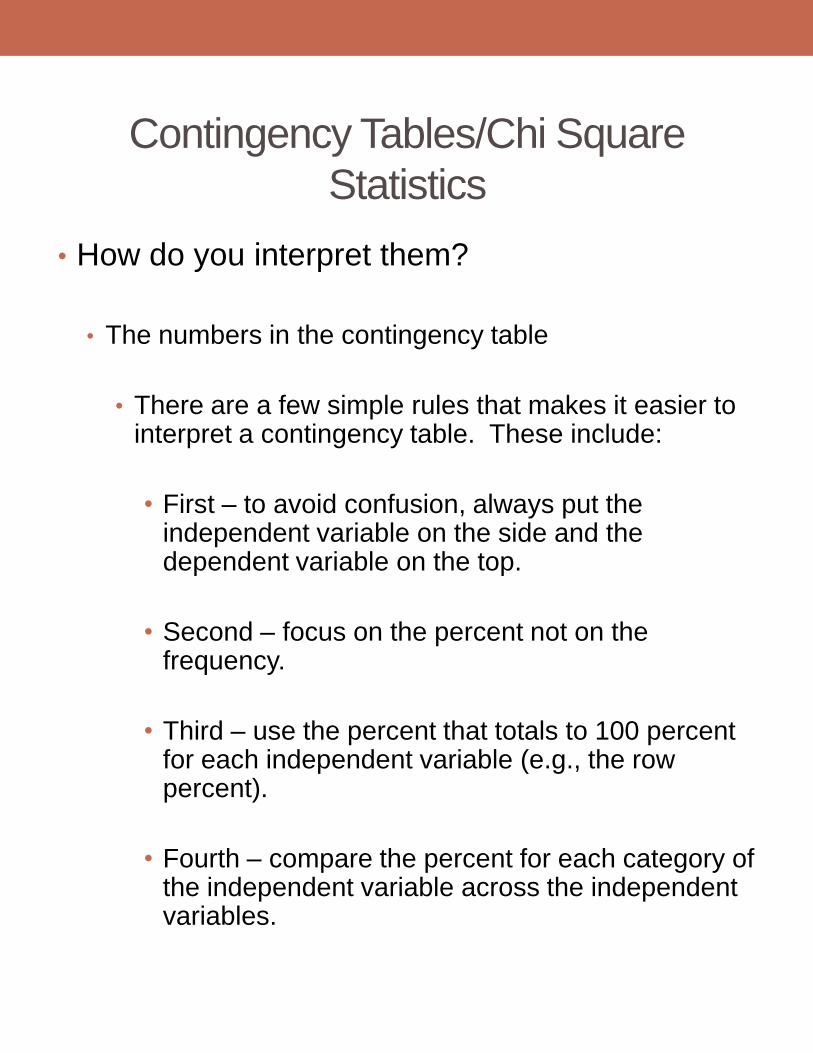
• How do you interpret them?
• The numbers in the contingency table
• There are a few simple rules that makes it easier to interpret a contingency table. These include:
• First – to avoid confusion, always put the independent variable on the side and the dependent variable on the top.
• Second – focus on the percent not on the frequency.
• Third – use the percent that totals to 100 percent for each independent variable (e.g., the row percent).
• Fourth – compare the percent for each category of the independent variable across the independent variables.
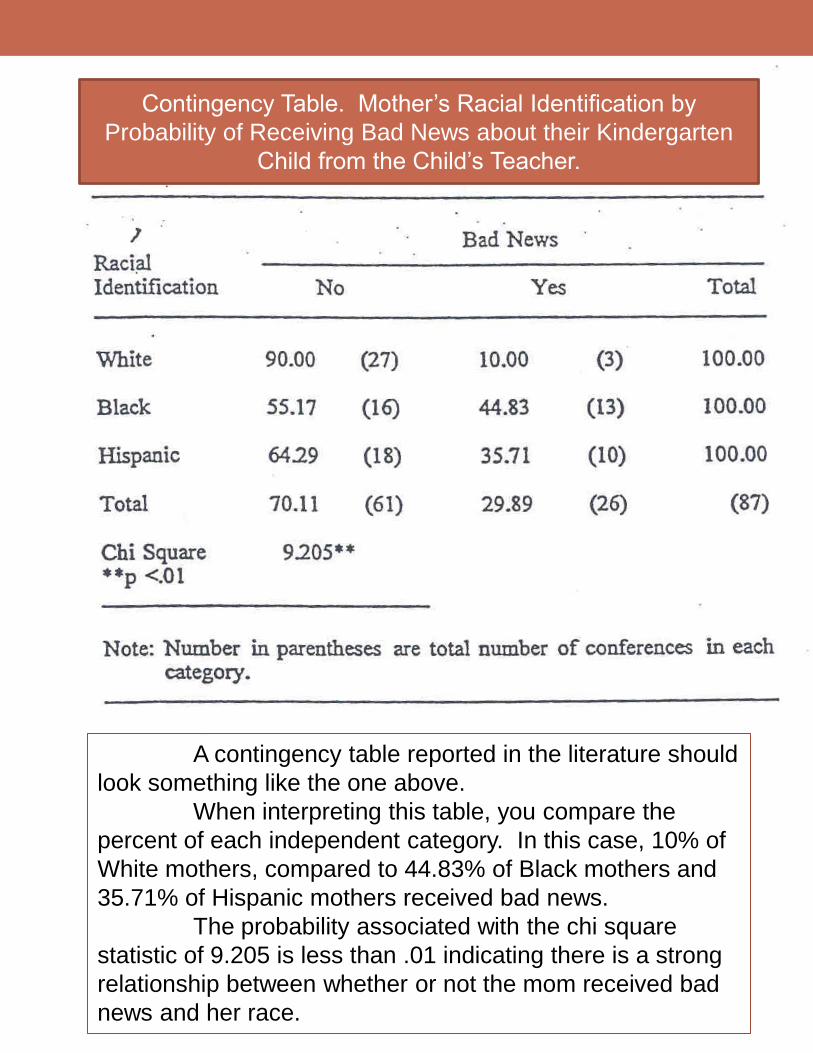
A contingency table reported in the literature should
look something like the one above.
When interpreting this table, you compare the
percent of each independent category. In this case, 10% of
White mothers, compared to 44.83% of Black mothers and
35.71% of Hispanic mothers received bad news.
The probability associated with the chi square
statistic of 9.205 is less than .01 indicating there is a strong
relationship between whether or not the mom received bad
news and her race.
Contingency Table. Mother’s Racial Identification by
Probability of Receiving Bad News about their Kindergarten
Child from the Child’s Teacher.
Computer Printouts
• How do you Interpret them?
• How do you construct a table from a computer
printout?
• How do you construct and interpret a bar chart
from a contingency table?
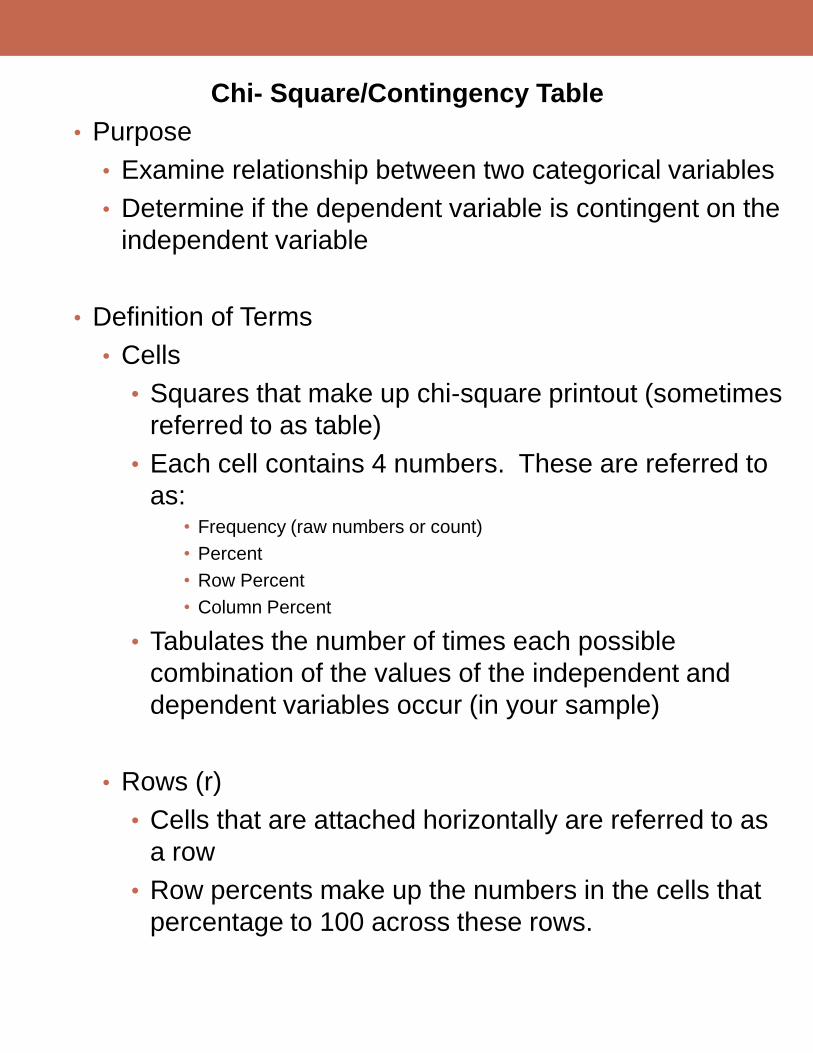
Chi- Square/Contingency Table
• Purpose
• Examine relationship between two categorical variables
• Determine if the dependent variable is contingent on the
independent variable
• Definition of Terms
• Cells
• Squares that make up chi-square printout (sometimes
referred to as table)
• Each cell contains 4 numbers. These are referred to
as: • Frequency (raw numbers or count)
• Percent
• Row Percent
• Column Percent
• Tabulates the number of times each possible
combination of the values of the independent and
dependent variables occur (in your sample)
• Rows (r)
• Cells that are attached horizontally are referred to as
a row
• Row percents make up the numbers in the cells that
percentage to 100 across these rows.
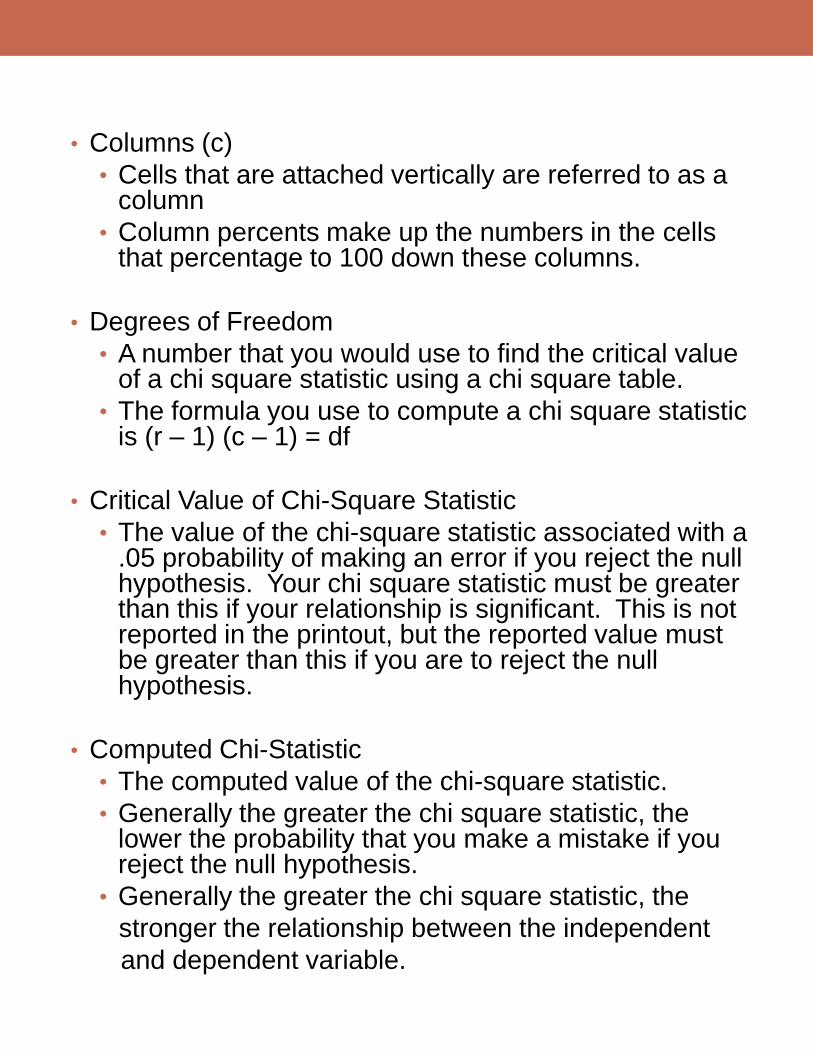
• Columns (c)
• Cells that are attached vertically are referred to as a column
• Column percents make up the numbers in the cells that percentage to 100 down these columns.
• Degrees of Freedom
• A number that you would use to find the critical value of a chi square statistic using a chi square table.
• The formula you use to compute a chi square statistic is (r – 1) (c – 1) = df
• Critical Value of Chi-Square Statistic
• The value of the chi-square statistic associated with a .05 probability of making an error if you reject the null hypothesis. Your chi square statistic must be greater than this if your relationship is significant. This is not reported in the printout, but the reported value must be greater than this if you are to reject the null hypothesis.
• Computed Chi-Statistic
• The computed value of the chi-square statistic.
• Generally the greater the chi square statistic, the lower the probability that you make a mistake if you reject the null hypothesis.
• Generally the greater the chi square statistic, the
stronger the relationship between the independent
and dependent variable.
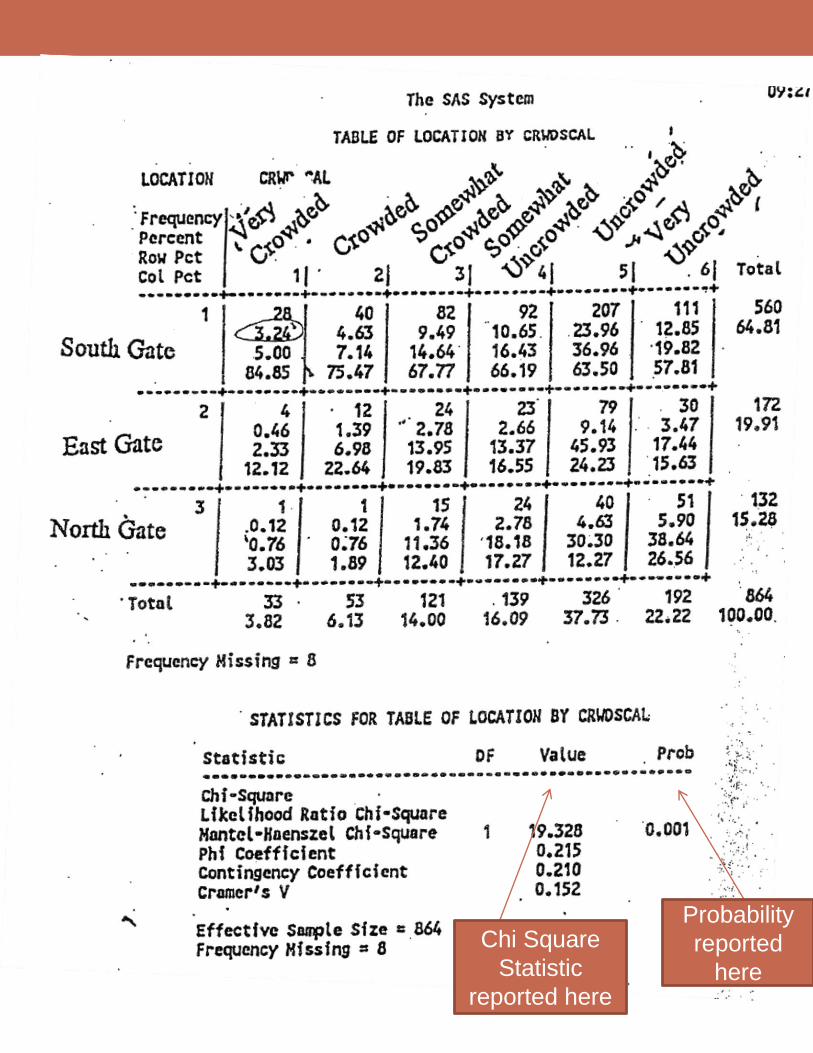
Chi Square
Statistic
reported here
Probability
reported
here
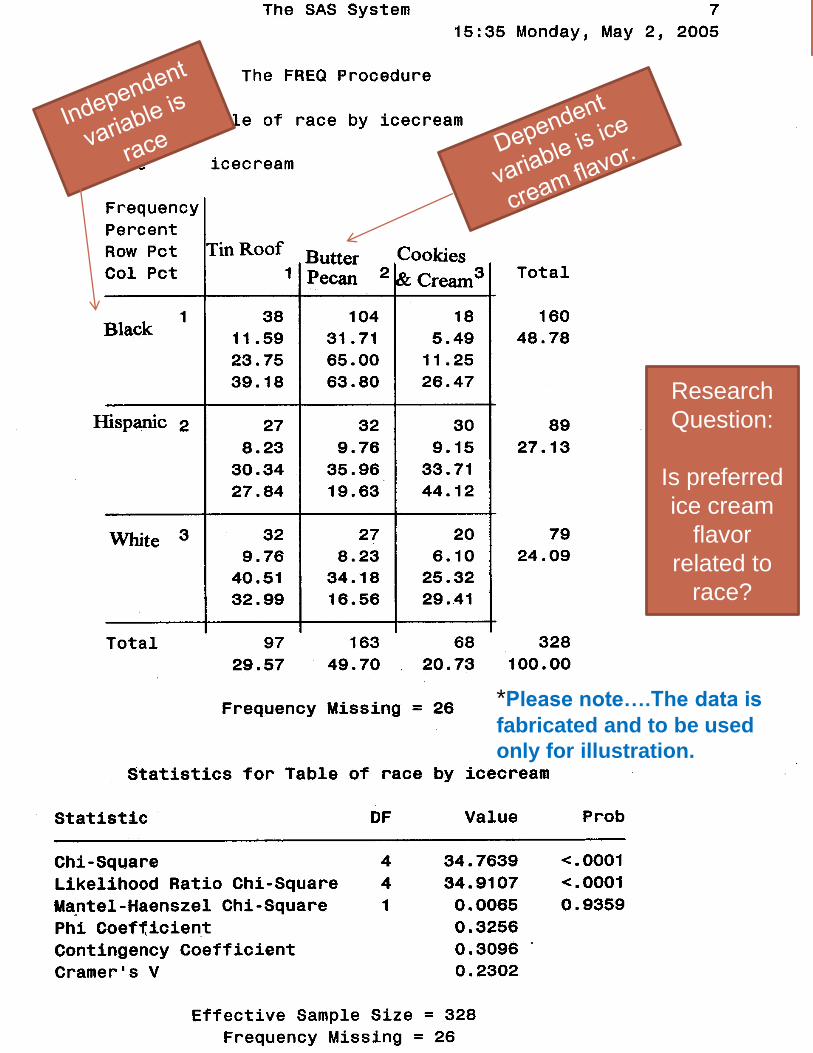
Research
Question:
Is preferred
ice cream
flavor
related to
race?
*Please note….The data is
fabricated and to be used
only for illustration.
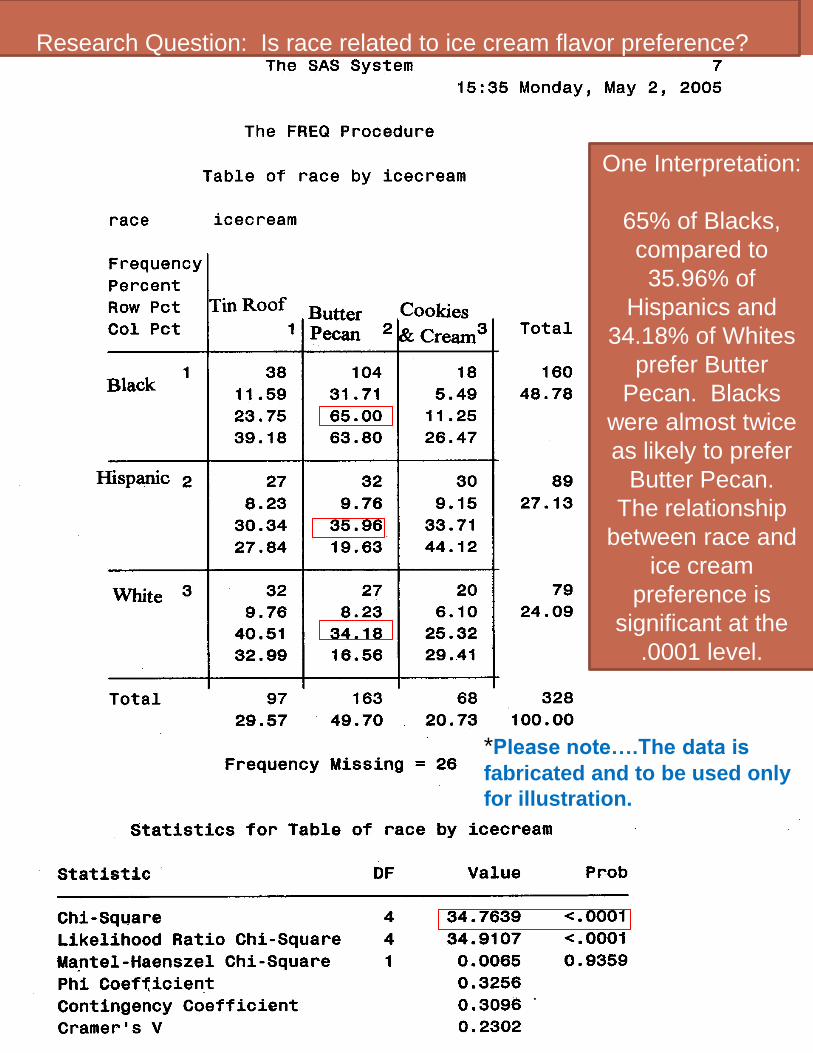
Research Question: Is race related to ice cream flavor preference?
*Please note….The data is
fabricated and to be used only
for illustration.
One Interpretation:
65% of Blacks,
compared to
35.96% of
Hispanics and
34.18% of Whites
prefer Butter
Pecan. Blacks
were almost twice
as likely to prefer
Butter Pecan.
The relationship
between race and
ice cream
preference is
significant at the
.0001 level.
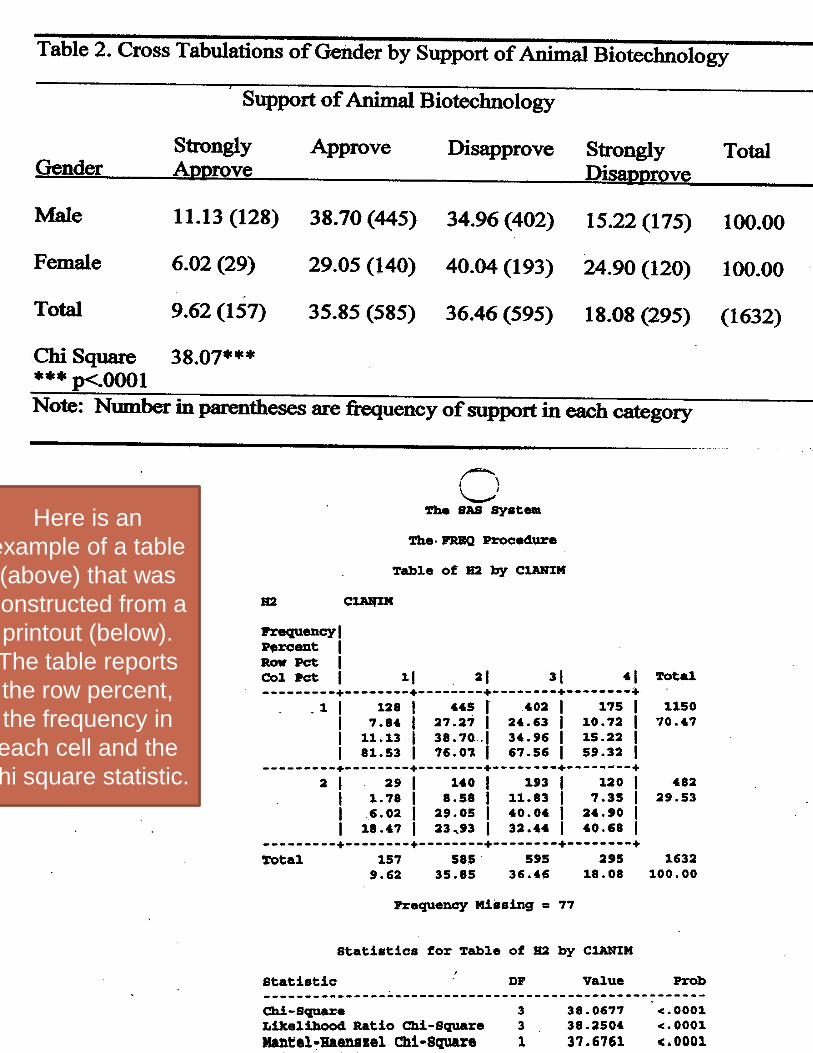
Here is an
example of a table
(above) that was
constructed from a
printout (below).
The table reports
the row percent,
the frequency in
each cell and the
chi square statistic.
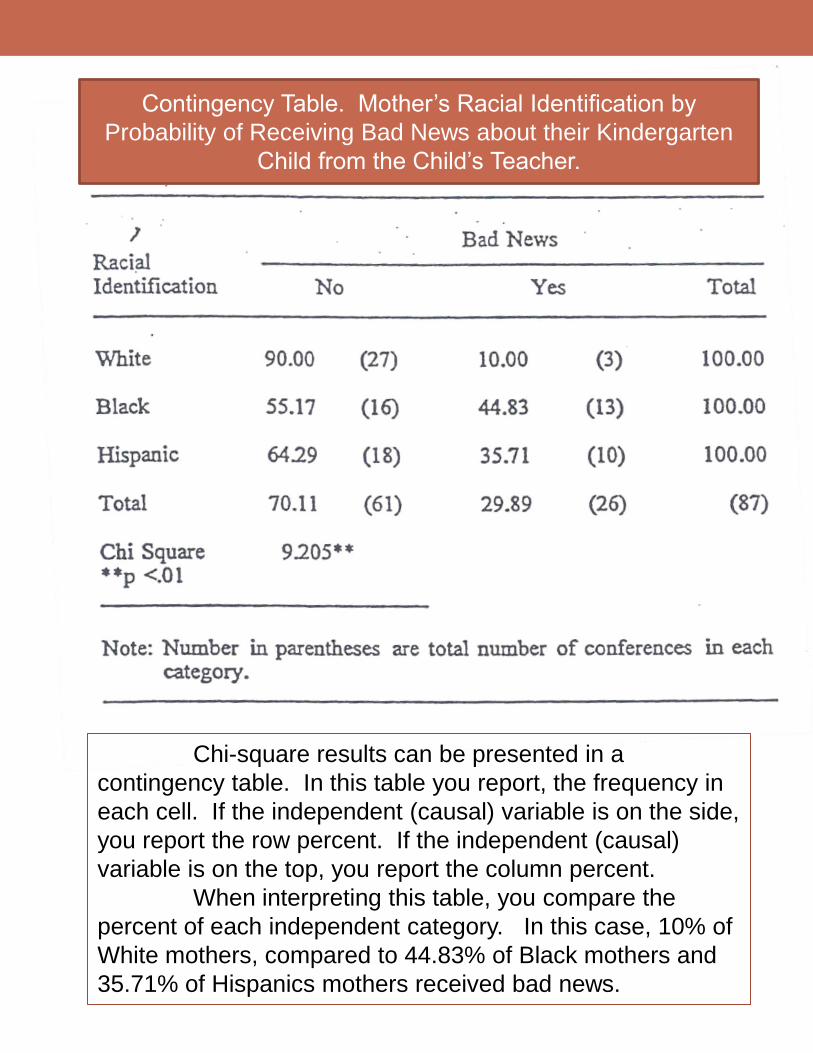
Chi-square results can be presented in a
contingency table. In this table you report, the frequency in
each cell. If the independent (causal) variable is on the side,
you report the row percent. If the independent (causal)
variable is on the top, you report the column percent.
When interpreting this table, you compare the
percent of each independent category. In this case, 10% of
White mothers, compared to 44.83% of Black mothers and
35.71% of Hispanics mothers received bad news.
Contingency Table. Mother’s Racial Identification by
Probability of Receiving Bad News about their Kindergarten
Child from the Child’s Teacher.
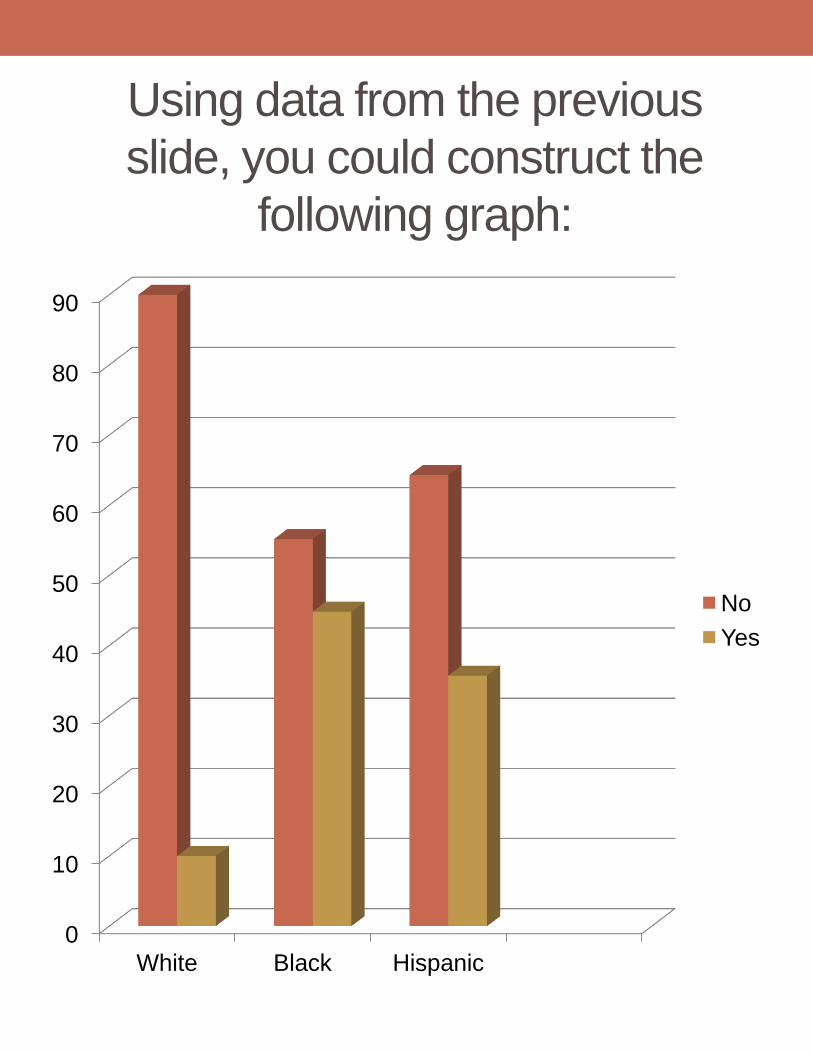
Using data from the previous
slide, you could construct the
following graph:
0
10
20
30
40
50
60
70
80
90
White Black Hispanic
No
Yes
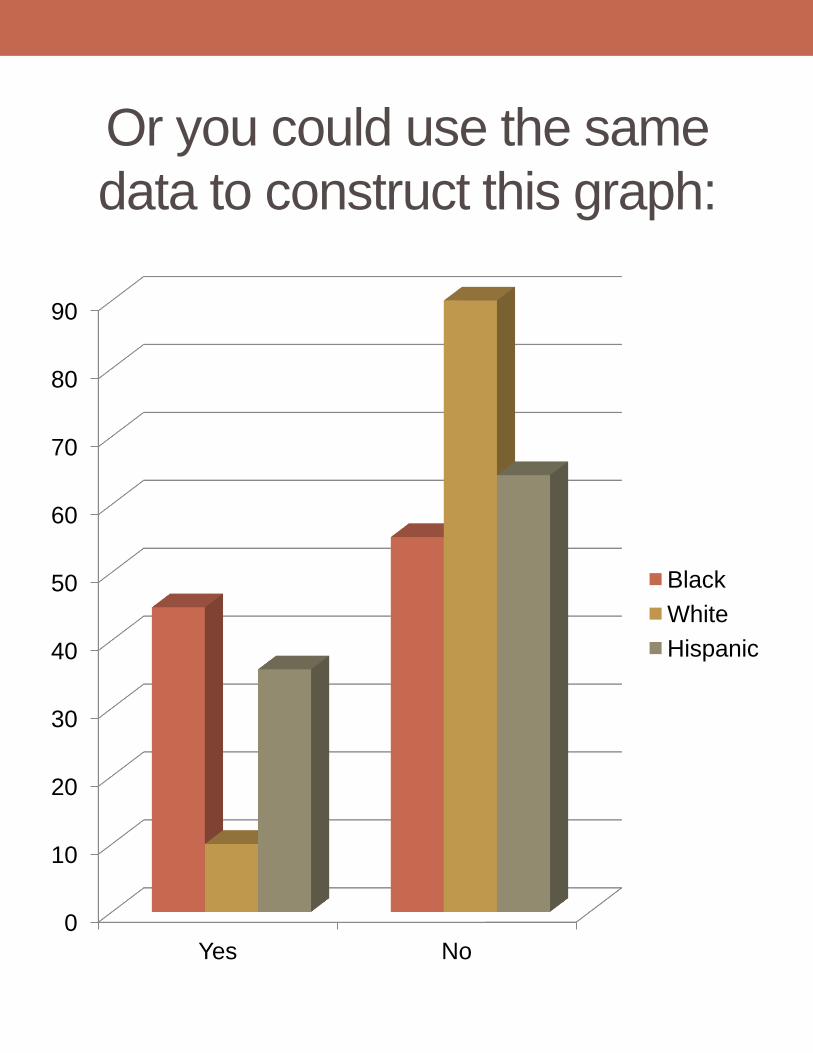
Or you could use the same
data to construct this graph:
0
10
20
30
40
50
60
70
80
90
Yes No
Black
White
Hispanic
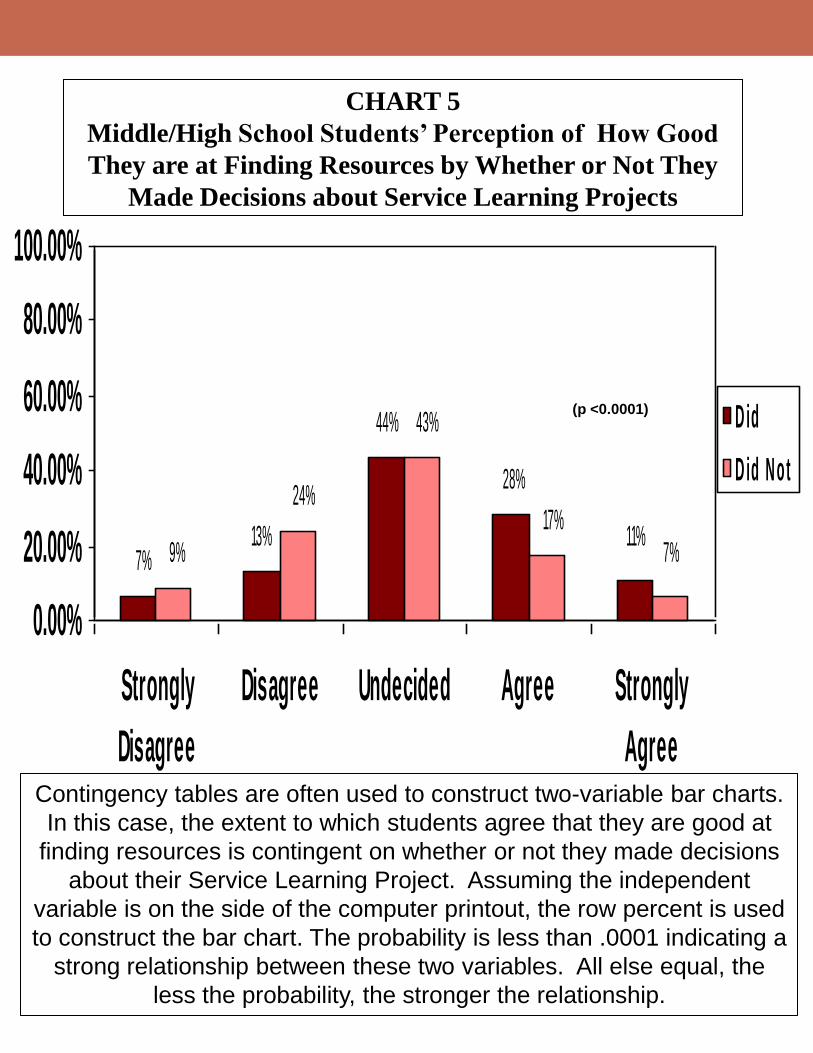
CHART 5
Middle/High School Students’ Perception of How Good
They are at Finding Resources by Whether or Not They
Made Decisions about Service Learning Projects
11%7%
28%
7%13%
44%
17%
43%
9%
24%
0.00%
20.00%
40.00%
60.00%
80.00%
100.00%
Strongly
Disagree
Disagree Undecided Agree Strongly
Agree
D id
D id N ot
(p <0.0001)
Contingency tables are often used to construct two-variable bar charts.
In this case, the extent to which students agree that they are good at
finding resources is contingent on whether or not they made decisions
about their Service Learning Project. Assuming the independent
variable is on the side of the computer printout, the row percent is used
to construct the bar chart. The probability is less than .0001 indicating a
strong relationship between these two variables. All else equal, the
less the probability, the stronger the relationship.
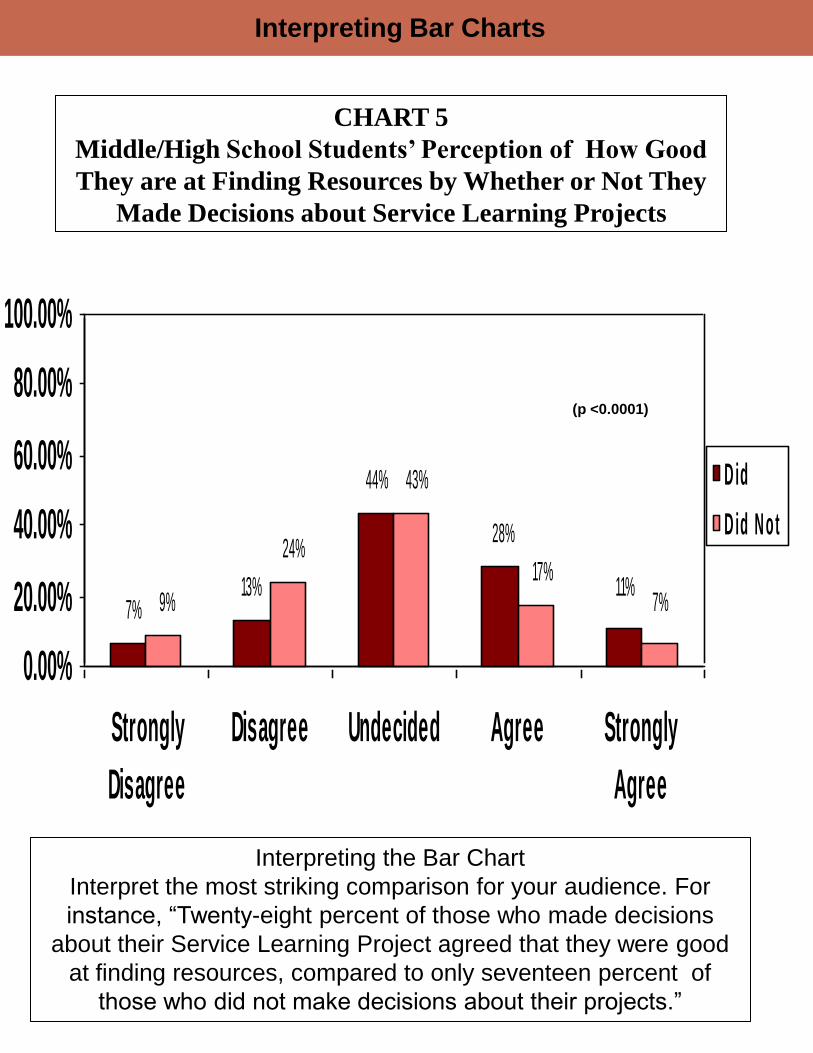
CHART 5
Middle/High School Students’ Perception of How Good
They are at Finding Resources by Whether or Not They
Made Decisions about Service Learning Projects
11%7%
28%
7%13%
44%
17%
43%
9%
24%
0.00%
20.00%
40.00%
60.00%
80.00%
100.00%
Strongly
Disagree
Disagree Undecided Agree Strongly
Agree
D id
D id N ot
(p <0.0001)
Interpreting the Bar Chart
Interpret the most striking comparison for your audience. For
instance, “Twenty-eight percent of those who made decisions
about their Service Learning Project agreed that they were good
at finding resources, compared to only seventeen percent of
those who did not make decisions about their projects.”
Interpreting Bar Charts
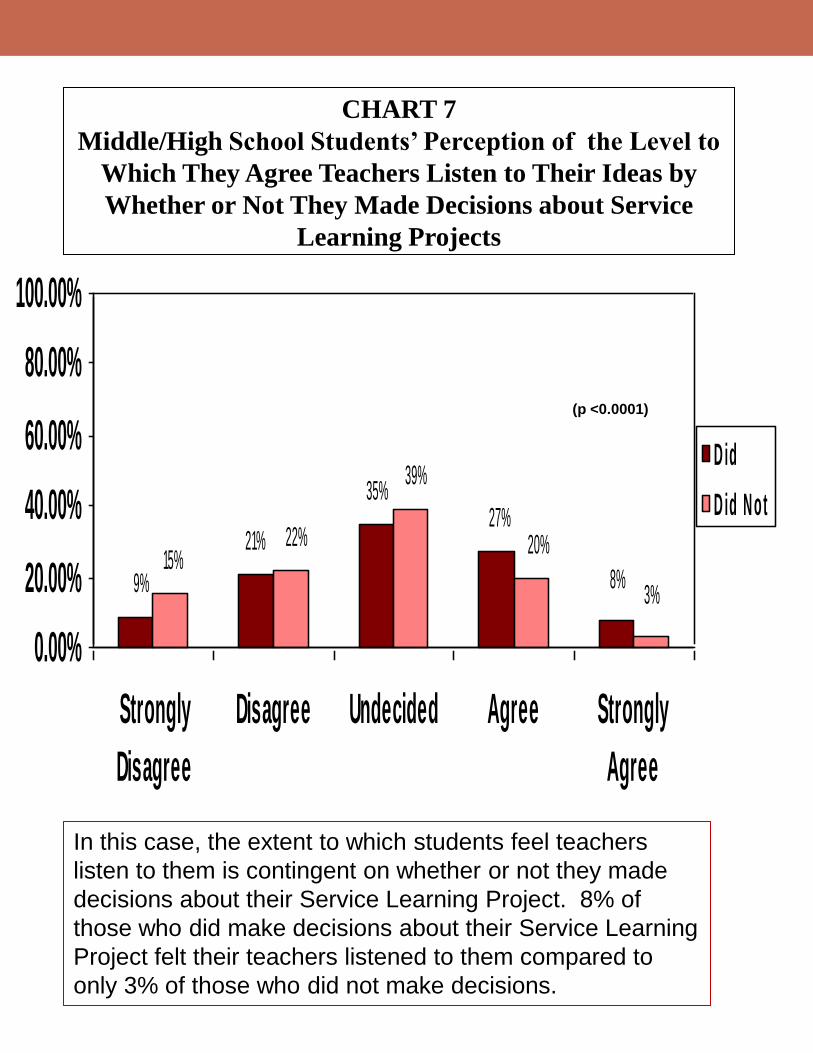
CHART 7
Middle/High School Students’ Perception of the Level to
Which They Agree Teachers Listen to Their Ideas by
Whether or Not They Made Decisions about Service
Learning Projects
8%3%
27%
9%
21%
35%
20%
39%
15%22%
0.00%
20.00%
40.00%
60.00%
80.00%
100.00%
Strongly
Disagree
Disagree Undecided Agree Strongly
Agree
D id
D id N ot
(p <0.0001)
In this case, the extent to which students feel teachers
listen to them is contingent on whether or not they made
decisions about their Service Learning Project. 8% of
those who did make decisions about their Service Learning
Project felt their teachers listened to them compared to
only 3% of those who did not make decisions.

Contact Information
• Dr. Carol Albrecht
• Assessment Specialist
• USU Extension
• 979-777-2421
Related Documents


![Chi square[1]](https://static.cupdf.com/doc/110x72/54933c70b479596e358b4594/chi-square1.jpg)