INTEGRATED RURAL ENERGY DECISLON SUPPORT SYSTEM by Shaligram Pokharel A thesis presented to the University of Waterloo in fulfilment of the thesis requirement for the degree of Doctor of Philosophy in Systems Design Engineering Waterloo, Ontario, Canada, 1997

Welcome message from author
This document is posted to help you gain knowledge. Please leave a comment to let me know what you think about it! Share it to your friends and learn new things together.
Transcript

INTEGRATED RURAL
ENERGY DECISLON SUPPORT SYSTEM
by
Shaligram Pokharel
A thesis
presented to the University of Waterloo
in fulfilment of the
thesis requirement for the degree of
Doctor of Philosophy
in
Systems Design Engineering
Waterloo, Ontario, Canada, 1997

National Library 191 of Canada Bibliothèque nationale du Canada
Acquisitions and Acquisitions et Bibtiographic Services services bibliographiques
395 Weijington Street 395. rue Wellington Ottawa ON K I A ON4 Ottawa ON K1A ON4 Canada Canada
The author has granted a non- L'auteur a accordé une licence non exclusive licence allowing the exclusive permettant à la National Library of Canada to Bibliothèque nationale du Canada de reproduce, loan, distribute or sel1 reproduire, prêter, distribuer ou copies of this thesis in microform, vendre des copies de cette thèse sous paper or electronic formats. la fome de microfiche/^ de
reproduction sur papier ou sur format électronique.
The author retains ownership of the L'auteur conserve la propdté du copyright in this thesis. Neither the droit d'auteur qui protège cette thèse. thesis nor substantial extracts fiom it Ni la thèse ni des extraits substantiels may be printed or otherwise de celle-ci ne doivent être imprimés reproduced without the author's ou autrement reproduits sans son permission. autorisation.

The University of Waterloo requires the signatures of al1 persons using or
photocopying this thesis. Please sign below, and give address and date.
(iii)

INTEGRATED R U U L
ENERGY DECISION SUPPORT SYSTEM
Abstract
Rural areas in developing countries face severe energy problems. At some places,
this problem is addressed by ad-hoc policies, which in many instances lack
continuity. The Iack of both energy data and the capability to analyse energy
options for a given planning area have been the primary causes for
misrepresentation of rural energy problems.
In this research, a systematic approach for analysing energy situations using
a decision support system is proposed. The approach combines a geographical
information system and a multiobjective programming method. A geographical
information system helps in database management and multiobjective
programmirtg helps in the analysis of conflicting objectives such as cost, efficiency,
environment, and equity.
The proposed system is applied to a rural region and two cases are studied.
Ten energy options are discussed and resource allocations are shown for a few of
these options. By knowing the resource allocation and evaluating their
implementation possibility, the decision makers are expected to be in a position to

choose a better option for the planning area.
The resdts obtained for the study area indicate that the emphasis should be
put on the distribution of efficient fuelwood stoves and exploitation of local energy
resources. Any deficit in energy supply thereafter should be met with imported
energy sources such as grid electricity and kerosene. The result also indicate that
if &e proposed energy allocation codd be implernented, then it can provide rural
employment and provides an opportunity to encourage interfuel substitution in the
planning area.

Acknowledgements
1 talce this opportunity to acknowledge constant encouragement, suggestions,
stimulating discussions, and support provided bv my s u p e ~ s o r Prof- M.
Chandrashekar during the course of this study and the preparation of this
dissertation.
1 want to thank my Dissertation Examination Cornmittee members, Profs
P. H. Calamai, D. Dudycha, J.D. Fuller, and G. J. Savage for providing me with
valuable comments. I also wish to acknowledge Prof. I . r k R Smith, from
University of California, Berkeley for evaiuating mv thesis as an Extemal
Examiner and providing me ~ i t h valuable comments.
1 would lile to thank my wife, Shrija, for understanding the nature of rnv
work and providing me wvith al1 the support. I want to thank mv son, Shamil,
who sacrificed his Sunday swimrning lessons dunng the preparation of this
dissertation.
My parents, Mr. Maniram and Mrs. Krishna Kumari, and my parents-in-
law, Dr. S. R Sharma and Mrs. Urmila Dhungel always encouraged me to work
for the better. 1 wish to thank them for their constant love and support in m y
everyday life.
I also wish to acknowledge Mr. S. N. Upadhyay, Dr. H. M. Shrestha, Dr.

G. R. Bhatta, Dr. D.N. Dhungel, and Mr. J.A. Nugent, who encouraged me to
join PhD program here at Waterloo.
1 wish to thank many individuals and offiaals from the watershed for
cordially inviting me to their houses and offices, listening to my ideas, and
providing me with information.
1 wish to thanlc my colleagues, Dr. D. Rowbotham for helping me to locate
the information on Phelvatal watershed and Ms. RC. Neudoerffer for reviewing
the draft of the thesis and mdung editorial suggestions.
Partial funding for this research \vas obtained From NSERC in the form of
Research Assistantship. The researcher also benefitted h-om the NSERC hnded
equipment for the analysis. T h e use of ARUNFO" for the spatial analysis in this
thesis \vas made possible, in part, bv the cooperative agreement between the
University of Waterloo and Environmental Svstem Research Institute (ESRI,
Canada) Ltd.
(vii )

My daughter Selene
My inspiration for a steady work.
(viii)
INTEGRAED RURAL
ENERGY DECISION SUPPORT SYSTEM
TABLE OF CONTENTS
Contenfs
Abstract Acknowledgements List of Tables List of Figures Acronyms
1.0 INTRODUCTION 1.1 Energy Planning Practice 1.2 Energy Modelling
1.2.1 Supply onen ted models 1.2.2 Demand orien ted models
1.3 Rural Areas and Energy 1.4 Energy Resources
1.4.1 Fuelwood 1.4.2 Charcoal 1.4.3 Crop residues 1.4.4 Animal manure 1.4.5 Hydropower 1.4.6 Solar energy 1.4.7 Wind energy 1.4.8 Biogas 1.4.9 Petroleum products
1.5 Energy Consumption Pattern 1.5.1 Cooking 1.5.2 Lighting 1.5.3 Space heating 1.5.4 Food processing 1.5.5 Other household uses
1.6 Multiobjective Decision Making 1.7 Thesis Organization
OBJECTrVES AND CONTRIBmONs 2.1 Purpose and Scope 2.2 Objectives 2.3 Contributions
TOOLS FOR DECISION SUPPORT 3.1 Mdtiobjective Prograrnming 3.2 MOP Solution Techniques
3.2.1 Generating tediniques 3.2.2 Preference-based techniques
3.3 The STEP-Method 3.4 Geographical Information System 3.5 GIS and Decision Support System 3.6 Energy Policy Formulation
ANALYSE METHODOLOGY The Spatial Model The Multiobjective Model 4.2.1 Energy planning objectives
a) Economic objectives b) Equity objective C) Environmental objective
4.2.2 The Constraints a) Sustainable supply of energy resources b) Energy demand C) Lirnit on technology dl Limit on external energy supply
Sensitivity Anaiysis The Decision Support System Model
DATA COLLECTION 5.1 Spatial Information
5.1.1 Clirnate 5.1 -2 Drainage S ys tem 5.1.3 Land use pattern 5.1.4 Demography 5.1.5 Economic condition
5.2 Energy Consumption Pattern
SPATIAL ANALYSIS AND RESULTS 6.1 Energy Resources Module
6.1.1 Biomass Resources a) Fuelwood
b) Crop residues C) ives tock manure
6.1-2 Nonbiomass Resources a) Hydropower b) Solar energy
6.2 Energy Demand Module 6.3 Energy Balance 6.4 Surnmary
7.0 MULTIOBJECTIVE ANALYSIS AND RESULTS 7.1 Energy Coefficients
7.1.1 Immediate /Economic/Financial cos& 7.1.2 Emplo yment coefficients
7.2 Energy Policy Analysis 7.3 Case 1: Watershed as Une Region
7.3.1 Results for Case 1 a) Individual optimization b) First iteration C) Second iteration
7.4 Case 2: Watershed as Sub-regions 7.4.1 Resultç for Case 2
a) Individual optimization b) First iteration C) Second iteration and Standard sensitivity analysis
7.5 Energy Balance 7.6 Sensi tivity Analysis
7.6.1 Sensitivity on Case 1 7.6.2 Sensitivity on Case 2 7.6.3 sensitivity to Changes in the Cons traint Coefficients 7.6.4 Normaiized Sensitivity 7.6.5 Data uncertainty
7.7 Summary
8.0 CONCLUSIONS AND RECOMMENDATIONS 8.1 Decision Support and its Application 8.2 Specific Results from DSS 8.3 Limitation 8.4 Postenor
Appendix A: SURVEY FORM
Appendix B:COST COEFFICIENTS B.1 Fuelwood

B.2 Crop residues B.3 &al manure 8.4 Biogas B.5 Fuelwood stoves B.6 Micro hydro B.7 Solar photovoltaic B.8 Kerosene B.9 Electric bulbs 8.10 Kerosene lamps and stoves
Appendix C:EMPLOYMENT COEFFICIENTS C.1 Fuelwood C.2 Crop residues C.3 Biogas C.4 Micro hydro C.5 Solar photovoltaic C.6 Kerosene C.7 Efficient fuelwood stoves
Appendix D:FORMULATION OF OBJECTAES AND CONSTRALNTS D.1 Case 1
D. 1.1 The objectives D.1.2 Constraints Set D. 1.3 First Iteration D. 1.4 Second Iteration
D.2 Case 2 D.2.1 The Objectives D.2.2 Constraints Set D.2.3 First Iteration D.2.4 Second Iteration
Bibliography
(xii)
List of Tables
Table 1.1 Basic information on some of energy models Table 1.2 Energy consumption in PJ in selected developing countries Table 1.3 Residue to crop ratio and calorific values Table 1.4 Animal manure production per year Table 1.5 Fuelwood requiremenû for food processing. Table 3.1 Construction of the Payoff Macrix Table 4.1 Data dictionary for the spatial mode1 Table 4.2 Some possible combinations of i, j, and k. Table 4.3 Extemal and end-use device efficiency. Table 4.4 List of possible objectives and constraints Table 5.1 Maps obtained for Phewatal watershed Table 5.2 Land use changes in Phewatal watershed Table 5.3 Average crop yields in mt/hectare Table 5.4 Population distribution in the watershed Table 5.5 Livestock population in VDCs. Table 5.6 Surveyed sample wards and location. Table 5.7 Energy consumption in Phewatal watershed in GJ Table 6.1 Sustainable fuelwood yields in air-dry mt/ha Table 6.2 Forest area and sustainable fuelwood supply Table 6.3 Accessible fuelwood supply situation in different VDCs Table 6.4 Area under cultivation and total cropped area in hectares Table 6.5 Total cropped area and residue production in different VDCs Table 6.6 Livestock manure for energy use in VDCs. Table 6.7 Biogas potential in VDCs. Table 6.8 Estimated and measured discharges in some streams Table 6.9 Estimated discharge and hydropower production Table 6.10 PV based electricity generation potential Table 6.11 Energy consumption in GJ by fuel type Table 6.12 Energy consumption in GJ by end-use Table 6.13 End use efficiency for different devices Table 6.14 Final energy consumption in GJ by fuel type Table 6.15 Final energy consumption in GJ by end-use Table 6.16 Energy surplus (+) and deficit (-1 Table 7.1 Vanous energy costs in US$/GJ Table 7.2 Employrnent coefficients in person-yrs/GJ Table 7.3 Payoff ma& for Case 1 Table 7.4 Resource allocation with second iteration Table 7.5 Payoff Matrix for Case 2. Table 7.6 Resource allocation in GJ with first iteration (Case 2) Table 7.7 Simulation study in second iteration Table 7.8 Resource allocation in GJ with second iteration (Case 2)
(xi ii)
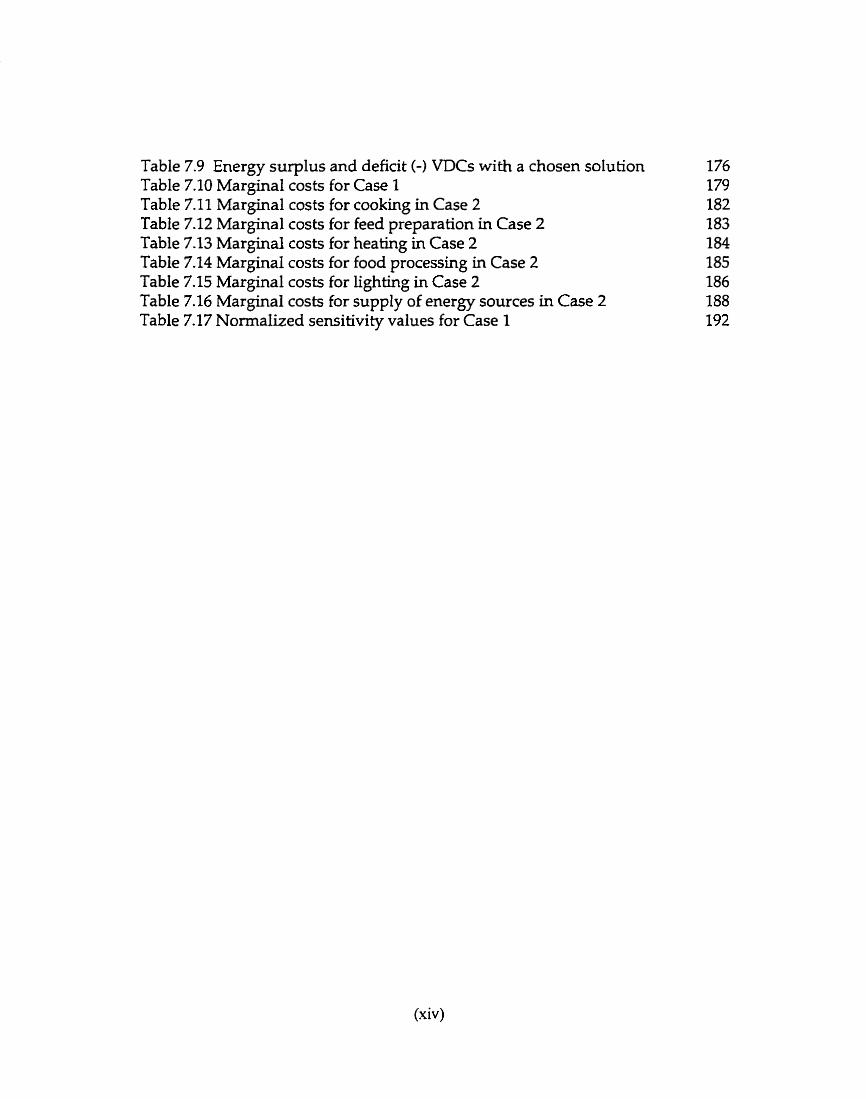
Table 7.9 Energy surplus and deficit (-1 VDCs with a chosen solution Table 7.10 Marginal costs for Case 1 Table 7.11 Marginal costs for cooking in Case 2 Table 7.12 Marginal cos& for feed preparation in Case 2 Table 7.13 Marginal costs for heating in Case 2 Table 7.14 Marginal costs for food processing in Case 2 Table 7.15 Marginal costs for lighting in Case 2 Table 7.16 Marginal costs for supply of energy sources in Case 2 Table 7.17 Normalized sensitivity values for Case 1
(xiv)
List of Figures
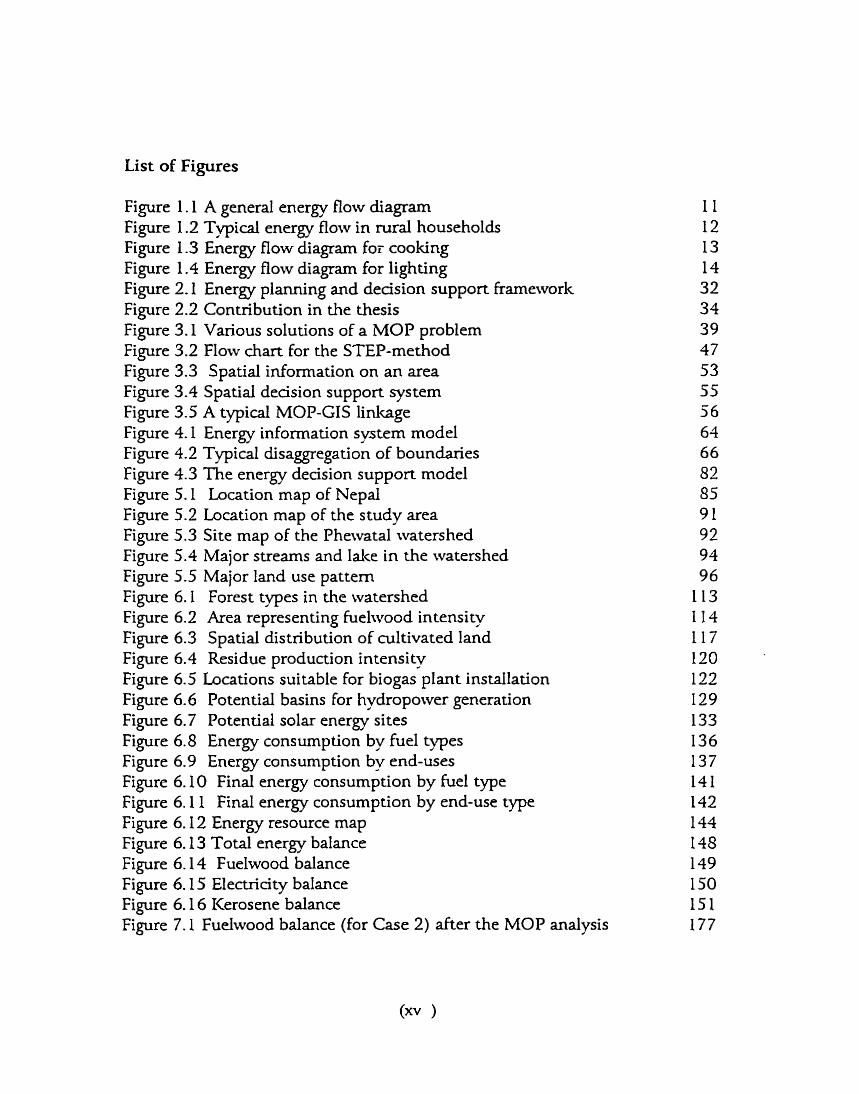
Figure 1.1 A general energy flow diagram Figure 1.2 Tvpical energy flow in rural households Figure 1.3 ~*ergy flow diagram foi cooking Figure 1.4 Energy flow diagram for lighting Figure 2.1 Energy planning and deàsion support fiameworlc Figure 2.2 Contribution in the thesis Figure 3.1 Various solutions of a MOP problem Figure 3.2 Flow chart for the STEP-method Figure 3.3 Spatial information on an area Figure 3.4 Spatial decision support system Figure 3.5 A typical MOP-GIS linkage Figure 4.1 Energy information svstem model Figure 4.2 Typical disaggregation of boundaries Figure 4.3 The energy decision support model Figure S. 1 Location map of Nepal Figure 5.2 Location map of the study area Figure 5.3 Site map of the Phewatal watershed Figure 5.4 Major streams and Ialce in the watershed Figure 5.5 Major land use pattern Figure 6.1 Forest types in the watershed Figure 6.2 Area representing fuelwood intensitv Figure 6.3 Spatial distribution of cultivated land Figure 6.4 Residue production intensitv Figure 6.5 Locations suitable for biogas plant instailation Figure 6.6 Potential basins for hvdropower generation Figure 6.7 Potential solar energy sites Figure 6.8 Energy consumption by h e l types Figure 6.9 Energy consumption bv end-uses Figure 6.10 Final energy consumption by fuel type Figure 6.1 1 Final energy consumption by end-use type Figure 6.12 Energy resource map Figure 6.13 Total energy balance Figure 6.14 Fuelwood balance Figure 6.15 Electricity balance Figure 6.16 Kerosene balance Figure 7.1 Fuelwood balance (for Case 2) after the MOP analysis

Acronvms
DCs DSS EBS EFS FA0 GIS ha IEP KDCC kg kl MOP MOWR mt NPC RES Rs. SDSS UN UNDP VDC W C S
Energy Units
Developing Countries Decision Support System Energy Balance Sheet Efficient Fuelwood Stove Food and Agricultural Organization Geographical Information System Hectare Integrated Energy Planning Kaski District Development Council Kilogram Kilo Litre Multiobjective Programming Ministry of Water Resources, Nepal Metric Tons National Planning Commission, Nepal Reference Energy System Nepalese Rupees (US $1.00 = Rs. 50.00) Spatial Decision Support Sys tem United Nations United Nations Development Program Village Development Council Water and Energy Commission Secretariat, Nepal
Watts Peak watts kilowatt kilowatt hours Megajoules Megawatts Megawatt hours gigajoules(109 joules) Terajoules (10'~ joules) Petajoules ( l O I 5 joules)
(xvi)

Chapter 1
INTRODUCTION
rMore than three quarters of the population of developing countries live in mral
areas, where farming is the main economic activity and biomass is the main source
to meet the energy demand for household chores. These people have fewer
econornic oppominities and live in a condition of lower infrastnicture development
with almost no supply of alternative resources, and have almost no role in decision
making for their own area. These vulnerabilities have forced the mral people in
developing countries into "a vicious cycle of poverty" (Chambers 1993). As a result,
rural people are either forced to migrate to urban areas or to use already
marginalized natural resources creating environmental degradation. Such a
degradation, in the opinion of the World Commission on Environment and
Development (WCED 19871, is a ".. new reality" to be increasingly faced by the
world in the coming years. Therefore, the Commission suggests that "decisive
1

Chnpter 1 2
political actions" should be taken to correct such a situation. Such actions should
have an objective of sustainable development, that is, to meet the present and the
future needs.
It is within the framework of sustainable development of nual areas in
developing countries (DCs) that this thesis is developed. This work is expected to
highlight the importance of energy awareness and rural energy development. As
a part of this research, a decision support system has been proposed, which the
decision makers 010th at the local and the national levelç) are expected to find
useful to enhance their knowledge of the feasibility of rural energy policies.
1.1 Energy Planning Practice
The purpose of an energy planning exercise is to generate an energy policy.
National level energy planning may be traced back to the indushial development
of electricity generating equipment. Until the 1970s, energy planning was
engineered with consumption driven supply planning. New generating facilities
were added when the demand superseded the energy supply capability. The two
"oil shodcç" of 1973 and 1979 brought energy demand management considerations
into the energy planning proces. Then foiIowed a series of energy plans or energy
master plans with a key assumption of rising oil prices (Hills 1988). In the United
states also, Project Independence was started by President Nixon to make the
country independent of foreign oil imports by 1980 (Gass 1994). Nevertheless, the
Chnpter 1 3
fate of this plan was sealed off due to the failing oil prices in the mid 1980s (Hills
1988). The failure, however, led to the idea of integratirtg energy plans with other
econornic activities, which we now cal1 Integrated Energy Planning (ZEF'). It was
realized that a better energy policy could be formuiated if the energy program
were integrated with other development goals. By taking the case of forest
denudation for fuel in Africa, Hosier et al. (1982) proposed that for an effective
energy policy, energy plans and local developmental activities should be integrated.
This was one of the first such propositions in the field of integrated energy
planning.
The need to integrate national level energy p l a ~ i n g with macroeconomic
planning was consolidated by the "Integrated Energy Planning" manual published
by the Asian and Pacific Development Centre (APDC 1985). The manual calls for
using a systms approach to amve at consistent energy policies at the national Zevel
over a long term. This manual seeks first to understand the Iinkage between the
energy sector, macro-economic factors, and socioeconomic objectives so that a
greater coordination could be achieved between energy demand and supply
management. Although this type of planning process dilutes the effect of rural
energy systems, there is a possibility of developing rural energy plans in the same
fashion (Shah 1988).
A framework for designing rural energy plans based on the concept of
integrated energy planning has been proposed in FA0 (1990). The framework calls
for micro-area based planning by assessing energy dernand, energy supply, and

Chap ter 1 4
potential energy technologies that codd be implemented in the planning area.
Rural energy consurnption is controlled by the consumers thernselves and
the interaction between the c o r n e r and energy consump tion is difficult to mode1
(Ramani 1988). Nevertheless, it is important that rural energy planning should be
highlighted dongside the urban oriented energy plan. If the rural energy situation
does not improve, more people will have to spend more t ime collecting fuel (Hill
et al. 1995) and less t ime in farming and other activities, thus further degrading
mral life.
To augment the rural energy supply, some efforts have been made in the past
b y installing photovoltaic electricity genera tion, wind pump or wind mil1
operations, biogas plants, micro hydro plants, and by distributing efficient
fuelwood stoves (EFS). However, these programs have lacked continuity in most
of the participating countries (FA0 1990). In some DCs, like Nepal, India, and
Thailand, supply planning and pricing of kerosene are major components of rural
energy planning. The cross subsidization of kerosene is expected to replace
fuelwood used for cooking. That could be hue in the urban areas as shown by
Pokharel(1992), but in rural areas the cross subsidization is likely to increase its use
in lighting, but not in cooking (Romahn 1988). The cross subsidization alone is not
enough to attract rural people to replace fuelwood consumption.
Except for some countries, energy planning for rural areas in DCs is either
absent or controlled by central authorities (Tingsabadh 1988). The absence of local
partiapation in rural development plans has led those plans to failure (Bartelmus
Chapter 1 s
1986). This situation is aggravated by the nvnber of uncoordhated and agency-
specific similar programs in the sarne area (Shrestha 1988, Behari 1988).
The public participation can be brought into the design process in the form
of grassroots Ievel information, manpower training, and local employment. FA0
(1990) suggests that if the community is made an integral part of energy programs,
the chances of sustainability of such programs can be increased.
Energy related environmental problems in mral areas are imrnediate but
conflicting at times. For example, the smoke from cooking/heating stoves causes
health hazards (Pandey et al. 1990, F A 0 1994), however, it preserves grains (Foley
et al. 19W) and helps to abate the termite problem that destroys beams and pillars
in the house. Collection of fuelwood from a nearby forest can reduce the working
load of women (Shrestha 1985, Hills 1988), however, it might create the problems
of soi1 erosion and land slides (Adhikary 1988) in or close to the fann land and
affect the food supply chah further degradhg rural life. Therefore, when
implementing an energy plan, clear identification of such aspects is essential.
1.2 Energy Modelling
Modelling and optimization of models illuminates conflicts within a system and
helps in generating a set of alternatives for further analysis (Liebman 1976).
Therefore, an effective mode1 is important to enhance rural energy planning.
The energy balance sheet (EBS) and the reference energy system (ES) have
Chapter 1 6
been used to mode1 energy systems in many DCs. These tools help in identifymg
surpluses or deficits in supply and in designing an energy intervention program.
RES has been used in energy planning in DCs including Sudan, Pem, Egypt,
Indonesia, and Sn Lanka (Munasinghe and Meier 1993).
Economic tools like net present worth of investment, rate of retum, and
benefit-cost ratio are also used in energy planning. Christensen and Vidal (1990)
and Pokharel et al. (1992) have used some of these economic tools for energy
analysis. Statistical models may also be attached to such economic tools.
Linear single objective optimization has been used for energy analysis by
Ramakumar et al. (1986), Joshi et al. (19911, Luhanga et al. (19931, Malik et al. (1994),
Sinha and Kandpal(1991a, 1991b, 1 9 9 1 ~ ~ 1992), Srinivasan and Balachandra (1993),
and Zhen (1993). By using goal programming, a type of mu1 tiobjec tive method, as
a case study in energy planning, C h e V and Subramanian (19881, Ramanathan and
Ganesh (1993 and 19941, Bose and Anandalingam (1996) have shown that the use
of multiobjective programmuig methods could enhance the applicability of energy
models.
The twls diçcuçsed above have been used to design genenc energy models
that are either supply or demand oriented. Supply oriented models generally focus
on energy resources and their interaction with the economy, whereas demand
oriented models focus on energy end-use and sectoral energy demands. Detailed
reviews of these models can be found in Fdler and Ziemba (1980), Foat et al. (1981),
UN (19821, UN (19891, and Munasinghe and Meier (1993). Basic information on
Chapter 1 7
some of the most widely used models, obtained from the reviewed literature, is
given in Table 1.1.
Table 1.1 Basic information on some of energy models
Model
ENERPLAN
BESOM
PIES
MEEDE
Main Data
Energy flow, tehology assessrnent
Based on RES
T h e series data on economics and energy
Based on RES
Based on RES
Energy conversion, hpor t , tariff, taxes, new supply.
Based on E S l Cost, efficiencies, macroeconomic factors
1 Rate of return for
Optimiza tion of Objectives
I
None
None
Single, cos t rninirnization for energy supp1y
Single, multi-penod
Single, cos t minimiza tion
1.2.1 Supply oriented models
These models focus on energy resources and their interaction with the economy.
energy projects
Allocation of energy sources
Econometric coefficients and demand projection
Optimal mix of technoIogies
Op tirnal mix of technologies
Optimal rnix of technologies
None
Single
The ENVEST model is perhaps the first energy supply model developed for any
Projection of energy requirements
Optimal rnix of technologies.
Chnpter 1 8
developing country. This model focuses on energy project analysis and evaluates
a projects' interna1 rate of retum. This model was followed by the development of
a more flexible model, RESGEN, based on the reference energy system. This
method requires a knowledgable user for implementation.
The Brookhaven Energy Systems Optimization Mode1 (BESOM) is a static
single objective linear optimization model, which focuses on a long range
technology assessment and policy analysis. Conceptually similar is the Market
Allocation model (MARKAL), a multi-period linear optimization model that
calculates an optimal mix of technologies according to one of several possible
criteria.
The Energy Planning model (ENERPLAN) is an econometric model based
on time series data and is suitable for statistical analysis. This model has been
applied to Thailand and Costa Rica as part of a demonstration.
The Long term Energy Analysis Package (LEAP) is a large scale energy-
economy model, which simulates market processes through supply and demand
interaction and provides reconunendation for policy options.
1.2.2 Demand oriented models
These type of models focus on energy end-use or çectoral energy demands and may
use econometric tools. The Project Independence Evaluation System (PIES) model
is an energy demand model for large scale energy systems. This model was
Chnp f er 1 9
developed in the early seventies to chalk out a plan for foreign oil independence
of the United States by 1980 (Gass 1994). This model incorporates economic and
linear programming sub-models for bringing about an economic equilibrium in
energy supply and demand.
The MEEDE model disaggregates the total energy demand into homogenous
end-use categories and determines the long term energy demand evolution within
a specified time horizon. The Waterloo Energy Modelling System (WATEMS) is a
linear or nonlinex single objective optimization model used for cost minimization
of energy technology rnix in RES framework (Fuller and Luthra 1990). The Tata
Energy Economy Simulation and Evaluation model (TEESE) uses pricing and single
objective linear optunization as guiding tools for energy analysis.
Both the supply and dernand oriented models described above are designed
for a market-based situation and therefore, they may not be suitable for application
in rural energy analysis. However, the tools Iike EBS, RES, and optimization used
in the above models could also be used to represent the rural energy situation.
1.3 Rural Areas and Energy
More than 75% of the population in developing countries live in rural areas. In
some of the developing countries, as much as 90% of the population lives in rural
areas (FA0 1994). People living in rural areas depend heavily on local resources
for their livelihood. The energy supply is dominated by biomass fuels and most of
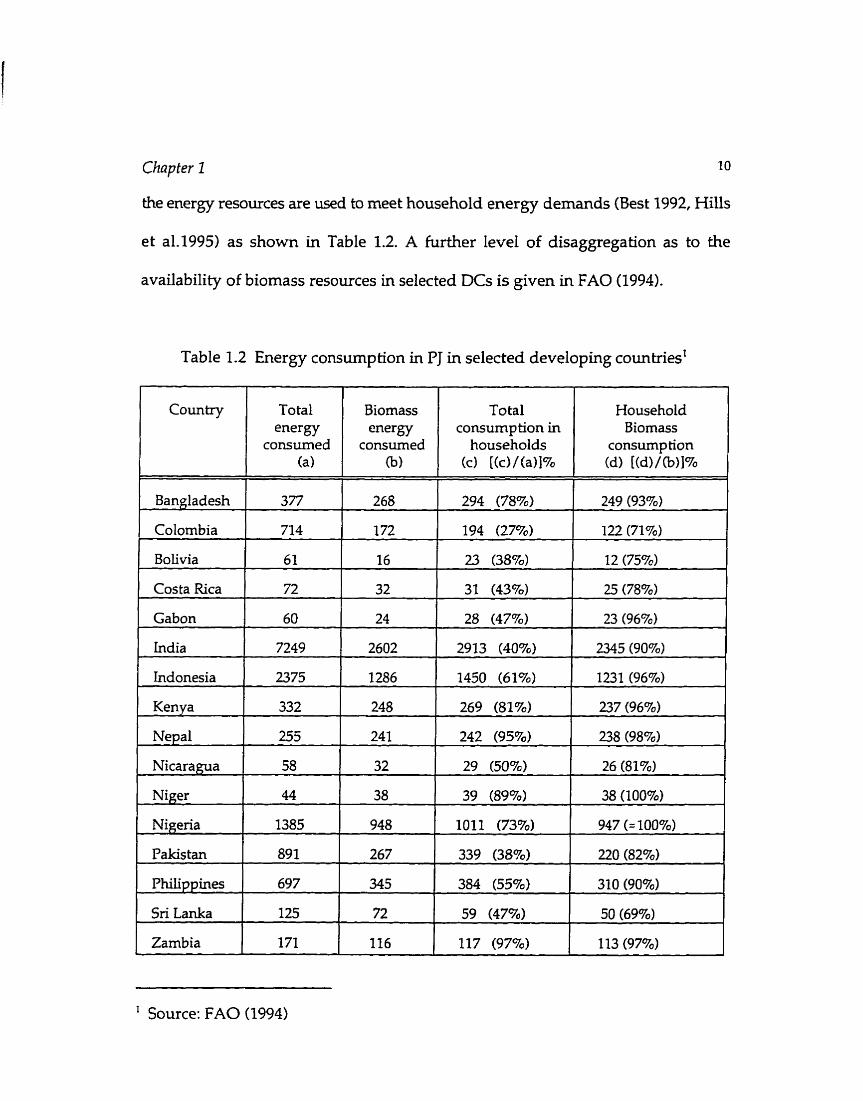
Chapter 1 IO
the energy resources are used to meet household energy demands (Best 1992, Hills
et a1.1995) as shown in Table 1.2. A further level of disaggregation as to the
availability of biomass resources in selected DCs is given in FA0 (1994).
Table 1.2 Energy consumption in PJ in selected developing countriesl
r
Country
consumed (a)
Total energy
Bangladesh 1 377
consumed 03)
Colombia I I I I
268 1 294 (78%)
Costa Rica
Gabon
Household Biomass
Biomass cnergy
households (CI [(c)/(a)l%
249 (93%)
l 714
Indonesia
To ta1 consump tion in
consump tion (dl [(d)/(b)l%
72
60
Kenya
172
2375
Nicaragua
32
24
332
Niger
194 (27%)
1286
58
Nigeria
Philippines 1 697 345 1 384 (55%) 1 310 (90%) I
122 (71%)
31 (43%)
28 (47%)
248
44
Pakistan
25 (78%)
23 (9670)
-- - - - -
1450 (61%)
32
1385
- - - - - -
1231 (96%)
269 (81%)
38
891
Sri Lanka
' Source: F A 0 (1994)
237 (96%)
29 (50%)
948
Zambia
26 (81%)
39 (89%)
267
l
125
38 (100%)
1011 (73%)
171
947 (= 100%)
339 (38%)
72
220 (82%)
116
59 (47%) 50 (69%)
117 (97%) 113 (9770)
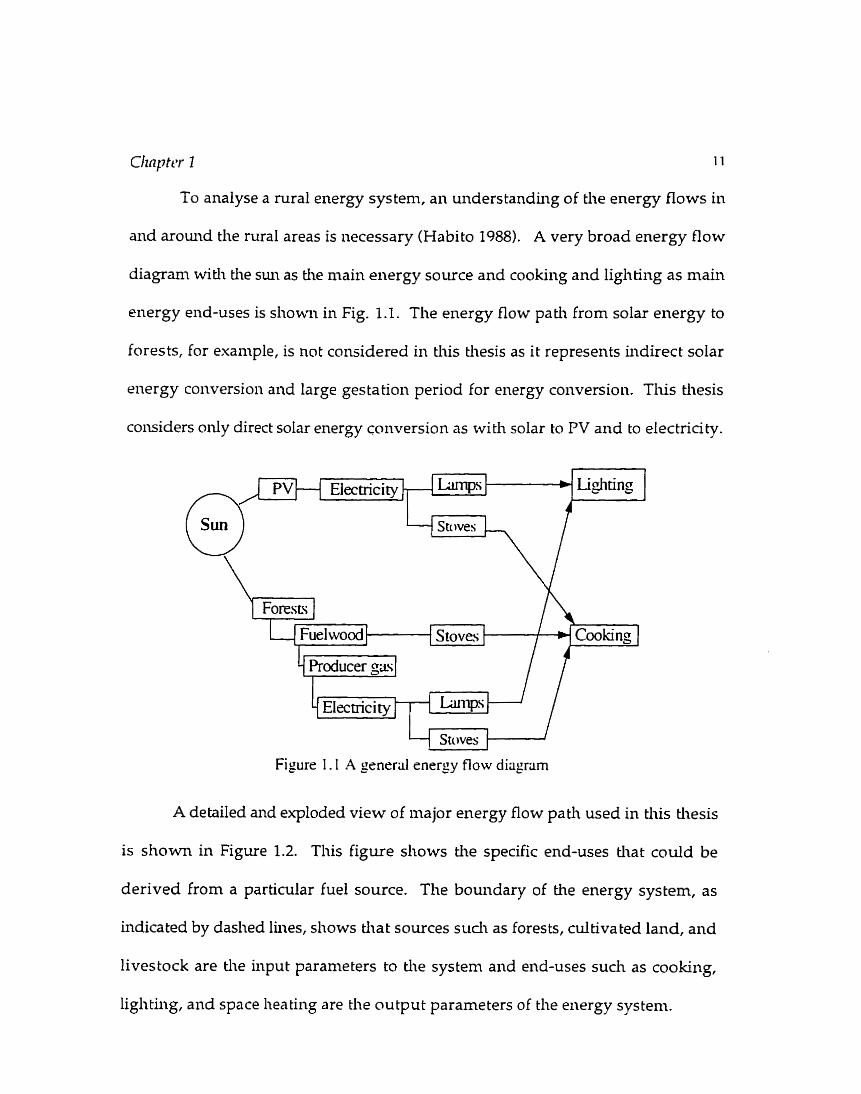
To analyse a rural energy system, an understanding of the energy flows in
and around the rural areas is iiecessary (Habito 1988). A very broad energy flow
diagrani with the sun as the main eiiergy source and cooking and ligliting as main
energy end-uses is sliowi in Fig. 1.1. The energy flow path from solar energy to
forests, for example, is iiot conjidered in tius thesis as it represeiits indirect solar
energy coiiversioii and large gestation period for eiiergy coiiversion. Tlus thesis
considers oxdy direct solar energy coiiversion as rvitli solar tn PV and to electricity.
Figure 1.1 A general energy flow diagram
A detailed aiid exploded view of major energy flow path used in tliis thesis
is sliown in Figure 1.2. This figure shows the specific end-uses tliat could be
derived from a particular fuel source. The bouiidary of the energy system, as
iiidicated by daslied lhies, sliows tha t sources such as forests, cultiva ted land, and
livestock are the input parameters to the system and end-uses such as cookiiig,
liglitiiig, and space Iieating are the output parameters of the energy system.
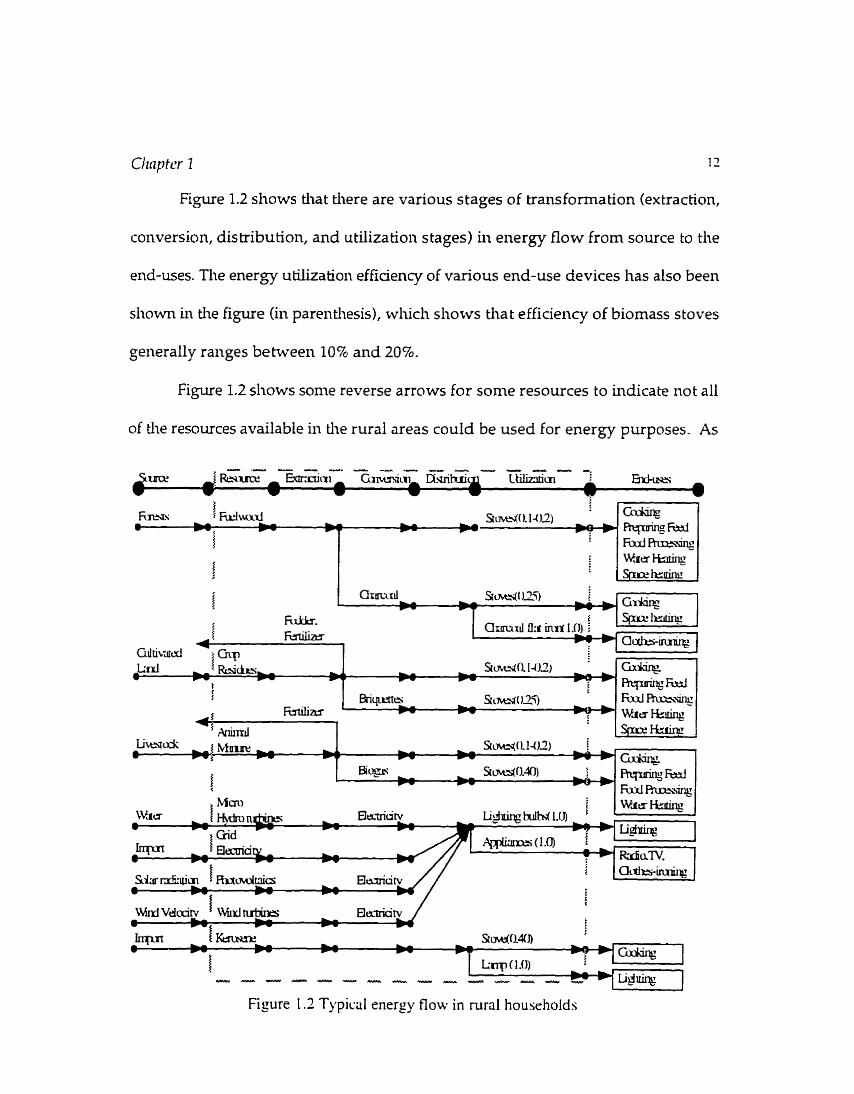
Figure 1.2 shows that there are various stages of transformation (extraction,
conversion, distribution, and utiliza tion stages) hi energy flow from source to the
end-uses. The energy utilizatioii efficiency of various end-use devices has also been
sliown hi the figure (in parentliesis), tvliicli sliows that efficiency of biomass stoves
generally ranges behveen 109 and 20%.
Figure 1.2 sliows some reverse arrows for some resources to indicate not al1
of the resources available in the rural areas could be used for energy purposes. As
b'i 3 wuorri a Sm&O. 14.2)
I Wb-
i
Stcnt.v(O. 1413) . - v+ Rqrnt%M Sttlct-;~( 125) FixllRux.ri
w a kq *KyLfi.l A
k, Stcnts(l ll4E) I
- a i l g Bogs sJwI).Irr) : m w ! - Furl RzIrxI~iilg
Mau N r t r
i Wdtr-
8 Li$uin& bulM 1.0
Gid
I Six du im Rxild&cs i Q C X I X S - ~
sliown by back arrows in tlie figure, crop residues and animal manure have ntlier
significaiit competing uses. Crop residues are used as mulcli and fodder in many
rural areas. Similarly, animal manure is ofteil the only fertilizer used in crops.
Tlierefore, suc11 competitig uses of resources shodd be carefully examined wliile
desigiiing a rural energy system.
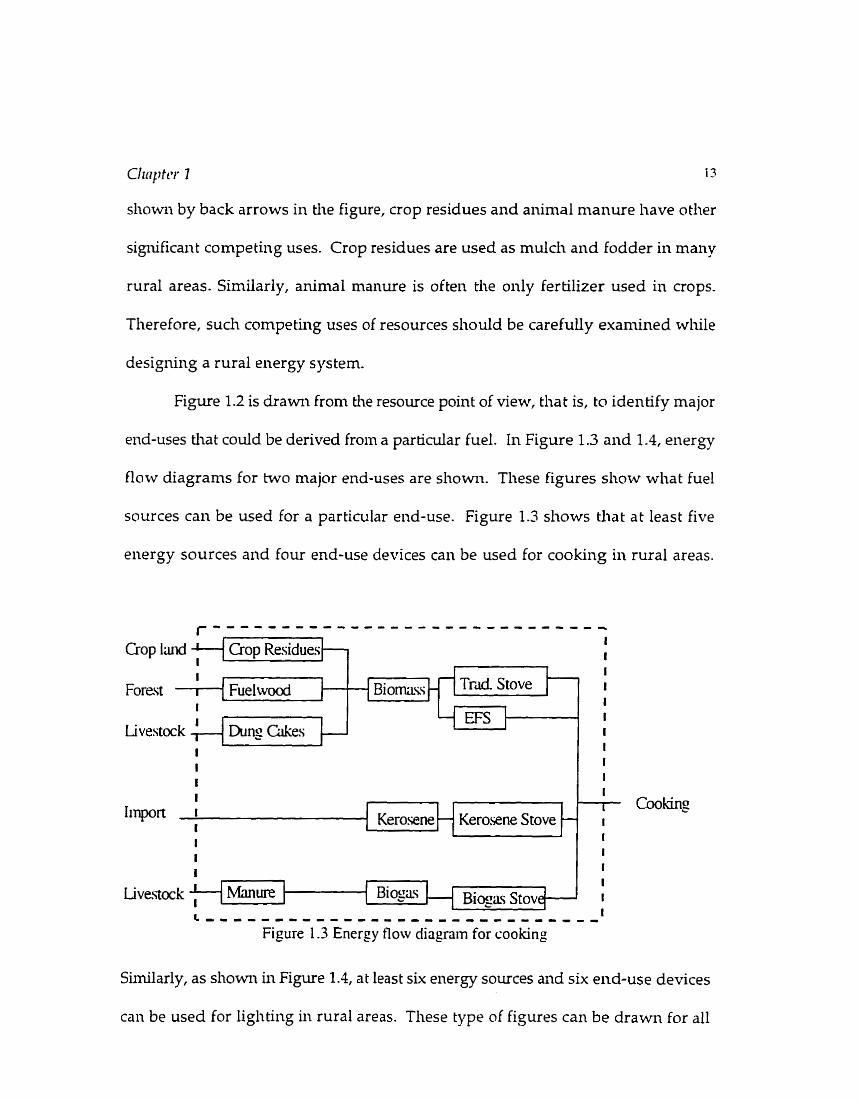
Figure 1.2 is drawn from the resource point of view, tliat is, to identify major
end-uses tliat could be derived froin a particular fuel. III Figure 1.3 and 1.4, energy
fInw diagrams for two major end-uses are sliown. These figures show wliat fuel
sources caii be used for a particular end-use. Figure 1.3 shows Uiat at least five
energy sources and four end-use devices caii be used for cooking in rural areas.
I 1 Bi omriss 1- T r i S tove 1
I I
Similarly, as sliown in Figure 1.4, a t leas t six energy sources and six end-use devices
can be used for ligliting in rural areas. Tliese type of figures caii be drawii for al1
I Cooking I
Iinport 1 1 - Kerosene - - Kerosene Stove -
Chapter 1
I J I
Radiation PV System -( ~lectricity i
A Flourescent 1 , I
Water Head ( Micro-Hydro
Livestock . 1 Manurej--1 Biogas i 1 I
energy end-uses shown in Figure 1.2. A detailed discussion on energy resources
and energy end-uses is given in the following subsections.
1.4 Energy Resources
In rural households, fuelwood, crop residues, animal manure, kerosene, electricity
and biogas are main energy sources. However, the use of each energy resource
depends upon its availability, accessibility, and affordability.
1.4.1 Fuelwood
Fuelwood is one of the dense biomass energy sources. The density of fuelwood
varies between 400kg/m3 and 1100kg/m3 (UN 1987). The energy content of air
Chapter 1 15
dried fuelwood varies between 16 GJ' (UN 1987) and 20 GJ (Bhatt and Todaria
1990) per metric ton (mt). The energy value of fuelwood depends mostly upon its
moisture content (UN 1987). The moisture content of green fuelwood varies
between 50450% (Bogach 1985) and in air-dried fuelwood the moisture could be
as high as 30% (Earl1975).
Fuelwood production on a sustained basis from a forest depends upon the
tree speaes, forest (or crown) density, and geographical conditions. The higher the
crown density, the higher the fuelwood availability. Similarly, the lower the
altitude the higher the fuelwood yield. The annual gross sustainable fuelwood and
thber supply fkorn Nepal's natural forests given in MOFSC (1987:Table 19) shows
that the yield in the mountains is almost half the yield in the Tarai (plain region in
the lower altitude). The sustainable yield and growing stock of forests in some
African states are given in Milington et al. (1994) and the fuelwood characteristics
of some mountain trees are given in Bhatt and Todaria (1990). These types of
information are helpful in understanding the variations in fuelwood production in
different regions.
1.4.2 Charcoal
Charcoal is obtained from carbonisation of fuelwood or crop residues in kilns.
Typical earthen k i h s have an energy conversion efficiency of about 17-2996 (Hall
' GJ = gigajoules
Chnpter 1 16
et ai. 1982). However for volumehic conversion, the efficiency is as low as 10%
(Hills et al. 1995). The calorific value of charcoal is about 29 GJ/mt (WECS 1994a).
Charcoal can be used for cooking, space heating, and in appliances such as
press iron or in cottage industries like black-smithy and gold-smithy (Cecelski 1979,
Chirarattananon 1984, Energy Research Group 1986, Moss and Morgan 1981). The
efficiency of a charcoal stove could be as high as 65% (Moss and Morgan 1981).
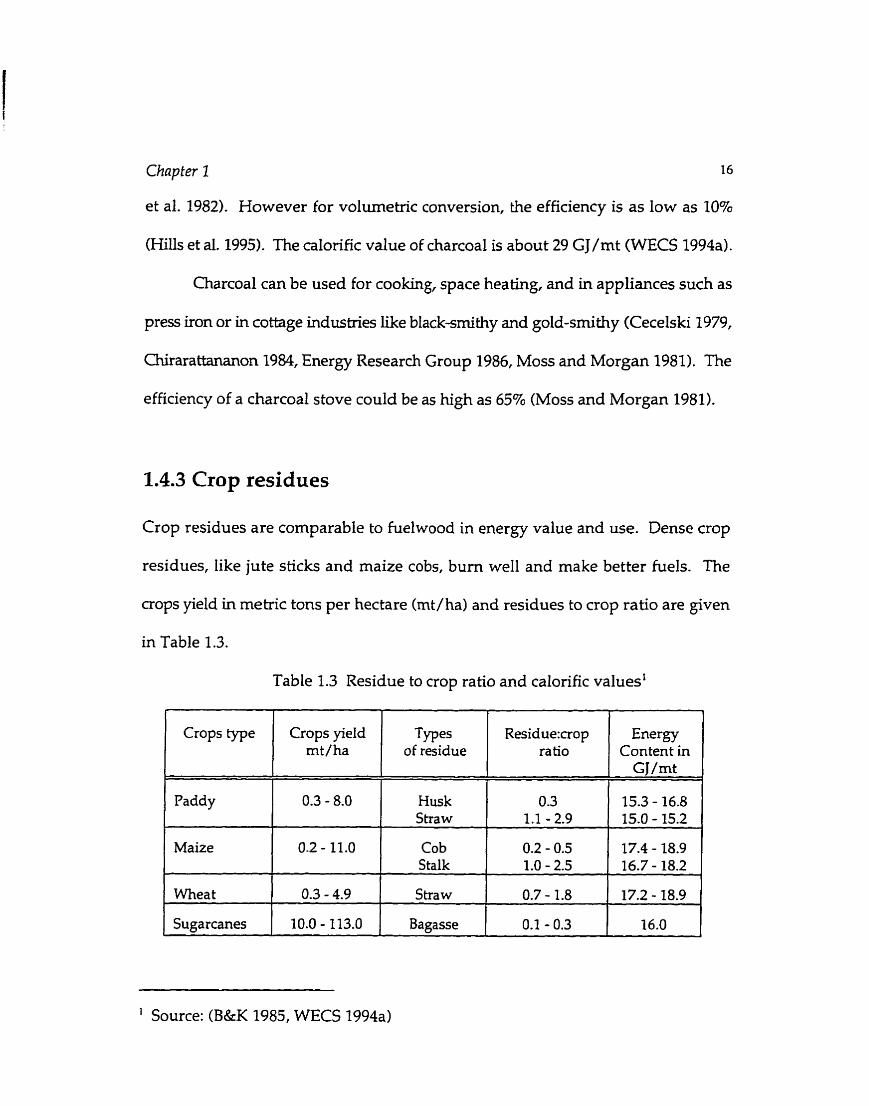
1.4.3 Crop residues
Crop residues are comparable to fuelwood in energy value and use. Dense crop
residues, like jute sticks and maize cobs, bum well and make better fuels. The
crops yield in metric tons per hectare (mt/ha) and residues to crop ratio are given
in Table 1.3.
Table 1.3 Residue to crop ratio and calorific values'
Crops type
Paddy
Maize
' Source: (B&K 1985, WECS 1994a)
Wheat
Sugarcanes
Crops yield mt/ha
0.3 - 8.0
0.2 - 11.0
0.3 - 4.9
10.0 - 213.0
Types of residue
Husk Shaw
Cob Stalk
S tra w
Bagasse
Residuexrop ratio
0.3 1.1 - 2.9
0.2 - 0.5 1.0 - 2.5
Energy Content in
GJ/mt
15.3 - 16.8 15.0 - 15.2
17.4 - 18.9 16.7 - 18.2
0.7 - 1.8
0.1 - 0.3
17.2 - 18.9
16.0
Chapter 1 17
The yield of a crop and its residue depends upon factors such as farming system
and agro-dhatic conditions. Gop residues are dso recycled to reduce soil erosion
from farm land (Hall et al. 1982). They are also used as fodder (Shacklady 1983).
However, not al1 of the crop residues are good for recycling (B&K 1985) nor for
animal fodder. Crop residues like rice straw, green maize stalks, and wheat stalks
are comrnon animal fodder. Therefore, the availability of crop residues for fuel
may be limited in some rural arem.
1.4.4 Animal manure
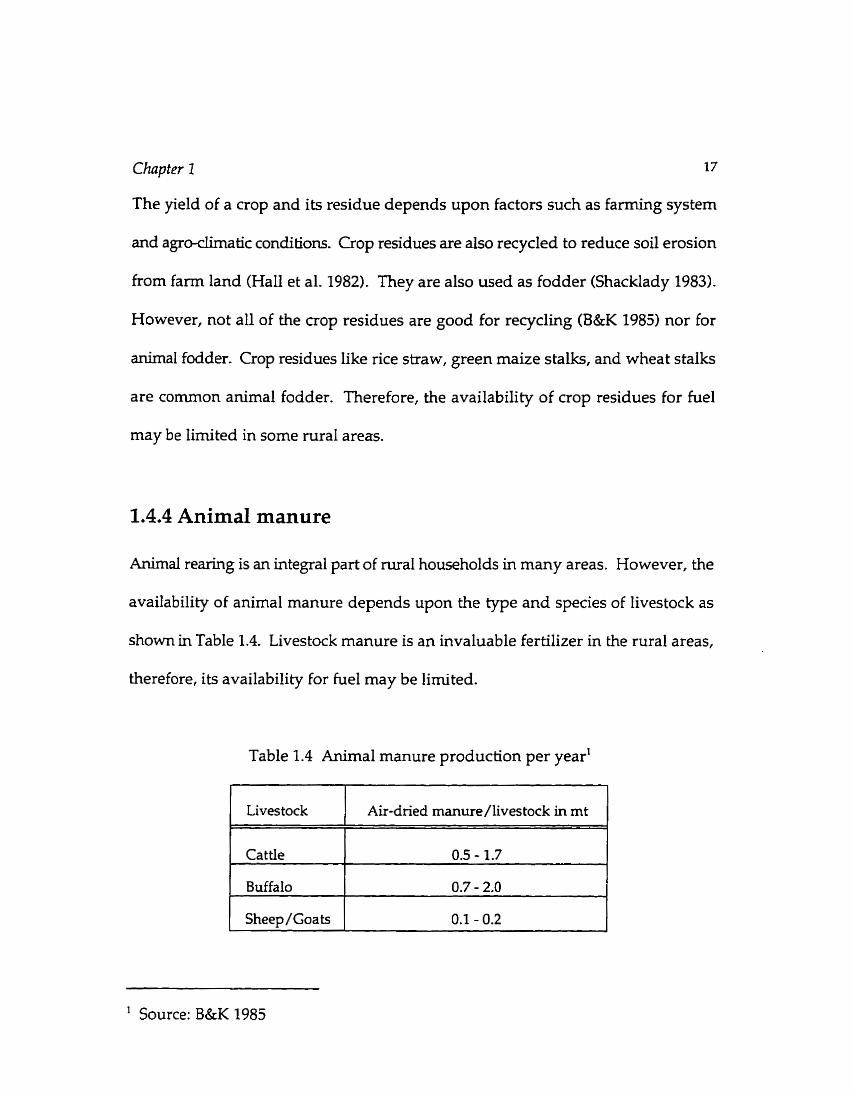
Animal rearing is an integral part of rural households in many areas. However, the
availability of animal manure depends upon the type and species of livestock as
shown in Table 1.4. Livestock manure is an invaluable fertilizer in the rural areas,
therefore, its availability for fuel may be limited.
Table 1.4 Animal manure production per yearl
Lives tock
Source: B&K 1985
Air-dned manure/livestock in mt
Buffalo 0.7 - 2.0
Chapter 1 2 8
Animal manure could be used as fuel either directly as dried dung cakes or dried
dung sticks or indirectly as biogas. Usually, only cattle and buffalo manure is used
for energy purposes. The energy content of air-dry animal manure is about 11
GJ/mt (WECS 1994a).
1.4.5 Hydropower
Hydropower is exploited in mal areas either through a traditional water wheel for
grain processing or with modem steel turbines for grain processing and electricity
generation. In countries like Nepal, China, Bhutan, Myanmar, India, Thailand,
Pakistan, Sri Lanka, and Papua New Guinea, there is a large potential for
generating smaller scale hydropower. Such power could be a way of providing
affordable energy to rural areas (Inversin 1986).
Hydropower could replace kerosene (used for lighhi-ig) and diesel (used for
agro processing). An ordinary kerosene lamp consumes an average of about 20
ml/hour (researchers' survey). If the lamp is used for about four hours a day, the
average m u a l kerosene consumption would be about 30 litres per kerosene lamp.
A IO-kW hydropower turbine can deliver 5-6 kW of electncity for lighting. This
would translate into a saving of about 4 kilo litres of kerosene per year. Similady,
a grain mil1 consumes about 3-5 litres of diesel fuel per hour. If a mil1 runs for
about six hours a day and for about 200 days in a year, about five kilo litres of
diesel are required, which could be replaced by hydropower-based grain
Chapter 1 19
processing w t s . Such a saving at different places can become significant on a
national scale. The installation of turbines in m a l areas also provides employment
opportunities in these rural areas (Pokharel 1990).
1.4.6 Solar energy
The solar energy absorbed by the earth's surface is as high as 8 kWh/rn2-day (Dayal
1993) in sunny, arid regions. The availability of solar energy depends upon the
local weather conditions and the geographical location. Solar energy iç a potential
source for water pumping, aop drying, electricity generation, and cooking (Bassey
1992, Hegazi 1992, GTZ 1992, Sinha 1994).
1.4.7 Wind energy
The availability of wind energy is site and tbne specific. About 4 m/s of wind
speed is required to operate a wind mi11 (Stout et al. 1979), but about 7 m/s is
desirable for electricity generation (Gmbb 1992). Methods for calculating wind
energy potential in a particular area are given in Heng (1985) and Stout et al. (1979).
Wind energy is used for water pumping, grain processing, and electricity
generation (Sinha 1994). However, long tenn wind velocity data of an area are
required to plan for wind energy extraction.
Chapter 1
1.4.8 Biogas
Biogas is produced by anaerobic digestion of animal manure. Its production is
dependent on the type of animal manure and site temperature. Higher digester
temperatures, not exceeding 35OC, will promote faster generation of biogas (UN
1984).
There are two main types of biogas digesters, which come in vanous
capacities. Pokharel (1992) has given a method for calculating the capacities of
biogas digesters for different energy demand levels. The methods for calculating
gas generating potential of biogas plants and the economic benefits due to methane
production are given in Jiapao and Cheng-xian (1985), and in Pokharel and Yadav
(1991).
Biogas contains 50% - 60% methane, with a calorific value of between 20 and
28 GJ/m3. Biogas could be used for cooking, lighting (0.14 m3/hr of biogas is
required to produce lumens' equivalent to that of a 60-W incandescent bulb), and
in grain processing (in combination with diesel, 50%-60% of diesel replacement).
About 70% of the input dung is available as spent dung (called slurry, extracted
after biogas formation), which can be used as field manure. Biogas installations use
local resources and provide an opportunity for local employment.
I Lumens per square meter is called lux. Gleny and Procter (1992) have
suggested that about 500 lux is recommended for office work. The requirement in household could be slightly lower.

Chap ter 1
1.4.9 Petroleum products
In general, two petroleum products -kerosene and diesel - are used in rural areas,
if available. In some rural areas, kerosene is also used for cooking. Kerosene could
be an energy option to meet Iighting and cooking energy dernands. Diesel is
generally used to run irrigation pumps (Chambers et al. 19891, grain processing
units, tractors, and for electricity generation.
1.5 Energy Consumption Pattern
As shown in Figure 1.1, the main end-uses of energy sources in rural households
are cooking, preparing feed for livestock, lighting, space heating, food processing,
water heating, and using appliances. However, some end-uses like space heating
and water heating depend upon the geographical location of the mral areas (Bhatia
1988, Best 1992). Ln the following sections, major end-uses in a typical rural area
are discussed.
1.5.1 Cooking
Both human food cooking and livestock feed cooking are important in mral
households. Cooking requires about 50% to 90% of the total household energy and
is the major end-use activityl. The main types of cooking stoves used in rural areas
' Zhu et al. (1983), Chirarattananon (1984), Munasinghe (19851, Sathaye and Meyers (19851, Leach (1988), Sathaye and Tyler (1991), Best (1992), Mwandosya

Chnpter 1 22
are Stone stoves, tripods, traditional mud stoves, iron sheet stoves, and efficient
helwood stoves (Foley et al. 1984). The end-use device efficiencies of different
types of cooking stoves have been given in Pokharel(1992).
1.5.2 Lighting
Lighting is the second major energy end-use in terms of necessity. Fuelwood in an
open stove Eoley et al
source in rural areas
1984, kerosene, biogas, and electricity are the main lighting
An ordinary kerosene lamp produces about 20 lumens
(derived from Sharma 1984). As a cornparison, an incandescent lamp and
fluorescent lamp produce about 12 lumens/watt and 75 lumens per watt (Gleny
and Procter 19921, respectively.
1.5.3 Space heating
Space heating is important in areas where the temperature drops considerably in
winter or during the night (Foley et al. 1984). The demand for space heating
changes with the season and is dependent upon the floor area to be heated
(Goldemberg et al. 1987). However, distinguishing between the energy required
for heating and cooking might be difficult in some areas, as the stove used for
cooking also heats the surrounding area.
and Luhanga (1994).

Chapter 1
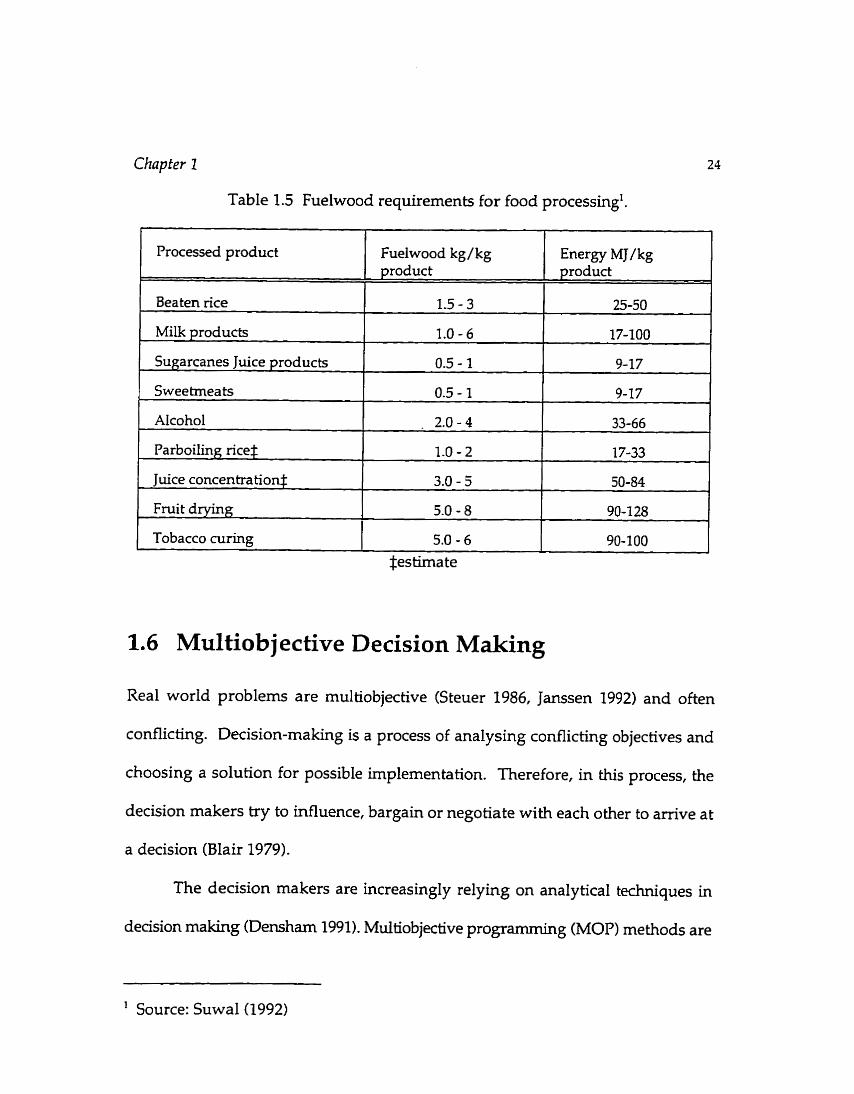
1.5.4 Food processing
Making alcohol, beaüng rice, processing milk, drying of fruits, and making
sweetmeats are some of the main food processing activities in rural households.
Estirnates of fuelwood requirementç per unit weight of processed food are given in
Table 1.5.
1.5.5 Other household uses
Clothes ironing, water heating, and the use of appliances fall under this end-use
category. In rural areas of DCs like Indonesia (Soesastro 1984) and Thailand
(Chirarattananon 1984), clothes ironing using charcoal-based press-iron is one of the
common activities.
Radios and television (where electricity is available and TV transmission is
received) are also used in m a l areas. In areas where electricity is not available, dry
ce11 batteries are used in the radios.
Chapter I
Table 1.5 Fuelwood requirements for food processing'.
Processed product
Bea ten rice
Milk products
Fuelwood kg/kg product
Sugarcanes Juice products
Energy h/lJ/kg product
1.5 - 3
1.0 - 6
Sweetmeats
25-50
17-100
0.5 - 1
Akohol
Parboiling rice$
1.6 Multiob jective Decision Making
9-17
0.5 - 1
Juice concentration$
Fruit drying
Tobacco cuMg
Real world problems are multiobjective (Steuer 1986, Janssen 1992) and often
conflicting. Decision-rnaking is a process of analysing conflicting objectives and
choosing a solution for possible implementation. Therefore, in this process, the
decision makers try to influence, bargain or negotiate with each other to amve at
a decision (Blair 1979).
9-17
. 2.0 - 4
1.0 - 2
The decision makers are increasingly relying on analytical techniques in
deasion making (Densharn 19% ). Multiobjective prograrnrning (MOPI methods are
33-66
17-33
testhate
3.0 - 5
5.0 - 8
5.0 - 6
Source: SuwaI(1992)
50-84
90-128
90-100
Chapter 1 25
an example of such analytical techniques, which are being increasingly used as
components of deasion support systems in public and private sectors (Cohon 1978,
Eom and Lee 1990, Hwang and Masud 1979, Korhonen et al. 1991).
Applications of MOP in water resources planning are given in Duckstein and
Opricovic (1980), Haimes and Allee (19821, and Magnouni and Triechel (1994). A
review of the application of MOP methods in facility location is given in Current et
al. (1990). Barber (1976) has applied a MOP method to analyse environmental
impacts, land use incompatibilities, facility access and energy consumption.
Werczberger (1976) has applied a MOP method to evaluate industrial locations in
the context of air pollution and economic achievement. Njiti and Sharpe (1994)
have used goal programming, a MOP method, to analyse the competing use of land
for forest and agriculture in Cameroon.
Siskos et al. (1994) have used a compromise programming approach to
mode1 regional agricultural planning in Tunisia by incorporating five objectives-
to maximize gross margin, employment, seasonal labour, and forage production,
and to reduce the use of tractors. Their analysis helped to arrive at a suitable
development policy specific to the given socioeconornic condition. Bowerman et
al. (1994) have applied a MOP method to analyse a school bus routing problem by
considering five conflicüng objectives -- student miles travelled, number of routes,
total bus route length, load balancing, and length balancing. The authors
recomrnend that this type of multiobjective analysis helps in arriving at an
economically efficient and politically acceptable solution. Kopsidas (1995) has
Chapter 1 26
analysed objectives to minimize the total investment and annual production cost
per ton of prepared green olive in an olive factory by using a 1,-metric technique.
The author argues that his mode1 reflects the actual practice in green olive
producing factories in some European countries.
The use of MOP methods to energy planning would enhance the decision
making process (Cohon 1978, Munasinghe and Meier 1993). The objectives to
evaluate in such a problem could be cost rninimization, reduction in environmental
impacts, and an increment in labour and energy supply. A MOP provides an
opportunity to assist in energy planning for regulatory and invesûment purposes.
Blair (1979) has used the concept of goal programming for energy facility location
in the USA. He has analysed seven different objectives to reflect the views of the
decision makers from the gov2rnment, electric utility, environmental groups, and
consumers. Janssen (1992) has applied a MOP method for selecting alternative
electriaty generation options in the Netherlands. He has analysed seven different
fuel options against 15 different environmental criteria.
Multiobjective methods are being hcreasingly used for policy planning
because they avoid a situation where the decision makers have to select a single
optimal solution. Also, MOP methods can be used to analyse several non
commensurable objectives without having to combine them into a single unit like
cost minimization or environmental improvement and this capability has increased
the applicability of MOP in real world problems (Cohon 1978).
Janssen (1992) has s h o w that a decision system using MOP should satisfy
Chnp fer 2 27
three main objectives- generation of information, generation of alternative
solutions, and provision of understanding the structure and the content of the
decision problem. The information generation in such a support system could be
handled by an information system or by a geographical information system in the
spatial context.
The use of multiobjective methods enhanceç the conflicting views of the
deasion makers and promotes the selection of an educated solution. With the use
of an interactive multiobjective programming method, the decision makers are
able to analyse the changes in the solution with a change in their preference to
different objective functions.
In this chapter, it was shown that rural energy planning is under-emphasized in
many developing countries. Some considerations have been given to falling energy
supply capability in the rural areas, but those programs have been ad-hoc and the
long term implications of such prograrns have hardly been realized. It waç
established that by including local participation and by integrating energy
programs with other m a l development activities, a better nual energy policy could
be fonned.
In a rural energy system, the household is the major energy consuming
sector. Therefore, a slight improvement in the household energy demand situation

Chap ter 1 28
can make a considerable impact on the total energy supply situation in rural areas.
The recent kend in policy planning encourages the use of hybrid tools like
a database program or an information system and multiobjecüve programmuig
methods to analyse deasion problem. Energy planning could also be analysed in
the same fashion by integrating costs, environmental concems, and local concems.
Establishment of such an analysis procedure would promote energy awareness and
promQte a systematic energy decision makuig process.
In Chapter 2, the objectives of this dissertation is discussed. The scope of this
dissertation and the contributions made by the researcher are also discussed in this
chap ter.
In Chapter 3, various multiobjective programming methods are reviewed in
brief. A particular multiobjective programming method suitable for m a l energy
analysis is discussed in detail. The applicability of the principles of a geographical
information system for the development of a decision support system to analyse
mral energy system is also discussed in this chapter.
In Chapter 4, a methodology to obtain energy information from a
geographical information system is discussed. The nexus between energy
information and MOP for the application is also s h o m in this chapter.
In Chapter 5, data required for the proposed decision support system are
diçcussed. A case area for the implementation of the support system is presented
and the spatial information related to that area is discussed.
Spatial analysis and results are presented in Chapter 6. Energy resource

Chap ter 1 29
availability, energy consumption patterns and energy balance sheets are also given
in this chapter. The resource and energy consumptions are combined to amve at an
energy balance for the study area.
In Chapter 7, the results obtained in Chapter 6 are moulded into a
multiobjective mode1 and two different cases are studied. It is shown that the
deasion makers can explore various solutions and understand the impact of their
preferences for one or another objective functions on resource allocation. This is
expected to promote more educated energy decision making in the future.
Condusions and recornmendations are presented in Chapter 8. The future
research work in this regard is also discussed.
The survey fom used during the rapid mral appraisal of the watershed is
given in Appendix A. The cost coefficients used in energy variables are discussed
in Appendix B and the employment coefficients are discussed in Appendix C. The
formulations of objectives and constraints are given in Appendix D.
Chapter 2
OBJECTIVES AND CONTRIBUTIONS
Energy is a necessityfor basic hltman activities. In mral areas, energy requirements are
fulfilled rnainly by biomass whereas in urban areas nonbiomass energy sources are
prùnarily used. Scarcity of one biomass fuel in the mral areas leads to substitution
by other biomasç fuels. For example, a scarcity of fuelwood leads to an increased
use of crop residues and dung for fuel. These substitutions are possible because
biomass sources are collected almost for free and the availability and affordability
of other fuels (nonbiomass) is low. If efficient and clean fuels are availablr and
affordable, the scarcity of one fuel leads to its replacement by a higher cost, more
efficient, and cleaner fuel (Smith et al. 1994).
Due to varied energy collection and energy c o m p t i o n patterns, the energy
planning process should be different in urban and rural economies. In rural areas,
energy planning should focus on the decentralized management of resources,
whereas in urban areas, it should involve demand and supply management tools
30
Chapter 2 31
such as energy pricing and the marketing of improved t e ~ o l o g i e s (Pokharel
1992).
The traditional farming system dominates the economic activity in rural
areas (Dixon 1990). When the population grows, the crop availability per capita
from the rural production declines. The crop availability c m be increased by either
adopting modem farming system such as using high yield variety seeds and
irrigation or land expansion. When the first option is not accessible and not
affordable, rural people resort to land expansion by encroaching forests and
marginal lands. Such a land expansion for cropping brings about ecological
imbalances induding a decreased sustainable yield of forests (Sharma 1988) This
cycle continues untiI the environment is severely damaged to cause food and
energy crisis in rural areas. This will further degrade the quality of mral life.
2.1 Purpose and Scope
To address a degrading rural energy situation, it is important that the energy
planners be equipped with a proper information tool so that energy decisions
become more representative of mral areas. In the decision-making process, if the
decision makers could be presented with an initial solution to the mral energy
problem then readions could be attracted . If the impact of their reaction could be
illustrated, then this would help in the search for a better area specific solution to
the rural energy problem.
In this thesis, an effort has been made to propose a methodology to analyse
rural energy situations and to reach at a better energy planning decision through
an Integrated Rural Energy Decision Support System (IREDSS). It is expected
that the adoption of the proposed rnethodology would help the decision makers to
visualize the planning area in t e m of its energy supply and demand
characteristics and to interact and dialogue with one another so that a more
informed decision could be reached.
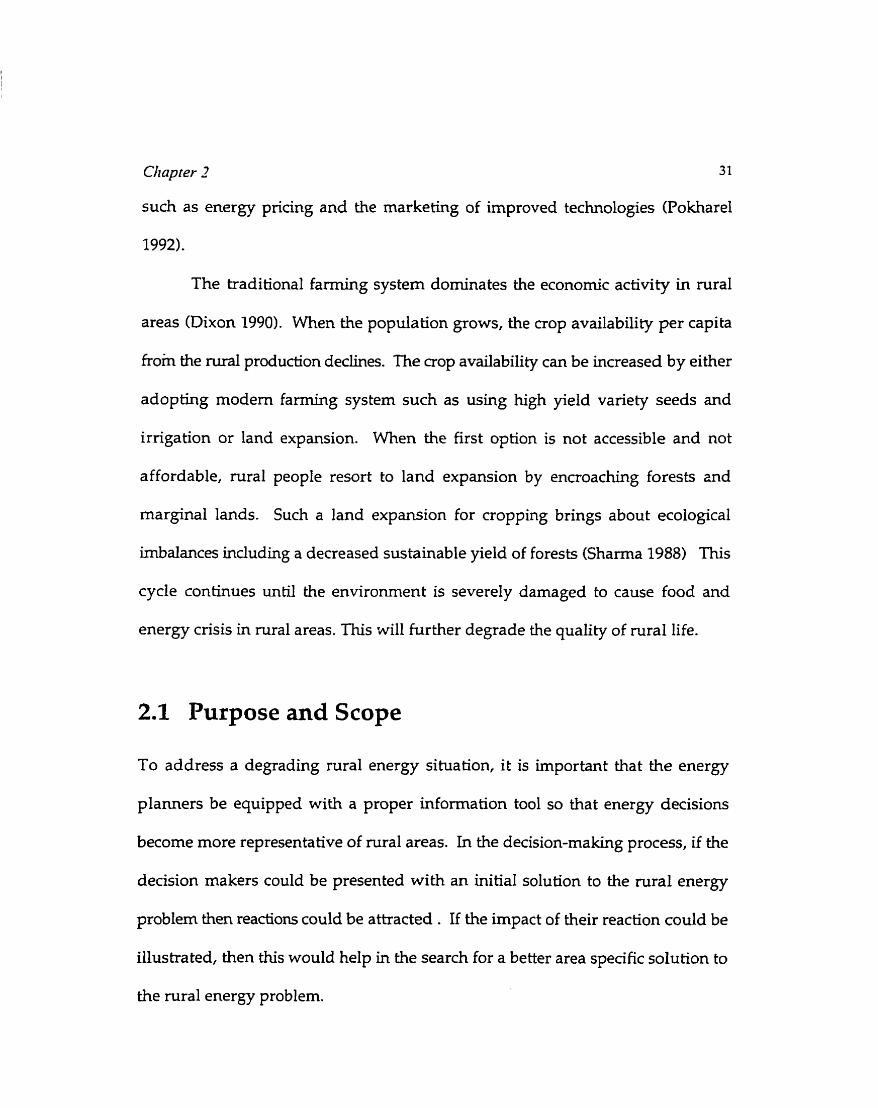
The proposed decision support system (DSS) framework in relation to the
national planning process is shown in Figure 2.1. The technical and economic data,
for example, system efficiency and costs, are extemal to the proposed system.
1 Macro Econornic Plan 1 I l l Energy Plan 1
Econornic Data c 1 Participation
1 Rural Economic plant
- Multiobjective Mode1 - R u d - Energy
Policv
Energy Information 1
l Spatial Information DSS
Figure 2.1 Energy planning and decision support framework
Chapter 2 33
Since households consume about 90% of the energy in rural areas and energy use
in the households is not efficient (MacuaIey et al. 19891, this thesis focuses on
household energy consumption only.
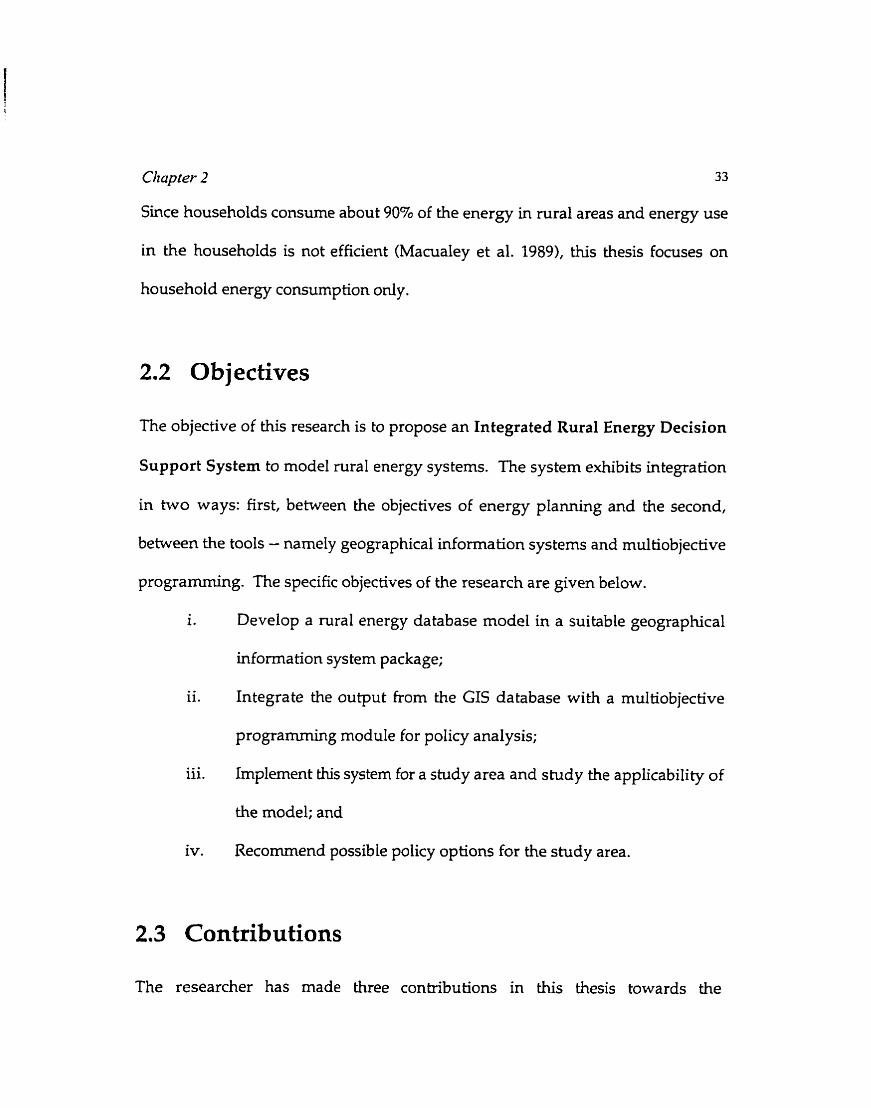
2.2 Objectives
The objective of this research is to propose an Integrated Rural Energy Decision
Support System to model rural energy systems. The system exhibits integration
in two ways: first, between the objectives of energy planning and the second,
between the tools - namely geographical information systems and multiobjective
programming. The specific objectives of the research are given below.
1.
. * I l .
iii.
iv.
Develop a rural energy database model in a suitable geographical
information sys tem package;
Integrate the output kom the GIS database with a multiobjective
programming module for policy analysis;
hplement this system for a study area and study the applicability of
the model; and
Recommend possible policy options for the study area.
2.3 Contributions
The researcher has made three contributions in this thesis towards the
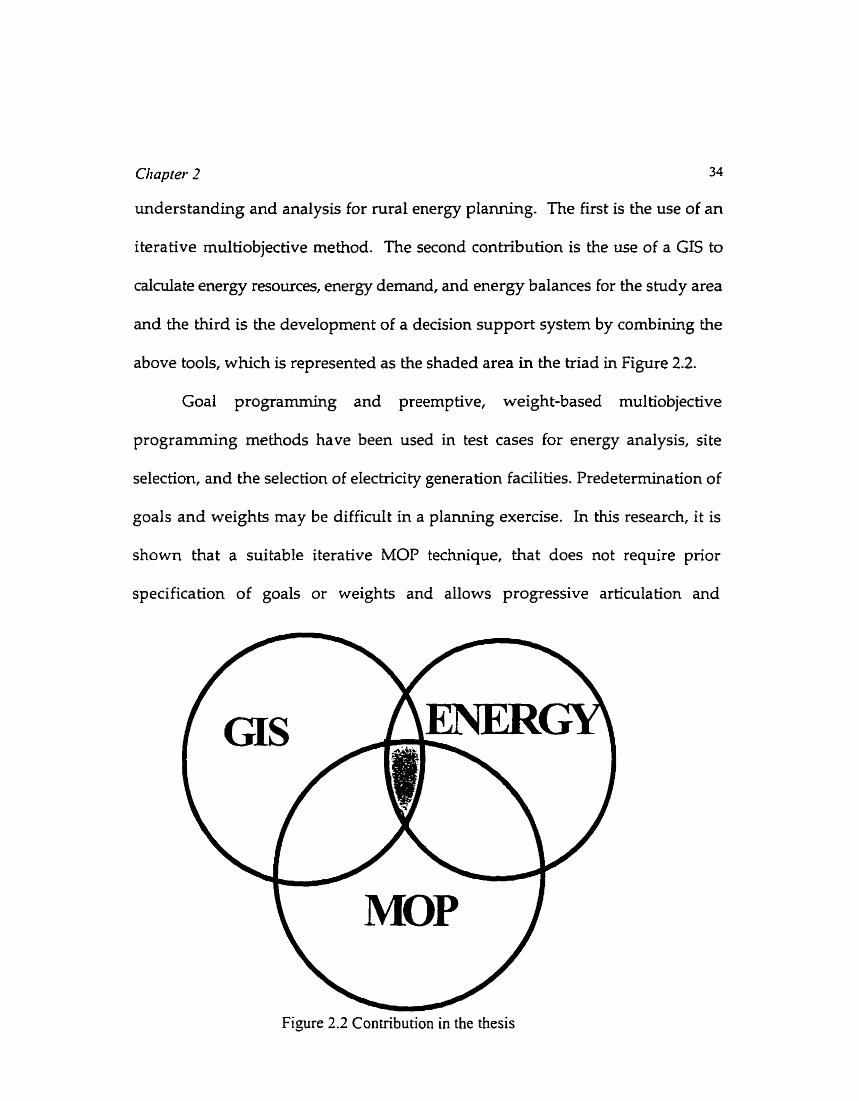
Chaprer 2 34
understanding and analysis for mral energy planning. The first is the use of an
iterative rnultiobjective method. The second contribution is the use of a GIS to
calculate energy resources, energy demand, and energy balances for the study area
and the third is the developrnent of a decision support system by combining the
above tools, which is represented as the shaded area in the triad in Figure 2.2.
Goal programming and preemptive, weight-based multiobjective
programming methods have been used in test cases for energy analysis, site
selection, and the selec tion of elechicity genera tion f a d i ties. Predetermina tion of
goals and weights may be difficult in a planning exercise. In this research, it is
shown that a suitable iterative MOP technique, that does not require prior
specification of goals or weights and allows progressive articulation and
MOP
Figure 2.2 Contribution in the thesis

Chapter 2
exploration of solutions is the best method for mral energy planning.
It is also shown that the principles of GIS could be applied for energl r dat
storage and analysis. Such an analysis is helpful for assessing the energy balance
either for the whole region or for smaller blocks within the study area.
The DSS developed by exchanging inputs and outputs between GIS and
MOP is expected to help the decision makers to explore different feasible options
or to test whether a particular option is technically feasible. As it will be seen later,
this combination allows the development of a better energy related policy.

Chapter 3
TOOLS FOR DECISION SUPPORT
In the proposed decision support system, a geographical information system (GIS)
is used for data capture, storage and analysis and a multiobjective programming
(MOP) method is used for policy analysis.
In this chapter, various MOP methods are reviewed in brief. A particular
MOP method suitable for rural energy planning is identified and reviewed in
detail. The chosen MOP method is an iterative method, which combines both
features of a decision support system: calculation and decision making.
The applicability of the principles of a geographical information system for
the development of the proposed DSS are discussed in this chapter. The literature
on the integration behveen GIS and MOP are also reviewed. The possibility of such
an integration for rural energy planning is discussed at the end of the chapter.

3.1 Multiob jective Programming
In general, a multiobjective maximization problem with 9 objective hc t ions is
defined as,
- Max[x-;.Ml, i = 1 , ...., q
s.t. X E X C W ~
Various multiobjective methods to solve problem (3.1) are reviewed in
Cohon (1978), Zeleny (19821, Steuer (1986), Nijkamp et al. (1990), and Shin and
Ravindran (1991). These methods produce solutions that are given specific names
depending upon their location and decisions made by the decision makers.
A feasible solution x' EX to problem (3.1) is called a non-infèrior or an W e n t
solution. The corresponding value of the objectivefi is called an efficient outcome if
there exists no other feasible solution y 6 X that satisfies (Cohon and Marks 1975).
fi(x9) <fi(y)fDr some k r q and
f,(x*) cf,(y) fir r 6 dBn, r = 12 ,.... k-1, k+l, ... ..q. (3.2)
In other words, a feasible solution x' is non-inferior, if there exist no other feasible
solutions that will improve the value of one objective function without degrading
the value of the other objective functions.
When problem (3.1) iç solved using the Ph objective only, then an optimum
valueho is obtained. The vector which defines the optimum values for al1 of the

chapte>- 3 38
objective functions is called an ideal solution or an utopia point (Yu 1973). The
deasion makers would like to be as "close" to the ideal solution as possible, since
it would maxirnize each of their objectives. Different MOI? methods provide
approaches to arrive at such a "dose" solution. A feasible solution that is accepted
by the decision makers is called the saf i@cing solution (after Simon 1957).
The concept of the multiobjective programming method is illustrated for a
two objetive V, andfi) mmaximization problem in Figure 3.1. The shaded area in the
figure represents the feasible objective space. Therefore, any solution that lies within
or on the boundary of the objective space is called thefensible solution. For example,
solutions that are represented by points a, b, c, d, d , and e are the feasible solutions
in the given objective space.
The solution which lies outside the feasible objective space, for example the
solution represented by point 11, is an infeasible soZution. If the solution at point u
defines the optimum values for both of the objectives, then it is called the ideal
solution.
The values of both objective functions at point d can be increased
simdtaneously to point d l as seen in Figure 3.1. It is also possible to improve the
value of one of the objective functions without decreasing the value of the other,
that is, the value of objective functionf, can be increased from d to c without
decreasing the value of objective hc t ionf , . Similarly, the value of objective
functionfi c m be increased from d to e without decreasing the value of objective
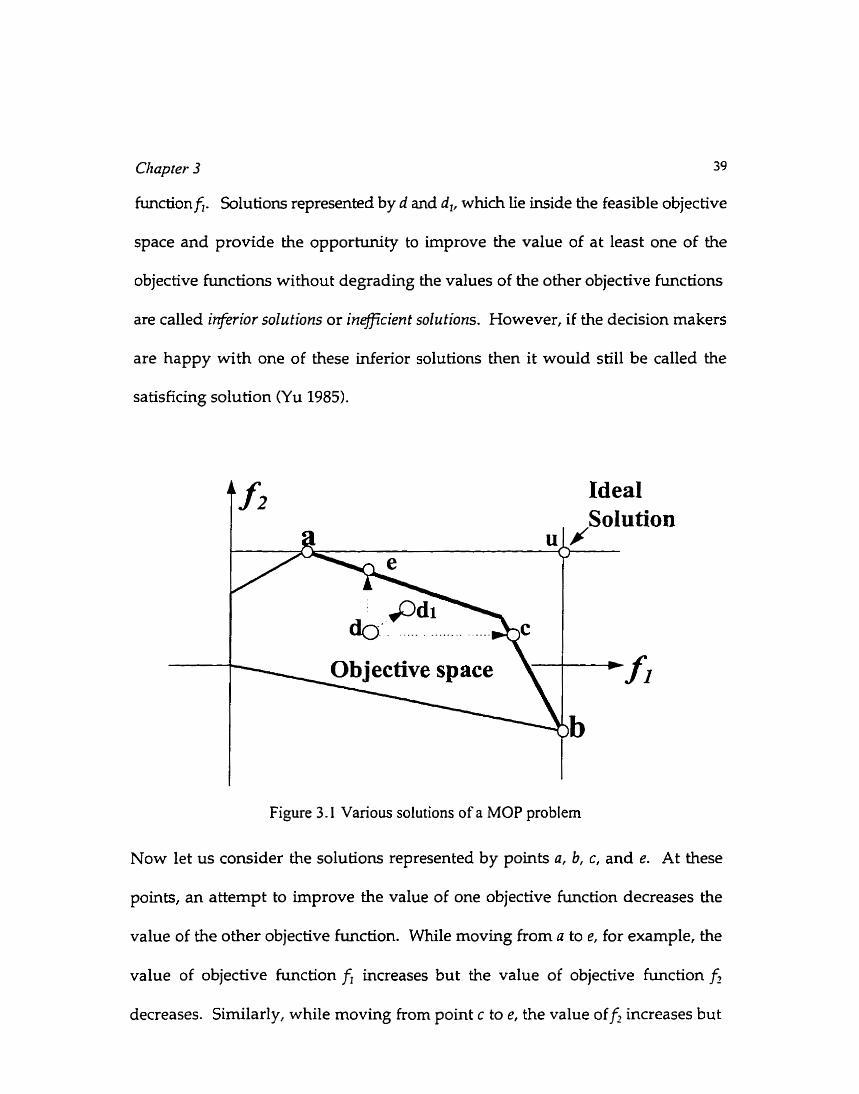
Chaprer 3 39
fundonfi. Solutions represented by d and d,, which lie inside the feasible objective
space and provide the opportunity to irnprove the value of at least one of the
objective functions without degrading the values of the other objective functions
are called infirior solutions or inficient solutions. However, if the decision makers
are happy with one of these inferior solutions then it would still be called the
satisficing solution (Yu 1985).
Figure 3.1 Vanous solutions of a MOP problem
Now let us consider the solutions represented by points a, b, c, and e. At these
points, an attempt to improve the value of one objective function decreases the
value of the other objective hc t i on . While moving from a to e, for example, the
value of objective h c t i o n f, increases but the value of objective function fi
decreases. Similarly, while moving from point c to e, the value off, increases but

Chapter 3 40
the value off, decreases. Therefore, as defined in equation (3.2), the solutions
represented by points a, b, c, and e are called non-inferior solutions or non-
dominated solutions or efficient solutions. The solution set representing the non-
inferior solutions is called the non-inferior set or the efficient frontier. The line
segment ab in Figure 3.1 is the efficient frontier.
A non-inferior solution can also be a satisficing solution. However, the
reverse is not necessarily h i e . For example, in the goal programming method,
goals for each of the objectives are set before the problem is solved. Such goals may
be represented by any feasible solution. However, in many cases, the goals may lie
within the objective space, for example at point d, , which is a feasible but infenor
solution leaving room for improvernent in the objective function values. However,
if the decision makers are happy with the solution represented by point d,, then it
is the safi@cing solution for the given goal programmùig problem.
The approach in this thesis is to Iocate a non-inferior solution, which
promotes the understanding of tradeaffs among the objective b c t i o n s being
analysed. The non-inferior solution generated by a multiobjective method is called
the compromise solution. Different multiobjective methods may lead to different sets
of compromise solutions. If the decision makers choose a particular compromise
solution for implementation, for example the solution represented by point c, then
it is referred to as the besi compromise solution.
3.2 MOP Solution Techniques
Multiobjective programming techniques can be broadly classified as generating
technique and preference-based techniques (Cohon 1978) and are discussed in the
following sections. The focus of multiobjective methods using generating
techniques is on the generation of many compromise solutions so that the decision
makers can choose one of these solutions as the best compromise solution.
Conversely, in preference based techniques, the decision makers are required to
articulate their preferences for different objective functions. Such articulation could
be done once during the formulation of the MOP problem or progressively during
the process of solution genera tion.
3.2.1 Generating techniques
The two c o m o n multiobjective methods that use generating techniques are the
simple additive weighing (SAW) method and the consbaint method. In the simple
additive weighing method, shictly positive weights are attached to the objective
functions. Then al1 the objectives are added together. This reduces the MOP
problem into a single objective programming (SOP) problem, which is solved with
a suitable SOI? method to generate a non-inferior solution. The non-inferior solution
set is generated by repeatedly solving the problem with other weights on the
objective functions. These solutions are presented to the decision makers for the
selection of the best compromise solution.
chapter 3 42
In the constraint method, the optimum value of one of the objectives is
searched for by treating the other objective functions as constraints. However, al1
of the objectives treated as constraints should be binduig at the optimal solution to
the constrained problem (Cohon 1978). The set of solutions thus generated is
preçented to the deasion makers for the selection of the best compromise solution.
The set of non-infenor solutions generated from these methods provides a
basis for selecting the best compromise solution. However, as the number of
objective functions and decision variables increases, the number of compromise
solutions also increases (Cohon and Marks 19751, which might make decision
making intractabte.
3.2.2 Preference-based techniques
The multiobjective programming methods using preference-based techniques are
either non-iterative or iterative. These methods are iess computationally intensive
than methods using generating techniques because the specification of preferences
allows the bulk of non-inferior solutions to be ignored (Cohon 1978). In the non-
iterative, preference-based methods such as the goal programming method, the
lexicographie method, and the utility function method, preemptive preferences on
the objective functions are required before solving the MOP problem.
In the iterative methods, however, preferences on the MOP problem are
progressively articulated by the decision makers. Therefore, these methods can
Chapter 3 43
promote negotiation and dialogue arnong the decision makers and lead to the
generation of a better solution for the given decision-making environment.
Examples of some preference-based iterative techniques include: interactive goal
programming (Lee 19721, local approximation of utility functions (Geoffrion et al.
19721, sequential MOP (Monarchi et al. 19731, and the STEP-method (Benayoun et
al. 1971).
The interactive goal programming (IGP) method proposed by Lee (1972)
starts with finding a solution based on predefined criteria. If this solution is not
satisfactory to the decision makers, then the tradeoff information associated with
achieved goals is used to modify the original problem. This tradeoff information
is obtained from the final tableau of the goal prograrnming simplex method. The
modified problem is solved using the goal programming method. This procedure
is repeated until a solution that satisfies the decision makers is found. Like the goal
prograrnming method, IGF may also produce an inferior solution.
The interactive method presented by Geoffrion et al. (1972) requires local
approximation of a utility function. This rnethod uses the Frank-Wolfe algorithm
for steepest axent (or descent) from the initial feasible solution (to be specified by
the detision rnakers) to obtain a compromise solution. To h d the steepest direction
of movement, the algorithm uses the marginal rate of substitutions among the
objectives. The marginal rate of substitutions provide information to find a
direction that will improve the utility h c t i o n . The information obtained for the
direction is then used to obtain the step size for the movement and the problem is
Cltaper 3 44
refomulated and solved to get the utility function. The decision makers c m choose
a solution with an improved utility function obtained in subsequent calculations.
The algorithm is stopped when there is no change in the direction and the step size.
That is, when the utility function does not change from the previous one. The
interaction with the decision makers makes this method better than the utility
function methods, however, this method assumes that the decision makers can
articulate the preferences exactly. In many cases, the approximation of a utilify
function is either difficult or impossible (Dyer 1972).
The sequential MOP (SEMOPS) technique presented by Monardu et al.
(1973) is a nonlinear iterative me thod and relies on the minimiza tion of deviations
from goals. In this method, goals are specified as intervals rather than fixed points.
In each iteration, some of the objectives are bounded by goals and are treated as
constraints. The MOI? problem is then solved to generate a non-infenor solution.
This procedure is repeated until the decision makers are satisfied with a solution.
However, as mentioned before, the specification of some goal intervals in this
method might yield an inferior solution.
The SEP-method proposed by Benayoun et al. (1971) is suitable for
analysing linear objectives and constraints. In this method, optimum values are
obtained first through the individual optimization of objectives subject to the
constraints, thus defining the ideal point. In the STEP-method, this information on
optimum values is used to calculate weights to be assigned to each of the objectives.
The problem then is to minimize the "distance" between the ideal solution and a
Chapter- 3 45
solution in the non-infenor du f ion set. The solution so obtained is forwarded to the
decision makers, who may adopt the solution as their best compromise solution.
Otherwise, the values of one or more objective functions are dianged and the
problem is solved to explore other possible solutions. Such a solution exploration
process allows the decision makers to understand the impact of their preferences
on the objectives (Johnson and Loucks 1980, Janssen 1992) and promotes the
formulation of a better policy.
None of the MOP methods are suitable for al1 applications. Therefore,
selection of a particular MOP tool for a particular application is a difficult task
(Duckstein 1982, Janssen 1992, Antunes et al. 1994). The choice of a particular
method depends upon the type of available information, the decision making
environment, and the expected output.
Methods to compare different multiobjective methods for an application are
given in Duckstein (19821, and Steuer (1986). Steuer (1986) suggests that 16
questions should be answered and analysed before choosing a rnethod. The
questions range from cornputer sophistication to CPU time required to process the
algorithm.
Duckstein (1982) has given 28 criteria divided in the following groups to
rank 17 preference-based methods of which six are iterative.
i. Mathematical programming versus detision analysis;
. . 11. Quantitative versus qualitative criteria;
. . . ui. Timing of reference determination (pnor, post, progressive); and
Chaper 3
iv. methods of comparing alternatives.
However, not all the aitena can be applied to al1 applications. The comparison of
six iterative methods indicated that only the STEP-method allows a direct
comparison between the altemate solutions. Such a direct comparison of solutions
pïoduced with different preference levels would help to make the decision makers
aware of the impact a particular preference for an objective function has on the
compromise solution. For these reasons, the SEP-method reflects the public
decision making process better. Moreover, the SEP-method is simpler to
understand and to implement, and it requires fewer iterations in obtaùUng the
required solution (Cohon and Marks 1975). However, Steuer (1986) suggests that
the SEP-Method may not be able to locate a solution. This situation could be
avoided by relaxing more than one objective at a thne and iteratively going through
the original problem. The algorithm can be implemented in single objective linear
prograrnrning packages such as G w ( G e n e r a 1 Algeb raic Modelling S ys tem) and
L N l O @ (Linear Discrete Optirnization). Therefore, this method is used for m a l
energy planning in this thesis.
3.3 The STEP-Method
As shown in Figure 3.2, the first step in the STEP-method is to formulate conflicting
objetives and constraints. Then at iteration t=O (where f = 0,1, 2, .....,4), each of the
objectives is individually optimized. This would generate an ideal solution (that
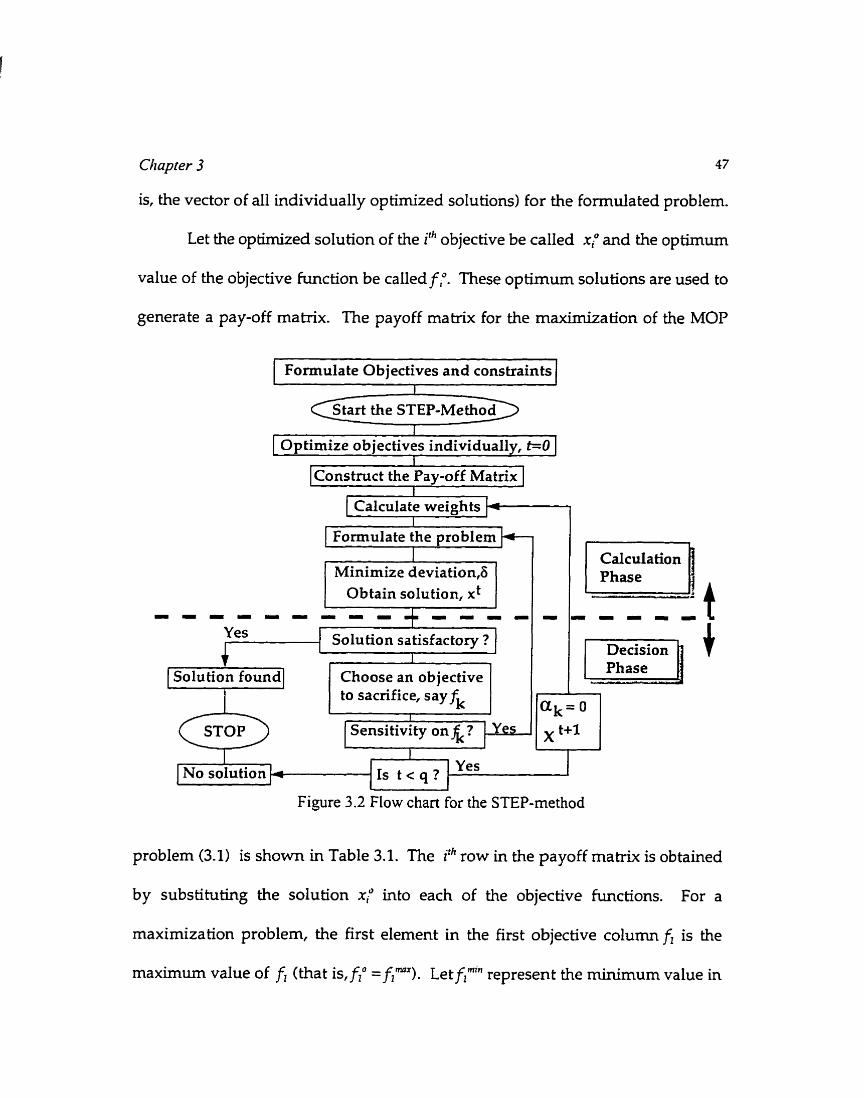
is, the vector of al1 individually optimized solutions) for the formdated problem.
Let the optirnized solution of the ith objective be called xp and the optimum
value of the objective function be called f ,". These optimum solutions are used to
generate a pay-off matrix. The payoff mahix for the maximization of the MOP
1 Formulate Objectives and constraints 1 Start the STEP-Method
I 1 Optimize objectives individually, t=O 1 I
I~onstnict the Pay-off Matrix 1 I
1 Calculate w e i g h t s j I I 1 Formulate the ~ r o b l e & k
1 Minimize deviation,& 1 Obtain solution, xt
- œ - œ m - œ
Yes I 1 Solution satisfactory ? 1
Choose an objective to sacrifice, say f
Calcula tion Phase
Phase
I
1 NO solution ~r 11s t c a ? I Y e s 1 I 1 I A
Figure 3.2 Flow chan for the STEP-method
problem (3.1) is shown in Table 3.1. The ith row in the payoff mat* is obtained
by substituting the solution x;.' into each of the objective functions. For a
maximization problem, the first element in the first objective column fi is the
maximum value of fi (that is, f," = f,""). Letfi"" represent the minimum value in
Chapter- 3
the same column.
Table 3.1 Construction of the Payoff Matrix
Solution that optimizes ith objective.
Value of ith objective fi f ,
The maximum and minimum values obtained from an objective column are first
substituted into (3.3) to obtain values for 'scoping variables' a, (i= 1,2. ...., q). Then
values for each scoping variable is wed in equation (3.4) to calculate corresponding
weights ~r, (i = 1,2, ...., q) for each of the objective functions being analysed. The
weights ~r,s obtained in the STEP-method are effective only in one iteration.
and n, - - 4-

Chapzer 3 49
In equation (3.31, ai, refers to the coefficient of the jth decision variable in the i"
objective. Benayoun et al. (1971) suggest that the term with the objective
coefficients a, in equation (3.3) nomalites the values taken by the objective
function.
When the difference between the maximum and minimum value for an
objective is srnail, the weight to be assigned to that objective also becomes srnall.
This means that there is not much room to manoeuvre on the value of the particular
objective and it is not a good objective to sacrifice in order to obtain changes in the
other objectives (Benayoun et al. 1971).
The weights calculated using equation (3.4) are associated with their
corresponding objectives to obtain the non inferior solution closest to the ideal
solution. The equation shown below is developed for problem (3.1).
In the above equation, 6 is the deviation between the ideal solution and the non-
inférior solution in each iteration t. In the first iteration, X1 = X. Let the solution
obtained in iteration t be called x' and the values of the objective functions
corresponding to this solution be calledf.
The values of the objective functions and the solution 2 obtained by solving
Chapter 3 50
equation (3.5) are presented to the decision makers, who, if satisfied with it, accept
it as the best compromise solution and stop the SEP-method algorithm. Otherwise,
the decision makers choose the value of an objective$ cf to sacrifice. The value
off,' is altered by a value Af, chosen by the decision makers. If Ah is reduced from
the current solutionfit, then the new decision space X '"in iteration t = t+l is
formulated as s h o m in equation (3.6).
For this new problem a, is taken as zero, therefore, rk = O. That is, the solution for
the Ph objective is fixed in this iteration. However, the values of other scoping
variables remains the same as in the first iteration. Then the weights I T ~ for the
rernaining objectives are computed using the equation (3.4). The modified problem
incorporating (3.6) is then solved to obtain a new compromise solution. If the
decision makers are not satisfied with the new solution, then this procedure is
repeated until the number of iteraiions equals the number of objectives. Sensitivity
analysis could be done either by setting a target forfi or by setting different values
of Af, and then solving the modified problem repeatedly. This type of sensitivity
analysis is called the standard sensitiuity analysis (Benayoun et al. 1971, Hwang and
Masud 1979).
Cltaper 3 5 1
If the best compromise solution for the MOP problem is not found in ts q
iterations, it is concluded that the best compromise solution does not exist (Cohon
and Marks 1975), and the STEP-method algorithm is terminated. This situation can
anse when the decision makers do not want to alter their position. Then obviously,
there would be no solution. However, such a situation could be avoided by doing
standard sensitivity analysis or by choosing to relax more than one objective in one
i teration.
The STEP-method has been applied to analyse capacity planning and
resource ailocation in a department of the University of saabmecken, Germany, by
Dinkelbach and Isermam (1980). It has also been applied for water resources
planning by Loucks (1977) and Johnson and Loucks (1980). The authors argue that
the STEP-method is suitable for public decision making. In the water resources
application, Johnson and Loucks (1980) used computer graphics to illustrate
solutions at each iteration of the STEP-method. The authors suggest that the use of
computer graphics enhances the understanding of altemate solutions and promotes
a closer interaction among the decision makers.
Antunes et al. (1992) have developed a software package to evaluate
multiobjective programming problem. The package, developed in Apple
~acin tosh~, implements the STEP-method as one of its modules. The most recent
version of the software can analyse three objectives, 64 constraints, and 116
variables.
Korhonnen (1992) and Zionts (1992) argue that future development in MOP

Chaprer 3 52
should be on its applicability in a decision support system (DSS) fiarnework. If
computer graphics are induded in a DSS then the understanding of the alternatives
would be improved (Dikson et al. 1986, Tufte 1990, Korhonnen 1992, and Zoints
1992). Eom and Lee (1990) found that current decision support systems use
multiobjective-based models and computer graphics more than the simulation
models.
3.4 Geographical Information System
A geographical information system (GIS), in its simplest form, can be described as
location specific information. In a GIS, geographical data in maps, slides, and
photographs provide references to the non geographical data (called attributes).
Geographical data are represented as points, lines, and polygons. A point
represents a location. A line feature is a combination of arcs and nodes and
represents features like roads and streams. A polygon represents an area enclosed
by lines.
Geographical data are stored either in vector format or raster format.
Remote sensing data or scanned data are, for example, available in raster format,
in which the attribute and position of a line, point, or area are represented by a grid
cell(s), their size depending upon the available reçolution of the data or the required
accuracy. Normally, the smaller the grid cell the better the accuracy. in vector
format, the positions of points, lines, and polygon can be more precisely located
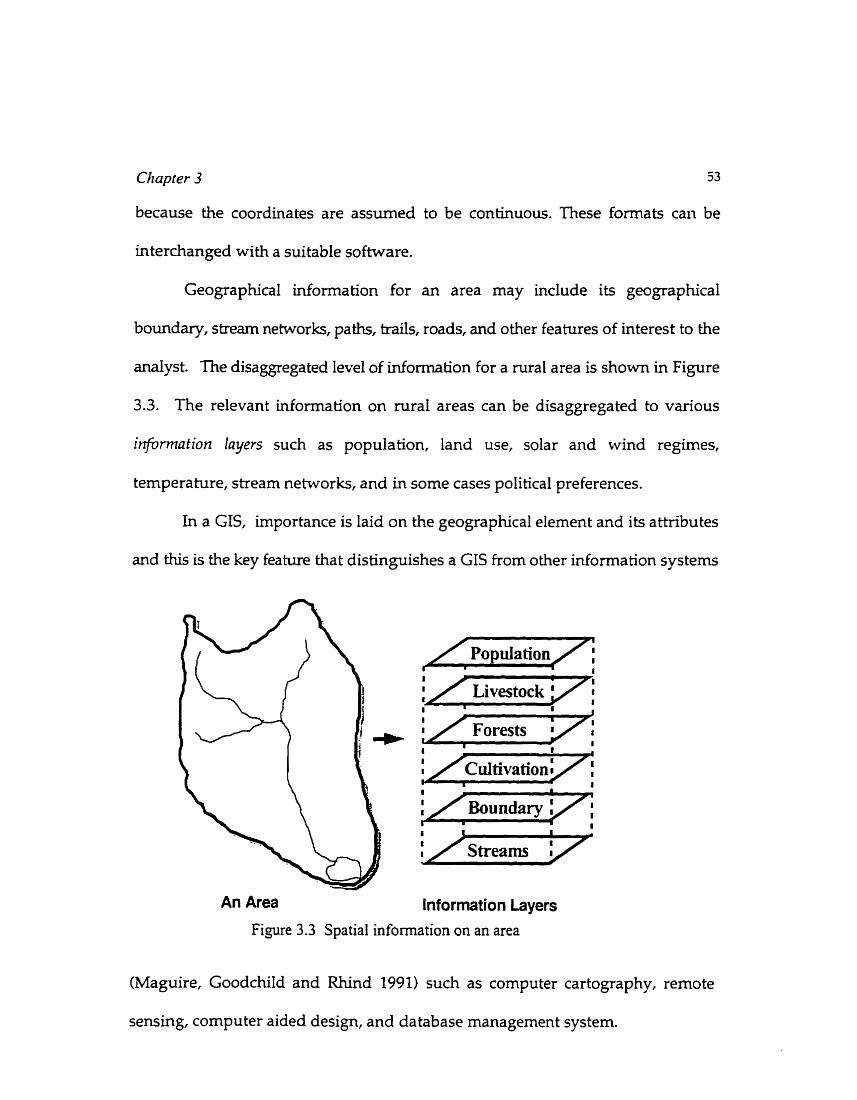
Chaper 3 53
because the coordinates are assumed to be continuous. These formats car1 be
interchanged with a suitable software.
Geographical information for an area may include its geographical
boundary, strearn networks, paths, trails, roads, and other features of interest to the
analyst The disaggregated level of information for a rural area is shown in Figure
3.3. The relevant information on rural areas can be disaggregated to vanous
i+nnation layers such as population, land use, solar and wind regimes,
temperature, stream networks, and in some cases political preferences.
In a GIS, importance is laid on the geographical element and its attributes
and this is the key feature that distinguishes a GIS from other information systems
An Area Information Layers
Figure 3.3 Spatial information on an area
(Maguire, Goodchild and Rhind 1991) such as computer cartography, remote
sensing, computer aided design, and database management system.
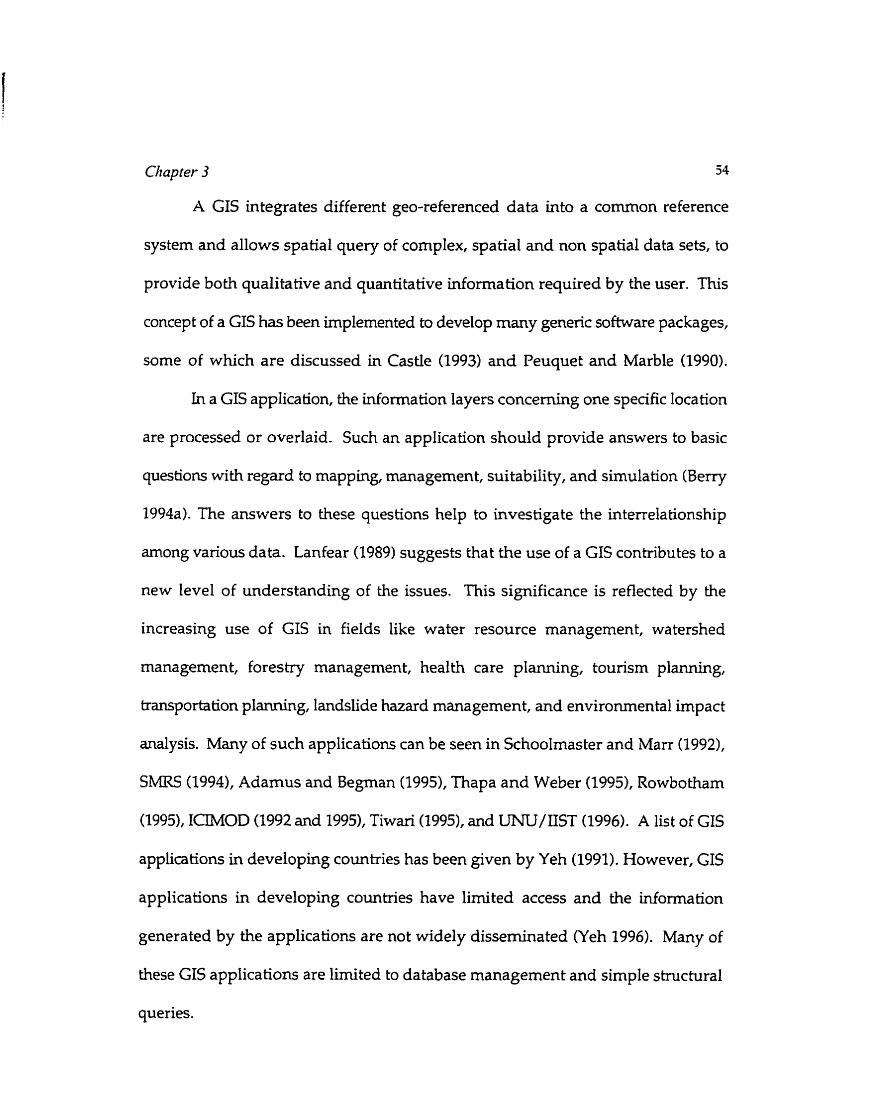
Cltaprer 3 54
A GIS integrates different geo-referenced data into a cornmon reference
system and allows spatial query of cornplex, spatial and non spatial data sets, to
provide both qualitative and quantitative information required by the user. This
concept of a GIS has been implemented to develop many generic software packages,
some of which are discussed in Castle (1993) and Peuquet and Marble (1990).
In a GIS application, the information layers concerning one specific location
are processed or overlaid. Such an application should provide answers to basic
questions with regard to mapping, management, suitability, and simulation (Berry
1994a). The answers to these questions help to investigate the interrelationship
arnong various data. Lanfear (1989) suggests that the use of a GIS contributes to a
new level of understanding of the issues. This signifieance is reflected by the
increasing use of GIS in fields like water resource management, watershed
management, forestry management, health care planning, tourkm planning,
transportation planning, landslide hazard management, and environmental impact
analysis. Many of such applications can be seen in Schoolmaster and Marr (1992),
SMRS (1994), Adamus and Begrnan (1995), Thapa and Weber (19951, Rowbotham
(1995), ICIMOD (1992 and 19951, Tiwari (1995), and UNü/IIST (1996). A list of GIS
applications in developing countries has been given by Yeh (1991). However, GIS
applications in developing countries have lirnited access and the ùiformation
generated by the applications are not widely disseminated (Yeh 1996). Many of
these GIS applications are limited to database management and simple structural
queries.

3.5 GIS and Decision Support System
The decision process trançforms the inputs as individuals and information through
a mode1 (or method) so that a decision can be obtained. Therefore, the quality of
a decision depends upon the inputs and the methods adopted for anatysis (Janssen
1992).
If the result obtained from a spatial mode1 could be processed by using an
extemal model, as shown in Figure 3.4, then the combination of spatial and extemal
models acts as a spatial decision support system, SDSS (Densham 1991) or a
deasion support systern (DSS) for a particular application (Fedra and Reitsrna 1990,
Burrough 1992, Engel et al. 1992, Johnson 1990, Kontoes et al. 1993, Rhind 1992, van
der Meulen 1992). Such an integration also helps the decision makers to solve
problerns in Iess time mainly for three reasons -- provision of interactive colour
Geographical Information System
Reports
- Data .L I I I
USER External
Input Mode1 Figure 3.4 Spatial decision suppon system

Chapter 3 56
displays, the effiaency in displaying maps, and a better grasp of problems because
of a better display with a GIS (Crossland et al. 1995). The decision makers may
resort to a judgemental decision too, avoiding the solution provided by the system,
however, the type of integration and interaction provided by a DSS would be of
great value in preparing such decisions (Kreglewski et al. 1991).
Decision making involves the analysis of confiicting objectives, therefore, the
effectiveness of such a DSS could be incrêased by analysing the GIS output with a
MOP mode1 (Wierzbicki 1983). Such a DSS should be easy to leam and should
provide meaningful information (Loucks 1995). A DSS allows iterative use of the
framework. Repeated inputs from the decision makers can alleviate the practice of
forcing the problem into a solvable form (Vertinsky et al. 1994). The inputs may
suggest that some choices of the decision makers may not be feasible under the
given decision making circumstances.
A DSS allows the decision makers to pose different quenes to solve
unstructured problems (Bracken and Webster 1989). Since MOP is only a
mathematical tool, with no database management system attached to it and a GIS
is a database management system, the integration of the two could result in an
interactive decision support system for an application like energy planning.
The recent work into integrafirtg a MOP method with a GIS to develop a DSS
can be seen in Canrer (1991). Janssen and Herwijen (1991), Diamond and Wright
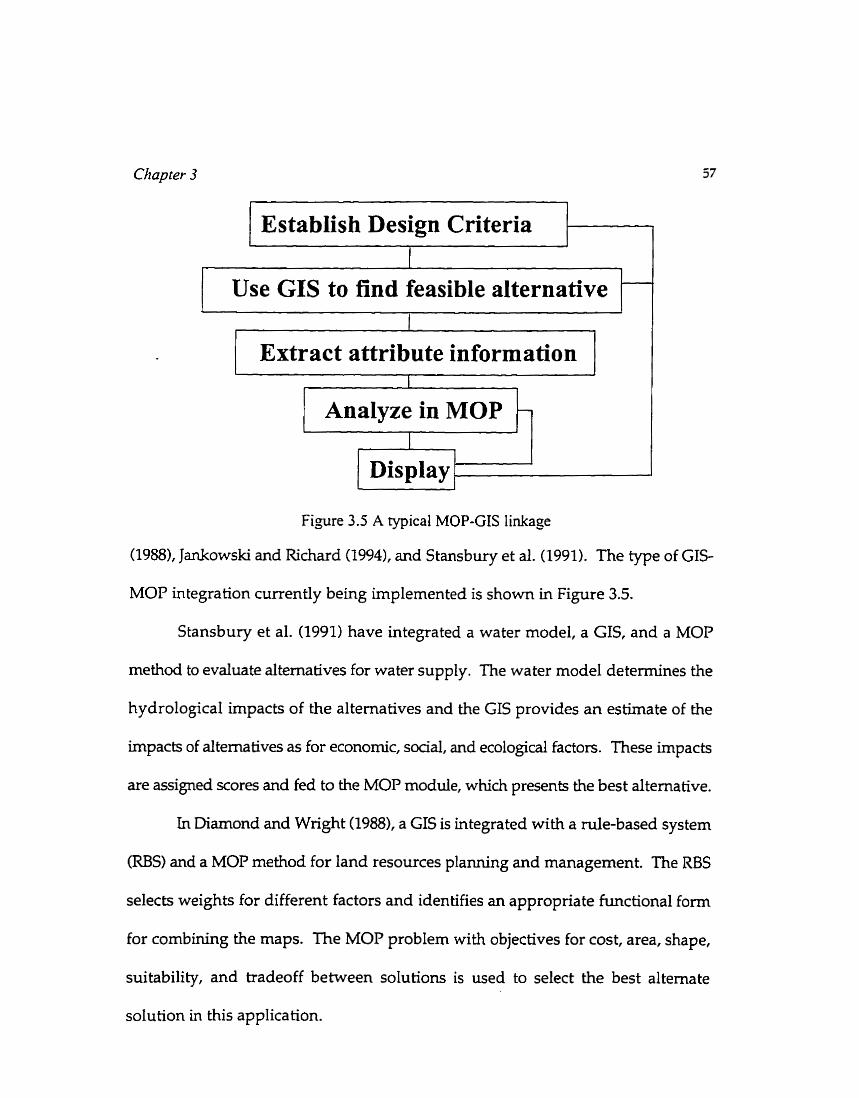
/ Establish Design Criteria - PL
Extract attribute information
I I
1
I
Use GIS to find feasible alternative
Figure 3.5 A typical MOP-GIS linkage
-
Analyze in MOP
(19881, Jankowski and Richard (19941, and Stansbury et al. (1991). The type of GIS-
MOP integration currently being implemented is shown in Figure 3.5.
Stansbury et al. (1991) have integrated a water model, a GIS, and a MOP
method to evaluate alternatives for water supply. The water model determines the
hydrological impacts of the alternatives and the GIS provides an estimate of the
impacts of alternatives as for economic, social, and ecological factors. These impacts
are assigned scores and fed to the MOP module, which presents the best alternative.
In Diamond and Wright (1988), a GIS is integrated with a de-based system
(RBS) and a MOP method for land resources planning and management. The RBS
selects weights for different factors and identifies an appropriate functional f o m
for combining the maps. The MOP problem with objectives for cost, area, shape,
suitability, and tradeoff between solutions is used to select the best altemate
solution in this application.
- I
Chapter 3 58
Carver (1991) has integrated a GIS with a MOP method for disposa1 of
radioactive waste in the United Kingdom. In his application, alternative sites
produced by a GIS overlay were weighed based on their perceived level of
importance to identify a srnaller nurnber of compromise alternatives. The author
has recommended further researdi on such an integration for other applications but
warns that the technique bias and preference bias could lead to a completely
different set of results.
A GISbased land suitability analysis and MOP are integrated by Jankowski
and Richard (1994) to select water supply routes. The authors view that their
approach produces a better decision, as the spatial analysis involves an entire set
of critena rather than a set of only pressing criteria.
3.6 Energy Policy Formulation
Blair (1979) indicates that an energy policy should be judged by assessing scientific,
technological, econornic, environmental, and societal feasibility. The inciusion of
scientific, technological, and economic factors in energy planning were mentioned
in Chapter 1. Environmental and societal factors are ljeing considered only
recently. Environmental factors deal with the impact of technology on the quality
of the environment. Societal factors, for example, willingness to accept a policy,
generally deal with human perception, which could be improved by involving the
local beneficiaries into the decision-making process. However, it has been observed

Chapter 3 59
that when the benefits korn a program are tangible, visible, and immediate, then
the program is embraced by the local beneficiaries (DSCWM 1990). The success of
a program due to local participation is also highlighted in Periera (1983).
There are two aspeds of energy planning. When the decision makers are not
aware of the local situations as to the resource use pattern, then there is a very high
chance of culminating conflicts in energy decision making and irnplementation.
Therefore, it is important that the energy deasion support system should be simple
for communication and it should clearly present the energy situation. The second
aspect is the objectivity of energy planning. For exarnple, energy problems may not
be the (first) priority of the people. They might be more interested in resolving
other issues like employment and environment For example, in a study conducted
by DSCWM (1990), the list for improvement included trails, water source
protection, canal improvement, conservation plantation, and gully control.
Therefore, energy programs should show that the identified issues are being
addressed to the extent possible.
Energy analysis is spatial in nature as energy consumption and reçources are
linked to a specific location. The information on forests, cultivated land, solar
radiation, water availability, Stream networks, elevation, tempera tue , rainfall
pattern, and population could be used to study the energy resources potential.
Similarly, the information on population and energy consumption attributes could
be used to study the energy demand in a planning area. ï h e energy balance sheet
for the area can be prepared by overlaying the information on energy resources and
Chaper 3 60
energy demand. The energy balance sheet indicates the energy surplus or deficit
blocks in an area. Identification of such pockets can help the decision makers to
choose the best energy alternative or energy intervention prograrns, through MOI?
analysis, targeted either to those pockets or to the whole planning area.
One of the earliest recommendations to establish an "indicative" energy
system domain came from Morse et al. (1984). Such an analysis could be performed
in an ecological area rather than an administrative area because a rural energy
system is also a manifestation of the ecosystem. DSCWM (1990) views that the use
of thematic maps on a particular area leads to the development of a better
management plan. Ramani (1988) views that planning at the village level may
ignore the structure of the local govemment from where a part of resources may
have to be extracted. Therefore, as suggested by Conway (1987) and Sinha et al.
(19941, analysing the energy system on a cluster of villages (or on a watershed level)
would be more effective. Watson and Wadsworth (1996) have also used a river
catchment (watershed) for their research on the development of a rural policy
formulation system The result so obtained can provide location specific guidelines
for different parts of administrative areas (Morse et al. 1984).
The integration of a GIS and a MOP method enhances the understanding of
a rural energy situation, promotes an interactive decision-making process, and
helps in formulating energy policies. In such a system, a GIS would be helpful in
managing data and the MOP method would be helpful in analysing the policy
al terna tives.

Chapter 3 6 1
When a problem is forwarded for analysis in different conditions, for
example, short term planning versus and long term planning, a different set of
decision makers, or decision making at different times, the decision makers will
undoubtedly assign different values to the objectives, variables, and the constraints
(Densham 1991). Therefore, the decision support system should be flexible enough
to incorporate the variations in decision-making environment.
Chapter 4
ANALYSIS METHODOLOGY
The management and p1-g of energy resources requires an organized decision-
making method. Such an approach can help the decision makers to tackle different
situations during decision making. Checkland and Scholes (1990) suggest that in
such a situation, a sofi systerns methodology, based on the systems approach, which
promotes a dear problem definition, is very useful. Odum and Odum (1976) have
shown that such an approach could be applied to various fields including energy
analysis. The systems approach includes an iterative process of systems analysis
and decision making. The systems analysis part includes identification of the
problem, evaluation of information, alternate solution generation, and solution
evaluation. This process could be largely handled by the geographical information
system. The decision making process includes the selection of a solution, and its
implementation and evaluation. This process could largely be handled by the
multiobjective programming methodology. Such an approach, therefore, directs the
62
Chapter 4 63
decision makers to interactively seek a workable solution in the given decision-
making environment
As shown in two models below- spatial and multiobjective-- this research
follows a systems approach in the analysis and selection of a particular energy
policy within the physical boundary of a planning area and the conceptuai
boundary defined by energy related resources - human and livestock population,
land use pattern, hydrology consideration, solar radiation and wind velocity, and
technological choice.
4.1 The Spatial Mode1
To develop the spatial model, the information on spatial distribution, such as land
use and resources, should be collected first. This information might be available in
thematic maps or in digitized form. If the information is available in thematic
maps, then the maps need to be digitized into information layers. However, if the
digitized information is available, then the information might have to be edited to
process data into different information layers. Recent aerial photographs, if
available, can aid in updating the land use information. If such information is not
available, then a base map or an administrative map should be digitized first and
a m a l appraisal should be conducted to c o d t the local people for approximating
the availability of different resources and demands. The local people are best
informed as to the availability of resources and "outsiders," as termed by Chambers

Chapter 4
(1993) for researchers, should leam from them.
When the basic information is ready, attribute information like forest types
and crown cover densities, should be added to obtain information layers (or
cuumages) in the spatial database. These coverages are either redassified or added
with entities to arrive at energy coverages. The collection of these coverages, with
their capability for query and other analysis has been termed the Energy IrrJormation
Sysfm (EIS) in this thesis. The spatial mode1 that considers local energy sources for
the proposed DSS is shown in Figure 4.1 and an expected data dictionary is given
in Table 4.1.
Six local energy resources coverages are considered here. Lnformation in
these coverages can be processed to arrive at biomass and nonbiomass resource
modules. A biomass module consists of information on fuelwood, crop residues,
and manure (and biogas) and a nonbiomass module consists information on solar,
micro hydro, and wind energy potential in the area. Kerosene and grid electricity
are also used in the watershed, but they have to be imported into the area. As
shown later, two additional energy consurnption layers are created to show
electricity and kerosene consumption in the watershed.
The energy demand coverage is created by overlaying the boundary and
population coverages and then adding energy consurnption attributes. These
attributes are either processed as a proxy value obtained fiom nearby sirnilar
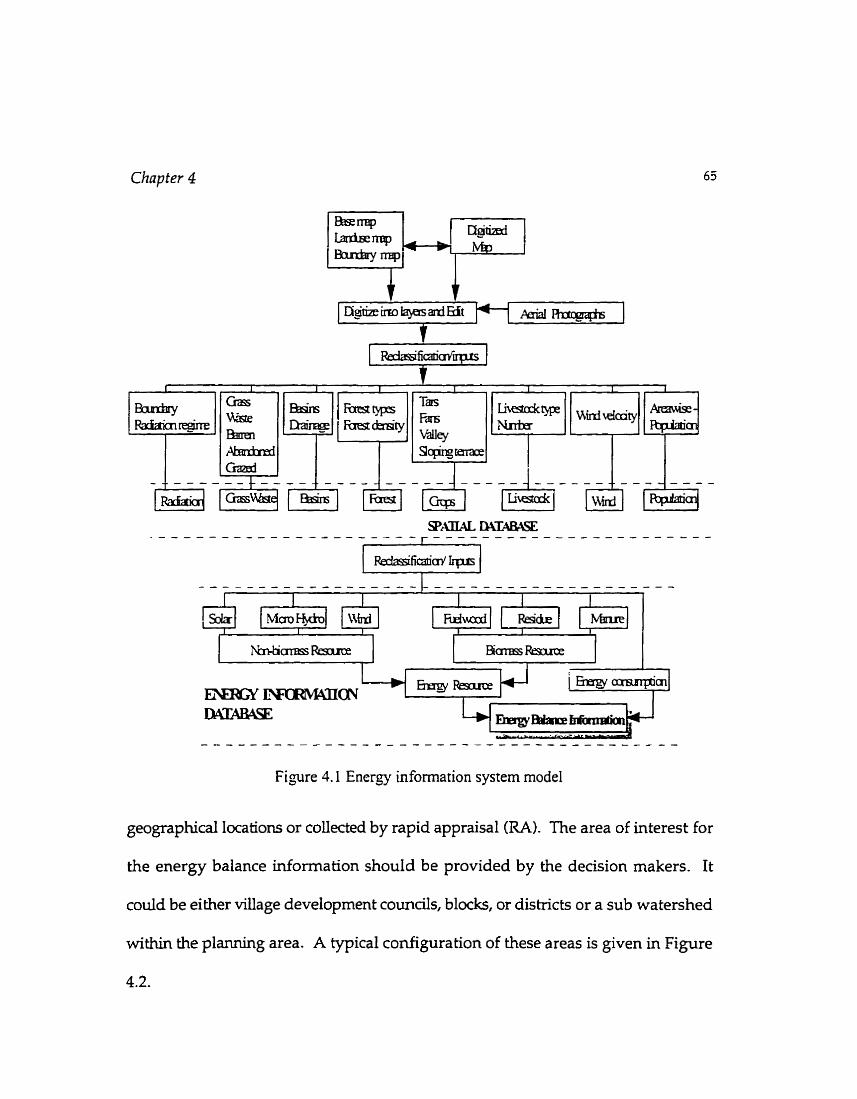
Chapter 4
mm-
Figure 4.1 Energy information system mode1
geographical locations or coliected by rapid appraisal (RA). The area of interest for
the energy balance information should be provided by the decision makers. It
could be either viilage development councils, blocks, or districts or a sub watershed
within the planning area. A typical configuration of these areas is given in Figure
4.2.
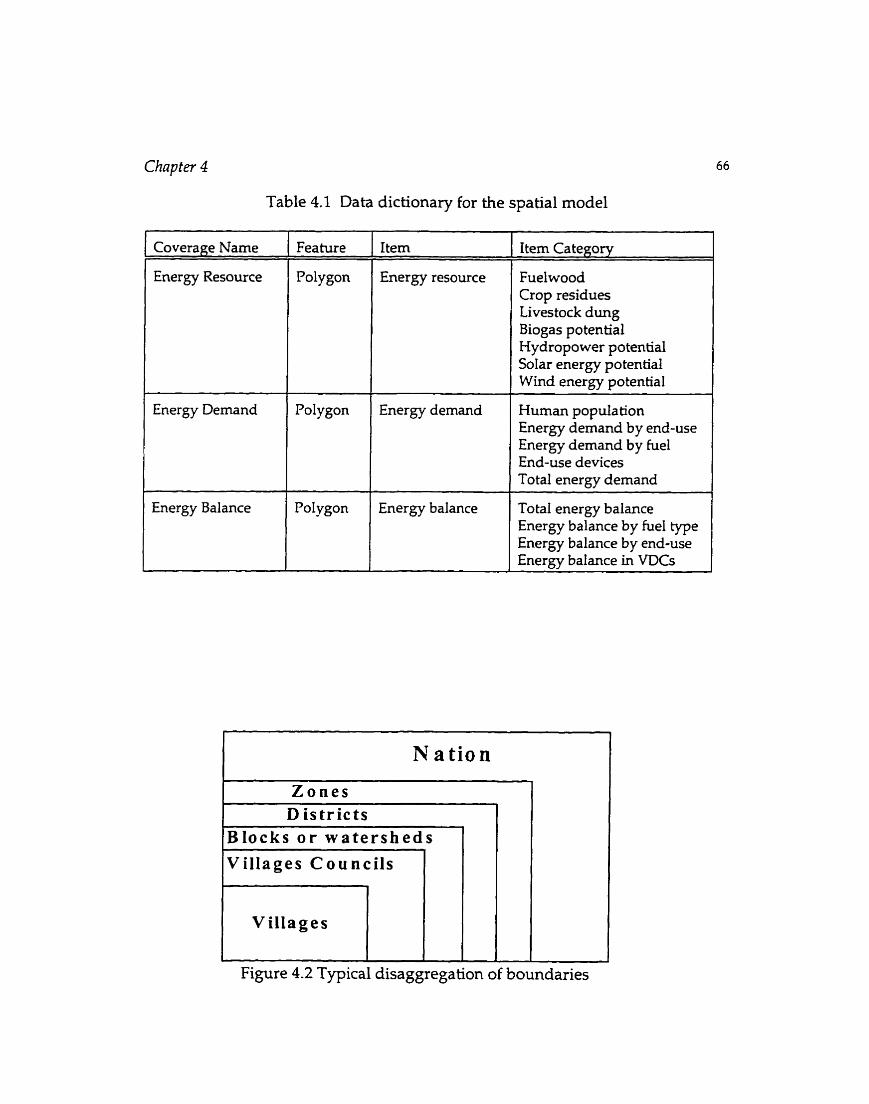
Chnpter 4
Table 4.1 Data dictionary for the spatial mode1
Coverage Name
Energy Resource
Energy Demand
Energy Balance
Fea ture
Polygon
Pol ygon
Polygon
Item
Energy resource
Energy demand
- -
Energy balance
Item Category
Fuelwood Crop residues Livestock dung Biogas potential Hydropower potentia Solar energy potential Wind energy potential
Human population Energy demand by end-use Energy demand by fuel End-use devices Total energy demand
Total energy balance Energy balance by fuel type Energy balance by end-use Enerm balance in VDCs
N a t i o n
I Z o n e s 1 Distr ic ts 1 l ~ l o c k s o r w a t e r s h e d s 1 1 Villages Counc i l s
Vi l lages
Figure 4.2 Typical disaggregation of boundaries
Chnp ter 4
4.2 The Multiobjective Mode1
The set of objectives that cm be considered for planning in different distiplines
such as production, forestry, and staff allocation is given in Steuer (1986). The
author suggests that maxunization of sustainable yields of forest, visitor days of
dispersed reaeation, wildlife habitat and months of grazing, and rninimization of
budget allocation could be the conflicting objectives for forestry management.
Chetty and Subramanian (1988) give three energy planning objectives as
minimization of energy cos& and use of non-local energy resources, and
maximization of system effiaency. In addition, Ramanathan and Ganesh (1993 and
1994) also consider maximization of ernployment generation, use of local energy
resources, and minimization of poilutant emission. However, minimization of non-
local resources and maximization of local energy resources may not be conflicting
objectives.
General objectives considered in an energy planning exercise are discussed
below. The parameten used to define the multiobjective mode1 are assumed to be
linear and it is also assumed that the chosen policy could be implemented. There
are two approaches to ensure the implementation of the proposed policy: fop-down
and botfom-up. In the top-down (or forward) approach, it is assumed that
considerable thought has been given to the formulation of objectives. In the bottom-
up (backward) approach, it is assumed that only those solutions which are
impiementable should be chosen. The backward approach is useful if the

Chapter 4 68
consequences of a planning policy could be foreseen or could be compared with
similar projects near the planning area.
To formulate the multiobjective mode1 for energy planning, let the subscript
of planning variables used in Chapter 3 be rede@ed here. Let x,,, be the variable
to be used for energy analysis. This variable represents the secondas. energy (for
example, the gigajoule value of one metic ton of fuelwood) to be met by fuel i
used in end-use device j for end-use' k in area p. If the study area is not
disaggregated to sub areas, then the fourth suffix p is omitted. Table 4.2 shows the
combination of ijk used in the analysis.
The list presented in Table 4.2 is not exhaustive but represents major fuels,
end-use devices, and end-uses in the rural areas. As shown in Table 4.2, not al1 of
the fuels c m be used in dl of the listed devices. For example, fuelwood can be bumt
in tripod stoves, traditional stoves, or efficient fuelwood stoves for cooking, feed
preparation, space heating, food processing, and water heating. As another
example, biogas cannot be fed into a fuelwood stove. In these cases, the coefficient
of the energy variables is set to zero.
The uni& of measurement for secondary energy is taken as gigajoules for al1
energy sources so that energy produced by a fuel could be combined to develop the
energy balances. This unit is also adopted by many international agencies to
convert the primary units of fuel (such as tons, litre, and kilowatt hours) to a
common unit (UN 1987). Other units of measurement could be ton of coal
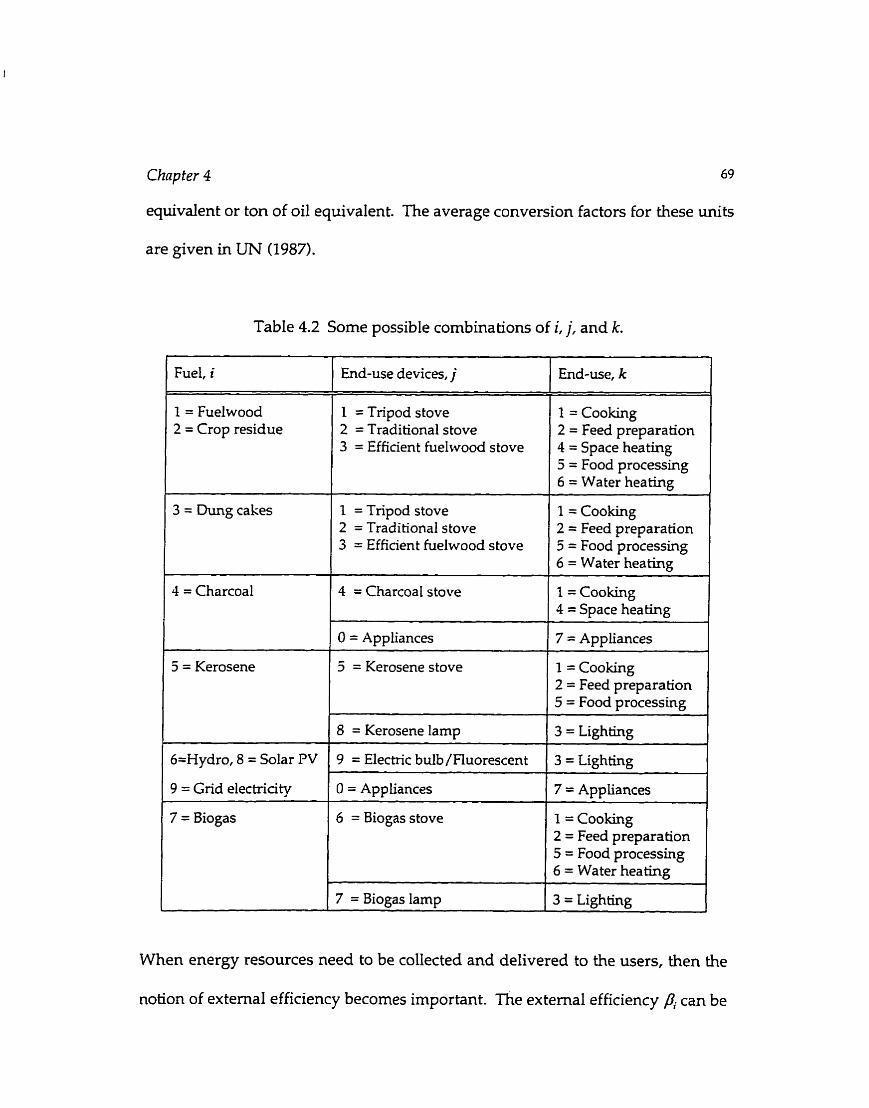
Chapter 4 69
equivalent or ton of oil equivalent The average conversion factors for these unit5
are given in UN (1987).
Table 4.2 Some possible combinations of i, j, and k.
1 Fuel, i
1 = Fuelwood 2 = Crop residue
4 = Charcoal
5 = Kerosene
6=Hydro, 8 = Solar PV
9 = Grid electricity - -
7 = Biogas
1
i
End-use devices, j 1 End-use, k
1 = Tripod stove 2 = Traditional stove 3 = Efficient fuelwood stove
1 = Cooking 2 = Feed preparation 4 = Space heating 5 = Food processing 6 = Water heating
1 = Tripod stove 2 = Traditional stove 3 = Efficient fuelwood stove
4 = Charcoal stove
O = Appliances
6 = Biogas stove
1 = Cooking 2 = Feed preparation 5 = Food processing 6 = Water heating
1 = Cooking 4 = Space heating
7 = Appliances
5 = Kerosene stove
8 = Kerosene lamp
9 = Electic bulb/Fiuorescent
O = Appliances
1 = Cooking 2 = Feed preparation 5 = Food processing 6 = Water heating
1 = Cooking 2 = Feed preparation 5 = Food processing
3 = Lighting
3 = Lighting
7 = Appliances
When energy resources need to be collected and delivered to the users, then the
notion of extemal efficiency becomes important. The extemal efficiency 4 can be
7 = Biogas lamp 3 = Lighting

Chapfer 4 70
defined as the efficiency of collection and possibly conversion of an energy source
to a w a b l e fonn. The other efficiency factor, which becomes important in energy
analysis is the end-use device efficiency, rl,. This efficiency defines the ratio of
energy that is delivered by a proper end-use device to perform an energy service
to the energy fed to the end-use device.
The extemal efficiency, Pi, and the end-use efficiency of different devices are
given in Table 4.3. The extemal efficiency for fuelwood, crop residues and animal
manure denotes collection efficiency. The extemal efficiency of animal manure is
the ratio of coilectable manure to total manure produced by the livestock. When the
animals are grazed for a longer period, the dung collection efficiency reduces
considerabl y.
The extemal efficiency for grid electricity is the efficiency of distribution.
The higher losses of eleciricity are due to technical losses in distribution and at the
sub-station (for stepping down the voltage). In the case of local electricity
generated by micro hydro units, the efficiency is lower because of converter
efficiency and distribution losses.
The extemal efficiency for charcoal includes charcoal conversion (from
fuelwood) and collection efficiency. The extemal efficiency for solar photovoltaic
indicates an 11% of conversion efficiency, about 60% of battery and inverter
efficiency, and about 75% of distribution efficiency. The system efficiency is the
product of end-use device efficiency and the external effïciency.
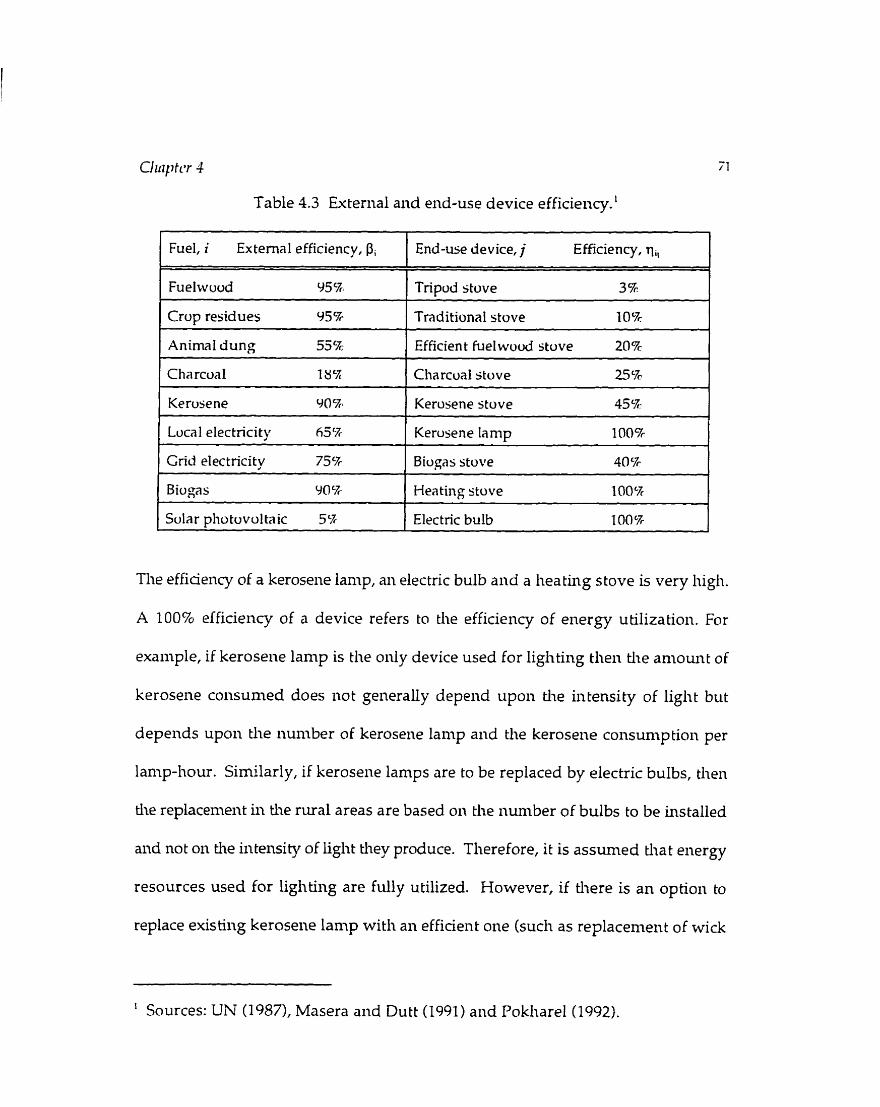
Table 4.3 Exteriial and end-use device efficiency.'
1 Fuel, i External efficiency, Pi 1 EnJ-use device, j Efficiency, qi, I
1 Crop residues 95% 1 Traditional stove 10% 1 Fuelwuod 95% Tnpod stove 3%
Kerosene 90% 1 Kerosene stove 45 % I
Aninml dung 55%
C ha rcoa1 18%
Efficient fueI wood stove 20%
Charcual stove 25 %
Local eIectricity 65%
Grid electricity 75 %
1 Sular photovoltaic 5% 1 Electnc bulb 100% I
Kerusene lamp 100%
Biogas stove 40%
Biogas 90%
The efficieiicy of a keroseiie lamp, ai electric bulb and a liea tiiig s tove is very liigli.
A 100% elficieiicy of a device refers to tlie efficiency of eiiergy utilization. For
example, if kerosene lamp is tlie only device used for ligliting tlien the a m o u t of
kerosene coiisunied does iiot generally depeiid upon die intensity of liglit but
depeiids upoii the iiuntber of kerosene lamp and tlie keroseiie consuniption per
lamp-hour. Similarly, if kerosene lamps are to be replaced by electric bulbs, tlieii
the replacenient in the rural areas are based on the iiumber of bulbs to be installed
and not on tlie inteiisity of ligltt they produce. Tlierefore, it is assumed tliat energy
resources used for ligliting are fully utilized. However, if there is an option to
replace existing kerosene lamp witli an efficient one (such as replacement of wick
Heating stove 100%
' Sources: UN (1987), Masera aiid Dutt (1991) and Pokliarel (1992).

Chapter 4 72
lamp by humcane lamp) or replacement of incandescent bulb with a fluorescent
bulb, then the intensity of light (or lumens) produced by these devices should also
be taken into accouit.
4.2.1 Energy planning objectives
The goal of any representative govemment is to maxùnize the social welfare of its
people. Economic efficiency, equity, and environmental quali ty are the main ideals
of social welfare (Cohon 1978). However, such qualitative ideas should be
quantified for planning purposes (Changkong and Haimes 1983). Table 4.4
highlights objectives and constraints that could be exarnined for energy planning.
Some of these objectives have been analysed in this thesis.
Table 4.4 List of possible objectives and constraints
Objectives
1. Economic Objectives - Reduced cost; - Increased efficiency; - Reduced energy input;
2. Equity Objectives - Increased employrnent;
- -
- Use of local resources; 3. Environmental Objectives
- Reduceci pollution
1. Limit on sustainable energy supply;
2. Meet al1 energy demand; 3. Limit on technology; 4. Limit on extemal energy
supply;
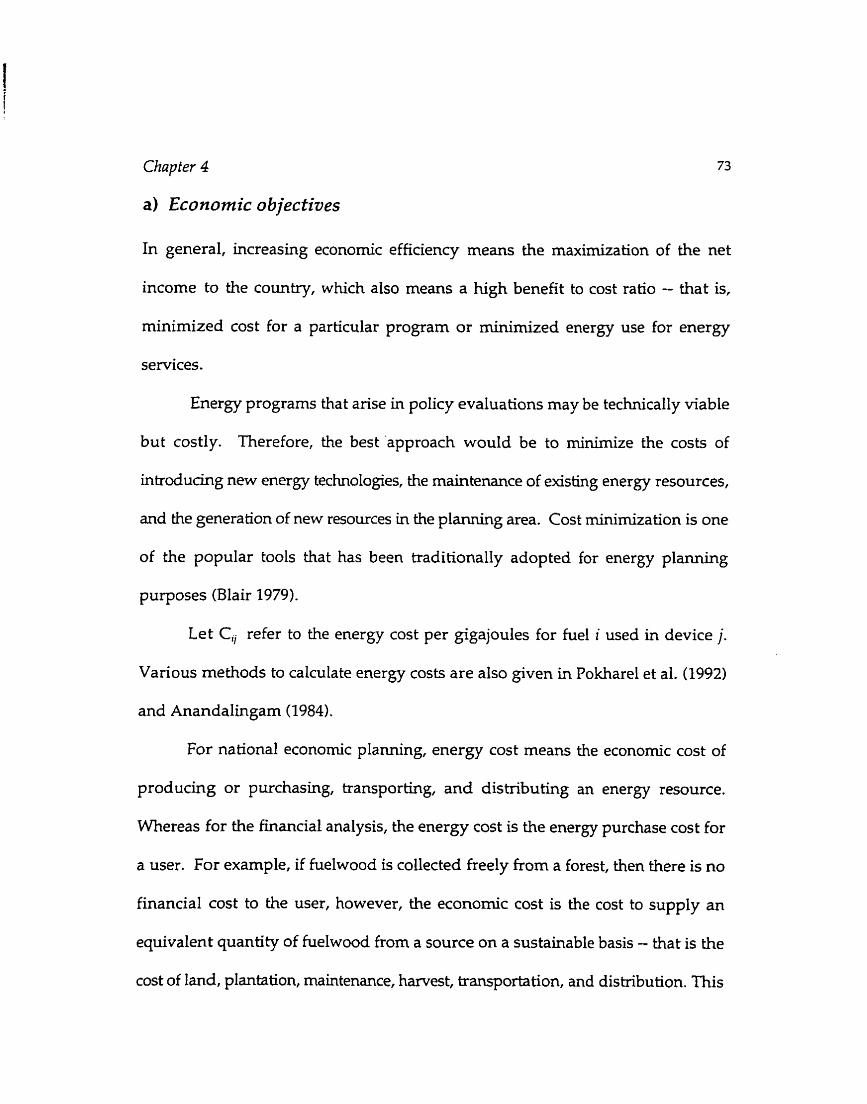
Chapter 4
a) Economic objectives
In general, increasing econornic efficiency means the maximization of the net
income to the country, which also means a high benefit to cost ratio -- that is,
minimized cost for a particular program or minimîzed energy use for energy
services.
Energy programs that arise in policy evaluations may be technically viable
but costly. Therefore, the best 'approach would be to rninirnize the costs of
introducing new energy technologies, the maintenance of existing energy resources,
and the generation of new resources in the planning area. Cost rnhimization is one
of the popular tools that has been traditionally adopted for energy planning
purposes (Blair 1979).
Let Ci, refer to the energy cost per gigajoules for fuel i used in device j.
Various methods to calculate energy costs are also given in Pokharel et al. (1992)
and Anandalingam (1984).
For national econornic planning, energy cost means the econornic cost of
producing or purchasing, transporting, and distributing an energy resource.
Whereas for the financial analysis, the energy cost is the energy purchase cost for
a user. For example, if fuelwood is collected freely from a forest, then there is no
financial cost to the user, however, the econornic cost is the cost to supply an
equivalent quantity of fuelwood from a source on a sustainable basis - that is the
cost of land, plantation, maintenance, harvest, transportation, and distribution. This
Chupbr 4
cost might varv from region to region.
When the energy programs are to be irnplemented, national and local
govemments would have to allocate funds hmediately. In such cases, the
immediate cost of the programs would be important. Therefore, the energy cost
coefficients to be used in energy planning analysis depend upon the scope of
analysis: long term, short term, or immediate.
The objective of economic effiaency for energy planning could be written for
the minimization of program cost as,
J K P
j : i A : ! p.1
and the rninimization of energy input for different end-uses as,
b) Equity objective
Equity refers to the distribution of benefits to a region, population class, or a
gender. Certain types of energy resources may promote equity in implementation.
If women are trained to install and use efficient fuelwood stoves then it would
generate an income for them and reduce respiratory problems for the cook. If an
energy source is promoted locally, then it might reduce fuel collection tirne and
labour required to fetch the fuel. Cohon (1978) indicates that the equity objectives

Chapter 4 75
are politically rnotivated and are therefore difficult to identify. The author suggests
that minimization of the difference between the range of benefits of different
regions could be a way to promote equity.
For rural energy planning, two objectives could Mfil equity considerations.
~ & t is the provision of employment for the region and second is the promotion of
the use of local resources.
Equity objectives could also be achieved by distributing efficient end-use
devices to the poor households. However, this is more an irnplementation objective
than a planning objective.
Let $ refer to the equity related parameter, which could be the person-years
that could be employed if an energy program is implemented. For example, forest
management could help in systematizing fuelwood collection based on a
sustainable fuelwood supply. Nevertheless, to maintain forests at the local level,
forest guards and technicians might have to be employed and equipment rnight
have to be supplied. The objective for the maximization of ernployment to be
generated by introducing a particular type of energy technology or management
process codd be written as,
However, not al1 the combinations of ei are possible. Therefore, when such
combinations are not possible, the parameters are assigned a zero value.
The objective to Mfil the energy demand by IL (1, s ll types of local energy
sources to the extent possible could be formulated as,
C) Environmental objective
Maintainhg or augmenthg environmental quality is currently being given much
attention .in various planning circles. The objectives that would satisfy the
environmental considerations could mean a decrease in soi1 erosion, a decrease in
the emission of pollutants, a decrease in the inundated land, or a decrease in the
known negative environmental impacts. However, environmental objectives are
problem specific and are difficult to quantify (Cohon 1978). Jamssen (1992)
indicates that environmental problems have long term impacts which may not
appear instantaneously. Therefore, it is imperative to look at these factors to the
extent possible.
Let % refer to the parameter having negative impacts (for example,
pollutants) generated by a fuel defined by Xijb. Then the objective to muiimize
negative environmental impact could be formulated as,
Chapter 4
I J K P
4.2.2 The Constraints
Four main constraints that could impose restrictions on the realization of energy
planning objectives are discussed below.
a) Sustainable supply of energy resources
There is a lirnit on the sustainable supply of energy resources in a particular area.
For example, there is a limit on fuelwood yield from the forest, residues yield from
the cultivated land, and the production of animal dung. Let U,, refer to the limit
for the supply of local energy resources, IL, in an area p, then the constraint could
be written as,
b) Energy demand
Whichever policy is chosen, the present energy demand should at least be met.
There could be a shift in the fuel for different end-uses or a shift from one type of
Chnpter 4 78
end-use device to the next because of changed resource allocation. Such
substitutions are discussed in detail by Pokharel (1992). Let ilb represent the
energy demand for an end-use k, in an area p, then the constraint could be
formulated as given in equation (4.7).
C) Limit on technology
Not al1 of the available energy sources could be converted to desired secondary
energy. For example, the use of animal dung for fuel may be limited because of
energy conversion constraints. Similarly, distribution of EFSs to all households rnay
not be feasible and desirable in the specified planning period. The generation of
biogas may not be possible at higher altitudes.
Let the upper limit on the potential of generaîing or supplying additional
energy by using a feasible technology be defined by L, , then the constraint codd
be formulated as,
Chapter 4
d) Limit on extemal energy supply
The Limit on the local sustainable energy supply and the minirnization of cost and
the maximization of environmental quality may create a shortage of fuel in the
planning area. In such cases, the option is to import energy from outside the
planning boundary. The import of kerosene, charcoal, and electricity, for example,
cm supplement the local energy supply. However, the decision makers may want
to impose restrictions on the use of such hels in a particular area. Let that
restriction be referred to as Then the constraint for this case can be formulated
as follows.
4.3 Sensitivity Analysis
The multiobjective mode1 used in this thesis requires input parameters such as cost
coeffiaents, energy resources, energy demands, employment coefficients, and end-
use device efficienaes. However, these input parameters diange with technological
change and macro economic impact such as changes in economic policy and
inflation. The estirnates of the input data also depend upon the data collection
methodology (Sinha et al 1994). Owing to these uncertainties, the input data and
parameters might change, leading to a change in the ideal solution and the
Chapter 4 80
compromise solution. Consequently, the choice of the best compromise solution
might also change.
In this research, small changes in the output (that is, the ideal solution to the
problem) due to small changes in the input data and parameters are being
considered. This type of sensitiviîy analysis using a single parameter for testing
is also called first-order sensitiuity analysis. Many linear programming software
packages, such as the linear p r o g r a m d g module of GAMS@ used in the thesis,
provide some information to carry out the first-order sensitivity analysis.
In a multiobjective situation, another type of sensitivity analysis, called the
standard sensitivity analysis, cm also be camed out by changing the values of one or
more of the objective functions (Benayuon et al. 1971 and Hwang and Masud 1979).
When the MOP problem is solved with such a change, it would alter the value of
the other objective functions. This might also change the allocation of energy
resources.
The opportuniy to carry out the first-order sensitivity analysis on the ideal
solution is provided by dual prices (also cded marginal costs). Dual prices define the
slope of diange in the value of the objective function due to a small change in an
input parameter. For example, if changes in the values of the objective f u n c t i ~ n s ~
are to be tested against a small change in the demand Dg for an end-use k, in an
area p, the marginal cost (MC) is defined by equa tion (4.10). In equation (4. IO), fl
refers to the optimum value of objectivefi.
The higher the marginal cost, the higher is the sensitivity of the particular input
parameter being tested. Therefore, care should be given while estimating such
input parameters. On the other hand, when marginal costs are equal or nearly equal
to zero, then the resources associated with these values (for constraints or variables)
are referred to as non-scarce resources. Changes in the values of such constraints
or variables do not have much impact on changes in the optimality of the solution.
In order to rank the sensitivity of objective hinctions to the input data and
parameters, the marginal values need to be normalized. A normalized value (SI
shows the percentage change in a function for one percent change in the input
parameter. Equation (4.11) gives the relation to calculate normalized value for D,,.
As mentioned before, the SEP-method requires that the objective functions
be optimized separately first (at iteration t=O). Therefore, the sensitivity of the
objective h c t i o n s with respect to input paiameters can be studied from the
marginal costs obtained in iteration f=O. These changes wodd indicate the
movement in the ideal solution and consequently the changes in the compromise
solutions in the following iterations.

Chapter 4 82
In this research, the decision support system is implemented to study the
energy resource allocation in two cases. In the first case, the watershed is treated
as one region (aggregated case) and in the second case the watershed has been
divided into six sub regions (disaggregated case). The hst order sensitivity
analysis is camed out for both of these cases and is presented in section 7.6. The
ranking of the sensitivity analysis has been studied for the aggregated case and is
presented in section 7.6.4.
As an illustration of the standard sensitivity analysis in this research, the
value of one of the objective hc t ions is changed and its impact on the other
objective hinctions is analysed. This type of sensitivity analysis is illustrated for the
disaggregated case in section 7.5.
4.4 The Decision Support System Model
The decision support system model for rural energy planning is illustrated in
Figure 4.3. In the proposed model, data are first analysed in a GIS and then
I
1 E n e r e v l
D a t a - C o l l e c t i o n
d
u J
M u l t i o b j e c t i v e Inform a t i o n - A n a l y s i s - S y s t e m
f
S p a t i a l D a t a b a s e
>
Figure 4.3 The energy decision support model

Chap ter 4 83
converted to an Energy Information Systmi (EIS). The output of the EIS is energy
balance information. This information along with other parameters is analysed
with the S'El?-Method to obtain the best compromise solution for implementation.
Such a solution is expected tu provide a direction on the formulation of an energy
policy for the planning area.
Chapter 5
DATA COLLECTION
The purpose of the case study investigated in this thesis is to examine the possibility
of implementing the integrated rural energy decision support system, developed
in this thesis, for energy policy planning. As such the selection of a case study site
was motivated by the availability of a geographical information base upon which
the application of IREDSS could be shown, as opposed to selecting a site with
potential for actual irnplementation.
Nepal (Figure 5.1) is chosen for the research because of a perceived need for
resource management, data availability, data accessibility, and the researcher's
familiarity with the location. Two candidate sites--Kulekhani and Phewatal ([ah in
Nepali) watersheds in Nepal were xreened in the first phase as they are prioritized
as sites for watershed management by the Depariment of Soi1 Conservation and
Watershed Management (DWSCM).
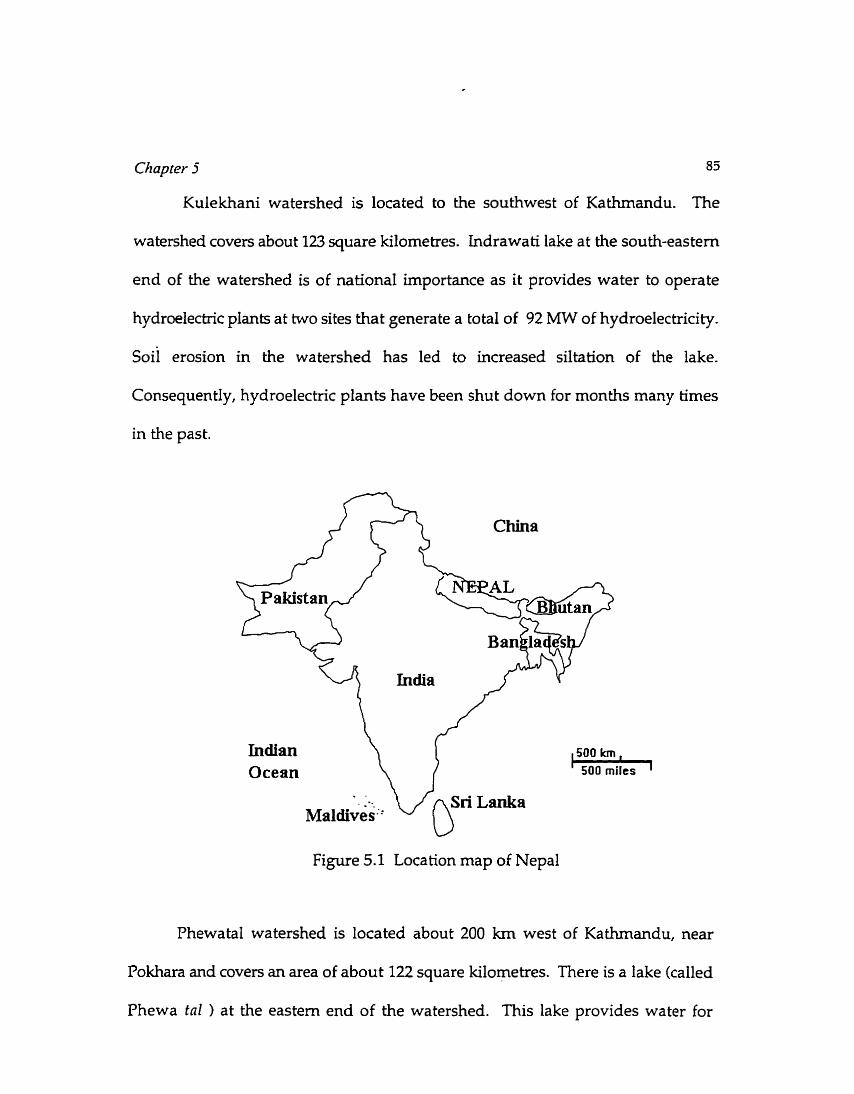
Chaprer j 83
Kulekhani watershed is located to the southwest of Kathmandu. The
watershed coven about 123 square kilometres. hdrawati lake at the south-eastem
end of the watershed is of nationaI importance as it provides water to operate
hydrwlectric plants at two sites that generate a total of 92 MW of hydroelectricity.
soi1 erosion in the watershed has led to increased siltation of the lake.
Consequently, hydroelectric plants have been shut down for months many times
in the past.
Pakistan w Indian Ocean
Figure 5.1 Location map of Nepal
Phewatal watershed is located about 200 km west of Kathmandu, near
Pokhara and covers an area of about 122 square kilometres. There is a lake (called
Phewa tnl ) at the eastem end of the watershed. This lake provides water for
Chapter 5 86
irrigation and power generation and is a popular tourist destination in Nepal.
Therefore, its siltation will have a significant economic effect in and around the
watershed.
A preliminary saeening found that only an amrnonia printed base map was
available for Kdekhani watershed. For Phewatal watershed, however, reports on
socioeconomic studies, a base map, a land use map, and a soils map were available
both in the printed form and in digitized form. Since more information for
Phewatal watershed was readily available, this watershed was chosen for the
irnplementation of the decision support system. The availability of digitized data
reduced the physical work (to digitize the maps) considerably.
In the Phewatal watershed, continuous population pressure on resources,
mainly forests for fuel, has resulted in increased soil erosion and crippling land
slides (Rowbotham 19951, and increased flash flood occurrence affecting the
livelihood of the m a l population. If the curent rate of soi1 erosion continues then
the sediment load in the lake would be about 39 tondha-year. With this rate, the
lake would be filled up with silt in about 70 years compared with a life span of over
450 years on a manageable sediment load of 10 tons/ha-year (Impat 1981). Balla
(1988) estimates that soil loss from non-degraded forested land is only about 3
tons/ha-year, whereas from grazing land it is about 67 tons/ha-year. Fuelwood
extraction is one of the major causes of forest denudation (ARDEC 1984) in the
watershed leading to such a high siltation rate. Therefore, this watershed needs
immediate attention for resource management.
Chapter 5 87
Digitized information on land use, contours, path, and bail of Phewatal
watershed is available in Rowbotharn (1995). This information was imported,
edited in conjunction with aerial photographs, and reclassifïed for the database
developmen t.
There are six village development councils in the watershed. A village
development cound may contain more than one village. Thematic maps obtained
from the conservation project and Kaski District Development Council (KDDC)
during the field vïsit were digitized to establish intemal administrative boundaries
of the village development councils.
As shown in Figure 4.1, the available information was first compiled to f o m
a GIS database, which was reclassified to obtain energy resource data. The
infornation on energy consumption was not available. Therefore, energy demand
data fi-om other areas, in and outside of Nepal were referred to in the initial stage
of database development. In this regard, the findings of the Tata Energy Researdi
Institute (TERI) for UW's Indo-Shasti Project on rural energy in Dhanawas and
district energy profiles prepared by the Water and Energy Commission Secretariat
(WECS), Nepal were helpful.
A rapid appraisal (RA) was conducted at the site and in Kathmandu during
Dec. 1995-Jan. 1996 and June-July 1996. The objectives of RA were to:
- validate the information obtained through IREDSS analysis on land
use and minimum flow in the sheams;
- assess the main energy consuming activities;

Chapter 5
- assess the average amount and type of energy consumed;
- identify the changes in villages boundaries;
- understand the forest management practice; and
- understand the public awareness on community participation.
During the RA, 52 households were sweyed to assess the energy consumption
patterns in the watershed. This information was recorded in tables and in maps.
The rapid appraisal was also helpfd for understanding the pIanning
concerns of the local population. This was important for multiobjective analysis.
The observation illustrated that the cornmunity concems are restricted to
employment and roads or trail construction.
Agencies related to energy policy formulation in Nepal were also visited
with the objective of assessing the viability of the proposed decision support
system. This idea was presented to the multidisciplinary teams at the Tata Energy
Research Institute, New Delhi, India in December 1995, and the Water and Energy
Commission Secretariat and the Ministry of Population and Environment, Nepal in
January 1996 and was well received. It was felt that su& a mode1 would help the
organizations in the design of a better energy policy.
The International Centre for Mountain Research and Development
(ICIMOD), the Department of Soi1 Conservation and Watershed Management
(DSCWM), the Finnish International Development Agency (FINNIDA), and the
Land Resource Mapping Project ( L M ) were some of the other agencies visited for
the collection of the site specific secondary data. ICIMOD has an ongoing GIS

chapîer 5 89
activity for the Hindu-Kush regions and is developing a Mountain Environrnent
and Natural Resources Information System (MENRIS) on an ongoing basis. The
MENRIÇ database could be modified to develop an integrated rural energy decision
support system. When MENRIS and IREDSS are combined, a better decision
support system for rural development could be created. As both MENRIS and
IREDSS are developed in ARC/INF@ software, such a creation should be straight
fonvard.
The DSCWM has developed a long tem watershed management plan for the
research area. The objectives of the watershed management project as obtained
from the DSCWM 1989 leaflet are:
- to sustain long-term, on-site soi1 productivity and reduce downstream
damage;
- to advocate better use of resources; and
- to motivate and involve comrnunity participation.
The soil consenration and watershed management in the watershed was initiated
in 1974 (IMrMP 1992). During 1980-1986, the project was assisted by a UNDP/FAO
program. From 1987 to 1994, FINNIDA assisted the project. From April 1994, the
Japan International Cooperation Agency (JICA) and the Japan Overçeas
Cooperation Volunteers (JOCV) have been involved in planning future work for
watershed management Until January 1996, however not a great deal of planning
was done. One of the site managers, Ms. Mikiko Nagai (at Bamdi), told the
researcher that in the m e n t project the micro level watershed management aspect

Chapter 5 90
is being considered. This requires public participation and an understanding of
geographical features of the area, where the information provided by this thesis
could be very helpful.
The DÇCWM has produced a base map, a land use map, a soils map, and a
village boundary rnap at a 1:25,000 resolution based on 1989/1990 aerial
photographs. An ammonia printed 1:25,000 rnap with 20 m contour intervals
interpreted from 1978 aerial photographs is also available. However, this rnap
could not be used because of its poor quality. A list of maps obtained for the study
are shown in Table 5.1.
Table 5.1 Maps obtained for Phewatal watershed
Information Maps
Topographie information Base Map
Geological Information Soils Map
Land use Information
The contours on the base map are at 100 mettes interval. The base rnap also contains
Land use Map
Village Development Council Boundaries
information on the location of villages, however during RA it was found this
VDC Map
information is incomplete. The land use map contains information on the type and
crown density of forests and cultivated land. The soils rnap has not been used at
present but it could be a potential source to locate afforestation areas in conjunction
with the slope map, which could be extracted from the base map.

Chapter 5
5.1 Spatial Information
The location of the Phewatal watershed in Nepal is shown in Figure 5.2. The
watershed extends from 28°11'37" to 28O17'26" N latitudes and from 83'48'2" to
83O59'18" E longitudes in the Middle Mountains of Nepal.
Figure 5.2 Location map of the study area
The elevation of the watershed ranges from 793 m at Phewa lake to 2508 rn
at Panchase dada (mountain in Nepali) at the west. The average slope of the
watershed is about 40% (Manandhm 1987). However, the slope of the valley is
between 3% and 5%. The lake has an average depth of nine metres and c m hold up
to 39 million cubic metres of water at its full capacity (Leminen 1991). The town of
Pokhara is located at the eastem end of the watershed and covers about six square
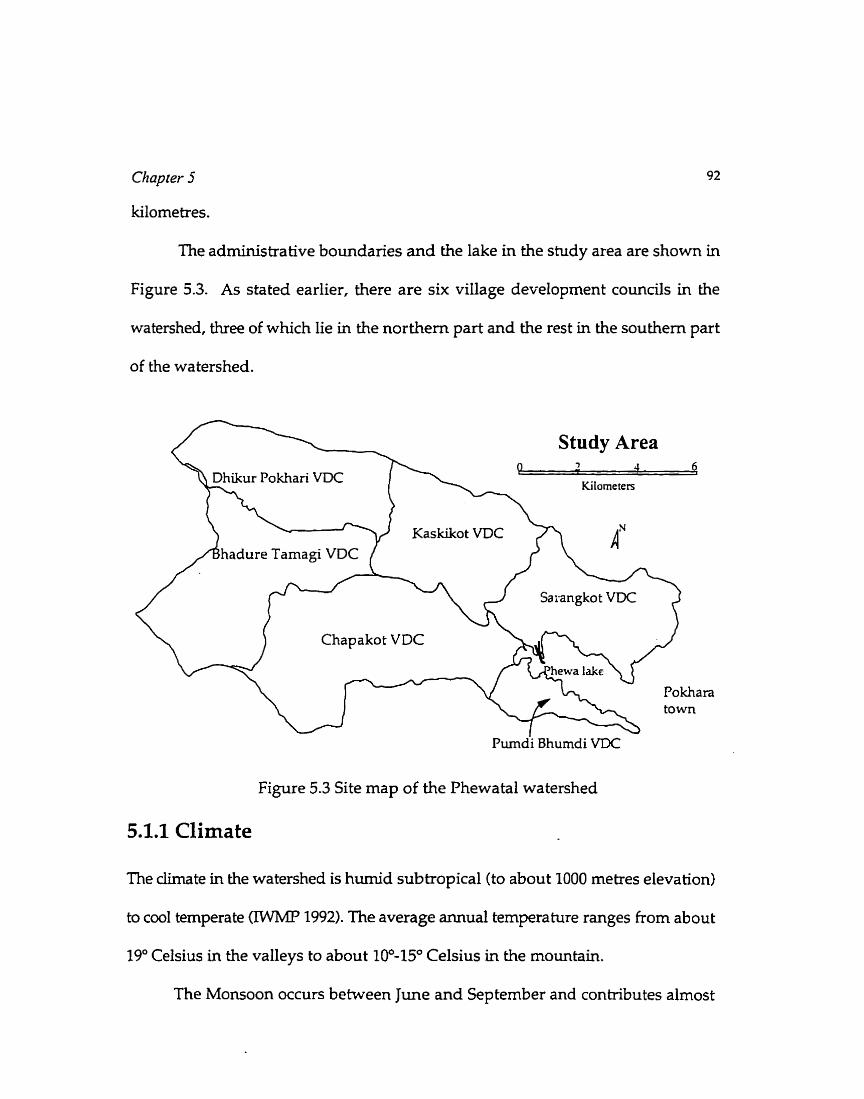
The administrative boundaries and the lake in the study area are shown in
Figure 5.3. As stated earlier, there are six village development councils in the
watershed, three of which lie in the northern part and the rest in the southem part
of the watershed.
Study Area
Kilometers
Kaskikot VDC hadure Tamagi VDC
Chapakot VDC
~ u r n d i Bhumdi VDC
Figure 5.3 Site map of the Phewatal watershed
The dimate in the watershed is humid subtropical (to about 1000 mebes elevation)
to cool temperate (IWMP 1992). The average annual temperature ranges from about
19" Celsius in the valleys to about 10°-150 Celsius in the mountain.
The Monsoon occurs between June and September and contributes almost
Chapter 5 93
85% of the total rainfall (Ramsay 1987). The average annual rainfall recorded for
two years at Banpale (1425m), Toripani (1500m), Tamagi (1650m),and Panchase
(2508rn) are 4385 mm, 4919 mm, 3843 mm, and 750ûmm (MrMP 1980), respectively.
Times series rainfall data collected for 15 years at Pokhara airport (854 m) and
Lumle (1662 m, about 5 km northwest of watershed) show that the annual average
rainfall in those areas is 3856 mm and 5200 mm (period 1971-861, respectively.
Based on these data and data on six other sites around the watershed, a correlation
is developed by Ramsay (1987) as,
Precipiration(mm.) = 2176 + elevation (nzeti-es) * 1.64, r=0.847 (5.1 )
About 57% of the rainfall is assumed to be the m o f f in the watershed (DSCWM
1980). The high rainfall intensity is an indication towards the increased annual
water availability. However, before such a condusion may be drawn, more reliable
data on seepage, evapotranspiration, and runoff coefficients are necessary.
5.1.2 Drainage System
The major streams and lakes in the watershed are shown in Figure 5.4. The average
stream density (that is, the number of streams/sq. km of catchment area) in the
watershed is 2.2, whereas in the degraded sub basins it is as high as 4.4
(Rowbotham 1995).
Andheri khola(slreilm in Nepali), Sidhane khola, and Handi khoh have

Chapter 5 94
Figure 5.4 Major streams and lake in the watershed
constricted charnels compared with other streams and have an average dope of
about 10-30% around the pour point. Andhen &oh originates near Poundur village
and Sidhane khola originates from Sidhane village. Handi Wiola merges with
Sidhane khola at about 1000 metre elevation at Ghanti Chhina. Sidhane khola and
Andheri khola meet at about 910 metres at Thulakhet to become Harpan khola
(Harpan river in Figure 5-41, which flows through the valley and drains into Phewa
ta!. During the dry season, there is no surface flow in Andhen Wrola.
The estimates for the average and the minimum flow in Phewa lake obtained
from Nippon Koei (1976) are ated in Rowbotham (1995) as 9.2m3/sec and lm3/sec.
The author suggests that these values do not represent the average water flow in the
watershed, however, provide an indication as to the variation.
During the RA, flow measurements were taken in Harpan khola, Andhen
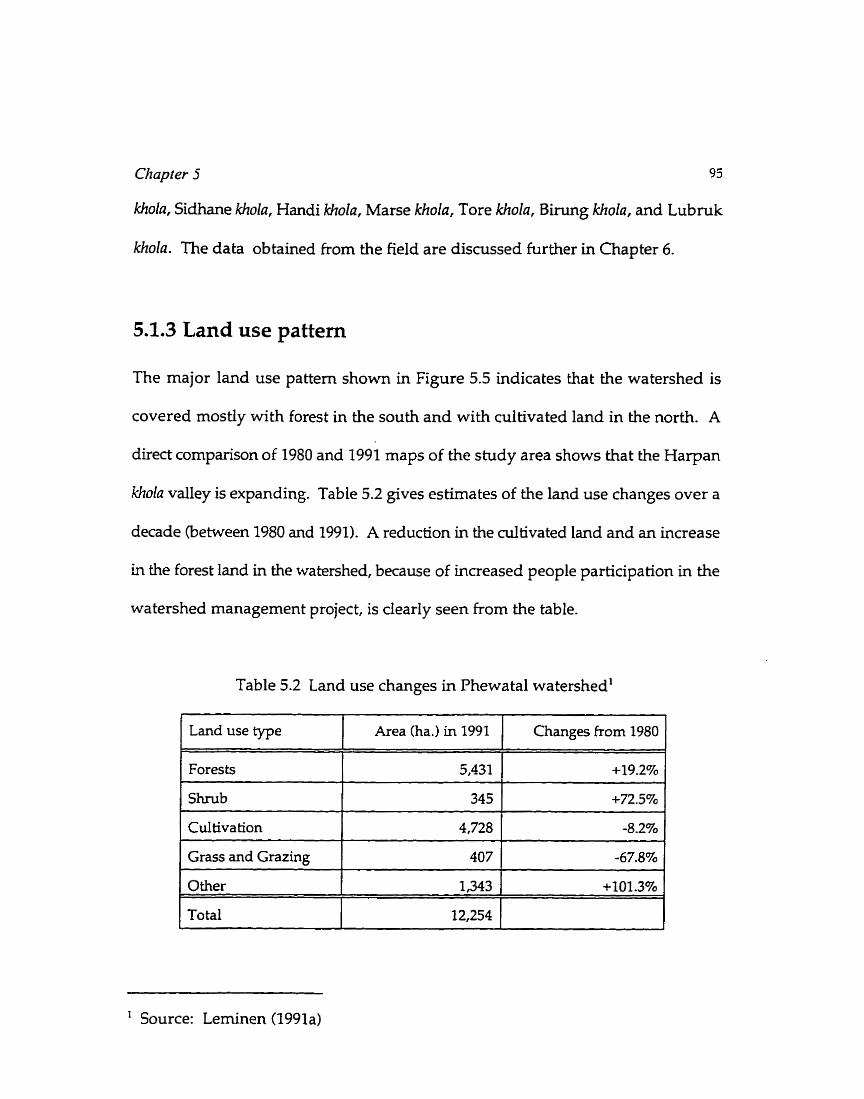
Chapter 5 95
khola, Sidhane Wlola, Handi khola, Marse Wiola, Tore khoia, Birung Wiola, and Lubruk
khola. The data obtained from the field are discussed further in Chapter 6.
5.1.3 Land use pattern
The major land use pattern shown in Figure 5.5 indicates that the watershed is
covered mostly with forest in the south and with cultivated land in the north. A
direct cornparison of 1980 and 1991 maps of the study area shows that the Harpan
khola valley is expanding. Table 5.2 gives estirnates of the land use changes over a
decade (between 1980 and 1991). A reduction in the cultivated land and an increase
in the forest land in the watershed, because of increased people participation in the
watershed management project, is clearly seen from the table.
Table 5.2 Land use changes in Phewatal watershed'
1 Land use type 1 Area (ha.) in 1991 1 Changes from 1980 1 Forests
S h b
Cultiva tion
5,43 1
345
Grass and Grazing
- -
' Source: Lerninen (1991a)
+19.2%
+72.5%
4,728
Other
To ta1
-8.2%
407 -67.8%
1,343
12,254
1
+101.3%
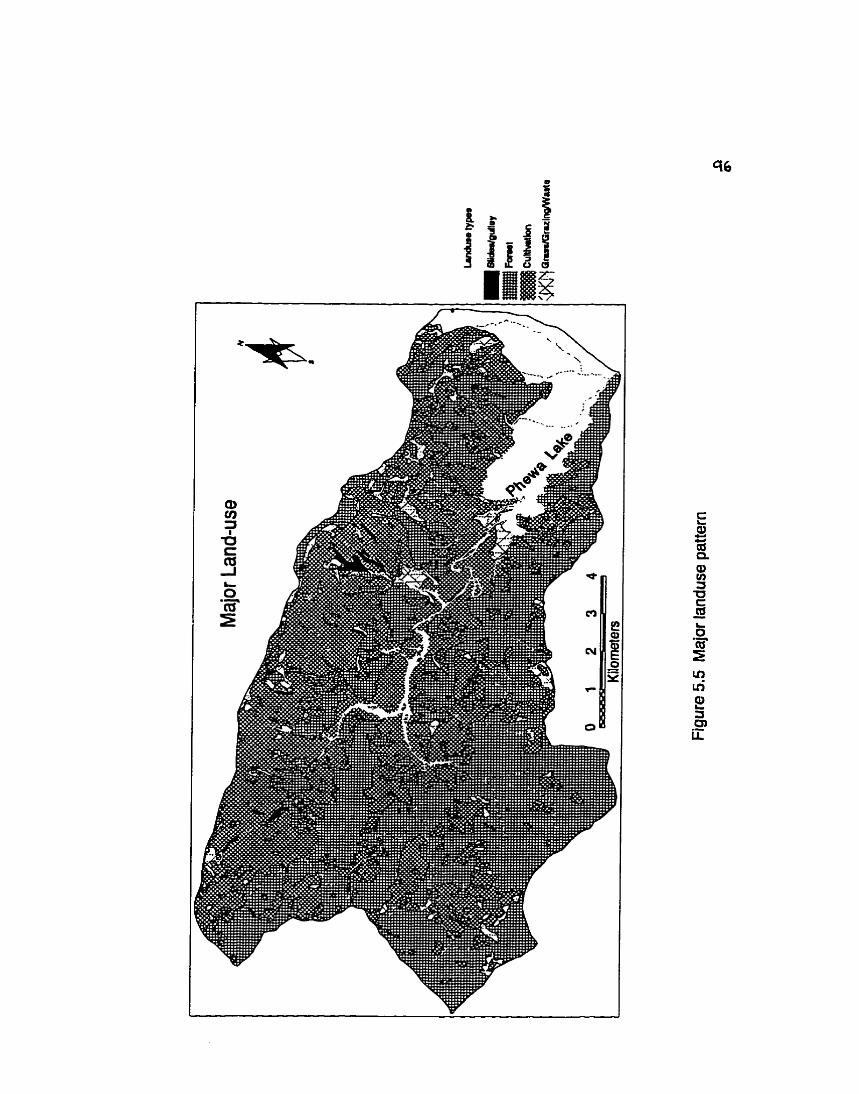
Chapter 5 97
About 44% of the land is covered with forests, dominated by hardwood
species. About a hectare of pine trees have been recorded at the north eastem part
of the watershed. The species indigenous to this watershed are Shorea Robusta (sa11
between 1000-2000 mebes (Gurung 1965 as cited in Rowbotharn 1995) and chir pine,
esp&ially Pinus Roxburghii, and oak forests above ZOO0 metres (Negi 1994). At
present, sub bopical species like Sal, Castanopsis indica (Katus),and Alnus Nepallensis
(Utis) are predorninant in the watershed. The species composition has been greatly
altered by selective cutting (DSCWM 1980) and replantation (present sunrey).
IWMP (1992) estimates the accessible forest area at about 75% of the total. In the
absence of data on the spatial distribution of accessible forest area, forest
accessibility is assumed to be the same throughout the watershed.
Data obtained from the Kaski District Forest Office in 1996 show that the
government has handed over about 1,891 ha of forests (almost 40% of the total
forests area) to the communities in different VDCs. The handover of government
forests to cornrnunity is continuing. In these cornmunity managed forests,
management of the forest areas and the extraction of fuelwood and timber are
controlled by local Consumers Committees.
Almost 39% of the watershed area is cultivated. Paddy, maize, wheat, and
millet are the main cultivated crops. The cultivated area is dispersed al1 around the
watershed. Whiie the Harpan Wlola v d e y is cultivated with one crop a year, the up
lands are cultivated with two to three crops annually. DECORE (1991) estimates
that the cropping intensity is about 259% in up lands and about 150% in the low
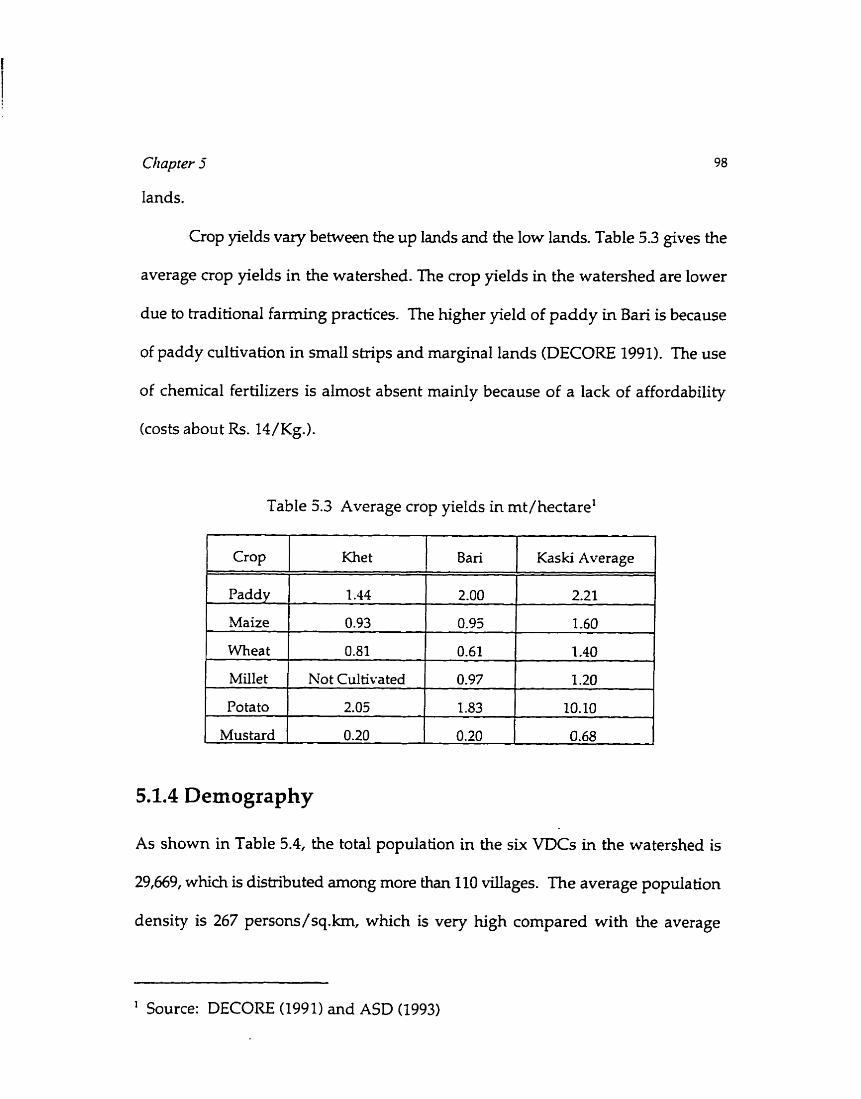
Chapter 5
lands.
Crop yields Vary between the up lands and the low lands. Table 5.3 gives the
average crop yields in the watershed. The crop yields in the watershed are lower
due to traditional farming practices. The higher yield of paddy in Bari is because
of paddy cultivation in small strips and marginal lands (DECORE 1991). The use
of chernical fertilizers is almost absent mainly because of a lack of affordability
(costs about Rs. 14/Kg.).
Table 5.3 Average crop yields in mt/hectarel
Crop
Paddy
Wheat 1 0.81 0.61 ! 1.40 1 I
Khet
Maize
1.44
Mus tard 0.20 0.20 0.68
Bari
0.93
Millet
5.1.4 Demography
As shown in Table 5.4, the total population in the six VDCs in the watershed is
29,669, which is distnbuted among more than 110 villages. The average population
density is 267 persons/sq.km, which is very high compared with the average
Kaski Average
2.00
- - - -- -
' Source: DECORE (1991) and ASD (1993)
2.21
0.95
hTot Cultivated
1.60
0.97 1.20 1
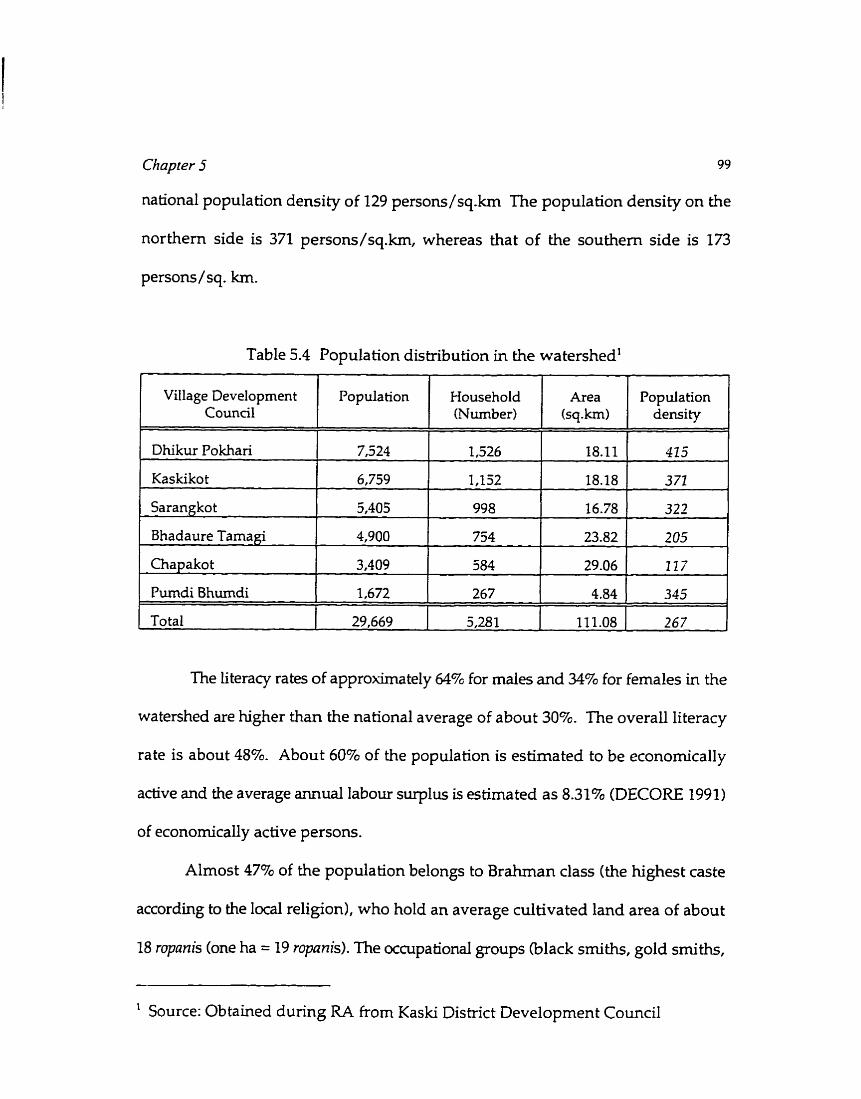
Chapter 5 99
national population density of 129 persons/sq.km The population density on the
northern side is 371 persons/sq.km, whereas that of the southem side is 173
persons / sq. km.
Table 5.4 Population distribution in the watershedl
The Literacy rates of approximately 64% for males and 34% for females in the
watershed are higher than the national average of about 30%. The overall literacy
rate is about 48%. About 60% of the population is estimated to be economically
active and the average annual labour surplus is estimated as 8.31% (DECORE 1991)
of economically active perçons.
Almost 47% of the population belongs to Brahman class (the highest caste
according to the local religion). who hold an average cultivated land area of about
18 ropanis (one ha = 19 ropanis). The occupational groups (black smiths, gold smiths,
- ' Source: Obtained during RA from Kaski District Development Council
,
Village Development Cound
Dhikur Pokhari
Kaskikot
Sarangko t
Bhadaure - Tamagi
Chapakot
Pumdi Bhumdi
Total
Population
7,324
6,759
5,405
4,900
3,409
1,672
29,669
Household (Number)
1,526
1,152
998
754
584
267
5,281
Area (sq-km)
18.11
18.18
16.78
23.82
29.06
4.84
111.08
-
Population density
415
3 72
322
205
117
345
267
Chopter 5 100
shoemakers, and tailors) make up about 29% of the population. This group has an
average land holding of about 6.8 ropanis. The rest of the population is comprised
of Gurung and Tamang (wamor class), Newar (business class), and others. The
average land holding in the watershed is about 13 ropanis per family, with the
lowest for the Tamang groups at 0.75 ropani per household. The owners cultivate
a h o s t 80% of the land.
5.1.5 Economic condition
Crop famiing, livestock rearing, and selling fuelwood and fish are the main
economic activities in the watershed. RecentIy, a few crop Hnding milis ninning
on electncity or diesel have been installed in different VDCs. Black smithing and
gold smithing are the main traditional activities. The local Consumers Cornmittee
do not aliow gold smiths to obtain wood for charcoal production. Therefore, they
are hans fehg their business to Pokhara town or elsewhere. Commercial activities
like keeping shops, lodges, and restaurants, however, are on the rise.
Livestodc are an integral part of most (98.970) of the households. Buffalos and
b d s are the main large livestock, providing nutrition, draft power, fertilizer, and
cash when sold. DECORE (1991) estimates that about 13% of the households seil
buffaloes and about 7% sel1 cattle for cash. The rearing of cows is decreasing,
however, as cows need to be grazed, whereas buffdos cari be stall fed. Stall feeding
is increasing as more grazing land is being converted into protected lands and
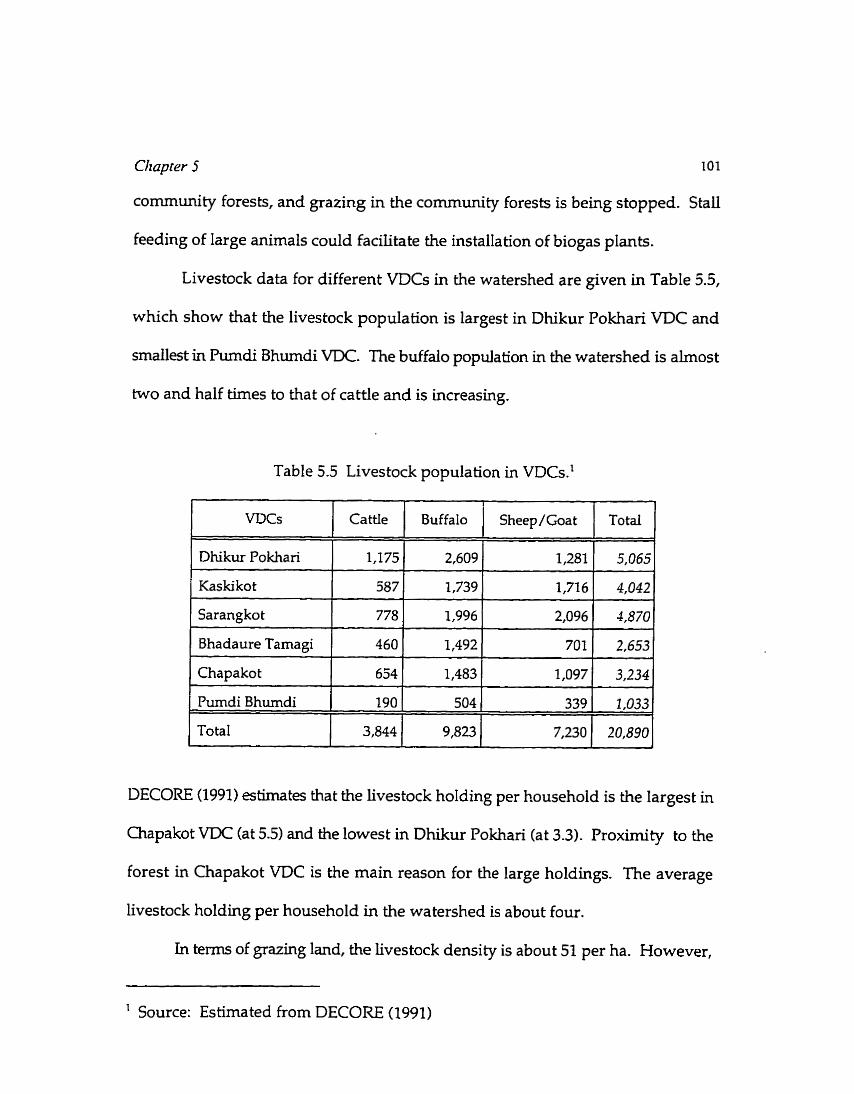
community forests, and grazing in the community forests is being stopped. StaU
feeding of large animab could facilitate the installation of biogas plants.
Livestock data for different VDCs in the watershed are given in Table 5.5,
which show that the livestock population is largest in Dhikur Pokhari VDC and
smallest in Purndi Bhurndi VDC. The buffalo population in the watershed is almost
two and half times to that of c a d e and is increasing.
Table 5.5 Livestock population in VDCs.'
VDCs
Dhikur Pokhan
Cattle
Kas ki ko t
Sarangkot
Bhadaure Tamagi
Chapakot
DECORE (1991) estirnates that the livestock holding per household is the largest in
Chapakot VDC (at 5.5) and the lowest in Dhikur Pokhari (at 3.3). Proximity to the
forest in Chapakot VDC is the main reason for the large holdings. The average
livestock holding per household in the watershed is about four.
In temis of grazing land, the livestock density is about 51 per ha. However,
1,175
Pumdi Bhurndi
' Source: Estimated from DECORE (1991)
587
778
460
654
Total Buffalo
2,609
190
Sheep/Goat
A
2,739
1,996
1,492
1,483
k
1,281
504
5,065
1,716
2,096
701
1,097
4,042
4,870
2,653
3,234
339 1,033
Chapter 5 102
not all of the grass land is grazed as it is also a source for Khar; a type of long grass
used for thatching roofs. F a m land and geographically accessible forests close to
the village are also grazed.
5.2 Energy Consumption Pattern
The data obtained kom earlier surveys showed only the fuelwood consumption in
the watershed. Therefore, it was necessary to coLlect energy consumption data for
the watershed. Since the purpose of the thesis is to examine household energy
sector, data were collected to establish energy use for household chores.
To obtain the household energy demand, it was decided that households
would be selected through a random and multistage sampling process. The
population and the number of houses in each VDC were obtained from the Kaski
District Development Council (KDDC) office at Pokhara. For the survey area
selection, it was determined that al1 of the VDCs would be surveyed. Each village
development council was divided further into wards. The wards for the survey
were selected at randorn. However, in each VDC, the ward where the VDC
secretariat is located was visited. This was mainly to discuss development issues
and the concems of the elected officiais in that area. The ward numbers and
villages visited during the rapid appraisal and survey are given in Table 5.6.
Altogether, 52 howholds were visited for data collection. To capture the variation
in energy consumption patterns, households from both the humid subtropical and
the cool temperate clirnatic zones were visited to the extent possible.
The households were surveyed in the winter season so that the f d e s could
be i n t e ~ e w e d at leisure. During the winter, the hawest of one crop, maize or rice,
is finished and farmers take a rest for a few weeks before they start ploughing the
field for next crop, mainly wheat.
Table 5.6 Çurveyed sample wards and location.
Sarangko t 1 Sarangkot 1 7 Gerhaia ti
1
VDCs
Dhikur Pokhari
Kaskikot
Ward Numbers
3 4 5 9 9
8 9 9
Bhadaure Tamagi
Chapakot
Pumdi Bhumdi
Villages
Nagdada Dare Gouda Dharapani Serachour Soureni
Kaskiko t Baskot Dada Khet
1 4 3 4 5
3 3 6 6 7 7
1 5 5 5
Deurali Bhadaure Tamagi Harpan Lampate Bazaar
Nirbane Chapakot Bha taban Okhadhungi Arsal Chaur Marse
Anadu Sirnle Pa tle Lamdada
Chapter 5 1 04
The energy consumption pattern in the watershed is given in Table 5.7. The
average per capita secondary energy consumption for household chores in the
watershed is estimated at 6.13 GJ per year. Almost 85% of this energy is used for
cooking. Similarly, fuelwood and crop residues supply about 92% and 3.6'31,
respectively of the total energy consumption in a household. A comparative study
of biomass energy consumption per person in DCs has been done by Nisanka and
Misra (19901, which shows that the total per capita biomass consumption for fuel
in developing countries varies from 5.3 GJ to 27.0 GJ per year depending upon the
availability of resources. The energy c o m p t i o n in the study area falls within the
range given above.
Table 5.7 Energy consumption in Phewatal watershed in GJ/capita
Almost all of the households in Sarangkot, Kaskikot, Pundi Bhumdi, and
aapakot VDCs have an access to grid electricity. Electricity is not available in the
End-use /Fuel
FueIwood
Residue
Biogas
Electricity
Charcoal
Kerosene
Total
Cooking
5.15
0.09
0.001
5.241
Feed prepa- ration
0.37
0.13
0.50
Light- ing
0.09
0.06
0.15
Space heating
0.08
0.08
Food process- ing
0.08
0.08
Applian- ces
0.0002
0.0001
0.0003
Other
0.08
0.08
Total
5.68
0.22
0.00
0.09
0.00
0.14
6.13
Chapter 5 105
Bhadaure Tamagi VDC. Likewise two of the western wards in the Dhikur Pokhari
VDC do not have an access to electricity. In the households with no access to
electncity, kerosene is the only option for lighting.
Electricity is used maidy for lighting and occasionally for radio, TV, and
cloth-ironing. The electricity consumption for appliances is not significant. The
high tariff on electriaty beyond the consumption of 20 kWh (&.4/kWh, increased
to Rs. 7/kWh from A p d 1996) and irregular electncity supply are the main reasons
for low electriaty consumption. The number of light bulbs varies between two and
four in most of the households. The energy consumption estimates obtained during
the mral appraisal indicates that the electicity consumption of the households is
about half what they are paying for, mainly because of fixed minimum charges and
load shedding.
The kerosene consumption for lighting given in the table is the current
consumption patterns in households with an access to grid electricity. In other
households, the kerosene consumption for lighting is 0.20 GJ/person-yr. The
kerosene consumption used for fuelwood kindling is given in the "other" colurnn
in the table.
The load shedding is comrnon in the watershed. Therefore, households use
kerosene for lighting during load shedding. The survey indicated that if there was
no load shedding then the electriaty demand for lighting and appliances are about
0.1172 G J/person-yr and 0.0002 GJ/person-yr, respectively. Equivalently, if the
average numbers of electric bulbs being used in the households with kerosene
Chapter 5 1 06
lamp, then the kerosene demand for lighting would be 0.2578 GJ/person-yr.
None of the households nweyed reported the use of animal manure as fuel
and it is the only organic fertilizer available in the area. There is no mention in the
literature of diarcoal use in the households. The existence of occupational castes like
black srniths, gold smiths, and tailors indicaies that there is some commercial use
of charcoal in the watershed. The appraisal revealed that charcoal is made locally
and is used predominantly for smithing and tailoring. A few earthen charcoal kilns
were seen by this researcher in Chapakot VDC. During the survey, only two
households reported the use of charcoal for clothes ironing. However, the
consumption is assumed to be insignificant. There are no brick and tile kilns as
houses are build with Stones, tirnber, and thatched by Khar or corrugated zinc
plates. The charcoal consumption for cottage industry types of activities is beyond
the scope of this research.
Two hydro turbines are operating (about 5 kW and 10 kW capacity
respectively) in Handi khola and Sidhane khola for grain processing. Similarly, one
waterwheel (about 1 kW) was operating at Andheri khola during the survey. An
effort to generate 1 kW of wind electriuty in Sarangkot was made in 1990, but it did
not succeed for two main reasons- technical problems with the wind turbine and
lack of interest after the extension of grid-electricity into the area.
Very few households in the watershed have installed biogas plants. The
installation is limited to the area around Harpan Wiola valley and is not popular
becaw of a Iack of information on subsidies and loans. During the survey, a few
Chapzer 5 107
households complained of the difficult Loan procedure of the Agriculture
Development Bank and non-cooperation from the local biogas installation
companies in this regard. Some of these issues are also discussed in Pokharel et al.
(1991).
Cooking for human consumption is the main energy end-use activity in the
watershed. Almost 96% of the cooking energy needs are met by fuetwood, m a d y
ushg the haditional stoves. Cooking with crop residues is not popular.
The Sister's Group (Chelibeti Samuha) of the watershed management project
had distributed and installed a number of EFSs a few years ago and many of them
were well received by local women. The control of fuelwood collection from the
commwty managed forests and the earlier hee distributions of EFSs are seen as
the main causes for the increased popularity of efficient fuelwood stoves.
Livestock feed preparation is an outdoor cooking activity. Fuelwood and
occasionally crop residues like rnaize stalks and cobs are used (when available) for
this purpose. About 15% of the total energy consumed in the households is used
for this purpose.
Lighting is another important energy end-use in the watershed. Electricity
is the main lighting fuel, however, kerosene is also used equaily because of frequent
electricity shutdowns. In Bhadaure Tamagi and two wards of Dhikur Pokhari,
kerosene is the o d y lighting fuel. About 2% of the total energy consumed in the
households is used for lighting.
Making Chiurn (beaten rice), dis tilling alcohol, making Ghiu (butter) and

Chapter 5 1 08
yogurt are popular food processing activities in the households. While butter and
yogurt are made in ahos t every households with livestock, distilling alcohol is
most common in the households of Gurungs, Tamangs, Newars, and in the
occupational castes. Except for making beaten rice in some households, grains are
processed in nearby grain rnills.
Water heating is not predominant in the watershed. Some households in the
higher altitudes use fuelwood for space heating for up to 60 days in a year. The
daily heating is required for about two to four hours in those houses. Fuelwood
and crop residues such as maize cobs and rice husks are used for space heating.
Among the use of appliances, many households have a radio or a cassette
player but most of them run on batteries. A very few number of households have
a television. Some households also use electric and charcoal clothes-irons
occasionall y.
Chapter 6
SPATIAL ANALYSIS AND RESULTS
The spatial model to be incorporated into the proposed DSS was discussed in
Chapter 4. The two main modules of the spatial model are the energy resources
module and the energy demand module. The information generated in these modules
are combined to obtain energy balance information for the study area. The energy
balance information for an area provides a starting point for energy analysis. The
energy resources module, the energy demand module, and the energy balance
information for the shidy area are discussed in the following sections.
6.1 Energy Resources Module
The energy resources module considers indigenous biomass and nonbiomass
resources. A bnef discussion of these resources is given below.
Chnpter 6
6.1.1 Biomass Resources
The three major biomass resources in the watershed are fuelwood, crop residues,
and animal m u r e . Since animal manure is the only source of ferrilizer in the area
and it is not bumt directly, only biogas is considered for the energy balance
analysis. Al1 of the available biomass resources have been discussed here and the
spatial information as obtained frorn the analysis is shown. Charcoal is not
considered as a resource. The demand for charcod is adjusted with the demand for
fuelwood in the energy demand module.
a) Fuelwood
As mentioned before, the fuelwood yields from the forests depends upon the
geographical conditions, the bec speties, and the crown density. Because of greater
rainfall, for example, fuelwood yield is almost 20% higher in Pokhara compared
with that in Kathmandu (deLucia and Associates 1994). If a 100% crown density is
assumed, then hardwood and conifer forests in the Nepalese mountains yield about
5 mt/ha-yr and 1.25 mt/ha-yr, respectively on a sustainable basis (WECS 1987).
Wyatt-Smith (1982), however, assumes that the sustainable yield for unmanaged
Nepalese forests is between 4 8 mt/ha-yr and for managed forest it is between 10-20
mt/ha-yr. Conservative fuelwood yield estirnates for Nepalese mountain fores&
obtained from WECS (1987) are given in Table 6.1. These estimates are used by
MOFSC (1987) and WECS (1987) for estimating fuelwood availability from the
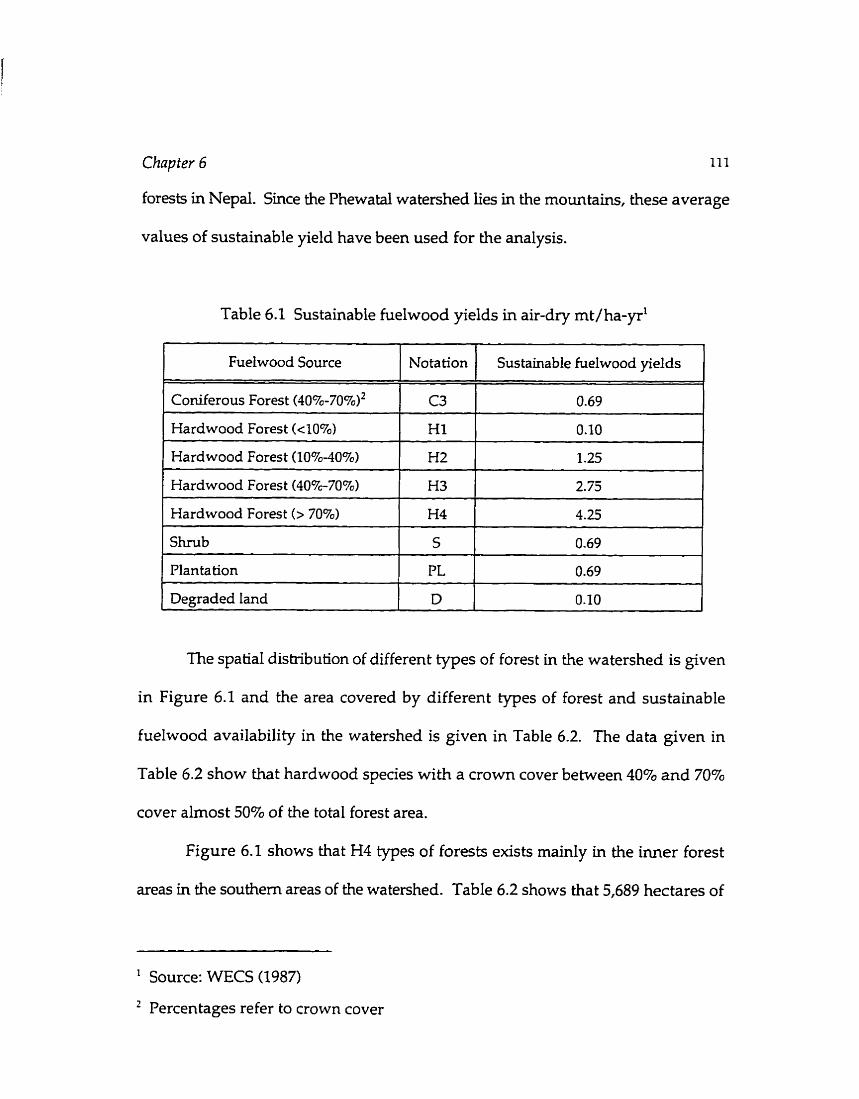
Chnpter 6 11 1
forests in Nepal. Since the Phewatal watershed lies in the mountains, these average
values of sustainable yield have been used for the analysis.
Table 6.1 Sustainable fuelwood yields in air-dry mt / ha-yrl
Hardwood Forest (> 70%) 1 H4 1 4.25
Fuelwood Source
Coniferous Forest (4070-70%)~
Hardwood Forest (<IO%)
Hardwood Forest (10%-40%)
Hardwood Forest (40%-70%~)
1 plantation 1 PL 1 0.69
Notation
C3
H l
H2
H3
The spatial distribution of different types of forest in the watershed is given
in Figure 6.1 and the area covered by different types of forest and sustainable
fuelwood availability in the watershed is given in Table 6.2. The data given in
Table 6.2 show that hardwood species with a crown cover between 40% and 70%
cover a h o s t 50% of the total forest area.
Figure 6.1 shows that H4 types of forests exists mainly in the inner forest
areas in the southem areas of the watershed. Table 6.2 shows that 5,689 hectares of
Sustainable fuelwood yields
0.69
0.10
1 .25
2.75
Degraded land
- - --
Source: WECS (1987)
Percentages refer to crown cover
D 0.10
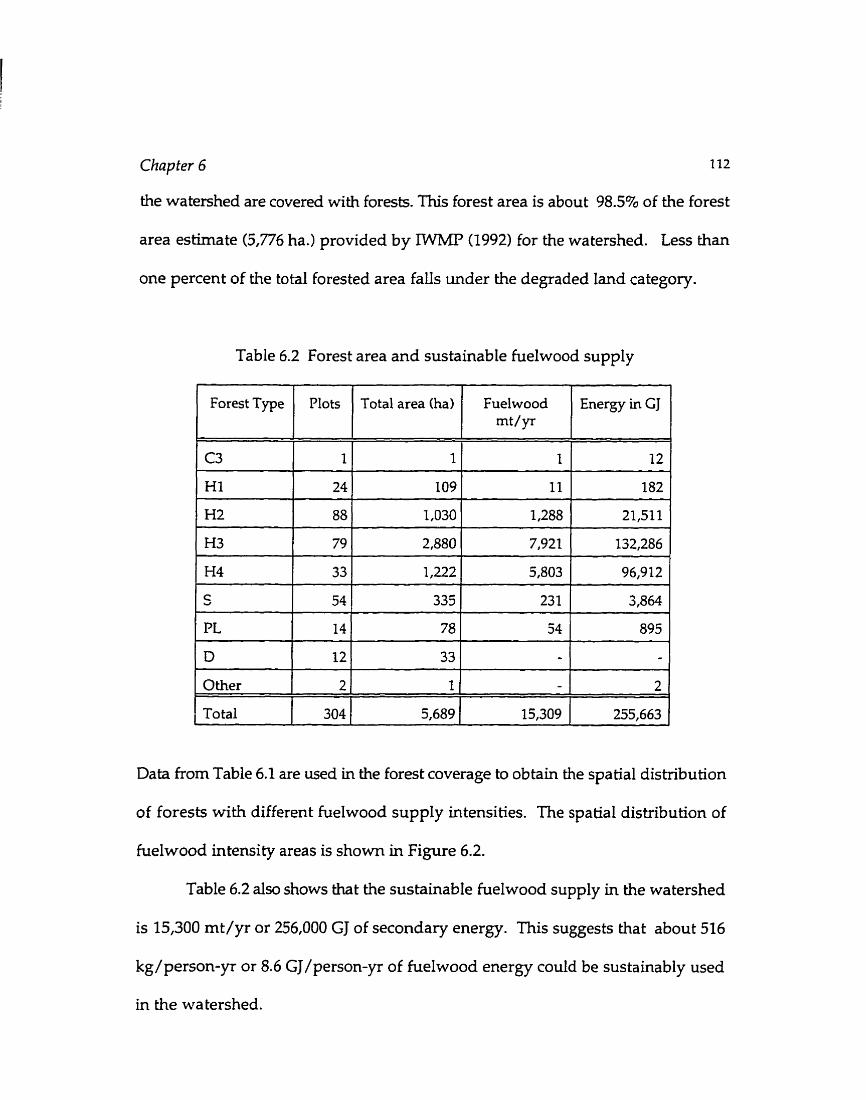
Chapter 6 112
the watershed are covered with fores&. This forest area is about 98.5% of the forest
area estimate (5,776 ha.) provided by IWMP (1992) for the watershed. Less than
one percent of the total forested area falls under the degraded land category.
Table 6.2 Forest area and sustainable fuelwood supply
1 Other 1 2 1 11 - 1 2 1
Forest Type
C3
Hl
Data from Table 6.1 are used in the forest coverage to obtain the spatial distribution
of foresû with different fuelwood supply intensities. The spatial distribution of
fuelwood intensity areas is shown in Figure 6.2.
Table 6.2 also shows that the sustainable fuelwood supply in the watershed
is 15,300 mt/yr or 256,000 GJ of secondary energy. This suggests that about 516
kg/person-yr or 8.6 GJ/person-yr of fuelwood energy could be sustainably used
in the watershed.
Plots
1
24
1 Total 304
Total area (ha)
1
109
5,689
Fuelwood mt/yr
1
II
15,309
Energy in GJ
12
182
255,663
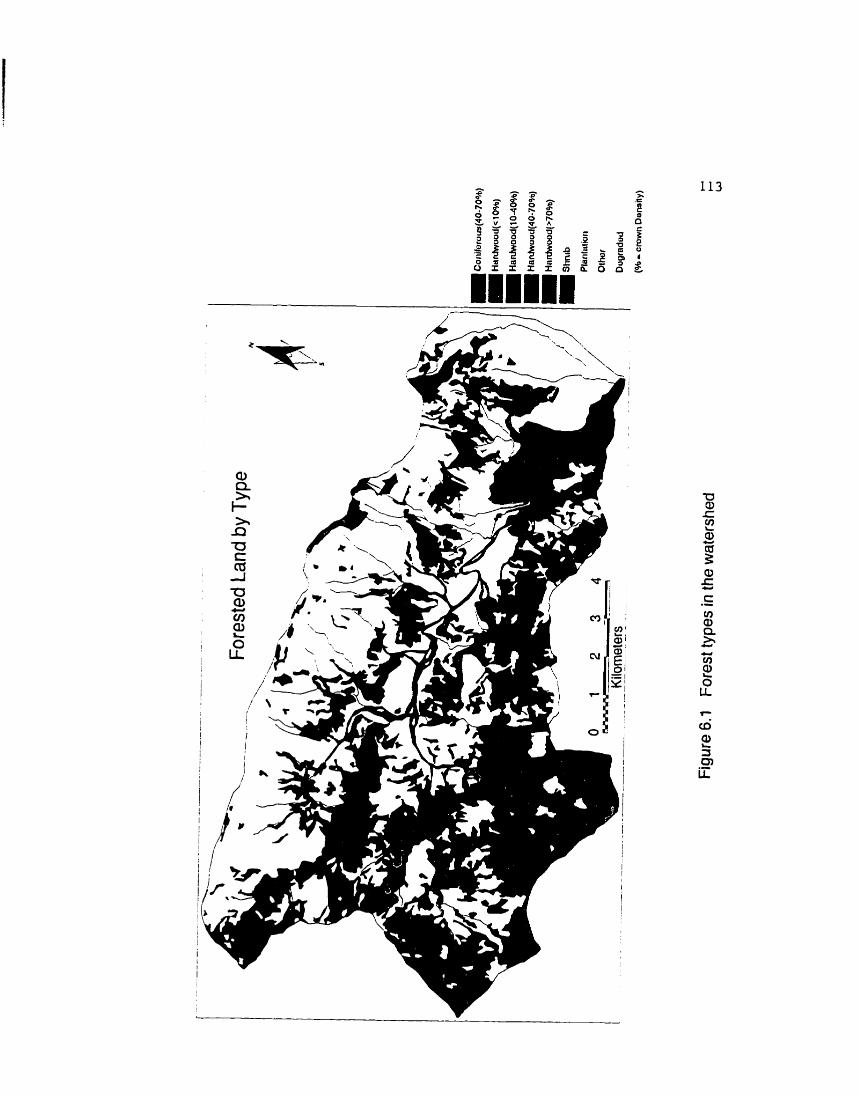

Chapter 6 115
IWMP (1992) has shown that about 75% of the forest is accessible for
fuelwood colletion. In the absence of VDC level data on accessibility of the forests,
the same percentage of accessibility is assumed for al1 VDCs. Based on these
assumptions, it is estimated that only about 11,500 mt/yr of fuelwood could be
used on a sustainable basis in the watershed, which translates to about 386
kg/person-yr of fuelwood or 6.4 GJ/person-yr of secondary energy.
In terms of fuelwood consumption, earlier studies estimate the hielwood
consumption to lie between 378 to 875 kg/person-yr (Levenson 1978 as cited in
DSCWM 1980). DECORE (1991) estimates the consumption to be about 3600
kg/household-year (about 600 kg/person-yr). The measurements camed out
during the survey reveal the current fuelwood consurnption avcrages to be about
340 kg/person-yr. This indicates that if sustainable fuelwood production is
managed, there will be no encroachment on forests for fuelwood.
The data in Table 6.3 show that if the VDCs are examined separately in tenns
of fuelwood production and the sarne average per capita fuelwood consumption is
assumed for dl VDCs, there exists a fuelwood deficit in the northern VDCs. Since
people need fuelwood to cook, and since fuelwood is seldom purchased, the figures
clearly indicate a cross VDC fuelwood flow from the southem forests to the
northem villages (or settlements) or encroadunent on the nearby forests maidy in
the northem VDCs.
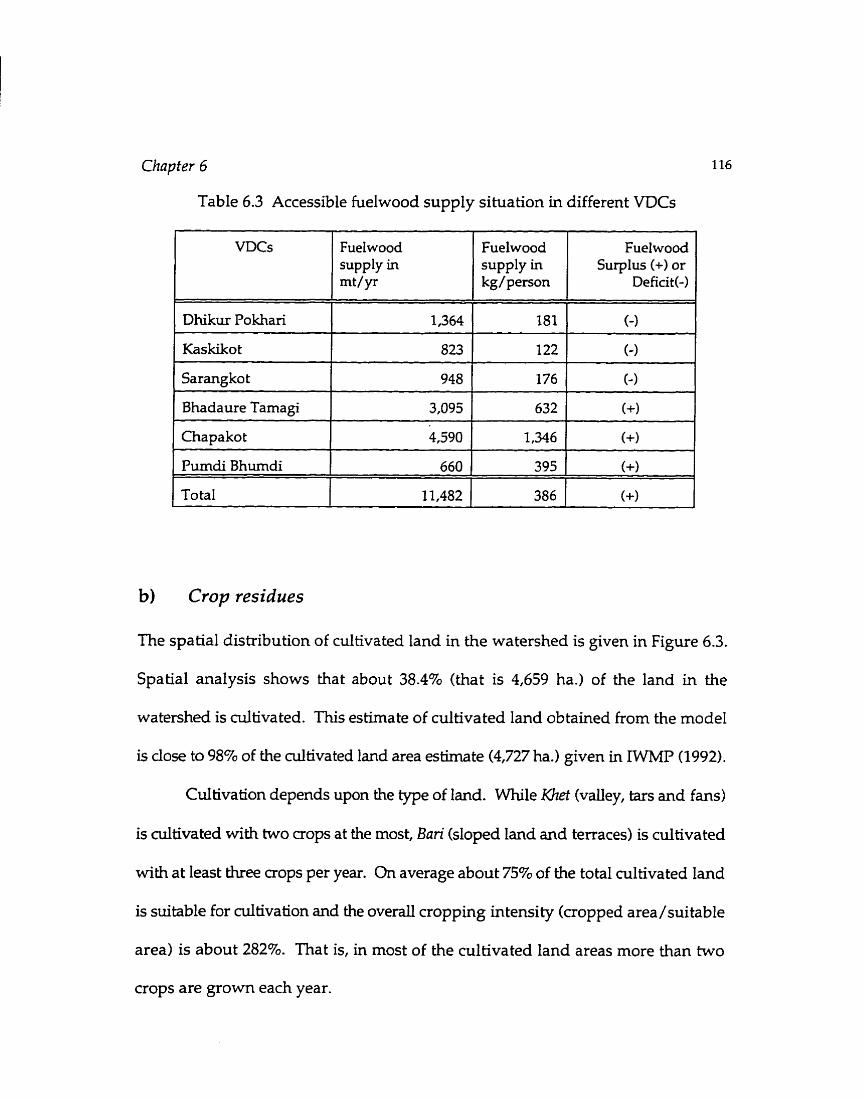
Chapter 6 116
Table 6.3 Accessible fuelwood supply situation in different VDCs
VDCs FueIwood supply in mt/yr
Dhikur Pokhari 1,364
Kas kikot 823
Sarangko t 948
Bhadaure Tamagi 3,095
Chapakot 4,590
Purndi Bhundi 1 660
Fuelwood Fuelwood supply in Surplus (+) or kg/person Deficit (-1
b) Crop residues
The spatial distribution of cultivated land in the watershed is given in Figure 6.3.
Spatial analysis shows that about 38.4% (that is 4,659 ha.) of the land in the
watershed is cultivated. This estimate of cultivated land obtained from the mode1
is dose to 98% of the cultivated land area estimate (4,727 ha.) given in IWMP (1992).
Cultivation depends upon the type of land. While Khet (valIey, tars and fans)
is cultivated with two crops at the most, Bari (sloped land and terraces) is cultivated
with at least h e e crops per year. On average about 75% of the total cultivated land
is suitable for cultivation and the overail cropping intensity (cropped area/suitable
area) is about 282%. That is, in most of the cultivated land areas more than two
crops are grown each year.
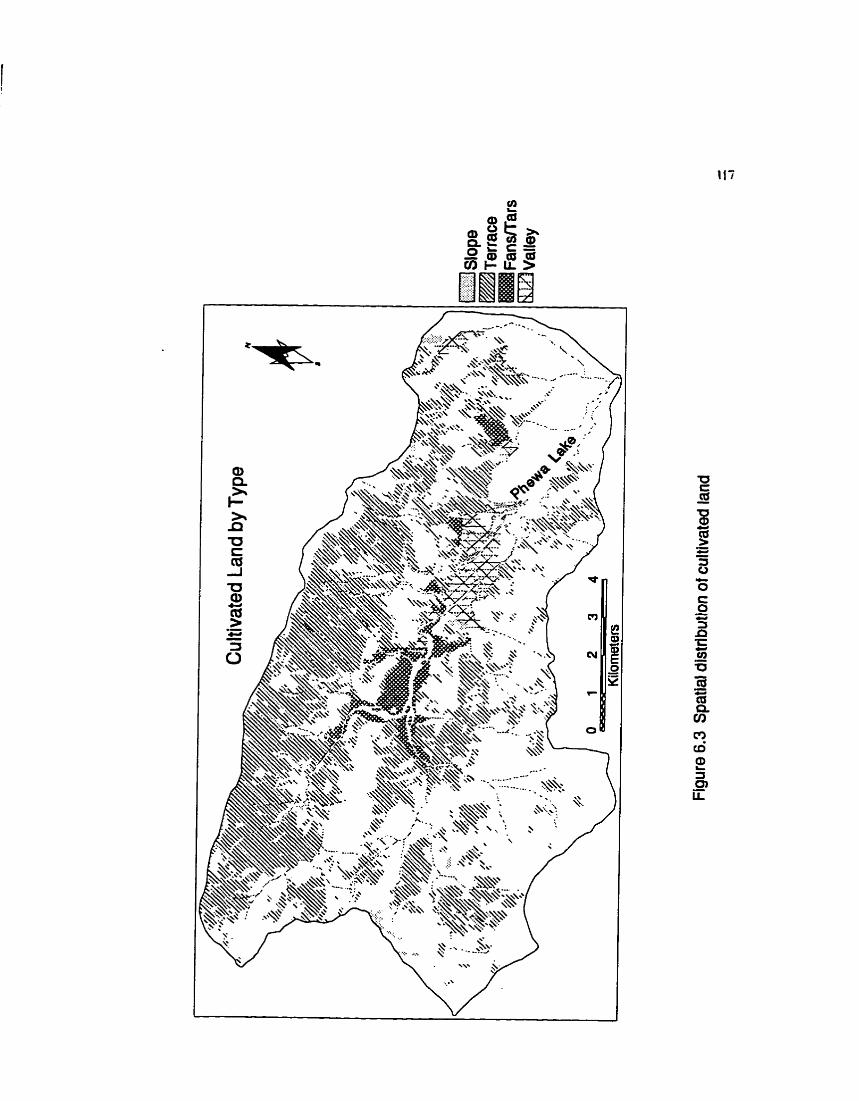
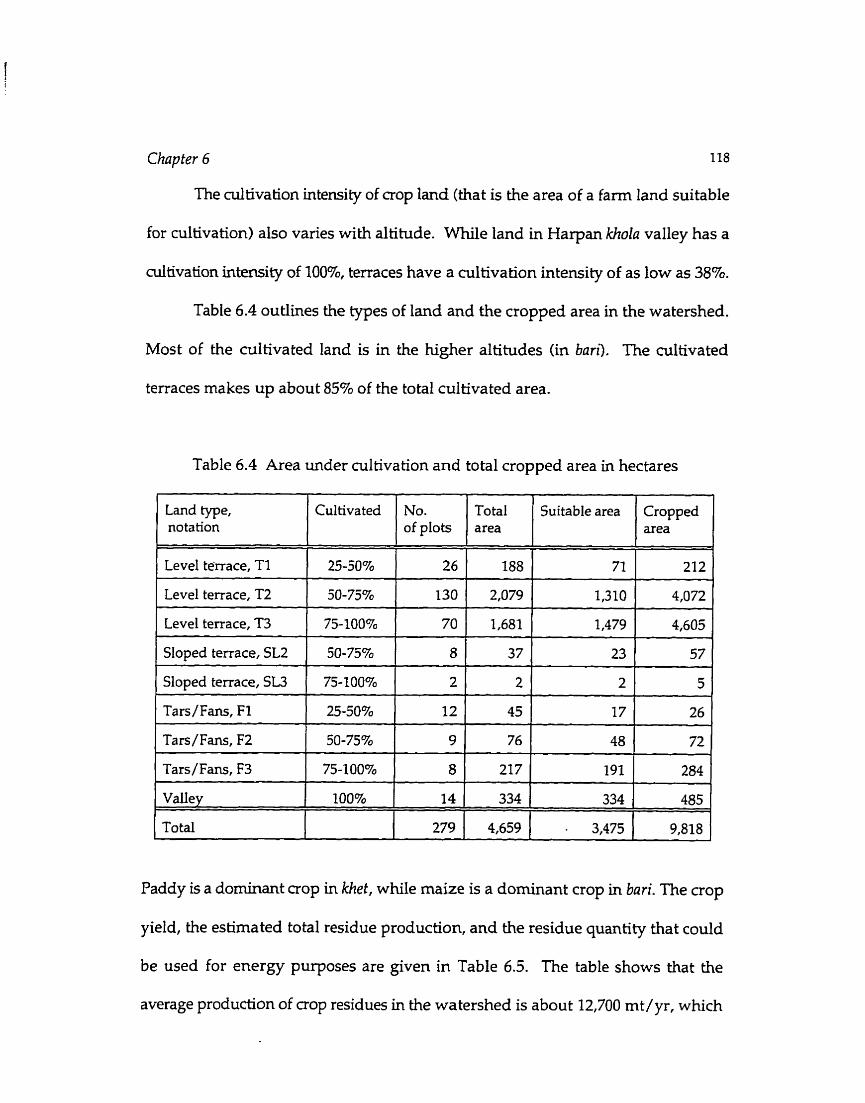
Chapter 6 118
The cultivation intensiv of crop land (that is the area of a farm land suitable
for cultivation) also varies with altitude. While land in Harpan khola valley has a
cultivation intensity of 100%, terraces have a cultivation intensity of as low as 38%.
Table 6.4 outlines the types of land and the cropped area in the watershed.
Most of the cultivated land is in the higher altitudes (in ban'). The cultivated
terraces makes up about 85% of the total cultivated area.
Table 6.4 Area under cultivation and total cropped area in hectares
Land type, notation
- - - - - - - - 1 Cultivrted 1 Na. 1 Total / Suitable zirea-/=ipeb- of pIots area area
l
Level tèrrace, Tl
Level terrace, T2
Level terrace, T3
Sloped tenace, SL2
Sloped terrace, S U
Tars/Fm, FI
Tars/Fans, F2
Tars/Fans, F3
Paddy is a dominant crop in khet, while maize is a dominant crop in bari. The crop
yield, the estimated total residue production, and the residue quantity that could
be used for energy purposes are given in Table 6.5. The table shows that the
average production of crop residues in the watershed is about 12,700 mt/yr, which
Valley
Total
25-50%
50-75%
75-10070
50-75%
75400%
25-50%
50-75%
75-100%
200%
188
2,079
1,681
37
2
45
76
217
I
26
130
70
8
2
12
9
8
14
279
71
1,310
1,479
23
2
17
48
191
212
4,072
4,605
57
5
26
72
284 l
334
4,659
334
- 3,475
485
9,818
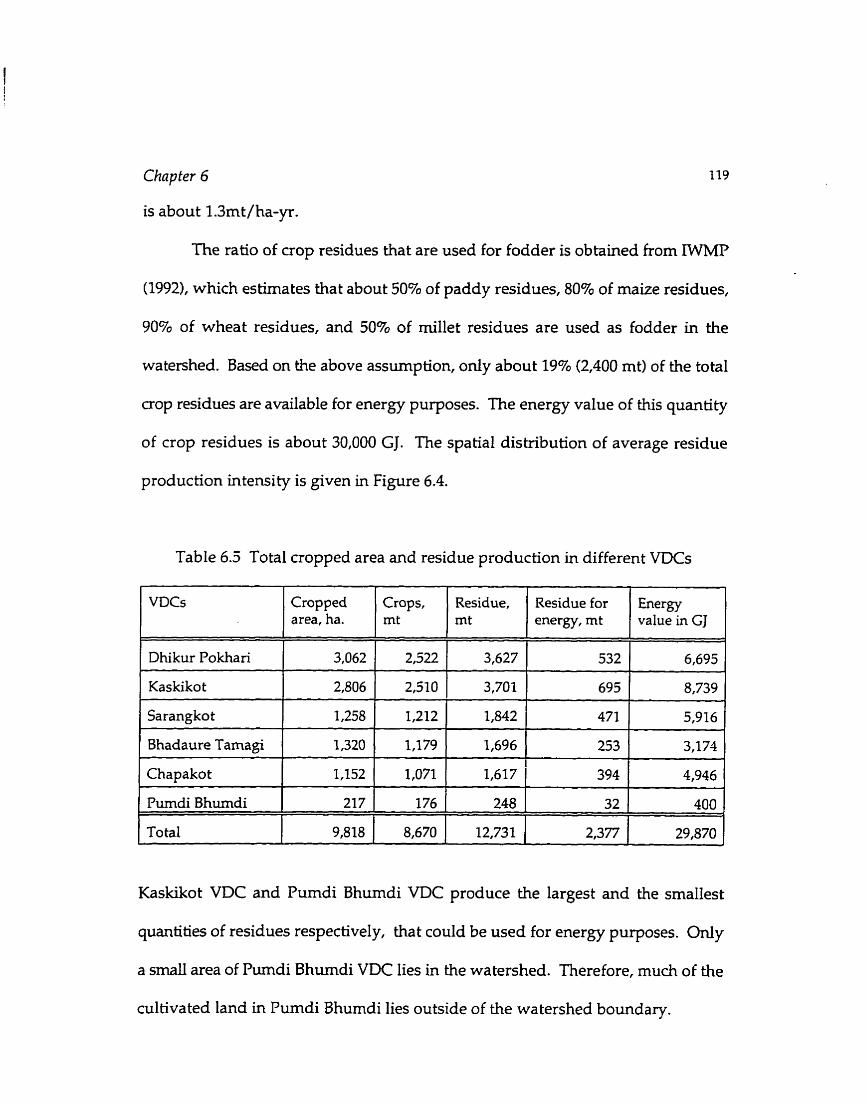
Chnpter 6
is about 13mt/ha-yr.
The ratio of crop residues that are used for fodder is obtained from IWMP
(1992), which estirnates that about 5010 of paddy residues, 80% of maize residues,
90% of wheat residues, and 50% of millet residues are used as fodder in the
watershed. Based on the above assumption, only about 19% (2,400 mt) of the total
crop residues are available for energy purposes. The energy value of this quantity
of crop residues is about 30,000 GJ. The spatial distribution of average residue
production intensity is given in Figure 6.4.
Table 6.5 Total cropped area and residue production in different VDCs
VDCs Cropped 1 area. h a / :PI, / Zidue . ( Reridue for 1 Energy 1 energy, rnt value in GJ
Dhikur Pokhari
Kaskiko t
Bhadaure Tamagi 1 1,320 1 1,179 1 1,696 1 253 1 3,174
3,062 ( 2,522 I
Sarangkot
2,806 ( 2,510 1 3,701 1 1
Kaskikot VDC and Pumdi Bhumdi VDC produce the largest and the smallest
quantities of residues respectively, that could be used for energy purposes. Only
a smaU area of Pumdi Bhumdi VDC lies in the watershed. Therefore, much of the
cultivated land in Pumdi Bhumdi lies outside of the watershed boundary.
3,627
695 1 8,739 I
1,258
Chapakot
Pumdi Bhumdi
532
1,212
1,152
217
6,695
1,842
1,071
176
471 5,916
4,946
400
1 1,617
248
394
32
Chapter 6
C) Liuestock manure
WECS (1994a) estimates that about 55% of the animal manure produced in Nepal
can be collected and ued. Assuming this ratio for the collection of animal manure
in the watershed, about 10,000 mt of dry animal m a u r e is available each year in
the watershed. The total manure produced in the watershed and its potential
energy use is given in Table 6.6. As indicated previously, only the possibility of
installing a biogas plant is examined here.
Biogas plants could be installed in areas with higher average daily
temperatures. The dimate in the watershed up to 1,000 m elevation is classified as
humid subtropical with an annual average temperature of about 19°C and the
lowest average monthly temperature of about 13°C in January (IWMP 1992). This
area is expected to be suitable for biogas production.
Table 6.6 Livestock manure for energy use in VDCs.
1 Kaskikot 1 3,250 1 1,787 1 18,947
VTX
Dhikur Pokhari
Total manure, mt
5,006
Sarangkot
Bhadaure Tamagi
Chapakot
Purndi Bhumdi
To ta1
Manure for energy use, mt
2,753
3,864
2,625
2,886
940
18,571
Energy value of available manure, GJ
29,185
2,125
1,443
1,587
517
10,241
22,527
15,304
16,825
5,480
108,269

Chapter 6 122
The spatial analysis shows ihat one village in each of Dhikur Pokhari and Kaskikot,
two in Bhadaure Tamagi, eleven in Chapakot, three in Pumdi Bhurndi, and four in
Sarangkot are suitable for biogas installation. This information is obtained by
overlaying contour coverage and villages (or settlements) coverages. The spatial
distribution of such villages and the potential number of biogas plants are s h o w
in Figure 6.5. While Pame village in Kaskikot VDC lies in the humid subtropical
region, this area is rnauily a shopping stop. Therefore, no biogas potential is shown
for this particular area.
GGC (1990) suggests that for a household size of less than six members (as
in the watershed), a 10m3 capacity biogas plant is required. By applyuig the mle
of thumb given by Pokharel et al. (19951, this plant produces a maximum of
1.8m3/day of biogas. Such a plant requires 60 kg of fresh dung every day, which
in tum requires four or more stall fed cattle and buffaloes.

Chap ter 6 124
About 20% of the households in each VDC in the watershed hold more than
four cattle and buffaio (survey) and are, therefore, potential households for biogas
installation. The analysis suggests that there is a potential to install more than 140
biogas plants of 10m3 capacity. The average annual biogas production and
hielwood that could be saved by using all of the generated biogas in different VDCs
ar? given in Table 6.7, which shows that there is a high potential for biogas
installation in Chapakot, Sarangkot, and Pumdi Bhumdi. This information at the
village level helps in formulating a better distribution plan for biogas installation.
Table 6.7 Biogas potential in VDCs.
Annual fuelwood saved, mt
Dhikur Pokhan
Kaskikot
Sarangkot
Bhadaure Tarnagi
Chapakot
5
5
Pumdi Bhumdi
Rowbotham (1995) indicates that biogas is pwrly received in the watershed because
of the belief that the diversion of dung to biogas deprives the fields of manure.
Therefore, to make biogas plants successful, proper awareness, technical backup,
and a proper loan mechanism are necessary. In the absence of a proper loan
41
8
56
Total
2,700
2,700
28
22,140
4,320
30,240
1,869
65
65
15,120
. 268
9
9
536
105
732
77
15
105
366 53

Chapfer 6 125
mechanism (Pokharel et al. 1990), the penetration of a biogas programme into the
area would be difficult.
lhere has been some attempt to introduce biogas plants in the area under the
watershed management program. The author visited three operating biogas plants
in Marse, Soureni and Dharapani. However, the total number of biogas plants
installed in the watershed is not known b e c a w of poor data keeping by the biogas
companies working in the area.
6.1.2 Nonbiomass Resources
Mar, wind, and hydropower are the three nonbiomass energy sources which can
be hamessed in the watershed. However, the data do not currently exist to
establish wind regimes in the watershed, therefore, the wind energy potential is not
considered in the spatial model. If the data were available as to the wind velocity
in different areas, the wind energy density map could be drawn and the potential
for wind energy extraction in those areas could be established.
The sections below discuss the small scale hydropower potential and the
solar energy potential in the watershed. Other nonbiomass energy sources, kerosene
and grid-electncity, are considered in the energy consumption module as these
resources are not generated in the watershed.

Chapter 6
a) Hydropower
The high intensity of rainfall, the large nurnber of strearns, and the lake at the
eastem end of the watershed suggest the feasibility of hydropower in the
watershed. There is an existing electncity generation station, that uses the water
discharge from Phewa lake to produce one megawatt of electricity. The electricity
generated by this station is connected to the Nepalese national electricity grid.
Recently, some power generated by this facility has been diverted back to the
watershed, under the rural elechification program.
Basin analysis shows that on) three basins in the watershed - Andheri Wiola,
Sidhane khola and Handi Wrola- have more than five square kilometre of catchment
areas. Therefore, if there is a potential for small hydropower generation, then these
three basins could be considered first. The electricity generated in these basins
could be used either for mechanical purposes or for electricity generation or both.
Considering the fa& that the current electricity consumption is only for lighting, it
is assumed that the third option of generating both mechanical (in the day) and
electrical power (in the night) is a teduiically viable option. However, only lighting
and the use of appliances are considered here.
In the absence of any data on the stream fiow, the following relation is used
to calculate the average stream flow,
Chapter 6 127
where Dm, refers to the minimum discharge at Phewa lake (lm3/s as given in
section 5-1.21, D, refers to the discharge from stream a, CA, refen to the catchment
area of stream v, and TCA refers to the total catchment area of the watershed (= 122
sq.km). Using this relation, it is estimated that the minimum water contribution to
Phewa lake is 0.008 m3/s by every square kilometre of the watershed area.
During the RA in January 1996, the pour points of Harpan khola (near Pame)
Andheri khola, Sidhane kholn, Handi khola, Marse khola and Tore khola were
measured using a cubical wooden float. Other streams had hardly any surface flow
in that period. The estimated minimum discharge of the streams obtained by using
equation (6.1) and the discharge obtallied by Boat measurements are given in Table
6.8. The percentage contribution of a stream is the ratio between the measured flow
at the pour point of each stream and the measured flow at Harpan khola.
Table 6.8 Estimated and measured discharges in some strearns
Stream
Andheri
Sidhane
Handi
Marse
Tore
Harpan
Phewa
Ca tchmen t area sq.krn.
16.9
19.1
- - -
9.3
2.2
3.7
-
122.2
Estima ted minimum discharge, m3 /s
0.14
0.16
0.07
0.02
0.03
-
1 .O0
Measured discharge, m3/s
0.18
0.37
0.31
0.05
0.04
1.27
--
Percentage contribution
14%
29%
24%
4%
3%
100%
Chnpter 6 128
Measured discharge figures show that Sidhane k M a and Handi khola
contribute the most to the water fIow in Harpan khola. The researcher was told
during the RA that in the dry season, Andheri Wlola "dies down" before meeting
with Harpan Wiola. At the time of measurement, Tore Wtola and Marse khola had a
very good water flow at their pour points but had seeped under after that.
Although the surface water flow in Harpan khola is good, the water head is
not available for small scale hydropower generation. Therefore, only the pour
points of Andheri khola, Sidhane Wlola, and Handi Wiola are considered for small
hydropower generation. To calculate the discharge (D, ) from stream v, equation
(6.1) is modified by including the percentage contribution given in Table 6.8. The
modified equation is given in equation (6.2).
The e sha t ed stream discharge available for hydropower generation (by assurning
that only about 80% of the minimum water flow in each of the potential streams is
used for hydropower generation), the potential hydropower capacity at a waterfall
of 20 m, and the delivered electricity for lighting (at 4 hours per night) are given
in Table 6.9. The hydropower generation at these sites could be increased by
increasing the waterfall. The stream basins with more than one square kilometre
of ca tchent area are shown in Figure 6.6. The stream basins which are potential
sites for hydropower generation have been shaded in the figure.
Table 6.9 Estimated discharge and hydropower production
----. --. - Xndheri khoia 7- -. Potential hydropower si tes
1 0 --. basin -
VDC
Dhikur Pokhan
Bhadaure Tamagi
Chapakot
The table shows that Sidhane Wrola c m provide a h o s t half of the total
electriaty generation in the watershed. Assuming a 65% extemal efficiency, these
Stream
Andhen
Sidhane
Handi
three sites can produce about 260 GJ/yr of electricity for use in the households.
To ta1 - 0.55
Discharge, m3/sec
0.11
0.24
0.20 ,
77 71,013 239
Potential, kW
16
34
27
Annual kWh
14,950
31,769
24,294
Energy, GJ
54
114
91

Chapter 6
b) Solar energy
Estirnates for annually received global radiation at different weather stations in
Nepal including Pokhara (latitude 28.22 degrees, longitude 84 degrees and
elevation 854 metres) and Lumle (latitude 28.18 degees, longitude 83.8 degrees and
elevation 1645 mebes) are given in WECS (19841, which show that the lowest
monthly solar radiation on a horizontal surface in Pokhara and Lumle are 315
w /m2 and 344 W /m$ respectively.
As a worst case xenario, it is assumed that a minimum of 315 W/m2 of solar
radiation fall on a horizontal surface in the watershed. However, for the optimum
absorption of solar energy, the surface should be inclined to an angle equal to the
latitude of the site. Duffie and Beckman (1980) provide charts (see Figures 1.7.la
to 1.7.le pp 19-21) to convert solar absorption on the horizontal surface to inclined
surface for beam radiation. These values are used to calculate the geometric ratio
(Rb) between the solar incidence on a horizontal surface (8,) and on an inclined
surface (8) as,
Rb = Cos0I CosB, (6.3)
which cornes out to be 1.4 for the study area. Therefore, the worst case optimum
solar absorption in the watershed is 440 W/m2. For a day Iength of 10 hours, the
average energy absorbed by an inclined surface would be about 4.5 kWh/m2-day
or 6.8 GJ/m2-year.
The worst case estimates of the average solar energy avadability in Nepal are

Chapter 6 131
provided by Solarex Corporation (1992) as 4.5 - 5 kWh/m2/day. From this
cornparison, it is conduded that for the preliminary calculation of the solar energy
availability, such a solar insolation map would be sufficient. For installing a solar
photovoltaic system at a site, however, long term data are necessary.
Solar energy c m be used for either water heating or PV based electricity
generation. Since there is a very limited demand for water heating, only
photovol taic-based electticity generation is considered here. S tout et al. (1979)
suggest that an 11% conversion efficiency and an 85% inverter efficiency
(converting from direct current to altemating current) are most realistic in PV
applications. The effiaency of energy storage batteries and the battery control unit
are assumed to be 70% and the efficiency of distribution as 75%. Therefore, the
solar energy that could be delivered to the consumer reduces to 0.28 GJ/m2/year.
That is, the overall efficiency of converting solar energy to electricity and
distributing it to the consumer is only about 5%. Therefore, in the watershed, to
generate one kilo-Watt hour of energy per day, 4.5 m' of PV modules would be
necessary.
It is assumed that PV modules could be installed on a portion of barren and
abandoned land. Recalling the heavy distribution losses incurred while extending
low voltage electricity distribution lines, it is assumed that PV modules should be
installed within a 500 metre horizontal radius from the nearest village. As an
illustration for understanding the feasibility of solar energy extraction in the
watershed, it is assumed that about 170 of the selected land sites could be

Chapter 6 132
committed to PV based electricity generation. Based on Kodari PV-installation in
Tatopani, Nepal, it is estimated that only 50% of that land could be used for
installing PV-modules. Spatial analysis with the above assumptions shows that
there are 11 sites suitable for solar-based electricity generation. These sites could
serve the lighting need of at least 12 villages. The analysis indicates that Pumdi
Bhumdi is not suitable for PV installation because there is no barren and abandoned
land dose enough to the settlements. The spatial distribution of selected sites and
electricity potential is given in Figure 6.7 and details of the potential for each site
is given in Table 6.10.
If a household illuminates two 40 W bulbs for four hours a day, then about
1.5 sq.m of PV modules would be required for each household to meet the Iighting
energy demand. If units are installed in each household, then about 1.2 sqm of PV
modules would be necessary because of reduced distribution losses.
Çolar cookers are not considered here because the currently rnarketed solar
cooken take long time in cooking. Also, cooking is limited to boiling, a method
which does not match to the culinary practices in the watershed.
Table 6.10 PV based electricity generation potential
Dhikur Pokhari
Kaskiko t
Bhadaure Tamagi
Zhapakot I
Kot Gaun f 2.5
Sera Chour
Bhirmuni 1 6.5
Karki Gaun 1 9 -8
Dhawa 1 4.4
Dada Khet 1 5.7
Parne I 12.5
Rote Pani 1 20.8
Kudwi Dada 2 5.9
sidane 1 3.7
Energy w y r
Served no. of househoIds
6.2 Energy Demand Module
Damai Dada
The energy demand is the quantity of energy used when there are no restrictions
in supply and when the available energy sources are affordable. Since, the goal of
this work is to formulate energy policy oriented towards sustainability, the current
energy consumption pattern is assumed as the energy demand. To obtain an energy
demand module, therefore, the energy demand attributes are added to the
population coverage. This way, energy demand maps are obtained to show the
1 2.2 13 20
Chapter 6 135
demand by fuel type and by end-use types. These maps are shown in Figures 6.8
and 6.9. Detailed data on energy demand are presented in Tables 6.11 and 6.12.
Table 6.11 Energy consump tion in GJ by fuel type
As seen from the tables, the secondary energy consumption in Dhikur Pokhan is the
VDCs
Dhikur Pokhan
Kaskiko t
Sarangko t
Bhadaure Tamagi
Chapakot
Pumdi Bhumdi
To ta1
highest and that in Pumdi Bhumdi is the lowest because of the difference in
population distribution. It is seen that about 137 kI (1 kl = 36.3 GJ) of kerosene and
620 M'Wh (1 MWh=3.6 GJ) of electricity is being consumed in the watershed
Fuel- wood
42,736
38,391
30,700
27,832
19,363
9,497
168,519
annually. Table 6.12 shows that a very high percentage of the total energy is
Biogas
8
7
5
5
3
2
30
required for cooking.
Resi- due
1,655
1,487
1,189
1,078
750
368
6,527
Char- coal
2
1
1
1
1
O
6
Kero- sene
1,204
946
757
1,372
477
234
4,990
Electri- city
603
610
488
O
308
151
2,160
Total
46,208
41,442
33,140
30,288
20,902
10,252
182,232
Fuelwood Crop Residue Charcoal
'i-:. , Animal Manure Biogas Kerosene Electricity Other 9 = 5000 GJ
Figure 6.8 Energy consumption by fuel types
Table 6.12 Energy consumption in GJ by end-use
VDCs
Chapakot 17,867 1,704 273 511 273 274 20,902
Kas kiko t
Sarangko t
Bhadaure Tamagi
Pumdi Bhumdi 1 8,763 836 134 1 251 134 134 10,252 t I
Cooking
An estimate of final energy consumption is essential to analyse the possibility of
35,424
28,328
25,681
interfuel and intermode substitution (Pokharel et al. 1992). The extemal efficiency
of some fuels and end-use efficiency of some devices were presented in Table 4.3.
End-use efficiencies used in this study are given in Table 6.13. It is assumed that
cooking is primanly done on traditional fuelwood stoves.
7
3,379
2,703
2,450
Lighting Feed Space Heating
541
432
392
Food Processing
1,014
811
980
Appliance /others
Total
542
432
392
543
434
393
41,442
33,140
30,288
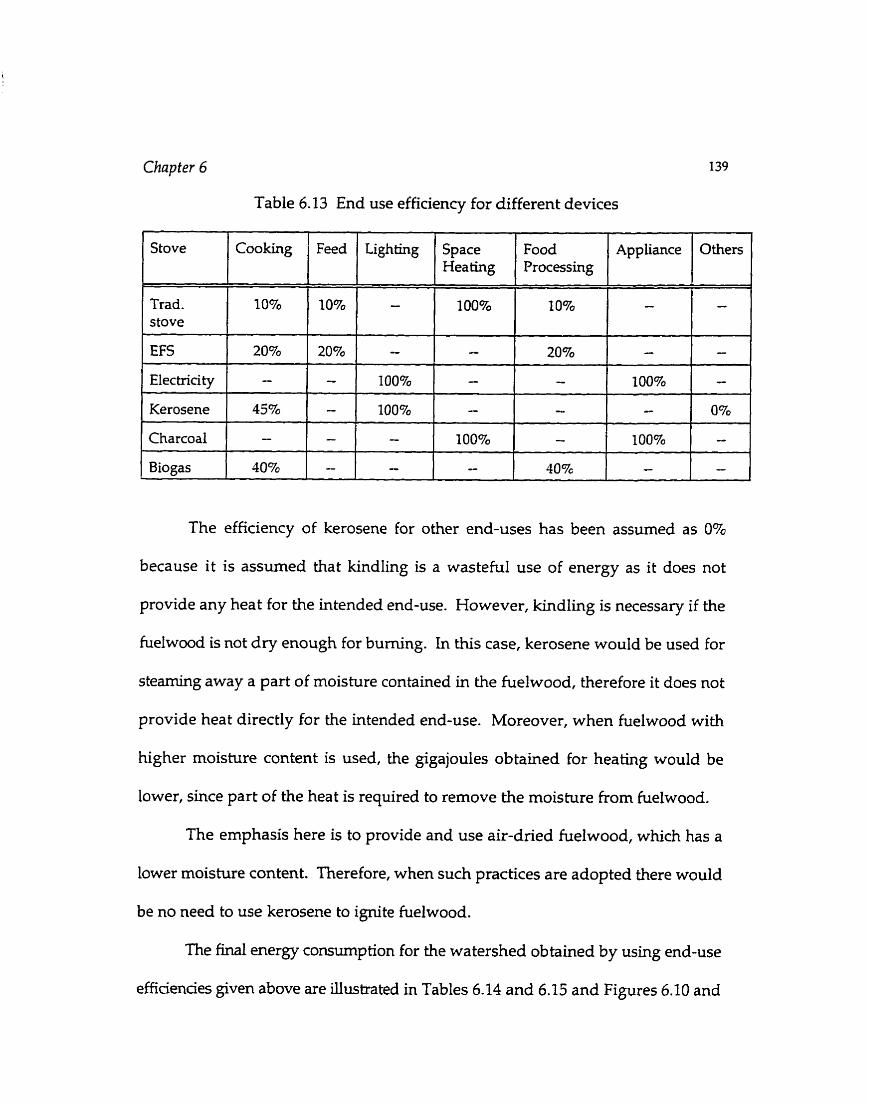
Chapter 6
Table 6.13 End use efficiency for different devices
The efficiency of kerosene for other end-uses has been assumed as 0%
because it is assumed that kindling is a wasteful use of energy as it does not
provide any heat for the intended end-use. However, kindling is necessary if the
fuelwood is not dry enough for buming. In this case, kerosene would be used for
steaming away a part of moisture contained in the helwood, therefore it does not
provide heat directly for the intended end-use. Moreover, when fuelwood with
higher moisture content is used, the gigajoules obtained for heating would be
lower, since part of the heat is required to remove the moisture h m fuelwood.
The emphasis here is to provide and use air-dned fuelwood, which has a
lower moisture content. Therefore, when such practices are adopted there would
be no need to use kerosene to ignite fuelwood.
The final energy consumption for the watershed obtained by using end-use
effiaencies given above are illustrated in Tables 6.14 and 6.15 and Figures 6.10 and
l Stove
Trad. stove
EFS
Electncity
Kerosene
Charcoal
Biogas
Cooking
1070
20%
-
45%
-
4070
Lighting
-
- 100%
l 00 l0
- -
' Feed
10%
2OTo
- -
-
-
Space Heating
100%
- - -
10070
-
Food Processirtg
10%
20%
- - -
40%
Appliance
-
- 100%
- 100C570
-
O thers
-
-
- 0%
- -
3
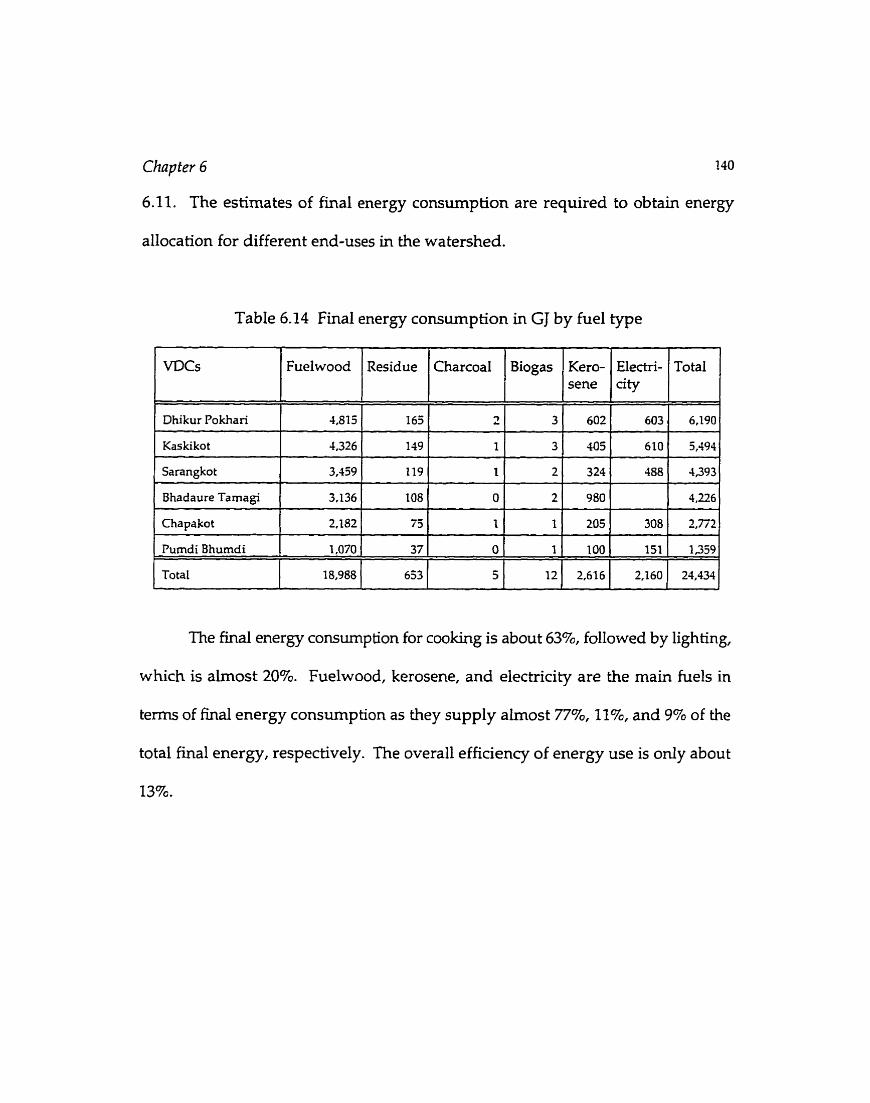
Chap ter 6 140
6.11. The estimates of final energy consumption are required to obtain energy
allocation for different end-uses in the watershed.
Table 6.14 Final energy consumption in GJ by fuel type
The final energy consumption for cookuig is about 63%, foIIowed by lighting,
which is almost 20%. Fuelwood, kerosene, and elechicity are the main fuels in
terms of final energy consumption as they supply a h o s t 77%, Il%, and 9% of the
total final energy, respectively. The overall efficiency of energy use is only about
13%.
1
WCç
Dhikur Pokhari
Kaskikot
Sarangkot
Bhadaure Tamagi
Chapakot
Pumdi Bhumdi
To ta1
Fuelwood
4,815
4,326
3,459
3,136
2,182
1,070
18,988
Residue
165
119
119
108
75
37
653
Charcoal
C. 3
1
1
O
I
O
5 -
Total
6,190
5,494
4,393
4,226
2,772
1,359
24,434 A
Kero- sene
602
405
324
980
205
100
2,616
Biogas
3
3
2
2
1
1
12
Electri- city
603
610
488
308
151
2,160
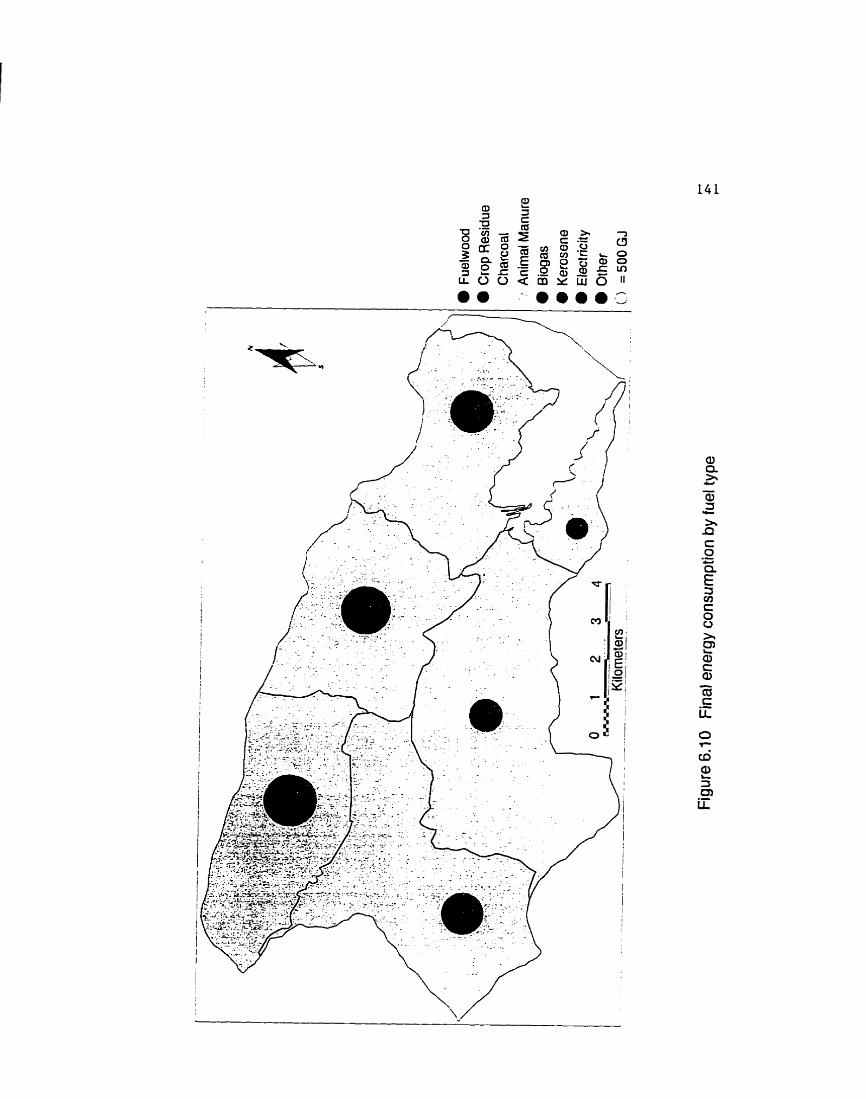
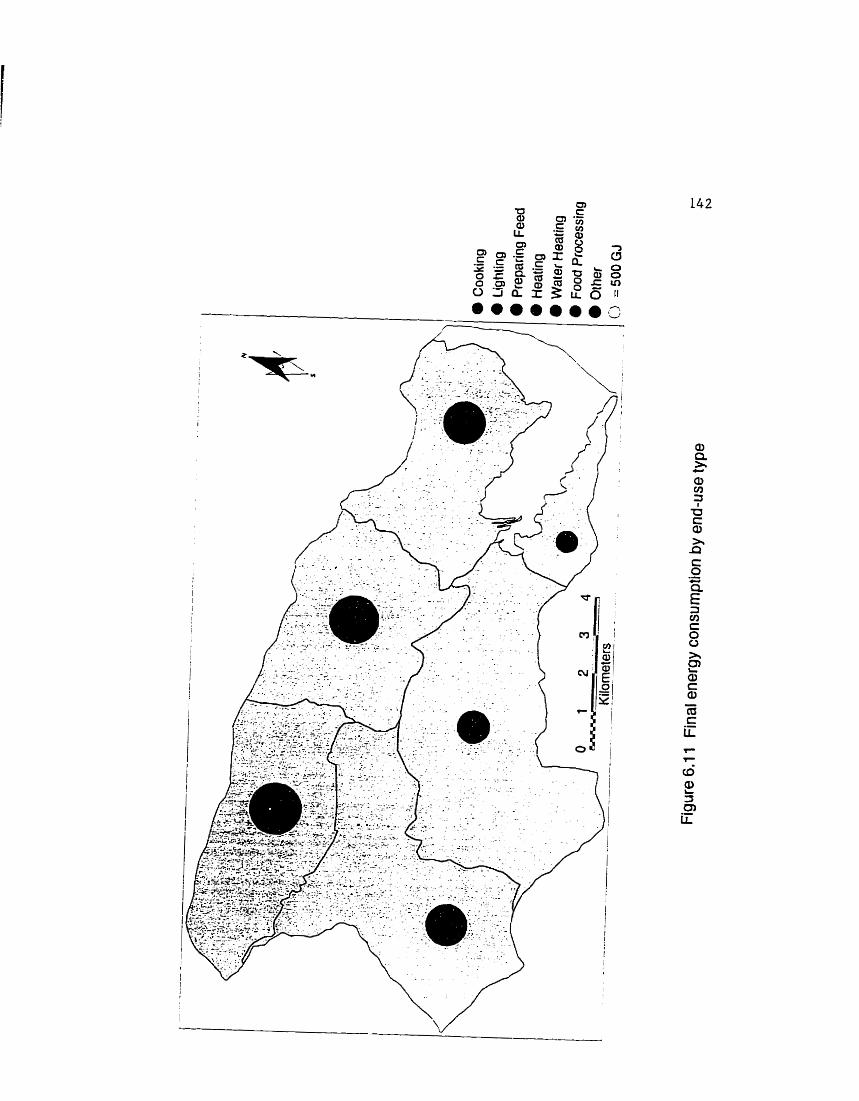
Chapter 6
Table 6.15 Final energy consumption in GJ by end-use
Cooking Feed Space Lighting Food Appliance 1 1 / Heahng / 1 Procesring 1 I i
Dhikur Pokhari 3,946 376 602 1,204 60 3
Kaskiko t 3,544 338 541 1,014 54 3 r
Sarangkot 2,834 270 432 811 44 2
Bhadaure Tamagi 2,570 245 392 980 39 O
Chapakot 1,788 170 273 511 27 1 I
Pumdi Bhumdi 877 84 134 251 13 ( 1 I
6.3 Energy Balance
Total
- 6,191
5,494
4,393
4,226
2,770
1,360
24,434 J
The information on biomass and nonbiomass energy sources given in section 6.2
could be cornbined to produce an energy resource map for the watershed as shown
in Figure 6.12. The figure shows that fuelwood dominates the energy availability
in the watershed. Biomass sources constitute a h o s t
resource availability. The energy demand rnap shows
used energy source in the watershed.
99.870 of the total energy
that fuelwood is the rnost
The energy balance sheet for the watershed given in Table 6.16 and Figure
6.13 shows that there is a net surplus of energy in the watershed. If interfuel
substitution was technically and economically feasible and if al1 the energy
resources were exploited, then the watershed should have been able to support a
Chapfer 6 145
self sustaining energy system for some tirne. However, the examination of
fuelwood consurnption shows that there is a fuelwood deficit in the northem VDCs
of the watershed; although there is a net surplus in the watershed as a whole
(Figure 6.14). This indicates a cross VDC flow of fuelwood and an encroadunent
on nearby forests particularly in the northem VDCs. Sùnilarly, with crop residues
there is surplus supply in al1 VDCs.
Table 6.16 Energy surplus (+) and deficit (-1 VDCs
1 VDCs Fuelwood Residue I I Dhikur Pokhari
Kaskiko t
Manure
29,181
The data show that even if al1 of the hydropower and PV potential in the
watershed were exploited, electriaty required for lighting and the use of appliances
would siil be in a deficit as shown in Figure 6.15. This means that either more PV
installation shodd be promoted @y committing more land area for PV generation)
or electriaty should be imported through grid extension. The electricity supply in
Bhadaure Tamagi VDC is in surplus because electricity is not currently available in
-12,360
-20,067
Sarangko t
Bhadaure Tamagi
Chapakot
Pumdi Bhumdi
To ta1
Biogas
58 5,040
7,252
-9,586
41,079
82,838
5,204
87,108
Electri- City
-496
4,727
2,096
4,196
32
23,343
Kero- sene
-1,203
TotaI
20,220
Chapter 6 146
this VDC. In the case of kerosene, since it is imported for use in the watershed, it
is shown in a deficit in Figure 6.16.
Sarangkot VDC is closest to the urban area where most of the biogas plant
installing agencies are located. Since fuelwood shortage has already been felt in
this VDC, a public awareness campaign could be created to promote the installation
of biogas plants. Although the potential for biogas is highest in Chapakot, the
proximity of the households to the forest and hence the ease of access to fuelwood,
impede an enthusiastic response to a biogas program there.
6.4 Summary
The development of a spatial mode1 for energy analysis is a contribution made by
the researcher towards energy planning. The chapter has demonstrated that the
extraction of energy information from spatial data and attribute information is
possible. The information was broken down by using a GIS capability to see the
resource and demand distribution in each VDC. Although the area considered here
is very small, it is expected that the methodology c m be seamlessly transfened to
larger areas.
Usually energy analysis starts with information on the total energy balance
for a particular region as a whole. Such information is of little value because of
technological and economic limits. It is also shown that an area-wise spatial
analysis helps in locating potential sites for energy generation, such as, biogas,

Chnpfer 6 147
hydro, and solar. Such information is very helpful in identifying location specific
energy programs. For example, by knowing fuelwood deficit areas, authorities
could initiate or encourage energy conservation and fuel substitution programs
hrgeted to that area.
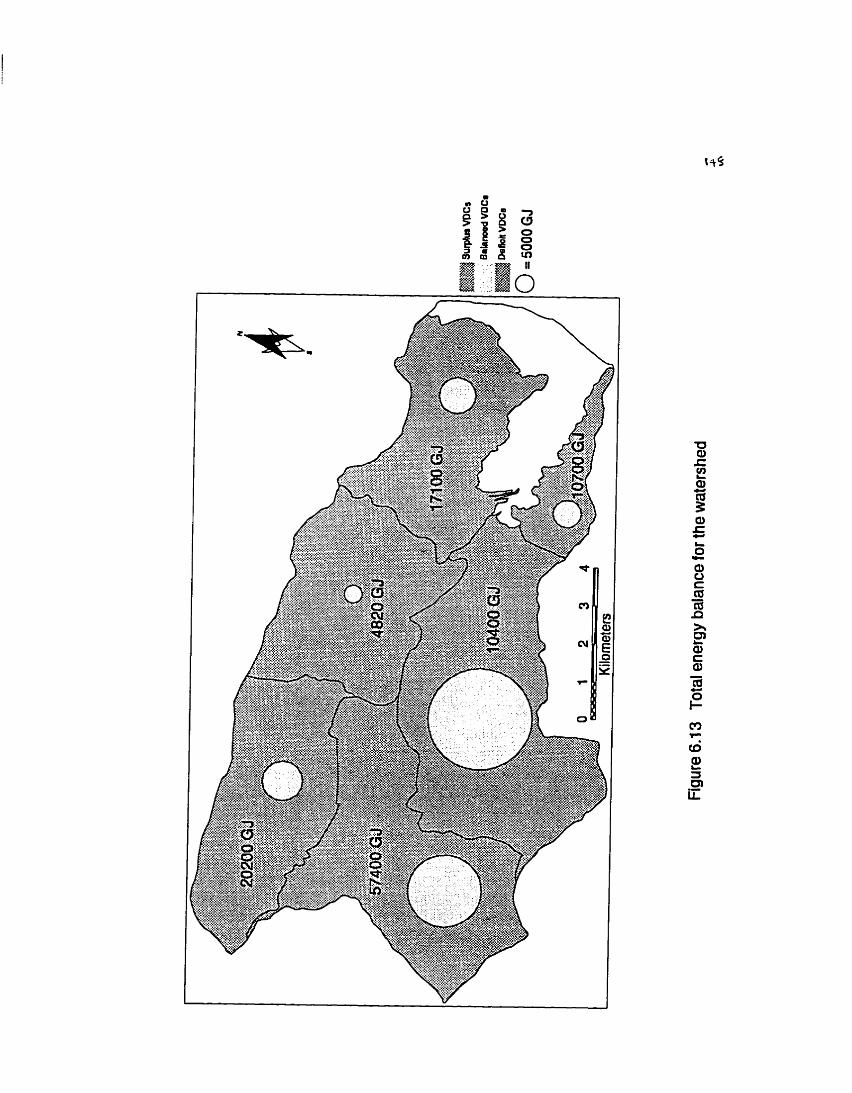
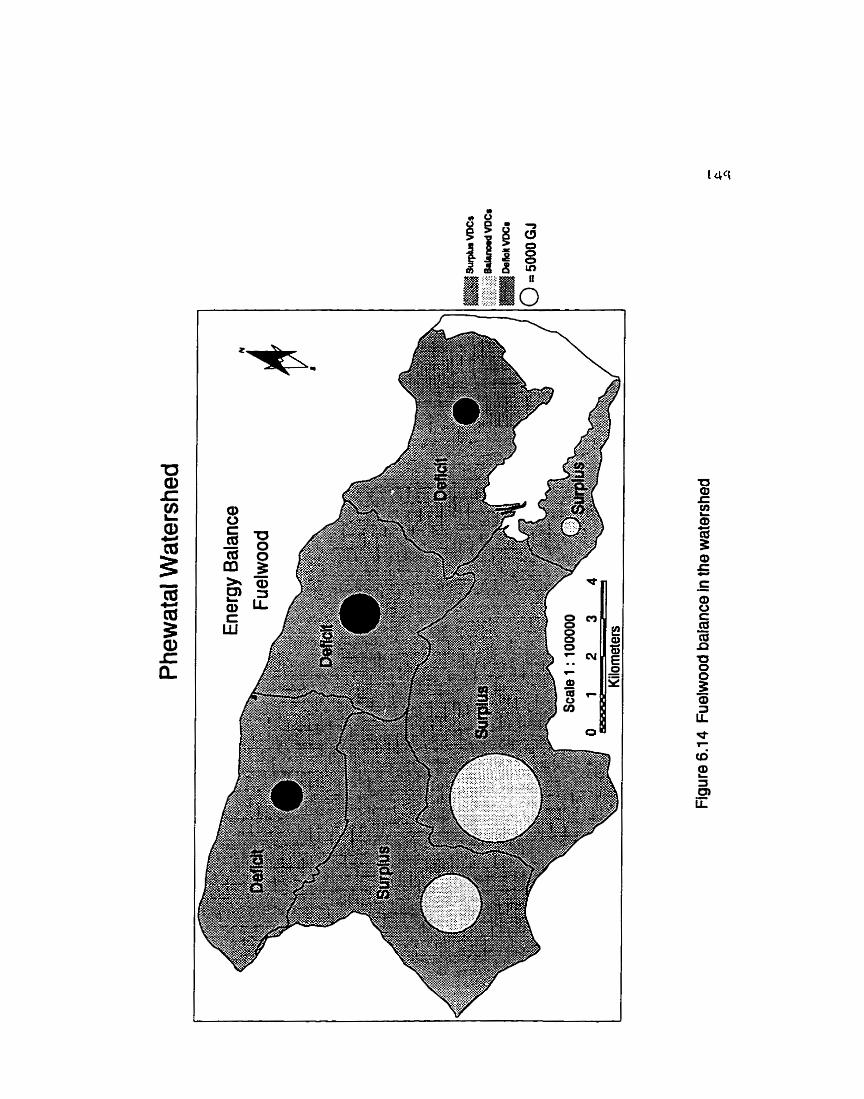
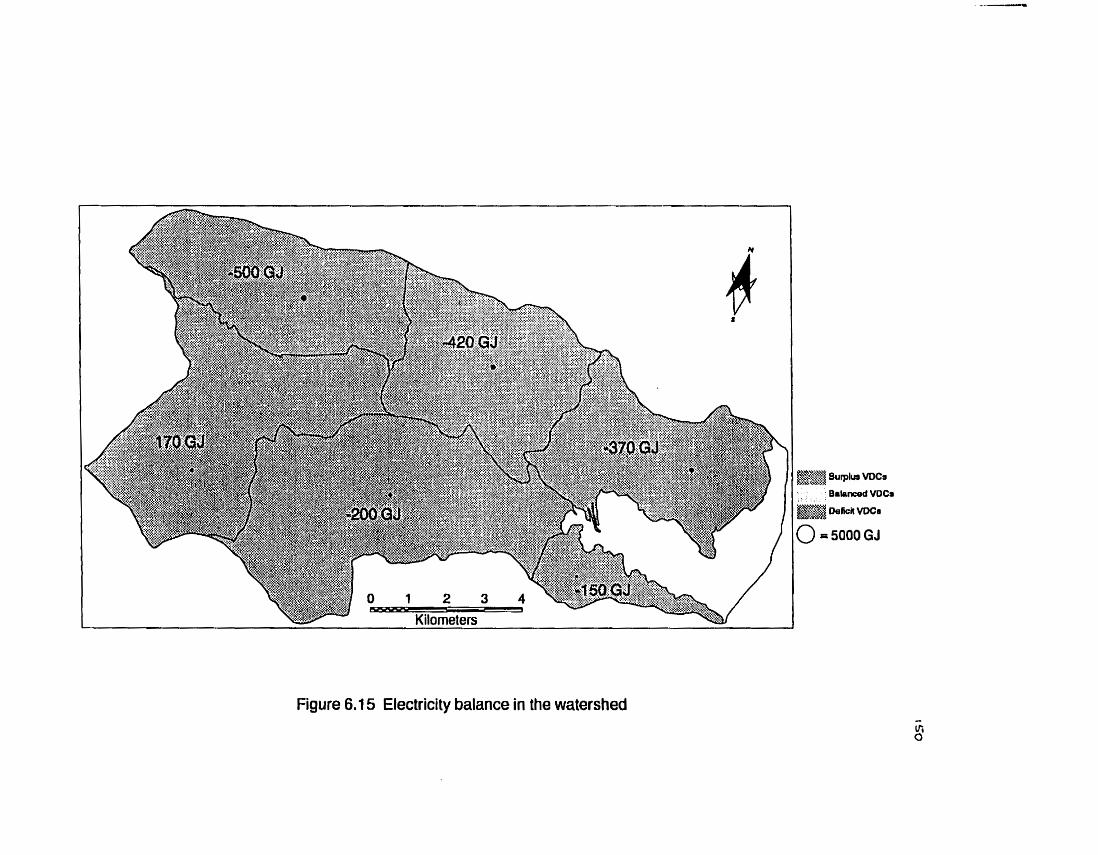
Figure 6.1 5 Electricity balance in the watershed

Chapter 7
MULTIOB JECTIVE ANALYSIS
AND RESULTS
In this chapter, the resource and consumption data obtained from the spatial model
are used to search for an energy solution for the study area. As mentioned in
section 4.2.1, coefficients of energy variables are required to formulate objective
functions and constraints. Such coefficients may represent energy cost, end-use
device efficiencies, employment coefficients, and pollution coefficients. The
efficiencies of end-use devices to be used in this research are given in Table 6.13.
The cost and employment coefficients are discussed in sections 7.1.1 and 7.1.2.
Three planning objectives and two case studies are examined in the
multiobjective model. In the first case study, all of the resources and consumption
Chapter 7 153
levels are aggregated for the whole watershed and an energy solution is examined.
This approach is used extensively by single objective optimization and goal
programming methods in energy analysis. In the second case, both the energy
resources and the average energy consumption have been disaggregated to the
VDC-level, that is, tu the srnaIlest area chosen for the planning. This case has been
examined to illustrate that it is better to choose a level of disaggregation for energy
analysis as it provides an opportunity for identification of energy surplus and
energy deficit areas in the planning region. This information is critical for the
formulation of relevant local energy policy. As a test case Pokharel and
Chandrashekar (1996b) have used such a disaggregation to formulate an energy
policy for one particular VDC in the watershed.
For both case studies, in addition to individual optimization of objectives,
two iterations of the STEP-method are performed. The energy balance for the
watershed has been tabulated for one of the solutions.
7.1
When
Energy Coefficients
the objective functions for energy planning are to be formulated, energy
coeffiaents such as costs, employment, and efficiency are required. As mentioned
in Figure 2.1, the derivation of these coefficients are extemal to the propoçed DSS.
Therefore, only a bnef discussion on these coefficients is given below.

Chap ter 7
7.1.1 Immediate/Economic/Financial costs
As outlined in section 4.2.1, three types of costs are generaily considered in policy
formulation. The approach used to calculate these costs for small scale energy
projects in developing countries is given in UN (1989).
The immediate costs refer to the costs to be allocated imrnediateiy by the
government for the irnplementation of an energy program. When energy programs
are to be promoted, funds should be allocated for implementation immediately
either by the national govemment or by the regional or local govemment.
Therefore, the irnrnediate (or implementation) cost rvould be of much relevance for
program initiatives.
The econornic costs refer to the costs of the project to the government over
the life time of the project. The financial costs refer to the cost of the project for a
project developer, or the cost of the product in the proposed scheme to the user.
Economic costs are generally obtahed by using the shadow prices on the financial
costs (NPC 2995).
Some energy alternatives could be attractive to the nation (that is lower
economic costs), but may not be financially viable. In such cases, the government
needs to promote the programs by creating public awareness, developing
infrastructure, and delegating authority. Even if the chosen alternative is
finanaally attractive, an effective public awareness campaign may still be required
for the better use of resources.
Chapter 7 155
Owing to the different service periods of different types of energy
alternatives, the calculation of the economic cos& and the financial costs may pose
problems in the analysis. In such cases, the service period of an energy alternative
with a maximum operating life time (or with a maximum investment) should be
taken as the standard service period and the econornic and financial cos& should
be calculated for al1 the energy alternatives (Pokharel and Chandrashekar 1995).
This will help in comparing the economic and financial costs of various energy
al tematives.
The cost estirnates used in this research are shown in Table 7.1. An
explanation of how these cost coefficients were obtained for use in this research is
given in Appendix B. The economic and financial cos& shown in the table are
extracted from NPC (1995). It should be noted that the cost estirnates are site
specific.
Table 7.1 shows that the cost coefficients associated with energy variables
representing solar energy are very high compared to other energy sources.
Moreover, the planning and implementation of a PV system requires more than two
years. Therefore, solar energy is not considered in MOP analysis.
Chay ter 7
Table 7.1 Various energy cos& in US$/GJ
Fuel/device
Fuelwood
Efficient fuelwood stove
Traditional fuelwood stove
Immedia te cost
8.30
Crop residues
- - -
0.20
0.00
Animal dung
Micro hydro 1 1.62 1 34.20 1 17.70
Economic cost
2.10
0.00 2.36
Biogas
-
Financial cost
0.30 - -
0.06
= 0.00
0.34
0.00
26.70 ( 0.60 1 0.64
- - - - - -
0.06
= 0.00
2.56
= 0.00
I
Kerosene
0.36
Electric bulb
Kerosene Lamp (wick)
7.1.2 Employment coefficients
Al1 new energy programs or ongoing energy programs provide employment
opporhinities. In this thesis, only direct rural employment that would be generated
because of new energy programs is considered with an objective to show the
linkage between employment generation and energy programs. The reduction in
employment due to a shift away from an energy source as a result of the
implemented energy program is not considered here. It is assumed that any
savings in labour can be used for useful household purposes and social and other
0.96
Kerosene Stove
= 0.00
I
= 0.00
= 0.00
6.06
= 0.00 1 0.44
5.10
0.07
0.36
= 0.00
C h q k r 7
ecoiioniic activi ties.
The estimates of employment coefficients used in tlus thesis are given in
Table 7.2. A brief discussion on Iiow the employrnent coefficients are es tirna ted for
use in tliis researcli is given in Appendk C. It must be noted that like cost
coefficients, eniployxnent coefficients are also site specific.
Table 7.2 Employnien t coefficients in person-yrs / G J
E n e r , ~ option
Fuelcvood
Inunediate employment
Micrv Hydro
Solar
Efficient Fuel wood stove
7.2 Energy Policy Analysis
Long term employment
0.007
l Kerosene 1 O -003
Tlie energy variables used in tliis thesis represent t l~e energy flow patli sliowii in
Figure 1.2. The eiiergy variable, x, discussed in Cliapter 4 lias i, j, k, and p indices,
wliere i refers to tlie type of fuel (eiiergy resource), j refers to tlie type of end-use
device (tlie utilization phase), k refers to the end-use, and p refers to a particular
area. The possible eiiergy variables h a t caii be used in the aiialysis caii be ob taiiied
0.0007
0.029
0.009
0.003
0.003
0.02
0.006
0.001 5

Clznptrr 7 15%
by exankuiig the eliergy flow path. However, if a particular flow patli is not to be
coiisidered in the anaiysis, theii the definition of energy variable for that particular
eiiergy flow sliould be blocked in the MOP model. For example, the eiiergy
variables representing briquettes-stoves-end-uses have no t been considered in tlie
present niodel. Tlus way, the effect of desired input parameters caii be studied for
policy analysis.
On the other hand, if the iiistailatioii of additional eiiergy tecluiology is to be
coiisidered in the model, then a fiftli index sliould be added in tlie definition of
energy variable. Tlierefore, an index, N, is assigned to the energy variable to
represen t addi tioiial installations of an existiiig energy tecluiology. For exaniple,
in tlie case study in tlus tliesis, the energy variable for installation of additional
biogas (i=7) plants for cooking (j=6 for biogns stove, k=I) in disaggregated area p
(p=1,2 ,.., 6) is writteii as x,,,,.
Energy Planning Obiectivu
The application of the proposed mode1 in energy planning is illustrated by
considering h e e pressing conflictiiig objectives ((7=3) as discussed below. The firs t
two objectives considered here are geiierally used separately in single objective
energy analysis. The tliird objective adds an important dimension to rural energy
p laiuiing.

Chapter 7 159
First Objective: Minimizing the costs of any program to reallocate energy
sources.
In order to promote the better use of resources, the govemment could initiate forest
management or interfuel substitution programs and meet the energy deficit either
by developing new energy sources or by importing energy. This requires that the
national or local government should allocate funds for such energy prograrns
immediately. For better economic efficiency, it would be better for the government
if the energy programs could be implernented at a lower cost. Therefore, it is
assumed that the main focus of the govemment is to minimize the immediate costs
for delivery of energy senrices.
Second Objective: Minimizing the energy use from the current level.
Energy planners are concemed with the inefficient use of resources. Therefore,
their objective is mainly to reduce the total energy input into a mral energy system
so that interfuel and intermode substitutions can be promoted. Therefore, the
second objective has been formulated as the minimization of the total energy
requirements in the watershed.
Third Objective: Maximizing the local employment that could be generated by
an energy program.
Another aspect of the planning objective is to show that local employment would
Chapter 7 1 60
be generated and subsequently îhat the local people could benefit from the
proposed energy program. This illustration is expected to help in creating a
positive perception of rival energy programs. Therefore, the objective to maxirnize
local employrnent is considered here.
Caçe Studies
In order to illustrate the use of MOP analysis in the decision support system, two
case studies have been anaiysed in this thesis. In the first case study, the watershed
is treated as one region and in the second case, the watershed is divided into six sub
regions. In each case, the objectives and constraints are first fonnulated. Then each
objective is optimized individually to generate the ideal solution.
In actual decision making environment, the decision makers analyse each of
these solutions and decide on further action. They may negotiate to choose one of
the ideal solution as the best compromise solution or instmct the analyst for further
analysis with the SEP-method. To illustrate the decision-making process in this
dissertation, however, the author has acted both as the deasion maker and the
anal ys t-
7.3 Caçe 1: Watershed as One Region
In this case, it is assumed that there would be a free flow of energy resources from
one part of the watershed to another. That way, any deficit in a fuel in one area is
Chapter 7 161
met by a supply of the sarne fuel from another area, by energy conservation (such
as by using EFSs), and by interfuel substitution (such as using a biogas system for
cooking instead of using a fuelwood system), however, there could be some
exceptions to this assump tion.
The watershed enjoys a net fuelwood surplus. However, because of an access
and affordabiliv to kerosene and difficulty in transportation of fuelwood, some of
the households may prefer to use kerosene for cooking, if available. Also, electricity
generated by smaU hydropower unib rnay not possible to distribute al1 around the
watershed because of the small hydroelectric potential. Therefore, localized
elechicity consumption around the generation sites might have to be considered.
In the Phewatal watershed, the t!!ree potential hydropower sites are located
in Bhadaure Tarnagi VDC ( p = I ) , Chapakot VDC (p=2) and Dhikur Pokhari VDC
(p=3). Therefore, al1 the electricity generated in these sites can only be distributed
in the surrounding areas. In addition to small hydropower potential, households
in Dhikur Pokhari and Chapakot also have an access to grid electricity. In the
remainùig VDG, Kaskikot (p=4) , Purndi Bhumdi @=SI, and Sarangkot (p=6) , only
grid electicity is available.
All households in Chapakot VDC are connected to the grid extension.
Therefore, electricity generated in Handi khola, would have no household use in
Chapakot VDC. However, the elechicity generated at this site can be distributed
in Bhadaure Tamagi VDC, which is very close to the potential hydropower site in
Chapakot.
Chnp ter 7 1 62
The formulation of the three objectives and constraints are given in
Appendices D. 1.1 and D.1.2. The results obtained by analysing these objectives
and constraints are discusçed here.
7.3.1 Results for Case 1
a) Individual optimization
The results obtained from the individual optimization of the formulated problem
are given in the payoff matrix shown in Table 7.3. Each individually optimized
solution falls in the non-inferior set as shown in Figure 3.1. Therefore, individually
these solutions constitute the compromise solution. The pay-off ma& shows that
if the minimizing cost criterion is chosen by the decision makers, then h e
govermnent has to allocate about US $1.22 million for the program. However, if the
rninimizing energy requirement criterion is chosen then almost 166 TJ' of primary
energy would be required to fulfil al1 of the energy demand compared with the
current energy consurnption of 182 TJ.
The minimization of energy input also mùiimizes the cost and appears to be
an attractive solution. The examination of resource allocation shows that while
minimizing the costs, more crop residues are allocated to reduce the cost of the
program. As we may recall, there are no immediate cost coefficients associated
with the variables representing crop residues.
TJ = 103 GJ
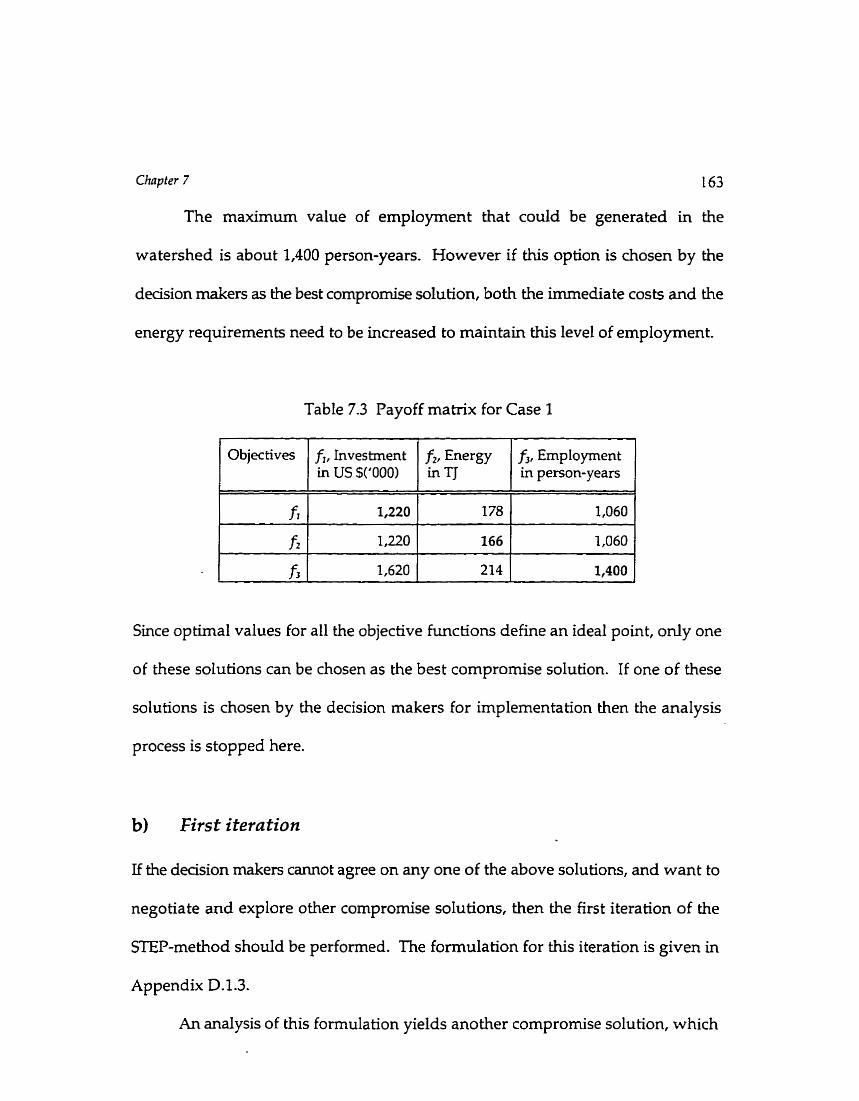
Chapter 7
The maximum value of employment that could be generated in the
watershed is about 1,400 person-years. However if this option is chosen by the
deasion makers as the best compromise solution, both the immediate costs and the
energy requirements need to be increased to maintain this level of employment.
Table 7.3 Payoff matrix for Case 1
Since optimal values for al1 the objective functions define an ideal point, only one
of these solutions can be chosen as the best compromise solution. If one of these
solutions is chosen by the decision makers for irnplementation then the analysis
process is stopped here.
b) Firs t iteration
If the decision maken cannot agree on any one of the
negotiate and explore other compromise solutions,
above solutions, and want to
then the first iteration of the
STEP-method should be performed. The formulation for this iteration is given in
Appendix D.1.3.
An analysis of this formulation yields another compromise solution, which
Cltapfer 7 164
shows that the next alternative wouid be to invest about US $1.36 million and to
accept an employment level of about 1,180 person-years. However, with this
solution the energy requirements would inaease to 187 TJ. This energy
requirement is greater than the present energy consumption level, however, if the
resources are to be managed and employment is to be created, then higher
consumption might be justified. If this compromise solution is accepted as the best
compromised solution, then the following policy options are to be adopted:
a. Manage forest areas and extract only about 164,000 GJ or 9,800 mt of
dry fuelwood for energy purposes. This would allow the protection
of other forest areas. Forest protection is very important especially in
the areas close to the settlements. By protecting degraded forest,
regeneration would be faster and forest density would be increased.
* Promote the use of crop residues for feed preparation, heating, and
food processing.
* Exploit all of the hydro resources available. It is to be noted that the
electricity generated in Chapakot is to be distributed in Bhadaure
Tamagi.
r~ Allocate the stipulated quantity of kerosene for
Tamagi and Dhikur Pokhari. Any surplus
lighting in Bhadaure
kerosene çhould be
promoted for cooking in fuelwood deficit VDCs.
* Promote the installation and use of al1 600 EFS in the watershed area.
This could be distributed in the fuelwood deficit northern part of the

Chapter 7
watershed.
* Do not promote m e r installation of biogas as it could be very costly
for the govemment in the short term. Since, the cooking and food
processing dernand is met by reallocation of fuelwood throughout the
watershed, the installation of biogas plants may not be necessary.
e Reduce the curent load shedding to the extent possible in order to
reduce kerosene consump tion for lighting.
These policy options are irnplementable, if there is a desire on the part of the
govemment and the local retipients. These options emphasize the use of fuelwood
and crop residues.
The decision makers representing cost objective and energy objective may
feel that the immediate costs and energy requirements are still higher. These lugher
values are required to maintain a higher employrnent level. Therefore, reduction
in the cost and energy requirements could be obtained by decreasing the
employment level.
Let it be assurned that the decision makers negotiate to reduce the
employment level to 1,100 person-years (from 1,180 person-years) so that a
reduction in both immediate costs and energy requirements can be obtained. This
requires the reformulation of the problem for the second iteration.
Chapter 7
C) Second iteration
In the second iteration, no weight is associated with the third objective because a
level of employment has been set The reformulation of the MOP problern for this
iteration is given in Appendix D.1.4.
The analysis of this reformulated
solution with a reduced implementation
problem yields another compromise
cost of about US $ 1.26 million and
reduced energy requirements of about 169 TJ. These values are slightly higher than
their optimal values shown in Table 7.3. However, in actual decision-making
environment, the deasion makers may
costs and energy requirements and
compromise solution.
ignore such a small increment in imrnediate
decide to choose this solution as the best
The energy allocation by fuel types for this compromise solution is given in
Table 7.4, which shows that fuelwood and uop residues need to be promoted in the
watershed. These two resources are suffiaent îo meet energy demands for cooking
and food processing and the installation of biogas plants would not be necessary.
This is also in-line with the perception of biogas companies in Pokhara; that there
is no demand for biogas plants because of an abundant fuelwood supply.
Chapter 7
Table 7.4 Resource allocation with second iteration
1 Biogas (new) 1 Local electricity
Kerosene 1,000
260
Grid electricity
Total 169,080
2,790
In this case study, five compromise solutions were examined. If the decision
makers choose one of these solutions, the detailed resouce allocation could be
examuied and the policy options could be drawn up. The deâsion makers may also
want to seek the energy allocation and consequent policy options before deciding
upon any one solution. If the decision makers do not agree on the choice of any of
the presented solutions, then one more iteration can be performed or as explained
in section 4.3, sensitivity analysis can also be performed on one of the objective
7.4 Case 2: Watershed as Sub-regions
In Case 1, it was assumed that there would be a free flow of local resources in the
watershed. However, if the forests are handed over to the community for

CIrapter 7 168
management and use, at some point, allowing the free flow of fuelwood from one
part of the watershed to anonother would be difficult. Also, with increasing
decentralization, VDCs may not be willing to share their resources for free.
Therefore, a local self sustaining energy program should be designed, where
possible. For such an analysis, it is necessary to understand the energy balance
situation in each VM- and analyse the policy options for each of them. This aspect
of policy analysis is considered in this section. The formulation of the objective
functions and constraints for this case are given in Appendices D.2.1 and D.2.2.
In cornparison to Case 1, the objectives and constraints are restricted in this
case. When the problem was analysed with the level of resources which gave a
compromise solution in Case 1, an infeasible solution was produced for Case 2. A
close look at the GAMSB output indicated that the cooking energy demand
constraints for the northem VDCs had been violated. In such a situation, either the
decision makers have to end the iteration by saying that there is no feasible solution
or they have to explore energy solutions with an increased amount of one or more
resources. The second option was tested with various ievels of kerosene imports
as it is the only resource which could be increased for a feasible solution. A value
of 10,160 GJ of kerosene imports produced the closest feasible solution and,
therefore, this value is taken as the upper M t for kerosene supply in the
watershed.
The key point here is that if the decision makers choose to plan at the
disaggregated level and if there is no flow of energy resources from one VDC to the
next, then this is the ody option they can examine under the given decision making
environment This example further demonstrates the advantage of a detailed and
small-region approach in energy analysis - an aggregate model, which considers
just one region for the whole watershed, would easily have missed this situation.
7.4.1 Results for Case 2
As in Case 1, the results are obtained first by optimizing the objectives individually
and then by using the STEP-method.
a) Individual optimization
The payoff matrix obtained by optimizing each of the objectives separately is shown
in Table 7.5, and shows that the minimum cost of the energy program with the
restricted formulations is Iess than one million US dollars. The minimum energy
requirement is about 134 TJ and the maximum employment that could be generated
by the program is about 1,420 person-years.
Table 7.5 Fayoff Matrix for Case 2.
Objectives f,, hvesûnent f i, Energy fi, Employment in 1 / in US 1 ('0001 / in TJ / persan-years
Chapter 7 170
This solution is an improvement over the solution obtained in Table 7.2 mainly
because of the increased upper limit on kerosene imports. The allocation of more
kerosene to avoid a violation of the cooking energy constraints in the northem
VDCs has produced a resdt which is less expensive than the result obtained in the
first case study. This allocation caused energy requirements to decrease and the
employment level to increase mainly because of the lower cost, higher efficiency,
and higher employment coefficients attached to the variables representirtg kerosene
use.
As in Case 1, a minimization of the energy input also minimizes the
imrnediate costs. This is because of the maximum allocation of crop residues while
optimizing the cost objective, as explained in Case 1.
If the decision makers agree to adopt one of the optimal solutions as their
best compromise solution. then analysis is stopped. Otherwise, further iterations
of the STEP-method should be performed.
b) First iteration
The formulation for the fi rst iteration on Case 2 is aven in Appendix D.2.3. The
analysis of the modified formulation yields another compromise solution for this
case. The solution shows that by increasing the investment to about US $ 1.24
million, the energy requirements for the various end-uses would increase to about
177 TJ, which is lower than the current level of energy consumption (182 TJ).
Cliapter 7 171
However with this solution, employment level is decreased to about 1,100 person-
years hom its optimal level of 1,420 peson-years.
The energy resources allocation for this compromise solution is given in
Table 7.6. In Chapakot, it is important to note that there is a wasteful extraction of
fuelwood. This would be necessary nonetheless to maintain the employment level
at 1,100 person-years.
Table 7.6 Resource allocation in GJ with first iteration (Case 2)
VDC 1 Fuelwood 1 Residue 1 Biogas 1 Electicity 1 Kerosene 1 Dhikur Pokhan
Kaskikot
Sarangko t
22,800
Bhadaure Tamagi
Pumdi Bhumdi 1 11,000 1 400 ( 2 1 196 1 O
13,800
15,800
Chapakot
The following points give a direction for policy options if this compromise solution
3,000
28,900
is chosen by the decision makers.
7,550
5,920
55,100
* Use al1 sustainable fuelwood yields in Dhikur Pokhari, Kaskikot,
44
O
Sarangkot, and Kaskikot. However, since there is a fuelwood surplus
44
313
O
in other VDCs, it provides an opportunity to protect the degraded
820
5
forests in those VDCs. The protection of such forests could allow
2,053
794
635
3
4,781
2,504
204 822
400 O
172
faster regeneration and consequently provide more fuelwood in the
future.
* Crop residues should be taken as the second alternative to fuelwood
and should be promoted in al1 VDCs except Chapakot and Bhadaure
Tamagi. These two VDCs are fuelwood surplus VDCs and, therefore,
the use of residues may not be an attractive option here.
Exploit al1 of the hydro resources available for electricity generation.
Allocate the stipulated quantity of kerosene for lighting only in
Bhadaure Tamagi and Dhikur Pokhari VDCs. The cooking energy
defiet in the three northem VDCs should be met partiy by kerosene.
Promote the installation and use of al1 600 efficient fuelwood stoves
in Dhikur Pokhari VDC.
Promote the utilization of al1 of the biogas potential in Sarangkot,
Dhikur Pokhari and Kaskikot. However, do not promote any new
biogas installation in other VDCs. There would be a potential to
install51 new biogas plants if this policy is adopted.
Load shedding should be reduced, as it drains money from the local
people to pay for lighting and drains valuable foreign reserves from
the nations coffers due to the increased import of kerosene for
ligh ting.
After studying these options, if the decision makers believe that they are feasible
to implement in the watershed, then it could be chosen as the best compromised

Chapfer 7
solution. Otherwise, second iteration should be performed.
c) Second iteration and Standard sensitivity analysis
The formulation for this iteration is given in Appendix D.2.4. In this iteration, the
analysis is performed by assuming that the decision makers choose to analyse the
MOP problem with different employment levels, that are lower than the value
obtained in the first iteration, so that irnprovement on other objectives can be
studied. This type of sensitivity analysis, as explained in section 4.3, is called the
standard sensitivity analysis. The result of sensitivity analysis with three
employment levels- 850,900, and 1000 persons- is given in Table 7.7, which shows
that by increasing the employment level, both cost and the energy requirements
would increase. That is, for every unit of increase in employment the irnmediate
cost is increased by about a thousand dollars. Similarly, to achieve a unit increase
in employment, the allocation of energy use should be increased by about 180 GJ.
This type of analysis helps the decision makers in understanding the tradeoffs
among objective functions. Such an opportunity can lead to further negotiation and
selection of a better solution.
Chapter 7
Table 7.7 Simulation study in second iteration
fi (US $ in thousands)
For the purpose of illustration, Scenario 2 is assumed to be chosen by the decision
makers. The resource allocation with this option is given in Table 7.8. The solution
indicates that with this option, the use of crop residues should be promoted in al1
VDCs and 51 new biogas plants should be promoted in fuelwood deficit VDCs.
If this option is to be adopted then about one million dollars would be necessary
and the energy requirement would be about 162 TJ, which is lower than the current
level of energy consumption (182 GJ).
fi (Employment in persow)
Table 7.8 Resource allocation in GJ with second iteration (Case 2)
950
850
1,000
VDC
1,120
900
Dhikur Pokhari
Kaskikot
1000
Fuelwood
Sarangko t
22,800
13,800
Bhadaure Tamagi
Pumdi Bhumdi 1 11.000 1 400 1 2 1 196 1 O
Residue
15,800
Chapakot
6,700
8,740
1
25,700
5,920
29,200
Kerosene Biogas
44
44
3,170
Elec~city
313
5 204 1 822
4,950
820
794
2,053
4,781
635
3
2,504
400 O
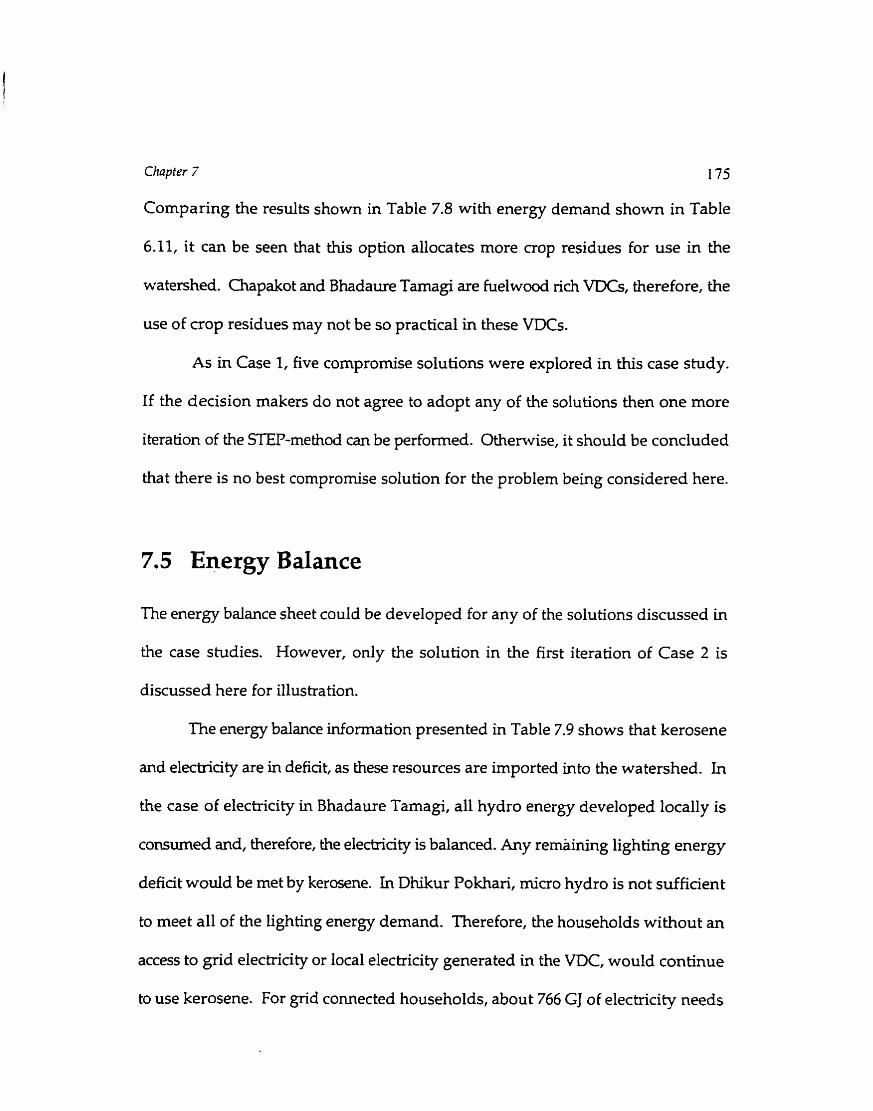
Chapter 7 175
Comparing the results shown in Table 7.8 with energy demand shown in Table
6.11, it cm be seen that this option allocates more crop residues for use in the
watershed. Chapakot and Bhadaure Tamagi are fuelwood rich VDCç, therefore, the
use of crop residues may not be so practical in these WCs.
As in Case 1, five compromise solutions were explored in this case study.
If the decision makers do not agree to adopt any of the solutions then one more
iteration of the SEP-method cm be perfomed. Othenvise, it should be concluded
that there is no best compromise solution for the problem being considered here.
7.5 Energy Balance
The energy balance sheet could be developed for any of the solutions discussed in
the case studies. However, only the solution in the first iteration of Case 2 is
discussed here for illustration.
The energy balance information presented in Table 7.9 shows that kerosene
and electricity are in deficit, as these resources are imported into the watershed. In
the case of electricity in Bhadaure Tamagi, al1 hydro energy developed locally is
consumed and, therefore, the electricity is balanced. Any rernaining lighting energy
defiat would be met by kerosene. In Dhikur Pokhari, micro hydro is not sufficient
to meet al1 of the iighting energy demand. Therefore, the households without an
access to grid electricity or local electricity generated in the VDC, would continue
to use kerosene. For grid comected households, about 766 GJ of electricity needs
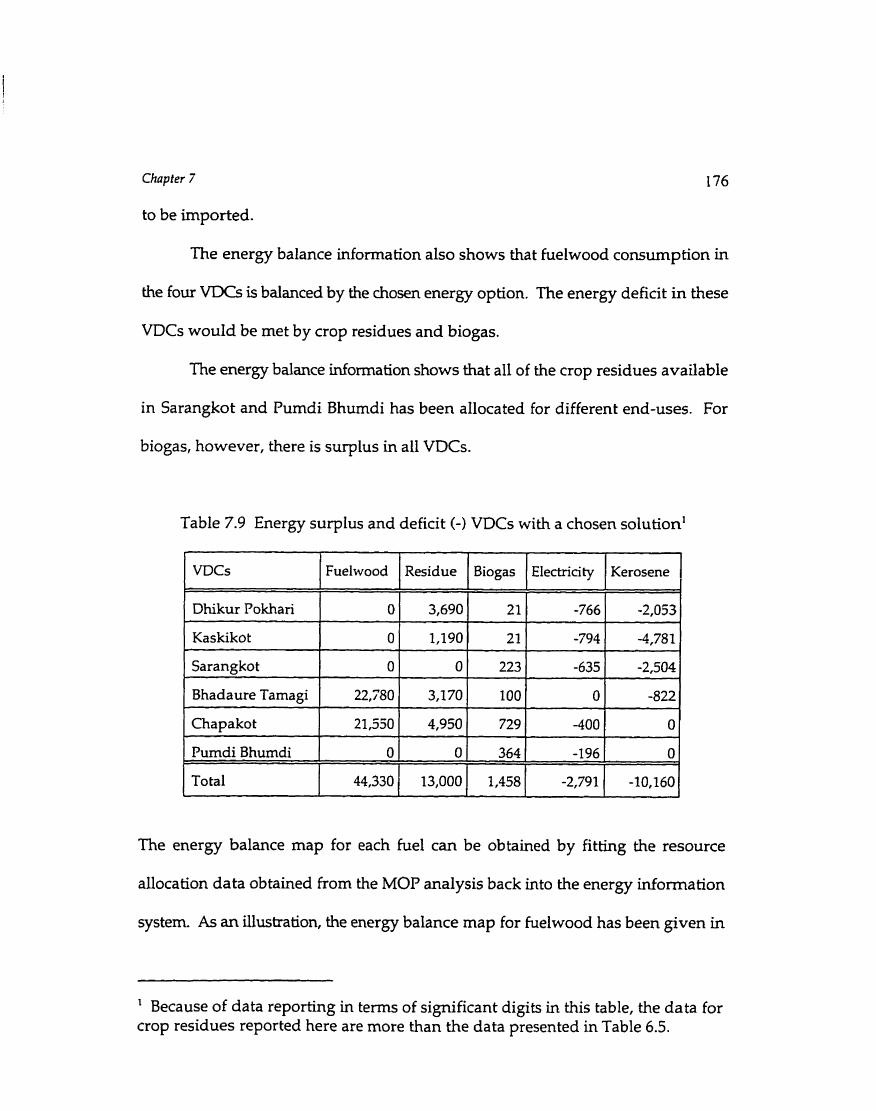
Chapter 7
to be irnported.
The energy balance information also shows that fuelwood consumption in
the four VDCs is balanced by the chosen energy option. The energy defi cit in these
VDCs would be met by crop residues and biogas.
The energy balance information shows that al1 of the crop residues available
in Sarangkot and Pumdi Bhumdi has been allocated for different end-uses. For
biogas, however, there is surplus in al1 VDCs.
Table 7.9 Energy surplus and deficit (-1 VDCs with a chosen solution'
VDCs
Dhikur Pokhan
Kaskiko t . - - - - - -
Sarangko t
Bhadaure Tamagi
Chapakot
Pumdi Bhumdi
To ta1
Fuelwood Residue Biogas ( Electricity 1 Kerosene I I
The energy balance map for each fuel can be obtained by fitting the resource
allocation data obtained from the MOP analysis back into the energy information
system. As an illustration, the energy balance map for fuelwood has been given in
Because of data reporting in tems of significant digits in this table, the data for crop residues reported here are more than the data presented in Table 6.5.
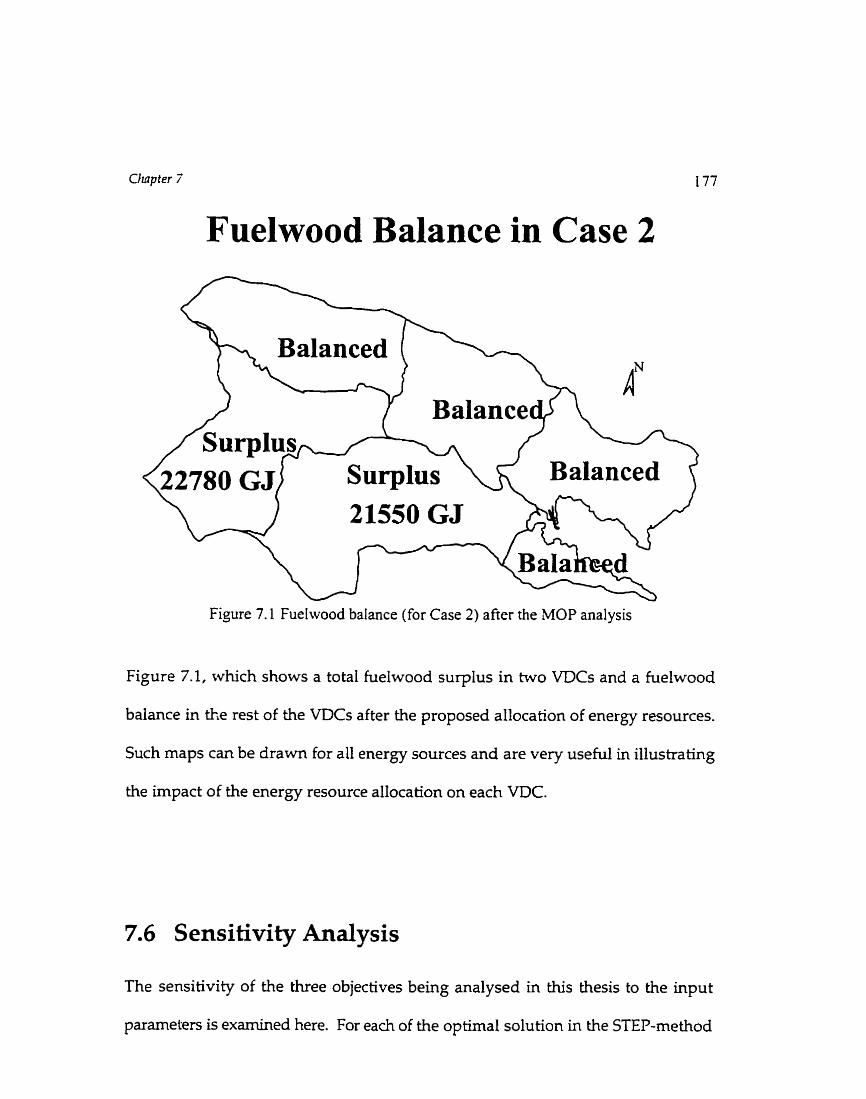
Fuelwood Balance in Case 2
Figure 7.1 Fuelwood balance (for Case 2) afier the MOP analysis
Figure 7.1, rvhich shows a total fuelwood surplus in two VDCs and a helwood
balance in the rest of the VDCs after the proposed allocation of energy resources.
Such maps c m be drawn for al1 energy sources and are very useful in illustrahg
the impact of the energy resource allocation on each VDC.
7.6 Sensitivity Analysis
The sensitivity of the three objectives being analysed in this thesis to the input
parameters is examined here. For each of the optimal solution in the STEP-rnethod
Chapter 7 178
iteration t=O, the resource allocation might be different. Therefore, the marginal
cos& would be different too. The marginal costs for each of the constrains given in
this section is obtained from GAMS output. The units of the marginal costs
depends upon the units used in the constraints. For example, demand conshaints
represent the final energy, whereas supply constraints represent the secondary
energy. The units of marginal costs can be calculated by using equation (4.10).
In the Tables below, (.) means no marginal cost (MC) and "EPS" means a
very small value for the marginal cost associated with the constraint. A positive
value for the marginal cost of a constraint means that if an additional unit of
"resource" (that is, right-hand side value) is available, then the objective fmction
will increase by the value of the marginal cost and the reverse is true for negative
values of marginal costs.
7.6.1 Sensitivity on Case 1
The sensitivity of input data, as explained in section 4.3, is discussed here. The
value of the resources allocated while optimizing each of the objectives and the
associated marginal costs for Case 1, as obtained frorn GAMS output, are given in
Table 7.10. The significance of vanous input parameters as to the change in the
ideal solution in this Case is explained in the following paragraphs.
The first conclusion to be made frorn the table is that there would be no
change in the optimum value of employment with a small change in any of the
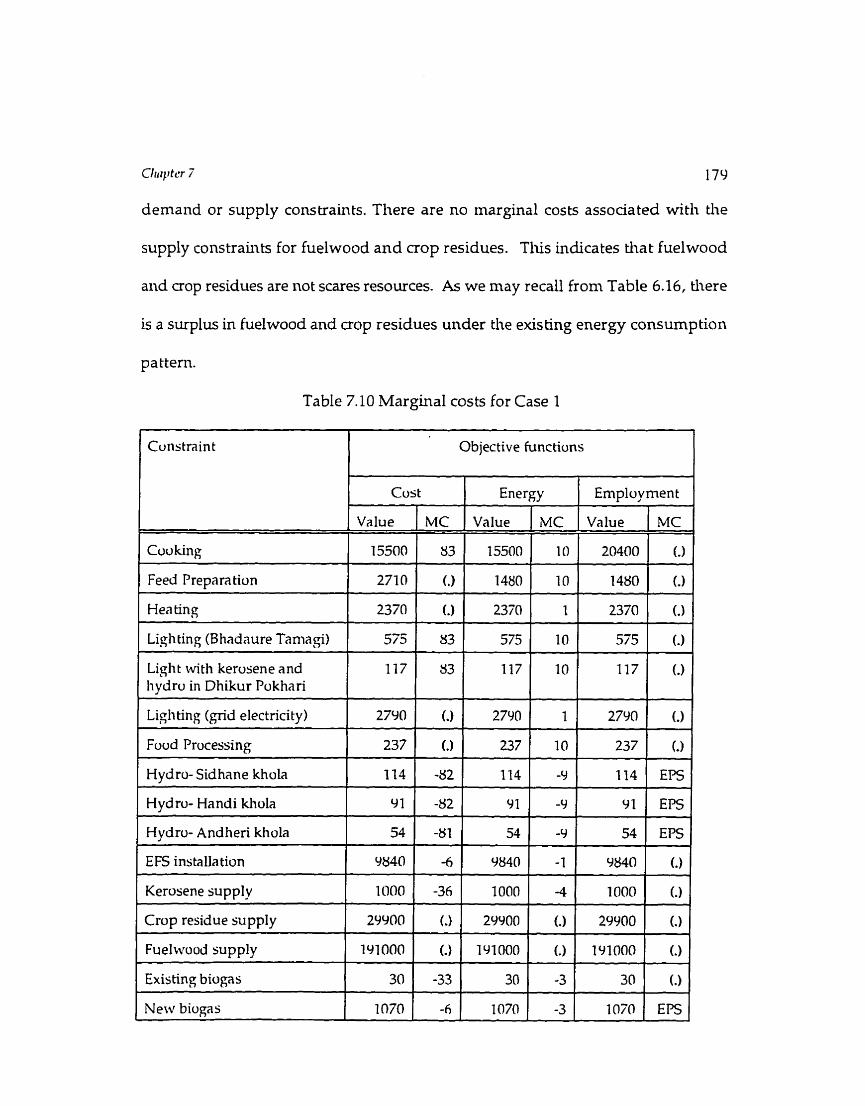
Chqi t ~ * r 7 179
demand or supply constraints. Tliere are no marginal costs associated witli the
supply constraints for fuelwood and crop residues. This indicates tiiat fuelwood
and crop residues are iiot scares resources. As we may recall froni Table 6.16, there
is a surplus in fuelwood and crop residues under the existing energy consumption
pattern.
Table 7.10 Marginal costs for Case 1
Objective functions
Cost
Cou king
Feed Prepara tion
Hea ting
Ligh ting (Bhadaure Tamagi)
Ligli t with kerusene and hydru in Dhikur Pokhari
Ligli ting (grid electrici ty)
Food Processing
Hydro- Sidhane khola
Hydru- Hanùi khola
Hydro- Andheri khola
EFS installation
Kerosene supply
Crop residue supply
Fuelwood supply
Existing biogas
New biogas
Energy Employ men t i
. Value
15500
2710
2371)
575
177
2790
237
114
Y 1
54
9840
1000
29900
191000
30
1070
MC
Y3
(-1
(-1
Y3
Y3
(.)
(-1
-82
-82
-81
-0
-36
1
. -33
-6
Value
15500
1480
2370
575
117
2790
237
114
Y I
54
Y840
1 O00
29900
19 IO00
30
I 070
MC
10
10
1
I O
10
1
10
-Y
-Y
-9
-1
-4
.
. -3
-3
Value
20400
1480
2370
575
117
2790
237
4
Y i
54
Y840
1000
29900
19 1000
30
1071,
MC
(-1
(-1
(-1
(-1
(-1
(-1
(-1
E E
El5
EPS
(.)
(.)
(.)
(.)
(-1
EPS
Chapfer 7 180
Table 7.10 shows that the marginal cost for cooking constraints are 83 for the first
objective and 10 for the second objective. This means that if the final energy
requirement were to increase by an additional unit, then the cost of the program
would increase by US $83 and an additional 10 GJ of secondary energy would need
to b'e supplied to meet this change. This also means that the additional energy for
cooking should be used in a traditional stove. In a traditional stove 10 GJ of
secondary energy would be required to generate 1 GJ of final energy.
If the dernand for grid electriaty increases by an additional unit, there would
be no impact on the irnplementation cost. Since electricity is used for lighting and
using appliances with a very high end-use efficiency, additional units of demand
should be met by supplying an additional unît of elecbicity. However, in Bhadaure
Tamagi and Dhikur Pokhari, this requirement increases to 9 GJ because of interfuel
substitution possibilitieç between electricity and kerosene.
If the efficiency of efficient fuelwood stoves could be increased, less
secondary energy would be required in the watershed. Therefore, if the EFSs to be
installed in the watershed can produce more final energy for use with an input of
one more unit of secondary energy, then the cost of the energy program would
decrease by US $6.4.
The marginal cost of kerosene shows that the an increase in the supply of
kerosene by one GJ would decrease the total implementation cost by about US $36
and decrease the energy requirement by 3.5 GJ. While comparîng this with the
hydropower potential, it can be stated that increasing the hydropower production
Chapter 7 181
might be a better option than increasing the kerosene supply. Hydropower can
replace the kerosene used for lighting in Bhadaure Tamagi and Dhikur Pokhari.
For biogas plants, the data indicate that it would be much better to use an
additional unit of biogas produced by existing plants than to supply biogas from
new plants. However, the reduction in the cost with existing biogas plant is much
Iarger compared with the new biogas plants. Therefore, if the energy demand
increases slightly in howholds with biogas plants and if the demand could be met
technically by existing biogas plants then this option would be better than the
installation of new biogas plants.
It can be concluded that, for the aggregated case, the objective functions
representing immediate costs and energy requirements are sensitive to the
estunation of the cooking energy demand, the hydropower potential, the kerosene
supply, and the m e n t use of existing biogas plants. The employment objective is
insensitive to small changes in the energy supply and demand.
7.6.2 Sensitivity on Case 2
The values of the resources allocated while optunizing. each of the objective
functions and the associated marginal costs for Case 2 are given in Tables 7.11
through 7.16. From al1 the data tables to follow in this sub section, it can be seen
that the objective h c t i o n representing employment is not sensitive to small
changes in the supply and demand.
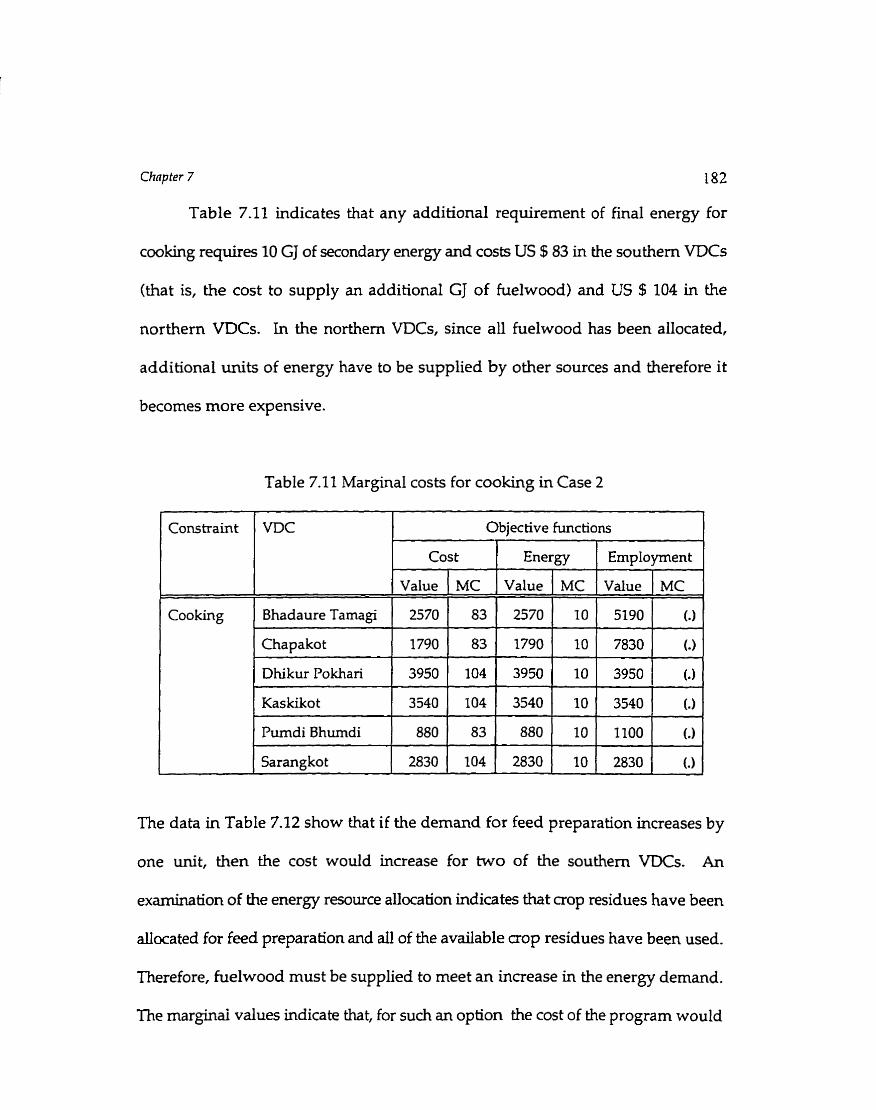
Chapter 7 182
Table 7.11 indicates that any additional requirement of final energy for
cooking requires 10 GJ of secondary energy and costs US $83 in the southem VDCs
(that is, the cost to supply an additional GJ of fuelwood) and US $ 104 in the
northern VDCs. In the northem VDCs, since al1 fuelwood has been ailocated,
additional units of energy have to be supplied by other sources and therefore it
becomes more expensive.
Table 7.11 Marginal costs for cooking in Case 2
The data in Table 7.12 show that if the demand for feed preparation increases by
Cooking
l
one unit, then the cost would increase for two of the southern VDCs. An
examination of the energy resource allocation indicates that aop residues have been
Bhadaure Tamagi
Chapakot
Dhi kur Po khan
Kas kiko t
Pumdi Bhumdi
Sarangko t
docated for feed preparation and all of the available crop residues have been used.
Therefore, fuelwood must be supplied to meet an increase in the energy demand.
The marginai values indicate that, for such an option the cost of the program would
Cos t
Value
2570
1790
3950
3340
880
2830
MC
83
83
104
104
83
104
Energy
Value
2570
1790
3950
3540
880
2830
Employment
MC
10
10
10
10
10
10
Value
5190
7830
MC
(-1
(= 1
3950 1 (.)
3540
1100
2830
( 0 1
(*)
1.1
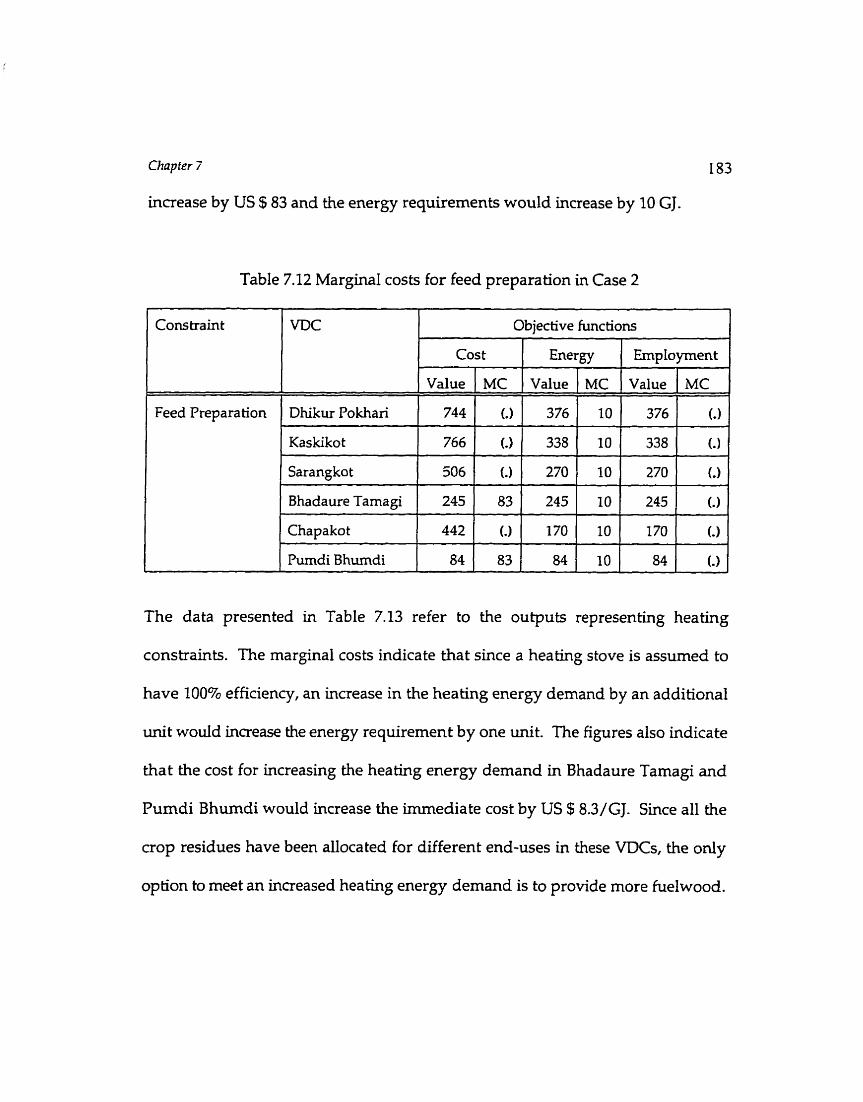
Chapter 7
increase by US $83 and the energy requirements would increase by 10 GJ.
Table 7.12 Marginal costs for feed preparation in Case 2
Feed Preparation
The data presented in Table 7.13 refer to the outputs representing heating
constraints. The marginal costs indicate that since a heating stove is assumed to
have 100% efficiency, an increase in the heating energy demand by an additional
unit would ina-ease the energy requirement by one unit. The figures also indicate
that the cost for increasing the heating energy demand in Bhadaure Tamagi and
Pumdi Bhumdi would increase the immediate cost by US $8.3/GJ. Since al1 the
crop residues have been allocated for different end-uses in these VDCs, the only
option to meet an increased heating energy demand is to provide more fuelwood.
1 mc
Dhikur Pokhari
Kaskikot
Sarangko t
Bhadaure Tamagi
Chapakot
Pumdi Bhumdi
Objective functiow
Cos t
Value
744
766
506
245
442
84
MC
6 )
.
. 83
(.)
83
Energy Ernp loyment
Value
376
338
270
245
170
84
Value
376
338
270
245
170
84
MC
10
10
10
IO
10
10
MC
(-1
( O 1
LI
LI
[ O 1
(-1
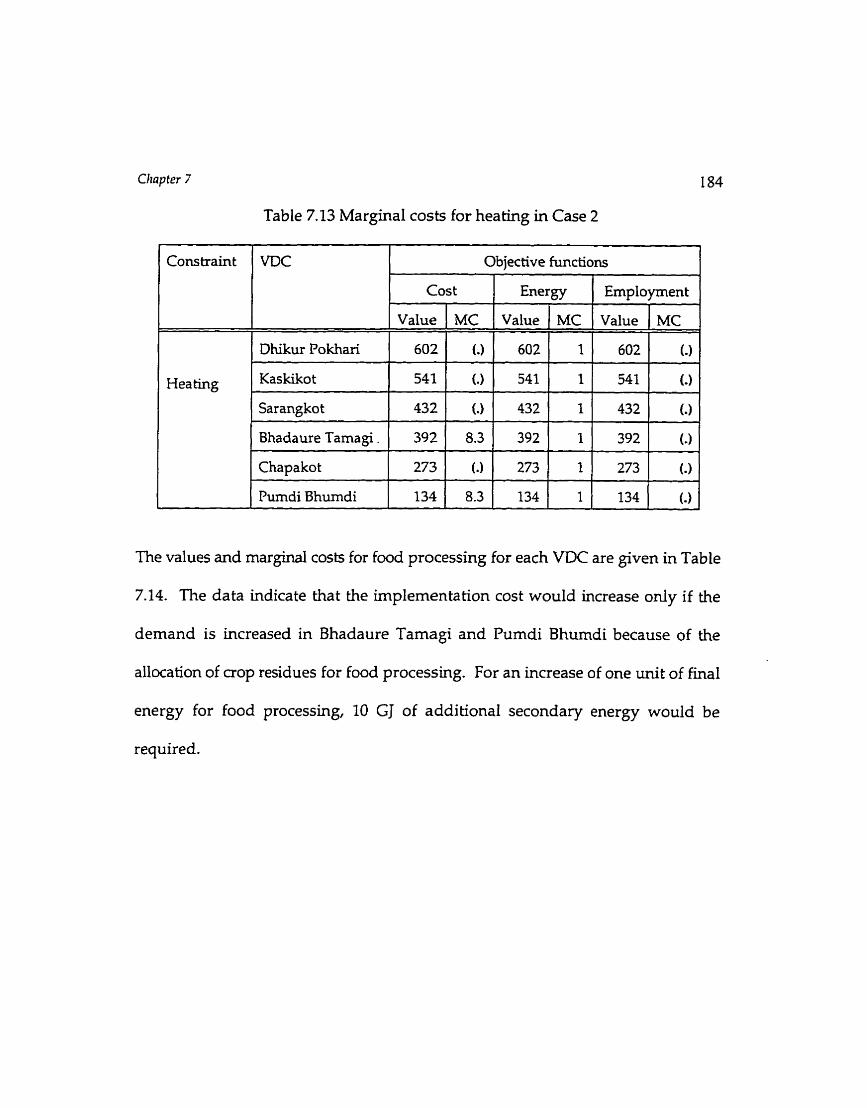
Table 7.13 Marginal cosh for heating in Case 2
The values and marginal costs for food processing for each VDC are given in Table
7.14. The data indicate that the implementation cost would increase only if the
dernand is increased in Bhadaure Tamagi and Pumdi Bhumdi because of the
allocation of aop residues for food processing. For an increase of one unit of final
energy for food processing, 10 GJ of additional secondary energy would be
required.
Cons traint
H~~~~
VDC
D hikur Po khari
Kaskikot
Sarangkot
Bhadaure Tamagi
Chapakot
Pumdi Bhumdi
Objective functions
Cos t
Value
602
541
432
392
273
134
MC
.
.
. 8.3
. 8.3
Energy
Value
602
541
432
392
273
134
Employrnent
MC
1
1
1
1
1
1
Value
602
541
432
392
273
134
MC
(-1
(-1
(J
( J
(-1
(-1

Table 7.14 Marginal costs for food processing in Case 2
The marginal costs and docated values for lighting are given in Table 7.15, which
indicates that where grid elechicity is available, the additional demand for lighting
(and using apptiances) could be met by the existing grid capacity without
increasing the imrnediate cost. This is tnie because no cost has been assigned for
variables representing grid electriaty. In Bhadaure Tamagi, demand for additional
Lighting energy has a very high cost because no grid electricity is available in that
VDC. The same is true, if the households without access to grid electricity in
Dhikur Pokhari VDC demand an additional unit of energy for lighting.
The marginal costs for grid electricity indicate that one unit of additional
energy should be supplied for every unit of increased lighting energy demand in
a VDC. In Bhadaure Tarnagi and Dhikur Pokhari VDCs, for an additional lighting
energy dernand, the requirement of secondary energy increases by 10 GJ because
of the interfuel substitution possibility between electricity and kerosene.
Cons traint
Food Processing
VDC
Dhikur Pokhari
Kas kiko t
Sarangkot
Bhadaure Tamagi
Chapako t
Purndi Bhumdi
Objective functions
Cost
Value
60
54
43
. 39
27
13
MC
(J
(-1
(-1
8.3
(-1
8.3
Energy
Value
60
54
43
39
27
13
Emplo yment
MC
1
1
1
I
1
1
Value
60
54
43
39
27
13
MC
LI
(-1
( -1
(el
( -1
L)

Clrapter 7
Table 7.15 Marginal costs for lighting in Case 2
Lighting
1 consbaint 1 WC I
Objective functions 1 1 ~ Cost
I
The values and marginal costs related to the resource constraints are given in Table
Value
7.16. The data indicate the scaraty of crop residues in Bhadaure Tamagi and Pumdi
Energy r
Bhumdi. However, in other VDCs, additional units of crop residues are available
Employment I
MC
for energy purposes. In the case of fuelwood, its relative scarcity in the northem
VDCç is indicated by a small marginal cost, indicating that cheaper options may be
Value
available to supply an additional unit of energy.
MC ( Value 1 MC ,
I 1
Table 7.16 shows that there would be a decrease in the immediate cost and
energy requirements with an increase in a small amount of energy supplied by
efficient fuelwood stoves. In the case of kerosene, supply of an additional unit
wodd reduce the immediate costs by US $ 4 5 and the energy requirements by 3.5
The mar@ costs for hydroelectricity shown in Table 7.16 indicates that an
increase in the hydropower capacity would decrease the kerosene required for
lighting. The decrease in the cost for a small increase in the hydropower capacity
is about US $100.

Chapter 7 L 87
In the case of biogas plants, as mentioned in the first case, every unit of
available biogas would decrease the total energy requirement by 3 GJ. However,
increasing the supply, if possible, from the existing biogas plants is mu& better
than installuig new biogas plants.
The data presented in Table 7.16 also show the relative scarcity of different
fuels in each VDC. In the table, the reduction in the total cost by supplying
kerosene for cooking in the northem VDCs iç shown by the decreased marginal
cost. The relative cost savings of new biogas plants shows that it might be much
better to start introducing biogas plants in the northem watershed, where fuelwood
scarcity is being felt and where the cost savings to the govemment to supply an
additional unit of energy would be greater.
The above mentioned parameters clearty show their significance in the
objective formulation and the development of the compromise solutions. These
values give guidelines as to the approximation of the energy demands and the
energy supply in the multiobjective model.
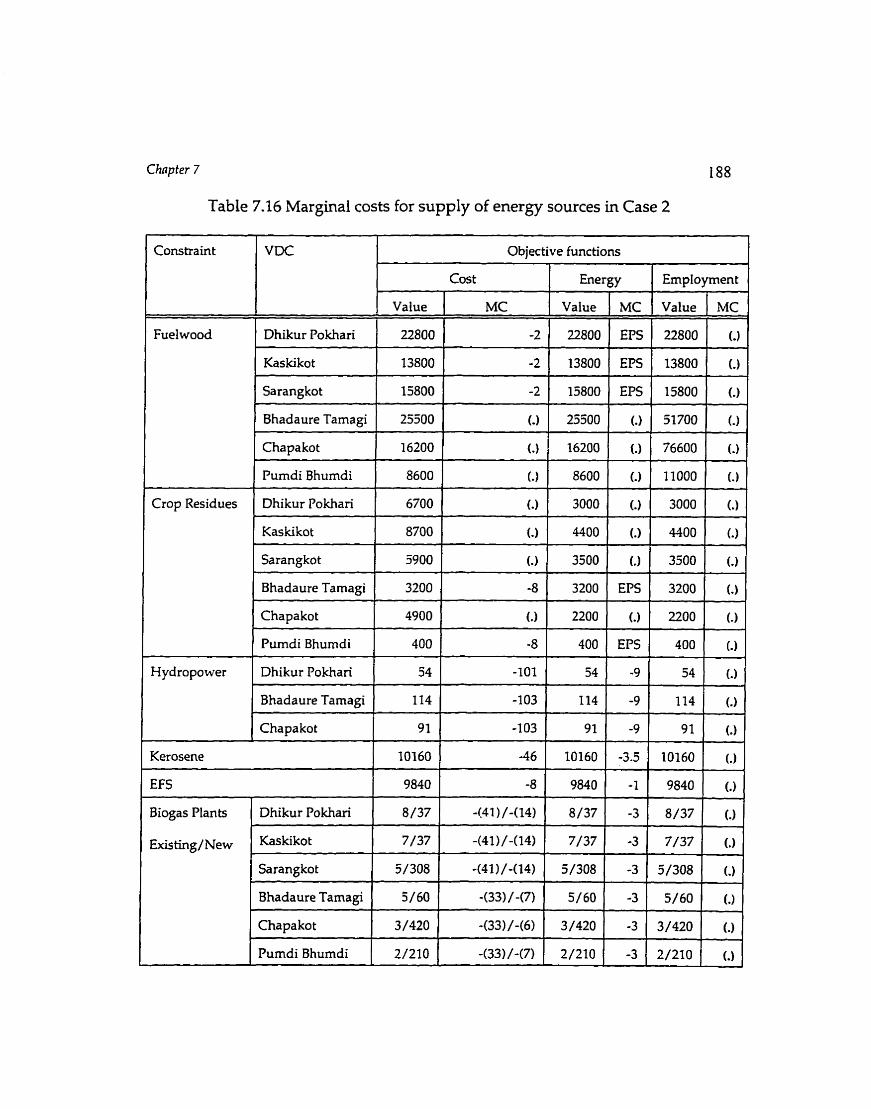
Chnp ter 7
Table 7.16 Marginal costs for supply of energy sources in Case 2
Constraint 1 VDC 1 Objective functions L
Cost l
I 1 Value I 1
Fuelwood
Energy I
MC
Crop Residues Dhikur Pokhari 6700 . 3000 ( ) 3000 (.)
Kaskikot 8700 (-1 4400 . MO0 (.)
Sarangkot 5900 ( 1 3500 . 3500 (.)
Bhadaure Tamagi 3200 -8 3200 EPS 3200 (.)
EmpIoyrnen t 1
Dhikur Pokhari
Kaskikot
Sarangkot
Bhadaure Tamagi
Hydropower
Value
Kerosene
EFS
Eis t i ng / N~~
22800
13800
15800
25500
Chapakot
Pumdi Bhumdi
Dhikur Pokhan
Bhadaure Tamagi
Chapakot
10160
9840
8/37 Biogas Plants
MC 1 Value I
Dhikur Pokhari
Kaskiko t
Sarangko t L I
Chapakot
Pumdi Bhumdi
MC
-2
-2
-2
( )
4900
400
54
114
91
-46
-8
- 1 4
-(33)/-(7) Bhadaure Tamagi 5/60
3/420
2/210
22800
23800
15800
25500
(-1
-8
-101
-103
-103
10160
9840
8/37 4
5/60
7/37
5/308
7/37
5/308
-(33)/-(6)
-(33)/-(7)
EPS
EPS
EPS
.
2200
400
54
114
91
-3.5
-1
-3
- 4 1 - 1
- 1 -
-3
-3
-3
3/420
2/210
22800
13800
15800
51700
. EPS
-9
-9
-9
10160
9840
8/37
5/60
(J
(.)
(.)
(-1
(.)
(.)
(.)
7/37
5/308
(.)
-3
-3
2200
400
54
114
91
(J
(.)
(.)
(.)
(-1
(.)
(-1
3/420
2/210
(.)
(.)
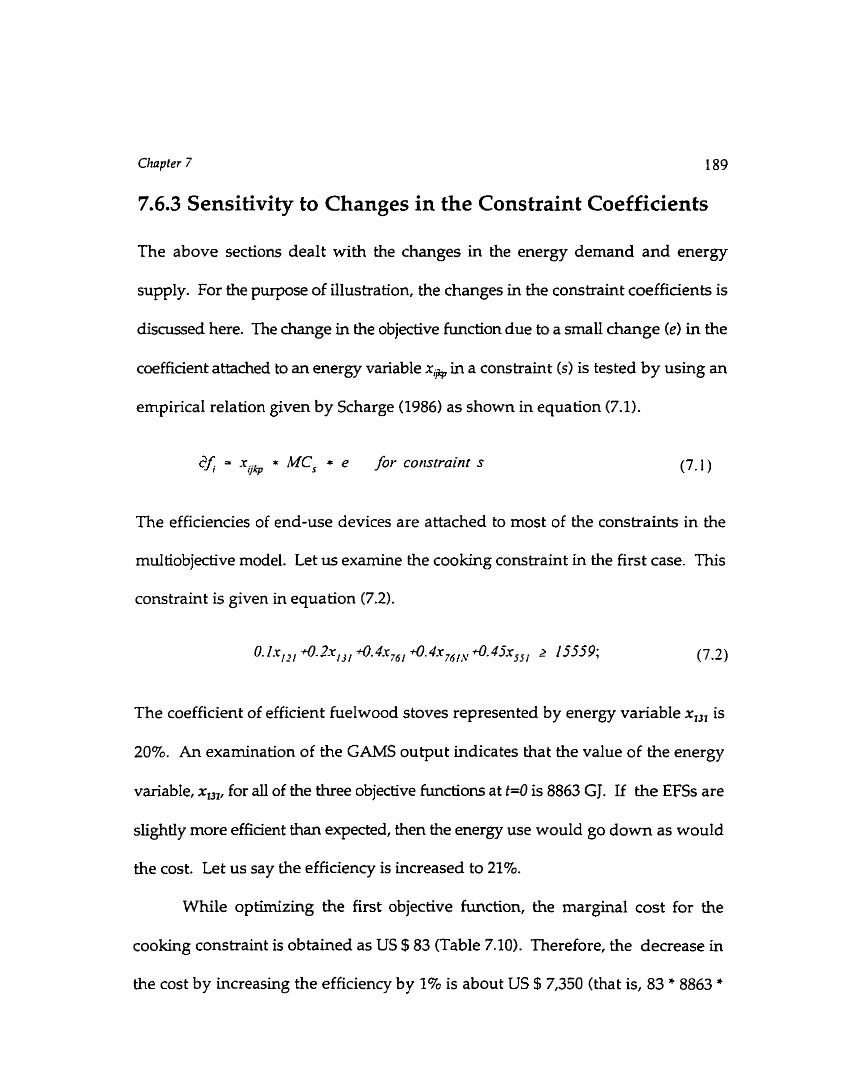
Chapter 7 189
7.6.3 Sensitivity to Changes in the Cons traint Coefficients
The above sections dealt with the changes in the energy demand and energy
supply. For the purpose of illustration, the changes in the constraint coefficients is
discussed here. The diange in the objective function due to a small change (el in the
cwffiaent attached to an energy variable xQ,, in a constraint (s) is tested by using an
ernpirical relation given by Scharge (1986) as shown in equation (7.1).
- -rqAF * MC, * e for constraint s
The efficiencies of end-use devices are attached to most of the constraints in the
multiobjective model. Let us examine the cooking constraint in the first case. This
constraint is given in equation (7.2).
The coefficient of efficient fuelwood stoves represented by energy variable x,,, is
20%. An examination of the GAMS output indicates that the value of the energy
variable, x,, for a l l of the three objective functions at t=O is 8863 GJ. If the EFSs are
slightly more efficient than expected, then the energy use would go down as would
the cost. Let us Say the efficiency is increased to 21%.
While optimizing the first objective function, the marginal cost for the
cooking constraint is obtained as US $83 (Table 7.10). Therefore, the decrease in
the cost by increasing the efficiency by 1% is about US $7,350 (that is, 83 * 8863 *
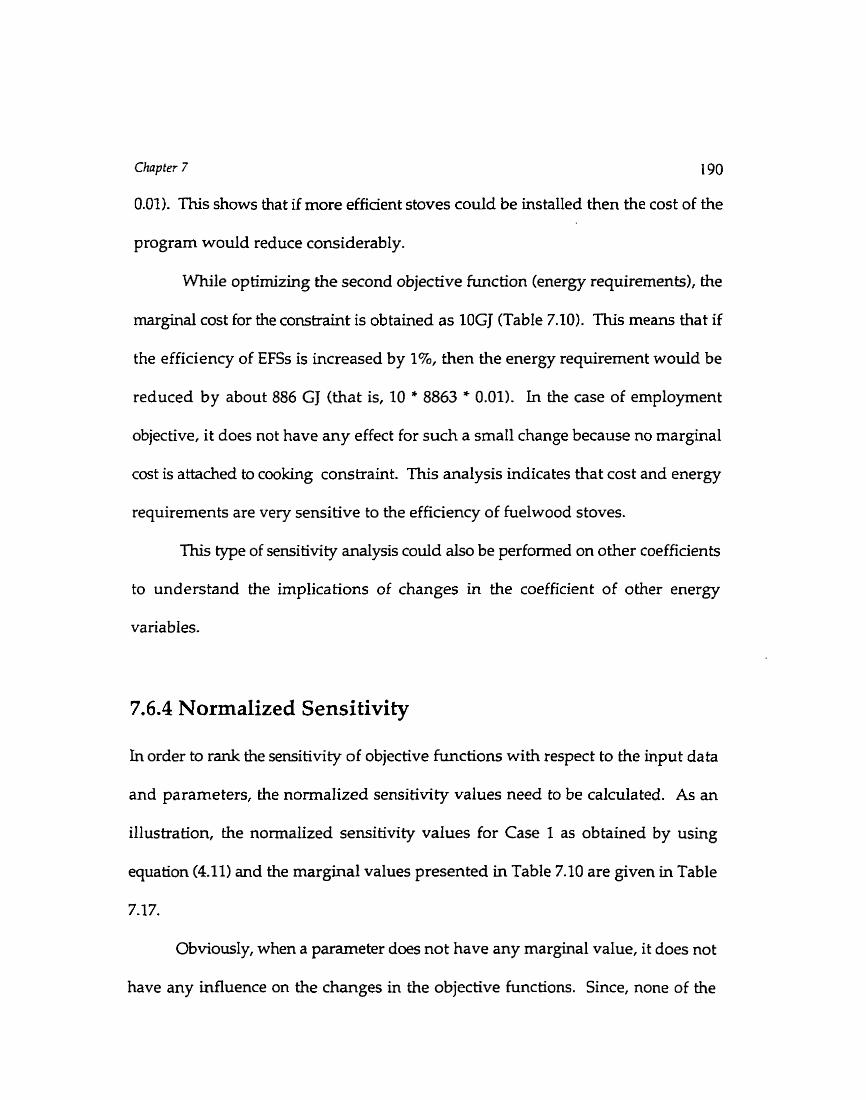
Chapter 7 I9O
0.01). This shows that if more efficient stoves could be installed then the cost of the
program would reduce considerably.
While optunizing the second objective function (energy requirements), the
marginal cost for the constraint is ob tained as lOGJ (Table 7.10). This means that if
the efficiency of EFSs is increased by 1%, then the energy requirement would be
reduced by about 886 GJ (that is, 10 ' 8863 * 0.01). In the case of employment
objective, it does not have any effect for such a small change because no marginal
cost is attached to cooking constraint. This analysis indicates that cost and energy
requirements are very sensitive to the efficiency of fuelwood stoves.
This type of sensitivity anaiysis could also be performed on other coefficients
to understand the implications of changes in the coefficient of other energy
variables.
7.6.4 Normalized Sensitivity
In order to rank the sensitivity of objective functions with respect to the input data
and parameters, the nomalized sensitivity values need to be calculateci. As an
illustration, the nonnalized sensitivity values for Case 1 as obtained by using
equation (4.11) and the marginal values presented in Table 7.10 are given in Table
7.17.
Obviously, when a parameter does not have any marginal value, it does not
have any influence on the changes in the objective functions. Since, none of the

Chnpfer 7 191
parameters produced any signihcant marginal value for the employrnent objective
(as shown in Table 7-10), there are no normalized sensitivity values for the
employrnent objective.
In the table above, values reported in Rank columns refer to the ranking of
parameters in te= their normalized sensitivity values. A positive normalized
value indicates the percentage increase in the value of an objective function due to
one percent increase in the input parameter. A negative normalized value indicates
the percentage decrease in the value of an objective function due to one percent
decrease in the input parameter.
The values indicate that cooking demand is a sensitive input parameter both
in terms of irnrnediate cost and in terms of energy requirements. If final energy
demand for cooking increases by one percent (that is, by 156 GJ), then the cost of the
prograrn would increase by US $13,000 (that is, 0.0106 * US $1.22 million) and the
energy requirement would increase by 1,560 GJ (that is 0.0094 ' 165,898) of
secondary energy. This information is also obtained directly by multiplying 1% of
cwking energy dernand with the marginal values for each of the objectives (shown
in Table 7.10). However, by ranking the normalized values of the parameters, the
significance of changes in the input parameter can be directly visualized.
Chapter 7
Table 7.17 Normalized sensitivity values for Case 1
Objective func tions
r
Cooking 1 1.060 1 1 1 0.940 1 1
Cost
Normalized sensi tivity values
Energy
l Feed Prepara tion
Hea ting
Rank Normalized sensi tivity values
Lighting (Bhadaure Tarnagi)
Light with kerosene and hydro in Dhikur Pokhari
Rank
O
O
Lighting (grid electricity)
Food Processing
0.040
0.008
Hydro- Sidhane khola
- -
O
O
Hydro- Handi khola
EFS installation
3
5
-0.008
Hydro- Andheri khola
0.070
0.014
- -
-0.006
2
6
0.030
0.007
5
-0.003
Kerosene supply
Table 7.17 shows that the percentage changes in the value of the objective function
with changes with other input data are not large. This leads to the conclusion that
the estimation of cooking energy demand codd be a single factor that cm influence
the choice of a particular compromise solution when the watershed is analysed as
one single region.
3
7
0.016
0.014
5 1 -0.005 1
New biogas
5
6
-0.016
8
7
-0.030
5
-0.005
-0.003
4
9
6
-0-021 4
-0.020 4
7.6.5 Data uncertainty
The sensitivity analysis presented above deals with small changes in the MOP
output for small changes in the input data. However, owing to the uncertainty in
the estimation of the input data, one would expect uncertainty in the estimation of
the values of the objective hc t ions .
As an illustration of the impact of uncertainty in input data, three examples
are examined here. Among the three examples, the first is the analysis of
uncertainty in the objective function coefficient, the second is the analysis of
uncertainSr in the constraint coefficient, and the third is the analysis of uncertainty
in the constraint limit. These three examples cover the type of uncertainty that
might have to be analysed in energy policy formulation. The importance of these
input parameters and their impact on uncertainty in the values of the objective
functions are discussed below.
a) Uncertainty in the estimates of coefficients of the objective functions.
To illusbate the impact of uncertainty in the values of the objective function becauçe
of the uncertainty in the estimates of its coefficients, the first objective of cost
muiimization is considered here. Since fuelwood is the major energy source in the
watershed, the uncertainty in the estimates of its cost coefficient might have a
significant impact on the optimal value of the immediate cost.
The estimation of cost coefficient for the base case is discussed in Appendix

Chapter 7 194
B.1 and the optimal value of immediate cost obtained by ushg the base case cost
coefficient is given in Table 7.3. The cost coefficient for fuelwood is obtained by
dividing the cost of forest management with the possible energy output from the
forests being managed. Therefore, if there exists an uncerlainty in the cost estima tes
for forest management or the energy output from the forest, then the estimates of
cost coefficient also becomes uncertain. The uncertainty in the estimation of cost
coeffiaents rnight lead to a significant impact on the optimal value of the immediate
cost. This case is examined below.
For the purpose of illustration, let the uncertainty for both the cost estimates
and the fuelwood availability be assumed to fa11 in a range of &IO% from their base
case estimates. Let the base case cost estimates be represented as Bc and the base
case gigajoules estimate be represented as BGJ. Then the range of cost coefficient
(cost/GJ), owhg to these uncertainties, can be calculated with the following
equation as suggested by Andrews and Ratz (1996). The term on the left hand side
of the equation (7.3) gives the lowest possible value and the term on the right hand
side gives the highest possible value for the cost coeffiaent owing to the uncertainty
explained above.
Using the above equation, the term on the Ieft hand side produces a minimum value
of coefficient as US $ 6.7/GJ and the term on the right hand side produces a

Cliap ter 7 195
maximum value of US $lO.O/GJ, irnplying a +20% change in the estimate of cost
coefficient from the base case (that is, from US $8.3/GJ). Therefore, if there were
a 110% uncertainty in the estimates of cost for forest management and energy
obtained from the forests, then the estimates for the cost coefficient woulci be in a
range of about 120% of its base case. When this range of cost coefficient is used in
the MOP model, the optimal value of the imrnediate cost is found to be in the range
of about US $ 1 million and about US $1.5 million. These values lie also within a
range of about e 0 % of the base case optimal cost shown in Table 7.3. This means
that the uncertainty in the estimates of the immediate cost is almost the same as the
uncertainty in the estimates of cost coefficients for fuelwood. Therefore, the
deasion makers might want to decide on a range of immediate cost to cushion the
impact of uncertainty in the estimates of cost coefficients.
b) Uncertainty in the estimates of the constraint coefficients
The impact of uncertainty in the estimates of the constraint coefficient is analysed
by choosing one of the major constraint coefficient in the watershed. As discussed
above, fuelwood is the main energy source in the watershed. Fuelwood is bumt
mainly in the traditional fuelwood stoves for cooking. Therefore, if the efficiencies
of the traditionai stoves were to change in the actual circumstances, then the energy
requirements and the immediate cos t would also change.
The field effiaency of a traditional stove could be as low as 5% (Dayal1993)
and as high as 15010 (Pokharel 1992). For a 5% efficiency of traditional stove, the
Cizapter 7 196
model produced an infeasible solution. An examination of GAMS output indicated
that the constraint representing the cooking energy demand was violated. The
lowest value for the efficiency that produces a feasible solution is 8%. Therefore,
if the efficiencies of the traditional stoves in the watershed were less than 8%, then
the deasion makers should also focus on supply of other energy alternatives such
as kerosene ro meet additional cooking energy demand.
When the efficiency range of 8% to 15% were analysed in the model, the
eshates in the optimal immedia te cost ranged between US $1.5 million and less
than US $1 million. The energy requirements for these efficiency estimates ranged
between 203 GJ and 116 GJ. This indicates that for a 20% reduction in the
efficiencies of the haditional stoves, the optimal values for immediate cost and
energy requirements increase 22% from their base case optimal values. However,
if the traditional stoves are 50% more efficient, then the optimal values for the
immediate cost and energy requirements would decrease by about 30%. This
shows that when there is an uncertainty in the estimate of efficiencies of traditional
stoves, it would also have a significant impact on the immediate cost and energy
requirements.
C) Uncertainty in the estimates of the limits on the constraints
The uncertainty in the limits on the constraints can be studied for either resources
or demands in the MOI? model discussed here. The limits for minimum energy
requirement for cooking is examined here.
Chapfer 7 197
The data indicate that as much as 85% of secondaxy energy used in the
households in the watershed is required for cookuig. Therefore, an uncertainty in
the estimates of cooking energy demand can have significant impact on the values
of the objective functions.
For the purpose of illustration, let it be assumed that under the actual
circumstances, the cooking energy demand varies within a range of 210%. That
means the final energy required for cooking in the watershed falls in a range of 14
TJ to 17 TJ. For this range in cooking energy demand estimates, the optimal value
for the immediate cost lies in the range of less than US $1 million and about US $
1.3 million, which is about 18% of the base case optimal cost. Similarly, owing to
this uncertainS, in the cooking energy demand estimates, the energy requirements
ranges between 150 TJ and 180 TJ, which is about +9% of the base case optimal
energy requirements.
The analysis indicates that there is no change in the maximum employment
level with this change in energy demand. This is because, while optimizing the
third objective for the base case, all the possible employment level had already been
a ttained.
The above discussion on data uncertainty was to illustrate the impact of
estimates in the availability of main fuel source, the use of main end-use device, and
the main energy end-use in the watershed. The analysis indicates that the optimal
values for imrnediate costs and the energy requirements are sensitive to the
uncertainty in the estirnates of fuelwood availability, efficiency of traditional stove,
Chpter 7 198
and cwking energy dernand. Therefore, care shodd be given to reduce uncertainty
in the estimation of these data. This also shows that the decision makers may want
to cushion the cost of implementation and energy requirements within a range to
absorb uncertainties in input data.
7.7 Summary
The main objective of this chapter was to show that there is a possibility of using
spatial data in a multiobjective model. It is noted that the multiobjective model
does not need to handle the data management part and the spatial model does not
have to proceed with analytical modelling. They act as separate entities, but
together produce a powerful tool with the properties of data handling, visual
display, and analytical modelling.
Altogether, five solutions were explored in each of the two case studies. The
deasion makers may choose any of the compromise solutions to their satisfaction.
The purpose of the model is to instigate a dialogue and facilitate the choice of an
educated and logical solution by iteratively exploring various solutions. This type
of iterative exploration is expected to provide a better understanding of the
solutions and their meaning.
If the decision rnakers are not satisfied with any of these solutions, then the
design process for the formulation of a better energy policy should be continued.
That is, either sensitivity analysis on one of the objectives should be done further,

Chapter 7 199
or one more iteration should be performed, or the objectives and constraints should
be reformulated. If none of the above options of the design process satisfies the
decision makers, then it should be concluded that there is no best compromise
solution for the given problem.
In this chapter, sensitivity of the objective functions to the input data and
parameters were also tested. The sensitivity with respect to input parameters helps
in recognizing important input païameters for the model.
As a case study, the sensitivity of the objective functionç with respected to
each other was also tested for the disaggregated case by performing the standard
sensitivity analysis on the value of one of the objective functiom. The sensitivity of
the objective values helps the decision makers to understand the tradeoffs among
the objective values.
The model presents the analytical solutions to the given problem. Therefore,
it should be emphasized here that the values of the objective functions and resource
allocations obtained from the analysis should be taken as guidingfactors and not in
absolute terms.
Chapter 8
CONCLUSIONS AND
RECOMMENDATIONS
Almost 75% of the world's population live in the developing countries, most of
which have, in recent years, experienced a significant growth in urban population.
Consequently, energy policy research and analysis is often focussed on addressing
the energy needs of these urban areas.
Sipnificantly, however, about three quarters of the population of developing
countries live in the rural areas where biomass is the main energy resource and the
use of energy resources is not efficient. Moreover, limitations in resource
availability, lack of altemate fuels, and lack of affordability of irnported fuels have
degraded rural life. Therefore, there exists a real and pressing need both for rural

Chapter 8 201
energy policy research and analysis and for state-of-the-art tools to facilitate this
analysis. The objective of this thesis is thus to develop and illustrate the utility of
a rural energy policy analysis tool, IREDÇÇ, which combines the data handling and
presentation capability of a GIS and analytical capability of a multiobjective
programming rnethod.
One way to irnprove the rural energy condition is to make more energy
resources available in the rural areas. There have been some attempts to augment
the energy nipply in the rural areas, but such programs have been ad-hoc and have
often lacked sustainability. As aforementioned, mral energy planning is either
absent or overshadowed by urban oriented energy planning. Some reasons for this
situation are the lack of understanding of the rural energv problems and a lack of
analysis of various energy options.
Many studies conducted so far atiempt to analyse the rural energy problem
with a single objective formulation and often shy away from managing voluminous
data. Since those formulations can only address one criterion of energy planning,
the best option chosen has often failed to generate public accephnce of the
implemented programs.
This study suggests that if the principles of geographical information systems
are applied, then it becomes much easier to manage the voluminous energy
resources data on a rural area and simultaneously it becomes possible to visualize
the energy balance information to a chosen level of disaggregation. Such
information is helpfd to isolate critical areas and to design location specific energy

Chnpfer 8
prograrns.
An energy program should address issues like invesûnent, inefficient use of
resources, local parfiapation, and environmental degradation, which is beyond the
scope of a single objective optimization. Therefore, a suitable multiobjective
programming method is recommended for the analysis energy policy options. It
is expected that, by including local participation in one form or another in the
national or regional energy planning process, public awareness can be increased,
which might increase the chance for the programs' sustainability.
8.1 Decision Support and its Application
The proposed DSS is tested on a rural watershed in western Nepal, where forest
denudation for fuel has caused severe environmental degradation. Data on energy
resources for the watershed were extracted from the available information as maps
and digitized data. A reconnaissance survey, also called a mral appraisal, was
done to validate the information obtained through the spatial analysis and to
understand the energy consumption by type for different end-uses. This was very
important because the information on the use of crop residues and animal dung for
fuel would not have been obtained from the desk sb~dy. The survey was
particularly helpful in understanding the fiow characteristics of the streams in the
watershed. It was found that three sheams contribute most of the water flow in the
watershed. Such a study was done by the researcher at this stage. When a decision
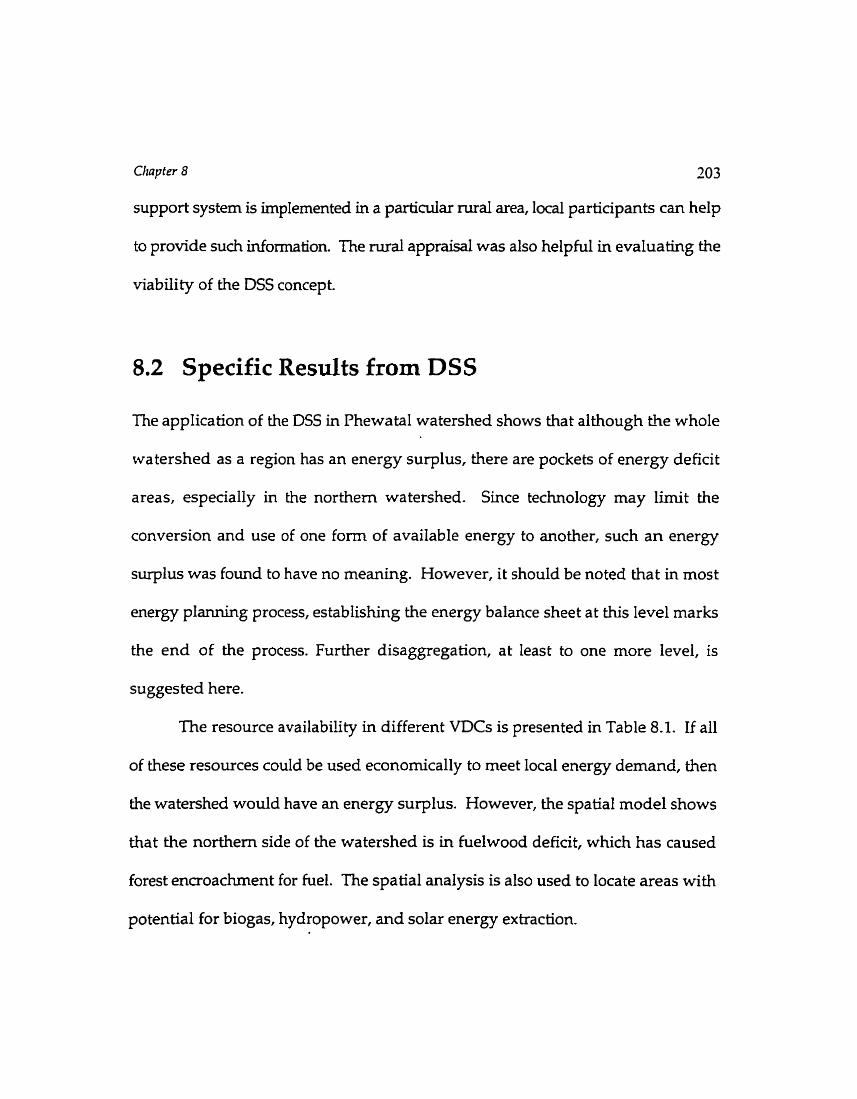
Chpter 8 203
support system is implemented in a particuiar rural area, local participants c m help
to provide such infomtion. The rural appraisal was also helpful in evaluating the
viability of the DSS concept.
8.2 Specific Results from DSS
The application of the DSS in Phewatal watershed shows that although the whole
watershed as a region has an energy surplus, there are pockets of energy deficit
areas, especially in the northem watershed. Since technology may limit the
conversion and use of one form of available energy to another, such an energy
surplus was fomd to have no meaning. However, it should be noted that in most
energy planning process, establishing the energy balance sheet at this level marks
the end of the process. Further disaggregation, at least to one more level, is
suggested here.
The resource availabi!ity in different VDCs is presented in Table 8.1. If al1
of these resources could be used econornically to meet local energy demand, then
the watershed would have an energy surplus. However, the spatial mode1 shows
that the northem side of the watershed is in fuelwood deficit, which has caused
forest encroachment for fuel. The spatial analysis is also used to locate areas with
potential for biogas, hydropower, and solar energy extraction.
Table 8.1 Energy resource in the shidy area (values in GJ)
VDClFuel Fuelwood Crop Manure Biogas residue
Dhikur Pokhari 30,300 6,700 29,200 65
Kaskikot 18,300 8,700 18,900 65
Sarangko t 1 21,100 5,900 22,500 536
Bhadaure Tamagi 68,900 3,200 15,300 105
Chapakot 102,200 4,900 16,800 732
Pumdi Bhumdi 24,700 400 1 5,500 366 t
Data obtained from the spatial analysis are analysed in the multiobjective mode1
with three objectives for minimizing cost, maximizing local employment, and
minunizing energy input Two cases are studied to underline the consequences of
developing energy programs by analysing the watershed as one region and as sub
regions The data obtained from the analysis are presented in Table 8.2, which show
that if a disaggregated planning option is chosen, then it can provide more
employment in the watershed. The optimal values of the imrnediate costs of the
program and energy requirements are less in the disaggregated case.
Table 8.2 Optimum values of objectives in three cases
Cases /Objectives
1 Case 2: disaggregated case 1 890 1 134 1 1,420
Case 1 :aggregated case r
fi, Invesûnent in US S('000)
1,220
fi, Energy input in TJ
f, Employment in person-years
166 1,400
Table 8.3 shows four additional energy options for consideration by the decision
makers obtained for each of the cases studied in this thesis. These solutions provide
the decision malsers with an opportunity to initiate a dialogue for a possible dioice
of a course of action in the design of a rural energy program.
Table 8.3 Analysis with the SEP-method in two iterations
The multiobjective model requires the analyst to specify many input parameters
Iterations
Cases \ Objectives
Case 1:aggregated case
Case 2:disaggregated case
which are subject to change due to macro economic impacts, technological
improvements, and data collection methodology. Changes in the input parameters
lead to changes in the compromise solutions. The sensitivity analysis helps in
Fust Iteration
identifpng input parameters that lead to significant changes in the solutions.
fi. US s(80ao,
1,360
1,240
Second 1 tera tion
The sensitivity analysis indicates that cooking energy demand is the most
important input parameter in the MOP mode1 used here. Therefore, care shodd be
fi US S('000)
1,260
1,000
@va as to its estimates. The illustrated analysis of data uncertainty indicates that
fi.
187
178
the percentage changes in the optimal values of the cost and energy requirements
f 3 r
person- years
1,180
1,100
2
TJ
169
162
are aimost the same as the percentage changes in the cost coefficient for fuelwood
fi, person- years
1,100
900
management, efficiencies of traditional stoves, and cooking energy demand.
Chapter 8 206
Therefore, the analyst may want to reduce the uncertainty in these data. By
knowing such impact on the values of the objective functions due to data
uncertainty, the decision makers may be able to choose a better decision that
cushions the effect of data uncertainty in the planning area.
8.3 Limitations
The prime objective of the research was to show that the development of an
effective decision support system for rural energy planning is possible by
combining spatial analysis and multiobjective prograrnming. Having produced
energy resource potential and energy balance information and by analysing the
output in a multiobjective model, the researcher has met this goal and has
contributed towards further understanding and analytical capability in energy
planning. Although the attempt was made to make the model as generic as
possible, the requirement of digitized data or thematic maps might make it difficult
to implement this model in al1 areas.
The collection of demand data poses some problem too. For the researcher,
at least, obtaining information from the households in the estimated tirne was very
difficult. To avoid any confusion with several surveys conducted to date in the
watershed, it became very essential to establish the purpose of the research and its
relevancy in most of the households visited. This made the survey process very
slow although very informative. However, it might pose little problems, if the local
Chapter 8 207
people are made aware of the data collection and the importance of their
participation in the decision-making.
The model presents analytical results and not subjective judgement and,
therefore, requires a user who can interpret the proposed solution. Formulation of
the objective functions and constraints might be a problem initially.
The proposed model marks the beginrung of the research to seek an energy decision
support system by using a geographical information system and multiobjective
programrning. Although this thesis is developed around a rural region in a
developing country, the concept could be applied to any other area with an energy
problem The model, when applied to Phewatal watershed has provided prornising
results. The following specific areas could be explored for future research in the
energy decision support system.
This procedure shodd be tested in other regions so that a more robust
decision support system could be developed in the future. Further
testing could be done by applying additional objectives, more local
resources, and extending to end-uses at non household levels.
b At present the spatial mode1 calculates the hydro energy potential by
using basin analysis and user provided hydropower sites. In future,
Chapf er 8 208
damrning possibility for hydropower generation and automatic
generation of Iength of water canal and maximum possible net water
head should be considered. Additional coefficients like surface
runoff, seepage, and evapotranspiration can also be considered to
calculate Stream flow.
b The mode1 is set up in ARC/INFO@ software on a UNIX platform.
This might hinder the dissemination of the DSS concept. Therefore,
work should be done to develop a microcornputer-based DSS so that
it could be provided faster and cheaper to the energy plamers in the
developing counhies.
b The siopes map could be generated from contour information. This
information and soils information would be helpful to add an
additional feature for watershed management.
Public participation can be one of the key factors in the analysis and
implementation of energy policies. Future work on the decision
support system can be camed out to seek ways to include public
participation in the DSS model.
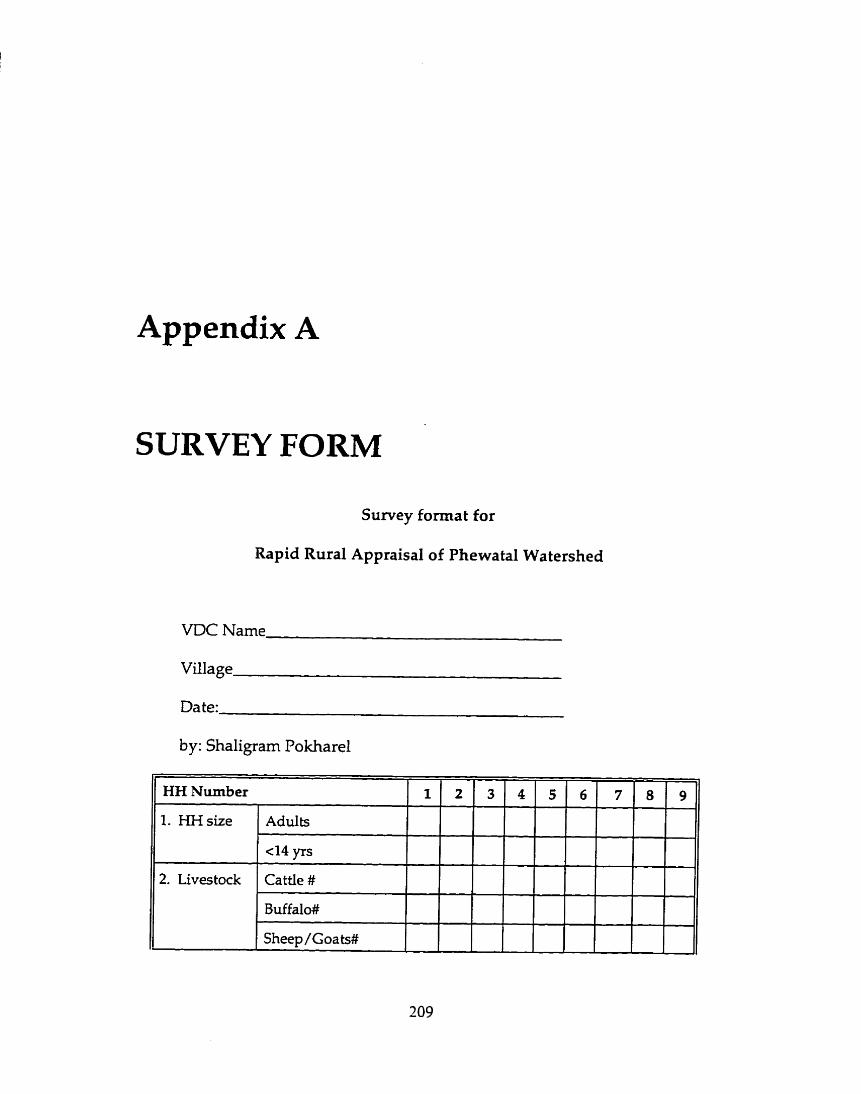
Appendix A
SURVEY FORM
Survey format for
Rapid Rural Appraisal of Phewatal Watershed
VDC Name
Village
Da te:
b y: Shaligrarn Pokharel
2. Livestock
1 2 3 4 5 6 7 8 9
"
Aduits
cl4 yrs
Cattle #
Buffalo#
Sheep/Goats#

Appendix A 210

Appendix A 21 1

Appendix A 212
l if two, one and two hrs, use 1.5 hrs


Appendix A 214
Appendix B
COST COEFFICIENTS
In this appendix, the immediate cost coefficients are calculated for use in the thesis.
The approach to obtairi economic and financial cost coefficients is briefly outlined.
B . l Fuelwood
The immediate cost required for forest management is estimated from deLucia and
Assodates (1994). Based on the literature, it is estimated that about US $370 (1 US
$ = Rs. 50) is required imrnediately to put every hectare of forest under
management in Nepal. Forest area covers almost 57 sq-km in the watershed and
produces almost 256,000 GJ of primary energy amually, if used sustainably.
Therefore, the average cost for fuelwood management in the watershed would be
US $ 8.3 per GJ. This is the immediate cost coefficient to the energy variables
representing fuelwood consumption.
The economic cost of fuelwood is the cost to the government to replace an
215
AppendL~ B 216
equivalent quantity of fuelwood in the watershed by growing it in the watershed
or by extracting fuelwood from a source outside the watershed, or the cost incurred
to correct negative impacts caused by fuelwood extraction. Since the analysis to
obtain environmental impact costs are complex and it was not possible to obtain
these data from the reviewed Iiterature, only the first option, that is to replace the
fuelwood consumed, is considered here.
The financial cost is the cost of labour required to collect fuelwood. If it were
purchased then the purchase pnce would be considered as the financial cost.
B.2 Crop residues
If energy uses for aop residues have to be promoted further, then they might have
to be collected and redistributed. However, due to a lack of data, no immediate
cost is assumed for the govemrnent.
The econornic cost of crop residues refers to the cost of collecting, storing,
and distributing crop residues, when it has to be promoted for energy use. It could
also be the cost of generating an equivalent quantity of energy or fodder from other
sources. Since there is no oppominity to coikt residues to produce energy sources
like briquettes, only the second option of costing could be considered here. The
finanaal cost of crop residues is the cost to the consumer if it has to be purchased.
Appendh B
B.3 Animal manure
The economic cost of animal manure is the cost required to replace manure use by
an alternative fertilizer of equivalent value. Generally, the value of diemical
fertilizer is taken as the replacement cost for animal manure. The financial cost is
the cost to produce an equivalent quantity of dry manure, if this is the sole by-
product, or the cost to purchase animal manure kom a source extemal to the
household.
Since, animal manure is the only input to the field, it would have negative
consequences if diverted for fuel use. Therefore, it is assumed that the use of dung
for energy would not be promoted.
B.4 Biogas
If the govemment provides a subsidy on the cost of biogas plant, then this subsidy
should be taken as the immediate cost because the government needs to provide
this money for the installation of biogas plant In Nepal, US $200 is provided as a
subsidy for every installed biogas plant. It is assumed that such a plant produces
13 GJ of secondary energy. However, if biogas is promoted for cooking and food
processing then, based on the current consumption pattern, about 7.5 GJ of biogas
energy would be used for cooking and food processing. Therefore, the cost for
subsidy would be about US $26.7 per GJ irrespective of the plant size.
The economic cost of a biogas plant is the cost required by the govemment
Appendir B 2 18
to pay as a subsidy over the operating life of a biogas plant or the economic cost of
the fuel replaced by biogas. A methodology for the calculation of the economic cost
of a biogas plant is given in Pokharel et al. (1991).
The finanaal cost of biogas indudes the cost of livestodc, if biogas generation
is the sole purpose for keeping livestock. However, then the revenue obtained by
selling rnilk or manure should be subtracted. Also, if the milk and manure
produced by livestock replace the earlier purchases, then these factors should also
be taken into account. A detailed treatment of the calculation of the financial cost
of a biogas plant is also given in Pokharel(1992).
B.5 Fuelwood stoves
The imrnediate cost for promoting efficient fuelwood stoves is the cost of
production and training. The cost of various types of effiaent fuelwood stoves used
in India are given in FA0 (1993a). Rijal and Graham (1987) have made a study on
the cost of EFSs in Nepal. Based on this study, it is estirnated that about US $4/EFS
is required to produce an EFS with about 20% end-use efficiency (and an operating
life of two years), train the trainees and the stove-users, and to install the stoves in
the watershed. On average, 32.8 GJ/yr of primary energy is used by a household
for cooking, feed preparation, and food processing if a traditional fuelwood stove
is used. If this activity is replaced by an EFS mentioned above, only about 16.4 GJ
of energy would be required to fulfil the same end-uses. Therefore, the average
Appendir B 219
cost of introducing an EFS would be US $0.2/GJ. Therefore when the fuelwood
costs are added, the energy-use cost for an EFS becomes US $ 8.5/GJ. Since
traditional stoves are made by the households thernselves, there would be no
additional cost ùivolved for the government.
The economic cost of a traditional stove is the economic cost of the material
used for rnaking the traditional stove. If an EFS has to be built (some models) and
distributed, then the economic cost of an EFS would be the economic cost of
production !or cost of purchasing the produced EFS), transportation, training
individuals, and installation The financial cost is the cost to the end-user to install
a traditional stove or to get an EFS installed.
B.6
Micro
Micro hydro
hydro based electricity generation is promoted by the government with a
subsidy of US $ 140 per plant to cover a part of the electricity generation cost.
Therefore, if electricity generation is to be promoted in the watershed, the three
identified sites would require about US $ 420, which averages to about US $
1.64/GJ.
Micro hydro replaces either diesel consumption, if used as a grain processing
unit or keroçene, if elecbiaty is generated. The generation of electricity specifically
would avoid the generation of an equivaient amount of electricity elsewhere and
extending electricity grid to the area. deLucia and Associates (1994) recommend

Apperrdir B 220
that the Long Range Marginal Cost (LRMC) of electricity could be taken as the
economic cost for electricity generation and expansion. However, it should be
noted that the LRMC depends upon the type of resource exploitation envisaged by
energy planners. The hancial cost of electricity to the consumer is the cost for
wiring, installing ballasts or switdi/sockets
fluorescent tubes, and the cost for the electricity
and the incandescent bulbs or
used.
B.7 Solar photovoltaic
The immediate cost for a solar photovoltaic installation is the cost of land
acquisition, materials, equipment, and installation of the system. Based on GTZ
(19921, the average cost of a PV module is estimated at about US $6-8 per peak-watt
W . For a PV system with battery control units, batteries, invertors, and
transmission, the cost increases to more than US $10/W,.
From Table 6.12, it is seen that a PV-module with 1 kWp capacity can
produce 5.8 GJ of annual energy. Therefore, the immediate cost for installation of
a solar photovoltaic system is US $1,700 per GJ, which is very high compared with
the hydropower and kerosene options for lighting.
The economic cost of a solar photovoltaic system is the cost to import the PV-
modules, transport them to the site, install the generation and battery storage
system, distribute the electriaty, and maintain the system. The economic cost of the
solar PV system is higher in Table 7.1. This is because of higher cost of the whole

Appendir B 22 1
system when the solar PV system was installed in Nepal. The cost of a solar PV
system is deaeasing over the years because of the advancement in PV technology.
The financial cost is the same as the financial cost for hydro based electricity.
B.8 Kerosene
In Nepal, every kilo litre (kl) of kerosene is sold at US $35.2 below its economic
price (as a subsidy) to discourage the use of fuelwood for cooking, at Ieast in the
urban areas. The immediate impact of kerosene use is in the import and the
subsidy amount, that is US $0.96 per GJ. The subsidy amount is an added cost to
the government and is taken as the immediate cost.
The economic cost of kerosene refers to the cost incurred to explore, distil,
and distribute kerosene, if the country produces a sufficient quantity of kerosene.
Otherwise, it refers to the cost of import, storage, and distribution. The financial
cost is the cost paid by the end-user in the open market.
B.9 Electric bulbs
Since electnc bulbs are to be purdiased by the public, the only inunediate cost to the
govemment would be the cost to import or produce an increased number of these
devices. It is assumed that there is no direct significant cost to the govemment with
such an increased consump tion.
The cost to import electric bulbs or to import the raw matenal and skills to

Appendk B 222
produce electnc bulbs is taken as the economic cost The financial cost is the cost
to the consumer.
B.10 Kerosene lamps and stoves
Kerosene lamps and kerosene stoves are purchased by the end-user. Therefore, no
irnmediate cost is assumed for the govemrnent. The economic costs of these devices
are the economic cost of the raw material for production. The financial cost is the
purchase pnce of these devices.
Appendix C
EMPLOYMENT COEFFICIENTS
The employment coefficients associated with the third objective discussed in
Chapter 7 are elaborated upon here.
C.l Fuelwood
As mentioned before, properly managed forests can yield fuelwood to the tune of
2.5 to 5 times that from a non-managed forest. In the Phewatal watershed,
fuelwood yields could be increased three fold if forests were managed (IWMP
1992). The government has nothing to lose from managed forest areas. The current
practice of handing over some of the forest areas to the local comrnunity should be
Iauded in this regard. However, the local people do not have enough expertise on
forestry management. It was seen that the local communities were protecting the
Appendix C 224
forest but cutting it down unçysternatically. Therefore, the training of local people
in conjunction with the hand over of more forest is highly recomrnended.
Employment in the forestry sector depends upon the forest area to be
managed and available idrastnictures. Better road access would allow for better
and more effective management as compared with inaccessible areas. The Iarger
the forest area, the lower is the employment factor. Similarly, if the forest area is
closer to the habitation, then more employment might be necessary to check
pilferage and unauthorized livestock grazing.
For forestry management, people are required for nursery development,
guarding forests, forest foremen, and rangers. These personnel could be recniited
at the local level. The employment estimates used here are based on deLucia and
Associates (1994) for a hectare of land (extracted frorn Table 3G-2C), which shows
that about 0.3 person-years would be required in the first year and 0.03 person-
years in the longer term to manage and redistribute fuelwood from a hectare of
land. From Table 6.2 it is known that the current fuelwood yield is about 256,000
GJ from 5,700 hectares of forest. Therefore, the short term ernployment generated
by forestry management in the watershed is about 0.007 person-years/GJ.
C.2 Crop residues
The employment for a o p reçidues would be for the collection, storage, and
management of the residues. However, due to a lack of data, no additional

Appendix C
employment due to the use of crop residues is assumed here.
C.3 Biogas
If the decision is taken to install biogas plants, then ernployment generated by
biogas should be considered. Every ten cubic metre biogas plant (which is
considered here for dissemination as most of the new installations in Nepal are of
this size) requires 45 person days of unskilled labour (that is, 0.12 person-years) that
could be employed locally. In the case of long term labour generation, at least one
person is required (as a keeper) for tending livestock, cleaning, feeding livestock,
and operating the biogas plant One biogas plant is expected to provide 7.5 GJ that
could be used for cooking and food processing in the watershed. That means, short
term labour (including the keeper) generated by biogas installation wouid be 0.15
person-yrs/ GJ.
C.4 Micro hydro
Like biogas, micro hydro also has both long term and short term employment
opportunities. In the short term, employment would be created for the
trançportation of materials, constmction of canals, installation of equipment, and
construction of a turbine house.
Based on Pokharel(1990), it is assumed that at least two persons would be
required to maintain the facility. In this watershed, since two steel turbines have
Appendix C 226
already been installed, immediate labour requirements in these cases would be
lower. In the case of a wooden waterwheel, if a steel turbine needs to be added,
then it would require labour for improvement of canal and installation of turbine
too. The number of unskilled labourers required depends upon the site, the length
of the canal to be constructed, the power output, and the transportation of material
and equipment. Based on the researchers' s w e y of micro hydro plants in Nepal
in 1989 and 1993 and his work as a production engineer at Balaju Yantra Shala
Kathmandu between 1985 and 1986, it is assumed that about 30 person-months of
labour (except house wiring) are required for the construction of a new micro-hydro
plant and five person-months for add-on installations below 20 kW capacity. The
total estimated output capaaty in the watershed is 260 GJ in three sites. Therefore,
short term employment wodd be about 0.009 person-years/GJ for a new plant and
0.0017 person-years for the add-on installation. When operating persons are
included, then it would be 0.029 and 0.022 person-yean/GJ for new and add-on
installation respectively. However, about 0.02 person-years/GJ of employment
would be required in the long term.
C.5 Solar photovoltaic
For solar-based electricity generation, long term employment is required for the
maintenance of the system if it is to be considered as a central distribution system.
Short term employment is generated for the transportation of matenals and
Appendix C 227
equipment, the construction of a site and generation house, and the house wiring.
In the absence of data, the short term employment is asçumed to be the same as that
of a new micro hydro unit. In the case of the long term employment coefficients,
inference could be drawn from a 25 kW (electricity distribution capacity) PV
generation unit in Tatopani, Nepal. The facility is currently manned by three
unskilled employees, three administration staffs, two metre readers and one
technician (in 1993). That means, if the operation is handed over to the comrnunity
then, except for the techniaan, a maximum of eight local people could be employed
there. This fadiSr produces and distributes about 1,350 GJ of solar energy per year.
The average employment provided by the facility, therefore, is 0.006 person-
years/GJ. In an isolated household system, however, both long term or short term
employment may not be created.
C.6 Kerosene
Assuming that every person can transport 20 litres of kerosene per day from the
urban centre to the clustered settlements, a person can transport about 265 GJ of
kerosene each year. This is assumed as both the short and long term employment
for the kerosene option. No short term and long terni employment has been
assumed for end-use devices using kerosene fuel due to a lack of data.
Appendix C
C.7 Efficient fuelwood stoves
If one trained person is allocated to install20 EFSs annually and to bain the end-
user to use it, then total energy produced by 20 EFS wodd be 328 GJ. That means,
thq short term employment with an EFS wodd be 0.003 person-years. Since, the
operaüng life of an EFS is assumed as two years, half of the short term employment
would be required every year to replace an older EFS.
Appendix D
FORMULATION OF
OBJECTIVES AND CONSTRAINTS
As shown in section 4.2, the energy variable used in this thesis is xijw where i refers
to the type of fuel, j refers to the type of end use devices, k refers to the end-use (or
energy service), and p refers to a particular area. Also recall from section 7.2 that
when additional energy technologies are to be anafysed for implementation, an
additional index N is added to the energy variable. The assumptions made for the
formulation of the objective functions and constraints are given below.
Hvdm and Grid Electricity
The elech-icity is used for lighting and appliances. Therefore, it is expected that if

Appendix D 230
a new micro hydro plant of capacity, /Ep, is installed in VDC p, then the constraint
could be written as,
X693p + X60ip Ap;
However, only a portion of the electricity would be used for appliances. The
survey indicated that if electricity codd be supplied uninterrupted, then the
consumption would be about 0.1172 GJ/capita for lighting and 0.0002 GJ for using
appliances. Therefore, the binding constraint for allocation would be,
(1/0.1172) ~ 6 % - (1/0.0002)~~+ = O;
Or, X,, = O. OO 1 7 xdg3,;
Or, s .OOI 7;
Kerosene Consumption
In te- of energy value, the present consumption patterns indicate that kerosene
demand for lighting is 2.2 times greater than electricity demand. Therefore, the
demand for lighting energy, 4, is written as,
&93p + x693p a 4;
Efficient Fuelwood Stove (EFS)
A traditional stove requires 32.8 GJ of primary energy for cooking, feed
preparation, and food processing in a household (average size 5.62 persons). If an
EFS could be used for the same purpose, because of increased end-use efficiency,
Append ix D 23 1
it would require oniy half that energy. Therefore if an EFS is to be used, and if &
number of EFS installations is plamed, then the constraints could be written as,
Xi31p + X ~ . 3 2 p + X135p g* 6-4; However, as seen from Table 5.7, the energy required for al1 three end-uses is
different Therefore, if an EFS is to be used for these end-uses, then the constraints
could be written as,
(7/5.24) x,,~, - (1/0.5) +,, = 0; and
(1/5.24) x ~ J ~ , - ( 1 / 0 . 0 8 ) ~ ~ ~ ~ , = O;
Therefore, x ,,,, s &*16.4/1.1102;
Biogas Installation
The effiaency of a biogas stove is assumed as 40%. Therefore the energy required
by a biogas stove for cooking and food processing is !4 that required by a traditional
stove. It is assumed that a biogas stove is used for cooking and food processing
only. The potential number of biogas plants has been identified in Table 6.7. Eadi
plant should supply 7.5 GJ of primary energy for the proposed end-uses in a
household. If the number of potential biogas plant in a VDC is 61$, then the
constraint could be written as,
xï61~+~765~ pp * 7-5;
Since only a portion of biogas will be used for food processing,
(1/5.24)xi6,, - (1/0.08) Xi,jlp = 0;
Appendix D
Therefore,
D.l Case 1
In this case, the watershed is assurned as one region and no restriction on the
supply of energy is assumed.
DmlS The objectives
a ) Minimizing the cost allocation for the program implementation:
The cost minimization objective is given below. The cost coefficients are the
immediate costs given in Table 7.1. Since, production of hydro elechicity in the
three sites is different, the cost per gigajoules is also different.
Minimize 8.3(x1,, + x,, + xrZ, + x I Z 5 ) + 8.5(1.7102 *x13 , ) +
26.7(1.0152 ' x W I N ) + 1.0017 (1.2 X6931f 1 . 6 ~ ~ ~ ~ ~ + 2.6 x6933 ) +
0 - 9 6 ( ~ ~ ~ ~ + *j831 + *5833 );
b) Minimizing total energy input:
The objective could be written as the minllnization of the total energy input for
different end-uses in the system and is formulated as,
Minimizex,,, + x,, + x,, + x,,, + x,, + + x2-, +7.1102 1 ~ 3 , + x,, +
X5s31 + Xg33 + Xiol +I .O152 X x z N 7.0017 ( x ~ ~ ~ ~ + X6932 + X6933 +Xg93? f
'9933 + Xg93-1 + Xgg3j + 1 4 9 3 d;
Appendix D
C) Maximizemralemployment:
In the objective function formulated below, the employment coefficients are
expressed in 1/1000 GJ. These values of immediate employment are obtained from
Table 7.2. The local employment for micro hydro installation is not the same for al1
three identified sites because the installations in Bhadaure Tamagi and Chapakot
are only add-on types. Therefore, the employment coefficients for micro hydro
installations in the above sites are lower.
Maximize 7(x,,, + xI ï + x,,, + x,,) + 10 (1.1102 x,,, ) + 15(1.0752~,,,) +
3(xj3 + XjB3, + XjaJ3 )+ 20 * 1.001 7 ( x ~ ~ ~ ~ + XSgJ2 )+ 29 * 1 . 0 0 1 7 ~ ~ ~ ~ 3 1;
D.1.2 Constraints Set
The limitations on the objectives formulated above are discussed in this section.
a) Energy required for cooking should be mef:
The coefficients used here are end-use efficiencies.
O . ~ X , ~ , + O.Zx,,, + 0 . 4 ~ ~ ~ + 0.4x,,, + 0 . 4 5 ~ ~ ~ 2 15559;
b) Energy used forfeed preparation should be met: The coefficients are end-use
efficiencies.
O.lx,, + 0 . 1 ~ ~ + 0.2 (0.0905 x,,, ) z 1483;
C) Energy required for lighting and appliances should be met:
The lilighting energy requirement in Bhadaure Tarnagi could be met by two sources,
either by hydro-based electricity or by kerosene. The lighting energy in Chapakot
Appendix D 234
can be met by grid electricity and hydro potential in Chapakot c m be used in
Bhadaure Tamagi because of the proximity of the site with Bhadaure Tamagi. The
constraints for lightîng energy (bath demand and potential) have been developed
on a VDC basis because of localized nature of hydropower installation.
1.0017 ( ~ 6 9 3 , + xm2 ) + 0 . 4 5 ~ ~ ~ ~ ~ 2 575;
x6931 s 114/1.0017;
x6, r %/Z .O01 7 ;
In Chapakot, all lighting/appliances energy is met by grid electricity
x,, z 400/1 .O01 7;
In Dhikur Pokhari, grid electricity, hydroelectricity, or kerosene could be used for
lighting. Almost 87% of the households meet their lighting energy demand by grid
electricity; the rest would be supplied with electricity generated by micro hydro
plants and kerosene for lighting.
1 .O01 7 x6933 + 0 . 4 5 ~ ~ ~ ~ 2 1 17;
I 54/1.0017;
2 766/l. 001 7;
In Kaskikot, al1 lighting/appliances energy is met by grid electricity
x,, 2 794/1.0017;
In Pumdi Bhumdi, lighting/appIiances energy is met by grid electricity
xggS r 19611 .O01 7;
In Sarangkot, al1 lighting/appliances energy could be met by grid electricity
Appendix D
~ 9 % a 635/1.OOl7;
d) Energy required for heating should be mef:
+ ~77~ 2 2374;
e) Eneqy used forfood processing should be met: The coefficients used here are
end-use efficiencies.
0 . 1 ~ ~ ~ + 0 . 1 ~ ~ + 0.2 10.01 52) x13, + 0.4 (0.0152 x X I N ) 2 237;
There is a limit on the use of crop residues as fuel:
X x r + x2, + X= 29870;
g) The fuelwood supply should no f exceed the sustainable Iimif:
The availability is to be measured in terms of accessible forest area. The accessible
fuelwood supply in the watershed is given in Table 6.3, therefore, the constraint is
fonnulated as,
xtti + x,, + xl14 + x,, +1.1102 xIl l s 191 746;
h) There is a limit on EFS installation:
It is assumed that the decision makers set a target of installing 600 EFSs in the
watershed. For cooking, food processing, and feed preparation, an EFS would
require 16.4 GJ of primary energy.
x,,, 1; 9840/1.llO2;
i) Kerosene consumption should be reduced:
Kerosene must be consumed in Bhadaure Tamagi and in parts of Dhikur Pokhari
for lighting because there is no electricity available and the hydro potential is not

Appendix D 236
enough to meet al1 of the demand. Also, wherever there is a fuelwood deficit, if
might be wise to promote the use of kerosene for cooking as a short term measure
to deviate forest denudation. However, a restriction should be put on the quantity
of kerosene to be consurned in the watershed. A limit of 1,000 GJ is used for the
purpose of illustration.
xssl + X33t f XjaJ3 1 1000;
j) Existing biogas dernand should be met by existing biogas plants:
xX1 c 30;
k) There is a limit on the installation of biogas plants:
There is a potential to instali 143 biogas plants. Therefore, the constraint could be
written as,
1.0152 i 1072;
First Iteration
The following is the formulation for the first itera tion to be analysed by the STEP-
method. This formulation is based on equation (3.5).
Minimize 6
s.t. x EX;
D.1.4 Second Iteration
As explained in Section 3.2, when the value of one of the objective functions is
changed to search for an improvement over the values of the other objective
functions, then the weight to be associated with the chosen objective function
should be equal to zero. Therefore, in this case, x, = O (the employment objective).
The formulation of the problem presented below for this iteration is based on
equations (3.5) and (3.6). As s h o w in equation (3.61, the decision makers can
choose either to relax objectives or to set a target and reanalyse the problem. Here,
a target of 1,000 person-years of employment is chosen.
D.2 Case 2
In this case, the watershed is divided k t o six administrative areas and the energy
dernand and potential for each VDC is analysed separately. There are six VDCs in
the watershed. Therefore, p = 1,2, ...., 6.
Appendix O
D.2.1 The Objectives
a) Minimizing the cost allocation for the program implementation:
6
Minimize C { 8 . 3 1 ~ ~ ~ ~ + x,,, + ~~2~~ + x,,, )+ P- 1
C ) Maximize rural emplo ymen t:
In the objective function fomulated below, employment coefficients are expressed
in 1 /IO00 GJ.
6
Maximize f 7 ( ~ , , ~ , + x12,, + x,,, + xIzp ) + 20(2. ll02x,,,, 1 + P - 1
Appendix D
D.2.2 Constraints Set
a) Energy demand for cooking should be met:

Appendix D
x6g32 91;
In Chapakot, al1 lighting/appliances energy is met by grid electricity
xgg3, 2 399.3;
In Dhikur Pokhari, grid electricity, hydro, or kerosene codd be used.
1.0017 1,933 + 0 . 4 5 ~ ~ ~ 3 3 2 117;
X6s33 s 54; X9933 2764.7;
In Kaskikot, al1 lighting/appliances energy is met by grid elechicity
x,, 2 792.6;
In Pumdi Bhurndi, lighting/appliances energy is met by grid electricity
x~~~~ 2 195.7;
In Sarangkot, al1 lighting/appIiances energy could be met by grid electricity
xg9% 2 633.9;
Energy required for heating should be met:
x ~ z ~ ~ + ~~2~~ 2 392; xItJt + x ~ z ~ ~ 2 273;
X12.g3 + $243 2 602; xz2, + xZ7.4 2 541;
x12.g5 + ~ ~ 2 . g ; 2 134; Xlz.g6 + x7746 2 432;
Energy used for food processing should be mef: .
0 . 1 ~ ~ ~ ~ + 0.1 xzzj1 + 0.0152 ( 0 . 2 ~ ~ ~ ~ ~ + 0 . 4 ~ ~ ~ ~ ~ ) r 39;
0 . 1 ~ ~ ~ + 0 . 1 ~ ~ ~ ~ + 0.0152 ( 0 . 2 ~ ~ ~ ~ ~ f d 27;
0 . 1 ~ ~ ~ + 0 . 1 ~ ~ ~ + 0.0252 (O.2xl3,, + 0 . 4 ~ ~ ~ ~ ~ ~ ) z 60;
O-lx,, + 0 . 1 ~ ~ ~ + 0.0152 ( 0 . 2 ~ ,,,, + 0 . 4 ~ ,,,, .J 2 54;
Appendix D r'
O-lx,, + 0 . 1 ~ ~ ~ + 0.0152 (0.2x13,, + O - ~ X , , ~ ) 2 13;
0 . 1 ~ ~ ~ + 0 . 1 ~ ~ + 0.0152 1 0 . 2 ~ ~ ~ ~ ~ + 0 . 4 ~ ~ ~ ~ ) 2 44;
fl There is a limit on the use cf crop residues as fuel:
x,,, + x,, + x,, s 3774;
xaZ + X, + x,? s 4946;
rZm + X,, + X-3 5 6695;
x ~ , + xZI4 + X, s 8739;
W, + XZZ + xZE c 400;
qZz6 + x~~~~ + xZli6 1 59 1 6;
g) Thefuelwood supply should not exceed the sustainable limit:
X I r l l + r1221 + x~~~~ + xlr j l + 1. I I O ~ X ~ ~ ~ ~ s 51683;
xlrl2 + X I z ? + xIZ12 + xIZjZ + 1.1 102 x~~~~ s 76654;
x~~~~ + x1,, + + xzm + 7.1102 x1,,3 r 22790;
x~~~~ + x p 4 + xlz, + x,-, + 1 . 1 1 0 2 ~ ~ ~ ~ ~ r 13750;
x~~~~ + x,, + xZ2, + x,, + 1.7 1 0 2 ~ ~ ~ ~ ~ 5 11 027;
X p 1 6 + Xln6 + X1246 + XlE6 + 1 . 1 1 0 2 ~ ~ ~ ~ ~ 3 15842;
h) There is a limit on the installation of EFS (600) in a year:
As mentioned before, a target of installing 600 EFSs in the watershed has
been studied here. The installation could also be limited for each VDC. For
example, installation could be planned only in the northem areas of the
watershed.

Appendix D
7 1102 ( ~ 1 3 1 , + x z ~ l r + xZ3,3 + ~ 1 3 1 , +x13z5 + xIJ16 ) r 9840;
i) A restriction should be put on kerosene supply:
The earlier assumption to reshict the kerosene supply to a level of 1,000 GJ
gave art infeasible solution mainly because of the high cooking energy
demand in Sarangkot, Dhikur Pokhari, and Kaskikot VDCs. Trial runs
indicated that a minimum of about 10,160 GJ (or 280 kl) would be required
for a feasible solution. Therefore, 10,160 GJ is set as the upper lunit for
kerosene supply.
Xj5z3 + XjS14 + GZ6 f X5g31 + X5833 110160;
j) Existing biogas plants should supply energy:
x,,, 5; X x l z 13; x7613 8;
x76l4 7; X,'615 12; X76z6 5;
k) There is a limit on the installation of new biogas plants:
The total potential to install 143 biogas plants in different VDCs as shown below.
The energy value is based on the consumption for cooking and food processing
only.
7.0152 XzZlN S 60; 1.0152 X,61N 5 420; 1.0152 X7613N S 37;
1.0752 Xi6,, s 37; 1.0152 X761N i; 210; 7.0152 X x l m 5 308;
D.2.3 First Iteration
The formulation of the problem to be analysed by the first iteration is based on

Appendix D 244
equation (3.5). The set of reformulated objectives and constral-its for the first
iteration of Case 2 is given below.
Minimize 6
s.f. x ex;
D.2.4 Second Iteration
In this iteration, the problem is reformulated by applying equations (3.5) and (3.6).
The weight on the third objective is set to zero because it is assumed that the
deasion rnakers have decided to =et different employment targets for the analysis.
The formulation for the employment target of 900 person-years is given below.
BIBLIOGRAPHY Adamus, CL., and M.J. Begman. 1995. Estimating nonpoint source pollution loads
with a GIS screening model. Water Resources Bulletin 31(4):647-655.
ADB (Asian Development Bank). 1992. Key Indicators of Developing Asian and PacFc
Countries. Oxford University Press, UK.
Adhikary, A. 1988. Fuelwood use and deforestation in Nepal. In Asian and Pacj4c
Experiences: R u r d Energy Planning, ed. K.V. Ramani, 395-399. Asian and Pacific
Development Center/GTZ, Malaysia.
Andrews, G.C. and Ratz, H.C. 1996. Introduction tu Prafssional Engineering.
University of Waterloo, Canada.
Antunes, C.H., L.A. Almedia, V. Lopes, and N. Climaco. 1994. A decision support
system dedicated to multicnteria problems. Decision Support Systems 12(4/5):327-
335.
Antunes, CH., M.J. Alves, A.L. Silva, and J.N. Climaco. 1992. An integrated MOLP
base package: a guided tour of TOMMIX. Cornputers Ops. Res. 19(7):609-625.
APDC (Asian and Pacific Development Center). 1985. htegrated Energy Planning:
A Manual. ed. R. Codoni, H. Park, and K.V. Ramani. Malaysia.
ARDEC (Agriculture and Rural Development Consultancy). 1984. "Study on
Ecosystem Evaluation in Phewatal Watershed, Final Report." Submitted to
Environmental Impact Shidy Project, Phewatal Watershed Management Project,
Nepal.
Aronoff, S. 1991. Geographic lrrforma tion Systems: A Management Perspective. WDL
Publications, Canada.
ASD (Agricultural Statistics Division). 1993. Agricultural St~tistics of Nepal, 1992-
1993. Ministry of Agriculture, Nepal.
Balla, M.K. 1988. Application of the Universal Soil Loss Equation to Estimate Soil
Loss in Phewatal Watershed. Ioumal offorestry, Institute of Forestry, Pokhara, 10:10-
17.
B&K (Barnard, G. and L. Knstoferson). 1985. Agrimltural Residues as Fuel in the Third
World. Earthscan, UK.
Barnett, A., L. Pyle, and S.K. Subramanian. 1978. Biogns Technology in the Third
World: A Multidisciplina y Rmiew. International Research Development Center
(IDRC), Canada.
Bartelmus, P. 1986. Environment and Developrnent. Allen and Unwin, USA.

Bassey, M.W. 1992. RenewabIe energy research and development in West and
Central Africa. in EnergyfOr Rural DPveloprnent, ed. M.R. Bhagavan and S. Karekezi,
89-107. Zed Books Ltd, UK.
Behan, S. 1988. Rural energy supply assessrnent in India, in Asian and Pa+
Experiences: Rural Enmgy Planning. ed. K.V. Ramani, 192-194. APDC/GTZ, Malaysia.
Benayoun, R., J. deMontgolfier, J. Tergny, and 0. Laritchev. 1971. Linear
programming with multiple objective fimctions: STEP me thod. Ma thema tical
Progrfarnrning 1:366-375.
Berry, J.K. 1994. Question GIS before you start. GIS World, 7(4):page 22.
Berry, J.K. 1994a. What cm GIS do for you. GIS World, 7(5):page 24.
Best, G. 1992. The role of renewable energy technologies in rural development. in
Energyfm Rural Daelopment, ed. M.R. Bhagavan and S. Karekezi, 3-37. Zed Books
Ltd, UK.
Bhatia, RK. 1988. Data base development at national level 1988. in Asian and Pac@
Experiences: Rural Energy Planning, ed. K.V. Ramani, 63-73. APDC/GTZ, Malaysia.
Bhatt, B.P., and N.P. Todana. 1990. Fuelwood characteristics of some mountain
trees and shrubs. Biomass 21:233-238.
Blair, P.D. 1979. Multiobjective Reg~onal Energy Planning Application to the Energy Park
Concept. Martimus Nijhoff Publishing, USA.
Bogach, V.S. 1985. Wood as Fuel: Energyfor Deveioping Countries. Praeger publishers,
USA.
Bose, R.K. and G. Anandalingam. 1996. Sustainable urban energy environment
management with multiple objectives. Energy:The In terna tional ~ournal21(4)305-318.
Bowerman, R., B. Hall, and P. Calamai. 1995. A multiobjective optunization
approach to urban school bus routing: formulation and solution method. Transpn.
Res.-A 29A(2): 107-123.
Bracken, 1. and C. Webster. 1989. Towards a typology of geographical information
systems. Int. 1. Geog. In$ Sys. 3(2):137-152.
Burrough, P.A. 1986. Pnnciples qfGeographica1 Infbrmation Systemsfor Land Resources
Assessment. Clarendon Press, Oxford, UK.
Burrough, P. A. 1992. Development of intelligent geographical information systems.
[nt. 1. #Geog. IF$ Sys. 6(1):1-11.
Carver, S.J. 1991. lntegrating multi-criteria evaluation with geographical
information systems. In t. 1. cf Geog. Ir$ Sys. 5(3):321-339.
Castle III, G.H. (ed.). 1993. Pr@ting fiom a Geographical Information System. GIS
World, USA.
Cecelski, E., J. Dunkerley, and W. Ramsay. 1979. Household Energy and the Poor in the
Third World. Resources for the Future, USA.

Chambers, R 1993. Rural Datelopment: Putting the Last First. Longman Scientific and
Technical and John Wiley & Sons, UK.
Chambers, R., N.C. Saxena, and T. Shah. 1989. To the Hands of the Poor: Water and
Trees. Intermediate Tedinology Publications, UK.
Changkong, V., and Y.Y. Haimes. 1983. Multiobjective Decision Making Theo y and
Methodology. North-Holland, USA.
Charnes A., and W.W. Cooper. 1961. Manngernent Models and Industrial Applications
oJ Linear Programming. Vol. 1, John Wiley and Sons Inc., USA.
Chetty, KM., and D.K. Subramanian. 1988. Rural energy consumption patterns with
multiple objectives. Int. [. 4Energy Research 12561-567.
Chirarattananon, S. 1984. Analysis of rural energy development in Thailand, in
Rural Energy to Meef Dewlopment Needs: Asian Village Approaches. ed. M N . Islam, R.
Morse, and M.H. Soesastro, 169-240. East-West Center, Hawaii, USA.
Christensen, J.M., and R.V.V. Vidal. 1990. Project evaluation for energy supply in
rural areas of developing countries. E uropean ]oumal qf Ops. Res. 49:230-237.
Cohon, J.L. 1978. Multiobjective programrning and planning. Mathematics in Science
and Engineering. Vol. 10, Academic press, USA.
Cohon, J.L. 1985. Multicriteria programrning: brief review and application. in
Design Optimization. ed. J.S. Gero, Academic Press, USA.

Cohon, J.L., and D.H. Marks. 1975. A review and evaluation of multiobjective
programming techniques. Water Resources Research 11(2):208-220.
Conway, G.R. 1987. The properties of agroecosysterns. Agricultural Systems 24:95-
117.
Conway, GR, and J.A. McCracken. 1990. Rapid rural appraisal and agroecosystem
analysis. in Agroecology and S m l l Fann Development. ed. M.A. Atieri, and S.B. Hecht,
CRC Press, USA.
Crossland, M.D., B.E. Wynne, and W.C. Perkins. 1995. Spatial decision support
systemsm overview of tedinology and test of efficacy. Decision Support Systems
14(3):219-235.
Current, J., H. Min, and D. Schilling. 1990. Multiobjective analysis of facility
location decisions. European Journal of Ops. Res, 49:295-307.
Dayal, M. 1992. Renewable energy in India: present situation and future plans. in
Energy for Rural Development. ed. M.R. Bhagava., and S. Karekezi, 186-192. Zed
Books Ltd, UK.
Dayal, M. 1993. Renewable Energy: E nvironmen t and Developmen t . Konark Publishers
Pvt Ltd, Delhi, India.
DECORE (Development, Communications and Researdi Consultancy Group). 199 1.
"ÇoQo Economic Baseline Survey of Phewatal Watershed." submitted to Integrated
Watershed Management Project, Kathmandu, Nepal.

deLucia and Associates, Inc. (1994). "The Equitable and Efficient Energy Pricing
Study." in association with subcon~actor NO International Finland, submitted to
Asian Development Bank and Water and Energy Commission Secretariat Nepal,
USA.
Densham, P.J. 1991. Spatial decision support system, in Geographical Information
Systems: Principles and Applications. ed. D.J. Maguire, M.F. Goodchild, and D.W.
Rhind, 403-412. Vol. 1, Longman, UK.
Diamond, J.T., and J.R Wright. 1988. Decision of an integrated spatial information
system for multiobjective land-use planning. Environment and Planning B: Planning
and Design 15:205-214.
Dikson, G.W., G. Dessanctis, and D.J. McBride. 1986. Understanding the
effectiveness of computer graphics for decision support: a cumulative experimental
approach. Communications ofthe A.C.M. 1:40-57.
Dinkelbach, W., and H. Isennam. 1980. Resource allocation of an acadernic
department in the presence of multiple criteria: some experience with a modified
STEM-Method. Comput. Ops. Res. 7:99-106.
Dixon, C. 1990. Rural DeveZoprnent in the lhird World. Routledge, London, UK.
DSCWM ( D e p m e n t of Soil Conservation and Watershed Management). 1980.
"Management Plan for the htegrated Development of Phewatal Watershed (1980-
85)." FOD/NEP/74/020 Field D0cument:Phewatal Technical Report # 12, Nepal.
253
DSCWM. 1990. "Integrated Watershed Management Project of Phewatal and
Kulekhani Watersheds" Vol 1, II and III, HMG-FINNIDA Joint Project RNNEP,
Nepal.
Duckstein, L., and S. Opricovic. 1980. Muitiobjective optimization in river basin
development. Water Resources Research l6( l ) : 14-20.
Duckstein, L. 1982. Selection of a multiobjective tedinique for a water resources
problem under uncertainties. in Multiobjective Annlysis in Water Resources. ed. Y.Y.
Haimes, and D.J. Allee, 179-202. American Society of Civil Engineers, New York.
Dyer, J. 1972. Interactive Goal Programming. Management Science 1952-70.
Earl, D.E. 1975. Forest Energtj and Economic Development. Oxford University Press,
England.
Energy Research Group.1986. Energy Research, Directions and Issues for
Developing Countries. IDRC, Ottawa and United Nations University, Japan.
Engle, B.A., D.D. Jones, and T.L. Thompson. 1992. htegrating expert systems with
traditional cornputer based problem solving techniques. AI Applications in Natural
Resource Management 6 (21 :5-12.
Eom, H.B., and S.M. Lee. 1990. A survey of DSS applications (1971-Apd 1988).
Interfaces 20(3):65-79
FA0 (Food and Agriculture Organization). 1990 A New Approach to Energy Planning
for Sustainable RuraZ Development. Italy.

254
. 1992. Wood/Biomass Based Energy Systems in Rural
Industries and Village Applications: Nepal, Working paper. Thailand.
. 1993. FA0 Production Yearbook: 1992. Italy.
. 1993a. Indian Improved Cookstoves: A Compendium.
produced in collaboration with Ministry of Non-Conventional Energy Sources and
Indian Institute of Technology, New Delhi, India.
. 1994. Bioenergy for Deuelopment: Technical and
Environmental Dimensions. Italy.
Fedra, K., and R.F. Reitsma. 1990. Decision Support and Geographical hfbmation
Systems. International Institute for Applied Systems Analysis, Austria.
Fleming, W.M. 1978. "Phewatal Watershed Management Proposals. " L W.M. Project
Field Document number PRT/5.HMG/UNDP/FAO, Nepal.
Foat, K.D., G.J. Protti, and G.W. Douglas. 1981. Modelsfor Energy Policy Analysis: A
Suniey. Canadian Energy Research Institute, Canada.
Foley, G., P. Moss, and L. Timberlake. 1984. Stoves and Trees. International Institute
for Environment and Development, Earthscan, UK.
Fuller, J.D., and D. Luthra. 1990. Mode1 formulation with the Waterloo Energy
Modelling Sys tem (WATEMS). Energy: The International Journal 15(5):413-425.
Fuller, J.D., and W.T. Ziemba. 1980. A survey of some energy policy models, in

255
Enmgy Policy and Modelling: United States and Canadian Experiences. ed. W.T. Ziemba,
and S.L. Schwartz, 70-109. Vol II, Martinus Nijhoff Publications.
Gass, S.I. 1994. Public secior analysis and operations research/management science.
in Handbooks in OR & MS. ed. S.M. Pollock, R. Rothkopf, and A. Bamett, 23-46. Vol
6.
Geoffrion, A., J. Dyer, and A. Feinberg. 1972. An interactive approach for multi-
criterion optimization with an application to the operation of an academic
department. Management Science 19(4):357-368.
GGC (Gobar Gas Company). 1992. Biogas Leaflet. Kathmandu, Nepal.
Gleny, T., and J. Procter. 1992. Energy efficient lighting teduiology, in Emerging
energy Technology: Impacts and Dolicy implications. 87-105. The Royal Lnstitute of
International Affairs, Dartmouth Publishing Company Ltd., UK.
Goldemberg, J., T.B. Johansson, A.K.N. Reddy, and R.H. Williams. 1987. Energyfor
a Sustainable World., World Resources Institute, USA.
Grubb, M. 1992, Wind Energy, in Emerging Energy Technology: Impacts and Policy
Implications. 163-191. The Royal Institute of International Affairs, Dartmouth
Publishing Company Ltd, UK.
GTZ. 1992. Rural Energy Supply: Renewable mergy. Information kit, Gerrnany.
Gurung, H. 1965. Pokhara Valley: A Field Study in Regional Geography. PhD diss.,
University of Edinburgh, Edinburgh as cited in Rowbotham 1995.
256
Hairnes, Y., and W. Hall. 1974. Multiobjectives in water resources systems analysis:
the surrogate worth tradeoff method. Water Resources Reçearch 10:615.
Hd, D.O., G.W. Barnard, and P.A. Moss. 1982. Biomassfor Energy in the Developing
Countries: Cuvent Role, Potential, Problems and Prospects. Pergamon press, UK.
Hamson, P. 1979. The curse of the tropics. New Scientist 22:602-603.
Hegazi, A. 1992. Renewable energy development in north Africa. in Energyfor Rwnl
Deuelopmenl. ed M.R. Bhagavan, and S. Karekezi, 127-143. Zed Books Ltd, UK.
Heng, X. 1985. Wind energy resources and their utilization, in Rural Energy Planning
in China and Other Deueloping Countries of Asia. ed. D. Bajracharya, 70-77. FAO,
Rome.
W, R, P. O'Keefe, and C. Snape. 1995. The Futitre qf Energy Use. St. Martins Press,
New York.
Hills, P. 1988. Integrated energy planning and its extension to rural energy
planning. in Asian and Pacifie Experiences: Rural Energy Planning. ed. K Y . Ramani,
31-42. APDC/GTZ. Malaysia.
Hosier, R., P. O'Keefe, D. Weiner, and D. Shakow. 1982. Energy Manning in
developing contries: Blunt axe in a forest of problems?. Ambio 11(4):180-287.
Hwang, C., and A.S.M. Masud. 1979. Multiple Objective Decision Making Methods And
Applicaf ions. Springer Verlag, Berlin.
ICIMOD (International Centre for Mountain Research and Development). 1992.
Applications uf GIS f ir Natural Resources Management in Dhading District, Nepal.
Kathmandu, Nepal.
. 1994. Application 4 GIS to Rurd DeveZopment PIanning in Nepal.
Ka thmandu, Nepal.
Impat, P. 1981. "Hydrometeorology and sediment data for Phewatal Watershed:
1979 data." HMG/UNDP/FAO, IWM Project FOD/NEP/74/020, M'M/PTR #15,
Nepal.
Inversin, A.R. 1986. Micro-Hydropower Source Book: A Practical Guide to Design and
lmplementation in Developing Colt nt ries. NRECA International Foundation, USA.
IWMP (Integrated Watershed Management Project). 1980. "Management Plan for
the lntegrated Development of Phewatal Watershed (l98O-l985)."
FOD/NEP/74/020, IWM/PTR # 12, Nepal.
. 1992. "Watershed Management Plan of Phewatal Watershed." rUrMP
Technical Paper nurnber 1 /W2 , FINNIDA-Joint Venture FINNEP, Nepal.
Jankowski, P., and L. Richard. 1994. Integration of GIS based suitability analysis
and multioiteria evaluation in a spatial decision support system for route selection.
Environment and Planning B: Planning and Design 21:323-340.
Janssen, R, and M. Herwijen. 1991. Graphical decision support applied to decision
changing the use of agricultural land. in Proceedings, Multiple Criteria Decision
Support, ed. P . Korhonen, A. Lewandouski, and J. Wallenius, 293-302. Springer-
Verlag.
258
Janssen, R 1992. Mdtiobjective Decision Support for Environmental Management.
Environment and Management. Vol 2, Muwer Academic Publishers, The Netherlands.
Jiapao, T., and L. Cheng-xian. 1985. Rural resources in rural China and their
utiliza tion, in Rural Energy Planning in China and Other DeveZoping Cou nt ries $Asin.
ed..D. Bajracharya, 44-53. FAO, Rome.
Johnson, K.M. 1990. Geoprocessing and geographic information system hardware
and software: looking toward the 1990s. in GISfor Urban and Regional Planning. ed.
H.J. Scholten, and J.C.H. Stillwell, 215-227. Kluwer Academic Publishers, The
Netherlands.
Johnson, L.E., and D.P. Loucks. 1980. Interactive multiobjective planning using
cornputer graphies. Comput. Ops. Res. 7239-97.
Joshi, B., T.S. Bhatti, N.K. Bansal, K. Rijal, and P.D. Grover. 1991. Decentralized
energy planning model for optimum resource allocation with a case study of the
domestic sector of rurals in Nepal. Inf. J. oJEnergy Res. 15:71-78.
Kontoes, C., G.G. Wilkinson, A. Bwil, S. Goffredo, and J. Megier. 1993. An
experirnental system for the integration of GIS data in knowledge based image
analysis for remote sensing of agriculture. Int. J. Geog. Ir$ Sys. 7(3):247-262.
Kopsidas, G.C. 1995. Multiobjective analysis of table olive preparation systems,
European Journal of Ops. Res. 85:383-398.
Korhonen, P., A. Lewandowski, and J. Wallenius. 1991. MuZtiple Criteria Decisior1
Support. Springer Verlag, Berlin.
259
Korhonen, P. 1992. Multiple aiteria decision support: the state of research and
future directions. Compuf. Op. Res. 19(7):549-557.
Kreglewski, T., J. Granat, and A.P. Wierzbicki. 1991. [AC-DIDAS-N A Dynamic
hferacfive Decision Analysis and Support Systm for Multicriteria Analysis of Nonlinear
Models, Vol 40, IISA, Austria.
Kreyszig, E . 1993. Advanced Engineering Mafhematics. John Wiley and Sons, USA.
Lanfear, K.J. 1989. Editorial: Geographical information systems and water resources
applications. Water Resources Bulletin 25(3):v-vi.
Leach, GA. 1988. Residential energy in the Third World. Annual Review uf Energy.
13:47-65.
Lee, S.M. 1972. Goal Programming and Decision AnaZysis. AUERBACH Publisher Inc,
USA.
Lerninen, K. 1991. "Phewatal Siltation S w e y : Base Line Data and the First Results
1990-1991." IWMP Technical Paper number 2/ 1991, IWMP (FINNIDA-Joint
Venture FINNEF), Nepal.
Lerninen, K. 1991a. "Land use of Phewatal Watershed." IWMP Technical Paper
number 3/1991, IWMP (FINNIDA-Joint Venture FINNEF), Nepal.
Liebman, J. 1976. %me simple-rninded observations on the role of optimization in
public systems decision making. Interfaces 6(4):102-108.

260
Loudcs, D. 1995. Developing and ïmplementing decision support systems: a critique
and a challenge. Water Resources Bullefin 31(4):571-582.
Luhanga, M.L., M.J. Mwandosya, and P.R. Luteganya. 1993 Optimization in
computerized energy modelling in Tanzania. Energy l8( l l ) : l l ï l - l l79 .
Macualey, M., M. Naimuddin, and P.C. Agarwal. 1989. Fuelwood use in urban
areas: a case study of Raipur India. The Energy Jo~~rnal10(3):137-180.
Magnouni, S.E., and N. Triechel. 1994. A multicriterion approach to groundwater
management. Wafer Resources Research. 30(6):1881-1895.
Maguire, D.J. 1991. An overview and definition of GIS, in Geopphical lnfomation
System: Principles and Applications. ed. D.J. Maguire, M.F. Goodchild, and D.W.
Rhind, 9-20. Vol. 1. Longrnan, England.
Maikhwi, RK., and A.K. Gangwar. 1991. Fuelwood use by different tribal and non-
tribal comrnunities in North-East India. Naturd Resources Forum lS(2): 162-165.
Malik, SB., P.S. Satsangi, S.C. Tripathy, and R. Balasubramanian. 1994.
Mathematical mode1 for energy planning of rural India. [nt. 1. of Energy Research
18(4)469-482.
Margh, S. 1967. Public Investment Criteria. MIT Press, Cambridge, Massachusetts,
USA.
Masera, O.R., and G.S. Dutt. 1991. A thermodynamic analysis of energy needs: a
case sîudy in a Mexican village. EnergyThe International Journal 16(4):763-769.

26 1
Milington, A C , Critchley, R.W., Douglas, T.D., and Ryan, P. 1994. Eslimating
Woody Biomass in Çub-Çaharan Africa. The World Bank, Washington D.C.
MNR and CISM (Mlliistry of Natural Resources and The Canadian lnstitute of
Surveying and Mapping). 199 1. Geogrnphic Information Sysfems Seminar. Canada.
MOFSC (Ministry of Forests and Soi1 Conservation). 1987. "Master Plan for
Forestry Sector: Nepal." His Majesty's Govemment of Nepal, Kathmandu.
Monarchi, D., C. Disiel, and L. Duckstein. 1973. Interactive mdtiobjective
programming in water resources:a case stud y. Water Resources Research 9(4):837-850.
Morse, R., D. Bajracharya, C.J.P. Colfer, B. Gills, and M. Wulfe. 1984. Converting
rural energy needs to opportunities. in Rural Energy to Meef Dmelopment Needs,
Asian Village Approach. ed. M.N. Islam, R Morse, and M.H. Soesastro, 519-547, East-
West Center, USA.
Moss, RP., and W.B. Morgan. 1981. Fuelwwd and Rural Energy Production and Supply
in the Humid Tropics. published for the United Nations University, Japan by Tycooly
International Publishing Ltd, UK.
Munasinghe, M. 1985. Energy Pricing and Demand Management. Westview Press.
Munasinghe, M., and P. Meier.1993. Energy Policy Analysis and Modelling.
Cambridge University Press, UK.
Mwandosya, M.J., and M.L. Luhanga. 1993. Energy and Development in Tanzania.
Energy Policy 21(5):441-453.
262
Negi, S.S. 1994. Forests and Forestry in Nepal. Ashish Publishing House, New DeK.
Nijkamp, P., P. Tietveld, and H. Voogd. 1990. Multicriteria Evaluation in Physical
Planning. North HoIIand, Amsterdam.
Nippon K w i Co. Ltd. 1976. "Phewa Dam Recortstmction Project, Study and Design
Report." HMG/UNDP, Nepal. (as cited in Rowbotham 1995).
Nisanka, S.K., and M.K. Misra. 1990. Ecological study of an Indian village
ecosystem. B iomass 23:165-178.
Njiti, CF., and D.M. Sharpe. 1994. A goal programming approach to the
management of competition and conflict among land uses in the tropics: the
Carneroon example. Ambio 23(2):112-119.
NPC (National Plaruiing Commission). 1995. "Perspective Energy Plan for Nepal.
Vol. 1, Vol. II, and IIL" submitted to National Planning Commission, Kathmandu,
Nepai.
Pachauri, RK. 1990. Energy efficiency in developing countries: policy options and
the poverty dilemma. Naturaf Resources Forum 14(4):19-325.
Pandey, M.R, RP. Neupane, A Gautam, and LB. Shrestha. 1990. The effectiveness
of srnokeless stoves in reducing indoor air pollution in a rural hi11 region of Nepal.
Mountain Research and Development 10(4):313-320.
Periera, H.C. 1983. Landuse policy and practice in Hirnalayan watersheds. in
Proceedings qf the Fourth Agricu[tural Sector Symposium, 360 pp. The World Bank,
Washington D.C.
263
Peuquet, D.J., and D.F. Marble (ed.). 1990. Introductory Readitzgs in Geographic
Information Systems. Taylor and Francis, UK.
Planning Service. 19û4. Philippine rural energy resource and consumption survey.
in Asian and Pacifk Experiences: Rural Energy Planning. ed. K.V. Ramani,135-168.
APDC/GTZ, Malaysia.
Pokharel, R.K., and R.P. Yadav. 1991. Application uf Biogas Technology in Nepal:
Problems and Prospectus. ICIMOD, Kathmandu.
Pokharel, S. 1988. An Evaluation $Rice Husks Densfication Technology in Nepal. Water
and Energy Commission Secretanat, Kathmandu, Nepal.
Pokharel, S. 1990. Micro hydropower development in Nepal. Industrial and Rural
Power Production Volume II. Asian hstitute of Technology, Bangkok, Thailand.
Pokharel, S. 1992. "Energy Analysis of Cooking in Developing Nations. " Master's
Thesis, University of Waterloo, Ontario, Canada.
Pokharel, S., M. Chandrashekar, and J.B. Robinson. 1990. Biogas potential and
implementation issues in Ne pal. Journal of Engineering for In terna tional Developmen t
1(1):45-56.
Pokharel, S., M. Chandrashekar, and J.B. Robinson. 1992. Inter fuel and intemode
substitution for cookùig. EnergyThe International ]ournal17(10):907-918.
Pokharel, S., and M. Chandrashekar. 1995. Analysis of cooking energy in
developing counhies. Natural Resources Fontrn 19(4):331-337.
Pokharel, S., and M. Chandrashekar. 1996a. "Integrated nual energy decision
support" Paper presented at the Expert Group Workshop on Decision Support System
for Sustainable Datelopment workshop arranged b y International Institute for
Software Teduiology/United Nations University, Feb 28-Mardi 8, 1996, Macau
(proceedings being made by International Development Research Centre, Canada).
Pokharel, S., and M. Chandrashekar. 1996b. Decision support for mral energy
planning. In proceedings Sustainable Enmgy and Environmental Technology (79-21 June
1996, Singapore), ed. P.F. Greenfield, C.Y. Liu, J.H.Tay, G.Q. Lu, A.C. Lua, and K.C.
Toh. World Scientific, Singapore.
Raj, D. 1972. The Design o fSmple Sumeys. McGraw-Hill Book Company, USA.
Ramakumar, R, P.S. Shetty, and K. Ashenay. 1986. A linear programrning approach
to the design of an integrated renewable energy systems for developing countries.
E E E Transactions on Energy Conversion EC-1(4):18-24.
Ramanathan, R, and L.S. Ganesh. 1993. A multi-objective programrning approach
to energy resources allocation problems. Int. 1. of Energy Research 17:105-119.
1994. A multi-objective analysis of cooking energy alternatives.
EnergyThe International Journal 19(4):469-478.
Ramani, K.V. 1988. Planning frarnework, in Asian and PacFc Experiences: Rural
Energy Planning. ed. K Y . Ramani, 3-12. APDC/GTZ, Malaysia.
Ramsay, W.J.M. 1987. Sediment Production and Transport in the Phewa Valley. In
P m . @the Corvallis Symposium: Erosion and Sedimentation in the Pacflc Rim. Aupst

1987, IAHS Publ. no. 165:461-472.
Rhind, D. 1992. The next generation of geographical information systems and the
context in which they will operate. Cornpufer, Environmenful und Urban Systems
161261-268.
Rijal, K., and S.S. Graham. 1987. "An evaluation of alternative energy technologies. "
Water and Energy Commission Seaetariat, Kathmandu.
Romahn, B. 1988. Renewable energy supply assessrnent in Botswana, in Asian and
Pacqîc Experiences: Rural Energy Planning. ed. K.V. Ramani, 208-222. APDC/GTZ,
Malaysia.
Rowbotham, D. 1995. Applying a GIS to the Modelling $Regional Slope Stabilify in
Phewa fa1 Watershed, Nepal. FhD d i s . University of Waterloo, Canada.
Roy, B. 1971. Problems and Methods with Multiple Objective Functions.
Mathematical Prograrnrning 1(2):239-266.
SAIC (Science Application International Corporation) and New ERA. 1992.
"Environmental Protection Study of Phewa Lake Nepal, hception Report. " Report
prepared for Asian Development Bank, Philippines (ADB TA No. 1663-NEP).
Çanterre, M.T. 19û4. Finanaal and reçource analysis of anaerobic digestion (biogas)
systems, in Rural Energy fo Meet Development Needs, Asian Village Approach. ed. M.N.
Islam, R. Morse, and M.H. Soesastro, 415-471. Westview Press, USA.

266
Sathaye, J., and S. Meyers. 1985. Energy use in cities of the developing countries.
Annual Review of Energy 10: 109-133.
Sathaye, J., and S. Tyler. 1991. Transitions in household energy use in urban China
India, The Philippines, Thailand, and Hong Kong. Annual Review of- Energy 16:295-
335.
Scharge, L. 1986. Linear, lnteger and Quadratic Programrning with L1NDO.The
Scientific Press, California.
Schoolmaster, F.A., and P.G. M m . 1992. Geographical information systems as a tool
water use data management. Water Resources Bulletin 28(2):331-336.
Shaddady, C.A. (ed.). 1983. The Use of0rganic Residues in Rural Communities. United
Nations Universiîy, Tokyo.
Shah, ICS. 1988. Rural energy programme/project data in India. in Asian and Pacjfc
Expm'ences: Rural Energy Planning. ed. KY. Ramani, 97- 109. APDC/GTZ, Malaysia.
Sharma, C.K. 1988. Natwral Hazards and Man-Made lmpacts in the Nepal Himalaya.
published b y Pushpa Sharma, Kathmandu.
çhamia, S.N. 1985. Energy pricing in Nepal. in Criteriafor Energy Pricing Policy. ed.
C.M. Siddayao. East-West Center, Graham and Trotman, USA.
Shin, W.S., and A. Ravindran. 1991. Interactive multiple objective optimization
survey 1 - continuous case. Cornput. Ops. Res.18(1):97-114.

Shrestha, M.K. 1988. Rural energy technology diffusion in Nepd. in Asian and PacrfTc
E.rperiences: Rural Energy Planning. ed. KV. Ramani, 273279, APDC/GTZ, Malaysia.
Shrestha, R.L.J. 1985. Incentives and distribution of benefiis in community foresq:
the case of Nepal. in Comrnunity Forest ry: Lessons Learned From Case S f udies in Asian
and Pacec Region. ed. Y.S. Rao, N.T. Vergara, M.W. Hoskins, and C.P. Castro, 87-
101. FAO, Bangkok.
Simon, H.A. 1957. A behavioral mode1 of rational choice. in Models $Man: Social
and Rationai; Mathonatical Essays on Rational Hrtman Behaviour in a Social Çetting, 241-
260. Wiley, New York.
Sinha, C.S. 1994. Renewable energy programmes in India. Natural Resources Forum
18(3):213-224.
Sinha, C.S., and T.C. Kandpal. 1991a. Optimal mk of energy technologies for rural
India: the cooking sector. Int. 1. oJEnergy Res. 15:85-100.
Sinha, C.S., and T.C. Kandpal. 1991b. Optimal mix of energy technologies for mral
India: the irrigation sector. [nt. 1. of Energy Res. 15:331-346.
Sinha, CS., and T.C. Kandpal. 1991~. Optimal mix of energy technologies for mral
India: the lighting sector. [nt. J. ofEnergy Res. 15653665.
Sinha, C.S., and T.C. Kandpal. 1992. Optimal mix of energy technologies for rural
India: the cooking, imga tion, and lighting sectors. In t . 1. uf Energy Res. l6:ll9-127.

268
Sinha, CS, R.P. Venkata, and V. Joshi. 1994. Rural energy planning in hdia:
designing effective intervention strategies. Exergy Policy 22(5) 403-414.
Smith, KR, M.G. Apte, M. Yuqing, W. Wongsekiarttirat, and A. Kulkarni. 1994. Air
Pollution and The Energy Ladder In Asian Cities. Energy 19(5):587-600.
SMRS (Surveys, Mapping and Remote Sensing). 1994. The Canadian Conference on
GIS: Proceedings. Vol. 1 and 2. Natural Resources Canada, Ottawa, Canada.
Soesastro, M.H. 1984. Policy analysis of m a l household energy needs in West Java.
in Rural Energy to Meet Deuelopment Needs: Asian Village Approach. ed. M.N. Islam,
R. Morse, and M.H. Soesastro, 89-134. East-Wcjt Center, USA.
Solarex Corporation. 1992. World Design Insolation (map). USA.
Soskos, Y., D.K. Despotis, and M. Ghediri. 1994. Multiobjective modelling for
regional agricultural planning: case shidy in Tunisia. European Journal $Op. Res.
?7:375-391.
Srinivasm, R., and P. Balachandra. 1993. Micro-level energy planning in India: a
case study of Bangalore North Taluk. [nt. 1. of Energy Research. 17621-632.
Stanskury, J., W. Woldt, 1. Bogardi, and A. Bleed. 1991. Decision support system for
water bans fer evaluation, Wa fer Resources Research 27(4):443-45 1.
Steuer, RE. 1986. Multiple Criteria Optimimization: Theory, Cornpu fation and Applications.
Wiley, New York.

269
Stout, B.A., C.A. Myers, A. Hurand, and L.W. Faidley. 1979. Energyfor World
Agriculture. FAO, Rome.
Suwal, P.N. 1992. Wood based energy system in rural industries and village
applications. in Wood/Biornass Based Energy Systems in Rural Industries and Village
Application Nepal Working Paper,(l-1)-(1-38). FAO, Bangkok.
TER1 (Tata Energy Research Institute). 1992. "Developing Methodology for Rural
Energy Planning at the District ~evel ." subrnitted to the Department of Non-
conventional Energy Sources, New Deihi, India.
Tingsabadh, C. 1988. Decision flows in the system. in Asian and Paczfïc Experiences:
Rural Energy Planning. ed. K.V. Ramani. 24-30. APDC/GTZ, Malaysia.
Tiwari, V.K. 1995. Planning support systems: an application to service development
in Mysore district India. Regional Development Dialogue 16(1):53-68.
Tufte, E.R. 1990. Envisioning Information. Graphics Press, Connecticut.
United Nations. 1982. Energy Modelling Studies and Conservation. Pergamon Press,
USA
. 1984. Updated Guidebook on Biogas Development. Bangkok, Thailand.
. 1987. Energy Statistics: D+nitions, Unifs ofMeasure and Conversion Factors.
New York.

270
. 1989. Energy Issues and Options for Developing Countries. Taylor and
Francis, USA.
. 1990. Energy Balances and Electricity Prgles 1988. New York.
. 1991. Concise Report on the World Popdation Situations in 1989 with a Special
Report on Population Trends and Policies in Least Deueloped Countries. New York.
1993, The Least Developed Countries 1992 Report, New York.
UNU/IIST (The United Nations University / International Institute for Software
Technology). 1996. Expert Group Workshop on Decision Support Systemfür Sustainable
Developmen f. Macau.
Van der Meulen, G.G. 1992. Geographical information system and decision system.
Compter, Environmental and Urban Systems 16:187-193.
Watson, P.M., and RA. Wadsworth. 1996. A computerised decision support system
for rural policy planning, Int. j. geog. iqf sys. 10(4):425-440.
WCED (The World Commission on Environment and Development). 1991. Our
Cornmon Future. Oxford University Press, US.
WECS (Water and Energy Commission Secretariat). 1984. "Solar Energy
Availability in Nepal." His Majesty's Govemment of Nepal, Kathmandu.
. 1987. "Fuelwood supply in districts of Nepal." Ministry of Water
Resources, His Majesty's Govemment of Nepal, Kathmandu.

27 1
. 1987a. "Energy Sector Synopsis Report: 1985/86." Ministry of Water
Resources, His Majesty's Govemment of Nepal, Kathmandu, Nepal.
1993a. "Energy Reso.urce and Consumption Profile of the Western
Development Region." Minisby of Water Resources, His Majesty's Government of
Nepal, Kathmandu, Nepal.
. 1993b. "Energy Resource and Consumption Profile of the Eastern
Development Region." Ministry of Water Resources, His Majesty's Govemment of
Nepal, Kathmandu, Nepal.
. 1994. "Energy Resource and Consumption Profile of the Central
Development Region." Ministry of Water Resources, His Majesty's Govemment of
Nepal, Kathrnandu, Nepal.
. 1994a, "Energy Sector Synopsis Report 1992/93." Ministry of Water
Resources, His Majesty's Govemment of Nepal, Kathmandu, Nepal.
. 1996, "Energy Resource and Consumption Profile of the Far-Western
Development Region." Ministry of Water Resources, His Majesty's Govemment of
Nepal, Kathmandu, Nepal.
Wierzbicki, A. 1983. A mathematical basis for satisfihg decision making.
Ma thema tical Modelling 3:391-405.
Wyatt-Smith, J. 1982. The agriculture system in the hills of Nepal: The rebis of
agricultural land to forest land and the problem of animal fodder. Agricultural
Projects Services Centre Occasional Paper No 1, cited in WECS 1987.

Yeh, A.G. 1991. The development and applications of geographical information
system for urban and regional planning in the developing countries. Int. 1. Geog.
1$. Sys. 5(1):5-27.
Yeh, A. 1996. "Geographical information systems in deasion support system for
sustainable development" Paper presented at the Expert Group Workshop on Decision
Support Systemfor Sustainable Development, 23 pp. UNU/IIST, Macau.
Yu, P. 1973. A class of decisions for group decision problems. hfmagement Science
19(8):936-946.
Yu, P. 1985. Multiple Criteria Decision Making: Concepts, Techniques and Extensions.
Plenum Press, New York.
Zeieny, M. 1974. Linear Multiobjective Programrning. Springer-Verlag, Germany.
Zeleny, M. 1982. Multiple Criteria Decision Making. McGraw Hill, New York.
Zheng, F. 1993. A mode1 of the energy supply and demand system at the village
Ievel. Energy: The Infernational Journal 18(4):365-369.
Zhu, H., M.R. Brarnbley, and R.P. Morgan. 1984. Household energy consumption
in The People's Republic of China. EnergyThe International Journal 8(10):763-774.
Zionts, S. 1992. Some thoughtç on research in multiple criteria decision making.
Comput. Ops. Res. 19(7):567-570.
Related Documents