MOLECULAR AND CELLULAR BIOLOGY, 0270-7306/99/$04.0010 May 1999, p. 3278–3288 Vol. 19, No. 5 Copyright © 1999, American Society for Microbiology. All Rights Reserved. Insulin Receptor Isoform A, a Newly Recognized, High-Affinity Insulin-Like Growth Factor II Receptor in Fetal and Cancer Cells F. FRASCA, 1 G. PANDINI, 1 P. SCALIA, 1 L. SCIACCA, 1 R. MINEO, 1 A. COSTANTINO, 1 I. D. GOLDFINE, 2 A. BELFIORE, 3 AND R. VIGNERI 1 * Istituto di Medicina Interna, Malattie Endocrine e del Metabolismo, University of Catania, Ospedale Garibaldi, 95123 Catania, 1 and Cattedra di Endocrinologia, University of Catanzaro, Policlinico Mater Domini, Catanzaro, 3 Italy, and Division of Diabetes and Endocrine Research, University of California, San Francisco, California 94115 2 Received 22 September 1998/Returned for modification 25 October 1998/Accepted 25 January 1999 Insulin-like growth factor II (IGF-II) is a peptide growth factor that is homologous to both insulin-like growth factor I (IGF-I) and insulin and plays an important role in embryonic development and carcinogenesis. IGF-II is believed to mediate its cellular signaling via the transmembrane tyrosine kinase type 1 insulin-like growth factor receptor (IGF-I-R), which is also the receptor for IGF-I. Earlier studies with both cultured cells and transgenic mice, however, have suggested that in the embryo the insulin receptor (IR) may also be a receptor for IGF-II. In most cells and tissues, IR binds IGF-II with relatively low affinity. The IR is expressed in two isoforms (IR-A and IR-B) differing by 12 amino acids due to the alternative splicing of exon 11. In the present study we found that IR-A but not IR-B bound IGF-II with an affinity close to that of insulin. Moreover, IGF-II bound to IR-A with an affinity equal to that of IGF-II binding to the IGF-I-R. Activation of IR-A by insulin led primarily to metabolic effects, whereas activation of IR-A by IGF-II led primarily to mitogenic effects. These differences in the biological effects of IR-A when activated by either IGF-II or insulin were associated with differential recruitment and activation of intracellular substrates. IR-A was preferentially expressed in fetal cells such as fetal fibroblasts, muscle, liver and kidney and had a relatively increased proportion of isoform A. IR-A expression was also increased in several tumors including those of the breast and colon. These data indicate, therefore, that there are two receptors for IGF-II, both IGF-I-R and IR-A. Further, they suggest that interaction of IGF-II with IR-A may play a role both in fetal growth and cancer biology. Insulin-like growth factors I and II (IGF-I and IGF-II) are related peptides with homology to the hormone insulin. In most cells, IGFs are major growth factors whereas insulin predominantly regulates glucose uptake and cellular metabo- lism. It is widely believed that IGF-I and IGF-II exert their effects through the type 1 IGF receptor (IGF-I-R), a trans- membrane protein with high homology to the insulin receptor (IR) (55). IGF-II also binds to the mannose-6-phosphate re- ceptor. This receptor is involved in the transport of lysosomal enzymes, is believed to act as a degradation pathway for IGF- II, and has no signaling activity for cell growth (58). However, there is evidence suggesting that under certain conditions, IGF-II may signal via the IR. First, dwarf transgenic animals with disruption of the IGF-II gene are born more severely growth retarded than are dwarf transgenic animals with dis- ruption of the IGF-I-R gene, suggesting that IGF-II may acti- vate another receptor (27). Genetic analysis of dwarfing phe- notypes suggests that this receptor may be the IR (28). Second, in IGF-I-R-deficient mouse fibroblasts transfected with the human IR, IGF-II stimulates cell proliferation through the IR (34). However, since prior data have indicated that IGF-II binds to the IR with relatively low affinity (approximately 1% that of insulin) (45), the interaction of IGF-II with the IR remains to be clarified. The human IR exists in two isoforms, isoform A (IR-A) and isoform B (IR-B). Alternative splicing of a small exon (exon 11) of the IR gene results in two transcripts, in which 36 additional nucleotides encoding 12 amino acids (residues 718 to 729) at the carboxyl terminus of the receptor a-subunit are either excluded (Ex112 or type A insulin receptor [IR-A]) or included (Ex111 or type B insulin receptor [IR-B]) (33). The relative expression of the two isoforms varies in a tissue-spe- cific manner. IR-A is expressed predominantly in central ner- vous system and hematopoietic cells, while IR-B is expressed predominantly in adipose tissue, liver, and muscle, the major target tissues for the metabolic effects of insulin (33, 35). Small functional differences in insulin binding and IR activation have been described for these two isoforms. IR-A has a slightly higher binding affinity and IR-B has a more efficient signaling activity as evaluated by its tyrosine kinase activity and phos- phorylation of insulin receptor substrate 1 (IRS-1) (22). There- fore, the biological roles of the two IR isoforms are unknown. In this study, we have investigated how IGF-II interacts with each individual isoform of the IR (IR-A and IR-B). We now report that IGF-II binds with high affinity to and activates IR-A but not IR-B. IR-A, when activated by IGF-II, elicits predominantly mitogenic rather than metabolic effects. We also report that the relative expression of IR-A is predominant in fetal tissues and some cancers. These findings indicate that IR-A is an IGF-II receptor which plays a role in fetal growth and cancer biology. MATERIALS AND METHODS Materials. The pNTK2 expression vectors containing the cDNA for either IR-A (Ex112) or IR-B (Ex111) were kindly provided by Axel Ullrich (Munich, Germany). The pECE expression vector containing the cDNA encoding the human IGF-I-R was a gift of Richard Roth (Stanford, Calif.). * Corresponding author. Mailing address: Cattedra di Endocrinolo- gia, Ospedale Garibaldi, 95123 Catania, Italy. Phone: 39-095-32 62 90. Fax: 39-095-715 80 72. E-mail: [email protected]. 3278

Welcome message from author
This document is posted to help you gain knowledge. Please leave a comment to let me know what you think about it! Share it to your friends and learn new things together.
Transcript
MOLECULAR AND CELLULAR BIOLOGY,0270-7306/99/$04.0010
May 1999, p. 3278–3288 Vol. 19, No. 5
Copyright © 1999, American Society for Microbiology. All Rights Reserved.
Insulin Receptor Isoform A, a Newly Recognized,High-Affinity Insulin-Like Growth Factor II
Receptor in Fetal and Cancer CellsF. FRASCA,1 G. PANDINI,1 P. SCALIA,1 L. SCIACCA,1 R. MINEO,1 A. COSTANTINO,1
I. D. GOLDFINE,2 A. BELFIORE,3 AND R. VIGNERI1*
Istituto di Medicina Interna, Malattie Endocrine e del Metabolismo, University of Catania, Ospedale Garibaldi,95123 Catania,1 and Cattedra di Endocrinologia, University of Catanzaro, Policlinico Mater Domini,
Catanzaro,3 Italy, and Division of Diabetes and Endocrine Research,University of California, San Francisco, California 941152
Received 22 September 1998/Returned for modification 25 October 1998/Accepted 25 January 1999
Insulin-like growth factor II (IGF-II) is a peptide growth factor that is homologous to both insulin-likegrowth factor I (IGF-I) and insulin and plays an important role in embryonic development and carcinogenesis.IGF-II is believed to mediate its cellular signaling via the transmembrane tyrosine kinase type 1 insulin-likegrowth factor receptor (IGF-I-R), which is also the receptor for IGF-I. Earlier studies with both cultured cellsand transgenic mice, however, have suggested that in the embryo the insulin receptor (IR) may also be areceptor for IGF-II. In most cells and tissues, IR binds IGF-II with relatively low affinity. The IR is expressedin two isoforms (IR-A and IR-B) differing by 12 amino acids due to the alternative splicing of exon 11. In thepresent study we found that IR-A but not IR-B bound IGF-II with an affinity close to that of insulin. Moreover,IGF-II bound to IR-A with an affinity equal to that of IGF-II binding to the IGF-I-R. Activation of IR-A byinsulin led primarily to metabolic effects, whereas activation of IR-A by IGF-II led primarily to mitogeniceffects. These differences in the biological effects of IR-A when activated by either IGF-II or insulin wereassociated with differential recruitment and activation of intracellular substrates. IR-A was preferentiallyexpressed in fetal cells such as fetal fibroblasts, muscle, liver and kidney and had a relatively increasedproportion of isoform A. IR-A expression was also increased in several tumors including those of the breast andcolon. These data indicate, therefore, that there are two receptors for IGF-II, both IGF-I-R and IR-A. Further,they suggest that interaction of IGF-II with IR-A may play a role both in fetal growth and cancer biology.
Insulin-like growth factors I and II (IGF-I and IGF-II) arerelated peptides with homology to the hormone insulin. Inmost cells, IGFs are major growth factors whereas insulinpredominantly regulates glucose uptake and cellular metabo-lism. It is widely believed that IGF-I and IGF-II exert theireffects through the type 1 IGF receptor (IGF-I-R), a trans-membrane protein with high homology to the insulin receptor(IR) (55). IGF-II also binds to the mannose-6-phosphate re-ceptor. This receptor is involved in the transport of lysosomalenzymes, is believed to act as a degradation pathway for IGF-II, and has no signaling activity for cell growth (58). However,there is evidence suggesting that under certain conditions,IGF-II may signal via the IR. First, dwarf transgenic animalswith disruption of the IGF-II gene are born more severelygrowth retarded than are dwarf transgenic animals with dis-ruption of the IGF-I-R gene, suggesting that IGF-II may acti-vate another receptor (27). Genetic analysis of dwarfing phe-notypes suggests that this receptor may be the IR (28). Second,in IGF-I-R-deficient mouse fibroblasts transfected with thehuman IR, IGF-II stimulates cell proliferation through the IR(34). However, since prior data have indicated that IGF-IIbinds to the IR with relatively low affinity (approximately 1%that of insulin) (45), the interaction of IGF-II with the IRremains to be clarified.
The human IR exists in two isoforms, isoform A (IR-A) andisoform B (IR-B). Alternative splicing of a small exon (exon
11) of the IR gene results in two transcripts, in which 36additional nucleotides encoding 12 amino acids (residues 718to 729) at the carboxyl terminus of the receptor a-subunit areeither excluded (Ex112 or type A insulin receptor [IR-A]) orincluded (Ex111 or type B insulin receptor [IR-B]) (33). Therelative expression of the two isoforms varies in a tissue-spe-cific manner. IR-A is expressed predominantly in central ner-vous system and hematopoietic cells, while IR-B is expressedpredominantly in adipose tissue, liver, and muscle, the majortarget tissues for the metabolic effects of insulin (33, 35). Smallfunctional differences in insulin binding and IR activation havebeen described for these two isoforms. IR-A has a slightlyhigher binding affinity and IR-B has a more efficient signalingactivity as evaluated by its tyrosine kinase activity and phos-phorylation of insulin receptor substrate 1 (IRS-1) (22). There-fore, the biological roles of the two IR isoforms are unknown.
In this study, we have investigated how IGF-II interacts witheach individual isoform of the IR (IR-A and IR-B). We nowreport that IGF-II binds with high affinity to and activatesIR-A but not IR-B. IR-A, when activated by IGF-II, elicitspredominantly mitogenic rather than metabolic effects. Wealso report that the relative expression of IR-A is predominantin fetal tissues and some cancers. These findings indicate thatIR-A is an IGF-II receptor which plays a role in fetal growthand cancer biology.
MATERIALS AND METHODS
Materials. The pNTK2 expression vectors containing the cDNA for eitherIR-A (Ex112) or IR-B (Ex111) were kindly provided by Axel Ullrich (Munich,Germany). The pECE expression vector containing the cDNA encoding thehuman IGF-I-R was a gift of Richard Roth (Stanford, Calif.).
* Corresponding author. Mailing address: Cattedra di Endocrinolo-gia, Ospedale Garibaldi, 95123 Catania, Italy. Phone: 39-095-32 62 90.Fax: 39-095-715 80 72. E-mail: [email protected].
3278
Dulbecco’s modified Eagle’s medium (DMEM), fetal calf serum, glutamine,gentamicin, Lipofectamine, IGF-I, and IGF-II were obtained from Gibco Lab-oratories (Paisley, United Kingdom). N-Acetyl-D-glucosamine, bovine serumalbumin ([BSA] radioimmunoassay grade), bacitracin, phenylmethylsulfonyl flu-oride (PMSF), puromicin, and porcine insulin were obtained from Sigma Chem-ical Co. (St. Louis, Mo.). Protein A-Sepharose was obtained from Pharmacia(Uppsala, Sweden). TyrA14-125I-labeled insulin (specific activity, 13.3 MBq/mg)was kindly provided by R. Navalesi (Pisa, Italy). 125I-labeled IGF-I (specificactivity, 11.8 MBq/mg) was obtained from Dupont NEN (Dreieich, Germany).The following antibodies were used: anti-IR MA-20 monoclonal antibody, whichreacts with the a-subunit at an epitope close to the insulin binding site (12), andanti-IGF-I receptor aIR3 monoclonal antibody, which reacts with the a-subunitat residues 223 to 274 (52) (Oncogene Research, Cambridge, Mass.); anti-IRS-1and anti-IRS-2 polyclonal antibodies and antiphosphotyrosine monoclonal anti-body (UBI, Lake Placid, N.Y.); anti-Shc polyclonal antibody (Transduction Lab-oratories, Lexington, Ky.); and phosphospecific extracellular signal-related ki-nase (ERK) polyclonal antibody and anti-ERK polyclonal antibody (NewEngland Biolabs, Beverly, Mass.).
Cell cultures and tissues. NIH 3T3 and CHO cells were obtained from theAmerican Type Culture Collection, and R2 mouse fibroblasts (mouse 3T3-likecells derived from animals with a targeted disruption of the IGF-I-R gene) werekindly provided by Renato Baserga (Philadelphia, Pa.). Human dermal fibro-blasts were obtained from both fetuses at 16 to 18 weeks gestational age afterspontaneous abortion and from adult healthy volunteers. All cell types wereroutinely grown in DMEM supplemented with 10% fetal bovine serum and 1%penicillin-streptomycin. cDNAs from normal fetal and adult tissues includingliver, muscle, kidney, brain (multiple-choice cDNAs) were obtained from Ori-Gene Technologies, Inc. (Rockville, Md.). Tissue specimens from both normaland neoplastic lungs, breasts, and colons were obtained at surgery and immedi-ately stored in liquid nitrogen until processed.
Transfection experiments. Cells grown in 35-mm plates until they were 60 to70% confluent were transfected for 5 h at 37°C with the pNTK2 expressionvector containing the cDNA for either IR-A (Ex112) or IR-B (Ex111) (7) orwith the pECE expression vector containing the cDNA encoding the IGF-I-R(53, 55) by using the Lipofectamine reagent (Gibco/BRL). R2 cells were alsocotransfected with pPDV61 plasmid, which contains the puromicin resistancegene. Transfected cells were then washed twice with phosphate-buffered saline(PBS; pH 7.4), and complete medium was added. At 48 h after transfection, thecells were divided among three 100-mm petri dishes and cultured in selectivemedium containing 2.5 mg of puromicin per ml. Cell clones expressing similaramounts of IR-A, IR-B, and IGF-I R (70 to 100 ng/100 mg of protein; approx-imately 3 3 105 to 5 3 105 receptors/cell as measured by specific enzyme-linkedimmunosorbent assays [ELISAs] [42]) were selected for subsequent studies.
Binding studies. Binding studies were performed with intact cells grown toapproximately 80% of confluence and serum starved for 16 h. After two washeswith PBS, the cells were incubated in binding buffer (DMEM without sodiumbicarbonate but with 50 mM HEPES, 1% BSA, and 0.06 mg of bacitracin per ml)in the presence of increasing concentrations of unlabelled ligands and 10 pM125I-insulin. After a 16-h incubation at 4°C, the cells were washed twice with cold10 mM Tris-buffered saline, and the cell-associated radioactivity was measured.
IR autophosphorylation and activation of intracellular substrates (IRS-1,IRS-2, Shc, ERK1, and ERK2) in response to either insulin or IGF-II. (i)Preparation of whole-cell detergent lysates. Confluent cells were washed twicewith PBS (pH 7.4) and serum starved for 48 h. The cells were then treated with10 nM insulin or IGF-II for various times as indicated in the figure legends.Ligand stimulation was terminated by two washes with ice-cold PBS (pH 7.4),removal of excess liquid by aspiration, and addition of ice-cold lysis buffer (150mM NaCl, 1% Nonidet P-40, 0.5% deoxycholate, 0.1% sodium dodecyl sulfate[SDS], 50 mM Tris [pH 7.4], 10 mM sodium pyrophosphate, 100 mM NaF, 2 mMPMSF, 2 mM sodium vanadate, 1 mg of pepstatin per ml, 1 mg of aprotinin perml, 1 mg of leupeptin per ml). After being scraped, the samples were rotated for15 min at 4°C. Insoluble material was separated from soluble extract by micro-centrifugation at 10,000 3 g for 10 min at 4°C. The protein concentration wasdetermined by the Bradford assay (Bio-Rad, Hercules, Calif.).
(ii) Immunoprecipitation. Cell lysates were incubated at 4°C under constantrotation for 2 h with either 5 mg of anti-IR monoclonal antibody (MA-20), 5 mgof anti-IRS-1 and anti-IRS-2 polyclonal antibodies, and 4 mg of anti-Shc poly-clonal antibody and then incubated for 1 h with protein A-Sepharose. Theimmunoprecipitates were then eluted and subjected to SDS-polyacrylamide gelelectrophoresis and immunoblotting as described below.
(iii) Immunoblot analysis. Whole-cell lysates or the specific immunoprecipi-tates were subjected to reducing SDS-polyacrylamide gel electrophoresis oneither 7.5% acrylamide gels (IR, IRS-1, and IRS-2) or 10% acrylamide gels(ERK1, ERK2, and Shc). After electrophoresis, the resolved proteins weretransferred to nitrocellulose membranes and subjected to immunoblot analysiswith an antiphosphotyrosine monoclonal antibody. For ERK activation studies,the blots were probed with a phosphospecific ERK polyclonal antibody (NewEngland Biolabs) (40) and, after being stripped (in 100 mM Tris-HCl [pH6.7]–10% SDS–100 mM b-mercaptoethanol for 30 min at 50°C), reprobed withanti-ERK polyclonal antibody. All immunoblots were revealed by an enhancedchemiluminescence method (Amersham, Little Chalfont, United Kingdom), au-toradiographed, and subjected to densitometric analysis.
(iv) ELISA of phosphorylated IR and IRSs. Studies of IR, IRS-1, and IRS-2phosphorylation were also carried out by a specific ELISA (3, 4). Briefly, 100 mlof the cell lysates prepared as described above was immunocaptured in Maxisorpplates coated with either anti-IR, anti-IRS-1, or anti-IRS-2 antibodies (2 mg/mlin 50 mM sodium bicarbonate [pH 9.0]) overnight at 4°C. After the plates werewashed, the captured phosphorylated proteins were incubated with an antiphos-photyrosine-biotin-conjugated antibody (0.3 mg/ml in 50 mM HEPES [pH 7.6]–150 mM NaCl–0.05% Tween 20–1% BSA–2 mM sodium orthovanadate–1 mg ofbacitracin per ml–1 mM PMSF) for 2 h at 22°C and then with peroxidase-conjugated streptavidin. The peroxidase activity was determined colorimetricallyby adding 100 ml of 3,39,5,59-tetramethylbenzidine (TMB [Kirkegaard & PerryLaboratories, Gaithersburg, Md.]) at 0.4 mg/ml in 0.1 M citrate-phosphate buffer(pH 5.0) with 0.4 ml of 5% H2O2 per ml and measuring the absorbance at 451nm.
(v) In vitro IR phosphorylation. IR kinase activity was also measured insolubilized receptors. Unstimulated cell monolayers were solubilized as de-scribed above, and IR was immunocaptured in Maxisorb plates coated with theanti-IR antibody MA-20. The immunopurified receptor was then stimulated withvarious concentrations of either insulin or IGFs in the presence of ATP (10 mM),MgCl2 (10 mM), and MnCl2 (2 mM). After the plates were washed, the phos-phorylated proteins were incubated with an antiphosphotyrosine-biotin-conju-gated antibody and the reaction was detected as described above.
PI3-kinase activity measurement. Cell lysates were immunoprecipitated witheither antiphosphotyrosine or anti-IRS-1 and anti-IRS-2 antibodies. Phospho-inositide 3-kinase (PI3-kinase) activity was measured in the immunoprecipitates,as previously described (16). Briefly, the immunoprecipitates were washed twicein PBS (pH 7.4) containing 1% Nonidet P-40 and 1 mM dithiothreitol (DTT),twice in 100 mM Tris (pH 7.4) containing 500 mM LiCl2 and 1 mM DTT, andtwice with 10 mM Tris pH 7.4 containing 100 mM NaCl and 1 mM DTT and thenincubated with 0.2 mg of phosphatidylinositol and [g-33P]ATP (40 mM, 10 mCi)for 5 min. The reaction was stopped by adding 4 N HCl and CHCl3-methanol(1:1). Samples obtained from the organic phase were then separated by thin-layer chromatography on silica plates and subjected to autoradiography. Phos-phatidylinositol phosphate (PIP) spots on silica plates were cut out, and radio-activity was measured in a b-counter.
IR measurement. Fresh tissue specimens collected at surgery, carefully dis-sected by a pathologist, and immediately frozen were stored in liquid nitrogenuntil processed. Tissues were solubilized for 60 min at 4°C with 50 mM HEPESbuffer (pH 7.6) containing 1 mM PMSF and 1% Triton X-100. The solubilizedmaterial was then centrifuged at 10,000 3 g, and the supernatant was frozen at280°C until assayed. The protein content in the cellular extracts was measuredby the Bradford assay (Bio-Rad, Hercules, Calif.). IRs were captured by incu-bating cell or tissue lysates in Maxisorp immunoplates (Nunc, Roskilde, Den-mark) precoated with 2 mg of MA-20 per ml. After the plates were washed, theimmunocaptured receptors were incubated with the biotinylated anti-IR aCT-1antibody (which recognizes a different epitope from MA-20) at 0.3 mg/ml in 50mM HEPES-buffered saline (pH 7.6) containing 0.05% Tween 20, 1% BSA, 2mM sodium orthovanadate, 1 mg of bacitracin per ml, and 1 mM PMSF and thenwith peroxidase-conjugated streptavidin. The peroxidase activity was determinedcolorimetrically by adding 100 ml of TMB. The reaction was stopped by theaddition of 1.0 M H3PO4, and the adsorbance was measured at 451 nm. Theinsulin receptor content was evaluated by comparing each sample to a standardcurve. The IR standard was purified from NIH 3T3 cells transfected with thehuman IR cDNA by sequential affinity chromatography on wheat germ aggluti-nin-agarose and on agarose coupled with MA-20. The receptor concentrationwas measured by amino acid analysis (42).
RT-PCR. Reverse transcription-PCR (RT-PCR) for IR isoforms was carriedout as previously described (47) with oligonucleotide primers spanning nucleo-tides 2229 to 2250 (59-AAC-CAG-AGT-GAG-TAT-GAG-GAT-39) and 2844 to2865 (59-CCG-TTC-CAG-AGC-GAA-GTG-CTT-39) of the human IR. PCRamplification was carried out for 25 cycles of 20 s at 96°C, 30 s at 58°C, and 1.5min at 72°C in a DNA thermal cycler (Perkin-Elmer Cetus). After electrophore-sis of the PCR products, the 600- and 636-bp DNA fragments representingEx112 and Ex111 IR isoforms were analyzed by scanning densitometry andcompared to the standards. Standard preparations were made with mRNA fromNIH 3T3 cells transfected with cDNA of both IR isoforms mixed at various ratiosand coamplified by RT-PCR. To verify that larger cDNA was really the IR-Bisoform, RT-PCR products were subjected to BanI digestion. Only cDNA con-taining exon 11, the restriction site for the enzyme, was digested.
Incorporation of [3H]thymidine or 5-bromo-2*-deoxyuridine into DNA.[3H]thymidine incorporation in response to insulin or IGF-II was carried out aspreviously described (31). Cells were seeded in 24-multiwell plates and allowedto attach for 24 h. Complete medium was replaced with DMEM–0.1% BSA for48 h to allow the cells to become quiescent. Growth factors were then added atthe indicated concentrations. After 48 h, medium was removed and 0.5 mCi of[3H]thymidine per ml was added for 2 h at 37°C. The cells were washed twicewith ice-cold PBS (pH 7.4) and incubated with 1 ml of 10% ice-cold trichloro-acetic acid for 30 min. The acid-insoluble fraction was solubilized in 0.5 ml of 0.1N NaOH for 30 min at room temperature, and the incorporation of [3H]thymi-dine into DNA was determined by scintillation counting. 5-Bromo-29-deoxyuri-dine incorporation into cell nuclei, a further measurement of cell proliferation,
VOL. 19, 1999 IGF-II AND INSULIN RECEPTOR ISOFORM A 3279
was revealed by immunohistochemistry (Boehringer Mannheim), and the pro-portion of stained nuclei was scored under a microscope.
2-[3H]deoxyglucose uptake. 2-[3H]deoxyglucose uptake in response to insulinand IGF-II was carried out as previously described (30) with modifications. Cellswere seeded in 24-multiwell plates and allowed to attach for 24 h. Completemedium was replaced with DMEM–0.1% BSA–5.5 mM glucose for 48 h. Thecells were then washed three times with transport buffer (20 mM HEPES [pH7.4], 120 mM NaCl, 1.2 mM MgSO4, 2 mM CaCl2, 2.5 mM KCl, 1 mM NaH2PO4,1 mM sodium pyruvate) and incubated in this buffer for additional 90 min witheither insulin or IGF-II at the concentrations indicated in the figure legends.Glucose transport was determined by incubation on ice for 10 min with 0.1 mM2-deoxyglucose (4.0 mCi/ml; Amersham). Glucose transport was terminated byrapid removal of the buffer containing the radiolabeled glucose analogue andrepeated washing with cold PBS, and cell-associated radioactivity was measuredafter cell monolayer solubilization with 0.1 N NaOH for 30 min at room tem-perature and scintillation counting.
Statistical analysis. Growth curves and 2-deoxyglucose incorporation in re-sponse to either insulin or IGF-II were compared by two-way analysis of vari-ance. The proportions of nuclei labeled by bromodeoxyuridine in response toeither insulin or IGF-II were compared by the use of contingency tables (x2 test).Statistical analysis was carried out with GraphPad software (Prism, London,United Kingdom).
RESULTS
IGF-II binds with high affinity and activates the tyrosinekinase activity of IR-A but not IR-B. To study the interactionof IGF-II with the IR isoforms, we used IR-transfected R2
cells. R2 cells are mouse fibroblasts that are derived fromanimals with a targeted disruption of the IGF-I-R gene andthus do not express the IGF-I receptor (49). In addition, R2
cells, like NIH 3T3 fibroblasts, have low levels of the IR (ap-proximately 5 3 103 receptors/cell or less). To study the spe-cific interaction of IGF-II with each IR isoform, R2 cells weretransfected with either IR-A or IR-B human cDNA, and ap-proximately 5 3 105 receptors/cell were obtained. These engi-neered models, in which only one human IR isoform is present,allowed the direct examination of the interaction of IGF-IIwith each individual IR isoform.
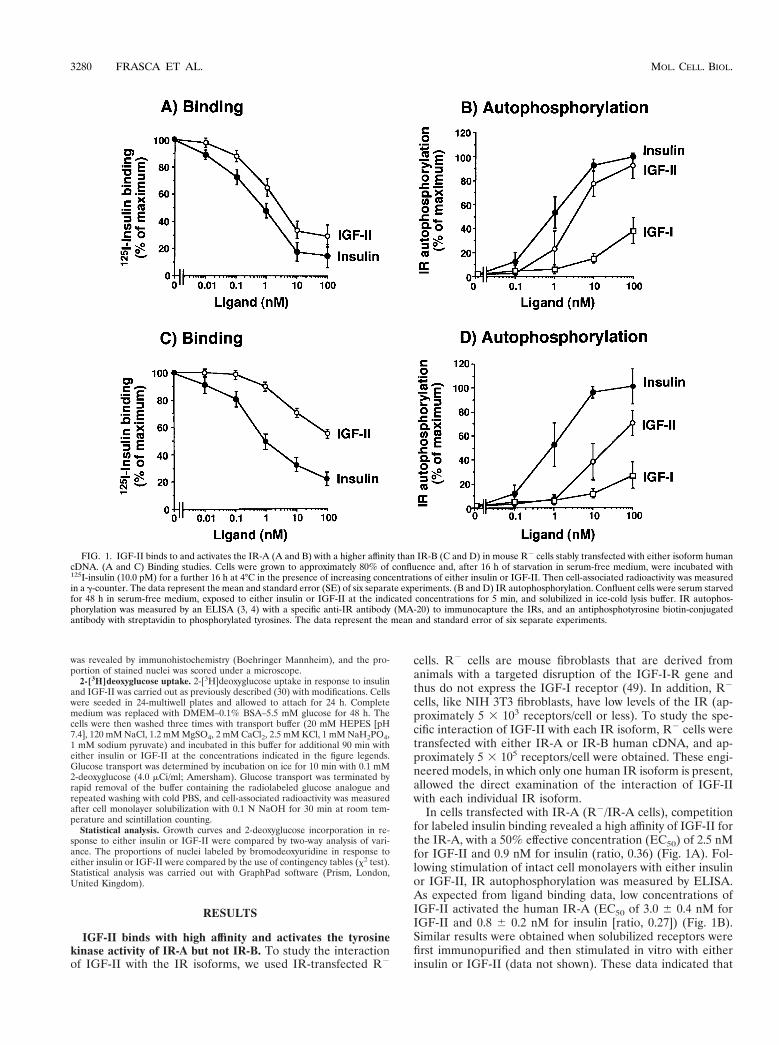
In cells transfected with IR-A (R2/IR-A cells), competitionfor labeled insulin binding revealed a high affinity of IGF-II forthe IR-A, with a 50% effective concentration (EC50) of 2.5 nMfor IGF-II and 0.9 nM for insulin (ratio, 0.36) (Fig. 1A). Fol-lowing stimulation of intact cell monolayers with either insulinor IGF-II, IR autophosphorylation was measured by ELISA.As expected from ligand binding data, low concentrations ofIGF-II activated the human IR-A (EC50 of 3.0 6 0.4 nM forIGF-II and 0.8 6 0.2 nM for insulin [ratio, 0.27]) (Fig. 1B).Similar results were obtained when solubilized receptors werefirst immunopurified and then stimulated in vitro with eitherinsulin or IGF-II (data not shown). These data indicated that
FIG. 1. IGF-II binds to and activates the IR-A (A and B) with a higher affinity than IR-B (C and D) in mouse R2 cells stably transfected with either isoform humancDNA. (A and C) Binding studies. Cells were grown to approximately 80% of confluence and, after 16 h of starvation in serum-free medium, were incubated with125I-insulin (10.0 pM) for a further 16 h at 4°C in the presence of increasing concentrations of either insulin or IGF-II. Then cell-associated radioactivity was measuredin a g-counter. The data represent the mean and standard error (SE) of six separate experiments. (B and D) IR autophosphorylation. Confluent cells were serum starvedfor 48 h in serum-free medium, exposed to either insulin or IGF-II at the indicated concentrations for 5 min, and solubilized in ice-cold lysis buffer. IR autophos-phorylation was measured by an ELISA (3, 4) with a specific anti-IR antibody (MA-20) to immunocapture the IRs, and an antiphosphotyrosine biotin-conjugatedantibody with streptavidin to phosphorylated tyrosines. The data represent the mean and standard error of six separate experiments.
3280 FRASCA ET AL. MOL. CELL. BIOL.
IR-A activation by IGF-II was an intrinsic property of thereceptor and not the result of either interfering factors on thecell membrane or IGF-II binding proteins.
In contrast to results obtained with R2/IR-A cells, in R2
cells transfected with IR-B (R2/IR-B cells) IGF-II inhibitedlabeled insulin binding with a low affinity (EC50 of .20.0 nMfor IGF-II and 1.0 nM for insulin) (Fig. 1C). Similarly, in thesecells IGF-II activated IR-B autophosphorylation with approx-imately 5% the potency of insulin. This effect was observed inboth intact cells and solubilized receptors (Fig. 1D). Theseresults indicated that human IR-A (but not IR-B) is a high-affinity receptor for IGF-II.
Similar results in IR autophosphorylation were obtainedwhen the two IR isoforms were also first transfected into eitherCHO cells or NIH 3T3 fibroblasts and then stimulated witheither insulin or IGF-II and the IR isoform autophosphoryla-tion was measured (Table 1). In contrast to IGF-II, IGF-I hadlow affinity for both IR isoforms.
IGF-II binds to and activates IR-A and IGF-I-R with asimilar affinity. Because IGF-I-R is considered the physiolog-ical receptor for IGF-II, we compared the relative activity ofIGF-II in binding to and stimulating the autophosphorylationof either IR-A or IGF-I-R. We transfected R2 cells with eitherIR-A or IGF-I-R cDNAs and found that they expressed asimilar number of receptors (approximately 5 3 105 IRs/celland 3.5 3 105 IGF-I-Rs/cell). Binding studies were then car-ried out to evaluate the ability of IGF-II to compete with eitherlabeled insulin (in R2/IR-A cells) or labeled IGF-I (in R2/IGF-I-R cells). Competition/inhibition curves indicated thatthe EC50 of IGF-II was 2.5 6 0.5 nM for IR-A and 2.0 6 0.4nM for IGF-I-R. We next evaluated the ability of IGF-II tostimulate receptor autophosphorylation in the same cells. TheEC50 was 3.0 6 0.4 nM for IR-A and 2.5 6 1.0 nM for IGF-I-R(Table 1), indicating a very similar affinity of IGF-II for the tworeceptors. Similar results were obtained with CHO cells trans-fected with the same cDNAs: the EC50 of IGF-II was 3.8 6 2.8nM for IR-A and 3.8 6 0.4 nM for IGF-I-R autophosphory-lation (Table 1).
IGF-II interactions with IR-A are primarily mitogenic,whereas insulin interactions are primarily metabolic. The twoligands, insulin and IGF-II, induce different biological effectsin target tissues, although a certain degree of overlap in theiractions is well recognized (25). In general, insulin is importantfor metabolic activities whereas IGF-II is important for cellgrowth and survival. This difference in the biological effects hasbeen previously attributed to ligand interaction with differentreceptors, i.e., insulin with IR and IGF-II with IGF-I-R.
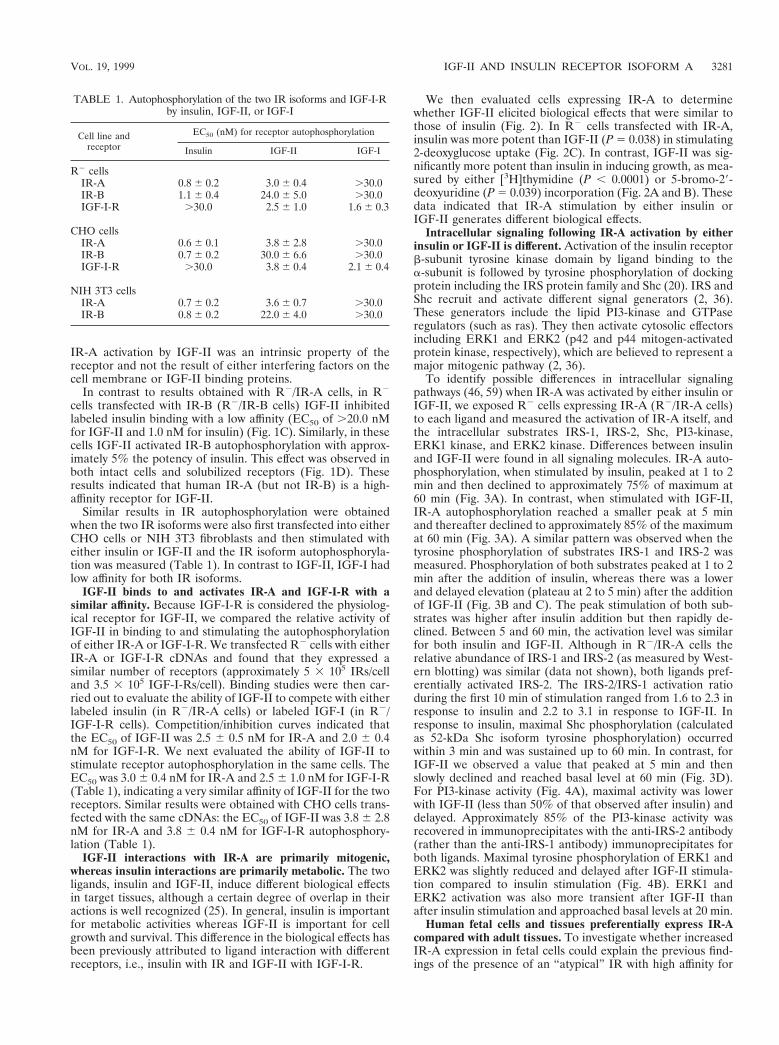
We then evaluated cells expressing IR-A to determinewhether IGF-II elicited biological effects that were similar tothose of insulin (Fig. 2). In R2 cells transfected with IR-A,insulin was more potent than IGF-II (P 5 0.038) in stimulating2-deoxyglucose uptake (Fig. 2C). In contrast, IGF-II was sig-nificantly more potent than insulin in inducing growth, as mea-sured by either [3H]thymidine (P , 0.0001) or 5-bromo-29-deoxyuridine (P 5 0.039) incorporation (Fig. 2A and B). Thesedata indicated that IR-A stimulation by either insulin orIGF-II generates different biological effects.
Intracellular signaling following IR-A activation by eitherinsulin or IGF-II is different. Activation of the insulin receptorb-subunit tyrosine kinase domain by ligand binding to thea-subunit is followed by tyrosine phosphorylation of dockingprotein including the IRS protein family and Shc (20). IRS andShc recruit and activate different signal generators (2, 36).These generators include the lipid PI3-kinase and GTPaseregulators (such as ras). They then activate cytosolic effectorsincluding ERK1 and ERK2 (p42 and p44 mitogen-activatedprotein kinase, respectively), which are believed to represent amajor mitogenic pathway (2, 36).
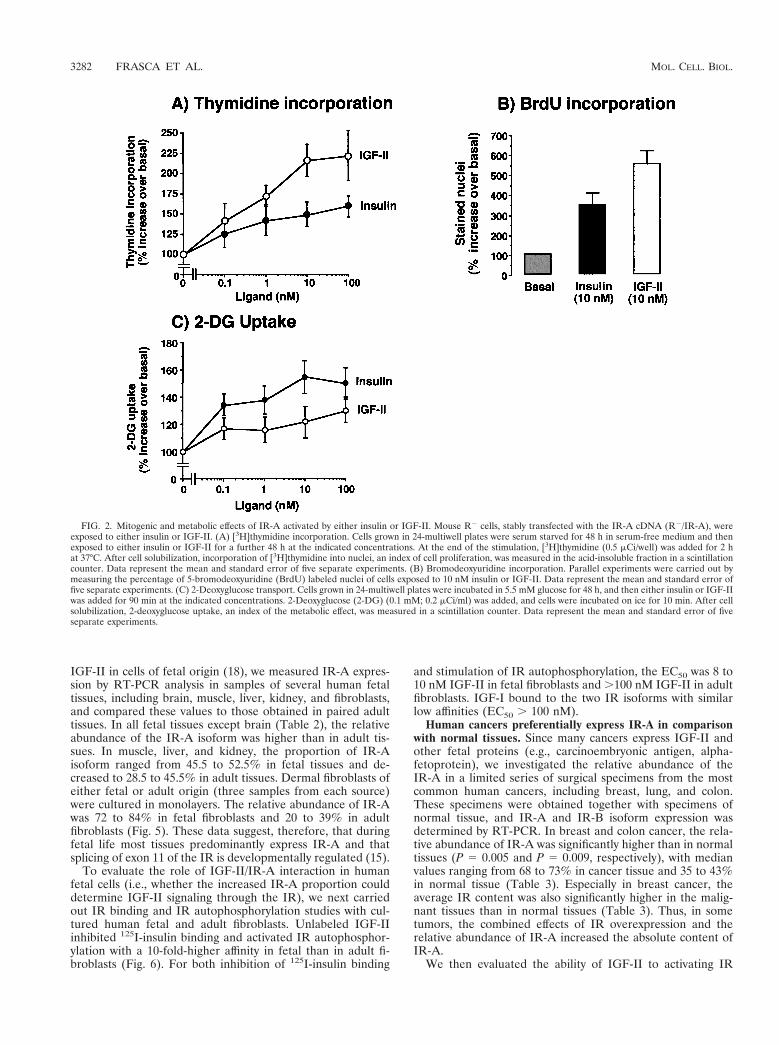
To identify possible differences in intracellular signalingpathways (46, 59) when IR-A was activated by either insulin orIGF-II, we exposed R2 cells expressing IR-A (R2/IR-A cells)to each ligand and measured the activation of IR-A itself, andthe intracellular substrates IRS-1, IRS-2, Shc, PI3-kinase,ERK1 kinase, and ERK2 kinase. Differences between insulinand IGF-II were found in all signaling molecules. IR-A auto-phosphorylation, when stimulated by insulin, peaked at 1 to 2min and then declined to approximately 75% of maximum at60 min (Fig. 3A). In contrast, when stimulated with IGF-II,IR-A autophosphorylation reached a smaller peak at 5 minand thereafter declined to approximately 85% of the maximumat 60 min (Fig. 3A). A similar pattern was observed when thetyrosine phosphorylation of substrates IRS-1 and IRS-2 wasmeasured. Phosphorylation of both substrates peaked at 1 to 2min after the addition of insulin, whereas there was a lowerand delayed elevation (plateau at 2 to 5 min) after the additionof IGF-II (Fig. 3B and C). The peak stimulation of both sub-strates was higher after insulin addition but then rapidly de-clined. Between 5 and 60 min, the activation level was similarfor both insulin and IGF-II. Although in R2/IR-A cells therelative abundance of IRS-1 and IRS-2 (as measured by West-ern blotting) was similar (data not shown), both ligands pref-erentially activated IRS-2. The IRS-2/IRS-1 activation ratioduring the first 10 min of stimulation ranged from 1.6 to 2.3 inresponse to insulin and 2.2 to 3.1 in response to IGF-II. Inresponse to insulin, maximal Shc phosphorylation (calculatedas 52-kDa Shc isoform tyrosine phosphorylation) occurredwithin 3 min and was sustained up to 60 min. In contrast, forIGF-II we observed a value that peaked at 5 min and thenslowly declined and reached basal level at 60 min (Fig. 3D).For PI3-kinase activity (Fig. 4A), maximal activity was lowerwith IGF-II (less than 50% of that observed after insulin) anddelayed. Approximately 85% of the PI3-kinase activity wasrecovered in immunoprecipitates with the anti-IRS-2 antibody(rather than the anti-IRS-1 antibody) immunoprecipitates forboth ligands. Maximal tyrosine phosphorylation of ERK1 andERK2 was slightly reduced and delayed after IGF-II stimula-tion compared to insulin stimulation (Fig. 4B). ERK1 andERK2 activation was also more transient after IGF-II thanafter insulin stimulation and approached basal levels at 20 min.
Human fetal cells and tissues preferentially express IR-Acompared with adult tissues. To investigate whether increasedIR-A expression in fetal cells could explain the previous find-ings of the presence of an “atypical” IR with high affinity for
TABLE 1. Autophosphorylation of the two IR isoforms and IGF-I-Rby insulin, IGF-II, or IGF-I
Cell line andreceptor
EC50 (nM) for receptor autophosphorylation
Insulin IGF-II IGF-I
R2 cellsIR-A 0.8 6 0.2 3.0 6 0.4 .30.0IR-B 1.1 6 0.4 24.0 6 5.0 .30.0IGF-I-R .30.0 2.5 6 1.0 1.6 6 0.3
CHO cellsIR-A 0.6 6 0.1 3.8 6 2.8 .30.0IR-B 0.7 6 0.2 30.0 6 6.6 .30.0IGF-I-R .30.0 3.8 6 0.4 2.1 6 0.4
NIH 3T3 cellsIR-A 0.7 6 0.2 3.6 6 0.7 .30.0IR-B 0.8 6 0.2 22.0 6 4.0 .30.0
VOL. 19, 1999 IGF-II AND INSULIN RECEPTOR ISOFORM A 3281
IGF-II in cells of fetal origin (18), we measured IR-A expres-sion by RT-PCR analysis in samples of several human fetaltissues, including brain, muscle, liver, kidney, and fibroblasts,and compared these values to those obtained in paired adulttissues. In all fetal tissues except brain (Table 2), the relativeabundance of the IR-A isoform was higher than in adult tis-sues. In muscle, liver, and kidney, the proportion of IR-Aisoform ranged from 45.5 to 52.5% in fetal tissues and de-creased to 28.5 to 45.5% in adult tissues. Dermal fibroblasts ofeither fetal or adult origin (three samples from each source)were cultured in monolayers. The relative abundance of IR-Awas 72 to 84% in fetal fibroblasts and 20 to 39% in adultfibroblasts (Fig. 5). These data suggest, therefore, that duringfetal life most tissues predominantly express IR-A and thatsplicing of exon 11 of the IR is developmentally regulated (15).
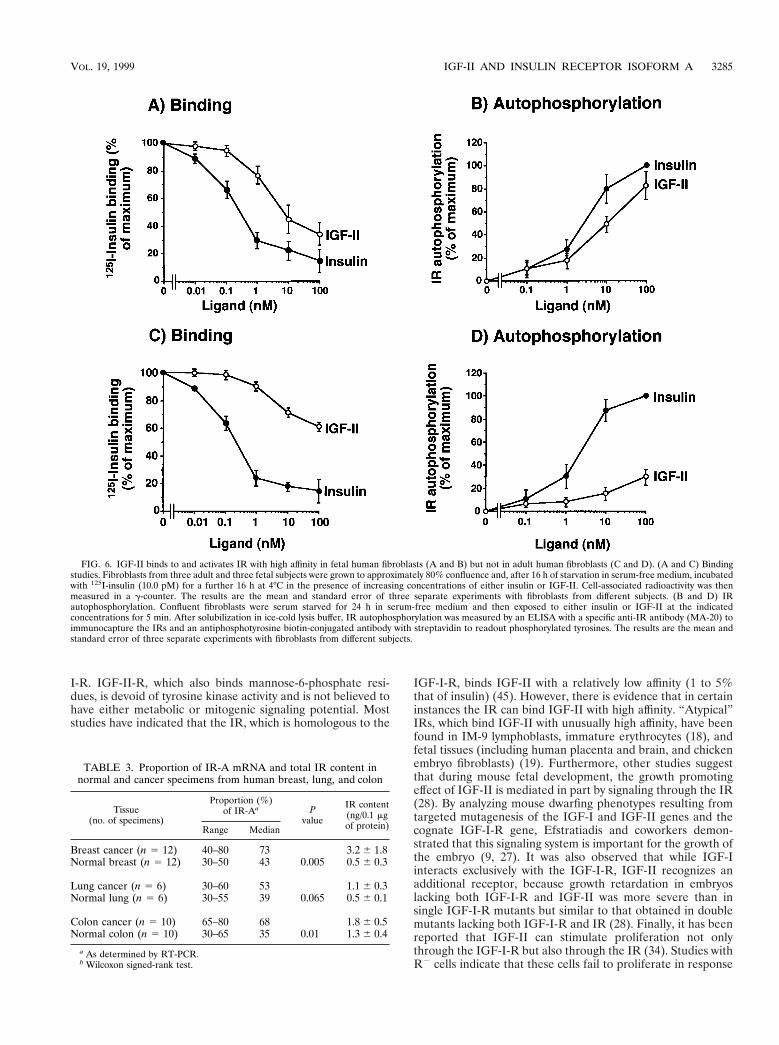
To evaluate the role of IGF-II/IR-A interaction in humanfetal cells (i.e., whether the increased IR-A proportion coulddetermine IGF-II signaling through the IR), we next carriedout IR binding and IR autophosphorylation studies with cul-tured human fetal and adult fibroblasts. Unlabeled IGF-IIinhibited 125I-insulin binding and activated IR autophosphor-ylation with a 10-fold-higher affinity in fetal than in adult fi-broblasts (Fig. 6). For both inhibition of 125I-insulin binding
and stimulation of IR autophosphorylation, the EC50 was 8 to10 nM IGF-II in fetal fibroblasts and .100 nM IGF-II in adultfibroblasts. IGF-I bound to the two IR isoforms with similarlow affinities (EC50 . 100 nM).
Human cancers preferentially express IR-A in comparisonwith normal tissues. Since many cancers express IGF-II andother fetal proteins (e.g., carcinoembryonic antigen, alpha-fetoprotein), we investigated the relative abundance of theIR-A in a limited series of surgical specimens from the mostcommon human cancers, including breast, lung, and colon.These specimens were obtained together with specimens ofnormal tissue, and IR-A and IR-B isoform expression wasdetermined by RT-PCR. In breast and colon cancer, the rela-tive abundance of IR-A was significantly higher than in normaltissues (P 5 0.005 and P 5 0.009, respectively), with medianvalues ranging from 68 to 73% in cancer tissue and 35 to 43%in normal tissue (Table 3). Especially in breast cancer, theaverage IR content was also significantly higher in the malig-nant tissues than in normal tissues (Table 3). Thus, in sometumors, the combined effects of IR overexpression and therelative abundance of IR-A increased the absolute content ofIR-A.
We then evaluated the ability of IGF-II to activating IR
FIG. 2. Mitogenic and metabolic effects of IR-A activated by either insulin or IGF-II. Mouse R2 cells, stably transfected with the IR-A cDNA (R2/IR-A), wereexposed to either insulin or IGF-II. (A) [3H]thymidine incorporation. Cells grown in 24-multiwell plates were serum starved for 48 h in serum-free medium and thenexposed to either insulin or IGF-II for a further 48 h at the indicated concentrations. At the end of the stimulation, [3H]thymidine (0.5 mCi/well) was added for 2 hat 37°C. After cell solubilization, incorporation of [3H]thymidine into nuclei, an index of cell proliferation, was measured in the acid-insoluble fraction in a scintillationcounter. Data represent the mean and standard error of five separate experiments. (B) Bromodeoxyuridine incorporation. Parallel experiments were carried out bymeasuring the percentage of 5-bromodeoxyuridine (BrdU) labeled nuclei of cells exposed to 10 nM insulin or IGF-II. Data represent the mean and standard error offive separate experiments. (C) 2-Deoxyglucose transport. Cells grown in 24-multiwell plates were incubated in 5.5 mM glucose for 48 h, and then either insulin or IGF-IIwas added for 90 min at the indicated concentrations. 2-Deoxyglucose (2-DG) (0.1 mM; 0.2 mCi/ml) was added, and cells were incubated on ice for 10 min. After cellsolubilization, 2-deoxyglucose uptake, an index of the metabolic effect, was measured in a scintillation counter. Data represent the mean and standard error of fiveseparate experiments.
3282 FRASCA ET AL. MOL. CELL. BIOL.
FIG. 3. Time courses of IR-A phosphorylation and post-receptor protein phosphorylation of IRS-1, IRS-2, and Shc in mouse R2 cells transfected with IR-A cDNAand exposed to either insulin or IGF-II. Confluent cells were serum starved for 48 h in serum-free medium, exposed to 10 nM either insulin or IGF-II for the indicatedtimes, and solubilized in lysis buffer. After protein quantitation, aliquots were used for ELISA and Western blot measurements. (A) IR autophosphorylation wasquantitated by a specific ELISA (top) and detected by Western blotting (bottom). Monoclonal antibody MA-20 was used to immunocapture phosphorylated IR. (B)IRS-1 phosphorylation was measured by a specific ELISA (top) and detected by Western blotting (bottom). A polyclonal anti-IRS-1 antibody was used toimmunocapture phosphorylated IRS-1. (C) IRS-2 phosphorylation was quantitated by a specific ELISA (top) and detected by Western blotting (bottom). A polyclonalanti-IRS-2 antibody was used to immunocapture phosphorylated IRS-2. (D) The 52-kDa Shc isoform phosphorylation was detected by Western blotting (bottom) andquantitated by densitometric scanning with Adobe Photoshop and NIH Image software (top). A polyclonal anti-Shc antibody was used to immunocapture phosphor-ylated Shc. Tyrosine phosphorylation of these proteins was revealed by using an antiphosphotyrosine (anti-PY) antibody biotin conjugated for the ELISAs. The toppanels show the mean and standard error of three separate experiments (except for Shc, where five experiments were carried out); the bottom panels show arepresentative experiment of three (five for Shc). IP, immunoprecipitation.
3283
autophosphorylation in cancer tissues and compared thesedata with those obtained for normal tissues. IRs were immu-nopurified from tissue lysates by adsorption to Maxisorb platesprecoated with MA-20 antibody and stimulated with eitherinsulin or IGF-II at different concentrations. IR autophosphor-ylation was then measured as described in Materials and Meth-ods. The IGF-II potency (data not shown), calculated as thepercentage of insulin ED50 relative to the IGF-II ED50 forstimulation of IR autophosphorylation, was correlated with theproportion of IR-A expression (r 5 0.51, P 5 0.001; Spearmanrank correlation).
These observations indicated that in some cancers, locally
produced IGF-II may bind to and activate the IR with highaffinity. This may be biologically relevant when IR is overex-pressed and IR-A is the predominant isoform.
DISCUSSION
The present study demonstrates that IR-A is a physiologicalreceptor for IGF-II. Previously it was believed that most, if notall, biological effects of IGF-II in cells were mediated by IGF-
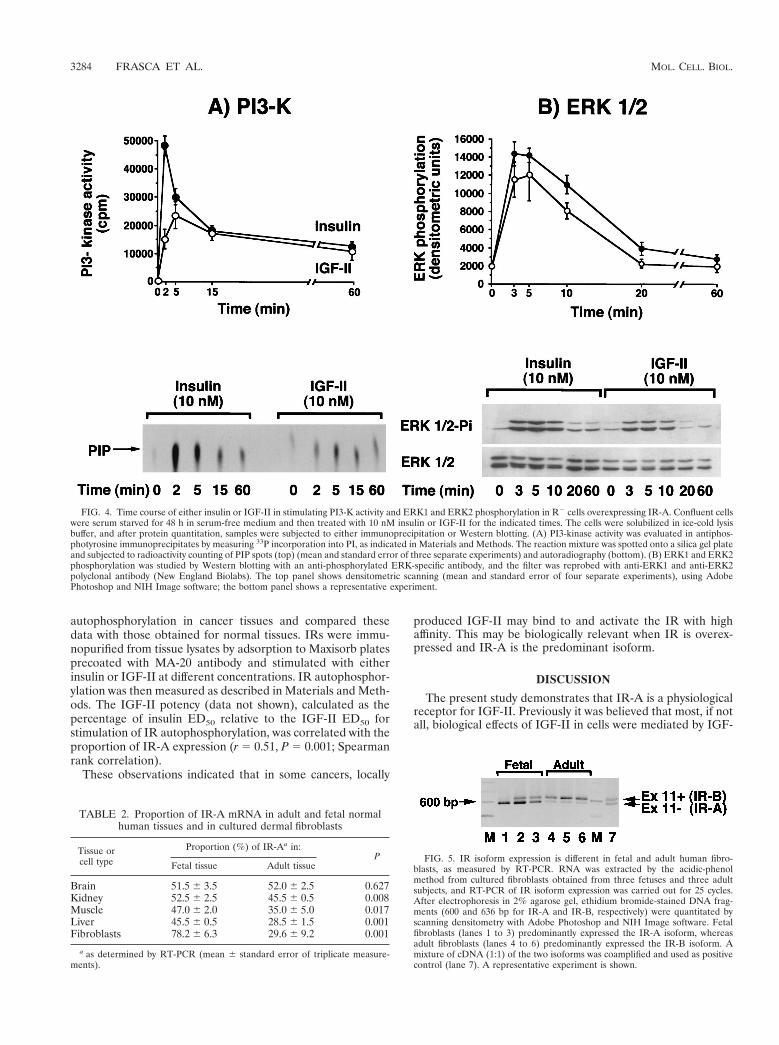
FIG. 4. Time course of either insulin or IGF-II in stimulating PI3-K activity and ERK1 and ERK2 phosphorylation in R2 cells overexpressing IR-A. Confluent cellswere serum starved for 48 h in serum-free medium and then treated with 10 nM insulin or IGF-II for the indicated times. The cells were solubilized in ice-cold lysisbuffer, and after protein quantitation, samples were subjected to either immunoprecipitation or Western blotting. (A) PI3-kinase activity was evaluated in antiphos-photyrosine immunoprecipitates by measuring 33P incorporation into PI, as indicated in Materials and Methods. The reaction mixture was spotted onto a silica gel plateand subjected to radioactivity counting of PIP spots (top) (mean and standard error of three separate experiments) and autoradiography (bottom). (B) ERK1 and ERK2phosphorylation was studied by Western blotting with an anti-phosphorylated ERK-specific antibody, and the filter was reprobed with anti-ERK1 and anti-ERK2polyclonal antibody (New England Biolabs). The top panel shows densitometric scanning (mean and standard error of four separate experiments), using AdobePhotoshop and NIH Image software; the bottom panel shows a representative experiment.
FIG. 5. IR isoform expression is different in fetal and adult human fibro-blasts, as measured by RT-PCR. RNA was extracted by the acidic-phenolmethod from cultured fibroblasts obtained from three fetuses and three adultsubjects, and RT-PCR of IR isoform expression was carried out for 25 cycles.After electrophoresis in 2% agarose gel, ethidium bromide-stained DNA frag-ments (600 and 636 bp for IR-A and IR-B, respectively) were quantitated byscanning densitometry with Adobe Photoshop and NIH Image software. Fetalfibroblasts (lanes 1 to 3) predominantly expressed the IR-A isoform, whereasadult fibroblasts (lanes 4 to 6) predominantly expressed the IR-B isoform. Amixture of cDNA (1:1) of the two isoforms was coamplified and used as positivecontrol (lane 7). A representative experiment is shown.
TABLE 2. Proportion of IR-A mRNA in adult and fetal normalhuman tissues and in cultured dermal fibroblasts
Tissue orcell type
Proportion (%) of IR-Aa in:P
Fetal tissue Adult tissue
Brain 51.5 6 3.5 52.0 6 2.5 0.627Kidney 52.5 6 2.5 45.5 6 0.5 0.008Muscle 47.0 6 2.0 35.0 6 5.0 0.017Liver 45.5 6 0.5 28.5 6 1.5 0.001Fibroblasts 78.2 6 6.3 29.6 6 9.2 0.001
a as determined by RT-PCR (mean 6 standard error of triplicate measure-ments).
3284 FRASCA ET AL. MOL. CELL. BIOL.
I-R. IGF-II-R, which also binds mannose-6-phosphate resi-dues, is devoid of tyrosine kinase activity and is not believed tohave either metabolic or mitogenic signaling potential. Moststudies have indicated that the IR, which is homologous to the
IGF-I-R, binds IGF-II with a relatively low affinity (1 to 5%that of insulin) (45). However, there is evidence that in certaininstances the IR can bind IGF-II with high affinity. “Atypical”IRs, which bind IGF-II with unusually high affinity, have beenfound in IM-9 lymphoblasts, immature erythrocytes (18), andfetal tissues (including human placenta and brain, and chickenembryo fibroblasts) (19). Furthermore, other studies suggestthat during mouse fetal development, the growth promotingeffect of IGF-II is mediated in part by signaling through the IR(28). By analyzing mouse dwarfing phenotypes resulting fromtargeted mutagenesis of the IGF-I and IGF-II genes and thecognate IGF-I-R gene, Efstratiadis and coworkers demon-strated that this signaling system is important for the growth ofthe embryo (9, 27). It was also observed that while IGF-Iinteracts exclusively with the IGF-I-R, IGF-II recognizes anadditional receptor, because growth retardation in embryoslacking both IGF-I-R and IGF-II was more severe than insingle IGF-I-R mutants but similar to that obtained in doublemutants lacking both IGF-I-R and IR (28). Finally, it has beenreported that IGF-II can stimulate proliferation not onlythrough the IGF-I-R but also through the IR (34). Studies withR2 cells indicate that these cells fail to proliferate in response
FIG. 6. IGF-II binds to and activates IR with high affinity in fetal human fibroblasts (A and B) but not in adult human fibroblasts (C and D). (A and C) Bindingstudies. Fibroblasts from three adult and three fetal subjects were grown to approximately 80% confluence and, after 16 h of starvation in serum-free medium, incubatedwith 125I-insulin (10.0 pM) for a further 16 h at 4°C in the presence of increasing concentrations of either insulin or IGF-II. Cell-associated radioactivity was thenmeasured in a g-counter. The results are the mean and standard error of three separate experiments with fibroblasts from different subjects. (B and D) IRautophosphorylation. Confluent fibroblasts were serum starved for 24 h in serum-free medium and then exposed to either insulin or IGF-II at the indicatedconcentrations for 5 min. After solubilization in ice-cold lysis buffer, IR autophosphorylation was measured by an ELISA with a specific anti-IR antibody (MA-20) toimmunocapture the IRs and an antiphosphotyrosine biotin-conjugated antibody with streptavidin to readout phosphorylated tyrosines. The results are the mean andstandard error of three separate experiments with fibroblasts from different subjects.
TABLE 3. Proportion of IR-A mRNA and total IR content innormal and cancer specimens from human breast, lung, and colon
Tissue(no. of specimens)
Proportion (%)of IR-Aa P
value
IR content(ng/0.1 mgof protein)Range Median
Breast cancer (n 5 12) 40–80 73 3.2 6 1.8Normal breast (n 5 12) 30–50 43 0.005 0.5 6 0.3
Lung cancer (n 5 6) 30–60 53 1.1 6 0.3Normal lung (n 5 6) 30–55 39 0.065 0.5 6 0.1
Colon cancer (n 5 10) 65–80 68 1.8 6 0.5Normal colon (n 5 10) 30–65 35 0.01 1.3 6 0.4
a As determined by RT-PCR.b Wilcoxon signed-rank test.
VOL. 19, 1999 IGF-II AND INSULIN RECEPTOR ISOFORM A 3285
to growth factors (49). However, when cells are transfectedwith and overexpress the IR, they are able to grow in serum-free medium supplemented with either insulin or IGF-II butnot with IGF-I (32). In these studies, however, the IR isoformused was not reported.
In the present study, employing R2 cells transfected witheither IR-A or IR-B cDNAs, we were able to investigate theinteraction of IGF-II with the two IR isoforms without inter-ference by the IGF-I-R. We observed that while IGF-I boundwith low affinity to both IR isoforms. IGF-II was bound byIR-A with relatively high affinity (30 to 40% that of insulin).We also found that IR-A but not IR-B was autophosphoryl-ated by IGF-II with a similar high affinity. The same resultswere obtained by using either intact cells or solubilized recep-tors, indicating that they resulted from an intrinsic character-istic of IR-A and not from the presence of other cellularfactors. By using R2 cells transfected with the IGF-I-R cDNA,we observed that the affinity of IGF-II for IR-A was verysimilar to its affinity for IGF-I-R.
The reason why IR-A binds IGF-II with a higher affinitythan does IR-B is unknown. Recent studies have suggestedthat the major insulin binding determinants reside within thefirst 468 amino acids and residues 704 to 716 of the IR mole-cule (24). However, the 12 carboxyl-terminal amino acids (ami-no acids 718 to 729, encoded by exon 11) may influence ligandbinding, since IR-A binds insulin with a slightly higher affinitythan does IR-B (60). It is possible that these 12 C-terminalamino acids hinder IGF-II binding to IR-B. Structural analysisof IR binding sites by X-ray crystallography with IR fragmentsdiffering in either the presence or absence of the 12 aminoacids encoded by exon 11 should provide a better understand-ing of the different binding affinity of IGF-II for the two IRisoforms.
Of major interest is the observation that in R2 cells express-ing IR-A, IGF-II (in contrast to insulin) predominantly elicitedmitogenic effects. Although the predominant effects of IR ac-tivation by insulin are metabolic, there is evidence that mito-genic effects may also be elicited (10, 25, 31, 34). In R2/IR-Acells, when glucose transport was studied, insulin had a greatereffect on this metabolic function than did IGF-II. In contrast,when thymidine incorporation was studied, IGF-II had agreater effect than insulin. The specificity of a receptor signal-ing may be regulated in different ways. The IR, like othertyrosine kinase receptors, interacts with a number of intracel-lular signaling molecules. After autophosphorylation, the IRphosphorylates docking proteins like IRS-s and Shc (2, 20, 36).These proteins then activate downstream signaling pathways,including PI3-kinase, ERK1, and ERK2 (2, 36). When weanalyzed these docking proteins and signaling pathways, weobserved quantitative and temporal differences when IR-A wasactivated by either insulin or IGF-II. Both IRS-1 and the Shcpathways were less intensely and more transiently activatedafter IGF-II than after insulin stimulation; these data do notsupport the possibility that these pathways are responsible forthe increased mitogenic effect of IGF-II unless one hypothe-sizes that a more transient activation of certain substrates (e.g.,ERK) may lead to a more mitogenic signal, as previouslysuggested (39, 54, 57). Alternatively, it is possible that otherpathways (e.g., ras) are involved. However, these observationsindicate that a site of selectivity for metabolic versus mitogenicsignaling may occur at the ligand binding domain. Similarobservations have already been reported for other receptors,such as the epidermal growth factor receptor (26). Also in thiscase, different ligands may elicit different receptor activationand postreceptor signaling (21). It is also known that insulinanalogs with different binding properties may affect both sig-
naling specificity and the timing of events downstream of re-ceptor binding (17, 50).
Also, our studies in humans indicate that, as in mice (1, 15,18, 22), IR isoform expression is regulated by development.When we examined human fetal tissues and compared therelative prevalence of IR-A in these tissues with respect to thatin adult tissues, we observed a clear shift from IR-A to IR-B inmuscle, liver, and kidney. In human cultured fetal fibroblasts,the relative expression of IR-A was higher than in adult fibro-blasts. As in R2 cells expressing IR-A, human fetal fibroblastsIGF-II bound to the IR with high affinity and had potent effectsin stimulating IR autophosphorylation.
IR isoform expression is also regulated by differentiation(15, 22). Many cancer cells dedifferentiate and acquire a morefetal phenotype, expressing proteins and antigens typical offetal cells. In the small series of tumors reported herein, wefound that IR-A is the predominant isoform in breast andcolon cancers but not in the corresponding normal tissues. Onaverage, the total IR protein content was also increased inthese cancers. In tumors that predominantly expressed IR-A,IGF-II was a relatively potent activator of the IR. Varioustumor cells express IGF-II. The preferential IR-A expressionin certain cancers may therefore activate an autocrine/para-crine loop whenever IGF-II is locally produced.
We have recently confirmed these data in a larger series ofbreast carcinomas and in cultured breast cell lines and haveobserved that a proportion of these cancer tissues and cellsalso express IGF-II (48). In these conditions, IGF-II is consid-ered to be a major factor for cancer cell proliferation andsurvival via autocrine or paracrine pathways. Further studiesare needed to ascertain whether other cancers, including thosetypically expressing large quantities of IGF-II (e.g., rhabdomy-osarcomas, adrenal cancers, and Wilms’ tumors) (6, 8, 37, 38,41, 51, 56, 61, 62) also overexpress IR-A.
The molecular mechanisms involved in the developmentaland differentiation regulation of the alternative splicing pro-cess of the IR gene are not clear. It has recently been reportedthat specific regions in intron 10 and exon 11 of the IR gene areinvolved in this process (23). In studies carried out with HepG2human hepatoma cells, which differentiate and predominantlyexpress IR-B after stimulation with glucocorticoids (22), bothsplicing enhancer sequences and inhibitory regions have beenidentified in intron 10 and splice site selection sequences havebeen identified in the IR gene exon 11 (23). Modified alterna-tive splicing for a variety of proteins has been found in prolif-erating cells and in cancer cells. In these models, the change inthe splicing pattern of pre-mRNAs occurs simultaneously witha change in the expression level of splicing factors of the SRfamily of phosphoproteins which bind pre-mRNA very earlyduring spliceosome assembly and determine the 59-splice-sitechoice during the splicing reaction. SR protein activity is mod-ulated by antagonist proteins, such as heterogeneous ribo-nucleoproteins: a predominance of these heterogeneous ribo-nucleoproteins favors distal 59-splice-site choices and exonskipping (29). The opposite occurs with increased SR levels.Intracellular factors (like cyclic AMP) (44) and extracellularconditions (like pH) (5, 14) are also known to influence thealternative splicing pattern of different proteins. The regula-tors of IR gene exon 11 skipping are not known and need to beinvestigated, since they enable the IR gene to encode receptorprotein isoforms with different functions.
In conclusion, the present study demonstrates that the IRisoform A is a physiological receptor for IGF-II and explainsboth the previously described data with “atypical” IRs withhigh-affinity IGF-II binding (18, 19, 34) and the role of the IRin fetal development (11, 28). Also, the present findings may
3286 FRASCA ET AL. MOL. CELL. BIOL.
shed new light on the role of the IR in cancer biology. IRs areoften overexpressed in cancer cells (13, 31, 43), and the prev-alent expression of IR-A may provide a selective growth ad-vantage to malignant cells in tumors that also produce IGF-II.
ACKNOWLEDGMENTS
We thank R. Baserga for mouse R2 cells, A. Ullrich for IR isoformexpression vectors, and R. A. Roth for the IGF-I-R expression vector.
L. Sciacca is a recipient of a fellowship from Associazione ItalianaRicerca sul Cancro (AIRC, Italy). These studies were supported by agrant from AIRC and by the University of Catania, Ministerodell’Universita e della Ricerca Scientifica e Tecnologica (MURST ex40%, N. 1271, Italy), and in part also by the J. Kerner Foundation, theJ. Gershow Cancer Research Fund, and the Ladies Auxiliary of Vet-erans of Foreign Wars.
REFERENCES
1. Alexandrides, T., A. C. Moses, and R. J. Smith. 1989. Developmental ex-pression of receptors for insulin, insulin-like growth factor I (IGF-I), andIGF-II in rat skeletal muscle. Endocrinology 124:1064–1076.
2. Avruch, J. 1998. Insulin signal transduction through protein kinase cascades.Mol. Cell. Biochem. 182:31–48.
3. Belfiore, A., A. Costantino, F. Frasca, G. Pandini, R. Mineo, P. Vigneri, I. D.Goldfine, B. A. Maddux, and R. Vigneri. 1996. Overexpression of membraneglycoprotein PC-1 in MDA-MB 231 breast cancer cells is associated withinhibition of insulin receptor tyrosine kinase activity. Mol. Endocrinol. 10:1318–1326.
4. Boge, A., and R. A. Roth. 1995. A non radioactive assay for the insulinreceptor tyrosine kinase: use in monitoring receptor tyrosine kinase activityafter activation of overexpressed protein kinase C alpha and high glucosetreatment. Anal. Biochem. 231:323–332.
5. Borsi, L., E. Balza, B. Gaggero, G. Alemanni, and L. Zardi. 1995. Thealternative splicing pattern of the tenascin-C pre-mRNA is controlled by theextracellular pH. J. Biol. Chem. 270:6243–6245.
6. Boulle, N., A. Logie, C. Gicquel, L. Perin, and Y. Le Bouc. 1998. Increasedlevels of insulin-like growth factor II (IGF-II) and IGF-binding protein-2 areassociated with malignancy in sporadic adrenocortical tumors. J. Clin. En-docrinol. Metab. 83:1713–1720.
7. Carrascosa, J. M., B. Vogt, A. Ullrich, and H. U. Haring. 1991. Activation ofphosphatidylinositol-3-kinase by insulin is mediated by both A and B humaninsulin receptor types. Biochem. Biophys. Res. Commun. 174:123–127.
8. Cullen, K. C., M. E. Lippman, D. Chow, S. Hill, N. Rosen, and J. A. Zwiebel.1992. Insulin-like growth factor-II overexpression in MCF-7 cells inducesphenotypic changes associated with malignant progression. Mol. Endocrinol.6:91–100.
9. DeChiara, T. M., A. Efstratiadis, and E. J. Robertson. 1990. A growth-deficiency phenotype in heterozygous mice carrying an insulin-like growthfactor II gene disrupted by targeting. Nature 345:78–80.
10. De Meyts, P. 1994. The structural basis of insulin and insulin-like growthfactor-I receptor binding and negative co-operativity, and its relevance tomitogenic versus metabolic signalling. Diabetologia 37:S135–S148.
11. Efstratiadis, A. 1996. Genetics of growth: developmental roles of IGF andinsulin receptors. Exp. Clin. Endocrinol. Diabetes 104(Suppl. 2):4–6.
12. Forsayeth, J. R., A. Montemurro, B. A. Maddux, R. DePirro, and I. D.Goldfine. 1987. Effect of Monoclonal antibodies on human insulin receptorautophosphorylation, negative cooperativity, and down-regulation. J. Biol.Chem. 262:4134–4140.
13. Frittitta, L., L. Sciacca, R. Catalfamo, A. Ippolito, P. Gangemi, V. Pezzino,S. Filetti, and R. Vigneri. 1999. Functional insulin receptors are overex-pressed in thyroid tumors. Is this an early event in thyroid tumorigenesis?Cancer 85:492–498.
14. Gerweck, L. E., and K. Seetharaman. 1996. Cellular pH gradient in tumorversus normal tissue: potential exploitation for the treatment of cancer.Cancer Res. 56:1194–1198.
15. Giddings, S. J., and L. R. Carnaghi. 1992. Insulin receptor gene expressionduring development: developmental regulation of insulin receptor mRNAabundance in embryonic rat liver and yolk sac, developmental regulation ofinsulin receptor gene splicing, and comparison to abundance of insulin-likegrowth factor 1 receptor mRNA. Mol. Endocrinol. 6:1665–1672.
16. Gliozzo, B., C. K. Sung, P. L. Scalia, V. Papa, F. Frasca, L. Sciacca, F.Giorgino, G. Milazzo, I. D. Goldfine, R. Vigneri, and V. Pezzino. 1998.Insulin-stimulated cell growth in IRS-1 deficient ZR-75-1 cells is mediatedby a phosphatidylinositol-3 kinase independent pathway. J. Cell. Biochem.70:268–280.
17. Hansen, B. F., G. M. Danielsen, K. Drejer, A. R. Sorensen, F. C. Wiberg,H. H. Klein, and A. G. Lundemose. 1996. Sustained signalling from theinsulin receptor after stimulation with insulin analogues exhibiting increasedmitogenic potency. Biochem. J. 315:271–279.
18. Hintz, R. L., A. V. Thorsson, G. Enberg, and K. Hall. 1984. IGF-II bindingon human lymphoid cells: demonstration of a common high affinity receptorfor insulin like peptides. Biochem. Biophys. Res. Commun. 118:774–782.
19. Jonas, H. A., J. D. Newman, and L. C. Harrison. 1986. An atypical insulinreceptor with high affinity for insulin-like growth factors copurified withplacental insulin receptors. Proc. Natl. Acad. Sci. USA 83:4124–4128.
20. Kao, A. W., S. B. Waters, S. Okada, and J. E. Pessin. 1997. Insulin stimulatesthe phosphorylation of the 66- and 52-kilodalton Shc isoforms by distinctpathways. Endocrinology 138:2474–2480.
21. Korc, M., C. A. Haussler, and N. S. Trookman. 1987. Divergent effects ofepidermal growth factor and transforming growth factors on a human en-dometrial carcinoma cell line. Cancer Res. 47:4909–4914.
22. Kosaki, A., and N. J. Webster. 1993. Effect of dexamethasone on the alter-native splicing of the insulin receptor mRNA and insulin action in HepG2hepatoma cells. J. Biol. Chem. 268:21990–21996.
23. Kosaki, A., J. Nelson, and N. J. G. Webster. 1998. Identification of intron andexon sequences involved in alternative splicing of insulin receptor pre-mRNA. J. Biol. Chem. 273:10331–10337.
24. Kristiensen, C., F. C. Wiberg, L. Schaffer, and A. S. Andersen. 1998. Ex-pression and characterization of a 70 kDa fragment of the insulin receptorthat binds insulin. J. Biol. Chem. 273:17780–17786.
25. Lamothe, B., A. Bandry, C. T. Christoffersen, P. De Meyts, J. Jami, D.Bucchini, and R. L. Joshi. 1998. Insulin receptor-deficient cells as a new toolfor dissecting complex interplay in insulin and insulin-like growth factors.FEBS Lett. 426:381–385.
26. Lipeski, L. E., J. M. Boylan, and P. A. Gruppuso. 1996. A comparison ofepidermal growth factor receptor-mediated mitogenic signaling in responseto transforming growth factor alpha and epidermal growth factor in culturedfetal rat hepatocytes. Biochem. Mol. Biol. Int. 39:975–983.
27. Liu, J-P., J. Baker, A. S. Perkins, E. J. Robertson, and A. Efstratiadis. 1993.Mice carrying null mutations of the genes encoding insulin-like growth factorI (Igf-1) and type 1 IGF receptor (Igf1r). Cell 75:59–72.
28. Louvi, A., D. Accili, and A. Efstratiadis. 1997. Growth promoting interactionof IGF-II with the insulin receptor during mouse embryonic development.Dev. Biol. 189:33–48.
29. Mayeda, A., D. M. Helfman, and A. R. Krainer. 1993. Modulation of exonskipping and inclusion by heterogeneous nuclear ribonucleoprotein A1 andpre-mRNA splicing factor SF2/ASF. Mol. Cell. Biol. 13:2993–3001.
30. Mayor, P., L. Maianu, and T. Garvey. 1992. Glucose and insulin chronicallyregulate insulin action via different mechanisms in BC3H1 myocites. Diabe-tes 41:274–284.
31. Milazzo, G., F. Giorgino, G. Damante, C. K. Sung, M. R. Stampfer, R.Vigneri, I. D. Goldfine, and A. Belfiore. 1992. Insulin receptor expression andfunction in human breast cancer cell lines. Cancer Res. 52:3924–3930.
32. Miura, M., E. Surmacz, J.-L. Burgaud, and R. Baserga. 1995. Differenteffects on mitogenesis and transformation of a mutation at tyrosine 1251 ofthe insulin-like growth factor I receptor. J. Biol. Chem. 270:22639–22644.
33. Moller, D. E., A. Yokota, J. F. Caro, and J. S. Flier. 1989. Tissue-specificexpression of two alternatively spliced insulin receptor mRNAs in man. Mol.Endocrinol. 3:1263–1269.
34. Morrione, A., B. Valentinis, S. Xu, G. Yumet, A. Louvi, A. Efstratiadis, andR. Baserga. 1997. Insulin-like growth factor II stimulates cell proliferationthrough the insulin receptor. Proc. Natl. Acad. Sci. USA 94:3777–3782.
35. Mosthaf, L., K. Grako, T. J. Dull, L. Coussens, A. Ullrich, and D. A.McClain. 1990. Functionally distinct insulin receptors generated by tissue-specific alternative splicing. EMBO J. 8:2409–2413.
36. Myers, M. G., Jr., and M. F. White. 1996. Insulin signal transduction and theIRS proteins. Annu. Rev. Pharmacol. Toxicol. 36:615–658.
37. Nonomura, N., K. Nishimura, T. Miki, N. Kanno, Y. Kojima, M. Yokoyama,and A. Okuyama. 1997. Loss of imprinting of the insulin-like growth factorII gene in renal cell carcinoma. Cancer Res. 57:2575–2577.
38. Nordqvist, A. C., M. Peyrard, H. Pettersson, T. Mathiesen, V. P. Collins,J. P. Dumanski, and M. Schalling. 1997. A high ratio of insulin-like growthfactor II/insulin-like growth factor binding protein 2 messenger RNA as amarker for anaplasia in meningiomas. Cancer Res. 57:2611–2614.
39. Nguyen, T. T., J-C. Scimeca, C. C. Filloux, P. Peraldi, J-L. Carpentier, andE. Van Obberghen. 1993. Co-regulation of the mitogen-activated proteinkinase, extracellular signal-regulated kinase 1, and the 90-kDa ribosomal S6kinase in PC12 cells. J. Biol. Chem. 268:9803–9810.
40. Okada, S., A. W. Kao, B. P. Ceresa, P. Blaikie, B. Margolis, and J. Pessin.1997. The 66-kDa Shc isoform is a negative regulator of the epidermal-growth factor-stimulated mitogen-activated protein kinase pathway. J. Biol.Chem. 272:28042–28049.
41. Okamoto, K., I. M. Morison, T. Taniguchi, and A. E. Reeve. 1997. Epigeneticchanges at the insulin-like growth factor II/H19 locus in developing kidney isan early event in Wilms tumorigenesis. Proc. Natl. Acad. Sci. USA 94:5367–5371.
42. Pandini, G., R. Vigneri, A. Costantino, F. Frasca, A. Ippolito, Y. Fujita-Yamaguchi, K. Siddle, I. D. Goldfine, and A. Belfiore. Insulin/IGF-I hybridreceptors play a major role in IGF-I signaling in breast cancer. Submitted forpublication.
43. Papa, V., V. Pezzino, A. Costantino, A. Belfiore, D. Giuffrida, L. Frittitta,
VOL. 19, 1999 IGF-II AND INSULIN RECEPTOR ISOFORM A 3287
G. B. Vannelli, R. Brand, I. D. Goldfine, and R. Vigneri. 1990. Elevated insulinreceptor content in human breast cancer. J. Clin. Investig. 86:1503–1510.
44. Parruti, G., F. Peracchia, M. Sallese, G. Ambrosini, M. Masini, D. Rotilio,and A. De Blasi. 1993. Molecular analysis of human b-arrestin-1: cloning,tissue distribution, and regulation of expression. J. Biol. Chem. 268:9753–9761.
45. Roth, R. A., G. Steele-Perkins, J. Hari, C. Stover, S. Pierce, J. Turner, J. C.Edman, and W. J. Rutter. 1988. Insulin and insulin-like growth factor re-ceptors and responses. Cold Spring Harbor Symp. Quant. Biol. 53:537–543.
46. Sasaoka, T., M. Ishiki, T. Sawa, H. Ishihara, Y. Takata, T. Imamura, I. Usui,J. M. Olefsky, and M. Kobayashi. 1996. Comparison of the insulin andinsulin-like growth factor 1 mitogenic intracellular signalling pathways. En-docrinology 137:4427–4434.
47. Sbraccia, P., M. D’Adamo, F. Leonetti, S. Caiola, P. Iozzo, A. Giaccari, A.Buongiorno, and G. Tamburrano. 1996. Chronic primary hyperinsulinemia isassociated with altered insulin receptor mRNA splicing in muscle of patientswith insulinoma. Diabetologia 39:220–225.
48. Sciacca, L., A. Costantino, G. Pandini, R. Mineo, F. Frasca, P. Scalia, P.Sbraccia, I. D. Goldfine, R. Vigneri, and A. Belfiore. Insulin receptor acti-vation by IGF-II in breast cancers: evidence for a new autocrine/paracrinemechanism. Oncogene, in press.
49. Sell, C., M. Rubini, R. Rubin, J-P. Liu, A. Efstratiadis, and R. Baserga. 1993.Simian virus 40 large tumor antigen is unable to transform mouse embryonicfibroblasts lacking type 1 insulin-like growth factor receptor. Proc. Natl.Acad. Sci. USA 90:11217–11221.
50. Shymko, M. R., P. De Meyts, and R. Thomas. 1997. Logical analysis of timingsignalling specificity: application to the insulin receptor metabolic and mi-togenic signalling pathways. Biochem. J. 326:463–469.
51. Singer, C. F., A. Rasmussen, M. E. Lippman, and K. J. Cullen. 1997.Coexpression of stromelysin-3 and insulin-like growth factor II in tumors ofectodermal, mesodermal, and endodermal origin: indicator of a fetal cellphenotype. J. Clin. Endocrinol. Metab. 82:1917–1922.
52. Soos, M. A., C. E. Field, R. Lammers, A. Ullrich, B. Zhang, R. A. Roth, A. S.Andersen, T. Kjeldsen, and K. Siddle. 1992. A panel of monoclonal anti-bodies for the type I insulin-like growth factor receptor. J. Biol. Chem.267:12955–12963.
53. Steele-Perkins, G., J. Turner, J. C. Edman, J. Hari, S. B. Pierce, C. Stover,W. J. Rutter, and R. A. Roth. 1988. Expression and characterization of afunctional human insulin-like growth factor I receptor. J. Biol. Chem. 263:11486–11492.
54. Traverse, S., N. Gomez, H. Paterson, C. Marshall, and P. Cohen. 1992.Sustained activation of the mitogen-activated protein (MAP) kinase cascademay be required for differentiation of PC12 cells. Comparison of the effectsof nerve growth factor and epidermal growth factor. Biochem. J. 288:351–355.
55. Ullrich, A., A. Gray, A. W. Tam, T. Yang-Feng, M. Tsubokawa, C. Collins, W.Henzel, T. Le Bon, S. Kathuria, E. Chen, S. Jacobs, U. Francke, J. Ram-achandran, and Y. Fujita-Yamaguchi. 1986. Insulin-like growth factor Ireceptor primary structure: comparison with insulin receptor suggests struc-tural determinants that define functional specificity. EMBO J. 5:2503–2512.
56. Wang, W., P. Kumar, W. Wang, J. Epstein, L. Helman, J. V. Moore, and S.Kumar. 1998. Insulin-like growth factor II and PAX-FKHHR cooperate inthe oncogenesis of rhabdomyosarcoma. Cancer Res. 58:4426–4433.
57. Waters, S. B., K. H. Holt, S. E. Ross, L.-J. Syu, K.-L. Guan, A. R. Saltiel,G. A. Koretky, and J. E. Pessin. 1995. Desensitization of Ras activation by afeedback dissociation of the SOS-Grb2 complex. J. Biol. Chem. 270:20833–20886.
58. Werner, H., and D. LeRoith. 1996. The role of the insulin-like growth factorsystem in human cancer. Adv. Cancer Res. 68:183–223.
59. White, M. F. 1997. The insulin signalling system and the IRS proteins.Diabetologia 40(Suppl.):S2–S17.
60. Yamaguchi, Y., J. S. Flier, H. Benecke, B. J. Ransil, and D. E. Moller. 1993.Ligand-binding properties of the two isoforms of the human insulin receptor.Endocrinology 132:1132–1138.
61. Zhang, L., S. Zhan, F. Navid, Q. Li, Y. H. Choi, M. Kim, P. Seth, and J. L.Helman. 1998. AP 2 may contribute to IGF-II overexpression in rhabdo-myosarcoma. Oncogene 17:1261–1270.
62. Zhang, L., Q. Zhan, S. Zhan, F. Kashanchi, A. J. Jr Fornace, P. Seth, andL. J. Helman. 1998. p53 regulates human insulin-like growth factor II geneexpression through active P4 promoter in rhabdomyosarcoma cells. DNACell Biol. 17:125–131.
3288 FRASCA ET AL. MOL. CELL. BIOL.
Related Documents