Mechanistic explanations for counter-intuitive phosphorylation dynamics of the insulin receptor and insulin receptor substrate-1 in response to insulin in murine adipocytes Elin Nyman 1 , Siri Fagerholm 1 , David Jullesson 1 , Peter Stra ˚ lfors 1 and Gunnar Cedersund 1,2,3 1 Department of Clinical and Experimental Medicine, Diabetes and Integrative Systems Biology, Linko ¨ ping University, Sweden 2 Department of Biomedical Engineering, Linko ¨ ping University, Sweden 3 Freiburg Institute of Advanced Sciences, School of Life Sciences, Germany Keywords conclusive mathematical modeling; core prediction; insulin signaling; mechanistic explanation; rat adipocytes Correspondence G. Cedersund, Department of Clinical and Experimental Medicine, SE58185 Linko ¨ ping, Sweden Fax: +46 10103 4149 Tel: +46 702 512323 E-mail: [email protected] Website: http://www.isbgroup.eu P. Stra ˚lfors, Department of Clinical and Experimental Medicine, SE58185 Linko ¨ ping, Sweden Fax: +46 10103 4149 Tel: +46 10103 4315 E-mail: [email protected] Website: http://www.hu.liu.se/ike/forskning/ cellbiologi/peter-stralfors (Received 17 June 2011, revised 14 November 2011, accepted 19 December 2011) doi:10.1111/j.1742-4658.2012.08488.x Insulin signaling through insulin receptor (IR) and insulin receptor sub- strate-1 (IRS1) is important for insulin control of target cells. We have pre- viously demonstrated a rapid and simultaneous overshoot behavior in the phosphorylation dynamics of IR and IRS1 in human adipocytes. Herein, we demonstrate that in murine adipocytes a similar overshoot behavior is not simultaneous for IR and IRS1. The peak of IRS1 phosphorylation, which is a direct consequence of the phosphorylation and the activation of IR, occurs earlier than the peak of IR phosphorylation. We used a conclu- sive modeling framework to unravel the mechanisms behind this counter- intuitive order of phosphorylation. Through a number of rejections, we demonstrate that two fundamentally different mechanisms may create the reversed order of peaks: (i) two pools of phosphorylated IR, where a large pool of internalized IR peaks late, but phosphorylation of IRS1 is gov- erned by a small plasma membrane-localized pool of IR with an early peak, or (ii) inhibition of the IR-catalyzed phosphorylation of IRS1 by negative feedback. Although (i) may explain the reversed order, this two- pool hypothesis alone requires extensive internalization of IR, which is not supported by experimental data. However, with the additional assumption of limiting concentrations of IRS1, (i) can explain all data. Also, (ii) can explain all available data. Our findings illustrate how modeling can potenti- ate reasoning, to help draw nontrivial conclusions regarding competing mechanisms in signaling networks. Our work also reveals new differences between human and murine insulin signaling. Database The mathematical model described here has been submitted to the Online Cellular Systems Modelling Database and can be accessed at http://jjj.biochem.sun.ac.za/database/nyman/ index.html free of charge. Introduction Insulin controls glucose homeostasis, and failures in this control can lead to insulin resistance and to type 2 diabe- tes [1]. Insulin acts through its receptor (IR), which is located in the caveolae at the cell surface of insulin- responding adipocytes [2]. After binding of insulin to the extracellular a-subunits, the receptor autophosphorylates Abbreviations IR, insulin receptor; IRS1, insulin receptor substrate-1; SH2, Src homology 2. FEBS Journal 279 (2012) 987–999 ª 2012 The Authors Journal compilation ª 2012 FEBS 987

Welcome message from author
This document is posted to help you gain knowledge. Please leave a comment to let me know what you think about it! Share it to your friends and learn new things together.
Transcript
Mechanistic explanations for counter-intuitivephosphorylation dynamics of the insulin receptor andinsulin receptor substrate-1 in response to insulin inmurine adipocytesElin Nyman1, Siri Fagerholm1, David Jullesson1, Peter Stralfors1 and Gunnar Cedersund1,2,3
1 Department of Clinical and Experimental Medicine, Diabetes and Integrative Systems Biology, Linkoping University, Sweden
2 Department of Biomedical Engineering, Linkoping University, Sweden
3 Freiburg Institute of Advanced Sciences, School of Life Sciences, Germany
Keywords
conclusive mathematical modeling; core
prediction; insulin signaling; mechanistic
explanation; rat adipocytes
Correspondence
G. Cedersund, Department of Clinical and
Experimental Medicine, SE58185 Linkoping,
Sweden
Fax: +46 10103 4149
Tel: +46 702 512323
E-mail: [email protected]
Website: http://www.isbgroup.eu
P. Stralfors, Department of Clinical and
Experimental Medicine, SE58185 Linkoping,
Sweden
Fax: +46 10103 4149
Tel: +46 10103 4315
E-mail: [email protected]
Website: http://www.hu.liu.se/ike/forskning/
cellbiologi/peter-stralfors
(Received 17 June 2011, revised 14
November 2011, accepted 19 December
2011)
doi:10.1111/j.1742-4658.2012.08488.x
Insulin signaling through insulin receptor (IR) and insulin receptor sub-
strate-1 (IRS1) is important for insulin control of target cells. We have pre-
viously demonstrated a rapid and simultaneous overshoot behavior in the
phosphorylation dynamics of IR and IRS1 in human adipocytes. Herein,
we demonstrate that in murine adipocytes a similar overshoot behavior is
not simultaneous for IR and IRS1. The peak of IRS1 phosphorylation,
which is a direct consequence of the phosphorylation and the activation of
IR, occurs earlier than the peak of IR phosphorylation. We used a conclu-
sive modeling framework to unravel the mechanisms behind this counter-
intuitive order of phosphorylation. Through a number of rejections, we
demonstrate that two fundamentally different mechanisms may create the
reversed order of peaks: (i) two pools of phosphorylated IR, where a large
pool of internalized IR peaks late, but phosphorylation of IRS1 is gov-
erned by a small plasma membrane-localized pool of IR with an early
peak, or (ii) inhibition of the IR-catalyzed phosphorylation of IRS1 by
negative feedback. Although (i) may explain the reversed order, this two-
pool hypothesis alone requires extensive internalization of IR, which is not
supported by experimental data. However, with the additional assumption
of limiting concentrations of IRS1, (i) can explain all data. Also, (ii) can
explain all available data. Our findings illustrate how modeling can potenti-
ate reasoning, to help draw nontrivial conclusions regarding competing
mechanisms in signaling networks. Our work also reveals new differences
between human and murine insulin signaling.
Database
The mathematical model described here has been submitted to the Online Cellular Systems
Modelling Database and can be accessed at http://jjj.biochem.sun.ac.za/database/nyman/
index.html free of charge.
Introduction
Insulin controls glucose homeostasis, and failures in this
control can lead to insulin resistance and to type 2 diabe-
tes [1]. Insulin acts through its receptor (IR), which is
located in the caveolae at the cell surface of insulin-
responding adipocytes [2]. After binding of insulin to the
extracellular a-subunits, the receptor autophosphorylates
Abbreviations
IR, insulin receptor; IRS1, insulin receptor substrate-1; SH2, Src homology 2.
FEBS Journal 279 (2012) 987–999 ª 2012 The Authors Journal compilation ª 2012 FEBS 987

and a downstream signaling cascade is initiated. Down-
stream signal mediators, such as insulin receptor sub-
strate-1 (IRS1), are recruited to the IR and are
phosphorylated on tyrosine residues. The subsequent sig-
naling through proteins with Src homology 2 (SH2)
domains that recognize tyrosine-phosphorylated IRS1
results in metabolic and mitogenic control of the cell.
These dynamic processes have been studied in both
human and rat adipocytes, and although similarities pre-
dominate, there are important differences. One signifi-
cant difference is that IRS1 is co-localized with IR in
caveolae in the plasma membrane of human adipocytes,
while in rat adipocytes, IRS1 is recruited to the receptor
and caveolae only in response to insulin [3,4].
We have previously demonstrated that the time-
courses for phosphorylation of IR and IRS1 on tyro-
sine residues in human primary adipocytes after insulin
stimulation exhibit simultaneous overshoots [5,6].
These overshoots are transient peaks of phosphoryla-
tion followed by establishment of a lower quasi
steady-state level of phosphorylation caused by a
down-regulation of the signal. In human adipocytes
the overshoots are rapid, occurring within 2 min.
Herein, we demonstrate an overshoot behavior also in
murine primary adipocytes. However, in contrast to
human adipocytes, the overshoot peak in the phos-
phorylation of IRS1 occurred earlier than the over-
shoot in the phosphorylation of IR. This counter-
intuitive order of phosphorylation is surprising because
phosphorylation of IRS1 is a consequence of the phos-
phorylation and activation of IR. Using a novel con-
clusive modeling approach [5], we tested a number of
plausible mechanistic hypotheses whereof some were
rejected and others served as possible explanations of
this counter-intuitive order of phosphorylation. We
identified two principal mechanisms that can produce
a reversed order of phosphorylation. Based on these
two principal mechanisms we also identified two differ-
ent hypotheses that can explain all available experi-
mental data in the murine adipocytes.
Results
Reversed peak order during phosphorylation of
the IR and the IRS1
We examined the early phase of insulin signaling (i.e.
autophosphorylation and activation of IR and the
directly downstream phosphorylation of IRS1 by the
activated IR in primary rat adipocytes). We found that
the phosphorylation of both proteins exhibited a tran-
sient peak within the first few minutes after insulin
stimulation followed by the establishment of an
increased quasi steady-state level of phosphorylation
(Fig. 1A), reminiscent of the situation in human adipo-
cytes [5]. However, in contrast to the situation in pri-
mary human adipocytes, in primary murine adipocytes
the phosphorylation of IR peaked at 4 min, signifi-
cantly later than the phosphorylation of its substrate
IRS1 (which peaked at 1 min) (Fig. 1A). Irrespective
of the physiological significance of this reversed order
of phosphorylation, it is of general and principal inter-
est to understand the molecular basis of such a coun-
ter-intuitive behavior in signaling. Also, considering
the overwhelming impact of murine models in research
on insulin signaling, normally and in insulin resistance
and type 2 diabetes, it is also important to understand
how animal models differ in fundamental ways from
the situation in humans. For this analysis we used a
newly developed conclusive modeling framework [5].
Feedback to enhanced dephosphorylation of IR
We first evaluated models that have previously been
shown to generate overshoot behaviors in the dynamic
phosphorylation of IR and IRS1 [5]. The first hypothe-
sis (Mf from [5]) is based on a feedback mechanism
from a downstream signaling intermediate (referred to
as X), leading to dephosphorylation of IR (Fig. 1B). A
simple model structure within this hypothesis contains
six states (IRm, IRmp, IRS1, IRS1p, X and Xp), where
m indicates that the state is located in the plasma
membrane and p indicates phosphorylation; eight
parameters (k1, k1b, km1, kf, k2, km2, k3 and km3);
and one input signal (insulin). With these notations,
the ordinary differential equations may be as follows
dðIRmÞdt
¼� ðk1 � insulinþ k1bÞ � IRm
þ ðkm1þ kf � XpÞ � IRmp
dðIRmpÞdt
¼ ðk1 � insulinþ k1bÞ � IRm
� ðkm1þ kf � XpÞ � IRmp
dðIRS1Þdt
¼ �k2 � IRp � IRS1þ km2 � IRS1p
dðIRS1pÞdt
¼ k2 � IRp � IRS1� km2 � IRS1p
dðXÞdt¼ �k3 � IRS1p � X þ km3 � Xp
dðXpÞdt¼ k3 � IRS1p � X � km3 � Xp
Note that the parameter k1b refers to basal phosphory-
lation, which occurs in the absence of insulin, and that
Explanation of counter-intuitive insulin signaling E. Nyman et al.
988 FEBS Journal 279 (2012) 987–999 ª 2012 The Authors Journal compilation ª 2012 FEBS

the above equations correspond to the model structure
Mf1 (Fig. S1). The measured signal is the phosphory-
lated IR and IRS1 states:
y ¼ IRmpIRS1p
�:
We tested two model structures within the Mf hypoth-
esis (Fig. S1), both of which can generate an overshoot
behavior, but could not find any combination of model
structures and parameter sets that explained the
reversed order of phosphorylation (Fig. 1C,D). The
Mf hypothesis was thus rejected (Table 1) because not
even the qualitative behavior in the data could be
reproduced with models of this hypothesis. In other
words, Mf models can produce overshoots, but the Mf
feedback mechanism is not sufficient to produce the
shift in the timing of the overshoot peaks exhibited by
the experimental data.
Internalization and dephosphorylation of IR
Next we evaluated a hypothesis involving internalization
of IR (hypothesis Mi from [5]). Mi is based on the fact
that the IR is internalized after its autophosphorylation
and then dephosphorylated before recycling back to the
plasma membrane (Fig. 2A). Simple model structures
with one internalized state (e.g. Mi1 and Mi3, Fig S2)
could not explain the data. These rejections deserve fur-
ther comment. First, the rejection of Mi3 indicates that
saturation of the phosphorylation reaction for IRS1 is
not enough to cause a reversed order of the peaks, which
is interesting because this saturation is an intuitively
plausible explanation. Despite rejections of these indi-
vidual model structures, we do not reject the Mi hypoth-
esis because complicated model structures with more
internalized IR states (e.g. Mi2 and Mi4, Fig. S2) can
produce the counter-intuitive order of the peaks in a
0.5 1 1.50.5
1
1.5
Time of peak in IR phosphorylation minimum
Tim
e of
pea
k in
IRS
1 ph
osph
oryl
atio
n m
inim
um
0 5 10 15 200
20
40
60
80
100
IRpIRS1p
C D
A B
Pho
spho
ryla
tion
(per
cent
age
of m
axim
um)
Pho
spho
ryla
tion
(per
cent
age
of m
axim
um)
0 5 10 15 200
25
50
75
100
Time (min)
Time (min)
Tyrosine-P
Tyrosine-P
Fig. 1. Dynamic protein phosphorylation in response to insulin cannot be explained by the Mf hypothesis. (A) Isolated primary rat adipocytes
were incubated with 100 nM insulin for the indicated periods of time. The extent of tyrosine phosphorylation of IR (d) or of IRS1 (s) was
determined by SDS ⁄ PAGE and immunoblotting. The percentage of maximum was calculated and the average of five separate experiments
is presented. The counter-intuitive observation is that the IR peak comes after the IRS1 peak, although IRS1 is downstream of IR. Error bars
are plotted in Figs 3B,C. (B) The Mf hypothesis consists of model structures with down-regulation through feedback from a downstream sig-
naling intermediate (referred to as X ) to dephosphorylation of the IR. (C) None of the model structures within the Mf hypothesis are accept-
able because none could produce the counter-intuitive order of the peak values. We see an example of a model and parameter set
combination that gives an overshoot, but a statistically unacceptable solution, in the phosphorylation of IR (- -, magenta) and IRS1 (–, blue).
(D) A comparison of the peak times for IR and IRS1 phosphorylation for a number of different, unacceptable parameter sets shows that the
IRS1 peak comes at the same time, or later than, the IR peak.
E. Nyman et al. Explanation of counter-intuitive insulin signaling
FEBS Journal 279 (2012) 987–999 ª 2012 The Authors Journal compilation ª 2012 FEBS 989

statistically acceptable manner (Fig. 2B). The statistical
fit was examined using chi-square tests [7] (see the Mate-
rials and Methods).
As the Mi hypothesis implies model structures that
can explain the counter-intuitive order of the peaks, it
is interesting to examine how this behavior arises. We
chose to have a closer look at Mi2, the simplest model
structure that produces the reversed peak order. In
Mi2 the phosphorylated state of the IR in the plasma
membrane (IRmp) exhibits an early peak (as does the
experimentally observed phosphorylation of IRS1),
and the internalized and phosphorylated state of the
IR (IRip) exhibits a late peak (as does the experimen-
tally observed phosphorylation of the IR) (Fig. 2B,C).
Furthermore, for all acceptable parameters, IRip
makes up the majority of the phosphorylated IR, while
IRmp dominates the phosphorylation of IRS1
(Fig. 2C,D). Therefore, as IRmp peaks early and domi-
nates the phosphorylation of IRS1, it is logical that
IRS1p may peak early. It is possible for IRmp to
account for a small amount of the total phosphory-
lated IR and at the same time dominate the phosphor-
ylation of IRS1, as we use different parameters for the
phosphorylated receptor states in the activation of
IRS1. The corresponding equation is:
dðIRS1pÞdt
¼ðk21 � IRmpþ k22 � IRipÞ�IRS1� km2 � IRS1p,
where the two potentially different parameters are
highlighted in bold. In other words, k21 � k22 for all
acceptable parameters, and the IRmp effect (k21ÆIRmp)
is thus larger than the IRip effect (k22ÆIRip) (Fig. 2D).
It is conceivable that k21 is different from k22 because
the localization of a protein is known to affect its abil-
ity to signal to other proteins.
By examining all acceptable parameters in Mi2 (i.e.
all parameters that can produce the required reversed
order of phosphorylation) we found that the hypothe-
sis Mi requires that < 10% of the total IR is at the
plasma membrane at steady state (Fig. 2E). Such a
uniquely identified prediction is referred to as a core
prediction [5] and we have previously reported that
91 ± 7% of the total IR is localized in the plasma
membrane 10 min after stimulation with insulin [8].
This experimental observation is not compatible with
the core prediction, and the Mi hypothesis therefore
has to be rejected (Table 1). We also tried to fit the
models to data both for the overshoot and for the
extent of internalization, but found no statistically
acceptable solutions; this lack of solutions validates
the core prediction approach and strengthens the rejec-
tion of the Mi hypothesis (Table 1).
As the internalization hypothesis (Mi) was rejected
and therefore lacks some essential mechanism, we
continued to examine a hypothesis that involves both
IR internalization and feedback from a downstream
signaling intermediate to the dephosphorylation of
the IR (Mif from [5], Fig. S2). The Mif hypothesis
has been shown to explain the ‘simultaneous’ over-
shoot behavior of the phosphorylation of IR and
IRS1 in human primary adipocytes without the
requirement for an excessive extent of internalization
[5]. However, despite extensive fitting to the data
sets, no better solutions were found for the Mif
Table 1. Summary of the hypotheses tested, experimental observations and conclusions. The experimental observations accumulate for
each column from left to right (i.e. if a model acquires OK ⁄ FAIL in the ‘Correct order of peak values’ column, the model was tested against
both the ‘Characteristic overshoot behavior’ and ‘Correct order of the peak values’ experimental observations). A hypothesis that failed was
not tested with respect to larger data sets.
Hypotheses
Experimental observations
Qualitative behavior Quantitative behavior
Characteristic
overshoot
behavior
Correct
order of
peak
values
Agreement
with IR and
IRS1 data
Correct
proportion of IR
in the plasma
membrane
Mf Down-regulation through a
negative feedback to IR
OK FAIL
Mi Down-regulation through internalization
and dephosphorylation of IR
OK OK OK FAIL
Mif A combination of Mf and Mi OK OK OK FAIL
Mi-fb Mi with added negative feedbacks
to the phosphorylation of IRS1
OK OK OK OK
Mi-lim Mi with a limiting concentration of
IRS1 and explicit IRS1 to IR binding
OK OK OK OK
Explanation of counter-intuitive insulin signaling E. Nyman et al.
990 FEBS Journal 279 (2012) 987–999 ª 2012 The Authors Journal compilation ª 2012 FEBS
hypothesis than for the Mi hypothesis, and we there-
fore also had to reject the Mif hypothesis (Table 1).
Feedback to inhibit IR phosphorylation of IRS1
We next introduced a new feedback, which inhibits the
ability of the IR to phosphorylate IRS1, and called
this hypothesis Mi-fb (Figs 3A, S3). We formulated the
negative feedback as:
dðIRS1pÞdt
¼ k2 � IRmp � IRS1
1þ kf � Yp� km2 � IRS1p,
where the mathematical representation of the feedback
is highlighted in bold.
0 5 10 15 200
20
40
60
80
100
0 5 10 15 200
20
40
60
80
100
IR e
ffect
on
IRS
1 ph
osph
oryl
atio
n
60
80
0 5 10 15 200
20
40
60
80
100
0 5 10 15 200
20
40
0 1 20
1
2
3
4
Tyrosine-P
Tyrosine-P
Tyrosine-P
Pho
spho
ryla
tion
(per
cent
age
of m
axim
um)
Time (min)
Time (min)Time (min)
Time (min)
IR in
the
plas
ma
mem
bran
e(p
erce
ntag
e of
tota
l IR
)
IR p
hosp
hory
latio
n(p
erce
ntag
e of
tota
l IR
)
A
C
E
D
B
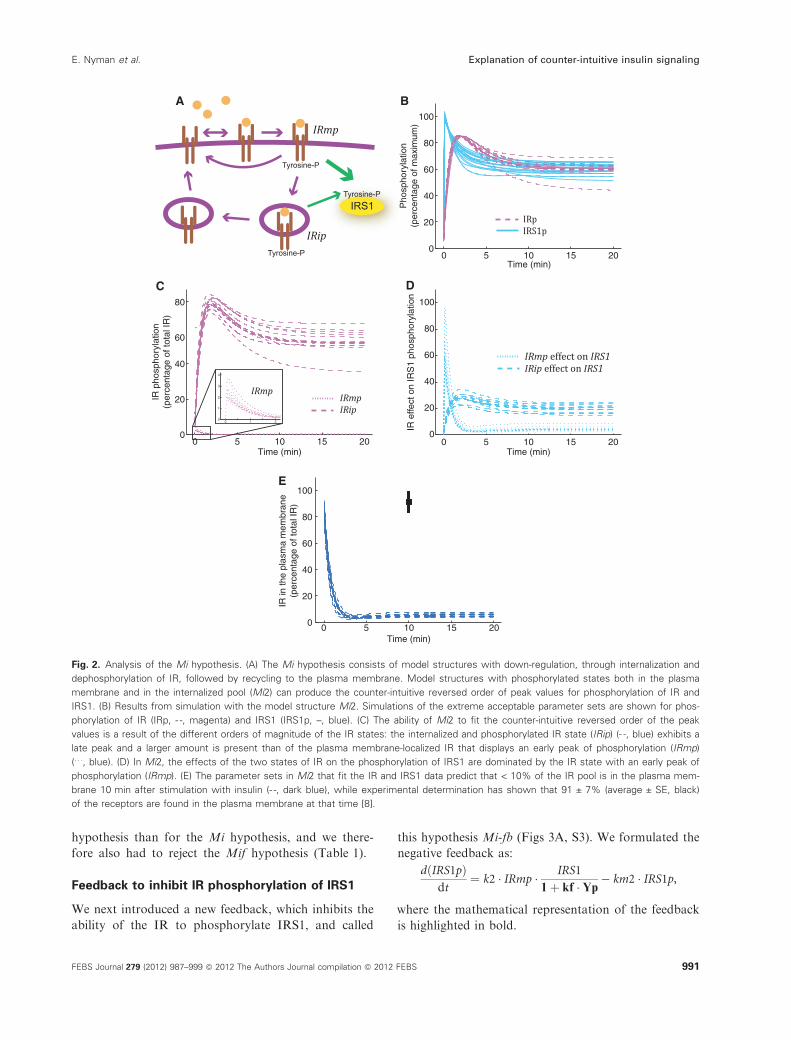
Fig. 2. Analysis of the Mi hypothesis. (A) The Mi hypothesis consists of model structures with down-regulation, through internalization and
dephosphorylation of IR, followed by recycling to the plasma membrane. Model structures with phosphorylated states both in the plasma
membrane and in the internalized pool (Mi2) can produce the counter-intuitive reversed order of peak values for phosphorylation of IR and
IRS1. (B) Results from simulation with the model structure Mi2. Simulations of the extreme acceptable parameter sets are shown for phos-
phorylation of IR (IRp, - -, magenta) and IRS1 (IRS1p, –, blue). (C) The ability of Mi2 to fit the counter-intuitive reversed order of the peak
values is a result of the different orders of magnitude of the IR states: the internalized and phosphorylated IR state (IRip) (- -, blue) exhibits a
late peak and a larger amount is present than of the plasma membrane-localized IR that displays an early peak of phosphorylation (IRmp)
(. . ., blue). (D) In Mi2, the effects of the two states of IR on the phosphorylation of IRS1 are dominated by the IR state with an early peak of
phosphorylation (IRmp). (E) The parameter sets in Mi2 that fit the IR and IRS1 data predict that < 10% of the IR pool is in the plasma mem-
brane 10 min after stimulation with insulin (- -, dark blue), while experimental determination has shown that 91 ± 7% (average ± SE, black)
of the receptors are found in the plasma membrane at that time [8].
E. Nyman et al. Explanation of counter-intuitive insulin signaling
FEBS Journal 279 (2012) 987–999 ª 2012 The Authors Journal compilation ª 2012 FEBS 991
We tested two model structures within the Mi-fb
hypothesis (Mi-fb1 and Mi-fb2), and both were statisti-
cally acceptable and could not be rejected based on the
qualitative and quantitative aspects of the experimental
data (Fig. 3B–D). Within the hypothesis also the sim-
ple model structure (Mi-fb1) with only one pool of
0 5 10 15 200
20
40
60
80
100
0 5 10 15 200
20
40
60
80
100
0 5 10 15 200
20
40
60
80
100
0 2 4 6 8 100
20
40
60
80
100
IR e
ffect
on
IRS
1 ph
osph
oryl
atio
n
0 5 10 15 200
10
20
30
40
50
60
Pho
spor
ylat
ed IR
bou
nd to
an
inhi
bito
ry p
rote
in p
erce
ntag
e of
tota
l IR
Time (min)
Time (min)Time (min)
Time (min)Time (min)
IRS
1 ph
osph
oryl
atio
n(p
erce
ntag
e of
max
imum
)
A B
C
E F
D
IR in
the
plas
ma
mem
bran
e(p
erce
ntag
e of
tota
l IR
)IR
pho
spho
ryla
tion
(per
cent
age
of m
axim
um)
IRmp effect on IRS1 without feedbackIRmp effect on IRS1 with feedback
Tyrosine-P
Tyrosine-P
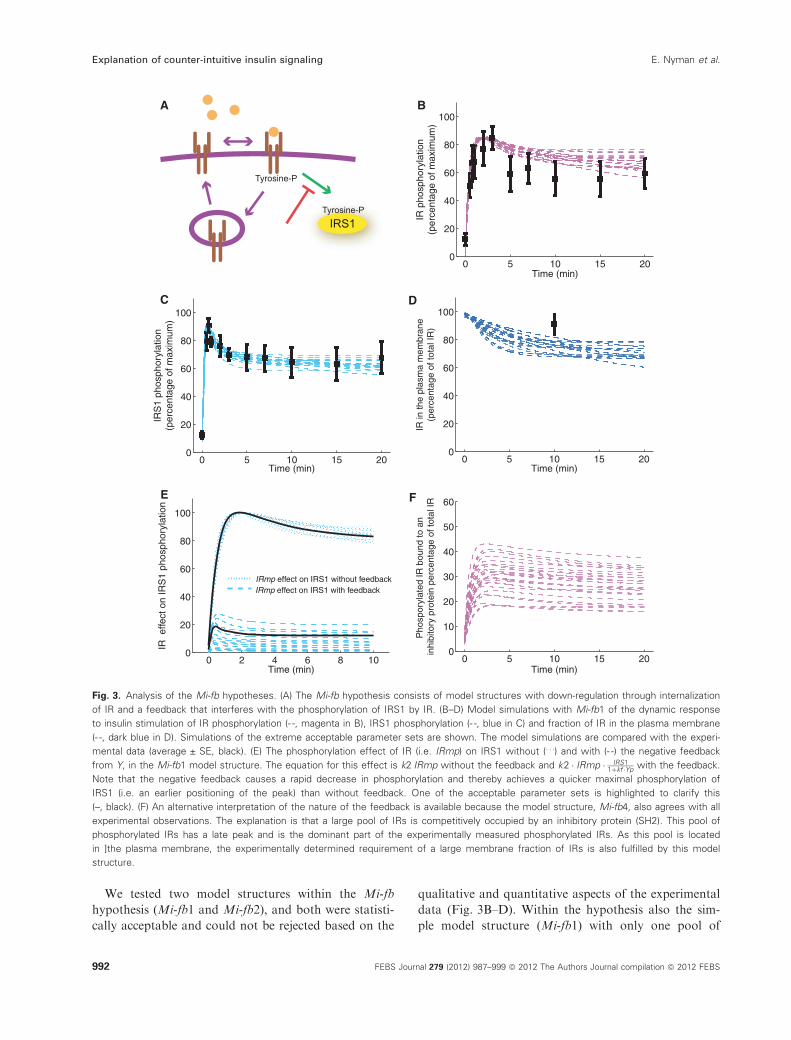
Fig. 3. Analysis of the Mi-fb hypotheses. (A) The Mi-fb hypothesis consists of model structures with down-regulation through internalization
of IR and a feedback that interferes with the phosphorylation of IRS1 by IR. (B–D) Model simulations with Mi-fb1 of the dynamic response
to insulin stimulation of IR phosphorylation (- -, magenta in B), IRS1 phosphorylation (- -, blue in C) and fraction of IR in the plasma membrane
(- -, dark blue in D). Simulations of the extreme acceptable parameter sets are shown. The model simulations are compared with the experi-
mental data (average ± SE, black). (E) The phosphorylation effect of IR (i.e. IRmp) on IRS1 without (. . .) and with (- -) the negative feedback
from Y, in the Mi-fb1 model structure. The equation for this effect is k2ÆIRmp without the feedback and k2 � IRmp � IRS11þkf �Yp
with the feedback.
Note that the negative feedback causes a rapid decrease in phosphorylation and thereby achieves a quicker maximal phosphorylation of
IRS1 (i.e. an earlier positioning of the peak) than without feedback. One of the acceptable parameter sets is highlighted to clarify this
(–, black). (F) An alternative interpretation of the nature of the feedback is available because the model structure, Mi-fb4, also agrees with all
experimental observations. The explanation is that a large pool of IRs is competitively occupied by an inhibitory protein (SH2). This pool of
phosphorylated IRs has a late peak and is the dominant part of the experimentally measured phosphorylated IRs. As this pool is located
in ]the plasma membrane, the experimentally determined requirement of a large membrane fraction of IRs is also fulfilled by this model
structure.
Explanation of counter-intuitive insulin signaling E. Nyman et al.
992 FEBS Journal 279 (2012) 987–999 ª 2012 The Authors Journal compilation ª 2012 FEBS
phosphorylated receptors was statistically acceptable,
and the explanation of the reversed order of the peaks
was thus not the same mechanism as in the previously
examined Mi-hypothesis. Examination of the simula-
tions revealed that the negative feedback provides a
mechanism for rapid inhibition of further phosphoryla-
tion of IRS1 so that the phosphorylation of IRS1
exhibits an earlier peak time (Fig. 3E). As a result of
scaling this gives an apparently faster phosphorylation
of IRS1 in the presence of the feedback. This mecha-
nism is an intuitively plausible explanation for the
reversed phosphorylation order.
We also tested to formulate this new feedback in
another way within the Mi-fb hypothesis. In two
additional model structures (Mi-fb3 and Mi-fb4,
Fig. S3) we included the feedback as the binding of a
protein (SH2) to phosphorylated IR and in that way
the binding and phosphorylation of IRS1 is competi-
tively inhibited. The most simple model structure,
Mi-fb3, is rejected because there is no combination of
models and parameters that can create an overshoot
for the total phosphorylated IR (Fig. S4). However,
the slightly more complex model structure, Mi-fb4,
where binding between the IR and the IRS1 is
included, reproduces the behavior in our experimental
data sets (Fig. S4). The explanation for the reversed
peak order is, in this case, that a large part of the
phosphorylated IR is sequestered by binding to the
inhibitory protein (SH2) and that this complex exhib-
its a late peak-time (Fig. 3F), while phosphorylated
IR that is free to bind and phosphorylate IRS1 is a
small part of the total IR and exhibits an early peak-
time. The inhibited pool of IR is located in the
plasma membrane and therefore the large fraction of
the IR localized in the plasma membrane is also
explained by the model structure Mi-fb4. All the
experimental data for phosphorylation of the IR and
the IRS1 in murine adipocytes, as well as the mea-
sured membrane fraction of IR, can thus be described
by three of the model structures examined from the
hypothesis Mi-fb (Table 1).
Limited availability of IRS1 for phosphorylation
by IR
Within the first Mi hypothesis we tested two model
structures (Mi3 and Mi4) that exhibit saturation of
the interaction between the IR and the IRS1. This
saturation can be modeled in another way, namely
through an assumption that IRS1 is in limited avail-
ability compared with the amount of IR. In a last
hypothesis, Mi-lim (Fig. 4A and Fig. S5), we tested
the effect of reducing the concentration of IRS1 to
1 ⁄ 100 of the concentration of IR. In this hypothesis
we need to take into account the actual binding of
IRS1 to IR and the complexity in the model struc-
tures therefore increases (Fig. S5). We found an
acceptable model structure (Mi-lim2) also within this
hypothesis (Table 1). The explanation for the
reversed peak order is the same as for the simpler
Mi hypothesis, namely generation of an early IRmp
peak, responsible for the phosphorylation of IRS1,
that is small compared with the late-peaking IRip.
The Mi-lim hypothesis, however, can also retain a
large fraction of the IR in the plasma membrane (as
required by experimental data), and can thus explain
all our data (Fig. 4B–D). The explanation for the
ability of the model to exhibit this behavior is that
the overshoot is not created by the IRmp state, but
by the binding of IRS1 to IRmp, because the
amount of free IRS1 decreases significantly during
the simulations (Fig. 4E). Without the need for an
overshoot in IRmp, the nonphosphorylated states of
the IR in the plasma membrane can instead domi-
nate; this domination was not possible in the Mi
hypothesis. The result of the drastic decrease of free
IRS1 is to produce an overshoot in the state with
IRmp–IRS1 in complex (Fig. 4F, hatched lines). The
overshoot disappears if the concentration of IRS1 is
increased again by a factor of 100 (Fig. 4F, dotted
lines).
A combined nonminimal model can explain data
from both murine and human adipocytes
We have used model-based hypothesis testing to iden-
tify a number of mechanisms crucial for explaining
both the qualitative and the quantitative aspects of
our experimental findings in murine adipocytes. In a
further step we combined the negative feedback in
the Mi-fb hypothesis with the Mif hypotheses, which
was originally developed for insulin signaling in
human adipocytes [5]. This combined model is not a
minimal model and thus is not intended to provide
conclusions, but it is a suggestion for a more com-
plete, and also complex, picture of the early signaling
events in murine adipocytes. The combined model
includes internalization of the IR (from the Mi
hypothesis), a feedback to enhance the dephosphory-
lation of internalized IR (from the Mif hypothesis)
and a negative feedback to the phosphorylation of
IRS1 by the IR (from the Mi-fb hypothesis) (Fig. 5A
and Fig. S6). The combined model can explain all
available data from the murine adipocytes (Fig. 5B–
D) because it is based on the Mi-fb hypothesis. The
model can also explain the data in the human
E. Nyman et al. Explanation of counter-intuitive insulin signaling
FEBS Journal 279 (2012) 987–999 ª 2012 The Authors Journal compilation ª 2012 FEBS 993

adipocytes because it is also based on the Mif
hypothesis. The only difference between the two spe-
cies is the values of the kinetic parameters. The num-
ber of parameters in the combined detailed model
(Fig. S6) compared with the Mi-fb1 model structure
(Fig. S3) has increased from 9 to 16, but the com-
bined model nevertheless passes a chi-square test,
even after subtracting the number of parameters from
the degrees of freedom:
v2ðcombined modelÞ ¼ 7:7 < v2ð23� 2� 16¼5;a ¼ 0:05Þ¼ 11,
where v2 (combined model) is a measure of the fit
between the model simulation and the experimen-
tal data, and v2 (23) 2)16 = 5, a = 0.05) is the
threshold for statistical acceptance for a model with
23)2)16 = 5 degrees of freedom (23 data points, two
normalizations and 16 parameters) and a level of sig-
nificance of 0.05. Finally, the fit to the data (Fig. 5B–
D) is visually more convincing for the combined
hypothesis compared with the simpler Mi-fb hypothesis
(Fig. 3B–D), which suggests, but does not prove, that
both mechanisms are operative in murine adipocytes.
Discussion
Our findings revealed two principally different mecha-
nisms that can create a counter-intuitive peak order in
the phosphorylation of IR and IRS1 in response to
0 1 2 3 4 50
20
40
60
80
100R
ate
of IR
−IR
S1
bind
ing
in th
e pl
asm
a m
embr
ane
(per
cent
age
of m
axim
um)
0 5 10 15 200
20
40
60
80
100
Free
non
−ph
osph
oryl
ated
IRS
1(p
erce
ntag
e of
tota
l IR
S1)
0 5 10 15 200
20
40
60
80
100
IRS
1 ph
osph
oryl
atio
n (p
erce
ntag
e of
max
imum
)
0 5 10 15 200
20
40
60
80
100
0 5 10 15 200
20
40
60
80
100
IR p
hosp
hory
latio
n (
perc
enta
ge o
f max
imum
)IR
in th
e pl
asm
a m
embr
ane
(per
cent
age
of to
tal I
R)
Time (min)
Time (min)
Time (min)Time (min)
Time (min)
Tyrosine-P
A B
C D
E F
Fig. 4. Analysis of the Mi-lim hypothesis. (A) The Mi-lim hypothesis consists of model structures with down-regulation through internaliza-
tion of IR and a limiting concentration of available IRS1. This hypothesis requires explicit binding between IR and IRS1. (B–D) Model simula-
tions with Mi-lim2 of the dynamic response to insulin stimulation of IR phosphorylation (- -, magenta in panel B), IRS1 phosphorylation
(- -, blue in panel C) and fraction of IR in the plasma membrane (- -, dark blue in panel D). Simulations of the extreme acceptable parameter
sets are shown. The model simulations are compared with the experimental data (average ± SE, black). (E) The free, nonphosphorylated
pool of IRS1 is of limited size and decreases significantly in response to insulin (- -, blue). (F) The limiting concentration of IRS1 gives rise
to a more pronounced overshoot in the rate of formation of the IRmp–IRS1 complex (- -, brown), compared with simulations using higher
concentrations of IRS1 (. . ., brown).
Explanation of counter-intuitive insulin signaling E. Nyman et al.
994 FEBS Journal 279 (2012) 987–999 ª 2012 The Authors Journal compilation ª 2012 FEBS

insulin: (i) phosphorylated IR consists mainly of inter-
nalized IR, but phosphorylation of IRS1 is governed
by the smaller phosphorylated and plasma membrane-
localized IR (Mi and Mi-lim hypotheses); and (ii) inhi-
bition of the IR-catalyzed phosphorylation of IRS1 by
negative feedback (Mi-fb hypothesis). The latter mech-
anism was further represented by two interpretations
of the negative feedback: (iia) downstream generation
of a feedback signal that inhibited IR activation or
activity against IRS1; and (iib) competitive inhibition
of IRS1 binding to active ⁄phosphorylated IR.
These findings are of general interest as the order of
phosphorylation is often used as an indicator of
causality: what comes first should be upstream of what
comes later. Our findings herein clearly show that
without a more thorough analysis, such a simple
deduction technique can lead to the wrong conclu-
sions. The widely used (also herein) measurements of
the relative extent of modification of proteins, rather
than measurements of absolute levels of modification,
can easily mask from direct inspection the true order
of modifications. In other words, even a moderately
complex signaling subsystem, involving only two sig-
naling proteins, requires mathematical modeling for
correct and complete data analysis.
Owing to the experimentally observed low extent of
IR internalization, only the mechanism with an inhibi-
tory negative feedback (i.e. Mi-fb, but not Mi or Mif)
can explain the data sets. However, we also examined
the effect of a limiting concentration of IRS1 in more
complex model structures with explicit binding
between the IR and the IRS1 (Mi-lim), and found that
to be an alternative explanation to the experimental
data. The mechanism behind the reversed peak order
is the same as in the simpler Mi hypothesis, but, in
addition, the experimentally determined low extent of
internalization can be reproduced by the Mi-lim
hypothesis. Thus, we have identified two fundamen-
tally different mechanisms (Mi-fb and Mi-lim) that can
explain all the available data for early insulin signaling
in murine adipocytes.
As our approach to mathematical modeling is, to
some extent, conceptually novel, we want to highlight
some of the properties of our results. Most impor-
tantly, our approach is centered around two types of
statements, which we refer to as conclusions: (a)
0 5 10 15 200
20
40
60
80
100
0 5 10 15 200
20
40
60
80
100
0 5 10 15 200
20
40
60
80
100
A B
C D
IRS
1 ph
osph
oryl
atio
n(p
erce
ntag
e of
max
imum
)
IR in
the
plas
ma
mem
bran
e(p
erce
ntag
e of
tota
l IR
)IR
pho
spho
ryla
tion
(per
cent
age
of m
axim
um)
Time (min)
Time (min)Time (min)
Tyrosine-P
Tyrosine-P
Tyrosine-P
Fig. 5. The combined detailed model. (A) The complete detailed model includes both the negative feedback of the Mi-fb hypothesis and the
final proposed model of the Mif hypothesis, which explains the data from human adipocytes. The model has a high level of detail and 16
parameters (Fig. S4). (B–D) Model simulations of the dynamic response to insulin stimulation of IR phosphorylation (- -, magenta in B), IRS1
phosphorylation (- -, blue in C) and fraction of IR in the plasma membrane (- -, dark blue in D). Simulations of the extreme acceptable parame-
ter sets are shown. The model simulations are compared with the experimental data (average ± SE, black).
E. Nyman et al. Explanation of counter-intuitive insulin signaling
FEBS Journal 279 (2012) 987–999 ª 2012 The Authors Journal compilation ª 2012 FEBS 995

model rejections and (b) uniquely identified core pre-
dictions. Recall that core predictions are model prop-
erties that have to be fulfilled for the corresponding
model structure to be able to explain the data, and
that these core predictions in practice may be found
as joint properties among all parameter sets that can
describe the existing data. We denote our two types
of statements as conclusions, for several reasons.
First, the statements (a) and (b) are final assessments
of the relationship between a model structure and
existing data from a system. This means that neither
of the statements will be altered by the collection of
more data (unless the old data were erroneous). A
rejected model will thus remain rejected also with
respect to a larger data set. Similarly, new data only
lead to more well-characterized properties in a model.
In other words, a core prediction is a property of a
model that always has to be fulfilled for the model
structure to explain the existing data from the studied
system, independently of how much data one collects
in the future. Second, our two types of statements are
independent of specific parameter values; this makes
the statements more conclusive because these parame-
ter values are rarely known or uniquely identifiable.
Finally, our two conclusive statements should be con-
trasted with the result of identifying a model, with
guessed or nonuniquely estimated parameters, and
then performing model analysis (such as metabolic
control analysis) at these parameters. The estimated
model or the results of such an analysis are then nei-
ther final statements nor statements independent of
the guessed parameter values. Such more conventional
statements are of the character ‘it may be in this
way, but it may also be in some other way’, which is
a suggestion, not a conclusion. For these reasons, we
denote the statements (a) and (b) as conclusions, and
our model approach as conclusive modeling. This
conclusive modeling approach has previously been
explained, discussed and exemplified [5].
The proposed negative feedback to IRS1 phosphory-
lation (Mi-fb) can be interpreted in several ways. The
feedback could represent the generation of an allosteric
inhibitor of IR or the phosphorylation of IRS1 at a
serine residue. Such serine phosphorylations have been
demonstrated to confer both positive and negative
effects on the ability of IRS1 to be phosphorylated by
IR or to affect the ability of protein tyrosine phospha-
tases to dephosphorylate IRS1 [9–14]. However, these
feedback mechanisms have relatively slow dynamics,
with maximal effects after 5–30 min in human adipo-
cytes [9] and after 10–60 min in C2C12 myoblasts [12].
An alternative interpretation, which is potentially more
rapid, is that the feedback consists of the competitive
binding of an inhibitory protein (e.g. SH2-domain-con-
taining protein) to tyrosine-phosphorylated IR to inhi-
bit phosphorylation of IRS1 [15,16]. There are also
possibilities of post-translational modifications of a
protein to induce binding of the protein to IR or to
IRS1, and thereby to inhibit further phosphorylation
of IRS1. Elucidation of the exact mechanism of the
proposed feedback will require further investigation.
This discovery of a feedback signal that is not present
to the same extent in the corresponding human cells is
important because murine cells are a dominant model
for the study of insulin signaling – normally and in
type 2 diabetes.
The limiting concentration of IRS1 in the Mi-lim
hypothesis does not necessarily represent the total
IRS1 concentration in the cell, but may also represent
a small pool of IRS1 molecules localized in proximity
to IR in the cells. We have previously demonstrated
that IRS1 is co-localized with IR in caveolae microdo-
mains of the plasma membrane in human adipocytes
but not in rat adipocytes [3,4]. It is therefore possible
that the pool of IRS1 that can readily bind to IR is a
limiting factor in rat adipocytes. We have also
reported other differences between human and rat
adipocytes [3,4,17,18]. One such difference is that
depletion of cholesterol in the plasma membrane inter-
feres with insulin control of the mitogen-activated pro-
tein kinases ERK1 ⁄ 2 in human adipocytes [3] but not
in rat adipocytes [17]. Collectively, such findings con-
stitute a strong warning against reliance on animal
models to accurately reflect the human situation.
Materials and methods
Materials
Monoclonal anti-phosphotyrosine (PY20) IgGs were from
Transduction Laboratories (Lexington, KY, USA). Anti-
insulin receptor b-chain and anti-IRS1 rabbit polyclonal
IgGs were from Santa Cruz Biotechnology (Santa Cruz,
CA, USA). Insulin and other chemicals were from Sigma-
Aldrich (St Louis, MO, USA) or as indicated. Harlan
Sprague Dawley rats (140–160 g in weight) were obtained
from B&K Universal (Sollentuna, Sweden) and treated in
accordance with Swedish animal care regulations. The rats
were killed with 70% CO2 in air and epididymal adipose
tissue was excised.
Isolation and incubation of adipocytes
Adipocytes were isolated by digestion with type 1 collagenase
(Worthington, Lakewood, NJ, USA) [19]. The cells were
incubated in Krebs-Ringer solution (0.12 M NaCl, 4.7 mM
Explanation of counter-intuitive insulin signaling E. Nyman et al.
996 FEBS Journal 279 (2012) 987–999 ª 2012 The Authors Journal compilation ª 2012 FEBS

KCl, 2.5 mM CaCl2, 1.2 mM MgSO4, 1.2 mM KH2PO4) con-
taining 20 mM Hepes, pH 7.40, 1% [weight by volume (w ⁄ v)]fatty acid-free BSA, 100 nM phenylisopropyladenosine,
0.5 UÆmL)1 of adenosine deaminase and 2 mM glucose, at
37 �C, except as indicated, on a shaking water bath.
Protein phosphorylation
Cell incubations were terminated by separating cells from
medium using centrifugation through dinonylphtalate. To
minimize postincubation signaling and protein modifica-
tions, which can occur during immunoprecipitation, the
cells were immediately dissolved in SDS and b-mercapto-
ethanol containing protease and protein phosphatase
inhibitors, frozen within 10 s and thawed in boiling water
for further processing [19]. Equal volumes of cells, as
determined by lipocrit, were subjected to SDS ⁄PAGE and
immunoblotting [18]. The phosphorylation of IRS1 and
IR was normalized to the amount of IRS1 and IR
protein, respectively, in each sample.
Immunoblotting
Cell proteins were separated by SDS ⁄PAGE, transferred to
a poly(vinylidene difluoride) blotting membrane (Immobi-
lon-P; Millipore, Bedford, MA, USA) and incubated with
the indicated primary antibodies. Bound antibodies were
detected using Renaissence+ (PerkinElmer Inc., Shelton,
CT, USA) or enhanced chemiluminescence (ECL) (Amer-
sham Biosciences, Amersham, UK) with horseradish perox-
idase-conjugated anti-IgG as secondary antibody. Blots
were evaluated by chemiluminescence imaging (Las 1000;
Fuji, Tokyo, Japan).
Hypotheses, model structures and models
A hypothesis gathers all model structures with a mechanistic
common denominator that are to be evaluated. For example,
the internalization hypothesis, Mi, contains model structures
with down-regulation through internalization and subse-
quent dephosphorylation of the receptor. A model structure
is a collection of a set of ordinary differential equations:
_x ¼ dx
dt¼ f ðx; pÞ
y ¼ gðx; pÞ ¼XN
i¼1
Xi,
where x represents the states, p represents the kinetic rate
constants, y represents the measured signals, f and g are
nonlinear functions that describe a set of specific
dynamic ⁄mechanistic assumptions and the index i runs over
the states that are included in the measured signals (i.e. the
phosphorylated states of IR and IRS1).
A model structure is hence a specific instance of a hypoth-
esis, and the model structures for hypothesis Mi are denoted
Mi1, Mi2, etc. A model is a model structure with specified
parameters (i.e. with specified values for the initial condi-
tions and for the kinetic and measurement parameters).
Optimization and statistical testing
The optimization is centered around a cost function, V(p),
that for the quantitative agreement with experimental data
is given by the sum of least squares:
VðpÞ ¼XN
i¼1
ðyðiÞ � yði; pÞÞ2
rðiÞ2,
where y(i) is the measured signal and yði; pÞ is the simulated
curve that we scale in the same way as we scale the experi-
mental data. In other words, we divide all simulated values
with the maximal simulated value. Furthermore, r(i) is cho-
sen as the SEM, as our models describe mean values, not
individual measurements. The summation of least squares
runs over all measured mean points, where the index i runs
over both different time-points and measured signals. For the
qualitative agreements with data (i.e. overshoot behavior and
order of peak values), we use weighted penalties to force the
optimization to recognize the wanted behavior. The wanted
overshoot behavior will, for example, be captured by the fol-
lowing penalty formulation:
if maxðyÞ< 1:1 � yðendÞ
cost ¼ cost þ ðmaxðyÞ � 1:1 � yðendÞÞ2
end,
where the penalty kicks in when the peak value goes below
110% of the steady-state value; the penalty increases line-
arly with the transgression beyond the threshold. Note that
these penalties are included only to help shape the cost
function landscape to make the search easier, and that the
penalties were used only regarding qualitative assessments
(Table 1) and in cases in which it was difficult to find any
acceptable parameters.
For the optimization we used the Systems Biology Tool-
box for Matlab [20] and its simannealing SBAO function,
which is a combination of a global simulated annealing
approach with a local, but not gradient-based, downhill
simplex approach. In this work we used the following
scheme to search for and gather statistically acceptable
parameter sets: we started with the temperature 10 000 and
lowered the temperature by a factor of 0.1 and used 1000
iterations per temperature step. This should be compared
with the fact that the cost function rarely exceeds 5000,
implying that we search more or less completely global at
the beginning of the optimization. For each temperature
E. Nyman et al. Explanation of counter-intuitive insulin signaling
FEBS Journal 279 (2012) 987–999 ª 2012 The Authors Journal compilation ª 2012 FEBS 997
step, 10 simplexes, far apart from each other in the para-
meter space, were used. When no acceptable parameters
were found we re-ran the scheme with the best found solu-
tion until no better solution was found. If the best solution
was unacceptable we rejected the model structure. For the
models where we found acceptable parameter sets we exam-
ined all statistically acceptable sets of parameters to unravel
the behavior of the model structure rather than for a spe-
cific model with a single parameter set. In the figures we
show model simulations of all extreme acceptable parame-
ter sets identified (i.e. the statistically acceptable parameter
sets that contain a maximum or a minimum value of one of
the parameters). We tested the statistical fit between model
simulation and experimental data using a chi-square test [7]
with a confidence level of 95%. Regarding degrees of free-
dom for the chi-square test, we used the number of data
points and either just compensated for the normalization
by subtracting 2 degrees of freedom, or, in the proposed
final combined model, also for the number of parameters
by subtracting 16 degrees of freedom.
Acknowledgements
The project was been funded by the European Com-
mission Network of Excellence ‘Biosim’, Ostergotland
County Council, Novo Nordisk Foundation, Lions,
Swedish Diabetes Association, and the Swedish
Research Council. We thank project members Julia
Carlsson, Oscar Dahlberg, Erika Einarsson, Patrik
Johansson, Zeljana Magic, Wiktor Suvander, and Elias
Trygg, from the course TSRT17, for cross-checking
some of the modeling results in this paper.
References
1 Herman MA & Kahn BB (2006) Glucose transport and
sensing in the maintenance of glucose homeostasis and
metabolic harmony. J Clin Invest 116, 1767–1775.
2 Gustavsson J, Parpal S, Karlsson M, Ramsing C,
Thorn H, Borg M, Lindroth M, Peterson KH, Magnus-
son KE & Stralfors P (1999) Localization of the insulin
receptor in caveolae of adipocyte plasma membrane.
FASEB J 13, 1961–1971.
3 Karlsson M, Thorn H, Danielsson A, Stenkula KG, Ost
A, Gustavsson J, Nystrom FH & Stralfors P (2004) Colo-
calization of insulin receptor and insulin receptor sub-
strate-1 to caveolae in primary human adipocytes.
Cholesterol depletion blocks insulin signalling for meta-
bolic and mitogenic control. Eur J Biochem 271, 2471–
2479, doi: 10.1111/j.1432-1033.2004.04177.x EJB4177 [pii].
4 Stenkula KG, Thorn H, Frank N, Hallin E, Sauma L,
Nystrom FH & Stralfors P (2007) Human, but not rat,
IRS1 targets to the plasma membrane in both human
and rat adipocytes. Biochem Biophys Res Commun 363,
840–845.
5 Brannmark C, Palmer R, Glad ST, Cedersund G &
Stralfors P (2010) Mass and information feedbacks
through receptor endocytosis govern insulin signaling as
revealed using a parameter-free modeling framework.
J Biol Chem 285, 20171–20179, doi: M110.106849 [pii]
10.1074/jbc.M110.106849.
6 Cedersund G, Roll J, Ulfhielm E, Danielsson A,
Tidefelt H & Stralfors P (2008) Model-based hypothesis
testing of key mechanisms in initial phase of insulin sig-
naling. PLoS Comput Biol 4, e1000096, doi: 10.1371/
journal.pcbi.1000096.
7 Cedersund G & Roll J (2009) Systems biology: model
based evaluation and comparison of potential explana-
tions for given biological data. FEBS J 276, 903–922,
doi: EJB6845 [pii] 10.1111/j.1742-4658.2008.06845.x.
8 Fagerholm S, Ortegren U, Karlsson M, Ruishalme I &
Stralfors P (2009) Rapid insulin-dependent endocytosis
of the insulin receptor by caveolae in primary adipo-
cytes. PLoS One 4, e5985, doi:10.1371/journal.pone.
0005985.
9 Danielsson A, Nystrom FH & Stralfors P (2006) Phos-
phorylation of IRS1 at serine 307 and serine 312 in
response to insulin in human adipocytes. Biochem Bio-
phys Res Commun 342, 1183–1187, doi:S0006-291X(06)
00354-8 [pii] 10.1016/j.bbrc.2006.02.075.
10 Moeschel K, Beck A, Weigert C, Lammers R, Kalbach-
er H, Voelter W, Schleicher ED, Haring HU & Leh-
mann R (2004) Protein kinase C-zeta-induced
phosphorylation of Ser318 in insulin receptor substrate-
1 (IRS-1) attenuates the interaction with the insulin
receptor and the tyrosine phosphorylation of IRS-1.
J Biol Chem 279, 25157–25163, doi:10.1074/jbc.M402
477200 M402477200 [pii].
11 Paz K, Liu YF, Shorer H, Hemi R, LeRoith D, Quan
M, Kanety H, Seger R & Zick Y (1999) Phosphoryla-
tion of insulin receptor substrate-1 (IRS-1) by protein
kinase B positively regulates IRS-1 function. J Biol
Chem 274, 28816–28822.
12 Weigert C, Kron M, Kalbacher H, Pohl AK, Runge H,
Haring HU, Schleicher E & Lehmann R (2008) Inter-
play and effects of temporal changes in the phosphory-
lation state of serine-302, -307, and -318 of insulin
receptor substrate-1 on insulin action in skeletal muscle
cells. Mol Endocrinol 22, 2729–2740, doi: me.2008-0102
[pii] 10.1210/me.2008-0102.
13 Johnston AM, Pirola L & vanObberghen E (2003)
Molecular mechanisms of insulin receptor substrate pro-
tein-mediated modulation of insulin signalling. FEBS
Lett 546, 32–36.
14 Zick Y (2004) Uncoupling insulin signalling by ser-
ine ⁄ threonine phosphorylation: a molecular basis for
insulin resitance. Biochem Soc Trans 32, 812–816.
Explanation of counter-intuitive insulin signaling E. Nyman et al.
998 FEBS Journal 279 (2012) 987–999 ª 2012 The Authors Journal compilation ª 2012 FEBS

15 Terauchi Y, Tsuji Y, Satoh S, Minoura H, Murakami
K, Okuno A, Inukai K, Asano T, Kaburagi Y,
Ueki K et al. (1999) Increased insulin sensitivity
and hypoglycaemia in mice lacking the p85 alpha
subunit of phosphoinositide 3-kinase. Nat Genet 21,
230–235.
16 Luo J & Cantley LC (2005) The negative regulation of
phosphoinositide 3-kinase signaling by p85 and its impi-
cation in cancer. Cell Cycle 4, 1309–1312.
17 Parpal S, Karlsson M, Thorn H & Stralfors P (2001)
Cholesterol depletion disrupts caveolae and
insulin receptor signaling for metabolic control
via insulin receptor substrate-1, but not for
mitogen-activated protein kinase control. J Biol Chem
276, 9670–9678, doi:10.1074/jbc.M007454200 M00745
4200 [pii].
18 Danielsson A, Ost A, Lystedt E, Kjolhede P,
Gustavsson J, Nystrom FH & Stralfors P (2005) Insulin
resistance in human adipocytes occurs downstream of
IRS1 after surgical cell isolation but at the level of
phosphorylation of IRS1 in type 2 diabetes. FEBS J
272, 141–151, doi: EJB4396 [pii] 10.1111/j.1432-1033.
2004.04396.x.
19 Stralfors P & Honnor RC (1989) Insulin-induced
dephosphorylation of hormone-sensitive lipase. Correla-
tion with lipolysis and cAMP-dependent protein kinase
activity. Eur J Biochem 182, 379–385.
20 Schmidt H & Jirstrand M (2006) Systems
Biology Toolbox for MATLAB: a computational
platform for research in systems biology. Bioinformat-
ics 22, 514–515, doi:bti799 [pii] 10.1093/bioinformatics/
bti799.
Supporting information
The following supplementary information is available:
Fig. S1. The model structures within the hypothesis
Mf.
Fig. S2. The model structures within the hypotheses
Mi and Mif.
Fig. S3. The model structures within the hypothesis
Mi-fb.
Fig. S4. Model simulations from the model structures
Mi-fb3 and Mi-fb4.
Fig. S5. The model structures within the hypothesis
Mi-lim.
Fig. S6. The combined detailed model.
Data S1. Supplementary File "SimulationFiles.zip"
contains all Matlab scripts, including model files, used
to obtain the conclusions in the paper. These models
can also be simulated using the Online Cellular Sys-
tems Modelling Database and can be accessed at
http://jjj.biochem.sun.ac.za/database/nyman/index.html
free of charge.
This supplementary material can be found in the
online version of this article.
Please note: As a service to our authors and readers,
this journal provides supporting information supplied
by the authors. Such materials are peer-reviewed and
may be reorganized for online delivery, but are not
copy-edited or typeset. Technical support issues arising
from supporting information (other than missing files)
should be addressed to the authors.
E. Nyman et al. Explanation of counter-intuitive insulin signaling
FEBS Journal 279 (2012) 987–999 ª 2012 The Authors Journal compilation ª 2012 FEBS 999
Related Documents