Research Resource: New and Diverse Substrates for the Insulin Receptor Isoform A Revealed by Quantitative Proteomics After Stimulation With IGF-II or Insulin Alaide Morcavallo, Marco Gaspari, Giuseppe Pandini, Angela Palummo, Giovanni Cuda, Martin R. Larsen, Riccardo Vigneri, and Antonino Belfiore Laboratories of Endocrinology (A.M., A.P., A.B.) and Proteomics (M.G., G.C.), Department of Clinical and Experimental Medicine, University Magna Graecia of Catanzaro, 88100 Catanzaro, Italy; Department of Internal Medicine and Medical Specialties (G.P., R.V.), Endocrinology, University of Catania, 95123 Catania, Italy; and Department of Biochemistry and Molecular Biology (M.R.L.), University of Southern Denmark, DK-5230 Odense, Denmark The isoform A of the insulin receptor (IR) (IR-A) is a bifunctional receptor, because it binds both insulin and IGF-II. IR-A activation by IGF-II plays a role in development, but its physiological role in adults is unknown. IGF-II signaling through IR-A is deregulated in cancer and favors tumor pro- gression. We hypothesized that IGF-II binding to the IR-A elicits a unique signaling pathway. In order to obtain an unbiased evaluation of IR-A substrates differentially involved after IGF-II and insulin stimulation, we performed quantitative proteomics of IR-A substrates recruited to ty- rosine-phosphorylated protein complexes using stable isotope labeling with amino acids in cell culture in combination with antiphosphotyrosine antibody pull down and mass spectrometry. Using cells expressing only the human IR-A and lacking the IGF-I receptor, we identified 38 IR-A substrates. Only 10 were known IR mediators, whereas 28 substrates were not previously related to IR signaling. Eleven substrates were recruited by stimulation with both ligands: two equally recruited by IGF-II and insulin, three more strongly recruited by IGF-II, and six more strongly recruited by insulin. Moreover, 14 substrates were recruited solely by IGF-II and 13 solely by insulin stimulation. Interestingly, discoidin domain receptors, involved in cell migration and tumor me- tastasis, and ephrin receptor B4, involved in bidirectional signaling upon cell-cell contact, were predominantly activated by IGF-II. These findings indicate that IR-A activation by IGF-II elicits a unique signaling pathway that may play a distinct role in physiology and in disease. (Molecular Endocrinology 25: 1456 –1468, 2011) I n recent years, the functional role of the two isoforms (A and B) of the insulin receptor (IR) has attracted renewed interest due to the finding that the IR isoform A (IR-A), generated by removal of exon 11, besides binding insulin, also binds IGF-II with high affinity (1). This IR-A binding feature is not shared by the IR-B isoform that contains the 12-amino acid string encoded by exon 11. IR-A has phys- iological significance in prenatal life, because its activa- tion by IGF-II plays a crucial role in embryo and fetal development (2, 3). However, the physiological role of IR-A in adult life remains unclear. In adults, IR-A expres- sion is predominant in nonclassical insulin target tissues (spleen, brain, etc.), whereas IR-B expression is predomi- nant in classical insulin target tissues, such as liver, fat, and ISSN Print 0888-8809 ISSN Online 1944-9917 Printed in U.S.A. Copyright © 2011 by The Endocrine Society doi: 10.1210/me.2010-0484 Received November 22, 2010. Accepted May 20, 2011. First Published Online June 16, 2011 Abbreviations: ABI1, Abelson interactor 1; ACN, acetonitrile; Arp, actin-related protein 2; Cdc42, cell division control protein 42; CIP4, Cdc42-interacting protein 4; DDR, discoidin domain receptor; EphB4, ephrin type-B receptor 4; H, heavy; HA, hyaluronan; i.d., inner diameter; IGF-IR, IGF receptor; IR, insulin receptor; IR-A, IR isoform A; IRS, IR substrate; L, light; LC, liquid chromatography; M, medium; MS, mass spectrometry; Myo10, myosin X; Nckap, Nck-associated protein; PI3K, phosphatidylinositol 3-kinase; Rac, Ras-related C3 botulinum toxin substrate 1; Ras, GTPase-activating protein Ras; Rhamm, receptor for HA-mediated motility; Sra, Rac1-associated protein-1; SH, Src homology; SILAC, stable isotope labeling with amino acids in cell culture; SPIN90, NCK interacting protein with SH3 domain; Src, proto-oncogene tyrosine-protein kinase Src; STRING, Search Tool for the Retrieval of Interacting Genes/Proteins; TFA, trifluoroacetic acid; WAVE2, Wiskott-Aldrich syndrome protein family member 2. RESEARCH RESOURCE 1456 mend.endojournals.org Mol Endocrinol, August 2011, 25(8):1456 –1468

Welcome message from author
This document is posted to help you gain knowledge. Please leave a comment to let me know what you think about it! Share it to your friends and learn new things together.
Transcript

Research Resource: New and Diverse Substrates forthe Insulin Receptor Isoform A Revealed byQuantitative Proteomics After Stimulation With IGF-IIor Insulin
Alaide Morcavallo, Marco Gaspari, Giuseppe Pandini, Angela Palummo,Giovanni Cuda, Martin R. Larsen, Riccardo Vigneri, and Antonino Belfiore
Laboratories of Endocrinology (A.M., A.P., A.B.) and Proteomics (M.G., G.C.), Department of Clinicaland Experimental Medicine, University Magna Graecia of Catanzaro, 88100 Catanzaro, Italy;Department of Internal Medicine and Medical Specialties (G.P., R.V.), Endocrinology, University ofCatania, 95123 Catania, Italy; and Department of Biochemistry and Molecular Biology (M.R.L.),University of Southern Denmark, DK-5230 Odense, Denmark
The isoform A of the insulin receptor (IR) (IR-A) is a bifunctional receptor, because it binds bothinsulin and IGF-II. IR-A activation by IGF-II plays a role in development, but its physiological role inadults is unknown. IGF-II signaling through IR-A is deregulated in cancer and favors tumor pro-gression. We hypothesized that IGF-II binding to the IR-A elicits a unique signaling pathway. Inorder to obtain an unbiased evaluation of IR-A substrates differentially involved after IGF-II andinsulin stimulation, we performed quantitative proteomics of IR-A substrates recruited to ty-rosine-phosphorylated protein complexes using stable isotope labeling with amino acids in cellculture in combination with antiphosphotyrosine antibody pull down and mass spectrometry.Using cells expressing only the human IR-A and lacking the IGF-I receptor, we identified 38 IR-Asubstrates. Only 10 were known IR mediators, whereas 28 substrates were not previously relatedto IR signaling. Eleven substrates were recruited by stimulation with both ligands: two equallyrecruited by IGF-II and insulin, three more strongly recruited by IGF-II, and six more stronglyrecruited by insulin. Moreover, 14 substrates were recruited solely by IGF-II and 13 solely by insulinstimulation. Interestingly, discoidin domain receptors, involved in cell migration and tumor me-tastasis, and ephrin receptor B4, involved in bidirectional signaling upon cell-cell contact, werepredominantly activated by IGF-II. These findings indicate that IR-A activation by IGF-II elicits aunique signaling pathway that may play a distinct role in physiology and in disease. (MolecularEndocrinology 25: 1456–1468, 2011)
In recent years, the functional role of the two isoforms (Aand B) of the insulin receptor (IR) has attracted renewed
interest due to the finding that the IR isoform A (IR-A),generated by removal of exon 11, besides binding insulin,also binds IGF-II with high affinity (1). This IR-A bindingfeature is not shared by the IR-B isoform that contains the12-amino acid string encoded by exon 11. IR-A has phys-iological significance in prenatal life, because its activa-tion by IGF-II plays a crucial role in embryo and fetaldevelopment (2, 3). However, the physiological role of
IR-A in adult life remains unclear. In adults, IR-A expres-sion is predominant in nonclassical insulin target tissues(spleen, brain, etc.), whereas IR-B expression is predomi-nant in classical insulin target tissues, such as liver, fat, and
ISSN Print 0888-8809 ISSN Online 1944-9917Printed in U.S.A.Copyright © 2011 by The Endocrine Societydoi: 10.1210/me.2010-0484 Received November 22, 2010. Accepted May 20, 2011.First Published Online June 16, 2011
Abbreviations: ABI1, Abelson interactor 1; ACN, acetonitrile; Arp, actin-related protein 2;Cdc42, cell division control protein 42; CIP4, Cdc42-interacting protein 4; DDR, discoidindomain receptor; EphB4, ephrin type-B receptor 4; H, heavy; HA, hyaluronan; i.d., innerdiameter; IGF-IR, IGF receptor; IR, insulin receptor; IR-A, IR isoform A; IRS, IR substrate; L,light; LC, liquid chromatography; M, medium; MS, mass spectrometry; Myo10, myosin X;Nckap, Nck-associated protein; PI3K, phosphatidylinositol 3-kinase; Rac, Ras-related C3botulinum toxin substrate 1; Ras, GTPase-activating protein Ras; Rhamm, receptor forHA-mediated motility; Sra, Rac1-associated protein-1; SH, Src homology; SILAC, stableisotope labeling with amino acids in cell culture; SPIN90, NCK interacting protein with SH3domain; Src, proto-oncogene tyrosine-protein kinase Src; STRING, Search Tool for theRetrieval of Interacting Genes/Proteins; TFA, trifluoroacetic acid; WAVE2, Wiskott-Aldrichsyndrome protein family member 2.
R E S E A R C H R E S O U R C E
1456 mend.endojournals.org Mol Endocrinol, August 2011, 25(8):1456–1468

muscle. The fact that IR-A is coexpressed with IR-B in thesetissues, especially in muscle and fat, remains puzzling (3).
Limited evidence suggests that the two IR isoformsmay activate partially different intracellular signaling andbiological effects in response to insulin, at least in somecellular models (4, 5). However, we hypothesize that thebiological significance of the ubiquitous IR-A expressionin adult tissues is related with its high affinity for theIGF-II (3).
IGF-II signaling through the IR-A may play a role incertain diseases, such as type 2 diabetes mellitus and can-cer (3, 6). IR-A is often overexpressed in a variety ofhuman malignancies, and activation of an autocrine IR-A/IGF-II loop is associated with cancer progression anddedifferentiation (1, 7–9). Anticancer therapies targetingthe IGF receptor (IGF-IR) do not block IGF-II signalingthrough the IR-A, although they block IGF-II binding tothe IGF-IR (9, 10).
For these reasons, it is important to unravel the intra-cellular signaling network activated by IGF-II binding tothe IR-A. In particular, we asked whether IGF-II signalingthrough IR-A is unique or just overlaps with insulin sig-naling. We have previously shown that in mouse fibro-blasts expressing only IR-A and lacking IGF-IR (R�/IR-Acells), IGF-II is a more potent mitogen than insulin (1) andelicits a gene expression profile partially different fromthat elicited by insulin (11, 12). We have also found that,in R�/IR-A cells, IGF-II induces a different balance be-tween the activation of the phosphatidylinositol 3-kinase(PI3K) and the ERK1/2 pathways as compared with in-sulin. As a consequence, IGF-II stimulates a signaling pat-tern characterized by increased ERK1/2:PI3K and p70S6kinase:protein kinase B activation ratios as comparedwith insulin (13).
To identify new proximal effectors of the IR-A andadditional differences between IGF-II and insulin in intra-cellular signaling, we undertook an unbiased approachaimed at identifying the components of protein com-plexes differentially activated by stimulation of R�/IR-Acells with either IGF-II or insulin. We used a mass spec-trometry (MS)-based proteomic approach [stable isotopelabeling with amino acids in cell culture (SILAC)], whichallows comparison between immunoprecipitated pro-teins from different cell culture conditions (14, 15).
We identified a number of IR effectors previously de-scribed in other model systems and also several new ef-fectors recruited by IR-A activation. Although the IGF-IIaffinity for IR-A is approximately 4-fold lower than thatof insulin (1), some of these effectors were approximatelyequally activated by the two ligands. Most intriguingly,several other IR-A effectors were exclusively activated ormore potently activated by one ligand, either IGF-II or
insulin. These findings confirm that IGF-II, via the IR-A,activates a unique signaling pathway, which may play anexclusive role in physiology and disease.
Results
Quantitative SILAC analysis of intracellularmediators after stimulation of R�/IR-A cells byeither IGF-II or insulin
To obtain a quantitative and unbiased analysis of thesignaling networks activated by IGF-II and insulin uponIR-A binding, we used R�/IR-A cells. As previously re-ported, these mouse fibroblasts overexpress the humanIR-A (�5 � 105 receptors per cell) and lack the IGF-IR.They also express low levels of endogenous IR-A, but noIR-B (13). Subconfluent R�/IR-A cell cultures were sub-divided in three sets and grown in unlabeled or labeledmedium, as indicated in Materials and Methods. After com-plete labeling, cells of the first set were stimulated with ve-hicle alone, the second set was stimulated with IGF-II (10nM) and the third one with insulin (10 nM) for 1 min. Cellslysates from the three different cell cultures were mixed, andtyrosine-phosphorylated proteins were purified by anti-phosphotyrosine-antibody pull down, and the proteins weresubsequently processed for liquid chromatography (LC)-MS/MS analysis, as described in Materials and Methods(Fig. 1). The experiment was repeated twice and analyzed asdescribed in Materials and Methods. Representative MSspectra of IR-A substrates are shown in Supplemental Figs. 1and 2, published on The Endocrine Society’s Journals On-line web site at http://mend.endojournals.org.
By LC-MS/MS analysis, a total of 158 gene productswas identified and quantified in the first experiment,whereas a total of 277 gene products was identified andquantified in the second experiment. Proteins, whose re-cruitment to the phosphotyrosine protein complexes oc-curred as a consequence of ligand stimulation, were con-sidered effectors of IGF-II and/or insulin in R�/IR-A cells.Our approach was aimed at identifying not only proteinsphosphorylated in tyrosine residues after stimulation butalso proteins that closely interact with direct interactorsand are involved in downstream signaling. A total of 38proteins showed a significant difference after either IGF-IIor insulin stimulation; 10/38 of them are known IR me-diators (Table 1), whereas 28/38 represent newly identi-fied effectors of IR-A signaling (Table 2).
Quantitative analysis of known IR mediatorsinvolved in IR-A signaling after stimulation witheither IGF-II or insulin
Ten proteins known to be involved in IR signaling werefound positively (activated, n � 9) or negatively recruited
Mol Endocrinol, August 2011, 25(8):1456–1468 mend.endojournals.org 1457

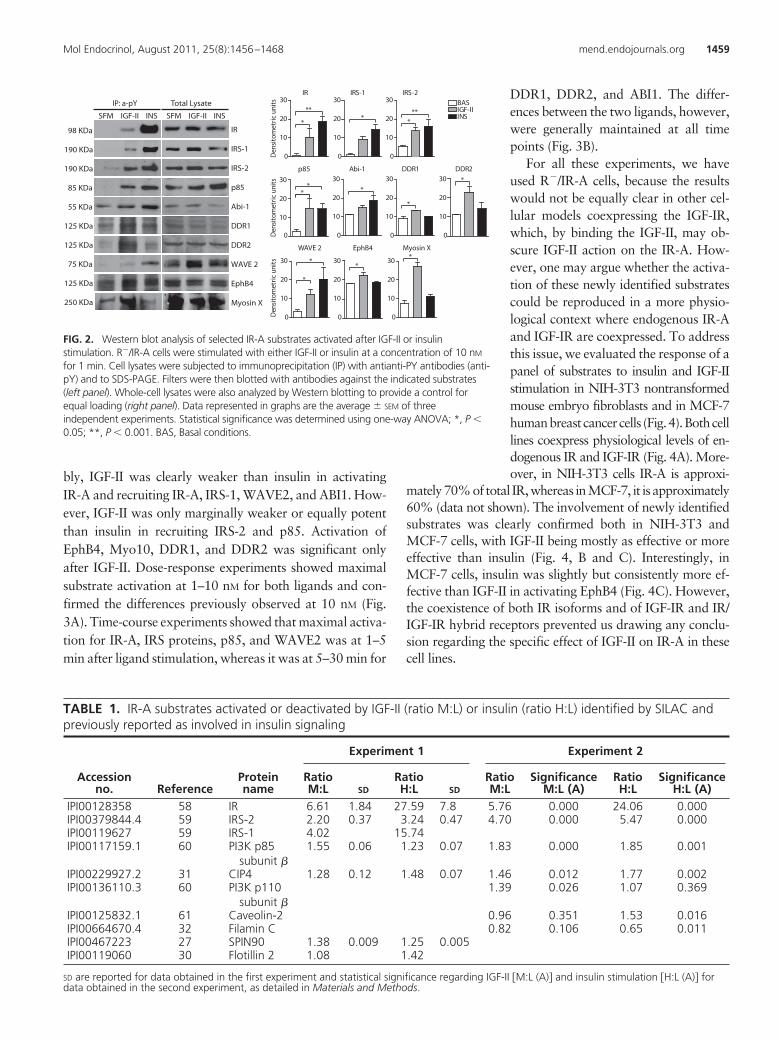
(deactivated, n � 1) to tyrosine-phosphorylated proteincomplexes after stimulation with either insulin or IGF-IIor both (Table 1). These findings provided a proof ofconcept that our SILAC approach was appropriate. Asexpected, the IR-A itself was the protein with the greatestlevel of activation as compared with unstimulated cells.The degree of activation was approximately 4-fold higherafter insulin than after IGF-II, in accordance with therelative IR-A binding affinity for the two ligands (Table1). The two immediate IR substrates (IRS), IRS-1 andIRS-2, were also found activated. However, althoughIRS-1 activation was approximately 4-fold greater afterinsulin than after IGF-II, IRS-2 activation was onlyslightly greater after insulin than after IGF-II. Intrigu-ingly, the p85� regulatory subunit of PI3K, a major sig-naling mediator of IR, was approximately equally re-cruited after IGF-II and insulin stimulation, whereas thePI3K catalytic subunit p110� was significantly associatedonly with IGF-II stimulation (Table 1).
NCK interacting protein with SH3 domain (SPIN90) alsoappeared to be activated solely by IGF-II, whereas caveo-lin-2 and flotilin-2 appeared to be activated solely by insulin
(Table 1). Filamin C was negatively associated with phos-photyrosine complexes only after insulin stimulation.
Quantitative analysis of new mediators involvedin IR-A signaling upon IGF-II or insulin stimulation
Twenty-eight mediators not previously directly associ-ated with insulin signaling were identified as positively ornegatively recruited to tyrosine-phosphorylated proteinsafter insulin and/or IGF-II (Table 2).
The receptor for hyaluronan (HA)-mediated motility(Rhamm) was approximately equally responsive to bothligands. However, cytoplasmic FMR 1-interacting pro-tein 1, Wiskott-Aldrich syndrome protein family member2 (WAVE2), Abelson interactor 1 (ABI1), Nck-associatedprotein (Nckap)1, and F-actin capping protein �-subunitwere all strongly activated after insulin and weakly acti-vated or nonactivated after IGF-II (Table 2). All thesemolecules participate in actin cytoskeletal reorganization.Protein kinase C �-binding protein, a component of cave-olae, was only responsive to insulin.
In contrast, myosin X (Myo10), a protein expressed witha role in filopodia formation, as well as discoidin domainreceptors (DDR), transmembrane collagen-binding receptortyrosine kinases that are involved in the regulation of cell adhe-sion and migration, were activated predominantly by IGF-II.
The ephrin receptor ephrin type-B receptor 4 (EphB4),which has a crucial role in the regulation of morphogen-esis, angiogenesis, and cell migration, and spectrin, a pro-tein involved in the formation of the lateral membranedomain of epithelial cells, were both activated by IGF-IIbut not by insulin.
Other proteins were negatively recruited to tyrosine-phosphorylated protein complexes in response to ligandstimulation. In particular, two of them were responsive toboth ligands, five solely to IGF-II, and five solely to insulin(Table 2).
The functional classification of these substrates isgiven in Table 3.
Western blotting validation of a set ofIR-A mediators
A subset of IR-A mediators, significantly modulated afterstimulation with either IGF-II or insulin or both, were cho-sen for validation by Western blot analysis. This subset in-cluded three molecules previously known as insulin signal-ing effectors (IRS-1, IRS-2, and PI3K-p85) and six newlyidentified mediators (ABI1, WAVE2, DDR1, DDR2,EphB4, and Myo10). The IR-A was studied as control. R�/IR-A cells were treated with either IGF-II or insulin for 1 minand tyrosine-phosphorylated protein complexes obtained asalready described for SILAC. Western blotting data were inclose accordance with MS analysis (Fig. 2, A and B). Nota-
SDS-PAGE
p-Tyr-IP
Trypsin-digestion
Protein identification and quantitation
Control IGF-II Insulin
Mix Cell Lysates
LC-MS/MS analysis
Arg- C 612
“Light”
Arg- C 613
“Medium”
Arg- C N613 15
4
“Heavy”
FIG. 1. Schematic overview of the SILAC approach used to identify IR-Amediators after IGF-II or insulin stimulation. Cells were grown in threedifferent arginine-stable isotope-labeled media. Cells grown in naturalarginine were stimulated with vehicle alone. Cells grown in l-13C6-Arg-containing medium were treated with IGF-II, and cells grown in l-13C615N4-Arg-containing medium were treated with insulin. Stimulationwas carried out with 10 nM ligand for 1 min. Equal amounts of proteinswere mixed with antiphosphotyrosine antibodies (anti-pY) and theimmunoprecipitated (IP) fraction was resolved by SDS-PAGE. The gel wasexcised into bands, and each band was digested with trypsin. Eachfraction from the in-gel digestion was analyzed by nano LC-MSMS, usinga QSTAR XL hybrid MS instrument or an LTQ Orbitrap XL.
1458 Morcavallo et al. Insulin Receptor Isoform A Substrates Mol Endocrinol, August 2011, 25(8):1456–1468
bly, IGF-II was clearly weaker than insulin in activatingIR-A and recruiting IR-A, IRS-1, WAVE2, and ABI1. How-ever, IGF-II was only marginally weaker or equally potentthan insulin in recruiting IRS-2 and p85. Activation ofEphB4, Myo10, DDR1, and DDR2 was significant onlyafter IGF-II. Dose-response experiments showed maximalsubstrate activation at 1–10 nM for both ligands and con-firmed the differences previously observed at 10 nM (Fig.3A). Time-course experiments showed that maximal activa-tion for IR-A, IRS proteins, p85, and WAVE2 was at 1–5min after ligand stimulation, whereas it was at 5–30 min for
DDR1, DDR2, and ABI1. The differ-ences between the two ligands, however,were generally maintained at all timepoints (Fig. 3B).
For all these experiments, we haveused R�/IR-A cells, because the resultswould not be equally clear in other cel-lular models coexpressing the IGF-IR,which, by binding the IGF-II, may ob-scure IGF-II action on the IR-A. How-ever, one may argue whether the activa-tion of these newly identified substratescould be reproduced in a more physio-logical context where endogenous IR-Aand IGF-IR are coexpressed. To addressthis issue, we evaluated the response of apanel of substrates to insulin and IGF-IIstimulation in NIH-3T3 nontransformedmouse embryo fibroblasts and in MCF-7humanbreastcancercells (Fig.4).Bothcelllines coexpress physiological levels of en-dogenous IR and IGF-IR (Fig. 4A). More-over, in NIH-3T3 cells IR-A is approxi-
mately70%of total IR,whereas inMCF-7, it is approximately60% (data not shown). The involvement of newly identifiedsubstrates was clearly confirmed both in NIH-3T3 andMCF-7 cells, with IGF-II being mostly as effective or moreeffective than insulin (Fig. 4, B and C). Interestingly, inMCF-7 cells, insulin was slightly but consistently more ef-fective than IGF-II in activating EphB4 (Fig. 4C). However,the coexistence of both IR isoforms and of IGF-IR and IR/IGF-IR hybrid receptors prevented us drawing any conclu-sion regarding the specific effect of IGF-II on IR-A in thesecell lines.
* *
FIG. 2. Western blot analysis of selected IR-A substrates activated after IGF-II or insulinstimulation. R�/IR-A cells were stimulated with either IGF-II or insulin at a concentration of 10 nM
for 1 min. Cell lysates were subjected to immunoprecipitation (IP) with antianti-PY antibodies (anti-pY) and to SDS-PAGE. Filters were then blotted with antibodies against the indicated substrates(left panel). Whole-cell lysates were also analyzed by Western blotting to provide a control forequal loading (right panel). Data represented in graphs are the average � SEM of threeindependent experiments. Statistical significance was determined using one-way ANOVA; *, P �0.05; **, P � 0.001. BAS, Basal conditions.
TABLE 1. IR-A substrates activated or deactivated by IGF-II (ratio M:L) or insulin (ratio H:L) identified by SILAC andpreviously reported as involved in insulin signaling
Accessionno. Reference
Proteinname
Experiment 1 Experiment 2
RatioM:L SD
RatioH:L SD
RatioM:L
SignificanceM:L (A)
RatioH:L
SignificanceH:L (A)
IPI00128358 58 IR 6.61 1.84 27.59 7.8 5.76 0.000 24.06 0.000IPI00379844.4 59 IRS-2 2.20 0.37 3.24 0.47 4.70 0.000 5.47 0.000IPI00119627 59 IRS-1 4.02 15.74IPI00117159.1 60 PI3K p85
subunit �1.55 0.06 1.23 0.07 1.83 0.000 1.85 0.001
IPI00229927.2 31 CIP4 1.28 0.12 1.48 0.07 1.46 0.012 1.77 0.002IPI00136110.3 60 PI3K p110
subunit �1.39 0.026 1.07 0.369
IPI00125832.1 61 Caveolin-2 0.96 0.351 1.53 0.016IPI00664670.4 32 Filamin C 0.82 0.106 0.65 0.011IPI00467223 27 SPIN90 1.38 0.009 1.25 0.005IPI00119060 30 Flotillin 2 1.08 1.42
SD are reported for data obtained in the first experiment and statistical significance regarding IGF-II �M:L (A)� and insulin stimulation �H:L (A)� fordata obtained in the second experiment, as detailed in Materials and Methods.
Mol Endocrinol, August 2011, 25(8):1456–1468 mend.endojournals.org 1459

Protein network modelingTo highlight signaling differences between IGF-II and
insulin, we performed a protein interaction network mod-
eling using Search Tool for the Retrieval of InteractingGenes/Proteins (STRING) database, a database dedicatedto protein-protein interactions, including both physical
TABLE 2. IR-A substrates activated or deactivated by IGF-II (ratio M:L) or insulin (ratio H:L) identified by SILAC andnot previously reported as involved in insulin signaling
Accession no.Proteinname
Experiment 1 Experiment 2
RatioM:L SD
RatioH:L SD
RatioM:L
SignificanceM:L (A)
RatioH:L
SignificanceH:L (A)
IPI00129221.1 DDR1 4.07 0.000 1.70 0.003IPI00466187.5 Myo10 1.37 0.30 1.88 0.73 2.43 0.000 1.85 0.001IPI00758066.2 EphB 4 1.88 0.000 1.06 0.380IPI00752490.1 Rhamm 1.73 0.000 1.69 0.004IPI00122971.2 Neural cell adhesion
molecule 11.56 0.003 1.32 0.077
IPI00284816.4 Collagen alpha-1(XVIII)chain precursor
1.55 0.004 1.31 0.087
IPI00124761.1 DDR2 1.48 1.43 1.53 0.005 1.19 0.182IPI00338854.3 Guanine nucleotide
binding protein(G protein), alphainhibitingactivity polypeptide 3
1.50 0.007 1.28 0.106
IPI00876558.1 Latrophilin-2 1.44 0.015 1.25 0.131IPI00319830.7 Isoform 1 of Spectrin
beta chain1.44 0.015 0.81 0.136
IPI00330476 Cytoplasmic FMR1-interacting protein 1
1.39 0.16 1.75 0.16 1.42 0.020 1.52 0.017
IPI00221723.1 WAVE2 1.41 0.11 1.76 0.56 1.39 0.027 2.29 0.000IPI00626627.4 FYN-binding protein 1.34 0.045 1.35 0.065IPI00798483.1 ABI1 1.63 2.01 1.20 0.167 2.00 0.000IPI00755241.1 Nckap1 1.59 1.77 1.19 0.182 1.91 0.001IPI00115516.1 Elastin microfibril
interface-locatedprotein 1
1.19 0.174 0.68 0.022
IPI00124959.1 Antigen KI-67 1.05 0.450 0.72 0.044IPI00280250.5 SH3 and PX domain-containing
protein 2A1.03 0.486 1.54 0.014
IPI00396739.1 SWI/SNF-relatedmatrix-associatedactin-dependentregulator ofchromatin A5
0.94 0.303 0.61 0.005
IPI00126939.1 Protein kinase C,delta binding protein
0.89 0.219 1.77 0.002
IPI00135443.2 DNA topoisomerase2-beta
0.89 0.217 0.65 0.012
IPI00222188.4 Collagen alpha-2(I)chain
0.88 0.203 0.72 0.040
IPI00555055.3 Histone H2AV 0.72 0.029 0.73 0.049IPI00127186.1 Neurogenic locus
notch homologprotein 1 precursor
0.71 0.024 1.21 0.169
IPI00221494.7 Lipoma-preferredpartner
0.69 0.015 1.01 0.487
IPI00122321 Serine/threonine-proteinkinase VRK3
0.70 0.78
IPI00124281 Myosin-Ib 0.64 0.08 0.75 0.14IPI00126725 Interferon-activable
protein 2020.56 0.79
SD are reported for data obtained in the first experiment and statistical significance regarding IGF-II �M:L (A)� and insulin stimulation �H:L (A)� fordata obtained in the second experiment, as detailed in Materials and Methods.
1460 Morcavallo et al. Insulin Receptor Isoform A Substrates Mol Endocrinol, August 2011, 25(8):1456–1468

and functional interactions. As shown in Fig. 5, the sig-naling network resulting from IGF-II stimulation is no-ticeably different from that resulting from insulin stimu-lation. It appears that differences in the degree and/orkinetics and/or compartimentalization of immediate IR-Asubstrates, such as IRS-1 and IRS-2, are sufficient to or-chestrate a substantially different signaling network whenR�/IR-A cells are stimulated with either IGF-II or insulin(Fig. 5).
Discussion
In the present study, we used the SILAC methodology incombination with antiphospho-tyrosine immunoprecipi-tation and MS to perform an unbiased study to identifymediators differentially recruited to tyrosine-phosphory-lated proteins after IR-A stimulation with either IGF-II orinsulin. It is noteworthy that most previous studies oninsulin signaling (16, 17), including some recent papersusing various proteomic approaches (15, 18–21), havebeen performed in classical insulin target cells (muscle
A
B
FIG. 3. Dose response and time course of the activation of selectedIR-A substrates after IGF-II or insulin stimulation. R�/IR-A cells werestimulated with either IGF-II or insulin at different concentrations for 1min (A) or at the concentration of 10 nM for different times (B), asindicated. Cell lysates were subjected to IP with antianti-PY andsubjected to Western blot analysis with antibodies against specificsubstrates, as described in Materials and Methods. The experimentshown is representative of three independent experiments.
TABLE 3. Functional classification of IR-A substratesrecruited after IGF-II or insulin exposure
Function Protein name IGF-II Insulin
Apoptosis Interferon-activable protein 202
Angiogenesis Collagen alpha-1(XVIII) chain precursor
Cell-to matrix interaction
Collagen alpha-2(I) chain
Lipoma-preferred partner
Neural cell adhesion molecule 1
SH3 and PX domain-containingprotein 2A
Cell trasformation ABI1a
Rhamm
Cytoskeleton rearrangement
Filamin Ca
Myosin-Ib
MYO10
Nckap1
Isoform 1 of Spectrin beta chain
CYFP1a
Elastin microfibril interface-located protein 1
Differentiation
Neurogenic locus notch homolog protein 1 precursora
Serine/threonine-protein kinase VRK3a
Flotillin 2
DNA repair Histone H2AV
DNA topoisomerase 2-beta
Endocytosis Caveolin-2a
CIP4a
G-protein-coupled receptor Latrophilin-2
Metabolism
Protein kinase C, delta binding protein
DDR1a
Serine/threonine-protein kinase VRK3a
Proliferation
Antigen KI-67
Serine/threonine-protein kinase VRK3a
SWI/SNF-related matrix-associatedactin-dependent regulator of chromatin A5
Signaling transduction
Signaling transduction
ABI1a
Caveolin-2a
CYFP1a
FYN-binding protein
Guanine nucleotide binding protein (G protein),alpha inhibiting activity polypeptide 3
IRS - 1
IRS - 2
PI3K p110
PI3K p85
WAVE2
CIP4a
SPIN90
Tyrosine kinase receptors
DDR1a
DDR2
EPHB4
IR
Cell motility
ABI1a
Neurogenic locus notch homolog protein 1 precursor1a
Filamin Ca
Red, activated �2.0; orange, activated up to 1.9; green, deactivated0.79–0.5; white, nonregulated.a Substrates classified in more than one functional class.
Mol Endocrinol, August 2011, 25(8):1456–1468 mend.endojournals.org 1461

cells, adipocytes, hepatocytes) that express both IR iso-forms with a predominance of the IR-B. Wild-type cellsalso coexpress the IGF-IR and IR/IGF-IR hybrid receptors(22, 23), which may also bind insulin, although at lowaffinity, and affect signaling specificity (24). No previousstudy has compared IGF-II and insulin signaling using anunbiased proteomic approach. The two ligands may elicitdifferent biological effects in R�/IR-A and in other cells,with IGF-II being a more potent stimulator of mitogenesisand migration and insulin being more metabolically ef-fective (1, 7). Interestingly, others have shown that it ispossible to design peptides with high affinity for IR-Abinding and eliciting high metabolic effects but reducedmitogenesis as compared with insulin (25), thus reinforc-ing the concept that different IR-A ligands may have di-vergent biological effects.
Our SILAC approach proved to be very effective, be-cause we were able to identify 10 previously known IRmediators as well as 28 new potential IR-A mediators notpreviously directly associated with insulin signaling. Toavoid false positives, we used very conservative thresh-olds for protein identification in combination with man-ual inspection of peptide fragmentation spectra. Overall,the number of substrates identified was comparable withthat found by studies using a similar approach (19–21).
Validation analysis carried out byWestern blot for a panel of effectorsand including dose-response and time-course experiments was in excellentagreement with our proteomics results.
Data analysis revealed several sig-naling differences between IGF-II andinsulin after binding to the IR-A. Thesedifferences were not unique to IR�/IR-A cells but were also found in non-engineered cells, such as NIH-3T3 fi-broblasts and MCF-7 breast cancercells, where a panel of these effectorswas evaluated by Western blotting.These cells, however, express endoge-nous IGF-IR and IR/IGF-IR hybrids,which may affect the response to IGF-II. The potential significance of some ofthese differences will be discussed. Wewill first discuss differences related topreviously known mediators and thendifferences related to newly identifiedmediators.
First, we found that IR-A and its im-mediate intracellular substrate IRS-1were more effectively activated by in-sulin as compared with IGF-II. This re-flects the relative binding affinities of
the two ligands to the IR-A confirming our previous find-ings (1). However, the activation of IRS-2 was similarafter IGF-II and insulin stimulation, suggesting a prefer-ential activation of IRS-2 by IGF-II, given the lower bind-ing affinity of IGF-II. This finding confirms previous ev-idences obtained by us and others (1, 13, 26) and suggeststhat the preferential IRS-2 activation by IGF-II may con-tribute to downstream signaling differences between thetwo ligands.
Interestingly, SPIN90, a proto-oncogene tyrosine-protein kinase Src (Src) homology (SH)3 domain-con-taining protein, implicated in IR signaling was moreeffectively activated by IGF-II than by insulin. SPIN90forms a complex with Wiskott-Aldrich syndrome pro-tein and recruits other proteins to Nck1 at focal adhe-sions after growth factors stimulation and/or cell ad-hesion (27).
In contrast, other known IR-A substrates, such ascaveolin-2 and flotilin-2, were significantly activated byinsulin but not by IGF-II. Both caveolin-2 and flotilin-2are scaffolding protein and components of the caveolae,which play an important role in the compartmentaliza-tion of a variety of signal transduction molecules. The IRitself is specifically recruited within caveolae (28). Caveo-
A
CB
FIG. 4. Western blot analysis of the activation of selected IR-A substrates in NIH-3T3 andMCF-7 cells. A, Proteins levels for the IR and IGF-IR in R�/IR-A, MCF-7 and NIH-3T3 cell lines.NIH-3T3 (B) and MCF-7 (C) cells were stimulated with either IGF-II or insulin at aconcentration of 10 nM for 1 min. Cell lysates were subjected to IP with antianti-pY antibodiesand to SDS-PAGE. Filters were then blotted with antibodies against the indicated substrates(left panel). Whole-cell lysates were also analyzed by Western blotting to provide a control forequal loading (right panel). The experiment shown is representative of three independentexperiments. IP, Immunoprecipitation.
1462 Morcavallo et al. Insulin Receptor Isoform A Substrates Mol Endocrinol, August 2011, 25(8):1456–1468

lin-2 is phosphorylated by insulin stimulation at Tyr19,and this phosphorylation affects the binding of SH2 do-main-containing proteins, including c-Src, Nck, and GT-Pase-activating protein (Ras), and regulates the activity ofRas/ERK and focal adhesion kinase (29). Flotilin proteinshave been involved in glucose transport (30).
Among molecules more strongly activated by insulinthan by IGF-II, we found cell division control protein 42(Cdc42)-interacting protein 4 (CIP4). CIP4 interacts withneuronal Wiskott-Aldrich Syndrome protein and dy-namin-2. A splice variant of mouse CIP4, CIP4/2, waspreviously identified as a putative TC10 protein effector.TC10 protein, a Ras homologous protein family, is acti-vated by insulin stimulation downstream of E3 ubiquitin-protein ligase CBL phosphorylation and may constitute asecond, PI3K-independent pathway, involved in insulin-stimulated glucose uptake in adipocytes and myocytes (31).
Only filamin C, among known IR mediators, appearedto be negatively associated with tyrosine phosphoproteinsafter stimulation, with statistical significance reachedonly after insulin. Filamin C is an actin-binding protein,which is serine phosphorylated by serine-threonine kinasein response to insulin stimulation (32) and plays a role instabilizing actin filaments network. It may also act as ascaffolding protein for signaling components.
In addition to previously described IR substrates, wealso identified 28 new IR-A mediators not previously di-rectly implicated in insulin signaling. Many were differ-entially recruited to phosphoproteins after IGF-II and in-sulin stimulation. Most of these mediators are involved in
important cellular functions, such as cytoskeleton remod-eling, extracellular matrix interactions or intercellularinteractions.
It is known that insulin induces a rapid remodeling ofactin filaments into a cortical network. Actin remodelingmay provide a scaffold to signaling molecules and plays arole in cell motility and in endocytotic processes and glu-cose transporter-4 translocation (33). We found that sev-eral components of the WAVE2 signaling complex, whichplays a crucial role in actin remodeling, are activated byIGF-II and insulin. These components include WAVE2,AbI1, Nckap1, Sra-1 [Ras-related C3 botulinum toxinsubstrate 1 (Rac1)-associated protein-1], and protein ki-nase C �-binding protein. WAVE2 is a component of theWiskott-Aldrich syndrome protein family and, throughits C-terminal domain, mediates binding of actin mono-mers to the actin-related protein 2 (Arp)2/3 complex andconsequent induction of Arp2/3 actin nucleating activity(34). The above-mentioned SPIN90 colocalizes with actinfilaments at the leading edges of cells and promotes theactivity of WAVE2 complexes by interacting with Arp2/3(35). The WAVE2-ABI1-Nckap1-Sra-1 complex existsunder basal conditions and is recruited via Rac interac-tion to lamellipodia, resulting in site-directed nucle-ation of actin filaments. ABI1 plays a role in connectingWAVE2 to Rac by translocating WAVE2 to the mem-brane and stabilizing the multiprotein complex (36,37). ABI1 also allows Abl-mediated WAVE2 tyrosinephosphorylation (38), which is required for linkingWAVE2 to activated Rac. Because Rac activation may
FIG. 5. Interaction maps of IR-A substrates modulated by either IGF-II or insulin. IR-A substrates found to be significantly modulated after eitherIGF-II or insulin stimulation were used to establish protein interaction maps using the STRING database. Nodes represent the protein substrates,and lines with different colors indicate different protein-protein interaction modes.
Mol Endocrinol, August 2011, 25(8):1456–1468 mend.endojournals.org 1463

be induced by growth factors, the WAVE2-ABI1-Nckap1-Sra-1 complex has an important role in con-necting extracellular signals to actin remodeling (34).
These components of the WAVE2 multiprotein com-plex showed quantitative differences in recruitment tophosphoproteins after IGF-II or insulin, suggesting a dif-ferential role of these ligands in actin remodeling.
Two other molecules involved in membrane-cytoskel-eton interactions, Myo10 and spectrin, were morestrongly modulated by IGF-II than by insulin. Myo10 isan unconventional myosin and plays a crucial role in theformation of filopodia, structures with an important rolein the regulation of wound healing, angiogenesis, andphagocytosis (39). Filopodial growth requires actin po-lymerization, which is stimulated by Arp2/3 activation bythe GTPase Cdc42. Myo10 is highly concentrated at thedistal tips of filopodia and can promote filopodia forma-tion by a mechanism downstream of Cdc42 (39). More-over, Myo10 has pleckstrin homology domains and is apotential downstream target of PI3K (40). Spectrin asso-ciates with ankyrin-G and E-cadherin in formation of thelateral membrane domain of both epithelial cells andearly embryos (41). Loss/derangement of this structure isa characteristic of metastatic cancer cells (42).
Extracellular matrix receptors, namely, receptors forHA and for collagen, were also recruited to tyrosine phos-phoproteins complexes after ligand stimulation. The HAreceptor Rhamm was identified in our analysis. Rhamm isexpressed at low levels in normal tissues, whereas it iscommonly overexpressed in cancer (43). Upon HA bind-ing, Rhamm activates multiple signaling pathways in-volved in cell motility, including Ras, c-Src, and ERK1/2(44). In particular, Rhamm seems to be required forERK1/2 sustained activation (44) and cooperates withCD44 antigen in promoting motility (45). For these rea-sons, Rhamm has been involved in cancer invasion, me-tastasis, and angiogenesis (46).
The collagen-binding receptors activated by IR-A stim-ulation belong to transmembrane tyrosine kinases DDR.Two different genes coding for DDR exist in human,DDR1 and DDR2, which are activated by different typesof collagen (47). Activation of DDR1 regulates cell adhe-sion, motility, and proliferation by binding a number ofdifferent SH2- and phosphotyrosine binding domain-containing molecules and activating multiple signalingpathways. DDR play a crucial role in growth and vascu-lature development and are involved in the regulation ofcell spreading and migration. In cancer, DDR play a keyrole in tumor epithelial-to-mesenchymal transition, bypromoting a switch from E-cadherin to N-cadherin ex-pression, and increasing invasion and metastasis (48)by stimulation of the tyrosine kinase pyruvate kinase
and transcription factor AP-1 NH2-terminal kinase andcooperation with integrin-stimulated focal adhesion ki-nase (47). To the best of our knowledge, HA receptorsand DDR have not been previously directly implicatedin insulin signaling. However, both of them may un-dergo phosphorylation at tyrosine residues (49, 50).
Rhamm was recruited to phosphoproteins complexesby IGF-II and insulin with approximately similar potency.In contrast, DDR were predominantly activated byIGF-II.
Another new and intriguing finding is the activation ofephrin receptor B4 by IGF-II. Ephrin receptors are recep-tor tyrosine kinases that bind two distinct types of mem-brane-anchored ephrin ligands, which themselves act astransmembrane tyrosine kinase signaling molecules andhave a crucial role in vascular morphogenesis (51). Ephreceptors, including EphB4, are often overexpressed in avariety of malignancies (52). No cooperation betweenEph receptors and IR has been described yet. Our finding,therefore, requires more work to elucidate the mecha-nisms by which IR-A may functionally interact with EphBin normal and cancer tissues.
In summary, by using engineered R�/IR-A cells, weperformed an unbiased quantitative analysis of intracel-lular mediators recruited to tyrosine-phosphorylated pro-tein complexes upon insulin or IGF-II binding to the IR-A.Several previously known and many newly discoveredIR-A mediators were identified. Data strongly support theconcept that IGF-II, upon binding to IR-A, activates aunique signaling pattern that partially differs from that ofinsulin. Although the IGF-II binding affinity for the IR-Ais lower than that of insulin, the activation of severalintracellular mediators is more strongly activated byIGF-II than by insulin. The preferential activation ofIRS-2 by IGF-II and of IRS-1 by insulin may play a pivotalrole in this differential signaling and biological effects ofthe two ligands through IR-A. Several of these newly iden-tified substrates are involved in important biological ef-fects, and their role in IR-A signaling needs to be exten-sively characterized both in normal and cancer cells. Thepresent study opens the way for a better understanding ofIGF-II signaling through the IR-A in development and incancer.
Materials and Methods
SILAC labeling and cell culturesR� cells, 3T3-like mouse fibroblasts with a targeted disrup-
tion of the igf-ir gene (kindly provided by Renato Baserga, Phil-adelphia, PA), were cotransfected with the pNTK2 expressionvector containing the cDNA for the human IR-A (Ex11�) andthe pPDV61 plasmid encoding the puromicin resistance gene,
1464 Morcavallo et al. Insulin Receptor Isoform A Substrates Mol Endocrinol, August 2011, 25(8):1456–1468

using the Lipofectamine reagent (GIBCO/BRL, Freiburg, Ger-many), as previously described (1). R�/IR-A cells were culturedin DMEM (4.5 g/liter glucose)-based medium.
To generate triple encoding SILAC conditions, medium de-ficient in arginine (Sigma-Aldrich, St. Louis, MO) was supple-mented with stable isotope arginine (Cambridge Isotope Labo-ratories, Andover, MA). We used L-13C615N4-arginine(Arg10) for “heavy” labeling, L-13C6-arginine (Arg6) for “me-dium” labeling, and L-12C614N4-arginine (Arg0) for the“light” condition. The final arginine concentration in mediumwas 86.1 mg/liter (15). In each SILAC condition, medium wassupplemented with 10% dialyzed fetal bovine serum, with 1%streptomycine/penicillin and 1% L-glutamine (all from Invitro-gen). To achieve a complete labeling, cells were grown in par-allel in light (L), medium (M), and heavy (H) SILAC medium formore than five generations.
NIH-3T3 mouse fibroblasts and MCF-7 breast cancer celllines were from American Type Culture Collection (Manas-sas, VA).
Cell stimulation, harvest, and protein enrichmentTo obtain 25 mg of starting material, 10 15-cm cell culture
dishes with 90% confluent cells per condition were prepared foreach triple SILAC experiment. R�/IR-A cells were serum starvedfor 12 h. H (Arg10) R�/IR-A cells were stimulated with 10 nM
insulin; M (Arg6) R�/IR-A cells were stimulated with 10 nM
IGF-II, and L (Arg0)-labeled R�/IRA cells were left untreated.Time of stimulation was 1 min. Cells were lysed in modifiedRIPA buffer (pH 7.4) and harvested. Cell lysates were centri-fuged at 16,000 � g and 4 C for 15 min. Supernatant wascollected and protein content measured by the Bradford assay.Equal amounts of proteins from the three samples were thenmixed, resulting in 75-mg proteins in total.
Tyrosine-phosphorylated proteins were enriched using twodifferent anti-pTyr monoclonal antibodies coupled to agarosebeads, 4G10 (Upstate Biotechnology, Waltham, MA) at a doseof 300 �g and RC20 (Biomol, Plymouth Meeting, PA) at a doseof 130 �g. After an overnight incubation at 4 C, the precipitatedimmune complexes were washed three times with lysis bufferand incubated with 100 mM phenyl phosphate in PBS for 15min. To remove phenyl phosphate, the eluate was dialyzed over-night at 4 C. The dialyzed eluate was concentrated in a vacuumcentrifuge to 100–150 �l, boiled in sample buffer, and resolvedby 15� 15-cm SDS-PAGE.
In-gel digestionThe gel was stained with 0.l% silver nitrate for 30 min at 4 C,
the gel lanes were then excised and cut horizontally into 18sections. Excised sections were resuspended in acetonitrile(ACN) and destained by using 50% ACN and 50% 50 mM
ammonium bicarbonate solution. Proteins were reduced by add-ing 10 mM dithiothreitol in 100 mM ammonium bicarbonatesolution for 30 min, followed by alkylation of cysteines by in-cubation with 55 mM iodoacetamide for 20 min. Digestion wasstarted by adding 12.5 ng/�l MS grade trypsin solution. After2 h, samples were diluted with 50 mM ammonium bicarbonateand 10% c and trypsin was added overnight. Peptides wereextracted with 5% formic acid and 50% ACN, dried by vacuumcentrifugation, and resuspended in loading pump solvent forLC-MS/MS analysis.
Nanoscale LC-MS/MS analysisFor the first experiment, a quadrupole-time-of-flight mass
spectrometer was available for analysis. The second experimentwas performed using a mass spectrometer providing higher per-formance (Orbitrap), in collaboration with M.R.L. of the pro-teomics group at University of Southern Denmark.
First experimentChromatography was performed on an Ultimate nano LC
system from Dionex (Sunnyvale, CA), using a vented column-like setup (53, 54). The in-gel digests were reconstituted in 40 �lof loading pump solvent (see below), centrifuged at 13,000 � gfor 10 min. The supernatant (10 �l) was loaded onto an in-house packed 100 �m inner diameter (i.d.), Integra Frit (NewObjective, Cambridge, MA) trapping column packed with C18silica particles, 5-�m particle size, from Maisch (Ammerbuch-Entringen, Germany). Trapping column packing bed length was1.5 cm; loading flow rate was 10 �l/min of loading pump sol-vent, consisting of H2O, ACN, and trifluoroacetic acid (TFA)97.95:2:0.05 (vol/vol/vol). After 4 min of column washing, thetrapping column was switched on-line to the analytical column,an in-house packed 50 �m i.d., Pico Frit column (New Objec-tive), 10 cm in length, filled with 3-�m C18 silica particles fromMaisch. Peptide separation started at 100 nl/min using a binarygradient. Mobile phase A was H2O, ACN, formic acid, and TFA97.9:2:0.09:0.01 (vol/vol/vol/vol); mobile phase B was H2O,ACN, formic acid, and TFA 29.9:70:0.09:0.01 (vol/vol/vol/vol).Gradient was from 5–40% B in 80 min. After 10 min at 95% B,the column was reequilibrated at 5% B for 15 min before thenext injection.
MS detection was performed on a QSTAR XL hybrid LC-MS/MS from Applied Biosystems, Inc. (Foster City, CA) oper-ating in positive ion mode, with nESI potential at 1300 V, cur-tain gas at 15 units, CAD gas at 3 units. Information-dependentacquisition was performed by selecting the two most abundantpeaks for MS/MS analysis after a full time-of-flight-MS scanfrom 400 to 1400 m/z lasting 1 sec. Both MS/MS analyses wereperformed in enhanced mode (1.5 sec/scan). Threshold value forpeak selection for MS/MS was 20 counts. Nano LC-MS/MSdata files were internally recalibrated after acquisition by usingbackground ions due to polymethylsiloxane traces, detected inthe full scan MS spectrum at medium intensity in absence ofeluting peptides. Calibration m/z values were: 445.1200,519.1388, 593.1576, 667.1764, 741.1952, and 815.2140.
Data analysisMS/MS spectra were converted in Mascot generic format by
the Analyst software (version 1.1; Applied Biosystems, Inc.). Ascript running on Analyst was used to determine peptide chargestate and to perform centroiding and deisotoping on MS/MSdata. MS/MS data were searched on the Mascot search engine(www.matrixscience.com), version 2.2, against the Interna-tional Protein Index database (mouse version 3.58; 56,619 se-quences) using the following parameters. MS tolerance, 20 ppm;MS/MS tolerance, 0.1 Da; fixed modifications, carbamidom-ethyl; variable modifications, oxidation, phospho-Y; enzyme,trypsin; maximum missed cleavages, 1; and quantitation, SILACR6 R10.
Using a Mascot score threshold of 30, peptide false discoveryrate was estimated to be 5.5% using the decoy search option onthe Mascot search engine, which allows to perform an auto-
Mol Endocrinol, August 2011, 25(8):1456–1468 mend.endojournals.org 1465
mated second search on a randomized database after havingperformed the first search on the forward database. Identifica-tions with two peptides above Mascot score 30 were consideredvalid. Only 13 protein identifications among the 158 reported inthe final list were based on a single peptide above the signifi-cance threshold. They were all subjected to validation by man-ual inspection of MS/MS data. Proteins identified by a singlepeptide are listed in Supplemental Table 1; their MS/MS spectraare reported in Supplemental Fig. 3. In case multiple proteinsmatched the same set of peptides, only one member of the pro-tein group was reported in Tables 1–3.
Quantitative analysis was performed by MSQuant softwareversion (II). Bold red peptides above Mascot score 30 were usedfor quantitation. Data were normalized on the median of theLog2 of M:L and H:L ratios, respectively. Whenever a proteinwas quantified by using two or more peptides, the median ofM:L and H:L ratios was adopted. Proteins quantified by a singlearginine-containing peptide were visually inspected. Signifi-cance thresholds for quantitative changes were chosen accord-ing to the values calculated by MaxQuant software for experi-ment 2 (see below). For Arg6 values (IGF-II stimulation),proteins were considered significantly underrepresented whentheir M:L ratio was below 0.74, whereas they were consideredoverrepresented when their M:L ratio was above 1.33. ForArg10 values (insulin stimulation), proteins were consideredsignificantly underrepresented when their H:L ratio was be-low 0.73, whereas they were considered overrepresentedwhen their H:L ratio was above 1.38. The complete list ofidentified and quantified proteins in experiment 1 is availableas Supplemental Table 2.
Second experimentChromatography was performed on an Easy nano LC system
from Proxeon (Odense, Denmark). In-gel digested peptides werepurified by stage tips (55). The eluate was lyophilized, reconsti-tuted in 0.3 �l of 100% formic acid, and diluted with 5 �l ofmobile phase A (see below). The peptides were loaded onto a 20cm long, 100 �m i.d., 360 �m outer diameter, ReproSil-Pur C18
AQ 3-�m (Maisch) reversed phase capillary column. The pep-tides were eluted using a gradient from 100% phase A (0.1%formic acid) to 40% phase B (0.1% formic acid and 80%MeCN) over 30 min at 200 nl/min directly into a LTQ-OrbitrapXL mass spectrometer (Thermo Scientific, San Jose CA). TheLTQ-Orbitrap XL was operated in a data-independent modeautomatically switching between MS and MSMS of the fivemost intense ions from the MS scan. The signal intensity thresh-old for selection for MSMS was sat to 30,000 NL, the activationtime was 30 msec, and previous selected peptides were excludedfor 20 sec.
Data analysisRaw datafiles from the Orbitrap analysis were analyzed using
MaxQuant software (56), version 1.0.13.8. Data were searched onthe Mascot search engine (www.matrixscience.com), against theInternational Protein Index database (mouse version 3.52; 55,303sequences) using the following parameters. Initial MS tolerance, 10ppm; MS/MS tolerance, 0.6 Da; fixed modifications, carbamidom-ethyl; variable modifications, oxidation, acetyl (protein N termi-nus), Gln-pyro-Glu (N-terminal Q), and phospho-STY; en-zyme, trypsin; maximum missed cleavages, 1; and quantitation,SILAC R6 R10. False-discovery rate was set at 1%. Signifi-
cance thresholds for quantitative changes were automaticallycalculated by the software (56). For Arg6 values (IGF-II stimu-lation), proteins were considered significantly underrepresentedwhen their M:L ratio was below 0.74, whereas they were con-sidered overrepresented when their M:L ratio was above 1.33.For Arg10 values (insulin stimulation), proteins were consideredsignificantly underrepresented when their H:L ratio was below0.73, whereas they were considered overrepresented when theirH:L ratio was above 1.38. The complete list of identified andquantified proteins in experiment 2, together with the full set ofcorresponding peptides, is available as Supplemental Tables 3and 4, respectively.
Western blot analysisSubconfluent cell cultures were incubated in the presence or
the absence of either insulin or IGF-II for 1 min.R�/IR cells, in time-course experiments, were incubated whit
insulin or IGF-II (10 nM) for 1, 5, 30 min, whereas dose-responseexperiments were carried out at 0.1, 1.0, and 10 nM for 1 min.
Cell lysates were then incubated with anti-p-Tyr monoclonalantibodies coupled with G-sepharose beads, as described above,to immunopurify protein complexes containing phosphorylatedtyrosine residues, which were then subjected to SDS-PAGE. Theresolved proteins were transferred to nitrocellulose membranesand subjected to immunoblotting analysis. Immunoblots wererevealed by the enhanced chemiluminescence method (Amer-sham, Little Chalfont, UK), autoradiographed, and subjected todensitometric analysis. The following antibodies were used:anti-IR�, anti-IGF-IR�, anti-�-actin, anti-WAVE2, anti-ABI1,anti-EphB4, anti-DDR1, anti-DDR2, anti-Myo10 (Santa CruzBiotechnology, Inc., Santa Cruz, CA), anti-PI3K (p85), anti-IRS-1, and anti-IRS-2 (Upstate Biotechnology).
Reverse transcription-polymerase chain reactionRT-PCR for mouse IR isoforms was carried out with oligo-
nucleotide primers spanning nucleotides 2147–2171 (5�-ATCAGA GTG AGT ATG ACG ACT CGG-3�) and 2349–2373(5�-TCC TGA CTT GTG GGC ACA ATG GTA-3�) of themouse IR. PCR amplification was carried out for 30 cycles of 30sec at 94 C, 30 sec at 60 C, and 45 sec at 72 C in a DNA thermalcycler 9700 (Applied Biosystems, Inc.). After electrophoresis ofthe PCR products, the 286- and 250-bp DNA fragments repre-sented Ex11 and Ex11�, respectively. RT-PCR for human IRisoforms was carried out as previously described (1).
Densitometric analysisDensitometric analysis was performed using ImageJ. Values
are expressed as arbitrary units.
Statistical analysisExperiments were repeated at least three times. Results are
expressed as mean � SEM. All statistical analyses were carriedout with GraphPad software (Prism, London, UK). Results werecompared using the one-way ANOVA test. Differences wereconsidered statistically significant at P � 0.05.
Protein network modelingNetwork analysis of protein interaction was carried out us-
ing the database and web-tool STRING (http://string.embl.de).STRING is a metaresource that aggregates most of the available
1466 Morcavallo et al. Insulin Receptor Isoform A Substrates Mol Endocrinol, August 2011, 25(8):1456–1468

information on protein-protein associations, scores, andweights it (57). It includes not only functional associations butalso physical interactions and information from genes that sharesimilarities in their phylogenetic profiles or display a similartranscriptional response. Information from text mining and in-teraction transfer between organisms are also integrated proba-bilistically. Two separate analyses were carried out for eitherIGF-II or insulin, including all identified mediators that resultedsignificantly up- or down-modulated by the specific ligand.
Acknowledgments
Address all correspondence and requests for reprints to: An-tonino Belfiore, Department of Clinical and Experimental Med-icine, Endocrinology, University of Catanzaro, Campus Univer-sitario, Localita Germaneto, 88100 Catanzaro, Italy. E-mail:[email protected].
This work was supported by grants from the AssociazioneItaliana per la Ricerca sul Cancro (A.B. and R.V.) and by Pro-grammi di ricerca di Rilevante Interesse Nazionale -Ministerodell’Istruzione, dell’Universita e della Ricerca, Grant2008BKRFBH_005 (to A.B.).
Disclosure Summary: The authors have nothing to disclose.
References
1. Frasca F, Pandini G, Scalia P, Sciacca L, Mineo R, Costantino A,Goldfine ID, Belfiore A, Vigneri R 1999 Insulin receptor isoform A,a newly recognized, high-affinity insulin-like growth factor II recep-tor in fetal and cancer cells. Mol Cell Biol 19:3278–3288
2. Louvi A, Accili D, Efstratiadis A 1997 Growth-promoting interac-tion of IGF-II with the insulin receptor during mouse embryonicdevelopment. Dev Biol 189:33–48
3. Belfiore A, Frasca F, Pandini G, Sciacca L, Vigneri R 2009 Insulinreceptor isoforms and insulin receptor/insulin-like growth factorreceptor hybrids in physiology and disease. Endocr Rev 30:586–623
4. Leibiger B, Leibiger IB, Moede T, Kemper S, Kulkarni RN, KahnCR, de Vargas LM, Berggren PO 2001 Selective insulin signalingthrough A and B insulin receptors regulates transcription of insulinand glucokinase genes in pancreatic � cells. Mol Cell 7:559–570
5. Uhles S, Moede T, Leibiger B, Berggren PO, Leibiger IB 2003Isoform-specific insulin receptor signaling involves different plasmamembrane domains. J Cell Biol 163:1327–1337
6. Liquori CL, Ricker K, Moseley ML, Jacobsen JF, Kress W, NaylorSL, Day JW, Ranum LP 2001 Myotonic dystrophy type 2 caused bya CCTG expansion in intron 1 of ZNF9. Science 293:864–867
7. Sciacca L, Mineo R, Pandini G, Murabito A, Vigneri R, Belfiore A2002 In IGF-I receptor-deficient leiomyosarcoma cells autocrineIGF-II induces cell invasion and protection from apoptosis via theinsulin receptor isoform A. Oncogene 21:8240–8250
8. Vella V, Pandini G, Sciacca L, Mineo R, Vigneri R, Pezzino V,Belfiore A 2002 A novel autocrine loop involving IGF-II and theinsulin receptor isoform-A stimulates growth of thyroid cancer.J Clin Endocrinol Metab 87:245–254
9. Belfiore A 2007 The role of insulin receptor isoforms and hybridinsulin/IGF-I receptors in human cancer. Curr Pharm Des 13:671–686
10. Hofmann F, García-Echeverría C 2005 Blocking the insulin-likegrowth factor-I receptor as a strategy for targeting cancer. DrugDiscov Today 10:1041–1047
11. Pandini G, Medico E, Conte E, Sciacca L, Vigneri R, Belfiore A2003 Differential gene expression induced by insulin and insulin-like growth factor-II through the insulin receptor isoform A. J BiolChem 278:42178–42189
12. Pandini G, Conte E, Medico E, Sciacca L, Vigneri R, Belfiore A2004 IGF-II binding to insulin receptor isoform A induces a par-tially different gene expression profile from insulin binding. AnnNY Acad Sci 1028:450–456
13. Sacco A, Morcavallo A, Pandini G, Vigneri R, Belfiore A 2009Differential signaling activation by insulin and insulin-like growthfactors I and II upon binding to insulin receptor isoform A. Endo-crinology 150:3594–3602
14. Ong SE, Blagoev B, Kratchmarova I, Kristensen DB, Steen H, Pan-dey A, Mann M 2002 Stable isotope labeling by amino acids in cellculture, SILAC, as a simple and accurate approach to expressionproteomics. Mol Cell Proteomics 1:376–386
15. Blagoev B, Mann M 2006 Quantitative proteomics to study mito-gen-activated protein kinases. Methods 40:243–250
16. Cohen P 2006 The twentieth century struggle to decipher insulinsignalling. Nat Rev Mol Cell Biol 7:867–873
17. Taniguchi CM, Emanuelli B, Kahn CR 2006 Critical nodes in sig-nalling pathways: insights into insulin action. Nat Rev Mol CellBiol 7:85–96
18. Ibarrola N, Molina H, Iwahori A, Pandey A 2004 A novel pro-teomic approach for specific identification of tyrosine kinase sub-strates using [13C]tyrosine. J Biol Chem 279:15805–15813
19. Schmelzle K, Kane S, Gridley S, Lienhard GE, White FM 2006Temporal dynamics of tyrosine phosphorylation in insulin signal-ing. Diabetes 55:2171–2179
20. Wang Y, Li R, Du D, Zhang C, Yuan H, Zeng R, Chen Z 2006Proteomic analysis reveals novel molecules involved in insulin sig-naling pathway. J Proteome Res 5:846–855
21. Saeki K, Yasugi E, Okuma E, Breit SN, Nakamura M, Toda T,Kaburagi Y, Yuo A 2005 Proteomic analysis on insulin signaling inhuman hematopoietic cells: identification of CLIC1 and SRp20 asnovel downstream effectors of insulin. Am J Physiol EndocrinolMetab 289:E419–E428
22. Soos MA, Whittaker J, Lammers R, Ullrich A, Siddle K 1990 Re-ceptors for insulin and insulin-like growth factor-I can form hybriddimers. Characterisation of hybrid receptors in transfected cells.Biochem J 270:383–390
23. Bailyes EM, Nave BT, Soos MA, Orr SR, Hayward AC, Siddle K1997 Insulin receptor/IGF-I receptor hybrids are widely distributedin mammalian tissues: quantification of individual receptor speciesby selective immunoprecipitation and immunoblotting. Biochem J327(Pt 1):209–215
24. Pandini G, Frasca F, Mineo R, Sciacca L, Vigneri R, Belfiore A 2002Insulin/insulin-like growth factor I hybrid receptors have differentbiological characteristics depending on the insulin receptor isoforminvolved. J Biol Chem 277:39684–39695
25. Jensen M, Hansen B, De Meyts P, Schaffer L, Ursø B 2007 Activa-tion of the insulin receptor by insulin and a synthetic peptide leadsto divergent metabolic and mitogenic signaling and responses. J BiolChem 282:35179–35186
26. Denley A, Carroll JM, Brierley GV, Cosgrove L, Wallace J, ForbesB, Roberts Jr CT 2007 Differential activation of insulin receptorsubstrates 1 and 2 by insulin-like growth factor-activated insulinreceptors. Mol Cell Biol 27:3569–3577
27. Lim CS, Kim SH, Jung JG, Kim JK, Song WK 2003 Regulation ofSPIN90 phosphorylation and interaction with Nck by ERK and celladhesion. J Biol Chem 278:52116–52123
28. Foti M, Porcheron G, Fournier M, Maeder C, Carpentier JL 2007The neck of caveolae is a distinct plasma membrane subdomain thatconcentrates insulin receptors in 3T3-L1 adipocytes. Proc NatlAcad Sci USA 104:1242–1247
29. Lee H, Park DS, Wang XB, Scherer PE, Schwartz PE, Lisanti MP2002 Src-induced phosphorylation of caveolin-2 on tyrosine 19.Phospho-caveolin-2 (Tyr(P)19) is localized near focal adhesions,
Mol Endocrinol, August 2011, 25(8):1456–1468 mend.endojournals.org 1467

remains associated with lipid rafts/caveolae, but no longer forms ahigh molecular mass hetero-oligomer with caveolin-1. J Biol Chem277:34556–34567
30. Baumann CA, Ribon V, Kanzaki M, Thurmond DC, Mora S, Shige-matsu S, Bickel PE, Pessin JE, Saltiel AR 2000 CAP defines a secondsignalling pathway required for insulin-stimulated glucose trans-port. Nature 407:202–207
31. Chang L, Adams RD, Saltiel AR 2002 The TC10-interacting pro-tein CIP4/2 is required for insulin-stimulated Glut4 translocation in3T3L1 adipocytes. Proc Natl Acad Sci USA 99:12835–12840
32. Murray JT, Campbell DG, Peggie M, Mora A, Cohen P 2004 Iden-tification of filamin C as a new physiological substrate of PKB�using KESTREL. Biochem J 384:489–494
33. Kanzaki M 2006 Insulin receptor signals regulating GLUT4 trans-location and actin dynamics. Endocr J 53:267–293
34. Steffen A, Rottner K, Ehinger J, Innocenti M, Scita G, Wehland J,Stradal TE 2004 Sra-1 and Nap1 link Rac to actin assembly drivinglamellipodia formation. EMBO J 23:749–759
35. Kim DJ, Kim SH, Lim CS, Choi KY, Park CS, Sung BH, Yeo MG,Chang S, Kim JK, Song WK 2006 Interaction of SPIN90 with theArp2/3 complex mediates lamellipodia and actin comet tail forma-tion. J Biol Chem 281:617–625
36. Leng Y, Zhang J, Badour K, Arpaia E, Freeman S, Cheung P, Siu M,Siminovitch K 2005 Abelson-interactor-1 promotes WAVE2 mem-brane translocation and Abelson-mediated tyrosine phosphoryla-tion required for WAVE2 activation. Proc Natl Acad Sci USA 102:1098–1103
37. Innocenti M, Zucconi A, Disanza A, Frittoli E, Areces LB, Steffen A,Stradal TE, Di Fiore PP, Carlier MF, Scita G 2004 Abi1 is essentialfor the formation and activation of a WAVE2 signalling complex.Nat Cell Biol 6:319–327
38. Stuart JR, Gonzalez FH, Kawai H, Yuan ZM 2006 c-Abl interactswith the WAVE2 signaling complex to induce membrane rufflingand cell spreading. J Biol Chem 281:31290–31297
39. Bohil AB, Robertson BW, Cheney RE 2006 Myosin-X is a molec-ular motor that functions in filopodia formation. Proc Natl AcadSci USA 103:12411–12416
40. Cox D, Berg JS, Cammer M, Chinegwundoh JO, Dale BM, CheneyRE, Greenberg S 2002 Myosin X is a downstream effector of PI(3)Kduring phagocytosis. Nat Cell Biol 4:469–477
41. Kizhatil K, Davis JQ, Davis L, Hoffman J, Hogan BL, Bennett V2007 Ankyrin-G is a molecular partner of E-cadherin in epithelialcells and early embryos. J Biol Chem 282:26552–26561
42. Huber MA, Kraut N, Beug H 2005 Molecular requirements forepithelial-mesenchymal transition during tumor progression. CurrOpin Cell Biol 17:548–558
43. Shigeishi H, Fujimoto S, Hiraoka M, Ono S, Taki M, Ohta K,Higashikawa K, Kamata N 2009 Overexpression of the receptor forhyaluronan-mediated motility, correlates with expression of micro-tubule-associated protein in human oral squamous cell carcinomas.Int J Oncol 34:1565–1571
44. Hamilton SR, Fard SF, Paiwand FF, Tolg C, Veiseh M, Wang C,McCarthy JB, Bissell MJ, Koropatnick J, Turley EA 2007 Thehyaluronan receptors CD44 and Rhamm (CD168) form complexeswith ERK1,2 that sustain high basal motility in breast cancer cells.J Biol Chem 282:16667–16680
45. Maxwell CA, McCarthy J, Turley E 2008 Cell-surface and mitotic-spindle RHAMM: moonlighting or dual oncogenic functions?J Cell Sci 121:925–932
46. Toole BP, Slomiany MG 2008 Hyaluronan: a constitutive regulatorof chemoresistance and malignancy in cancer cells. Semin CancerBiol 18:244–250
47. Vogel WF, Abdulhussein R, Ford CE 2006 Sensing extracellularmatrix: an update on discoidin domain receptor function. Cell Sig-nal 18:1108–1116
48. Shintani Y, Fukumoto Y, Chaika N, Svoboda R, Wheelock MJ,Johnson KR 2008 Collagen I-mediated up-regulation of N-cad-herin requires cooperative signals from integrins and discoidin do-main receptor 1. J Cell Biol 180:1277–1289
49. Mertins P, Eberl HC, Renkawitz J, Olsen JV, Tremblay ML, MannM, Ullrich A, Daub H 2008 Investigation of protein-tyrosine phos-phatase 1B function by quantitative proteomics. Mol Cell Proteom-ics 7:1763–1777
50. Luo W, Slebos RJ, Hill S, Li M, Brabek J, Amanchy R, ChaerkadyR, Pandey A, Ham AJ, Hanks SK 2008 Global impact of oncogenicSrc on a phosphotyrosine proteome. J Proteome Res 7:3447–3460
51. Frisen J, Holmberg J, Barbacid M 1999 Ephrins and their Ephreceptors: multitalented directors of embryonic development.EMBO J 18:5159–5165
52. Vaught D, Brantley-Sieders DM, Chen J 2008 Eph receptors inbreast cancer: roles in tumor promotion and tumor suppression.Breast Cancer Res 10:217
53. Licklider LJ, Thoreen CC, Peng J, Gygi SP 2002 Automation ofnanoscale microcapillary liquid chromatography-tandem massspectrometry with a vented column. Anal Chem 74:3076–3083
54. Gaspari M, Abbonante V, Cuda G 2007 Gel-free sample prepara-tion for the nanoscale LC-MS/MS analysis and identification oflow-nanogram protein samples. J Sep Sci 30:2210–2216
55. Rappsilber J, Ishihama Y, Mann M 2003 Stop and go extractiontips for matrix-assisted laser desorption/ionization, nanoelectros-pray, and LC/MS sample pretreatment in proteomics. Anal Chem75:663–670
56. Cox J, Mann M 2008 MaxQuant enables high peptide identifica-tion rates, individualized p.p.b.-range mass accuracies and pro-teome-wide protein quantification. Nat Biotechnol 26:1367–1372
57. Jensen LJ, Kuhn M, Stark M, Chaffron S, Creevey C, Muller J,Doerks T, Julien P, Roth A, Simonovic M, Bork P, von Mering C2009 STRING 8—a global view on proteins and their functionalinteractions in 630 organisms. Nucleic Acids Res 37:D412–D416
58. Ullrich A, Bell JR, Chen EY, Herrera R, Petruzzelli LM, Dull TJ,Gray A, Coussens L, Liao YC, Tsubokawa M, et al 1985 Humaninsulin receptor and its relationship to the tyrosine kinase family ofoncogenes. Nature 313:756–761
59. White MF 1994 The IRS-1 signaling system. Curr Opin Genet Dev4:47–54
60. Backer JM, Myers Jr MG, Shoelson SE, Chin DJ, Sun XJ, MiralpeixM, Hu P, Margolis B, Skolnik EY, Schlessinger J 1992 Phosphati-dylinositol 3�-kinase is activated by association with IRS-1 duringinsulin stimulation. EMBO J 11:3469–3479
61. Kwon H, Jeong K, Pak Y 2009 Identification of pY19-caveolin-2 asa positive regulator of insulin-stimulated actin cytoskeleton-depen-dent mitogenesis. J Cell Mol Med 13:1549–1564
1468 Morcavallo et al. Insulin Receptor Isoform A Substrates Mol Endocrinol, August 2011, 25(8):1456–1468
Related Documents