Insider Ownership and Corporate Performance – Evidence from Germany * Christoph Kaserer and Benjamin Moldenhauer Center for Entrepreneurial and Financial Studies (CEFS) and Department for Financial Management and Capital Markets Technische Universit¨ at M¨ unchen Arcisstr. 21 D-80290 M¨ unchen www.cefs.de www.ifm.wi.tum.de [email protected] [email protected] September, 2005 * We thank Deutsche B¨ orse AG for the cooperation in the German Entrepreneurial Index (GEX r ) project, which is part of a broader research project concerning corporate governance and control structures in German listed companies with a special focus on insider ownership. We are grateful for financial support for this research project provided by the Bund der Freunde der Technischen Universit¨ at M¨ unchen e.V. and Deutsche Bundesbank. We owe special thanks to Dietmar Harhoff, Bernd Rudolph and the participants of the CEFS-ODEON seminars in finance and entrepreneurship, Munich, for their helpful comments. 1

Welcome message from author
This document is posted to help you gain knowledge. Please leave a comment to let me know what you think about it! Share it to your friends and learn new things together.
Transcript

Insider Ownership and Corporate Performance –
Evidence from Germany∗
Christoph Kaserer and Benjamin Moldenhauer
Center for Entrepreneurial and Financial Studies (CEFS)and Department for Financial Management and Capital Markets
Technische Universitat MunchenArcisstr. 21
D-80290 Munchen
www.cefs.dewww.ifm.wi.tum.de
[email protected]@wi.tum.de
September, 2005
∗We thank Deutsche Borse AG for the cooperation in the German Entrepreneurial Index(GEX r©) project, which is part of a broader research project concerning corporate governanceand control structures in German listed companies with a special focus on insider ownership.We are grateful for financial support for this research project provided by the Bund der Freundeder Technischen Universitat Munchen e.V. and Deutsche Bundesbank. We owe special thanksto Dietmar Harhoff, Bernd Rudolph and the participants of the CEFS-ODEON seminars infinance and entrepreneurship, Munich, for their helpful comments.
1
Insider Ownership and CorporatePerformance – Evidence from Germany
Abstract
In this paper we address the question whether there is any empirical rela-tionship between corporate performance and insider ownership. Most studiesdeal with Anglo-Saxon countries, where it seems that results are significantlyaffected by an endogeneity problem. This problem is due to the fact thatin these countries insider ownership seems to be mainly driven by compen-sation contracts. We argue that Germany might be different in this regard.In fact, insider ownership seems to be rather stable over time. Starting fromthis presumption our data will allow to make an unbiased observation as towhether insider ownership affects firm performance. Using a data set of 245companies for the year 2003 we find evidence for a positive and significantrelationship between corporate performance, as measured by stock price per-formance as well as by Tobin’s Q, and insider ownership. This relationshipseems to be rather robust, even if we account for endogeneity by applyinga 2SLS regression approach. Moreover, we also find outside blockownershipas well as more concentrated insider ownership to have a positive impact oncorporate performance. Overall the results indicate that ownership structuremight be an important variable explaining the long term value creation in thecorporate sector.
Keywords:Ownership Structure, Shareholder Structure, Insider Ownership,Firm Performance, Corporate Governance, Agency Costs
JEL classification code: G32
2
1 Introduction
Since the pathbreaking study of Berle and Means (1932), which was the first toput light on the fact that large American corporations were usually not run by theirowners, a whole branch of research evolved investigating into the effects of the sep-aration of ownership and control. However, the implications of the findings of Berleand Means remained almost unnoticed for a long time before Jensen and Meckling(1976) developed their “theory of the firm”, and thereby explicitly modelled theeffects of the dispersion of ownership and control. The studies of Morck, Shleifer,and Vishny (1988) and McConnell and Servaes (1990) have been among the first toempirically test the effects of managerial equity ownership (i.e. insider ownership)on firm value. Since then several studies have been published on that issue.
Two important results emerge from this branch of literature. First, most ofthese studies provide evidence that insider ownership actually affects firm value,although the relationship seems not to be monotonic. A positive impact of insiderownership on firm value can be explained by the so-called convergence-of-interesthypothesis, stating that larger equity shares of insiders should be associated withhigher market valuations due to lower agency costs. In contrast, a negative relationcan be explained by the so-called entrenchment hypothesis, predicting that insiderownership above a certain threshold will have a value destroying effect due to theupcoming conflict between large blockholders (in this case the management) and thedispersed shareholders. These two hypotheses serve as an explanation for the bell-shaped relationship between insider ownership and firm value found by McConnelland Servaes (1990) or the piecewise-linear relationship discovered by Morck, Shleifer,and Vishny (1988) in their previous study.
However, a serious theoretical objection against the approach used in these stud-ies has been put forward by Demsetz (1983). He argues that insider ownership isendogenously determined and, hence, cannot be a determinant of firm value. Hisarguments are supported by the evidence presented in Demsetz and Lehn (1985),where firm size, volatility, return on assets and industry evolve as adequate explana-tory variables for the ownership structure of US corporations. Hence, it may well bethat low levels of managerial ownership turn out to be an optimal incentive arrange-ment in those firms whose firm value tends do be lower than in other companies,where higher levels of insider ownership are optimal. As long as one cannot controlfor the variables being responsible for this relationship, i.e. there is unobserved firmheterogeneity, the detected correlation between ownership and firm performancemight just be spurious.
Therefore, more recent studies pay special attention to this problem of endo-geneity. In fact, the second important result emerging from the pertinent literatureindicates that by using more advanced econometric methods that allow to partiallycontrol for endogeneity it seems that firm performance is not affected by manage-rial ownership.1 However, some doubts are left preventing these results from beingaccepted as a final outcome. Evidently, in a perfect frictionless capital marketcompetitive forces would make sure that every company puts a value maximizingownership structure in place. By definition, insider ownership would be endogenousand presumably determined, among other factors, by the company’s performance.Under such a theoretical perspective the question itself, whether firm performance
1For a comprehensive overview of these studies see Demsetz and Villalonga (2001, pp. 231-233).
3

depends on the ownership structure, is nonsense.However, pondering on the vast corporate governance literature that emerged
over the last decade may challenge this theoretical perspective. Several questionsarise in this context. First of all, do corporate governance regimes really allow marketforces to put value maximizing ownership structures in place? Isn’t it true that inmany countries, including the US, several mechanisms exist allowing managers toshelter themselves from the market for corporate control? And, finally, isn’t ittrue that ownership structure often is rather inert, making a flexible adjustment tochanging market conditions unlikely? From these questions it follows immediatelythat more evidence on the ownership-performance relationship is needed, especiallyunder different corporate governance regimes.
This study makes a contribution to the literature exactly under this perspective.First, as a code law country, the whole German corporate governance regime is verydifferent from that governing common law countries. As a stylized fact, in codelaw countries investor protection regularly is lower and the market for corporatecontrol is more hampered.2 This is particulary true for Germany, as Franks andMayer (1990) or Wenger and Kaserer (1998a) have pointed out. Therefore, itmight well be that ownership structure does not flexibly adapt to pressures comingfrom investors searching for value gains. This inertia in the ownership structureis enhanced by the fact that blockholdings have been of particular importance inGermany. These blockholdings where due to presence of a large number of family-controlled companies and to a dense network of corporate cross-holdings.3 It isinteresting in this regard to note that according to a recently evolving branch ofthe literature, which pays particular attention to a special case of insider ownershipby looking at the impact of family ownership on firm performance, new evidencehas been found corroborating the presumption that ownership structure matters toperformance.
The second contribution of this paper is more technical, but nevertheless inter-esting. Almost all papers investigating the relationship between ownership structureand firm performance aim to measure the latter by Tobin’s Q, i.e. by putting themarket value of a company in relation to the replacement value of its assets. Inpractice, however, Tobin’s Q is approximated by a firm’s market-to-book ratio. Wehave strong reservations whether the market-to-book ratio can really be taken as aproxy for firm value, at least in a Continental-European accounting context, wherehistorical cost accounting is still important. Therefore, we measure firm performanceby the stock price return.
Our results indicate that there is a significantly positive relationship betweeninsider ownership and firm performance as measured by stock price performanceover a five year period. In order to account for possible endogeneity we employan instrumental variable two-stage least squares regression approach. It turns outthat results seem not to be driven by endogeneity. Moreover, we also find outsideblockownership as well as more concentrated insider ownership to have a positiveimpact on corporate performance. Hence, the paper is in line with the perceptionthat ownership may have an autonomous influence on firm performance.
2Cf., among others, La Porta, Lopez-de Silanes, Shleifer, and Vishny (2000), La Porta,Lopez-de Silanes, and Shleifer (1999), and La Porta, Lopez-de Silanes, Shleifer, and Vishny(1998).
3For a detailed description of this network as of 1996 cf. Wenger and Kaserer (1998b,pp. 51-61); There is some indication that the density of this network has been reduced overthe last 4 years. Cf. Hopner and Krempel (2005, pp. 10-11).
4

The rest of the paper is organized as follows. Section 2 gives a brief literaturereview. Section 3 explains the research design as well as the data set, while section4 presents the results. Section 5 concludes.
2 A Brief Review of the Literature
As has been mentioned, the first studies investigating into the relationship betweeninsider ownership, as measured by top-managements’ shareholdings, and firm valuehave been those of Morck, Shleifer, and Vishny (1988) and McConnell and Servaes(1990). Both papers found a significant, non-monotonic relationship. The mostimportant theoretical objection against the approach used in these studies has beenput forward by Demsetz (1983) and Demsetz and Lehn (1985). Basically, they arguethat in competitive capital market environment market forces will make sure thatevery company chooses its value maximizing ownership structure. Hence, insideownership is an endogenously determined variable and any observed correlation ofownership and firm value is, basically, meaningless. In fact, the relationship of insideownership with firm value value might be due to some firm characteristics that areunobservable for the econometrician. As a consequence, an endogeneity problemarises, because ownership structure and firm value are determined simultaneously.In fact, Demsetz and Lehn (1985) show that ownership structure of US companiesis plausibly determined by firm size, stock price volatility, industry affiliation, andsome other variables. According to their view this corroborates the understandingthat ownership structure is endogenously determined. Himmelberg, Hubbard, andPalia (1999) extend Demsetz and Lehns’ results by using a fixed effects panel datamodel and instrumental variables to control for possible unobserved firm hetero-geneity. They conclude, that most variation in managerial ownership is explainedby unobserved firm heterogeneity and that managerial ownership does not affectfirm performance to an econometrically observable extent. Research presented byLoderer and Martin (1997) points in the same direction. They construct a simulta-neous equation system for a set of companies involved in acquisitions which handlesperformance and insider ownership as endogenous variables. As a result, insiderownership does not have a predictive effect on performance in their model, butthe other way round performance has a negative effect on insider ownership. Cho(1998), after being able to replicate the results of Morck, Shleifer and Vishny, buildsa simultaneous equation system consisting of three equations where insider owner-ship, performance and investment are treated as endogenous variables. Similarly toLoderer and Martin performance seems to influence ownership but not vice versa.
An integrated approach, where insider ownership is treated as only one of sevencorporate governance mechanisms, is taken by Agrawal and Knoeber (1996) whopresent evidence of interdependence among these mechanisms in a large sampleof US firms. The positive effect of insider ownership on firm performance, whichwas found if each mechanism was examined separately, disappears in the integratedmodel, broadly supporting Demsetz’ theory of the optimal use of control mecha-nisms. A similar procedure is later taken by Bhagat and Jefferis (2002). They areable to find evidence for their hypothesis that takeover defenses, takeovers, manage-ment turnover, corporate performance, capital structure, and ownership structureare interrelated and, thus, should be examined in a system of simultaneous equa-tions. However, they admit that “such a system of equations is nontrivial” andeven looks less feasible for studies about non US markets, where data availabil-
5
ity and quality often represent a serious problem. Beiner, Drobetz, Schmid, andZimmermann (2005), following the methodology of Agrawal and Knoeber (1996),model a simultaneous equation system which defines block ownership, a constructedfirm-specific corporate governance index, board size, outside representation of theboard, and leverage as relevant corporate governance mechanisms besides insiderownership. Using a sample of 109 Swiss listed companies they find evidence for thewidespread hypothesis of a positive relationship between corporate governance andperformance.
Recently, a new branch in the literature has evolved which investigates into theeffects of family-control. Evidently, family ownership has to be seen mostly as aspecial case of insider ownership and therefore this new family business literatureis quite relevant for the insider ownership issue as well. This is even more true forGermany, where family businesses traditionally attracted a lot of attention giventheir predominate economic role. For the US, recently Anderson and Reeb (2003)show that family ownership is present in a third of all S&P 500 companies and thatfamily firms outperform non-family firms, thus suggesting that family ownershipis an effective organizational structure. Villalonga and Amit (2005), looking atall Fortune 500 companies during 1994-2000, come to the conclusion that familyownership creates value for the case that the founder serves as CEO or as chairmanof the family firm. We argue that family ownership is stickier than equity ownershipof hired managers. Therefore, as it is quite unrealistic to assume that this type ofownership adjusts continuously to changing market conditions, it may be improbablethat family ownership is endogenously determined, except in the very long run.Actually, these results are at least challenging from a perspective, where insiderownership and corporate value are simultaneously determined.4
While previous results are predominantly derived from US data, also some inter-national evidence exists. For the UK, Davies, Hillier, and McColgan (2005) find thatthe insider ownership-corporate value relationship is co-deterministic giving furtherevidence to the work of Himmelberg, Hubbard and Palia or Cho. For Japan, Chen,Guo, and Mande (2003) are able to find a positiv relation between insider ownershipand firm performance, if they control for fixed effects. Their results are stable to thetreatment of insider ownership and Tobin’s Q (as a measure of firm performance) asendogenous variables in a simultaneous equation system. For Switzerland, Beiner,Drobetz, Schmid, and Zimmermann (2005) also find a significantly positive effectof managerial ownership on firm valuation. Their findings also remain stable, ifinsider ownership is integrated in a simultaneous equation system, thus suggestingthat the influence of insider ownership on performance does actually exist.
Given the fact that results coming from code law countries tend to be in conflictwith US evidence, the presumption arises that the relationship between ownershipstructure and corporate performance might be influenced by the corporate gov-ernance regime. Therefore, it is very interesting that some studies dealing withGerman family firms corroborate the view that ownership matters for firm value.For instance, by locking at the long run performance (1903-2003) of a matchingsample of 62 family and 62 non-family firms, Ehrhardt, Nowak, and Weber (2004)show that family businesses outperform non-family firms in operating performance,but not with respect to stock price performance. In an earlier study of 105 IPOsof German family-owned firms Ehrhardt and Nowak (2003) found that the long run
4Further studies about family firms are e.g. McConaughy, Walker, Henderson, and Mishra(1998), Chami (1999) or Burkart, Panunzi, and Shleifer (2003).
6
abnormal performance of family firms was affected by the family ownership pat-tern during a three year post-IPO period. Bott (2002), who analyzes the effectsof announcements of changes in shareholder structures with regard to shareholderconcentration and shareholder identity, does not find convincing evidence that stockmarket reactions to those announcements depend on the identity of the sharehold-ers.
Besides founding family ownership, the concentration of share ownership hasattracted some German research recently. For example, Edwards and Weichenrieder(2004) show that for most types of large shareholders the benefits of concentratedownership through greater monitoring of management and reduced agency conflictsequal or sometimes even significantly outweigh the harmful effects of concentration,e.g. private benefits through exploitation of minority shareholders. Hereby, they es-pecially distinguish between control rights and cash flow rights, which usually differwhen non-voting share classes exist. While looking at control rights seems appro-priate for the examination of monitoring effects, cash flow rights seem to be theright measure for the investigation of alignment of interest effects. Hence, we defineshare ownership as the portion of cash flow rights throughout this study, because in-tuitively the monitoring effect of block ownership can not be assumed to be presentin the case of managerial ownership. The results of Edwards and Weichenriederare in line with prior findings of Edwards and Nibler (2000) which concluded thatownership concentration is a more important factor in the German corporate gover-nance system than banks, which originally were thought to posses a dominating role.
3 Methodology and Data
3.1 Methodolody
In this study, we will use a cross-section of German listed companies to examinecurrent shareholder structures and the phenomenon of insider ownership. Thoughbeing aware of the problems arising from the use of mere cross-sectional data, wedecided to use them because of the following reasons: First, since insider ownershipin Germany experienced little attraction in research until now, we thought that itis still necessary to better understand shareholder structures at large and to learnmore about the appropriate measurement of insider ownership before going into adeeper analysis. Second, since the historical availability of shareholder structuredata in Germany is rather limited, the construction of a large and comprehensivepanel data set faces an enormous effort. Furthermore, it is not clear if such aneffort would be rewarded, because poor data quality might pose natural limits tothe examination of low frequency (e.g. yearly) shareholder structure data. Third,as we will show in section 4 inside ownership tends to be rather sticky, limiting theinsights from a panel data analysis.
We will address our research question in a three step analysis. In a first step,explicit attention is paid to the descriptive statistics. This is done in section 3.4,where a comparison with prior findings for the German market is presented. In asecond step, section 4 presents the results of an OLS-regression estimation in orderto gain a more extensive understanding about the effectiveness of insider owner-ship as a corporate governance mechanism. Finally, we follow the contemporaryresearch trend to build a simultaneous equation system to treat insider ownership
7

and performance as endogenous variables. In this way we should be able to controlfor endogeneity in our data set.
3.2 Sample Selection
The universe for the cross sectional sample comprises all companies, which weremember of the CDAX at the end of 2003 and 1998, i.e. in existence during the pastfive years.5 The way how the final sample was derived is shown in table 1.
Insert table 1
From a total of 520 share classes 245 firms have been left in the data set afterexcluding secondary share classes, financial firms, firms with missing data, and an-other 86 companies, which are not listed in the CDAX as of 31.12.2003, we wereleft with a total of 294 companies.6 However, complete data sets are available foronly 238 companies. Consequently, our sample captures 51,5% of all and 62,6% ofall non-financial CDAX companies as of 31.12.1998.
3.3 Definition of Variables
The ownership structure variables constitute a key element in this analysis and,hence, deserve additional attention. The shareholder structures has been takenfrom the 2004-I edition of Hoppenstedt Aktienfuhrer. Identified shareholders havebeen classified manually according to a proprietary scheme which is further describedin table 2.
Insert table 2
In line with common research all members of both boards, i.e. the managementboard (“Vorstand”) and the supervisory board (“Aufsichtsrat”), as well as theirfamilies are defined as being insiders (coded as MB and SB). In addition, we alsoidentify a third group of “quasi-insiders”, in which we classified all former membersof the boards and their families (FBM). For this reason the insider definition usedin this study deviates from that normally used in the literature. Nevertheless, thismay be reasonable as in this way we account for a peculiarity of German companies,were former board members with large ownership stakes often execute considerableinfluence on “their‘” former companies without being officially in charge. Becausewe are ignorant of the appropriate measure for insider ownership in Germany wewill test these single measures individually as well as in combination, where totalinsider ownership is defined as the total equity stake controlled altogether by thethree insider groups (MB SB FBM).
Besides insiders, we define non-financial corporates, investment companies, banks,insurance companies, other institutional investors, government, outside individuals,
5The condition that companies must have been CDAX members for the past five years isintroduced because we decided to track performance over this period.
6Most of the 86 companies were either acquired by another listed companies or delistedafter a squeeze-out. We are aware of the fact that this criterion may induce a sample selectionbias into our analysis. However, since only few of these companies actually went bankruptand we did not find any signs of systematic differences of these firms compared to the samplefirms, we think that the potential bias is manageable from an econometric point of view.
8
treasury shares (of course not a real owner type), employees, and others as relevantoutside ownership groups. As a result, for each company an ownership structure byowner type becomes available, where the individual variables express the percentageshare owned by the respective groups. As mentioned in section 2, we decided touse cash flow instead of control rights for measuring ownership.7 Alongside own-ership type variables also two ownership concentration variables, BLOCK O andBLOCK NO, are computed, indicating the cumulative share owned by all outsideblockholders owning at least 5% and the number of those outside blockholders,respectively. These variables are introduced because there is a widespread believethat block ownership constitutes an effective monitoring mechanism. Consequently,an interdependency between insider ownership and block ownership is probable.
An overview of all key variables used in this study and their descriptions is given intable 3. Firm performance is measured as Tobin’s Q (Q AV) as well as on the basis ofhistorical stock returns (SR AV). As suggested by Chung and Pruitt (1994), Agrawaland Knoeber (1996), and Beiner, Drobetz, Schmid, and Zimmermann (2005) weuse the “simple” Tobin’s Q. Hence, Tobin’s Q is calculated as the market value ofthe firm divided by its book value. The market value is calculated as the sum ofthe market value of equity8 plus the book value of debt. The book value of thefirm is approximated by the book value of total assets. It should be noted thataccording to the definition of Tobin’s Q the denominator should be the replacementcost of total assets. Following other studies we proxy the unobservable replacementcosts by the book value. However, as has already been pointed out there are strongobjections against this procedure in a Continental-European accounting context,where historical cost accounting is still prevalent.9 Hence, we put much moreemphasis on the results where firm performance is measured on the basis of stockprice returns.
It should be noted that this approach, in a certain sense, is more conservativethan the firm value approach used in the US literature. To see this, assume thatfor whatever reason there is a positive relationship between insider ownership andfirm performance. If the market is completely aware of this relationship, stock priceswould react accordingly right in the moment when the ownership structure becomespublic. Hence, as long as there is no change in the ownership structure no under-or outperformance would be observable, even though insider controlled companieswould be economically successful. Under these conditions our approach would notbe able to detect any relation between insider ownership and firm performance.However, if the market does not fully reflect the benefits of insider control rightfrom the beginning, stock price returns would convey partial information about themarket’s assessment of the benefits of insider ownership. It seems plausible thatthe market is affected by such learning effects, especially if longer periods are takeninto consideration. However, the longer the period of observation the more likelyit is that even a rather sticky ownership variable is subject to changes and, hence,the stock price movement would be affected by such changes. For that reason wechose an observation period of 5 years, being sufficiently long in order to account forthe market’s learning effects, but sufficiently short not to be too much affected by
7Meanwhile control rights are measured by the share of voting shares (usually ordinaryshares), cash flow rights also include potential non-voting shares (usually preferred shares).
8To reduce fluctuations in the market value of equity, we followed Beiner, Drobetz, Schmid,and Zimmermann (2005, p. 25) by computing the market value of equity as the mean of dailyobservations during 2003.
9For similar objections cf. Edwards and Weichenrieder (2004, p. 152).
9

changes in the insider ownership structure.10 Finally, it should be noted that stockreturns are calculated as the arithmetic average of 60 monthly total returns fromDecember 1998 to December 2003. All market data and accounting informationare drawn from the Datastream and Worldscope database.
Insert table 3
Besides ownership and performance variables a number of control variables areintroduced. Firm Size (LN ASSETS), measured by the natural logarithm of totalassets, is included to account for the fact that insider ownership in very large cor-porations is less widespread. Moreover, governance mechanisms might be differentin large companies. The growth potential (SALES G), which is expected to becaptured in the market valuation of equity, is proxied by the average annual salesgrowth over the past three years, i.e. 2001 - 2003. We include it in our analysisto differentiate higher market valuations arising from higher growth potential fromthose that might be the result of lower agency costs due to the alignment of interestamong management and other shareholders. Firm specific risk (SIGMA) measuresthe standard deviation of 60 monthly stock returns. The dummy variable dividends(DIV) indicates whether dividends have been paid during 2003. The financial struc-ture (LEVERAGE), measured as total debt to firm value, reflects the discipliningeffect of higher interest burdens on managements’ behavior. Differences in marketvaluation due to variations in operating performance were accounted for by includ-ing the return on assets (ROA), calculated as the ratio of operating profit to theaverage of total assets as of year end 2002 and 2003. Finally, industry dummyvariables are used to account for heterogeneity among eight different industries11.
3.4 Descriptive Statistics
According to the data the mean ownership stake of insiders, as measured by cashflow rights, adds up to 27,8%. As can be seen from the summary statistics intable 4 incumbent executive board members control on average 9,6% of their firm’sshares, while incumbent supervisory board members control 10,4% on average. Theequity stake of former board members averages 7,8%. As a further result it shouldbe emphasized that outside blockholders, i.e. all non-insiders that control a stakeof at least 5% each, dispose of 33,0% on average. Finally, table 4 gives summaryinformation about all the other variables used in this study.
Insert table 4
As can be seen from table 5 there are no remarkable differences among sixof the eight industry categories. However, the insider ownership pattern in thefood&beverages- as well as in the utilities-industry is quite different from otherindustries. In fact, the former has an unusual high insider ownership share of 49,8%,
10A similar approach has been used in some recent corporate governance studies, e.g. Dro-betz, Schillhofer, and Zimmermann (2004) .
11Our industry classification differs from the current scheme used by Deutsche Borse AGwhich classifies Prime Standard companies into 18 different industries, since the new classifi-cation scheme differs from the one in place at the end of 1998. Furthermore, we reduced thenumber of industry categories in place as of end 1998 by grouping from 15 to 8 non-financialcategories in order to increase the number of cases in each category
10

while in the latter the opposite is true with an insider share of 5,7%. Presumably,this result is driven by a size effect and small group sizes of the food&beverages (n= 11) and utilities industry (n = 17). Moreover, it should be noted that utilitiesin Germany in many cases are formerly state owned companies. Anyhow, it canbe stated that insider ownership is a widespread phenomenon in listed Germancompanies.
Insert table 5
As has already been emphasized, there is only a very small number of studiesanalyzing the ownership structure of German companies. For instance, Bott (2002,pp. 279-280) reports that as measured by the number of directly held share blocks,as registered with the BaFin at the end of 1999, individuals represent the mostimportant shareholder group in as much as they account for 33,1% of all registeredshare blocks. Franks and Mayer (2001, p. 947), investigating a sample of 171German firms in 1990, find that family groups are the second most important ownergroup behind other corporates. The difference to our results, which are reportedin table 6 and where corporates rank only second after insiders, could be explainedby the fact that in 1990 disclosure of ownership stakes was only mandatory at theexcess of control thresholds beyond 20%. Since in our sample the distribution of theownership stakes of corporates is even more skewed than for individual insiders12, thechanges in disclosure rules and the increasing transparency of ownership structuresover the last decade revealed most notably also smaller ownership stakes. This maybe the reason why insider ownership has become more visible over the last years.The same effect may explain the relatively low mean ownership stake for individualsof 10,8%, which was found by Koke (1999, p. 16) for listed corporations over theperiod 1994 to 1998.
The mean insider ownership stake of 27,8% in our sample is relatively largecompared with findings from other countries. For instance, Morck, Shleifer, andVishny (1988, p. 297) find a mean combined stake of all board members of 10,6%for listed US firms, which is close to the 12,1% which were found by Cho (1998,p. 107). According to Davies, Hillier, and McColgan (2005, p. 651) the meanownership stake held by the management of UK firms is 13,0%, while the same figureis equal to 17,3% for Switzerland, according to Schmid (2003, p. 39). Althoughthe insider ownership definition used in these studies is slightly different from thedefinition used in this paper, as we include former board members, it is neverthelesssafe to say that insider ownership plays a more important role in German than inother countries.13 Moreover, the peculiarity of the shareholder structure in Germanybecomes even more pronounced, if all blockholdings by current or former boardmembers as well as by other external individuals, companies or the governmentare summed up. In that case it turns out accordingly that the mean freefloat ina German listed company is only 39.2%.14 Davies, Hillier, and McColgan (2005,p. 651) report that for the average UK firm the sum of management shareholdingsplus external blockholdings is equal to 50,3%; from that one can conclude that the
12For corporates the mean equity stake is 19,3%, while the median is 0,0%. For individuals,the mean and median are equal to 27,8% and 17,0%, respectively.
13This can also be seen from the fact that in our sample equity stakes of board membersalone sum up to an average of 20.0%.
14Please note that according to table 4 the average blockholding, i.e. the sum of all externalequity stakes individually larger than 5%, is 33,0%. Together with insider equity holdings of27,8% this adds up to a closely-held equity stake of 60,8% on average.
11
average freefloat should be equal to 49.7%.15 For the US according to McConnelland Servaes (1990, p. 600) the sum of insider holdings and external blockholdingsequals 37,4%. Hence, it is still true that dispersed ownership is less important inGermany than in the Anglo-Saxon world.
Insert table 6
¿From these figures it seems that dispersed ownership is unexpectedly low, evenin the US or UK. However, it should be noted that these figures are unweightedmeans and, hence, systematic differences in small and large companies are nottaken into account. In fact, the picture becomes substantially different, if market-cap-weighted means are calculated, as has been done in the third column of table 6.In that case the average insider ownership stake is equal to 11,3% and the averagefreefloat increases up to 45,5%. Evidently, managerial ownership is the more relevantthe smaller the market capitalization of a company. Although a comparable figureis, to our knowledge, not available for the US or UK, it can be safely assumedthat the market-cap-weighted mean freefloat would be substantially higher than the62.7% reported above. In fact, Himmelberg, Hubbard, and Palia (1999, p. 362)find an average total managerial ownership stake of 13,4% for companies whosesales exceed $ 188 million while smaller companies show significantly higher insiderownership stakes between 25,4% ($ 22 million ≤ sales ≤ $ 188 million) and 32,0%(sales ≤ $ 22 million). Although these results do not include external blockholdings,it can be expected that even for such external stakes a clear size-effect exists.
A more precise picture of the size-effect can be gathered from table 7 where sam-ple companies are grouped according to their insider ownership share. As indicatedthe distribution of the insider ownership variable MB SB FBM is heavily skewedand in 44,9% of the companies the insiders own less than 10% of the company’scash flow rights.
Insert table 7
4 Empirical Results
4.1 A first look at ownership and performance
We start with a simple two-sample t-test in order to gather some basic informationabout the relationship between insider ownership and performance. For that purposethe sample is split into two sub-samples using the insider ownership as discriminatingvariable. The results are reported in table 8. We find that the sub-sample withhigher insider ownership exhibits a higher average Tobin’s Q (1,27 vs. 1,21) but alower average monthly stock return (0,2% vs. 0,4%). However, these differencesare not significant. Nevertheless, the tests for differences in means, shown in table8, highlight other interesting varieties in firm characteristics.
Insert table 8
For example, low insider ownership companies have a highly significant higherownership share held by outside blockholders (58,6%) than high insider ownership
15Similar figures for the UK are reported by Faccio and Lasfer (1999).
12

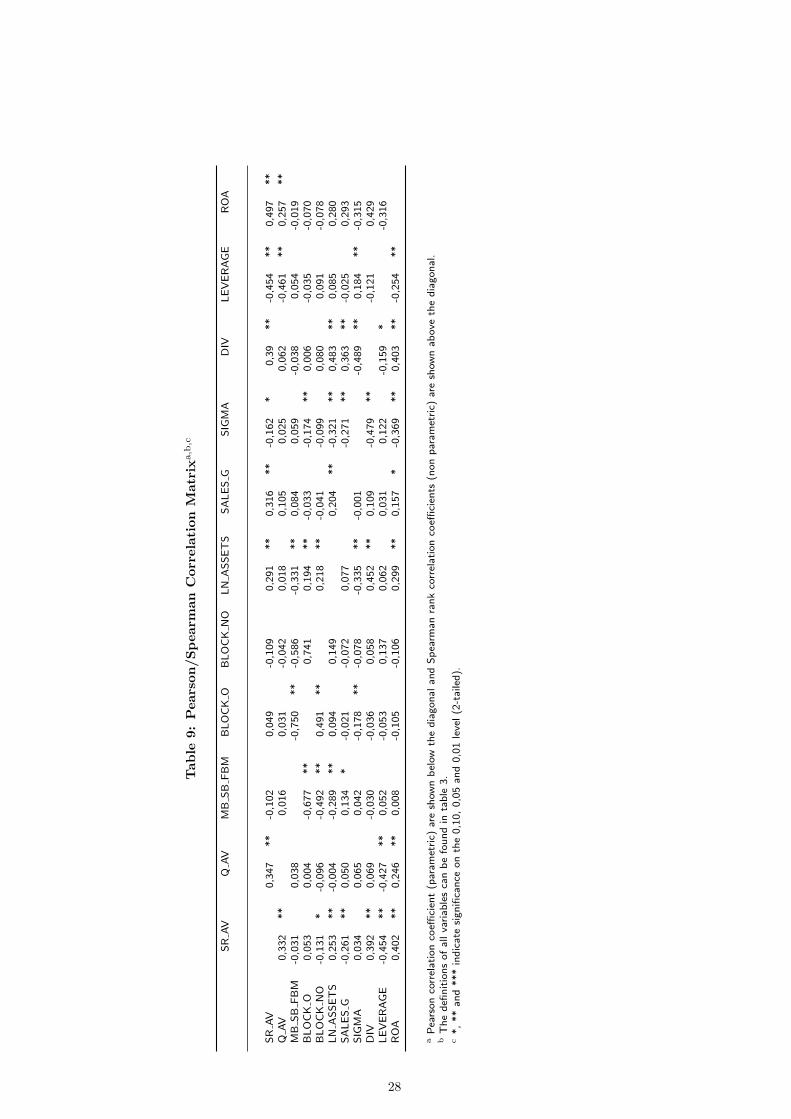
companies (8,1%). This underlines the widespread existence of outside blockhold-ings and is in line with the evidence found by Becht and Bohmer (2003, p. 8) that82,3% of listed German firms have a minority blockholder which controls more than25%; 64,7% of listed firms are even majority controlled. Thus, it seems that outsideblock ownership might be a substitute to insider ownership and, hence, both owner-ship phenomenons have to be taken into account in the analysis. This assumptionis further supported by the significant negative correlation between outside block-holdings and insider ownership, as reported in table 9. Furthermore, significantdifferences can be found for firm size, firm age, the number of management boardmembers, the affiliation in a stock index and the existence of any kind of deviationsfrom the one-share-one-vote principle.
Insert table 9
Examining the correlation matrix we observe that contradicting albeit insignif-icant correlations between the insider ownership variable and both performancevariables exist. In the next sections the insider ownership-performance relationshipwill be analyzed in a multivariate regression framework.
4.2 Base case: OLS regression results
OLS regression results are presented in table 10, where models 1 and 2 use Tobin’s Q(Q AV) as dependent variable, whereas models 3 and 4 use stock returns (SR AV).Since we felt the need to learn more about the appropriate measure for insiderownership in Germany we carried out the regression analysis with the three insiderownership variables individually (i.e. MB, SB, and FBM) in models 1 and 3 andwith the aggregated insider ownership variable (i.e. MB SB FBM) in models 2and 4. We had complete data sets for only 238 of the 245 sample companies,which constitutes our final sample size for all regression analyses. In contrast to theunivariate analysis in section 3.4, in the multivariate analyzes the signs of all insiderownership coefficients in models 1 to 4 are positive, indicating a positive impactof insider ownership on firm value. However, not all of the coefficients turn out tobe significantly different from zero. For the aggregate insider ownership variable,i.e. MB SB FBM, we get a significant result in both regression specifications.This yields a first indication that there might be an economic rationale for firmperformance to be influenced by insider ownership.
Insert table 10
With regard to the explanatory power of the models it should be noted thatthe adjusted R2 is equal to 52%, if stock returns are used as dependent variable,and equal to 30%, if Tobin’s Q is used. This is in line with the view that Tobin’sQ cannot be appropriately calculated for German companies.16 Thus, we will usemodel 4 as the base case, which will be discussed in more detail. The insiderownership coefficient of 0,009 - significant at the 0,05 level - states that on averagean increase in insider ownership by 100 basis points results in an increase of the fiveyear stock price performance of 54 basis points. Among the control variables forfirm characteristics, firm size (LN ASSETS), growth potential (SALES G), stockprice volatility (SIGMA), dividend payments (DIV), and the return on assets (ROA)
16Cf. in this regard also Edwards and Weichenrieder (2004, p. 152).
13
have a positive effect on stock returns, while high levels of debt (LEVERAGE)turn out to have a negative impact (all significant at the 0,01 level). While thepositive effects of sales growth, dividend payments and return on assets may beintuitively plausible, the remaining effects deserve further discussion. One possibleexplanation for the negative effect of high debt levels might be that small and highlyleveraged firms experienced more serious devaluations in their stock prices duringthe market downturn from 2001 to 2003. On the other hand, the positive sign ofthe coefficient of firm specific risk, measured by the standard deviation of stockreturns, could signify that those firms which managed to recover from their drops inmarket values of equity showed higher return variations than those which did not.Furthermore, we find in our data that a firm’s market risk, as measured by its beta,is positively associated with total stock price risk.17 Finally, the results stronglysupport the presumption that board ownership and outside blockholdings are asubstitute to each other. In fact, according to model 4 in table 10 the marginal rateof substitution is equal to 0,009/0,012=0,75. Hence, a change in insider ownershipby 100 basis points must be accompanied by an offsetting change of 75 basis pointsin external blockholdings in order not to have any impact on firm performance. Ina very strict sense it follows from this that external blockholdings are more effectivein terms of value creation. However, given the variance in the data one should notinsist on this result. As a corollary, it is interesting to note that the coefficient onthe number of blockholders variable is significantly negative. This is in line with theview that the benefits of outside control decrease the more dispersed blockholdingsare.
4.3 Variations to the base case
After assuming a pure linear specification of the impact of insider ownership onperformance in the previous section, we now investigate the possibility of alterna-tive specifications. We search for the curvilinear relationship found by McConnelland Servaes (1990) by including the squared term of board member ownership, la-belled as MB SB FBM SQ in model 5 of table 11. As a result, the coefficient forMB SB FBM becomes slightly negative but not on a significant level. The coef-ficient of the squared term (MB SB FBM SQ) is positive but not on a significantlevel. Thus, we fail to find the bell-shape relationship found by McConnell and Ser-vaes where insider ownership above a certain threshold becomes value destroying.18
This is quite interesting, as the result is not in accordance with the view that largeinsider stakes are harmful to outside shareholders because of their expropriation viathe consumption of private benefits by insiders.19
Insert table 11
17The correlation coefficient (Pearson) between SIGMA, as a measure of total stock pricerisk, and beta, calculated from a regression on 60 monthly CDAX returns, is 0,634 andsignificant at the 0,01 level.
18We doubt the reliability of results including higher terms of insider ownership as indepen-dent variables because of the arising multicollinearity. In our sample the VIFs for MB SB FBMand MB SB FBM SQ reach 15,9 and 12,1 respectively indicating presence of multicollinearity.We find no procedure to deal with this problem in McConnell and Servaes (1990).
19It should be noted that we also included higher terms of MB SB FBM as done by Davies,Hillier, and McColgan (2005) without obtaining more promising results than those found inour base case model 4.
14
We also checked whether it would be possible to replicate the piecewise-linear re-lationship found by Morck, Shleifer, and Vishny (1988) or Cho (1998). Dividing theinsider ownership variable in three subvariables — one for low (MB SB FBM 0to5),medium (MB SB FBM 5to25) and high (MB SB FBM 25to100) insider ownershipstakes — using the thresholds of 5% and 25% as proposed by Morck, Shleifer andVishny, only the coefficient for insider ownership above 25% turned out to be signif-icant, even though at the 0,1 level only. This can be seen from the results of model6 in table 11. Even by looking at several different combinations of the thresholds wehave not been able to improve the results. Hence, the linear relationship betweeninsider ownership and firm performance, as used in model 4, seems to represent stillthe most convincing specification.
Suggestions to alter the insider ownership variable to reflect the concentrationof insider ownership or the dollar value of the ownership share were implemented inmodels 7 and 8, respectively. In model 7a, the coefficient for the average ownershipshare per board member (MB SB FBM AV) was positive (0,076) and even moresignificant than in the base case. Nevertheless, we regard this result with cautionbecause of the methodic issue involved: Since we are not able to obtain the numberof all former board members (nor we think that this would be especially useful),the divisor of the average insider ownership variable contains the share of all activeand former board members while the denominator does only reflect all active boardmembers. Basically, the result of model 7a may be a consequence of the result al-ready obtained in model 3 of table 10, where we have seen that the impact of formerboard member stakes tends to be stronger than those of incumbent board members.In model 7b we take a different approach to account for the concentration of insiderownership: Besides the cumulated shareholdings of insiders (MB SB FBM) we in-clude the number of those registered insider shareholders (MB SB FBM NO) as anadditional explanatory variable. The result is similar to those previously found forthe case of blockholders: While MB SB FBM is positive, MB SB FBM NO is nega-tive (both significant at the 0,05 level) indicating that the positive effect declines, ifthe insider ownership share is spread across an increasing number of insiders. Eventhough the results of model 7b appear as plausible as the base case specification ofmodel 4 we will stick to the base case model 4 in the next section because of the ad-vantages associated with dealing with only one - and not two - possible endogenousinsider variables. Finally, in model 8 inside ownership is measured in terms of theEuro-value instead in terms of the equity share. The accordingly defined variable(MB SB FBM EUR) turns out to be insignificant. To summarize, it doesn’t seemthat any of the variations of the insider ownership variable discussed before gener-ates more reliable results than the simple insider ownership measure MB SB FBMused in the base case model 4 of the analysis.
4.4 The possible impact of endogeneity
In the OLS regression analysis insider ownership was implicitly assumed to be anexogenous variable. Because of the objections raised by Demsetz and Lehn (1985)and many others, which have been discussed in section 2, we follow the com-mon approach to construct a simultaneous equation system in order to account forthe potentially reciprocal dependence of insider ownership and firm performance.20
20Similar simultaneous equation systems were used, among others, by Agrawal and Knoeber(1996), Cho (1998) Davies, Hillier, and McColgan (2005), and Beiner, Drobetz, Schmid, andZimmermann (2005) to address the potential endogeneity effect.
15
Specifically, we estimate a simultaneous equation system treating insider owner-ship and corporate value as endogenous variables using the two-stage least squares(2SLS) method. Our systems consists of the following two equations:
Corporate value = (1)f(Insider ownership, firm characteristics)
Insider ownership = (2)g(Corporate value, firm characteristics)
Equation (1), the corporate value equation, is the base case equation fromsection 4.2. Hence, the OLS results for model 9 in table 12 are the known resultsfrom our base case, i.e. model 4 in table 10. But treating insider ownership asan endogenous variable, while we further assume the other control variables to beexogenously determined, the 2SLS results in model 10 differ from those of the OLSregression.
Equation (2), the insider ownership equation, treats corporate performance,measured by stock returns, as an endogenous variable. To meet the specificationcondition for simultaneous equation systems we exclude the dividend payment vari-able (DIV) from equation (2), since we do not believe that insiders would choosetheir share participation level according to expected dividend payments. In addi-tion to the other control variables from equation (1), we include four new variableswhich we expect to have an impact on the level of insider ownership. We expectinsider ownership to be lower in codetermined companies (CODET) and in compa-nies with a large number of management board members (MB NO).21 In contrast,we believe that the existence of non-voting shares (VOTE), which facilitates theinsiders to gain control rights in excess of their cash flow rights, and a high ratio ofintangible assets to total assets (INT ASSETS), a measure for discretionary powerof management, will favorably influence the extent of insider ownership. Since itcan be plausibly argued that insider ownership and corporate performance sharecommon determinants,22 we use the set of all exogenous variables from model 9and 11 as instrumental variables for the endogenous variables in model 10 and 12.The OLS- and 2SLS regression results for both equations are shown in table 12.
Insert table 12
As the insider ownership variable in model 10 still has a positive coefficient(significant at the 0,1 level) while the corporate value variable in model 12 has anegativ though insignificant coefficient, we do not find evidence for the hypothesisthat the OLS results might be strongly biased through the possible endogeneity ofinsider ownership.23 Thus, our results conflict with the evidence presented by e.g.
21German codetermination law requires that in companies of a certain size half of thesupervisory board members must be representatives of the employees. Since this narrows thescope of managerial actions the managers might be restrained from owning larger stakes insuch types of companies. Cf. Gorton and Schmid (2000).
22Cf. Himmelberg, Hubbard, and Palia (1999, p. 379).23As a corollary it should be noted that the results of equation 10 indicate that insider
ownership is more effective in value creation than external blockholdings, as the ratio of bothcoefficients is equal to 1.5.
16

Agrawal and Knoeber (1996) and Cho (1998), who show that a positive impactof insider ownership on corporate value is a mere result of failing to control forendogeneity. In contrast, our findings are roughly in line with those of Beiner,Drobetz, Schmid, and Zimmermann (2005) who also find a positive impact ofinsider ownership on corporate performance, even when they account for the possibleendogeneity of insider ownership.
As a final piece of evidence against endogeneity in the insider ownership variablethe stickiness of this variable should be emphasized. For that purpose the ques-tion is addressed to what extent current insider ownership is explained by formerinsider ownership. More specifically, model 11 in table 12 is estimated once againas an OLS-regression. This corresponds to model 13 in table 13. Thereafter, in-sider ownership measured as of the end of the year 1998 is used as an additionalindependent variable. As can be seen from the results of model 14 in table 13, thisvariable adds perceivable explanatory power to the regression and is highly signif-icant. Hence, current insider ownership structure depends significantly on formerinsider ownership corroborating the view of the stickiness of this variable.
Insert table 13
To sum up, the results presented in this study corroborate the view that underthe German corporate governance environment insider ownership may, to some ex-tent, be resistant to market mechanisms. This view is supported by the argument ofEdwards and Nibler (2000, p. 252) which justify their treatment of ownership con-centration as exogenous variable by the observation that “. . . the ownership struc-tures of many large German firms [. . . ] do not change much over time”. Later,Edwards and Weichenrieder (2004) test for endogeneity by dividing their sample intwo parts, one with and one without changes in ownership structure. They infer thatbecause the results for the two subsamples are not different on a significant level,ownership probably is not endogenous. Weighing all known arguments and evalu-ating the empirical evidence, it may be plausible to treat insider ownership as anexogenous variable, at least for Germany. Under this perspective this study providesinteresting evidence on the impact of insider ownership on firm performance.
4.5 Problems and Subjects of Further Research
It is well known that 2SLS-estimations are quite sensitive to the specification ofthe equation system. The theory for choosing instrumental variables is poor andvariations in the choice of instruments can significantly effect the results.24 This is asevere problem of all empirical studies dealing with simultaneous equation systems.As pointed out by Himmelberg, Hubbard, and Palia (1999, p. 379) ‘instrumentalvariables for managerial ownership are difficult to find. The basic problem is thatfor any variable that plausibly determines the optimal level of managerial ownership,it is also possible to argue that the same variable might plausibly affect Tobin’s Q[as a measure for corporate value].’ Hence, it was argued here that endogeneity isnot only a question of how the results of an ordinary OLS-equation compare to theresults of an appropriate 2SLS-estimation. It is also a question of economic andempirical reasoning. Given that it could have been showed that insider ownership isa rather inert variable, endogeneity may be perceived as less imminent than in theUS data. There, insider ownership is much more related to firm performance, as it
24Cf. Barnhart, Marr, and Rosenstein (1994) and Bøhren and Ødegaard (2004).
17
is to a large extent the result of compensation contracts. This is still very differentfrom the German situation.
Of course, future research should still address the issue of endogeneity. One wayto do so is to extend the cross-sectional data set to a low frequency unbalanced paneldata set. This would allow to use lagged variables as more plausible instrumentsand to increase the sample size in a pooled cross section analysis. This procedure isalso suggested by Borsch-Supan and Koke (2002), which provide a comprehensivereview of the problems involved in empirical corporate governance studies.
5 Conclusion
This paper addressed the question whether there is any empirical relationship be-tween corporate performance and insider ownership. Although agency theory pro-vides some good reasons why such a relationship should exist, empirical evidence israther fuzzy in this regard. One reason is that most studies deal with Anglo-Saxoncountries, where it seems that results are significantly affected by an endogeneityproblem. This problem is due to the fact that in these countries insider ownershipseems to be mainly driven by compensation contracts. Evidently, in such a casefirm performance and insider ownership are simultaneously determined.
This paper deals with the German capital market. This is important for thefollowing reasons. First, insider ownership in Germany is a widespread phenomenonthat is only partially influenced by the fact that firms grant stock based compen-sation packages. In fact, insider ownership seems to be rather stable over time inGermany. Second, it seems that there is much more cross-sectional variation in theownership structure in Germany as compared to the US. Starting from this presump-tion the results in this paper make a contribution to the literature for the followingtwo reasons. First, if it is true that the relationship between firm performance andinsider ownership is not significantly affected by endogeneity, the data will allow tomake an unbiased observation as to whether insider ownership affects firm perfor-mance. Second, this study is among the first to give a comprehensive overview onthe ownership structure of German corporations. Using a data set of 245 compa-nies for the year 2003 we find evidence for a positive and significant relationshipbetween corporate performance, as measured by stock price performance as well asby Tobin’s Q, and insider ownership. This relationship seems to be rather robust.Specifically, the sign and significance of the relationship does not change, even ifwe account for endogeneity by applying a 2SLS regression approach. Moreover, wealso find outside block ownership as well as more concentrated insider ownership tohave a positive impact on corporate performance. Overall the results indicate thatownership structure might be an important variable explaining the long term valuecreation in the corporate sector.
18

References
Agrawal, A. and C. R. Knoeber (1996). Firm performance and mechanisms tocontrol agency problems between managers and shareholders. Journal of Fi-nancial and Quantitative Analysis 31(3), 377–197.
Anderson, R. C. and D. M. Reeb (2003). Founding-family ownership and firmperformance: Evidence from the S&P 500. Journal of Finance 58(3), 1301–1327.
Barnhart, S. W., M. W. Marr, and S. Rosenstein (1994). Firm performanceand board composition: Some new evidence. Managerial and Decision Eco-nomics 15(4), 329–340.
Becht, M. and E. Bohmer (2003). Voting control in German corporations. Inter-national Review of Law and Economics 23(1), 1–29.
Beiner, S., W. Drobetz, M. M. Schmid, and H. Zimmermann (2005). An inte-grated framework of corporate governance and firm valuation: Evidence fromSwitzerland. European Financial Management Journal . Forthcoming.
Berle, A. A. and G. C. Means (1932). The Modern Corporation and PrivateProperty. New York: Harcourt, Brace and World, Inc.
Bhagat, S. and R. H. Jefferis, Jr. (2002). The Econometrics of Corporate Gov-ernance Studies. Cambridge, Massachusetts and London, England: The MITPress.
Bøhren, Ø. and B. A. Ødegaard (2004). Governance and performance revisted.ECGI - Finance Working Paper No. 28/2003.
Borsch-Supan, A. and J. Koke (2002). An applied econometricians’ view of empir-ical corporate governance studies. German Economic Review 3(3), 295–326.
Bott, C. (2002). Aktionarsstruktur, Kontrolle und Erfolg von Unternehmen.Gabler Edition Wissenschaft. Deutscher Universitats-Verlag.
Burkart, M., F. Panunzi, and A. Shleifer (2003). Family firms. The Journal ofFinance 58(5), 2167–2201.
Chami, R. (1999). What’s different about family businesses? University of NotreDame and IMF Institute - Working Paper.
Chen, C. R., W. Guo, and V. Mande (2003). Managerial ownership and firm val-uation: Evidence from Japanese firms. Pacific-Basin Finance Journal 11(3),267–283.
Cho, M.-H. (1998). Ownership structure, investment, and the corporate value:An empirical analysis. Journal of Financial Economics 47, 103–121.
Chung, K. H. and S. W. Pruitt (1994). A simple approximation of tobin’s q.Financial Management 23(3), 70–74.
Davies, J. R., D. Hillier, and P. McColgan (2005). Ownership structure, man-agerial behavior and corporate value. Journal of Corporate Finance 11(4),645–660.
Demsetz, H. (1983). The structure of ownership and the theory of the firm.Journal of Law & Economics 26(2), 375–390.
Demsetz, H. and K. Lehn (1985). The structure of corporate ownership: Causesand consequences. Journal of Political Economy 93(6), 1155–1177.
19

Demsetz, H. and B. Villalonga (2001). Ownership structure and corporate per-formance. Journal of Corporate Finance 7(3), 209–233.
Drobetz, W., A. Schillhofer, and H. Zimmermann (2004). Corporate governanceand expected stock returns: Evidence from Germany. European FinancialManagement 10, 267–293.
Edwards, J. S. S. and M. Nibler (2000). Corporate governance in Germany: Therole of banks and ownership concentration. Economic Policy , 239–267.
Edwards, J. S. S. and A. J. Weichenrieder (2004). Ownership concentration andshare valuation. German Economic Review 5(2), 143–171.
Ehrhardt, O. and E. Nowak (2003). Private Kontrollenten in deutschen Un-ternehmen. Die Betriebswirtschaft 63(4), 363–377.
Ehrhardt, O., E. Nowak, and F.-M. Weber (2004). Running in the family — theevolution of ownership, control, and performance in German family-ownedfirms 1903-2003. Working Paper.
Faccio, M. and M. A. Lasfer (1999). Managerial ownership, board structure andfirm value: The UK evidence. Working Paper.
Franks, J. and C. Mayer (1990). Capital markets and corporate control: a studyof france, germany and the uk. Economic Policy 5, 189–231.
Franks, J. and C. Mayer (2001). Ownership and control of German corporations.The Review of Financial Studies 14(4), 943–977.
Gorton, G. and F. A. Schmid (2000). Universal banking and the performance ofGerman firms. Journal of Financial Economics 58(1–2), 29–80.
Himmelberg, C. P., R. G. Hubbard, and D. Palia (1999). Understanding thedeterminants of managerial ownership and the link between ownership andperformance. Journal of Financial Economics 53(3), 353–384.
Hopner, M. and L. Krempel (2005). Ein Netzwerk in Auflosung: Wie die Deutsch-land AG zerfallt. In MPIfG-Jahrbuch 2003/04, pp. 9–14. Koln: Max-Planck-Institut fur Gesellschaftsforschung.
Jensen, M. C. and W. H. Meckling (1976). Theory of the firm: Managerialbehavior, agency costs and ownership structure. Journal of Financial Eco-nomics 3(4), 305–360.
Koke, F. J. (1999). New evidence on ownership structures in Germany. ZEWDiscussion Paper No. 99-60.
La Porta, R., F. Lopez-de Silanes, and A. Shleifer (1999). Corporate ownershiparound the world. The Journal of Finance 54(2), 471–517.
La Porta, R., F. Lopez-de Silanes, A. Shleifer, and R. W. Vishny (1998). Lawand finance. Journal of Political Economy 106(6), 1113–1155.
La Porta, R., F. Lopez-de Silanes, A. Shleifer, and R. W. Vishny (2000). Investorprotection and corporate governance. Journal of Financial Economics 58(1),1–25.
Loderer, C. and K. Martin (1997). Executive stock ownership and performance:Tracking faint traces. Journal of Financial Economics 45(2), 223–255.
McConaughy, D. L., M. C. Walker, G. V. Henderson, Jr., and C. S. Mishra (1998).Founding family controlled firms: Efficiency and value. Review of FinancialEconomics 7(1), 1–19.
20
McConnell, J. J. and H. Servaes (1990). Additional evidence on equity ownershipand corporate value. Journal of Financial Economics 27(2), 595–612.
Morck, R., A. Shleifer, and R. W. Vishny (1988). Management ownership andmarket valuation: An empirical analysis. Journal of Financial Economics 20,293–315.
Schmid, M. (2003). Managerial incentives and firm valuation: Evidence fromSwitzerland. Working Paper.
Villalonga, B. and R. Amit (2005). How do family ownership, control, and man-agement affect firm value? Journal of Financial Economics. Forthcoming.
Wenger, E. and C. Kaserer (1998a). German banks and corporate governance:A critical view. In K. J. Hopt, H. Kanda, M. J. Roe, E. Wymeersch, andS. Prigge (Eds.), Comparative Corporate Governance - The State of the Artand Emerging Research, pp. 499–536. Oxford: Oxford University Press.
Wenger, E. and C. Kaserer (1998b). The German system of corporate governance— a model which should not be imitated. In S. W. Black and M. Moersch(Eds.), Competition and Convergence in Financial Markets - The Germanand Anglo-American Models, pp. 41–78. Amsterdam et al.: North-HollandElsevier Science.
White, H. (1980). A heteroskedasticity-consistent covariance matrix estimatorand a direct test for heteroskedasticity. Econometria 48, 817–838.
21

Table 1: Sample Selection from the CDAXa
Number of share classes represented in the CDAX as of 31.12.1998 520
./. Number of secondary share classes 60
Number of companies represented in the CDAX as of 31.12.1998 460
./. Number of financial companies (i.e. investment companies,mortgage banks, credit banks, insurance companies)
80
Number of non-financial companies represented in the CDAX as of31.12.1998
380
./. Number of non-financial companies which are not representedin the CDAX as of 31.12.2003
86
Number of non-financial companies represented in the CDAX as of31.12.1998 and 31.12.2003
294
./. Number of companies for which several key variables couldnot be determined due to limited data availability
49
Final Sample Size 245
a The CDAX includes the shares of all domestic companies listed in Prime Standard andGeneral Standard. The index represents the German equity market in its entirety, i.e. allcompanies listed on FWB Frankfurter Wertpapierborse (Frankfurt Stock Exchange).
22

Table 2: Ownership Structure Classification Schemea
Category (CODE) Description
Managerial Ownership / Insider Ownership
Management boardmember (MB)
Active member of the management board (“Vorstand”) including familymembers
Supervisory boardmember (SB)
Active member of the supervisory board (“Aufsichtsrat”) including familymembers
Former board member(FBM)
Former member of the management and supervisory board including fam-ily members
Outsider Block Ownership
Corporates Non-financial companyInvestment companies Investment companies (i.e. venture capital and buyout companies)Banks Mortgage, credit or investment bank (for own account)Institutionals Institutional Investors (asset management companies, pension funds,
banks (for third party account), etc.)Insurance companies Insurance companiesGovernment German municipal, state and federal governmentOutside Individuals Individual persons which are not insidersTreasury Shares Shares hold by the company itself (limited to 10% in § 71 Abs. 2 AktG)Employees Employees of the company excluding members of the boardsOthers All shareholders which can not be assigned to another category
Outsider Dispersed Ownership
Freefloat Freefloat portion of the shares calculated as 100% less sum of the share-holdings of all other categories
a The scheme was developed for this specific research project and is characterized by the explicit consider-ation of insider ownership. Other, more common classification schemes only use the categories “privatehouseholds”, “individuals” or “families” without further distinguishing among different types of individuals(e.g. outsiders and insiders) and, hence, are not appropriate for our research purpose.
23
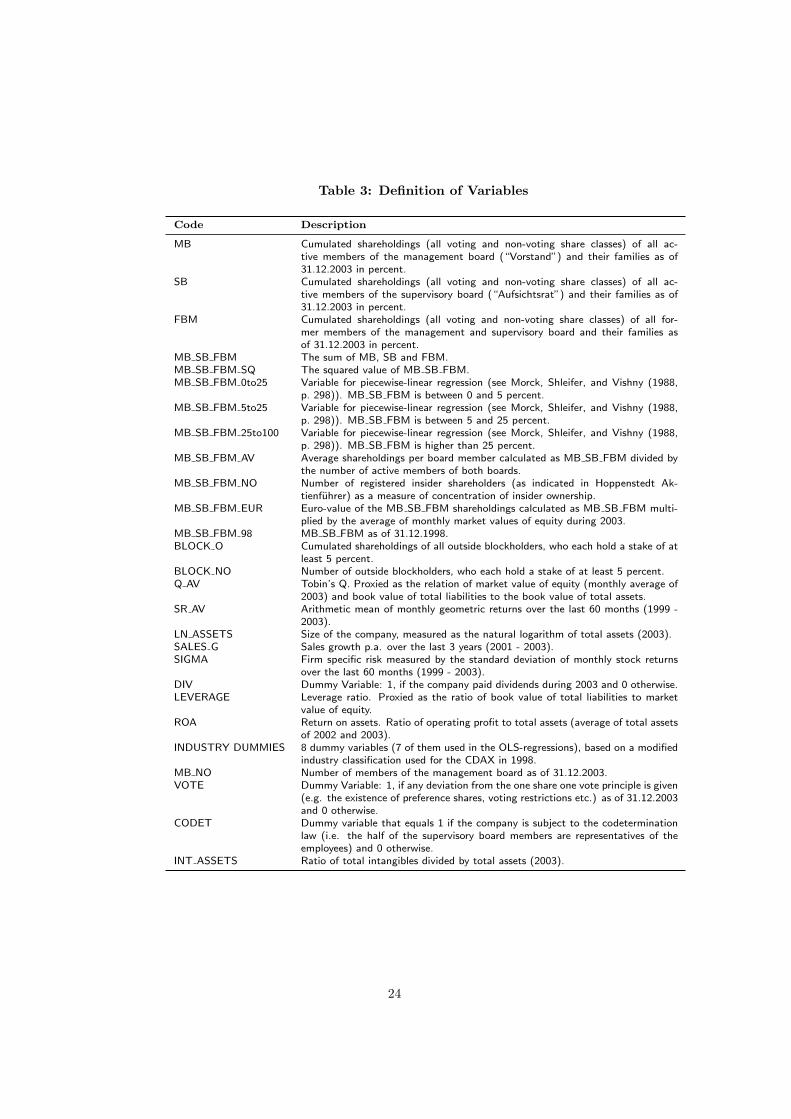
Table 3: Definition of Variables
Code Description
MB Cumulated shareholdings (all voting and non-voting share classes) of all ac-tive members of the management board (“Vorstand”) and their families as of31.12.2003 in percent.
SB Cumulated shareholdings (all voting and non-voting share classes) of all ac-tive members of the supervisory board (“Aufsichtsrat”) and their families as of31.12.2003 in percent.
FBM Cumulated shareholdings (all voting and non-voting share classes) of all for-mer members of the management and supervisory board and their families asof 31.12.2003 in percent.
MB SB FBM The sum of MB, SB and FBM.MB SB FBM SQ The squared value of MB SB FBM.MB SB FBM 0to25 Variable for piecewise-linear regression (see Morck, Shleifer, and Vishny (1988,
p. 298)). MB SB FBM is between 0 and 5 percent.MB SB FBM 5to25 Variable for piecewise-linear regression (see Morck, Shleifer, and Vishny (1988,
p. 298)). MB SB FBM is between 5 and 25 percent.MB SB FBM 25to100 Variable for piecewise-linear regression (see Morck, Shleifer, and Vishny (1988,
p. 298)). MB SB FBM is higher than 25 percent.MB SB FBM AV Average shareholdings per board member calculated as MB SB FBM divided by
the number of active members of both boards.MB SB FBM NO Number of registered insider shareholders (as indicated in Hoppenstedt Ak-
tienfuhrer) as a measure of concentration of insider ownership.MB SB FBM EUR Euro-value of the MB SB FBM shareholdings calculated as MB SB FBM multi-
plied by the average of monthly market values of equity during 2003.MB SB FBM 98 MB SB FBM as of 31.12.1998.BLOCK O Cumulated shareholdings of all outside blockholders, who each hold a stake of at
least 5 percent.BLOCK NO Number of outside blockholders, who each hold a stake of at least 5 percent.Q AV Tobin’s Q. Proxied as the relation of market value of equity (monthly average of
2003) and book value of total liabilities to the book value of total assets.SR AV Arithmetic mean of monthly geometric returns over the last 60 months (1999 -
2003).LN ASSETS Size of the company, measured as the natural logarithm of total assets (2003).SALES G Sales growth p.a. over the last 3 years (2001 - 2003).SIGMA Firm specific risk measured by the standard deviation of monthly stock returns
over the last 60 months (1999 - 2003).DIV Dummy Variable: 1, if the company paid dividends during 2003 and 0 otherwise.LEVERAGE Leverage ratio. Proxied as the ratio of book value of total liabilities to market
value of equity.ROA Return on assets. Ratio of operating profit to total assets (average of total assets
of 2002 and 2003).INDUSTRY DUMMIES 8 dummy variables (7 of them used in the OLS-regressions), based on a modified
industry classification used for the CDAX in 1998.MB NO Number of members of the management board as of 31.12.2003.VOTE Dummy Variable: 1, if any deviation from the one share one vote principle is given
(e.g. the existence of preference shares, voting restrictions etc.) as of 31.12.2003and 0 otherwise.
CODET Dummy variable that equals 1 if the company is subject to the codeterminationlaw (i.e. the half of the supervisory board members are representatives of theemployees) and 0 otherwise.
INT ASSETS Ratio of total intangibles divided by total assets (2003).
24
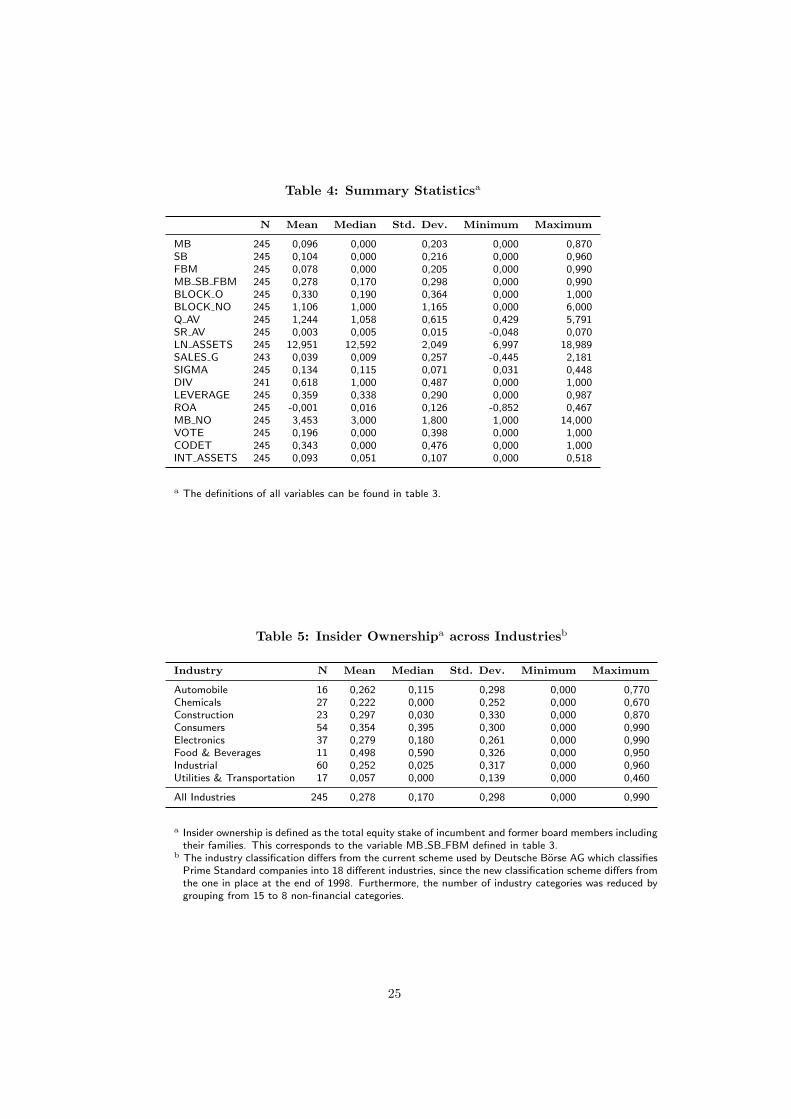
Table 4: Summary Statisticsa
N Mean Median Std. Dev. Minimum Maximum
MB 245 0,096 0,000 0,203 0,000 0,870SB 245 0,104 0,000 0,216 0,000 0,960FBM 245 0,078 0,000 0,205 0,000 0,990MB SB FBM 245 0,278 0,170 0,298 0,000 0,990BLOCK O 245 0,330 0,190 0,364 0,000 1,000BLOCK NO 245 1,106 1,000 1,165 0,000 6,000Q AV 245 1,244 1,058 0,615 0,429 5,791SR AV 245 0,003 0,005 0,015 -0,048 0,070LN ASSETS 245 12,951 12,592 2,049 6,997 18,989SALES G 243 0,039 0,009 0,257 -0,445 2,181SIGMA 245 0,134 0,115 0,071 0,031 0,448DIV 241 0,618 1,000 0,487 0,000 1,000LEVERAGE 245 0,359 0,338 0,290 0,000 0,987ROA 245 -0,001 0,016 0,126 -0,852 0,467MB NO 245 3,453 3,000 1,800 1,000 14,000VOTE 245 0,196 0,000 0,398 0,000 1,000CODET 245 0,343 0,000 0,476 0,000 1,000INT ASSETS 245 0,093 0,051 0,107 0,000 0,518
a The definitions of all variables can be found in table 3.
Table 5: Insider Ownershipa across Industriesb
Industry N Mean Median Std. Dev. Minimum Maximum
Automobile 16 0,262 0,115 0,298 0,000 0,770Chemicals 27 0,222 0,000 0,252 0,000 0,670Construction 23 0,297 0,030 0,330 0,000 0,870Consumers 54 0,354 0,395 0,300 0,000 0,990Electronics 37 0,279 0,180 0,261 0,000 0,990Food & Beverages 11 0,498 0,590 0,326 0,000 0,950Industrial 60 0,252 0,025 0,317 0,000 0,960Utilities & Transportation 17 0,057 0,000 0,139 0,000 0,460
All Industries 245 0,278 0,170 0,298 0,000 0,990
a Insider ownership is defined as the total equity stake of incumbent and former board members includingtheir families. This corresponds to the variable MB SB FBM defined in table 3.
b The industry classification differs from the current scheme used by Deutsche Borse AG which classifiesPrime Standard companies into 18 different industries, since the new classification scheme differs fromthe one in place at the end of 1998. Furthermore, the number of industry categories was reduced bygrouping from 15 to 8 non-financial categories.
25
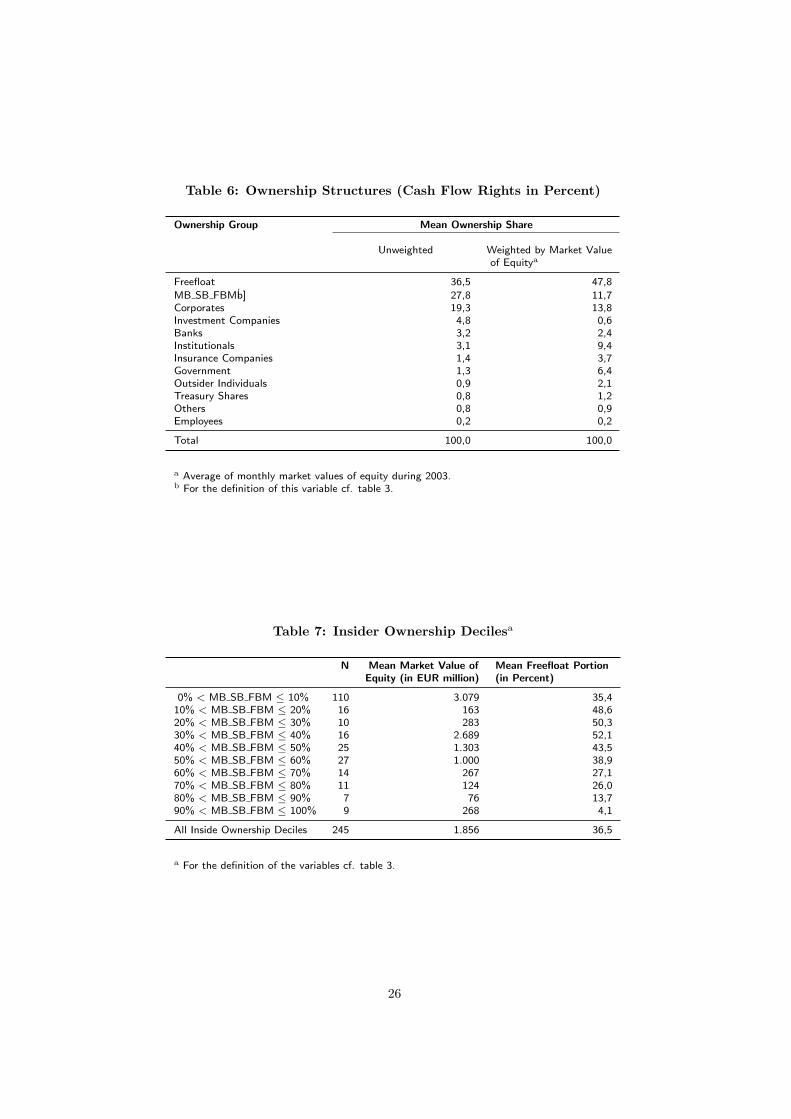
Table 6: Ownership Structures (Cash Flow Rights in Percent)
Ownership Group Mean Ownership Share
Unweighted Weighted by Market Valueof Equitya
Freefloat 36,5 47,8
MB SB FBM[b] 27,8 11,7Corporates 19,3 13,8Investment Companies 4,8 0,6Banks 3,2 2,4Institutionals 3,1 9,4Insurance Companies 1,4 3,7Government 1,3 6,4Outsider Individuals 0,9 2,1Treasury Shares 0,8 1,2Others 0,8 0,9Employees 0,2 0,2
Total 100,0 100,0
a Average of monthly market values of equity during 2003.b For the definition of this variable cf. table 3.
Table 7: Insider Ownership Decilesa
N Mean Market Value of Mean Freefloat PortionEquity (in EUR million) (in Percent)
0% < MB SB FBM ≤ 10% 110 3.079 35,410% < MB SB FBM ≤ 20% 16 163 48,620% < MB SB FBM ≤ 30% 10 283 50,330% < MB SB FBM ≤ 40% 16 2.689 52,140% < MB SB FBM ≤ 50% 25 1.303 43,550% < MB SB FBM ≤ 60% 27 1.000 38,960% < MB SB FBM ≤ 70% 14 267 27,170% < MB SB FBM ≤ 80% 11 124 26,080% < MB SB FBM ≤ 90% 7 76 13,790% < MB SB FBM ≤ 100% 9 268 4,1
All Inside Ownership Deciles 245 1.856 36,5
a For the definition of the variables cf. table 3.
26
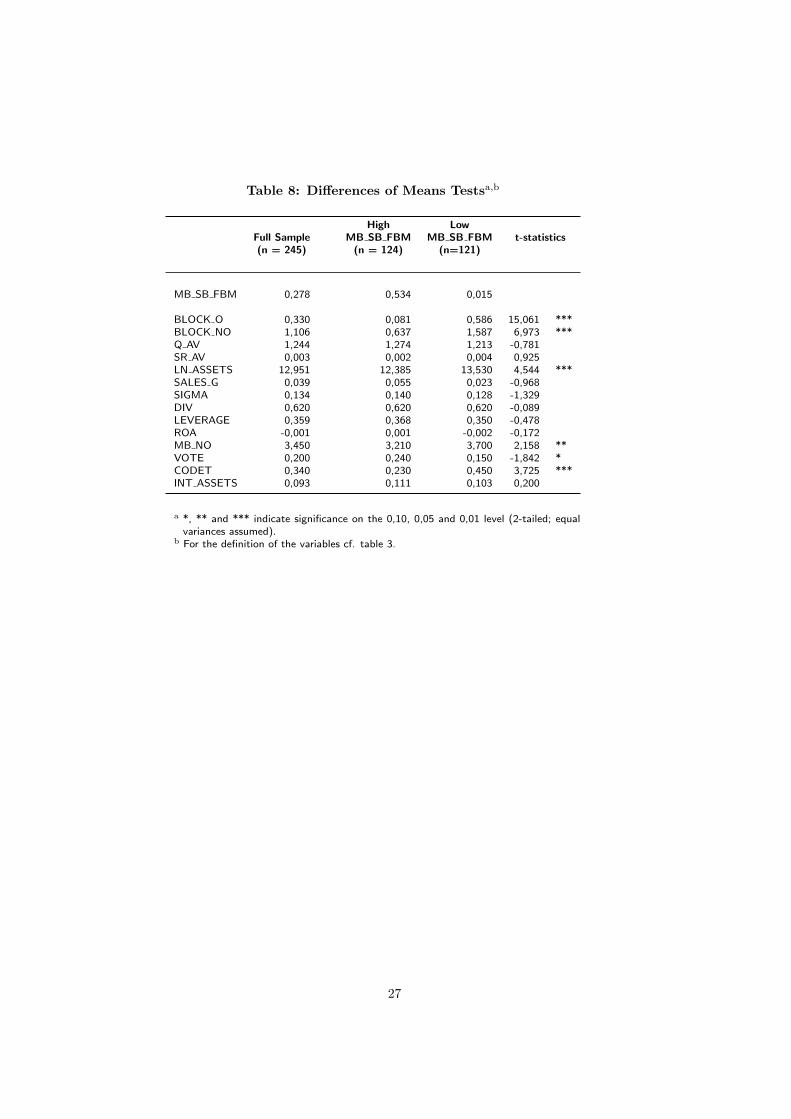
Table 8: Differences of Means Testsa,b
High LowFull Sample MB SB FBM MB SB FBM t-statistics(n = 245) (n = 124) (n=121)
MB SB FBM 0,278 0,534 0,015
BLOCK O 0,330 0,081 0,586 15,061 ***BLOCK NO 1,106 0,637 1,587 6,973 ***Q AV 1,244 1,274 1,213 -0,781SR AV 0,003 0,002 0,004 0,925LN ASSETS 12,951 12,385 13,530 4,544 ***SALES G 0,039 0,055 0,023 -0,968SIGMA 0,134 0,140 0,128 -1,329DIV 0,620 0,620 0,620 -0,089LEVERAGE 0,359 0,368 0,350 -0,478ROA -0,001 0,001 -0,002 -0,172MB NO 3,450 3,210 3,700 2,158 **VOTE 0,200 0,240 0,150 -1,842 *CODET 0,340 0,230 0,450 3,725 ***INT ASSETS 0,093 0,111 0,103 0,200
a *, ** and *** indicate significance on the 0,10, 0,05 and 0,01 level (2-tailed; equalvariances assumed).
b For the definition of the variables cf. table 3.
27
Tab
le9:
Pea
rson
/Spea
rman
Cor
rela
tion
Mat
rix
a,b
,c
SR
AV
QAV
MB
SB
FBM
BLO
CK
OBLO
CK
NO
LN
ASSET
SSA
LES
GSIG
MA
DIV
LEVERAG
ERO
A
SR
AV
0,3
47
**
-0,1
02
0,0
49
-0,1
09
0,2
91
**
0,3
16
**
-0,1
62
*0,3
9**
-0,4
54
**
0,4
97
**
QAV
0,3
32
**
0,0
16
0,0
31
-0,0
42
0,0
18
0,1
05
0,0
25
0,0
62
-0,4
61
**
0,2
57
**
MB
SB
FBM
-0,0
31
0,0
38
-0,7
50
**
-0,5
86
-0,3
31
**
0,0
84
0,0
59
-0,0
38
0,0
54
-0,0
19
BLO
CK
O0,0
53
0,0
04
-0,6
77
**
0,7
41
0,1
94
**
-0,0
33
-0,1
74
**
0,0
06
-0,0
35
-0,0
70
BLO
CK
NO
-0,1
31
*-0
,096
-0,4
92
**
0,4
91
**
0,2
18
**
-0,0
41
-0,0
99
0,0
80
0,0
91
-0,0
78
LN
ASSET
S0,2
53
**
-0,0
04
-0,2
89
**
0,0
94
0,1
49
0,2
04
**
-0,3
21
**
0,4
83
**
0,0
85
0,2
80
SA
LES
G-0
,261
**
0,0
50
0,1
34
*-0
,021
-0,0
72
0,0
77
-0,2
71
**
0,3
63
**
-0,0
25
0,2
93
SIG
MA
0,0
34
0,0
65
0,0
42
-0,1
78
**
-0,0
78
-0,3
35
**
-0,0
01
-0,4
89
**
0,1
84
**
-0,3
15
DIV
0,3
92
**
0,0
69
-0,0
30
-0,0
36
0,0
58
0,4
52
**
0,1
09
-0,4
79
**
-0,1
21
0,4
29
LEV
ERAG
E-0
,454
**
-0,4
27
**
0,0
52
-0,0
53
0,1
37
0,0
62
0,0
31
0,1
22
-0,1
59
*-0
,316
RO
A0,4
02
**
0,2
46
**
0,0
08
-0,1
05
-0,1
06
0,2
99
**
0,1
57
*-0
,369
**
0,4
03
**
-0,2
54
**
aPea
rson
corr
elation
coeffi
cien
t(p
aram
etric)
are
show
nbel
owth
edia
gonaland
Spea
rman
rank
corr
elation
coeffi
cien
ts(n
on
par
am
etric)
are
show
nabove
the
dia
gonal.
bT
he
defi
nitio
ns
ofall
variable
sca
nbe
found
inta
ble
3.
c*,**
and
***
indic
ate
signifi
cance
on
the
0,1
0,0,0
5and
0,0
1le
vel(2
-tailed
).
28
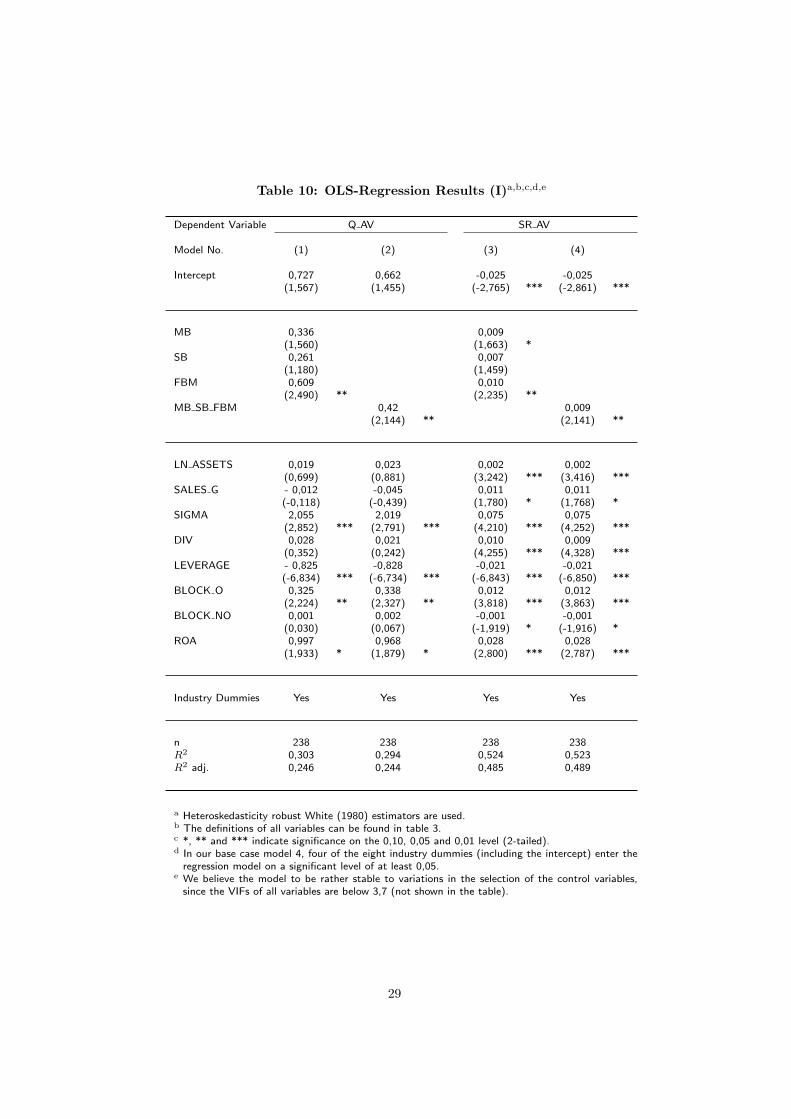
Table 10: OLS-Regression Results (I)a,b,c,d,e
Dependent Variable Q AV SR AV
Model No. (1) (2) (3) (4)
Intercept 0,727 0,662 -0,025 -0,025(1,567) (1,455) (-2,765) *** (-2,861) ***
MB 0,336 0,009(1,560) (1,663) *
SB 0,261 0,007(1,180) (1,459)
FBM 0,609 0,010(2,490) ** (2,235) **
MB SB FBM 0,42 0,009(2,144) ** (2,141) **
LN ASSETS 0,019 0,023 0,002 0,002(0,699) (0,881) (3,242) *** (3,416) ***
SALES G - 0,012 -0,045 0,011 0,011(-0,118) (-0,439) (1,780) * (1,768) *
SIGMA 2,055 2,019 0,075 0,075(2,852) *** (2,791) *** (4,210) *** (4,252) ***
DIV 0,028 0,021 0,010 0,009(0,352) (0,242) (4,255) *** (4,328) ***
LEVERAGE - 0,825 -0,828 -0,021 -0,021(-6,834) *** (-6,734) *** (-6,843) *** (-6,850) ***
BLOCK O 0,325 0,338 0,012 0,012(2,224) ** (2,327) ** (3,818) *** (3,863) ***
BLOCK NO 0,001 0,002 -0,001 -0,001(0,030) (0,067) (-1,919) * (-1,916) *
ROA 0,997 0,968 0,028 0,028(1,933) * (1,879) * (2,800) *** (2,787) ***
Industry Dummies Yes Yes Yes Yes
n 238 238 238 238R2 0,303 0,294 0,524 0,523R2 adj. 0,246 0,244 0,485 0,489
a Heteroskedasticity robust White (1980) estimators are used.b The definitions of all variables can be found in table 3.c *, ** and *** indicate significance on the 0,10, 0,05 and 0,01 level (2-tailed).d In our base case model 4, four of the eight industry dummies (including the intercept) enter the
regression model on a significant level of at least 0,05.e We believe the model to be rather stable to variations in the selection of the control variables,
since the VIFs of all variables are below 3,7 (not shown in the table).
29

Table 11: OLS-Regression Results (II)a,b,c,d,e
Dependent Variable SR AV
Model No. (5) (6) (7a) (7b) (8)
Intercept -0,022 -0,023 -0,029 -0,024 -0,018(-2,578) *** (-2,590) *** (-3,546) *** (-2,831) *** (-2,489)***
MB SB FBM -0,005 0,011(-0,541) (2,568) **
MB SB FBM SQ 0,016(1,588)
MB SB FBM 0to5 -0,079(-0,850)
MB SB FBM 5to25 0,018(0,678)
MB SB FBM 25to100 0,012(1,990) *
MB SB FBM AV 0,076(2,655) ***
MB SB FBM NO -0,001(-2,130) **
MB SB FBM EUR 0,000(0,726)
LN ASSETS 0,001 0,001 0,002 0,002 0,001(3,054) *** (3,085) *** (3,978) *** (3,485) *** (3,041) ***
SALES G 0,010 0,010 0,010 0,010 0,012(1,785) * (1,766) * (1,922) * (1,729) * (1,791) *
SIGMA 0,077 0,078 0,072 0,077 0,070(4,435) *** (4,382) *** (4,355) *** (4,432) *** (3,998) ***
DIV 0,010 0,010 0,009 0,01 0,009(4,539) *** (4,491) *** (4,465) *** (4,421) *** (4,132) ***
LEVERAGE -0,021 -0,021 -0,022 -0,021 -0,021(-6,868) *** (-7,074) *** (-7,171) *** (-6,948) *** (-6,403) ***
BLOCK O 0,010 0,010 0,012 0,011 0,008(3,339) *** (3,296) *** (4,343) *** (3,649) *** (3,219) ***
BLOCK NO -0,001 -0,001 -0,001 -0,001 -0,002(-1,6906) * (-1,448) (-1,793) * (-1,814) * (-2,608) **
ROA 0,028 0,028 0,027 0,027 0,026(2,818) *** (2,919) *** (2,750) *** (2,795) *** (2,508) **
Industry Dummies Yes Yes Yes Yes Yes
n 238 238 238 238 238R2 0,528 0,527 0,535 0,530 0,510R2 adj. 0,491 0,489 0,502 0,494 0,473
a Heteroskedasticity robust White (1980) estimators are used.b The definitions of all variables can be found in table 3.c *, ** and *** indicate significance on the 0,10, 0,05 and 0,01 level (2-tailed).d Variations of the insider ownership thresholds in equation 6 were performed. However, the results are not shown because
none of these variations delivered considerably better results than those by using the 5% and 25% thresholds originallyused by Morck, Shleifer, and Vishny (1988).
e In model 5 the VIFs for MB SB FBM and MB SB FBM SQ are 15,9 and 12,1 respectively indicating the presence ofmulticollinearity.
30
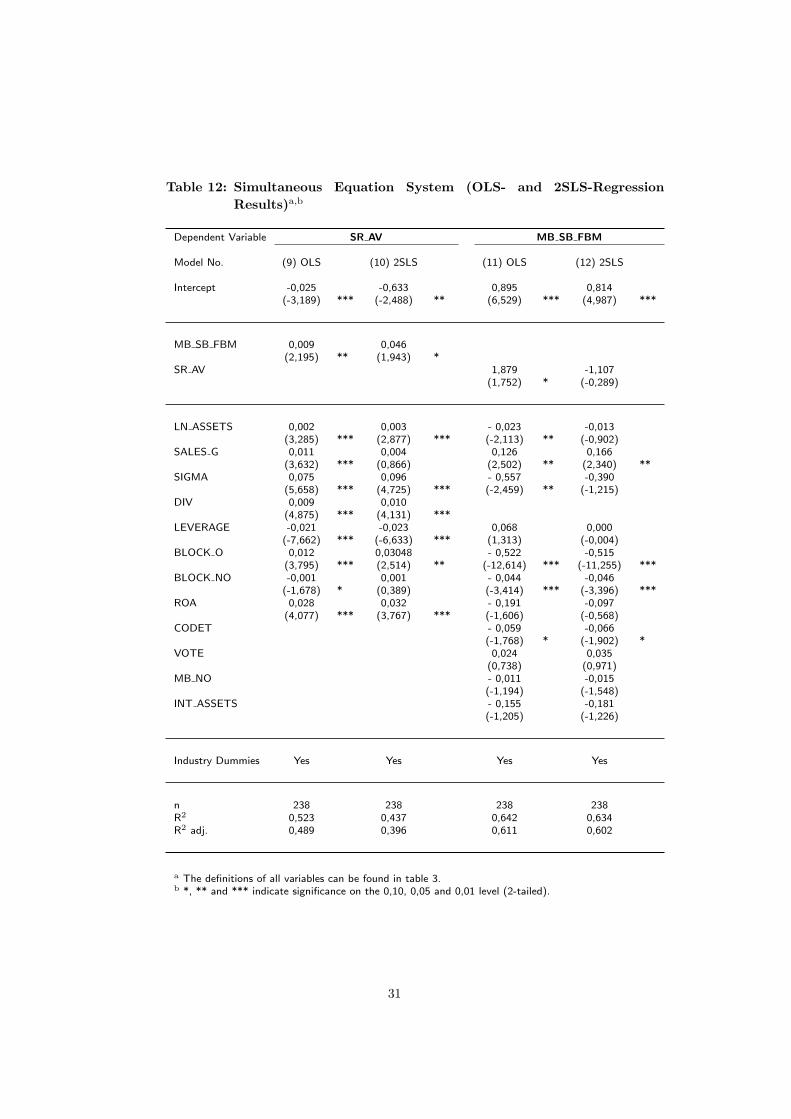
Table 12: Simultaneous Equation System (OLS- and 2SLS-RegressionResults)a,b
Dependent Variable SR AV MB SB FBM
Model No. (9) OLS (10) 2SLS (11) OLS (12) 2SLS
Intercept -0,025 -0,633 0,895 0,814(-3,189) *** (-2,488) ** (6,529) *** (4,987) ***
MB SB FBM 0,009 0,046(2,195) ** (1,943) *
SR AV 1,879 -1,107(1,752) * (-0,289)
LN ASSETS 0,002 0,003 - 0,023 -0,013(3,285) *** (2,877) *** (-2,113) ** (-0,902)
SALES G 0,011 0,004 0,126 0,166(3,632) *** (0,866) (2,502) ** (2,340) **
SIGMA 0,075 0,096 - 0,557 -0,390(5,658) *** (4,725) *** (-2,459) ** (-1,215)
DIV 0,009 0,010(4,875) *** (4,131) ***
LEVERAGE -0,021 -0,023 0,068 0,000(-7,662) *** (-6,633) *** (1,313) (-0,004)
BLOCK O 0,012 0,03048 - 0,522 -0,515(3,795) *** (2,514) ** (-12,614) *** (-11,255) ***
BLOCK NO -0,001 0,001 - 0,044 -0,046(-1,678) * (0,389) (-3,414) *** (-3,396) ***
ROA 0,028 0,032 - 0,191 -0,097(4,077) *** (3,767) *** (-1,606) (-0,568)
CODET - 0,059 -0,066(-1,768) * (-1,902) *
VOTE 0,024 0,035(0,738) (0,971)
MB NO - 0,011 -0,015(-1,194) (-1,548)
INT ASSETS - 0,155 -0,181(-1,205) (-1,226)
Industry Dummies Yes Yes Yes Yes
n 238 238 238 238R2 0,523 0,437 0,642 0,634R2 adj. 0,489 0,396 0,611 0,602
a The definitions of all variables can be found in table 3.b *, ** and *** indicate significance on the 0,10, 0,05 and 0,01 level (2-tailed).
31

Table 13: Endogeneity of Insider Ownership(OLS-Regression Results)a,b,c
Dependent Variable MB SB FBM
Model No. (13) OLS (14) OLS
Intercept 0,895 0,569(7,442) *** (4,626) ***
SR AV 1,879 2,368(1,856) * (2,587) ***
MB SB FBM 98 0,335(6,182) ***
LN ASSETS - 0,023 - 0,011(-2,280) ** (-1,193)
SALES G 0,126 0,150(2,619) *** (3,198) ***
SIGMA - 0,557 - 0,596(-2,529) ** (-2,553) **
LEVERAGE 0,068 0,082(1,379) (1,904) *
BLOCK O - 0,522 - 0,442(-16,628) *** (-11,724) ***
BLOCK NO - 0,044 - 0,029(-3,669) *** (-2,605) ***
ROA - 0,191 - 0,2302(-1,996) ** (-2,367) **
CODET - 0,059 - 0,052(-1,910) * (-1,898) *
VOTE 0,024 - 0,005(0,895) (-0,211)
MB NO - 0,011 - 0,011(-1,369) (-1,580)
INT ASSETS - 0,155 -0,173(-1,232) (-1,566)
Industry Dummies Yes Yes
n 238 238R2 0,642 0,712R2 adj. 0,611 0,688
a Heteroskedasticity robust White (1980) estimators are used.b The definitions of all variables can be found in table 3.c *, ** and *** indicate significance on the 0,10, 0,05 and 0,01
level (2-tailed).
32
Related Documents