This article was downloaded by: [84.122.203.252] On: 24 October 2012, At: 09:19 Publisher: Taylor & Francis Informa Ltd Registered in England and Wales Registered Number: 1072954 Registered office: Mortimer House, 37-41 Mortimer Street, London W1T 3JH, UK European Journal of Phycology Publication details, including instructions for authors and subscription information: http://www.tandfonline.com/loi/tejp20 Influence of temperature on the relationship between oxygen- and fluorescence-based estimates of photosynthetic parameters in a marine benthic diatom (Cylindrotheca closterium) Edward P. Morris a & Jacco C. Kromkamp a a Netherlands Institute of Ecology, Centre for Estuarine and Coastal Ecology (NIOO- CEME), PO Box 140, 4400 AC, Yerseke, The Netherlands Version of record first published: 09 Nov 2010. To cite this article: Edward P. Morris & Jacco C. Kromkamp (2003): Influence of temperature on the relationship between oxygen- and fluorescence-based estimates of photosynthetic parameters in a marine benthic diatom (Cylindrotheca closterium) , European Journal of Phycology, 38:2, 133-142 To link to this article: http://dx.doi.org/10.1080/0967026031000085832 PLEASE SCROLL DOWN FOR ARTICLE Full terms and conditions of use: http://www.tandfonline.com/page/terms-and-conditions This article may be used for research, teaching, and private study purposes. Any substantial or systematic reproduction, redistribution, reselling, loan, sub-licensing, systematic supply, or distribution in any form to anyone is expressly forbidden. The publisher does not give any warranty express or implied or make any representation that the contents will be complete or accurate or up to date. The accuracy of any instructions, formulae, and drug doses should be independently verified with primary sources. The publisher shall not be liable for any loss, actions, claims, proceedings, demand, or costs or damages whatsoever or howsoever caused arising directly or indirectly in connection with or arising out of the use of this material.

Welcome message from author
This document is posted to help you gain knowledge. Please leave a comment to let me know what you think about it! Share it to your friends and learn new things together.
Transcript
This article was downloaded by: [84.122.203.252]On: 24 October 2012, At: 09:19Publisher: Taylor & FrancisInforma Ltd Registered in England and Wales Registered Number: 1072954 Registered office: MortimerHouse, 37-41 Mortimer Street, London W1T 3JH, UK
European Journal of PhycologyPublication details, including instructions for authors and subscriptioninformation:http://www.tandfonline.com/loi/tejp20
Influence of temperature on the relationshipbetween oxygen- and fluorescence-basedestimates of photosynthetic parameters ina marine benthic diatom (Cylindrothecaclosterium)Edward P. Morris a & Jacco C. Kromkamp aa Netherlands Institute of Ecology, Centre for Estuarine and Coastal Ecology (NIOO-CEME), PO Box 140, 4400 AC, Yerseke, The Netherlands
Version of record first published: 09 Nov 2010.
To cite this article: Edward P. Morris & Jacco C. Kromkamp (2003): Influence of temperature on the relationshipbetween oxygen- and fluorescence-based estimates of photosynthetic parameters in a marine benthic diatom(Cylindrotheca closterium) , European Journal of Phycology, 38:2, 133-142
To link to this article: http://dx.doi.org/10.1080/0967026031000085832
PLEASE SCROLL DOWN FOR ARTICLE
Full terms and conditions of use: http://www.tandfonline.com/page/terms-and-conditions
This article may be used for research, teaching, and private study purposes. Any substantial orsystematic reproduction, redistribution, reselling, loan, sub-licensing, systematic supply, or distributionin any form to anyone is expressly forbidden.
The publisher does not give any warranty express or implied or make any representation that thecontents will be complete or accurate or up to date. The accuracy of any instructions, formulae, anddrug doses should be independently verified with primary sources. The publisher shall not be liable forany loss, actions, claims, proceedings, demand, or costs or damages whatsoever or howsoever causedarising directly or indirectly in connection with or arising out of the use of this material.

Eur. J. Phycol. (2003). 38: 133 - 141.'0 Taylor & Francis~ Tol)'lor&franmGroup
Influence of temperature on the relationship between oxygen- andfluorescence-based estimates of photosynthetic parameters in amarine benthic diatom (Cylindrotheca closterium)
EDWARD P. MORRIS AND JACCO C. KROMKAMP
Netherlands Institute of Ecology. Centre for Estuarine and Coastal Ecology (NIOO-CEME). PO Box 140.4400 AC, Yerseke.The Netherlands
(Received 21 Decemher 200/: accepted 31 Decemher 2002)
In this paper we investigate the temperature sensitivity of the photosynthetic process of the benthic diatom Cylindrothecaclosterium grown in light-limited turbidostat cultures at two different growth rates. Photosynthesis was measured as the rateof oxygen evolution and as the photosystem II (PSII) electron transport rate (ETR). The photosynthetic efficiency (a), asmeasured by both methods. was rather insensitive to temperature, and decreased significantly only at the extremetemperatures used (S and 3S'C). The maxImum PSII quantum efficiency (Fv/Fm) showed a small but significant trend ofreduction with increasing temperature. However, the maximum rate of photosynthesis (pBmax and ETRmax) was extremelytemperature sensitive. The effect of temperature on the relationship between pB and ETR was limited to the most extremetemperatures investigated; deviations from linearity were most extreme at SoC and different conversion factors were observedat Sand 3YC. A short-term change in temperature (lO-30°C), as might be experienced during emersion on a Europeantidal flat, will not significantly affect the relationship between pB and ETR. However, care should be taken when using asingle conversion factor between pB and ETR at the extremes of the temperature range. We have also shown that algalabsorption measurements are important for correct calcUlation of ETR. The facts that different species seem to havedifferent conversion factors and that changing environmental conditions will affect the absorption capacity and growth rateof the microphytobenthos (MPH) community suggest that it is wise to perform further calibrations of the relationship in thefield before use in primary production modelling. Variable fluorescence measurements are quick and non-invasive and, withknowledge of the absorption properties of the MPH community, allow the quantification of photosynthetic parametersacross large areas. Hence they are potentially useful for improving our estimates of ecosystem scale primary production.
Key words: microphytobenthos. PAM fluorescence. photosynthesis, PSII electron transport. temperature
Introduction
Benthic microalgae or microphytobenthos (MPB)form highly productive natural ecosystems inintertidal areas (Cahoon, 1999). They are animportant food source for both benthic and pelagiccommunities (MacIntyre et al., 1996; Underwood& Kromkamp, 1999) and have also been linked tosediment stabilization (Underwood et al., 1995).
Three main factors appear to regulate the rate ofphotosynthesis in microphytobenthos: I~ght availability (Barranguet et al., 1998; Perkms et af.,2001), mud surface temperature (Blanchard et al.,1996; Guarini et al., 1997) and CO2 availability(Underwood & Kromkamp, 1999 and referencestherein). Nutrients are not generally thought to belimiting in intertidal habitats (Underwood &Kromkamp, 1999). Both light and temperature
Correspondence 10· E. Morris. e-mail: E.morris(a·nioo.knaw.nl
change on seasonal, daily and hourly time scales.The two factors also co-vary, making theirindividual effects hard to separate in field situations(Guarini et al., 1997). In order to model and predictrates of primary production on estuarine flatssuccessfully, it is necessary to understand therelationship between temperature and photosynthesis at both short (hourly, daily) and long-term(seasonal) time scales.
The temperature of the surface (upper 200 }.lm)in muddy (dominated by < 0.63}.lm particles)sediments in temperate regions can easily changeby lOoe within an emersion period, with rates oftemperature change as high as 4°C h-I (Harrison,1985). The magnitude of these changes is related tothe timing of exposure to the atmosphere and theprevailing meteorological conditions, which jointlydetermine the nature of heat exchange between thesediment and the atmospheric boundary layer(Harrison & Phizacklea, 1987).
ISSN 0967-0262 pnnt ISSN 1469-4433 online' 2003 Bntlsh Phycologlcal SocIety
DOl: 10 1080/0967026031000085832
Dow
nloa
ded
by [
84.1
22.2
03.2
52]
at 0
9:19
24
Oct
ober
201
2
E. P. Morris and J. C. Kromkamp
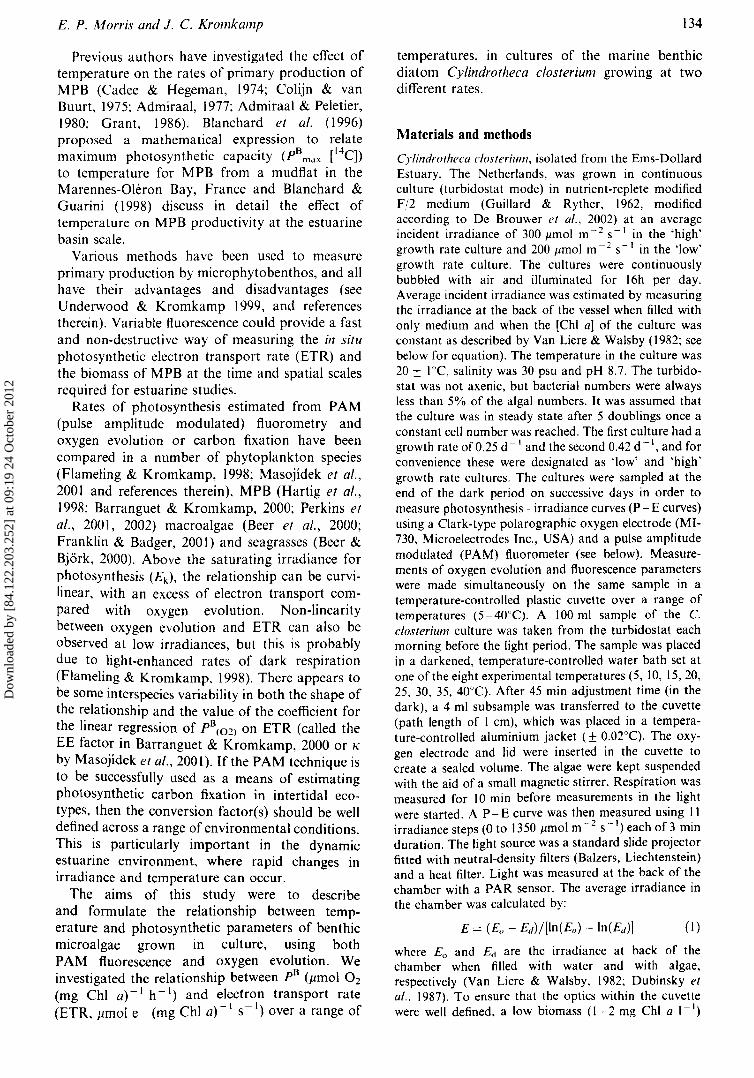
Previous authors have investigated the effect oftemperature on the rates of primary production ofMPB (Cadee & Hegeman, 1974; Colijn & vanBuurt, 1975; Admiraal, 1977; Admiraal & Peletier,1980; Grant, 1986). Blanchard et al. (1996)proposed a mathematical expression to relatemaximum photosynthetic capacity (pB
l11dX [14CD
to temperature for MPB from a mudflat in theMarennes-Oleron Bay, France and Blanchard &Guarini (1998) discuss in detail the effect oftemperature on MPB productivity at the estuarinebasin scale.
Various methods have been used to measureprimary production by microphytobenthos, and allhave their advantages and disadvantages (seeUnderwood & Kromkamp 1999, and referencestherein). Variable fluorescence could provide a fastand non-destructive way of measuring the in situphotosynthetic electron transport rate (ETR) andthe biomass of MPB at the time and spatial scalesrequired for estuarine studies.
Rates of photosynthesis estimated from PAM(pulse amplitude modulated) fluorometry andoxygen evolution or carbon fixation have beencompared in a number of phytoplankton species(Flameling & Kromkamp, 1998; Masojidek et al.,2001 and references therein), MPB (Hartig et al.,1998; Barranguet & Kromkamp, 2000; Perkins etal., 2001, 2002) macroalgae (Beer et al., 2000;Franklin & Badger, 2001) and seagrasses (Beer &Bjork, 2000). Above the saturating irradiance forphotosynthesis (Ed, the relationship can be curvilinear, with an excess of electron transport compared with oxygen evolution. Non-linearitybetween oxygen evolution and ETR can also beobserved at low irradiances, but this is probablydue to light-enhanced rates of dark respiration(Flameling & Kromkamp, 1998). There appears tobe some interspecies variability in both the shape ofthe relationship and the value of the coefficient forthe linear regression of pB(02) on ETR (called theEE factor in Barranguet & Kromkamp, 2000 or K
by Masojidek et al., 2001). If the PAM technique isto be successfully used as a means of estimatingphotosynthetic carbon fixation in intertidal ecotypes, then the conversion factor(s) should be welldefined across a range of environmental conditions.This is particularly important in the dynamicestuarine environment, where rapid changes inirradiance and temperature can occur.
The aims of this study were to describeand formulate the relationship between temperature and photosynthetic parameters of benthicmicroalgae grown in culture, using bothPAM fluorescence and oxygen evolution. Weinvestigated the relationship between p B (/lmol O 2
(mg Chi a) - I h - I) and electron transport rate(ETR, /lmol e (mg Chi a) - I S-I) over a range of
134
temperatures, in cultures of the marine benthicdiatom Cylindrotheca c10sterium growing at twodifferent rates.
Materials and methods
Cy/indrotheca c!osterium, isolated from the Ems-DollardEstuary, The Netherlands, was grown in continuousculture (turbidostat mode) in nutrient-replete modifiedFj2 medium (Guillard & Ryther, 1962, modifiedaccording to De Brou'Wer et al., 2002) at an averageincident irradiance of 300 Jimol m - 2 S - I in the 'high'growth rate culture and 200 flmol m- 2 S- 1 in the 'low'growth rate culture. The cultures were continuouslybubbled with air and illuminated for l6h per day.Average incident irradiance was estimated by measuringthe irradiance at the back of the vessel when filled withonly medium and when the [Chi aJ of the culture wasconstant as described by Van Liere & Walsby (1982; seebelow for equation). The temperature in the culture was20 ± IOC. salinity was 30 psu and pH 8.7. The turbidostat was not axenic, but bacterial numbers were alwaysless than 5% of the algal numbers. It was assumed thatthe culture was in steady state after 5 doublings once aconstant cell number was reached. The first culture had agrowth rate of 0.25 d - I and the second 0.42 d -I, and forconvenience these were designated as 'low' and 'high'growth rate cultures. The cultures were sampled at theend of the dark period on successive days in order tomeasure photosynthesis - irradiance curves (P - E curves)using a Clark-type polarographic oxygen electrode (MI730, Microelectrodes Inc" USA) and a pulse amplitudemodulated (PAM) fluorometer (see below). Measurements of oxygen evolution and fluorescence parameterswere made simultaneously on the same sample in atemperature-controlled plastic cuvette over a range oftemperatures (5-40°C). A 100 ml sample of the C.c10sterium culture was taken from the turbidostat eachmorning before the light period. The sample was placedin a darkened, temperature-controlled water bath set atone of the eight experimental temperatures (5, 10, IS, 20,25, 30, 35, 40°C). After 45 min adjustment time (in thedark), a 4 ml subsample was transferred to the cuvette(path length of I cm), which was placed in a temperature-controlled aluminium jacket (± 0.02°C). The oxygen electrode and lid were inserted in the cuvette tocreate a sealed volume. The algae were kept suspendedwith the aid of a small magnetic stirrer. Respiration wasmeasured for 10 min before measurements in the lightwere started. A P- E curve was then measured using IIirradiance steps (0 to 1350 Jimol m -2 s -I) each of 3 minduration. The light source was a standard slide projectorfitted with neutral-density filters (Balzers, Liechtenstein)and a heat filter. Light was measured at the back of thechamber with a PAR sensor. The average irradiance inthe chamber was calculated by:
where Eo and Ed are the irradiance at back of thechamber when filled with water and with algae,respectively (Van Liere & Walsby, 1982; Dubinsky etaI., 1987). To ensure that the optics within the cuvettewere well defined, a low biomass (I - 2 mg Chi a 1- I)
E. P. Morris and J. C. Kromkamp
Previous authors have investigated the effect oftemperature on the rates of primary production ofMPB (Cadee & Hegeman, 1974; Colijn & vanBuurt, 1975; Admiraal, 1977; Admiraal & Peletier,1980; Grant, 1986). Blanchard et al. (1996)proposed a mathematical expression to relatemaximum photosynthetic capacity (pB
l11dX [14CD
to temperature for MPB from a mudflat in theMarennes-Oleron Bay, France and Blanchard &Guarini (1998) discuss in detail the effect oftemperature on MPB productivity at the estuarinebasin scale.
Various methods have been used to measureprimary production by microphytobenthos, and allhave their advantages and disadvantages (seeUnderwood & Kromkamp 1999, and referencestherein). Variable fluorescence could provide a fastand non-destructive way of measuring the in situphotosynthetic electron transport rate (ETR) andthe biomass of MPB at the time and spatial scalesrequired for estuarine studies.
Rates of photosynthesis estimated from PAM(pulse amplitude modulated) fluorometry andoxygen evolution or carbon fixation have beencompared in a number of phytoplankton species(Flameling & Kromkamp, 1998; Masojidek et al.,2001 and references therein), MPB (Hartig et al.,1998; Barranguet & Kromkamp, 2000; Perkins etal., 2001, 2002) macroalgae (Beer et al., 2000;Franklin & Badger, 2001) and seagrasses (Beer &Bjork, 2000). Above the saturating irradiance forphotosynthesis (Ed, the relationship can be curvilinear, with an excess of electron transport compared with oxygen evolution. Non-linearitybetween oxygen evolution and ETR can also beobserved at low irradiances, but this is probablydue to light-enhanced rates of dark respiration(Flameling & Kromkamp, 1998). There appears tobe some interspecies variability in both the shape ofthe relationship and the value of the coefficient forthe linear regression of pB(02) on ETR (called theEE factor in Barranguet & Kromkamp, 2000 or K
by Masojidek et al., 2001). If the PAM technique isto be successfully used as a means of estimatingphotosynthetic carbon fixation in intertidal ecotypes, then the conversion factor(s) should be welldefined across a range of environmental conditions.This is particularly important in the dynamicestuarine environment, where rapid changes inirradiance and temperature can occur.
The aims of this study were to describeand formulate the relationship between temperature and photosynthetic parameters of benthicmicroalgae grown in culture, using bothPAM fluorescence and oxygen evolution. Weinvestigated the relationship between p B (/lmol O 2
(mg Chi a) - I h - I) and electron transport rate(ETR, /lmol e (mg Chi a) - I S-I) over a range of
134
temperatures, in cultures of the marine benthicdiatom Cylindrotheca c10sterium growing at twodifferent rates.
Materials and methods
Cy/indrotheca c!osterium, isolated from the Ems-DollardEstuary, The Netherlands, was grown in continuousculture (turbidostat mode) in nutrient-replete modifiedFj2 medium (Guillard & Ryther, 1962, modifiedaccording to De Brou'Wer et al., 2002) at an averageincident irradiance of 300 Jimol m - 2 S - I in the 'high'growth rate culture and 200 flmol m- 2 S- 1 in the 'low'growth rate culture. The cultures were continuouslybubbled with air and illuminated for l6h per day.Average incident irradiance was estimated by measuringthe irradiance at the back of the vessel when filled withonly medium and when the [Chi aJ of the culture wasconstant as described by Van Liere & Walsby (1982; seebelow for equation). The temperature in the culture was20 ± IOC. salinity was 30 psu and pH 8.7. The turbidostat was not axenic, but bacterial numbers were alwaysless than 5% of the algal numbers. It was assumed thatthe culture was in steady state after 5 doublings once aconstant cell number was reached. The first culture had agrowth rate of 0.25 d - I and the second 0.42 d -I, and forconvenience these were designated as 'low' and 'high'growth rate cultures. The cultures were sampled at theend of the dark period on successive days in order tomeasure photosynthesis - irradiance curves (P - E curves)using a Clark-type polarographic oxygen electrode (MI730, Microelectrodes Inc" USA) and a pulse amplitudemodulated (PAM) fluorometer (see below). Measurements of oxygen evolution and fluorescence parameterswere made simultaneously on the same sample in atemperature-controlled plastic cuvette over a range oftemperatures (5-40°C). A 100 ml sample of the C.c10sterium culture was taken from the turbidostat eachmorning before the light period. The sample was placedin a darkened, temperature-controlled water bath set atone of the eight experimental temperatures (5, 10, IS, 20,25, 30, 35, 40°C). After 45 min adjustment time (in thedark), a 4 ml subsample was transferred to the cuvette(path length of I cm), which was placed in a temperature-controlled aluminium jacket (± 0.02°C). The oxygen electrode and lid were inserted in the cuvette tocreate a sealed volume. The algae were kept suspendedwith the aid of a small magnetic stirrer. Respiration wasmeasured for 10 min before measurements in the lightwere started. A P- E curve was then measured using IIirradiance steps (0 to 1350 Jimol m -2 s -I) each of 3 minduration. The light source was a standard slide projectorfitted with neutral-density filters (Balzers, Liechtenstein)and a heat filter. Light was measured at the back of thechamber with a PAR sensor. The average irradiance inthe chamber was calculated by:
where Eo and Ed are the irradiance at back of thechamber when filled with water and with algae,respectively (Van Liere & Walsby, 1982; Dubinsky etaI., 1987). To ensure that the optics within the cuvettewere well defined, a low biomass (I - 2 mg Chi a 1- I)
Dow
nloa
ded
by [
84.1
22.2
03.2
52]
at 0
9:19
24
Oct
ober
201
2

Temperature and photosynthesis in Cy1indrotheca closterium 135
of C. c10sterium was used in the incubations. The lowbiomass allowed accurate irradiance measurementsand, therefore, ETR determination, but meant thatthe oxygen electrode was operating at its detectionlimit.
Fluorescence was measured using a PAM 10 I-I 03fluorometer (H. Walz, Effeltrich, Germany). The algalsolution was excited by a weak red measuring light(I ).lmol m - 2 S - " maximum emission at 650 nm) andfluorescence was detected at wavelengths above 695 nm.The maximum energy conversion efficiency or quantumefficiency of PSII charge separation (Fv/Fm) wascalculated as:
(2)
concentration (mg 1- I) of the culture was measuredspectrophotometrically according to Jeffrey & Humphries (1975) after extraction of the pigments in 90%acetone. Net oxygen production was normalized to thedaily [ChI aJ and gross production was estimated byadding the initial rate of respiration. P- E curves,which did not show a significant degree of photoinhibition, were fitted to the model proposed by Webbef a/. (1974) and, from the fit, the maximumphotosynthetic capacity (pBmax and ETRmax) and thephotosynthetic efficiency (cxB and aETR
) were derived.The relationship between temperature and maximalphotosynthetic rate was fitted using the non-linearmodel described by Blanchard ef al. (1996):
where Fo is the minimal fluorescence and Fm is themaximum fluorescence (during a saturating light pulse,0.6 s, 6000 Jlmol m - 2 S - ') of a sample dark-adapted forat least 15 min. The effective quantum efficiency ofcharge separation (i.e. the effective quantum efficiency ofPSIl) in actinic irradiance is:
where F is the steady-state fluorescence and Fm' themaximum fluorescence after a saturating pulse whenmeasured in the light (Genty el 0/., 1989), Using t1F/Fm',
the linear rate of electron transport (ETR) can becalculated for a single PSII unit (Genty ef af., 1989;Hofstraat el aI., 1994):
ETR = a*pslI x Ex t1F/Fm ' (4)
where a*psII is the optical cross-section of PSII. Theproduct of E and a*pslI is the amount of irradianceabsorbed by a PSJI unit. Because a*pslI is difficult tomeasure, the spectrally averaged (400-700 nm) chlorophyll specific absorption cross-section was determinedusing the opal glass method according to Shibata el al.(1954) using a double-beam scanning spectrophotometer (UVIKON 940). Values of a* were0.0159 + 0.0005 and 0.0108 ± 0.0004 m2 mg Chi a-I(mean ±SE, n = II) in the low and high growth ratecultures, respectively. For simplicity, it was assumedthat absorbed irradiance was divided equally betweenPSI and PSII (Gilbert ef al., 2000). Therefore, ETRwas calculated as t1F/Fm ' x £12 x a* ().lmol e- (mgChI a)-I S-I).
At least three replicate P- E curves (three curveseach day) were carried out at each of the 8experimental temperatures for both growth treatments,except at 40°C, at which no photosynthesis could bemeasured, and at 15°C for the 'high' growth rateculture, where equipment failure prevented measurements. On each day, an experimental temperature waschosen at random (i.e. temperatures were examined ina random order over the experimental period). Thethree replicate P-E curves were carried out over a 45 h period for each temperature treatment, meaning ineffect that the sample used for the last P- E curve hadup to 4 h to acclimatize to the experimen~al temperature. Replicates from each day were exammed but nopattern of acclimatization in photosynthetic parameters could be found. The chlorophyll a (Chi a)
where Pmax (1) is the maximum photosyntheticcapacity (~mol O2 (mg ChI a)-I h -lor Jimol e- mgChI a - I S - I) at temperature T CC), PMAX is themaximum value of Pmax reached at the optimumtemperature (Topt), Tmax CC) is the lethal temperatureat which no photosynthesis is detectable, and f1 is adimensionless shape parameter. To simplify the curvefitting and error estimation process, the shape parameter f1 was set to 1.3 (an average of the valuesreported by Blanchard et al., 1996) for all thetemperature versus Pmax curves. Changing p between0.5 and 2 resulted in only small changes in the otherfitted parameters « 5%). All curve fitting was carriedout using ordinary least-squares criterion in Statistica6 (StatSoft, Tulsa, USA, 2001).
Linear regression (model I) analysis was carried outon the relationship between p B and ETR (with ETR asthe predictor) across the full range of experimentaltemperatures and for both the experimental growthrates. Data were log transformed (In (x» to ensurestatistical assumptions were fulfilled (normal distribution, homoscedasticity of variance).
A three-way mixed model ANOVA was used toevaluate significant effects of growth rate (fixed factor),temperature (fixed factor) and experimental replication(random factor, nested within growth rate andtemperature) on the slope coefficients of the relationship between p B and ETR (with pB and ETR as thedependent and continuous predictor variables, respectively). Homogeneity of slopes was tested to seewhether temperature affected the slope of the regression estimates (tested separately within each growthtreatment). Fv/Fm data were arcsine transformed[x' = arcsin(vx)] before analysis. One-way or twoway (model I) ANOVA was used to test for significantvariation of the data. The post-hoc unequal meansHSD test was used to determine the significantdifferences between group means within the one-wayANOVA setting. Bartlett's test was used to check forheteroscedasticity of variances. All confidence intervals(el) are at the 95% level. All statistical analyses wereperformed in Statistica 6 (StatSoft, Inc., Tulsa, USA,2001).
(5)( )
/i(Tmax - T)Pmax(T) =PMAX (T
max_ T
opt) x
[ P(( (Tmax - T)) I ) ]exp - (Tmax
- Topd -
(3)t1F/Fm ' = (Fm -F)/Fm '
Dow
nloa
ded
by [
84.1
22.2
03.2
52]
at 0
9:19
24
Oct
ober
201
2

E. p_ Morris and J. C. Kromkamp 136
Results
b~fluellce of temperalure on the maximum rate ofphotosynthesis
Photosynthetic capacity (pBIII,n) The relationshipbetween p B
rna" and temperature for both low andhigh growth rate cultures of Cylindrotheca closterium was characterized by a steady rise in pBmax
with temperature from a value of about 200 /lmolO2 (mg ChI a) - 1 h- I at S°e, to a maximum valueof between 1100 and 900 ,umol O2 (mg ChIa) -1 h -I between 20 and 30v C (Fig. I). Attemperatures above 30°e, pBmax began to declinerapidly, and photosynthesis was undetectable at40c e. Although the fitted curves give an optimumtemperature of approximately 30c C for bothgrowth rates, the highest pBmax value recordedfor the higher growth rate was measured at thegrowth temperature of 20°e. This may be acoincidence or indicate that acclimation to thegrowth temperature has occurred. There were nosignificant differences between parameter valuesestimated from the temperature- pBmax equationfor the high and low growth rate cultures (Table I).
between 1.7 and 2 /lmol e- (mg ChI a) - I S-I at30-35°C.
The estimates for Topt derived from oxygenevolution and ETR measurements were slightlydifferent (I cC ) but, since the measurements weremade at 5°C temperature intervals, the significanceof these differences cannot be evaluated. Nophotosynthesis was measurable at 4QoC with eithermethod.
Influence of temperature on photosynthetic efficiency
Photosynthetic efficiency per unit chlorophyll a(rx B
) There was no clear trend in aB across therange of experimental temperatures (Fig. 3). In thelow growth rate culture, as was between 3.75 and5.9 ,umol O2 (mg ChI a)-I h- I (/lmol m- 2 S-I)-1
in the 10- 35°C range. The lower value at 5°Cwas not statistically significant. In the highgrowth rate culture, ~B was about 2.5 /lmol O2(mg ChI a)-I h- I (,umol m- 2 S-I)-I across the5- 3YC range. The mean value of a B across therange of experimental temperatures was lower forthe high growth rate than for the low growth rateculture (two-way ANOVA, F(\. 37) = 21.14).
Maximum ETR (ETRma ,.) The shapes of therelationships between ETRmax and temperaturefor the low and high growth rate cultures weresimilar to those for pBmax (Fig. 2). The fittedtemperature response curves for the two growthrates were also similar (Table 2). Both growthtreatments began with an ETRmax of approximately 0.38/lmol e- (mg Chi a)-I S-I at 5°C,and ETRmax steadily rose to an optimum of
~ETR There was little influence of temperature ona ETR in either culture (Fig. 4). The high growthrate culture had a mean aETR of 3 nmol e - (mgChi a) - I ()lmol photons) - I m2 across the full rangeof experimental temperatures. The low growthrate culture had a mean aETR of 5.7 nmol e(mg ChI a) - I (/lmol photons) - 1 m2 from 10 to30oe, but aETR was reduced at both 5 and 35cCwhen compared with the adjacent temperature
Fig. 2. Influence of temperature on the maximum electrontransport rate (ETRm,,,, jlmol e- (mg Chi a)-I S-I) ofCylindrotheca closterium grown at 20ne. Other details as inFig. I.
o
-~~---,-------
10 15 20 25 30 35 40 45
Temperature (OC)5
4 '--1-------1o HIgh growlh rate 042 d ', • Low growth rate 0 25 d •
I ... High growlh rate fit
_ Low growth rale fil I I3
o
2 -
1 -
o·I
1800 roH'9h growth rate 0 42 d-1 --l
1600 ~ • Low growth rate fil 0 25 d '~ ... High grOWlh rate fit
:c1400 -
- Low growth rate fIt~
~ (/)
:c 1200 '~0
01 1000 - :c.s- O
'"800 - 01
0 E-O 600 -
EQ)
2: 400 - 0
" E'" 200 - 2:E
lD ><Cl. '"0- ~ Ea:::I-W
0 5 10 15 20 25 30 35 40 45
Temperature (DC)
Fig. 1. Influence of temperature on the maximum photosynthetic capacity (pBmax, ilmol O2 (mg ChI a) -I h -I) ofCl'lindrotheca closterium grown at 20°e. Filled circles,c~lture with a growth rate of 0.25 d - I; open circles, culturewith a growth rate of 0.42 d -I. Error bars show 95%
confidence intervals.
E. P. Morris and J. C. Kromkamp 136
Results
Influence of iemperalUre on ihe maximum raie ofphotosynthesis
Photosynthetic capacity (pBIllt/,.) The relationshipbetween pBmax and temperature for both low andhigh growth rate cultures of Cylindroiheca closterium was characterized by a steady rise in pBmax
with temperature from a value of about 200 J-lmolO2 (mg Chi a) - 1 h - I at 5°e, to a maximum valueof between 1100 and 900 ,umol O2 (mg ChIa)-1 h- 1 between 20 and 30v C (Fig. 1). Attemperatures above 30°e, pBmax began to declinerapidly, and photosynthesis was undetectable at40c e. Although the fitted curves give an optimumtemperature of approximately 30cC for bothgrowth rates, the highest p B
max value recordedfor the higher growth rate was measured at thegrowth temperature of 20°e. This may be acoincidence or indicate that acclimation to thegrowth temperature has occurred. There were nosignificant differences between parameter valuesestimated from the temperature- pBmax equationfor the high and low growth rate cultures (Table I).
between 1.7 and 2 J-lmol e- (mg ChI a) - I S-I at30-35°C.
The estimates for Topt derived from oxygenevolution and ETR measurements were slightlydifferent (I cC ) but, since the measurements weremade at 5°C temperature intervals, the significanceof these differences cannot be evaluated. Nophotosynthesis was measurable at 40°C with eithermethod.
Influence of temperature on photosynthetic efficiency
Photosynthetic efficiency per unit chlorophyll a(rx B
) There was no clear trend in rxB across therange of experimental temperatures (Fig. 3). In thelow growth rate culture, rx B was between 3.75 and5.9 ,umol O2 (mg ChI a)-I h- I (J-lmol m- 2 S-I)-1
in the 10 - 35°C range. The lower value at 5°Cwas not statistically significant. In the highgrowth rate culture, aD was about 2.5 Jlmol O2(mg ChI a)-I h- I (,umol m- 2 S-I)-I across the5- 3YC range. The mean value of rx B across therange of experimental temperatures was lower forthe high growth rate than for the low growth rateculture (two-way ANOVA, F(l. 37) = 21.14).
Maximum ETR (ETRma.,.) The shapes of therelationships between ETRmax and temperaturefor the low and high growth rate cultures weresimilar to those for pBmax (Fig. 2). The fittedtemperature response curves for the two growthrates were also similar (Table 2). Both growthtreatments began with an ETRmax of approximately 0.38 ,umol e - (mg Chi a) - I S-I at 5°C,and ETRmax steadily rose to an optimum of
:t. ETR There was little influence of temperature ona ETR in either culture (Fig. 4). The high growthrate culture had a mean rxETR of 3 nmol e - (mgChI a) - I (J-lmol photons) - I m2 across the full rangeof experimental temperatures. The low growthrate culture had a mean rxETR of 5.7 nmol e(mg Chi a) - I (J-lffiol photons) - I m2 from 10 to30°C, but rx ETR was reduced at both 5 and 35cCwhen compared with the adjacent temperature
Fig. 2. Influence of temperature on the maximum electrontransport rate (ETRma•• jlmol e- (mg Chi a)-I S-I) ofCylindrotheca closterium grown at 20n C. Other details as inFig. I.
o
--~---,-------
10 15 20 25 30 35 40 45
Temperature (Oe)
5
4 'I---------------1o HIgh growlh rate 042 d '
, • Low growth rate 0 25 d '
I .. - High growlh rale fit
_ Low growth rale fit I I3
o
2 -
1 -
o·I
1800 roHogh growth rate 0 42 d-' --l
1600 ~ • low growth (ale fit 0 25 d '~ - .. High grOWlh rate fit
:c 1400 -- Lew growth rste fit
~
Cil (/)
:c 1200 '~()
OJ 1000 - :c.s ()
'"800 - OJ
0 E-O 600 -
EQ)
2: 400 - 0
" E'" 200· 2:E
CD
"0.. '"0- ., Ea:::I-w
a 5 10 15 20 25 30 35 40 45
Temperature (DC)
Fig. 1. Influence of temperature on the maximum photosynthetic capacity (pBmax, pmol O2 (mg ChI a) -I h -I) ofCrlindrotheca closterium grown at 20°e. Filled circles,c~lture with a growth rate of 0.25 d - I; open circles, culturewith a growth rate of 0.42 d -I. Error bars show 95%confidence intervals.
Dow
nloa
ded
by [
84.1
22.2
03.2
52]
at 0
9:19
24
Oct
ober
201
2
Temperature and photosynthesis in Cylindrotheca closterium 137
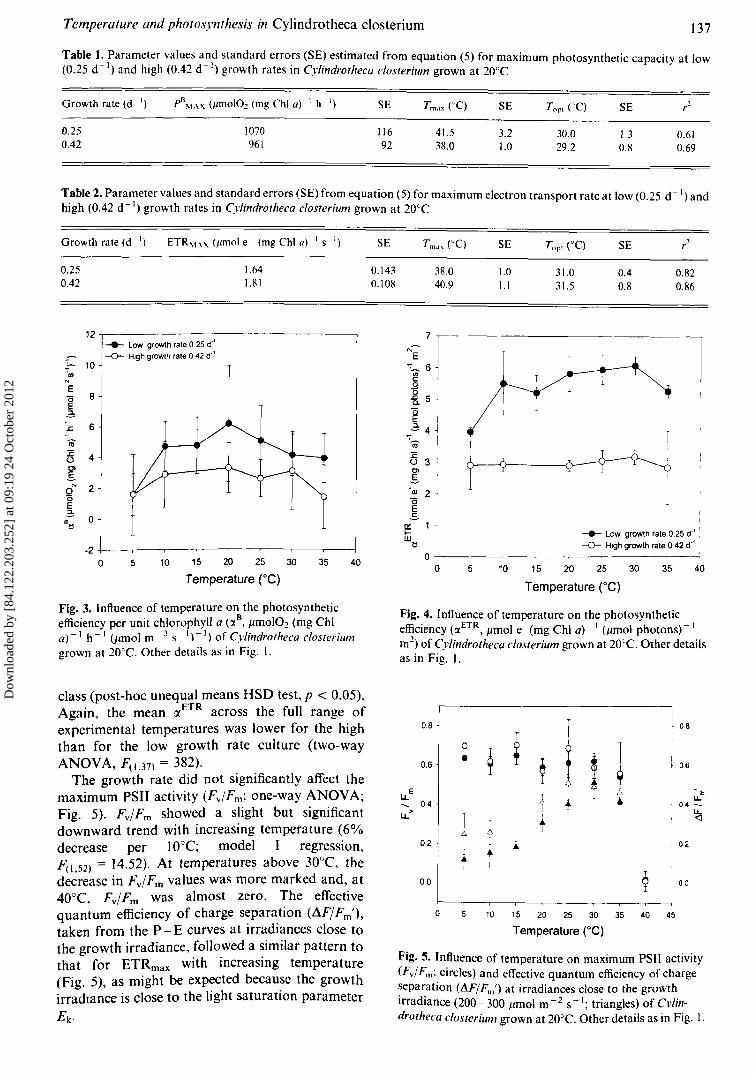
Table I. Parameter values and standard errors (SE) estimated from equation (5) for maximum photosynthetic capacity at low(0.25 d - J) and high (0.42 d - I) growth rates in Cylindrotheca closterium grown at 20°C
Growth rate (d ') p8~1"X (ttmol01 (mg Chi a) I h '} SE SE SE r1
0.250.42
1070961
11692
41.538.0
3.21.0
30.029.2
1.30.8
0.610.69
Table 2. Parameter values and standard errors (SE) from equation (5) for maximum electron transport rate at low (0.25 d - I) andhigh (0.42 d - J) growth rates in Cylilldrotheca closterium grown at 20°C
Growth rate (d ') ETR'I\X (ttmol e (mg ChI a) 'Si) SE SE SE
0.250.42
1.641.81
0.1430.108
38.040.9
1.01.1
31.031.5
0.40.8
0.820.86
40353025
-.- Low growth rale 0.25 d"' I-0- High growth rate 0 42 dO'
2015105
Temperature ee)
o~---~-~--~---~-----'
o403515 20 25 30
Temperature rC)105
........ Low growth rale 0 25 d"'-0- High growth rale 0 42 dO'
·2 +---.---.---.--.--.--.----.----1o
:c 6
-;..... 10"'IllN
E(5 8E3:
12..------------------,
Fig. 3. Influence of temperature on the photosyntheticefficiency per unit chlorophyll a (:x
B• jlmolO~ (mg Chi
a)-I h- I (Jimol m- 2 5- 1)-1) ofCylilldrotheca closteriumgrown at 20CC. Other details as in Fig. I.
Fig. 4. Influence of temperature on the photosyntheticefficiency (IXETR , jlmol e - (mg Chi a) - I (jlmol photons) - I
m2) of Cylindrotheca c10sterium grown at 20'C. Other detailsas in Fig. I.
class (post-hoc unequal means HSD test, p < 0.05).Again, the mean (XETR across the full range ofexperimental temperatures was lower for the highthan for the low growth rate culture (two-wayANOVA, F(I.37) = 382).
The growth rate did not significantly affect themaximum PSII activity (Fv/Fm; one-way ANOVA;Fig. 5). Fv/Fm showed a slight but significantdownward trend with increasing temperature (6%decrease per 10°C; model J regression,F(I.52) = 14.52). At temperatures above 30°C, thedecrease in FvlFm values was more marked and, at40°C, FvlFm was almost zero. The effectivequantum efficiency of charge separation (AFIFm'),
taken from the P- E curves at irradiances close tothe growth irradiance, followed a similar pattern tothat for ETRmax with increasing temperature(Fig. 5), as might be exp~cted becau~e the growthirradlance is close to the light saturation parameter
Ek ·
0.8
i~ 08
0
~ ~ i•9 t ~ 060.6
E EU. { • u...... 04 . 04 -
U.>
tT ~
r t02 t .. - 02,..00 2 00
0 5 10 15 20 25 30 35 40 45
Temperature ("C)
Fig. 5. Influence of temperature on maximum PSII activity(Fv/Fm; circles) and effective quantum efficiency of chargeseparation (J1Fj Fm ') at irradiances close to the growthirradiance (200- 300 jlmol m - 2 S- I; triangles) of Cylindrotheca c10sterium grown at 20°C. Other details as in Fig. I.
Temperature and photosynthesis in Cylindrotheca closterium 137
Table I. Parameter values and standard errors (SE) estimated from equation (5) for maximum photosynthetic capacity at low(0.25 d - J) and high (0.42 d - I) growth rates in Cylindrotheca closterium grown at 20°C
Growth rate (d ') p8~1"X (ttmol01 (mg Chi a) I h '} SE SE SE r1
0.250.42
1070961
11692
41.538.0
3.21.0
30.029.2
1.30.8
0.610.69
Table 2. Parameter values and standard errors (SE) from equation (5) for maximum electron transport rate at low (0.25 d - I) andhigh (0.42 d - J) growth rates in Cylilldrotheca closterium grown at 20°C
Growth rate (d ') ETR'I\X (ttmol e (mg ChI a) 'Si) SE SE SE
0.250.42
1.641.81
0.1430.108
38.040.9
1.01.1
31.031.5
0.40.8
0.820.86
40353025
-.- Low growth rale 0.25 d"' I-0- High growth rate 0 42 dO'
2015105
Temperature ee)
o~---~-~--~---~-----'
o403515 20 25 30
Temperature rC)105
........ Low growth rale 0 25 d"'-0- High growth rale 0 42 dO'
·2 +---.---.---.--.--.--.----.----1o
:c 6
-;..... 10"'IllN
E(5 8E3:
12..------------------,
Fig. 3. Influence of temperature on the photosyntheticefficiency per unit chlorophyll a (:x
B• jlmolO~ (mg Chi
a)-I h- I (Jimol m- 2 5- 1)-1) ofCylilldrotheca closteriumgrown at 20CC. Other details as in Fig. I.
Fig. 4. Influence of temperature on the photosyntheticefficiency (IXETR , jlmol e - (mg Chi a) - I (jlmol photons) - I
m2) of Cylindrotheca c10sterium grown at 20'C. Other detailsas in Fig. I.
class (post-hoc unequal means HSD test, p < 0.05).Again, the mean (XETR across the full range ofexperimental temperatures was lower for the highthan for the low growth rate culture (two-wayANOVA, F(I.37) = 382).
The growth rate did not significantly affect themaximum PSII activity (Fv/Fm; one-way ANOVA;Fig. 5). Fv/Fm showed a slight but significantdownward trend with increasing temperature (6%decrease per 10°C; model J regression,F(I.52) = 14.52). At temperatures above 30°C, thedecrease in FvlFm values was more marked and, at40°C, FvlFm was almost zero. The effectivequantum efficiency of charge separation (AFIFm'),
taken from the P- E curves at irradiances close tothe growth irradiance, followed a similar pattern tothat for ETRmax with increasing temperature(Fig. 5), as might be exp~cted becau~e the growthirradlance is close to the light saturation parameter
Ek ·
0.8
i~ 08
0
~ ~ i•9 t ~ 060.6
E EU. { • u...... 04 . 04 -
U.>
tT ~
r t02 t .. - 02,..00 2 00
0 5 10 15 20 25 30 35 40 45
Temperature ("C)
Fig. 5. Influence of temperature on maximum PSII activity(Fv/Fm; circles) and effective quantum efficiency of chargeseparation (J1Fj Fm ') at irradiances close to the growthirradiance (200- 300 jlmol m - 2 S- I; triangles) of Cylindrotheca c10sterium grown at 20°C. Other details as in Fig. I.
Dow
nloa
ded
by [
84.1
22.2
03.2
52]
at 0
9:19
24
Oct
ober
201
2
E. P. Morris and J. C. Kromkamp 138
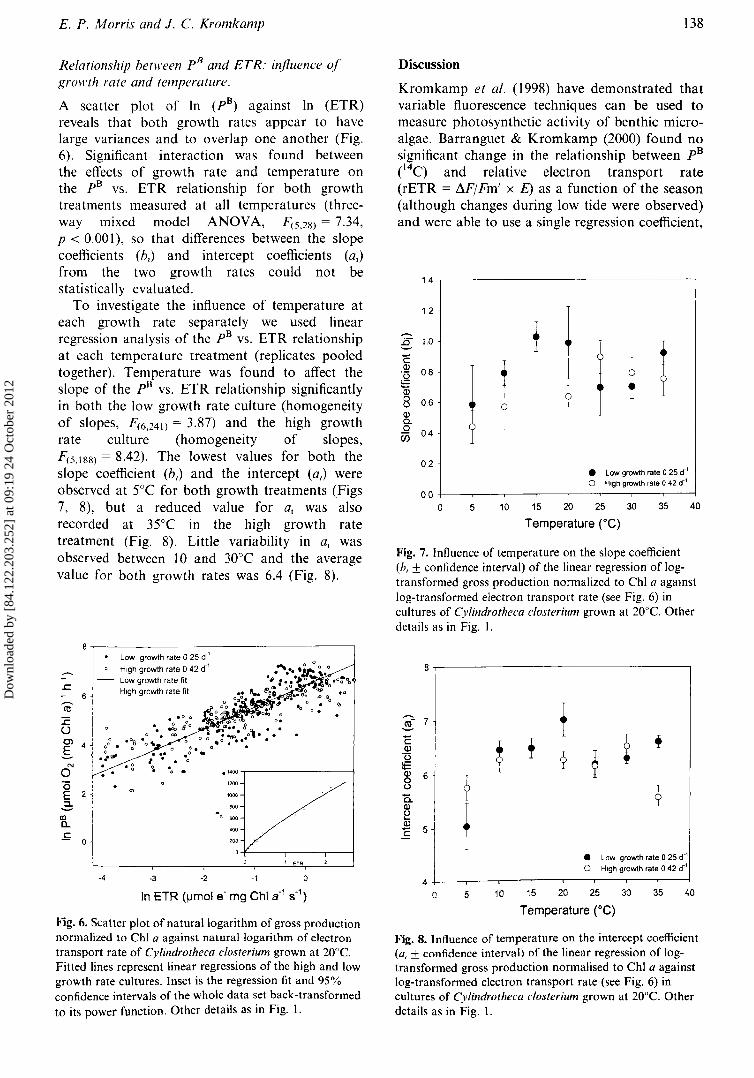
Relationship between pB and ETR: influence ofgrowth rate and temperature.
A scatter plot of In (pB) against In (ETR)reveals that both growth rates appear to havelarge variances and to overlap one another (Fig.6). Significant interaction was found betweenthe effects of growth rate and temperature onthe pB vs. ETR relationship for both growthtreatments measured at all temperatures (threeway mixed model ANOVA, F(5.28) = 7.34,P < 0.001), so that differences between the slopecoefficients (b.) and intercept coefficients (a.)from the two growth rates could not bestatistically evaluated.
To investigate the influence of temperature ateach growth rate separately we used linearregression analysis of the pB vs. ETR relationshipat each temperature treatment (replicates pooledtogether). Temperature was found to affect theslope of the pB vs. ETR relationship significantlyin both the low growth rate culture (homogeneityof slopes, F(6.241) = 3.87) and the high growthrate culture (homogeneity of slopes,F(5.188) = 8.42). The lowest values for both theslope coefficient (b l ) and the intercept (a l ) wereobserved at 5°e for both growth treatments (Figs7, 8), but a reduced value for at was alsorecorded at 35°e in the high growth ratetreatment (Fig. 8). Little variability in a, wasobserved between 10 and 30 0 e and the averagevalue for both growth rates was 6.4 (Fig. 8).
Discussion
Kromkamp et al. (1998) have demonstrated thatvariable fluorescence techniques can be used tomeasure photosynthetic activity of benthic microalgae. Barranguet & Kromkamp (2000) found nosignificant change in the relationship between pB(14C) and relative electron transport rate(rETR = I1.FjFm' x E) as a function of the season(although changes during low tide were observed)and were able to use a single regression coefficient,
14
12
~~ fE 1.0
t tc t 1 1Q)
08
! f'(3
~Q)
00u 0.6 0 j
Q)Cl.0 0.4Ci5
02• Low growth rate a25 dol
o High growth rate 0 42 dol
000 5 10 15 20 25 30 35 40
Temperature (0G)
Fig. 7. Influence of temperature on the slope coefficient(h, ± confidence interval) of the linear regression of logtransformed gross production normalized to Chi a agamstlog-transformed electron transport rate (see Fig. 6) incultures of Cylindrotheca closterium grown at 20°e. Otherdetails as in Fig. I.
m'-7 fc t + i +Q)'(3 9 ~~Q) 6
1a ?u
?Q.Q)
+u...Q)
5C
• Low growth rate a25 dO'0 High growth rate a42 dO'
40 5 10 15 20 25 30 35 40
Temperature rG)
8-r------------------,
Fig. 8. Influence of temperature on the intercept coefficient(0, ± confidence interval) of the linear regression of logtransformed gross production normalised to ChI a againstlog-transformed electron transport rate (see Fig. 6) incultures of Cylindl'otheca closterium grown at 20De. Otherdetails as in Fig. I.
. Low growth rate 0 25 d '0 High growth rate 0 42 dO'
..c - Low growth rate fit
6High growth rate fit
~
<ll
~ . ~·~o:u 0.
00. .Cl ° .Og 0'4 0° .-S .~g11
0
N . • g0 . . .1.00
(5 , "00E 2 ~ 1000
2: I600
en.. 600a..
'00
.£ 0 200
, ETR
-4 -3 -2 -1 0
Fig. 6. Scatter plot of natural logarithm of gross productionnormalized to ChI a against natural logarithm of electrontransport rate of Cylindrotheca closterium grown at 20°e.Fitted lines represent linear regressions of the high and lowgrowth rate cultures. Inset is the regression fit and 95%confidence intervals of the whole data set back-transformedto its power function. Other details as in Fig. I.
E. P. Morris and J. C. Kromkamp 138
Relationship between pB and ETR: influence ofgrowth rate and temperature.
A scatter plot of In (pB) against In (ETR)reveals that both growth rates appear to havelarge variances and to overlap one another (Fig.6). Significant interaction was found betweenthe effects of growth rate and temperature onthe pB vs. ETR relationship for both growthtreatments measured at all temperatures (threeway mixed model ANOVA, F(5.28) = 7.34,P < 0.001), so that differences between the slopecoefficients (b.) and intercept coefficients (a.)from the two growth rates could not bestatistically evaluated.
To investigate the influence of temperature ateach growth rate separately we used linearregression analysis of the pB vs. ETR relationshipat each temperature treatment (replicates pooledtogether). Temperature was found to affect theslope of the pB vs. ETR relationship significantlyin both the low growth rate culture (homogeneityof slopes, F(6.241) = 3.87) and the high growthrate culture (homogeneity of slopes,F(5.188) = 8.42). The lowest values for both theslope coefficient (b l ) and the intercept (a l ) wereobserved at 5°e for both growth treatments (Figs7, 8), but a reduced value for at was alsorecorded at 35°e in the high growth ratetreatment (Fig. 8). Little variability in a, wasobserved between 10 and 30 0 e and the averagevalue for both growth rates was 6.4 (Fig. 8).
Discussion
Kromkamp et al. (1998) have demonstrated thatvariable fluorescence techniques can be used tomeasure photosynthetic activity of benthic microalgae. Barranguet & Kromkamp (2000) found nosignificant change in the relationship between pB(14C) and relative electron transport rate(rETR = I1.FjFm' x E) as a function of the season(although changes during low tide were observed)and were able to use a single regression coefficient,
14
12
~~ fE 1.0
t tc t 1 1Q)
08
! f'(3
~Q)
00u 0.6 0 j
Q)Cl.0 0.4Ci5
02• Low growth rate a25 dol
o High growth rate 0 42 dol
000 5 10 15 20 25 30 35 40
Temperature (0G)
Fig. 7. Influence of temperature on the slope coefficient(h, ± confidence interval) of the linear regression of logtransformed gross production normalized to Chi a agamstlog-transformed electron transport rate (see Fig. 6) incultures of Cylindrotheca closterium grown at 20°e. Otherdetails as in Fig. I.
m'-7 fc t + i +Q)'(3 9 ~~Q) 6
1a ?u
?Q.Q)
+u...Q)
5C
• Low growth rate a25 dO'0 High growth rate a42 dO'
40 5 10 15 20 25 30 35 40
Temperature rG)
8-r------------------,
Fig. 8. Influence of temperature on the intercept coefficient(0, ± confidence interval) of the linear regression of logtransformed gross production normalised to ChI a againstlog-transformed electron transport rate (see Fig. 6) incultures of Cylindl'otheca closterium grown at 20De. Otherdetails as in Fig. I.
. Low growth rate 0 25 d '0 High growth rate 0 42 dO'
..c - Low growth rate fit
6High growth rate fit
~
<ll
~ . ~·~o:u 0.
00. .Cl ° .Og 0'4 0° .-S .~g11
0
N . • g0 . . .1.00
(5 , "00E 2 ~ 1000
2: I600
en.. 600a..
'00
.£ 0 200
, ETR
-4 -3 -2 -1 0
Fig. 6. Scatter plot of natural logarithm of gross productionnormalized to ChI a against natural logarithm of electrontransport rate of Cylindrotheca closterium grown at 20°e.Fitted lines represent linear regressions of the high and lowgrowth rate cultures. Inset is the regression fit and 95%confidence intervals of the whole data set back-transformedto its power function. Other details as in Fig. I.
Dow
nloa
ded
by [
84.1
22.2
03.2
52]
at 0
9:19
24
Oct
ober
201
2
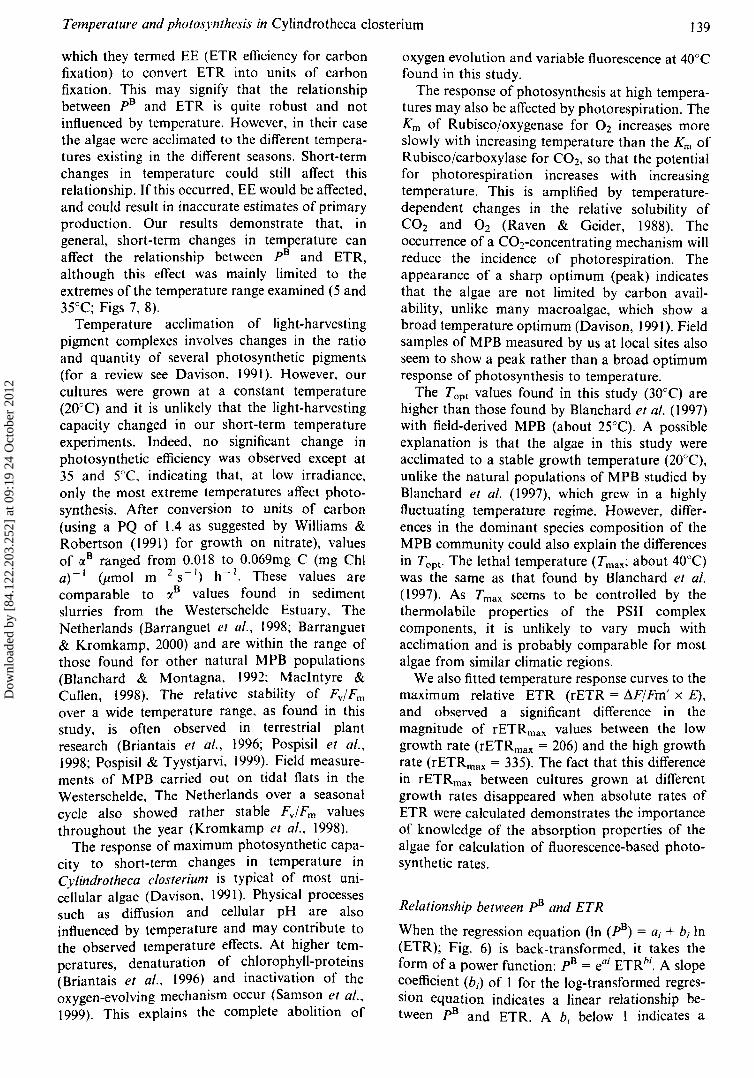
Temperature and photosynthesis in Cylindrotheca closterium 139
which they termed EE (ETR efficiency for carbonfixation) to convert ETR into units of carbonfixation. This may signify that the relationshipbetween pB and ETR is quite robust and notinfluenced by temperature. However, in their casethe algae were acclimated to the different temperatures existing in the different seasons. Short-termchanges in temperature could still affect thisrelationship. If this occurred, EE would be affected,and could result in inaccurate estimates of primaryproduction. Our results demonstrate that, ingeneral, short-term changes in temperature canaffect the relationship between pB and ETR,although this effect was mainly limited to theextremes of the temperature range examined (5 and35c C; Figs 7, 8).
Temperature acclimation of light-harvestingpigment complexes involves changes in the ratioand quantity of several photosynthetic pigments(for a review see Davison, 1991). However, ourcultures were grown at a constant temperature(20°C) and it is unlikely that the light-harvestingcapacity changed in our short-term temperatureexperiments. Indeed, no significant change inphotosynthetic efficiency was observed except at35 and 5°C, indicating that, at low irradiance,only the most extreme temperatures affect photosynthesis. After conversion to units of carbon(using a PQ of 1.4 as suggested by Williams &Robertson (1991) for growth on nitrate), valuesof ~H ranged from O.oI 8 to 0.069mg C (mg Chi0)-1 (J.lmol m- z S-I) h- I
. These values arecomparable to (XB values found in sedimentslurries from the Westerschelde Estuary, TheNetherlands (Barranguet et al., 1998; Barranguet& Kromkamp, 2000) and are within the range ofthose found for other natural MPB populations(Blanchard & Montagna, 1992; MacIntyre &Cullen, 1998). The relative stability of Fv/Fm
over a wide temperature range, as found in thisstudy, is often observed in terrestrial plantresearch (Briantais et 01., 1996; Pospisil et 01.,1998; Pospisil & Tyystjarvi, 1999). Field measurements of MPB carried out on tidal flats in theWesterschelde, The Netherlands over a seasonalcycle also showed rather stable FvlFm valuesthroughout the year (Kromkamp et 01., 1998).
The response of maximum photosynthetic capacity to short-term changes in temperature inCylindrotheca c10sterium is typical of most unicellular algae (Davison, 1991). Physical processessuch as diffusion and cellular pH are alsoinfluenced by temperature and may contribute tothe observed temperature effects. At higher temperatures, denaturation of ~hlor~ph~ll-proteins(Briantais et 01., 1996) and mactlvatlOn of theoxygen-evolving mechanism occur (Samso.n. et al.,1999). This explains the complete abohtlOn of
oxygen evolution and variable fluorescence at 40°Cfound in this study.
The response of photosynthesis at high temperatures may also be affected by photorespiration. TheKm of Rubisc%xygenase for O2 increases moreslowly with increasing temperature than the Km ofRubisco/carboxylase for CO2, so that the potentialfor photorespiration increases with increasingtemperature. This is amplified by temperaturedependent changes in the relative solubility ofCOz and Oz (Raven & Geider, 1988). Theoccurrence of a CO2-concentrating mechanism willreduce the incidence of photorespiration. Theappearance of a sharp optimum (peak) indicatesthat the algae are not limited by carbon availability, unlike many macroalgae, which show abroad temperature optimum (Davison, 1991). Fieldsamples of MPB measured by us at local sites alsoseem to show a peak rather than a broad optimumresponse of photosynthesis to temperature.
The Tapt values found in this study (30°C) arehigher than those found by Blanchard et al. (1997)with field-derived MPB (about 25°C). A possibleexplanation is that the algae in this study wereacclimated to a stable growth temperature (20°C),unlike the natural populations of MPB studied byBlanchard et al. (1997), which grew in a highlyfluctuating temperature regime. However, differences in the dominant species composition of theMPB community could also explain the differencesin Topt ' The lethal temperature (Tmax; about 40°C)was the same as that found by Blanchard et al.(1997). As Tmax seems to be controlled by thethermolabile properties of the PSII complexcomponents, it is unlikely to vary much withacclimation and is probably comparable for mostalgae from similar climatic regions.
We also fitted temperature response curves to themaximum relative ETR (rETR = dF/Fm' x E),and observed a significant difference in themagnitude of rETRmax values between the lowgrowth rate (rETRmax = 206) and the high growthrate (rETRmax = 335). The fact that this differencein rETRmax between cultures grown at differentgrowth rates disappeared when absolute rates ofETR were calculated demonstrates the importanceof knowledge of the absorption properties of thealgae for calculation of fluorescence-based photosynthetic rates.
Relationship between pB and ETR
When the regression equation (In (pB) = ai + hi In(ETR); Fig. 6) is back-transformed, it takes theform of a power function: pB = eQi ETRhi. A slopecoefficient (b i ) of I for the log-transformed regression equation indicates a linear relationship between pH and ETR. A b, below I indicates a
Temperature and photosynthesis in Cylindrotheca closterium 139
which they termed EE (ETR efficiency for carbonfixation) to convert ETR into units of carbonfixation. This may signify that the relationshipbetween pB and ETR is quite robust and notinfluenced by temperature. However, in their casethe algae were acclimated to the different temperatures existing in the different seasons. Short-termchanges in temperature could still affect thisrelationship. If this occurred, EE would be affected,and could result in inaccurate estimates of primaryproduction. Our results demonstrate that, ingeneral, short-term changes in temperature canaffect the relationship between pB and ETR,although this effect was mainly limited to theextremes of the temperature range examined (5 and35c C; Figs 7, 8).
Temperature acclimation of light-harvestingpigment complexes involves changes in the ratioand quantity of several photosynthetic pigments(for a review see Davison, 1991). However, ourcultures were grown at a constant temperature(20°C) and it is unlikely that the light-harvestingcapacity changed in our short-term temperatureexperiments. Indeed, no significant change inphotosynthetic efficiency was observed except at35 and 5°C, indicating that, at low irradiance,only the most extreme temperatures affect photosynthesis. After conversion to units of carbon(using a PQ of 1.4 as suggested by Williams &Robertson (1991) for growth on nitrate), valuesof ~H ranged from O.oI 8 to 0.069mg C (mg Chi0)-1 (J.lmol m- z S-I) h- I
. These values arecomparable to (XB values found in sedimentslurries from the Westerschelde Estuary, TheNetherlands (Barranguet et al., 1998; Barranguet& Kromkamp, 2000) and are within the range ofthose found for other natural MPB populations(Blanchard & Montagna, 1992; MacIntyre &Cullen, 1998). The relative stability of Fv/Fm
over a wide temperature range, as found in thisstudy, is often observed in terrestrial plantresearch (Briantais et 01., 1996; Pospisil et 01.,1998; Pospisil & Tyystjarvi, 1999). Field measurements of MPB carried out on tidal flats in theWesterschelde, The Netherlands over a seasonalcycle also showed rather stable Fv/Fm valuesthroughout the year (Kromkamp et 01., 1998).
The response of maximum photosynthetic capacity to short-term changes in temperature inCylindrotheca closterium is typical of most unicellular algae (Davison, 1991). Physical processessuch as diffusion and cellular pH are alsoinfluenced by temperature and may contribute tothe observed temperature effects. At higher temperatures, denaturation of ~hlor~ph~ll-proteins(Briantais et 01., 1996) and mactlvatlOn of theoxygen-evolving mechanism occur (Samso.n. et al.,1999). This explains the complete abohtlOn of
oxygen evolution and variable fluorescence at 40°Cfound in this study.
The response of photosynthesis at high temperatures may also be affected by photorespiration. TheKm of Rubisc%xygenase for O2 increases moreslowly with increasing temperature than the Km ofRubisco/carboxylase for CO2, so that the potentialfor photorespiration increases with increasingtemperature. This is amplified by temperaturedependent changes in the relative solubility ofCOz and Oz (Raven & Geider, 1988). Theoccurrence of a CO2-concentrating mechanism willreduce the incidence of photorespiration. Theappearance of a sharp optimum (peak) indicatesthat the algae are not limited by carbon availability, unlike many macroalgae, which show abroad temperature optimum (Davison, 1991). Fieldsamples of MPB measured by us at local sites alsoseem to show a peak rather than a broad optimumresponse of photosynthesis to temperature.
The Tapt values found in this study (30°C) arehigher than those found by Blanchard et al. (1997)with field-derived MPB (about 25°C). A possibleexplanation is that the algae in this study wereacclimated to a stable growth temperature (20°C),unlike the natural populations of MPB studied byBlanchard et al. (1997), which grew in a highlyfluctuating temperature regime. However, differences in the dominant species composition of theMPB community could also explain the differencesin Topt ' The lethal temperature (Tmax; about 40°C)was the same as that found by Blanchard et al.(1997). As Tmax seems to be controlled by thethermolabile properties of the PSII complexcomponents, it is unlikely to vary much withacclimation and is probably comparable for mostalgae from similar climatic regions.
We also fitted temperature response curves to themaximum relative ETR (rETR = dF/Fm' x E),and observed a significant difference in themagnitude of rETRmax values between the lowgrowth rate (rETRmax = 206) and the high growthrate (rETRmax = 335). The fact that this differencein rETRmax between cultures grown at differentgrowth rates disappeared when absolute rates ofETR were calculated demonstrates the importanceof knowledge of the absorption properties of thealgae for calculation of fluorescence-based photosynthetic rates.
Relationship between pB and ETR
When the regression equation (In (pB) = ai + hi In(ETR); Fig. 6) is back-transformed, it takes theform of a power function: pB = eQi ETRhi. A slopecoefficient (b i ) of I for the log-transformed regression equation indicates a linear relationship between pH and ETR. A b, below I indicates a
Dow
nloa
ded
by [
84.1
22.2
03.2
52]
at 0
9:19
24
Oct
ober
201
2
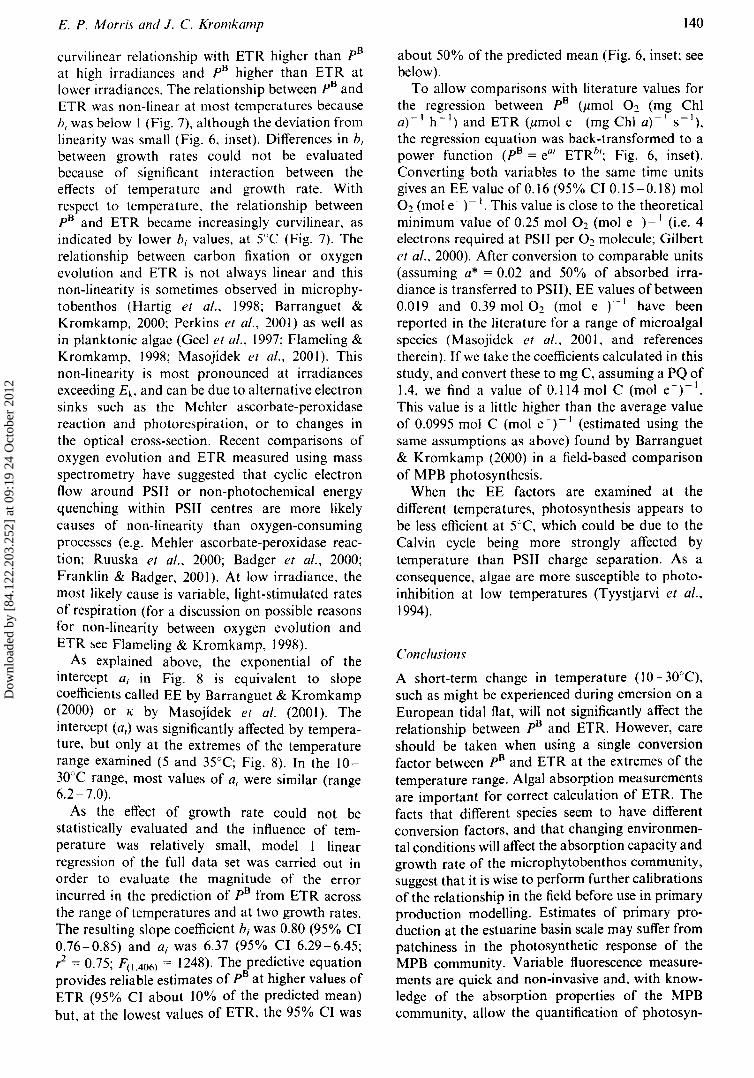
E. P. Morris and J. C. Kromkamp
curvilinear relationship with ETR higher than pBat high irradiances and pB higher than ETR atlower irradiances. The relationship between pB andETR was non-linear at most temperatures becauseh f was below I (Fig. 7), although the deviation fromlinearity was small (Fig. 6, inset). Differences in b f
between growth rates could not be evaluatedbecause of significant interaction between theeffects of temperature and growth rate. Withrespect to temperature, the relationship betweenpB and ETR became increasingly curvilinear, asindicated by lower b i values, at 5°C (Fig. 7). Therelationship between carbon fixation or oxygenevolution and ETR is not always linear and thisnon-linearity is sometimes observed in microphytobenthos (Hartig et al., 1998; Barranguet &Kromkamp, 2000; Perkins et 01., 2001) as well asin planktonic algae (Geel et al., 1997; Flameling &Kromkamp, 1998; Masojidek et al., 200 I). Thisnon-linearity is most pronounced at irradiancesexceeding E ko and can be due to alternative electronsinks such as the Mehler ascorbate-peroxidasereaction and photorespiration, or to changes inthe optical cross-section. Recent comparisons ofoxygen evolution and ETR measured using massspectrometry have suggested that cyclic electronflow around PSII or non-photochemical energyquenching within PSII centres are more likelycauses of non-linearity than oxygen-consumingprocesses (e.g. Mehler ascorbate-peroxidase reaction; Ruuska et 01., 2000; Badger et 01., 2000;Franklin & Badger, 2001). At low irradiance, themost likely cause is variable, light-stimulated ratesof respiration (for a discussion on possible reasonsfor non-linearity between oxygen evolution andETR see Flameling & Kromkamp, 1998).
As explained above, the exponential of theintercept ai in Fig. 8 is equivalent to slopecoefficients called EE by Barranguet & Kromkamp(2000) or K by Masojidek et al. (200 I). Theintercept (aJ was significantly affected by temperature, but only at the extremes of the temperaturerange examined (5 and 35°C; Fig. 8). In the 1030°C range, most values of af were similar (range6.2-7.0).
As the effect of growth rate could not bestatistically evaluated and the influence of temperature was relatively small, model I linearregression of the full data set was carried out inorder to evaluate the magnitude of the errorincurred in the prediction of pB from ETR acrossthe range of temperatures and at two growth rates.The resulting slope coefficient bj was 0.80 (95% CI0.76-0.85) and OJ was 6.37 (95% CI 6.29-6.45;1'2 = 0.75; F(1,406) = 1248). The predictive equationprovides reliable estimates of pB at higher values ofETR (95% CI about 10% of the predicted mean)but, at the lowest values of ETR, the 95% CI was
140
about 50% of the predicted mean (Fig. 6, inset; seebelow).
To allow comparisons with literature values forthe regression between pB (Jimol O2 (mg Chia)-I h -1) and ETR (,umol e- (mg Chi a)-I S-I),
the regression equation was back-transformed to apower function (pB = eat ETRhf
; Fig. 6, inset).Converting both variables to the same time unitsgives an EE value of 0.16 (95% CI 0.15 - 0.18) molO2 (mol e)-I. This value is close to the theoreticalminimum value of 0.25 mol O2 (mol e-)_l (i.e. 4electrons required at PSII per O2 molecule; Gilbertet al., 2000). After conversion to comparable units(assuming a* = 0.02 and 50% of absorbed irradiance is transferred to PSII), EE values of between0.019 and 0.39 mol O2 (mol e )- I have beenreported in the literature for a range of microalgalspecies (Masojidek et al., 200 I, and referencestherein). If we take the coefficients calculated in thisstudy, and convert these to mg C, assuming a PO of1.4, we find a value of 0.114 mol C (mol e-)-1.This value is a little higher than the average valueof 0.0995 mol C (mol e -)-1 (estimated using thesame assumptions as above) found by Barranguet& Kromkamp (2000) in a field-based comparisonof MPB photosynthesis.
When the EE factors are examined at thedifferent temperatures, photosynthesis appears tobe less efficient at 5°C, which could be due to theCalvin cycle being more strongly affected bytemperature than PSII charge separation. As aconsequence, algae are more susceptible to photoinhibition at low temperatures (Tyystjarvi et al.,1994).
Conclusions
A short-term change in temperature (10- 30°C),such as might be experienced during emersion on aEuropean tidal flat, will not significantly affect therelationship between pB and ETR. However, careshould be taken when using a single conversionfactor between pB and ETR at the extremes of thetemperature range. Algal absorption measurementsare important for correct calculation of ETR. Thefacts that different species seem to have differentconversion factors, and that changing environmental conditions will affect the absorption capacity andgrowth rate of the microphytobenthos community,suggest that it is wise to perform further calibrationsof the relationship in the field before use in primaryproduction modelling. Estimates of primary production at the estuarine basin scale may suffer frompatchiness in the photosynthetic response of theMPB community. Variable fluorescence measurements are quick and non-invasive and, with knowledge of the absorption properties of the MPBcommunity, allow the quantification of photosyn-
Dow
nloa
ded
by [
84.1
22.2
03.2
52]
at 0
9:19
24
Oct
ober
201
2
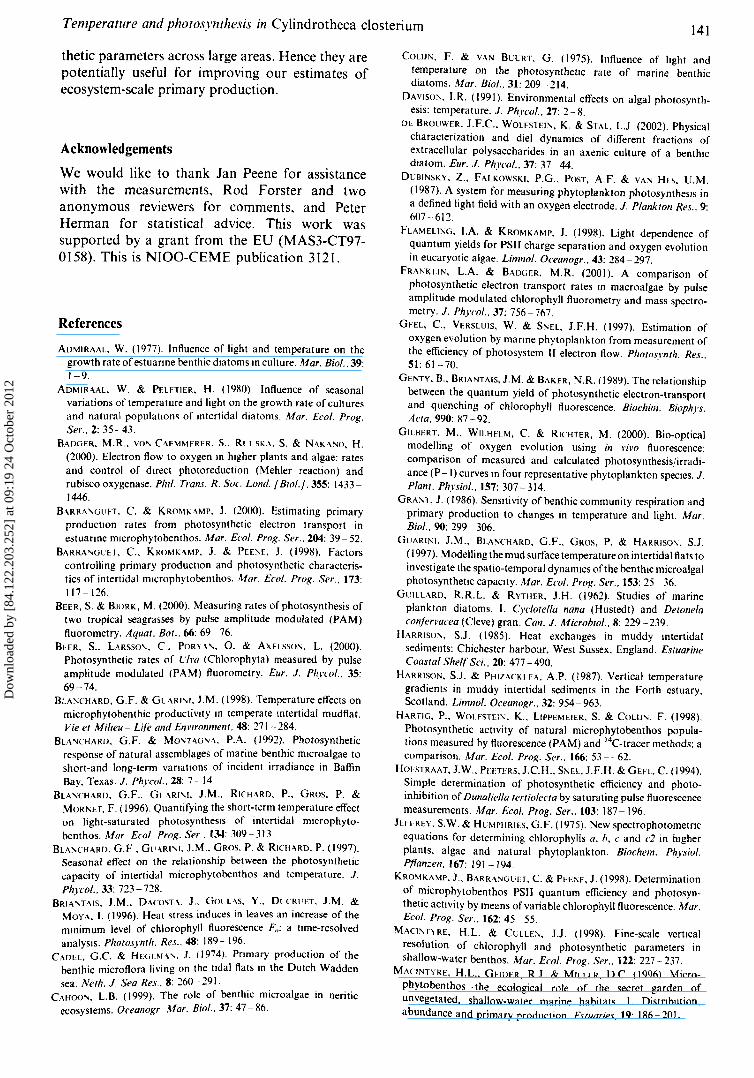
Temperature and photosynthesis in Cylindrotheca closterium 141
thetic parameters across large areas. Hence they arepotentially useful for improving our estimates ofecosystem-scale primary production.
Acknowledgements
We would like to thank Jan Peene for assistancewith the measurements, Rod Forster and twoanonymous reviewers for comments, and PeterHerman for statistical advice. This work wassupported by a grant from the EU (MAS3-CT970158). This is NIOO-CEME publication 3121.
References
ADMIRAAL. W. (1977). Influence of light and temperature on thegrowth rate ofestuanne benthic dIatoms In culture. Mar. Bioi., 39:1-9.
ADMIRAAL. W. & PUHIER. H. (1980). Influence of seasonalvariations of temperature and light on the growth rate of culturesand natural populaltons of Intertidal diatoms. Mar. Ecol. Prog.
Ser., 2: 35-43.BADGER. M.R.. VO'" C"EMMFRER. S.. Rll SIC\. S. & N"K"NO. H.
(2000). Electron flow to oxygen In hIgher plants and algae: ratesand control of direct photoreduction (Mehler reaction) andrubisco oxygenase. Pht!. Trails. R. Soc. LOlld. [ BIOI.f, 355: 1433
1446.BARRA 'GUET. C & KROMK·\MP. J. (2000). Estimating primary
production rates from photosynthetic electron transport inestuanne mlcrophytobenthos. Mar. Ecol. Prog. Ser., 204: 39- 52.
BARRA....GVET. C. KROMK·\MP. J. & PEE:-'E. J. (1998). Factorscontrolling primary produclton and photosynthetic characteristics of intertidal mu.:rophytobenthos. Mar. Ecol. Prog. Ser., 173:
117-126.BEER, S. & BJORK. M. (2000). Measuring rates of photosynthesis of
two tropical seagrasses by pulse amplitude modulated (PAM)fluorometry. Aqual. Bol.. 66: 69 - 76.
BEER. S.. LARsso,. C. PORn'. O. & AXELssoN. L. (2000).Photosynthetic rates of UII'a (Chlorophyta) measured by pulseamplitude modulated (PAM) fluorometry. Elir. J. Phycol., 35:
69-74.BLA:"CHARD. G,F. & GL ARI". J.M. (1998). Temperature effects on
microphytobenthic productivllY In temperate mtertidal mudflat.Vie et Mi/teu- Life alld En l'lrollment , 48: 271-284.
BLA\lCHARD. G.F. & MO>,,;HG .... ·\. P.A. (1992). Photosyntheticresponse of natural assemblages of marine benthic mlcroalgae toshort-and long-term vanations of incident irradiance in BaffinBay. Texas. J. Phycol.. 28: 7- 14.
BLA\lCHARD. G.F .. GI ·\RI'I. J.M .. RICH·\RD. P.. GRas. P. &MORI"ET. F. (1996). Quanlifying the short-term temperature effecton light-saturated photosynthesIs of intertidal mlcrophytobenthos, Mar £col Prog. Ser, 134: 309-313.
BLAl'ooCHARD. G.F . GlJ.\RI"I. J.M .. GRaS. P. & RICH>\RD. P. (1997).Seasonal effect on the relationship between the photosyntheticcapacity of intertidal microphytobenthos and temperature. J.
Phycol., 33: 723 - 7:!8.BRIA'TAIS. J.M .• D'\COST>\. J.. Gm L·\S. Y .. DlCRllET. J.M. &
MaYA. I. (1996). Heat stress induces in leaves an increase of themmimum level of chlorophyll fluorescence Fa: a time-resolvedanalySIS. PhOlosymh. Res.. 48: 189 - 196.
CADEr. G.C & HEGI:M\'. J. (1974). Pnmary production of thebenthic microflora living on the tidal flats In the Dutch Waddensea. Nerh. J. Sea Res.. 8: 260 - :!91.
CAHOO". L.B. (1999). The role of benrhic microalgae in neriticecosystems. Oceanogr Mar. Bioi.. 37: 47 - 86,
COLlJN. F. & VAN BliURT. G. (1975). Influence of hght andtemperature on the photosynthetic rate of marine benthicdiatoms. Mar. Bioi., 31: 209-214.
DAVISON. LR. (1991). Environmental effects on algal photosynthesis: temperature. J. Phycol., 27: 2 - 8.
DE BROUWER. J.F.C.. WOLFSTEIN. K. & STAL. L.J (2002). Physicalcharacterization and dieI dynamics of different fractions ofextracellular polysaccharides in an axenic culture of a benthiCdiatom, Eur. 1. Phycol., 37: 37 - 44.
DUBINSKY. Z.. FALKOWSKI. P.G.. POST. A.F. & VAN Hl~. U,M.(1987). A system for measuring phytoplankton photosynthesIs ina defined light field with an oxygen electrode, J. Plallktoll Res.. 9:607-612.
FLAMELING. LA. & KROMKAMP. J. (1998). Light dependence ofquantum yields for PSII charge separation and oxygen evolutionin eucaryolic algae. Limnol. Oceanogr., 43: 284-297.
FRANKLIN. L.A. & BADGER. M.R. (2001). A comparison ofphotosynthetic electron transport rates m macroalgae by pulseamplitude modulated chlorophyll fluorometry and mass spectrometry.1. Phycol.. 37: 756 -767.
GEEL. C, VERSLUIS. W. & SNEL. J.F.H. (1997). Estimation ofoxygen evolution by marine phytoplankton from measurement ofthe efficiency of photosystem Il electron flow. Photos!'l1/h. Res..51: 61-70.
GENTY. B.• BRIANTAIS. J.M. & BAKER. N.R. (1989). The relationshipbetween the quantum yield of photosynthetic electron-transportand quenching of chlorophyll fluorescence. Biochim. Bioph)'s.Acta, 990: 87 -92.
GILBERT. M,. WILHELM. C & RICHTER. M. (2000). Bio-opticalmodelling of oxygen evolution using ill \'i\'o fluorescence:comparison of measured and calculated photosynrhesis/irradiance (P-I) curves 10 four representative phytoplankton speCies, J.Plallr. Physiol., 157: 307-314,
GRA'T. J. (1986). Sensllivity of benthic community respiration andprimary production to changes in temperature and light. Mar.Bioi., 90: 299 - 306.
GUARINI. J.M .• BLANCHARD. G.F,. GROS. P, & HARRISO'l. S.J.(1997). Modelling the mud surface temperature on intertidal flats toinvestigate the spatio-temporal dynamICs of the benthic microalgalphotosynthetic capactly, Mar, £col. Prog. Ser., 153: 25 - 36.
GUILLARD. R.R.L. & RYTHER. J.H. (1962). Studies of marineplankton diatoms. I. Cydorella 110110 (Husted!) and Detollelaconjermcea (Cleve) gran. Call. J. MicroblOl., 8: 229 - 239.
HARRISOl\, SJ. (1985). Heat exchanges in muddy Intertidalsediments: Chichester harbour. West Sussex. England, EstuarilleCoastal Shelf Sci" 20: 477 -490.
HARRISON, SJ. & PHIIACKI FA. A.P, (1987). Vertical temperaturegradients in muddy intertidal sediments in the Forth estuary.Scotland. Limnol. Oceallogr" 32: 954- 963,
HARTIG. P.. WOLFSTEIN. K.. LIPPEMEIER. S. & COLIJ"'. F. (1998).Photosynthetic activity of natural microphytobenthos populations measured by fluorescence (PAM) and 14C-tracer methods: acomparison. Mar. Ecol. Prog. Ser, , 166: 53 --62.
HOFSTRMT. lW.• PrF.TERs. J,CH .• SNEL. J.F.H. & GEFL. C (1994),Simple determination of photosynthetic efficiency and photoinhibition of Dunaliella /er/iolecta by saturating pulse fluorescencemeasurements. Mar. Ecol. Prog. Ser.. 103: 187 - 196.
JHFREY. S.W. & Hl;MPHRIES. G.F. (1975). New spectrophotometncequations for determining chlorophylls a. h, c and c2 in hIgherplants. algae and natural phytoplankton. Biochem. Physiol.Pjfanzen. 167: 191 - 194.
KROMKAMP. J .. BARRA~GUET. C. & PFE~E. J. (1998). Determinationof microphytobenthos PSII quantum efficiency and photosynthetic activity by means or variable chlorophyll fluorescence. Mar.£col, Prog. Ser., 162: 45 - 55,
MAclNn RE. H.L. & CULLE~. JJ. (1998). Fine-scale vertIcalresolution of chlorophyll and photosynthetic parameters inshallow-water benthos. Mar, Ecol, Prog. Ser.. 122: 227 - 237.
MACINTYRE. H.L.. GElDER. RJ. & MILLER. D.C. (1996), Microphytobenthos - the ecological role of the secret garden ofunvegetated. shallow-water marine habitats, I. Distnbution.abundance and primary production. Estuaries. 19: 186 - 201.
Temperature and photosynthesis in Cylindrotheca closterium 141
thetic parameters across large areas. Hence they arepotentially useful for improving our estimates ofecosystem-scale primary production.
Acknowledgements
We would like to thank Jan Peene for assistancewith the measurements, Rod Forster and twoanonymous reviewers for comments, and PeterHerman for statistical advice. This work wassupported by a grant from the EU (MAS3-CT970158). This is NIOO-CEME publication 3121.
References
ADMIRAAL. W. (1977). Influence of light and temperature on thegrowth rate ofestuanne benthic dIatoms In culture. Mar. Bioi., 39:1-9.
ADMIRAAL. W. & PUHIER. H. (1980). Influence of seasonalvariations of temperature and light on the growth rate of culturesand natural populaltons of Intertidal diatoms. Mar. Ecol. Prog.
Ser., 2: 35-43.BADGER. M.R.. VO'" C"EMMFRER. S.. Rll SIC\. S. & N"K"NO. H.
(2000). Electron flow to oxygen In hIgher plants and algae: ratesand control of direct photoreduction (Mehler reaction) andrubisco oxygenase. Pht!. Trails. R. Soc. LOlld. [ BIOI.J, 355: 1433
1446.BARRA 'GUET. C & KROMK·\MP. J. (2000). Estimating primary
production rates from photosynthetic electron transport inestuarine mlcrophytobenthos. Mar. Ecol. Prog. Ser., 204: 39- 52.
BARRA....GVET. C. KROMK·\MP. J. & PEE:-'E. J. (1998). Factorscontrolling primary produclton and photosynthetic characteristics of intertidal mu.:rophytobenthos. Mar. Ecol. Prog. Ser., 173:
117-126.BEER, S. & BJORK. M. (2000). Measuring rates of photosynthesis of
two tropical seagrasses by pulse amplitude modulated (PAM)fluorometry. Aqual. Bol.. 66: 69 - 76.
BEER. S.. LARsso",. C. PORn.... O. & AXELssoN. L. (2000).Photosynthetic rates of UII'a (Chlorophyta) measured by pulseamplitude modulated (PAM) fluorometry. Elir. J. Phycol., 35:
69-74.BLA:"CHARD. G,F. & GL ARI". J.M. (1998). Temperature effects on
microphytobenthic productivllY In temperate mtertidal mudflat.Vie et Mi/teu- Life alld En l'lrollment , 48: 271-284.
BLA\lCHARD. G.F. & MO>,,;HG .... ·\. P.A. (1992). Photosyntheticresponse of natural assemblages of marine benthic mlcroalgae toshort-and long-term vanations of incident irradiance in BaffinBay. Texas. J. Phycol.. 28: 7- 14.
BLA\lCHARD. G.F .. GI ·\RI'I. J.M .. RICH·\RD. P.. GRas. P. &MORI"ET. F. (1996). Quanlifying the short-term temperature effecton light-saturated photosynthesIs of intertidal mlcrophytobenthos, Mar Ecol Prog. Ser, 134: 309-313.
BLAl'ooCHARD. G.F . GlJ.\RI"I. J.M .. GRaS. P. & RICH>\RD. P. (1997).Seasonal effect on the relationship between the photosyntheticcapacity of intertidal microphytobenthos and temperature. J.
Phycol., 33: 723 - 7:!8.BRIA'TAIS. J.M .• D'\COST>\. J.. Gm L·\S. Y .. DlCRllET. J.M. &
MaYA. I. (1996). Heat stress induces in leaves an increase of themmimum level of chlorophyll fluorescence Fa: a time-resolvedanalySIS. PhOlosymh. Res.. 48: 189 - 196.
CADEr. G.C & HEGI:M\'. J. (1974). Primary production of thebenthic microflora living on the tidal flats In the Dutch Waddensea. Nerh. J. Sea Res.. 8: 260 - :!91.
CAHOO". L.B. (1999). The role of benrhic microalgae in neriticecosystems. Oceanogr Mar. Bioi.. 37: 47 - 86,
COLlJN. F. & VAN BliURT. G. (1975). Influence of Itght andtemperature on the photosynthetic rate of marine benthicdiatoms. Mar. Bioi., 31: 209-214.
DAVISON. LR. (1991). Environmental effects on algal photosynthesis: temperature. J. Phycol., 27: 2 - 8.
DE BROUWER. J.F.C.. WOLFSTEIN. K. & STAL. L.J (2002). Physicalcharacterization and dieI dynamics of different fractions ofextracellular polysaccharides in an axenic culture of a benthiCdiatom, Eur. 1. Phycol., 37: 37 - 44.
DUBINSKY. Z.. FALKOWSKI. P.G.. POST. A.F. & VAN Hl~. U,M.(1987). A system for measuring phytoplankton photosynthesIs ina defined light field with an oxygen electrode, J. Plallktoll Res.. 9:607-612.
FLAMELING. LA. & KROMKAMP. J. (1998). Light dependence ofquantum yields for PSII charge separation and oxygen evolutionin eucaryolic algae. Limnol. Oceanogr., 43: 284-297.
FRANKLIN. L.A. & BADGER. M.R. (2001). A comparison ofphotosynthetic electron transport rates m macroalgae by pulseamplitude modulated chlorophyll fluorometry and mass spectrometry.1. Phycol.. 37: 756 -767.
GEEL. C, VERSLUIS. W. & SNEL. J.F.H. (1997). Estimation ofoxygen evolution by marine phytoplankton from measurement ofthe efficiency of photosystem Il electron flow. Photos!'l1/h. Res..51: 61-70.
GENTY. B.• BRIANTAIS. J.M. & BAKER. N.R. (1989). The relationshipbetween the quantum yield of photosynthetic electron-transportand quenching of chlorophyll fluorescence. Biochim. Bioph)'s.Acta, 990: 87 -92.
GILBERT. M,. WILHELM. C & RICHTER. M. (2000). Bio-opticalmodelling of oxygen evolution using ill \'i\'o fluorescence:comparison of measured and calculated photosynrhesis/irradiance (P-I) curves 10 four representative phytoplankton speCies, J.Plallr. Physiol., 157: 307-314,
GRA'T. J. (1986). Sensllivity of benthic community respiration andprimary production to changes in temperature and light. Mar.Bioi., 90: 299 - 306.
GUARINI. J.M .• BLANCHARD. G.F,. GROS. P, & HARRISO'l. S.J.(1997). Modelling the mud surface temperature on intertidal flats toinvestigate the spatio-temporal dynamICs of the benthic microalgalphotosynthetic capactly, Mar, Ecol. Prog. Ser., 153: 25 - 36.
GUILLARD. R.R.L. & RYTHER. J.H. (1962). Studies of marineplankton diatoms. I. Cydorella 110110 (Husted!) and Detollelaconjermcea (Cleve) gran. Call. J. MicroblOl., 8: 229 - 239.
HARRISOl\, SJ. (1985). Heat exchanges in muddy Intertidalsediments: Chichester harbour. West Sussex. England, EstuarilleCoastal Shelf Sci" 20: 477 -490.
HARRISON, SJ. & PHIIACKI FA. A.P, (1987). Vertical temperaturegradients in muddy intertidal sediments in the Forth estuary.Scotland. Limnol. Oceallogr" 32: 954- 963,
HARTIG. P.. WOLFSTEIN. K.. LIPPEMEIER. S. & COLIJ"'. F. (1998).Photosynthetic activity of natural microphytobenthos populations measured by fluorescence (PAM) and 14C-tracer methods: acomparison. Mar. Ecol. Prog. Ser, , 166: 53 --62.
HOFSTRMT. lW.• PrF.TERs. J,CH .• SNEL. J.F.H. & GEFL. C (1994),Simple determination of photosynthetic efficiency and photoinhibition of Dunaliella /er/iolecta by saturating pulse fluorescencemeasurements. Mar. Ecol. Prog. Ser.. 103: 187 - 196.
JHFREY. S.W. & Hl;MPHRIES. G.F. (1975). New spectrophotometncequations for determining chlorophylls a. h, c and c2 in hIgherplants. algae and natural phytoplankton. Biochem. Physiol.Pjfanzen. 167: 191 - 194.
KROMKAMP. J .. BARRA~GUET. C. & PFE~E. J. (1998). Determinationof microphytobenthos PSII quantum efficiency and photosynthetic activity by means or variable chlorophyll fluorescence. Mar.Ecol, Prog. Ser., 162: 45 - 55,
MAclNn RE. H.L. & CULLE~. JJ. (1998). Fine-scale vertIcalresolution of chlorophyll and photosynthetic parameters inshallow-water benthos. Mar, Ecol, Prog. Ser.. 122: 227 - 237.
MACINTYRE. H.L.. GElDER. RJ. & MILLER. D.C. (1996), Microphytobenthos - the ecological role of the secret garden ofunvegetated. shallow-water marine habitats, I. Distnbution.abundance and primary production. Estuaries. 19: 186 - 201.
Dow
nloa
ded
by [
84.1
22.2
03.2
52]
at 0
9:19
24
Oct
ober
201
2

E. P. Morris and J. C. Kromkamp
MA\OIIllH., J . OIWIIB~lAAR. J.U., PI.C1IAR, L. & KOBLI/.~K, M.(200 I). Photosystem II electron transport rates and oxygenproductIon in natural waterblooms of freshwater cyanobacteriadunng a diel cycle. 1. Plankton Res., 23: 57 - 66.
PIRKI'\. R.O. U'DlIlI\(K)J>. OJ.c.. BRon~. V .• 5!'oo\\. a.c..JI\l'5. B & RIB~.IRo, L. (2001). Responses ofmlcrophytobenlhosto hght: primary productIOn and carbohydrate allocation over anemerslon penod. Mar. Em/. Prog. Ser., 223: 101 -112.
PIRKl". R.G .. OXBOROI:(,II. K .. HANLON, A.R.M .. U"OLRWOOO,GJ C. & BAKt:.R, N.R. (2002) Can chlorophyll fluorescence beused to estimate the rate of photosynthetic electron transportwithin mlcrophytobenthic biofilms') Mar. £col. Prog. Ser.. 228:47 - 56.
POWI\IL, P & TY\~TJARvl. E. (1999). Molecular mechanism of hlghtemperature-mduced mhlbltlOn of acceptor sIde of PhotosystemII, PhotosI'll/h. Res., 62: 55-66.
PO\PI~IL, P. 5KOT'I<'A. J. & N"ll\, J. (1998). Low and highh:mperature dependence of minimum Fo and maximum Fm
chlorophyll fluorescence i/1 vivo. Biochim. Biophys. ACIO, 1363:95·99.
R,\VI 'J, J.A. & GUDlR, RJ. (1988). Temperature and algal growth.Nell' Phytol., 110: 441-461.
Rl:l'\K,\. 5.A .. B\D(;~R, M.R .. A-';DRlw5. T.J. & Vos CAt:.MM~.RER.
5 (2000). Photosynthetic electron Sinks In transgenic tobacco withreduced amounts of Rublsco: hllie eVIdence for significant Mehlerreaction J. Exp. Bot., 51: 357-368.
S\M\O:". G .. PRASIL, O. & YMKOUBD, B (1999) Photochemical andthermal phases of chlorophyll <I fluorescence, Photosynrhetica, 37:163-182.
142
SHIBATA, K., BtNSON, A.A. & CALVIN, M. (1954). The absorptionspectra of suspensions of living micro-orgamsms, Bioe/llm.Biophy.\. Acta, 15: 461-470.
SOK"L, R.R & ROHLr. FJ (1995). Biometry, 3rd edition. W.H.Freeman. New York.
TVVSTJARvl. E., KnTl ">t:.'oo. R & ARo. E.M. (1994). The rateconstant of photoinhibition i/1 vitro IS independent of the antennasize of photosystem II but depends on temperature. BlOchim.Biophys. Acta, 1186: 177 -185.
UNDERWOOD, G.J.c. & KROMKAMP, J. (1999) Primary productionby phytoplankton and mlcrophytobenthos m estuaries. Adv. Ecol.Res.. 29: 93 - 153.
U'()~RWOO(), O.J.C" PUERSO... D.M. & PARKlS. RJ, (1995). Themeasurement of microbial carbohydrate exopolymers fromintertidal sediments. Limnol. Oceaf/ogr , 40. 1243 - 1253.
VAN LII.Rl. L. & WALSBY. A.E. (1982). Interactions ofcyanobacteria with hghl. In Biology ()f the Cyanohacteria (Carr. N.O. &Whitton. B.A.. editors), Blackwell Scientific, Oxford.
WEBB. W.L., N~WTON. M. & STARR, D. (1974), Carbon dioxideexchange of Alnus rubra: a mathematical model. Decolagia, 17:281 -291.
WILU"M\, PJ L. & ROB~RTS()N, J,E. (1991). Overall planktOniCoxygen and carbon dioxide metabolisms: the problem ofreconcihng observations and calculations of photosyntheticquotients J. Plankton Res.. 13. 153-169.
E. P. Morris and J. C. Kromkamp
MA\OIIllH., J . GROHB~LAAR. J.U., PI.C1IAR. L. & KOBLlI.~K. M.(200 I). Photosystem II electron transport rates and oxygenproductIon in natural waterblooms of freshwater cyanobacteriadunng a diel cycle. 1. Plankton Res., 23: 57 - 66.
PI Rid". R.G. U'DLR\\OOJ). G.J.c.. BRon~. V.• S",O\\. G.c..JI\l'5. B & RIB~.IRO. L. (2001). Responses ofmlcrophytobenlhosto light: primary productIOn and carbohydrate allocation over anemerslOn perIod. Mar. Em/. Prog. Ser., 223: 101 -112.
PI RKI'''. R.G .. OXBOROI:(,II. K., HANLON. A.R.M .. U'OLRWOOO.GJ C. & BAKl:R. N.R. (2002) Can chlorophyll fluorescence beused to estimate the rate of photosynthetIc electron transportwithin mlcrophytobenthic biofilms'? Mar. Ecol. Prog. Ser.. 228:47 - 56.
POWI'lL P & TY\~TJARVI. E. (1999). Molecular mechanism of hlghtemperature-Induced inhibitIOn of acceptor Side of PhotosystemII. PhotosI'll/h. Res., 62: 55-66.
PO\PI\IL P. SKOT'I<'A. J. & N"t l \. J. (1998). Low and highIt:mpt:ralure dependt:nct: of minimum Fo and maximum Fm
chlorophyll fluorescence ill vivo. Biochim. Biophys. ACIO, 1363:95·99.
R,\VI 'I. J.A. & GI:IDlR. RJ. (1988). Temperature and algal growth.Nell' Phytol.. 110: 441-461.
Rt:t'\K'\. S.A .. B\l)(;~R. M.R .. A'uRl:ws. T.J. & Vo:-; CAI:MM~.RI:R.
S (2000). Photosynthetic electron Sinks In transgenic tobacco withreduced amounts of Rublsco: little eVidence for significant Mehlerreaction J. Exp. Bot., 51: 357-368.
S \M\O:". G .. PRASIL. O. & YMKOUBO, B (1999) Photochemical andthermal phases of chlorophyll (J fluorescence, Photosynrhetica, 37:163-182.
142
SHIBATA. K .• BI:NSON. A.A. & CALVIN. M. (1954). The absorptionspectra of suspensIOns of living micro-orgamsms. Bioe/llm.Biophy.\. Acta. 15: 461-470.
SOK"L, R.R & ROHLr. FJ (1995). Biometry. 3rd edition. W.H.Freeman. New York.
TVVSTJARVI. E.• KIoTTl"Io'o,. R & ARo. E.M. (1994). The rateconstant of photoinhibition i/1 vitro IS independent of the antennasize of photosystem II but depends on temperature. BlOchim.Biophys. Acta, 1186: 177 -185.
UNDERWOOD. G.J.c. & KROMKAMP. J. (1999) Primary productionby phytoplankton and mlcrophylobenthos In estuaries. Adv. Ecol.Res.. 29: 93 -153.
U"D}-R\\'(X)O, G.J.C.• P~HRSO'J, D.M. & PARKI:S. RJ. (1995). Themeasurement of microbial carbohydrate exopolymers fromintertidal sediments. Urnnol. OcearlOgr , 40. 1243 - 1253.
VAN LII.RI:. L. & WALSBY. A.E. (1982). Interactions ofcyanobacteria with light. In Biology (!! the Cyallohacteria (Carr. N.G. &Whitton. B.A.. editors). Blackwell Scientific. Oxford.
WEBB. W.L.. NeWTON. M. & STARR. D. (1974). Carbon dioxideexchange of Alnus rubra: a mathematical model. Oecologia. 17:281 -291.
WILI.I,yM\. PJ L. & ROB~RTS()N. J.E. (1991). Overall planktOniCoxygen and carbon dioxide metabolisms: the problem ofreconciling observations and calculatIOns of photosyntheticquotients J. Plankton Res.. 13. 153-169.
Dow
nloa
ded
by [
84.1
22.2
03.2
52]
at 0
9:19
24
Oct
ober
201
2
Related Documents