Running head: SUBPHONEMIC SENSITIVITY AND PHONOLOGICAL SKILLS Individual Differences in Subphonemic Sensitivity and Phonological Skills Monica Y.C. Li a,b,c,d , David Braze b,d , Anuenue Kukona d,e , Clinton L. Johns d , Whitney Tabor a,b,d , Julie A. Van Dyke b,d , W. Einar Mencl d,f , Donald P. Shankweiler a,d , Kenneth R. Pugh a,b,c,d,f , and James S. Magnuson a,b,c,d a Department of Psychological Sciences, University of Connecticut, Storrs, CT 06269-1020, USA b Connecticut Institute for the Brain and Cognitive Sciences, University of Connecticut, Storrs, CT 06269-1272, USA c Brain Imaging Research Center, University of Connecticut, Storrs, CT 06269-1271 d Haskins Laboratories, 300 George St., New Haven, CT 06510, USA e School of Applied Social Sciences, De Montfort University, The Gateway, Leicester, LE1 9BH, UK f Department of Linguistics, Yale University, New Haven, CT 06520, USA Please address correspondence to: Monica Y.C. Li, M.S. Email: [email protected]

Welcome message from author
This document is posted to help you gain knowledge. Please leave a comment to let me know what you think about it! Share it to your friends and learn new things together.
Transcript
Running head: SUBPHONEMIC SENSITIVITY AND PHONOLOGICAL SKILLS
Individual Differences in Subphonemic Sensitivity and Phonological Skills
Monica Y.C. Lia,b,c,d, David Brazeb,d, Anuenue Kukonad,e, Clinton L. Johnsd, Whitney
Tabora,b,d, Julie A. Van Dykeb,d, W. Einar Mencld,f, Donald P. Shankweilera,d, Kenneth R.
Pugha,b,c,d,f, and James S. Magnusona,b,c,d
aDepartment of Psychological Sciences, University of Connecticut, Storrs, CT 06269-1020, USA
bConnecticut Institute for the Brain and Cognitive Sciences, University of Connecticut, Storrs, CT 06269-1272, USA
cBrain Imaging Research Center, University of Connecticut, Storrs, CT 06269-1271
dHaskins Laboratories, 300 George St., New Haven, CT 06510, USA
eSchool of Applied Social Sciences, De Montfort University, The Gateway, Leicester, LE1 9BH, UK
fDepartment of Linguistics, Yale University, New Haven, CT 06520, USA
Please address correspondence to: Monica Y.C. Li, M.S. Email: [email protected]
SUBPHONEMIC SENSITIVITY AND PHONOLOGICAL SKILLS
1
Abstract
Many studies have established a link between phonological abilities (indexed by phonological
awareness and phonological memory tasks) and typical and atypical reading development.
Individuals who perform poorly on phonological assessments have been mostly assumed to have
underspecified (or “fuzzy”) phonological representations, with typical phonemic categories, but
with greater category overlap due to imprecise encoding. An alternative posits that poor readers
have overspecified phonological representations, with speech sounds perceived allophonically
(phonetically distinct variants of a single phonemic category). On both accounts, mismatch
between phonological categories and orthography leads to reading difficulty. Here, we consider
the implications of these accounts for online speech processing. We used eye tracking and an
individual differences approach to assess sensitivity to subphonemic detail in a community
sample of young adults with a wide range of reading-related skills. Subphonemic sensitivity
inversely correlated with meta-phonological task performance, consistent with overspecification.
Keywords: spoken word recognition, eye tracking, phonological skills, individual
differences, reading ability
SUBPHONEMIC SENSITIVITY AND PHONOLOGICAL SKILLS
2
Phonology is important to the acquisition of skilled reading, and limitations in 1
phonological processing contribute to reading difficulties (Brady, Braze, & Fowler, 2011; Elliott 2
& Grigorenko, 2014). Considerable effort has been spent identifying the underlying causes of 3
decoding-based reading disorder (RD), commonly called developmental “dyslexia” (e.g., Brady 4
et al., 2011; Elliott & Grigorenko, 2014), and the phonological core deficit model has, perhaps, 5
received the most attention (e.g., Gallagher, Frith, & Snowling, 2000; Liberman, 1973; Liberman 6
& Mattingly, 1985; Stanovich, 1988). This model holds that difficulty in the phonological 7
component of language plays a causal role in reading problems (Harm & Seidenberg, 1999; 8
Puolakanaho et al., 2007; Ramus, 2003; for a review, see Brady, 2011). Indeed, a range of 9
phonological and meta-phonological capacities have well-established associations with reading 10
ability and reading acquisition, including phonological awareness (Bruck, 1992; Byrne & 11
Fielding-Barnsley, 1991; Scarborough, 1989), rapid automatized naming (Blachman, 1984; Wolf 12
& Bowers, 1999), phonological short-term memory (McDougall, Hulme, Ellis, & Monk, 1994), 13
and set for variability (Anthony et al., 2010; Tunmer & Chapman, 2012; Venezky, 1999). 14
Furthermore, it has been suggested that individual differences in meta-phonological skills (e.g., 15
phonological awareness) and phonological representations may modulate the development and 16
expression of skilled reading (Ramus, Marshall, Rosen, & Van Der Lely, 2013). 17
Of course, factors other than phonology are certainly required to achieve skilled reading 18
(Braze, Tabor, Shankweiler, & Mencl, 2007; Kieffer, Petscher, Proctor, & Silverman, 2016), and 19
are often implicated in failure to do so (Catts & Adolph, 2011; Elwér et al., 2015; Pennington, 20
2006; Snowling, 2008). Indeed, we assume that a multivariate continuum of skills, capacities, 21
and experiences serve to co-determine how quickly and how well an individual learns to read 22
(e.g., Catts et al., 2017). Phonological ability is a part of that continuum, but certainly not the 23
SUBPHONEMIC SENSITIVITY AND PHONOLOGICAL SKILLS
3
whole of it. However, given the importance of phonological capacities to the attainment of 24
reading skills, and the relevance of other factors notwithstanding, our goal in this paper is to 25
better understand the nature of meta-phonological skills differences implicated in variation in 26
reading ability. 27
Two accounts of phonological performance deficits: underspecified vs. overspecified
representations
Two prominent theoretical accounts of the connection between phonology and reading 28
suggest that this association depends on the degree of specificity of phonological representations. 29
On these accounts, RD individuals’ phonological representations are either under- or 30
overspecified (as labelled by Noordenbos, Segers, Serniclaes, & Verhoeven, 2013). The 31
underspecification account suggests that RD individuals’ poorer performance on meta-32
phonological tasks originate from incomplete or imprecise encoding of speech. In contrast, the 33
overspecification account suggests that RD individuals may have excessively fine-grained 34
phonological representations (i.e., more phonological categories) than are characteristic of a 35
given language. We consider both of these accounts in turn.36
SUBPHONEMIC SENSITIVITY AND PHONOLOGICAL SKILLS
4
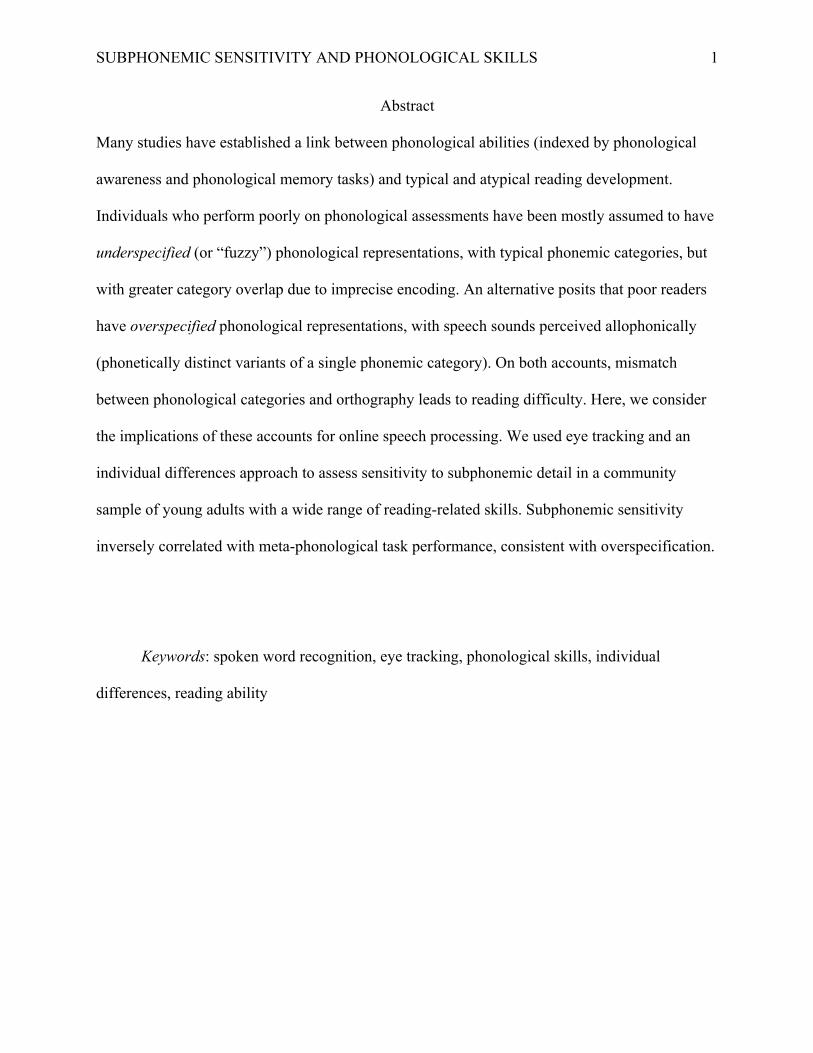
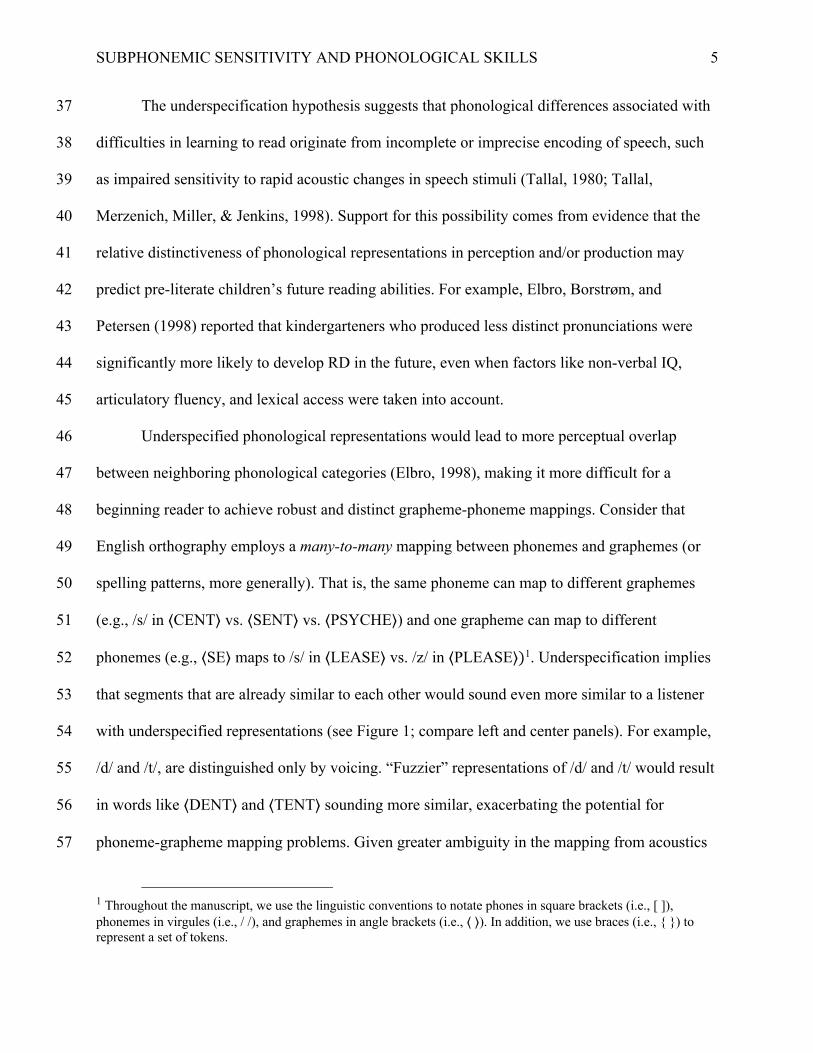
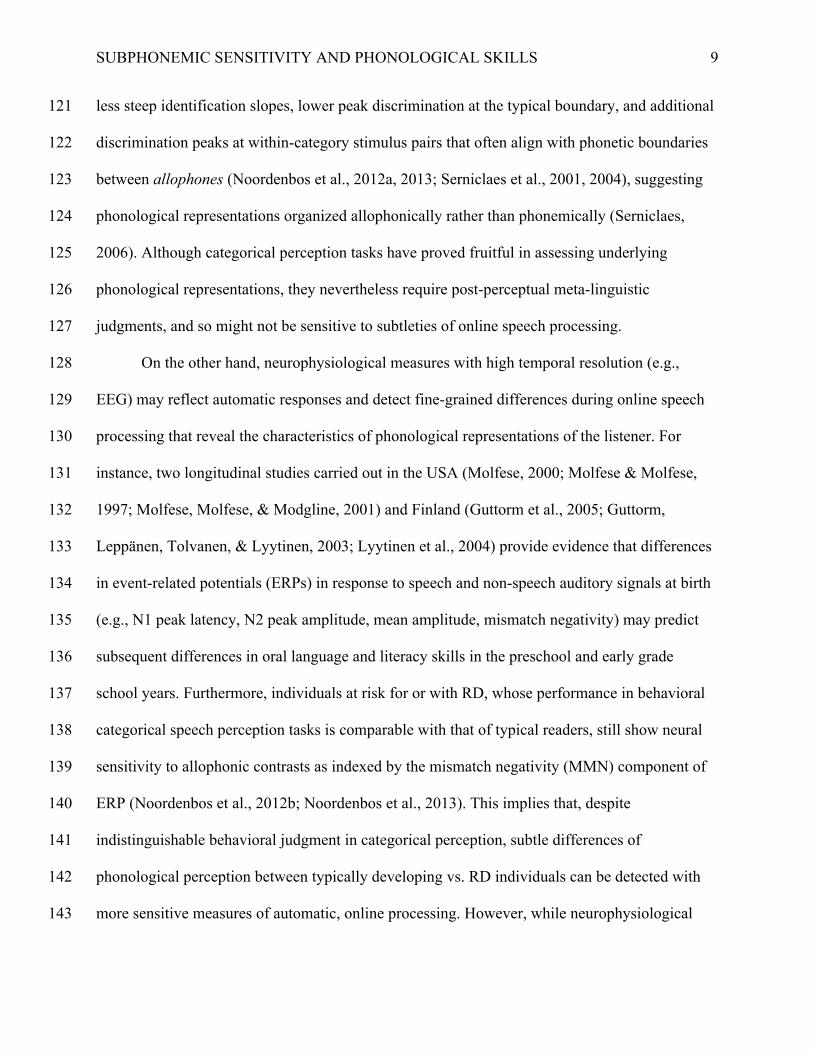
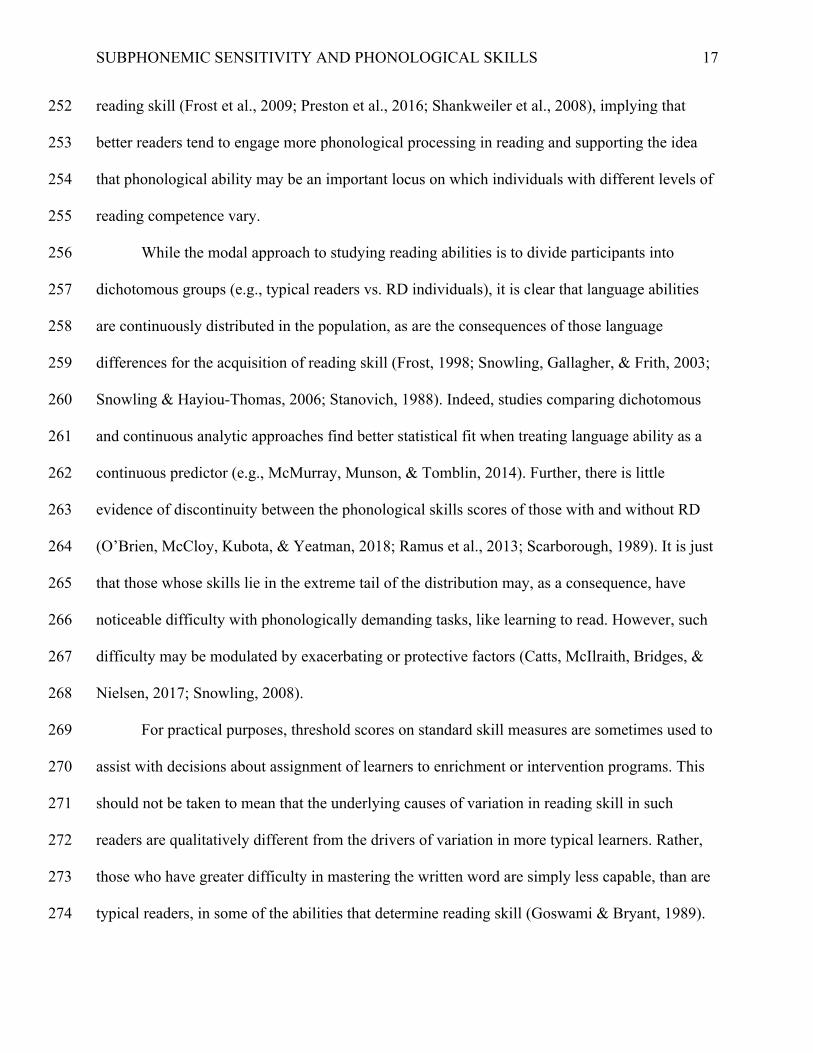
Figure 1. Phonological categories as functional units in different levels of phonological specification. In listeners with typical language (center panel), the functional units of spoken word recognition are phonemes. While phonemic perception is largely categorical, there is a modest overlap between categories where speech sounds on the boundary may be somewhat ambiguous. Underspecification accounts propose that the phonological categories of RD individuals are phonemic, but have “fuzzy” boundaries (left panel). That is, individuals with underspecified phonological representations use phonemes as functional units in spoken word recognition, but these categories have greater overlap than the categories of typical listeners. Overspecification accounts (right panel), in contrast, propose that RD individuals divide phonological space into more categories than individuals with typical language, where the functional units are allophones (“variants of the same phoneme in the production of speech under the effect of coarticulation”; Serniclaes et al., 2004, p. 338). VOT = voice onset time; POA = place of articulation.
SUBPHONEMIC SENSITIVITY AND PHONOLOGICAL SKILLS
5
The underspecification hypothesis suggests that phonological differences associated with 37
difficulties in learning to read originate from incomplete or imprecise encoding of speech, such 38
as impaired sensitivity to rapid acoustic changes in speech stimuli (Tallal, 1980; Tallal, 39
Merzenich, Miller, & Jenkins, 1998). Support for this possibility comes from evidence that the 40
relative distinctiveness of phonological representations in perception and/or production may 41
predict pre-literate children’s future reading abilities. For example, Elbro, Borstrøm, and 42
Petersen (1998) reported that kindergarteners who produced less distinct pronunciations were 43
significantly more likely to develop RD in the future, even when factors like non-verbal IQ, 44
articulatory fluency, and lexical access were taken into account. 45
Underspecified phonological representations would lead to more perceptual overlap 46
between neighboring phonological categories (Elbro, 1998), making it more difficult for a 47
beginning reader to achieve robust and distinct grapheme-phoneme mappings. Consider that 48
English orthography employs a many-to-many mapping between phonemes and graphemes (or 49
spelling patterns, more generally). That is, the same phoneme can map to different graphemes 50
(e.g., /s/ in ⟨CENT⟩ vs. ⟨SENT⟩ vs. ⟨PSYCHE⟩) and one grapheme can map to different 51
phonemes (e.g., ⟨SE⟩ maps to /s/ in ⟨LEASE⟩ vs. /z/ in ⟨PLEASE⟩)1. Underspecification implies 52
that segments that are already similar to each other would sound even more similar to a listener 53
with underspecified representations (see Figure 1; compare left and center panels). For example, 54
/d/ and /t/, are distinguished only by voicing. “Fuzzier” representations of /d/ and /t/ would result 55
in words like ⟨DENT⟩ and ⟨TENT⟩ sounding more similar, exacerbating the potential for 56
phoneme-grapheme mapping problems. Given greater ambiguity in the mapping from acoustics 57
1 Throughout the manuscript, we use the linguistic conventions to notate phones in square brackets (i.e., [ ]), phonemes in virgules (i.e., / /), and graphemes in angle brackets (i.e., ⟨ ⟩). In addition, we use braces (i.e., { }) to represent a set of tokens.
SUBPHONEMIC SENSITIVITY AND PHONOLOGICAL SKILLS
6
to perceptual categories, correspondences that are clear for typical individuals become more 58
challenging for individuals with underspecified phonological representations. 59
Alternately, phonological performance deficits in RD individuals may instead stem from 60
overspecified phonological representations. On the overspecification hypothesis, a listener would 61
have more contrastive sound categories than a typical listener (see Figure 1; compare center and 62
right panels). That is to say, individuals with overspecified phonological representations would 63
retain greater sensitivity to phonetic distinctions that are actually subphonemic for most 64
individuals who speak that language. In this case, RD individuals may be more attuned to 65
allophones (phonetic variants within a phonemic category) than to phonemes. There is evidence 66
that individuals with RD show atypical categorical perception: reduced discrimination in native-67
language phonemic contrasts, but enhanced discrimination in spoken sounds within a given 68
phonemic category (Serniclaes, Sprenger-Charolles, Carré, & Démonet, 2001; Serniclaes et al., 69
2004). For example, on the voice onset time (VOT) continuum, individuals with allophonic 70
perception might register the phones [d], [t] and [th] (with VOT ranges of approximately -165 to 71
-40 ms, 0 to 25 ms, and 25 to 125 ms, respectively; Lisker & Abramson, 1964), as belonging to 72
distinct phonological categories, even in a language where there should only be two such 73
categories, /d/ and /t/ (with VOT < 30 ms and VOT > -30 ms in English, respectively; Hoonhorst 74
et al., 2009). 75
Although typical readers are sensitive to allophonic variation at the phonetic level, they 76
nonetheless reliably map allophones onto a smaller set of phonemic categories at the 77
phonological level (see Serniclaes et al., 2004). In contrast, Serniclaes (2006) suggests that 78
individuals with RD fail to associate allophonic variants with appropriate phonemic categories at 79
the phonological level, and use allophones as the primary functional units for speech. While such 80
SUBPHONEMIC SENSITIVITY AND PHONOLOGICAL SKILLS
7
allophonic perception2 may not cause obvious difficulty in speech processing, the mismatch 81
between phonological categories and graphemes may cause important problems in reading 82
acquisition and processing (Serniclaes, 2006). For example, while typical readers may have 83
consistent phoneme–grapheme mappings (e.g., /d/ → ⟨D⟩; /t/ → ⟨T⟩), individuals with 84
overspecified phonological representations may have more variable mappings (e.g., [d] → ⟨D⟩; 85
[t] → {⟨D⟩, ⟨T⟩}; [th] → ⟨T⟩; for schematics, see Figure 5 in Serniclaes, 2006). 86
It is worth noting that both underspecification and overspecification hypotheses predict 87
that certain phonetic contrasts may be hard for affected listeners to detect—but for different 88
reasons. For instance, with overspecified phonological representations, additional allophonic 89
representations (e.g., [t]) straddle the boundaries of canonical phonemic categories (e.g., /d/ and 90
/t/), and any two sounds that fall within such a range would be hard to distinguish from each 91
other (see again Figure 1). However, for phonemes with multiple allophonic variants (e.g., 92
allophones [t] and [th] for phoneme /t/), individuals relying on allophonic perception may make 93
unnecessarily fine-grained distinctions among sounds that fall within a single phonemic 94
category. Thus, while both accounts predict cases where there is less sensitivity to distinguishing 95
spoken sounds, only overspecification predicts cases with greater sensitivity. Therefore, behavior 96
indicating greater subphonemic sensitivity would be consistent with the overspecification 97
hypothesis and at odds with underspecification. 98
2 Serniclaes et al., (2004) “refer to this as ‘allophonic perception’ rather than simply as ‘phonetic perception.’ Allophonic perception implies that although the perceptual system does not decode speech into phonetic units, it is sensitive to segments that are present as allophones in the language. However, phonetic distinctions that are totally absent in the sounds of the language would not be kept in the phonological repertoire. Thus, speech perception by children affected by dyslexia would be neither reducible to phonetic perception nor equivalent to normal phonological perception. Rather, it would correspond to a deviant phonological development based on allophones rather than on phonemes” (p. 341).
SUBPHONEMIC SENSITIVITY AND PHONOLOGICAL SKILLS
8
Eye tracking: a sensitive timecourse measure for online phonological processing
The debate over whether phonological performance deficits implicated in RD arise from 99
underspecified or overspecified representations is difficult to resolve by way of conventional 100
standardized tests, like measures of phonological awareness (PA) or rapid automatized naming 101
(RAN). Almost universally, standardized phonological skills measures used in reading research, 102
for classroom progress monitoring, or for clinical assessment, are significantly meta-linguistic in 103
nature, depending not only on underlying phonological representations and processes, but also on 104
the ability to reason more or less consciously about them. Moreover, such tasks capture only the 105
behavioral end points (e.g., accuracy, response time) of cognitive processes. Therefore, they do 106
not provide much insight into how differences in phonological representations relate to reading 107
skill or the fine-grained time course of lexical access and competition (in print or speech). 108
That said, the relationships among decoding ability, phonological representations, and 109
phonological processing have been investigated with behavioral measures like categorical 110
perception tasks or neurophysiological measures like EEG. Categorical perception is typically 111
measured with identification and discrimination of spoken stimuli varying along a minimal-pair 112
continuum (e.g., /ta/-/da/). The slope of identification rates as a function of the continuum step 113
indicates boundary precision between phonemic categories, whereas ability to discriminate 114
adjacent continuum steps within (usually hard) and between categories (usually easy) can reflect 115
sensitivity to phonemic and subphonemic features (Serniclaes, 2006). Strongly categorical 116
perception is indicated when an individual exhibits a steep (sigmoidal) identification curve and 117
her discrimination is high and maximal at the boundary indicated by the identification curve and 118
poor throughout the rest of the continuum (Serniclaes, 2006). In contrast, as mentioned 119
previously, individuals with RD (or at risk for RD) often show less clear categorical perception: 120
SUBPHONEMIC SENSITIVITY AND PHONOLOGICAL SKILLS
9
less steep identification slopes, lower peak discrimination at the typical boundary, and additional 121
discrimination peaks at within-category stimulus pairs that often align with phonetic boundaries 122
between allophones (Noordenbos et al., 2012a, 2013; Serniclaes et al., 2001, 2004), suggesting 123
phonological representations organized allophonically rather than phonemically (Serniclaes, 124
2006). Although categorical perception tasks have proved fruitful in assessing underlying 125
phonological representations, they nevertheless require post-perceptual meta-linguistic 126
judgments, and so might not be sensitive to subtleties of online speech processing. 127
On the other hand, neurophysiological measures with high temporal resolution (e.g., 128
EEG) may reflect automatic responses and detect fine-grained differences during online speech 129
processing that reveal the characteristics of phonological representations of the listener. For 130
instance, two longitudinal studies carried out in the USA (Molfese, 2000; Molfese & Molfese, 131
1997; Molfese, Molfese, & Modgline, 2001) and Finland (Guttorm et al., 2005; Guttorm, 132
Leppänen, Tolvanen, & Lyytinen, 2003; Lyytinen et al., 2004) provide evidence that differences 133
in event-related potentials (ERPs) in response to speech and non-speech auditory signals at birth 134
(e.g., N1 peak latency, N2 peak amplitude, mean amplitude, mismatch negativity) may predict 135
subsequent differences in oral language and literacy skills in the preschool and early grade 136
school years. Furthermore, individuals at risk for or with RD, whose performance in behavioral 137
categorical speech perception tasks is comparable with that of typical readers, still show neural 138
sensitivity to allophonic contrasts as indexed by the mismatch negativity (MMN) component of 139
ERP (Noordenbos et al., 2012b; Noordenbos et al., 2013). This implies that, despite 140
indistinguishable behavioral judgment in categorical perception, subtle differences of 141
phonological perception between typically developing vs. RD individuals can be detected with 142
more sensitive measures of automatic, online processing. However, while neurophysiological 143
SUBPHONEMIC SENSITIVITY AND PHONOLOGICAL SKILLS
10
measures like EEG indeed provide substantial insight, discrepancies between neurophysiological 144
and behavioral results can be challenging to interpret (cf. Noordenbos et al., 2012b; Noordenbos 145
et al., 2013). 146
To better inform the over- vs. underspecification debate and to potentially provide 147
converging evidence, a more ideal solution would be behavioral measures capable of capturing 148
fine-grained, automatic cognitive processing in real time, such as the Visual World Paradigm 149
(VWP; Tanenhaus, Spivey-Knowlton, Eberhard, & Sedivy, 1995). In a basic VWP study of 150
spoken word processing (e.g., Allopenna, Magnuson, & Tanenhaus, 1998), participants follow 151
simple spoken instructions to interact with a visual scene. Fixation proportions over time closely 152
track phonetic detail, and participants’ fixations are assumed to reflect the real-time activation of 153
the pictures’ names during lexical access. 154
The VWP has proved fruitful in measuring the fine-grained nature of online speech 155
processing at various linguistic levels, including discourse/pragmatic (Altmann & Kamide, 2009; 156
Engelhardt, Bailey, & Ferreira, 2006; Magnuson, Tanenhaus, & Aslin, 2008), syntactic 157
(Chambers, Tanenhaus, & Magnuson, 2004; Tanenhaus et al., 1995), semantic (Huettig & 158
Altmann, 2005; Kaiser, Runner, Sussman, & Tanenhaus, 2009), lexical (Magnuson, Dixon, 159
Tanenhaus, & Aslin, 2007), phonemic (Allopenna et al., 1998; Desroches, Joanisse, & 160
Robertson, 2006; Magnuson, Tanenhaus, Aslin, & Dahan, 2003) and, most importantly for the 161
purposes of our study, at subphonemic levels (Dahan, Magnuson, Tanenhaus, & Hogan, 2001; 162
McMurray, Aslin, Tanenhaus, Spivey, & Subik, 2008). While general speech perception and 163
comprehension (as assessed by standardized instruments) do not seem to be severely affected in 164
RD and related phonological deficits (Giraud & Poeppel, 2012; Serniclaes et al., 2004), the VWP 165
has the potential to reveal subtle differences in sensitivity to even subphonemic coarticulatory 166
SUBPHONEMIC SENSITIVITY AND PHONOLOGICAL SKILLS
11
details in speech (Dahan et al., 2001). For example, Cross and Joanisse (2018)demonstrated 167
differences between adults and children in responses to coarticulatory cues. 168
Therefore, in this study, we investigated individuals’ sensitivity to subphonemic 169
information using a VWP task. We modeled our study closely after the eye tracking experiment 170
used by Dahan et al. (2001), who extended the basic VWP for spoken word recognition 171
(Allopenna et al., 1998) to subcategorical (i.e., subphonemic) detail in speech. In order to tap 172
into participants’ sensitivity to subphonemic information, they created spoken stimuli with 173
misleading coarticulation by cross-splicing the onset and nucleus of one word onto the offset of 174
another. For example, they took a target word (W1; e.g., /nɛt/) and spliced its final consonant 175
onto the initial portion (beyond the midpoint of the vowel) of another token of W1, of a different 176
real word (W2; e.g., /nɛk/), or of a nonword (N3; e.g., /nɛp/). Thus, they had three forms of each 177
target word (where subscripts indicate coarticulation present in the vowel): an identity-spliced 178
token with no misleading coarticulation (W1W1; /nɛtt/) as the control condition, a cross-spliced 179
token with misleading coarticulation consistent with a lexical alternative (W2W1; /nɛkt/), and a 180
cross-spliced token with misleading coarticulation that did not favor a lexical item (N3W1; 181
/nɛpt/). 182
Dahan et al.’s (2001) study was motivated by earlier work by Marslen-Wilson and 183
Warren (1994), who claimed to have found lexical decision results that conflicted with 184
predictions from the TRACE model of spoken word recognition (McClelland & Elman, 1986). 185
According to simulations conducted by Marslen-Wilson and Warren (1994), TRACE predicts 186
that W2W1 should be harder to process than N3W1, because the initial portion of W2W1 187
matches a word (W2), which should be strongly activated and so compete with W1, while the 188
initial portion of N3W1 would not selectively activate a competitor. Counter to this prediction, 189
SUBPHONEMIC SENSITIVITY AND PHONOLOGICAL SKILLS
12
Marslen-Wilson and Warren (1994) found that W2W1 and N3W1 both took longer to recognize 190
in a lexical decision task than W1W1, but W2W1 was recognized just as quickly as N3W1. 191
Dahan et al. (2001) asked whether the lexical decision task might not be sufficiently sensitive to 192
detect differences. 193
Using the VWP and a sample of university students, Dahan et al. (2001) compared the 194
time course of target (W1) and competitor (W2) fixations (Experiment 2; or just fixations to the 195
target in Experiment 1) given W1W1, W2W1, or N3W1 as the stimulus. They observed that 196
target fixation proportions rose significantly faster for W1W1 (no mismatch) than for N3W1 or 197
W2W1. Crucially, participants were significantly faster to fixate W1 given N3W1 than W2W1—198
in contrast to Marslen-Wilson and Warren’s (1994) finding, but consistent with TRACE. Dahan 199
et al. (2001) referred to the difference of target fixations between W1W1 and N3W1 as a 200
phonological mismatch effect and the difference between N3W1 and W2W1 as a lexical 201
competition effect. That is, while both N3W1 and W2W1 differ from W1 phonologically, W2W1 202
adds the influence of a specific lexical competitor. Dahan et al.’s (2001) finding suggests that, 203
compared to final outcome measures (e.g., reaction time and accuracy in lexical decision), the 204
VWP is a more sensitive measure, able to reveal subtle differences during online speech 205
perception that were masked in lexical decision.206
SUBPHONEMIC SENSITIVITY AND PHONOLOGICAL SKILLS
13
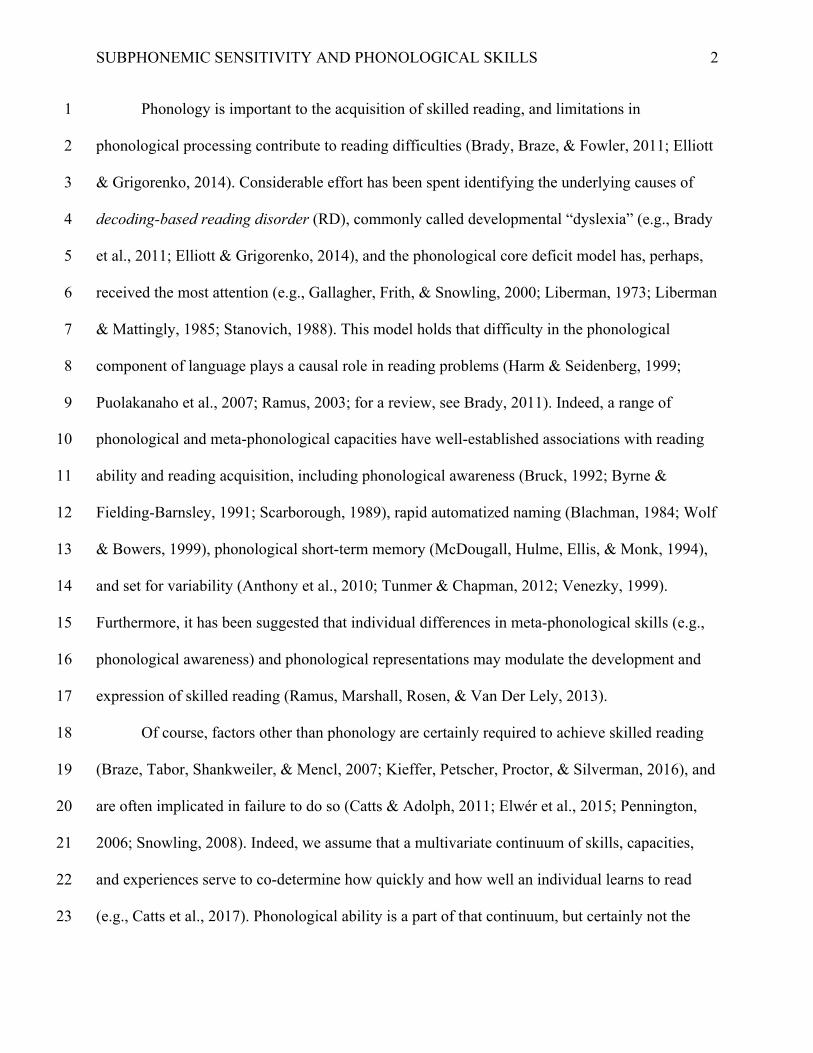
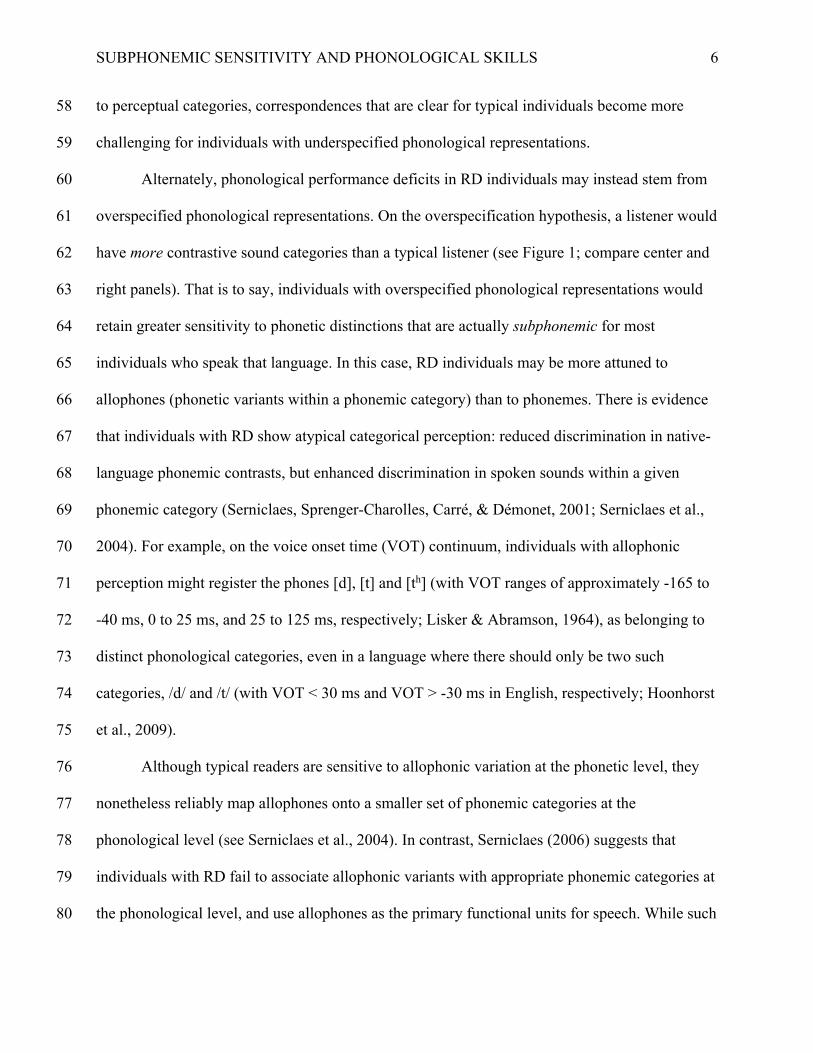
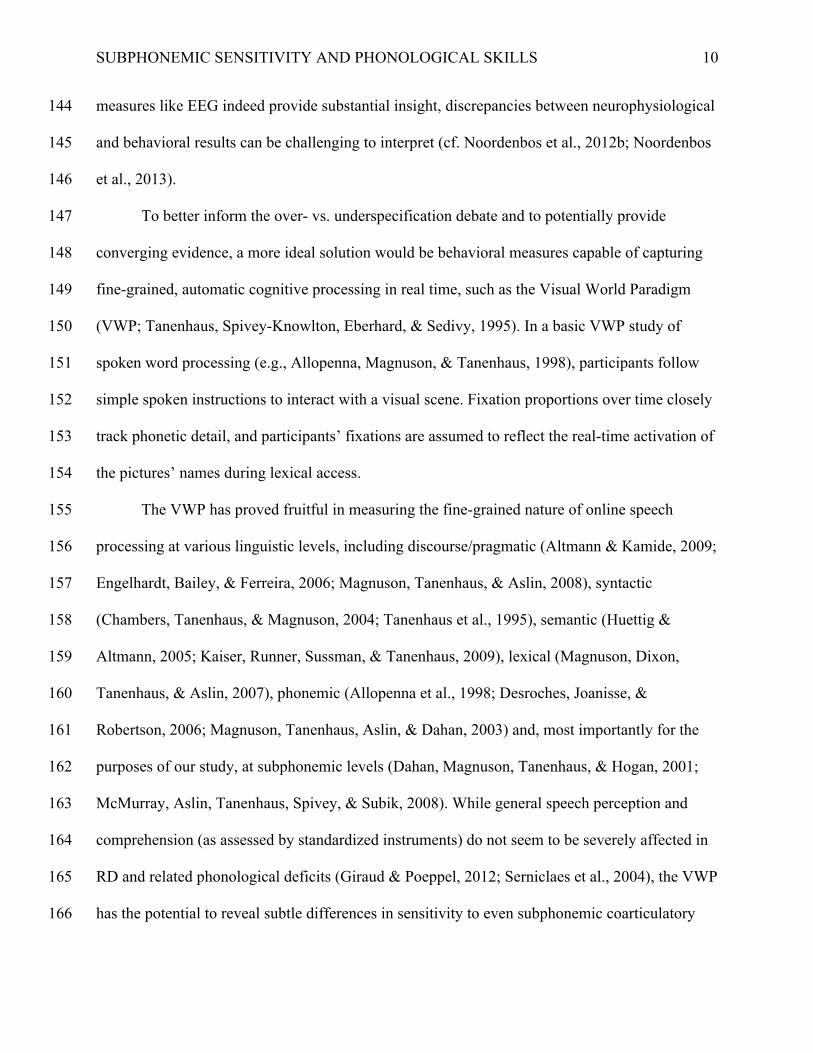
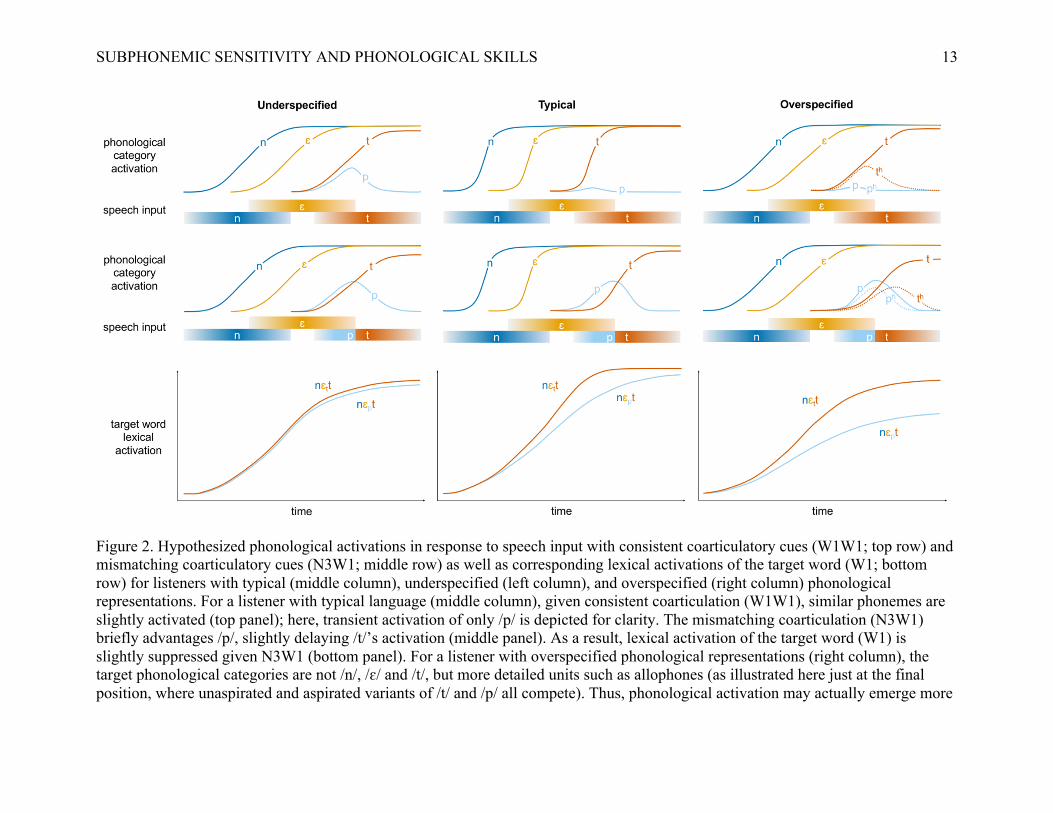
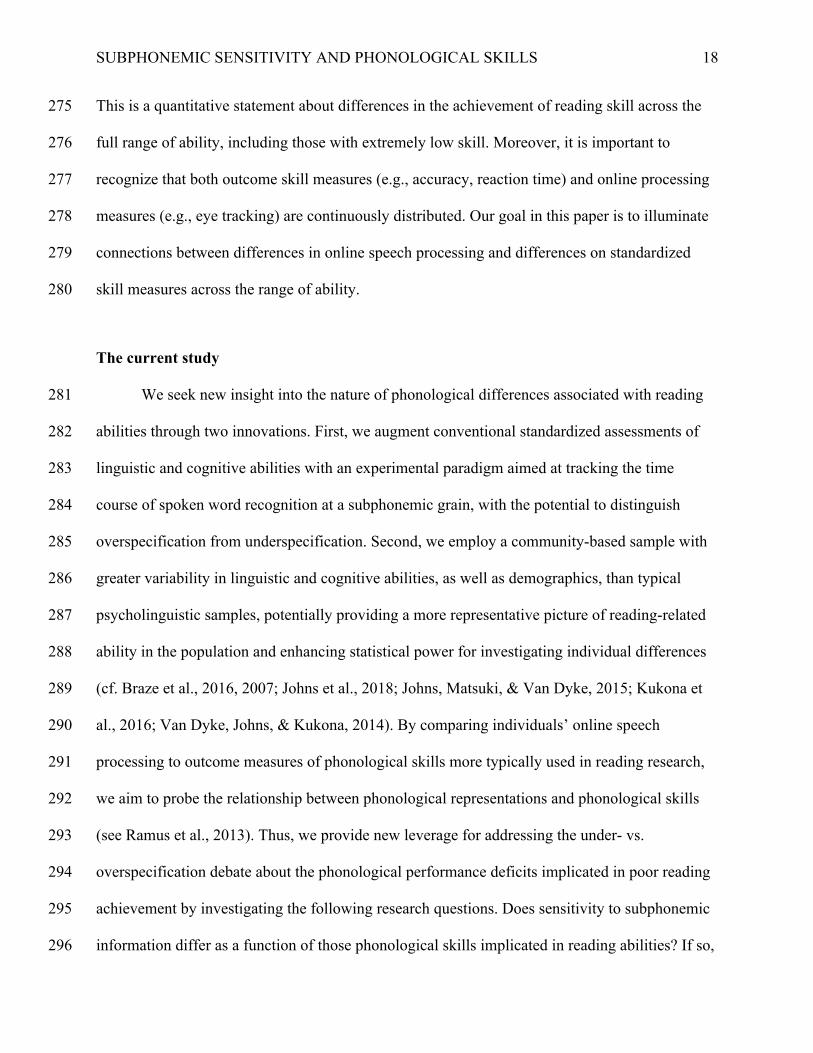
Figure 2. Hypothesized phonological activations in response to speech input with consistent coarticulatory cues (W1W1; top row) and mismatching coarticulatory cues (N3W1; middle row) as well as corresponding lexical activations of the target word (W1; bottom row) for listeners with typical (middle column), underspecified (left column), and overspecified (right column) phonological representations. For a listener with typical language (middle column), given consistent coarticulation (W1W1), similar phonemes are slightly activated (top panel); here, transient activation of only /p/ is depicted for clarity. The mismatching coarticulation (N3W1) briefly advantages /p/, slightly delaying /t/’s activation (middle panel). As a result, lexical activation of the target word (W1) is slightly suppressed given N3W1 (bottom panel). For a listener with overspecified phonological representations (right column), the target phonological categories are not /n/, /ɛ/ and /t/, but more detailed units such as allophones (as illustrated here just at the final position, where unaspirated and aspirated variants of /t/ and /p/ all compete). Thus, phonological activation may actually emerge more
SUBPHONEMIC SENSITIVITY AND PHONOLOGICAL SKILLS
14
slowly at each position, because even when coarticulation is ultimately consistent (W1W1), there are more potential competitors at any position given more phonological categories (top panel). Similarly, the mismatching coarticulation (N3W1) activates more partially matching phonological categories than a typical listener would have, leading to substantially more disruption than for a typical listener (middle panel). Consequently, the hypothetical time course of target word lexical activation is depressed given W1W1, and even more so given N3W1, relative to that for a typical listener (bottom panel). For a listener with underspecified phonological representations (left column), the target phonological categories are similar to those in typical listeners (that is, more phonemic than allophonic) but have a coarser grain, leading to more diffuse activation of similar phonemes and slower phonological activation. Hence, /t/ and /p/ compete more strongly given W1W1 than they would for a typical listener (top panel). Mismatching coarticulation (N3W1) would have similar consequences as consistent coarticulation does, since these similar phonemes activate each other as strongly (middle panel). Therefore, while lexical activation would be predicted to be generally more sluggish than for typical listeners, there would be little or no difference due to mismatching coarticulation (bottom panel).
SUBPHONEMIC SENSITIVITY AND PHONOLOGICAL SKILLS
15
As we noted above, standardized assessments that rely on meta-linguistic judgements 207
and/or recall appear to identify deviation from typical phonological abilities, but cannot 208
distinguish between the possibilities of under- vs. overspecification. Both hypotheses predict 209
more effortful speech processing and increased competition for clear speech (Figure 2, top row), 210
and listeners with either underspecified or overspecified representations would be predicted to 211
show weaker lexical activation of a target word (e.g., shallower slopes and lower asymptotes) as 212
compared to typical listeners (Figure 2, bottom row). Specifically, given underspecification, even 213
clear inputs would result in less selective activation, during which more phonological categories 214
are activated than under typical speech processing. For example, a /t/ input could lead to similar 215
activation among phonemes differing from /t/ by a feature or two, such as /d/, /p/, /k/, etc. (Figure 216
2, top left panel). Given overspecification, there would be more competition than under typical 217
speech processing because there would be more phonological categories. For example, a clear /t/ 218
would produce strong competition among [th], [t], [d], etc., under allophonic perception (Figure 219
2, top right panel). Similarly, poor performance on standardized assessments could result from 220
either kind of deviation (i.e., under- or overspecification) from typical, phonemically-grained 221
perception. 222
On the other hand, under- vs. overspecification hypotheses have distinct predictions when 223
it comes to real-time phonological and lexical activations for unclear speech with mismatching 224
coarticulation (Figure 2, middle row). Listeners with overspecified representations would show 225
much weaker lexical activation of the target than typical listeners (Figure 2, bottom row). In 226
contrast, for listeners with underspecified representations, mismatching coarticulation would 227
give rise to similar phonological and lexical activations as clear speech, since more overlap 228
between phonological categories results in more diffusive and less selective activation. For 229
SUBPHONEMIC SENSITIVITY AND PHONOLOGICAL SKILLS
16
example, a vowel containing mismatching coarticulatory cues of /p/ would still activate /t/ 230
strongly, consequently leading to similar activation as induced by consistent coarticulation cues 231
of /t/ (Figure 2, middle left). Overspecification, however, predicts that mismatching 232
coarticulation would activate more partially matching phonological categories than a typical 233
listener would have, causing more disruption from mismatching cues than a typical listen would 234
have. For example, a vowel containing mismatching coarticulatory cues of /p/ would activate at 235
least two allophones ([ph] and [p]), as opposed to one phoneme (/p/), which would compete with 236
phonological categories consistent with /t/ more than for a typical listener, resulting in an 237
enhanced phonological mismatch effect (Figure 2, middle right). Therefore, while both under- 238
and overspecified phonological representations may lead to more suppressed phonological and 239
lexical activations overall given clear speech, differences in underlying phonological categories 240
may be revealed by real-time, fine-grained measures that reflect lexical activation as a function 241
of mismatching coarticulatory information. 242
A community sample for investigating individual differences
Although the hypotheses under scrutiny here have been largely motivated by studies of 243
individuals with RD, we believe that it is worthwhile to expand the investigation to a wider 244
population. Our motivation for an individual differences approach is the premise that 245
phonological processing skills modulate the outcome of reading acquisition continuously across 246
the full range of reading ability. For instance, in Scarborough’s (1989) study, preschoolers’ 247
phonological awareness, measured and analyzed as a continuous variable, uniquely explained the 248
wide variation in reading outcomes at second grade, ranging from reading disabled, to low-249
achieving, to normal. Also, functional neuroimaging research shows that the amount of overlap 250
between the neural substrates of speech processing and print processing varies continuously with 251
SUBPHONEMIC SENSITIVITY AND PHONOLOGICAL SKILLS
17
reading skill (Frost et al., 2009; Preston et al., 2016; Shankweiler et al., 2008), implying that 252
better readers tend to engage more phonological processing in reading and supporting the idea 253
that phonological ability may be an important locus on which individuals with different levels of 254
reading competence vary. 255
While the modal approach to studying reading abilities is to divide participants into 256
dichotomous groups (e.g., typical readers vs. RD individuals), it is clear that language abilities 257
are continuously distributed in the population, as are the consequences of those language 258
differences for the acquisition of reading skill (Frost, 1998; Snowling, Gallagher, & Frith, 2003; 259
Snowling & Hayiou-Thomas, 2006; Stanovich, 1988). Indeed, studies comparing dichotomous 260
and continuous analytic approaches find better statistical fit when treating language ability as a 261
continuous predictor (e.g., McMurray, Munson, & Tomblin, 2014). Further, there is little 262
evidence of discontinuity between the phonological skills scores of those with and without RD 263
(O’Brien, McCloy, Kubota, & Yeatman, 2018; Ramus et al., 2013; Scarborough, 1989). It is just 264
that those whose skills lie in the extreme tail of the distribution may, as a consequence, have 265
noticeable difficulty with phonologically demanding tasks, like learning to read. However, such 266
difficulty may be modulated by exacerbating or protective factors (Catts, McIlraith, Bridges, & 267
Nielsen, 2017; Snowling, 2008). 268
For practical purposes, threshold scores on standard skill measures are sometimes used to 269
assist with decisions about assignment of learners to enrichment or intervention programs. This 270
should not be taken to mean that the underlying causes of variation in reading skill in such 271
readers are qualitatively different from the drivers of variation in more typical learners. Rather, 272
those who have greater difficulty in mastering the written word are simply less capable, than are 273
typical readers, in some of the abilities that determine reading skill (Goswami & Bryant, 1989). 274
SUBPHONEMIC SENSITIVITY AND PHONOLOGICAL SKILLS
18
This is a quantitative statement about differences in the achievement of reading skill across the 275
full range of ability, including those with extremely low skill. Moreover, it is important to 276
recognize that both outcome skill measures (e.g., accuracy, reaction time) and online processing 277
measures (e.g., eye tracking) are continuously distributed. Our goal in this paper is to illuminate 278
connections between differences in online speech processing and differences on standardized 279
skill measures across the range of ability. 280
The current study
We seek new insight into the nature of phonological differences associated with reading 281
abilities through two innovations. First, we augment conventional standardized assessments of 282
linguistic and cognitive abilities with an experimental paradigm aimed at tracking the time 283
course of spoken word recognition at a subphonemic grain, with the potential to distinguish 284
overspecification from underspecification. Second, we employ a community-based sample with 285
greater variability in linguistic and cognitive abilities, as well as demographics, than typical 286
psycholinguistic samples, potentially providing a more representative picture of reading-related 287
ability in the population and enhancing statistical power for investigating individual differences 288
(cf. Braze et al., 2016, 2007; Johns et al., 2018; Johns, Matsuki, & Van Dyke, 2015; Kukona et 289
al., 2016; Van Dyke, Johns, & Kukona, 2014). By comparing individuals’ online speech 290
processing to outcome measures of phonological skills more typically used in reading research, 291
we aim to probe the relationship between phonological representations and phonological skills 292
(see Ramus et al., 2013). Thus, we provide new leverage for addressing the under- vs. 293
overspecification debate about the phonological performance deficits implicated in poor reading 294
achievement by investigating the following research questions. Does sensitivity to subphonemic 295
information differ as a function of those phonological skills implicated in reading abilities? If so, 296
SUBPHONEMIC SENSITIVITY AND PHONOLOGICAL SKILLS
19
does sensitivity to subphonemic information decrease or increase as phonological skills decrease, 297
indicating underspecified or overspecified phonological representations, respectively? 298
Predictions
Prediction 1: We expected to replicate the well-established finding that performance on 299
standardized measures for meta-phonological skills (e.g., phonological awareness and 300
phonological memory) is highly correlated with performance on other reading-related skills (e.g., 301
decoding and reading comprehension). Testing this correlation will provide a useful empirical 302
contribution, addressing whether the association between phonological skills and reading ability 303
persists in adulthood (one of many aspects of language that have been studied extensively with 304
children but rarely with adults; but see Bruck, 1992 and Katz et al., 2012). 305
Prediction 2: We predicted that individuals’ phonological skills would also be correlated 306
with the size of the lexical competition effect (i.e., difference between N3W1 and W2W1) 307
observed in the eye tracking data. We assume that the quality of individuals’ lexical 308
representations (Perfetti, 2007) would vary with their phonological skills, such that individuals 309
with lower phonological skills would have lower quality lexical representations due to reading 310
deficiency. Furthermore, higher quality of lexical representations may lead to stronger 311
competition among related lexical items. Indeed, it has been shown that individuals with slower 312
access to lexical information show less interference between lexical competitors (Kukona et al., 313
2016). Thus, we predicted that individuals with lower phonological skills would have a weaker 314
lexical competition effect. Note that this prediction cannot distinguish between the two 315
alternative accounts under investigation in the current study, since both under- and overspecified 316
phonological representations should cause poor lexical representations because of suboptimal 317
mappings between spoken categories and graphemes. Therefore, it is crucial to probe the factor 318
SUBPHONEMIC SENSITIVITY AND PHONOLOGICAL SKILLS
20
that could be decisive—individual differences in subphonemic sensitivity—with the 319
phonological mismatch effect. 320
Prediction 3: Most importantly, we predicted that fine-grained subphonemic sensitivity 321
as indexed by the phonological mismatch effect in the eye tracking task would correlate highly 322
with phonological skills; the mismatch effect is operationalized as the difference between 323
perception of clear speech (W1W1) and perception of speech with misleading, but not lexically 324
biased, coarticulation information (N3W1). A high absolute correlation between an individual’s 325
phonological skills and phonological mismatch effect could follow from one of two bases. If 326
lower phonological skills stem from having underspecified phonological representations (i.e., 327
low sensitivity to subphonemic details), the phonological mismatch effect should be smaller for 328
lower-skilled individuals than for higher-skilled individuals, leading to a positive correlation 329
between phonological skills and the phonological mismatch effect (Prediction 3a). Conversely, 330
if lower phonological skills originate from overspecified phonological representations (i.e., high 331
sensitivity to subphonemic information), the phonological mismatch effect should be greater for 332
lower-skilled individuals than for higher-skilled individuals, leading to a negative correlation 333
between phonological skills and the phonological mismatch effect (Prediction 3b). 334
Methods
Participants
We recruited 64 college-aged native speakers of English (ages from 16.9 to 24.8 years, M 335
= 20.9, SD = 2.1; years of education from 8 to 16, M = 11.7, SD = 1.5) from community colleges, 336
General Education Development (GED) programs, and from the community at large in the New 337
Haven area. The participants for this study were a subset of those participating in a larger study 338
SUBPHONEMIC SENSITIVITY AND PHONOLOGICAL SKILLS
21
that investigated neural and behavioral individual differences in language, reading, and learning 339
in young adults (see Braze et al., 2016; Kukona et al., 2016). The sample included individuals 340
with wide ranges of cognitive and reading abilities, and none reported having been diagnosed 341
with reading or learning disabilities. The participants gave informed consent and received 342
financial compensation for their participation ($20 / hour). All protocols were approved by the 343
Yale University Human Investigation Committee. Three participants were excluded from 344
analyses, one for each of the following reasons: (1) eye tracking data corruption, (2) failing to 345
complete several of the tasks in our assessment battery, or (3) failing to complete a high 346
proportion of critical trials (7 out of 15) of the eye tracking task (see Procedure for details). Thus, 347
preliminary inclusion criteria left 61 participants; one additional participant was later excluded 348
due to their extreme score on one of the individual differences measures (see Individual 349
differences measures). 350
Materials
Subcategorical Mismatch Task. The auditory materials were those originally used by 351
Dahan et al. (2001) and consisted of 15 triplets of one target word (W1), one competitor word 352
(W2) and one nonword (N3). Items within each triplet shared the same onset, such as /nɛt/, /nɛk/ 353
and /nɛp/, respectively (for the full set of the 15 triplets, see Appendix A). Dahan et al. (2001) 354
created cross-spliced versions of W1 that all ended with the final consonant of W1, but began 355
with the onset and nucleus from either another recording of W1 (W1W1, consistent 356
coarticulation, e.g., /nɛt/ + /nɛt/ = /nɛtt/), or from a recording of W2 (W2W1, misleading 357
competitor coarticulation, e.g., /nɛk/ + /nɛt/ = /nɛkt/) or N3 (N3W1, misleading nonword 358
coarticulation, e.g., /nɛp/ + /nɛt/ = /nɛpt/). Each cross-spliced item sounds like W1, but items 359
cross-spliced with W2 or N3 have misleading coarticulation on the vowel. The visual materials 360
SUBPHONEMIC SENSITIVITY AND PHONOLOGICAL SKILLS
22
were similar to those used in Experiment 2 in Dahan et al. (2001), except that their black-and-361
white line drawings were replaced with color images. See Appendix B for the full list of visual 362
materials. 363
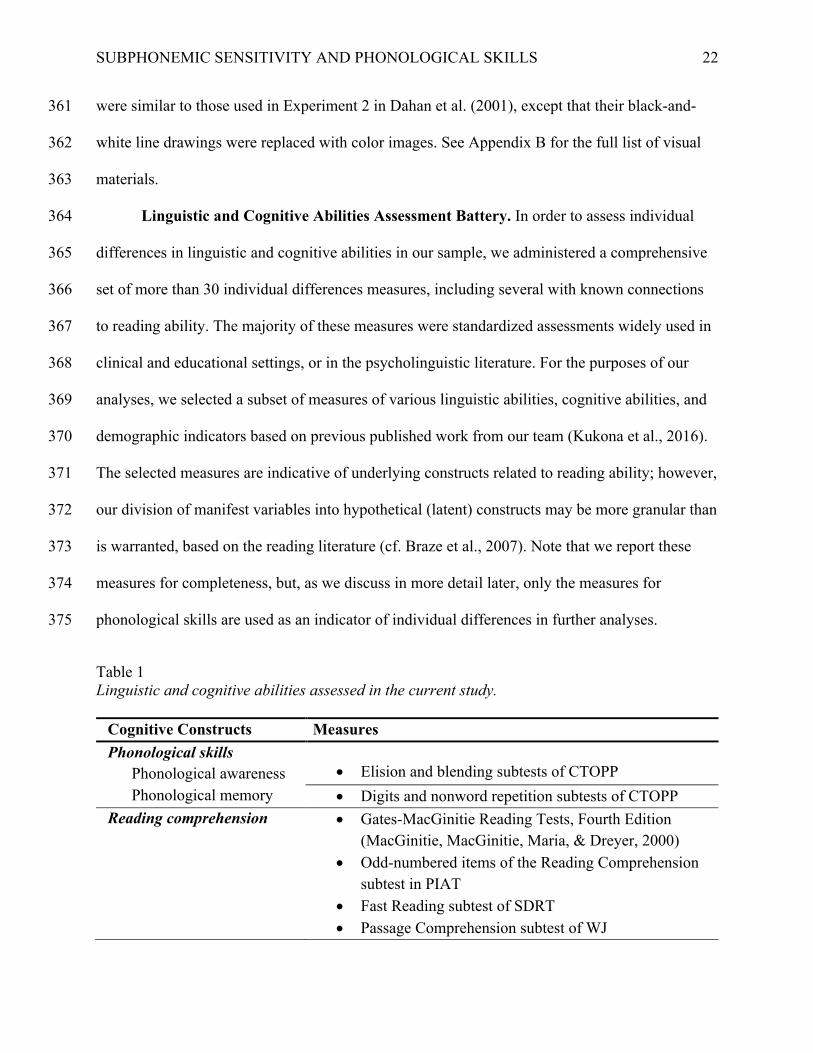
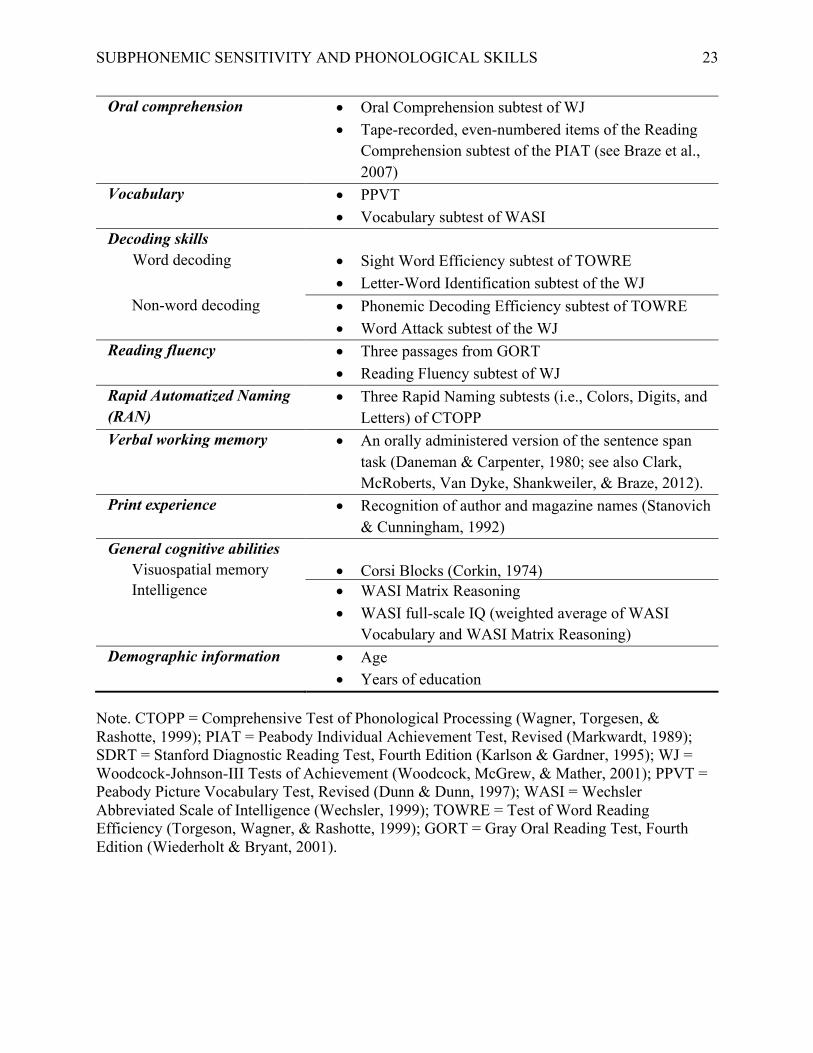
Linguistic and Cognitive Abilities Assessment Battery. In order to assess individual 364
differences in linguistic and cognitive abilities in our sample, we administered a comprehensive 365
set of more than 30 individual differences measures, including several with known connections 366
to reading ability. The majority of these measures were standardized assessments widely used in 367
clinical and educational settings, or in the psycholinguistic literature. For the purposes of our 368
analyses, we selected a subset of measures of various linguistic abilities, cognitive abilities, and 369
demographic indicators based on previous published work from our team (Kukona et al., 2016). 370
The selected measures are indicative of underlying constructs related to reading ability; however, 371
our division of manifest variables into hypothetical (latent) constructs may be more granular than 372
is warranted, based on the reading literature (cf. Braze et al., 2007). Note that we report these 373
measures for completeness, but, as we discuss in more detail later, only the measures for 374
phonological skills are used as an indicator of individual differences in further analyses.375
Table 1 Linguistic and cognitive abilities assessed in the current study.
Cognitive Constructs Measures Phonological skills
Phonological awareness
• Elision and blending subtests of CTOPP
Phonological memory • Digits and nonword repetition subtests of CTOPP Reading comprehension • Gates-MacGinitie Reading Tests, Fourth Edition
(MacGinitie, MacGinitie, Maria, & Dreyer, 2000) • Odd-numbered items of the Reading Comprehension
subtest in PIAT • Fast Reading subtest of SDRT • Passage Comprehension subtest of WJ
SUBPHONEMIC SENSITIVITY AND PHONOLOGICAL SKILLS
23
Oral comprehension • Oral Comprehension subtest of WJ • Tape-recorded, even-numbered items of the Reading
Comprehension subtest of the PIAT (see Braze et al., 2007)
Vocabulary • PPVT • Vocabulary subtest of WASI
Decoding skills Word decoding • Sight Word Efficiency subtest of TOWRE
• Letter-Word Identification subtest of the WJ Non-word decoding • Phonemic Decoding Efficiency subtest of TOWRE
• Word Attack subtest of the WJ Reading fluency • Three passages from GORT
• Reading Fluency subtest of WJ Rapid Automatized Naming (RAN)
• Three Rapid Naming subtests (i.e., Colors, Digits, and Letters) of CTOPP
Verbal working memory • An orally administered version of the sentence span task (Daneman & Carpenter, 1980; see also Clark, McRoberts, Van Dyke, Shankweiler, & Braze, 2012).
Print experience • Recognition of author and magazine names (Stanovich & Cunningham, 1992)
General cognitive abilities Visuospatial memory • Corsi Blocks (Corkin, 1974) Intelligence • WASI Matrix Reasoning
• WASI full-scale IQ (weighted average of WASI Vocabulary and WASI Matrix Reasoning)
Demographic information • Age • Years of education
Note. CTOPP = Comprehensive Test of Phonological Processing (Wagner, Torgesen, & Rashotte, 1999); PIAT = Peabody Individual Achievement Test, Revised (Markwardt, 1989); SDRT = Stanford Diagnostic Reading Test, Fourth Edition (Karlson & Gardner, 1995); WJ = Woodcock-Johnson-III Tests of Achievement (Woodcock, McGrew, & Mather, 2001); PPVT = Peabody Picture Vocabulary Test, Revised (Dunn & Dunn, 1997); WASI = Wechsler Abbreviated Scale of Intelligence (Wechsler, 1999); TOWRE = Test of Word Reading Efficiency (Torgeson, Wagner, & Rashotte, 1999); GORT = Gray Oral Reading Test, Fourth Edition (Wiederholt & Bryant, 2001).
SUBPHONEMIC SENSITIVITY AND PHONOLOGICAL SKILLS
24
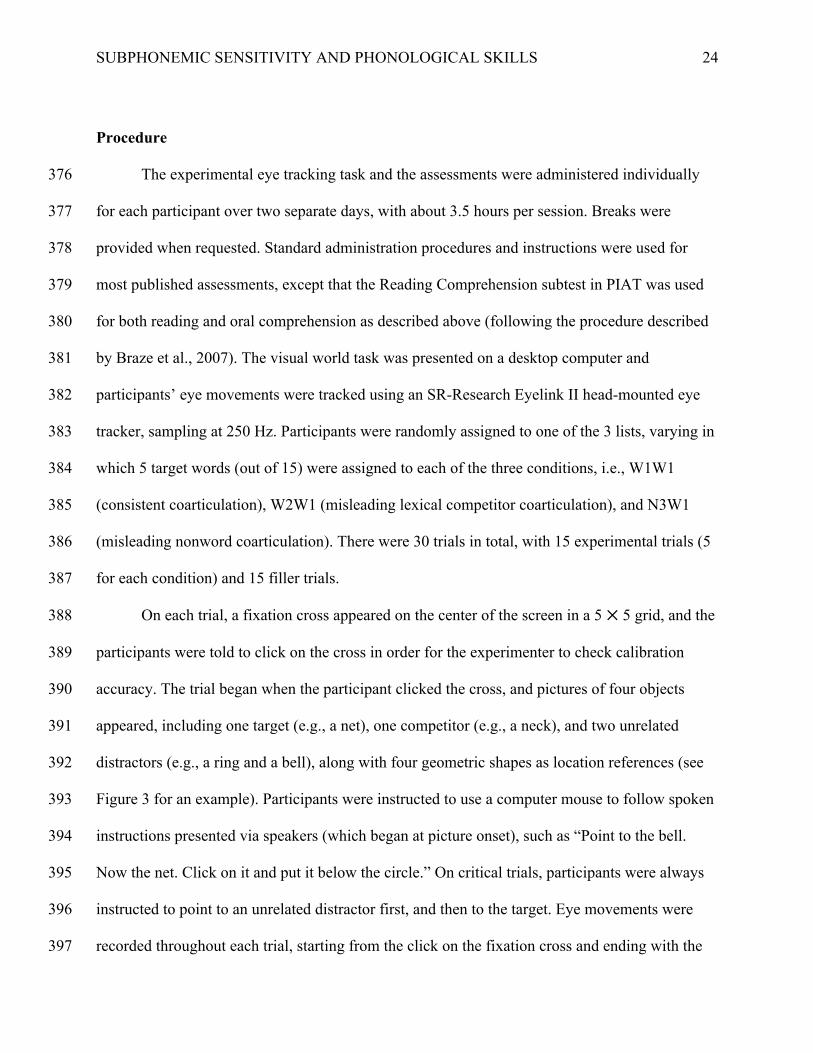
Procedure
The experimental eye tracking task and the assessments were administered individually 376
for each participant over two separate days, with about 3.5 hours per session. Breaks were 377
provided when requested. Standard administration procedures and instructions were used for 378
most published assessments, except that the Reading Comprehension subtest in PIAT was used 379
for both reading and oral comprehension as described above (following the procedure described 380
by Braze et al., 2007). The visual world task was presented on a desktop computer and 381
participants’ eye movements were tracked using an SR-Research Eyelink II head-mounted eye 382
tracker, sampling at 250 Hz. Participants were randomly assigned to one of the 3 lists, varying in 383
which 5 target words (out of 15) were assigned to each of the three conditions, i.e., W1W1 384
(consistent coarticulation), W2W1 (misleading lexical competitor coarticulation), and N3W1 385
(misleading nonword coarticulation). There were 30 trials in total, with 15 experimental trials (5 386
for each condition) and 15 filler trials. 387
On each trial, a fixation cross appeared on the center of the screen in a 5 ⨉ 5 grid, and the 388
participants were told to click on the cross in order for the experimenter to check calibration 389
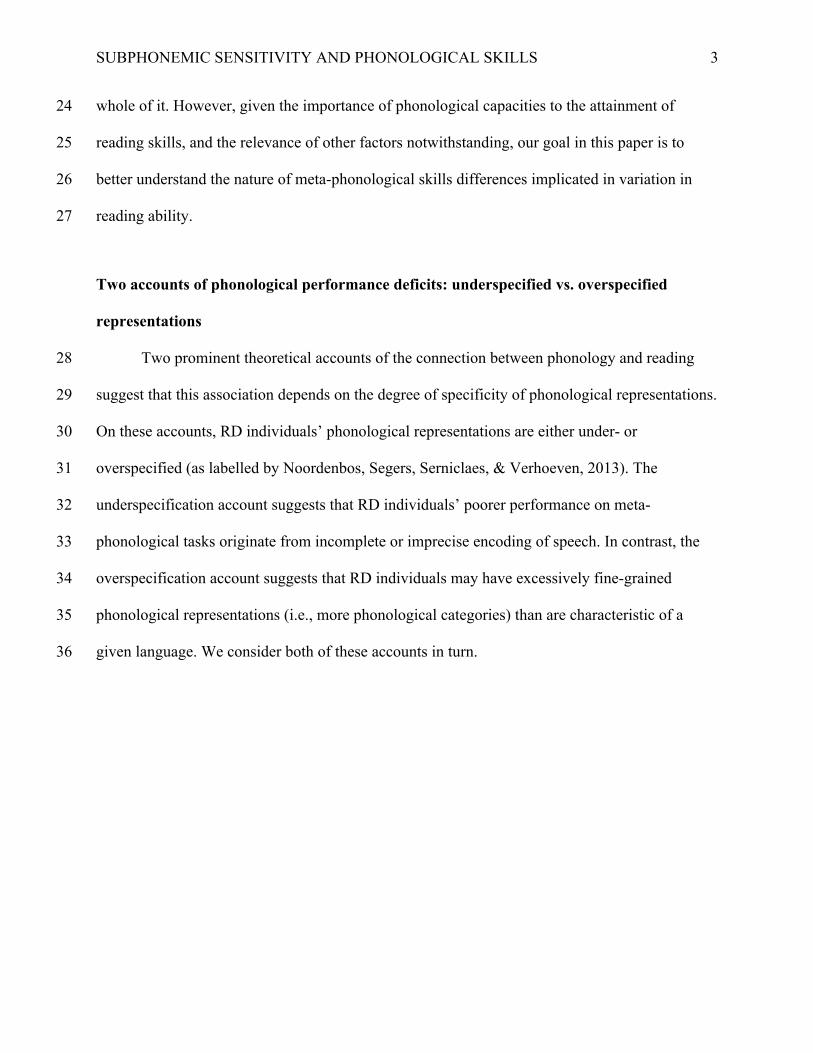
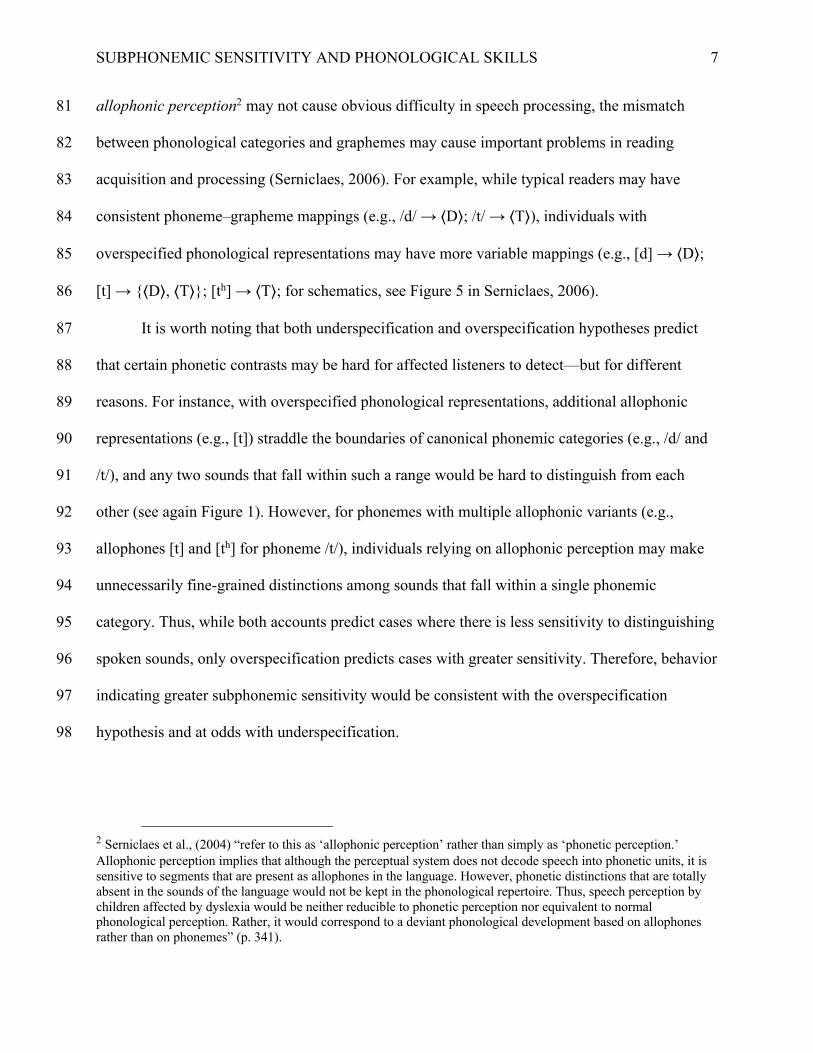
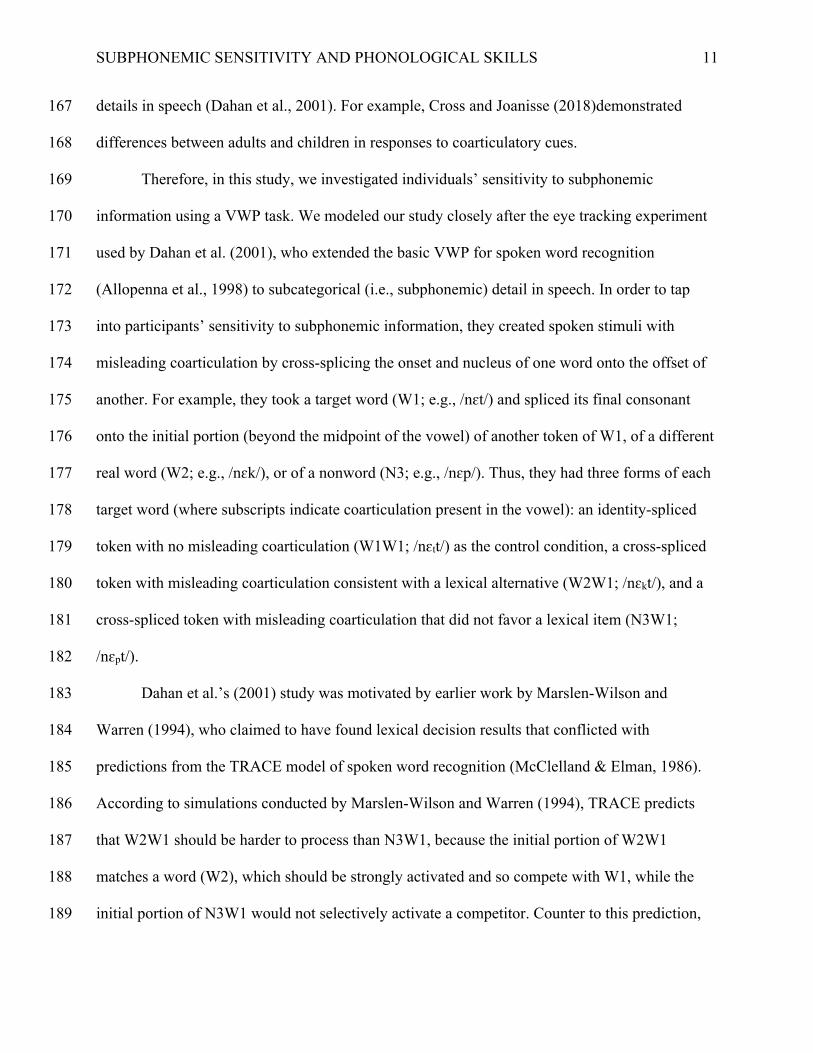
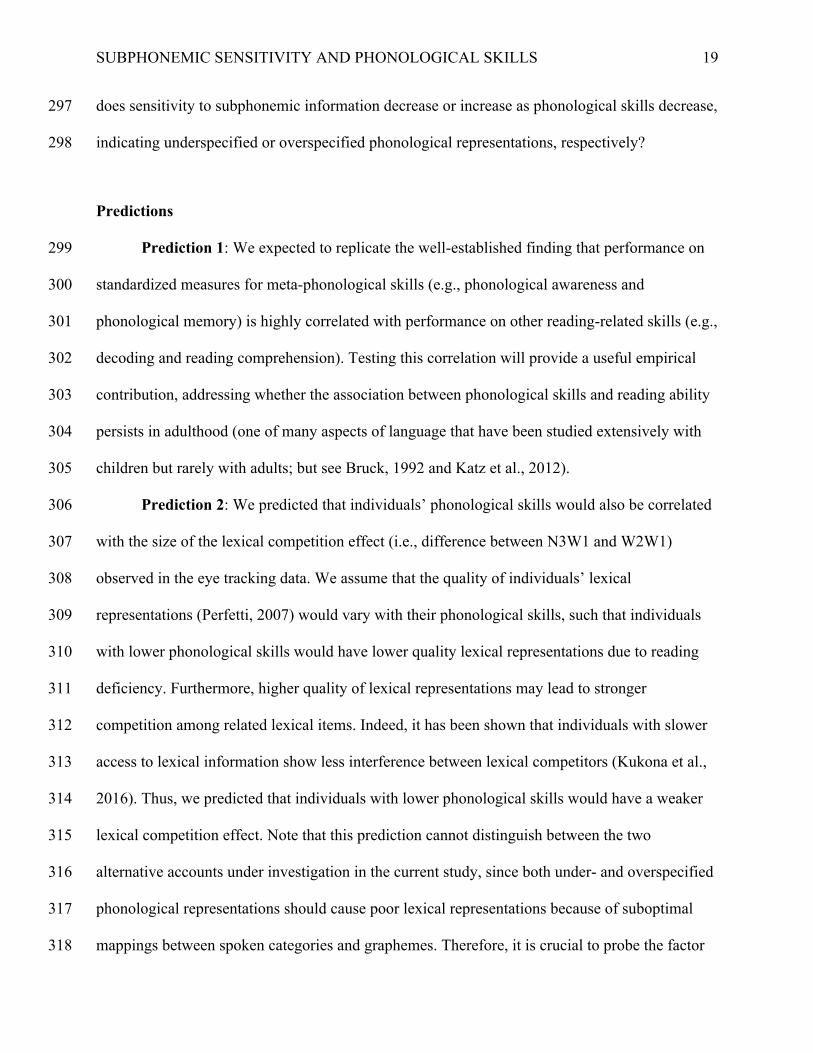
accuracy. The trial began when the participant clicked the cross, and pictures of four objects 390
appeared, including one target (e.g., a net), one competitor (e.g., a neck), and two unrelated 391
distractors (e.g., a ring and a bell), along with four geometric shapes as location references (see 392
Figure 3 for an example). Participants were instructed to use a computer mouse to follow spoken 393
instructions presented via speakers (which began at picture onset), such as “Point to the bell. 394
Now the net. Click on it and put it below the circle.” On critical trials, participants were always 395
instructed to point to an unrelated distractor first, and then to the target. Eye movements were 396
recorded throughout each trial, starting from the click on the fixation cross and ending with the 397
SUBPHONEMIC SENSITIVITY AND PHONOLOGICAL SKILLS
25
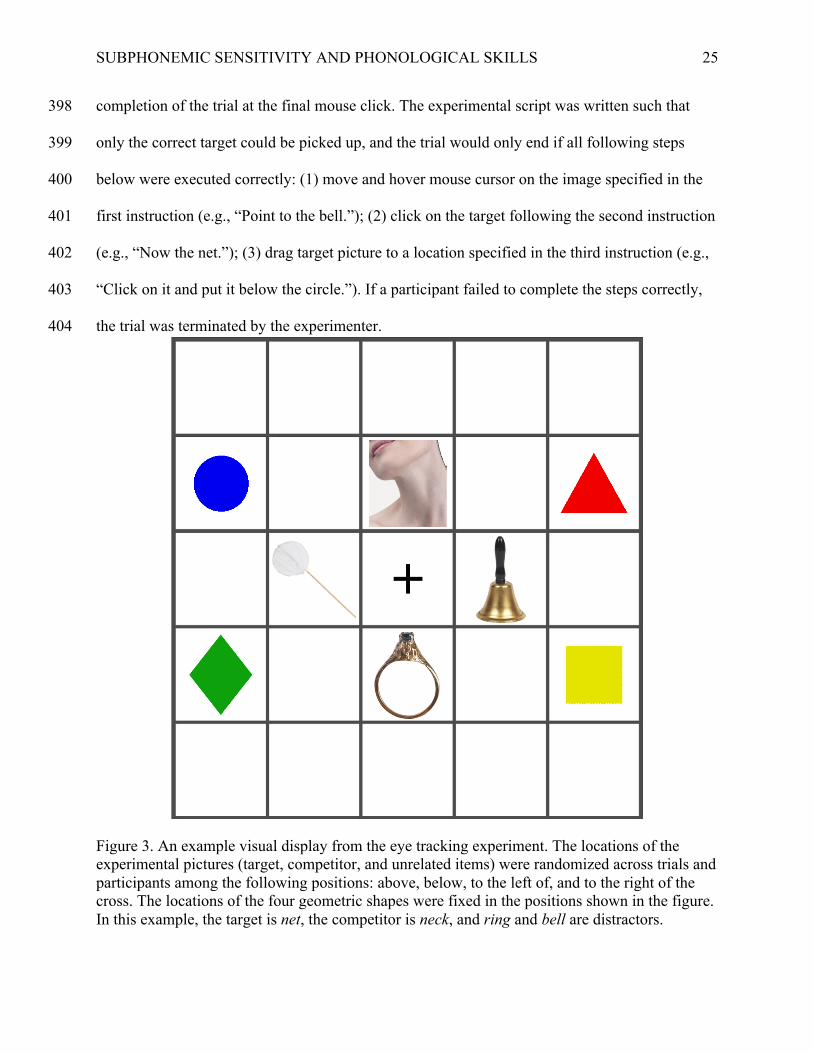
completion of the trial at the final mouse click. The experimental script was written such that 398
only the correct target could be picked up, and the trial would only end if all following steps 399
below were executed correctly: (1) move and hover mouse cursor on the image specified in the 400
first instruction (e.g., “Point to the bell.”); (2) click on the target following the second instruction 401
(e.g., “Now the net.”); (3) drag target picture to a location specified in the third instruction (e.g., 402
“Click on it and put it below the circle.”). If a participant failed to complete the steps correctly, 403
the trial was terminated by the experimenter.404
Figure 3. An example visual display from the eye tracking experiment. The locations of the experimental pictures (target, competitor, and unrelated items) were randomized across trials and participants among the following positions: above, below, to the left of, and to the right of the cross. The locations of the four geometric shapes were fixed in the positions shown in the figure. In this example, the target is net, the competitor is neck, and ring and bell are distractors.
SUBPHONEMIC SENSITIVITY AND PHONOLOGICAL SKILLS
26
Results
All statistical analyses were conducted using packages in the R statistical environment 405
version 3.5.0 (R Core Team, 2018). “Packages” refer to special-purpose modules within R that 406
provide specific analyses. 407
Individual differences measures
Three assessment data points were missing (from different participants for three different 408
tasks: the two Reading Fluency measures and the SDRT Reading Comprehension measure). 409
These values were replaced using multiple imputation applied to the dataset using the mice 410
package (version 2.46.0; van Buuren & Groothuis-Oudshoorn, 2011) before further analysis. For 411
most measures, higher scores indicated better performance. Exceptions are the three sub-tests of 412
CTOPP Rapid Automatized Naming (Colors, Digits, and Letters), where higher scores indicated 413
poorer performance. The raw scores of the CTOPP Rapid Automatized Naming measures were 414
transformed by subtracting participants’ scores from the maximum observed score of the 415
corresponding measure, so that for all measures, a higher score indicates better performance. 416
We observed skewness in most of the raw-score distributions based on quantile-quantile 417
(Q-Q) plots, which compared the score distribution of each assessment against a theoretical 418
normal distribution (car::qqPlot, version 2.1-5; Fox & Weisberg, 2011). Box-Cox power 419
transformations were applied to all assessment scores to normalize the distributions before 420
further analysis to alleviate violations of the normality assumption (Box & Cox, 1964): raw 421
scores of each assessment were raised to the power of an optimal lambda value, ranging from -2 422
to 2 in steps of 0.1 (MASS::boxcox, version 7.3-47; Venables & Ripley, 2002), that 423
transformed a given score distribution into a normal one (car::bcpower, version 2.1-5; Fox 424
SUBPHONEMIC SENSITIVITY AND PHONOLOGICAL SKILLS
27
& Weisberg, 2011). To account for variance heterogeneity across measures, Box-Cox 425
transformed scores were further standardized to z-scores (i.e., centered and scaled), allowing 426
direct comparisons across assessments. We examined potentially influential data points by 427
visually inspecting the Q-Q plot of each transformed measure and by evaluating three influence 428
estimates of each data point: Studentized residual, hat value, and Cook’s distance 429
(car::influencePlot, version 2.1-5; Fox & Weisberg, 2011). One participant was 430
removed from all further analyses due to their extreme score on the TOWRE Word Naming task 431
(outside of the 95% confidence interval of the Q-Q plot; Studentized residual = -10.04; Hat value 432
= 0.11; Cook’s distance = 2.38). After this participant was removed, we re-calculated optimal 433
lambda values and re-applied Box-Cox transformation and standardization to the raw scores for 434
the remaining participants. Visual inspection of the distributions suggested no more overly 435
influential data points falling outside of the 95% confidence interval of the Q-Q plots. Thus, data 436
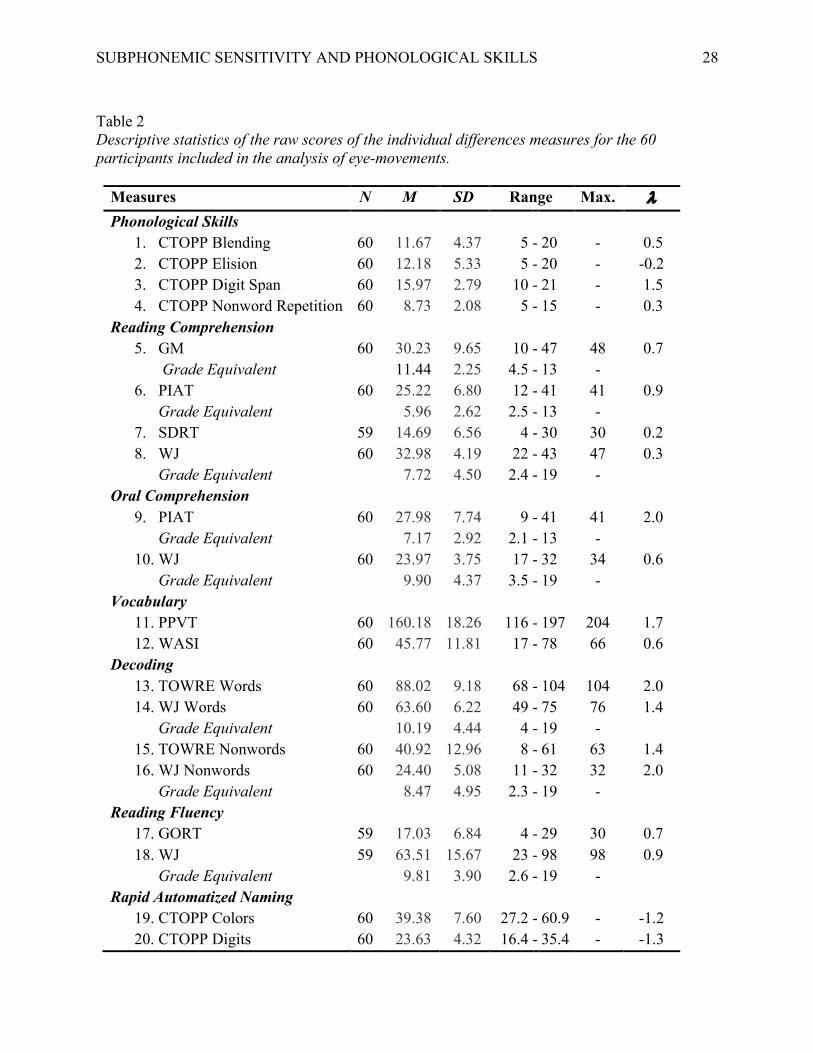
from 60 participants was retained for further analyses. The descriptive statistics of each measure 437
and specific lambdas applied to the raw scores are listed in Table 2, excluding the removed 438
subject and imputed values. Wide ranges of assessment scores across the board indicated high 439
heterogeneity in the current sample, suitable for use in an individual differences analysis. Simple 440
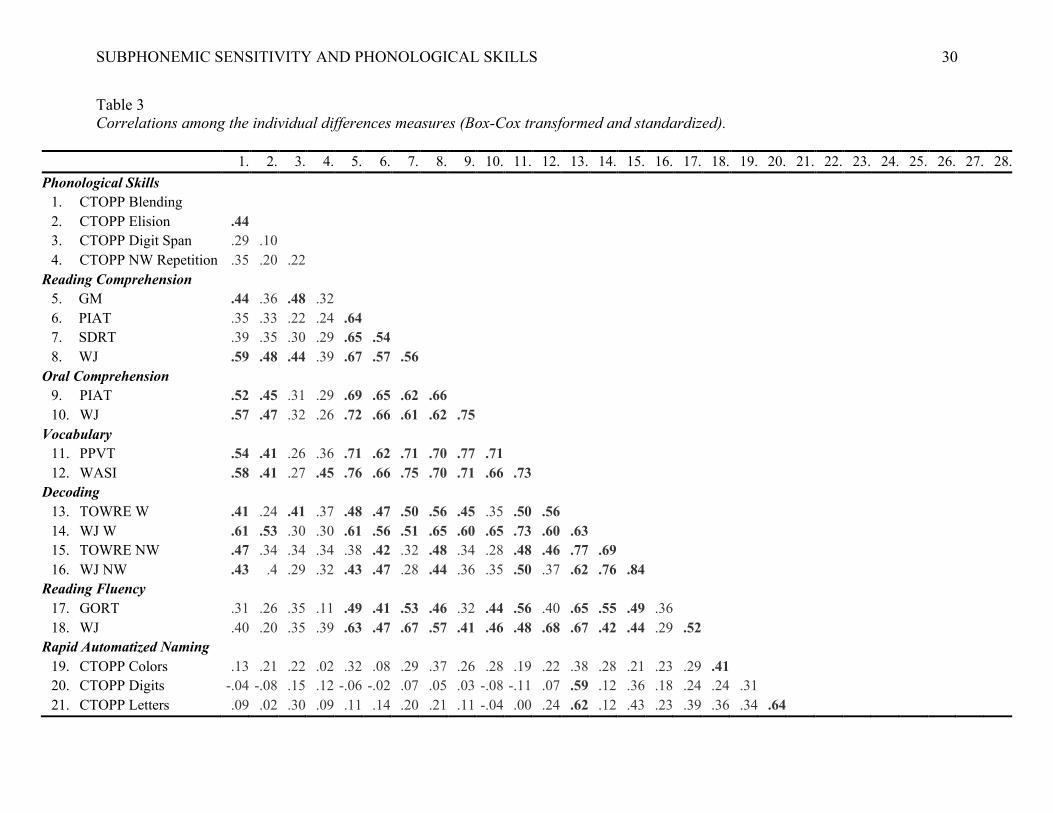
correlations among the individual differences measures, Box-Cox transformed and standardized, 441
are shown in Table 3.442
SUBPHONEMIC SENSITIVITY AND PHONOLOGICAL SKILLS
28
Table 2 Descriptive statistics of the raw scores of the individual differences measures for the 60 participants included in the analysis of eye-movements.
Measures N M SD Range Max. l Phonological Skills
1. CTOPP Blending 60 11.67 4.37 5 - 20 - 0.5 2. CTOPP Elision 60 12.18 5.33 5 - 20 - -0.2 3. CTOPP Digit Span 60 15.97 2.79 10 - 21 - 1.5 4. CTOPP Nonword Repetition 60 8.73 2.08 5 - 15 - 0.3
Reading Comprehension 5. GM
Grade Equivalent 60 30.23
11.44 9.65 2.25
10 4.5
- -
47 13
48 -
0.7
6. PIAT Grade Equivalent
60
25.22 5.96
6.80 2.62
12 2.5
- -
41 13
41 -
0.9
7. SDRT 59 14.69 6.56 4 - 30 30 0.2 8. WJ
Grade Equivalent 60 32.98
7.72 4.19 4.50
22 2.4
- -
43 19
47 -
0.3
Oral Comprehension 9. PIAT
Grade Equivalent 60 27.98
7.17 7.74 2.92
9 2.1
- -
41 13
41 -
2.0
10. WJ Grade Equivalent
60 23.97 9.90
3.75 4.37
17 3.5
- -
32 19
34 -
0.6
Vocabulary 11. PPVT 60 160.18 18.26 116 - 197 204 1.7 12. WASI 60 45.77 11.81 17 - 78 66 0.6
Decoding 13. TOWRE Words 60 88.02 9.18 68 - 104 104 2.0 14. WJ Words
Grade Equivalent 60 63.60
10.19 6.22 4.44
49 4
- -
75 19
76 -
1.4
15. TOWRE Nonwords 60 40.92 12.96 8 - 61 63 1.4 16. WJ Nonwords
Grade Equivalent 60 24.40
8.47 5.08 4.95
11 2.3
- -
32 19
32 -
2.0
Reading Fluency 17. GORT 59 17.03 6.84 4 - 29 30 0.7 18. WJ
Grade Equivalent 59 63.51
9.81 15.67 3.90
23 2.6
- -
98 19
98 -
0.9
Rapid Automatized Naming 19. CTOPP Colors 60 39.38 7.60 27.2 - 60.9 - -1.2 20. CTOPP Digits 60 23.63 4.32 16.4 - 35.4 - -1.3
SUBPHONEMIC SENSITIVITY AND PHONOLOGICAL SKILLS
29
21. CTOPP Letters 60 24.98 4.35 18 - 37.4 - -0.9 Verbal Working Memory
22. Sentence Span 59 36.73 9.98 16 - 60 - 1.0 Print Experience
23. Authors 60 3.37 3.80 0 - 18 40 -0.7 24. Magazines 60 5.58 4.54 0 - 17 40 -0.2
General Cognitive Abilities 25. WASI Matrix 60 25.10 5.31 7 - 35 35 2.0 26. Corsi Blocks VM 60 4.81 1.10 2.2 - 7.2 9 1.0 27. WASI Full-Scale IQ 60 90.40 17.05 55 - 138 - 0.1
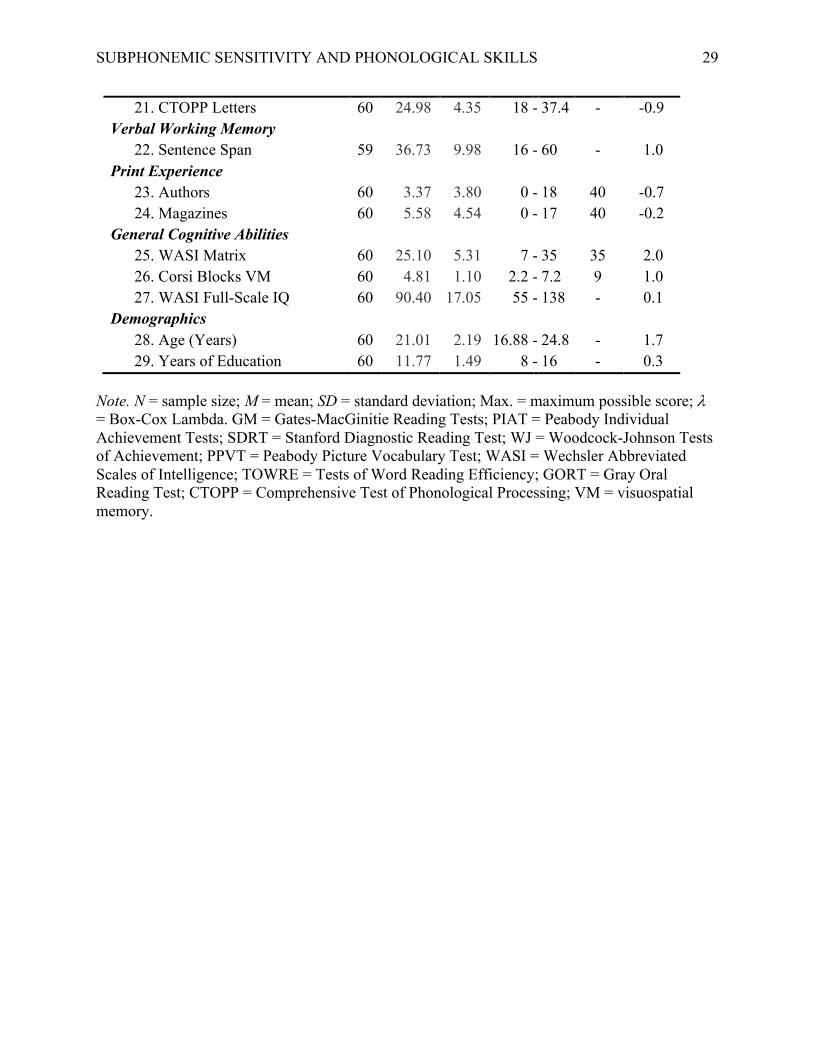
Demographics 28. Age (Years) 60 21.01 2.19 16.88 - 24.8 - 1.7 29. Years of Education 60 11.77 1.49 8 - 16 - 0.3
Note. N = sample size; M = mean; SD = standard deviation; Max. = maximum possible score; l = Box-Cox Lambda. GM = Gates-MacGinitie Reading Tests; PIAT = Peabody Individual Achievement Tests; SDRT = Stanford Diagnostic Reading Test; WJ = Woodcock-Johnson Tests of Achievement; PPVT = Peabody Picture Vocabulary Test; WASI = Wechsler Abbreviated Scales of Intelligence; TOWRE = Tests of Word Reading Efficiency; GORT = Gray Oral Reading Test; CTOPP = Comprehensive Test of Phonological Processing; VM = visuospatial memory.
SUBPHONEMIC SENSITIVITY AND PHONOLOGICAL SKILLS
30
Table 3 Correlations among the individual differences measures (Box-Cox transformed and standardized).
1. 2. 3. 4. 5. 6. 7. 8. 9. 10. 11. 12. 13. 14. 15. 16. 17. 18. 19. 20. 21. 22. 23. 24. 25. 26. 27. 28.
Phonological Skills
1. CTOPP Blending
2. CTOPP Elision .44
3. CTOPP Digit Span .29 .10
4. CTOPP NW Repetition .35 .20 .22
Reading Comprehension
5. GM .44 .36 .48 .32
6. PIAT .35 .33 .22 .24 .64
7. SDRT .39 .35 .30 .29 .65 .54
8. WJ .59 .48 .44 .39 .67 .57 .56
Oral Comprehension
9. PIAT .52 .45 .31 .29 .69 .65 .62 .66
10. WJ .57 .47 .32 .26 .72 .66 .61 .62 .75
Vocabulary
11. PPVT .54 .41 .26 .36 .71 .62 .71 .70 .77 .71
12. WASI .58 .41 .27 .45 .76 .66 .75 .70 .71 .66 .73
Decoding
13. TOWRE W .41 .24 .41 .37 .48 .47 .50 .56 .45 .35 .50 .56
14. WJ W .61 .53 .30 .30 .61 .56 .51 .65 .60 .65 .73 .60 .63
15. TOWRE NW .47 .34 .34 .34 .38 .42 .32 .48 .34 .28 .48 .46 .77 .69
16. WJ NW .43 .4 .29 .32 .43 .47 .28 .44 .36 .35 .50 .37 .62 .76 .84
Reading Fluency
17. GORT .31 .26 .35 .11 .49 .41 .53 .46 .32 .44 .56 .40 .65 .55 .49 .36
18. WJ .40 .20 .35 .39 .63 .47 .67 .57 .41 .46 .48 .68 .67 .42 .44 .29 .52
Rapid Automatized Naming
19. CTOPP Colors .13 .21 .22 .02 .32 .08 .29 .37 .26 .28 .19 .22 .38 .28 .21 .23 .29 .41
20. CTOPP Digits -.04 -.08 .15 .12 -.06 -.02 .07 .05 .03 -.08 -.11 .07 .59 .12 .36 .18 .24 .24 .31
21. CTOPP Letters .09 .02 .30 .09 .11 .14 .20 .21 .11 -.04 .00 .24 .62 .12 .43 .23 .39 .36 .34 .64
SUBPHONEMIC SENSITIVITY AND PHONOLOGICAL SKILLS
31
Verbal Working Memory
22. Sentence Span .38 .38 .18 .37 .48 .58 .46 .59 .46 .40 .49 .61 .50 .58 .54 .58 .27 .44 .31 .20 .13
Print Experience
23. Authors .44 .13 .40 .44 .64 .54 .53 .58 .47 .42 .58 .59 .61 .52 .51 .46 .47 .69 .25 .03 .16 .41
24. Magazines .31 .13 .27 .27 .46 .51 .37 .45 .43 .40 .46 .56 .40 .46 .38 .30 .30 .42 .03 .16 .09 .40 .54
General Cognitive Abilities
25. WASI Matrix .49 .54 .24 .32 .58 .54 .54 .56 .67 .65 .59 .54 .31 .51 .28 .33 .41 .38 .29 -.06 .15 .41 .28 .10
26. Corsi .40 .47 .22 .29 .47 .39 .38 .40 .43 .45 .45 .49 .41 .46 .40 .36 .34 .43 .50 .07 .18 .40 .34 .08 .54
27. Full-Scale IQ .49 .43 .19 .41 .67 .67 .70 .66 .72 .68 .72 .84 .53 .61 .45 .39 .51 .54 .26 .16 .28 .62 .41 .45 .77 .47
Demographics
28. Age .02 -.22 .27 -.16 .27 .17 .02 .12 .21 .15 .10 .05 .03 .05 .04 .16 .10 .16 .27 -.09 .02 .09 .19 .12 .07 .09 .04
29. Years of Education .16 .14 .25 .25 .30 .30 .39 .36 .21 .25 .34 .32 .21 .20 .25 .21 .34 .40 .06 .08 .08 .35 .26 .35 .17 .23 .30 .28
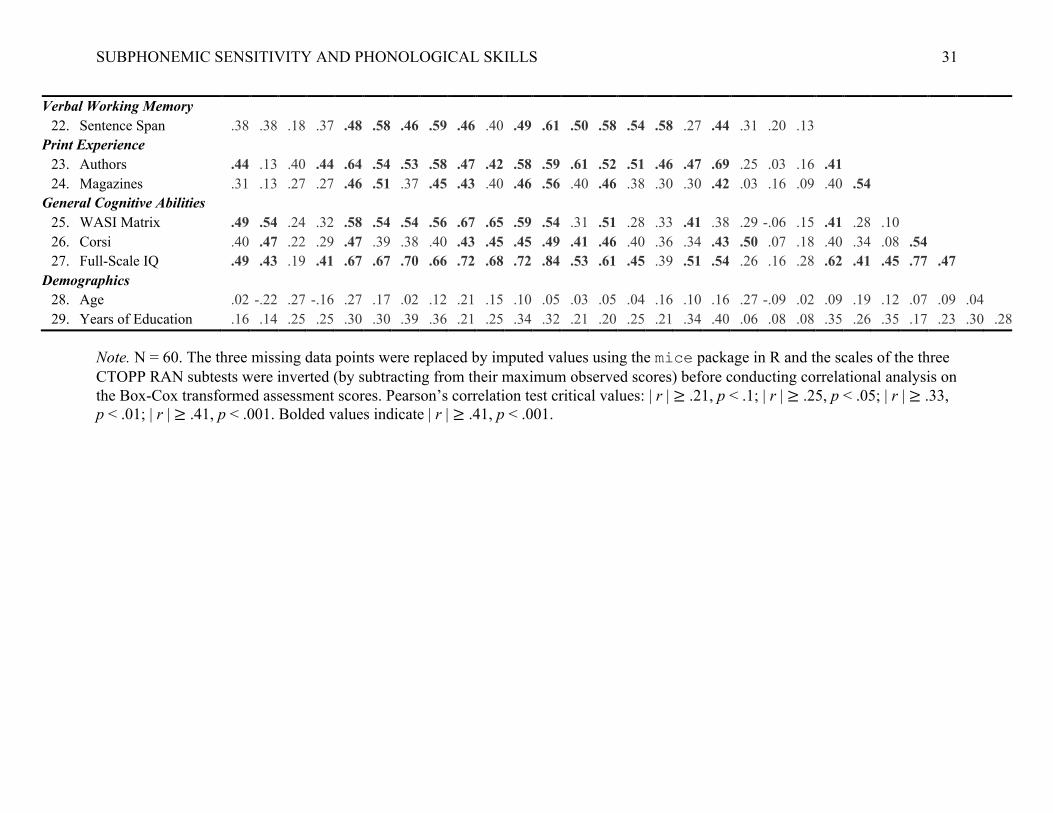
Note. N = 60. The three missing data points were replaced by imputed values using the mice package in R and the scales of the three
CTOPP RAN subtests were inverted (by subtracting from their maximum observed scores) before conducting correlational analysis on
the Box-Cox transformed assessment scores. Pearson’s correlation test critical values: | r | ≥ .21, p < .1; | r | ≥ .25, p < .05; | r | ≥ .33,
p < .01; | r | ≥ .41, p < .001. Bolded values indicate | r | ≥ .41, p < .001.
SUBPHONEMIC SENSITIVITY AND PHONOLOGICAL SKILLS
32
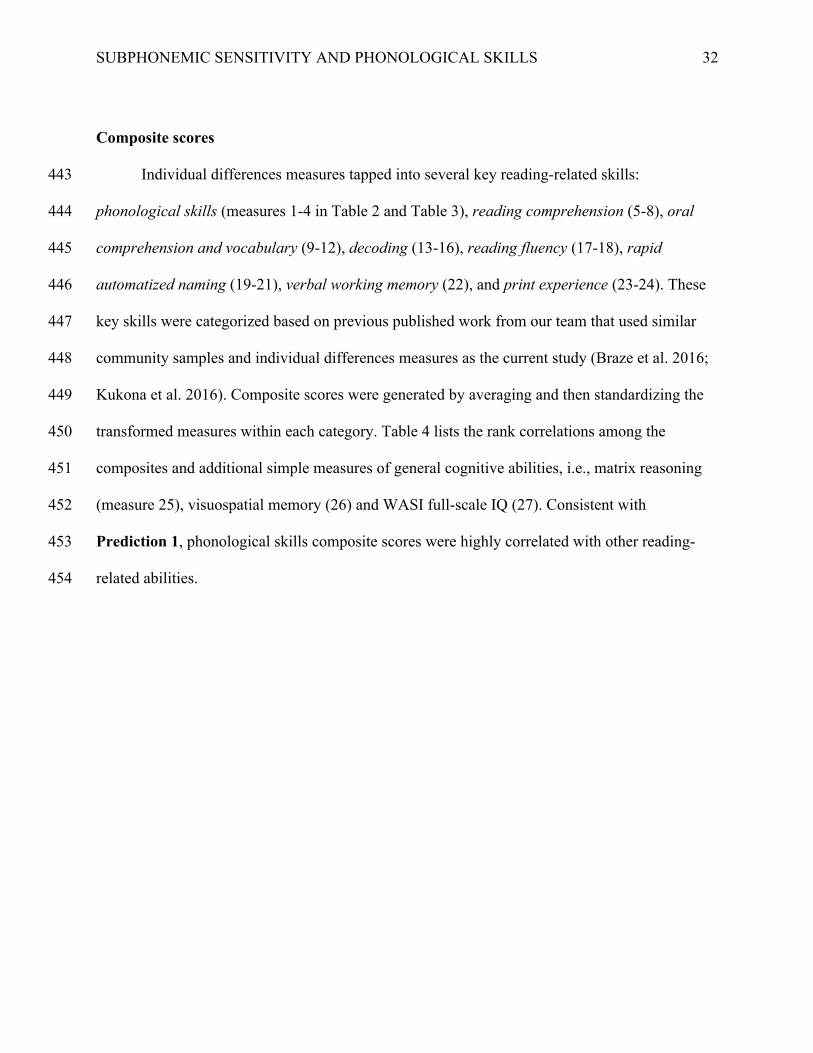
Composite scores
Individual differences measures tapped into several key reading-related skills: 443
phonological skills (measures 1-4 in Table 2 and Table 3), reading comprehension (5-8), oral 444
comprehension and vocabulary (9-12), decoding (13-16), reading fluency (17-18), rapid 445
automatized naming (19-21), verbal working memory (22), and print experience (23-24). These 446
key skills were categorized based on previous published work from our team that used similar 447
community samples and individual differences measures as the current study (Braze et al. 2016; 448
Kukona et al. 2016). Composite scores were generated by averaging and then standardizing the 449
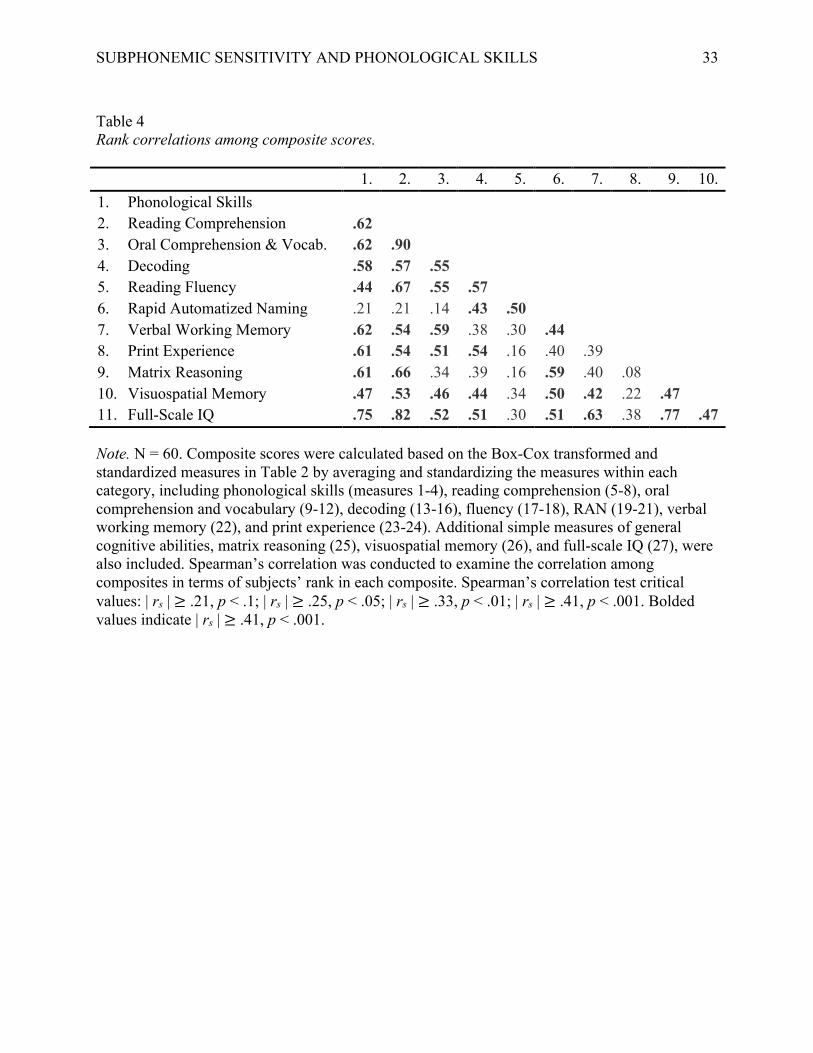
transformed measures within each category. Table 4 lists the rank correlations among the 450
composites and additional simple measures of general cognitive abilities, i.e., matrix reasoning 451
(measure 25), visuospatial memory (26) and WASI full-scale IQ (27). Consistent with 452
Prediction 1, phonological skills composite scores were highly correlated with other reading-453
related abilities.454
SUBPHONEMIC SENSITIVITY AND PHONOLOGICAL SKILLS
33
Table 4 Rank correlations among composite scores.
1. 2. 3. 4. 5. 6. 7. 8. 9. 10.
1. Phonological Skills 2. Reading Comprehension .62 3. Oral Comprehension & Vocab. .62 .90 4. Decoding .58 .57 .55 5. Reading Fluency .44 .67 .55 .57 6. Rapid Automatized Naming .21 .21 .14 .43 .50 7. Verbal Working Memory .62 .54 .59 .38 .30 .44 8. Print Experience .61 .54 .51 .54 .16 .40 .39 9. Matrix Reasoning .61 .66 .34 .39 .16 .59 .40 .08 10. Visuospatial Memory .47 .53 .46 .44 .34 .50 .42 .22 .47 11. Full-Scale IQ .75 .82 .52 .51 .30 .51 .63 .38 .77 .47
Note. N = 60. Composite scores were calculated based on the Box-Cox transformed and standardized measures in Table 2 by averaging and standardizing the measures within each category, including phonological skills (measures 1-4), reading comprehension (5-8), oral comprehension and vocabulary (9-12), decoding (13-16), fluency (17-18), RAN (19-21), verbal working memory (22), and print experience (23-24). Additional simple measures of general cognitive abilities, matrix reasoning (25), visuospatial memory (26), and full-scale IQ (27), were also included. Spearman’s correlation was conducted to examine the correlation among composites in terms of subjects’ rank in each composite. Spearman’s correlation test critical values: | rs | ≥ .21, p < .1; | rs | ≥ .25, p < .05; | rs | ≥ .33, p < .01; | rs | ≥ .41, p < .001. Bolded values indicate | rs | ≥ .41, p < .001.
SUBPHONEMIC SENSITIVITY AND PHONOLOGICAL SKILLS
34
Eye tracking
Within trials, fixation proportions to pictures were tracked over time. Eye movements 455
were sampled throughout every trial at the rate of 250 Hz and were down-sampled to 20 Hz (50 456
ms time steps) for all further analyses. For each trial, at each time step beginning from target 457
word onset, we determined fixation location as falling into one of five categories: target, 458
competitor, a distractor, the cross, or elsewhere. Over-time fixation proportions of the five 459
locations were then computed over trials by condition and by participant at each time step, 460
excluding the filler trials and experimenter-terminated trials (5% of all critical trials). Distractor 461
proportions were divided by the number of distractors (two) to result in the mean proportion of 462
fixations to distractors. 463
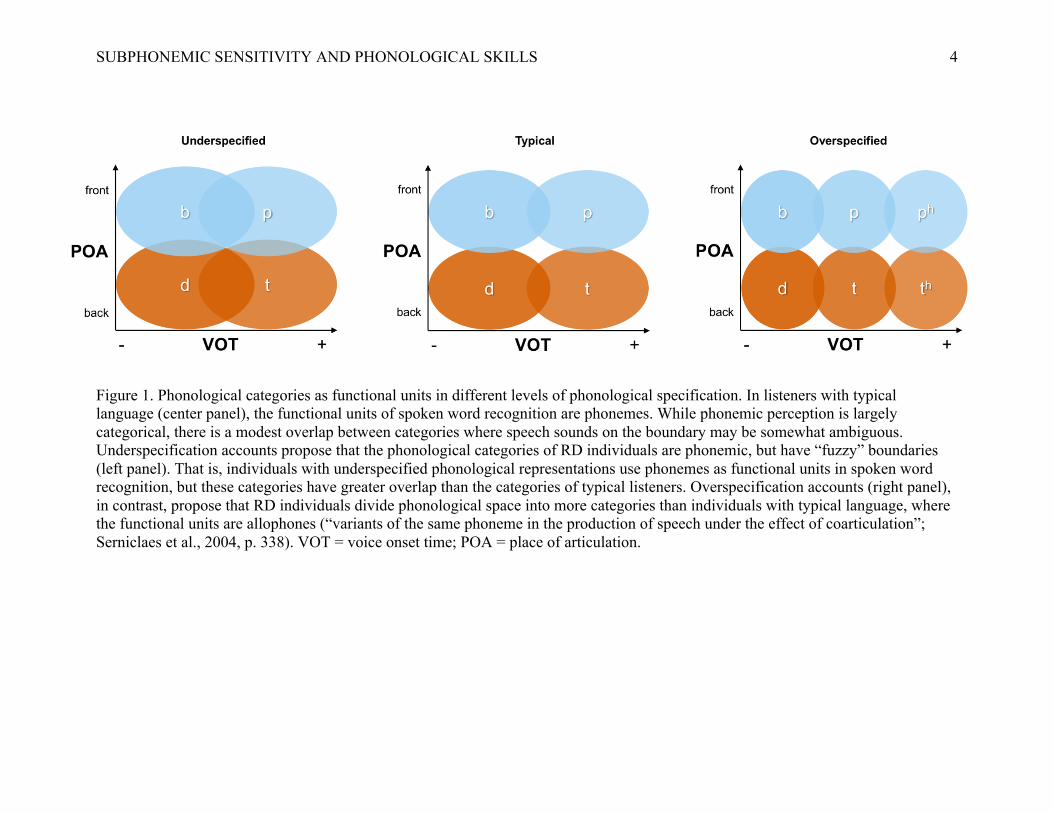
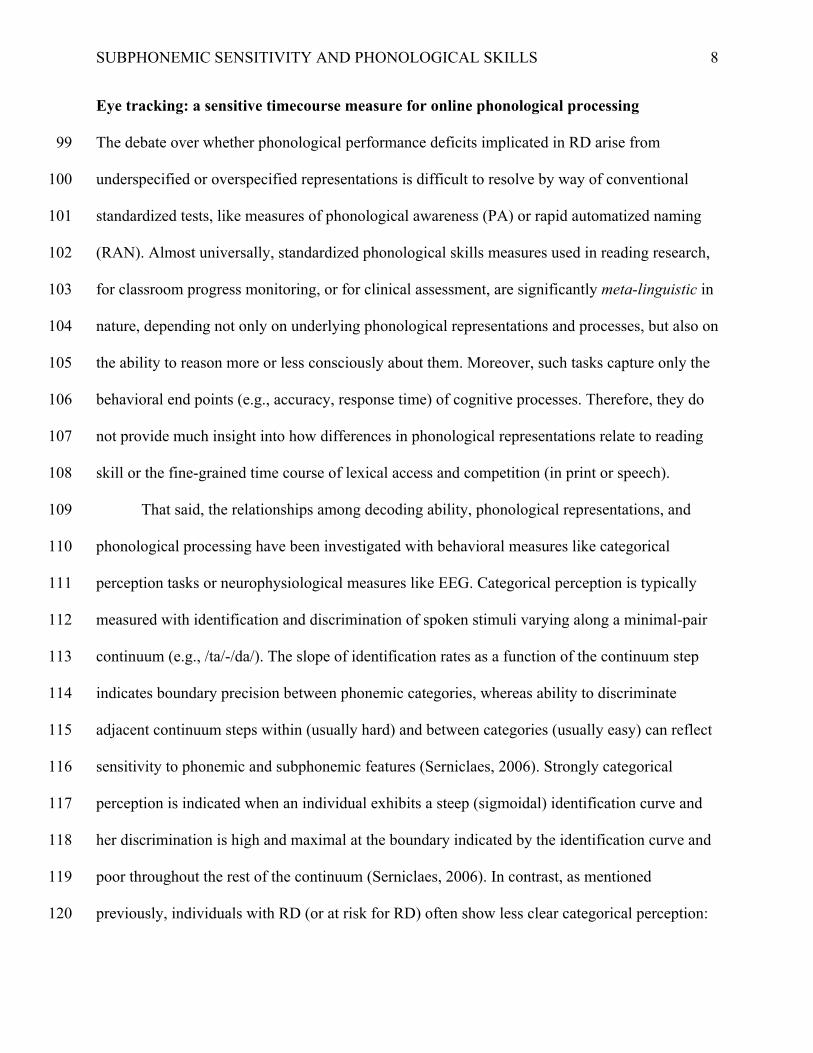
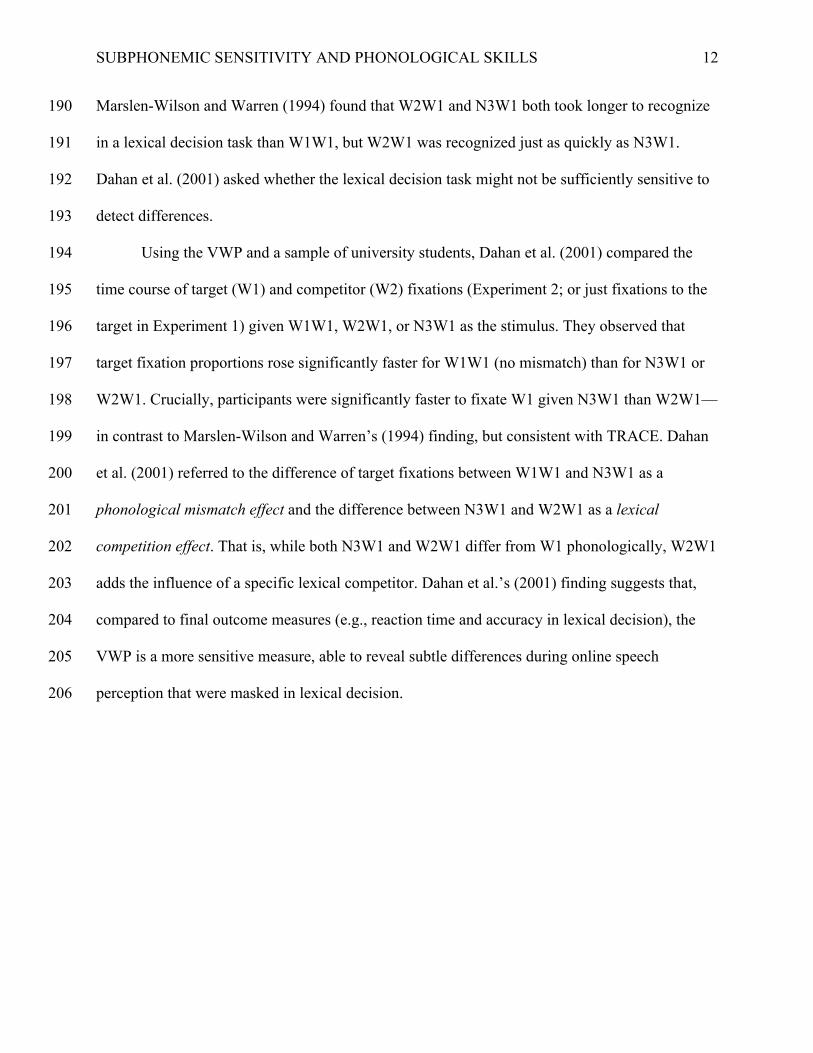
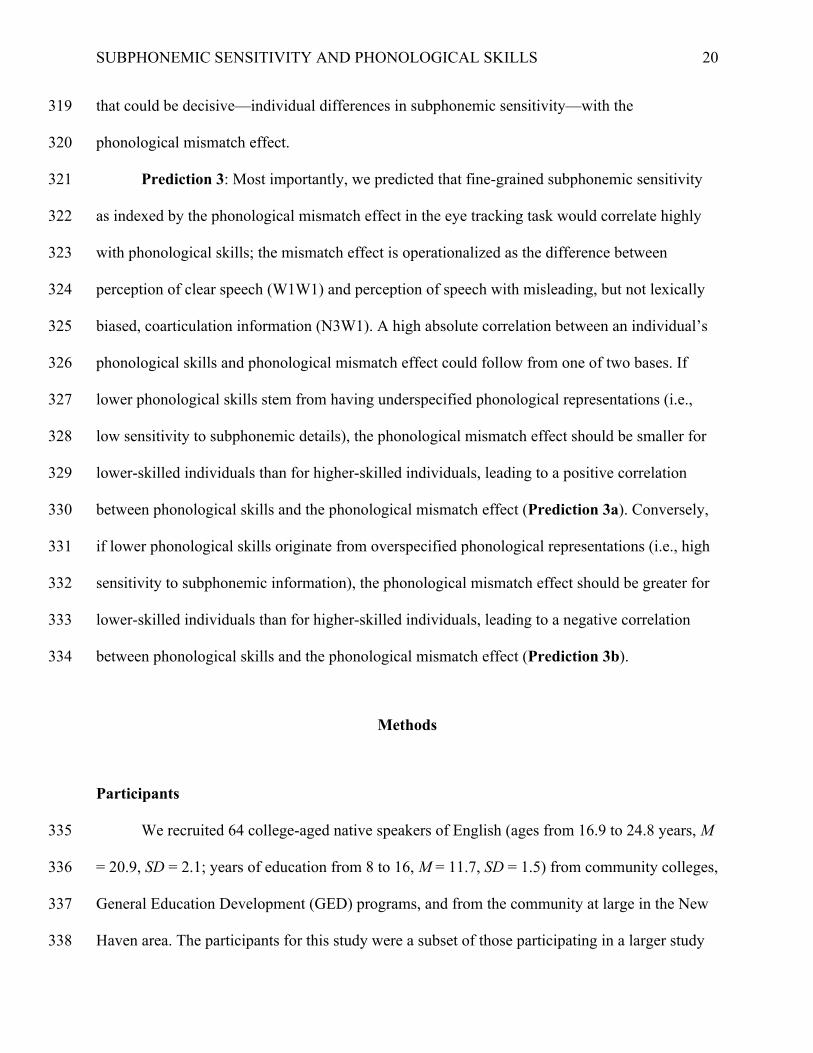
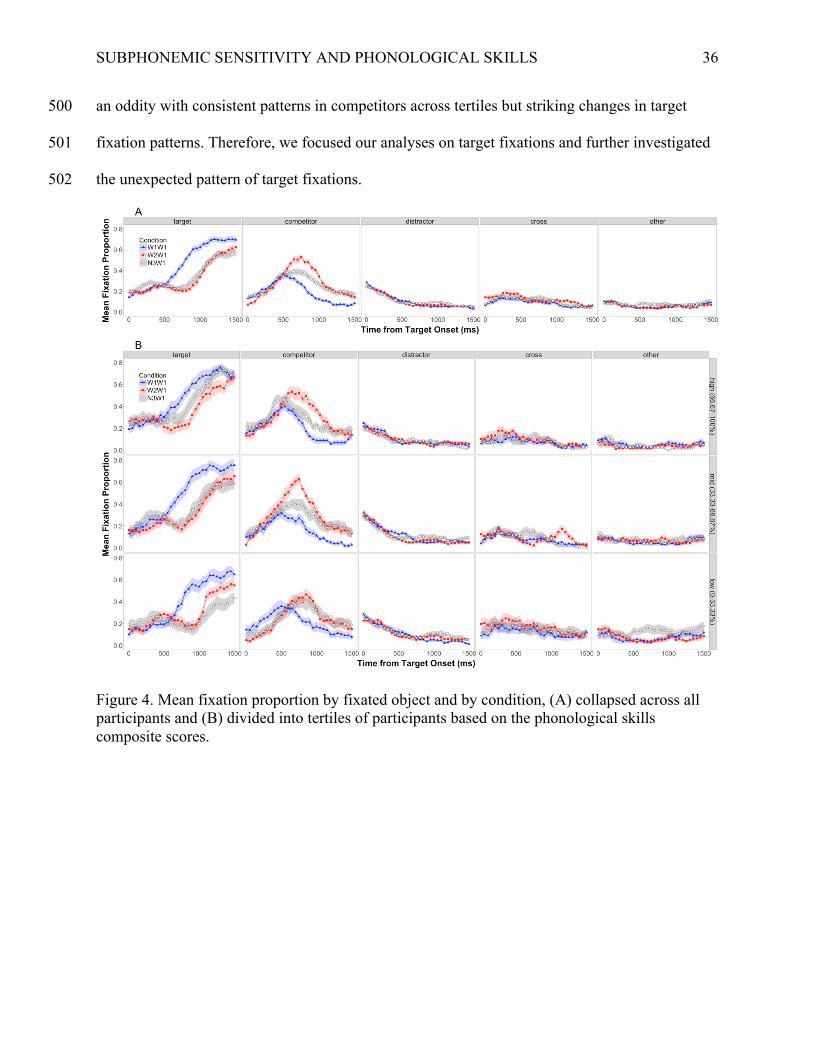
Mean fixation proportions by condition and item type across all participants are shown in 464
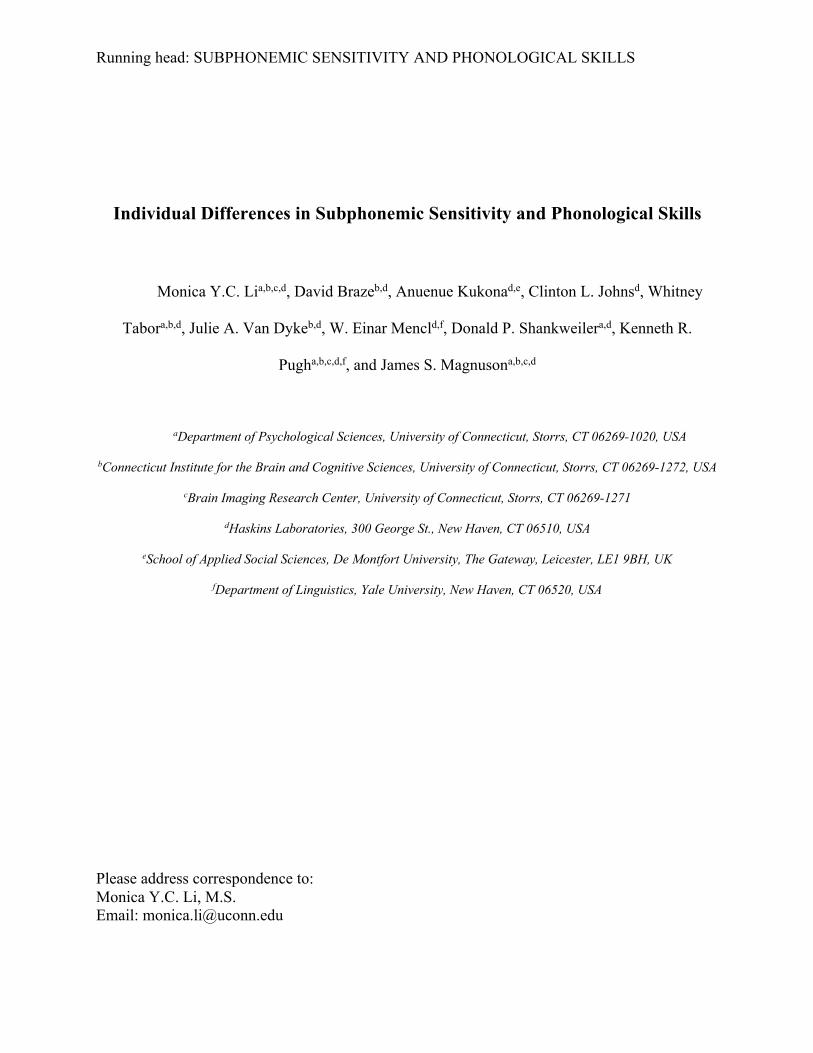
Figure 4A. The overall target fixation proportions replicated the subcategorical mismatch effects 465
seen in Dahan et al. (2001), where participants looked to the target faster and to a greater extent 466
when there was no mismatching coarticulatory information in the word (W1W1), with slower 467
and lesser target fixation proportions when mismatching coarticulation corresponded to a 468
nonword (N3W1), and even slower and lesser target fixation proportions when the mismatching 469
coarticulation was consistent with a word (W2W1). Similarly, the overall competitor fixation 470
proportions also replicated the findings in Dahan et al. (2001), where the rank order of the 471
competitor fixation proportions was complementary to that of the target fixation proportions, 472
showing the highest competitor fixation proportions in W2W1, followed by N3W1, and the 473
lowest competitor fixation proportions in W1W1. 474
The fixation proportions to distractors did not differ reliably across conditions. Fixation 475
proportions to distractors at word onset were notably higher than to other items. This reflected 476
SUBPHONEMIC SENSITIVITY AND PHONOLOGICAL SKILLS
35
the residual eye movements to the distractors due to the first step of each trial, where the 477
participant was asked to point to a distractor picture, prior to the critical instruction to point to 478
the target picture. Any bias towards unrelated items clearly dissipated prior to the critical 479
analysis window. Overall fixation proportions to the cross and other regions on the screen did not 480
differ across conditions and did not change notably over time. 481
To provide a sense of how subcategorical mismatch effects changed with phonological 482
skills, we divided the participants into tertiles based on their phonological skills composite 483
scores. Mean fixation proportions by condition and item type of each participant tertile are 484
shown in Figure 4B. The top tertile target fixation proportions were very similar to the overall 485
pattern qualitatively, in terms of the rank order of condition. Interestingly, as the phonological 486
skills composite scores decreased, there was a trend for target fixation proportions to decrease in 487
N3W1 but increase in W2W1, to such an extent that individuals with lower phonological skills 488
actually showed a reversal of rank order between W2W1 and N3W1 (see the left-most column of 489
Figure 4B). This reversal in the target fixations was completely unexpected, although lower-490
skilled participants’ heightened fixations in N3W1 to other regions on the screen (see the right-491
most column of Figure 4B) could suggest that these individuals may have noisier processing or 492
that they may be more sensitive to the coarticulatory information and were searching for an 493
alternative picture to match what they perceived. We will discuss the reversal between W2W1 494
and N3W1 in more detail in a later section. 495
It is worth noting that, although target fixations and competitor fixations are usually 496
complimentary, there are cases in the literature where sometimes only target fixations are 497
analyzed (e.g., Desroches, Joanisse, & Robertson, 2006) and sometimes both target and 498
competitor fixations are analyzed (e.g., Dahan et al., 2001). In inspecting the data, we discovered 499
SUBPHONEMIC SENSITIVITY AND PHONOLOGICAL SKILLS
36
an oddity with consistent patterns in competitors across tertiles but striking changes in target 500
fixation patterns. Therefore, we focused our analyses on target fixations and further investigated 501
the unexpected pattern of target fixations.502
Figure 4. Mean fixation proportion by fixated object and by condition, (A) collapsed across all participants and (B) divided into tertiles of participants based on the phonological skills composite scores.
SUBPHONEMIC SENSITIVITY AND PHONOLOGICAL SKILLS
37
Growth curve analysis and individual differences
In order to characterize the individual differences in the eye tracking data, we employed 503
Growth Curve Analysis (GCA; Magnuson et al., 2007; Mirman, 2014; Mirman, Dixon, & 504
Magnuson, 2008) for target fixation proportions and extracted effect sizes (i.e., differences of 505
target fixation proportions between conditions) for individual participants3. Note that stimulus-506
driven eye movements in tasks similar to the visual world paradigm typically lag approximately 507
200 ms behind phonetic detail in speech (Allopenna et al., 1998). This lag is close to minimum 508
signal driven eye movement latencies (Fischer, 1992; Viviani, 1990). The splice point was 509
approximately 380 ms after word onset (means were 376 ms, 378 ms, and 383 ms for W1W1, 510
W2W1, and N3W1 stimuli, respectively). Therefore, following Dahan et al. (2001), we set the 511
GCA analysis window from 600 ms after word onset (approximately 220 ms after the splice 512
point) to 1200 ms (approximately where target fixation proportions asymptoted). 513
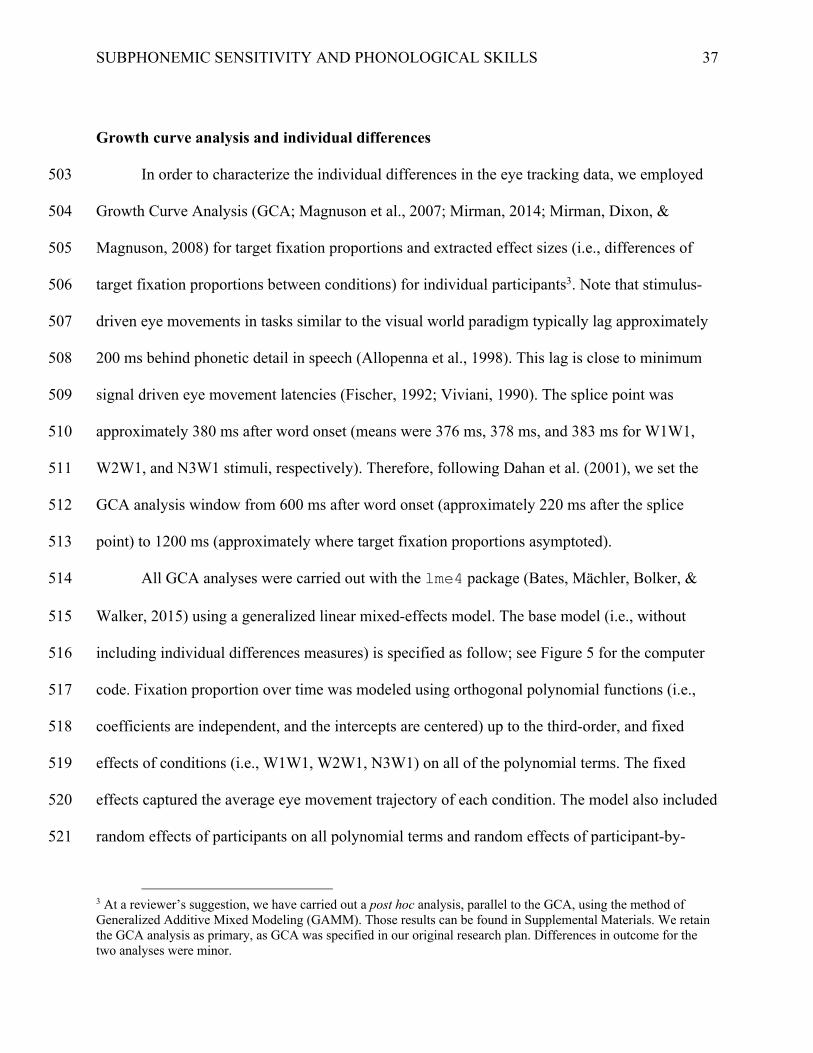
All GCA analyses were carried out with the lme4 package (Bates, Mächler, Bolker, & 514
Walker, 2015) using a generalized linear mixed-effects model. The base model (i.e., without 515
including individual differences measures) is specified as follow; see Figure 5 for the computer 516
code. Fixation proportion over time was modeled using orthogonal polynomial functions (i.e., 517
coefficients are independent, and the intercepts are centered) up to the third-order, and fixed 518
effects of conditions (i.e., W1W1, W2W1, N3W1) on all of the polynomial terms. The fixed 519
effects captured the average eye movement trajectory of each condition. The model also included 520
random effects of participants on all polynomial terms and random effects of participant-by-521
3 At a reviewer’s suggestion, we have carried out a post hoc analysis, parallel to the GCA, using the method of Generalized Additive Mixed Modeling (GAMM). Those results can be found in Supplemental Materials. We retain the GCA analysis as primary, as GCA was specified in our original research plan. Differences in outcome for the two analyses were minor.
SUBPHONEMIC SENSITIVITY AND PHONOLOGICAL SKILLS
38
condition interaction on the intercept, linear and quadratic terms. The random effects and their 522
interaction with conditions captured how much each participant deviated from the average eye 523
movement trajectory overall and for each condition, respectively.524
m.wo.phono <- lmer(meanFix ~ (ot1+ot2+ot3)*(COND) +
(ot1+ot2+ot3 | SUBJECT) +
(ot1+ot2 | SUBJECT:COND),
control = lmerControl(optimizer = "bobyqa"),
data = data.trg.allCon, REML = FALSE)
Figure 5. Base GCA model specification. meanFix = mean fixation proportions; ot1 = first-order (linear) orthogonal polynomial term; ot2 = second-order (quadratic) orthogonal polynomial term; ot3 = third-order (cubic) orthogonal polynomial term; COND = Condition (as a fixed effect).
For each participant, the participant-by-condition random effects estimates of the 525
intercept were used to compute effect sizes by subtracting the random effect estimate of N3W1 526
from that of W1W1 (i.e., the phonological mismatch effect) and subtracting the random effect 527
estimate of W2W1 from that of N3W1 (i.e., the lexical effect). The two subcategorical mismatch 528
effects were negatively correlated with each other (r[58] = .-53, p < .001), indicating that 529
participants whose phonological mismatch effect was larger tended to have a smaller lexical 530
effect, and vice versa. This suggests that individuals who have higher subphonemic sensitivity 531
tend to have less lexical competition, possibly due to lower lexical quality, as we shall see next, 532
when we turn to individual differences in standardized measures. 533
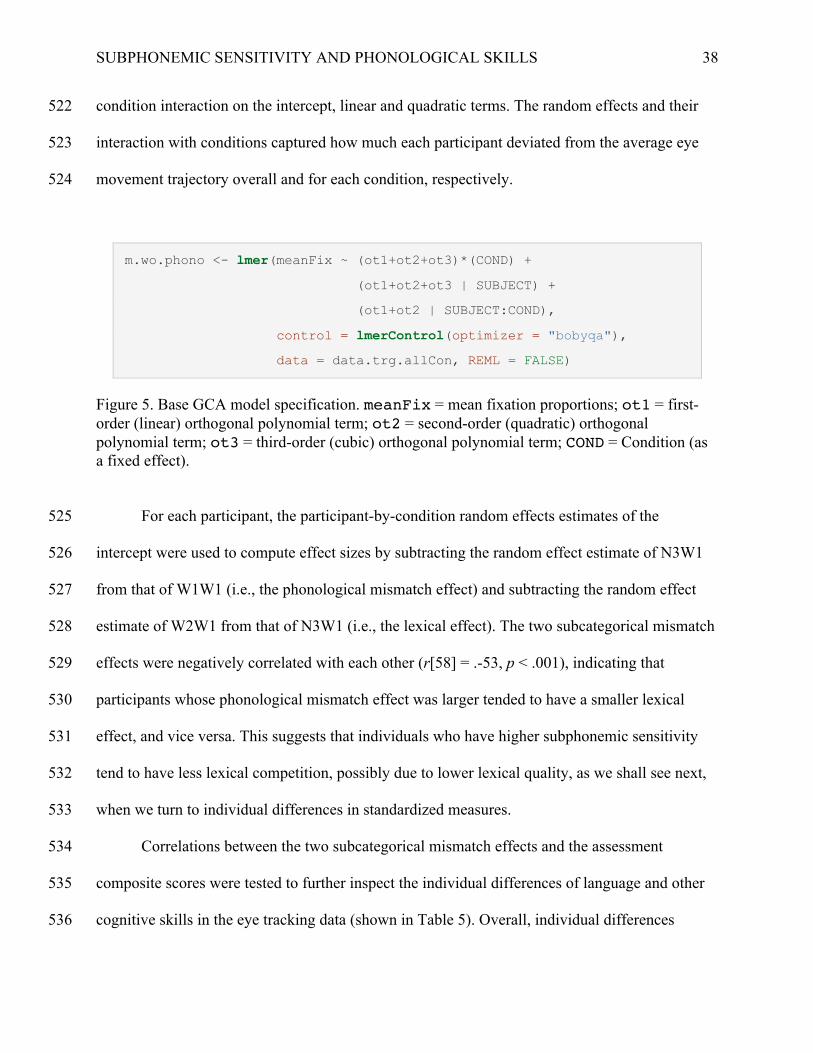
Correlations between the two subcategorical mismatch effects and the assessment 534
composite scores were tested to further inspect the individual differences of language and other 535
cognitive skills in the eye tracking data (shown in Table 5). Overall, individual differences 536

SUBPHONEMIC SENSITIVITY AND PHONOLOGICAL SKILLS
39
composite scores were negatively correlated with the phonological mismatch effect (W1W1-537
N3W1) and positively correlated with the lexical effect (N3W1-W2W1). In particular, the 538
phonological mismatch effect shows significant, negative correlations with phonological skills 539
and oral comprehension, while the lexical effect shows significant, positive correlations with 540
phonological skills, oral comprehension, decoding, and reading fluency. Importantly, both 541
effects are most highly correlated with the phonological skills composite. This suggests that 542
performance on these indicators of meta-phonological skills and online phonological processing 543
efficiency depend on overlapping cognitive capacities. The significantly positive correlation 544
between phonological skills and the lexical effect is consistent with our Prediction 2, suggesting 545
that lower phonological skills were associated with less lexical competition. The significantly 546
negative correlation between the phonological skills composite and the phonological mismatch 547
effect is consistent with our Prediction 3b, indicating that lower phonological skills were 548
associated with higher subphonemic sensitivity. 549
In short, the correlations among the two subcategorical mismatch effects and the 550
assessment scores revealed the following trends in individual differences: (1) reading related 551
scores, especially phonological skills, were moderately correlated with effect sizes in the eye 552
tracking task; (2) lower phonological skills are associated with greater phonological mismatch 553
effects and smaller lexical competition effects.554
SUBPHONEMIC SENSITIVITY AND PHONOLOGICAL SKILLS
40
Table 5 Correlations between subcategorical mismatch effects and individual differences scores.
W1W1-N3W1 (Phono)
N3W1-W2W1 (Lexical)
N3W1-W2W1 -.53 1. Phonological Skills -.31 .36 2. Reading Comprehension -.18 .24 3. Oral Comprehension & Vocabulary -.26 .27 4. Decoding -.11 .31 5. Reading Fluency -.12 .32 6. Rapid Automatized Naming -.08 .21 7. Verbal Working Memory -.04 .17 8. Print Experience -.09 .22 9. Matrix Reasoning -.20 .09 10. Visuospatial Memory -.11 .19 11. Full-Scale IQ -.18 .22
Note. N = 60. Pearson’s correlation test critical values: | r | ≥ .21, p < .1; | r | ≥ .25, p < .05; | r | ≥ .33, p < .01. Bolded values indicate | r | ≥ .25, p < .05.
SUBPHONEMIC SENSITIVITY AND PHONOLOGICAL SKILLS
41
Growth curve analysis with phonological skills as a fixed effect
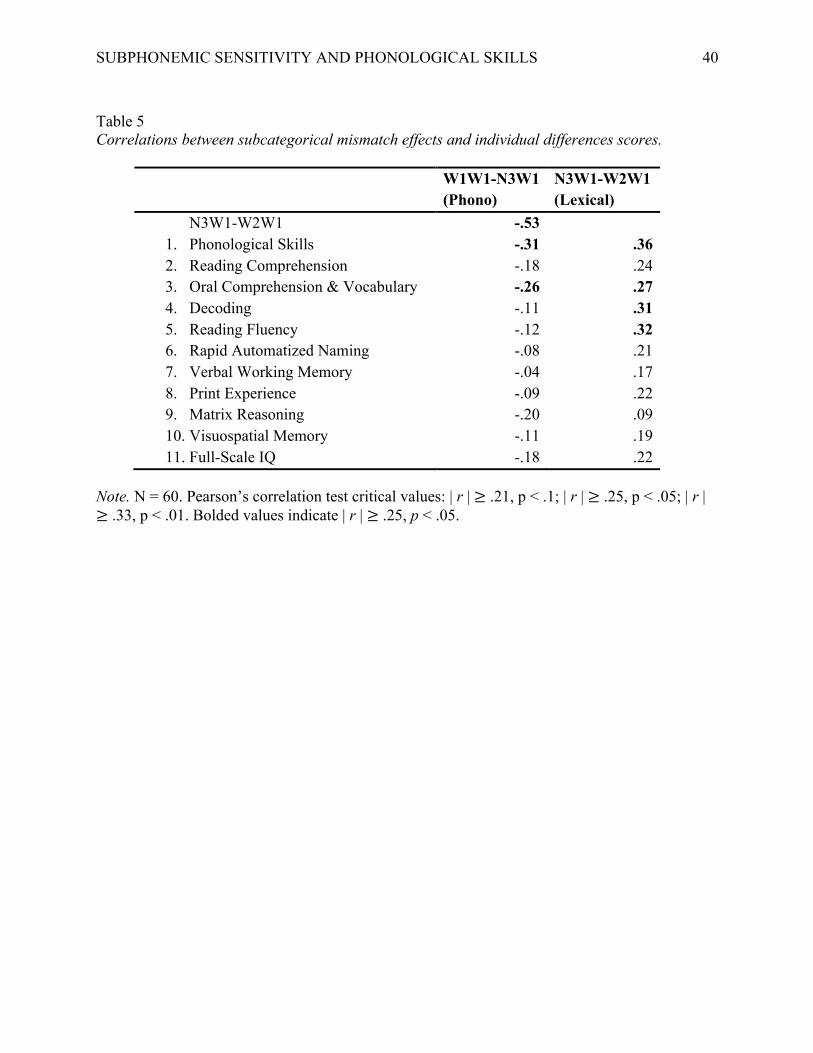
In order to quantify the effect of individual differences in phonological skills on 555
subcategorical mismatch effects, we added the phonological skills composite to the GCA model 556
as a fixed effect, together with its interactions with condition and time (see Figure 6 for the 557
computer code). Adding the phonological skills composite as a fixed effect to the model 558
significantly improved model fit (Table 6), suggesting that individuals’ phonological skills 559
explained additional variance in participants’ gaze behavior.560
m.w.phono <- lmer(meanFix ~ (ot1+ot2+ot3)*(COND)*(phono.composite) +
(ot1+ot2+ot3 | SUBJECT) +
(ot1+ot2 | SUBJECT:COND),
control = lmerControl(optimizer = "bobyqa"),
data = data.trg.allCon, REML = FALSE)
Figure 6. GCA model specification with Phonological Skills as a fixed effect. meanFix = mean fixation proportions; ot1 = first-order (linear) orthogonal polynomial term; ot2 = second-order (quadratic) orthogonal polynomial term; ot3 = third-order (cubic) orthogonal polynomial term; COND = Condition (as a fixed effect). Table 6 Comparison between GCA models with vs. without the composite scores of phonological skills as a fixed effect.
df AIC BIC logLik deviance χ² dfχ² p without 29 -2716.8 -2549.8 1387.4 -2774.8 with 41 -2725.1 -2489.1 1403.6 -2807.1 32.37 12 0.001
Note. Adding phonological skills composite scores significantly improved the model fit. df: degrees of freedom; AIC: Akaike information criterion; BIC: Bayesian information criterion; logLik: log-likelihood; χ²: Chi-Square test value; dfχ²: Chi-Square degrees of freedom.
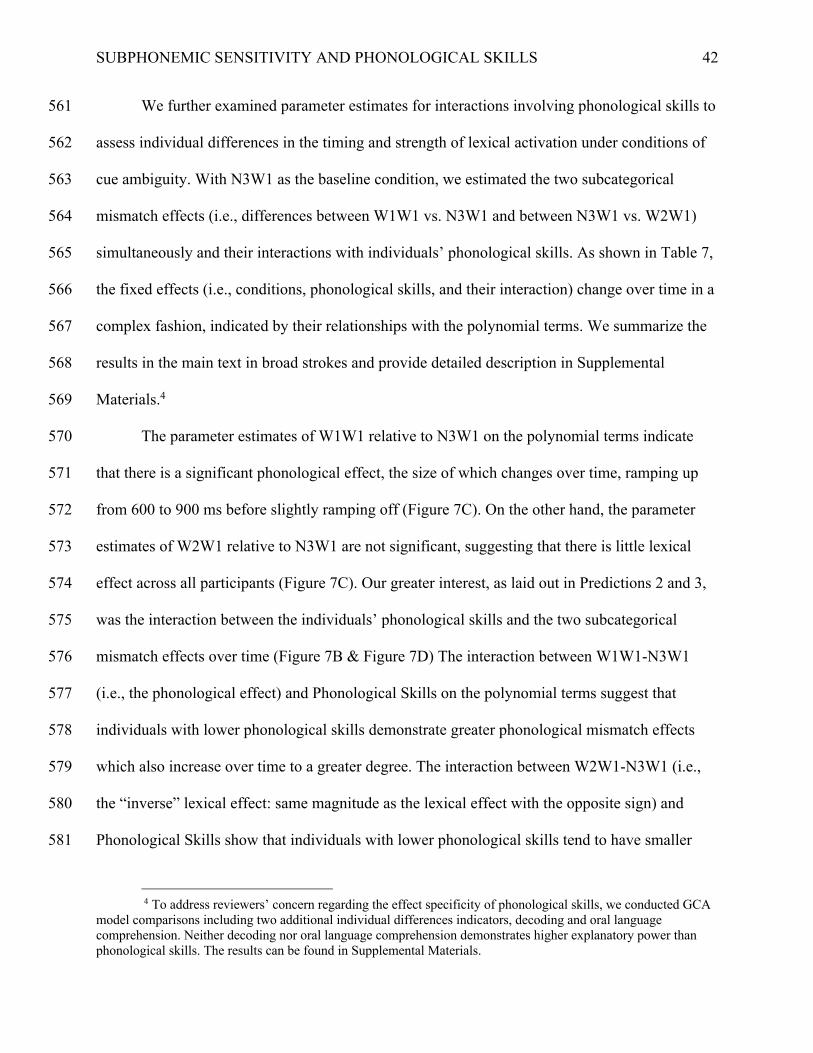
SUBPHONEMIC SENSITIVITY AND PHONOLOGICAL SKILLS
42
We further examined parameter estimates for interactions involving phonological skills to 561
assess individual differences in the timing and strength of lexical activation under conditions of 562
cue ambiguity. With N3W1 as the baseline condition, we estimated the two subcategorical 563
mismatch effects (i.e., differences between W1W1 vs. N3W1 and between N3W1 vs. W2W1) 564
simultaneously and their interactions with individuals’ phonological skills. As shown in Table 7, 565
the fixed effects (i.e., conditions, phonological skills, and their interaction) change over time in a 566
complex fashion, indicated by their relationships with the polynomial terms. We summarize the 567
results in the main text in broad strokes and provide detailed description in Supplemental 568
Materials.4 569
The parameter estimates of W1W1 relative to N3W1 on the polynomial terms indicate 570
that there is a significant phonological effect, the size of which changes over time, ramping up 571
from 600 to 900 ms before slightly ramping off (Figure 7C). On the other hand, the parameter 572
estimates of W2W1 relative to N3W1 are not significant, suggesting that there is little lexical 573
effect across all participants (Figure 7C). Our greater interest, as laid out in Predictions 2 and 3, 574
was the interaction between the individuals’ phonological skills and the two subcategorical 575
mismatch effects over time (Figure 7B & Figure 7D) The interaction between W1W1-N3W1 576
(i.e., the phonological effect) and Phonological Skills on the polynomial terms suggest that 577
individuals with lower phonological skills demonstrate greater phonological mismatch effects 578
which also increase over time to a greater degree. The interaction between W2W1-N3W1 (i.e., 579
the “inverse” lexical effect: same magnitude as the lexical effect with the opposite sign) and 580
Phonological Skills show that individuals with lower phonological skills tend to have smaller 581
4 To address reviewers’ concern regarding the effect specificity of phonological skills, we conducted GCA
model comparisons including two additional individual differences indicators, decoding and oral language comprehension. Neither decoding nor oral language comprehension demonstrates higher explanatory power than phonological skills. The results can be found in Supplemental Materials.
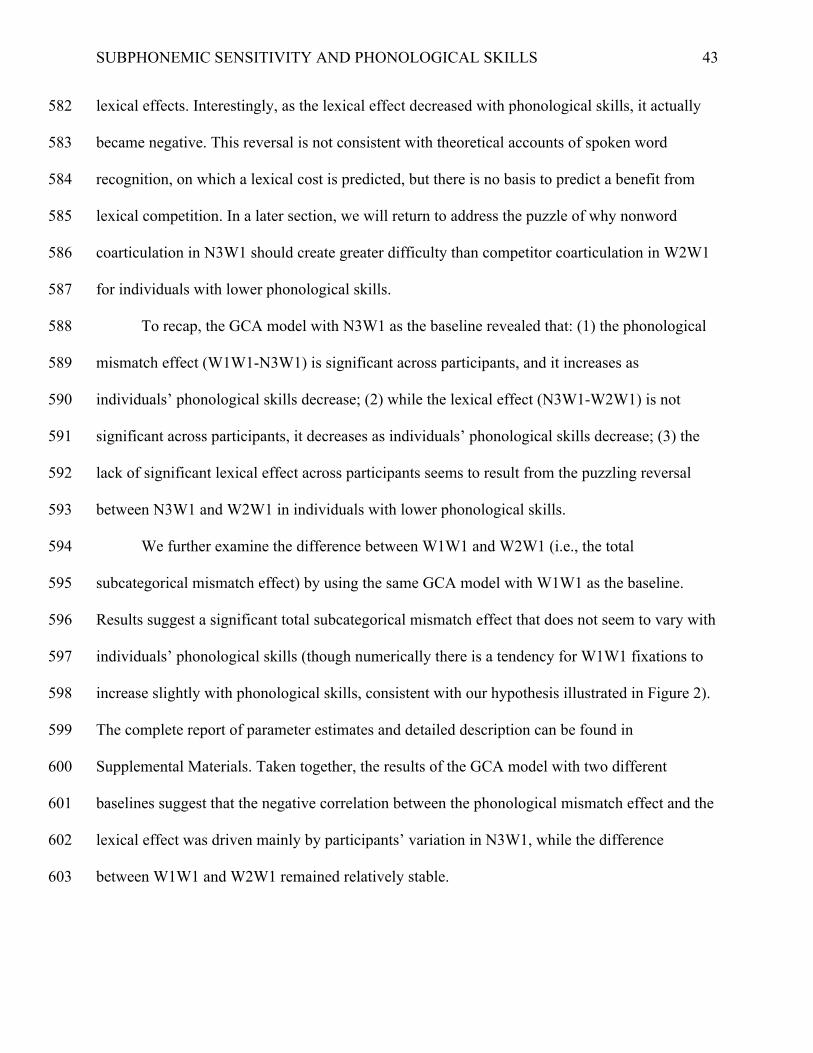
SUBPHONEMIC SENSITIVITY AND PHONOLOGICAL SKILLS
43
lexical effects. Interestingly, as the lexical effect decreased with phonological skills, it actually 582
became negative. This reversal is not consistent with theoretical accounts of spoken word 583
recognition, on which a lexical cost is predicted, but there is no basis to predict a benefit from 584
lexical competition. In a later section, we will return to address the puzzle of why nonword 585
coarticulation in N3W1 should create greater difficulty than competitor coarticulation in W2W1 586
for individuals with lower phonological skills. 587
To recap, the GCA model with N3W1 as the baseline revealed that: (1) the phonological 588
mismatch effect (W1W1-N3W1) is significant across participants, and it increases as 589
individuals’ phonological skills decrease; (2) while the lexical effect (N3W1-W2W1) is not 590
significant across participants, it decreases as individuals’ phonological skills decrease; (3) the 591
lack of significant lexical effect across participants seems to result from the puzzling reversal 592
between N3W1 and W2W1 in individuals with lower phonological skills. 593
We further examine the difference between W1W1 and W2W1 (i.e., the total 594
subcategorical mismatch effect) by using the same GCA model with W1W1 as the baseline. 595
Results suggest a significant total subcategorical mismatch effect that does not seem to vary with 596
individuals’ phonological skills (though numerically there is a tendency for W1W1 fixations to 597
increase slightly with phonological skills, consistent with our hypothesis illustrated in Figure 2). 598
The complete report of parameter estimates and detailed description can be found in 599
Supplemental Materials. Taken together, the results of the GCA model with two different 600
baselines suggest that the negative correlation between the phonological mismatch effect and the 601
lexical effect was driven mainly by participants’ variation in N3W1, while the difference 602
between W1W1 and W2W1 remained relatively stable.603
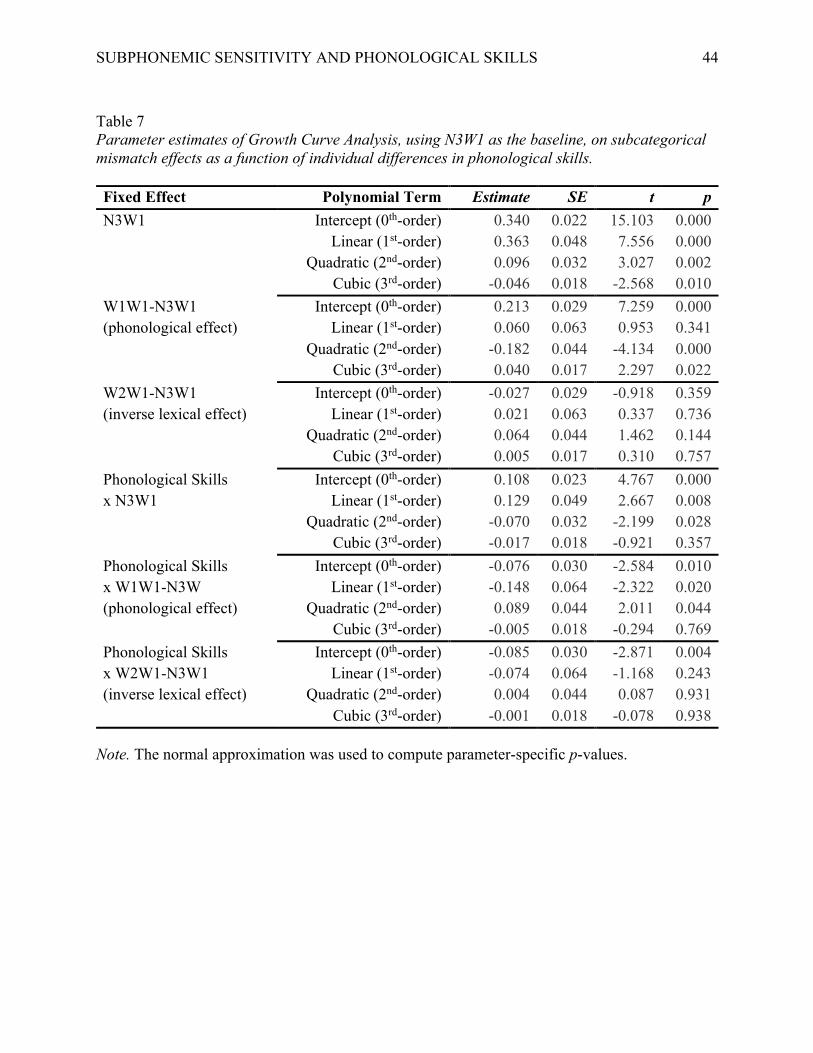
SUBPHONEMIC SENSITIVITY AND PHONOLOGICAL SKILLS
44
Table 7 Parameter estimates of Growth Curve Analysis, using N3W1 as the baseline, on subcategorical mismatch effects as a function of individual differences in phonological skills. Fixed Effect Polynomial Term Estimate SE t p N3W1 Intercept (0th-order) 0.340 0.022 15.103 0.000
Linear (1st-order) 0.363 0.048 7.556 0.000 Quadratic (2nd-order) 0.096 0.032 3.027 0.002
Cubic (3rd-order) -0.046 0.018 -2.568 0.010
W1W1-N3W1 (phonological effect)
Intercept (0th-order) 0.213 0.029 7.259 0.000 Linear (1st-order) 0.060 0.063 0.953 0.341
Quadratic (2nd-order) -0.182 0.044 -4.134 0.000 Cubic (3rd-order) 0.040 0.017 2.297 0.022
W2W1-N3W1 (inverse lexical effect)
Intercept (0th-order) -0.027 0.029 -0.918 0.359 Linear (1st-order) 0.021 0.063 0.337 0.736
Quadratic (2nd-order) 0.064 0.044 1.462 0.144 Cubic (3rd-order) 0.005 0.017 0.310 0.757
Phonological Skills x N3W1
Intercept (0th-order) 0.108 0.023 4.767 0.000 Linear (1st-order) 0.129 0.049 2.667 0.008
Quadratic (2nd-order) -0.070 0.032 -2.199 0.028 Cubic (3rd-order) -0.017 0.018 -0.921 0.357
Phonological Skills x W1W1-N3W (phonological effect)
Intercept (0th-order) -0.076 0.030 -2.584 0.010 Linear (1st-order) -0.148 0.064 -2.322 0.020
Quadratic (2nd-order) 0.089 0.044 2.011 0.044 Cubic (3rd-order) -0.005 0.018 -0.294 0.769
Phonological Skills x W2W1-N3W1 (inverse lexical effect)
Intercept (0th-order) -0.085 0.030 -2.871 0.004 Linear (1st-order) -0.074 0.064 -1.168 0.243
Quadratic (2nd-order) 0.004 0.044 0.087 0.931 Cubic (3rd-order) -0.001 0.018 -0.078 0.938
Note. The normal approximation was used to compute parameter-specific p-values.
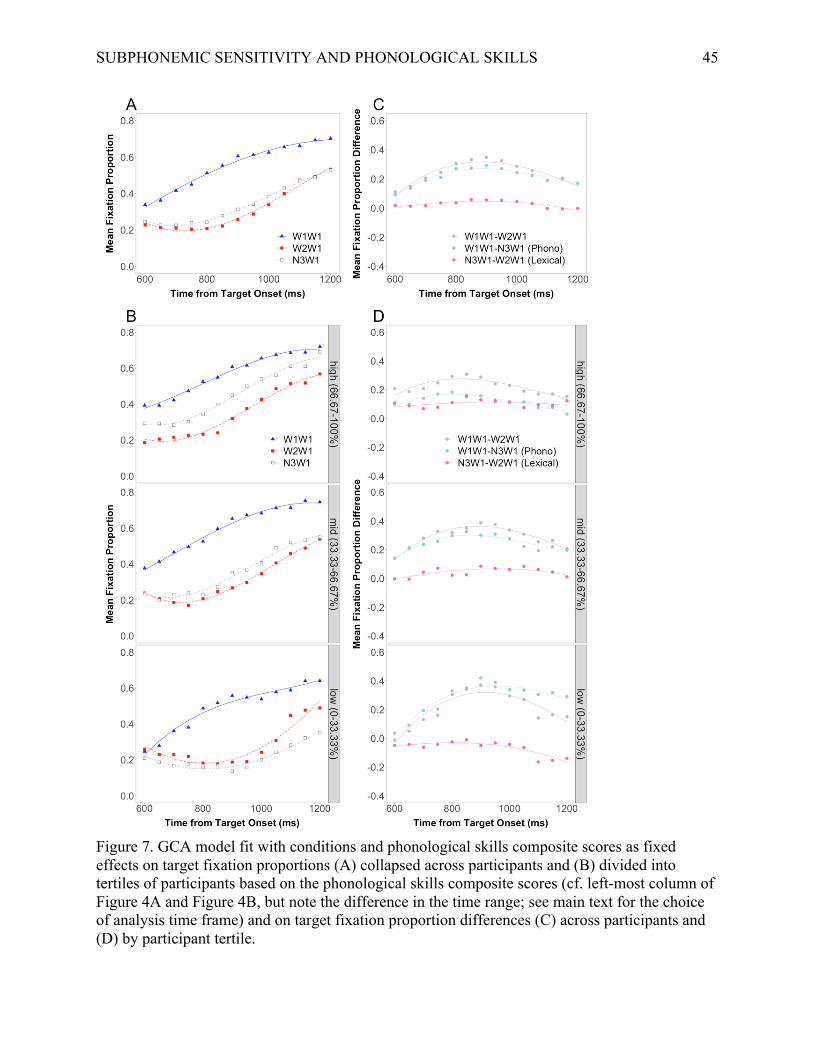
SUBPHONEMIC SENSITIVITY AND PHONOLOGICAL SKILLS
45
Figure 7. GCA model fit with conditions and phonological skills composite scores as fixed effects on target fixation proportions (A) collapsed across participants and (B) divided into tertiles of participants based on the phonological skills composite scores (cf. left-most column of Figure 4A and Figure 4B, but note the difference in the time range; see main text for the choice of analysis time frame) and on target fixation proportion differences (C) across participants and (D) by participant tertile.
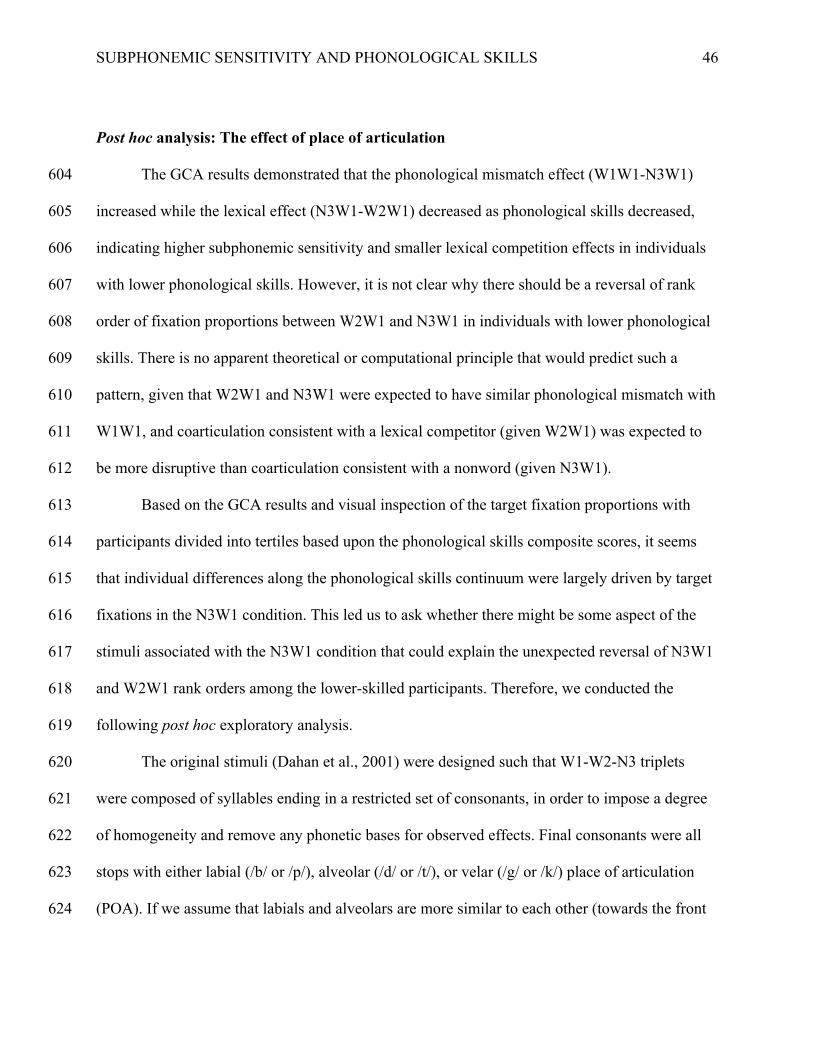
SUBPHONEMIC SENSITIVITY AND PHONOLOGICAL SKILLS
46
Post hoc analysis: The effect of place of articulation
The GCA results demonstrated that the phonological mismatch effect (W1W1-N3W1) 604
increased while the lexical effect (N3W1-W2W1) decreased as phonological skills decreased, 605
indicating higher subphonemic sensitivity and smaller lexical competition effects in individuals 606
with lower phonological skills. However, it is not clear why there should be a reversal of rank 607
order of fixation proportions between W2W1 and N3W1 in individuals with lower phonological 608
skills. There is no apparent theoretical or computational principle that would predict such a 609
pattern, given that W2W1 and N3W1 were expected to have similar phonological mismatch with 610
W1W1, and coarticulation consistent with a lexical competitor (given W2W1) was expected to 611
be more disruptive than coarticulation consistent with a nonword (given N3W1). 612
Based on the GCA results and visual inspection of the target fixation proportions with 613
participants divided into tertiles based upon the phonological skills composite scores, it seems 614
that individual differences along the phonological skills continuum were largely driven by target 615
fixations in the N3W1 condition. This led us to ask whether there might be some aspect of the 616
stimuli associated with the N3W1 condition that could explain the unexpected reversal of N3W1 617
and W2W1 rank orders among the lower-skilled participants. Therefore, we conducted the 618
following post hoc exploratory analysis. 619
The original stimuli (Dahan et al., 2001) were designed such that W1-W2-N3 triplets 620
were composed of syllables ending in a restricted set of consonants, in order to impose a degree 621
of homogeneity and remove any phonetic bases for observed effects. Final consonants were all 622
stops with either labial (/b/ or /p/), alveolar (/d/ or /t/), or velar (/g/ or /k/) place of articulation 623
(POA). If we assume that labials and alveolars are more similar to each other (towards the front 624
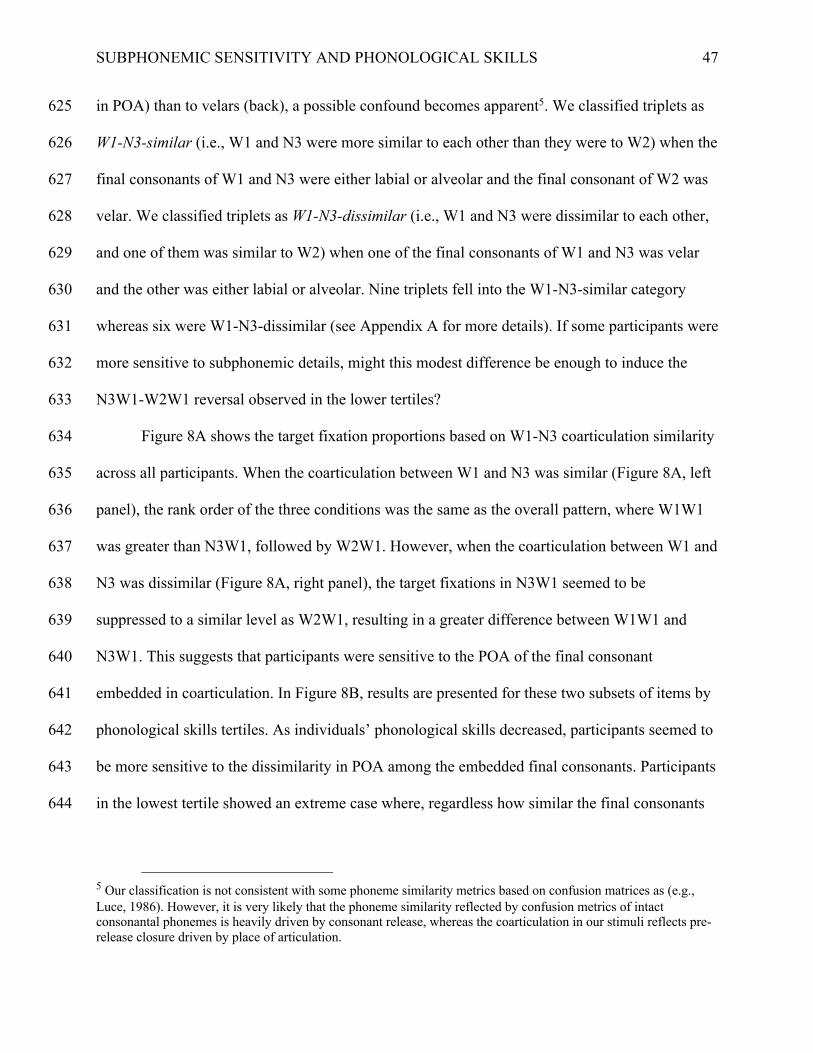
SUBPHONEMIC SENSITIVITY AND PHONOLOGICAL SKILLS
47
in POA) than to velars (back), a possible confound becomes apparent5. We classified triplets as 625
W1-N3-similar (i.e., W1 and N3 were more similar to each other than they were to W2) when the 626
final consonants of W1 and N3 were either labial or alveolar and the final consonant of W2 was 627
velar. We classified triplets as W1-N3-dissimilar (i.e., W1 and N3 were dissimilar to each other, 628
and one of them was similar to W2) when one of the final consonants of W1 and N3 was velar 629
and the other was either labial or alveolar. Nine triplets fell into the W1-N3-similar category 630
whereas six were W1-N3-dissimilar (see Appendix A for more details). If some participants were 631
more sensitive to subphonemic details, might this modest difference be enough to induce the 632
N3W1-W2W1 reversal observed in the lower tertiles? 633
Figure 8A shows the target fixation proportions based on W1-N3 coarticulation similarity 634
across all participants. When the coarticulation between W1 and N3 was similar (Figure 8A, left 635
panel), the rank order of the three conditions was the same as the overall pattern, where W1W1 636
was greater than N3W1, followed by W2W1. However, when the coarticulation between W1 and 637
N3 was dissimilar (Figure 8A, right panel), the target fixations in N3W1 seemed to be 638
suppressed to a similar level as W2W1, resulting in a greater difference between W1W1 and 639
N3W1. This suggests that participants were sensitive to the POA of the final consonant 640
embedded in coarticulation. In Figure 8B, results are presented for these two subsets of items by 641
phonological skills tertiles. As individuals’ phonological skills decreased, participants seemed to 642
be more sensitive to the dissimilarity in POA among the embedded final consonants. Participants 643
in the lowest tertile showed an extreme case where, regardless how similar the final consonants 644
5 Our classification is not consistent with some phoneme similarity metrics based on confusion matrices as (e.g., Luce, 1986). However, it is very likely that the phoneme similarity reflected by confusion metrics of intact consonantal phonemes is heavily driven by consonant release, whereas the coarticulation in our stimuli reflects pre-release closure driven by place of articulation.
SUBPHONEMIC SENSITIVITY AND PHONOLOGICAL SKILLS
48
were between W1 and N3, N3W1 target fixation proportions were suppressed to as distinct from 645
W1W1 as W2W1. 646
In sum, the patterns in Figure 8 suggest a possible explanation for the unexpected N3W1-647
W2W1 reversal for individuals with lower phonological skills: target fixations for N3W1 may 648
have been substantially influenced by fine-grained similarity in POA. On the other hand, the 649
mean level of target fixations given W2W1 was quite stable across phonological skills tertiles, 650
suggesting a robust competition effect due to lexical status. We assume both lexical status and 651
subphonemic similarity are at play in these results. In higher-skilled participants, lexical 652
competition may have a large impact and strongly outweigh the effect of W1-N3 similarity, 653
though that effect is still apparent in the reduced difference between N3W1 and W2W1 for W1-654
N3-dissimilar items (Figure 8B, top right panel). In lower-skilled participants, the effect of 655
subphonemic similarity dominates and overwhelms the lexical effect, even for W1-N3-similar 656
items (Figure 8B, bottom left panel). As we discuss next, this exploratory analysis appears 657
consistent with the interpretation that individuals with lower phonological skills have 658
overspecified phonological representations.659
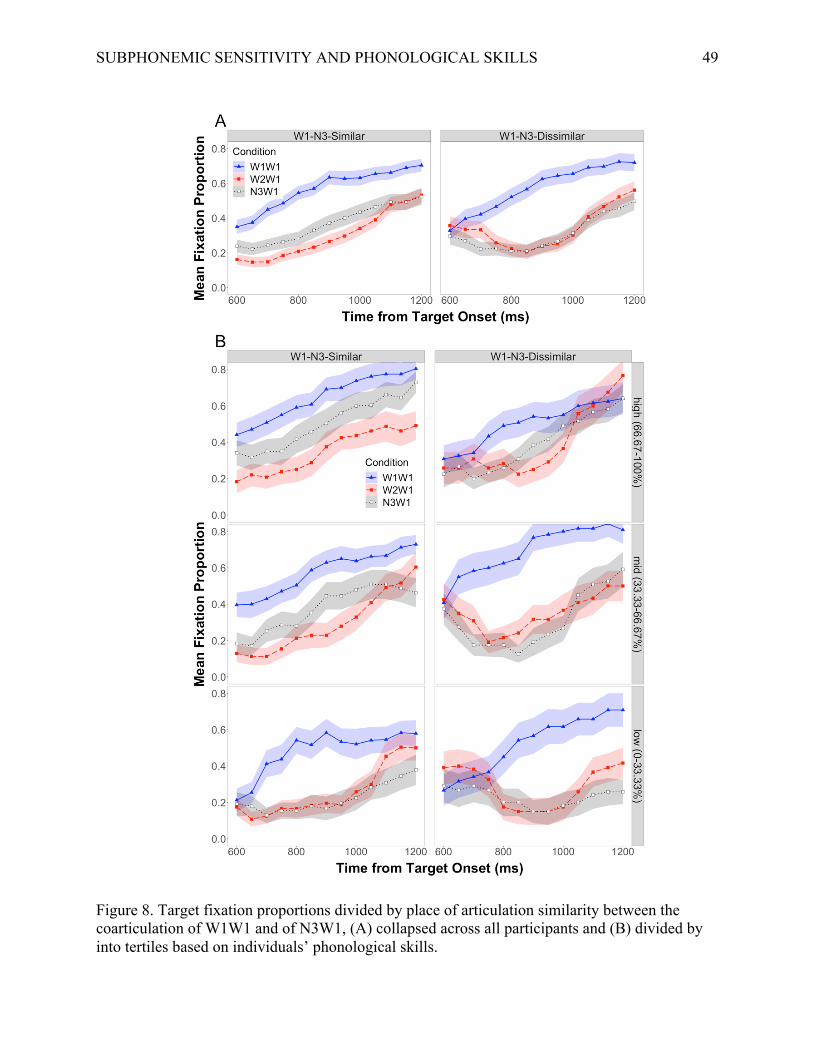
SUBPHONEMIC SENSITIVITY AND PHONOLOGICAL SKILLS
49
Figure 8. Target fixation proportions divided by place of articulation similarity between the coarticulation of W1W1 and of N3W1, (A) collapsed across all participants and (B) divided by into tertiles based on individuals’ phonological skills.
SUBPHONEMIC SENSITIVITY AND PHONOLOGICAL SKILLS
50
Discussion
We investigated variation in young adults’ sensitivity to subphonemic information in 660
spoken word recognition as a function of performance on phonologically grounded tasks using a 661
subcategorical mismatch paradigm (Dahan et al., 2001). Our findings provide new insights into 662
how individual differences in meta-phonological skills relate to online speech processing and 663
underlying phonological representations. Specifically, individuals with lower scores on CTOPP 664
tasks (phonological awareness and phonological memory subtests) appear to exhibit greater 665
sensitivity to subphonemic detail in speech, consistent with the allophonic perception hypothesis 666
(i.e., overspecification) of RD proposed by Serniclaes and colleagues (Serniclaes, 2006; 667
Serniclaes et al., 2001, 2004). 668
Our study tested three primary predictions. First, results show that individuals’ 669
phonological skills (CTOPP) in adulthood were positively correlated with their other reading 670
related skills (Table 4), replicating the well-established association between phonological 671
processing and general reading competence. Second, our prediction that individuals with lower 672
phonological skills should experience less lexical competition during online spoken word 673
recognition is supported by a positive correlation between a composite indicator of phonological 674
skills and individual variation in the magnitude of the lexical effect (N3W1-W2W1) in the eye 675
tracking task. Finally, of all individual differences measures, the phonological skills composite 676
had the strongest correlation with the phonological mismatch effect (W1W1-N3W1), consistent 677
with our Prediction 3 that fine-grained subphonemic sensitivity as indexed by the phonological 678
mismatch effect in the eye tracking task would correlate highly with phonological skills. 679
Moreover, we find a negative correlation between phonological skills and the magnitude of the 680
phonological mismatch effect. This suggests that lower levels of phonological skills may be due 681
SUBPHONEMIC SENSITIVITY AND PHONOLOGICAL SKILLS
51
in part to overspecified phonological representations, consistent with Prediction 3b (i.e., 682
overspecification), and not with Prediction 3a (i.e., underspecification). 683
In addition, the relation of unexpected details in our eye tracking results to phonological 684
skills is suggestive of higher subphonemic sensitivity in participants with lower phonological 685
skills (albeit via an exploratory, post hoc analysis). The central tendency of our results replicated 686
the main findings of Dahan et al. (2001): participants’ fixations to targets were slowed by 687
mismatching coarticulation, with greater slowing on average when misleading coarticulation was 688
consistent with a competitor word (W2W1 condition) than when it was consistent with a 689
nonword (N3W1 condition; see Figure 4A). A greater phonological mismatch effect among 690
lower-skilled participants manifested most saliently in an unexpected reversal of N3W1 and 691
W2W1. That is, participants with lower phonological skills showed greater interference from 692
coarticulation consistent with a nonword (N3W1; Figure 4B)—a result that does not appear 693
consistent with any extant theory or model of spoken word recognition. However, a close 694
examination of this outcome revealed a potential explanation: the reversal seems to have been 695
driven primarily by responses to items where places of articulation were more distant between 696
N3 and W1 (than between W2 and W1), suggesting that in those cases, N3 may be more 697
phonologically dissimilar to W1, leading to a more disruptive effect of misleading coarticulation 698
(Figure 4A). This subphonemic similarity effect was stronger for individuals with lower 699
phonological skills, such that it appeared to overwhelm the effect of lexical competition (Figure 700
4B); in contrast, the lexical effect dominated in higher-skilled individuals, consistent with the 701
college-based sample of Dahan et al. (2001). 702
Phonological Representations, Phonological Memory, and Phonological Awareness
Interestingly, one of the first studies that suggested the impact of phonological processing 703
SUBPHONEMIC SENSITIVITY AND PHONOLOGICAL SKILLS
52
on reading acquisition outcome showed that low-ability readers experienced less interference 704
from rhyming items in short-term memory than better readers (Shankweiler, Liberman, Mark, 705
Fowler, & Fischer, 1979). One possible interpretation for this surprising result is that low-ability 706
readers’ phonological encodings differed from typical readers in a way that allowed them to 707
better resist interference from similar items in the memory list. In the current study, we 708
hypothesize that this difference is characterized by a higher degree of phonological specification 709
in their representations. In the same vein, although it may appear paradoxical, poorer overall 710
phonological memory performance in low-ability readers has been attributed to encoding and 711
retaining of higher degree of details that saturate the buffer in phonological working memory 712
(Lehongre, Ramus, Villiermet, Schwartz, & Giraud, 2011). 713
On the other hand, the relationship between phonological processing and phonological 714
representations revealed in the current study may seem inconsistent with some previous studies 715
regarding categorical perception in individuals with developmental language disorders. For 716
example, Robertson, Joanisse, Desroches, and Ng (2009) demonstrated that, when listening to 717
stimuli varying on a place of articulation continuum from “ball” to “doll”, children with specific 718
language impairment (SLI) showed a significantly shallower categorical identification slope and 719
poorer between-category discrimination when compared to the controls. In contrast, children 720
with RD showed similar patterns in categorical perception tasks to the controls, suggesting that 721
children with RD do not seem to have atypical phonological representations. In addition, no 722
significant correlation was found between individuals’ categorical perception and phonological 723
awareness performance across the entire sample, suggesting no direct relationship between 724
phonological processing skills and phonological representations. Yet, there are a few differences 725
between the current study and Robertson et al. (2009) that may help to explain the seeming 726
SUBPHONEMIC SENSITIVITY AND PHONOLOGICAL SKILLS
53
inconsistency. 727
To begin with, Robertson et al. (2009) employed a group analysis approach as opposed to a 728
continuous approach. Moreover, a close look at performance levels on their categorical 729
discrimination task indicates that the RD group falls between the SLI and control groups. Indeed, 730
a recent study by Ramus et al. (2013) suggests a continuous distribution in the quality of 731
phonological representations across children with typical reading development, with RD, and 732
with SLI. That is to say, the absence of a significant difference between the RD and control 733
groups in Robertson et al. (2009) may be a consequence of a group design with small sample 734
sizes (N = 14 per group). In comparison, consistent with the view of continuous distribution of 735
abilities across typically and atypically developing trajectories, our focus on individual 736
differences in the current study may provide a more statistically powerful approach. 737
Furthermore, the absence of significant correlations between phonological awareness and 738
categorical perception measures in Robertson et al.’s (2009) study may be attributed to two 739
factors. First, Robertson et al. (2009) used but a single measure of phonological awareness (i.e., 740
the phoneme elision subtest from CTOPP), which may not capture the fuller range of 741
phonological processing skills (e.g., different types of phonological awareness and phonological 742
memory) as we did in the current study. Second, the categorical perception tasks of Robertson et 743
al. (2009) require judgment after perception, which, unlike the eyetracking paradigm in the 744
current study, may fail to reveal automatic responses and subtle changes during online speech 745
processing. Therefore, we argue that phonological-based reading disability indeed involves 746
atypical phonological representations, but sensitive measures and appropriate experimental 747
designs are required to capture subtle variation in individual differences along the ability 748
continuum. 749
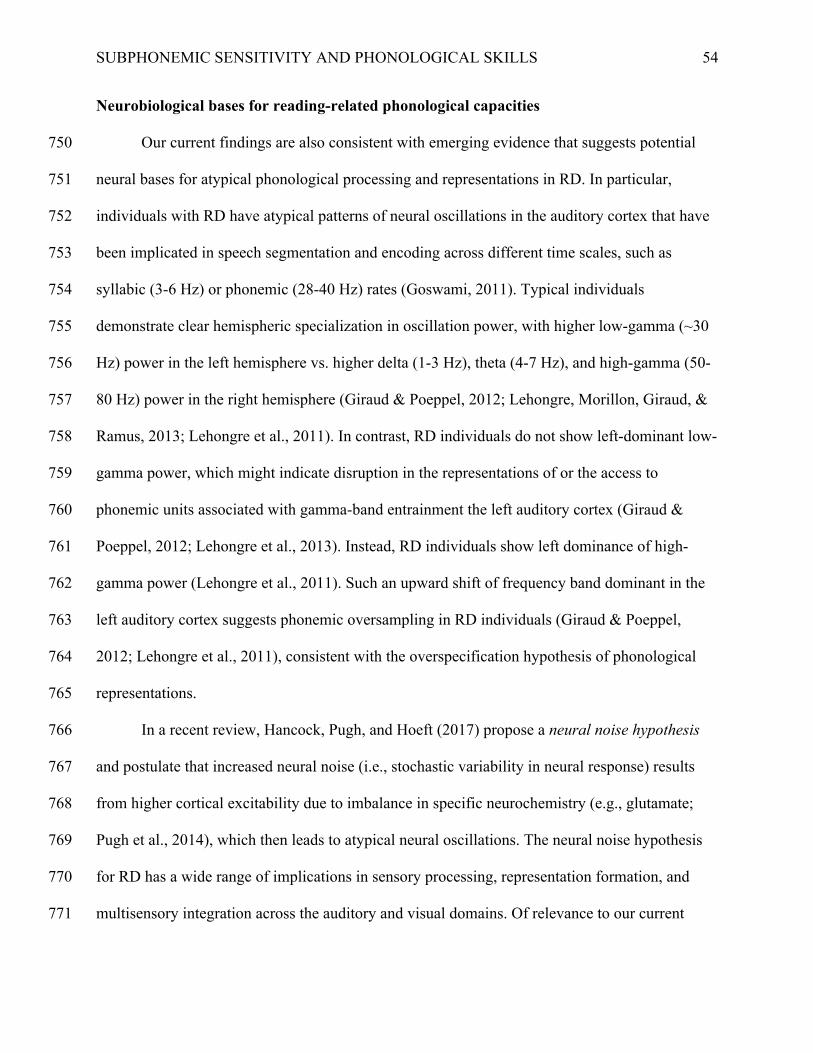
SUBPHONEMIC SENSITIVITY AND PHONOLOGICAL SKILLS
54
Neurobiological bases for reading-related phonological capacities
Our current findings are also consistent with emerging evidence that suggests potential 750
neural bases for atypical phonological processing and representations in RD. In particular, 751
individuals with RD have atypical patterns of neural oscillations in the auditory cortex that have 752
been implicated in speech segmentation and encoding across different time scales, such as 753
syllabic (3-6 Hz) or phonemic (28-40 Hz) rates (Goswami, 2011). Typical individuals 754
demonstrate clear hemispheric specialization in oscillation power, with higher low-gamma (~30 755
Hz) power in the left hemisphere vs. higher delta (1-3 Hz), theta (4-7 Hz), and high-gamma (50-756
80 Hz) power in the right hemisphere (Giraud & Poeppel, 2012; Lehongre, Morillon, Giraud, & 757
Ramus, 2013; Lehongre et al., 2011). In contrast, RD individuals do not show left-dominant low-758
gamma power, which might indicate disruption in the representations of or the access to 759
phonemic units associated with gamma-band entrainment the left auditory cortex (Giraud & 760
Poeppel, 2012; Lehongre et al., 2013). Instead, RD individuals show left dominance of high-761
gamma power (Lehongre et al., 2011). Such an upward shift of frequency band dominant in the 762
left auditory cortex suggests phonemic oversampling in RD individuals (Giraud & Poeppel, 763
2012; Lehongre et al., 2011), consistent with the overspecification hypothesis of phonological 764
representations. 765
In a recent review, Hancock, Pugh, and Hoeft (2017) propose a neural noise hypothesis 766
and postulate that increased neural noise (i.e., stochastic variability in neural response) results 767
from higher cortical excitability due to imbalance in specific neurochemistry (e.g., glutamate; 768
Pugh et al., 2014), which then leads to atypical neural oscillations. The neural noise hypothesis 769
for RD has a wide range of implications in sensory processing, representation formation, and 770
multisensory integration across the auditory and visual domains. Of relevance to our current 771
SUBPHONEMIC SENSITIVITY AND PHONOLOGICAL SKILLS
55
findings, Hancock et al. (2017) propose that neural noise in the auditory domain may affect the 772
time window for sensory processing and integration that is crucial for learning speech and non-773
speech sound categories (e.g., Gabay & Holt, 2015; Vandermosten et al., 2010). 774
The neural noise hypothesis, however, may not be able to distinguish between under- vs. 775
overspecified representations implicated in phonological processing. On the one hand, with 776
increased neural noise and spike variability, stimulus representations may become less robust or 777
“fuzzy”, as the underspecification hypothesis postulates. On the other hand, cortical 778
hyperexcitability may affect the time window of sensory processing necessary for learning sound 779
categories, such that affected individuals may not develop fine-tuned phonological 780
representations ideal for a given language (cf. Kuhl et al., 2006) and instead retain overspecified 781
representations that lead to allophonic perception (Serniclaes, 2006). 782
Therefore, it will be fruitful to further investigate individual differences in the neural 783
underpinnings for phonological representations in future research. Specifically, the 784
spectrotemporal sensitivity of the superior temporal gyrus (STG) has been linked to sensitivity to 785
phonetic features, such as voice onset time, place of articulation, and formant frequency (for a 786
review, see Leonard & Chang, 2014). Given functional and structural deviations in the STG 787
(Maisog, Einbinder, Flowers, Turkeltaub, & Eden, 2008; Paulesu et al., 2001; Simos et al., 2002; 788
Steinbrink et al., 2008) and heightened sensitivity to phonetic features (e.g., Bogliotti et al., 789
2008; Noordenbos et al., 2013, 2012a, 2012b; Serniclaes et al., 2004) observed in individuals 790
with RD, a closer examination of STG activity as a function of phonological skills and reading 791
ability may shed light on neural signatures that characterize the grain size of phonological 792
representations. In addition, individual differences in STG activity may also be informative of 793
the interaction between phonological grain size and lexical knowledge (for lexically-mediated 794
SUBPHONEMIC SENSITIVITY AND PHONOLOGICAL SKILLS
56
phonological processing in STG, see Gow, Segawa, Ahlfors, & Lin, 2008; Myers & Blumstein, 795
2008) that is likely to have substantial implications in various aspects of language processing. 796
Conclusion
Individual differences in subphonemic sensitivity during spoken word recognition and in 797
standardized phonological performance tasks suggest that lower phonological skills are 798
associated with higher subphonemic sensitivity, indicating overspecified phonological 799
representations. Our findings provide new insights into how phonological representations may 800
play a role in phonological skills implicated in reading ability. Individual differences in 801
phonological representations implicated in the current study may guide future neurobiological 802
work, deepening our knowledge about the underlying mechanisms and factors that contribute to 803
the dynamic between phonological processing and reading skills.804
SUBPHONEMIC SENSITIVITY AND PHONOLOGICAL SKILLS
57
References
Aikens, N. L., & Barbarin, O. (2008). Socioeconomic differences in reading trajectories: The contribution of family, neighborhood, and school contexts. Journal of Educational Psychology, 100(2), 235–251. https://doi.org/10.1037/0022-0663.100.2.235
Allopenna, P. D., Magnuson, J. S., & Tanenhaus, M. K. (1998). Tracking the Time Course of Spoken Word Recognition Using Eye Movements: Evidence for Continuous Mapping Models. Journal of Memory and Language, 38(4), 419–439. https://doi.org/10.1006/jmla.1997.2558
Altmann, G. T. M., & Kamide, Y. (2009). Discourse-mediation of the mapping between language and the visual world: Eye movements and mental representation. Cognition, 111(1), 55–71. https://doi.org/10.1016/j.cognition.2008.12.005
Anthony, J. L., Williams, J. M., Aghara, R. G., Dunkelberger, M., Novak, B., & Mukherjee, A. D. (2010). Assessment of individual differences in phonological representation. Reading and Writing, 23(8), 969–994. https://doi.org/10.1007/s11145-009-9185-7
Bates, D., Mächler, M., Bolker, B., & Walker, S. (2015). Fitting Linear Mixed-Effects Models Using {lme4}. Journal of Statistical Software, 67(1), 1–48. https://doi.org/10.18637/jss.v067.i01
Blachman, B. A. (1984). Relationship of rapid naming ability and language analysis skills to kindergarten and first-grade reading achievement. Journal of Educational Psychology, 76(4), 610–622. https://doi.org/10.1037/0022-0663.76.4.610
Bogliotti, C., Serniclaes, W., Messaoud-Galusi, S., & Sprenger-Charolles, L. (2008). Discrimination of speech sounds by children with dyslexia: Comparisons with chronological age and reading level controls. Journal of Experimental Child Psychology, 101(2), 137–155. https://doi.org/10.1016/j.jecp.2008.03.006
Box, G. E. P., & Cox, D. R. (1964). An Analysis of Transformations. Journal of the Royal Statistical Society. Series B (Methodological), 26(2), 211–252.
Brady, S. A. (2011). Efficacy of Phonics Teaching for Reading Outcomes: Indications from Post-NRP Research. In S. A. Brady, D. Braze, & C. A. Fowler (Eds.), Explaining individual differences in reading: Theory and evidence (pp. 69–96). New York, NY: Psychology Press. https://doi.org/10.4324/9780203817964
Brady, S. A., Braze, D., & Fowler, C. A. (Eds.). (2011). Explaining Individual Differences in Reading: Theory and Evidence. New York, NY: Psychology Press.
SUBPHONEMIC SENSITIVITY AND PHONOLOGICAL SKILLS
58
Braze, D., Katz, L., Magnuson, J. S., Mencl, W. E., Tabor, W., Van Dyke, J. A., … Shankweiler, D. P. (2016). Vocabulary does not complicate the simple view of reading. Reading and Writing, 29(3), 435–451. https://doi.org/10.1007/s11145-015-9608-6
Braze, D., Tabor, W., Shankweiler, D. P., & Mencl, W. E. (2007). Speaking up for vocabulary: reading skill differences in young adults. Journal of Learning Disabilities, 40(3), 226–243. https://doi.org/10.1177/00222194070400030401
Bruck, M. (1992). Persistence of dyslexics’ phonological awareness deficits. Developmental Psychology, 28(5), 874–886. https://doi.org/10.1037/0012-1649.28.5.874
Byrne, B., & Fielding-Barnsley, R. (1991). Evaluation of a program to teach phonemic awareness to young children. Journal of Educational Psychology, 83(4), 451–455. https://doi.org/10.1037/0022-0663.83.4.451
Catts, H. W., & Adolph, S. M. (2011). Phonological and other language deficits associated with dyslexia. In S. A. Brady, D. Braze, & C. A. Fowler (Eds.), Explaining individual differences in reading: Theory and evidence (pp. 137–151). New York, NY: Psychology Press.
Catts, H. W., McIlraith, A., Bridges, M. S., & Nielsen, D. C. (2017). Viewing a phonological deficit within a multifactorial model of dyslexia. Reading and Writing, 30(3), 613–629. https://doi.org/10.1007/s11145-016-9692-2
Chambers, C. G., Tanenhaus, M. K., & Magnuson, J. S. (2004). Actions and affordances in syntactic ambiguity resolution. Journal of Experimental Psychology. Learning, Memory, and Cognition, 30(3), 687–696. https://doi.org/10.1037/0278-7393.30.3.687
Clark, N. B., McRoberts, G. W., Van Dyke, J. A., Shankweiler, D. P., & Braze, D. (2012). Immediate memory for pseudowords and phonological awareness are associated in adults and pre-reading children. Clinical Linguistics & Phonetics, 26(7), 577–596. https://doi.org/10.3109/02699206.2012.673045
Cross, A. M., & Joanisse, M. F. (2018). Eyetracking of coarticulatory cue responses in children and adults. Language, Cognition and Neuroscience, 33(10), 1315–1324. https://doi.org/10.1080/23273798.2018.1484148
Coley, R. J. (2002). An uneven start: Indicators of inequality in school readiness. Princeton, NJ: Educational Testing Service. Retrieved from http://www.ets.org/research/pic
Corkin, S. (1974). Serial-ordering deficits in inferior readers. Neuropsychologia, 12(3), 347–354. https://doi.org/10.1016/0028-3932(74)90050-5
Dahan, D., Magnuson, J. S., Tanenhaus, M. K., & Hogan, E. M. (2001). Subcategorical mismatches and the time course of lexical access: Evidence for lexical competition. Language and Cognitive Processes, 16(5–6), 507–534. https://doi.org/10.1080/01690960143000074
SUBPHONEMIC SENSITIVITY AND PHONOLOGICAL SKILLS
59
Daneman, M., & Carpenter, P. A. (1980). Individual differences in working memory and reading. Journal of Verbal Learning and Verbal Behavior, 19(4), 450–466.
Desroches, A. S., Joanisse, M. F., & Robertson, E. K. (2006). Specific phonological impairments in dyslexia revealed by eyetracking. Cognition, 100(3), 32–42. https://doi.org/10.1016/j.cognition.2005.09.001
Dunn, L. M., & Dunn, L. M. (1997). Peabody Picture Vocabulary Test (3rd ed.). Circle Pines, MN: American Guidance Service, Inc.
Elbro, C. (1998). When reading is “readn” or somthn. Distinctness of phonological representations of lexical items in normal and disabled readers. Scandinavian Journal of Psychology, 39(3), 149–153. https://doi.org/10.1111/1467-9450.393070
Elbro, C., Borstrøm, I., & Petersen, D. K. (1998). Predicting dyslexia from kindergarten: the importance of distinctiveness of phonological represetations of lexical items. Reading Research Quarterly, 33(1), 36–60. https://doi.org/10.1598/RRQ.33.1.3
Elliott, J. G., & Grigorenko, E. L. (2014). The dyslexia debate. Cambridge University Press.
Elwér, Å., Gustafson, S., Byrne, B., Olson, R. K., Keenan, J. M., & Samuelsson, S. (2015). A retrospective longitudinal study of cognitive and language skills in poor reading comprehension. Scandinavian Journal of Psychology, 56(2), 157–166. https://doi.org/10.1111/sjop.12188
Engelhardt, P. E., Bailey, K. G. D., & Ferreira, F. (2006). Do speakers and listeners observe the Gricean Maxim of Quantity? Journal of Memory and Language, 54(4), 554–573. https://doi.org/10.1016/j.jml.2005.12.009
Fischer, B. (1992). Saccadic Reaction Time: Implications for Reading, Dyslexia, and Visual Cognition. In Eye movements and visual cognition (pp. 31–45). Springer New York. https://doi.org/10.1007/978-1-4612-2852-3_3
Fox, J., & Weisberg, S. (2011). An {R} Companion to Applied Regression (Second). Thousand Oaks CA: Sage. Retrieved from http://socserv.socsci.mcmaster.ca/jfox/Books/Companion
Frost, R. (1998). Toward a strong phonological theory of visual word recognition: true issues and false trails. Psychological Bulletin, 123(1), 71–99. Retrieved from http://www.ncbi.nlm.nih.gov/pubmed/9461854
Frost, S. J., Landi, N., Mencl, W. E., Sandak, R., Fulbright, R. K., Tejada, E. T., … Pugh, K. R. (2009). Phonological awareness predicts activation patterns for print and speech. Annals of Dyslexia, 59(1), 78–97. https://doi.org/10.1007/s11881-009-0024-y
Gabay, Y., & Holt, L. L. (2015). Incidental learning of sound categories is impaired in developmental dyslexia. Cortex, 73, 131–143. https://doi.org/10.1016/j.cortex.2015.08.008
SUBPHONEMIC SENSITIVITY AND PHONOLOGICAL SKILLS
60
Gallagher, A., Frith, U., & Snowling, M. J. (2000). Precursors of literacy delay among children at genetic risk of dyslexia. Journal of Child Psychology and Psychiatry, and Allied Disciplines, 41(2), 203–213. https://doi.org/10.1017/S0021963099005284
Giraud, A.-L., & Poeppel, D. (2012). Cortical oscillations and speech processing: emerging computational principles and operations. Nature Neuroscience, 15(4), 511–517. https://doi.org/10.1038/nn.3063
Goswami, U. (2011). A temporal sampling framework for developmental dyslexia. Trends in Cognitive Sciences, 15(1), 3–10. https://doi.org/10.1016/j.tics.2010.10.001
Goswami, U., & Bryant, P. (1989). The interpretation of studies using the reading level design. Journal of Literacy Research, 21(4), 413–424. https://doi.org/10.1080/10862968909547687
Gow, D. W., Segawa, J. A., Ahlfors, S. P., & Lin, F.-H. (2008). Lexical influences on speech perception: A Granger causality analysis of MEG and EEG source estimates. NeuroImage, 43(3), 614–623. https://doi.org/10.1016/j.neuroimage.2008.07.027
Guttorm, T. K., Leppänen, P. H. T., Poikkeus, A.-M., Eklund, K. M., Lyytinen, P., & Lyytinen, H. (2005). Brain event-related potentials ({ERPs}) measured at birth predict later language development in children with and without familial risk for dyslexia. Cortex, 41(3), 291–303. Retrieved from https://www.ncbi.nlm.nih.gov/pubmed/15871595
Guttorm, T. K., Leppänen, P. H., Tolvanen, A., & Lyytinen, H. (2003). Event-related potentials in newborns with and without familial risk for dyslexia: principal component analysis reveals differences between the groups. J Neural Transm, 110(9), 1059–1074. https://doi.org/10.1007/s00702-003-0014-x
Hancock, R., Pugh, K. R., & Hoeft, F. (2017). Neural Noise Hypothesis of Developmental Dyslexia. Trends in Cognitive Sciences, 1–15. https://doi.org/10.1016/j.tics.2017.03.008
Harm, M. W., & Seidenberg, M. S. (1999). Phonology, reading acquisition, and dyslexia: insights from connectionist models. Psychological Review, 106(3), 491–528. https://doi.org/10.1037/0033-295X.106.3.491
Hollingshead, A. B. (1975). Four factor index of social status. New Haven, CT: Yale University, Department of Sociology.
Hoonhorst, I., Colin, C., Markessis, E., Radeau, M., Deltenre, P., & Serniclaes, W. (2009). French native speakers in the making: From language-general to language-specific voicing boundaries. Journal of Experimental Child Psychology, 104(4), 353–366. https://doi.org/10.1016/j.jecp.2009.07.005
Huettig, F., & Altmann, G. T. M. (2005). Word meaning and the control of eye fixation: semantic competitor effects and the visual world paradigm. Cognition, 96(1), B23-32. https://doi.org/10.1016/j.cognition.2004.10.003
SUBPHONEMIC SENSITIVITY AND PHONOLOGICAL SKILLS
61
Johns, C. L., Jahn, A. A., Jones, H. R., Kush, D., Molfese, P. J., Van Dyke, J. A., … Braze, D. (2018). Individual differences in decoding skill, print exposure, and cortical structure in young adults. Language, Cognition and Neuroscience, 1–21. https://doi.org/10.1080/23273798.2018.1476727
Johns, C. L., Matsuki, K., & Van Dyke, J. A. (2015). Poor readers’ retrieval mechanism: Efficient access is not dependent on reading skill. Frontiers in Psychology, 6(OCT), 1–20. https://doi.org/10.3389/fpsyg.2015.01552
Kaiser, E., Runner, J. T., Sussman, R. S., & Tanenhaus, M. K. (2009). Structural and semantic constraints on the resolution of pronouns and reflexives. Cognition, 112(1), 55–80. https://doi.org/10.1016/j.cognition.2009.03.010
Karlson, B., & Gardner, E. (1995). Stanford Diagnostic Reading Test (4th ed.). San Antonio, TX: Psychological Corporation.
Katz, L., Brancazio, L., Irwin, J., Katz, S., Magnuson, J. S., & Whalen, D. H. (2012). What lexical decision and naming tell us about reading. Reading and Writing, 25(6), 1259–1282. https://doi.org/10.1007/s11145-011-9316-9
Kieffer, M. J., Petscher, Y., Proctor, C. P., & Silverman, R. D. (2016). Is the Whole Greater Than the Sum of Its Parts? Modeling the Contributions of Language Comprehension Skills to Reading Comprehension in the Upper Elementary Grades. Scientific Studies of Reading, 20(6), 436–454. https://doi.org/10.1080/10888438.2016.1214591
Kuhl, P. K., Stevens, E., Hayashi, A., Deguchi, T., Kiritani, S., & Iverson, P. (2006). Infants show a facilitation effect for native language phonetic perception between 6 and 12 months. Developmental Science, 9(2), F13–F21. https://doi.org/10.1111/j.1467-7687.2006.00468.x
Kukona, A., Braze, D., Johns, C. L., Mencl, W. E., Van Dyke, J. A., Magnuson, J. S., … Tabor, W. (2016). The real-time prediction and inhibition of linguistic outcomes: Effects of language and literacy skill. Acta Psychologica, 171, 72–84. https://doi.org/10.1016/j.actpsy.2016.09.009
Lehongre, K., Morillon, B., Giraud, A.-L., & Ramus, F. (2013). Impaired auditory sampling in dyslexia: further evidence from combined fMRI and EEG. Frontiers in Human Neuroscience, 7(August), 454. https://doi.org/10.3389/fnhum.2013.00454
Lehongre, K., Ramus, F., Villiermet, N., Schwartz, D., & Giraud, A.-L. (2011). Altered Low-Gamma Sampling in Auditory Cortex Accounts for the Three Main Facets of Dyslexia. Neuron, 72(6), 1080–1090. https://doi.org/10.1016/j.neuron.2011.11.002
Leonard, M. K., & Chang, E. F. (2014). Dynamic speech representations in the human temporal lobe. Trends in Cognitive Sciences, 18(9), 472–479. https://doi.org/10.1016/j.tics.2014.05.001
SUBPHONEMIC SENSITIVITY AND PHONOLOGICAL SKILLS
62
Liberman, A. M., & Mattingly, I. G. (1985). The motor theory of speech perception revised. Cognition, 21(1), 1–36. https://doi.org/10.1016/0010-0277(85)90021-6
Liberman, I. Y. (1973). Segmentation of the spoken word and reading acquisition. Bulletin of the Orton Society, 23(1), 64–77. https://doi.org/10.1007/BF02653842
Lisker, L., & Abramson, A. S. (1964). A Cross-language Study of Voicing in Initial Stops: Acoustical Measurements. WORD, 20(3), 384–422. https://doi.org/10.1080/00437956.1964.11659830
Luce, P. A. (1986). Neighborhoods of Words in the Mental Lexicon. Research on Speech Perception. Technical Report No. 6. (Doctoral Dissertation). Indiana University.
Lyytinen, H., Aro, M., Eklund, K., Erskine, J., Guttorm, T., Laakso, M.-L., … Torppa, M. (2004). The development of children at familial risk for dyslexia: birth to early school age. Ann Dyslexia, 54(2), 184–220. Retrieved from https://www.ncbi.nlm.nih.gov/pubmed/15741935
MacGinitie, W. H., MacGinitie, R. K., Maria, K., & Dreyer, L. G. (2000). Gates-MacGinitie Reading Tests Level AR: Directions for Administration. Itasca, IL: Riverside Publishing.
Magnuson, J. S., Dixon, J. A., Tanenhaus, M. K., & Aslin, R. N. (2007). The Dynamics of Lexical Competition During Spoken Word Recognition. Cognitive Science, 31(1), 133–156. https://doi.org/10.1080/03640210709336987
Magnuson, J. S., Tanenhaus, M. K., & Aslin, R. N. (2008). Immediate effects of form-class constraints on spoken word recognition. Cognition, 108(3), 866–873. https://doi.org/10.1016/j.cognition.2008.06.005
Magnuson, J. S., Tanenhaus, M. K., Aslin, R. N., & Dahan, D. (2003). The time course of spoken word learning and recognition: studies with artificial lexicons. Journal of Experimental Psychology. General, 132(2), 202–227. https://doi.org/10.1037/0096-3445.132.2.202
Maisog, J. M., Einbinder, E. R., Flowers, D. L., Turkeltaub, P. E., & Eden, G. F. (2008). A meta-analysis of functional neuroimaging studies of dyslexia. Annals of the New York Academy of Sciences, 1145, 237–259. https://doi.org/10.1196/annals.1416.024
Markwardt, F. C. (1989). Peabody Individual Achievement Test - Revised. Circle Pines, MN: American Guidance Service, Inc.
Marslen-Wilson, W., & Warren, P. (1994). Levels of perceptual representation and process in lexical access: Words, phonemes, and features. Psychological Review, 101(4), 653–675. https://doi.org/10.1037/0033-295X.101.4.653
SUBPHONEMIC SENSITIVITY AND PHONOLOGICAL SKILLS
63
McClelland, J. L., & Elman, J. L. (1986). The TRACE model of speech perception. Cognitive Psychology, 18(1), 1–86. https://doi.org/10.1016/0010-0285(86)90015-0
McDougall, S., Hulme, C., Ellis, a, & Monk, a. (1994). Learning to read: the role of short-term memory and phonological skills. Journal of Experimental Child Psychology. https://doi.org/10.1006/jecp.1994.1028
McMurray, B., Aslin, R. N., Tanenhaus, M. K., Spivey, M. J., & Subik, D. (2008). Gradient sensitivity to within-category variation in words and syllables. Journal of Experimental Psychology. Human Perception and Performance, 34(6), 1609–1631. https://doi.org/10.1037/a0011747
McMurray, B., Munson, C., & Tomblin, J. B. (2014). Individual Differences in Language Ability Are Related to Variation in Word Recognition, Not Speech Perception: Evidence From Eye Movements. Journal of Speech Language and Hearing Research, 57(4), 1344. https://doi.org/10.1044/2014_JSLHR-L-13-0196
Mirman, D. (2014). Growth Curve Analysis and Visualization Using R. Chapman & Hall/CRC.
Mirman, D., Dixon, J. A., & Magnuson, J. S. (2008). Statistical and computational models of the visual world paradigm: Growth curves and individual differences. Journal of Memory and Language, 59(4), 475–494. https://doi.org/10.1016/j.jml.2007.11.006
Molfese, D. L. (2000). Predicting dyslexia at 8 years of age using neonatal brain responses. Brain Lang, 72(3), 238–245. https://doi.org/10.1006/brln.2000.2287
Molfese, D. L., & Molfese, V. J. (1997). Discrimination of language skills at five years of age using event-related potentials recorded at birth. Dev Neuropsychol, 13(2), 135–156. https://doi.org/10.1080/87565649709540674
Molfese, V. J., Molfese, D. L., & Modgline, A. A. (2001). Newborn and preschool predictors of second-grade reading scores: an evaluation of categorical and continuous scores. J Learn Disabil, 34(6), 545–554. https://doi.org/10.1177/002221940103400607
Myers, E. B., & Blumstein, S. E. (2008). The neural bases of the lexical effect: An fMRI investigation. Cerebral Cortex, 18(2), 278–288. https://doi.org/10.1093/cercor/bhm053
Noordenbos, M. W., Segers, E., Serniclaes, W., Mitterer, H., & Verhoeven, L. (2012a). Allophonic mode of speech perception in Dutch children at risk for dyslexia: A longitudinal study. Research in Developmental Disabilities, 33(5), 1469–1483. https://doi.org/10.1016/j.ridd.2012.03.021
Noordenbos, M. W., Segers, E., Serniclaes, W., Mitterer, H., & Verhoeven, L. (2012b). Neural evidence of allophonic perception in children at risk for dyslexia. Neuropsychologia, 50(8), 2010–2017. https://doi.org/10.1016/j.neuropsychologia.2012.04.026
SUBPHONEMIC SENSITIVITY AND PHONOLOGICAL SKILLS
64
Noordenbos, M. W., Segers, E., Serniclaes, W., & Verhoeven, L. (2013). Neural evidence of the allophonic mode of speech perception in adults with dyslexia. Clinical Neurophysiology, 124(6), 1151–1162. https://doi.org/10.1016/j.clinph.2012.12.044
O’Brien, G. E., McCloy, D. R., Kubota, E. C., & Yeatman, J. D. (2018). Reading ability and phoneme categorization. Scientific Reports, 8(1), 16842. https://doi.org/10.1038/s41598-018-34823-8
Paulesu, E., Démonet, J.-F., Fazio, F., McCrory, E., Chanoine, V., Brunswick, N., … Frith, U. (2001). Dyslexia: Cultural Diversity and Biological Unity. Science, 291(5511), 2165–2167. https://doi.org/10.1126/science.1057179
Pennington, B. F. (2006). From single to multiple deficit models of developmental disorders. Cognition, 101(2), 385–413. https://doi.org/10.1016/j.cognition.2006.04.008
Perfetti, C. (2007). Reading Ability: Lexical Quality to Comprehension. Scientific Studies of Reading, 11(4), 357–383. https://doi.org/10.1080/10888430701530730
Preston, J. L., Molfese, P. J., Frost, S. J., Mencl, W. E., Fulbright, R. K., Hoeft, F., … Pugh, K. R. (2016). Print-Speech Convergence Predicts Future Reading Outcomes in Early Readers. Psychological Science, 27(1), 75–84. https://doi.org/10.1177/0956797615611921
Pugh, K. R., Frost, S. J., Rothman, D. L., Hoeft, F., Del Tufo, S. N., Mason, G. F., … Fulbright, R. K. (2014). Glutamate and choline levels predict individual differences in reading ability in emergent readers. The Journal of Neuroscience : The Official Journal of the Society for Neuroscience, 34(11), 4082–4089. https://doi.org/10.1523/JNEUROSCI.3907-13.2014
Puolakanaho, A., Ahonen, T., Aro, M., Eklund, K., Leppänen, P. H. T., Poikkeus, A.-M., … Lyytinen, H. (2007). Very early phonological and language skills: estimating individual risk of reading disability. Journal of Child Psychology and Psychiatry, 48(9), 923–931. https://doi.org/10.1111/j.1469-7610.2007.01763.x
R Core Team. (2018). R: A Language and Environment for Statistical Computing. Vienna, Austria: R Foundation for Statistical Computing. Retrieved from https://www.r-project.org/
Ramus, F. (2003). Developmental dyslexia: Specific phonological deficit or general sensorimotor dysfunction? Current Opinion in Neurobiology, 13(2), 212–218. https://doi.org/10.1016/S0959-4388(03)00035-7
Ramus, F., Marshall, C. R., Rosen, S., & Van Der Lely, H. K. J. (2013). Phonological deficits in specific language impairment and developmental dyslexia: Towards a multidimensional model. Brain, 136(2), 630–645. https://doi.org/10.1093/brain/aws356
Robertson, E. K., Joanisse, M. F., Desroches, A. S., & Ng, S. (2009). Categorical speech perception deficits distinguish language and reading impairments in children. Developmental Science, 12(5), 753–767. https://doi.org/10.1111/j.1467-7687.2009.00806.x
SUBPHONEMIC SENSITIVITY AND PHONOLOGICAL SKILLS
65
Scarborough, H. S. (1989). Prediction of reading disability from familial and individual differences. Journal of Educational Psychology, 81(1), 101–108. https://doi.org/10.1037//0022-0663.81.1.101
Serniclaes, W. (2006). Allophonic perception in developmental dyslexia: Origin, reliability and implications of the categorical perception deficit. Written Language & Literacy, 9(1), 135–152. https://doi.org/10.1075/wll.9.1.09ser
Serniclaes, W., Sprenger-Charolles, L., Carré, R., & Démonet, J.-F. (2001). Perceptual Discrimination of Speech Sounds in Developmental Dyslexia. Journal of Speech Language and Hearing Research, 44(2), 384. https://doi.org/10.1044/1092-4388(2001/032)
Serniclaes, W., Van Heghe, S., Mousty, P., Carré, R., & Sprenger-Charolles, L. (2004). Allophonic mode of speech perception in dyslexia. Journal of Experimental Child Psychology, 87(4), 336–361. https://doi.org/10.1016/j.jecp.2004.02.001
Shankweiler, D., Mencl, W. E., Braze, D., Tabor, W., Pugh, K. R., & Fulbright, R. K. (2008). Reading Differences and Brain: Cortical Integration of Speech and Print in Sentence Processing Varies With Reader Skill. Developmental Neuropsychology, 33(6), 745–775. https://doi.org/10.1080/87565640802418688
Shankweiler, D. P., Liberman, I. Y., Mark, L. S., Fowler, C. A., & Fischer, F. W. (1979). The speech code and learning to read. Journal of Experimental Psychology: Human Learning and Memory, 5(6), 531–545. https://doi.org/10.1037/0278-7393.5.6.531
Simos, P. G., Fletcher, J. M., Bergman, E., Breier, J. I., Foorman, B. R., Castillo, E. M., … Papanicolaou, A. C. (2002). Dyslexia-specific brain activation profile becomes normal following successful remedial training. Neurology, 58(8), 1203–1213. https://doi.org/10.1212/WNL.58.8.1203
Snowling, M. J. (2008). Specific disorders and broader phenotypes: The case of dyslexia. Quarterly Journal of Experimental Psychology, 61(1), 142–156. https://doi.org/10.1080/17470210701508830
Snowling, M. J., Gallagher, A., & Frith, U. (2003). Family Risk of Dyslexia Is Continuous: Individual Differences in the Precursors of Reading Skill. Child Development, 74(2), 358–373. Retrieved from http://www.jstor.org/stable/3696318
Snowling, M. J., & Hayiou-Thomas, M. E. (2006). The Dyslexia Spectrum. Topics in Language Disorders, 26(2), 110–126. https://doi.org/10.1097/00011363-200604000-00004
Spencer, S., Clegg, J., Stackhouse, J., & Rush, R. (2016). Contribution of spoken language and socio-economic background to adolescents’ educational achievement at age 16 years. International Journal of Language & Communication Disorders, (1), 184–196. https://doi.org/10.1111/1460-6984.12264
SUBPHONEMIC SENSITIVITY AND PHONOLOGICAL SKILLS
66
Stanovich, K. E. (1988). Explaining the Differences Between the Dyslexic and the Garden-Variety Poor Reader: The Phonological-Core Variable-Difference Model. Journal of Learning Disabilities, 21(10), 590–604. https://doi.org/10.1177/002221948802101003
Stanovich, K. E., & Cunningham, A. E. (1992). Studying the consequences of literacy within a literate society: the cognitive correlates of print exposure. Memory and Cognition, 20(1), 51–68. https://doi.org/10.3758/BF03208254
Steinbrink, C., Vogt, K., Kastrup, A., Müller, H. P., Juengling, F. D., Kassubek, J., & Riecker, A. (2008). The contribution of white and gray matter differences to developmental dyslexia: Insights from DTI and VBM at 3.0 T. Neuropsychologia, 46(13), 3170–3178. https://doi.org/10.1016/j.neuropsychologia.2008.07.015
Tallal, P. (1980). Auditory temporal perception, phonics, and reading disabilities in children. Brain and Language, 9(2), 182–198. https://doi.org/10.1016/0093-934X(80)90139-X
Tallal, P., Merzenich, M. M., Miller, S., & Jenkins, W. (1998). Language learning impairments: Integrating basic science, technology, and remediation. Experimental Brain Research, 123(1–2), 210–219. https://doi.org/10.1007/s002210050563
Tanenhaus, M. K., Spivey-Knowlton, M. J., Eberhard, K. M., & Sedivy, J. C. (1995). Integration of visual and linguistic information in spoken language comprehension. Science, 268(5217), 1632–1634. https://doi.org/10.1126/science.7777863
Torgesen, J. K., Wagner, R. K., & Rashotte, C. A. (1999). Tests of Word Reading Efficiency (TOWRE). Austin, TX: Pro-Ed.
Tunmer, W. E., & Chapman, J. W. (2012). Does Set for Variability Mediate the Influence of Vocabulary Knowledge on the Development of Word Recognition Skills? Scientific Studies of Reading, 16(2), 122–140. https://doi.org/10.1080/10888438.2010.542527
van Buuren, S., & Groothuis-Oudshoorn, K. (2011). mice : Multivariate Imputation by Chained Equations in R. Journal of Statistical Software, 45(3), 1–67. https://doi.org/10.18637/jss.v045.i03
Van Dyke, J. A., Johns, C. L., & Kukona, A. (2014). Low working memory capacity is only spuriously related to poor reading comprehension. Cognition, 131(3), 373–403. https://doi.org/10.1016/j.cognition.2014.01.007
Vandermosten, M., Boets, B., Luts, H., Poelmans, H., Golestani, N., Wouters, J., & Ghesquiere, P. (2010). Adults with dyslexia are impaired in categorizing speech and nonspeech sounds on the basis of temporal cues. Proceedings of the National Academy of Sciences, 107(23), 10389–10394. https://doi.org/10.1073/pnas.0912858107
Venables, W. N., & Ripley, B. D. (2002). Modern Applied Statistics with S (Fourth). New York: Springer.
SUBPHONEMIC SENSITIVITY AND PHONOLOGICAL SKILLS
67
Venezky, R. L. (1999). The American way of spelling: The structure and origins of American English orthography. Guilford Press.
Viviani, P. (1990). Eye movements in visual search: Cognitive, perceptual, and motor control aspects. In E. Kowler (Ed.), Eye movements and their role in visual and cognitive processes (pp. 353–393). Amsterdam: Elsevier.
Wagner, R. K., Torgesen, J. K., & Rashotte, C. A. (1999). The comprehensive test of phonological processing (CTOPP). Austin, TX: Pro-Ed.
Wechsler, D. (1999). Wechsler Abbreviated Scale of Intelligence. New York, NY: The Psychological Corporation: Harcourt Brace & Company.
Wiederholt, J. L., & Bryant, B. R. (2001). Gray Oral Reading Test (GORT) (4th ed.). Austin, TX: Pro-Ed.
Wolf, M., & Bowers, P. G. (1999). The double-deficit hypothesis for the developmental dyslexias. Journal of Educational Psychology, 91(3), 415–438. https://doi.org/10.1037//0022-0663.91.3.415
Woodcock, R. W., McGrew, K. S., & Mather, N. (2001). Woodcock-Johnson III Tests of Achievement. Itasca, IL: Riverside Publishing.

SUBPHONEMIC SENSITIVITY AND PHONOLOGICAL SKILLS
68
Author Notes
The data and analysis code of the current study are available at https://osf.io/6rd2u/files/.
A preliminary report of the current study (N = 32) was reported by Magnuson et al. (2011). We
thank Joshua Coppola and Erica Davis for their help with this project. This work was supported
by US National Institutes of Health [grant numbers R01 HD40353, R01 HD071988] to Haskins
Laboratories.
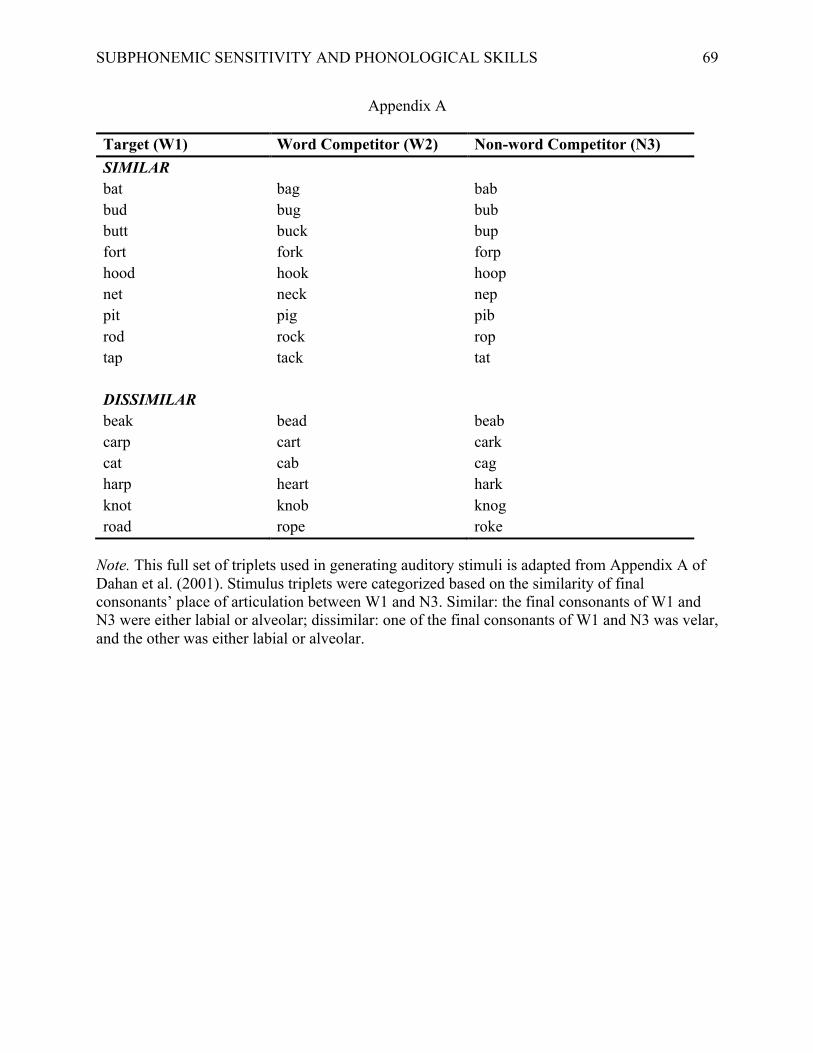
SUBPHONEMIC SENSITIVITY AND PHONOLOGICAL SKILLS
69
Appendix A
Target (W1) Word Competitor (W2) Non-word Competitor (N3) SIMILAR bat bag bab bud bug bub butt buck bup fort fork forp hood hook hoop net neck nep pit pig pib rod rock rop tap tack tat DISSIMILAR beak bead beab carp cart cark cat cab cag harp heart hark knot knob knog road rope roke
Note. This full set of triplets used in generating auditory stimuli is adapted from Appendix A of Dahan et al. (2001). Stimulus triplets were categorized based on the similarity of final consonants’ place of articulation between W1 and N3. Similar: the final consonants of W1 and N3 were either labial or alveolar; dissimilar: one of the final consonants of W1 and N3 was velar, and the other was either labial or alveolar.
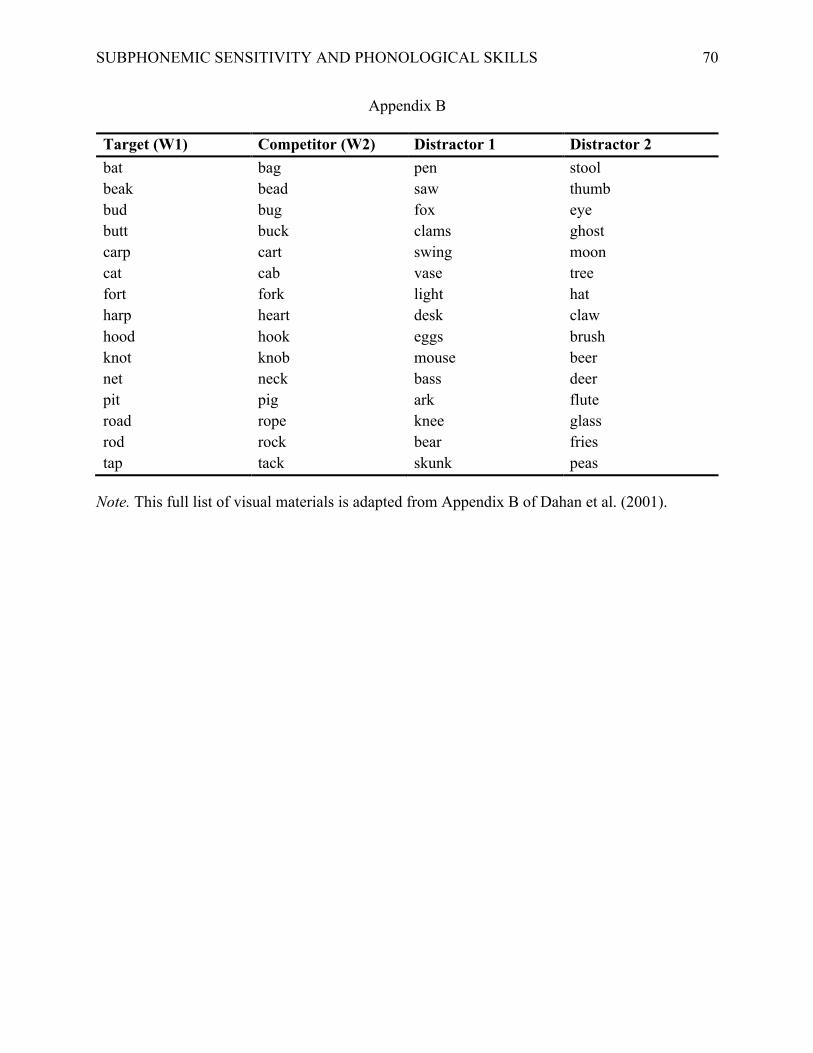
SUBPHONEMIC SENSITIVITY AND PHONOLOGICAL SKILLS
70
Appendix B
Target (W1) Competitor (W2) Distractor 1 Distractor 2 bat bag pen stool beak bead saw thumb bud bug fox eye butt buck clams ghost carp cart swing moon cat cab vase tree fort fork light hat harp heart desk claw hood hook eggs brush knot knob mouse beer net neck bass deer pit pig ark flute road rope knee glass rod rock bear fries tap tack skunk peas
Note. This full list of visual materials is adapted from Appendix B of Dahan et al. (2001).
SUBPHONEMIC SENSITIVITY AND PHONOLOGICAL SKILLS
71
Supplemental Materials
1. Data and Analysis Scripts
The data and analysis code of the current study are available at https://osf.io/6rd2u/files/.
2. Generalized Additive Mixed Model (GAMM) Analysis on Target Fixation Proportions
An exploratory analysis with generalized additive mixed modeling (GAMM) on target
fixation proportions was suggested by a reviewer, Dr. A. Protopapas. The GAMM results
converge with the growth curve analysis (GCA; Magnuson, Dixon, Tanenhaus, & Aslin, 2007;
Mirman, 2014; Mirman, Dixon, & Magnuson, 2008) presented in the main text, suggesting the
robustness of the observed effects.
Benefits of the GAMM approach include: (1) the ability to account for autocorrelation
often present in time-series data, (2) the ability to fit complex nonlinear curves more easily and
flexibly with smooth terms, where a smooth term consists of a smoothing spline (i.e., piecewise
polynomial function) and a penalization method for “wiggliness” to optimize function fit, and (3)
the ability to model multidimensional continuous interactions in a straightforward way (Baayen,
van Rij, de Cat, & Wood, 2016; Baayen, Vasishth, Kliegl, & Bates, 2017; Porretta, Kyröläinen,
van Rij, & Järvikivi, 2018b; van Rij, 2015; Wieling, 2018; Winter & Wieling, 2016). Despite its
advantages for fitting time-series data, GAMM has not been used to analyze eyetracking data
until recently (Porretta et al., 2018b). To our knowledge, to date, there have been no direct
comparisons of GCA and GAMM analysis of Visual World data.
We conducted our GAMM analysis in the R statistical environment (version 3.5.0; R
Core Team, 2018). The following R packages were used for preprocessing the eyetracking data,
model fitting, and visualization: VWPre (version 1.1.0; Porretta, Kyröläinen, van Rij, &
SUBPHONEMIC SENSITIVITY AND PHONOLOGICAL SKILLS
72
Järvikivi, 2018a), mgcv (version 1.8-23; Wood, 2017), and itsadug (version 2.3; van Rij,
Wieling, Baayen, & van Rijn, 2017).
2.1. GAMM analysis preprocessing
In order to use the Gaussian distribution to control for autocorrelation in the time series,
proportion data generated in the VWP procedure were submitted to the empirical logit (an
approximation to log odds) transformation with weights for variance estimation (Porretta et al.,
2018a, 2018b). Further, the critical word onset of each trial was marked as the beginning of each
time series to prepare for autocorrelation using itsadug::start_event() (van Rij, 2015;
van Rij et al., 2017). Finally, the N3W1 condition was set as the reference level to examine
contrasts between W1W1 vs. N3W1 and between W2W1 vs. N3W1 for the fixed effects by
specifying Condition as an ordered factor with contrast treatment (Wieling, 2018).
2.2. Base model
In the base model, elogit-transformed target fixations were regressed on a mixed effect
model (mgcv::bam(); Wood, 2017); see Figure S1 for the computer code of model
specification. The base model includes the following fixed effects: intercept estimation of
Condition with N3W1 as the baseline, a smooth term of Time at the baseline condition (N3W1),
a smooth term for each of the remaining two levels relative to the baseline (W1W1-N3W1 and
W2W1-N3W1). A smooth term of the interaction between Subject and Time for each condition
(with Condition as a non-ordered factor) was included as the random effects. The smoothing
parameter estimation method we used here was ML (maximum likelihood), instead of the default
fREML (fast restricted estimation of maximum likelihood), to enable comparison of models with
different fixed effects (Wieling, 2018). The base model was further corrected for autocorrelation
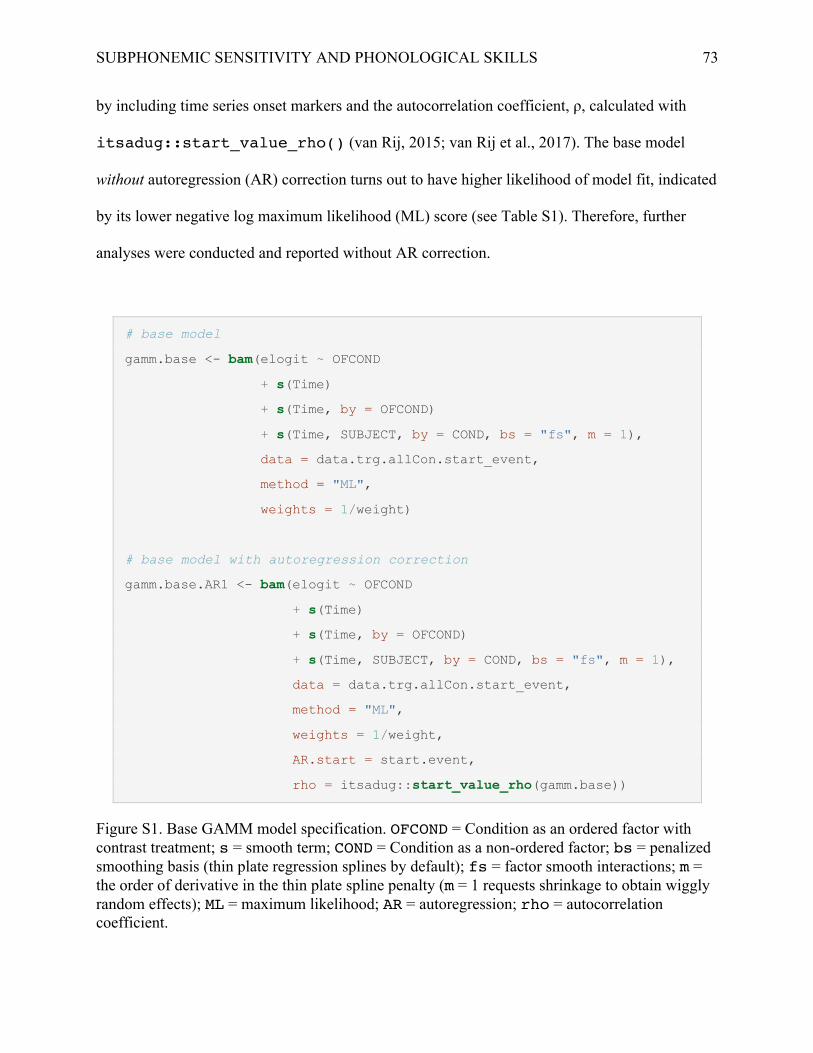
SUBPHONEMIC SENSITIVITY AND PHONOLOGICAL SKILLS
73
by including time series onset markers and the autocorrelation coefficient, ρ, calculated with
itsadug::start_value_rho() (van Rij, 2015; van Rij et al., 2017). The base model
without autoregression (AR) correction turns out to have higher likelihood of model fit, indicated
by its lower negative log maximum likelihood (ML) score (see Table S1). Therefore, further
analyses were conducted and reported without AR correction.
# base model
gamm.base <- bam(elogit ~ OFCOND
+ s(Time)
+ s(Time, by = OFCOND)
+ s(Time, SUBJECT, by = COND, bs = "fs", m = 1),
data = data.trg.allCon.start_event,
method = "ML",
weights = 1/weight)
# base model with autoregression correction
gamm.base.AR1 <- bam(elogit ~ OFCOND
+ s(Time)
+ s(Time, by = OFCOND)
+ s(Time, SUBJECT, by = COND, bs = "fs", m = 1),
data = data.trg.allCon.start_event,
method = "ML",
weights = 1/weight,
AR.start = start.event,
rho = itsadug::start_value_rho(gamm.base))
Figure S1. Base GAMM model specification. OFCOND = Condition as an ordered factor with contrast treatment; s = smooth term; COND = Condition as a non-ordered factor; bs = penalized smoothing basis (thin plate regression splines by default); fs = factor smooth interactions; m = the order of derivative in the thin plate spline penalty (m = 1 requests shrinkage to obtain wiggly random effects); ML = maximum likelihood; AR = autoregression; rho = autocorrelation coefficient.
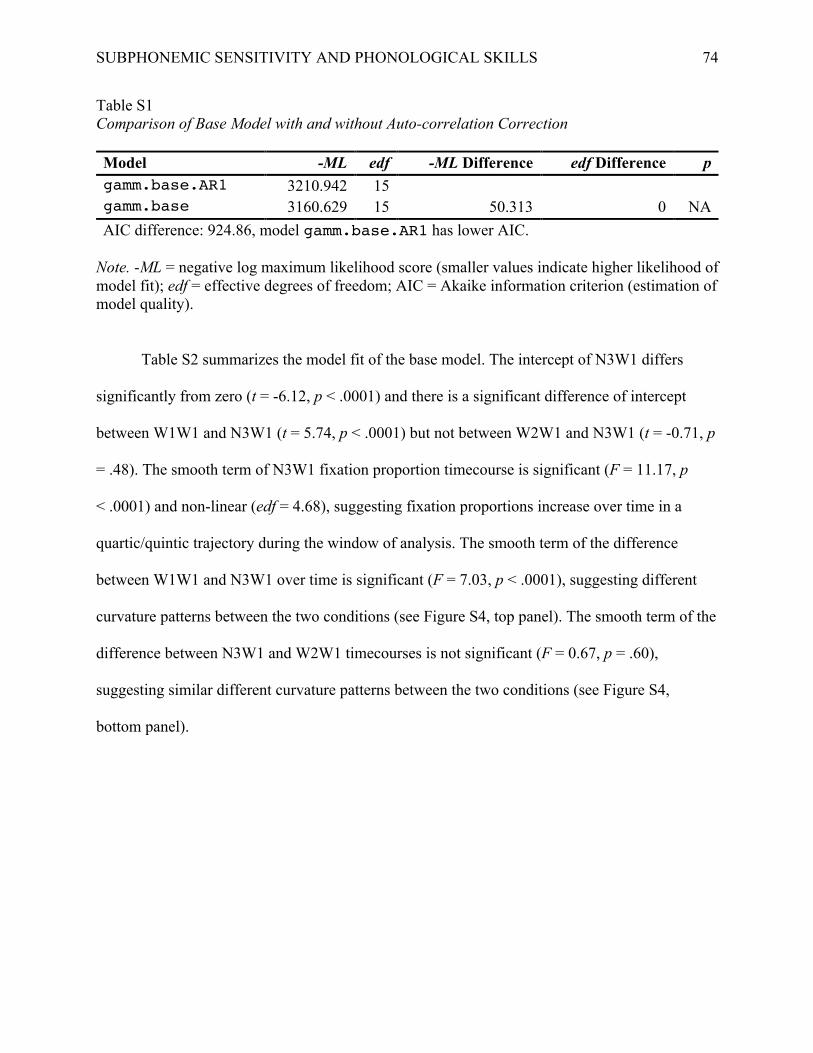
SUBPHONEMIC SENSITIVITY AND PHONOLOGICAL SKILLS
74
Table S1 Comparison of Base Model with and without Auto-correlation Correction Model -ML edf -ML Difference edf Difference p gamm.base.AR1 3210.942 15 gamm.base 3160.629 15 50.313 0 NA
AIC difference: 924.86, model gamm.base.AR1 has lower AIC.
Note. -ML = negative log maximum likelihood score (smaller values indicate higher likelihood of model fit); edf = effective degrees of freedom; AIC = Akaike information criterion (estimation of model quality).
Table S2 summarizes the model fit of the base model. The intercept of N3W1 differs
significantly from zero (t = -6.12, p < .0001) and there is a significant difference of intercept
between W1W1 and N3W1 (t = 5.74, p < .0001) but not between W2W1 and N3W1 (t = -0.71, p
= .48). The smooth term of N3W1 fixation proportion timecourse is significant (F = 11.17, p
< .0001) and non-linear (edf = 4.68), suggesting fixation proportions increase over time in a
quartic/quintic trajectory during the window of analysis. The smooth term of the difference
between W1W1 and N3W1 over time is significant (F = 7.03, p < .0001), suggesting different
curvature patterns between the two conditions (see Figure S4, top panel). The smooth term of the
difference between N3W1 and W2W1 timecourses is not significant (F = 0.67, p = .60),
suggesting similar different curvature patterns between the two conditions (see Figure S4,
bottom panel).
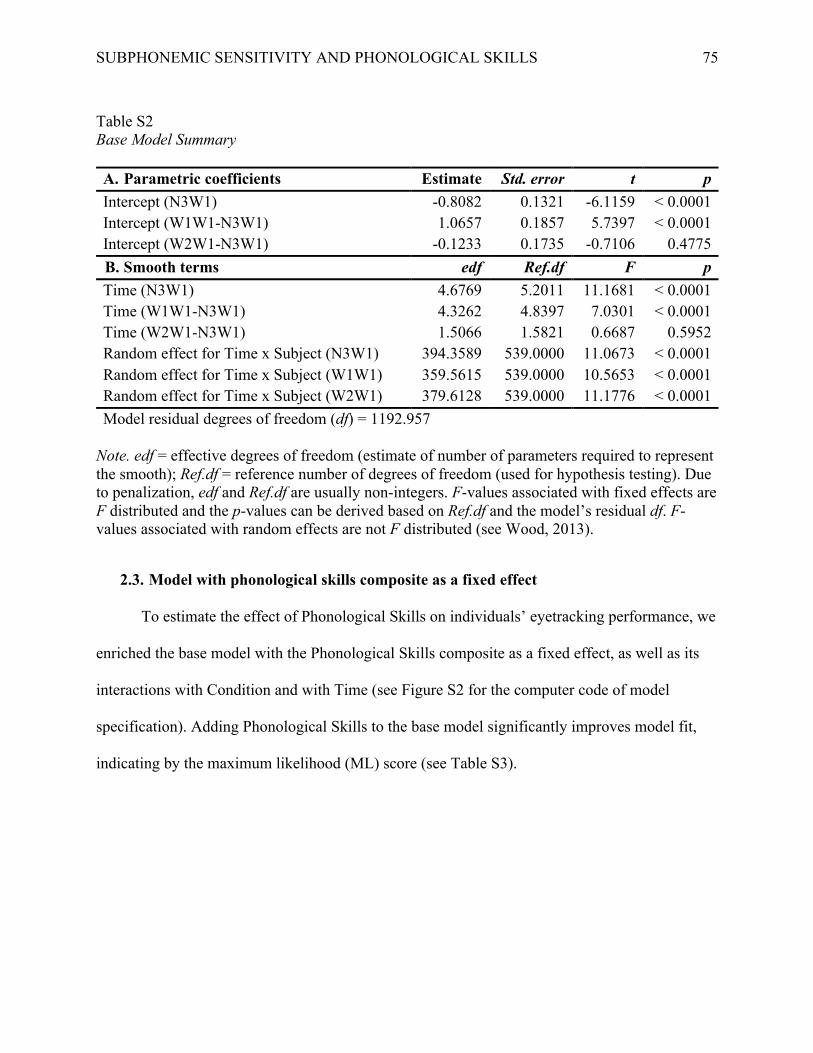
SUBPHONEMIC SENSITIVITY AND PHONOLOGICAL SKILLS
75
Table S2 Base Model Summary A. Parametric coefficients Estimate Std. error t p Intercept (N3W1) -0.8082 0.1321 -6.1159 < 0.0001 Intercept (W1W1-N3W1) 1.0657 0.1857 5.7397 < 0.0001 Intercept (W2W1-N3W1) -0.1233 0.1735 -0.7106 0.4775
B. Smooth terms edf Ref.df F p Time (N3W1) 4.6769 5.2011 11.1681 < 0.0001 Time (W1W1-N3W1) 4.3262 4.8397 7.0301 < 0.0001 Time (W2W1-N3W1) 1.5066 1.5821 0.6687 0.5952 Random effect for Time x Subject (N3W1) 394.3589 539.0000 11.0673 < 0.0001 Random effect for Time x Subject (W1W1) 359.5615 539.0000 10.5653 < 0.0001 Random effect for Time x Subject (W2W1) 379.6128 539.0000 11.1776 < 0.0001
Model residual degrees of freedom (df) = 1192.957
Note. edf = effective degrees of freedom (estimate of number of parameters required to represent the smooth); Ref.df = reference number of degrees of freedom (used for hypothesis testing). Due to penalization, edf and Ref.df are usually non-integers. F-values associated with fixed effects are F distributed and the p-values can be derived based on Ref.df and the model’s residual df. F-values associated with random effects are not F distributed (see Wood, 2013).
2.3. Model with phonological skills composite as a fixed effect
To estimate the effect of Phonological Skills on individuals’ eyetracking performance, we
enriched the base model with the Phonological Skills composite as a fixed effect, as well as its
interactions with Condition and with Time (see Figure S2 for the computer code of model
specification). Adding Phonological Skills to the base model significantly improves model fit,
indicating by the maximum likelihood (ML) score (see Table S3).
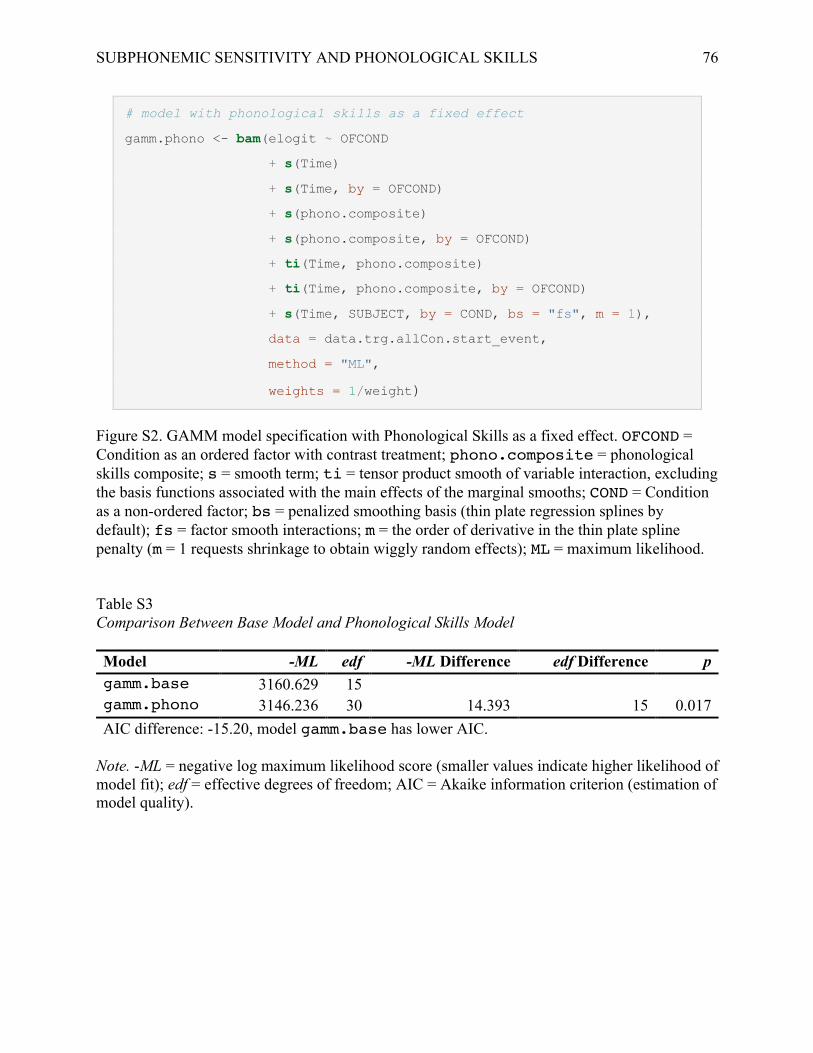
SUBPHONEMIC SENSITIVITY AND PHONOLOGICAL SKILLS
76
# model with phonological skills as a fixed effect
gamm.phono <- bam(elogit ~ OFCOND
+ s(Time)
+ s(Time, by = OFCOND)
+ s(phono.composite)
+ s(phono.composite, by = OFCOND)
+ ti(Time, phono.composite)
+ ti(Time, phono.composite, by = OFCOND)
+ s(Time, SUBJECT, by = COND, bs = "fs", m = 1),
data = data.trg.allCon.start_event,
method = "ML",
weights = 1/weight)
Figure S2. GAMM model specification with Phonological Skills as a fixed effect. OFCOND = Condition as an ordered factor with contrast treatment; phono.composite = phonological skills composite; s = smooth term; ti = tensor product smooth of variable interaction, excluding the basis functions associated with the main effects of the marginal smooths; COND = Condition as a non-ordered factor; bs = penalized smoothing basis (thin plate regression splines by default); fs = factor smooth interactions; m = the order of derivative in the thin plate spline penalty (m = 1 requests shrinkage to obtain wiggly random effects); ML = maximum likelihood. Table S3 Comparison Between Base Model and Phonological Skills Model Model -ML edf -ML Difference edf Difference p gamm.base 3160.629 15 gamm.phono 3146.236 30 14.393 15 0.017
AIC difference: -15.20, model gamm.base has lower AIC.
Note. -ML = negative log maximum likelihood score (smaller values indicate higher likelihood of model fit); edf = effective degrees of freedom; AIC = Akaike information criterion (estimation of model quality).
SUBPHONEMIC SENSITIVITY AND PHONOLOGICAL SKILLS
77
Table S4 summarizes the model fit of the final model with Phonological Skills as a fixed
effect. The results regarding Condition intercepts and Condition timecourses are similar to that of
the base model. Of interest, smooth terms of Phonological Skills by Condition were significant.
The smooth term of N3W1 fixation proportions as a function of Phonological Skills is
significantly linear (edf = 1, F = 24.03, p < .0001), indicating that there is a linear trend such that
individuals with higher phonological skills composite scores had higher N3W1 fixation
proportions overall (see Figure S3a, bottom panel). The smooth terms of fixation proportion
differences between conditions as a function of Phonological Skills are also significantly linear
(W1W1-N3W1: F = 5.05, p = .02; W2W1-N3W1: F = 8.92, p = .003), suggesting that the
subcategorical phonological effect (W1W1-N3W1) and lexical effect (N3W1-W2W1) varies as a
function of Phonological Skill. In particular, the phonological effect (W1W1-N3W1) increases
as Phonological Skills decrease (Figure S4a, top panel) whereas the lexical effect (N3W1-
W2W1) decreases as Phonological Skills decrease (Figure S4a, bottom panel). The Time x
Phonological skills interaction is significant for N3W1 (F = 4.68, p = .003), indicating that the
curvature of N3W1 fixation proportions over time varies slightly as a function of Phonological
Skills (see Figure S3a, bottom panel). The Time x Phonological Skills interaction is also
significant for W1W1-N3W1 (F = 4.30, p = .02), indicating that the phonological effect over
time varies as a function of Phonological Skills (see Figure S4a, top panel). There is no
significant Time x Phonological Skills interaction for W2W1-N3W1 (F = 0.36, p = .55),
suggesting the lexical effect over time stays stable across Phonological Skills levels (see Figure
S4a, bottom panel).
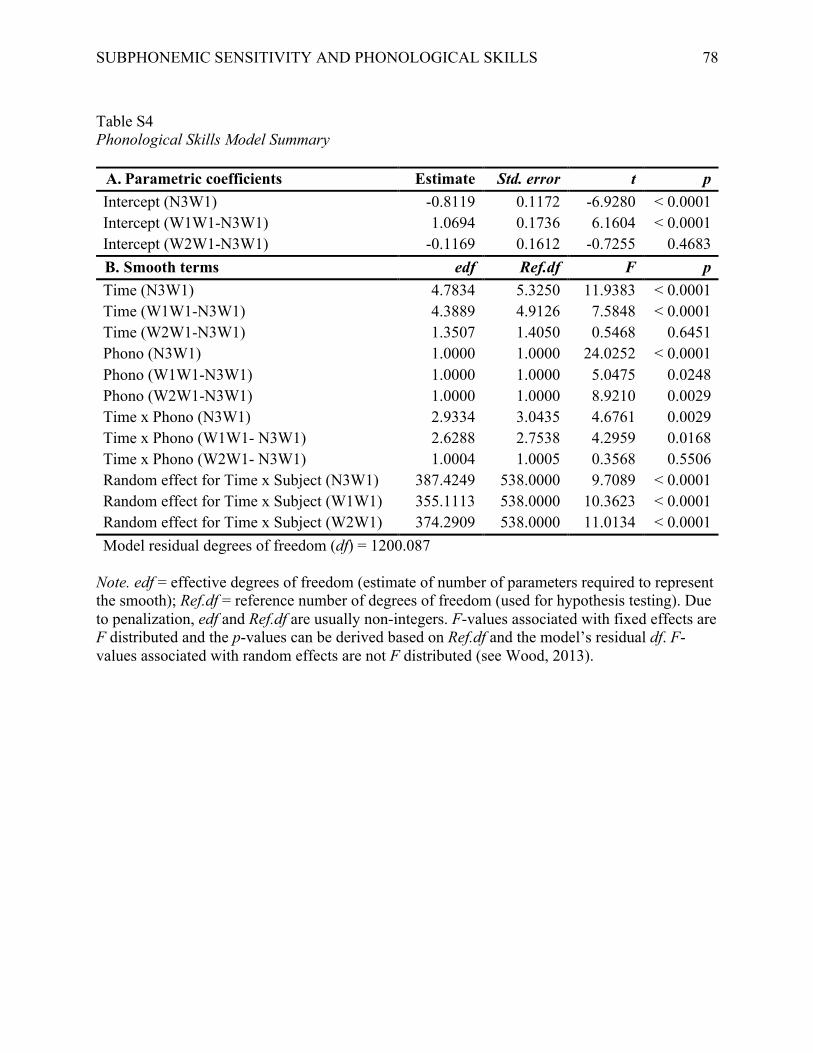
SUBPHONEMIC SENSITIVITY AND PHONOLOGICAL SKILLS
78
Table S4 Phonological Skills Model Summary
A. Parametric coefficients Estimate Std. error t p Intercept (N3W1) -0.8119 0.1172 -6.9280 < 0.0001 Intercept (W1W1-N3W1) 1.0694 0.1736 6.1604 < 0.0001 Intercept (W2W1-N3W1) -0.1169 0.1612 -0.7255 0.4683
B. Smooth terms edf Ref.df F p Time (N3W1) 4.7834 5.3250 11.9383 < 0.0001 Time (W1W1-N3W1) 4.3889 4.9126 7.5848 < 0.0001 Time (W2W1-N3W1) 1.3507 1.4050 0.5468 0.6451 Phono (N3W1) 1.0000 1.0000 24.0252 < 0.0001 Phono (W1W1-N3W1) 1.0000 1.0000 5.0475 0.0248 Phono (W2W1-N3W1) 1.0000 1.0000 8.9210 0.0029 Time x Phono (N3W1) 2.9334 3.0435 4.6761 0.0029 Time x Phono (W1W1- N3W1) 2.6288 2.7538 4.2959 0.0168 Time x Phono (W2W1- N3W1) 1.0004 1.0005 0.3568 0.5506 Random effect for Time x Subject (N3W1) 387.4249 538.0000 9.7089 < 0.0001 Random effect for Time x Subject (W1W1) 355.1113 538.0000 10.3623 < 0.0001 Random effect for Time x Subject (W2W1) 374.2909 538.0000 11.0134 < 0.0001
Model residual degrees of freedom (df) = 1200.087
Note. edf = effective degrees of freedom (estimate of number of parameters required to represent the smooth); Ref.df = reference number of degrees of freedom (used for hypothesis testing). Due to penalization, edf and Ref.df are usually non-integers. F-values associated with fixed effects are F distributed and the p-values can be derived based on Ref.df and the model’s residual df. F-values associated with random effects are not F distributed (see Wood, 2013).
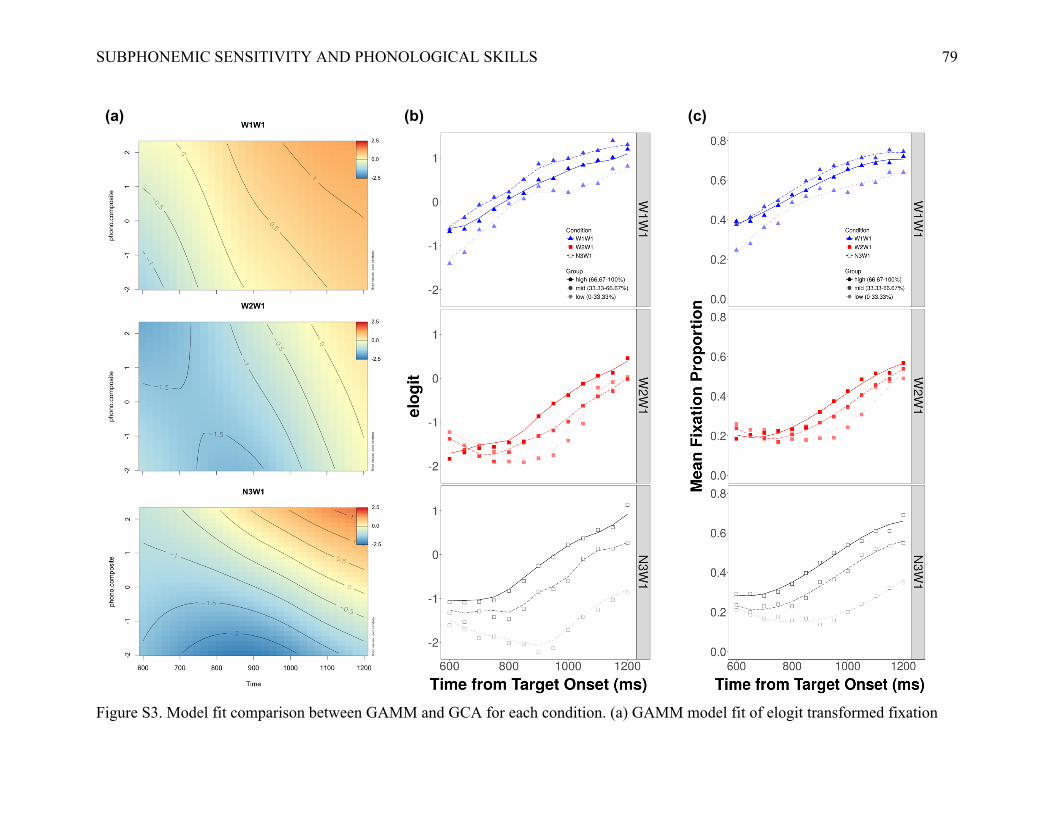
SUBPHONEMIC SENSITIVITY AND PHONOLOGICAL SKILLS
79
Figure S3. Model fit comparison between GAMM and GCA for each condition. (a) GAMM model fit of elogit transformed fixation
(a) (b) (c)
SUBPHONEMIC SENSITIVITY AND PHONOLOGICAL SKILLS
80
proportions over time of each condition as a function of Phonological Skills. The contour lines represent fixation proportions (in log
odds) predicted by the model for each condition. Log odds values are unbounded around 0, which represents 50%. Positive log odds
values indicate fixation proportions greater than 50%, whereas negative log odds values indicate fixation proportions less than 50 %.
The contour plots show an increasing log odds over time and a decreasing log odds as Phonological Skills decrease for all three
conditions. (b) GAMM model fit of elogit transformed fixation proportions over time of each condition by Phonological Skills tertile
(i.e., low, mid, and high). The symbols indicate observed elogit while the curves denote the fitted values, both of which are averaged
within each condition and tertile at a given time point. Here we present the same underlying GAMM results in curves by group to
demonstrate the similarity of model fit between GAMM and GCA. (c) GCA model fit of fixation proportions over time of each
condition by Phonological Skills tertile (i.e., low, mid, and high). Fixation proportion timecourses predicted by GCA suggest a trend
of decreasing fixation proportions as Phonological Skills decrease, particularly in N3W1 and W2W1.
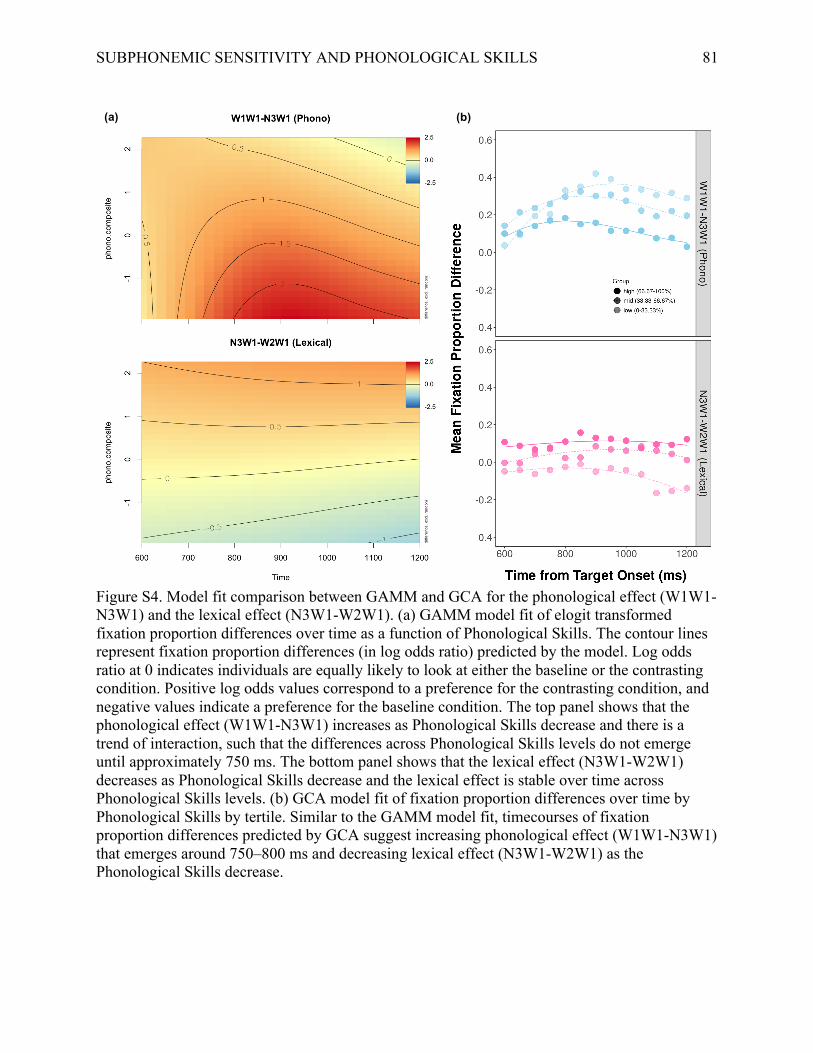
SUBPHONEMIC SENSITIVITY AND PHONOLOGICAL SKILLS
81
Figure S4. Model fit comparison between GAMM and GCA for the phonological effect (W1W1-
N3W1) and the lexical effect (N3W1-W2W1). (a) GAMM model fit of elogit transformed
fixation proportion differences over time as a function of Phonological Skills. The contour lines
represent fixation proportion differences (in log odds ratio) predicted by the model. Log odds
ratio at 0 indicates individuals are equally likely to look at either the baseline or the contrasting
condition. Positive log odds values correspond to a preference for the contrasting condition, and
negative values indicate a preference for the baseline condition. The top panel shows that the
phonological effect (W1W1-N3W1) increases as Phonological Skills decrease and there is a
trend of interaction, such that the differences across Phonological Skills levels do not emerge
until approximately 750 ms. The bottom panel shows that the lexical effect (N3W1-W2W1)
decreases as Phonological Skills decrease and the lexical effect is stable over time across
Phonological Skills levels. (b) GCA model fit of fixation proportion differences over time by
Phonological Skills by tertile. Similar to the GAMM model fit, timecourses of fixation
proportion differences predicted by GCA suggest increasing phonological effect (W1W1-N3W1)
that emerges around 750–800 ms and decreasing lexical effect (N3W1-W2W1) as the
Phonological Skills decrease.
(a) (b)
SUBPHONEMIC SENSITIVITY AND PHONOLOGICAL SKILLS
82
2.4. Comparison between GAMM and GCA results
Overall, GAMM results converge remarkably with our findings with GCA. Specifically,
both GAMM and GCA results show an increasing phonological mismatch effect (W1W1-
N3W1) and a decreasing lexical effect (N3W1-W1W1) as phonological skills composite scores
decrease, suggesting less skilled individuals tend to have higher subphonemic sensitivity and
lower lexical competition (see Figure S4). GAMM visualization also mirrors that of GCA
(Figure S3), such that curvature patterns seem to vary with Phonological Skills the most in
N3W1, and less so in W1W1 and W2W1, suggesting that N3W1 is the main locus where
individual differences in Phonological Skills manifested. In addition, both GAMM and GCA
results suggest that the timecourse pattern of N3W1 is similar to that of W2W1 but significantly
different from that of W1W1. Both GAMM and GCA results also suggest a significant Time x
Phonological Skills interaction in N3W1, similar to that of W2W1 but different from that of
W1W1.
In sum, the GAMM and GCA approaches yield converging results, suggesting the
robustness of the observed effects. While GAMM analysis is indeed a promising avenue for
investigating individual differences in Visual World data, our planned analysis with GCA is
sufficiently informative for our current investigation.
SUBPHONEMIC SENSITIVITY AND PHONOLOGICAL SKILLS
83
2.5. References
Baayen, H., Vasishth, S., Kliegl, R., & Bates, D. (2017). The cave of shadows: Addressing the
human factor with generalized additive mixed models. Journal of Memory and Language,
94, 206–234. https://doi.org/10.1016/j.jml.2016.11.006
Baayen, R. H., van Rij, J., de Cat, C., & Wood, S. N. (2016). Autocorrelated errors in
experimental data in the language sciences: Some solutions offered by Generalized Additive
Mixed Models. ArXiv. https://doi.org/10.1002/pssb.201300062
Magnuson, J. S., Dixon, J. A., Tanenhaus, M. K., & Aslin, R. N. (2007). The Dynamics of
Lexical Competition During Spoken Word Recognition. Cognitive Science, 31(1), 133–156.
https://doi.org/10.1080/03640210709336987
Mirman, D. (2014). Growth Curve Analysis and Visualization Using R. Chapman & Hall/CRC.
Mirman, D., Dixon, J. A., & Magnuson, J. S. (2008). Statistical and computational models of the
visual world paradigm: Growth curves and individual differences. Journal of Memory and Language, 59(4), 475–494. https://doi.org/10.1016/j.jml.2007.11.006
Porretta, V., Kyröläinen, A.-J., van Rij, J., & Järvikivi, J. (2018a). VWPre: Tools for
Preprocessing Visual World Data. R package version 1.1.0.
Porretta, V., Kyröläinen, A., van Rij, J., & Järvikivi, J. (2018b). Visual World Paradigm Data:
From Preprocessing to Nonlinear Time-Course Analysis. In I. Czarnowski, R. Howlett, &
L. Jain (Eds.), Intelligent Decision Technologies 2017. IDT 2017. Smart Innovation, Systems and Technologies (Vol. 73, pp. 268–277). Springer, Cham.
https://doi.org/10.1007/978-3-319-59424-8_25
R Core Team. (2018). R: A Language and Environment for Statistical Computing. Vienna,
Austria: R Foundation for Statistical Computing.
van Rij, J. (2015). Overview GAMM analysis of time series data. Retrieved November 27, 2017,
from http://www.sfs.uni-tuebingen.de/~jvanrij/Tutorial/GAMM.html
van Rij, J., Wieling, M., Baayen, R. H., & van Rijn, H. (2017). itsadug: Interpreting Time Series
and Autocorrelated Data Using GAMMs. R package version 2.3.
Wieling, M. (2018). Analyzing dynamic phonetic data using generalized additive mixed
modeling: A tutorial focusing on articulatory differences between L1 and L2 speakers of
English. Journal of Phonetics, 70, 86–116. https://doi.org/10.1016/j.wocn.2018.03.002
Winter, B., & Wieling, M. (2016). How to analyze linguistic change using mixed models,
Growth Curve Analysis and Generalized Additive Modeling. Journal of Language Evolution, 1(1), 7–18. https://doi.org/10.1093/jole/lzv003
Wood, S. N. (2013). A simple test for random effects in regression models. Biometrika, 100(4),
1005–1010. https://doi.org/10.1093/biomet/ast038
Wood, S. N. (2017). Generalized Additive Models: An Introduction with R (2nd ed.). Chapman
and Hall/CRC.
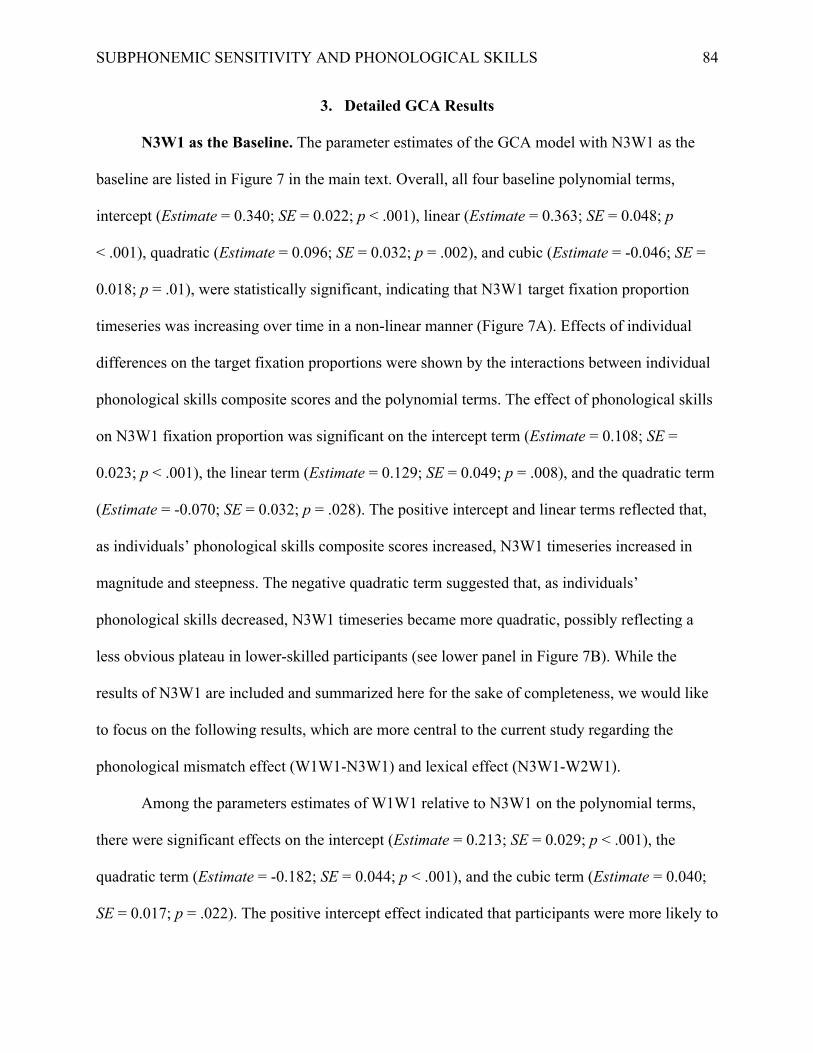
SUBPHONEMIC SENSITIVITY AND PHONOLOGICAL SKILLS
84
3. Detailed GCA Results
N3W1 as the Baseline. The parameter estimates of the GCA model with N3W1 as the
baseline are listed in Figure 7 in the main text. Overall, all four baseline polynomial terms,
intercept (Estimate = 0.340; SE = 0.022; p < .001), linear (Estimate = 0.363; SE = 0.048; p
< .001), quadratic (Estimate = 0.096; SE = 0.032; p = .002), and cubic (Estimate = -0.046; SE =
0.018; p = .01), were statistically significant, indicating that N3W1 target fixation proportion
timeseries was increasing over time in a non-linear manner (Figure 7A). Effects of individual
differences on the target fixation proportions were shown by the interactions between individual
phonological skills composite scores and the polynomial terms. The effect of phonological skills
on N3W1 fixation proportion was significant on the intercept term (Estimate = 0.108; SE =
0.023; p < .001), the linear term (Estimate = 0.129; SE = 0.049; p = .008), and the quadratic term
(Estimate = -0.070; SE = 0.032; p = .028). The positive intercept and linear terms reflected that,
as individuals’ phonological skills composite scores increased, N3W1 timeseries increased in
magnitude and steepness. The negative quadratic term suggested that, as individuals’
phonological skills decreased, N3W1 timeseries became more quadratic, possibly reflecting a
less obvious plateau in lower-skilled participants (see lower panel in Figure 7B). While the
results of N3W1 are included and summarized here for the sake of completeness, we would like
to focus on the following results, which are more central to the current study regarding the
phonological mismatch effect (W1W1-N3W1) and lexical effect (N3W1-W2W1).
Among the parameters estimates of W1W1 relative to N3W1 on the polynomial terms,
there were significant effects on the intercept (Estimate = 0.213; SE = 0.029; p < .001), the
quadratic term (Estimate = -0.182; SE = 0.044; p < .001), and the cubic term (Estimate = 0.040;
SE = 0.017; p = .022). The positive intercept effect indicated that participants were more likely to
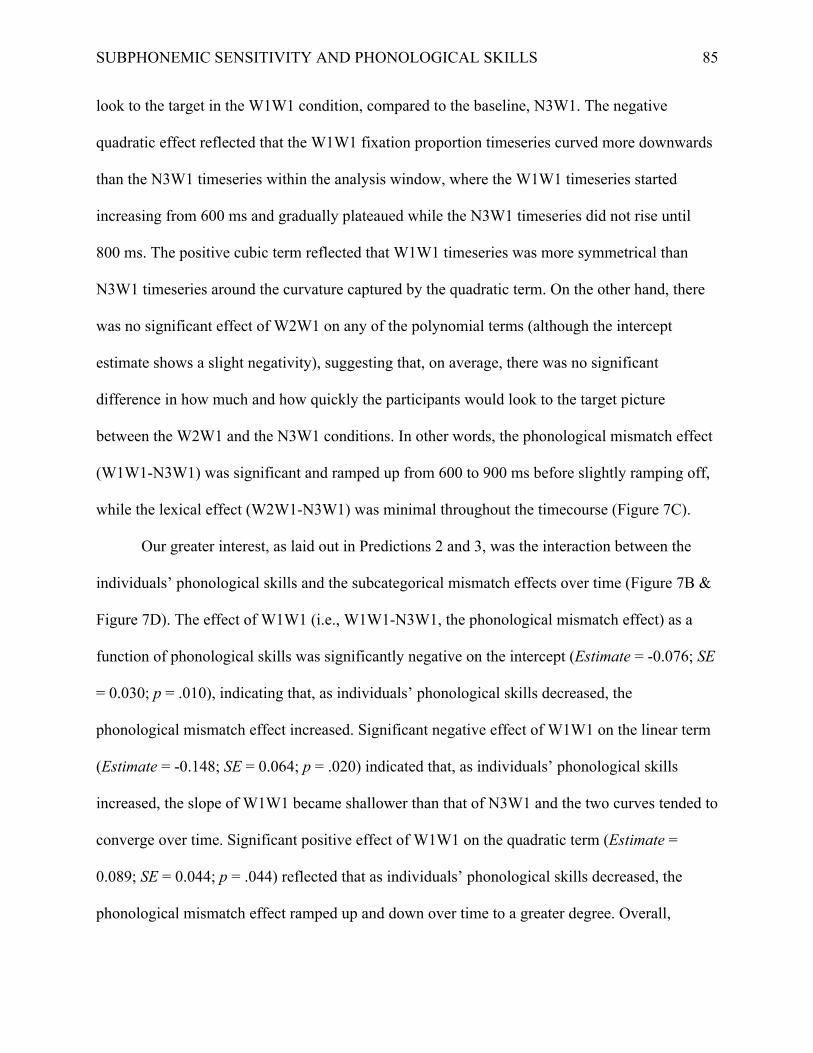
SUBPHONEMIC SENSITIVITY AND PHONOLOGICAL SKILLS
85
look to the target in the W1W1 condition, compared to the baseline, N3W1. The negative
quadratic effect reflected that the W1W1 fixation proportion timeseries curved more downwards
than the N3W1 timeseries within the analysis window, where the W1W1 timeseries started
increasing from 600 ms and gradually plateaued while the N3W1 timeseries did not rise until
800 ms. The positive cubic term reflected that W1W1 timeseries was more symmetrical than
N3W1 timeseries around the curvature captured by the quadratic term. On the other hand, there
was no significant effect of W2W1 on any of the polynomial terms (although the intercept
estimate shows a slight negativity), suggesting that, on average, there was no significant
difference in how much and how quickly the participants would look to the target picture
between the W2W1 and the N3W1 conditions. In other words, the phonological mismatch effect
(W1W1-N3W1) was significant and ramped up from 600 to 900 ms before slightly ramping off,
while the lexical effect (W2W1-N3W1) was minimal throughout the timecourse (Figure 7C).
Our greater interest, as laid out in Predictions 2 and 3, was the interaction between the
individuals’ phonological skills and the subcategorical mismatch effects over time (Figure 7B &
Figure 7D). The effect of W1W1 (i.e., W1W1-N3W1, the phonological mismatch effect) as a
function of phonological skills was significantly negative on the intercept (Estimate = -0.076; SE
= 0.030; p = .010), indicating that, as individuals’ phonological skills decreased, the
phonological mismatch effect increased. Significant negative effect of W1W1 on the linear term
(Estimate = -0.148; SE = 0.064; p = .020) indicated that, as individuals’ phonological skills
increased, the slope of W1W1 became shallower than that of N3W1 and the two curves tended to
converge over time. Significant positive effect of W1W1 on the quadratic term (Estimate =
0.089; SE = 0.044; p = .044) reflected that as individuals’ phonological skills decreased, the
phonological mismatch effect ramped up and down over time to a greater degree. Overall,
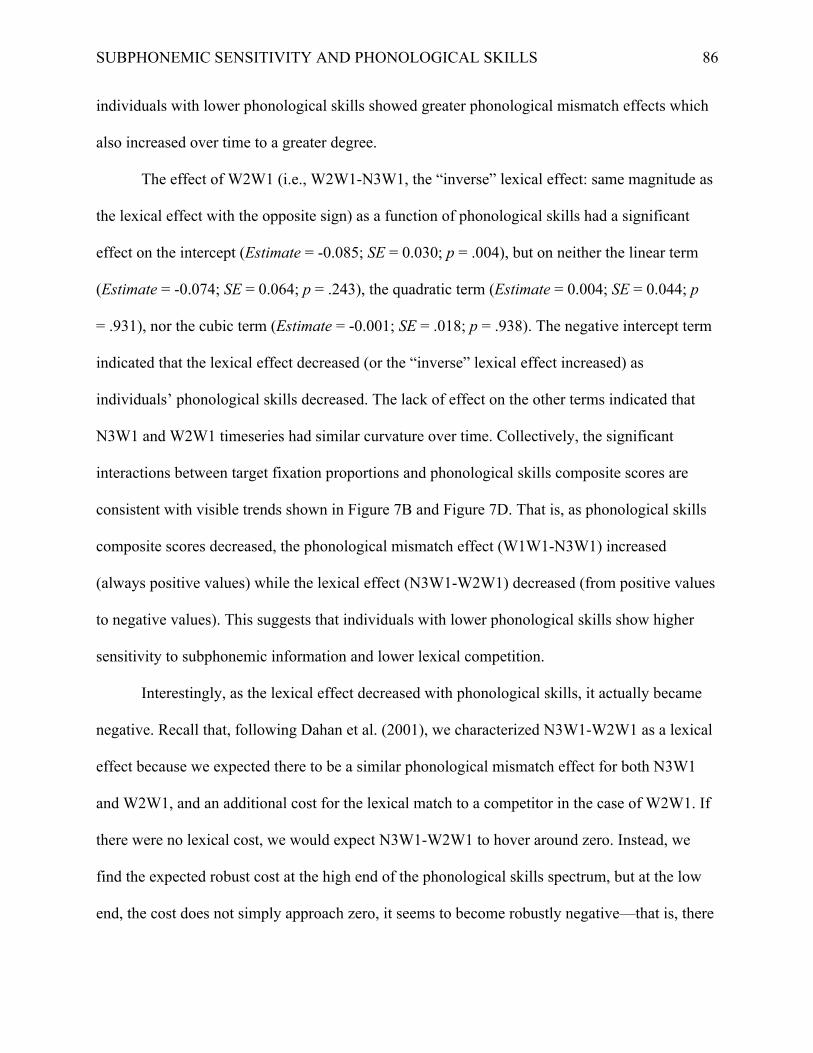
SUBPHONEMIC SENSITIVITY AND PHONOLOGICAL SKILLS
86
individuals with lower phonological skills showed greater phonological mismatch effects which
also increased over time to a greater degree.
The effect of W2W1 (i.e., W2W1-N3W1, the “inverse” lexical effect: same magnitude as
the lexical effect with the opposite sign) as a function of phonological skills had a significant
effect on the intercept (Estimate = -0.085; SE = 0.030; p = .004), but on neither the linear term
(Estimate = -0.074; SE = 0.064; p = .243), the quadratic term (Estimate = 0.004; SE = 0.044; p
= .931), nor the cubic term (Estimate = -0.001; SE = .018; p = .938). The negative intercept term
indicated that the lexical effect decreased (or the “inverse” lexical effect increased) as
individuals’ phonological skills decreased. The lack of effect on the other terms indicated that
N3W1 and W2W1 timeseries had similar curvature over time. Collectively, the significant
interactions between target fixation proportions and phonological skills composite scores are
consistent with visible trends shown in Figure 7B and Figure 7D. That is, as phonological skills
composite scores decreased, the phonological mismatch effect (W1W1-N3W1) increased
(always positive values) while the lexical effect (N3W1-W2W1) decreased (from positive values
to negative values). This suggests that individuals with lower phonological skills show higher
sensitivity to subphonemic information and lower lexical competition.
Interestingly, as the lexical effect decreased with phonological skills, it actually became
negative. Recall that, following Dahan et al. (2001), we characterized N3W1-W2W1 as a lexical
effect because we expected there to be a similar phonological mismatch effect for both N3W1
and W2W1, and an additional cost for the lexical match to a competitor in the case of W2W1. If
there were no lexical cost, we would expect N3W1-W2W1 to hover around zero. Instead, we
find the expected robust cost at the high end of the phonological skills spectrum, but at the low
end, the cost does not simply approach zero, it seems to become robustly negative—that is, there
SUBPHONEMIC SENSITIVITY AND PHONOLOGICAL SKILLS
87
is a greater cost for N3W1 than for W2W1 (see the red dashed vs. black dotted lines in the
bottom plot of Figure 7B). This reversal is not consistent with theoretical accounts of spoken
word recognition, on which a lexical cost is predicted, but there is no basis to predict a benefit
from lexical competition. In a later section, we will return to address the puzzle of why nonword
coarticulation in N3W1 should create greater difficulty than competitor coarticulation in W2W1
for individuals with lower phonological skills.
To recap, the GCA model with N3W1 as the baseline revealed that: (1) across
participants, target fixations of W1W1 were significantly greater than N3W1, and such a
phonological mismatch effect (W1W1-N3W1) increased as individuals’ phonological skills
decreased; (2) across participants, there was no significant difference of target fixations between
N3W1 and W2W1, but the lexical effect (N3W1-W2W1) decreased as individuals’ phonological
skills decreased; (3) the lack of significant lexical effect across participants seemed to result from
the puzzling reversal between N3W1 and W2W1 in individuals with lower phonological skills.
W1W1 as the Baseline. Although using N3W1 as the baseline allowed us to observe
both the phonological mismatch effect (W1W1-N3W1) and the lexical effect (N3W1-W2W1) in
one model, there is one important caveat: with N3W1 as the baseline, the difference between
W1W1 and W2W1 could not be estimated, and thus it is not clear whether the relationship
between W1W1 and W2W1 played a role in the correlation between the two subcategorical
mismatch effects. Therefore, we need to consider a GCA model with W1W1 as the baseline,
which entails losing the contrast between N3W1 and W2W1 (which is why analyses with both
baselines are needed).
SUBPHONEMIC SENSITIVITY AND PHONOLOGICAL SKILLS
88
The parameter estimates of the GCA model with W1W1 as the baseline are listed in Table
S5. The W1W1 fixation proportion timeseries was statistically significant on the intercept
(Estimate = 0.553; SE = 0.022; p < .001), linear (Estimate = 0.424; SE = 0.048; p < .001) and
quadratic (Estimate = -0.087; SE = 0.032; p = .006) terms, reflecting that W1W1 target fixation
proportions were greater than zero and increased over time in a non-linear manner that
eventually plateaued (Figure 7A). Among the parameter estimates of W2W1 (i.e., W2W1-
W1W1) on the polynomial terms, there was a significant effect of W2W1 on the intercept
(Estimate = -0.240; SE = 0.029; p < .001), the quadratic term (Estimate = 0.247; SE = 0.044; p
< .001), and the cubic terms (Estimate = -0.035; SE = 0.017; p = .047), but not the linear
(Estimate = -0.039; SE = 0.063; p = .538). The negative intercept effect indicated that
participants were less likely to look to the target in W2W1 than in W1W1. The lack of difference
in the linear term indicated that W2W1 and W1W1 timeseries had similar slope. The positive
quadratic effect reflected that the W2W1 timeseries curved more upwards than W1W1
timeseries, where the W2W1 timeseries did not rise until 800 ms while the W1W1 timeseries
started increasing from 600 ms and gradually plateaued. The negative cubic term reflected that
W2W1 timeseries was less symmetrical than W1W1 timeseries around the curvature captured by
the quadratic term. The N3W1 effect here (i.e., N3W1-W1W1) is the same as the W1W1 effect
with N3W1 as the baseline (i.e., W1W1-N3W1), except that the sign is opposite for the
parameter estimates (Figure 7A & Figure 7C).
No polynomial term was significant of the W1W1 fixation proportion timeseries as a
function of phonological skills (though numerically there is a slight trend of W1W1 fixations
increasing with phonological skills, consistent with our hypothesis illustrated in Figure 2),
indicating that individuals with varying phonological skills performed similarly when there was
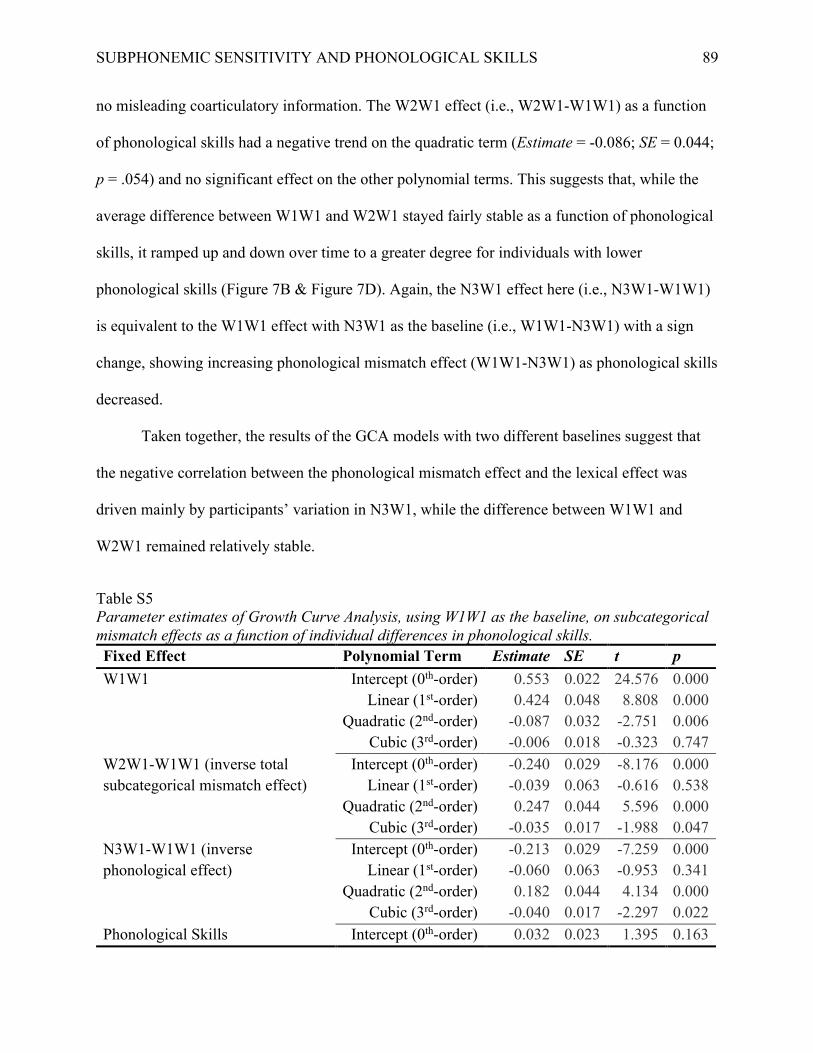
SUBPHONEMIC SENSITIVITY AND PHONOLOGICAL SKILLS
89
no misleading coarticulatory information. The W2W1 effect (i.e., W2W1-W1W1) as a function
of phonological skills had a negative trend on the quadratic term (Estimate = -0.086; SE = 0.044;
p = .054) and no significant effect on the other polynomial terms. This suggests that, while the
average difference between W1W1 and W2W1 stayed fairly stable as a function of phonological
skills, it ramped up and down over time to a greater degree for individuals with lower
phonological skills (Figure 7B & Figure 7D). Again, the N3W1 effect here (i.e., N3W1-W1W1)
is equivalent to the W1W1 effect with N3W1 as the baseline (i.e., W1W1-N3W1) with a sign
change, showing increasing phonological mismatch effect (W1W1-N3W1) as phonological skills
decreased.
Taken together, the results of the GCA models with two different baselines suggest that
the negative correlation between the phonological mismatch effect and the lexical effect was
driven mainly by participants’ variation in N3W1, while the difference between W1W1 and
W2W1 remained relatively stable.
Table S5
Parameter estimates of Growth Curve Analysis, using W1W1 as the baseline, on subcategorical mismatch effects as a function of individual differences in phonological skills. Fixed Effect Polynomial Term Estimate SE t p W1W1 Intercept (0th-order) 0.553 0.022 24.576 0.000
Linear (1st-order) 0.424 0.048 8.808 0.000
Quadratic (2nd-order) -0.087 0.032 -2.751 0.006
Cubic (3rd-order) -0.006 0.018 -0.323 0.747
W2W1-W1W1 (inverse total
subcategorical mismatch effect)
Intercept (0th-order) -0.240 0.029 -8.176 0.000
Linear (1st-order) -0.039 0.063 -0.616 0.538
Quadratic (2nd-order) 0.247 0.044 5.596 0.000
Cubic (3rd-order) -0.035 0.017 -1.988 0.047
N3W1-W1W1 (inverse
phonological effect)
Intercept (0th-order) -0.213 0.029 -7.259 0.000
Linear (1st-order) -0.060 0.063 -0.953 0.341
Quadratic (2nd-order) 0.182 0.044 4.134 0.000
Cubic (3rd-order) -0.040 0.017 -2.297 0.022
Phonological Skills Intercept (0th-order) 0.032 0.023 1.395 0.163
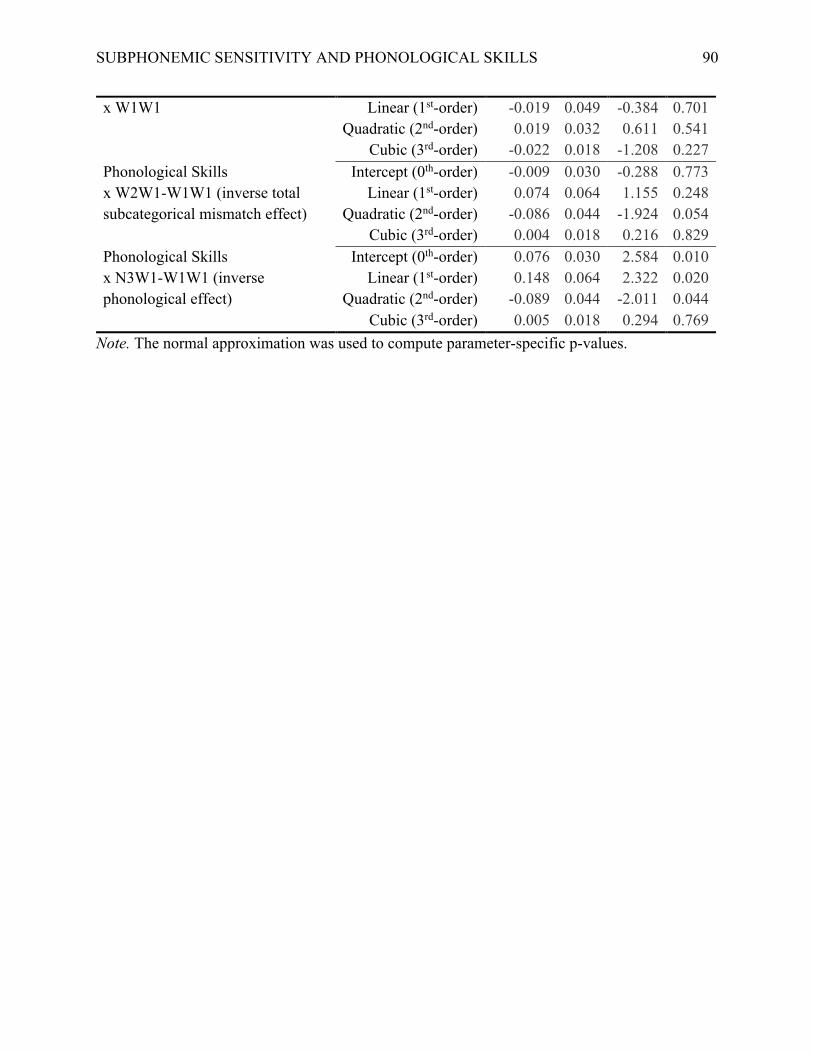
SUBPHONEMIC SENSITIVITY AND PHONOLOGICAL SKILLS
90
x W1W1 Linear (1st-order) -0.019 0.049 -0.384 0.701
Quadratic (2nd-order) 0.019 0.032 0.611 0.541
Cubic (3rd-order) -0.022 0.018 -1.208 0.227
Phonological Skills
x W2W1-W1W1 (inverse total
subcategorical mismatch effect)
Intercept (0th-order) -0.009 0.030 -0.288 0.773
Linear (1st-order) 0.074 0.064 1.155 0.248
Quadratic (2nd-order) -0.086 0.044 -1.924 0.054
Cubic (3rd-order) 0.004 0.018 0.216 0.829
Phonological Skills
x N3W1-W1W1 (inverse
phonological effect)
Intercept (0th-order) 0.076 0.030 2.584 0.010
Linear (1st-order) 0.148 0.064 2.322 0.020
Quadratic (2nd-order) -0.089 0.044 -2.011 0.044
Cubic (3rd-order) 0.005 0.018 0.294 0.769
Note. The normal approximation was used to compute parameter-specific p-values.
SUBPHONEMIC SENSITIVITY AND PHONOLOGICAL SKILLS
91
4. Post Hoc Analysis on Specificity of Phonological Skills Effect
We conducted additional analysis to address concerns that were raised in the review
process regarding the specificity of phonological skills (P) in driving the subphonemic sensitivity
effect observed in the eyetracking data. Given our results’ potential implications in reading
abilities, the reviewers suggested examining other individual differences indicators also known
to be related to reading ability, such as decoding skill. Therefore, we selected the decoding (D)
and oral language comprehension (O) composites, which correspond to the two major constructs
that contribute to overall reading comprehension, according to the Simple View of Reading
(Braze et al., 2016; Gough & Tunmer, 1986; Tunmer & Chapman, 2012).
We examined all possible permutations of model comparison between two nested models,
with one and two of the indicators as fixed effects, respectively. This yielded six sets of model
comparisons, where the magnitude of target fixation proportions from the subcategorical
mismatch study was the predicted variable: (1) P vs. P+D, (2) P vs. P+O, (3) D vs. D+P, (4) D
vs. D+O, (5) O vs. O+P, and (6) O vs. O+D (Table S6 for full model comparison outputs). None
of the six model comparisons resulted in a significant difference after controlling for multiple
comparisons with Bonferroni correction (post hoc α = .05 ÷ 6 ≈ .0083). Thus, these post hoc
model comparisons suggest that none of the three indicators accounts for more variance in the
observed effect than others. To put it another way, any individual composite (P, D, or O)
accounts for similar variance in individual differences in the subcategorical mismatch
experiment, and pairing composites does not improve fit.
Although it is clear that these differences are systematically associated with reading
related skills, confidently identifying the specific latent construct responsible for the association
requires further research (e.g., using structural equation modeling with a much larger sample size
SUBPHONEMIC SENSITIVITY AND PHONOLOGICAL SKILLS
92
than ours). We do, however, have strong theoretical reasons to believe that phonological skills
remain the best candidate, given evidence indicating phonological skills as a fundamental factor
that contributes to both decoding (Cunningham, Witton, Talcott, Burgess, & Shapiro, 2015;
Engen & Høien, 2002; Høien-Tengesdal & Tønnessen, 2011) and oral comprehension (Foorman,
Herrera, Petscher, Mitchell, & Truckenmiller, 2015; Lepola, Lynch, Laakkonen, Silvén, &
Niemi, 2012). A speculative interpretation of this result might be that performance in the
subcategorical mismatch paradigm taps into aspects of phonological ability and lexical quality
that are sufficiently central to an individual’s linguistic abilities to link significantly to any core
component of reading ability (P, D, or O).
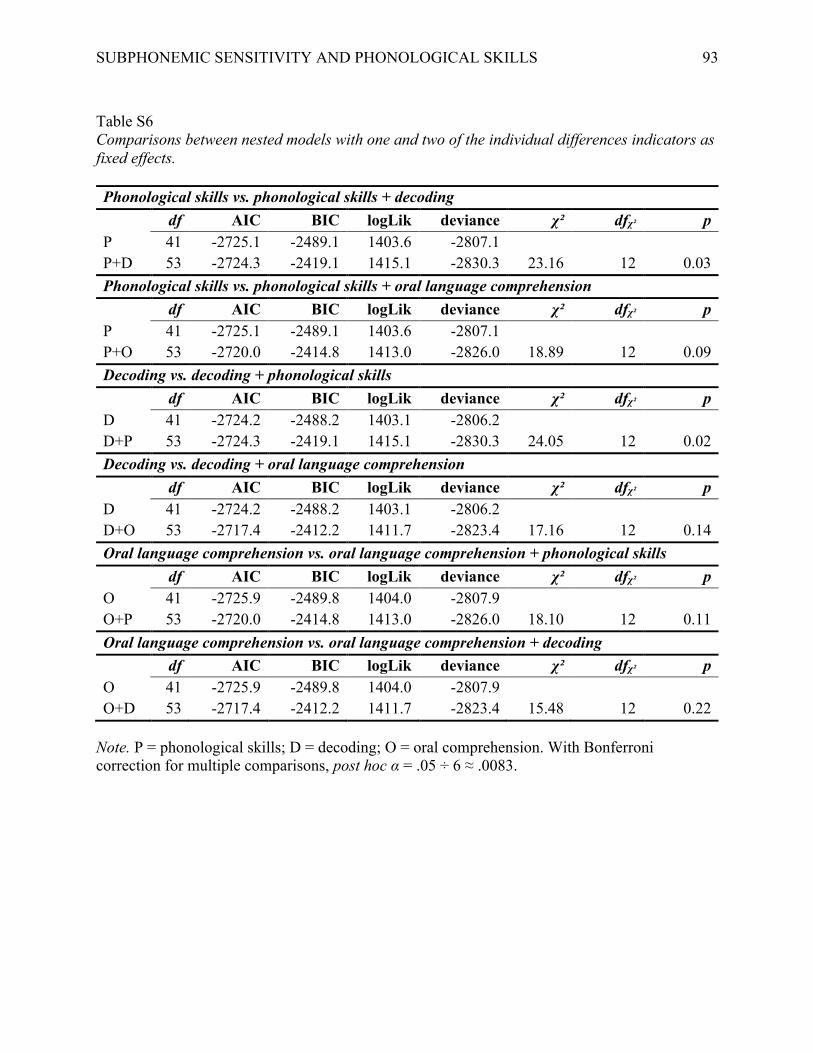
SUBPHONEMIC SENSITIVITY AND PHONOLOGICAL SKILLS
93
Table S6
Comparisons between nested models with one and two of the individual differences indicators as fixed effects. Phonological skills vs. phonological skills + decoding
df AIC BIC logLik deviance χ² dfχ² p P 41 -2725.1 -2489.1 1403.6 -2807.1
P+D 53 -2724.3 -2419.1 1415.1 -2830.3 23.16 12 0.03
Phonological skills vs. phonological skills + oral language comprehension df AIC BIC logLik deviance χ² dfχ² p
P 41 -2725.1 -2489.1 1403.6 -2807.1
P+O 53 -2720.0 -2414.8 1413.0 -2826.0 18.89 12 0.09
Decoding vs. decoding + phonological skills df AIC BIC logLik deviance χ² dfχ² p
D 41 -2724.2 -2488.2 1403.1 -2806.2
D+P 53 -2724.3 -2419.1 1415.1 -2830.3 24.05 12 0.02
Decoding vs. decoding + oral language comprehension df AIC BIC logLik deviance χ² dfχ² p
D 41 -2724.2 -2488.2 1403.1 -2806.2
D+O 53 -2717.4 -2412.2 1411.7 -2823.4 17.16 12 0.14
Oral language comprehension vs. oral language comprehension + phonological skills df AIC BIC logLik deviance χ² dfχ² p
O 41 -2725.9 -2489.8 1404.0 -2807.9
O+P 53 -2720.0 -2414.8 1413.0 -2826.0 18.10 12 0.11
Oral language comprehension vs. oral language comprehension + decoding df AIC BIC logLik deviance χ² dfχ² p
O 41 -2725.9 -2489.8 1404.0 -2807.9
O+D 53 -2717.4 -2412.2 1411.7 -2823.4 15.48 12 0.22
Note. P = phonological skills; D = decoding; O = oral comprehension. With Bonferroni
correction for multiple comparisons, post hoc α = .05 ÷ 6 ≈ .0083.
SUBPHONEMIC SENSITIVITY AND PHONOLOGICAL SKILLS
94
4.1. References
Braze, D., Katz, L., Magnuson, J. S., Mencl, W. E., Tabor, W., Van Dyke, J. A., … Shankweiler,
D. P. (2016). Vocabulary does not complicate the simple view of reading. Reading and Writing, 29(3), 435–451. https://doi.org/10.1007/s11145-015-9608-6
Cunningham, A. J., Witton, C., Talcott, J. B., Burgess, A. P., & Shapiro, L. R. (2015).
Deconstructing phonological tasks: The contribution of stimulus and response type to the
prediction of early decoding skills. Cognition, 143, 178–186.
https://doi.org/10.1016/j.cognition.2015.06.013
Engen, L., & Høien, T. (2002). Phonological skills and reading comprehension. Reading and Writing, 15, 613–631. https://doi.org/10.1023/A:1020958105218
Foorman, B. R., Herrera, S., Petscher, Y., Mitchell, A., & Truckenmiller, A. (2015). The
structure of oral language and reading and their relation to comprehension in Kindergarten
through Grade 2. Reading and Writing, 28(5), 655–681. https://doi.org/10.1007/s11145-
015-9544-5
Gough, P. B., & Tunmer, W. E. (1986). Decoding, reading, and reading disability. Remedial and Special Education, 7, 6–10. https://doi.org/10.1177/074193258600700104
Høien-Tengesdal, I., & Tønnessen, F. E. (2011). The relationship between phonological skills
and word decoding. Scandinavian Journal of Psychology, 52(1), 93–103.
https://doi.org/10.1111/j.1467-9450.2010.00856.x
Lepola, J., Lynch, J., Laakkonen, E., Silvén, M., & Niemi, P. (2012). The role of inference
making and other language skills in the development of narrative listening comprehension
in 4-6-year-old children. Reading Research Quarterly, 47(3), 259–282.
https://doi.org/10.1002/RRQ.020
Tunmer, W. E., & Chapman, J. W. (2012). The Simple View of Reading Redux: Vocabulary
Knowledge and the Independent Components Hypothesis. Journal of Learning Disabilities,
45(5), 453–466. https://doi.org/10.1177/0022219411432685
94
Related Documents