In vivo Raman spectroscopy of human uterine cervix: exploring the utility of vagina as an internal control Rubina Shaikh Tapas Kumar Dora Supriya Chopra Amita Maheshwari Deodhar Kedar K. Rekhi Bharat C. Murali Krishna

Welcome message from author
This document is posted to help you gain knowledge. Please leave a comment to let me know what you think about it! Share it to your friends and learn new things together.
Transcript
In vivo Raman spectroscopy ofhuman uterine cervix: exploring theutility of vagina as an internal control
Rubina ShaikhTapas Kumar DoraSupriya ChopraAmita MaheshwariDeodhar Kedar K.Rekhi BharatC. Murali Krishna
In vivo Raman spectroscopy of human uterine cervix:exploring the utility of vagina as an internal control
Rubina Shaikh,a Tapas Kumar Dora,b Supriya Chopra,b Amita Maheshwari,c Deodhar Kedar K.,d Rekhi Bharat,dand C. Murali Krishnaa,*aChilakapati Lab, ACTREC, Kharghar, Navi-Mumbai 410210, IndiabTata Memorial Center, Radiation Oncology, ACTREC, Kharghar, Navi Mumbai 410210, IndiacTata Memorial Hospital, Gynecology Oncology, Parel, Mumbai 400012, IndiadTata Memorial Hospital, Department of Pathology, Parel, Mumbai 400012, India
Abstract. In vivo Raman spectroscopy is being projected as a new, noninvasive method for cervical cancerdiagnosis. In most of the reported studies, normal areas in the cancerous cervix were used as control.However, in the Indian subcontinent, the majority of cervical cancers are detected at advanced stages, leavingno normal sites for acquiring control spectra. Moreover, vagina and ectocervix are reported to have similar bio-chemical composition. Thus, in the present study, we have evaluated the feasibility of classifying normal andcancerous conditions in the Indian population and we have also explored the utility of the vagina as an internalcontrol. A total of 228 normal and 181 tumor in vivoRaman spectra were acquired from 93 subjects under clinicalsupervision. The spectral features in normal conditions suggest the presence of collagen, while DNA and non-collagenous proteins were abundant in tumors. Principal-component linear discriminant analysis (PC-LDA)yielded 97% classification efficiency between normal and tumor groups. An analysis of a normal cervix andvaginal controls of cancerous and noncancerous subjects suggests similar spectral features between thesegroups. PC-LDA of tumor, normal cervix, and vaginal controls further support the utility of the vagina as aninternal control. Overall, findings of the study corroborate with earlier studies and facilitate objective, noninva-sive, and rapid Raman spectroscopic-based screening/diagnosis of cervical cancers. © 2014 Society of Photo-Optical
Instrumentation Engineers (SPIE) [DOI: 10.1117/1.JBO.19.8.087001]
Keywords: cervical cancer; Raman spectroscopy; in vivo spectroscopy; principal component-linear discrimination analysis; leave-one-out cross validation.
Paper 140121PRR received Mar. 12, 2014; revised manuscript received Jun. 29, 2014; accepted for publication Jul. 14, 2014; pub-lished online Aug. 7, 2014.
1 IntroductionCarcinoma of the uterine cervix is the third most commoncancer among females worldwide.1 Around 80% of the globalburden is contributed by developing countries including India.2
Annually, more than one million new cases are diagnosed inIndia with >50% mortality, which is primarily attributed tolate diagnosis.2 The papanicolau test (Pap test) has been usedas a preliminary screening tool. An abnormal Pap smear is fol-lowed by colposcopy-guided biopsy for confirmatory diagnosis.Histopathology is the gold standard for cervical cancer diagno-sis. However, conventional screening and/or diagnostic toolshave been known to suffer from disadvantages, such as tediousmethodology, long output duration, and interobserver variabil-ity, besides patient discomfort.3,4
Optical spectroscopic techniques, such as fluorescence,infrared (IR), and Raman, have shown potentials in classifyingnormal and tumor groups in various cancers.5–8 Several ex vivoRaman studies have demonstrated the classification of normal,precancerous, and cancerous cervical tissues.9–12 The first invivo Raman study of cervical cancer was reported in 1998.13
A subsequent study has demonstrated similarities between invivo and in vitro cervix spectra.14 Studies were then extendedby exploring the classification of high-grade dysplasia andbenign conditions.15 Successful classification among normal
ectocervix, normal endocervix as well as low-grade dysplasiaand high-grade dysplasia has been reported.16 Recent studiessuggest that the inclusion of parameters, such as hormonaland menopausal status, would improve the classification effi-ciency.17,18 The utility of higher wavenumber Raman spectrain precancer detection has been reported.19 The efficacy ofsimultaneous fingerprint and high-wavenumber Raman spectrain enhancing early detection of cervical precancer has also beendemonstrated.20 More recent studies have demonstrated the util-ity of confocal Raman spectroscopy in improving precancerdetection, noninvasive assessment of menopausal-related hor-monal changes, and the effect of Vagifem treatment on postme-nopausal women.21–22 Despite an abundance of literature,further careful validations on diverse populations and largercohorts are required for the translation of this technologyinto clinics. Cervical cancer subjects in developing countriesare very often present at advanced stages and, in such caseswhen the majority of the cervix is diseased, there is no normalcervix site to acquire control spectra. Therefore, the healthy cer-vix of subjects having other gynecologic cancers (uterine orovarian) undergoing hysterectomies have been used as con-trols,23 in which subject accrual is often a major constraint.Vagina and cervix (ectocervix) are known to have similar his-tology;24 malignancy-associated changes/cancer field effectshave not been reported in cervical cancers. Therefore, as an
*Address all correspondence to: Chilakapat Murali Krishna, E-mail:[email protected] or [email protected] 0091-3286/2014/$25.00 © 2014 SPIE
Journal of Biomedical Optics 087001-1 August 2014 • Vol. 19(8)
Journal of Biomedical Optics 19(8), 087001 (August 2014)
alternative, vagina can be utilized as an internal control, espe-cially in screening camps where colposcopy may not be avail-able. In the present study, we have investigated the feasibility ofthe classification between normal and cervical cancers in theIndian population and also the utility of the vagina as an internalcontrol. Spectral data were analyzed by multivariate statisticaltools, principal component-linear discriminant analysis (PC-LDA) followed by a leave-one-out cross validation and an in-dependent test prediction. The feasibility of classificationbetween all control groups, i.e., the normal cervix sites and vag-inal sites of cancerous and noncancerous subjects, was alsoinvestigated. It was followed by the analysis of normal cervix,vagina, and tumor spectra. The findings of the study are dis-cussed in the paper.
2 Methods and Materials
2.1 Sample Details
Ninety-three (93) subjects diagnosed with gynecological can-cers and referred for treatment at Advanced Center forTreatment, Research and Education in Cancer (ACTREC),Tata Memorial Center, participated in the study. Informedand written consents were taken from each subject prior tothe spectral recording. Nonpregnant subjects in the age groupof 30 to 70 years, with no history of a hysterectomy, wererecruited. Details of menstruation status were obtained througha questionnaire. Among the 93 subjects, 87 (93%) were postme-nopausal and only 6 (7%) were premenopausal subjects.
2.1.1 Normal and cancer subjects
To explore the classification between normal and cervical can-cers, 61 subjects (154 spectra) were enrolled in the study. Out of154, 80 spectra were acquired from a cervical tumor (T) of 31cervical cancer subjects and 74 spectra from an uninvolved nor-mal cervix (N) of 30 subjects. Sample details are given inTable 1(a).
2.1.2 Exploring the utility of the vagina as an internalcontrol
To explore the utility of the vagina as an internal control, 230spectra from 66 subjects were utilized. Among the 230 spectra,74 were acquired from normal cervix sites (N) of 30 normalsubjects, 64 spectra were acquired from normal vaginal sites(VN) of 20 normal subjects and 92 spectra from normal vaginalsites (VT) of 36 cervical cancer subjects [Table 1(b)].
2.1.3 Evaluating internal controls
To evaluate the utility of a vagina as an internal control, a total of409 spectra were utilized. Out of 409, 181 spectra were acquiredfrom 63 cervical cancer subjects (T), 74 spectra from normalcervix sites (N) of 30 normal cervix subjects, 154 spectrawere acquired from uninvolved vaginal sites of 56 subjectswith or without cervical cancers (V) [Table 1(c)].
Cuscus speculum was inserted in vagina to observe cervixthat was cleaned with a saline solution. Multiple in vivoRaman spectra (3 to 6) were recorded from gross tumors normalcervix or vagina of normal and tumor subjects under clinicalsupervision. Raman spectra were acquired by placing theprobe perpendicular to the surface of the site. To avoid contami-nation among subjects, prior to spectral recording, the probe was
disinfected with CIDEX (Johnson and Johnson, Mumbai, India)solution and wrapped in parafilm.
2.2 Raman Spectroscopy
Spectra were recorded with HE-785 commercial Raman spec-trometer (Jobin-Vyon-Horiba, France). Details of the instrumentwere described elsewhere.25 Briefly, this system consists of adiode laser (PI-ECL-785-300-FC, Process Instruments) of785-nm wavelength as an excitation source, a high-efficiencyspectrograph (HE-785, HORIBA Jobin Yvon, France) withfixed 950 gr∕mm grating coupled with charge coupled device(CCD) (CCD-1024X256-BIDD-SYN, Synapse, Longjumeau,France). The commercial RamanProbe (RPS 785/12-5,InPhotonics Inc. (Downey St., Norwood, Massachusetts), con-sisting of an excitation and collection fibers (NA-0.40) withdiameters of 105 and 200 μm, respectively, was used to couplethe excitation source and the detection system. The estimatedspot size and depth of penetration as per the manufacturer’sspecifications were 105 μm and 1 mm, respectively.26 Thisinstrument has no movable parts and the spectral resolutionas per manufacturer’s specification was ∼4 cm−1. As per theprotocol followed in previous studies, to maintain the focus dur-ing all measurements, a detachable spacer with a length of 5 mmwas attached at the tip of the probe.25,27 Spectra were acquired at80-mW laser power, integrated for 5 s, and averaged over threeaccumulations.
Table 1 Details of samples: (a) classification of normal (N) and cer-vical tumor (T); (b) exploring internal controls; and (c) evaluating inter-nal controls.
Categories
Numberof subjects
Numberof spectra
(a) Tumor Vs normal: sample details
Normal cervix (N) 30 74
Tumor (T) 31 80
Total number of cases 61 154
(b) Exploring internal controls: sample details
Normal cervix (N)a 30 74
Normal vagina of normal cervix cases (VN)a 20 64
Normal vagina of normal cervix cases (VT) 36 92
Total number of cases 66 230
(c) Evaluating internal controls: sample details
Tumor (T)b 63 181
Normal cervix (N) 30 74
Vagina (V)b 56 154
Total number of cases 93 409
a20 cases were common.b56 cases were common.
Journal of Biomedical Optics 087001-2 August 2014 • Vol. 19(8)
Shaikh et al.: In vivo Raman spectroscopy of human uterine cervix. . .
2.3 Data Analysis
In vivo Raman spectra were preprocessed by correcting for aCCD response with a National Institute of Standards andTechnology certified SRM 2241 material followed by back-ground subtraction to remove the spectral contaminationsfrom fibers and optic elements.28 To remove the interferenceof the slow-moving background, the first derivative of the pre-processed Raman spectra was computed (Savitzky–Golay, win-dow size 3).29,30 The primary objective of the first derivativecorrection was to construct a spectral profile depicting point-by-point deviation of the spectral intensity over a moving win-dow of three points. This transformation provides a peak profilein the spectra irrespective of optical response-related intensity.Since our previous studies have demonstrated the efficacy of the1200 − 1800 cm−1 region in classifying normal and malignantoral cancers27,28 and as it is less influenced by fiber signals,we have employed same region for further analysis.Background-corrected spectra were interpolated and first deriv-atized, which was followed by a vector normalization. Vector-normalized spectra were subjected to PC-LDA, the multivariatestatistical tool.27,28
In PC-LDA, principal component analysis (PCA) is first car-ried out on the entire data set to reduce the dimensions of thedata, while preserving the diagnostically significant informationfor classification. PCA describes data variance by identifying anew set of orthogonal features, so-called principal components(PCs) or eigenvectors. Due to their orthogonal characteristics,the first few PCs are sufficient to represent the maximumdata variance. Every eigenvector is associated with the originalspectrum by a variable named as a PC score, which characterizesthe rank of that particular component against the source
spectrum. Differences between different classes are reflectedby PC scores. An unpaired student’s t-test was used to diagnos-tically identify significant PCs (p < 0.05).31,32 These PC scoreswere used as input data for linear discriminant analysis (LDA)algorithms-based classifications. Although PCA aims to identifythe features that represent variance in the data, LDA providesdata classification based on an optimized criterion, whichwas objective for more class separability. An LDA transforma-tion matrix was generated, and it further identifies eigenvector orLDA components of this classification criterion.32 Scree plotsdepict the variance (% correct classifications) accounted forby the total number of LDA components selected for analysis.The outcomes of PC-LDA were represented in the form of aconfusion matrix, where diagonal elements were true positiveand nondiagonal elements were false-positive predictions.The confusion matrix aids in understanding the separationwithin the groups, which were acquired by accounting forthe contribution of all selected factors used for analysis. PC-LDA results were also represented in the form of scatterplots, generated by plotting various combinations of scores ofthe factors. The performance of the PC-LDA diagnostic modelswas further validated in an unbiased method by leave-one-outcross validation (LOOCV). In the LOOCV methodology, onespectrum were held out from the data set and the remainingdata were used to redevelop the PC-LDA model. In our experi-ments, test prediction was also used to validate the model.
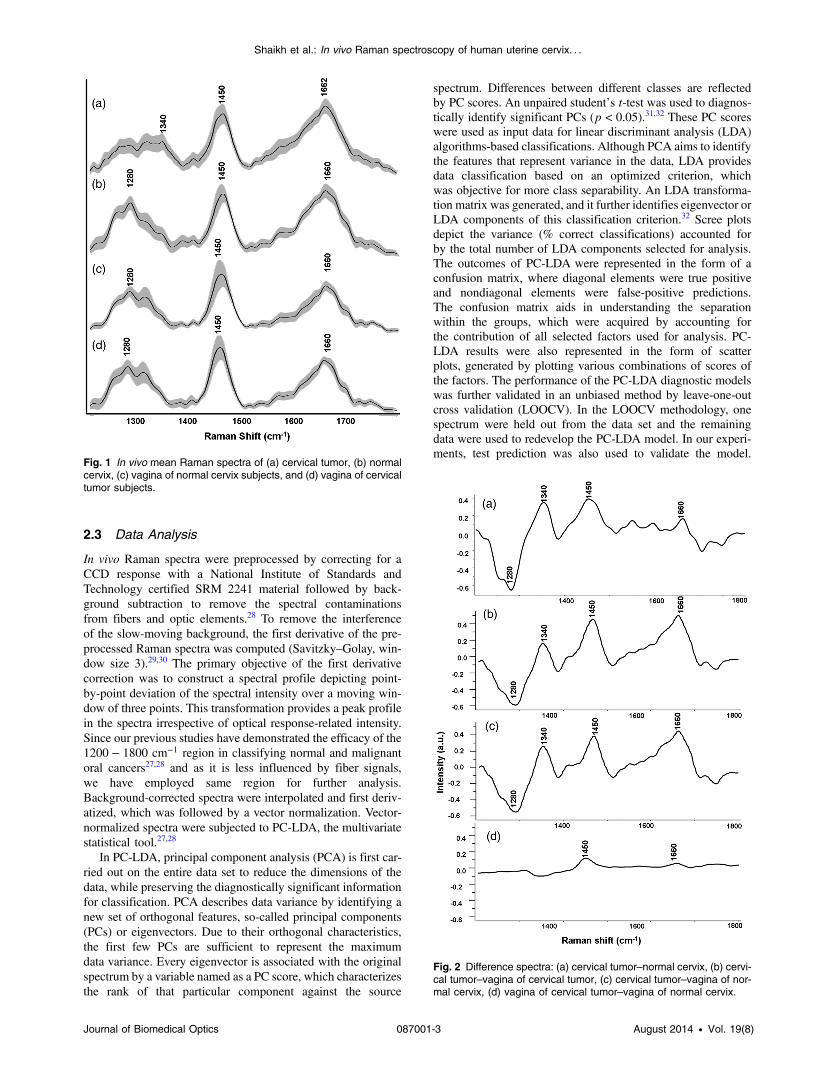
Fig. 1 In vivo mean Raman spectra of (a) cervical tumor, (b) normalcervix, (c) vagina of normal cervix subjects, and (d) vagina of cervicaltumor subjects.
Fig. 2 Difference spectra: (a) cervical tumor–normal cervix, (b) cervi-cal tumor–vagina of cervical tumor, (c) cervical tumor–vagina of nor-mal cervix, (d) vagina of cervical tumor–vagina of normal cervix.
Journal of Biomedical Optics 087001-3 August 2014 • Vol. 19(8)
Shaikh et al.: In vivo Raman spectroscopy of human uterine cervix. . .
This process was repeated until all withheld spectra were clas-sified. Algorithms for these analyses were implemented inMATLAB® (Mathworks Inc., Norwood, Massachusetts) basedin-house software.33
Average spectra were calculated from the background sub-tracted spectra prior to derivatization for each group andwere baseline corrected by fitting a fifth-order polynomial
function. These baseline-corrected, smoothed (Savitzky–Golay, 3), and vector-normalized spectra were used for spectralcomparisons and for computing the difference spectra. The stan-dard deviation and mean were also computed to illustrate theintraclass variability.
3 Results and Discussions
3.1 Raman Spectral Features
Vector-normalized average in vivo spectra of cervical tumor (T),normal cervix (N), vagina of normal (VN), and cervical cancer(VT) cases along with their standard deviations are illustrated inFig. 1. Standard deviation spectra showed minor intensity-related changes within the groups. The mean spectra of a normalcervix exhibit characteristic features of amide III and strong andbroad amide I, which can be attributed to the presence of col-lagenous proteins. Prominent spectral features in a tumor, withrespect to a normal spectrum, are strong and sharper amide I, aminor shift in δCH2 and a distinct band at 1340 cm−1, which areindicative of DNA and noncollagenous proteins. These findingscorroborate earlier ex vivo and in vivo Raman spectroscopicstudies on cervical cancers,9,10,24 although in vivo vagina spectralfeatures were very similar to normal cervix and exhibited fea-tures of collagenous proteins, indicating resemblances in theirbiochemical compositions.
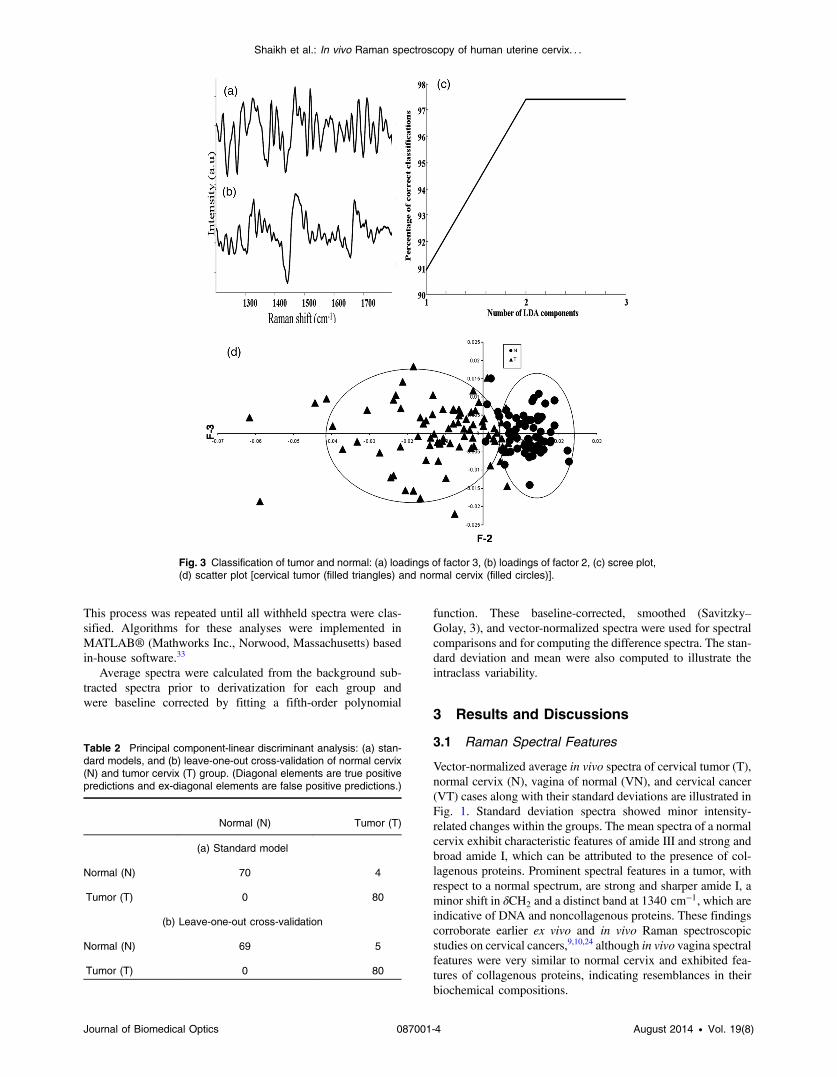
Fig. 3 Classification of tumor and normal: (a) loadings of factor 3, (b) loadings of factor 2, (c) scree plot,(d) scatter plot [cervical tumor (filled triangles) and normal cervix (filled circles)].
Table 2 Principal component-linear discriminant analysis: (a) stan-dard models, and (b) leave-one-out cross-validation of normal cervix(N) and tumor cervix (T) group. (Diagonal elements are true positivepredictions and ex-diagonal elements are false positive predictions.)
Normal (N) Tumor (T)
(a) Standard model
Normal (N) 70 4
Tumor (T) 0 80
(b) Leave-one-out cross-validation
Normal (N) 69 5
Tumor (T) 0 80
Journal of Biomedical Optics 087001-4 August 2014 • Vol. 19(8)
Shaikh et al.: In vivo Raman spectroscopy of human uterine cervix. . .
To reveal the spectral differences between cervical tumor andnormal cervix, the difference spectra, one of the conventionalways to understand the spectral variations, were employed.Difference spectrum was computed by subtracting the mean nor-mal cervix spectrum from the mean cervical tumor spectrum[Fig. 2(a)].The positive peaks in the difference spectrum arefrom a tumor, while negative bands are from normal. Strongpositive peaks of proteins, such as amide I (1662 cm−1),δCH2 deformation (1450 cm−1), and DNA (1340 cm−1) suggesttheir predominance in tumor spectrum, whereas negative peaks(1280 cm−1) indicate higher collagenous protein in a normalcervix. The difference spectra of T-VT, T-VN, and VT-VNare illustrated in Figs. 2(b)–2(d), respectively. It was observedthat the difference spectra of T-VT and T-VN showed a similarprofile to that of T-N (Fig. 2). Observed positive peaks at 1660,1450, and 1340 cm−1 of the difference spectra were character-istic of a cervical tumor, which indicates increased DNA andprotein while negative peaks at 1280 and 1240 cm−1 indicatecollagenous proteins. The difference spectra of VT-VN showed
minor variations in amide I and δCH2 peaks, further exhibitingsimilarities among VT and VN.
3.2 Multivariate Analysis
3.2.1 Exploring the classification between normal andcancer groups
To determine the feasibility of classification between normaland cervical tumors, the vector-normalized preprocessed spectrawere subjected to supervise the method of PC-LDA followed byLOOCV. Loadings of factors can provide crucial informationof biochemical variations among different groups. Loadingsof factors 3 and 2 are presented in Figs. 3(a) and 3(b), respec-tively. The findings corroborate spectral variability suggestingdifferences in the types of proteins and the content of nucleicacid among normal and tumor groups. The third PC (PC3)has two major bands that correspond to δCH2 stretch and avibrational mode at 1340 cm−1 from nucleic acid. In the secondcomponent (PC2), the main peak features correspond to amide I,
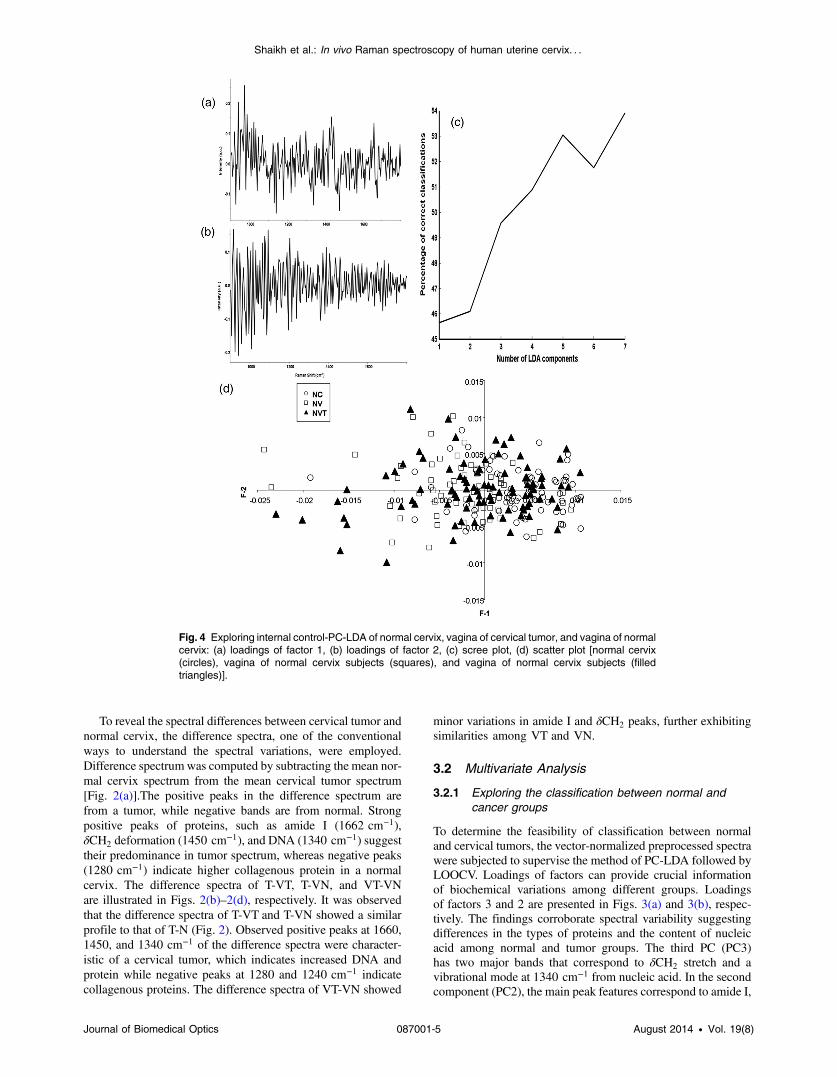
Fig. 4 Exploring internal control-PC-LDA of normal cervix, vagina of cervical tumor, and vagina of normalcervix: (a) loadings of factor 1, (b) loadings of factor 2, (c) scree plot, (d) scatter plot [normal cervix(circles), vagina of normal cervix subjects (squares), and vagina of normal cervix subjects (filledtriangles)].
Journal of Biomedical Optics 087001-5 August 2014 • Vol. 19(8)
Shaikh et al.: In vivo Raman spectroscopy of human uterine cervix. . .
δCH2 stretch, and nucleic acid. A scree plot depicts the varianceor percent correct classifications accounting for the total numberof factors selected for analysis. Three factors contributing to∼97% of the classification were used for analysis, whichis shown in Fig. 3(c). The scatter plot has been shown inFig. 3(d); it depicts exclusive clusters corresponding to normaland cervical tumors. These results are also summarized inTable 2. As seen, 70/74 normal and 80/80 tumor spectrawere correctly classified. None of the tumor spectra were mis-classified, whereas 4 normal spectra were misclassified astumors. LOOCV was also executed to evaluate the classificationefficiency of the model and has been shown in Table 2(b). Only5 spectra out of 74 normal cervix sites were misclassified and alltumor spectra were correctly classified. An average classifica-tion efficiency of 97% was observed.
3.2.2 Exploring internal controls
Several in vivo Raman studies on cervical cancers have investi-gated the role of parameters, such as menopausal status, hormonalstatus, age, and parity on the classification efficiency of thedata.14–19 In such studies, colposcopy-guided spectra of normalsites were used as controls. As mentioned earlier, in developingcountries such as India, cervical cancer subjects present atadvanced stages (Stage IIA and above).4 As the majority ofthe cervix is involved, no normal cervix sites are left to acquirecontrol spectra. In such cases, spectra acquired from normal cer-vix of subjects undergoing hysterectomy for other gynecologicalcancers were used as controls.24 This could be a major constraintfor subject accruals, especially in cancer hospitals where normalhysterectomy cases rarely visit. Moreover, the composition of avagina and an ectocervix is similar as they contain the inner liningof squamous epithelial cells;25 no CFE/MAC has been reported incervical cancers, thus vagina can serve as a good internal control.Hence we have explored the utility of a vagina as an internal con-trol. This approach could be helpful to circumvent interpatientvariability as well as it could be useful, especially in screeningcamps where colposcopy may not be available.
To explore the variations between the control groups, 74 spec-tra from normal cervix (N), 64 from the vagina of normal subjects(VN), and 92 from the vagina of tumor subjects (VT) were ana-lyzed by PC-LDA using seven factors. Loadings of factors 1 and2 are shown in Figs. 4(a) and 4(b), respectively. As seen at theloading, no major differences were observed within the controlgroups. Scree and scatter plots are shown in Figs. 4(c) and 4(d), respectively. A large overlap and/or misclassificationswere observed among normal cervix (N), vagina of normal cervixsubjects (VN) and vagina of cervical tumor subjects (VT).
The findings of PC-LDA are also shown in a confusionmatrix for a standard model and LOOCV in Table 3(a) and 3(b),respectively. In the case of the standard model, 49/74 normalcervix spectra (N), 41/64 vagina spectral sites of normal subjects(VN), and 34/92 vagina spectral sites of tumor subjects (VT)were correctly classified. In the case of LOOCV, 44/74 of nor-mal cervix spectra (N), 25/64 vaginal sites of normal subjects(VN), and 21/92 vaginal sites of tumor subjects (VT) were cor-rectly classified. Whereas 13 and 17 spectra of the normal cervix(N) were misclassified with the vaginal sites of normal subjects(VN) and the vagina of tumor subjects (VT), respectively, and inthe case of the vagina of normal subjects (VN), 9 and 30 spectrawere misclassified with a normal cervix (N) and the vagina oftumor subjects (VT), respectively. For vaginal sites of tumorsubjects (VT), 36 spectra were misclassified with a normal
cervix (N) and 35 with spectra of vagina of normal subjects(VN). The higher misclassifications were observed among thespectra of normal cervix (N), vagina of normal subjects(VN), and vaginal sites of tumor subjects (VT), which wereindicative of the biochemical similarities among these groups.The findings suggest that vaginal sites can be used as an internalcontrol on similar lines to the oral and breast cancers wherein,contralateral and uninvolved areas are employed as controls,respectively.26,34 This approach may also help to circumventthe possible influence of hormonal status, menopausal status,age, and parity. Also, spectral acquisition does not require col-poscope at the site. As the spectra of a vagina of normal subjects(VN) and a vagina of tumor subjects (VT) show similarities, wehave grouped them together and referred to as vagina spectra (V)in our subsequent evaluations of a vagina as a control. It is alsoimportant to note that among 93 subjects, 87 (93%) cases werepostmenopausal and only 6 (7%) were premenopausal. Hence,menopausal status may not have an influence on current results.
3.2.3 Evaluating internal controls
In order to evaluate the efficacy of Raman spectroscopic meth-ods in discriminating tumor conditions against control groups,spectra from the site of the tumor (T), the normal cervix (N), andthe vagina (V) were subjected to PC-LDA. In the first step, 28spectra from tumor (T), 34 from normal cervix (N), and 24 spec-tra of the vaginal (V) were employed to build the standard modelby utilizing seven factors. Loadings of factors, scree, and scatterplots are shown in Fig. 5. The loadings of factors 1 and 2 exhib-ited similar patterns as it was observed in the classification ofnormal and cervical tumors, also corroborating the observationsof mean spectral findings. The first PC (PC1) has three majorbands that correspond to amide I, δCH2 stretch, and a band at1340 cm−1 from nucleic acid. In the second component, PC2exhibited minor peak features corresponding to amide I and
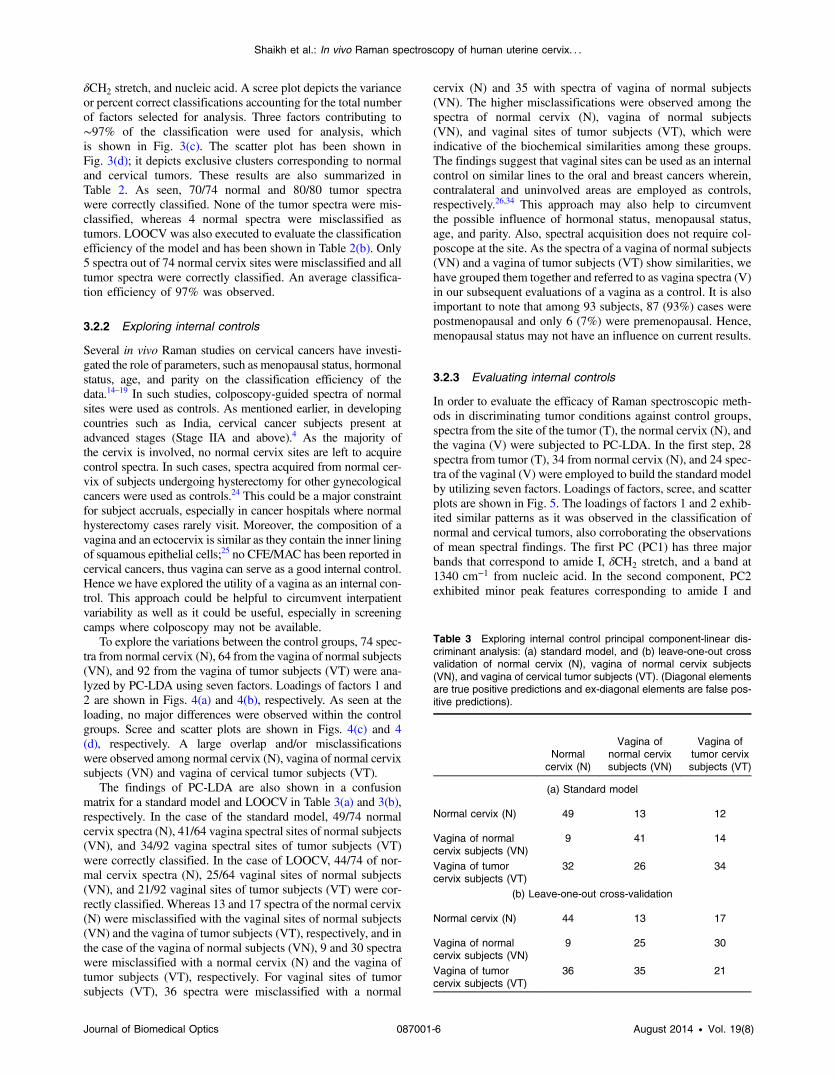
Table 3 Exploring internal control principal component-linear dis-criminant analysis: (a) standard model, and (b) leave-one-out crossvalidation of normal cervix (N), vagina of normal cervix subjects(VN), and vagina of cervical tumor subjects (VT). (Diagonal elementsare true positive predictions and ex-diagonal elements are false pos-itive predictions).
Normalcervix (N)
Vagina ofnormal cervixsubjects (VN)
Vagina oftumor cervixsubjects (VT)
(a) Standard model
Normal cervix (N) 49 13 12
Vagina of normalcervix subjects (VN)
9 41 14
Vagina of tumorcervix subjects (VT)
32 26 34
(b) Leave-one-out cross-validation
Normal cervix (N) 44 13 17
Vagina of normalcervix subjects (VN)
9 25 30
Vagina of tumorcervix subjects (VT)
36 35 21
Journal of Biomedical Optics 087001-6 August 2014 • Vol. 19(8)
Shaikh et al.: In vivo Raman spectroscopy of human uterine cervix. . .
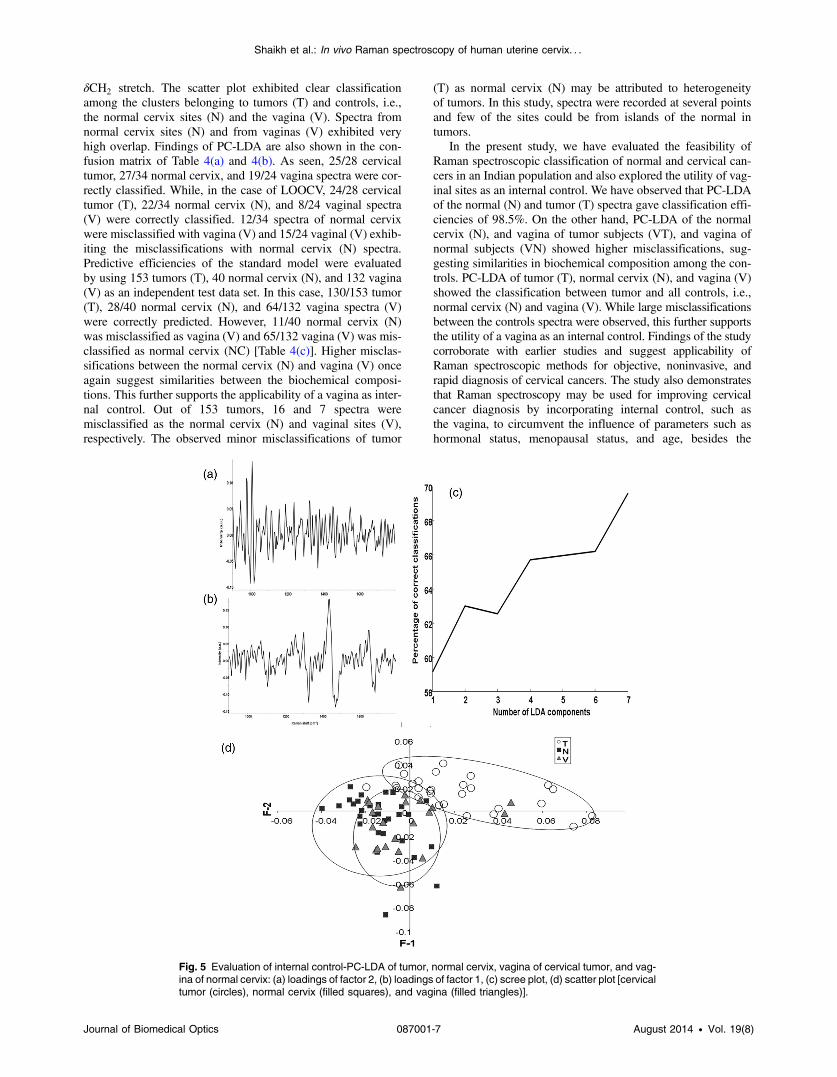
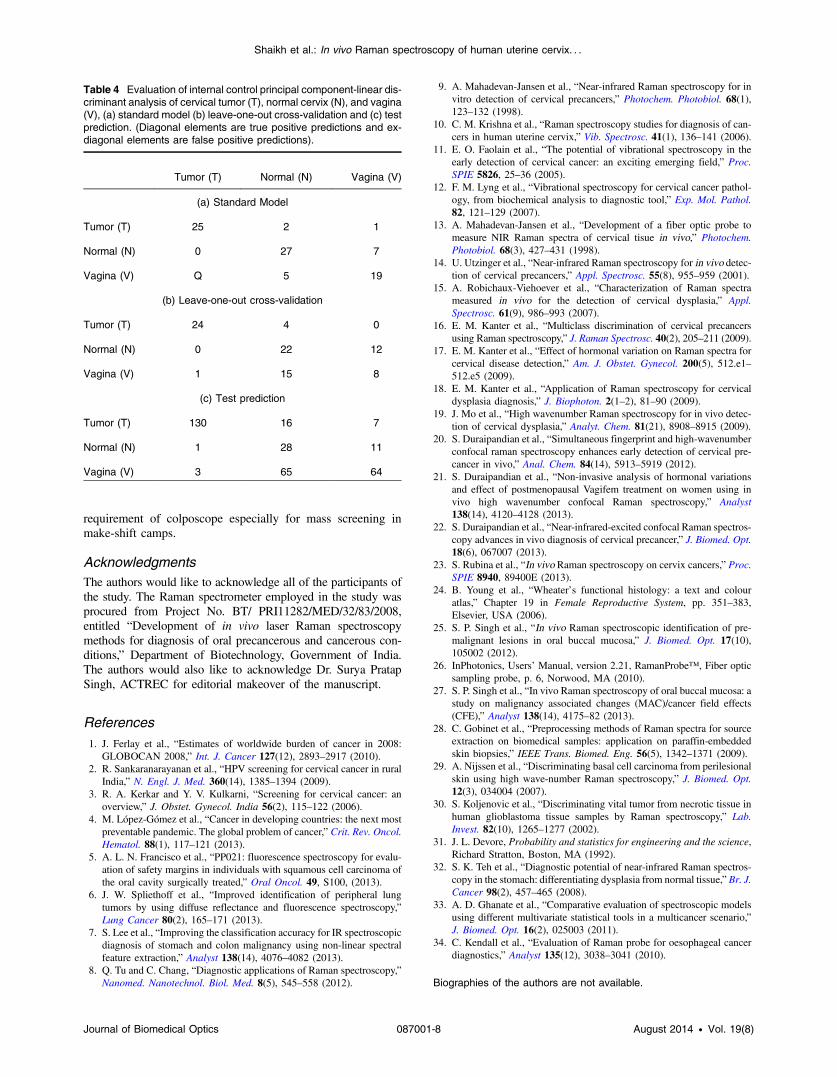
δCH2 stretch. The scatter plot exhibited clear classificationamong the clusters belonging to tumors (T) and controls, i.e.,the normal cervix sites (N) and the vagina (V). Spectra fromnormal cervix sites (N) and from vaginas (V) exhibited veryhigh overlap. Findings of PC-LDA are also shown in the con-fusion matrix of Table 4(a) and 4(b). As seen, 25/28 cervicaltumor, 27/34 normal cervix, and 19/24 vagina spectra were cor-rectly classified. While, in the case of LOOCV, 24/28 cervicaltumor (T), 22/34 normal cervix (N), and 8/24 vaginal spectra(V) were correctly classified. 12/34 spectra of normal cervixwere misclassified with vagina (V) and 15/24 vaginal (V) exhib-iting the misclassifications with normal cervix (N) spectra.Predictive efficiencies of the standard model were evaluatedby using 153 tumors (T), 40 normal cervix (N), and 132 vagina(V) as an independent test data set. In this case, 130/153 tumor(T), 28/40 normal cervix (N), and 64/132 vagina spectra (V)were correctly predicted. However, 11/40 normal cervix (N)was misclassified as vagina (V) and 65/132 vagina (V) was mis-classified as normal cervix (NC) [Table 4(c)]. Higher misclas-sifications between the normal cervix (N) and vagina (V) onceagain suggest similarities between the biochemical composi-tions. This further supports the applicability of a vagina as inter-nal control. Out of 153 tumors, 16 and 7 spectra weremisclassified as the normal cervix (N) and vaginal sites (V),respectively. The observed minor misclassifications of tumor
(T) as normal cervix (N) may be attributed to heterogeneityof tumors. In this study, spectra were recorded at several pointsand few of the sites could be from islands of the normal intumors.
In the present study, we have evaluated the feasibility ofRaman spectroscopic classification of normal and cervical can-cers in an Indian population and also explored the utility of vag-inal sites as an internal control. We have observed that PC-LDAof the normal (N) and tumor (T) spectra gave classification effi-ciencies of 98.5%. On the other hand, PC-LDA of the normalcervix (N), and vagina of tumor subjects (VT), and vagina ofnormal subjects (VN) showed higher misclassifications, sug-gesting similarities in biochemical composition among the con-trols. PC-LDA of tumor (T), normal cervix (N), and vagina (V)showed the classification between tumor and all controls, i.e.,normal cervix (N) and vagina (V). While large misclassificationsbetween the controls spectra were observed, this further supportsthe utility of a vagina as an internal control. Findings of the studycorroborate with earlier studies and suggest applicability ofRaman spectroscopic methods for objective, noninvasive, andrapid diagnosis of cervical cancers. The study also demonstratesthat Raman spectroscopy may be used for improving cervicalcancer diagnosis by incorporating internal control, such asthe vagina, to circumvent the influence of parameters such ashormonal status, menopausal status, and age, besides the
Fig. 5 Evaluation of internal control-PC-LDA of tumor, normal cervix, vagina of cervical tumor, and vag-ina of normal cervix: (a) loadings of factor 2, (b) loadings of factor 1, (c) scree plot, (d) scatter plot [cervicaltumor (circles), normal cervix (filled squares), and vagina (filled triangles)].
Journal of Biomedical Optics 087001-7 August 2014 • Vol. 19(8)
Shaikh et al.: In vivo Raman spectroscopy of human uterine cervix. . .
requirement of colposcope especially for mass screening inmake-shift camps.
AcknowledgmentsThe authors would like to acknowledge all of the participants ofthe study. The Raman spectrometer employed in the study wasprocured from Project No. BT/ PRI11282/MED/32/83/2008,entitled “Development of in vivo laser Raman spectroscopymethods for diagnosis of oral precancerous and cancerous con-ditions,” Department of Biotechnology, Government of India.The authors would also like to acknowledge Dr. Surya PratapSingh, ACTREC for editorial makeover of the manuscript.
References1. J. Ferlay et al., “Estimates of worldwide burden of cancer in 2008:
GLOBOCAN 2008,” Int. J. Cancer 127(12), 2893–2917 (2010).2. R. Sankaranarayanan et al., “HPV screening for cervical cancer in rural
India,” N. Engl. J. Med. 360(14), 1385–1394 (2009).3. R. A. Kerkar and Y. V. Kulkarni, “Screening for cervical cancer: an
overview,” J. Obstet. Gynecol. India 56(2), 115–122 (2006).4. M. López-Gómez et al., “Cancer in developing countries: the next most
preventable pandemic. The global problem of cancer,” Crit. Rev. Oncol.Hematol. 88(1), 117–121 (2013).
5. A. L. N. Francisco et al., “PP021: fluorescence spectroscopy for evalu-ation of safety margins in individuals with squamous cell carcinoma ofthe oral cavity surgically treated,” Oral Oncol. 49, S100, (2013).
6. J. W. Spliethoff et al., “Improved identification of peripheral lungtumors by using diffuse reflectance and fluorescence spectroscopy,”Lung Cancer 80(2), 165–171 (2013).
7. S. Lee et al., “Improving the classification accuracy for IR spectroscopicdiagnosis of stomach and colon malignancy using non-linear spectralfeature extraction,” Analyst 138(14), 4076–4082 (2013).
8. Q. Tu and C. Chang, “Diagnostic applications of Raman spectroscopy,”Nanomed. Nanotechnol. Biol. Med. 8(5), 545–558 (2012).
9. A. Mahadevan-Jansen et al., “Near-infrared Raman spectroscopy for invitro detection of cervical precancers,” Photochem. Photobiol. 68(1),123–132 (1998).
10. C. M. Krishna et al., “Raman spectroscopy studies for diagnosis of can-cers in human uterine cervix,” Vib. Spectrosc. 41(1), 136–141 (2006).
11. E. O. Faolain et al., “The potential of vibrational spectroscopy in theearly detection of cervical cancer: an exciting emerging field,” Proc.SPIE 5826, 25–36 (2005).
12. F. M. Lyng et al., “Vibrational spectroscopy for cervical cancer pathol-ogy, from biochemical analysis to diagnostic tool,” Exp. Mol. Pathol.82, 121–129 (2007).
13. A. Mahadevan-Jansen et al., “Development of a fiber optic probe tomeasure NIR Raman spectra of cervical tisue in vivo,” Photochem.Photobiol. 68(3), 427–431 (1998).
14. U. Utzinger et al., “Near-infrared Raman spectroscopy for in vivo detec-tion of cervical precancers,” Appl. Spectrosc. 55(8), 955–959 (2001).
15. A. Robichaux-Viehoever et al., “Characterization of Raman spectrameasured in vivo for the detection of cervical dysplasia,” Appl.Spectrosc. 61(9), 986–993 (2007).
16. E. M. Kanter et al., “Multiclass discrimination of cervical precancersusing Raman spectroscopy,” J. Raman Spectrosc. 40(2), 205–211 (2009).
17. E. M. Kanter et al., “Effect of hormonal variation on Raman spectra forcervical disease detection,” Am. J. Obstet. Gynecol. 200(5), 512.e1–512.e5 (2009).
18. E. M. Kanter et al., “Application of Raman spectroscopy for cervicaldysplasia diagnosis,” J. Biophoton. 2(1–2), 81–90 (2009).
19. J. Mo et al., “High wavenumber Raman spectroscopy for in vivo detec-tion of cervical dysplasia,” Analyt. Chem. 81(21), 8908–8915 (2009).
20. S. Duraipandian et al., “Simultaneous fingerprint and high-wavenumberconfocal raman spectroscopy enhances early detection of cervical pre-cancer in vivo,” Anal. Chem. 84(14), 5913–5919 (2012).
21. S. Duraipandian et al., “Non-invasive analysis of hormonal variationsand effect of postmenopausal Vagifem treatment on women using invivo high wavenumber confocal Raman spectroscopy,” Analyst138(14), 4120–4128 (2013).
22. S. Duraipandian et al., “Near-infrared-excited confocal Raman spectros-copy advances in vivo diagnosis of cervical precancer,” J. Biomed. Opt.18(6), 067007 (2013).
23. S. Rubina et al., “In vivo Raman spectroscopy on cervix cancers,” Proc.SPIE 8940, 89400E (2013).
24. B. Young et al., “Wheater’s functional histology: a text and colouratlas,” Chapter 19 in Female Reproductive System, pp. 351–383,Elsevier, USA (2006).
25. S. P. Singh et al., “In vivo Raman spectroscopic identification of pre-malignant lesions in oral buccal mucosa,” J. Biomed. Opt. 17(10),105002 (2012).
26. InPhotonics, Users’ Manual, version 2.21, RamanProbe™, Fiber opticsampling probe, p. 6, Norwood, MA (2010).
27. S. P. Singh et al., “In vivo Raman spectroscopy of oral buccal mucosa: astudy on malignancy associated changes (MAC)/cancer field effects(CFE),” Analyst 138(14), 4175–82 (2013).
28. C. Gobinet et al., “Preprocessing methods of Raman spectra for sourceextraction on biomedical samples: application on paraffin-embeddedskin biopsies,” IEEE Trans. Biomed. Eng. 56(5), 1342–1371 (2009).
29. A. Nijssen et al., “Discriminating basal cell carcinoma from perilesionalskin using high wave-number Raman spectroscopy,” J. Biomed. Opt.12(3), 034004 (2007).
30. S. Koljenovic et al., “Discriminating vital tumor from necrotic tissue inhuman glioblastoma tissue samples by Raman spectroscopy,” Lab.Invest. 82(10), 1265–1277 (2002).
31. J. L. Devore, Probability and statistics for engineering and the science,Richard Stratton, Boston, MA (1992).
32. S. K. Teh et al., “Diagnostic potential of near-infrared Raman spectros-copy in the stomach: differentiating dysplasia from normal tissue,” Br. J.Cancer 98(2), 457–465 (2008).
33. A. D. Ghanate et al., “Comparative evaluation of spectroscopic modelsusing different multivariate statistical tools in a multicancer scenario,”J. Biomed. Opt. 16(2), 025003 (2011).
34. C. Kendall et al., “Evaluation of Raman probe for oesophageal cancerdiagnostics,” Analyst 135(12), 3038–3041 (2010).
Biographies of the authors are not available.
Table 4 Evaluation of internal control principal component-linear dis-criminant analysis of cervical tumor (T), normal cervix (N), and vagina(V), (a) standard model (b) leave-one-out cross-validation and (c) testprediction. (Diagonal elements are true positive predictions and ex-diagonal elements are false positive predictions).
Tumor (T) Normal (N) Vagina (V)
(a) Standard Model
Tumor (T) 25 2 1
Normal (N) 0 27 7
Vagina (V) Q 5 19
(b) Leave-one-out cross-validation
Tumor (T) 24 4 0
Normal (N) 0 22 12
Vagina (V) 1 15 8
(c) Test prediction
Tumor (T) 130 16 7
Normal (N) 1 28 11
Vagina (V) 3 65 64
Journal of Biomedical Optics 087001-8 August 2014 • Vol. 19(8)
Shaikh et al.: In vivo Raman spectroscopy of human uterine cervix. . .
Related Documents