RESEARCH ARTICLE Improved Characterization of EV Preparations Based on Protein to Lipid Ratio and Lipid Properties Xabier Osteikoetxea 1 , Andrea Balogh 2 , Katalin Szabó-Taylor 1 , Andrea Németh 1 , Tamás Géza Szabó 1 , Krisztina Pálóczi 1 , Barbara Sódar 1 , Ágnes Kittel 3 , Bence György 4,1 , Éva Pállinger 1 , János Matkó 2 , Edit Irén Buzás 1 * 1 Department of Genetics, Cell- and Immunobiology, Semmelweis University, Budapest, Hungary, 2 Department of Immunology, Eötvös Loránd University, Budapest, Hungary, 3 Institute of Experimental Medicine, Hungarian Academy of Sciences, Budapest, Hungary, 4 Howard Hughes Medical Institute, Harvard Medical School, Boston, Massachusetts, United States of America * [email protected] Abstract In recent years the study of extracellular vesicles has gathered much scientific and clinical interest. As the field is expanding, it is becoming clear that better methods for characteriza- tion and quantification of extracellular vesicles as well as better standards to compare stud- ies are warranted. The goal of the present work was to find improved parameters to characterize extracellular vesicle preparations. Here we introduce a simple 96 well plate- based total lipid assay for determination of lipid content and protein to lipid ratios of extracel- lular vesicle preparations from various myeloid and lymphoid cell lines as well as blood plas- ma. These preparations included apoptotic bodies, microvesicles/microparticles, and exosomes isolated by size-based fractionation. We also investigated lipid bilayer order of extracellular vesicle subpopulations using Di-4-ANEPPDHQ lipid probe, and lipid composi- tion using affinity reagents to clustered cholesterol (monoclonal anti-cholesterol antibody) and ganglioside GM1 (cholera toxin subunit B). We have consistently found different protein to lipid ratios characteristic for the investigated extracellular vesicle subpopulations which were substantially altered in the case of vesicular damage or protein contamination. Spec- tral ratiometric imaging and flow cytometric analysis also revealed marked differences be- tween the various vesicle populations in their lipid order and their clustered membrane cholesterol and GM1 content. Our study introduces for the first time a simple and readily available lipid assay to complement the widely used protein assays in order to better char- acterize extracellular vesicle preparations. Besides differentiating extracellular vesicle sub- populations, the novel parameters introduced in this work (protein to lipid ratio, lipid bilayer order, and lipid composition), may prove useful for quality control of extracellular vesicle re- lated basic and clinical studies. PLOS ONE | DOI:10.1371/journal.pone.0121184 March 23, 2015 1 / 16 OPEN ACCESS Citation: Osteikoetxea X, Balogh A, Szabó-Taylor K, Németh A, Szabó TG, Pálóczi K, et al. (2015) Improved Characterization of EV Preparations Based on Protein to Lipid Ratio and Lipid Properties. PLoS ONE 10(3): e0121184. doi:10.1371/journal. pone.0121184 Academic Editor: Andrea Caporali, University of Edinburgh, UNITED KINGDOM Received: August 28, 2014 Accepted: January 28, 2015 Published: March 23, 2015 Copyright: © 2015 Osteikoetxea et al. This is an open access article distributed under the terms of the Creative Commons Attribution License, which permits unrestricted use, distribution, and reproduction in any medium, provided the original author and source are credited. Data Availability Statement: All relevant data are within the paper and its Supporting Information files. Funding: This work was supported by OTKA 84043 (http://www.otka.hu/) FP7-PEOPLE-2011-ITN—PITN- GA-2011-289033 “DYNANO”(http://www.dynano.eu/) BMBS COST Action BM1202 ME HAD (http://www. mehad-cost.eu/). The funders had no role in study design, data collection and analysis, decision to publish, or preparation of the manuscript. Competing Interests: The authors have declared that no competing interests exist.

Welcome message from author
This document is posted to help you gain knowledge. Please leave a comment to let me know what you think about it! Share it to your friends and learn new things together.
Transcript
RESEARCH ARTICLE
Improved Characterization of EVPreparations Based on Protein to Lipid Ratioand Lipid PropertiesXabier Osteikoetxea1, Andrea Balogh2, Katalin Szabó-Taylor1, Andrea Németh1, TamásGéza Szabó1, Krisztina Pálóczi1, Barbara Sódar1, Ágnes Kittel3, Bence György4,1,Éva Pállinger1, János Matkó2, Edit Irén Buzás1*
1 Department of Genetics, Cell- and Immunobiology, Semmelweis University, Budapest, Hungary, 2Department of Immunology, Eötvös Loránd University, Budapest, Hungary, 3 Institute of ExperimentalMedicine, Hungarian Academy of Sciences, Budapest, Hungary, 4 Howard Hughes Medical Institute,Harvard Medical School, Boston, Massachusetts, United States of America
AbstractIn recent years the study of extracellular vesicles has gathered much scientific and clinical
interest. As the field is expanding, it is becoming clear that better methods for characteriza-
tion and quantification of extracellular vesicles as well as better standards to compare stud-
ies are warranted. The goal of the present work was to find improved parameters to
characterize extracellular vesicle preparations. Here we introduce a simple 96 well plate-
based total lipid assay for determination of lipid content and protein to lipid ratios of extracel-
lular vesicle preparations from various myeloid and lymphoid cell lines as well as blood plas-
ma. These preparations included apoptotic bodies, microvesicles/microparticles, and
exosomes isolated by size-based fractionation. We also investigated lipid bilayer order of
extracellular vesicle subpopulations using Di-4-ANEPPDHQ lipid probe, and lipid composi-
tion using affinity reagents to clustered cholesterol (monoclonal anti-cholesterol antibody)
and ganglioside GM1 (cholera toxin subunit B). We have consistently found different protein
to lipid ratios characteristic for the investigated extracellular vesicle subpopulations which
were substantially altered in the case of vesicular damage or protein contamination. Spec-
tral ratiometric imaging and flow cytometric analysis also revealed marked differences be-
tween the various vesicle populations in their lipid order and their clustered membrane
cholesterol and GM1 content. Our study introduces for the first time a simple and readily
available lipid assay to complement the widely used protein assays in order to better char-
acterize extracellular vesicle preparations. Besides differentiating extracellular vesicle sub-
populations, the novel parameters introduced in this work (protein to lipid ratio, lipid bilayer
order, and lipid composition), may prove useful for quality control of extracellular vesicle re-
lated basic and clinical studies.
PLOS ONE | DOI:10.1371/journal.pone.0121184 March 23, 2015 1 / 16
OPEN ACCESS
Citation: Osteikoetxea X, Balogh A, Szabó-Taylor K,Németh A, Szabó TG, Pálóczi K, et al. (2015)Improved Characterization of EV Preparations Basedon Protein to Lipid Ratio and Lipid Properties. PLoSONE 10(3): e0121184. doi:10.1371/journal.pone.0121184
Academic Editor: Andrea Caporali, University ofEdinburgh, UNITED KINGDOM
Received: August 28, 2014
Accepted: January 28, 2015
Published: March 23, 2015
Copyright: © 2015 Osteikoetxea et al. This is anopen access article distributed under the terms of theCreative Commons Attribution License, which permitsunrestricted use, distribution, and reproduction in anymedium, provided the original author and source arecredited.
Data Availability Statement: All relevant data arewithin the paper and its Supporting Information files.
Funding: This work was supported by OTKA 84043(http://www.otka.hu/) FP7-PEOPLE-2011-ITN—PITN-GA-2011-289033 “DYNANO”(http://www.dynano.eu/)BMBS COSTAction BM1202 ME HAD (http://www.mehad-cost.eu/). The funders had no role in studydesign, data collection and analysis, decision topublish, or preparation of the manuscript.
Competing Interests: The authors have declaredthat no competing interests exist.

IntroductionExtracellular vesicles (EVs) comprise a heterogeneous group of lipid bilayer enclosed vesiclesreleased by most, if not all, cells. The most extensively studied types of EVs have been classifiedas exosomes derived from multivesicular bodies (usually ranging from 50nm to 100nm in size[1–3], and microvesicles (often also referred to as microparticles or ectosomes) which are di-rectly shed from the plasma membrane (mostly with sizes of 100nm to 1μm) [1,2,4]. Cells un-dergoing apoptosis are known to release apoptotic vesicles (up to 5 μm, [1]). The largestapoptotic vesicles are termed apoptotic bodies [2].
EVs have been found to carry and protect from degradation proteins and RNAs likemRNAs or miRNAs [5], and recent reports provide evidence also for the presence of DNA inassociation with EVs [6]. Consequently, different types of EVs have been implicated with rolesin intercellular communication and signaling processes such as inflammation, immune sup-pression, antigen presentation, tumor development, as well as in the transfer of genetic infor-mation, morphogens and signaling molecules [5].
The field of EVs is emerging rapidly, and EV related biomarker and therapeutic applicationsmake this field particularly attractive not only for basic but also for translational scientists.
Currently, many studies use total protein content determination as an integral step to quan-titate and normalize the amount of EVs in preparations prior to performing downstream as-says. However, an important limitation of using total protein content is that soluble proteinsand protein complexes are prevalent in body fluids and culture media. Furthermore, proteinaggregates can be co-purified with different EVs [7]. Additionally, membranes of EVs may rup-ture causing a loss in protein cargo.
Other methods used to quantitate EVs including tunable resistive pulse sensing (TRPS) andnanoparticle tracking analysis (NTA), do not provide evidence for the vesicular nature of thestudied particles [8] and they require special instrumentation which may not be available inall laboratories.
In this article we propose for the first time the use of total lipid content, and protein to lipidratio as additional parameters to total protein content and particle counts for quantifying andcharacterizing EV preparations. We also propose that protein to lipid ratio, lipid bilayer order(which reflects the degree of lipid packing), and selected lipid composition can also discrimi-nate among differently sized EV subpopulations.
Materials and Methods
Cell linesJurkat (TIB-152) human T cell lymphoma and THP-1 (TIB202) human acute monocytic lym-phoma cell lines were obtained from ATCC (Manassas, VA). The BV-2 murine microglia cellline was a generous gift of Prof. Rosario Donato (Università degli Studi di Perugia, Perugia,Italy) [9]. MH-S murine alveolar macrophage cell line originally obtained from ATCC waskindly provided by Dr. Dolores Solis (Madrid, Spain). The cell lines were cultured in RPMI me-dium containing 10% (v/v) fetal bovine serum (FBS), 2 mM glutamine, and 1% AntibioticAntimycotic Solution (Ab/AM) (all from Sigma-Aldrich, St Louis, MO), at 37°C in 5% CO2/air. The cell lines were regularly tested for Mycoplasma contamination by fluorescence micros-copy using DAPI staining (Molecular Probes Life Technologies, Carlsbad, CA).
EV isolation from cell culture supernatantsCells used for the production of EVs were grown at concentrations 0.3–1 x 10⁶/mL dependingon the optimal density recommended for each cell line by ATCC. Prior to isolation, cells were
Protein to Lipid Ratio and Lipid Properties of EVs
PLOS ONE | DOI:10.1371/journal.pone.0121184 March 23, 2015 2 / 16
washed three times with PBS, and EV production was allowed to take place for 24 hours inserum-free RPMI medium to avoid contamination of the preparations with EVs present infetal bovine serum. Cell viability under serum free conditions for 24 hours was found tobe>90–95% as confirmed by using annexin V-FITC and propidium iodide (both from BDBiosciences, San Jose, CA) staining as described before [10]. Three different EV subpopulationswere isolated including apoptotic bodies (APO), microvesicles (MV), and exosomes (EXO) bythe combination of gravity driven filtration and differential centrifugation. Briefly, cells wereremoved by centrifugation at 300g for 10 min, and then the supernatant was filtered by gravitythrough a 5μm filter (Millipore, Billerica, MA) and submitted to a 2,000g centrifugation for 10min at room temperature to pellet APOs. The supernatant was next filtered by gravity througha 0.8μm filter (Millipore) and centrifuged at 12,600g for 30 min at room temperature to pelletMVs. Finally, the supernatant was ultracentrifuged in an Optima MAX-XP bench top ultracen-trifuge with MLA-55 rotor (Beckman Coulter Inc., Brea, CA) at 100,000g for 70 min at 4°C topellet EXOs. Each EV pellet was resuspended once in PBS, and recentrifuged under the sameconditions that were originally used for pelleting. In the case of red blood cell derives EVs, fiveconsecutive washes were performed.
EV isolation from human blood plasma, activated platelets, and redblood cell concentratesTo obtain EVs from human blood plasma, we collected 30–40mL of blood from two healthyadult donors in acid-citrate dextrose tubes (ACD-A tube, Greiner Bio-One, Kremsmünster,Austria). The use of human blood samples was approved by the Scientific Ethics Committee ofthe Hungarian Health Scientific Council (ETT TUKEB), and human blood donors providedwritten informed consent. The samples were processed as described earlier [11] following theInternational Society on Thrombosis and Hemostasis protocol for preparation of platelet-freeplasma [12,13]. Briefly, the ACD blood was centrifuged twice at 2,500g for 15 min at roomtemperature using a HermLe Z206A bench top centrifuge (HermLe Labortechnik GmbH,Wehingen, Germany). The supernatant was next filtered by gravity through a 0.8μm filter(Millipore) and centrifuged at 12,600g for 30 min at room temperature to pellet MVs. Finally,the supernatant was ultracentrifuged in an Optima MAX-XP bench top ultracentrifuge withMLA-55 rotor (Beckman Coulter Inc) at 100,000g for 70 min at 4°C.
For isolation of platelets, acid-citrate dextrose (ACD) plasma samples were pelleted at 400gfor 15 min at room temperature to remove most of the blood cells, and then the platelet con-taining supernatant was diluted 4-fold in TRIS-citrate buffer. Next, the platelet-rich plasmawas again centrifuged at 600g for 20 minutes at room temperature, and the pellet was resus-pended in 3mL PBS. Platelets were then incubated at 37°C for an hour in the presence of10 μM adenosine diphosphate (ADP) (Sigma-Aldrich). Next, 4mL of PBS was added to reducethe viscosity of the samples, and centrifuged at 800g for 20 min at room temperature. The su-pernatant was filtered by gravity through a 0.8μm filter (Millipore). After filtration, the sampleswere centrifuged at 20,000g for 60 minutes at room temperature to obtain the MV pellet, andthen at 100,000g for 70 min at 4°C.
Red blood cell concentrates (expired by 1–7 days) were submitted for MV isolation accord-ing to the protocol described earlier [14]. Briefly, red blood cell concentrates were diluted twofold in PBS, pelleted at 1550g twice for 20 min at 20°C, and the supernatant was then centri-fuged at 18,900g for 30 min in order to obtain the MV pellet.
Protein to Lipid Ratio and Lipid Properties of EVs
PLOS ONE | DOI:10.1371/journal.pone.0121184 March 23, 2015 3 / 16
Tunable resistive pulse sensing (TRPS) measurementsEV preparations were submitted to TRPS analysis using a qNano instrument (IZON Science,New Zealand) as described previously [15]. First, serial dilutions were prepared from each EVpreparation. Subsequently, particle numbers were counted for 5 min using 5 mbar pressureand NP200, NP400 and NP2000 nanopore membranes stretched between 45 and 47 mm. Volt-age was set in between 0.1 and 0.25 V in order to achieve a stable 115nA current. Particle sizehistograms were recorded when root mean square noise was below 12 pA, particle rate in timewas linear, and at least 500 events were counted. Calibration was performed using known con-centration of beads CPC100B (mode diameter: 110nm), CPC200B (mode diameter: 203 nm)or CPC400E (mode diameter: 340nm) and CPC2000C (mode diameter: 1900nm) (all fromIZON) diluted 1:1,000 in 0.2μm filtered PBS.
Transmission electron microscopyIn order to characterize the morphology and size of the different EV preparations, pellets werefixed with 4% paraformaldehyde in 0.01M PBS for 60 min at room temperature. Followingwashing with PBS, the preparations were postfixed in 1% OsO4 (Taab, Aldermaston, Berks,UK) for 30 min. After rinsing the intact fixed pellets within the centrifugation tubes with dis-tilled water, the pellets were dehydrated in graded ethanol, including block staining with 1%uranyl-acetate in 50% ethanol for 30 min, and were embedded in Taab 812 (Taab). Overnightpolymerization of samples at 60°C was followed by sectioning, and the ultrathin sections wereanalyzed using a Hitachi 7100 electron microscope (Hitachi Ltd., Japan) equipped with aMegaview II (lower resolution, Soft Imaging System, Germany) digital camera.
Flow cytometry of cells and extracellular vesiclesCholera toxin (CTX) subunit B-Alexa Fluor647 was purchased from Life Technologies. Theanti-cholesterol antibody (AC8) was produced at Eötvös Loránd University (Budapest, Hun-gary) [16] and conjugated to CF488A fluorophore according to the Mix-n-Stain protocol (Bio-tium, Sigma-Aldrich). Annexin V-FITC (in annexin binding buffer from BD Biosciences),anti-CD9 FITC and anti-CD63 PE-conjugated antibodies (all from BD Biosciences) wereadded to cells and EV preparations, and were incubated for 30 min at room temperature in thedark. Isotype controls (all from BD Biosciences) were used for samples stained with fluoro-chrome-conjugated antibodies, whereas autofluorescence was detected in the absence of eitherannexin V or CTX. To verify the vesicular nature of MVs and APOs, and to exclude the pres-ence of antibody aggregates, we added Triton X-100 to 0.05% final concentration to the sam-ples, as we described previously [7]. This step resulted in prompt disappearance of fluorescentevent counts from the MV and APO gates suggesting the presence of membranous structureswithin these gates. Exosomes were resuspended in a total volume 50μL of PBS, and aliquots of5μL were incubated with 5μL of 4μm aldehyde/sulfate latex beads (Life Technologies), followedby an incubation of 5 min at room temperature. Then 20μL of PBS was added, and incubationwas continued for another 15 min at room temperature. Thirty μL of 2% bovine serum albumin(BSA) in PBS was added and samples were blocked for 2 hours at room temperature. Then theEppendorf tubes were filled with PBS, and were centrifuged at 2,700g for 3 min at room tem-perature. The supernatant was discarded, and the pellet was resuspended in 200μL of 100mMglycine in PBS, and was incubated for 30 min at room temperature. The Eppendorf tubes werefilled again with PBS, and centrifuged at 2,700g for 3 min at room temperature. Then the su-pernatant was discarded, and the pellet was resuspended in 100μL of PBS for staining as de-scribed above. EV preparations were analyzed by using FACSAria III and FACSCalibur flowcytometers (both from BD Biosciences). In case of APOs and MVs, instrument settings and
Protein to Lipid Ratio and Lipid Properties of EVs
PLOS ONE | DOI:10.1371/journal.pone.0121184 March 23, 2015 4 / 16
gates were set as described earlier [12,13] using Megamix beads (BioCytex, Marseille, France)optimized with 1 μm Silica Beads Fluo-Green (Kisker, Steinfurt, Germany). Ten thousandevents from equal sample volumes were counted at medium flow rate. Data were analyzed byFlowJo software (Treestar, Ashland, OR). In some experiments EVs were also stained with di-4-ANEPPDHQ (Life Technologies) at 5μM final concentration for 30 min at 37°C.
Total protein determination of EV preparationsTotal protein content of EV preparations was determined using the Micro BCA Protein AssayReagent Kit (Thermo Scientific, Rockford, IL) following the manufacturer’s specifications andusing BSA (Thermo Scientific) as a standard.
Total lipid determination of EV preparationsTo measure total lipid content of EVs, the colorimetric reaction of sulfuric acid and phospho-vanilin with lipids [17] was used in a 96 well plate format sulfophosphovanilin (SPV) assay.Lipid standard solutions (2μg/μL) were prepared from menhaden fish oil and cholesterol (bothfrom Sigma-Aldrich) in chloroform. Different volumes of the lipid standard solutions in chlo-roform were pipetted into Eppendorf tubes to result in 0 to 140μg of lipid per tube, and chloro-form was added to each tube up to a final volume of 70μL. Chloroform (70 μL) was alsopipetted onto either dry EV pellets or empty Eppendorf tubes to be used later for EV contain-ing suspensions in PBS. The chloroform was then evaporated by incubating the tubes at 90°Cfor 10 min in a heater block (Techne DB-2D, Bibby Scientific Ltd, Staffordshire, UK). All stepsinvolving chloroform handling were performed under a fume hood with lids open for all tubes.In the case when EV suspensions, as opposed to EV dry pellets were assessed, 50μL of EV sus-pension (with at least 10–30 μg/mL of protein depending on the EV type) was added to theempty chloroform-pretreated Eppendorf tubes and 50μL of PBS was also added to each tubecontaining the lipid standards. The pre-treatment with equal volumes of chloroform, and PBSin the case of EV suspensions, ensured the same background color development in all Eppen-dorf tubes. As a following step, 250μL of 96% sulfuric acid was added to the tubes followed byincubation with open lids at 90°C for 20 min in a heater block. Next, 220 μL of samples andstandards in sulfuric acid were transferred into a 96-well polystyrene plate (Nunc, Sigma-Al-drich), and allowed to cool down to room temperature. Finally, 110μL of 0.2mg/mL vanillin in17% phosphoric acid (both from Sigma-Aldrich) was added to each well, and the plate was in-cubated for 10 min at room temperature. Absorbance was measured at 540nm by an MS Read-er (Multiskan MS; Labsystems, Helsinki, Finland). S1 Fig. shows a simplified schematicsummary of the total lipid determination protocol.
Assessment of interference of different compounds with lipid and proteinassaysIn order to assess possible interference of different substances with the total lipid and proteinassays, 0μg to 20μg of tryptophan, leucine, serine, bovine serum albumin, menhaden fish oil,low molecular weight heparin, glucose (all from Sigma-Aldrich), as well as human U937 cell-derived total DNA and RNA were subjected to lipid and protein determination as describedabove (S2 Fig.).
Some interference by glucose was detected on the SPV assay. In the Micro BCA proteinassay, both tryptophan and glucose resulted in strong colorimetric reactions. Data of n = 3 in-dependent experiments are shown. The scale of the Y axis the amino acid interference onMicro BCA is different of the rest.
Protein to Lipid Ratio and Lipid Properties of EVs
PLOS ONE | DOI:10.1371/journal.pone.0121184 March 23, 2015 5 / 16

Assessment of assay variability of lipid and protein assaysEqual concentrations of menhaden fish oil and BSA (both from Sigma-Aldrich) were subjectedto total lipid and protein assays in 6 parallel technical repeats of 0, 10, 20, 30, 40, 50, 100, and200 μg/mL concentrations in three independent experiments. Intra-assay variation was calcu-lated as % coefficient variation (% CV) using the following formula: standard deviation (SD) ofmeasured values/measured values x 100. Results are shown in S3A Fig. Percentage error wasdetermined as follows: (|measured value—nominal value|/nominal value) x 100, and the resultsare shown in S3B Fig.
Inter-assay variation was determined as follows: average of 10μg/mL (lowest) and 200μg/mL(highest) % CVs, and were found to be 11.4 and 3.1 for the lipid and protein assays, respectively.
Exposure of EVs to membrane damaging conditionsIn order to compare intact EV preparations to those with damaged membranes, fresh EV prep-arations were either directly subjected to total lipid and protein determinations or were incu-bated overnight at 37°C before repelleting for total lipid and protein determination. Inpreliminary experiments incubation of MVs at 37°C overnight was found to cause vesiculardamage (unpublished data).
EV Staining with Di-4-ANEPPDHQIn order to investigate the membrane lipid bilayer order of EV preparations, EVs were stainedwith the membrane probe Di-4-ANEPPDHQ (Life Technologies) at 5μM final concentrationfor 30 min at 37°C as described previously [18]. EV subpopulations, immobilized on poly-L-ly-sine (Sigma-Aldrich) coated cover slips, were analyzed by confocal microscopy (IX81 invertmicroscope based Fluoview500 laser scanning confocal system and software; Olympus Europe,Hamburg, Germany) at 60x magnification. Suspensions of APOs, MVs as well as 4-μm latexbead-bound EXOs were also assessed by flow cytometry. The Di-4-ANEPPDHQ probe exhibitsa 60nm spectral shift between the liquid-ordered and liquid-disordered phases. Ratiometricmeasurement of the fluorescence intensity by confocal microscopy was performed in the 560–600nm and the>660nm emission channels, defined by appropriate band pass and cut off fil-ters, respectively. Background-corrected fluorescence intensities of EV samples in each channelwere calculated by ImageJ software (http://imagej.nih.gov/ij/). General polarization (GP) val-ues were determined as follows: GP = (I560–600—I>660)/(I560–600+I>660). In flow cytometry, PE(585±21 nm) and PE-Texas Red (616±12 nm) filters were used to define the correspondingtwo emission channels and GP values were calculated in similar way.
Statistical analysisFor data analysis we used GraphPad Prism v.4. For comparison of different parameters of EVsubpopulations, we used Wilcoxon matched-pairs signed rank test. For membrane lipid orderdata obtained by confocal microscopy, 1-way ANOVA was used followed by Dunnetts post-hoc test. P values of less than 0.05 were considered statistically significant (� P<0.05, �� P<0.01and ��� P<0.001).
Results
Isolation and characterization of different EV subpopulationsEV subpopulations (APOs, MVs, and EXOs) were isolated from the supernatants of the celllines THP-1, BV-2, MH-S, and Jurkat as described previously [10,19]. The vesicles from BV-2
Protein to Lipid Ratio and Lipid Properties of EVs
PLOS ONE | DOI:10.1371/journal.pone.0121184 March 23, 2015 6 / 16
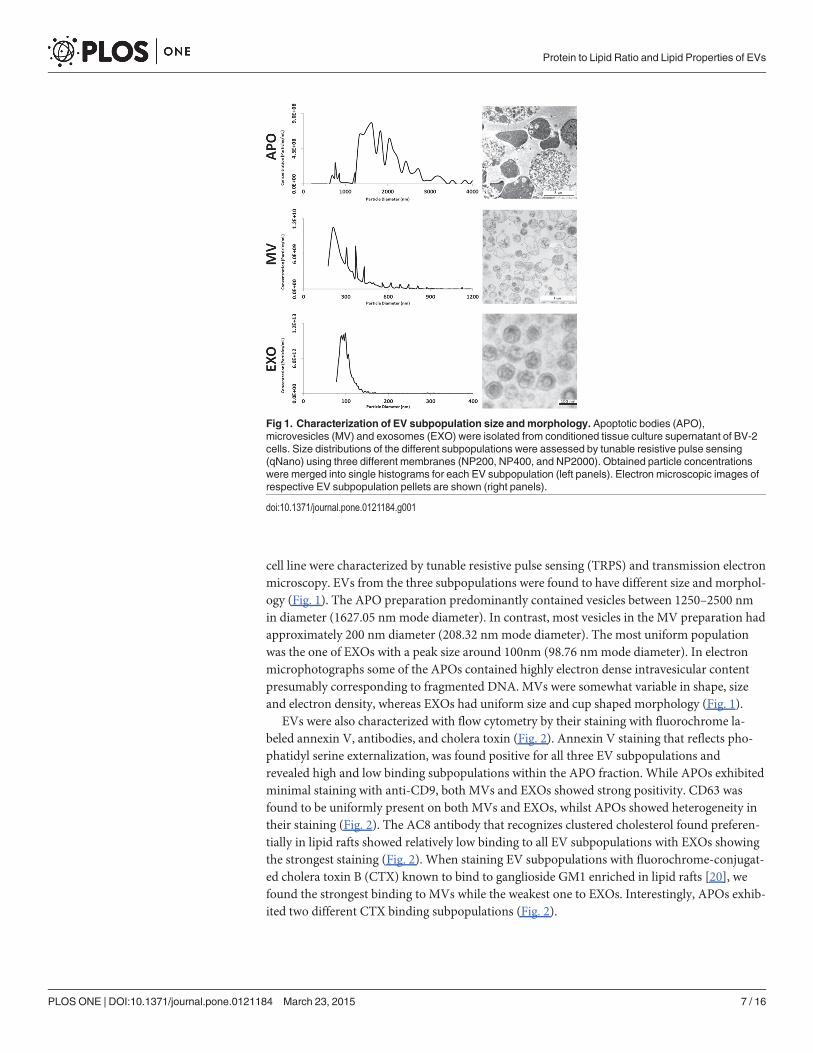
cell line were characterized by tunable resistive pulse sensing (TRPS) and transmission electronmicroscopy. EVs from the three subpopulations were found to have different size and morphol-ogy (Fig. 1). The APO preparation predominantly contained vesicles between 1250–2500 nmin diameter (1627.05 nm mode diameter). In contrast, most vesicles in the MV preparation hadapproximately 200 nm diameter (208.32 nmmode diameter). The most uniform populationwas the one of EXOs with a peak size around 100nm (98.76 nmmode diameter). In electronmicrophotographs some of the APOs contained highly electron dense intravesicular contentpresumably corresponding to fragmented DNA. MVs were somewhat variable in shape, sizeand electron density, whereas EXOs had uniform size and cup shaped morphology (Fig. 1).
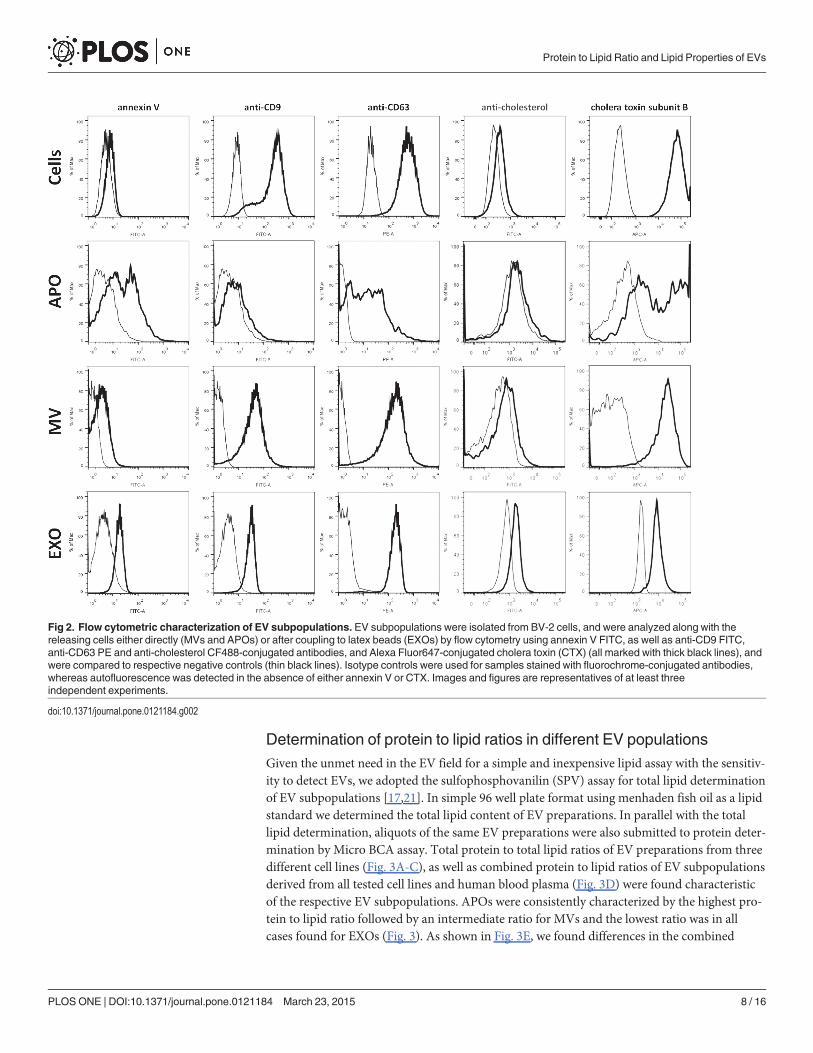
EVs were also characterized with flow cytometry by their staining with fluorochrome la-beled annexin V, antibodies, and cholera toxin (Fig. 2). Annexin V staining that reflects pho-phatidyl serine externalization, was found positive for all three EV subpopulations andrevealed high and low binding subpopulations within the APO fraction. While APOs exhibitedminimal staining with anti-CD9, both MVs and EXOs showed strong positivity. CD63 wasfound to be uniformly present on both MVs and EXOs, whilst APOs showed heterogeneity intheir staining (Fig. 2). The AC8 antibody that recognizes clustered cholesterol found preferen-tially in lipid rafts showed relatively low binding to all EV subpopulations with EXOs showingthe strongest staining (Fig. 2). When staining EV subpopulations with fluorochrome-conjugat-ed cholera toxin B (CTX) known to bind to ganglioside GM1 enriched in lipid rafts [20], wefound the strongest binding to MVs while the weakest one to EXOs. Interestingly, APOs exhib-ited two different CTX binding subpopulations (Fig. 2).
Fig 1. Characterization of EV subpopulation size andmorphology. Apoptotic bodies (APO),microvesicles (MV) and exosomes (EXO) were isolated from conditioned tissue culture supernatant of BV-2cells. Size distributions of the different subpopulations were assessed by tunable resistive pulse sensing(qNano) using three different membranes (NP200, NP400, and NP2000). Obtained particle concentrationswere merged into single histograms for each EV subpopulation (left panels). Electron microscopic images ofrespective EV subpopulation pellets are shown (right panels).
doi:10.1371/journal.pone.0121184.g001
Protein to Lipid Ratio and Lipid Properties of EVs
PLOS ONE | DOI:10.1371/journal.pone.0121184 March 23, 2015 7 / 16
Determination of protein to lipid ratios in different EV populationsGiven the unmet need in the EV field for a simple and inexpensive lipid assay with the sensitiv-ity to detect EVs, we adopted the sulfophosphovanilin (SPV) assay for total lipid determinationof EV subpopulations [17,21]. In simple 96 well plate format using menhaden fish oil as a lipidstandard we determined the total lipid content of EV preparations. In parallel with the totallipid determination, aliquots of the same EV preparations were also submitted to protein deter-mination by Micro BCA assay. Total protein to total lipid ratios of EV preparations from threedifferent cell lines (Fig. 3A-C), as well as combined protein to lipid ratios of EV subpopulationsderived from all tested cell lines and human blood plasma (Fig. 3D) were found characteristicof the respective EV subpopulations. APOs were consistently characterized by the highest pro-tein to lipid ratio followed by an intermediate ratio for MVs and the lowest ratio was in allcases found for EXOs (Fig. 3). As shown in Fig. 3E, we found differences in the combined
Fig 2. Flow cytometric characterization of EV subpopulations. EV subpopulations were isolated from BV-2 cells, and were analyzed along with thereleasing cells either directly (MVs and APOs) or after coupling to latex beads (EXOs) by flow cytometry using annexin V FITC, as well as anti-CD9 FITC,anti-CD63 PE and anti-cholesterol CF488-conjugated antibodies, and Alexa Fluor647-conjugated cholera toxin (CTX) (all marked with thick black lines), andwere compared to respective negative controls (thin black lines). Isotype controls were used for samples stained with fluorochrome-conjugated antibodies,whereas autofluorescence was detected in the absence of either annexin V or CTX. Images and figures are representatives of at least threeindependent experiments.
doi:10.1371/journal.pone.0121184.g002
Protein to Lipid Ratio and Lipid Properties of EVs
PLOS ONE | DOI:10.1371/journal.pone.0121184 March 23, 2015 8 / 16

protein concentrations of EV subpopulations of different cellular origin with MVs showing thelowest protein concentration. Interestingly, in the case of combined lipid concentrations, astriking elevation in EXOs was observed as compared to MV or APOs.
� P<0.05 and ��� P<0.001In addition, we tested different substances present in biological samples for their assay inter-
ference with the total lipid and protein determinations. We found some interference by glucoseon the SPV assay (S2 Fig.), and in the Micro BCA protein assay, both tryptophan and glucoseresulted in strong colorimetric reactions (S2 Fig.).
Protein to lipid ratios in exosome-free, damaged, or contaminated EVpreparationsTo show the applicability of protein to lipid ratio as a quality control parameter of EV prepara-tions, we tested EVs from different conditions.
Firstly, platelets were incubated with adenosine diphosphate (ADP) for one hour in PBS,and the supernatant was subsequently submitted for EV isolation. The low speed (20,000g)MV pellet was characterized by the expected protein to lipid ratio (Fig. 4A) and the presence ofMVs was confirmed by using transmission electron microscopy (Fig. 4B). However, the proteinto lipid ratio of the high speed “EXO” (100,000g) pellet was found to be abnormally elevated(Fig. 4A). In accordance with this value, electron microscopy showed the lack of any vesicularstructures in the 100,000g pellet (Fig. 4C), suggesting that under these conditions the pellet was
Fig 3. Protein to lipid ratios of EV subpopulations. Protein to lipid ratios are presented for APOs, MVs, and EXOs isolated fromMH-S (A), THP-1 (B), andBV-2 (C) cell lines (data represent� 3 independent experiments for each EV type from all cell lines). Combined protein to lipid ratios obtained using EVsderived fromMH-S, THP-1, BV-2, Jurkat, U937 as well as from human blood plasma are shown (D) (results of� 12 independent experiments each EV type).Combined protein (E) and lipid concentrations (F) for the above cell line derived and blood plasma derived EVs are also shown. Mean values are representedby horizontal lines, and standard error means (SEMs) are indicated by error bars. The mean values ± SEM of lipid and protein concentrations (μg/mL) ofconditioned media are reported below each respective EV subpopulation.
doi:10.1371/journal.pone.0121184.g003
Protein to Lipid Ratio and Lipid Properties of EVs
PLOS ONE | DOI:10.1371/journal.pone.0121184 March 23, 2015 9 / 16
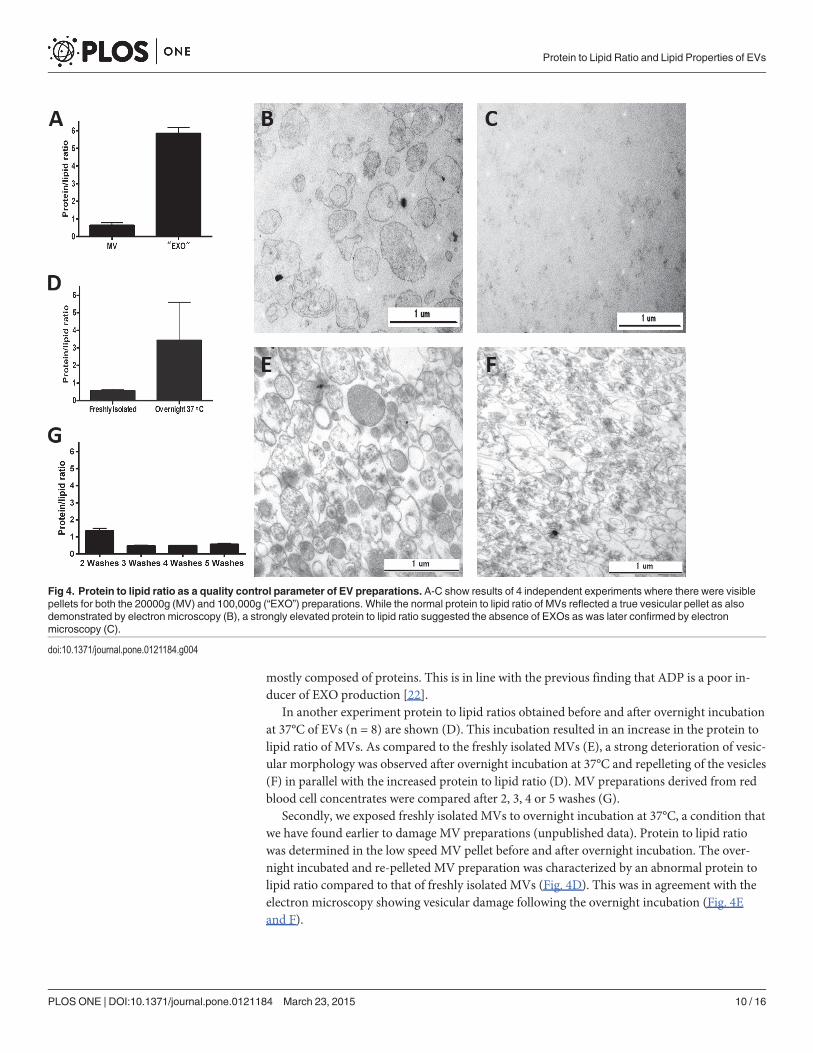
mostly composed of proteins. This is in line with the previous finding that ADP is a poor in-ducer of EXO production [22].
In another experiment protein to lipid ratios obtained before and after overnight incubationat 37°C of EVs (n = 8) are shown (D). This incubation resulted in an increase in the protein tolipid ratio of MVs. As compared to the freshly isolated MVs (E), a strong deterioration of vesic-ular morphology was observed after overnight incubation at 37°C and repelleting of the vesicles(F) in parallel with the increased protein to lipid ratio (D). MV preparations derived from redblood cell concentrates were compared after 2, 3, 4 or 5 washes (G).
Secondly, we exposed freshly isolated MVs to overnight incubation at 37°C, a condition thatwe have found earlier to damage MV preparations (unpublished data). Protein to lipid ratiowas determined in the low speed MV pellet before and after overnight incubation. The over-night incubated and re-pelleted MV preparation was characterized by an abnormal protein tolipid ratio compared to that of freshly isolated MVs (Fig. 4D). This was in agreement with theelectron microscopy showing vesicular damage following the overnight incubation (Fig. 4Eand F).
Fig 4. Protein to lipid ratio as a quality control parameter of EV preparations. A-C show results of 4 independent experiments where there were visiblepellets for both the 20000g (MV) and 100,000g (“EXO”) preparations. While the normal protein to lipid ratio of MVs reflected a true vesicular pellet as alsodemonstrated by electron microscopy (B), a strongly elevated protein to lipid ratio suggested the absence of EXOs as was later confirmed by electronmicroscopy (C).
doi:10.1371/journal.pone.0121184.g004
Protein to Lipid Ratio and Lipid Properties of EVs
PLOS ONE | DOI:10.1371/journal.pone.0121184 March 23, 2015 10 / 16
Finally MV preparations derived from red blood cell concentrates were compared after 2, 3,4 or 5 consecutive washes by repeatedly centrifuging the samples at 18,900g for 30 min. Asshown in Fig. 4G, the 3rd washing step resulted in a shift from elevated protein to lipid ratio tothe ratio expected for MVs suggesting the removal of contaminating proteins, and this ratio re-mained stable upon further washes.
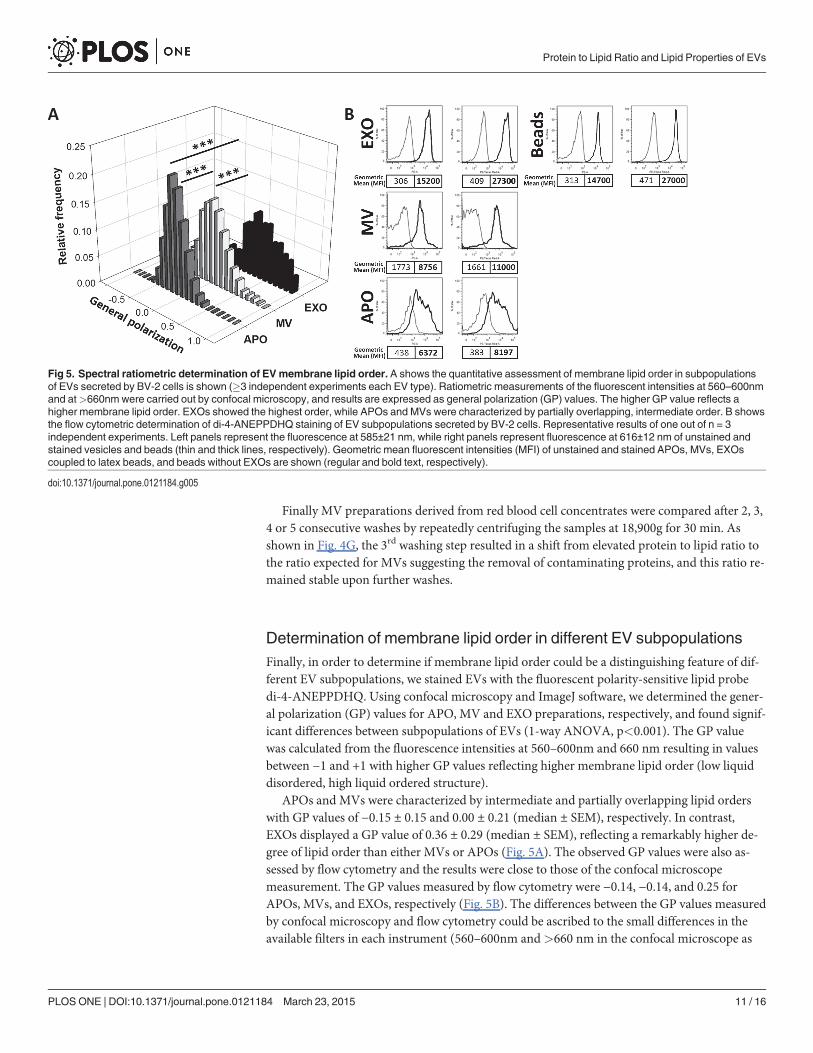
Determination of membrane lipid order in different EV subpopulationsFinally, in order to determine if membrane lipid order could be a distinguishing feature of dif-ferent EV subpopulations, we stained EVs with the fluorescent polarity-sensitive lipid probedi-4-ANEPPDHQ. Using confocal microscopy and ImageJ software, we determined the gener-al polarization (GP) values for APO, MV and EXO preparations, respectively, and found signif-icant differences between subpopulations of EVs (1-way ANOVA, p<0.001). The GP valuewas calculated from the fluorescence intensities at 560–600nm and 660 nm resulting in valuesbetween −1 and +1 with higher GP values reflecting higher membrane lipid order (low liquiddisordered, high liquid ordered structure).
APOs and MVs were characterized by intermediate and partially overlapping lipid orderswith GP values of −0.15 ± 0.15 and 0.00 ± 0.21 (median ± SEM), respectively. In contrast,EXOs displayed a GP value of 0.36 ± 0.29 (median ± SEM), reflecting a remarkably higher de-gree of lipid order than either MVs or APOs (Fig. 5A). The observed GP values were also as-sessed by flow cytometry and the results were close to those of the confocal microscopemeasurement. The GP values measured by flow cytometry were −0.14, −0.14, and 0.25 forAPOs, MVs, and EXOs, respectively (Fig. 5B). The differences between the GP values measuredby confocal microscopy and flow cytometry could be ascribed to the small differences in theavailable filters in each instrument (560–600nm and>660 nm in the confocal microscope as
Fig 5. Spectral ratiometric determination of EVmembrane lipid order. A shows the quantitative assessment of membrane lipid order in subpopulationsof EVs secreted by BV-2 cells is shown (�3 independent experiments each EV type). Ratiometric measurements of the fluorescent intensities at 560–600nmand at>660nm were carried out by confocal microscopy, and results are expressed as general polarization (GP) values. The higher GP value reflects ahigher membrane lipid order. EXOs showed the highest order, while APOs and MVs were characterized by partially overlapping, intermediate order. B showsthe flow cytometric determination of di-4-ANEPPDHQ staining of EV subpopulations secreted by BV-2 cells. Representative results of one out of n = 3independent experiments. Left panels represent the fluorescence at 585±21 nm, while right panels represent fluorescence at 616±12 nm of unstained andstained vesicles and beads (thin and thick lines, respectively). Geometric mean fluorescent intensities (MFI) of unstained and stained APOs, MVs, EXOscoupled to latex beads, and beads without EXOs are shown (regular and bold text, respectively).
doi:10.1371/journal.pone.0121184.g005
Protein to Lipid Ratio and Lipid Properties of EVs
PLOS ONE | DOI:10.1371/journal.pone.0121184 March 23, 2015 11 / 16
opposed to 585±21 nm and 616±12 in the flow cytometer). However, the pattern of higherorder in EXOs was observed by both instruments.
DiscussionIn the past 15 years EV research emerged as a novel field of cell biology. Understanding of theroles of EVs has profoundly impacted our understanding of intercellular communication,tumor and stem cell biology, inflammation, virology, circulating extracellular RNA and DNAresearch among other fields [1,4,5,23].
In the meantime, different methods have been adopted to quantify EVs. However, currentlyused assays either do not discriminate between vesicular or non-vesicular particles (such asNTA and TRPS), or solely quantify EVs in a given preparation based on the total protein con-tent. Since protein aggregates have been shown to be co-purified with EVs [7], and in somesamples soluble proteins and protein aggregates are more abundant than lipid bilayer enclosedEVs, such approaches are error-prone. We hypothesized that as an alternative to protein-basedEV quantification, simultaneous determination of both the protein and lipid content may leadto a better quantification of the EVs in a sample. In spite of the large body of published data onEVs, virtually none of the studies have used an assay to determine total lipids in EV prepara-tions besides determining the protein content. Thus, there has been an unmet need in the fieldfor a simple lipid assay to detect EVs. Furthermore, there have been no universally acceptedmolecular markers to distinguish among the subpopulations of EVs.
This study was undertaken to establish a simple lipid assay for EVs and to find good qualitycontrol parameters to characterize EV preparations that might be utilized both in basic re-search and in clinical laboratory settings.
For the first time we used and optimized the SPV total lipid assay for EV studies and com-bined this lipid assay with the conventional Micro BCA protein determination that is usedwidely in the EV field. This total lipid assay is simple and fast requiring only 30 min of incuba-tion, and 0.5μg protein containing EVs either in dry pellet or in up to 50μL volume. Further-more, we showed if used under the optimized conditions described in this paper, the SPV assaysensitivity is adequate for EV studies and compares favorably to Micro BCA in terms of accura-cy, although shows slightly higher intra and inter-assay variabilities. However, at concentra-tions>50 μg/mL lipid for SPV or protein for Micro BCA, both assays show low variability andgood accuracy (S3 Fig.). Using these two assays, we introduced protein to lipid ratio as a novelparameter to characterize EV preparations (EXOs, MVs, and APOs). As expected, we found in-creasing protein to lipid ratios for EV subpopulations of increasing diameter. Our data are inline with results of an earlier study that determined protein and lipid composition of plateletmicroparticle size fractions using mass spectrometry and a detection of lipid phosphorous withthe method of Bartlett [24]. We found that the protein to lipid values depended on the lipidstandard used in the assay. Although the reference lipids (such as menhaden fish oil) that weused in this study may not exactly reflect the complex composition of EV lipid membranes,they are produced under standardized conditions, they are inexpensive and they are commer-cially available for the broad scientific community. More sophisticated lipid standards may befurther developed as the lipid composition of EVs will be better understood. Regardless of themethod used, if adhering to the same lipid standard consistently throughout the experiments,protein to lipid ratio determination may prove very useful for quality control of EV prepara-tions. In addition to the SPV method introduced in this study, more sophisticated methodssuch as infrared spectroscopy could be alternatively used for the determination of protein andlipid content of EVs. However, the requirement for special equipment may prevent the use ofinfrared spectroscopy in many laboratories. Furthermore, cholesterol as well as other sterols do
Protein to Lipid Ratio and Lipid Properties of EVs
PLOS ONE | DOI:10.1371/journal.pone.0121184 March 23, 2015 12 / 16
not have many useful infrared features by which to distinguish them from other molecules.The vibrational bands due to C–C or C-H bonds, which are commonly used to measure sterolswith infrared spectroscopy, are not only very weak but are also shared by most biological mole-cules including proteins [25]. Its reduced cholesterol sensitivity may thus, limit the wide use ofinfrared spectroscopy for EV studies.
Besides EVs, we also determined the protein to lipid ratio of cells releasing EVs. We foundthat, as compared to the different EV subpopulations, cells showed substantially higher varia-tion of protein to lipid ratios probably reflecting differences in cell types and in cell cycle phases(data not shown). Lipid sorting mechanisms (such as preferential sorting of cholesterol intoEXOs) during the generation of different EV subpopulations have been reported [26, 27]. Suchsorting process may result in the enrichment of given lipids in different EV subpopulationswhich may contribute to the relatively low variation of protein to lipid ratios of the same EVsubpopulation compared to the producing cells.
Next, in an attempt to find novel parameters to characterize EV subpopulations, using flowcytometry we stained our EVs with an anti-cholesterol antibody, and found strongest stainingfor EXOs. Furthermore, we found staining of all EV subpopulations with CTX reflecting thepresence of GM1 gangliosides in all EV subpopulations. GM1 gangliosides have been previous-ly detected in EXOs [28, 29]. Here we found that GM1 was not only present in EXOs but alsoespecially enriched in MVs and differentiated two subpopulations of APOs. Intriguingly, het-erogeneity within APOs was not only suggested by bimodal CTX binding, but also by theannexin V and anti-CD63 staining. Transmission electron microscopy also revealed the pres-ence of highly electron dense, possibly fragmented DNA containing APOs and less electrondense and more granular APOs possibly corresponding to the recently described different sub-populations of APOs [30].
Our flow cytometry data are in accordance with earlier findings that EXOs are particularlyenriched in cholesterol and GM1 gangliosides [26,31].
The spectral ratiometric approach of this study provides evidence that EV subpopulationscan be distinguished based on the difference in their membrane lipid order. This parameter re-flects the degree of lipid packing and is one of the most important biophysical parameters ofmembranes [18]. In low ordered membrane domains the probability of protein-protein inter-actions is decreased. Therefore membrane lipid order can impact signaling pathways. This isstrongly supported by the findings that high membrane lipid order is typically found at the im-munological synapse, sites of cell adhesion, viral entry and budding as well as in exosomes (thelatter described for the first time in this work). Our data suggest that EXOs are characterizedby highest membrane lipid order, while APOs and MVs showed low to intermediate, partiallyoverlapping lipid order reflecting important differences in membrane lipid composition. Ahigh degree of membrane lipid order and the relatively high content of cholesterol in EXOsmay be important factors explaining their distinguished role in intercellular signaling.
There is an ongoing debate in the EV field about the classification of different subpopula-tions of EVs. Without universally accepted molecular markers reflecting different biogenic ori-gin of EV subpopulations, many studies simply classify EVs based on their size. Such a size-based classification could be challenged by observations that exosome-sized EVs can also beshed from the plasma membrane [32]. In an attempt to assess whether this kind of observationsrepresent exceptions to the rule or if size-based classification is arbitrary, we looked beyondsize, and compared lipid properties and protein to lipid ratios in EVs fractionated by size. Wefound differential binding of an anti-cholesterol antibody and CTX to different sized popula-tions. Additionally, our data suggest the decreasing protein to lipid ratio of decreasing sized EVsubpopulations is not solely dependent on a diminished surface area to volume ratio. S1 Tableshows that instead we found a smaller increase in the protein to lipid ratios than what was
Protein to Lipid Ratio and Lipid Properties of EVs
PLOS ONE | DOI:10.1371/journal.pone.0121184 March 23, 2015 13 / 16
expected based on geometry (surface area to volume ratio). This may either represent differentcargo packing densities or different molecular composition of the different EV subtypes.
Our observations suggest that simple size-based classification enables distinguishing EVswith different membrane lipid properties. Until selective molecular markers become available,established protein to lipid ratios may serve as suitable parameters to characterize different EVsubpopulations. In addition, protein to lipid ratio may also prove useful for routine qualitycontrol of EV preparations.
Supporting InformationS1 Fig. A simplified schematic summary of the total lipid determination protocol.(TIF)
S2 Fig. Interference with the 96 well plate Micro BCA total protein and SPV total lipid de-termination assays.(TIF)
S3 Fig. Working concentration ranges and coefficients of variations of the Micro BCA andSPV assays. S3A Fig. shows precision profile as defined by Carrol (2003) indicating the work-ing concentration range by percentage coefficient intra-assay variation (%CV) plotted againstconcentration for both SPV total lipid assay and Micro BCA total protein assay. The suggestedworking range (gray box) is defined as the range of concentrations for which the coefficient ofvariation is<20%. S3B Fig. shows the intra-assay percentage error (% Error) for the same as-says reflecting higher accuracy of the SPV measurements. The working range as suggested inS3A Fig. is also indicated by a gray box. The scales of the Y axis are not the same. n = 3, 6 tech-nical parallels for each concentration.(TIF)
S1 Table. Calculated volumes to surface area ratios for the size ranges of different EV sub-populations in comparison with the observed protein to lipid ratios.(TIF)
AcknowledgmentsThe authors thank Dániel Vértessy for his technical help.
Author ContributionsConceived and designed the experiments: XO BG JM EIB. Performed the experiments: XO ABKST AN TGS KP BS ÉP ÁK. Analyzed the data: XO AB BG JM EIB. Contributed reagents/ma-terials/analysis tools: XO AB ÉP JM EIB. Wrote the paper: XO AB BG JM EIB.
References1. Buzas EI, Gyorgy B, Nagy G, Falus A, Gay S. Emerging role of extracellular vesicles in inflammatory
diseases. Nat Rev Rheumatol. 2014; 10: 356–64. doi: 10.1038/nrrheum.2014.19 PMID: 24535546
2. György B, Szabó T, Pásztói M, Pál Z, Misják P, Aradi B, et al. Membrane vesicles, current state-of-the-art: emerging role of extracellular vesicles. Cell Mol Life Sci. 2011; 68: 2667–2688. doi: 10.1007/s00018-011-0689-3 PMID: 21560073
3. Thery C. Exosomes: secreted vesicles and intercellular communications. F1000 Biol Rep. 2011; 3:15.doi: 10.3410/B3-15 PMID: 21876726
4. Thery C, Ostrowski M, Segura E. Membrane vesicles as conveyors of immune responses. Nat RevImmunol. 2009; 9: 581–593. doi: 10.1038/nri2567 PMID: 19498381
Protein to Lipid Ratio and Lipid Properties of EVs
PLOS ONE | DOI:10.1371/journal.pone.0121184 March 23, 2015 14 / 16
5. van der Pol E, Boing AN, Harrison P, Sturk A, Nieuwland R. Classification, Functions, and Clinical Rele-vance of Extracellular Vesicles. Pharmacol Rev. 2012; 64: 676–705. doi: 10.1124/pr.112.005983PMID: 22722893
6. Kahlert C, Melo SA, Protopopov A, Tang J, Seth S, Koch M, et al. Identification of Double Stranded Ge-nomic DNA Spanning all Chromosomes with Mutated KRAS and p53 DNA in the Serum Exosomes ofPatients with Pancreatic Cancer. J Biol Chem. 2014; 289(7): 3869–3875. doi:10.1074/jbc.C113.532267 PMID: 24398677
7. György B, Módos K, Pállinger É, Pálóczi K, Pásztói M, Misják P, et al. Detection and isolation of cell-de-rived microparticles are compromised by protein complexes due to shared biophysical parameters.Blood. 2011; 117: e39–48. doi: 10.1182/blood-2010-09-307595 PMID: 21041717
8. Momen-Heravi F, Balaj L, Alian S, Tigges J, Toxavidis V, Ericsson M, et al. Alternative methods forcharacterization of extracellular vesicles. Front Physiol. 2012; 3: 354. doi: 10.3389/fphys.2012.00354PMID: 22973237
9. Adami C, Sorci G, Blasi E, Agneletti AL, Bistoni F, Donato R. S100B expression in and effects on micro-glia. Glia. 2001; 33: 131–1429. PMID: 11180510
10. Crescitelli R, Lasser C, Szabo TG, Kittel A, Eldh M, Dianzani I, et al. Distinct RNA profiles in subpopula-tions of extracellular vesicles: apoptotic bodies, microvesicles and exosomes. J Extracell Vesicles.2013; 2: 20677, doi: 10.3402/jev.v2i0.20677
11. György B, Paloczi K, Kovacs A, Barabas E, Beko G, Várnai K, et al. Improved circulating microparticleanalysis in acid-citrate dextrose (ACD) anticoagulant tube. Thromb Res. 2014; 133: 285–292. doi: 10.1016/j.thromres.2013.11.010 PMID: 24360116
12. Lacroix R, Judicone C, Poncelet P, Robert S, Arnaud L, Sampol J, et al. Impact of pre-analytical param-eters on the measurement of circulating microparticles: towards standardization of protocol. J ThrombHaemost. 2012; 10: 437–446. doi: 10.1111/j.1538-7836.2011.04610.x PMID: 22212198
13. Lacroix R, Judicone C, Mooberry M, Boucekine M, Key NS, Dignat-George F, et al. Standardization ofpre-analytical variables in plasmamicroparticle determination: results of the International Society onThrombosis and Haemostasis SSC Collaborative workshop. J Thromb Haemost. 2013; 11: 1190–1193.
14. Varga Z, Yuana Y, Grootemaat AE, van der Pol E, Gollwitzer C, Krumrey M et al. Towards traceablesize determination of extracellular vesicles. J Extracell Vesicles. 2014; 3: 23298, doi: http://dx.doi.org/10.3402/jev.v3.23298
15. Szabo GT, Tarr B, Paloczi K, Eder K, Lajko E, Kittel A, et al. Critical role of extracellular vesicles in mod-ulating the cellular effects of cytokines. Cell Mol Life Sci. 2014; 20: 4055–4067. doi: 10.1007/s00018-014-1618-z PMID: 24705984
16. Biro A, Cervenak L, Balogh A, Lorincz A, Uray K, Horvath A, et al. Novel anti-cholesterol monoclonal im-munoglobulin G antibodies as probes and potential modulators of membrane raft-dependent immunefunctions. J Lipid Res. 2007; 48: 19–29. PMID: 17023738
17. Chabrol E, Charonnat R. Une nouvelle reaction pour l’etude des lipides l’oleidemie. L'oleidemie PresseMed. 1937; 45:1713–4.
18. Owen DM, Rentero C, Magenau A, Abu-Siniyeh A, Gaus K. Quantitative imaging of membrane lipidorder in cells and organisms. Nat Protoc. 2012; 7: 24–35, doi: 10.1038/nprot.2011.419 PMID:22157973
19. Turiak L, Misjak P, Szabo TG, Aradi B, Paloczi K, Ozohanics O, et al. Proteomic characterization of thy-mocyte-derived microvesicles and apoptotic bodies in BALB/c mice. J Proteomics. 2011; 74: 2025–2033. doi: 10.1016/j.jprot.2011.05.023 PMID: 21635979
20. Holmgren J, Lonnroth I, Mansson J, Svennerholm L. Interaction of cholera toxin and membrane GM1ganglioside of small intestine. Proc Natl Acad Sci U S A. 1975; 72:25204.
21. McMahon A, Lu H, Butovich IA. The spectrophotometric sulfo-phospho-vanillin assessment of total lip-ids in human meibomian gland secretions. Lipids. 2013; 48: 513–525. doi: 10.1007/s11745-013-3755-9PMID: 23345137
22. Aatonen M, Öhman T, Nyman T, Laitinen S, GrönholmM, Siljander P. Isolation and characterization ofplatelet-derived extracellular vesicles. J Extracell Vesicles 2014; 3: 24692, doi: 10.3402/jev.v3.24692
23. Al-Nedawi K, Meehan B, Rak J. Microvesicles: messengers and mediators of tumor progression. CellCycle. 2009; 8: 2014–2018. PMID: 19535896
24. DeanWL, Lee MJ, Cummins TD, Schultz DJ, Powell DW. Proteomic and functional characterisation ofplatelet microparticle size classes. Thromb Haemost. 2009; 102: 711–718. doi: 10.1160/TH09-04-243PMID: 19806257
25. Kasal A, Budesinsky M, Griffiths WJ. Spectroscopic Methods of Steroid Analysis. In: Makin HLJ, GowerDB editors. Steroid Analysis. Springer Netherlands; 2010. pp. 27–161.
Protein to Lipid Ratio and Lipid Properties of EVs
PLOS ONE | DOI:10.1371/journal.pone.0121184 March 23, 2015 15 / 16
26. Llorente A, Skotland T, Sylvanne T, Kauhanen D, Rog T, Orłowski A, et al. (2013) Molecular lipidomicsof exosomes released by PC-3 prostate cancer cells. Biochim Biophys Acta. 2013; 1831: 1302–9.PMID: 24046871
27. Bissig C, Gruenberg J. Lipid sorting and multivesicular endosome biogenesis. Cold Spring Harb Per-spect Biol. 2013; 5: a016816. doi: 10.1101/cshperspect.a016816 PMID: 24086044
28. Tan SS, Yin Y, Lee T, Lai RC, Yeo RW, Zhang B, et al. Therapeutic MSC exosomes are derived fromlipid raft microdomains in the plasmamembrane. J Extracell Vesicles. 2013; 2: 22614. doi: 10.3402/jev.v2i0.22614
29. de Gassart A, Geminard C, Fevrier B, Raposo G, Vidal M. Lipid raft-associated protein sorting in exo-somes. Blood. 2003; 102:4336–44 PMID: 12881314
30. Bilyy RO, Shkandina T, Tomin A, Munoz LE, Franz S, Antonyuk V, et al. Macrophages discriminate gly-cosylation patterns of apoptotic cell-derived microparticles. J Biol Chem. 2012; 287: 496–503. doi: 10.1074/jbc.M111.273144 PMID: 22074924
31. Record M, Carayon K, Poirot M, Silvente-Poirot S. Exosomes as new vesicular lipid transporters in-volved in cell-cell communication and various pathophysiologies. Biochim Biophys Acta. 2014; 1841:108–120. doi: 10.1016/j.bbalip.2013.10.004 PMID: 24140720
32. Booth AM, Fang Y, Fallon JK, Yang JM, Hildreth JE, Gould SJ. Exosomes and HIV Gag bud from endo-some-like domains of the T cell plasmamembrane. J Cell Biol. 2006; 172: 923–935. PMID: 16533950
Protein to Lipid Ratio and Lipid Properties of EVs
PLOS ONE | DOI:10.1371/journal.pone.0121184 March 23, 2015 16 / 16
Related Documents