Impact of Nonverbal Behaviour of Teachers on Students Educational Accomplishment Fahim Ullah Khan Student ID No. 9301-P Ph.D Education Qurtuba University of Science & Information Technology Peshawar, Khyber Pakhtunkhwa

Welcome message from author
This document is posted to help you gain knowledge. Please leave a comment to let me know what you think about it! Share it to your friends and learn new things together.
Transcript

Impact of Nonverbal Behaviour of Teachers on Students
Educational Accomplishment
Fahim Ullah Khan
Student ID No. 9301-P
Ph.D Education
Qurtuba University of Science & Information Technology
Peshawar, Khyber Pakhtunkhwa

ii
Impact of Nonverbal Behaviour of Teachers on Students
Educational Accomplishment
Fahim Ullah Khan
Student ID No. 9301-P
Ph.D Education
Department of Education
Supervisor: Dr. Wazeem Khan
Qurtuba University of Science & Information Technology
Peshawar, Khyber Pakhtunkhwa

iii
Author’s Declarations
I Fahim Ullah Khan hereby state that my Ph.D thesis titled “Impact of Nonverbal
Behaviour of Teachers on Students Educational Accomplishment” is my own work and
has not been submitted previously by me for taking any degree from this university, Qurtuba
University of Science & Information Technology Peshawar Campus or anywhere else in
the country/world. At any time if my statement is found to be incorrect even after my degree
the university has the right to withdraw my PhD degree.
Name of Student: Fahim Ullah Khan
Date: 02/01/2017
Signature:
iv
Plagiarism Undertaking
I solemnly declare that research work presented in the thesis titled “Impact of Nonverbal
Behaviour of Teachers on Students Educational Accomplishment” is solely my research
work with no significant contribution from any other person. Small contribution/help
wherever taken has been duly acknowledged and that complete thesis has been written by me.
I understand the zero tolerance policy of the HEC and University “Qurtuba University of
Science & Information Technology” towards plagiarism. Therefore, I as an author of the
above titled thesis declare that no portion of my thesis has been plagiarized and any material
used as reference is properly referred /cited.
I undertake that if I am found guilty of any formal plagiarism in the above titled thesis even
after award of PhD degree, the University reserves the rights to withdraw/revoke my PhD
degree and that HEC and the University has the right to Publish my name on the
HEC/University website on which names of students are placed who submitted plagiarized
thesis.
Author Name: Fahim Ullah Khan
Author Signature:

v
Certificate of Approval

vi
DEDICATION
The dedication goes to my supervisors Prof. Dr. Wazeem Khan and Prof. Dr. Muhammad
Sharif Khan; and to those who are serving humanity beyond the confinements of nationality,
race, language, color and religion.

vii
ACKNOWLEDGEMENTS
ALHAMDULILLAH (All praise to Allah), I would like to express my deepest gratitude to all
those who contributed and assisted one or the other way in the research work described in this
thesis.
First and foremost of all, I thank my academic supervisor, Professor Dr. Wazeem Khan, the
Dean and Head of Teacher Education Department for his unremitting guidance, supervision,
motivation, encouragement, critical evaluation, and valuable suggestions. Without him it
wouldn‟t have been possible to accomplish this research work successfully. May Allah bless
him (Ameen).
I am also indebted to my co-supervisor, professor Dr. Sharif khan, Ex-Head of Education
Department, Khuskhal Khan Khattak University, Karak for his kind guidance, motivation,
care, support, and valuable suggestions not only during the course of this research work but
also during the whole PhD program. May Allah bless him also (Ameen).
I am very grateful to Assistant Professor, Dr. Muhammad Nasir for his cooperation and
extensive guidance during this research work. Besides, the researcher feels deeply indebted to
the ever affectionate Dr. Mohammad Adnan, DEO (Male) Karak, Mr. Qazi Mohib Ullah
Shah, Ex-DPE (E&S) Education Department and Mr. Saif-ul-Islam, a CSS officer for their
pro-active support and collaboration during the course of this study.
I would like to express my heartfelt gratitude to the heads of educational institution, owners,
principals, teachers and students I had the opportunity to work with. I would also like to
acknowledge the prompt support provided by Mr. Nisar Ahmad with regard to the
composition and edition of this research work besides any computer related problem
encountered in the meanwhile.
Finally, I would like to acknowledge my parents whose unending prayers enabled me
accomplish this research work successfully. I thank my siblings, spouse and beloved sons,
Tayyab, Sadiq, and Salih whose genuine love spurred me travel smoothly towards this uphill
task. I would also like to mention Mr. Mushtaq Ahmad, Said Umar Khan and Shah Nawaz

viii
Khan especially whose financial, physical, psychological, moral, and spiritual support let me
tread my path with chin up. Allah may bless all of them (Ameen).

ix
ABSTRACT
Nonverbal behaviour precedes a significant role in our everyday life. It helps in
expression of our thoughts, behaviour, emotions, ideas, and skills in the teaching learning
process. We exchange information not verbal but also, through nonverbal communication
on different occasions. Non-verbal communication is synonymously known as sign
language including all kinds of behaviors performed in the presence of others-
consciously or unconsciously. This descriptive study aims at investigating the impact of
nonverbal behaviour of teachers‟ on students‟ educational accomplishments for which
descriptive cum observational method has been used. This also determined the
relationship among the unspoken behaviour of teachers working within different school
systems. The main objectives are:
a) To investigate the non-verbal communication of teachers serving in government,
private, with semi government & private standard schools.
b) To evaluate the unspoken communication of teachers in the above mentioned
educational systems.
c) To be consistent with the non-verbal behaviour of both (male & female) teachers‟.
d) To examine the association with teachers nonverbal behaviors‟ and students
educational accomplishment.
To accomplish the above mentioned objectives, a sample of one hundred eight teachers
out of three hundred sixty four teachers was chosen randomly from various school
systems stated above utilizing multiphase random sampling technique. In turn to
determine, the teachers nonverbal communication properly, a rating scale was used with
differential rating depends on Galloway's category of non-verbal movements. The
unspoken communication of teachers was rated on ranking tool which complement the
spoken measurement of Flanders system of communication. The pilot study was
conducted to see the reliability and validity. The paradigm of the research was
observational cum explanatory, and the data obtained was analyzed and interpreted by
means of different arithmetical tools; as it as mean, standard variation, standard error, Z-
x
test, analysis of variance technique and co-efficient of co-relation „r‟. Generalizations
were made on the basis of results obtained after using appropriate statistical tests. The
main findings of study were that:
i) The non-verbal behaviour of teachers was found to be compatible with their
verbal communication.
ii) No statistical variation was found among the unspoken communications of both
(male & female) teachers.
iii) The unspoken behaviour of teachers serving in different educational institutions
was insignificant.
iv) A strong relationship was found between the teachers‟ nonverbal behaviour and
their students‟ educational accomplishments.
In the light of conclusions, it is recommended that non-verbal teaching behaviour ought to
be certain essential place in schooling learning process, a program of study of human
behaviors‟ be able to improve for teachers guidance programs, and both male as well as
arts womanly teacher can be ready alert to make use of their body movements throughout
schooling learning process. It may help guiding and attracting the students‟ attention
through nonverbal communication. For future research it is recommended that the policy
makers and curriculum designers, through arrangement of training programs for the
teachers, may recognize the importance of nonverbal behaviour in the enhancement of
their communication skills. A different research studies depends on Galloway‟s research
design of non-verbal message may be launched. Single way echo soundtrack tool may
exist use to gain improved outcomes, and the tool developed for the current study could
be dwelt upon by the subordinate staff. However, in the light of Galloway system of
nonverbal communication and Flanders interaction analysis, an observation outline is
there built-up for the teacher‟s guidance and surveillance of teacher for the period of
lessons practice.
Keywords: Nonverbal behaviour, Teachers, Students, Classroom Interaction,
Educational accomplishments, Observation Form and Standardized Tests

xi
TABLE OF CONTENTS
AUTHOR’S DECLARATIONS ............................................................................... iii
PLAGIARISM UNDERTAKING ............................................................................ iv
CERTIFICATE OF APPROVAL…………………………………………………..v
DEDICATION............................................................................................................ vi
ACKNOWLEDGEMENTS ..................................................................................... vii
ABSTRACT ................................................................................................................ ix
LIST OF TABLES ................................................................................................. xxiv
List of Abbreviations ............................................................................................. xxvi
CHAPTER 1 .................................................................................................................1
Introduction ..................................................................................................................1
1.1 Background of the Study ..................................................................................... 1
1.2 Statement of the Problem ..................................................................................... 8
1.3 Research Objectives ............................................................................................. 8
1.4 Delimitation of the Study……………………………………………………….9
1.5 Significance of the Study…………………………………………………….....9
1.6 Hypotheses of the Study .................................................................................... 10
1.7 Methodologies.................................................................................................... 11
1.7.1 Population ................................................................................................... 11
1.7.2 Sample......................................................................................................... 11
1.7.3 Research Tool ............................................................................................. 11
1.7.4 Research Design…………………………………………………………..12
1.7.5 Data collection ............................................................................................ 12
1.7.6 Data analysis ............................................................................................... 13

xii
1.8 Definition of the Key Term................................................................................ 13
1.9 Overview of the Thesis……………………………………………………......14
CHAPTER 2 ...............................................................................................................15
LITERATURE REVIEW .........................................................................................15
2.1 Verbal Communication ...................................................................................... 15
2.2 Learning ............................................................................................................. 16
2.3 Effective Teaching ............................................................................................. 18
2.4 Components of Effective Teaching-Learning Process ...................................... 19
2.5 Nonverbal Aspect of Teaching .......................................................................... 23
2.6 FIACS-Flanders Interaction Analysis Category System ................................... 27
2.7 Nonverbal Communication ................................................................................ 30
2.8 Nonverbal Behaviour in the Classroom Environment ....................................... 32
2.8.1 Gestures, Postures and Body language ....................................................... 33
2.8.1.1 Gestures and body movements in the classroom ............................... 34
2.8.1.2 Gestures .............................................................................................. 34
2.8.1.3 Posture ................................................................................................ 35
2.8.2 Facial Expressions ...................................................................................... 35
2.8.2.1 Varieties of Expressions ..................................................................... 35
2.8.2.2 Face Talks .......................................................................................... 36
2.8.2.3 Facial expressions in the classroom ................................................... 37
2.8.3 Eyes ............................................................................................................. 38
2.8.3.1 Behavior of Eyes in the Classroom .................................................... 39
2.8.4 Touch .......................................................................................................... 41

xiii
2.8.5.1 Vocal intonation in school Classroom ............................................... 43
2.8.6 Physical Environment ............................................................................ 44
2.8.6.1 Personal Space.................................................................................... 45
2.8.6.2 Territoriality ....................................................................................... 46
2.8.7 Dress ........................................................................................................... 46
2.8.7.1 Dressing and Classroom ..................................................................... 46
2.8.8 Individual Artifacts ..................................................................................... 47
2.8.9 Physical Attractiveness ............................................................................... 48
2.8.10 Chronemics ............................................................................................... 49
2.9 Review of the Related Theories ......................................................................... 51
2.10 Critiques on Related Literature………………………………………………61
2.11Summary……………………………………………………………………..62
CHAPTER 3 ...............................................................................................................64
METHOD AND PROCEDURE ...............................................................................64
3.1 Research Methodology ...................................................................................... 64
3.2 Nature of the Research ....................................................................................... 65
3.3 Aim of the Research........................................................................................... 66
3.4 Research Design................................................................................................. 66
3.5 Population .......................................................................................................... 67
3.6 Sample of the study ............................................................................................ 68
3.7 Instrument of the Research ................................................................................ 70
3.8 Data Collection .................................................................................................. 72
3.9 Data Analysis ..................................................................................................... 74

xiv
3.10 Ethics in Research ............................................................................................ 76
CHAPTER 4 ...............................................................................................................78
Presentation, Analysis and Interpretation of the Data ...........................................78
CHAPTER 5 ...............................................................................................................94
FINDINGS, CONCLUSIONS, SUMMARY, DISCUSSION AND
RECOMMENDATIONS .............................................................................................94
5.1 Findings.............................................................................................................. 94
5.2 Conclusions ........................................................................................................ 99
5.3 Summary .......................................................................................................... 103
5.4 Discussions ...................................................................................................... 105
5.5 Recommendations ............................................................................................ 107
REFERENCES ...................................................................................................... 111
APPENDICES ....................................................................................................... 123
Appendix –“A” .................................................................................................. 123
OBSERVATIONAL FORM .................................................................................. 123
Impact of Nonverbal Behavior of Teachers on Students Educational
Accomplishment .................................................................................................... 123
Academic Qualification ..................................................................................... 123
Appendix –“A” .................................................................................................. 126
OBSERVATIONAL FORM .................................................................................. 126
Impact of Nonverbal Behavior of Teachers on Students Educational
Accomplishment .................................................................................................... 126
Academic Qualification ..................................................................................... 126

xv
Appendix- “A1” ..................................................................................................... 129
Nonverbal Behavior of Teachers (Male) Government Schools ......................... 129
Appendix “A2” ...................................................................................................... 132
Nonverbal Behavior of Teachers (Female) Government Schools ..................... 132
Appendix “A3” ...................................................................................................... 135
Nonverbal Behavior of Teachers (Male) Private Schools ................................. 135
Appendix “A4” ...................................................................................................... 138
Nonverbal Behavior of Teachers (Female) Private Schools .............................. 138
Appendix “A5” ...................................................................................................... 141
Nonverbal Behavior of Teachers (Male) Semi Government & Private Standard
Schools ............................................................................................................... 141
Appendix “A6” ...................................................................................................... 144
Nonverbal Behavior of Teachers (Female) Semi Government & Private Standard
Schools ............................................................................................................... 144
Appendix “A7” ...................................................................................................... 147
Values of Mean and Standard deviation Nonverbal Behavior Score of Teachers
while Accepting Students Feelings (Observation 1 & 2)................................... 147
Appendix “A8” ...................................................................................................... 150
Values of Mean and Standard deviation Nonverbal Behavior Score of Teachers
while Accepting Students Ideas (Observation 3) ............................................... 150
Appendix “A9” ...................................................................................................... 153
Values of Mean and Standard deviation Nonverbal Behavior Score of Teachers
While Making Questions (Observation 4) ......................................................... 153

xvi
Appendix “A10” .................................................................................................... 157
Values of Mean and Standard deviation Nonverbal Behavior Score of Teachers
while Delivering Lecture (Observation 5) ......................................................... 157
Appendix “A11” .................................................................................................... 158
Appendix “A12” .................................................................................................... 161
Values of Mean and Standard deviation Nonverbal Behavior Score of Teachers
while criticizing and Justifying Authorities‟ (Observation 7) ........................... 161
Appendix “B1”....................................................................................................... 165
Values of Standard error of mean and A 100(1-α)% Confidence Interval for
Population mean Nonverbal behavior score of teachers while Accepting feeling
of students .......................................................................................................... 165
(Observation 1&2) ............................................................................................. 165
Appendix “B2”....................................................................................................... 166
Values of Standard error of mean and A 100(1-α)% Confidence Interval for
Population mean Nonverbal behavior score of teachers while Accepting student
ideas ................................................................................................................... 166
(Observation 3) .................................................................................................. 166
Appendix “B3”....................................................................................................... 167
Values of Standard error of mean and A 100(1-α)% Confidence Interval for
Population mean Nonverbal behavior score of teachers while Making questions
............................................................................................................................ 167
(Observation 4) .................................................................................................. 167

xvii
Appendix “B4”....................................................................................................... 168
Values of Standard error of mean and A 100(1-α)% Confidence Interval for
Population mean Nonverbal behavior score of teachers while Delivering lecture
............................................................................................................................ 168
(Observation 5) .................................................................................................. 168
Appendix “B5”....................................................................................................... 169
Values of Standard error of mean and A 100(1-α)% Confidence Interval for
Population mean Nonverbal behavior score of teachers while Giving directions
............................................................................................................................ 169
(Observation 6) .................................................................................................. 169
Appendix “B6”....................................................................................................... 170
Values of Standard error of mean and A 100(1-α)% Confidence Interval for
Population mean Nonverbal behavior score of teachers while Justifying
authorities ........................................................................................................... 170
(Observation 7) .................................................................................................. 170
Appendix “C1”....................................................................................................... 171
Appendix “C2”....................................................................................................... 172
Values of Mean and Standard deviation Nonverbal Behavior Score of Male
Teachers while Accepting Students, Ideas (Observation 3) .............................. 172
Appendix “C3”....................................................................................................... 173
Values of Mean and Standard deviation Nonverbal Behavior Score of Male
Teachers while Making Questions (Observation 4) ........................................... 173
Appendix “C4”....................................................................................................... 174
Values of Mean and Standard deviation Nonverbal Behavior Score of Male
Teachers while Delivering Lecture (Observation 5) .......................................... 174

xviii
Appendix “C5”....................................................................................................... 175
Values of Mean and Standard deviation Nonverbal Behavior Score of Male
Teachers while Giving Directions (Observation 6) ........................................... 175
Appendix “C6”....................................................................................................... 176
Values of Mean and Standard Deviation Nonverbal Behavior Score of Male
Teachers while Justifying Authorities (Observation 7) ..................................... 176
Appendix “D1” ...................................................................................................... 177
Values of Mean and Standard Deviation Nonverbal Behavior Score of Female
Teachers while Accepting Students, Feelings (Observation 1 & 2) .................. 177
Appendix “D2” ...................................................................................................... 178
Values of Mean and Standard deviation Nonverbal Behavior Score of Female
Teachers while Accepting Students, Ideas (Observation 3) .............................. 178
Appendix “D3” ...................................................................................................... 179
Values of Mean and Standard deviation Nonverbal Behavior Score of Female
Teachers while Making Questions (Observation 4) ........................................... 179
Appendix “D4” ...................................................................................................... 180
Values of Mean and Standard deviation Nonverbal Behavior Score of Female
Teachers while Delivering Lecture (Observation 5) .......................................... 180
Appendix “D5” ...................................................................................................... 181
Values of Mean and Standard deviation Nonverbal Behavior Score of Female
Teachers while Giving Directions (Observation 6) ........................................... 181
Appendix “D6” ...................................................................................................... 182
Values of Mean and Standard deviation Nonverbal Behavior Score of Female
Teachers while Justifying Authorities (Observation 7) ..................................... 182

xix
Appendix “E1” ....................................................................................................... 183
Comparison between Nonverbal Behavior Scores of Male and Female Teachers
While Accepting Students Feelings (Observation 1&2) .................................... 183
Appendix “E2” ....................................................................................................... 184
Comparison between Nonverbal Behavior Scores of Male and Female Teachers
While Accepting Students Ideas (Observation 3) .............................................. 184
Appendix “E3” ....................................................................................................... 185
Comparison between Nonverbal Behavior Scores of Male and Female Teachers
While Asking Questions (Observation 4) .......................................................... 185
Appendix “E4” ....................................................................................................... 186
Comparison between Nonverbal Behavior Scores of Male and Female Teachers
While Delivering Lecture (Observation 5) ........................................................ 186
Appendix “E5” ....................................................................................................... 187
Comparison between Nonverbal Behavior Scores of Male and Female Teachers
While Giving Directions (Observation 6) .......................................................... 187
Appendix “E6” ....................................................................................................... 188
Comparison between Nonverbal Behavior Scores of Male and Female Teachers
While Criticizing and Justifying Authorities (Observation 7) ........................... 188
Appendix “F1” ....................................................................................................... 189
Mean and Standard deviation of Nonverbal Scores of Teachers performing his
job in Government Schools while Accepting Students Feelings (Observation 1 &
2) ........................................................................................................................ 189
Appendix “F2” ....................................................................................................... 190
Mean and Standard deviation of Nonverbal Scores of Teachers performing his
job in Government Schools while Accepting Students Ideas (Observation 3) .. 190
xx
Appendix “F3” ....................................................................................................... 191
Mean and Standard deviation of Nonverbal Scores of Teachers performing his
job in Government Schools while Making Questions (Observation 4) ............. 191
Appendix “F4” ....................................................................................................... 192
Mean and Standard deviation of Nonverbal Scores of Teachers performing his
job in Government Schools while Delivering Lecture (Observation 5) ............ 192
Appendix “F5” ....................................................................................................... 193
Mean and Standard deviation of Nonverbal Scores of Teachers performing his
job in Government Schools while Giving Directions (Observation 6) .............. 193
Appendix “F6” ....................................................................................................... 194
Mean and Standard deviation of Nonverbal Scores of Teachers performing his
job in Government Schools while Criticizing Authorities (Observation 7) ...... 194
Appendix “G1” ...................................................................................................... 195
Mean and Standard deviation of Nonverbal Scores of Teachers performing his
job in Private Schools while Accepting Students Feelings (Observation 1 & 2)
............................................................................................................................ 195
Appendix “G2” ...................................................................................................... 196
Mean and Standard deviation of Nonverbal Scores of Teachers performing his
job in Private Schools while Accepting Students Ideas (Observation 3)........... 196
Appendix “G3” ...................................................................................................... 197
Mean and Standard deviation of Nonverbal Scores of Teachers performing his
job in Private Schools while Making Questions (Observation 4) ...................... 197
Appendix “G4” ...................................................................................................... 198
Mean and Standard deviation of Nonverbal Scores of Teachers performing his
job in Private Schools while Delivering Lecture (Observation 5) ..................... 198

xxi
Appendix “G5” ...................................................................................................... 199
Mean and Standard deviation of Nonverbal Scores of Teachers performing his
job in Private Schools while Giving Directions (Observation 6) ...................... 199
Appendix “G6” ...................................................................................................... 200
Mean and Standard deviation of Nonverbal Scores of Teachers performing his
job in Private Schools while Criticizing Authorities (Observation 7) ............... 200
Appendix “H1” ...................................................................................................... 201
Mean and Standard deviation of Nonverbal Scores of Teachers performing his
job in Semi Government & Private Standard Schools while Accepting Students
Feelings .............................................................................................................. 201
(Observation 1 & 2) ........................................................................................... 201
Appendix “H2” ...................................................................................................... 202
Mean and Standard deviation of Nonverbal Scores of Teachers performing his
job in Semi Government & Standard Private Schools while Accepting Students
Ideas (Observation 3) ......................................................................................... 202
Appendix “H3” ...................................................................................................... 203
Mean and Standard deviation of Nonverbal Scores of Teachers performing his
job in Semi Government & Standard Private Schools while Making Questions
(Observation 4) .................................................................................................. 203
Appendix “H4” ...................................................................................................... 204
Mean and Standard deviation of Nonverbal Scores of Teachers performing his
job in Semi Government & Private Standard Schools while Delivering Lecture
(Observation 5) .................................................................................................. 204

xxii
Appendix “H5” ...................................................................................................... 205
Mean and Standard deviation of Nonverbal Scores of Teachers performing his
job in semi Government & Private Standard Schools while Giving Directions
(Observation 6) .................................................................................................. 205
Appendix “H6” ...................................................................................................... 206
Mean and Standard deviation of Nonverbal Scores of Teachers performing his
job in Semi Government & Private Standard Schools while Criticizing
Authorities (Observation 7) ............................................................................... 206
Appendix “I1” ........................................................................................................ 207
Comparison of Nonverbal Scores of Teachers performing his job in Government,
Private and Semi Government & Private Standard Schools while Accepting
Students Feelings (Observation 1 & 2) .............................................................. 207
Appendix “I2” ........................................................................................................ 208
Comparison of Nonverbal Scores of Teachers performing his job in Government,
Private and Semi Government & Private Standard Schools while Accepting
Students Ideas (Observation 3) .......................................................................... 208
Appendix “I3” ........................................................................................................ 209
Comparison of Nonverbal Scores of Teachers performing his job in Government,
Private and Semi Government & Private Standard Schools while Making
Questions (Observation 4) ................................................................................. 209
Appendix “I4” ........................................................................................................ 210
Comparison of Nonverbal Scores of Teachers performing his job in Government,
Private and Semi Government & Private Standard Schools while Delivering
Lecture ............................................................................................................... 210
(Observation 5) .................................................................................................. 210

xxiii
Appendix “I5” ........................................................................................................ 211
Comparison of Nonverbal Scores of Teachers performing his job in Government,
Private and Semi Government & Private Standard Schools while Giving
Directions ........................................................................................................... 211
(Observation 6) .................................................................................................. 211
Appendix “I6” ........................................................................................................ 213
Comparison of Nonverbal Scores of Teachers performing his job in Government,
Private and Semi Government & Private Standard Schools while Criticizing
Authorities (Observation 7) ............................................................................... 213
Appendix “J” .......................................................................................................... 214
Nonverbal Scores of All the Teachers ................................................................... 214
Frequency Distribution of Nonverbal Scores of Teachers ................................. 215
Appendix “K” ........................................................................................................ 216
Total Students Average Educational Accomplishment ......................................... 216
Frequency Distribution of Students‟ Educational Accomplishment ................. 217
Appendix “L” ......................................................................................................... 218
Relationship between Nonverbal Behaviour Scores of Teachers and Students
Average Educational Accomplishment.............................................................. 218
Correlation co-efficient calculated by using the following formula .................. 221

xxiv
LIST OF TABLES
Table-1: Galloway System Of The Nonverbal Behaviors ............................... ………25
Table-2: Sampling Break-up of the Educational Institutions and Teachers ................ 28
Table-3: Frequency Distribution of Nonverbal Behavior Scores of Teachers ............ 69
Table-4: Frequency Distribution of Average Students‟ Educational
Accomplishment…………… ...................................................................................... 79
Table-5: Values of Standard error, Mean and Standard deviation nonverbal scores of
teachers, while accepting feelings of students ........................................................... 80
Table-6: Values of Mean, Standard error, and Standard deviation nonverbal scores of
teachers, while accepting students‟ ideas................................................................... 81
Table-7: Values of Mean, Standard error, and Standard deviation nonverbal scores of
teachers, while making questions .............................................................................. 82
Table-8: Values of Mean, Standard error and Standard deviation nonverbal scores of
teachers, while delivering lecture .............................................................................. 82
Table-9: Values of Mean, Standard error and Standard deviation nonverbal scores of
teachers, while giving directions ................................................................................ 83
Table-10: Values of Mean, Standard error and Standard deviation nonverbal scores of
teachers, while criticizing & justifying authorities .................................................... 84
Table-11: Comparison between Non verbal Behaviour rating Scores of Female and
Male Teacher‟s While Accepting Student's thoughts (Observation 1&2) ................... 84
Table-12: Comparison between Non verbal Behaviour rating Score of Female and
Male Teacher's, While Accepting Students Feelings (Observation 3) ........................ 85
Table-13: Comparison between Non verbal Behaviour Score of Female and Male
Teacher's, While Asking Questions (Observation 4) ................................................... 86
Table-14: Comparison between Non verbal Behaviour Score of Female and Male
Teachers, While Delivering Lecture (Observation 5) .................................................. 86
Table-15: Comparison between Non verbal Behaviour Score of Female and Male
Teacher's, While Giving Directions (Observation 6) ................................................... 87

xxv
Table-16: Comparison between Non verbal Behaviour Score of Female and Male
Teachers‟ While Criticizing and Justifying Authorities (Observation 7) .................... 87
Table-17: Relationship of non verbal rating score of teacher's working in government,
private and semi government & private standard schools ' while accepting feelings of
student's (observation 1 & 2) ....................................................................................... 88
Table-18: Comparison of Non verbal Rating Score of Teachers Serving in
Government, Private and Semi Government & Private Standard Schools while
Accepting Students Idea (Observation 3) .................................................................... 88
Table-19: Comparison of Non verbal Rating Score of Teachers, Serving in
Government, Private and Semi Government & Private Standard Schools while
Making Questions (Observation 4) .............................................................................. 89
Table-20: Comparison of Nonverbal Scores of Teachers Serving in Government,
Private and Semi Government & Private Standard Schools while Delivering Lecture
(Observation 5) ............................................................................................................ 90
Table-21: Comparison of Nonverbal Scores of Teachers Serving in Government,
Private and Semi Government & Private Standard Schools while Giving Directions
(Observation 6) ............................................................................................................ 90
Table-22: Comparison of Non verbal Rating Score of Teachers‟ working in Private,
Government and Semi Government & Private Standard Schools while Criticizing
Authorities (Observation 7) ......................................................................................... 91
Table-23: Relation among Teachers Non Verbal rating Score and Students
Educational Accomplishment ...................................................................................... 92

xxvi
List of Abbreviations
NV Nonverbal
NVC Nonverbal Communications
FICAS Flanders Interaction Category System
SSC Secondary School Certificate
BISE Board of Intermediate and Secondary Education
r Co-efficient of correlation
ANOVA Analysis of Variance
B.A Bachelor of Arts
Bed Bachelor of Education
Med Master of Education
M.A Master of Arts
MSc Master of Science
MPhil Master of Philosophy
PhD Doctor of Philosophy
CT Certificate of Teaching
SST Secondary School Teacher
DPE Director of Physical Education
GHS Government High School
GGHS Government Girls High School
Govt Government
IER Institute of Education and Research
xxvii
KPK Khyber Pakhtunkhwa
CSS Central Superior Services
DEO District Education Officer
PBUH Peace and Blessing be Upon Him
M Male
F Female
ADEO Assistant District Education Officer
DDEO Deputy District Education Officer
IMU Independent Monitoring Unit
1
CHAPTER 1
INTRODUCTION
1.1 Background of the Study
Nonverbal behaviors‟ are the nonlinguistic transmission of information through facial
expression, body language, eye contact and gesture of human being. The
understanding of each other through body language and eye expression is known as
nonverbal behaviour. We exchange information through different ways and means to
convey our feelings, ideas and thoughts. It is generally understood that message is
indicated by means of verbal communication and sound, however in fact message is
the sequence of vocal and non-verbal exchange of information. Allan and Pease
(2004) stated “when an individual or a group of people is sustaining message, at the
time they are focused on the entire environment around them. Albert Mehrabian, a
pioneer researcher of non-verbal communications in 1950‟s found that, the total effect
of a message is about seven percent verbal and fifty five percent nonverbal unspoken
and thirty eight percent verbal together with, inflection, pitch of tone and additional
sound.
In this connection, Given (2002) also stated that, nonverbal behaviour includes body
movement, tone, volume of voice, stance, pitch, speed, artifacts, dress and
appearance, facial expressions, eye movement and contact, apparent behaviour,
sound, gesture posture of an individual which encodes motivation, concept, or mood
(gesture is nor energy and neither matter but information).In generic sense, it is a
symbol used to communicate one after or part from words. We believe that the
investigation of body language, eye contact and facial expression has valuable
applications in the study of nonverbal behaviour and other forms of educational
psychology.
Alberto and Troutman (2003) stated that, every action by a person that can be heard or
seen is called behaviour. Behaviour may be observable or measurable, so that each
one working with the student has a good understanding of what the behaviour look
like or sound like. Non-verbal behaviour remains the oversight part of teaching

2
learning process specifically in Pakistan. In order to teach effectively, neglecting
unspoken message during the class room would be inappropriate at the same time as it
remains an essential tool for sympathetic understanding of class-room interaction.
In every educational system, the role of a teacher holds pivotal importance. Effective
teaching takes place when a teacher successfully transmits the concept and the basic
ideas to the pupils. The effective element of comprehensive teaching was to bring to
an end by using different methods of Meta-analysis. Furthermore, researcher gathered
thousands of studies as well as a list of important factors which consist of positive
reinforcement, academic time, utilization and movement including cooperative
learning activities, feedback, classroom environment, standard quality questioning
and use of modern organizers (Walberg, 1990).
Nonverbal behaviour plays an important role inside the class-room all over lessons
understanding. Nonverbal behaviour causes an effect going on the understanding of
the student, which eventually domino affects in enhanced education and thoughtful
ideas. Teachers similar to everyday state of affairs too utilize unspoken behaviour
inside the classrooms, although but they employ properly and when instruction
strategies with the aim to produce curiosity among the student improved outcomes are
able to attain in the shape of student-learning achievements.
Delleo (1977) stated, “Communication comprises all types of language; facial
expression, crying, yelling, touching, and also speech and writing. Communication of
message is an integral part of our life. Teachers convey their message to students in
diverse way, to reflect their feelings, thoughts, skills, ideas, and knowledge.
Normally, it is believed that information is exchanged and expressed only with the
help of sounds and speech, but exchange of information is actually the result of a
combination of verbal ideas and nonverbal signals and cues. Indeed, the primary
source of relation among all human beings is communication and a greater portion of
communication is made of nonverbal signals.
Unlike verbal communication, nonverbal communication is a silent language to
express messages in the form of gestures or postures rather than verbal. This system
of communication is more related with the feeling and perception we have about the
idea. However, when a nonverbal signal or body language is used for communication,

3
especially for those people who are deaf, is not considered nonverbal movement. In
such type of situation it becomes the only source through which information could be
transferred. It is revealed through researches that more than sixty percent
communication is nonverbal which is considered a powerful means of
communication.
Nonverbal behaviour among the individuals is a transformation to dispatch by means
of communication and receiving speechless movements. It comprises the use of visual
signals such as physical appearance, body movement; paralanguage means voice,
touch (hepatices) and distance (proxemics). It may consists oculesic (eye contact, the
movement of looking while listening and talking, patterns of fixations, and frequency
of quick look, blink rate, and students‟ expansion).
In the eyes of a layman, nonverbal signals do not hold much significance in
transferring messages, but this field is very vast and is an essential part of every
communication in every type of context. The use of time, merely as a speech includes
nonverbal elements called paralanguage. It consist pitch, voice quality, speaking style,
rate, and volume as well as relating to the rhythmic aspect of language. Similarly,
intonation, stress, and rhythm of the verbal signals also compose part of nonverbal
communication and, therefore, written texts have a verbal component especially
arrangement of words, handwriting style, or visible page layout. Moreover, most of
the research work based on nonverbal behavior has brought into focus communication
between peoples and divided it into three major areas; state of the environment, which
is the situation where the communication happens, physical features of the
communicators, and manner of communicators during communication. In this
connection, Amulya (2004) stated that “reflection is the base of useful learning”.
Teachers may use their body movements, eye contact; facial appearance, pitch of
accent, anger, smile; frown, and aloofness for improved accepting of the concept of
student. Teachers might make use of nonverbal cues intended for quick learning of the
student‟s with less effort. This teaching method based on learning mean, which finally
lead to educational accomplishments. These accomplishments are the ending results
of education learning development.

4
Teaching strategy and learning accomplishments of student are based on learn
behavior. The higher degree of retention and achievements of the students are directly
proportionate to the quality and arrangement of the learning activities. The basic
purpose and aim, the final results of all academic actions is knowledge achievements;
as a result these academic tricks help and require immense be concerned and special
consideration during the time of execution and designing in the classroom. If the
learning activities are well organized and suited to the requirements of the students
and the situation then academic performance of the student‟s will be of higher degree.
Gronlund (1970) also observed that, there was a great interrelation between teaching
learning and educational accomplishments. The wisdom practice was not a conclusion
nevertheless a way to desired last part. Various A.V aids and teaching methods in the
teachings are advised as an instrument to accomplish preferred learn
accomplishments. Teaching education presentation is as well contributes to learning
procedure, in the context so as to give some idea and guidance to the teachers‟ chosen
from their appropriate learning methods and respective materials in the class-rooms.
Furthermore, but educational results are appropriately communicated to students; then
learning activities may be enhanced both within and external side of the school to a
great extent. A nonverbal behavior carries the intended and unaware methods of
encoding and decoding. The encoding means the process of creating information such
as gestures, postures and facial expression. Similarly, decoding interprets information
from the received perception in the light of some previous experience.
It is very important to mention here that culture and social values also play pivotal
role in non-verbal behaviour. It is one of the most essential aspects that assist to infer
how learning activities are established. Different nonverbal signals may attribute
various things in different cultures. We cannot negate the role played by culture if we
want to take the help of nonverbal signals. Learning depends not only on verbal but
also on the nonverbal communication which serves as a basis to organize and to
interpret the interpersonal interactions. It will be extremely difficult to interpret and
comprehend a message in verbal communication without taking into account the
nonverbal cues. Researchers have investigated that how children learn to involve
culture and social values and to participate in this organize system of signals and cue
from a young age (Paradise & Ruth, 1994). In fact, two-third part of the nonverbal

5
behavior is represented by all exchange of information. Furthermore, non-verbal
behaviour may describe a communication both by verbal and nonverbal signals.
Hogan and Stubbs (2003) stated “body language consist of physical characteristics,
may be intended and insensible signals, body language gestures and postures, the
medium of individual space”. A false communication is conveyed when a movement
of body does not match with the verbal. Nonverbal behaviour throws the first
expression an ordinary situation like motivating a business partner in a business
interview. Abstractions are largely formed within the first few seconds. Allan and
Pease (2004) stated‟ when an individual or a group of an individuals‟ is absorbing a
communication, at the time they are focused on the whole environment around them.
In this condition an individual uses 83% of his eye sight, eleven percent 11% hearing,
three percent 3% smell, two percent 2% touch and one percent1% taste of all his five
senses in this interaction.
Behavior approach is ambitious and simplistic that claims to explain all learning. It
does not take into account mental processes in learning because they cannot be
directly observed. Behavioral approach uses the concept of conditioning to explain
how learning takes place. Learning refers to those changes in behavior, knowledge or
thinking that occur mainly due to practice or experience. Behaviorist, in fact, attempt
to discover universal scientific laws just to explain how all organisms, people
including all living organism learn.
In teaching learning process, teaching is one of the most important elements
performed by different educational experts and teachers. Effective communication is
that where a trained and qualified teacher transmits the subject matter or ideas to the
learners efficiently. The majority understandable and all-inclusive evaluation of
instruction learning efficacy was carried out by Walberg as cited by (Sprinthall,
1994). Using the process of a quantitative analysis of several separate but similar
experiments, he collected more than three thousand studies and then synthesized them
carefully to find out and predict immediately how every component was important in
student education. Since his study outcome, he gathered a record of important
components which included students‟ time, utilization, gestures and positive

6
reinforcement including feedback, cooperative learning interaction, class
environment, morality, use of advance organizers and standard queries'.
To know where these elements fit together undoubtedly, Flanders (1970) classified
teachers‟ verbal communication into seven groups. These classifications represent the
most generally observed behaviors‟. Whereas both designs of the research were
entirely old but served as a foundation for the present research work. Flanders‟ study
depends on traditional method of teaching. In our country educational system is still
based on teacher centered method. In such a case, it becomes essential to make use of
the research study of Galloway‟s as cited by Gay (1996) how to see effectiveness of
nonverbal communication of the teachers‟ being affected in the system? Galloway
study seems old but it is followed by many research studies later on. Similarly
Kodakos‟ and Polemikos‟ (2000) conducted scientific study on non-verbal behavior at
Kindergarten school just to see non-verbal cues of teachers and children, and its
relation to their verbal behaviour.
Gage (1978), “Flanders system of interaction classified keen on two foremost
category undeviating and not direct method of schooling”. On the basis of his research
work, teaching models were designed for a better method of teaching for students
learning. The classification of interaction planned by Flanders no merely connect
seven point rating strategy technique firmly and strongly constructed, however in
addition it serve the same as a link among the general and detailed lessons models.
Albert's (2006) conduct a study on top of the closeness or non-verbal immediacy
within the class-room atmosphere with the aim of finding a relation among the
operation of unspoken behaviour and sharpness of the listeners participating in the
discussion. An assumption was made to denote student‟s sharpness to discuss
different situations with a teacher in the class room atmosphere. Really, it assists the
students to enhance their performance and understanding.
These studies demonstrate that Galloway research is still important framework for
nonverbal communication. Nonverbal behaviour to bring into being by combining is
its place and getting momentum in teacher centered teaching. On the other hand, a
majority of the methods of teaching in our country is direct. Although, there is a
growing concern about this and, now, here is a model vary and shift from straight

7
method of teaching to instructional method. However, this does not mean that we
should abolish everything related with the direct method. The traditional method of
teaching means teacher centered method is still important (Gay, 1996). While to study
effective communication more stress was given to the spoken aspect of teachers‟
behaviour. These ideas were advocated by Sprinnthall (1994.) who reflected
instructional method and do research on education usefulness. The main purpose of
his reflection was basically to focus on the improvement and analysis of verbal
behaviour of school teachers. However, nonverbal behavior is widely used by teacher
whether consciously or unconsciously. It is based on teachers‟ body language towards
teaching, learning process and the students. The nonverbal signals are very helpful in
creating a favorable classroom atmosphere which facilitates students' learning. When
teachers‟ behavior is positive about their teaching, then the attention of the students
tends to be much more enthusiastic about what they teach.
Nonverbal behavior provides us a lot more about the teacher and his/her teaching
style. The lack of confidence or enthusiasm is exhibited by such nonverbal cues as
gestures, postures, manner of influence, facial appearance, and judgment get in touch
with (Gay, 1996). However, it is very much unfortunate that the nonverbal behaviour
aspect of teaching is neglected and overlooked in our country and no proper attention
is given to it while designing and executing teaching activities. On the other hand, it is
a proven fact that seventy five to ninety percent messages are transmitted nonverbally.
In fact, verbal behaviour is less important as compared to tone of voice, facial
expression, gestures, postures and eye contacts etc. when it comes to the
understanding of message and effective communication. However, it must be noted
here that the use of essential body language is based on positive attitude. Research
study showed those teachers‟ who have positive behaviour towards the physical
existence really employ an important and large set of non-verbal signals for
facilitating and encouraging the participation of the students.
Galloway (1977) stated that “Nonverbal communication of Flanders system of
interaction serves a helpful research for teachers' nonverbal behavior analysis”.
Different researches have been launched in our country to predict the impact of the
nonverbal behaviour of teachers on the educational performance of the students. In
this connection, the results of the previously conducted researches may give a useful

8
knowledge about the present study. They may serve as an expensive input for teacher
training programs specially in teaching learning process regarding the social status of
teachers. By reviewing the research studies the importance of nonverbal movements
can be showed but not in the sense as was given by Galloway who extended his
contribution upon nonverbal. It was this clear evidence for the researcher that
compelled him to conduct a research on it. A research in diverse setting presents a
pivotal role in human understanding.
1.2 Statement of the Problem
The current research titled as “Impact of nonverbal behaviour of teachers on students‟
educational accomplishment”. The researcher would like to conduct a research on
teachers‟ nonverbal behaviour in different school systems. Although despite its role
and importance it remains a strongly ignorable part of instructional education
procedure in the setting of our country. It is essential for better understanding of the
area under discussion by the students and if we neglected it then effective exchange of
information in the classroom is not possible. It is a very sad fact that in the setting of
our country, teachers give more stress to verbal communication more than the
nonverbal, whereas effective teaching needs a good and wise amalgamation of both.
As Flanders interaction analysis theory neglects nonverbal communication, it was
strongly felt that nonverbal communication should also be an integral part of verbal
communication for effective teaching. In the light of the personal experience of the
researcher as a teacher, this aspect is generally ignored in our educational system. In
order to remove this flaw from the educational system of our country, where teaching
institutions focus only on a teacher‟s verbal behaviour during the teaching-learning
process, the current study assumes much importance because this current practice
might negatively affect the education of the student. Furthermore, the reading also
aims at assessing that how teacher make use of this method for the improved
academic accomplishments of the students.
1.3 Research Objectives
The objectives were formulated for do research:

9
1. To know about mean, standard deviation and standard error in the teachers'
nonverbal behaviour in various educational institutions and to investigate that
whether it is compatible with their verbal or not.
2. To find out, evaluate and compare and contrast the nonverbal behaviour of
male and female arts teachers in different educational institutions.
3. To find out a significant difference base on their gender category difference
between the nonverbal behaviour of both (male & female) arts teacher
working in government, private, semi-government & private standard schools.
4. To investigate the relation between the unspoken message of the teacher along
with the educational accomplishments of the students.
5. To make recommendations and suggestions for the teachers to use nonverbal
communication strategies as an essential part of their teaching activities in
order to improve the academic accomplishments of their students.
1.4 Delimitation of the Study
The research work was delimited to the unspoken cues of the teachers such as facial
expression, body language, vocal cues, artifacts, judgment contact, and bearing, pitch
and speed of talking between the teacher-students for the period of lessons wisdom
procedure. The ability of the research work was further acute behind to the classes of
9th
and 10th
(both genders) of secondary school students in the subject of arts only
(English, Urdu and Islamiat) in Government, Private, Semi government & private
standard schools located in district Karak, Khyber Pakhtunkhwa, Pakistan.
1.5 Significance of the Study
Nonverbal behaviour shows an essential position in our everyday life in realize the
meaning and milieu of the message. Researchers likes Allan and Pease have revealed
that seventy to ninety percent communication is nonverbal. Non-verbal behaviour is
the unspoken exchange of information that takes place in each and all confronting
each other come across through other individual. It is the nonverbal signal or cue
which informs us that what kind of feelings others are having towards us, and how
well are our words being received and perceived by them. The present study was
undertaken consecutively to explain and elaborate the importance of unspoken

10
behaviour in authentic class room situation and atmosphere and to determine the
effect of non-verbal message of teacher lying on the learning process. Similarly, this
study is able to help the teachers to get an evaluation and feedback for their nonverbal
communication in terms of percentage. Research in diverse settings indicates that
nonverbal behaviors‟ can serve a wide range of responsibilities in human involvement
and understanding. It would also pave way for teachers to reinforce, supplement, or
control a verbal message with appropriate non-verbal communications.
Furthermore, the suggestions of the research might be helpful for curriculum designer
at the instance of scheming syllabi by means of results of the research. It might be
helpful for teachers to use nonverbal teaching behavior and to effectively combine it
with verbal signals to facilitate students learning. The results of the present research
work might strengthen make use of guidance practice that emphasize on nonverbal
communication during the training courses in our country, especially in teachers‟
education.
The study was tried to explore whether the educational accomplishments of the
students were somehow linked to the nonverbal behaviour of the teachers or not.
Broophy (1988), stated the ideas that concrete instruction is a series of organize and
stable monitor movements. The outcome of the lessons might be useful intended for
the in-service and pre-service teachers‟ guidance programs, and this aspect may be
given some place in the teachers‟ education, especially in teaching practice. The
results may also identify directions for further research in future.
1.6 Hypotheses of the Study
The hypothesis developed for the present research work was:
H1: There is an important variation among the average non-verbal communication
rating score of male and female arts teachers in six dimension of nonverbal behaviour.
H2: There is an important variation among the average nonverbal behaviour rating
score of arts teacher working in government, private, semi government & private
standard schools.

11
H3: There is an important relation among arts teacher unspoken communication rating
score and their students‟ educational accomplishment.
The versus of the hypotheses were;
H01: There is trivial variation among the average unspoken communication rating
score of both (male & female) arts teacher in six dimension of nonverbal behaviour.
H02: There is trivial variation among the normal unspoken behaviour rating score of
arts teachers working in government, private, semi government & private standard
schools.
H03: There is no correlation among teacher nonverbal communication rating score
along with their students‟ educational accomplishment.
1.7 Methodologies
1.7.1 Population
The entire secondary schools teacher 364 (233 male & 131female) and students
(7583) in the subjects of English, Urdu and Islamiat from government (95), private
(80), semi-government and private standard school (13) situated in Karak district
constituted population of the research.
1.7.2 Sample
A sample of one hundred eight (108) arts teachers (54 male and 54 female) out of
three hundred sixty four (364) arts teachers and (1144) one thousand one hundred
forty four students out of 7583 was randomly selected through multistage cluster
sampling technique from 36 secondary school of the defined population of schools.
1.7.3 Research Tool
So as to determine, the non-verbal communication of teacher with differential rating
tool; recommended by Galloway be use, to observe how far-away the teacher use their
non-verbal communications with the intention of be well-matched by means of their
spoken performance, and how far their nonverbal communication wasn‟t compatible
12
through their spoken communication. The body position is rated on rating scale. The
major essentials of the patterns of non-verbal behaviour are alienated interested in two
foremost area. Nonverbal behaviour that i.e. facilitates student knowledge ii tightens
their wisdom. Galloway‟s structured the non-verbal category according to Flanders
classification of teachers‟ direct and not direct manipulation. The ranking on the
examination form be complete at the same time as explain in section three.
Later than construct the instrument of the research, it was direct experienced. The
random sample of the pre study constituted of both (5 male & 5 female) teacher from
the definite people. Direct experiment confirmed the soundness of tool for the reason
that no complexity was bring into being in assessing nonverbal activities of these
teacher. Investigation consistency of the device is firm, which was 0.70, which is
quite satisfactory indication of the reliability.
The variable of students‟ educational accomplishments was measured by averaging
out the marks obtained by the sample students in secondary school certificate
examination held by their respective boards.
1.7.4 Research Design
Descriptive cum observational tool was used for data collection.
1.7.5 Data collection
For the collection of primary data, the researcher personally completed comments
concerning nonverbal performance of the teacher inside the program throughout two
diverse sessions including of five or six follow-up every one. The mean gain lying on
every measurement was measured as indication of the teacher nonverbal behaviour.
Similarly, the nonverbal behaviour rating score of one hundred eight teachers was
also observed.
The educational performance of the students was composed from the concerned
educational institution. This documentation consist the outcome of the assessment
detained by board of intermediate and secondary education immediately subsequent to
the study gathering.

13
1.7.6 Data analysis
The nonverbal behaviour of every teacher was rated on a rating scale and the
unspoken performance score of every teacher be investigated by summarizing up
rating score on seven different proportions. The average rating score and standard
variation were calculated. Students in every class were 25 to 34; hence, normal of this
figure would be predicted in sequence to get there at single learner gain for every
teacher achieve. This provided a standard data set allowing comparison of one teacher
against one learner. The z-test was carried out to check the disparity among the
average nonverbal gain of a male with a womanly teacher. Similarly, the same
technique was used to come across the dissimilarity among the teachers of
government, private and semi-government schools. The correlation among non-verbal
performance rating score of the teachers on students‟ standard academic performance
during their lessons be compute by means of the Pearson‟s method. The 5%
significance level was used.
1.8 Definition of the Key Term
Some important definitions of the key terms are;
Nonlinguistic behaviors is a communication in which signal is conveyed
through environment, artifacts and vocal intonation.
Students‟ educational accomplishment means academic performance achieved
by students in educational institutions rather than sports or music.
Classroom means interaction between teacher-students learning process.
FIACS stand for Flanders Interaction Analysis Category System. It is a
research tool used for teaching effectiveness in order to improve teachers'
teaching skills for ensuring an active participation of students.
Body language means the unspoken behaviour of body which comprises the
movements of the body, vocal intonations, nonverbal cues, gestures, postures,
eye contact and facial expressions.

14
Kinesics means the study of body language; in different aspects as gestures,
facial expression and eye contact etc.
Facial appearance and eye interactions are the mainly animated medium of
interaction which can facilitate students learning.
Body language used to understand what kind of communication made by
teachers with their gestures and postures.
Eye contact, the most powerful kind of nonverbal signal which is used for the
purpose of emotional relations between speaker and listener.
Posture means the body position of a person that conveys different messages.
Gesture means the motion of body to covey speech of an individual.
Hepatics means the study of touching which refers to how human and animals
communicate with each other via touching.
1.9 Overview of the Thesis
The idea has been set in five chapters‟. Chapter #1 furnished a detailed introduction to
the background and importance of the study, including definition of the key terms.
The problem of the study is the impact of nonverbal behavior of teachers on students‟
academic accomplishments. It justified the research question and objectives, in a few
words summary, the suggestion and implication, and contextualize the research.
Allied writing has been review in chapter 2, which has relatives by way of this study
impinge leading the research hypothesis. The connected literature evaluation has been
accepted on the origin of two concepts: vocal and unvocal interactions. The method
and procedure of this research has been discuss in chapter three which offers careful
details of the methods adopted for the compilation and the investigation of gathered
data. Chapter 4 presents and analyses the data that has been gathered through
observational form that what are the impacts of non-verbal behaviour of teachers on
students‟ educational accomplishments. Chapter five represents a detailed discussion
on findings, bringing in related literature; conclusion and suggestions for further
research of this observable fact.
15
CHAPTER 2
LITERATURE REVIEW
This part of the research is concerned with the review of accessible literature
connected to the study. The ideas and observations of the relative literature provided
not only a penetration but also a theoretical base to the researcher which facilitated to
understand what others are aware of this issue in the same situation. The appraisals in
this research work provide a theoretical design to the study and tinted the diverse
directions of unspoken behaviour on the sources of pertinent text in equal perspectives
i.e. limited and universal perspective. The basic aim of the research work is to
investigate the impact of nonverbal behaviour of teachers on students‟ educational
accomplishments. This chapter focuses on the nonverbal communication of teachers
in the perspective of ideas performance and teaching efficacy. Thus, this section
discuss verbal communication, teaching, learning, , the unspoken aspects of lesson,
nonverbal communication, fundamentals of efficient schooling, Flanders
communication investigation, verbal aspects of learning and review of the associated
literature.
Miller (1988) stated that, communication is a continuous processes of receiving and
sending information that enables‟ human beings to share their skills, attitudes,
knowledge, and effective method of teaching based on successful interactions”. When
students and teachers share information in a particular setting either implicit or
explicit, then communication should occurs in one way or the other. This research
revealed that there are two dimensions of communications; one is verbal
communication and the other is nonverbal communication.
2.1 Verbal Communication
Bedwell et al. (1991) stated, that “Problems arise in spoken dimension, when a sender
and a receiver don‟t share identical ideas, or they use words by speaking together in
different models”. Due to this, it is more essential that teacher‟s especially in diverse
setting, enhance the students‟ comprehension in their respective class. Effective
communication clearly explains concepts, ideas, or simply defines new terms.

16
Sensitiveness to this act becomes nearly second nature as a teachers probe into their
students' understanding.
Wood (1976) stated, “Verbal behaviour may be used to exchange almost everything. In
contrary, the non-verbal movement of body position appears to have a more limited
range. So, it is easy to know and understand that limited range and use it for
comprehending new information.
A body movement communicates emotions, feelings, and the opportunity of choosing
information about occasion, affiliation, and gender and subsequently into view.
Usually, a body movement also support or contradict in sequence convey orally. Body
movements include any part of the body such as rising of the eye brows, nod of the
head, and cues of the whole body”. L. J. Sahe (2009) has discussed that while
teachers‟ have some control on verbal communication but not on non-verbal
messages. Weinstein and her colleagues (Brattesani, Weinstein, & Marshall, 1998)
correlate teachers she called low and high discriminated. These were teachers‟ who
differentiating to a greater or of lower status between their high and low state of
expected students. Weinstein stated that, students‟ educational accomplishment varied
substantially based on in any case, the children‟ were placed in the classrooms of high
or low discriminating teachers. Highly discriminated teachers‟ become attached to a
fixed view of capability, placed students in a courteous manner, inflexible ability
class, discouraged counterpart interactions, vividly differentiated between the
educational activities of high and low performance students, emphasized aim and
goal, and used primarily negative behavior guidance techniques. The low performance
discriminated teachers‟ on the other hand held cumulative concepts of intelligence,
stressed task mastery goals, and chiefly used interest based collection, and an
indicating positive relation between teachers and students.
2.2 Learning
In the light of past experiences, all of us understand things. Really, it is due to
learning, we get an idea of what „learning‟ means in the light of what to do in the past.
For example, we might think that learning as something taking place in a school
environment or in a classroom. We may consider of it as an individual sitting isolated

17
at night, trying to learn a lot of facts. He does all this, so, that he could pass an
assessment examination. However, a series of thought will show that knowledge is
vaster than that. In spite of consideration, children understand a great deal ahead they
go to school. They know speaking and walking. Educational psychologists told that
any movement which tends to a change in our behavior is called learning.
Karban (2015) stated, Learning is the method of acquiring and reinforcing present
information, behavior, skills and may involve in combining different kind of
knowledge. Although, learning skills possessed by animals, humans and plants.
However, human learning is an integral part of personal development, education or
training. It may occur consciously or unconsciously. A common assurance given by
an individual when asked what school of thought is to 'facilitate children learning'.
Santrock (2006) stated that Learning- is comparatively a permanent change in
behaviour, knowledge, skills and thinking, which come from first to last experience.
This analysis is specified by Hummel (2006) in these words, "alteration in manners
the same as a consequence of understanding due to learning".
Behavior may be best explained through observable experience in our daily
life and it cannot be express by psychological process. On behalf of
behaviorists, actions are the whole thing so as to carry out which be able to be
observed honestly. However, intellectual psychologists analyze that
knowledge as a permanent modification in cognitive process on account of
past practice. Psychologists on the other hand explain mental process as
thoughts, feelings and motives. Everyone gains from experience but the
problem is that these cannot be observed by others in true meaning as we have
no clue how all these things happen. Even though we can‟t frankly observe
judgment, way of thinking and motive, they exist no fewer factual (Santrock,
2006). On behalf of the behaviorist these feelings, belief and motive are not
suitable theme for a logical activities as they cannot be openly convenient as
stated by Pearcee (2001). Despite the fact that equally behaviorists and
cognitive psychologists have the same opinion that education is an alteration
because of a past practice; however they focus on noticeable and
imperceptible change and effort in the direction of give details how these
change have effect. The entire justifications are accurate since education is a

18
multifaceted method. Learning about nonverbal behavior and signals may
assist us to reflect the idea we want to present, and make more aware of the
cues that we are to explain or interpret.
2.3 Effective Teaching
Simultaneously, our power of comprehending of what “education” is based on our
earlier period put into practice. Our first practice was in institution, everywhere the
teacher was also a teacher, status an area of interest, impressive us what to be taught
and what to accomplish. Certain of us practiced the identical class of training at
school. Other might have practiced lessons somewhere the teacher is supplementary
of an equal, who take explanation of the learners understanding and yet learn from the
apprentice.
Education may be described as the guidance and discipline of teaching wisdom
process. It is the progress which given that chances for student to create
comparatively enduring change from first to last experience and management provide
by the teachers. Education facilitates wisdom by means of the philosophy of learning
flexibly and creatively. An effective teacher enables the students to learn and
understand the subject matter effortlessly and keep hold of it for further request and
use the same data for comprehending new information.
Santrock (2006) commented, “Effective communication is one of the important
variant for school enhancement. This revision is interested with how to explain
teacher‟s effectiveness and what makes a real teacher. It draws out implication for
policy makers in teaching learning-process and for enhancing class room interaction.
To be an effective teacher it is very important to contain a control in excess of the
area under discussion and in parallel ought to possess essential training skill in
addition to excellent educational strategies supported by instructional planning,
method of goal setting and classroom administration. He should be acquainted with
how to communicate, stimulate and work efficiently by way of students from different
background and should also comprehend how to use suitable skill in the classroom.
These reflections are more explore by Sprinethall and Sprinethall (1994) by introduce
idea of instruction. An idea of instruction comprises series of instructional methods,

19
which are organized to arrive at a specific category of learning result through
students. Although no particular method of teaching represents the most excellent
means to educate. As an alternative, whole usefulness will depend on teacher
competency; foremost to design a particular technique and then to merge inside a
specific idea. Lastly, he will expand the capability to employ a diversity of model. A
teacher‟s effectiveness is commonly referred to in term of a focus on students‟ results,
teacher‟s behaviors and classroom process that promotes better understanding of the
students. This review suggests that effective teachers are clear about teaching goals,
knowledge and information regarding content of the curriculum and appropriate
instructional strategies.
2.4 Components of Effective Teaching-Learning Process
The fundamental elements of teaching that make possible results are the teachers,
students, learning atmosphere. The prime movers of the educational institutions are
the teacher and student. These are the participants of the teaching learning process. A
suitable environment provides essential ingredients that could guide the process
needed for smooth connection among the three elements.
Furthermore, fundamentals of lessons are too connected with effectual learning. There
is a very deep connection between these Elements of teaching and effective learning.
This connection is very well stated by Walberg (1990) through meta-analysis which is
an inclusive appraisal of essentials of training usefulness. For this purpose, he
composed a record of subjective factor. The basics that are nearly too every person
directly correlated to the spoken and unspoken actions of effective teacher in the
school classroom environment are integrated in academic learning time, cooperative
learning activities, use of positive reinforcement, feedback and cues, classroom
environment, and high order questioning. Herring (2009) also held a similar view and
enhanced these by stating the following factors: access and equality, possessing
students‟ responsibility, setting anticipation, engaging students, sharing authority and
improving critical thinking.
Sprinthall (1994) stated, “As a quantitative statistical analysis of several separate but
similar experiments of teaching, there was a raising view of authentic teaching as

20
similar with direct method of teaching”. The Centre on the institutes for explore study
going on instruction learning process at Michigan State particularly generate a huge
amount of researches helping the speculation that gain in educational
accomplishments are frequently affiliated through this technique. Effectively, shortest
method of teaching is highly designed and teachers present the physical objects in
little steps, use move ahead, check used for mental grasp, take the students‟ answers
turn by turn and provide direct feedback on their replies. Moreover, the teachers
accomplish each and every one this at a quick and commerce approximating
swiftness. By close connection, the teacher would use up incredibly small instance, if
another method, as discovery or inductive method of instruction. The study seems
toward hold up ideas so as to communicative lessons is a series of constantly and
carefully monitor movements. Actually, the supposition was that the undeviating
training is suitable for every subject at the entire level. Brophy (1988) stated that one
must bear in mind about inquiry learning and research which suggests when and who
for the direct instruction is best and appropriate.
To conclude, argue was that through via straight lessons, we cannot merely improve
educational accomplishment transversely the board, however too an effective and
individual expansion will be encouraged. During observing the soundness of these
results, it is essential to realize a lot of drawback. For instance, the basic study
objective has been simple schools classroom instead of secondary school. However,
the research work has been limited to specified area at the beginning classes and here
were thumbs down endeavor to engage a factual irritable part of school type, as rural,
municipal, lofty and small socio-economic position and so forth. This mistrust may
exist casted ahead the assertion of the generalizations. Ultimately, the utmost concern
is to facilitate, efficient coaching cannot arrive at concise of telling a on its own set of
teachers‟ behaviour high-quality in spite of subject, for all students and for all that
period.
Towards the end result, undeviating teaching presents simply a fractional image of the
schooling learning process and concern is requisite adjacent to the contemporary
generalization. There are many other practitioners who have the same opinion by
means of in cooperation Cubin and Schulman‟s when describe by way of suggestion
to Sprint hall and they call for more modern view for a broad concept. The study on
21
schooling attempt to focuses going on only a single variable on time, because, if it
was being within the limits of ability to concrete teaching framework. An instruction
is communicative and involves amalgamation of numerous variables sooner than
achievement through very soon an only one variable. The record indicated that not
each and every one of the educated performance continued to correlate with the
achievement gains. Similarly, several of the new educators didn‟t constantly exercise
the arranged outline. Furthermore, it also showed that not all of the arranged activities
were compulsory for enhanced accomplishment. In additional, a fine grained
investigation of assert cannot hold up the contention of the nonstop instruction. The
last and the for the most part was the absolute deficiency of presumption to give
details the feelings. Exclusive of hypothesis, there is small to direct carry out and
there is no organized system to make clear the inconsistency in the behavioral
explanation. Finally, a transparent ending is that, dynamic training provides a few,
other than all answer to the difficult problems faced by teachers for effective learning.
We can see that effective teachers don't rely all the time only on opening book and
being able to convey the information they prepare. In order to be effective, teachers
use contemporary data in science subjects, social studies and arts subjects to help the
students see the value of the information they are learned.
2.4.1 Nonverbal Communication in the Class
The class is the area of perpetual interaction among students as well as teachers.
The role of teachers is near to make easy and encourage students towards academic,
social and emotional developments. The teacher responsibility is the overall
development of students is greater in the lower levels, narrowing down in higher
level. Apparently teachers‟ and students share their educational aims and would act in
simultaneously to achieve them, but the individuality and psychological complication
of the class room reject this pleasing image. The class room is most often an area of
continuous struggle, teachers and students have to hope for particular purposes, and
classroom supervision is very much difficult effort a. Teachers have the constituting
authority and capable of being presumed power, but students‟ are not inevitably
impotent in their continuous struggle with teachers‟ and they can make life
complicated and lonely for the teacher. Approximately another hierarchical living
organism system, particularly human systems a different emotion, positive and
22
negative emotion are expressed and experienced in the classroom interaction. Much of
this emotional disorder is observed via non-verbal channels, with conscious or
without awareness of the teacher or students. Larger nonverbal sensitivity converted
to intelligible form would support teachers an intensive understanding of the
emotional hidden opinions in the classroom, and possible them to be more valid and
reliable in the class room smoothly. The main aims of education are the scholastic
achievement and cognitive development, and as far as educational accomplishment is
concerned is the verbal communication that is most important in education. Thinking,
curriculum, didactics, cognitive process writing, and reading are all constituted
through the use of body language and verbal communication.
In that context, the role of the nonverbal communication in education is secondary.
But the nonverbal behaviour is the critical factor in the delivery of teaching,
mediating teachers‟ success in achieving the basic goals of education. Whereas less
competent teacher most often fail in their nonverbal communication delivery, whereas
valuable quality in teaching is always portray by teachers‟‟ positive effective style
(Babad, 2009).
2.4.2 Students Non-verbal communication Teachers as a Detector
Teachers‟ nonverbal behaviour perceptiveness and their skill to convert into
intelligible form nonverbal cues in students‟ communication are discussed first,
disconnecting between classroom administrations and learning related process.
Students nonverbal communication provides teachers‟ with continuing feedback,
if they can determine it and interpret it rightly. Much of the effective teaching is carry
on through teachers‟ students interrelation, either the teacher leads guides or asks and
students replied, or students ask or act and the teachers respond.
An effective teaching the teacher needs cues indicating students‟ level of
comprehending. Because students (especially weak students or mediocre), hate to
allow when they do not reach to the conclusion, the teachers need their nonverbal
communication to give the required cues. Tricky teachers find out dearth of
understanding even when unchallengeable students‟ claim to have truly understood.
Students‟ nonverbal behavior also gives the teacher with information about their
attention and their level of motivation at any given process of moving.

23
Teachers‟ interference can become more authoritative when they have command on
such knowledge from the sure origin. Much as students require refined cues from the
teachers‟ to understand how smart they are, teachers need nonverbal communication
from the students to rectify their teaching behaviors‟. Because the teachers
communicate with different students at any time, their nonverbal behavior gives the
teacher with different movement to indicate where other students are at a given time,
and who requires what at any point. In this way; teachers can relate the students who
need distinctive help. Teachers‟ nonverbal ability and finding ability assist them to
attain essential feedback from students‟ nonverbal behavior in the social domain.
Classroom atmosphere and students‟ feeling can be detected from nonverbal cues, and
implicit stress can sound a signal in real time for research and hopefully precautionary
(Babad, 2009).
2.4.3. Teachers’ non-verbal communication; Students as a Detector
Students extend a considerable proportion of their life in the classroom. The setting is
imperative instead of democratic, many requisite are made, and they are awfully
based on the figure in authority; the teacher. It would be greatly helpful for them to
pick up to judge their teachers deeply, to development-experts, able to
decode the craftiest nuances of teachers‟ behavior. Because often messages are not
communicated verbally and clearly, students become experts in comprehending
teachers‟ nonverbal behavior (Babad, 2009).
2.5Nonverbal Aspect of Teaching
It is a matter of fact that we use body language all the time. It is not possible to
communicate some idea, though, or impression with others without any contact.
Nonverbal communication has a wide range and can include gestures postures,
shaking hands, facial expressions, appearance, voice tone, hairstyle, clothes, smiles,
touch, artifact, color choice and (even) silence. All these are important elements of
teaching with efficacy. To an incongruous, the unspoken feature of an individual is
subsequently observable that teachers frequently take it for granted and usually ignore
it. Actually, in anticipation of the effort of theorist such as; Galloways (1977), the
vicinity of nonverbal communication was extremely unobserved in schooling learning

24
process and no attention was paid to its effectiveness by teachers inside their
classrooms. Despite the fact that it is very rigid to visualize yet from seventy to eighty
percent of a messages affect is communicated non-verbally.
Generally, it was proved that most of the messages are communicated non-verbally.
The spoken communications turn out to be less significant than gestures, postures,
pace of talk and facial appearance. In the class environment how the teacher sits or
stands using postures and gestures convey a message to his students. However
unhappily, as Galloway‟s point out, also frequently, we are approximately completely
unconscious of our personal nonverbal etiquette. We hardly ever observe ourselves in
communication and therefore don‟t actually appreciate what effect we may possibly
have lying on others (Sprintahall, 1994). Really the production of literary work
suggest that body language, eye contact and mimics are generally used for having
grasp over and keeping muteness at secondary level, other than higher level students
denoted this aspect of nonverbal behavior.
Researchers have revealed that teachers who encompass absolute attention towards
the community really place a vital position of accelerating non-verbal behaviour to
reinforce students' involvement and participations. Those who have negative attention
lay out non-verbal communication designed to inhibit and discourage the students'
participation (Smith, 1981). Moreover, Sprinthall and Sprinthall (1994) stated that the
kids unspoken the significance of diverse physical movements and might understand
the teachers' facial language similar to release manuscript.
During classroom interaction between teachers and students, the exchange of
information may occur exclusively at the verbal level, but it does not mean that
nonverbal cues will not be included. In every case of communication a freight-age of
meaning is interchanged at the nonverbal level also. There are a large number of signs
and signals that serves the purpose of what we might phrase unspoken
communication. It is this nonverbal language from which conclusions may be
formulated because students unconsciously tend to read the meaning of the
expressions. Sometimes, a glance of an eye or a facial expression may reveal what the
actual me meaning is. Indeed, a message communicated in this way may be quite
informative and easy to understand.

25
Consequently, Galloway‟s and his associate developed a non-verbal description of
Flanders‟s scheme. As an alternative of code spoken communication, but, they rate
the body movements of the teacher as described below.
Table-1: The Galloway System of Nonverbal Behaviors
DIR
EC
T IN
FL
UE
NC
E
1 and 2. Congruent
Non-verbal behaviour is compatible with
verbal. No mixed message is given. Body
language substantiates suitable set of
feelings.
3. Implement
Whenever the teacher takes and accepts
ideas of students, non-verbal cues are
constantly unhesitating. For example, leans
in respect to laugh
4. Personal
A teacher keep up direct eye make contact
through the class, and preserve an easeful
psychological spacing from the students‟.
Incongruent
Behaviour authenticates words,
e.g. laugh when upset. Body
movement is more than restricted.
Thoughts are occasionally, if
increasingly revealed.
unthinking
Nonverbal behaviour shows no
bona fide attention in students‟
idea. e.g. Bored facial expression.
Impersonal
Teacher avoids face to face
communication. For example, he
looks towards the ceiling, or
discussion to the bottom, or
maintain unnecessary aloofness
from the students

26
a. Observation 1 & 2 combined by Galloway
The over classification outline the key essentials of the pattern of message that are
distributed interested in two chief arenas, non-verbal communication that promotes
students' development and constrict their expansion. Galloway too prepared the
unspoken category according to their direct and indirect control. The fallout of
Galloway‟s study has implication which involves a basic requirement of obvious and
comprehensive relation among a teacher nonverbal cues and the class feeling which
ultimately should set classroom tone. Moreover, teachers could do with to construct
an intentional effort to turn into extra conscious of their own necessary collection of
non-verbal behaviour. Zwozdiak, Capel,Leask and Turner (2005) stated that much of
communication between teachers and students takes place as in the form of nonverbal
as gestures, postures, appearance, facial expression and mannerism.
In this connection, the make use of videotapes of class presentation is one most
important method of fast attentiveness and considering the effects of teachers‟
IND
IRE
CT
AF
FE
CT
5. Reactive
Tone of voice and pace of talk of the
teacher are attempted to observe students'
participation.
6. Involve
Non-verbal behaviour provokes students‟
involvement in justifying direction.
7. Comfortable
Non-verbal cues are consistent and
coherent with firm language in controlling
misbehavior.
Unresponsive
Teacher speaks in a monotonous
tone with little bit change in tone
with a high pace of talk and
protected students' movement.
Dismiss
In non-verbal behaviour, students‟
escape participation.
Rigorous
Nonverbal behavior is an
aggressive, terrible, severe and
really discouraging.

27
behaviour. A teacher will become well aware of the importance of his nonverbal
signals once he analysis later on in the form of a video clip. Another method of
investigating the nonverbal signals inside the classroom for later analysis is to inquire
an important person to watch and mark down example of how your performance keen
on the Galloway‟s classification. Let us observe the hypothetical idea of nonverbal
message in universal and inside the classroom.
2.6 FIACS-Flanders Interaction Analysis Category System
This strategy was developed by Flanders at University of Minnesota between 1955
and 1960. It is a mode of observation in which classroom interaction records was
distributed in ten categories. This technique only measures the verbal communication
of teachers‟. This methodology was developed by Flanders related to children' posture
of teacher influence. Interrelationships is initially concerned with analyzing the
important patterns of the teacher, and understand those respond of the teachers, which
increase students‟ freedom of reaction from those response that decrease it. The
system of categories shape a screen in front of observers eyes, in above those respond
which result in compliance are sharply separated from those that invite more creative
and spontaneous involvement, while certain appearance of content are neglected.
To draw conclusion, how the components collectively added clearly, and the effort of
Flander (1970) is critical. He as well as his colleagues made far-reaching class
explanation of teachers at unusual and transversely diverse content area. He
establishes that teachers' conversation behaviour can be separated into seven
categories. The classification symbolizes the mainly generally pragmatic teaching
behaviour which brings us to the query. 'What is the relation among these behaviour
and students‟ educational accomplishment? Really, the main analysis of Flanders
work was completed by Gage (1978) into his manuscript, "The logical basis for the
ability of teaching". In order to have clear idea of those categories it will be helpful to
discuss them at some length.

28
Table 2: Classification for Flanders communication Analysis IN
DIR
EC
T I
NF
LU
EN
CE
OF
TE
AC
HE
R T
AL
K
1. Accepts Sentiments
In this classification, teachers accept the impression of students‟. He perceives
himself that the students shouldn‟t be criticized for exhibiting their heartstrings.
A student is given the opportunity to express his/her feelings without the fear
that what will be the reaction of the teacher. This acceptance of feelings on the
part of the teacher encourages the students to express what they feel about a
particular situation. However, it must be noted that the emotions could be
appreciative or unenthusiastic.
2. Praise or accredited
Teacher support students‟ communication. When a student gives response to the
question asked by the teacher, the teacher gives positive underpinning by saying
words like „correct', 'excellent', 'good', 'very good', 'better', 'carry on', etc. It is a
kind of feedback in positive manner. Even if the response of the student is not
right or if it needs modification, the instructions are given in a positive and sugar
coated manner to encourage the students.
3. Accepts notion of students'
The first category is justified. The students‟ ideas are only appreciated not his
impressions. Here, the rational element of what the student says is stressed and
judged. Students are given opportunity to freely present their opinions, views and
perspectives regarding a given topic or situation. If a student proceeds on some
idea, then the teacher may iterate in nutshell in his own words. The teacher can
view, I comprehend what you mean? The teacher develops ideas given by a
student.
4. Asking Questions
Inquire questions about procedures which are depends on the teachers feelings
and then expecting response from students. Occasionally, teacher interrogates,
but he carries on his lecture without ratify any answer.
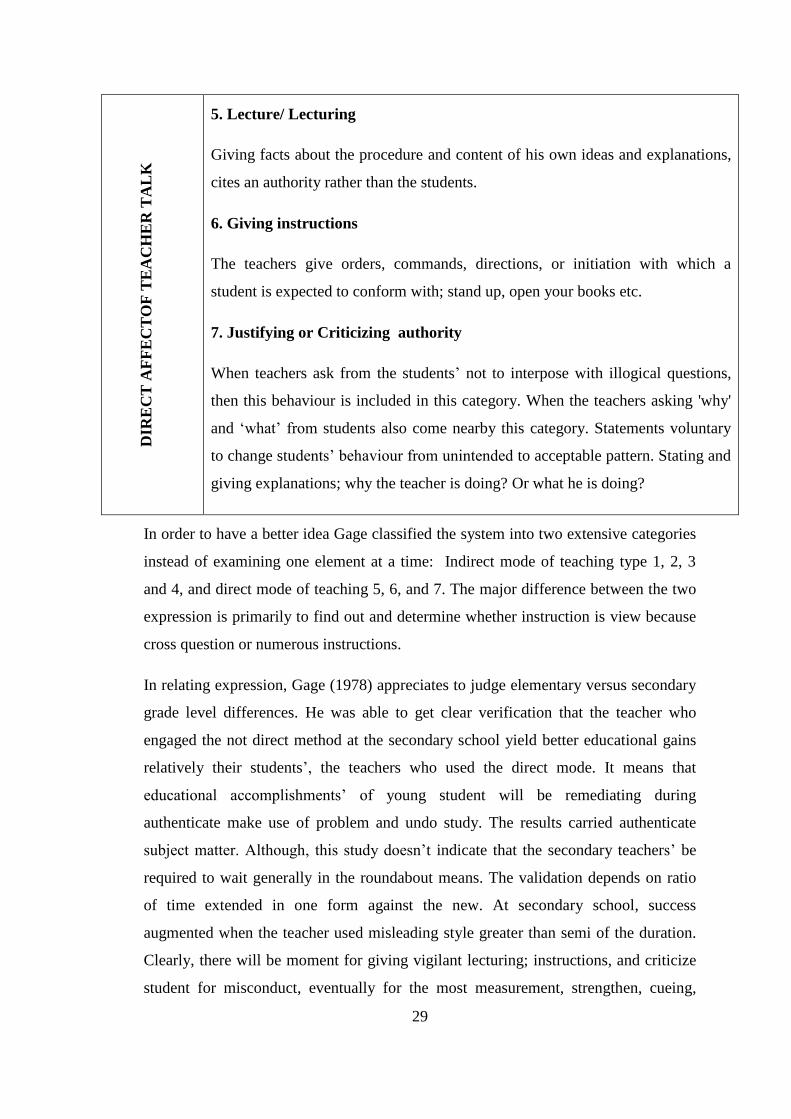
29
DIR
EC
T A
FF
EC
TO
F T
EA
CH
ER
TA
LK
5. Lecture/ Lecturing
Giving facts about the procedure and content of his own ideas and explanations,
cites an authority rather than the students.
6. Giving instructions
The teachers give orders, commands, directions, or initiation with which a
student is expected to conform with; stand up, open your books etc.
7. Justifying or Criticizing authority
When teachers ask from the students‟ not to interpose with illogical questions,
then this behaviour is included in this category. When the teachers asking 'why'
and „what‟ from students also come nearby this category. Statements voluntary
to change students‟ behaviour from unintended to acceptable pattern. Stating and
giving explanations; why the teacher is doing? Or what he is doing?
In order to have a better idea Gage classified the system into two extensive categories
instead of examining one element at a time: Indirect mode of teaching type 1, 2, 3
and 4, and direct mode of teaching 5, 6, and 7. The major difference between the two
expression is primarily to find out and determine whether instruction is view because
cross question or numerous instructions.
In relating expression, Gage (1978) appreciates to judge elementary versus secondary
grade level differences. He was able to get clear verification that the teacher who
engaged the not direct method at the secondary school yield better educational gains
relatively their students‟, the teachers who used the direct mode. It means that
educational accomplishments‟ of young student will be remediating during
authenticate make use of problem and undo study. The results carried authenticate
subject matter. Although, this study doesn‟t indicate that the secondary teachers‟ be
required to wait generally in the roundabout means. The validation depends on ratio
of time extended in one form against the new. At secondary school, success
augmented when the teacher used misleading style greater than semi of the duration.
Clearly, there will be moment for giving vigilant lecturing; instructions, and criticize
student for misconduct, eventually for the most measurement, strengthen, cueing,
30
employ problem, and replying to perception will yield educational gain to a better
quantity. The importance of nonverbal behavior increases many fold when it comes to
indirect method in the above mentioned model. Nonverbal behavior plays a vital role
as a feedback for accepting the feelings, encouraging them, allowing them to present
and elaborate their ideas etc.
Additionally, to this approach of teaching, Chickering and Ehrmann (1996) conducted
a list of self-dependent research at higher level. Whereas, the concrete Flanders‟
taxonomy was not used, the whole outcomes were all together alike. The college
scholars initiate that professor who provided occasion for students‟ question,
authorize students‟ to asking problem from one more, and encouraged student to craft
assertion in the classroom nourished intellectual development and better intricacy of
opinion on behalf of their student. However, outcomes from mutually lofty and senior
classes indicated the content of the not direct method of teaching when it was utilized
by older students.
At secondary school, Gages‟ investigation indulged slightly different conclusions. He
set up subordinate coordination among the coded method of teaching and students‟
wisdom. There were a few unchallengeable results in the coded method, other than
numerous in the direct approach. Really, contemporary study particularly, at
secondary school, recalls indicating the more direct approach to teaching may be
completely important in yielding students' accomplishment (Gage, 1978).
The impressive secondary school teacher involuntarily to ask question from the
students, encourage their responses, construct their idea about the topic, and reply to
their passions. However, he may use their direct mode. The vigilant make use of
progress organizer along with a small degree of vagueness on the part of the teacher
provide smaller children‟s with helping direction for education. In this connection,
complete representation of teaching come the same as next stage of generalization in
observe to lessons.
2.7 Nonverbal Communication
Crable (1979) stated, “Nonverbal behaviors engage the intentional or unintentional
techniques of converting message into intelligible form. Encoding is the process of

31
generating information such as body language, gestures, facial expressions and
postures. It manipulates signals which probably think to be multipurpose. Decoding is
the explanation from generally accepted perception given by the encoder. Decoding
data apply wisdom one may have of certain received feelings.
Elisha Babad (2009) demonstrates the unique implication of nonverbal behaviour in
multifold side; its availability to observers, its links to feelings, control nature, its
speed, and the fact that it conveys special meanings.
Knapp (1972) also stated that nonverbal behavior may be considered all those human
reactions which are not found in verbal. Miller stated that “it consist overt behaviors”
as it is a facial expression, tone of voice, touching, eyes, like less clear messages as
postures, dress and special distance among two or more individual. Miller showed that
nonverbal behavior is not limited to a specific time. He maintained that the nonverbal
behavior which is learned shortly after birth is refined and practiced through the
individuals‟ entire life. However, nonverbal behaviour is a difficult process both as
communication and behaviour, whether conscious or unconscious (Hickson & Stacks,
1993).
Message is convey of information among the sender and a receiver by means of the
purpose of allocation of information, ideas, thoughts and experience. Even though we
categorize message only with respect to verbal communication, while, practical
communication can be defined in two dimensions termed as verbal and nonverbal.
Nonverbal behaviour is that behaviour of individuals, which is unspoken but should
involve gestures, postures, facial expressions, body movement, eye contact, and pace
of talk, moving and pitch of tone and a smaller amount understandable means but
more observable like dressing, posture and spatial distance between two or more
people. It is a fact that the whole thing communicate, counting substance, bodily
distance, and the moment in time. Though we are able to turn off the verbal output but
it is almost impossible to turn off the nonverbal output. Even silence also speaks.
Activities, words, silence and inactivity each and every one have significant
communication to affect other, or to instigate positive events in relevant context. Thus
all the elements through which we stop verbal signals themselves communicate in
nonverbal signals (Segerstrile & Molars, 1997).

32
Additionally, Segerstriles and Molars (1997) argue that individual who has ear and
eyes to listen and see could encourage himself that keep a covert is one of the nearly
entirely complicated responsibilities. If his mouth are uncommunicative, his rambling
conversation through his fingerprint; change in sequence flow exclusion or
deprivation. Non-verbal behaviors‟ starts with delivery and get sophisticated with the
means of access of time during one's existence. Initially, one learns the unspoken
interactions during simulation and this learning phase of non-verbal behaviour is
further obvious during early days. Nonverbal message are used as a; plain and
consistent, further proper mode of appearance, dominant gesture potency, partial
terms and new authentic and reasonable. However, it has been observed that
nonverbal behavior helps in communicating much more intentions and feelings as
compare to spoken only. Mehrabian and Wiener recommended that language only
give to seven percent of the message, while remaining ninety three percent is being
transmitted through nonverbal expressions. So, it is evident that one must be aware of
the significance of nonverbal signals while conveying a message and must be aware
how to utilize these signals in the best possible way in order to make the message
easier to understand.
2.8 Nonverbal Behaviour in the Classroom Environment
Segerstrile and Molars (1997) defined nonverbal behaviour as a judgmental aspect of
interpersonal conveyed information which takes place in the classroom environment.
This means that it plays a very critical role in explaining the message we want to
convey to the students. Where, Galloway explored educators as involving several
psychological senses who can only talk sometimes. Hence spoken language is not the
only source as it is normally believed. Majority of the input and output are explained
consciously and unconsciously in the light of nonverbal cues. Blazer revealed through
his research that about seventy five percent of the working in classroom is nonverbal.
So it becomes very pertinent that a teacher is mindful of his/her nonverbal signals and
he/she consciously try to codify his/her message in nonverbal signals. Smith reported
that teacher nonverbal behaviour denoted the mental status of the teachers to student.
This definition takes the value and the role of nonverbal signals a little further. A
teacher is explained and revealed to the students through his/her nonverbal signals.

33
This helps a lot in developing and strengthening the interpersonal exchange of
information between the teachers‟ and students as well as explains the message.
Rosenthal and Jacobson (as cited by Segerstril & Molars, 1997) in “Teacher
opportunity for the deprived” recommended that there are chances of the negative
effects of nonverbal behaviour where in some cases teachers may develop some false
expectations about their students, and in many cases the students may also develop
wrong ideas or thoughts about teachers, or may be wrong in judgments by observing
the teacher‟s nonverbal behaviour. This shows that relying blindly on nonverbal
signals is not free from dangers. If the teacher is not conscious of his nonverbal
signals then it can result in some dangerous misunderstanding. Ekman (1967)
expressed that there are certain elements like facial expression, physical atmosphere,
body movements‟, vocal cues and gestures, physical attractiveness, touch and dress
which play a major role in occurrence of nonverbal communication in the classroom.
A brief detail of each of them is given below;
2.8.1 Gestures, Postures and Body language
The most encompassing means of nonverbal communication as well as the most
complicated to manage the current information to other is during actions and gesture.
These movements and gestures are made by the body parts which include face, eyes,
hands, legs, arms, and rest of the body parts. It is expected that presently there are
above two lac bodily motions capable of moving meaning in other person. A simple
example is that of eyebrow, where there are twenty three different gestures, each
suitable of enchanting a diverse implication.
The movements and posture of the body are used clearly by an individual‟s to
articulate their attitudes and make clear or communicate the messages in accurate
correspondence and courage which are not easy to be masked. As we recognize that
nonverbal message is unaltered by the attendance of sound because their gesture to
sound ratio is greatly other than message using terms which finally outcome in
towering information tariff in evaluation to vocal message. It is usually taken for
granted but) message is universally. We express communication to others throughout
our pace, the mode we place and the means we be seated, our body talking also

34
denotes position or wanting another person. A more positive attitude is almost directly
proportional to direct orientation.
Body actions and attitude perform argument directly to the verbal and enhance the
listeners' capability at large. If, on the other hand, the body movements and postures
do not match with the vocal expressions, subsequently the outcome infer can be a
muddled picture. This is where the importance of nonverbal signals comes to play for
a teacher. If the teacher is not able to make any correspondence between his body
movements and the output then it may give a distorted image of the message to the
students. On the other hand, if there is a visible and fine link between the nonverbal
signals and the output then it will serve as additional context in the light of which the
message can be understood well and easily.
2.8.1.1 Gestures and body movements in the class
In class actions of information to the learner be able to communicate by various
behavior and resources everywhere. Nonverbal message has participated most
important part and has an enormous end product on inter-personal awareness. The
body movement of a teacher throughout the lecture in the class convey a big contract
of observation to the student e.g. if an instructor, while teaching in the classroom
twitches to students then he is not likely to be noticed as a well-balanced individual.
Whereas teachers who consistently come out to be calm always of the conclusion, is
expected to be observed like a snap and introvert and most excellent understand by
the students (Gullberg & McCafferty, 2008).
Coulson (2004) stated, “Self-assurance, liveliness, tiredness, or position is quite
obvious from the body postures and movements. Often, a teacher can also evaluate
students' extravagant hope and expectations through different messages of nonverbal
signals such as a student who moves his hands, twists his fingers and rolls his eyes as
compared to the students who is attentive and sits erect in classroom.
2.8.1.2 Gestures
The area of gestures is very vast and deep. Different researchers have observed
different kinds of body movements, hand movements and facial expressions. Cassel

35
(1999), in his research, “Embodied Conversation” narrated gestures as a vital part of
flexible flow of the exchange or in new viewpoint we know how to speak that signal
help in clarifying, or replacing a verbal message, E.g. single node of the skull, open
and close the eye, waving of hand preserve express the necessary communication to a
learner in class also to maintain his movements or end.
2.8.1.3 Posture
A particular posture of the body can convey or explain the message very much.
Different researchers found and pinpointed different postures and their significance in
conveying and clarifying verbal messages. Friesen and Ekman (2008) stated that, the
teachers-students relationship, attention towards each other, effective method of
teaching, understanding, warmness and other numerous variables linked to class
behavior be able to best take out from individual attitude. From his research he
discovered that postures convey an overall impact whereas, particular emotions are
better communicated through body and facial expressions.
2.8.2 Facial Expressions
Words are mere words and bundles of confusion if they are not accompanied by facial
expressions. Kocher (1992) stated, “A picture is worth a thousand words". It helps in
effective description of the meaning being conveyed and well delineates the meaning
of relating to the face expressions. Face appearances like skin appearance, muscle
tone with regard to color, and eye flush exhibits endless signal that disclose best in
sequence pertaining to individual period, gender, contest, racial and position.
2.8.2.1 Varieties of Expressions
Meaning is what we feel a particular emotion or attitude about it that particular word.
In this connection, Hexby and Hoffman (2002) in their study going on “Human
nervous system for face identification and extroverted contact” established a general
scope of facial movements probable on a person expression and do this in an
organized mode. Along with this there is a second set of facial cues-which is less
permanent comprising of hair length, their style, cleanliness, and facial hair related to
ones thinking about beauty.

36
There is another group of facial makers as well which may be termed as momentary
expression signal or the third group of facial makers which actually brings a change in
forehead, eye related expressions including rest of the face like wrinkling the brow,
curling the lip and raising the eyebrows etc. Some of them are either visible, while
others are transitory. But both of them possess the capability to add strength to the
verbal and transmits cue regarding attitude and emotions. However, some of them
willingly enhance the verbal communication and communicate expressions through
attitude and emotions.
2.8.2.2 Face Talks
Face brings exposure about the trait of an individual and gives a communication
regarding rather inside to the expresser. If we compare appearance in terms of
expression and non-verbal communication, then we can find that expression pertains
to the alteration of image model ended time, however as fixed image will brief
information about someone's mood or at least sentiments can be extracted quite
obviously, hence we can say that the face can express relatively fixed uniqueness
clearly termed as physiognomy (Gullberg & McCafferty, 2008). The idea of facial
appearance has three basic elements which thus includes;
A person‟s trait that is represented is called signified. On the other hand we have a
Signifier that is a diagram pattern which symbolizes this trait, the material expression
used for the appearance of this characteristic that is individual's skin, eye and muscle
movements, wrinkles, lines, blemishes on face or forehead etc. and in last perceiver,
the ones that observe and understand these secret codes (Hager, 1985).
Facial language has many dimensions. They could be premeditated or accidental in
addition they might be unconscious signal, or too be controlled depending upon the
circumstances. The mope, raised eyebrow, open mouth, jutting cheek, and mock are
facial language that be able to exchange a few words and directly transmit artifact.
The entire human beings are suitable to manipulate a smile, a pleased frown or a
gloomy face.
37
2.8.2.3 Facial expressions in the class room
Within the class environment both instructor and learner exchange non-verbal
communication with each other all the time. This change of communication could be
consciously as well as unconsciously. Teachers should update themselves of the
utilization of unspoken contact owing to two basic grounds; first, to be enhanced
beneficiary of learner communication and ultimately increase the capability to
retransmit optimistic indication that will surely support learner understanding, and
secondly, attractive new intellectual and skillful at keep away from unenthusiastic
gesture that help in stifling student learning (Ekman, 1994).
Facial expressions may be used by the students in the classroom to convey their
feelings to teachers related to understanding, speed of lecture, or even ask teachers to
change their method of teaching. Just before be present a solid recipient of learner
communications, a teacher should be positively flexible and well-adjusted with the
classroom vicinity and be able to grasp a lot from minor nonverbal communication
that their students send.
Apart from being good receivers, it is also very much significant for the instructor to
be high-quality nonverbal communicator because both attributes have equal
importance during the different phases of classroom instructions. Teachers express
confidence, enthusiasm, assertiveness, warmth, and anger during facial language,
spoken inflection, gesture and use of gap. Whereas, once the teachers display spoken
communication, students become confused which can have severe implications on
their learning accomplishment.
Hall and Knapp (2001) stated that “the entire community together with teachers and
students create use of facial appearance to shape imitation of other”. As we are aware
of the fact that a freeze hard aspect has lengthy in the sort of instructor arms which is
often used. Similarly, a smile may have an accessible tool in establishing the behavior
of the students. Teachers can also predict a lot as feedback from students facial
movements which may be quite valuable for adopting future course of actions. For
example, while delivering lecture a teacher can make out when he should speed up,
slow down, make lecture interesting, or generally change his lecture to be more easily
understood by the students. This all can be known from the face reading of the

38
students during the lecture. Intellectuals who are involved in the study of facial
expressions interrelate to the very small momentary movements or alter in the
reflection that consistently take place in all individual senders, and are generally thus
transitory that they require greatly peculiar to be equipped separate them for study.
Yet, as they precede diagonally the expression of an individual, they are immediately
to take hold and lift up by others and get the desired reaction. When teachers are in
communication with their students then the improving the appearance of the face can
serve as reinforcement to the students or even a non-reinforce as well. As a matter of
fact, teachers have very less control over such very small momentary gestures, but at
the same time they must be capable to manage more enduring articulation such as
sneer which will ultimately serve the purpose understanding of teachers by the
students (Jabon, Ahn & Bailenson, 2011).
2.8.3 Eyes
Eyes are the most distinctive feature of facial expression. From this expression a very
clear and comprehensive source of exchange of information takes place between
teachers and students in school classroom environment. Much obvious information
like shifting and evasiveness, guilt, hate, fear, or love, expressing confidence, and
support etc. all are depicted quite easily through eyes. Eye is also well thought-out to
be a key deciding issue in interpretation of verbal expressions and helps to a great
extent in conversation of dialect exclusive of any require of vocabulary. Eyes can be
termed as the most reliable means of message in gap to the communication
transmitted through speech. Most of the people in our society bearing congenial
acceptance by knowing the eyes of others and try to extract as much information as
possible.
Optimistic or unenthusiastic side is able to easily sense from eyes. Visualization is
used longer for belongings and community whom you resembling more than the ones
whom you hate. A teacher who uses frequent eye contact is likely to be observed as
more self-reliant, credible, professional and honest. Usual eye dilation is involuntary
but when bearing at acceptably agreeable then the pupils of an individual will tighten.
39
Furthermore, eye behaviour is also prejudiced by bashfulness and unreservedness
personality of the qualities.
2.8.3.1 Behavior of Eyes in the Class
Eye behaviour well shows the category of message between teachers and students in
class events. This eye behaviour is well obvious once a teacher asks a question in
classroom. The students who know the reply will try to seem into teacher eyes while
those who do not know the answer will try to avoid the teacher. Jeckeer, Maccoby and
Brietrose (as cited by Ekman, 1967) in their field of study hidden visual feelings by
learner which appeared to connected through address content understanding and also
highlighted that those instructor who can conceive these visual cues get more
accuracy while judging their students as compared to those teachers who lack this
capability.
The study results of Breede, Christiansen and Larson as cited by (Ekman, 1967) also
highlighted that illustration cues or contacts among teachers within classroom
increase the student‟s attention; increases his aptitude, his understanding of lecture
contents and ultimately improvement in grades. Normally those students who have
greater extent of eye contact with teachers usually get better grades in class tests and
quizzes.
In the same context, Exline (1971) reported through a survey conducted with college
students. According to that study, once students were asked to have interactive
communication with teachers and only 50% of students liked to have inter-active
message by means of teachers for improved sympathetic and idea buildings as
opposed to hundred percent of the moment in time or not at all.
Additional study highlighted that only those students who are self-assured, well-
informed and paying special attention favor to have hundred percent of eye contact
time with teachers. While opposite is the case for a speaker in having epidemic
difficulty among knowledge, self-possession or concern for students or he is not at all
well prepared for the lecture. Inter-personal communication can also be forbidden
during contact. Once community don‟t want to be disturbed during their speeches
they will just have a glance either at audience or on side walls of lecture hall and will

40
continue with their proceedings and once they want to have some interaction with
people sitting in front, they will just pause and will try to have direct eye contact with
them (Brent & Felder, 2000).
Teachers also try to extract maximum information from the eye contact of the
students to differentiate between students who are well prepared and who are not.
However, some interesting information can also be extracted by teachers to confirm
which student is lying or not caring regarding assignment completion or homework. It
is also a matter of fact that the dishonest person will never look into your eyes.
Moreover, wrong perceptions may sometimes be made due to less eye contact by
teachers about their students and sometimes students may be blamed for cheating
related activities if they have less eye contact with investigation teams dealing the
cases. Unhappily, there seems to be marginal validity to this generalization.
However, it has been revealed through research that it is totally reverse of the fact
about factual community who are lying are usually create to have an excellent eye
make contact among researcher, possibly as an intentional answer to the concept.
Teachers on the other hand can have direct eye contact with individual students in
class. Attitude of familiarity, acquaintance, unfriendliness, or unresponsiveness can be
incidental by the means a teacher observe or keep away from come across at a
student. Normally, the trained teachers do come to know about interest of the students
in ongoing lecture. The eyes of the students are a big source which conveys
tremendous amount of signals related to pay attention and non-listening
communications, thus exchanging delicate communication about their be short of
engagement or bareness for the lecture contents. Students having fixed their eyes on
the clock may require break either because of dullness of the lecture contents, or
because of the lack of teacher‟s motivation and preparation to ensure involvement of
students. In any case, eye observation can be used in evaluating teachers‟ and
students' performance behavior. Teachers' coordination, motivation and preparation of
the lectures ensure enrolment of the students and a teacher will succeed in this only
when he is able to develop clear understanding with the students. This understanding
is ensured more smoothly and easily through the exchange of nonverbal signals. In
any situation, eye contact may be used in assessing and evaluating performance
behavior of teachers‟ and students‟.
41
2.8.4 Touch
Emotional support, tenderness and encouragement can be expressed via touch. Parents
prefer physical emotions for their children instead of verbal emotions. Physical means
of exchange of information can tend to useful function in the class room environment
but needs to be utilized carefully. Touching behaviors may be demonstrated by
teachers whichever by immediately realize a few learner workings, by hand over, or
by grasp the shoulder or arm of a badly behaved learner. However, touching in some
cases may lead to inflowing the student freedom undesirable. Similarly, touching may
lead the students towards highest level of goal achievement as far as brilliant students
are considered, whereas the naughty students may develop negative feelings due to
this and may consider it some kind of intruding.
Miller (2000) stated that “Positive aspects of touching are considered as reinforce”.
Invading the students‟ personal space by teachers may help in developing a close
relationship of encouragement and really enhance learning abilities. One up to date
research has indicated that for children employing such behaviour by teachers tend
them to learn extensively extra and this augment interest and attachment in classroom.
Whereas, with the passage of time as kids grow up, these moving actions losses their
deep impacts.
Touch has diverse contact in the class and depends to great extant on sex and age of
the students‟. To continue an irregular touch on the reverse and hand shaking might
demonstrate to be authoritative for older students to some extant but in case of young
children, touch or contact participate a key part. It can correspond, logic of fit in and
comprehending to an adolescent. Similarly, if teachers deliberately refuse contact a
teen can experience rejected or inaccessible, which know how to guide to the
development of neglect feelings in the direction of studies but most probably about
(the) teacher.
Miller (2000) also stated about touch phenomenon in elementary students as kids in
the junior elementary position make use of touch to learn things about atmosphere.
This phenomenon of touching is not only limited among youngsters to each other but
they also tend to touch teachers‟ clothes and hair as well. For this purpose, the teacher
needs to be vigilant to interpret students touching behaviour depends on the elder

42
touching usual norms. Teachers need to understand that these are well put
enlightening fluctuations and must be outlook. Though at elementary school level,
touch is considered as a reward by students but as students promoted from junior to
senior high school, variations occur that needed change of teachers‟ behavior.
When it comes to gender differences the teacher should be very much careful about
touch behavior. Due to set cultural norms it can result in negative outcome. Touch as
an encouragement at this moment may be misinterpreted greatly, especially, by other
people who just keep to. It is this gender sensitivity which compels male teachers to
avoid making use of it with female students and consider it inappropriate which may
not be considered well appreciated among students.
2.8.5 Vocal Intonation and Cues
Intonation means the way someone‟s voice rises and falls when they are speaking. It
is not what we state that influence but how we say it. The meaning of a given
expression is reflected by vocal intonation. This has revealed that use of oral cues are
correct signal of body type, race and height, overall appearance, education, and dialect
region frequently reveal situations in a true manner. Emotional expression can also be
best narrated by making use of disparity in volume, throw, accent, resonance, nuance,
rate, and pulse.
Picard (2011) indicated in his research that effective expressions seeing that anger are
illustrate orally by fast pace, elevated pitch, and loud resonance and mostly it does
help out in creating a good impact. While on the other hand, inactive manner such as
hopelessness are expressed by low pitch, delay pace and ringing noise. Similarly,
people make use of higher pitch and loud voice to show their stress and the opposite is
true for depression. People are generally aware of vocal cues phenomenon and does
indicate all this during conversation as to have deeper impact on listeners by
depressing sound pitch and by rising at the end of problems. Vocal message may
challenge the spoken one and when done intentionally, is thoughtful indication of
irony.
Mehrabian as cited by (Ekman, 1967) proved via his study that listener perceptions of
the behaviour of a narrator were effected thirty eight percent by the vocal tones
43
opposed to seven percent by the verbal message. Words have different meanings but a
particular meaning is specified and conveyed to the listener only because of how they
are being conveyed through intonation. As an example just analyses this brief
expression “thank you". If expressed naturally, it indicates wording of gratefulness;
but if intonate ironically, it can indicate a completely opposite aspiration and may
mean to mock the listener. People are generally aware of oral intonation which shows
all this during conversation.
2.8.5.1 Vocal intonation in school Classroom
Students' participation is affected to a large extent due to vocal cues in classroom.
Normally, teachers in reply to correct answers by their students answered with
positive spoken reinforcement in addition to vocal tone or pitch, showing liking with
students' answer. Opposite responses will be seen or observed once the teachers do
not like the answer. Higher levels of retention, understanding of the context and
clarity of the concepts can be experienced due to large variations in pitch, frequency,
and tone in comparison to the messages being delivered without these variations.
However, this practice should be conducted with proper care in certain situations.
Exclusive spoken and non-verbal communication cause considerable trouble for small
children. There are certain expressions in which the contrast between the words and
the intonation is very drastic and can confuse small children. A best expression for
this is the use of satire, which is an unsuitable means of communication with little
children and is quite hard to understand. In almost all examples small children were
unable to comprehend the irony which was present in those satirical expressions.
Intonation is not only a key to the understanding of verbal signals but a light through
which an idea about the overall personality is made. People create certain personality
features which are deduced from the intonation of the speaker. The stereotype about
either a teacher or a student is affected by their vocal behavior. It is because of these
stereotypes that there are very little chances of acceptance of a teacher by students in
class room if he or she possesses very nasal speaking voice because the teacher will
be perceived to have a variety of unwanted physical and personal characteristics.

44
Similarly, the females‟ teacher through especially stressed tone is frequently noticed
as more touching, being younger, feminine, less intelligent, and easily upset. The
males teacher with the similar oral qualities are often observe as being more
unyielding, cantankerous, and older. Similarly, the teachers‟ perception of students is
also affected by vocal characteristics and can be correlated with the stereotypes
defined above. But as students and teachers get closer these stereotypes get overcome
gradually.
This phenomenon is more likely to be observed in the low grade classes whereas; in
the higher levels and secondary schoolteachers and students may never interact
repeatedly enough to exceed stereotyped reaction. The teachers may get shocked at
students imitations of them. It is true that students often try to imitate and mimic the
teachers‟ vocal pattern which resemble quite similar to that of teachers and it is very
rare to find any differences. Similarly, intonation may also become a cause to bring
mental distances between the teacher and the students. Once the teachers speak in an
accent or dialect which is different from the one with which the students are familiar
in classroom, a intentional or unconscious biases may develop. This situation is good
for the cases where individuals leave their home towns for better employment,
education and often face difficulty due to their accent or dialect (Meyer, 2009).
Children learn most of the things from their surroundings which include their parents
and environment where they grow up. Children assume that whatever they have learnt
with the channel of time is accurate and need no modifications. It is this idea of
absolute correctness due to which a child cannot accommodate any change in his
accent. If the intonation or vernacular is discarded by a teacher then this rejection is
considered as a personal rejection by the child and this ultimately results in inferior
self-esteem and ultimately negative response of the teacher as well as the school.
2.8.6 Physical Environment
To make use of the arena in class room can have a to a great extent effect on
behaviors‟ between teachers and students‟. These messages become more inter-active,
if the material environment also goes with the provision. If together effects are set
aside beneath contemplation through class room actions by teachers‟ then the

45
students‟ learning ability and accepting concept turn out to be greatly easier. The
physical environment organized and arranged by the teacher has a great effect on the
exchange of ideas among students and teachers. This exchange of information looks
attractive, if physical environment is suitable to the requirement. If physical
environment and space are set aside below discussion throughout class routine by
teacher, after that the students‟ ability of knowledge and concept of accepting become
much easier. Space in a classroom may be personal or territorial.
2.8.6.1 Personal Space
In communication process space is considered a very difficult factor between teachers
and students. Teacher can easily feel and understand the acceptance or rejection
behaviour of students merely by the aloofness they preserve. Teachers just like other
human beings are likely to break the personal space barriers with the students. It is
true and pertinent to understand that students possess more liking for those with
whom they do not maintain personal space. While on the other hand, they maintain
improved detachment from those they do not similar to. However a conducive and
creative education atmosphere means a lot of efforts by teachers in classroom by just
making use of individual freedom effects. Immediately as we know that region have
permanent boundaries, similarly the personal distance has also been connected to
hidden bubble shaped something like a human being by himself which go through
him and can extend in length or turn out to be lesser based on the circumstances.
As the time passes person learn a lot from their surroundings. Similarly, they also
learn how to restrain their replies to the incursion of their individual space by
intruders, whereas little children‟s are far away from learning this yet. They must
show their responses via their both verbal and physical aggression. The teachers
require being extremely aware, together in class and in further school environment
about the security of small children.
Ekman (1967) stated that, “the classroom by itself has specified volume of distance
and the means that gap is engaged will surely have an effect on the type of
announcement and will deeply affect the learning environment of students”.

46
2.8.6.2 Territoriality
All humans and animals in the universe share these territorial limits and are
considered as a natural to assured distance for oneself and to protect that space for any
change without their will by potential intruders. This territory violation by intruders
may come across different reactions depending upon the individual to be invaded.
2.8.7 Dress
Rollman has stated (1977), Really dressing plays an important role in expressing one's
personality, status, sex, age, socio-economic class, physical climate, group
membership, and occasion in the past. Though, the majority of the communities are
apparently conscious of the communicative messages delivered by their dressing. In
addition, clothing is also related to attitude and can also be related to traditions, self-
expression, aesthetic satisfaction, positive values and social participation.
Dressing takes part in interpersonal effectiveness and tends to create greater collision
on others in social gathering and helps people be established between unfamiliar
groups as measure up to the ones who are not sounding decent. It is quite interesting
and amusing but research has proved that there hold up a linkage between the
students‟ success and their dressing in classroom. All of the individuals involved in
the research related to relationship between dressing and individual performance
account to their impression regarding an individual was affected a lot by his dressing.
Presently, still the same concept is held about dressing but the definition has changed
a little bit with the passage of time. However, there does a contradictory opinion about
dressing of a person or his efforts involved in being well-dressed appearance which
may affect other aspects.
2.8.7.1 Dressing and Classroom
Miller (2000) stated, “Dressing tells about one‟s perception”. This idea where
affordability is not an issue encourages people to dress well to do manner. While
dressing influences very little on those with whom one is familiar, but it is considered
totally opposite about teacher‟s impression on students. An educator is a kind of
character mock-up for students and they tend to make ideas about him and his role
47
from his dressing. That is why the teachers should put all their efforts into appearing
at ease, and more suitable in the role in organizing to improve credibility.
Furthermore, if the teacher is able to impress the students with his dressing then this
would eliminate some emblematic instructor learner obstacle as well.
Conversely, it is not all in one object inside the classroom for a good teacher.
Although dresses can communicate but it doesn‟t assurance goodness of a people
character similar to acquaintance, philosophy, performance and ethical standards?
Students are joke only for the time by the covering but trick them for an extended
through this is not likely. Student ratio teachers support on their qualified ability like
inspiration, justice and honesty to the occupation.
Similarly strong feelings have a great effect on students understanding. First
impression as usual has much deeper impact on the students and it is believed that the
first thirty seconds of communication between teachers and students last a great
impression on students about their instructors for the rest of the time being spent
together.
Allportt as cited by (Ekman, 1967) has stated, “by means of a short statement of the
main points visual concept, a difficult psychological development is alert”, aftereffect
inside an incredibly small duration in finding of age, size, gender, ethnic group,
culture, occupation, societal cast of the unfamiliar person, simultaneously by way of a
few estimates with his ascendant, his temperament, quality of being reliable,
friendliness, and even his honesty and uprightness”.
2.8.8 Individual Artifacts
Appearance, glasses, gemstone, make-up and jewelry also send a lot of information
about an individual. Horn as cited by( Ekman, 1967) also disagree that comments
about assuming traits depends on an individual appearance of an individual, is
probably based on some group of a logic which may not be correct all the time. This
inferring about that person from the artifacts can be flawed as well. For example, he
writes, “a person suffering from eye strain and wearing glasses, his eye strain is
probably due to much of the reading. An individual who review a lot is supposed to

48
be very exceptional; consequently; it's not at all logical or necessary to say that the
individuals who be dressed in eyeglasses are competent and smart.
However, it is quite arousing to communication that the past researches have
indicated those publics via glasses are rated superior in intellect and knowledgeable
by school students‟. However, sometimes they are also considered to be as clumsy,
stopped and nerdy natured individuals.
2.8.9 Physical Attractiveness
Bodily pleasant appearance is the extent to which an individual' physical
characteristics are considered with regard to perception and appreciation of beauty.
The physical beauty stereotype is an attribute which is represented by psychologists to
suppose that people who are physically fascinating and attractive may possess other
socially attractive personality traits. Physically energetic and attractive people are
more friendly and less socially fearful and alone than less physically attractive people.
Stereotyping is the procedure by which we draw conclusions about other people based
on knowledge of the class to which they belong. These stereotypes are also related to
body types to a large extent and communicate a lot to others. There are three general
body types and each will affect stereotypes regarding personality trait and can be
identified. The first in this regard is an ectomorph who is a thin person. Usually,
ectomorph has lengthy thin projecting joined appendage of the body such as arm and
leg etc. with lean and thin muscles. The qualities of ectomorph are fragile design and
bone building, classic gainer, little shoulders, bony, smooth chest, lean muscles mass,
firm to get mass, and fast metabolism. However, these are skinny and tall.
The second one is a Mesomorph and it consists of a large muscle, large bone, and
inherently athletic physique. It is best body kind for body structure. It may easily lose
and gain weight. The traits of mesomorph are strong, usually hard body, athletic, ease
to see muscles, and rectangular body shape.
The third one is an endomorph body type and it is generally soft and solid.
Endomorph gain fats very easily. Endo's are also generally of a shorter structure with
thick legs and arms. Body tissues are strong, especially the upper legs. They are
basically strong in leg exercises like the knee bend etc. The qualities of an endomorph

49
are round body, slow metabolism, round physique, gains fat and muscles very easily,
generally short, muscles are not so well defined. Endomorphs are reflection of
feelings, sociable and warm. Either these traits are accurate or not but they correspond
to and stimulate the actual label (Ekman, 1967).
The cause behind why these stereotypes are being emphasized for a number of
teachers is that students, like the other individuals, also go to stereotype teachers
depends on this trait of bodily appearance. Mesomorph is considered be the mainly
motivating body style individuals and be likely to get desirable results merely not
only due to their ability but because they are more attractive and generally appear
more interactive. Several studies and researches which were conducted about this
phenomenon have succeeded in developing relation between physical attractiveness
and grade-point average (GPA) from academic results (Bogden & Biklin, 2007).
It is a matter of fact that in classroom environment, physical attractiveness control
class communication to a large degree. This varying, on the other hand, is possibly
not as much of invaluable concentration as various, because statement does not
exclusive of intricacy alter it. However, we cannot simply ignore this and the
stereotypes must be dealt very carefully by the teachers. One of the main problems of
this is that it will make us believe something which is not true such as it is not
possible that all intelligent students will wear glasses, well artifact and well dress in
the same manner. Similarly, Chubby are not happy, satisfied and easy going as they
are generally believed. Furthermore, healthy built adolescent group are not each and
every one jock
2.8.10 Chronemic
It is the study of the role of time which takes place in message and it is one of
multiple subdivisions of larger categories of non-verbal behaviour. Other remarkable
subcategories consists kinesics (body movements), haptic (touch), proxemics (the use
of space) and vocalic (paralanguage), .Thomas (1970) stated, “Chronemics is the
social gathering of time in human reciprocal action". It can be abruptly and usually
defined as the study of human activity or pace as it is affiliated to human
communication.

50
In a specific manner, chronemics bears the study of both objective and subjective
human activity as they are interrelated with human behaviour. Moreover, it is the
study of human exchange of information as it compare to interrelated and co-opted
level of time experiencing. In the past, these integrated and interdependent levels have
been discussed and outlined as: social time, biological time, cultural time, and
psychological time. A number of grouping system exists in the literary culture.
Although, such systems are not put to practical use human interaction straightly
(Bruneau & Thomas, 1980).
In spite of the fact that this section has not been studied in detail it is still considered
that the use of time and management has a great effect on nonverbal communication
which can never be ignored. At elementary level, the teachers attempt all the time to
convince pupils to accept the content of mathematics. It is an essential act as
compared to history, but often in teaching history they certainly impart the
significance of history in pupils' mind set. Similarly, those who know a lot regarding
the students but considerably plan only a little time for gathering around people for a
particular purpose with them. Duration and time handling, formality and regularity,
personal manner in this way exchange information to pupils. Time is usually observed
as an artifact in institution. Lesson plans are set up and requirements are strictly
followed, and failing rules and regulations should be getting into one's possession as a
transgression and be awarded with punishment (Miller, 2000).
There are a variety of schools of belief regarding the time facing the end of the
classroom. Several say that very soon at the conclusion of the classroom student
misplace their curiosity in the speech and generally have no new will to hear
something, therefore, a fresh topic must not initiate at the end of the class. However,
various studies propose the contradictory. For example, they believe that the attention
of the students go up to its hit the highest point a moment ago before the conclusion.
However, students are extremely aware about the contravention of their occasion and
they create contact unspoken if such circumstances happen, so, there must be
reliability in group lessons and class ought to be ended on time (Felder & Brent,
2003).

51
Moreover, the use of silence is of immense significance even as present information.
Silence after or before several satisfied depict value of the communication presented
in the subject matter. It is generally observed that mainly classroom engage teachers‟
students‟ communication generally in the form of asking query from each other.
Giving enough time to obtain a respond from the learner, though, is a tricky job for a
trainer to manage. Majority of the learner, out of terror or uncertainty, do not response
rapidly and get time to react whilst the teachers; to consider probable response. It
happens very repeatedly that while no reply is made available from the learner the
teacher then moreover gives response himself, or might shout on a few other deprived
learners who are not prepared mentally for some action.
Obviously it doesn't denote that the entire moment should be exhausted in coming up
for answer. Each and every one depends on the whole behaviour of the group of
students. Different students have diverse responses to find out the response. Some can
take a time while others may be quick in giving the answer. This mainly depends on
the response pattern of the students and most of them have nothing to perform with
concentration, intelligence, or preparation. Therefore, it is useful for the teachers to
keep this point in mind for receiving better accomplishments from their students.
2.9 Review of the Related Theories
The revision in this research work provided an ideal framework to study and focused
the various dimension on the basis of related production of literary work both in
global and local perspectives. The ideas given by Galloway‟s nonverbal behaviour in
1972 is receiving much recognition at present time, as numerous further latest studies
are based on it. Only some of the interrelated studies are appended below;
A study and investigation of speculation was carrying out by Galloway (1972) in
nonverbal message. He projected that equally instructor and learner were not being
educated in the sense of non-verbal interactions. Moreover, special hypothesis were
made for nonverbal statement with the means of access of time as well. However due
to the lack of insufficient measure of consistency, soundness and some degree of
funds of practical group, the investigation in this area is not easy. Innovative study is
being carry out to learn how nonverbal cues are learnt; their distinctive shape in

52
diverse traditions about the globe, and generate dissimilar apparatus and techniques
for observational tool that illustrate class communication.
An observation arrangement was planned by the instigator throughout his initial study
of the time in which he enlarges an observational classification unfolding the
importance of non-verbal category. The key plan was to establish whether a consistent
observational system can be extended or not. For this purpose, he added new
categories in the course time. However, despite of all this till nonverbal skills
education is a relatively latest area. By wisdom the talent of nonverbal cues, instructor
gain knowledge of about the signification and role of their own behaviour and its
meanings to students during the course of teaching learning process, and they become
skilled at to monitor and become aware of nonverbal movements from learner so that
they are able to deliver effectively and ensure higher accomplishments.
Woolfolk (2004) commented on communication that “exchange of information is
greater than teachers‟ talks and student listen”. It is extra than the verbal exchange
among persons. We exchange in different behavior. Our actions, accent attitude, facial
appearance and numerous additional non-verbal cues mail information to our student.
Numerous period exchange of information we accomplish to mail are not the
conveyed information our apprentice accept” through wisdom practice nonverbal
moments take part towards the accomplishments of students‟. The complete education
knowledge method based on the achievement of knowledge outcome, so, the method
of improving education consequences is extremely important and desires crafty skills.
Leighe (2005) stated that, the accomplishment of knowledge results and the
production of learning intention after everything else. He more suggested that, “Each
objective should set out pertaining to reactions made in response which can be
independently noticed. This is required because state of being active with a basis in
observable facts rather than feelings.
Nayak (2004) reach to the point that, knowledge is not continually the development of
lessons. Majority learner inside the class makes out take away as we reflect they have
agreed upon because of good teaching. Mostly the interpretation of students is
bounded and unintelligible, if not completely incorrect; consequently, it is extremely

53
significant to have close in the progress of academic objectives and objective, thus
that nature of indulgent is gained through learning conclusion.
Significance of nonverbal behavior in the area of teacher students‟ relation is
completing through the aid of subsequent self-exploration in diverse field of learning.
The research investigator donates a great deal and accomplishes studies on non-verbal
behaviour and its significance on learning system.
Zekiaa (2009) resulted interested in awareness of the students‟ observations regarding
nonverbal cues in class room attraction on eye movement, body language and mimics.
The overall numbers of sixty seven (67) students distributed into two groups. Thirty
seven (37) were the respondent of the research. The assignment were set to a certain
students, to note down a significant suggestion statement on any happening that they
reasoned immediate on one occasion a week being in accordance with their lessons
for 2 month. Record was use as a tool for the research. Content of a body of
communicated material as book was used to analyze the categorical data, or involving
quality gather from the information throughout converting into code and classifying
the most important shape in the records. The lessons concentrated on the research
question; like inquire, what perform the learner sign up in the class room
administration classes report on the sense of body language and eye movement?
The findings of the study discovered that, nonverbal cues might be an essential basis
of attraction and motivation for learner wisdom, as well as a technique for enchanting
and maintain attraction. It was suggested that teachers should employ the significance
of non-verbal movements; and use this behaviors‟ in favor of learner to produce an
extra relaxed and motivating atmosphere within a group of students for improved
class room arrangement.
Baylore,et al (2009) carry out a study titled as “Designing efficient non-verbal
behavior for academic means”. Studies recognized the impact of understanding arena,
facial expression and body gesture on the behaviour to subject matter, remember and
influence appearance. Multi system analysis (MANOVA) and reduce analysis of
variance (ANOVA) were used. Findings denoted that the influence between facial
expressions and knowledge arena significantly impacted the attitude regarding subject
matter. Notwithstanding, together the absence and presence of facial appearance
exaggerated attitudinal and procedural component, but the attendance of facial

54
appearance was more important on attitudinal component than the nonattendance of
facial signal, but the nonappearance of facial movement have further important result
on technical standard than the attendance of facial way of thinking. The body signal
had as well as significant impact on outlook to subject matters. Simply the
information arena was important for remember, whereas leftover kinds be there
describe to be inconsiderable. The major impact of knowledge domain and eye
expression was important on mediator manifestation.
Richmond, Mc Croskey, Fayer, Sallinen and Barrowclough (1996) have done a
research titled as, “A multi-cultural assessment of relation-ship between nonverbal
nearness and effective learning”. The researcher assembled the information from 4
diverse kingdom; US, Finland, Puerto Rican, Australia. The respondent students were
chosen from colleges. Two hypothesis were refined clarifying, How much the
relation-ship among nonverbal nearness and emotional language through culture and;
how much the interrelation among a human being nonverbal closeness and authentic
knowledge lie transversely the civilization?” Data was collected throughout survey;
consisting ten nonverbal objects were at randomly chosen explicitly, monotone, or
boring tone of voice seem at the group of students, gestures, beam, at individuals. The
study exposed that interrelation among the non-verbal closeness and effective
knowledge lies in three except one i.e. Puerto Rican.
It was extra demonstrated within the conclusions that vocal variety, smiles and eye
contact as non-verbal expression were frequently connected to communicative
knowledge. The nonverbal movements of instructor mostly exaggerated the students‟
knowledge process, which obviously stated the significance of nonverbal movements
of trainer in instruction knowledge procedure across the ethnicity.
Stanton‟ (2004) also acknowledged that, “the entire nonverbal components of
behaviour similar to eye contact, body language, facial appearance, proximity, head
nods infrequently termed as meta message, from Greek sound „meta‟ denotation
beyond. Meta message is consequently being „in addition to communication and we
prerequisite forever be conscious of continuation.
Staven‟ (1980) reviewed different research works that emphasis on the task of
nonverbal behaviors in the background of education. Throughout this research work,
55
various fields were search with classroom interaction, chronemics, kinesics, eye
movements, polemics, Para-language and physical appearance. When he completed
his research after intensive study in these areas, he drew a final conclusion and among
them the main focal point was that the teachers‟ learning programs must maintain a
firm focus on the contact of trainer on their students' in classroom interaction. He
maintained that the controlled nonverbal communication variables which can affect
student attitudes and performance towards learning and building concepts should be
made essential part of such programs.
The studies recorded extended have given an idea of the impact of different kinds of
nonverbal movements on the learner. However, it is not explained, how this impact on
their education be able to studied with no rising a suitable scale. Besides, the result of
spoken activities of instructor can‟t be entirely rejected on the source of justification
that unspoken cues are extra conducive and productive to improved coaching learning
process. Of course, it is accepted that learners are provoked to wisdom, by watching
instructor diverse nonverbal communications. A few research work re-create in the
existing part have demonstrated special effects of non-verbal cues of dissimilar
students. For example, a learner in teen-ages is sharp and inquisitive observer, of what
the teacher performs?
Smith (1988) also presented valuable suggestions after the review and conversation of
semantic matter and universal nonverbal study. These suggestions were presented in a
discipline correlated study fewer than seven type of non-verbal touching behavior,
kinesics, ecological issue, polemics, physical appearance, artifacts‟ and Para-
language. He draws the traits of all-purpose academic hypothesis and too tinted the
method result model and the interrelation of non-verbal message in this arena. In last
phase of the investigation he presented unusual statistical and technological
apprehension. The major aim of the assessment was to explore the studies of non-
verbal communication in the class room and to define encouraging design and
strategy for prospect study in non-verbal behavior which are resulting from the past
researches.
In this connection, a number of limitations were forced when the appraisal was
carrying out. Particular stress was established on the non-verbal behaviour in

56
classroom research study of kids from nursery school to level three. But on time,
study was also passed out in post-secondary and pre-kindergarten which means that
sometimes the research was also conducted before and after schooling of the children.
McCroskey and Sidelinger (1997) carry out a study focusing on the work “message
associate of teachers‟ transparency in the college classroom". The core issue of this
research was to bring into light the positive correlation between the teachers‟
precision and students‟ intellectual knowledge in addition to the students‟ perceived
effectiveness of the teacher. Similarly, they also wanted to establish the fact that if
spoken and unspoken communication in classroom instruction enhances the students
learning skill or not. The final results of the research revealed that there exists a
positive correlation among spoken and unspoken communication of the instructors.
Similarly, teachers‟ clarity also correlates with the two dimensions of socio- talkative
teaching technique.
A survey was conducted on two hundred and four graduate learners reading in a mid-
Atlantic institute. The part was resulting from a huge address examine classes in
communication. Learners were given directives not merely vocally moreover
throughout a covering correspondence. They were properly briefed about their
contribution in the learning which was intended and unspecified. Later on towards the
end of the semester, data collection was conducted and students‟ perception about
teacher clearness in the class was considered by an extended version of the balance
used by Powel and Hartvillee (as cited by Sidelinger & McCroskey, 1997). The
improved sizes constituted of twenty two objects make use of a five-point Linker
nature weighing tool. They found quite enough variations in the relations connected to
the research query “Is there a connection among instructor precision in class coaching
and learner touching learning?". The results obtained proved right towards larger side
but, however, alike and significant correlation was also found for the research
problem, “Is there a connection among educator simplicity in class teaching and
learner teacher assessment?” Hence, both vocal and non-vocal communication of
educator was found to be closely linked to the effective learning of the students.
Later on, in a research which was conducted by Davis (2002) to investigate from the
suspense worth of effort were found quite a few motivational and cognitive variations

57
which were understood to have an effect on students‟ growth, teacher-student
relationship. The research also found that this in return affects the classroom
interaction success ratio. From this research of expectancy-value theory, three
variable correlated to learners were out looked as key reason in the progress of
teacher/student relationship accomplishment, nonverbal communication skills,
development of an optimistic affiliation with educator, and social self-concept beliefs.
The research population of this study was diverse and eighty two students participated
in it from fourth and fifth grades.
In another research, the learner awareness of the feature of their association with their
key teacher and their class performance were inspecting with respect to different
variables. The results obtained from it stated that students develop schematic mini
handbooks, their social self-concept idea without interference of any other individual
about their communication through instructor that are reliable with their non-verbal
message ability. The obtained outcome also tinted that focusing the affiliation among
main teacher might payment for non-verbal complexity for both constructive
consciousness of association and educational accomplishments.
On the other hand, Polemikos and Kodak's (2002) conducted an empirical research on
non-verbal movements at kindergarten just to assess the non-verbal cues of children
and teachers and most significant its relation to their spoken communication. The
main theme of the research was to investigate the appraisal of non-verbal behaviour of
the nursery school teachers and the kids. The assumption which was recognized from
the investigation showed that there is a negation established among vocal and
nonlocal behavior of the nursery school instructor. They study further found that there
is a contract among atmosphere and target in kids. In such connection, their spoken
and nonverbal behaviour decided. The study integrated nine diverse nursery school of
the city of Rhodes; where the average learner in each class was ten. Sixty five (fifty
five percent) of these kids were baby girl and fifty two (forty four percent) of them
were boy. The time of the learner vary from four to six year. In order to make the
research more effective and accurate and to draw better conclusions record
investigation was used as a tool to attain the outcome. For commencement of the
research, an instrument of account, evaluation and data-entry of non-verbal interaction
was build. A scheme of interactive affairs investigation instrument was also enhanced

58
by the investigators to discover the relation between the nursery school instructor and
the kids‟ behaviour. The conclusion shows an encouraging conformity among nursery
school teachers' spoken and unspoken behaviour. Though, discrepancy is exposed in
the case of unenthusiastic communication.
Rosa (2002) carries out a study on comprehending the significant and possible effect
of non-verbal behavior in basic class environment. The reason was to distinguish the
relationship among the nonverbal communications of the learners who were vigilant
normal in their intellect by means of those who were considering when empirically
test. This study of contrast was made during the time as soon as they were active
during common classroom teaching within together small along with large collection
situation. The research revealed the nonverbal communication of single instructor
because he was communicating by means of a selective collection of pupils inside the
natural class interaction.
The summarization of data involved class-room observations, activities noting,
informal, formal context, discussion with teachers about students‟ profiles, lesson
plan, and overall validity of the study and videotaping of science lessons in groups. At
the end, the outcomes of the research showed the most common nonverbal interaction
which was showed by both the special and common learning apprentice was
“presence to events” as they were during the observation.
Albert (2006) also conducted a study on the nearness, or we can also call it as a
nonverbal immediacy within the class room understanding. The purposes of the study
were to come across interrelation between the non-verbal movements and the
sharpness of the audience experience in discussion. As a result of the study an
assumption was made which was based on an indication that the students‟ sharpness
to talk about usually from various points of view with a teacher inside the class room
atmosphere actually assist them a lot to enhance their understanding of the input and
increase their performance. Apart from this, it was also highlighted in this premise
that making the use of nonverbal behaviors, in its true spirit, also increases the
keenness of audience and makes them more eager and enthusiastic to encounter in
deliberations external of the language surroundings. For this purpose, a total of one
hundred and eight learners of undergraduate interaction and psychology play part in

59
this study from an intermediate sized state college in northwestern Missouri. It was
made sure that the entire subjects taught were to be treating among the “Ethical
principles of Psychologist and Code of conduct”. In this connection, the primary
instrument used for this purpose was the development of a scale of ten items revised
nonverbal immediacy measure (Sidelinger & McCroskey, 1997).
Furthermore, Albert also managed to develop a tool of his own specially designed for
the purpose. He actually used this tool in that study which was called the level of
additional interaction. Albert also made the make use of videotapes as an instrument
for conducting research. In this process, he has to give three to four minutes speech to
an individual and also made the use of several non-verbal cues that were considered to
be of immediate importance. Then, the person was tape recording another time using
the same expression of thought in spoken words with full implementation of direct
movements. Later video tapes were handed over to class participants and were asked
for individual‟s performance and this process was repeated with various individuals.
For statistical data analysis, a 2(Gender of subject) X 2(Nonverbal immediacy)
between subject factorial ANOVA was computed relating entire gain on Albert's
balance of extra-curricular activities by means of the non-verbal rapid communication
in verbal communication and the masculinity of the area under discussion. In all this
process, he found a very significant effect along with an important communication
among the understanding of non-verbal and gender of the participator.
A similar study was also conducted by Rogers (2006), with a focus on designing the
answer to this interesting questions; what nonverbal behaviour should be opted for use
by effective teachers for at risk students? For this purpose, he collected the
achievement assessment forms about the teachers‟ nonverbal communication from
students. Thirteen performances that comprises of seven nonverbal areas were
included in the data forms. However, in addition to this, it was also decided to observe
the teachers within the classroom environment. In order to carry it out, four trainers
were noticed thrice for a span of thirty odd actions and in the same way two extra
instructors were also monitor just once. The conclusion of the research facilitate to
emphasize in relation to harmony that both spoken and un spoken communications
make easy learning and helps a great deal in improving the at risk students a lot by
making them take more interest in class with much more devotion and zeal.
60
Similarly, a study on “individual make contact by means of the classroom” was
conducted by Andrzegewski and Davis (2007). In this study they try to investigate
about how educator talks on the subject of and discuss the topic of moving students.
For the subject of study, they selected four experienced teachers for whom touching
students was considered to be the basic instinct of their teaching skills. They carried
out discussions with them and explored about how they determined on selection
regarding at what time engage in the dangerous behaviour of emotive students and get
maximum out of this behaviour. At the end of the study the results obtained were
segregated in to two different notations. The first judgment indicating that how
participated instructor professed background like make possible or cons-training
individual contacts, and the second judgment tinted the aspects of conversation
regarding person contact exposed about participant lessons. Though the research
carried out not merely enabled to contribute to the text on learner trainer dealings but
in addition give tools on teacher conclusion making. This investigation also
highlighted the suggestion involved correlated to the teachers-students relationship,
teachers‟ education and teacher decision making.
In a nutshell, education can be termed as alteration in actions which deal with
progress of understanding, skills and attitudes. Education plays an important role in
teaching. By using learning techniques and method, procedure of teaching and
training in the teaching-learning process can be successfully enhanced. But we must
keep in brain the results and points given by Galloway and Flanders. Majority
research work has shown that skills of knowledge can be enhanced by applying vocal
and nonverbal message through teaching the same as both are completely associated
to successful learning. Furthermore, the data findings obtained from diverse studies
highlight the truth that spoken communication can most excellent conveyed to
students when we use unusual variables of non-verbal statement simultaneously as
appropriate to the occasion and the demand.
After going through the literature related to nonverbal communication, it became clear
that the given study is important to know the existing situation of teachers‟ nonverbal
communication in Pakistani education system, and to find out how much the
nonverbal behaviour is used. Furthermore, it is also pertinent to find out on the basis
of this that what is the educational performance of students? Similarly, it will tell us

61
that how we can train our teachers to develop reliability among their spoken and non-
verbal interaction for a better accomplishment because research on effective
communication reveals that a greater uniformity among non-verbal and vocal message
always fallout in high educational accomplishment. So, the present study might
hopefully help us to fill in the gap between verbal and nonverbal behaviors of teachers
for greater educational excellence.
Furthermore, Galloway classification of non-verbal behaviour is a useful addition
depends on Flanders analysis of spoken communication. This system is not used as a
method of spoken and nonverbal interaction in teachers‟ education and research on
teaching in the context of Pakistan.
The writer is of the opinion that although Galloway gives importance to nonverbal
communication but he has given less importance to verbal one because of his opinion
that from seventy five to ninety percent of messages is communicated through
nonverbal communication. However, words and vocal interaction are also very
important which are well categorized by Flanders. So, the blend of both of these
frameworks leads towards a better communication and interaction.
After the work of Galloway (1977), nonverbal communications gain popularity in the
system of education because it complimented teachers‟ verbal behaviors. Researchers
like Segeerstrile and Molars (1997), highlighted nonverbal message as “a serious
aspect of inter-personal exchange of information in the classroom environment”. The
researcher strongly agree with the ongoing research studies on nonverbal
communication and that is why he felt to explore the status of nonverbal
communication in Pakistani system of education, and to incorporate it along with
verbal communication in the classrooms for effective learning. The work of Galloway
research work is appreciated as it provides base to many research studies in the area
of nonverbal behaviors and its importance in the system of education.
2.10 Critiques on Related review
The research investigation presents a universal view of nonverbal message along with
their larger strength on students learning outcomes. However, these research works
should not go without scrutiny as they were accomplish in different contexts.

62
Similarly, the importance of nonverbal communication is not only considered in
secondary school but also in primary and elementary schools as well. This view is
argued by researcher like; Smith and Kodakos & Polemikos etc. The findings of the
present work strongly reliable with the result of researcher. Smith stated that, the
importance of body language on the teachers and students of kindergarten and
accomplished that; instructor should use this skill to generate a motivated and a
comfortable classroom learning environment.
Additionally, Davis also research on the suspense worth of work on a number of
analytic and motivated variables. Similarly, the outcomes of the current work, the
significance of nonverbal message in lessons knowledge development was also
found, during the profession and teaching of medical students‟, encouragement of
teachers‟ nonverbal behaviour, and positive relation between teachers and learners.
Investigators like Galloway, Stave, McCroskeys, Rosa and Albert have carry out
research studies on the significance of non-verbal behaviour in the instruction of
diverse traditions. They found it‟s important and helping in spatial remoteness, and
disclosed that nonverbal behaviour is similarly important in everyday life. The
findings and results of the present research work powerfully support the conclusion of
the aforementioned studies about the significance of nonverbal behaviour conducted
across the globe. The study moreover illustrates the significance of nonverbal
behaviour ability in students‟ wisdom process in the learning set-up of Pakistan.
2.11 Summary
Nonverbal communication is progressing in developed as well as in developing
countries on the basis of international declaration in teaching-learning process. The
Government of Pakistan is also testing to pass some initiative in favor of nonverbal
communication which would be beneficial for its successful implementation.
Teachers are important figure in the accomplishment of nonverbal communication
which is an essential component in teaching-learning process as may be observed
from this literature review. However, there are also some constraint significant to
teachers‟ “knowledge and attitudes” regarding nonverbal communication which are
considered to be major issue, to successful implementation of nonverbal

63
communication in Pakistan. For examples; insufficient knowledge of nonverbal
communication, lack of teaching skills, lack of training and large class size etc.

64
CHAPTER 3
METHOD AND PROCEDURE
This methodology chapter provides a description of the qualities of educational
research as well as presents the research design used in this study. It is an established
fact that a research has a pivotal role in education (Bell, 2005, Cohen, Manion &
Morrison, 2007); and academic research is always depends on some ways of
reasoning and reliable method of authenticating a knowledge and belief (Drew, Hosp
& Hardman, 2008).
Conventionally, investigators used three lenses for educational research, namely
qualitative, quantitative and mixed method paradigm (Bell, 2005; Manion, Cohen &
Morrison, 2007). The description in this chapter is mainly about the quantitative
approach. By using such approach, a researcher can use the strength of quantitative
design as suitable to the topic and data. The data collection procedure also described
in this chapter, method of selecting a random sample and research paradigm was used
to choose a random sampling.
There is also a discussion of reliability and validity, ethical considerations, and some
of the issues which were come across during the data gathering. This research work is
also investigating the effect of non-verbal behavior of the instructors on the
educational accomplishment of the students at secondary school level working in
diverse and different school systems such as government, semi government and
standard private schools situated within the premises of district Karak, Khyber
Pakhtunkhwa.
3.1 Research Methodology
This section is to lead and demonstrate different paradigms, including a description of
research approaches. There are different methodologies used by various investigators
for their research study, such as quantitative, mixed method, qualitative and action
research. A quantitative design is generally depends on observations that are
controlled and structured (Punch, 2009). On reverse, qualitative design is depend on a
more holistic perspective and it is not about questions-answering such as “to how or
what extent well something is done. Furthermore, in the production of literary work, a

65
researcher can make opinion by integrating and evaluating past research studies
(Cooper, 1989).
The area of action research is practitioners carried out and based is by teachers in their
class room with their aim and purpose of enhancing art of teaching to the students
(Carr &Philips, 2010). These approaches are like a group of people in which
individuals of each group encounter similar methodological orientations, background,
research idea and practices. A different researcher has been linked with different
paradigms (Teddies & Tashakkori, 2009).
The main focus of this study was to observe the effect of nonverbal behavior of
teachers on students‟ educational accomplishment. The concept of unspoken message
of teachers in secondary school teaching system has emerged recently in different
developing countries including Pakistan. This was observational study which
observed teachers‟ nonverbal behavior in real classroom environment and its impact
on the students. In order to draw finding and make them more accurate, a semantic
rating scale was to be used for non-verbal communication of the teachers‟. Along with
this, the educational accomplishments of the students were obtained from the
respective boards.
3.2 Nature of the Research
According to Biklen and Bogdan (2007), we can determine research as investigate
information through methodologies to add to one own body knowledge and possible
to that of several by encounter significant insights and facts. The researcher describes
in his research as a systematic way of method of inquiry, asking questions and a
communication that may be used to acquire more information. Lichtman (2010) stated
that by conducting study, an investigator may also disclose arising knowledge
phenomena and in this way he can produce new information.
Drew, Hardman and Hosp (2008) stated that “research is administered to solve issues
and to enhance level of understanding and knowledge”. Keeping in line with this
approach of the scholars, this study involves impact of nonverbal behavior of
teachers‟ on students‟ educational accomplishment as well as their positive effects on
the overall teaching-learning process.

66
3.3 Aim of the Research
It is also significant for the researcher to comprehend when, how and why; a research
design is needed to collect data, how the data will provide available information and
how to avoid difficulties in the research (Morse & Nihaus, 2009). In the light of this
opinion of Hardman, Drew and Hosp (2008) it is essential to discuss in details the aim
of the research. Denzin (2010) also introduce that the nature of research is designed
and framed by the nature of the research. So, the current research describes to
investigate the impacts of nonverbal communication of teachers in different
educational systems on students‟ educational performance by using mixed-method
approach. Within the scope of this study, behaviour of teachers is studied within
empirical perspectives as those of Srivastava, Chhabra and Srivastava (2010).
Although, behaviour is a larger concept in social psychology and according to,
Chaiken and Eagly (1993) there are three perspectives of behavior, affective,
cognitive and psychomotor behaviour. When the cognitive judgment is related to
teachers‟ beliefs or knowledge regarding educating students with particular needs, and
the affective perception considers their feelings, and the psychomotor viewpoint
reflects their tendency to respond.
3.4 Research Design
In educational research, there are several approaches within which qualitative and
quantitative design can be best worked. The aim of the study determines the research
design (Denzin, 2010). Researchers may use both designs, which have emerged from
diverse philosophical thoughts, to shape their understanding and acceptance.
Quantitative purists vocalize hypotheses which are generally called a positivistic
philosophy (Johnson & Onwuegbuzie, 2004). In the reverse, the interpretive approach
is usually concentrated on trying to know the meaning which the events have for
individuals and their words (Lichtmans, 2010). His study “describes a world in which
reality is fabricated, complicated and enduringly changing”.
Creswell (2008) stated that quantitative research is a process of investigation that may
be utilized for understanding the trends and to make relationship between variables. A
quantitative paradigm based on numeric data collection the same as, surveys which

67
are focused on a hypothetical authentication (Johnson & Christensen, 2000; Wierrsma
& Jurss, 2009). However, the center of attention of the numeric study was to
determine the attitude of the teachers towards the nonverbal behavior of teachers on
students‟ educational accomplishment with special reference to the need in the
mainstream classroom. As the aim of this research work is to understand some special
phenomenon about the nonverbal behaviour of teachers on students‟ academic
performance, the quantitative method seems to be suitable as part of this mixed-
method approach. Qualitative research is an umbrella term for various research
approaches (Bogdan & Bikelin, 2007). It refers to the interpretation, analysis and
collection of comprehensive and visual data in order to attain insights into a
knowledgeable phenomenon of interest (Springer, 2010).
3.5 Population
According to Gay (1996), “The term „population‟ is the aggregate to which an
investigator should be fond of the outcomes of a research to be comprehensive”. The
present research was confined to determine impact of nonverbal behaviour of teachers
on educational accomplishments of the students, and also to compare and contrast the
nonverbal behaviour of teachers working in government, semi-government and
standard private schools which are located in the premises District Karak, Khyber
Pakhtunkhwa, Pakistan.
The population of the research constituted the entire man and feminine secondary
schools instructor in the subjects of English, Urdu, and Islamiat of district Karak.
Similarly, the relevant data was obtained from the available record of the board of
intermediate and secondary education Kohat and DEO office Karak according to
2014-15 sessions. The total number of schools of both genders was one hundred
eighty eight (188) i.e. ninety five (95) government, eighty (80) private, and thirteen
(13) semi government and standard schools.
Total numbers of teacher working in the existing school systems was 364 (233 male
& 131female). The entire students‟ registered in secondary schools examinations was
seven thousand five hundred eighty three (7583).The minimum qualifications of

68
teachers were B.A/B.Sc, C.T and B.Ed. A very few number have higher qualification
e.g. M.Sc/ M.Ed, M.A, M.Phil and Ph.D.
3.6 Sample of the study
It is a common fact that the value of research is basically determined by paying
serious and cautious concentration to the sample selection process (Parkker &
Trietter, 2006; Mannion, & Morrison, 2011). So far the size of sampling is concerned;
Cohen, Manion, and Morrison (2011) are of the opinion that there are no rigid
regulations for sample selecting procedure in relative to size. This based on the
environment of the aggregate that are the topic of the investigation method as well as
the traits and intention of the study. Furthermore, likelihood sampling is measured
more suitable for quantitative inquires where the fundamental intent is simplification,
as non-likelihood sample fits greater to the plan of qualitative study which focus itself
not less to have in detail investigation of the observable fact in the explicit
background, and where deeper approaching is the key plan as conflicting to overview.
However, sampling is not simply a combination of few persons upon which
experiments are made, rather they represent a whole class to whom we can apply the
deduced results of the study. In connection, Gay and Airsian (2000) suggested that
“Sampling is the method of choose a sample of individual for a research in such a
technique that the selected person represents the whole cluster as of which samples
are chosen”. The part of the current research comprises one hundred eight teachers
including: fifty four male and fifty four female teachers. They were selected randomly
from the defined population. Similarly, to select a sample from the population,
multiphase cluster sampling technique was used. Six male and six female schools
were randomly selected from different educational institutions. It was followed by the
selection of three arts teachers in the area under discussion is English, Urdu, and
Islamiat. The distribution of secondary school teachers in the subjects of Urdu,
English, and Islamiat is as under:

69
Table-3: The sampling distribution of teachers and their educational institutions
Name of educational
institutions
Number of
Institutions
Number of teachers
per institutions
Total number of
teachers
Male Female
Government Male Schools 06 3 - 18
Government Female Schools 06 - 3 18
Private Male Schools 06 3 - 18
Private Female Schools 06 - 3 18
Semi Government & Private
Standard Male Schools
06 3 - 18
Semi Government & Private
Standard Female Schools
06 - 3 18
Total 36 - - 108
The selection of sample was cohesive and compatible. The number of teachers may be
less or more than one hundred eight. However, the sample size, n=108 out of three
hundred sixty four arts teachers is enough to represent the whole population.
In order to find out gender difference and analyze these differences critically, the
sample of both genders was kept equal for the purpose of comparing and contrasting
and to test the consistency of verbal and non-verbal behavior (Gay, 1996, pp.111-
116). There were one thousand one hundred and forty two (1142) students in the
subjects of English, Urdu and Islamiat who constituted the sample of study.
Furthermore, only those learners were incorporated in the sample who attended
classes of the one hundred eight teachers.

70
3.7 Instrument of the Research
In this study the relation of two variables was investigated. It was the study of
association among variables that is; teachers‟ nonverbal communication with
students‟ educational accomplishment. Efforts were made as far as possible to
accurately find out a simple relationship between these two variables. For example,
the time of observation was kept constant. All the teachers were informed regarding
the general aim of the study without any details of the study, and all the participated
teachers were observed twice by the researcher at the same time and in the same
subject and students. The scale which was used in this study complemented verbal
dimension of Flanders interactions.
So as to decide the impact of non-verbal behaviour of teachers‟ seven-point semantics
ranking score was developed by following Galloway‟s alliance. According to Gay,
(1996) revealed that; nonverbal behaviour equivalent to Flanders interaction
classification of spoken behaviour. Similarly, the nonverbal behavior of instructor was
observed on an evaluation form specifically designed for this purpose. Nonverbal
communication of the teachers was distributed into two major areas; Non-verbal
behaviour that facilitates students learning; nonverbal behaviour that constricts
students accomplishments.
The points on the rating scale were as follow;
1 & 2. When accepting positive and negative expression of the students in
unthreatening way and encourages or praises them, the teachers‟ body movement is:
Compatible and
constant by means of
language with
appropriate sort of
expression.
1 2 3 4 5 6 7
Inconsistent with words
and variable
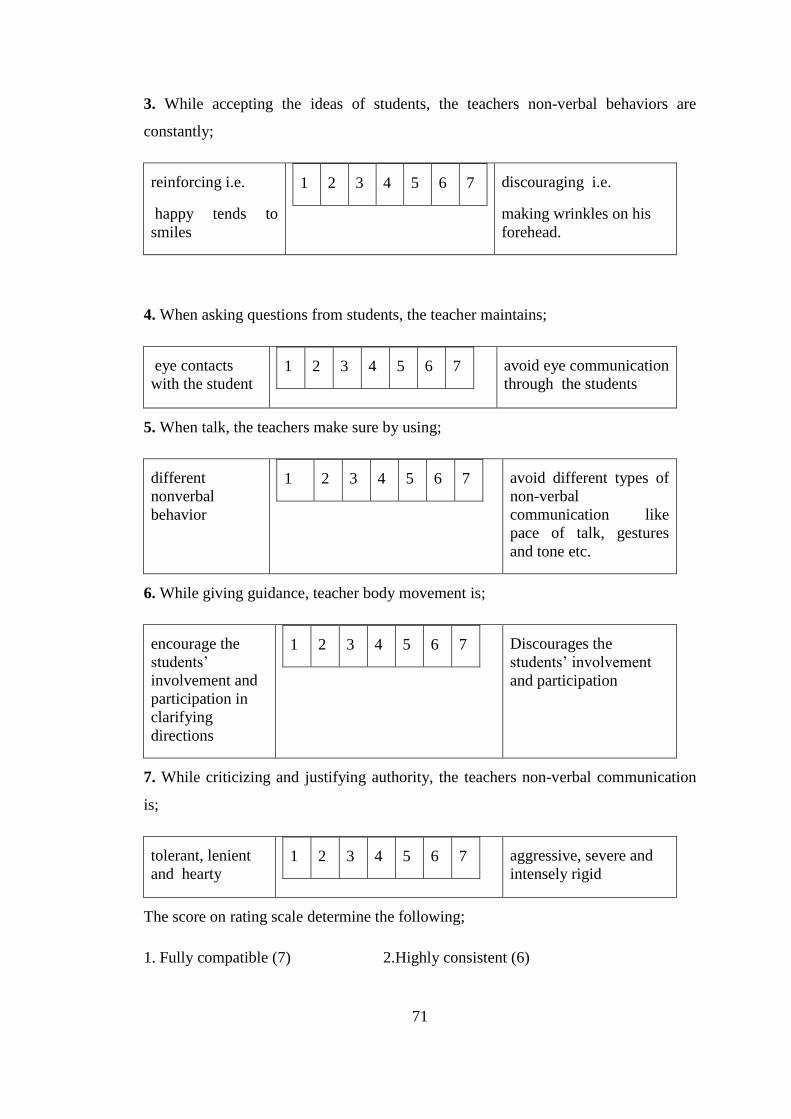
71
3. While accepting the ideas of students, the teachers non-verbal behaviors are
constantly;
reinforcing i.e.
happy tends to
smiles
1 2 3 4 5 6 7
discouraging i.e.
making wrinkles on his
forehead.
4. When asking questions from students, the teacher maintains;
eye contacts
with the student 1 2 3 4 5 6 7
avoid eye communication
through the students
5. When talk, the teachers make sure by using;
different
nonverbal
behavior
1 2 3 4 5 6 7
avoid different types of
non-verbal
communication like
pace of talk, gestures
and tone etc.
6. While giving guidance, teacher body movement is;
encourage the
students‟
involvement and
participation in
clarifying
directions
1 2 3 4 5 6 7
Discourages the
students‟ involvement
and participation
7. While criticizing and justifying authority, the teachers non-verbal communication
is;
tolerant, lenient
and hearty 1 2 3 4 5 6 7
aggressive, severe and
intensely rigid
The score on rating scale determine the following;
1. Fully compatible (7) 2.Highly consistent (6)

72
3. Moderately consistent (5) 4. Partially consistent (4)
5. Moderately inconsistent (3) 6. Highly inconsistent (2)
7. Fully inconsistent (1)
Like this, the observational tool was planned by means of an instrument in the
research work to examine nonverbal teaching behaviour of the instructor. The
evaluation form was an addition of non-verbal measurement to the renowned Flanders
communication system which is used throughout the world without any modification
for research purposes. In spite of all this, most of the researchers are very much
conscious of the cultural elements and they have linked culture to be part of nonverbal
behavior. However, the nonverbal version of Flanders system appears to be as
civilization free which does not need any revision.
3.8 Data Collection
Before the data summarization, a pilot study was carrying out so as to see the
reliability and validity of the data.
3.8.1 Pilot Study
In advance of collecting the main data, the investigator executed a pilot study to make
sure the quality of the observational form. For this purpose, the nonverbal behavior of
10 arts teachers (five male and five female) was randomly selected from the definite
people for pilot study. However, the selection of these teachers was not contained in
the main sample. The pilot test was considered successful as no intricacy was
practiced in watching the non-verbal teaching behaviour of those arts teachers. The
researcher himself observed the body language of the teachers. English is the
secondary language in Pakistan and observational form‟ was in English.
To check the reliability and validity of the self-developed observation scale in the
light of Galloway categories, opinions of the experts (supervisor and faculty of
teachers of Education Department at Qurtuba University) were obtained who
considered rating scale to be valid for considering the nonverbal teaching behaviour
of arts teachers. To ensure its reliability and validity, co-efficient of consistency was
73
measured by using test retest method on the obtained data. The co-efficient of
reliability was 70%. The coefficient ranges from zero to one. If coefficient of
reliability is equal to zero, it means that there is no reliability, and if co-efficient of
reliability is equal to one then its means a perfect reliability. Generally, it was
observed that all tests had some errors as well as co-efficient of reliability, which
cannot be perfect. Similarly, standardized test reliability is 80% or erom. If it is more
than 70% then it is regarded as very good reliability. If it is below 50%, then the test
would not be considered as a reliable one (Trochim, 2006).
3.8.2 Quantitative Data Collection
Quantitative data was collected; after pilot study, this involved the accomplishment of
observational form on nonverbal communication of secondary schools teacher tends
to students‟ learning. The teachers‟ nonverbal behaviour observation duration were
noticed by researcher contacting with the head of the institutions from which teachers
were chosen. Before entrance to the educational institutions, an investigator received
proper permission from the university. The scholar also received right permission to
collect data from the office of District Education Officer, Karak, Pakistan. In this
research study, the investigator went to all the nominate institutions personally to
gather data. Data collection was organized into different phases.
Firstly, the study was descriptive cum observational in design which is a kind of
quantitative research (Gay, 1994) because the non-verbal behavior of teachers‟ was
rated on rating scale and ratings were converted into scores by using standard
criterion. However, recording and observing the nonverbal movements of teachers‟
coherent by means of their spoken message was a complicated job. In order to resolve
this problem, the researcher himself made observation of every trainer twice. The last
rating value was allocate whereas observance in intellect together the observation and
videotape audio recording. The subsequent process was assumed to collect data:
Secondly, for data compilation from the chosen sample of observations rating scale
was used as a tool of research. Each instructor was noted by investigator twice
himself through different instruction hours for about 6 or 5 minutes. The non-verbal
behaviour of the educator was recorded. The time space between first and second
observation was one month. The final rating score were allocating by safe custody in
74
brain connected with the interpretation. In this process the nonverbal and verbal
behaviour of all sampled trainer was too videotaped, observed, and analyzed under the
control of the supervisor so as to ensure the viewer consistency.
Thirdly, so as to observe the effect of nonverbal behaviour of teachers on learner
educational accomplishment, the information of the dependent variable learner
educational accomplishment was together from the selected school evidence. This
evidence comprised the outcome of secondary school examination detained by the
board of intermediate and secondary education, Kohat.
3.9 Data Analysis
In order to come across a reliable conclusion the following method was assumed to
investigate the data;
Ratings allocate to each instructor comprised in the selected sample were gain
in the reverse order by assigning a utmost value of seven (7) to score one (1)
with a smallest score of one (1) to rating seven (7) on each dimension. The
unspoken behavior rating of every teacher was determined by outline score on
seven aspect of non-verbal behaviour of the teachers as described in the
observational form (Appendix-A). The maximum score of nonverbal
behaviour on the entire dimension was forty two (42) and the minimum rating
score was seven (7).
The average nonverbal behavior score was calculated for the arts teachers of
each educational system including both teachers‟ (male & female) and for all
teachers included in the sample.
In order to decide whether the non-verbal communication of teachers‟ was
compatible and cohesive with their linguistic behaviour; the following
principle was followed:
The high mean score of rating on rating scale means that the higher
correspondence between the spoken and non-verbal cues of teachers‟.
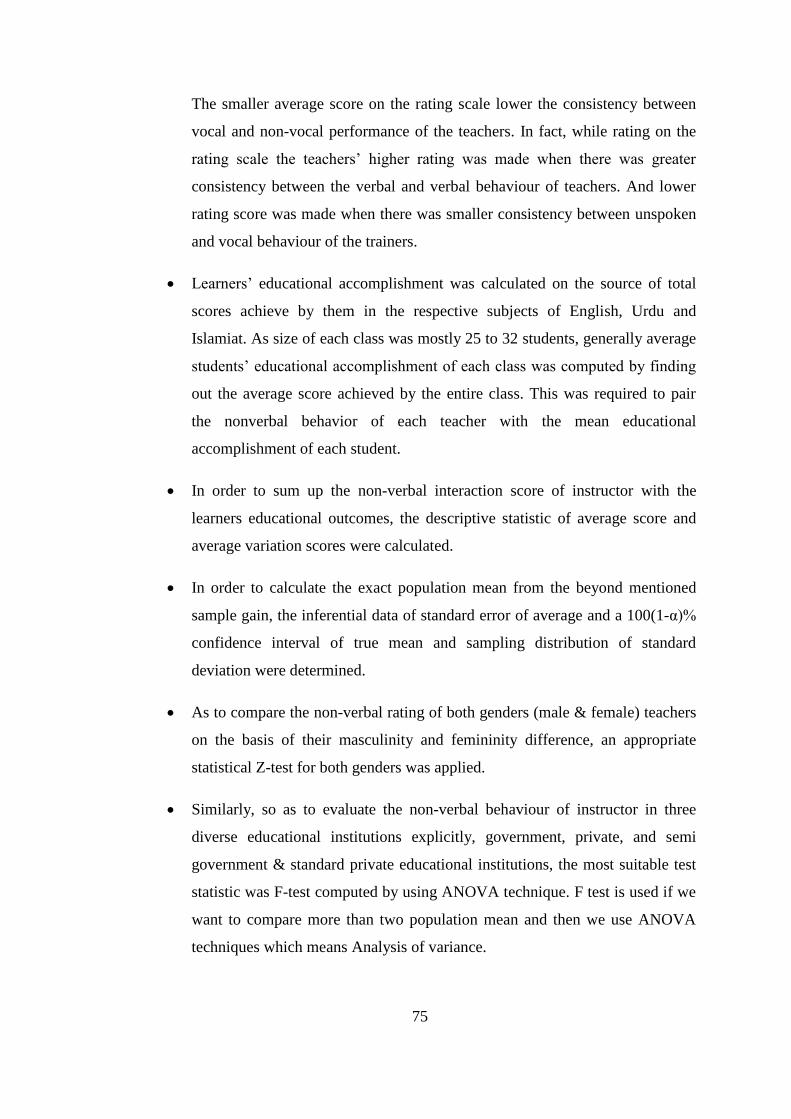
75
The smaller average score on the rating scale lower the consistency between
vocal and non-vocal performance of the teachers. In fact, while rating on the
rating scale the teachers‟ higher rating was made when there was greater
consistency between the verbal and verbal behaviour of teachers. And lower
rating score was made when there was smaller consistency between unspoken
and vocal behaviour of the trainers.
Learners‟ educational accomplishment was calculated on the source of total
scores achieve by them in the respective subjects of English, Urdu and
Islamiat. As size of each class was mostly 25 to 32 students, generally average
students‟ educational accomplishment of each class was computed by finding
out the average score achieved by the entire class. This was required to pair
the nonverbal behavior of each teacher with the mean educational
accomplishment of each student.
In order to sum up the non-verbal interaction score of instructor with the
learners educational outcomes, the descriptive statistic of average score and
average variation scores were calculated.
In order to calculate the exact population mean from the beyond mentioned
sample gain, the inferential data of standard error of average and a 100(1-α)%
confidence interval of true mean and sampling distribution of standard
deviation were determined.
As to compare the non-verbal rating of both genders (male & female) teachers
on the basis of their masculinity and femininity difference, an appropriate
statistical Z-test for both genders was applied.
Similarly, so as to evaluate the non-verbal behaviour of instructor in three
diverse educational institutions explicitly, government, private, and semi
government & standard private educational institutions, the most suitable test
statistic was F-test computed by using ANOVA technique. F test is used if we
want to compare more than two population mean and then we use ANOVA
techniques which means Analysis of variance.

76
Furthermore, Pearson co-relation tool was applied to measure the connection
among variables i.e. nonverbal behaviour score of instructor with learners‟
educational accomplishment, and to arrange the essential postulation of
linearity.
Similarly, for the purpose of driving a conclusion from the value of real
population interrelation between the unspoken communication of teachers and
learner educational accomplishment, the chances of error was computed by
using the formula (P.Er). In this formula, if they obtained computed value “r”
is smaller than 4×P.Er; it means that there is no relation among the variables.
But, if obtained value “r” is equal or less than 4×P.Er, and then it means that
there is some relationship between these two variables. There is a strong
relation among these two variables when computed value of co-efficient of co
relations is equal to 6×pEr, or 5×PEr (Garret, 2000, P.170-173).
Generally used confidence levels for testing hypotheses are 1% or 5% and or
10%. These are pre-assigned values and its known is a type first error. It is the
probability of rejecting the null hypothesis when actually it is true.
3.10 Ethics in Research
It must be stated here that a social research requires paying special attention the issue
of ethical values. The main ethical issues and values include the informed consent,
confidentiality, intrusiveness and anonymity. For this purpose, a researcher needs to
have rising standards of individual and professional integrity. A researcher needs to
very much careful about the research site and the well-being of the individual
participants. For the undergoing‟ research, ethical permission was given by the ethics
committee of Qurtuba University Peshawar, Pakistan. The researcher also received
permission from District education officer, Karak. Furthermore, the investigator is
obligated to preserve the participant‟s rights in two ways; by informing the
participants‟ of their role in the research and by maintaining confidentiality during the
study.
Before conducting a survey or observe nonverbal behaviour of teachers, it was
compulsory to get a written permission of willingness from all the participated

77
teachers and all the participants agreed that they were briefed about the purpose and
nature of the study and that they were fully ready to cooperate in the task they were
participating.
In this connection, confidentiality refers to the satisfaction given by the researcher
that the obtained data should not be exposed to any other individual, professionals,
and organizations, and that the participated teachers‟ names would be kept secret.
Teachers „participation was entirely willingly and they voluntary presented to be
observed during their classes for the purpose of the research. Similarly, every
participant was informed that he/she had the right to remove from the research at any
stage and time. Furthermore, apart from their willing participate the researcher also
made it sure that there was no hazard or potential risk that would have resulted from
involvement in this study.
During the process of carrying out this study, the researcher faced a bunch of
problems in relation to the collection of data. Firstly the dates which were plan for
data collection by the investigator were not easy for some institutions, because of their
annual examinations as well as because of some cultural restrictions. This fact made it
difficult for the researcher to collect data and to observe the school teachers non-
verbal communication. Secondly, majority teachers‟ have no proper awareness about
the fields of non-vocal communication. Majority teachers had not been participated in
any research activities before and all the participated teachers have no knowledge
regarding verbal and nonverbal communication. Initially, the teachers felt confused
because of the fact that someone was present there for observing and recording their
behavior inside the class, but this shyness and confusion was removed by them very
soon.
Finally, this study was mainly conducted within the positivistic and paradigm. For this
purpose, observational form and rating scale were used as a medium in order to
collect data for accurate analysis. This data was collected by conducting face to face
observations of the teachers. As a result of all this, obtained data was sesylama by
applying inferential and descriptive statistics.

78
CHAPTER 4
Presentation, Analysis and Interpretation of the Data
For the aim of this research, the basic source of data collection included the nonverbal
behaviors of teachers‟ and the educational accomplishments of the students. In order
to accurately record and further analyze the nonverbal behavior of the teachers, an
observational form was used during the lessons delivered by them. Similarly, results
from the concerned boards were obtained in order to check and then compare the
accomplishments of the learners‟. The secondary source of information gathering was
a related literature review and document in limited and international prospective. The
data which was achieved from these sources were identified to qualitative and
quantitative analysis with their reliability and validity was observed through the use of
statistical tests.
For the purpose of studying group dynamics, Flanders‟ research work was used to
identify the sequence of interrelationship between the individual teachers and
students. This research work helped to know which students were giving attention,
and which kind of attention was directed towards each student. In the present study,
the researcher studied a group of teachers in order to bring out their group behaviour.
The nonverbal behaviour of 108 teachers was scored through proper methodology.
Later on, in order to have a holistic view of the outcome the individual nonverbal
behaviour scores were summed up into group behaviour scores.
This study examined the nonverbal behaviour of the teachers with the purpose to find
out the average and standard variation of unspoken score of trainers‟. The study was
also aimed to determine interrelation among the non-verbal rating score with their
learner educational accomplishments through correlation techniques. During this
process, the non-verbal communication of teachers was observed not only towards the
individual students but also towards the class as a whole.
The obtained data also disclosed the teachers understanding level about the conscious
use of nonverbal cues, and how much impact this knowledge have upon the
educational accomplishments of the students. All these revelations were made in a
form of descriptive statistics. Furthermore, mean standard error and standard
79
deviation, and inferential statistic that are confidence intervals about population mean,
and the testing of hypothesis, Z-test, ANOVA and co-efficient of correlation in this
regard was determined by using statistical tools for data analysis.
At this stage, it is pertinent to mention that although the aim and focus of the present
research was the nonverbal behaviors of teachers, but the verbal behaviour has served
as the context in which the nonverbal behavior took place and performed its purpose.
The outcomes of the analysis are provided in the below tables;
Table-4: The Frequency Distribution of the Teachers‟ Nonverbal Behavior rating
Scores
Nonverbal
Scores of
Teachers
f Class
Mark
Class
Boundaries
h Tally
21-23 3 22 20.5-23.5 3 III
24-26 6 25 23.5-26.5 3 IIIII I
27-29 12 28 26.5-29.5 3 IIIII IIIII II
30-32 24 31 29.5-32.5 3 IIIII IIIII IIIII IIIII IIII
33-35 23 34 32.5-35.5 3 IIIII IIIII IIIII IIIII III
36-38 27 37 35.5-38.5 3 IIIII IIIII IIIII IIIII IIIII
II
39-41 11 40 38.5-41.5 3 IIIII IIIII I
42-44 2 43 41.5-44.5 3 II
∑ 108
Table 4 shows the one hundred and eight teachers‟ nonverbal rating scores where the
nonverbal behaviour of every teacher is rated on a rating scale and the non-verbal
communication score of every trainer determined by means of summarization score
on seven different aspects. Similarly, the average rating score as well as standard
variations calculated. From each institution, the nonverbal behaviour of three teachers
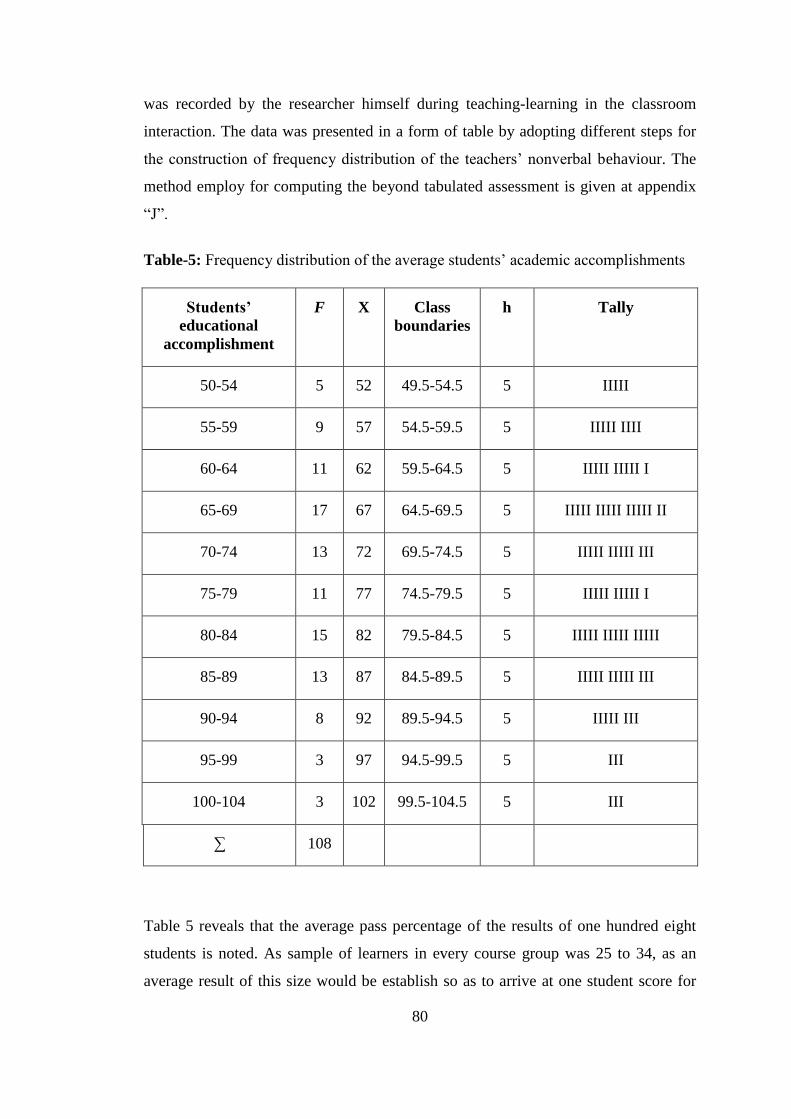
80
was recorded by the researcher himself during teaching-learning in the classroom
interaction. The data was presented in a form of table by adopting different steps for
the construction of frequency distribution of the teachers‟ nonverbal behaviour. The
method employ for computing the beyond tabulated assessment is given at appendix
“J”.
Table-5: Frequency distribution of the average students‟ academic accomplishments
Students’
educational
accomplishment
F X Class
boundaries
h Tally
50-54 5 52 49.5-54.5 5 IIIII
55-59 9 57 54.5-59.5 5 IIIII IIII
60-64 11 62 59.5-64.5 5 IIIII IIIII I
65-69 17 67 64.5-69.5 5 IIIII IIIII IIIII II
70-74 13 72 69.5-74.5 5 IIIII IIIII III
75-79 11 77 74.5-79.5 5 IIIII IIIII I
80-84 15 82 79.5-84.5 5 IIIII IIIII IIIII
85-89 13 87 84.5-89.5 5 IIIII IIIII III
90-94 8 92 89.5-94.5 5 IIIII III
95-99 3 97 94.5-99.5 5 III
100-104 3 102 99.5-104.5 5 III
∑ 108
Table 5 reveals that the average pass percentage of the results of one hundred eight
students is noted. As sample of learners in every course group was 25 to 34, as an
average result of this size would be establish so as to arrive at one student score for

81
every instructor gain. The combination of this provides a standard data set allowing
comparison of one teacher against one learner. From each institution, the average
pass percentage of the students in each subject was obtained from the available school
record. The data was presented in a form of a table by adopting different statistical
tools for the construction of frequency distribution of the average students‟ academic
accomplishments.
The method used for computing above tabulated value is given at appendix „K‟.
Table-6: Values of Standard deviation of mean, Mean and Standard deviation of
non-verbal behaviour score of teacher, while accepting feelings of the students:
Standard Error(x
S ) Mean ( x ) Standard Deviation
(S)
A 100(1-α)% C.I
for
0.09 5.65 0.96 83.547.5
The above table reveals that while accepting feeling of the students‟ during teaching
learning process inside the class, the overall mean nonverbal behaviour score of the
arts teacher was 5.65 with very small dispersion in the arts teachers‟ individual
nonverbal communication score that was 0.96. This statistic indicates that the
teachers‟ nonverbal behavior was extremely compatible and cohesive with their
spoken communication. It convey an idea indirectly, as the true average score was
estimated from sampling mean, the lower boundary of the population non-verbal
communication mean score is 5.47 and its upper limit range is 5.83, then the teachers‟
non-verbal sample mean score lies within these two limits that is demonstrated as
highly coherent and cohesive with their spoken behaviour.
The method applied for calculating above value is given at appendix „A7‟ and „B1‟.

82
Table 7: Values of arithmetic Mean, average error, and Standard deviation of
nonverbal behaviour scores of teachers, while accepting students’ ideas:
Standard Error(x
S ) Mean ( x ) Standard Deviation
(S)
A 100(1-α)% C.I
for
0.06 5.56 0.95 77.553.5
The above table reveals that during the time of accepting different ideas of the
students, the overall mean nonverbal behaviour score of the arts teacher was 5.56 with
very small dispersion in the arts teachers‟ individual nonverbal communication score
that was 0.95. This also indicates that the arts teachers‟ nonverbal behavior was
completely consistent and cohesive with their spoken behaviour. It convey an idea
indirectly, as the true average score was estimated from sampling average, the lower
boundary of the population non-verbal communication mean score is 5.53 and its
upper limit range is 5.77, then the teachers‟ non-verbal sample mean score also lies
within these two limits that is demonstrated as highly coherent and cohesive with their
spoken behaviour.
The method use for computing above calculated value is provided at appendix „A8‟ as
well as „B2‟.
Table-8: Values of sample Mean, average error, and Standard deviation of
nonverbal behaviour score of teachers, while making questions:
Standard Error(x
S ) Mean ( x ) Standard Deviation
(S)
A 100(1-α)% C.I
for
0.09 5.68 0.94 86.550.5
The above table reveals that during the time when the teachers asked questions from
the students, the overall mean nonverbal behaviour score of arts teacher was 5.68 with
very small dispersion in the arts teachers‟ individual nonverbal communication score
that was 0.94. This indicates that the arts teachers‟ nonverbal behavior was vitally
consistent and cohesive with their spoken behaviour. It conveys an idea indirectly, as

83
soon as the true average score was estimated from random sampling average, the
lower boundary of the population non-verbal communication mean score is 5.50 and
its upper limit range is 5.86, then the teachers‟ non-verbal sample mean score lies
within these two limits that is demonstrated as highly coherent and cohesive with their
spoken behaviour.
The method use for computing above calculated value is provided at appendix „A9‟ as
well as in „B3‟.
Table-9: Values of Arithmetic Mean, Average error and Standard deviation of
nonverbal rating score of teachers, while delivering lecture:
Standard Error(x
S ) Mean ( x ) Standard Deviation
(S)
A 100(1-α)% C.I
for
0.09 5.52 0.95 70.534.5
The above table reveals that during the time of delivering lectures to the students, the
overall mean nonverbal behaviour score of the arts teachers was 5.52 with very small
dispersion in the arts teachers‟ individual nonverbal communication score that was
0.95. This indicates that the arts teachers‟ nonverbal behavior was favorably
consistent and cohesive with their spoken behaviour. It convey an idea indirectly,
whilst the true average score was estimated from sampling mean, the inferior
boundary of the population non-verbal communication mean score is 5.34 and its
upper limit range is 5.70, then the teachers‟ non-verbal sample mean score lies within
these two limits that is demonstrated as highly coherent and cohesive with their
spoken behaviour.
The method employ for computing above calculated value is provided at appendix
„A10‟ and „B4‟.

84
Table 10: Values of sample Mean Standard error and Standard deviation of
nonverbal behaviour score of teachers, while giving directions:
Standard Error(x
S ) Mean ( x ) Standard Deviation
(S)
A 100(1-α)% C.I
for
0.09 5.56 0.97 74.538.5
The above table reveals that during the time of giving different directions to the
students, the overall mean nonverbal behaviour score of the arts teacher was 5.56 with
very small dispersion in the arts teachers‟ individual nonverbal communication score
that was 0.97. This indicates that the arts teachers‟ nonverbal behavior was vitally
consistent and cohesive with their spoken behaviour. It convey an idea indirectly,
while the true mean score was estimated from simple random sample mean, the lower
boundary of the population non-verbal communication mean score is 5.38 and its
upper limit range is 5.74, then the teachers‟ non-verbal sample mean score lies within
these two limits that is demonstrated as highly coherent and cohesive with their
spoken behaviour.
The method employ for computing above calculated value is provided at appendix
„A11‟ and „B5‟.
Table 11: Values of Sample Mean, Average error and Standard deviation of
nonverbal score of teachers, while criticizing & justifying authorities:
Standard Error(x
S ) Mean ( x ) Standard Deviation
(S)
A 100(1-α)% C.I
for
0.10 5.45 1.06 65.525.5
The above table reveals that during the time of criticizing students and justifying
authorities in a given situation, the grand total average of the teachers‟ nonverbal
score was 5.45 with a very small amount of variation in the arts teachers‟ nonverbal
communication score. This was measured in term of standard deviation that is 1.06. It

85
clearly indicates that the nonverbal behaviour rating score of teachers‟ was favorably
consistent and constant with their spoken behaviour. It convey an idea indirectly,
while the true average score was estimated from simple random sample, the lower
boundary of the population non-verbal communication mean score is 5.25 and its
upper limit range is 5.65, then the teachers‟ non-verbal sample mean score lies within
these two limits that is demonstrated as highly coherent and cohesive with their
spoken behaviour.
The method employ for computing above calculated value is provided at appendices
“A12” & “B6”.
Table 12: The Relationship among unspoken communication rating Score of
male and female Teacher’s While Accepting Student's thoughts (Observation
1&2):
Gender n x S2
Z cal
Male 54 5.69 0.96 0.43
Female 54 5.61 0.90
,96.12
Z at α = 0.05
The data in table 12 reveals that; the computed Z value is smaller than the Z-tabulated
i.e. Z tab = 96.1 , at 0.05 significance level. The assumption under H01 is accepted.
Therefore, no statistical diversity among the average nonverbal behaviour rating score
of both gender (male & female) teachers, even as accepting thoughts of students‟.
The method employ for computing above calculated value is provided at appendix
„C1, D1 & E1‟.

86
Table 13: The Relationship among Non-verbal Behaviour rating Score of Female
and Male Teacher's, While Accepting Students Feelings (Observation 3)
Gender N x S2
Z call
Male 54 5.56 1.25
-0.05 Female 54 5.57 0.64
,96.12
Z at α = 0.05
The data in table 13 reveals that; the computed Z value i.e. Z call= -0.05 which is less
than Z-tabulated value i.e. Z tab = 96.1 , at 0.05 significance level. The assumption
under H01 is accepted. Therefore, no statistical variation is found among the average
nonverbal behaviour rating score of both (male & female) instructors even as
accepting learners‟ idea.
The method employ for computing above calculated value is provided at appendix
„C2, D2 & E2‟.
Table 14: The Relationship among Non-verbal Behaviour Score of both (male &
female) Teacher, as asking Problem (Observation 4):
Gender N x S2
Z Cal
Male 54 5.61 1.04
-0.72
Female 54 5.74 0.71
,96.12
Z at α = 0.05
The data in table 14 reveals that; the computed value of Z i.e. Z Cal= -0.72, which is
less than Z-tabulated value i.e. Z tab = 96.1 , at 0.05 significance level. The
assumption under H01 is accepted. Therefore, no significant variation is found among
the average nonverbal behaviour rating score of both gender (male & female) teachers

87
as asking problems. The method employ for computing above calculated value is
provided at appendix „C3, D3 & E3‟.
Table 15: The relationship among Nonverbal Behaviour Score of Female and
Male Teachers, While Delivering Lecture (Observation 5):
Gender N x S2
Z Cal
Male 54 5.46 1.06
-0.61
Female 54 5.57 0.72
96.12
Z at α = 0.05
The data in table 15 reveals that; the Z computed value i.e. Z cal= -0.61 which is less
than Z-tabulated value i.e. Z tab = 96.1 , at 0.05 significance level. The assumption
under H01 is accepted. Therefore, no important variation is found among the average
non-verbal behaviour rating score of both (male & female) teachers at the same time
as delivering a lecture. The method employ for computing above calculated value is
provided at appendix „C4, D4 & E4‟.
Table 16: The relationship among Nonverbal Behaviour Score of both gender
(male & female) Teachers, While Giving Directions (Observation 6)
Gender N x S2
Z cal
Male 54 5.48 1.03
-0.62
Female 54 5.57 0.72
96.12
Z at α = 0.05
The data in table 16 reveals that the calculated value of Z i.e. Z Cal= -0.62 which is
less than Z-tabulated value i.e. Z tab = 96.1 , at 0.05 significance level. The
assumption under H01 is accepted. Therefore, no variation is found among the average
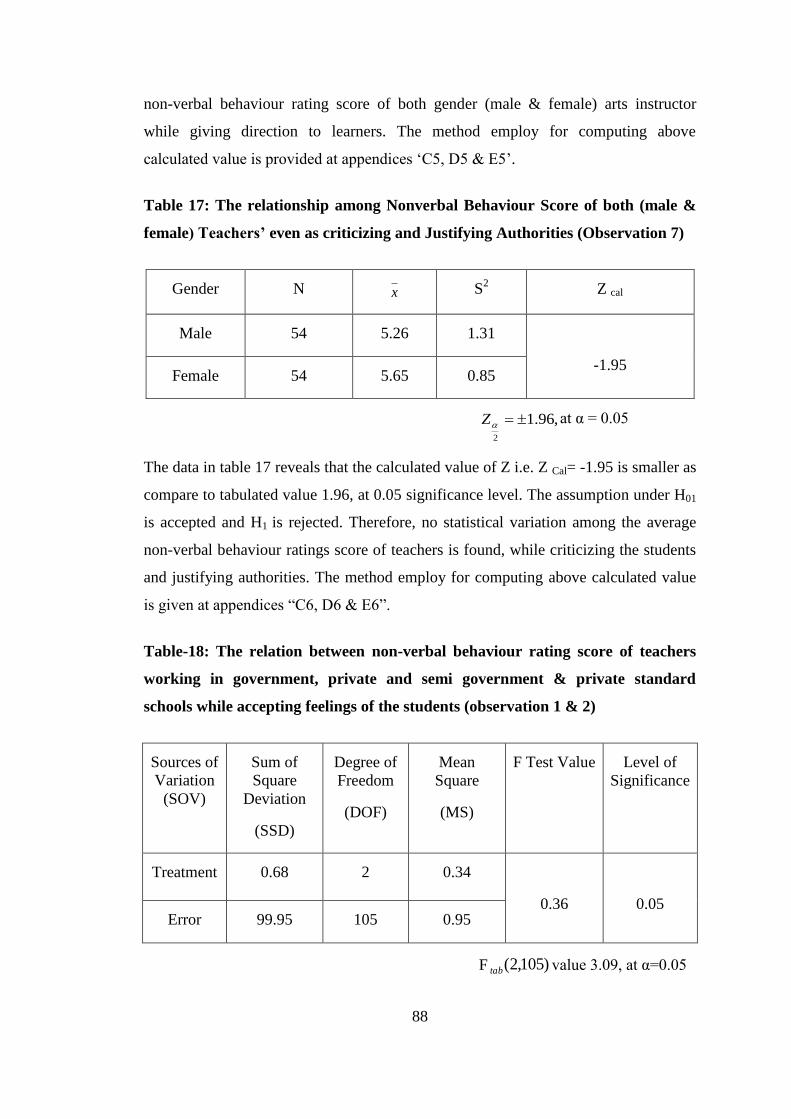
88
non-verbal behaviour rating score of both gender (male & female) arts instructor
while giving direction to learners. The method employ for computing above
calculated value is provided at appendices „C5, D5 & E5‟.
Table 17: The relationship among Nonverbal Behaviour Score of both (male &
female) Teachers’ even as criticizing and Justifying Authorities (Observation 7)
Gender N x S2
Z cal
Male 54 5.26 1.31
-1.95 Female 54 5.65 0.85
,96.12
Z at α = 0.05
The data in table 17 reveals that the calculated value of Z i.e. Z Cal= -1.95 is smaller as
compare to tabulated value 1.96, at 0.05 significance level. The assumption under H01
is accepted and H1 is rejected. Therefore, no statistical variation among the average
non-verbal behaviour ratings score of teachers is found, while criticizing the students
and justifying authorities. The method employ for computing above calculated value
is given at appendices “C6, D6 & E6”.
Table-18: The relation between non-verbal behaviour rating score of teachers
working in government, private and semi government & private standard
schools while accepting feelings of the students (observation 1 & 2)
Sources of
Variation
(SOV)
Sum of
Square
Deviation
(SSD)
Degree of
Freedom
(DOF)
Mean
Square
(MS)
F Test Value Level of
Significance
Treatment 0.68 2 0.34
0.36
0.05 Error 99.95 105 0.95
F )105,2(tab value 3.09, at α=0.05

89
The above table indicates that F-computed value is 0.36 which is less than F- tab
value 3.09, at 0.05significance level. The assumption under H02 is accepted and,
therefore, its alternative hypothesis is rejected. It means that during the time of
accepting the feelings of the students, no statistical variation was found among the
nonverbal behaviour score of the instructor working in government, private as well as
semi government & private standard school systems.
The method employ for computing above calculated value is provided at appendices
„F1, G1, H1 and I1‟.
Table 19: Relation of non-verbal rating score of teachers’ serving in
Government, Private and Semi Government & Private Standard Schools while
Accepting Students’ Ideas (Observation 3)
Sources of
Variation
(SOV)
Sum of
Square
Deviation
(SSD)
Degree of
Freedom
(DOF)
Mean Square
(MS)
F Test Value Level of
Significance
Treatment 3.02 2 1.51
1.59
0.05
Error 99.53 105 0.95
F )105,2(tab value 3.09, at α=0.05
The above table reveals that F-calculated value is 1.59, which is smaller than F
tabulated value is 3.09, at 0.05 significance level. The hypothetical statement under
H02 is accepted and, therefore, the alternative hypothesis is rejected. It means that
during the time of accepting the students‟ thoughts and feelings, no statistical
variation was found among the non-verbal behaviour score of teachers‟ serving in
Government, Private as well as Semi Government & Private standard school systems.
The method employ for computing above calculated value is provided at appendices
„F2, G2, & H2 & I2‟.

90
Table-20: Relationship of non-verbal rating score of teachers’ serving in
government, private and semi government & private standard schools while
making questions (Observation 4)
Sources
of
Variation
(SOV)
Sum of
Square
Deviation
(SSD)
Degree of
Freedom
(DOF)
Mean
Square
(MS)
F Test Value Level of
Significance
Treatment 11.13 2 5.57
6.88
0.05 Error 84.53 105 0.81
F )105,2(tab value 3.09, at α=0.05
The above table reveals that F-calculated value is 6.88, which are more than F-
tabulated value is 3.09 at 5% significance level. As a result, the assumption under H02
is rejected and, therefore, the alternative hypothesis is accepted. It implies that during
the time of asking questions from the students a statistical variation was found among
the nonverbal behaviour score of educator serving in Government, Private as well as
Semi Government & Private standard school systems. The method employ for
computing the above calculated value is provided at appendices „F3, G3, & H3 & I3‟.
Table 21: Relationship of Non-verbal Score of Teachers’ Serving in Government,
Private and Semi Government & Private Standard Schools while Delivering
Lecture (Observation 5)
Sources of
Variation
(SOV)
Sum of
Square
Deviation
(SSD)
Degree of
Freedom
(DOF)
Mean
Square
(MS)
F Test
Value
Level of
Significance
Groups 11.57 2 5.79
7.15
0.05 Error 85.39 105 0.81
F )105,2(tab value 3.09, at α=0.05
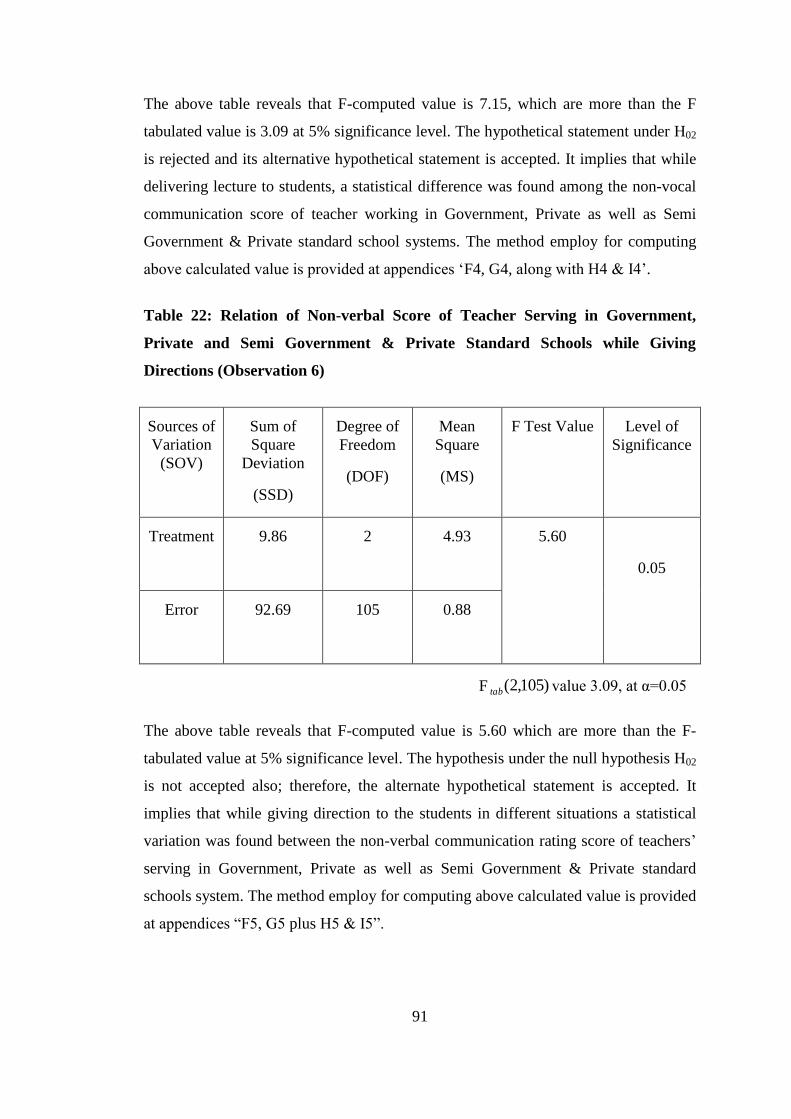
91
The above table reveals that F-computed value is 7.15, which are more than the F
tabulated value is 3.09 at 5% significance level. The hypothetical statement under H02
is rejected and its alternative hypothetical statement is accepted. It implies that while
delivering lecture to students, a statistical difference was found among the non-vocal
communication score of teacher working in Government, Private as well as Semi
Government & Private standard school systems. The method employ for computing
above calculated value is provided at appendices „F4, G4, along with H4 & I4‟.
Table 22: Relation of Non-verbal Score of Teacher Serving in Government,
Private and Semi Government & Private Standard Schools while Giving
Directions (Observation 6)
Sources of
Variation
(SOV)
Sum of
Square
Deviation
(SSD)
Degree of
Freedom
(DOF)
Mean
Square
(MS)
F Test Value Level of
Significance
Treatment 9.86 2 4.93
5.60
0.05
Error 92.69 105 0.88
F )105,2(tab value 3.09, at α=0.05
The above table reveals that F-computed value is 5.60 which are more than the F-
tabulated value at 5% significance level. The hypothesis under the null hypothesis H02
is not accepted also; therefore, the alternate hypothetical statement is accepted. It
implies that while giving direction to the students in different situations a statistical
variation was found between the non-verbal communication rating score of teachers‟
serving in Government, Private as well as Semi Government & Private standard
schools system. The method employ for computing above calculated value is provided
at appendices “F5, G5 plus H5 & I5”.

92
Table-23: Relationship of Non-verbal Rating Score of Teachers serving in
Private, Government and Semi Government & Private Standard Schools while
criticizing and justifying Authorities (Observation 7)
Sources of
Variation
(SOV)
Sum of
Square
Deviation
(SSD)
Degree of
Freedom
(DOF)
Mean
Square
(MS)
F Test Value Level of
Significance
Treatment 16.35 2 8.18
8.26
0.05
Error 104.42 105 0.99
F )105,2(tab value 3.09, at α=0.05
The above table reveals that F-computed value is 8.26 which are more than the F
tabulated value at 5% significance level. The hypothesis under the null statement H02
is not accepted also; therefore, the other hypothetical statement was established. It
implies that while criticizing and justifying authorities, a significant variation was
found between the non-vocal communication rating score of instructor serving in
three the different educational systems such as Government, Private as well as Semi
Government & Private standard school.
The method employ for computing above calculated value is given at appendices „F6,
G6, along with H6 & I6‟.
Table-24: The interrelation among the non-verbal rating score of teacher with
their students educational accomplishments:
Sample size Co-efficient of
correlation
Chances of
error (P. Er)
Strength of relationship
108 0.77 0.03 Strong „+ve‟ relationship

93
The above table reveals that the coefficient of correlation i.e. r = 0.77, is much greater
than 6×P.E; therefore, the hypothesis under the null hypothesis H03 is rejected. It
denotes a strong positive interrelation among the non-verbal communication rating
score of teacher with their learners educational accomplishments. The method used in
computing the above calculated values is given in appendix “L”.
In this chapter, the researcher presented a detail discussion regarding data
presentation, analysis and interpretations. In order to come across accurate findings,
different statistical tools were adopted for computing the values of the test statistic.
The next chapter would focus on summary, conclusions, findings, and future
suggestions in the light of data analysis.
94
CHAPTER 5
Summary, Findings, Conclusions, Discussion and Recommendations
The present research investigated the role of nonverbal communications of school
teachers and students‟ academic accomplishments. Similarly, it was also aimed to find
out how they utilize and integrate nonverbal communication during the teaching
learning process inside the classroom. In this connection, the current section deal
through, summary, findings, conclusion, discussion and recommendation of the
research on the basis of the facts which was analyzed, collected and understand with
the help of arithmetical tools. Furthermore, this chapter also explains findings of the
study in terms of the literature review, which are then followed by detail summary of
the outcomes of the study. Along with this limitation is also presented, in which the
researcher encountered during the process of this investigation. As a result of all this,
a section is devoted to the recommendations for other scholars on the basis of which
the researcher would like future research to be carried out in the field of nonverbal
behaviour.
5.1 Findings
In order to bring out the best possible and precise results out of this research, the
researcher used a quantitative approach in this study. For this purpose, the
observational data was obtained from the observational forms which were recorded
during the observations of the teacher in real time teaching inside the classrooms. In
this process of data collection, the researcher focused on the teachers‟ conscious and
unconscious use of nonverbal behavior in their interactions with the students. Based
on data analysis and literature review the study found that;
1. During the time of accepting the feelings of the students in active interaction
the overall mean nonverbal behaviour rating score of the arts teachers was
5.65 with very small dispersion in arts teachers individual nonverbal scores
0.96. This indicates that the arts teachers‟ nonverbal behaviour scores were
highly consistent and cohesive with their spoken or verbal behaviour. When
true population average rating score was estimated on the basis of sample
mean, then the 95% confidence interval of true population mean lies within

95
the limits i.e. 5.47 5.83. Hence, this result is demonstrated as vitally
coherent with their spoken communication. (See Table 6)
2. In the field of accepting ideas of the students during the interaction with them,
the population average nonverbal behaviour rating score of the arts teachers
was 5.56 with very small dispersion in the arts teachers‟ individual nonverbal
behaviour scores as 0.95. This indicates that the arts teachers‟ nonverbal
behaviour scores were highly consistent and cohesive with their spoken or
verbal behaviour. When true population average rating score was estimated on
the basis of sample mean, then the 95% confidence interval of true population
mean lies within the limits i.e.5.53 5.77, that was interpreted as highly
consistent and coherent with their verbal communication. (See Table 7)
3. While asking questions from students, the population average nonverbal
behaviour rating score of the arts teachers was 5.68 with very small dispersion
in the arts teachers‟ individual nonverbal behaviour scores as 0.94. This
indicates that the arts teachers‟ nonverbal behaviour scores were highly
consistent and cohesive with their spoken or verbal behaviour. When true
population average rating score was estimated on the basis of sample mean,
then the 95% confidence interval of true population mean lies within the limits
i.e.5.50 5.86, that was interpreted as highly consistent and coherent with
their verbal communication. (See Table 8)
4. While delivering lecture to the students, the population average nonverbal
behaviour rating score of the arts teachers was 5.52 with very small dispersion
in arts teachers‟ individual nonverbal behaviour scores as 0.95. This indicates
that the arts teachers‟ nonverbal behaviour scores were highly consistent and
cohesive with their spoken or verbal behaviour. When true population average
rating score was estimated on the basis of sample mean, then the 95%
confidence interval of true population mean lies within the limits i.e.5.34
5.70, that was interpreted as highly consistent and coherent with their
verbal communication. (See Table 9)

96
5. While giving directions to the students about the performance of some specific
tasks, the population average nonverbal behaviour rating score of the arts
teachers was 5.56 with very small dispersion in arts teachers‟ individual
nonverbal behaviour scores as 0.97. This indicates that the arts teachers‟
nonverbal behaviour scores were highly consistent and cohesive with their
spoken or verbal behaviour. When true population average rating score was
estimated on the basis of sample mean, then the 95% confidence interval of
true population mean lies within the limits i.e.5.38 5.74, that was
interpreted as highly consistent and coherent with their verbal communication.
(See Table 10)
6. While criticizing and justifying authorities, the population average nonverbal
behaviour rating score of the arts teachers was 5.45 with very small dispersion
in arts teachers‟ individual nonverbal behaviour scores as 1.06. This indicates
that the arts teachers‟ nonverbal behaviour scores were highly consistent and
cohesive with their spoken or verbal behaviour. When true population average
rating score was estimated on the basis of sample mean, then the 95%
confidence interval of true population mean lies within the limits i.e. 5.25
5.65, that was interpreted as highly consistent and coherent with their
verbal communication. (See Table 11)
7. Similarly, there was no statistical variation found among the average
nonverbal behaviour score of both gender (male & female) arts teacher based
on their gender differences while accepting the feelings of the students inside
the classroom during their real time teaching. The computed value of Z
statistic 0.43 which was not important at 5% significance level. As a result, the
null hypothetical statement under the hypothesis H01 is accepted as well as its
alternative hypothesis is rejected. (See Table 12)
8. There was no statistical variation among the average nonverbal behaviour
rating score of both (male & female) teachers based on their gender
differences while accepting the ideas of the students during their interactions
inside the classroom. The obtained Z computed value (-0.05) was not
statistically important at 5% significance level. Therefore, the null

97
hypothetical statement under the assumption H01 is not rejected but accepted.
(See Table 13)
9. There was no statistical variations between the average non-verbal behaviour
rating scores of both (male & female) teachers‟ based on their sex differences
while asking various types of questions (open ended, close ended etc.) from
the students for different purposes. The computed value of Z (-0.72) was not
statistically significant at 5% level of significance. Thus, the null hypothesis
under the assumption H01 is not rejected however accepted. (See Table 14)
10. There was no statistical variation among the average nonverbal behaviour
rating score of both (male & female) arts teacher based on their gender
differences while delivering lecture to the students inside the classroom. The
calculated Z value -0.61, was not statistically significant at 5% significance
level. Thus, the null hypothetical statement under the assumption H01 is not
rejected other than accepted. (See Table 15)
11. There was no statistical variation between the average non-verbal behaviour
rating score of both (male & female) teachers based on their sex differences
while giving different types of instructions to the students inside the
classroom. The computed value of Z test statistic is -0.62, which was not
important at 5% significance level. Therefore, the null hypothetical statement
under the assumption H01 is accepted by means of its alternative hypothesis
rejected. (See Table 16)
12. There was no statistical variation between the average non-verbal behaviour
rating score of both (male & female) counterpart instructor based on their sex
differences while criticizing and justifying authorities. The obtained value of Z
test statistic is -1.95 which was not significant at 5% significance level. as a
result, the null hypothetical statement under the assumption H01 is established
as well as its alternative hypothesis is rejected. (See Table 17)
13. While accepting feelings of the students, no statistical variation was found
among the non-verbal communication score of teacher working in
government, private as well as semi government & private standard school

98
systems. The obtained F value 0.36 was not statistically significant at 5%
significance level. Thus, the null hypothetical statement under the assumption
H02 is accepted in addition to its unconventional assumption is rejected. (See
Table 18)
14. While accepting ideas of the students, no statistical variation was found among
the non-verbal communication score of the instructor working in government,
private as well as semi government & private standard school systems. The F
calculated value 1.59 was insignificant at 5% significance level. As a result,
the null hypothetical statement under the assumption H02 is acknowledged and
its alternatives hypothesis is rejected. (See Table 19)
15. While asking question from the students, a statistical variation was found
between the non-verbal communication rating score of teachers‟ serving in
government, private and semi government & private standard school systems.
The calculated value of F statistic 6.88 was more than the tabulated value at
5% significance level. This means that the test statistic value is significant. As
a result, the null hypothesis under the assumption H02 is not accepted but
rejected and its alternatives hypothesis is accepted. (See Table 20)
16. While delivering lecture to the students, a statistical variation was found
between the non-verbal communication rating score of teachers‟ serving in
government, private and semi government & private standard school systems.
The F obtained value 7.15 was more than the F tabulated value with 2 and 105
degree of freedom at 5% significance level. So, the null hypothetical statement
H02 is discarded as well as it‟s another hypothesis is accepted. (See Table 21)
17. While giving directions to the students for different purposes, a statistical
deviation was found among the nonverbal communication rating score of
teachers‟ serving in government, private and semi government & private
standard school systems. The computed value of F test statistic is 5.60 which
are more than tabulated value at 5% significance level. Thus, the hypothetical
statement under the assumption H02 is discarded also its opposite hypothesis is
established. (See Table 22)
99
18. While criticizing and justifying authorities, a statistical variation was found
between the non-verbal communication rating score of teachers‟ serving in
government, private and semi government & private standard school systems.
The calculated value of F statistic is 8.26, which is more than the F tabulated
value at 5% significance level. Hence, the hypothetical statement under the
assumption H02 is discarded also its opposite hypothesis is acknowledged.
(See Table 23)
19. The study found a very strong and positive relation between the nonverbal
behaviour rating scores of the arts teachers and the educational
accomplishments of the students. The coefficient of correlation between the
nonverbal behaviour rating scores of the teachers and the students‟ academic
learning is 0.77, which is much greater than 6×PEr (Garret, 2000). As a result,
the null hypothesis under the assumption H03 is rejected. (See Table 24)
5.2 Conclusions
After proper measuring, analyzing and interpreting all the related data, the study
reported that when a teacher is conscious of his/her nonverbal signals and wisely
and carefully arrange and integrate these nonverbal cues in verbal signals then a
very positive and visible change can be brought during the academic learning of
the learners. In this study, the instructors and learners revealed understanding of
nonverbal behaviour and its significance. Similarly, the study also revealed that
this effectiveness of nonverbal communication is free from gender based
differences as the same kind of effectiveness was found in both male and female
oriented classrooms. Based on the conclusions drawn from the careful
investigation of data along with the associated text subsequent implications were
drawn:
When accepting feelings of the students the teachers showed a remarkable
coherence and consistency in their nonverbal communication. The teachers
accepted in positive and candid nonverbal behavior the negative and positive
behaviors of the students and did not make them feel threatened. During the
process of teaching-learning many of the difficult concepts and ideas were

100
reported by the students to be clarified to them by the facial expressions of the
teachers. Furthermore, due to the pleasant, encouraging and amicable
nonverbal signals of the teachers the students felt very relaxed and showed
keen interest in the learning process.
There was a great and continues step by step correlation between the
nonverbal communication and verbal behavior of the arts teachers when they
were accepting the ideas of the students in classroom interaction. This
consistency and correlation between the two kinds of communication proved
extremely helpful in creating an environment where there was no confusion
and steady interchange of ideas was made possible. The teachers did not show
any contradiction between the verbal and nonverbal behavior and their body
languages were not over controlled. The careful and wise use of body
language delivered a well-built ground to the instructors to teach more
sufficiently and effectively. The students always reported back positively and
in affirmative the understanding of various difficult concepts whenever the
teachers used movements of their hands, shoulders and head. This integration
of nonverbal behavior resulted in an effective technique which visibly
improved the overall teaching expertise of the teachers. In this process, the
most positive kind of development occurred when there was an interchange of
ideas and information. Due to the positive use of nonverbal behavior a
pleasant and suitable atmosphere was created where the students felt
encouraged and willingly presented their own ideas in the classroom based
discussion. This, in turn, also helped the teacher who further elaborated on the
suggested ideas of the learners and made the lessons learning practice very
much effective as well as fruitful.
The non-verbal behavior of the arts teachers proved very effective and
encouraging in the field of asking questions as well. The facial expressions
and body movements of the educator helped the learner a lot in differentiating
between various types of questions such as rhetorical, open ended, close ended
etc. The proper use of nonverbal behavior also helped the students in how to
respond to a particular type of question. In the open ended questions, the
teachers asked students about the contents of the course and asked about their

101
ideas and opinions. This effectiveness of nonverbal behavior was found in
asking all types of questions.
The nonverbal behaviour of the arts teachers was also very highly compatible
with their linguistic behaviour while delivering a lecture. Whenever, the
teachers presented their opinions or gave facts about certain procedures and
contents then the use of proper body language helped a lot in making better the
understanding of the students. The tone and pace of their talks was designed so
as to keep the students consistently interested in the lessons. Similarly, the fall
and rise in the teachers‟ tone also assist the learner in proper accepting of the
subject matter. Furthermore, the proper and suitable voice of the teacher as
well fixed the attraction of the learner for increase their educational
achievements. Overall, the teachers brought proper variations in their tone as
demanded by the occasion and they just did not drone on and on.
The arts teachers also showed great clarity, consistency and correlation
between their nonverbal and verbal behavior whenever they were giving
various directions to the students. In guiding their students and regulating
different behaviors of the students their proper and wise integration of
nonverbal cues helped a lot in clarifying their instructions. The students were
very well aware how to comply with those directions because of the nonverbal
cues of the teachers. In this way, the students were involved and the
implementation of rules and regulations was made very easy and smooth.
The teachers also showed great consistency and correlation between their
nonverbal and verbal behavior whenever they were criticizing some undesired
behaviors of the students and justifying authority in such cases. The teachers
used statements which were intended to change the students‟ behaviour from
undesirable to desirable pattern and these statements were supported and
backed up by their nonverbal cues. The nonverbal behaviour was constant by
means of firm language used in calculating misconduct of the students.
Furthermore, it was not severe and aggressive and perfectly matched the
verbal behaviour.

102
The research work also exposed that there was little variation in the
effectiveness of non-verbal communication of both genders. Both genders
(male & female) instructors encourage and praised students‟ actions and tried
to be humorous in classrooms to avoid any type of tense in the classroom. This
created good impression on students and encouraged their class participation.
Similarly, no significant variation was found between the non-verbal
behaviour of the arts teachers‟ serving in government, public and semi
government and private standard school systems while accepting the ideas and
feelings of the students. However, a little bit difference was found while
asking questions, delivering lectures, giving directions and justifying
authorities.
It was too drawn from the research that suitable make use of unspoken
behavior not only helped in facilitating the learning process, other than too
described the professional interest and attitude of teachers‟ tends to teaching
as a profession. It was concluded that the conscious and intentional use of
nonverbal behavior changed the perception of the teachers about their teaching
and motivated them a lot because of its effectiveness and fruit-bearing
outcomes. Along with them, the students also showed a greater degree of
interest and motivation in teaching-learning process. All this resulted in
greater involvement of students and better educational accomplishments.
On the other hand, those teachers who did not take nonverbal behavior into
consideration during the course of teaching-learning process showed a
remarkable decreased level of interest in their teaching. Similarly, they were
also unable to increase the interest and motivate enthusiastic involvement and
participation of their learners in teaching- learning procedure. Eventually, all
this resulted in the low and poor educational accomplishments of their
students.
Finally, it can be said that a very strong correlation was found between the
nonverbal behaviour of the arts teachers and the educational accomplishments
of their students. It was revealed that carefully and properly selected nonverbal
behavior is the corner stone of effective teaching-learning process. Proper
103
guidance, counseling, careful directions while delivering lectures and
criticizing students for their misbehavior all these are essential and integral
elements without which no teaching can take place, besides for the most part
of questioning and answering to the expressions of students with proper and
suitable to the occasion nonverbal cues and behaviour created educational
achievements‟ to a better degree.
5.3 Summary
The present research was descriptive cum observational, which investigates the
significance of nonverbal behavior of teachers on students‟ academic learning process
in the real classroom arrangement. The research was bringing out in the areas of Urdu,
English and Islamyiat at IX-X classes. The nonverbal cues were delimited to facial
expression, body movements and eye contacts among instructors and learners.
The undergoing research was a descriptive and its purpose and aim was to investigate
and find out that how much important role the nonverbal cues and behavior plays in
helping to understand the verbal behavior, and how this could be beneficial in
teaching learning process in the actual classroom setting. The basic structure of the
research work designed as a result to examine in depth relation among the non-verbal
interactions of the instructors‟ along with its effect upon the educational
accomplishments of the students. In this connection, the major objectives were to
determine the non-verbal behaviour of educators serving in three different school
systems during instructions and to compare and contrast the nonverbal behaviour of
arts teachers serving in above mentioned three school systems. Similarly, it was also
aimed to relate the non-verbal behaviour of both (male &female) arts teachers‟ of
these school systems based on their gender differences. Furthermore, the end result
was to measure the interrelation between these teachers non-verbal communication
and the student‟s educational accomplishments.
So far the area is concerned, this research was limited to facial expressions, the
teachers‟ body language, eye contacts, gestures and postures and pace of talk of all
gender elementary & secondary schools arts teacher serving in government, private as
well as semi government & private standard schools in the vicinity of district Karak.

104
Samples of one hundred and eight (108) arts teacher were randomly selected from the
beyond educational institutions during two-phase sample techniques.
For the purpose of exact measuring of the variable instructors‟ nonverbal
communications, a seven point differential evaluation scale depends on Galloway‟s
classification of non-verbal behaviour be developed. Furthermore, the observational
form complemented the spoken aspect of Flanders interaction categories system
through non-verbal aspect.
Similarly, the paradigm of the study was quantitative like as; observational cum
descriptive. For data compilation, the observational technique was used and each arts
educator was noticed by the investigator himself twice throughout different lessons
time for about five to seven minutes. For the accuracy of data collection the
inspection were continuously assembled. The last ranking was allocated by average of
together ratings. Along with this, for better analysis of the date and to introduce
greater objectivity in the research the spoken and non-spoken communications of
every arts instructor was also videotape and analyze by the research supervisor to
facilitate the consistency and dependability of the observed behaviour of the teachers.
On the other hand, data of the other variable regarding the academic accomplishments
of the students was composed from different school records. This data comprised the
results of the secondary examination detained by the Board of Intermediate and
Secondary Education, Kohat. For the purpose of finding true results of the study, this
data was collected six months behind the watching session. For data investigation,
score assign to trainer were evaluated and non-verbal behaviour rating evaluation of
every trainer was investigated by summing up score on seven dimensions of non-
verbal performance of the instructor. Later on, the average achievement and average
deviations were calculated. The dissimilarity among the average score of both genders
(male & female) arts instructor of government, private and semi government &
private standard school with educator of government also personal zone was
experienced by using Z plus ANOVA techniques. Similarly, the interrelation among
the instructors non-verbal behaviour score on their students‟ educational
accomplishments in their classes was determined and computed by using the Pearson

105
co-efficient of correlation „r‟. For the validity and reliability, a 5% significance level
was used.
On the basis of data analysis the research work find out the following conclusions:
Facial appearance like smile and anger would assist the learners to recognize
the communications, which should be useful to improve their behavior
according to the teaching in the classroom atmosphere requirements.
Eye interaction would also play an important role in teaching learning process
as these communications prepared the learners‟ aware as well as attentive in
the classroom environment.
The final result of the study revealed that instructors finished the education
atmosphere dynamic through their bodily movements; whereas learners feel
paying special attention in the class room and took vigilant involvement in
teaching development process.
5.4 Discussions
The present research work was carrying out to observe the significant effect of non-
verbal behaviour of teachers within the classroom on their students‟ educational
accomplishment. As every research work has a number of objectives and all the
objectives are not equally important. The primary objective of the present study was
to observe the correlation among the arts teachers‟ nonverbal behaviour with their
learners educational accomplishment. Other objectives were of secondary importance
which sought to find out two major group differences; the gender based differences
and the school systems differences on arts teachers‟ nonverbal behaviour. The study
focused on a less explored aspect of teaching behavior i.e. the nonverbal aspect which
compliments verbal behaviour and is no less important in facilitating the learning of
students.
One of the results of the research was that non-verbal behaviour of arts teachers‟ was
greatly cohesive, matching, consistent and compatible with their spoken
communications. A several research work was formerly carried out to observe the

106
effect of non-verbal behaviour in terms of the vocal message on students‟ learning.
Galloway‟s (1972) established the significance of teachers‟ nonverbal movements in
relation with the spoken interaction in addition to their verbal communications in the
classroom. This idea was further elaborated and supported by Kodakoas and
Polemikaos (2002) along with Parks and other (2007) in their research works. The
results of these researches generally demonstrate harmony among teachers‟ spoken
and unspoken behaviour during teaching learning. Though, dissimilarity was also
exposed in term of need of compatibility among the two. The present study thus
supports the results of the previous studies on this phenomenon to a large extent.
Another conclusion of the current study was that; the non-verbal teaching
communication of male and female teachers‟ was not differentiated, thereby that
female teachers are as good as their male counter parts. During the course of this
study the researcher could not found that both genders (male & female) arts trainer be
different in their non-verbal teaching performance. This means that female teachers
are as good as their male counter parts in the area of nonverbal communication.
Furthermore, the researcher could not find earlier researches evaluate nonverbal
behaviour of both genders (male & female) teachers based on their gender
differences. The available preceding study was mostly carried out either on both
genders. Therefore, disparities in the nonverbal actions of educators were not in use
on the basis of their gender. However, Albert (2006) found gender difference due to
important communication among awareness of non-verbal behaviour as well as male
and female participants, but the current study does not support it.
Moreover, the research study revealed that there was no significant variation among
the non-verbal behaviour of arts teachers working in diverse system. The researcher
may possibly not come across any prior research focusing on this dimension as well.
The end outcome of the research study brought out strong connection between the
nonverbal behaviour of teachers and students educational accomplishments. This
result lends supports to the results of the available researches via Steven (1980), Rosa
(2002), Davis (2002), as well as Albert‟s (2006). Rosa (2002) found that the
conscious and wise use of nonverbal behavior by both teachers and students always
paves way for enhanced accepting communicating of the subject matter. Likewise,
107
Stevens (1980) too hinted that nonverbal behaviour of trainers has a great effect on
the educational performance of the students. Furthermore, Davis (2002) found a
strong and positive connection between nonverbal behaviour and the academic
performance of students.
The research works and studies by Galloway played a major role in popularizing and
perfecting the system of interaction analysis which was originally propounded by
Flanders. But interestingly, little research work followed on Galloway's frame work.
Some studies may be conducted on the use of Galloway‟s frame work abroad, or may
be in Pakistan as well, but they could not be traced.
Although, it is evident from the chapter of literature review that nonverbal
communication was much important but not in the case as was used by Galloway.
Flanders' interaction system of analysis gained much popularity and generated a lot of
research studies other than Galloway who expanded his categories by adding
nonverbal behaviour of teaching to it. It was quiet impelling and inspiring for the
investigator to carry out a research with the ambitious aim to understand and improve
teaching behaviour leading to increase student‟s learning.
5.5 Recommendations
Based on the findings and conclusion the following recommendations are hereby
made;
5.5.1 Recommendations for Practice
The results of this research study provide useful insights about the proper behaviour
of teachers‟ for those students who are participated in different fields of the
educational institutions as an educational administrators, students, policy makers and
teachers.
As the study revealed that nonverbal communication of instructors‟ was generally
coherent and cohesive with their linguistic behaviour, a curriculum on human
exchange of information can be improved for teachers training programs in order to
assist teachers‟ to recognize the diverse nature of effective nonverbal communication
in the direction of non-verbal communication of teachers vitally compatible with their

108
spoken behaviour. Emphasis on the development of non-vocal skills is laid as much
on development of verbal communication skills of potential and gossiaaaep teachers.
Similarly, the study discovered that those instructors who have physically powerful
non vocal communication demonstrate high proportion of outcome. In the light of this
finding, the teachers training institutions and policy makers may extend a strategy for
teachers‟ guidance conceals utmost component of non-vocal behaviour. Non vocal
teaching behaviour is given important place in teaching strategies and in practice
teaching. In the assessment Performa used for evaluating teacher trainees during
practice teaching as nonverbal teaching behavior is as much important as the verbal
teaching behaviour. The instrument used in this study can serve as a model for
redesigning the assessment Performa.
The research shows that no important variation during the non-verbal behaviour of
both (male &female) instructors‟. thus, both gender (male & female) teachers‟ are
made intellectual use of their body movements during learning process, in order to
create their body movements are further consistent through their spoken behaviour,
because a positive relationship was investigated between nonverbal cues of teachers
with students‟ educational accomplishment.
In respect to educational administrators, this research offers insight into what resource
distribution are more likely to encourage teachers‟ non-verbal communication. It will
also give a head, a good concept of what teachers‟ attitude and beliefs are, and what
are those elements which make the views of a teacher‟ encourage or discourage tends
to the non-verbal communication.
From this research study, an administrator can also investigate a teachers‟
comprehending of non-verbal behaviour and can be make final strategy for teachers
training that can conveniently contained the gaps in teachers understanding. Data
mentioned that while curtains‟ teachers‟ prevailing training concerned to the
comprehending of the different use of nonverbal communication but it is neglected in
our area at large. Particularly, this research work recommends that teachers need
further training to attain the ability to use knowledge effectively regarding nonverbal
behaviour of both practical and theoretical.

109
5.5.2 Recommendations for Further research
The nature and result of this research presents some recommendations for future study
as well. The main focus of this research was to determine that whether there lies any
connection between the nonverbal communication of teachers and students‟ academic
accomplishments rather than how does the nonverbal communication of teachers
affect the students‟ learning behaviour in the classroom. Similarly, it was also the
investigators idea that is conveyed or intended to be conveyed to the mind by
language that; how the teachers‟ non-verbal communication is consistent and cohesive
with their verbal behaviour other than the understanding of its all aspect. Furthermore,
the participants‟ of the research is only secondary school teachers. There was also
another factor which would have a positive effect on the behaviour of teachers; like as
relating to their social and economic status which is outside the scope of the current
study. Therefore, further research work would continue to examine how the teachers‟
replicate in their communication while teaching in the class room; both at elementary
and secondary schools, in addition to investigate the understanding of the nonverbal
behaviors‟ of primary and secondary school teachers‟.
Nonverbal behaviour is the ability to use one‟s knowledge effectively and readily in
executions; which would establish by teachers at various educational systems.
Teachers at different educational institutions must be given direction regarding
nonverbal behaviour along with the ability; therefore gained would be exercised in
their learning strategies. Similarly, teachers may be reinforced to use this ability so as
to change the students‟ curiosity and attention makes them authenticate within the
classroom. Facial expression and eye contacts are the preliminary types of non-verbal
cues, if properly utilized by teachers, may increase the comprehending of the students
regarding the concept taught in the classroom.
As not as much of research work appears to have been launched on Galloway design,
a diverse researches should be conducted depends on Galloway‟s research work of
non-verbal movements. For example, in order to elaborate the effect of non-verbal
communication on students accomplishments, empirical research study might be
instigated in which the empirical cluster can be out to particularly skillful teacher‟s in
non-verbal communications, but the control group should be sensitive to routine

110
teaching in order to see whether verbal and nonverbal consistency in teaching
behaviour makes a difference or not.
So far the tools of researches are concerned; observations and recordings should be
used to observe the effect of non-vocal interaction. Similarly, one mode soundtrack
strategy should be utilized for attaining more credible outcomes if it does not violate
ethical considerations. The current study was depends on Galloway‟s ideas of non-
verbal behaviour in the context of spoken message. Additional studies might be
conducted for authentication the results of the current study at diverse level of
learning by using the combined version of Flanders system of oral teaching along
with Galloway systems of nonverbal lessons as used in the present study.
Video recording and observation were used in the current study which was found to
be the most appropriate techniques to determine the non-verbal behaviour. However,
the observations were made by the researcher personally as a single observer that
might have polluted the study results. To ensure observers validity, the use of a pair of
trained observer might have led to more credible and authentic results.
It is recommended that policy makers and curriculum designer ought to make out the
significance of unspoken behaviour and create a part of teachers‟ instruction program;
as a result that prospective trainers‟ must be skilled in this essential area. The allied
literature review has given a significance weight in teaching learning process; finally,
it is recommended that the ability of non-vocal behaviour be able to use in diverse
educational systems.
.

111
REFERENCES
Airsian, P. (2000). Educational research: competency for analysis and application.
(6th
ed.). New Jerseys, USA, Pearson Education. (P.140)
Albert, E. (2006). Nonverbal Immediacy in the classroom. Retrieved June 15, 2015,
from http: / crock @ missouriwestern.edu/
Alberto, P. A., Troutman. A. C. (2003). Applied behavior analysis procedures for
teachers (4th ed.) Englewood Cliffs, NJ: Prentice Hall,
Allan, Pease, B. (2004).The definite book of body language. Buderim,Australia:
Pease international. Retrieved May26,2011,from
http:/www.4shared.com/network/searches.
Amulya, J. (2004). Guide to Integrating Reflection into field based courses. Centre for
Reflective Community Practice. Retrieved from http:// crcp.mit.edu/
Andrzegewski, C.E. & Davis, H.A.(2007). Human Contact in the classroom.
Retrieved June, 21, 2012, from http://www,sciencedirect.com/
Argyle, M., Cook, M. (1976). Gaze And Mutual Gaze. Cambridge. Eng.; Cambridge
University Press
Bedwell, L., Hunt, G., Touzel, T., & Wiseman, D. (1991). Effective Teaching:
Preparation and Implementation.(2nd ed.). Springfield, IL: Charles, C.
Thomas.
112
Bell, J. (2005). Doing Your Research Project. A Guide For the First Time
Researchers In Education. Health and Social Science (4th ed.). London: Open
University Press.
Bogdan, R. C., & Biklen, S. K. (2007). Qualitative research for education: An
introduction to theories and methods. Boston, MA : Pearson.
Brent, R. & Felder R.M. (2000). "Helping new faculty Get Off to a Good
Start."Proceedings,Annual Meeting of the American Society for Engineering
Education, ASEE.
Brophy, J. (1988). “Synthesis of Research on Good Teaching”? Insights from the
Work of the Institute for Research on Teaching. Educational Leaderships”,
45(8), 74-85.
Bruneau, Thomas, J. (1980). “Chronemics and the verbal-Nonverbal Interface”. In
Key, Mary Ritchie (ed.). The Relationship of Verbal and Nonverbal
Communications. Mouton Press pp. 110-119.
Cassel, J. (1999). "Embodied Conversation: Integrating Face and Gesture into
Automatic Spoken Dialogue System”.
Chhabra, S., Srivastava, R., & Srivastava, I. (2010). Inclusive education in Botswana:
The perception of school teachers. Journal of Disability Policy Studies, 20(4),
219-228.
Chickening, A. W., & Ehrmann, S.C. (1996). "Implementing the seven principles:
Technology as a Lever". AAHE Bulletin, 49(2), 3-6.

113
Cohen, L., Manion, L., & Morrison, K. (2007). Research Methods In Education.(6th
Ed.). London: Routledge Falmer.
Cooper, H. M. (1989). Integrating research: A guide for literature reviews.(2nd ed.).
London: Sage.
Crable, R. (1979). What can you believe about rhetoric?. In J.Mckay (Ed.),
Exploration in speech communications (pp.114-132) Columbus, OH:Charles E
Merrill.
Creswell, J. W. (2008). Educational research: Planning, conducting, and evaluating
quantitative and qualitative research.(3rd ed.). Upper Saddle River, NJ :
Pearson.
Coulson, M. (2004). Journal of Nonverbal Behavior. Retrieved June 20, 2015 from
http:// www.imi.aau.dk.com/
Davis, H.A. (2002). Expectancy value of Work Several Cognitive and Motivational
Variables.
Demarais, A., White, V. (2004). First Impressions . New York, NY:
BantamBooks. ISBN 0553803204
Denzin, N.K.(2010). Moments, mixed-methods and Paradigm dialogs.Qualitative
Inquiry,16 (6),419-427.
Dlleo, J.H. (1977). Child development: Analysis and Synthesis. New York: Brunner
Drew, J. C. Hardman, L. M., & Hosp, L. J. (2008). Designning and conducting
research in education. Thousand Oaks,CA: Sage.

114
Eagley, A. H. & Chaiken, S. (1993). The nature of attitudes. In A. H. Eagley, & S,
Chaiken The psychology of attitudes (pp. 1-21) Fort Worth, TX: Harcourt
Brace.
Ekman, P. (1967). How Faces Share Feelings. Retrieved from http://
www.nature.com/
Ekman, P. (1994). Strong Evidence for Universals in Facial Expressions: A reply to
Russell's Mistaken Critique. Psychological Bulletin, 115, 268-287. Retrieved
from http:// face-and-emotion.com/dataface/misctext/iwafgr.html
Exline, R.V. (1971). Elements of Nonverbal Communication. Retrieved from http: //
www.nature.com/
Felder, R.M. & Brent, R. (2003). "A model for Engineering Faculty
Development."Intl. Journal of Engr. Education, 19(2), 234-240. Retrieved
from http:// www4.ncsu.edu/
Flanders, N.A. (1970). Analyzing Teaching behavior Reading, Mass.Washington,
D.C, Addison-Wesley (P.34)
Friesen, W. & Ekman, P. (2008). Universal Facial Expressions of Emotion: An Old
Controversy and New Findings. Retrieved December 15,2014 from http"//
www3.interscience.wiley.com/
Galloway, C.M. (1977). 'Nonverbal'. Theory into Practice 16(30), 129-133.
Gage, N.L. (1978). The Scientific Basis for the Art of Teaching. John Wiley, New
York: (pp.698-701)

115
Garret, H.E. (2000). Statistics In Psychology and Education. (5th Ed.), S.T, Printers
Rawalpindi, (pp.44-46,216)
Gay, L.R. (1996). Educational research: competency for analysis and application.
Upper Saddle River, NJ : Prentice Hall Inc
Gay, L. R., & Airasian, P. (2000). Educational Research: Competencies for Analysis
and Application. (6th
ed.). New Jersey, USA: Pearson Education. (Pp.140-142)
Given, H.E. (2002). The nonverbal dictionary of gestures, signs & body language
cues. Washington: Centre for nonverbal studies press. Retrieved June 13,
2014, from http:www.4shared.com/network
Gronlund, E.N.(1970). Stating behavioral objectives for classroom instruction.
Toronto, Canada & USA: The Macmillan Company
Gullberg, M., & McCafferty, S.G. (2008). Introduction to Gesture and SLA: An
Integrated Approach. Studies in School Language Acqusion, 30(2), 133-146.
Hager, J.C. (1985). A Comparison of Units for Visually Measuring Facial Action.
Nonverbal-Communication-Human-Interaction-Knapp/dp.
Elisha Babad.(2009). Teaching and nonverbal behaviour in the classroom
International Handbook of Research on Teachers and Teaching. pp 817-827
Hall, A.J, & Knapp, M.L. (2001). Nonverbal Communication in Human Interaction.
(7th
ed.), Lyn uhl, BostonUSA. Retrieved from http:// www.amazon.com/
http:// books.google.com/

116
Hexby, J.M, & Hoffman, E. A. (2002). Human Neural System for Face Recognition
and Social Communication. Retrieved from http:// www.psy2.ucsd.education/
Herring, R. (2009). California International Studies Project, Retrieved from Behavior
Research Methods, Instruments and computers, 17, 450-468.
Hickson III, M.L., & Stacks, D.W. (1993). NVC Nonverbal Communication Studies
and Applications. Dubuque, IA:Wm C Brown Communications
Hogan, K., Stubbs, R. (2003). Can't Get Through: 8 Barriers to
Communication.Grenta, LA: Pelican Publishing Company. ISBN 978-
1589800755
Hummel, J. (2006). An Overview of the Behavioral Perspective. Educational
Psychology Interactive. Valdosta, GA: ValdostaState university. Retrieved
from http:// www.edpsycinteractive.org/topics/behavior/behsys.html/
Jabon, E., Ahn, & Bailenson, J.N. (2011). Automatically Analyzing facial Features
Movements to Identify Human Errors.IEEE Intelligent Systems 26(2), 54-
63.Retrieved November 7, 2015, from http:// www.informatik.uni-trier.de/
~ley/pers/hd/j/Jabon: Maria-E=.html
Johnson, B., & Christensen, L. (2000). Educational research: quantitative and
qualitative approaches. Needham Heights, MA: Allyn and Bacon.
Johnson, R. B., & Onwuegbuzie, A. J. (2004). Mixed methods research: A research
paradigm whose time has come. Educational Researcher, 33(7), 14-26.

117
Karban, R. (2015). Plant Learning and Memory. In: Plant Sensing and
Communication. ChicagoandLondon: The University Of Chicago Press,
pp.31-44.
Knapp, M.L. (1972). Nonverbal Communication in Human Interaction. New York:
Holt, Rinehart & Winston.
Kochhar, S.K. (1992). Methods and Techniques of Teaching. Sterling publishers Pvt.
Ltd, Retrieved January 10, 2015 http: //books.google.com.pk
Kodakos, A., Polemikos, N. (2000). Nonverbal Communication in Kindergarten,
Retrieved from http:/ [email protected]/
Krejcie, R.V, & Morgan, D.W. (1970). Educational and Psychological Measurement:
30, 607-610.
Lichtman, M. (2010). Qualitative research in education: A user's guide (2nd ed.).
Thousand oaks, Calif : Sage
McCafferty, S.G., & Gale Stam. (2008). Gesture: Second Language Acquisitions and
classroom research. New York: Routledge. pp.330-332.
Mehrabian, Albert; Wiener, Morton(1967). "Decoding Of Inconsistent
Communication". Journal of personality and social psychology 6 (1). 109-114
Meyer, K.R., Ph.D., (June,2009). Communication Studies Students Classroom
Engagement: Rethinking Participation Grade and Student Silence. pp.341-344.

118
Miller, W.P. (2000). Nonverbal Communication in the Classroom. Illustrated
edition,Patrick, W. Miller & Associates. Retrieved from
http://books.google.com.pk/books
Miller, P.W. (1998). Nonverbal Communication. What a researcher says to the
teachers (3rd
ed.). USA: Nea.
Morse, M.J., & Nihau‟s, L. (2009). Mixed-method design: Principles and procedures.
Walnut Creek, CA: LeftCoast Press.
Oreovics, F., Phillip, C. & Wankat, (1993). Teaching Engineering. McGraw-Hill
Paradise, Ruth,. (1994). "Interactional Style and Nonverbal Meaning: Mazahua
Children Learning How to Be Separate-But-Together". Anthropology
&Education Quarterly. 25 (2): 156–172.
Parker, A., & Tritter, J.(2006). Focus group method and methodology: Current
Practice and Recent Debate. International Journal of Research and Method in
Education, 29(1), 23-37.
Pearce, J.M. (2001). Transfer of Spatial Behavior between Different Environments:
Implications for Theories of Spatial Learning and for the Role of the
Hippocampus in Spatial Learning. Retrieved from Http:// www.cardiff.ac.uk/
Pease B., Pease A.(2004). The Definitive Book of Body Language.New York, NY:
Bantam Books.
Philips, D.K., & Carr, K.(2010). Becoming a teacher through action research:
process, context, and self-study (2nd ed.). New York: Routledge.

119
Picard, R. (2011). "Recognizing effect from speech prosody using hierarchical
graphical models"., Sensing Emotions and Affect- Facing Realism in Speech
Processing. Volume 53, Issues 9-10, Pages 1088-1103.
Punch, K.F (2009). Introduction to research methods in Education. London: Sage
Rogers, B. (2006). Behaviour Management: A Whole School Approach. Alden Press
Olney Mead, Oxford
Rollman, A.S. (1977). Nonverbal Communication in the classroom. Pennsylvania
State University, USA. Retrieved from http:// books.google.com/
Rosa, S.B. (2002). Understanding the Role and Potential Impact of Nonverbal
Communication in the Primary Inclusion Classroom. Retrieved from http://
eric.ed.gov/
Santrock, J.W. (2006). Educational Psychology.(2nd
Ed.), Texas: McGraw-Hill,
P.210.
Segerstrile, U. & Molars, P. (1997). Nonverbal Communication Where Nature Meets
Culture.Retrieved February 22, 2014 from http:
//www.cognitivepsychologyarena.com
Sidelinger, R.J. & McCroskey, J.C. (1997). Communication Correlates of Teacher
Clarity (Nonverbal Communication) in the college Classroom. Retrieved from
http: // eric.ed.gov/
Smith, A.H. (1981). Nonverbal communication in Teaching. Review of Educational
Research, 49 (4), pp.631-672.
120
Smith, A.H. (1988). Nonverbal Communication in Teaching. Retrieved December 13,
2013 fromhttp://www.jstor.org
Springer, K.(2010). Educational research: contextual approach. New York: John
Wiley.
Sprinthall, N.A. (1994). Educational Psychology. New York McGraw-Hill, Inc
Staven, A. (1980). Role of Nonverbal Communication in Education. Retrieved from
http:// eric.ed.gov/
Teddies, C. & Tashakkori, A. (2009). Foundations of Mixed methods research:
Integrating quantitative and qualitative approaches in the social and
behavioral sciences. Thousand Oaks, CA: Sage.
Thomas, G. & Loxley, A. (2007). Deconstructing special education and constructing
inclusion. In G. Thomas and A. Loxley (2nd
ed.) Maidenhead: Open University
Press.
Trochim, W.M. (2006). The Research Methods Knowledge Base. 2nd
Edition. Retriev
April14,2009,fromhttp;//www.socialresearchmethods.net/kb/index.php.
Walberg, H.J. (1990). Productive Teaching and Instruction. Phi Delta, Kappan,
Pp.470-478.
Wiersma, W., & Jurs, S.G. (2009). Research Methods In Education: An Introduction.
(9th
ed.). Boston, M.A: Pearson.
Wood, B.S. (1976). Children and Communication:Verbal and Nonverbal Language
Development. New Jersey: Prentice Hall. (pp.184-187)

121
Lawrence J. Saha (2009).International Handbook of Research on Teachers and
Teaching.volume 21. ISBN 978-0-387-73316-6
Weinstein, R. S., & McKown, C. (1998). Expectancy effects in “context”: Listening
to the voices of students and teachers. In J. Brophy (Ed.), Advances in
research on teaching. Expectations in the classroom (Volume. 7, pp. 215–242).
Greenwich, CT: JAI Press
Zwozdiak-Myers, P., Capel, S. Leask, M. & Turner, T. (2005). Communicating with
pupils in learning to teach in the secondary school. New York: Routledge. (p.
114).
Baylor, A. L., Kim, S., Son, C., & Lee, M. (2009). Designing nonverbal
communication for pedagogical agent. Computers in human behaviour,25 (5).
USA
Leigh, D. (2005). Handbook of designing and delivering training or groups, New
Dehli, India: Crest (p.10)
McCroskey, J. C., Fayer, J. M., Richmond, V. P., Sallinen, A., & Barraclough,R. A.
(1996). A multi-cultural examination of relationship between nonverbal
immediacy and affective learning. Communication quarterly. 44 (3), 297-
307.
Nayak, A.K,m Rao, V.K. (2004). Classroom teaching: methods and practices. New
Dehli, India: A.P.H. (pp.215-216)
Stanton, N. (2004). Mastering communication, New York, USA:
PalcraveMacmillan.Woolfoil, A. (2004). Educational Psychology (9th ed).
Dehli India Pearson Eeducation. (pp.415)

122
Zekia, p.C. (2009). The importance of nonverbal communication in classroom
management. Procedia social and behavral sciences 1.(World Conference
onEducationalSciences).NorthCyprushttp:/www.sciencedirect.com/science.

123
APPENDICES
Appendix –“A”
OBSERVATIONAL FORM
Impact of Nonverbal Behavior of Teachers on Students Educational
Accomplishment
Name of Teacher: ____________________________________________
Name of School: _____________________________________________
Subject: _________________ Qualification:_______________________
Teaching Experience: _________________ Dated: _________________
Academic Qualification
PhD (___) MPhil (___) MA/MSc (___) BA/BSc (___) Others (___)
Professional Qualification:
Bed (___) Med (___) Others (___)
Note: The points on the rating scale determine the following scoring points:
1. Fully consistent (7) 2.Highly consistent (6)
3. Moderately consistent (5) 4. Partially consistent (4)
5. Moderately inconsistent (3) 6. Highly inconsistent (2)
7. Fully inconsistent (1)
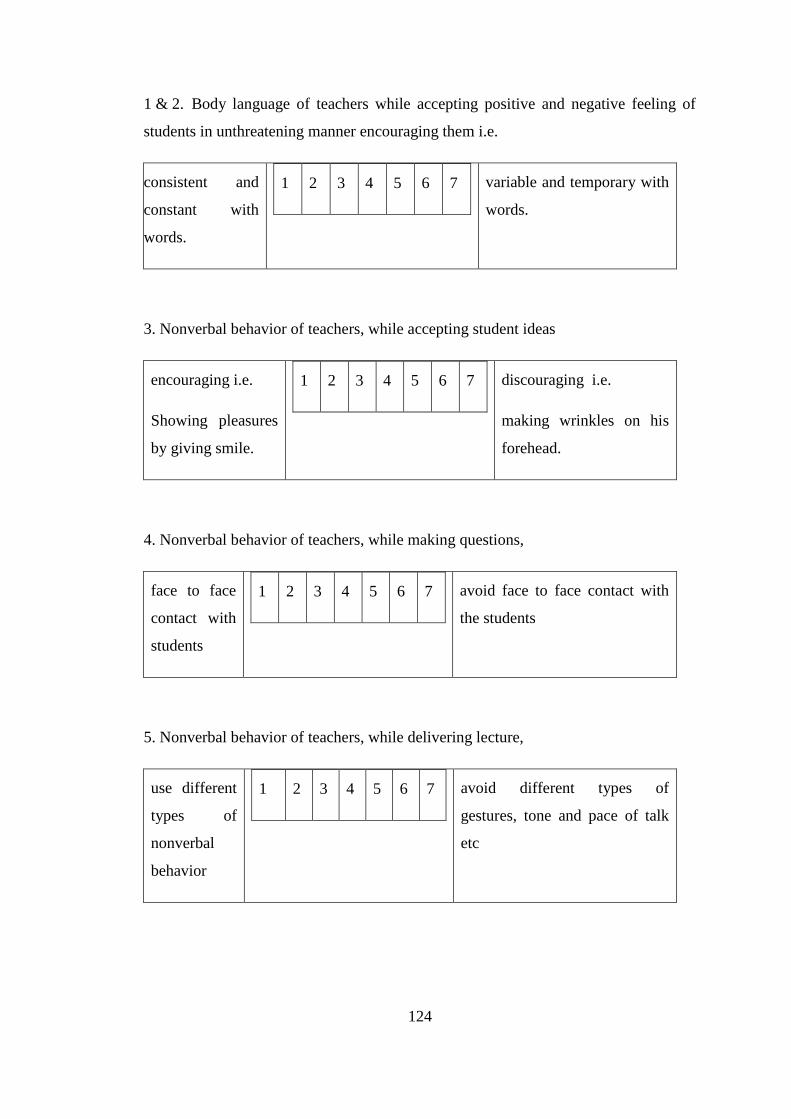
124
1 & 2. Body language of teachers while accepting positive and negative feeling of
students in unthreatening manner encouraging them i.e.
consistent and
constant with
words.
1 2 3 4 5 6 7
variable and temporary with
words.
3. Nonverbal behavior of teachers, while accepting student ideas
encouraging i.e.
Showing pleasures
by giving smile.
1 2 3 4 5 6 7
discouraging i.e.
making wrinkles on his
forehead.
4. Nonverbal behavior of teachers, while making questions,
face to face
contact with
students
1 2 3 4 5 6 7
avoid face to face contact with
the students
5. Nonverbal behavior of teachers, while delivering lecture,
use different
types of
nonverbal
behavior
1 2 3 4 5 6 7
avoid different types of
gestures, tone and pace of talk
etc

125
6. Nonverbal behavior of teachers, while giving directions,
encourages
students
involvement
1 2 3 4 5 6 7
discourages students
involvement and participation
7. Nonverbal behavior of teachers, while criticizing and justifying authority,
tolerant,
lenient and
hearty
1 2 3 4 5 6 7
aggressive, severe and intensely
rigid

126
Appendix –“A”
OBSERVATIONAL FORM
Impact of Nonverbal Behavior of Teachers on Students Educational
Accomplishment
Name of Teacher: ____________________________________________
Name of School: _____________________________________________
Subject: _________________ Qualification:_______________________
Teaching Experience: _________________ Dated: _________________
Academic Qualification
PhD (___) MPhil (___) MA/MSc (___) BA/BSc (___) Others (___)
Professional Qualification:
Bed (___) Med (___) Others (___)
Note: The points on the rating scale determine the following scoring points:
1. Fully consistent (7) 2.Highly consistent (6)
3. Moderately consistent (5) 4. Partially consistent (4)
5. Moderately inconsistent (3) 6. Highly inconsistent (2)
7. Fully inconsistent (1)

127
1 & 2. Body language of teachers while accepting positive and negative feeling of
students in unthreatening manner encouraging them i.e.
consistent and
constant with
words.
1 2 3 4 5 6 7
variable and temporary with
words.
3. Nonverbal behavior of teachers, while accepting student ideas
encouraging i.e.
showing pleasures
by giving smile.
1 2 3 4 5 6 7
discouraging i.e.
making wrinkles on his
forehead.
4. Nonverbal behavior of teachers, while making questions,
face to face
contact with
students
1 2 3 4 5 6 7
avoid face to face contact with
the students
5. Nonverbal behavior of teachers, while delivering lecture,
use different
types of
nonverbal
behavior
1 2 3 4 5 6 7
avoid different types of
gestures, tone and pace of talk
etc

128
6. Nonverbal behavior of teachers, while giving directions,
encourages
students
involvement
1 2 3 4 5 6 7
discourages students
involvement and participation
7. Nonverbal behavior of teachers, while criticizing and justifying authority,
tolerant,
lenient and
hearty
1 2 3 4 5 6 7
aggressive, severe and intensely
rigid

129
Appendix- “A1”
Nonverbal Behavior of Teachers (Male) Government Schools
S.No Name of Teacher Name of school Nonverbal Score
Classification
Students
Accomplishment
Sum of
Nonverbal
Score
1&2 3 4 5 6 7 Y
100
X
42
1 Muhammad Rauf(Urdu) GHS, Takhte Nasrati,
Karak
6 6 6 6 6 7 100 37
2
Muhammad Ishfaq (Islamiat) GHS, Takhte Nasrati,
Karak
7 7 6 6 6 6 97 38
3 Niaz Farid (English) GHS, Takhte Nasrati,
Karak
6 6 6 6 6 6 94 36
4 Maqbool Ahmad(Urdu) GHS,Sarki,Lawaghar,
Karak
6 7 7 7 7 7 92 41
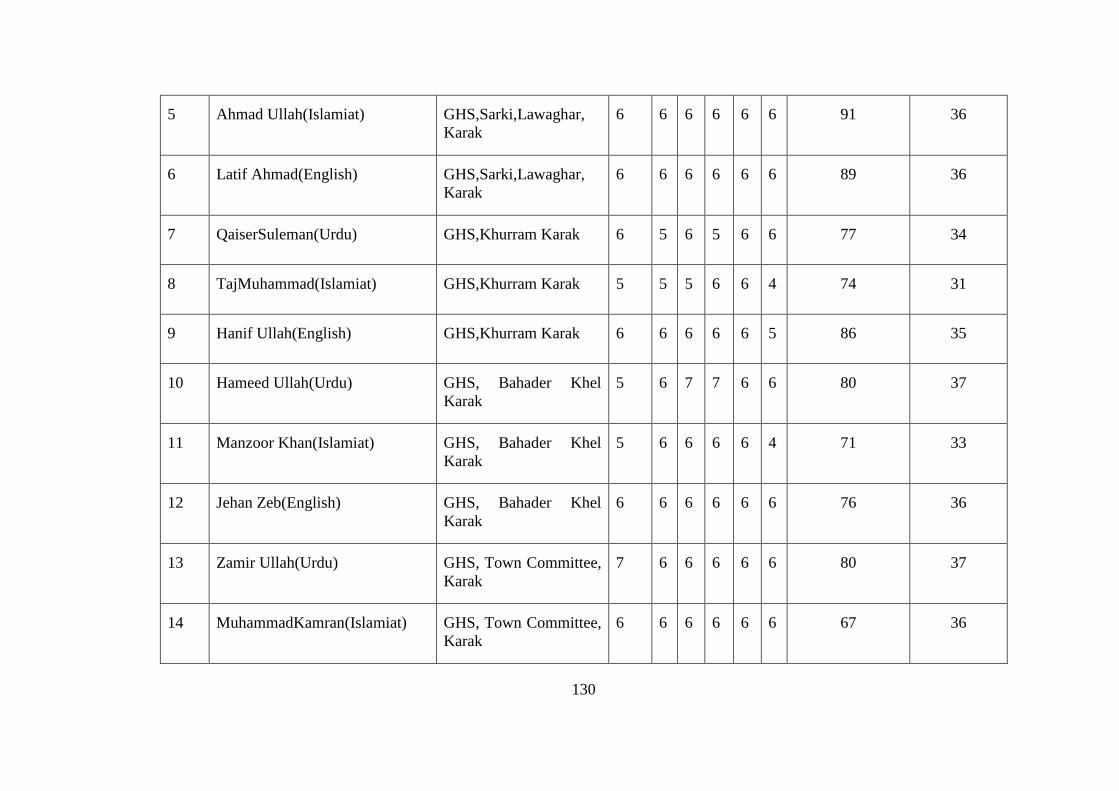
130
5 Ahmad Ullah(Islamiat) GHS,Sarki,Lawaghar,
Karak
6 6 6 6 6 6 91 36
6 Latif Ahmad(English) GHS,Sarki,Lawaghar,
Karak
6 6 6 6 6 6 89 36
7 QaiserSuleman(Urdu) GHS,Khurram Karak 6 5 6 5 6 6 77 34
8 TajMuhammad(Islamiat) GHS,Khurram Karak 5 5 5 6 6 4 74 31
9 Hanif Ullah(English) GHS,Khurram Karak 6 6 6 6 6 5 86 35
10 Hameed Ullah(Urdu) GHS, Bahader Khel
Karak
5 6 7 7 6 6 80 37
11 Manzoor Khan(Islamiat) GHS, Bahader Khel
Karak
5 6 6 6 6 4 71 33
12 Jehan Zeb(English) GHS, Bahader Khel
Karak
6 6 6 6 6 6 76 36
13 Zamir Ullah(Urdu) GHS, Town Committee,
Karak
7 6 6 6 6 6 80 37
14 MuhammadKamran(Islamiat) GHS, Town Committee,
Karak
6 6 6 6 6 6 67 36

131
15 Umer Farooq(English) GHS, Town Committee,
Karak
4 5 6 7 4 4 63 30
16 Mushtaq Ahmad(Urdu) GHS, Deli Mela Karak 4 3 5 6 7 3 58 28
17 Ahmad Shah(Islamiat) GHS, Deli Mela Karak 6 6 5 5 4 4 60 30
18 Sahib Zali Khan(English) GHS, Deli Mela Karak 5 3 4 4 5 5 56 26

132
Appendix “A2”
Nonverbal Behavior of Teachers (Female) Government Schools
S.No Name of Teacher Name of school Nonverbal Score Classification Students
Accomplishment
Sum of Nonverbal
Score
1&2 3 4 5 6 7 Y
100
X
42
1. Nargis (Urdu) GGHS,
Latamber, Krk
5 5 6 5 4 4 54 29
2.
Samina (English) GGHS,
Latamber, Krk
4 4 5 5 6 6 57 30
3. Zeba (Islamiat) GGHS,
Latamber, Krk
5 4 5 5 5 6 55 30
4 Nazia(English) GGHSS,Chokara
Karak
5 5 5 5 5 5 54 30
5 Shabnam(Urdu) GGHSS,Chokara
Karak
6 6 5 4 4 4 53 29
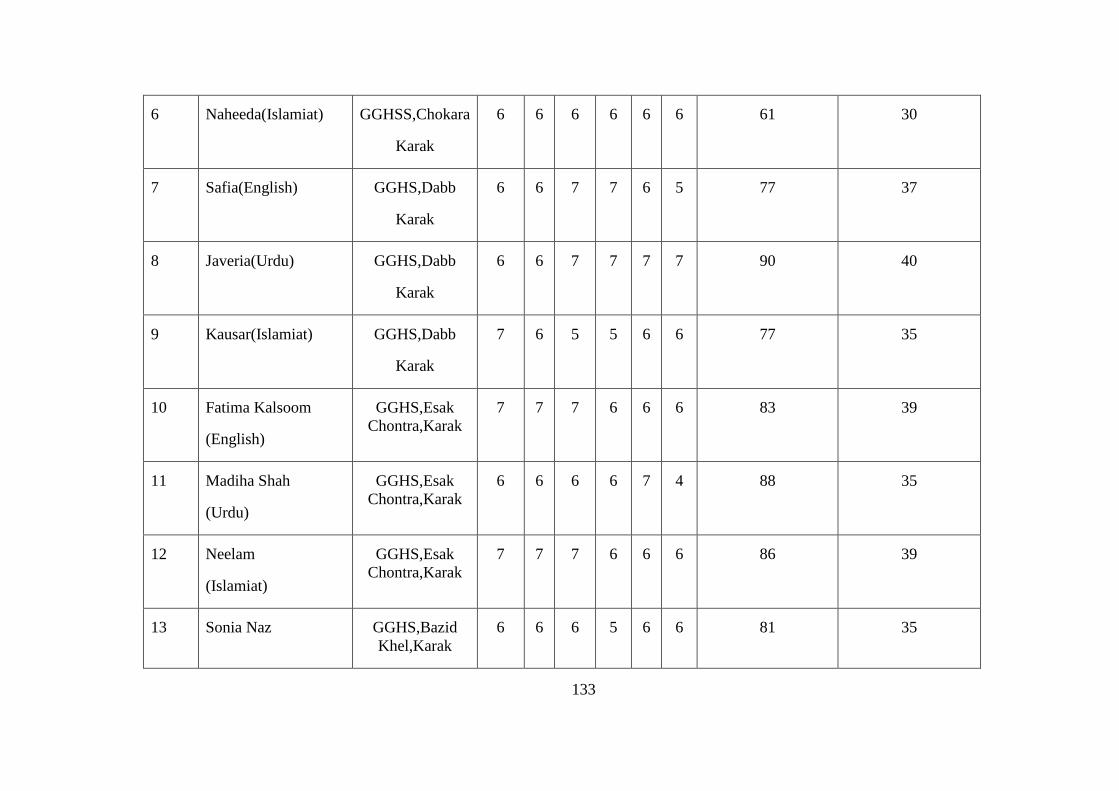
133
6 Naheeda(Islamiat) GGHSS,Chokara
Karak
6 6 6 6 6 6 61 30
7 Safia(English) GGHS,Dabb
Karak
6 6 7 7 6 5 77 37
8 Javeria(Urdu) GGHS,Dabb
Karak
6 6 7 7 7 7 90 40
9 Kausar(Islamiat) GGHS,Dabb
Karak
7 6 5 5 6 6 77 35
10 Fatima Kalsoom
(English)
GGHS,Esak
Chontra,Karak
7 7 7 6 6 6 83 39
11
Madiha Shah
(Urdu)
GGHS,Esak
Chontra,Karak
6 6 6 6 7 4 88 35
12 Neelam
(Islamiat)
GGHS,Esak
Chontra,Karak
7 7 7 6 6 6 86 39
13 Sonia Naz GGHS,Bazid
Khel,Karak
6 6 6 5 6 6 81 35

134
(English)
14 Lubna(Urdu) GGHS,Bazid
Khel,Karak
6 5 7 6 6 6 79 36
15 Wajeeha(Islamiat) GGHS,Bazid
Khel,Karak
5 5 5 6 6 6 81 33
16 Zahida(English) GGHS,Ahmadi
Banda,Karak
6 6 7 5 5 7 82 36
17 Fareeha Batool
(Urdu)
GGHS,Ahmadi
Banda,Karak
6 6 6 6 6 6 77 36
18 Amna Saeed
(Islamiat)
GGHS,Ahmadi
Banda,Karak
6 6 5 5 7 6 74 35
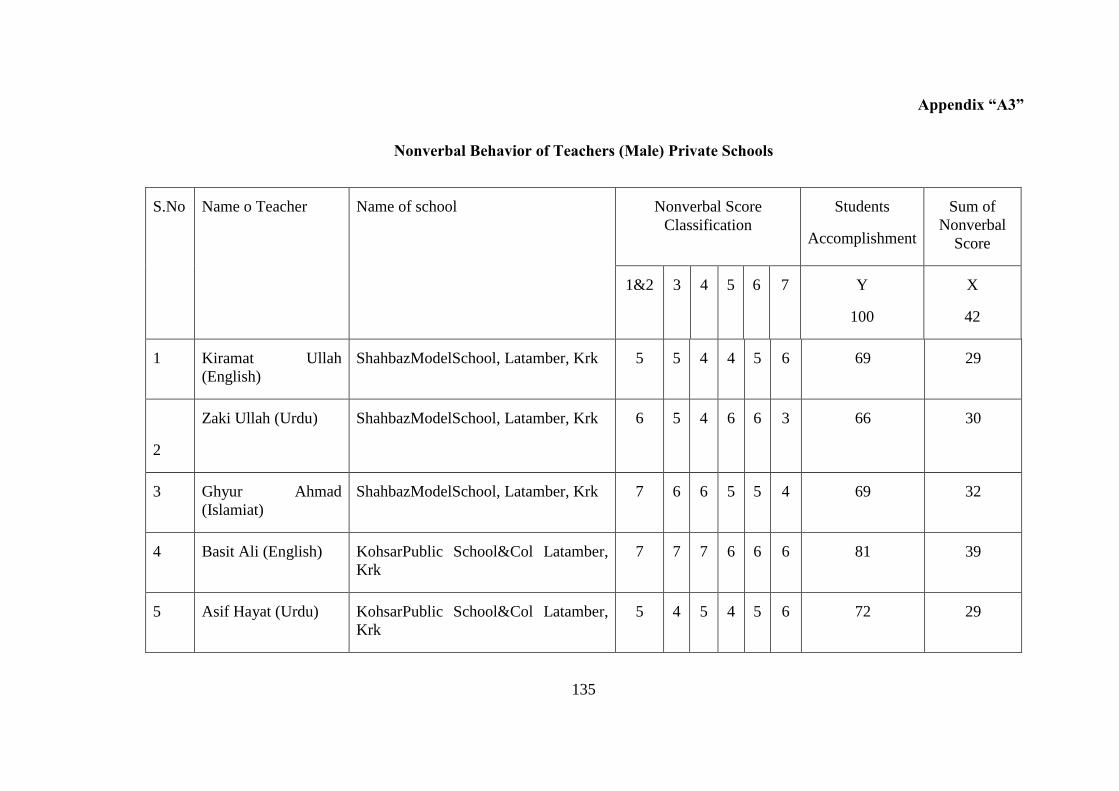
135
Appendix “A3”
Nonverbal Behavior of Teachers (Male) Private Schools
S.No Name o Teacher Name of school Nonverbal Score
Classification
Students
Accomplishment
Sum of
Nonverbal
Score
1&2 3 4 5 6 7 Y
100
X
42
1 Kiramat Ullah
(English)
ShahbazModelSchool, Latamber, Krk 5 5 4 4 5 6 69 29
2
Zaki Ullah (Urdu) ShahbazModelSchool, Latamber, Krk 6 5 4 6 6 3 66 30
3 Ghyur Ahmad
(Islamiat)
ShahbazModelSchool, Latamber, Krk 7 6 6 5 5 4 69 32
4 Basit Ali (English) KohsarPublic School&Col Latamber,
Krk
7 7 7 6 6 6 81 39
5 Asif Hayat (Urdu) KohsarPublic School&Col Latamber,
Krk
5 4 5 4 5 6 72 29

136
6 Muhammad Jammal
(Islamiat)
KohsarPublic School&Col Latamber,
Krk
6 6 6 5 5 6 86 34
7 Usman Saeed(Urdu) ShaheenChildren Academy Mitha
Khel, Karak
7 7 7 6 6 6 82 39
8 Muhammad
Asif(English)
ShaheenChildren Academy Mitha
Khel, Karak
6 6 6 6 4 5 80 33
9 Muhammad
Qadeer(Urdu)
ShaheenChildren Academy Mitha
Khel, Karak
4 4 5 6 5 4 72 28
10 Yasir Hameed(Urdu) IslamiaPublicHighSchool,BahaderKhel 4 4 5 5 5 4 66 27
11 Asad Iqbal(Islamiat) IslamiaPublicHighSchool,BahaderKhel 4 4 4 4 4 4 57 24
12 Afsar Ali(English) IslamiaPublicHighSchool,BahaderKhel 5 4 4 4 4 4 68 25
13 MunsifKhan(English) FalconPublicHigh
SchoolNariPanoos,Krk
4 4 4 4 3 3 62 22
14 Samar Gul(Urdu) FalconPublicHigh
SchoolNariPanoos,Krk
5 5 5 4 4 4 67 27

137
15 Farid Khan(Islamiat) FalconPublicHigh
SchoolNariPanoos,Krk
4 3 4 4 4 4 61 23
16 AslamKhan(English) HiraModalSchool,Takhte
Nasrati, Karak
6 4 4 4 4 4 66 26
17 Zameer Gul(Urdu) HiraModalSchool,Takhte
Nasrati, Karak
4 4 4 4 4 4 56 24
18 Hazrat Ali(Islamiat) HiraModalSchool,Takhte
Nasrati, Karak
4 5 3 3 3 3 52 21

138
Appendix “A4”
Nonverbal Behavior of Teachers (Female) Private Schools
S.No Name o Teacher Name of school Nonverbal Score
Classification
Students
Accomplishment
Sum of
Nonverbal Score
1&2 3 4 5 6 7 Y
100
X
42
1 Uzma Shaheen
(English)
Kohsar Public
S&C(F),Latambar Karak
6 7 7 7 7 7 91 41
2
Seema Nigar
(Urdu)
Kohsar Public
S&C(F),Latambar Karak
7 6 6 6 6 5 100 36
3 Saba Nawab
(Islamiat)
Kohsar Public
S&C(F),Latambar Karak
6 6 6 6 7 6 86 37
4 Arfa Ayaz
(English)
BlueBirdsAcademy(F),Karak 5 6 6 6 7 6 80 36
5 Sumira Parveen BlueBirdsAcademy(F),Karak 7 7 7 7 7 7 100 42

139
(Urdu)
6 Maryam Farooq
(Islamiat)
BlueBirdsAcademy(F),Karak 6 6 4 5 6 4 78 31
7 Aiman Raza
(English)
Umeed Science
S&C(F), Karak
5 6 7 5 3 6 83 32
8 Irum Abdullah
(Urdu)
Umeed Science
S&C(F), Karak
5 6 5 6 6 6 72 28
9 Zeenat Shafiq
(Islamiat)
Umeed Science
S&C(F), Karak
6 5 5 5 5 5 68 31
10 Saima Noreen
(English)
Al-FalahGirls PHS
AliKhel,Karak
6 6 6 6 5 5 67 34
11
Nimra Bano
(Urdu)
Al-FalahGirls PHS
AliKhel,Karak
5 5 5 5 6 6 66 32
12 Nida Umar
(Islamiat)
Al-FalahGirls PHS
AliKhel,Karak
6 6 6 4 5 5 62 32

140
13 Sadaf Tehseen
(English)
Al-HudaGirls S&C
MithaKhel,Karak
7 6 5 4 5 5 64 32
14 Rabia Begum
(Urdu)
Al-HudaGirls S&C
MithaKhel,Karak
6 6 5 5 6 4 62 32
15 Riffat (Islamiat) Al-HudaGirls S&C
MithaKhel,Karak
6 5 4 5 6 4 65 30
16 Yasmin Naz
(English)
AmnaPublicSchool,
BilandKila,Karak
6 6 6 6 6 6 66 36
17 Alia Naz (Urdu) AmnaPublicSchool,
BilandKila,Karak
6 5 5 5 5 5 68 31
18 Kalsoom Islam
(Islamiat)
AmnaPublicSchool,
BilandKila,Karak
6 5 6 5 5 6 65 33

141
Appendix “A5”
Nonverbal Behavior of Teachers (Male) Semi Government & Private Standard Schools
S.No Name o Teacher Name of school Nonverbal Score Category Students
Accomplishment
Sum of
Nonverbal
Score
1&2 3 4 5 6 7 Y
100
X
42
1 FazalHabib(English) WorkingFolksGrammer
HSS (Male), Karak
7 6 6 6 6 6 93 37
2
Farmanullah(Urdu) WorkingFolksGrammer
HSS (Male), Karak
6 6 5 4 5 6 88 32
3 Maqbool Alam(Islamiat) WorkingFolksGrammer
HSS (Male), Karak
6 5 5 5 5 6 84 32
4 MuhammadSajjad(English) FaujiFoundationModel
School, Karak
7 7 7 6 6 6 87 39
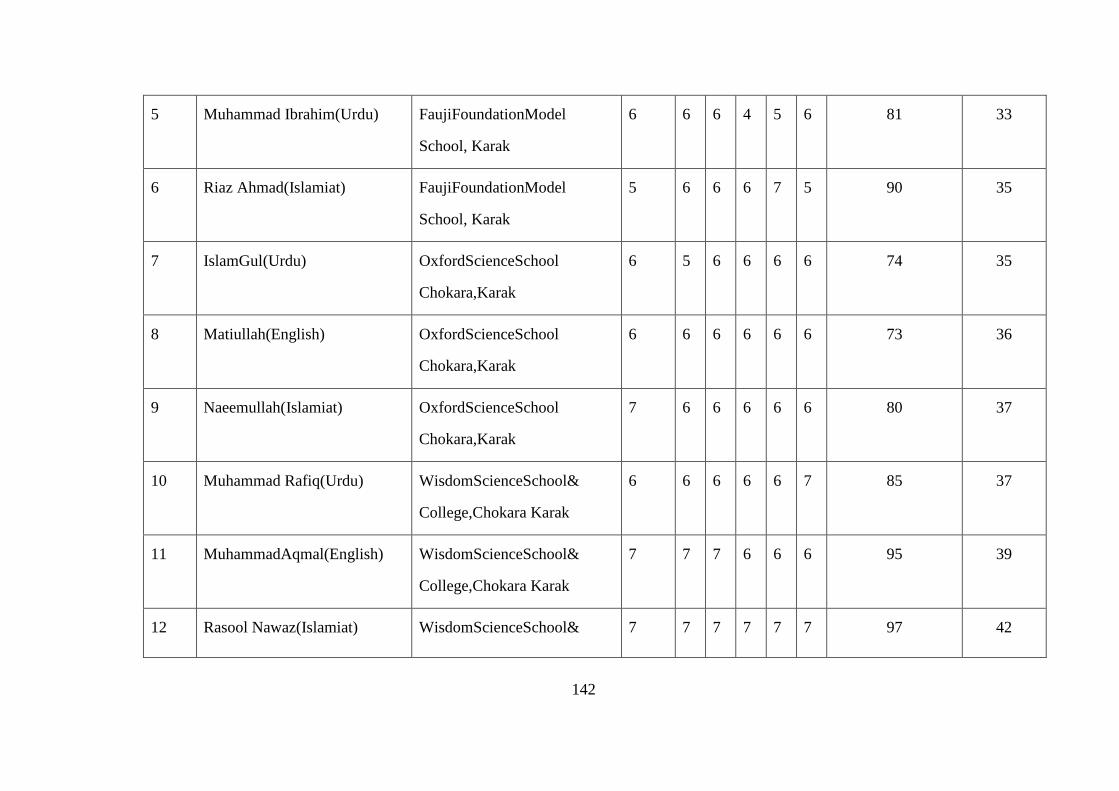
142
5 Muhammad Ibrahim(Urdu) FaujiFoundationModel
School, Karak
6 6 6 4 5 6 81 33
6 Riaz Ahmad(Islamiat) FaujiFoundationModel
School, Karak
5 6 6 6 7 5 90 35
7 IslamGul(Urdu) OxfordScienceSchool
Chokara,Karak
6 5 6 6 6 6 74 35
8 Matiullah(English) OxfordScienceSchool
Chokara,Karak
6 6 6 6 6 6 73 36
9 Naeemullah(Islamiat) OxfordScienceSchool
Chokara,Karak
7 6 6 6 6 6 80 37
10 Muhammad Rafiq(Urdu) WisdomScienceSchool&
College,Chokara Karak
6 6 6 6 6 7 85 37
11
MuhammadAqmal(English) WisdomScienceSchool&
College,Chokara Karak
7 7 7 6 6 6 95 39
12 Rasool Nawaz(Islamiat) WisdomScienceSchool& 7 7 7 7 7 7 97 42
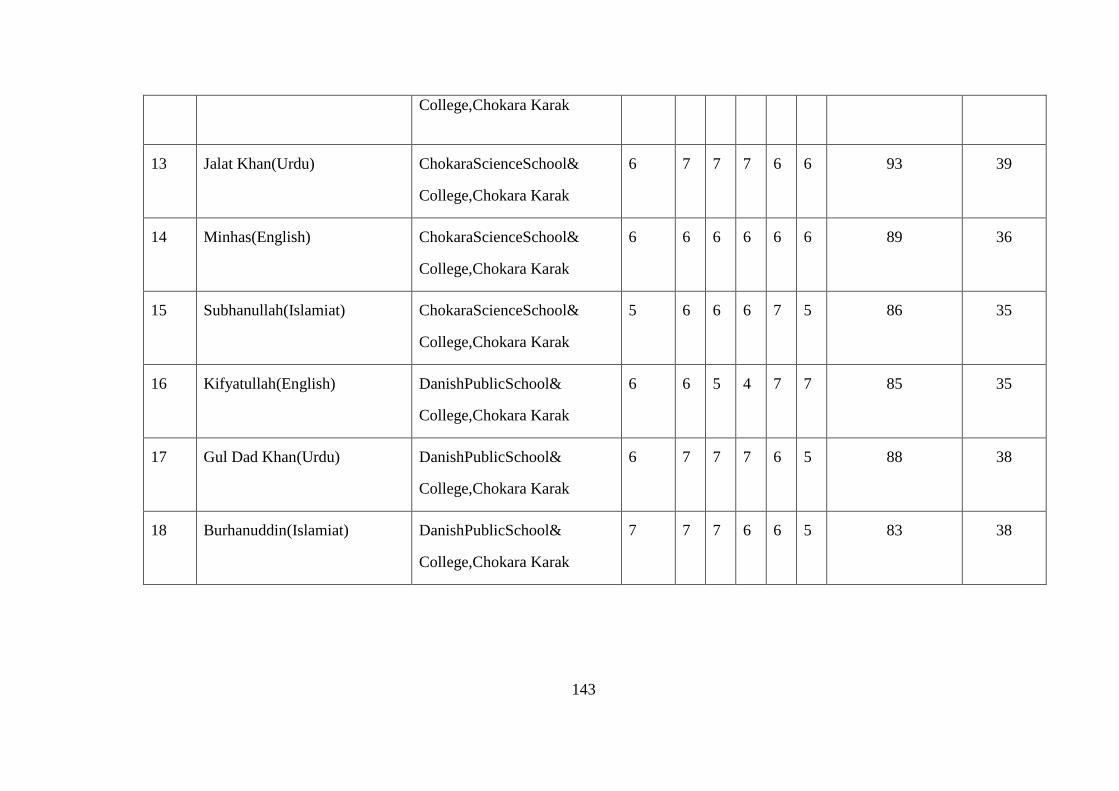
143
College,Chokara Karak
13 Jalat Khan(Urdu) ChokaraScienceSchool&
College,Chokara Karak
6 7 7 7 6 6 93 39
14 Minhas(English) ChokaraScienceSchool&
College,Chokara Karak
6 6 6 6 6 6 89 36
15 Subhanullah(Islamiat) ChokaraScienceSchool&
College,Chokara Karak
5 6 6 6 7 5 86 35
16 Kifyatullah(English) DanishPublicSchool&
College,Chokara Karak
6 6 5 4 7 7 85 35
17 Gul Dad Khan(Urdu) DanishPublicSchool&
College,Chokara Karak
6 7 7 7 6 5 88 38
18 Burhanuddin(Islamiat) DanishPublicSchool&
College,Chokara Karak
7 7 7 6 6 5 83 38

144
Appendix “A6”
Nonverbal Behavior of Teachers (Female) Semi Government & Private Standard Schools
S.No Name of Teacher Name of school Nonverbal Score
Classification
Students
Accomplishment
Sum of
Nonverbal Score
1&2 3 4 5 6 7 Y
100
X
42
1 Attia
Naz(English)
WorkingFolksGrammer
HSS(Female),Karak
5 5 6 5 4 4 54 29
2
Abida
Majeed(Urdu)
WorkingFolksGrammer
HSS(Female),Karak
4 4 5 5 6 6 57 30
3 RiffatYasmeen
(Islamiat)
WorkingFolksGrammer
HSS(Female),Karak
5 4 5 5 5 6 55 30
4 Mussarat(Urdu) FoujiFoundationModal,
HSS(Femal),Karak
6 6 6 5 6 7 78 36
5 Kousar(English) FoujiFoundationModal,
HSS(Femal),Karak
4 6 6 7 5 7 75 35

145
6 Fatima(Islamiat) FoujiFoundationModal,
HSS(Femal),Karak
4 4 4 5 5 5 62 27
7 Najma(English) DanishPublicS&C
(F),Chokara,Karak
6 6 7 6 6 7 78 32
8 Shaheen(Urdu) DanishPublicS&C
(F),Chokara,Karak
6 6 6 7 7 7 71 39
9 Balqis(Islamiat) DanishPublicS&C
(F),Chokara,Karak
4 5 6 7 5 5 68 32
10 NaheedAhtar
(English)
WisdomScience S&C
(F)Chokara,Karak
5 5 5 7 6 6 63 34
11
Sana Naheed
(Islamiat)
WisdomScience S&C
(F)Chokara,Karak
3 4 5 4 4 6 68 26
12 Aneela Hameed
(Urdu)
WisdomScience S&C(F)
Chokara,Karak
6 6 6 5 5 6 64 34
13 Fozia Baseer
(English)
Karak Educators
S&C(F), Karak
3 4 5 5 6 5 56 28

146
14 Amina Firdoos
(Urdu)
Karak Educators
S&C(F), Karak
6 6 7 5 6 6 77 36
15 Shakila Farid
(Islamiat)
Karak Educators
S&C(F), Karak
7 6 6 6 5 5 72 35
16 Huma Jabeen
(English)
HeraSchool&College(F)
Ahmadabad,Karak
6 6 6 6 7 4 77 35
17 Sadia Asghar
(Urdu)
HeraSchool&College(F)
Ahmadabad,Karak
5 6 6 7 4 7 73 35
18 Salma Afsheen
(Islamiat)
HeraSchool&College(F)
Ahmadabad,Karak
6 5 5 6 6 6 71 34

147
Appendix “A7”
Values of Mean and Standard deviation Nonverbal Behavior Score of Teachers while Accepting Students Feelings (Observation 1 & 2)
Nonverbal Behavior
Score of 108
Teachers,(X)
Value of Mean
x =n
x++
D=X- X
D2
Value of Standard
deviation
nDS /)2^(
6
7
6
6
6
6
6
5
6
5
5
6
5
6
7
7
5
6
7
6
4
4
4
5
7
6
6
7
6
5
6
6
7
6
7
7
∑X=610
n=108
x =n
x
X =610/108
X =5.65
0.35
1.35
0.35
0.35
0.35
0.35
0.35
-0.65
0.35
-0.65
-0.65
0.35
-0.65
0.35
1.35
1.35
-0.65
0.35
1.35
0.35
-1.65
-1.65
-1.65
-0.65
1.35
0.35
0.35
1.35
0.35
-0.65
0.35
0.35
1.35
0.35
1.35
1.35
0.12
1.82
0.12
0.12
0.12
0.12
0.12
0.42
0.12
0.42
0.42
0.12
0.42
0.12
1.82
1.82
0.42
0.12
0.42
0.12
2.72
2.72
2.72
0.42
1.82
0.12
0.12
1.82
0.12
0.42
0.12
0.12
1.82
0.12
1.82
1.82
∑D2
=100.36
n = 108
S=108
36.100
S=0.96

148
7
6
4
4
6
5
5
4
5
5
6
6
6
6
7
7
6
7
4
5
4
6
4
4
6
7
6
5
7
6
5
5
6
6
5
6
6
6
5
6
6
7
5
4
5
6
4
4
6
6
4
5
3
6
1.35
0.35
-1.65
-1.65
0.35
-0.65
-0.65
-1.65
-0.65
-0.65
0.35
0.35
0.35
0.35
1.35
1.35
0.35
1.35
-1.65
-0.65
-1.65
0.35
-1.65
-1.65
0.35
1.35
0.35
-0.65
1.35
0.35
-0.65
-0.65
0.35
0.35
-0.65
0.35
0.35
0.35
-0.65
0.35
0.35
1.35
-0.65
-1.65
-0.65
0.35
-1.65
-1.65
0.35
0.35
-1.65
-0.65
-2.65
0.35
1.82
0.12
2.72
2.72
0.12
0.42
0.42
2.72
0.42
0.42
0.12
0.12
0.12
0.12
1.82
1.82
0.12
1.82
2.72
0.42
2.72
0.12
2.72
2.72
0.12
1.82
0.12
0.42
1.82
0.12
0.42
0.42
0.12
0.12
0.42
0.12
0.12
0.12
0.42
0.12
0.12
1.82
0.42
2.72
0.42
0.12
2.72
2.72
0.12
0.12
2.72
0.42
7.02
0.12

149
6
6
5
6
6
6
7
6
6
6
6
6
3
6
7
6
5
6
0.35
0.35
-0.65
0.35
0.35
0.35
1.35
0.35
0.35
0.35
0.35
0.35
-2.65
0.35
1.35
0.35
-0.65
0.35
0.12
0.12
0.42
0.12
0.12
0.12
1.82
0.12
0.12
0.12
0.12
0.12
7.02
0.12
1.82
0.12
0.42
0.12

150
Appendix “A8”
Values of Mean and Standard deviation Nonverbal Behavior Score of Teachers while Accepting Students Ideas (Observation 3)
Nonverbal
Behavior Score of
108 Teachers,(X)
Value of
Mean
x =n
x
D=X- X
D2
Value of Standard
deviation
nDS /)2^(
6
7
6
7
6
6
5
5
6
7
4
6
6
6
5
7
6
6
∑x=601
n=108
x =n
x
0.44
1.44
0.44
1.44
0.44
0.44
-0.56
-0.56
0.44
1.44
-1.56
0.44
0.44
0.44
-0.56
1.44
0.44
0.44
0.19
2.07
0.19
2.07
0.19
0.19
0.31
0.31
0.19
2.07
2.43
0.19
0.19
0.19
0.31
2.07
0.19
0.19
∑D2
=102.16
n = 108
S=108
16.102
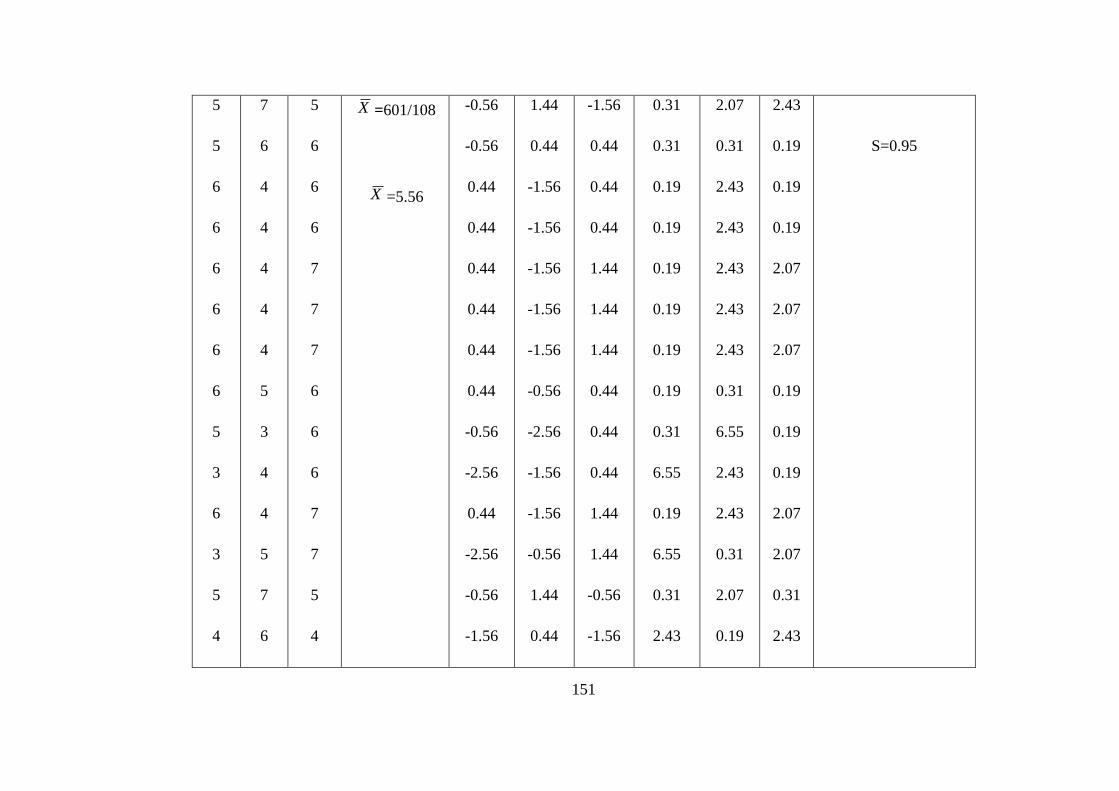
151
5
5
6
6
6
6
6
6
5
3
6
3
5
4
7
6
4
4
4
4
4
5
3
4
4
5
7
6
5
6
6
6
7
7
7
6
6
6
7
7
5
4
X =601/108
X =5.56
-0.56
-0.56
0.44
0.44
0.44
0.44
0.44
0.44
-0.56
-2.56
0.44
-2.56
-0.56
-1.56
1.44
0.44
-1.56
-1.56
-1.56
-1.56
-1.56
-0.56
-2.56
-1.56
-1.56
-0.56
1.44
0.44
-1.56
0.44
0.44
0.44
1.44
1.44
1.44
0.44
0.44
0.44
1.44
1.44
-0.56
-1.56
0.31
0.31
0.19
0.19
0.19
0.19
0.19
0.19
0.31
6.55
0.19
6.55
0.31
2.43
2.07
0.31
2.43
2.43
2.43
2.43
2.43
0.31
6.55
2.43
2.43
0.31
2.07
0.19
2.43
0.19
0.19
0.19
2.07
2.07
2.07
0.19
0.19
0.19
2.07
2.07
0.31
2.43
S=0.95
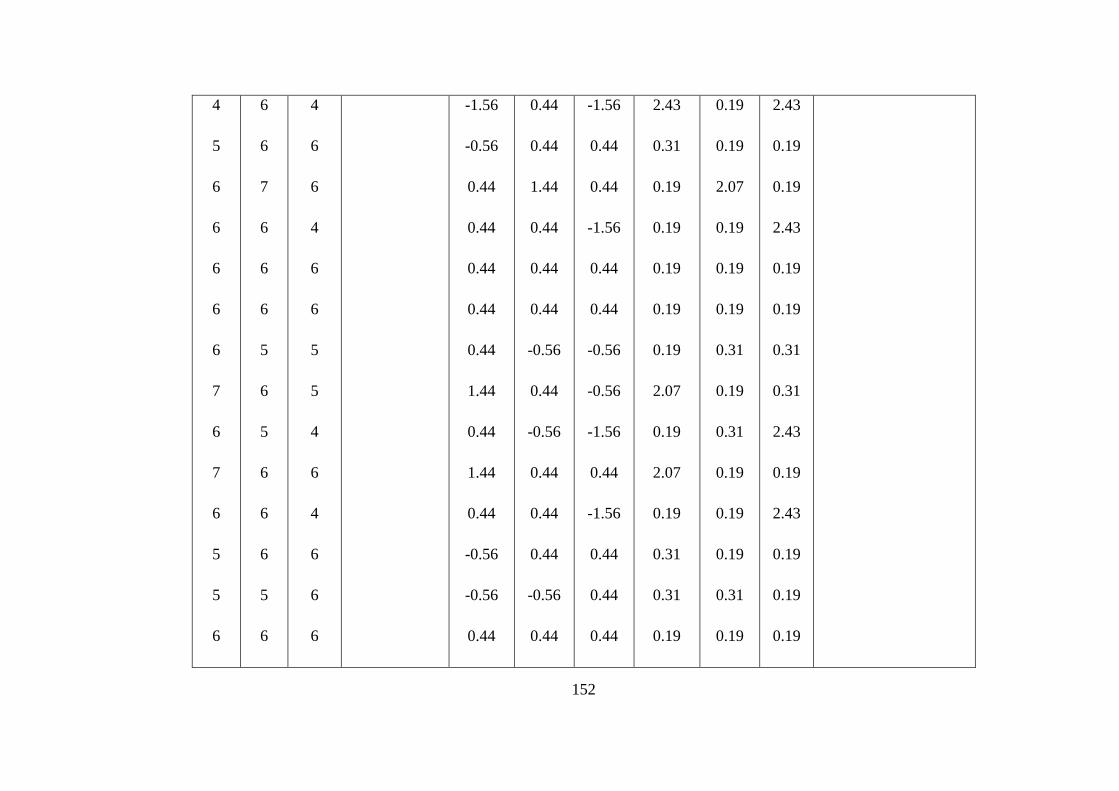
152
4
5
6
6
6
6
6
7
6
7
6
5
5
6
6
6
7
6
6
6
5
6
5
6
6
6
5
6
4
6
6
4
6
6
5
5
4
6
4
6
6
6
-1.56
-0.56
0.44
0.44
0.44
0.44
0.44
1.44
0.44
1.44
0.44
-0.56
-0.56
0.44
0.44
0.44
1.44
0.44
0.44
0.44
-0.56
0.44
-0.56
0.44
0.44
0.44
-0.56
0.44
-1.56
0.44
0.44
-1.56
0.44
0.44
-0.56
-0.56
-1.56
0.44
-1.56
0.44
0.44
0.44
2.43
0.31
0.19
0.19
0.19
0.19
0.19
2.07
0.19
2.07
0.19
0.31
0.31
0.19
0.19
0.19
2.07
0.19
0.19
0.19
0.31
0.19
0.31
0.19
0.19
0.19
0.31
0.19
2.43
0.19
0.19
2.43
0.19
0.19
0.31
0.31
2.43
0.19
2.43
0.19
0.19
0.19

153
6
6
5
5
6
5
0.44
0.44
-0.56
-0.56
0.44
-0.56
0.19
0.19
0.31
0.31
0.19
0.31
Appendix “A9”
Values of Mean and Standard deviation Nonverbal Behavior Score of Teachers While Making Questions (Observation 4)
Nonverbal Behavior
Score of 108
Teachers, (X)
Mean Value
x =n
x
D=X- X
D2
Value of Standard
deviation
nDS /)2^(
6
6
6
4
4
6
6
5
5
∑x=613
0.32
0.32
0.32
-1.68
-1.68
0.32
0.32
-0.68
-0.68
0.1
0.1
0.1
2.82
2.82
0.1
0.1
0.46
0.46
∑D=0

154
7
6
6
6
5
6
7
6
6
6
6
6
5
5
7
5
6
7
6
5
5
4
4
4
5
4
4
4
7
6
6
6
6
6
6
7
7
7
6
6
5
7
n = 108
X =613/108
X =5.68
1.32
0.32
0.32
0.32
-0.68
0.32
1.32
0.32
0.32
0.32
0.32
0.32
-0.68
-0.68
1.32
0.32
0.32
0.32
0.32
-0.68
-0.68
-1.68
-1.68
-1.68
-0.68
-1.68
-1.68
-1.68
1.32
0.32
0.32
0.32
0.32
0.32
0.32
1.32
1.32
1.32
0.32
0.32
-0.68
1.32
1.74
0.1
0.1
0.1
0.46
0.1
1.74
0.1
0.1
0.1
0.1
0.1
0.46
0.46
1.74
0.1
0.1
0.1
0.1
0.46
0.46
2.82
2.82
2.82
0.46
2.82
2.82
2.82
1.74
0.1
0.1
0.1
0.1
0.1
0.1
1.74
1.74
1.74
0.1
0.1
0.46
1.74
∑D2
=95.4
n = 108
S= 1084.95
S=0.94
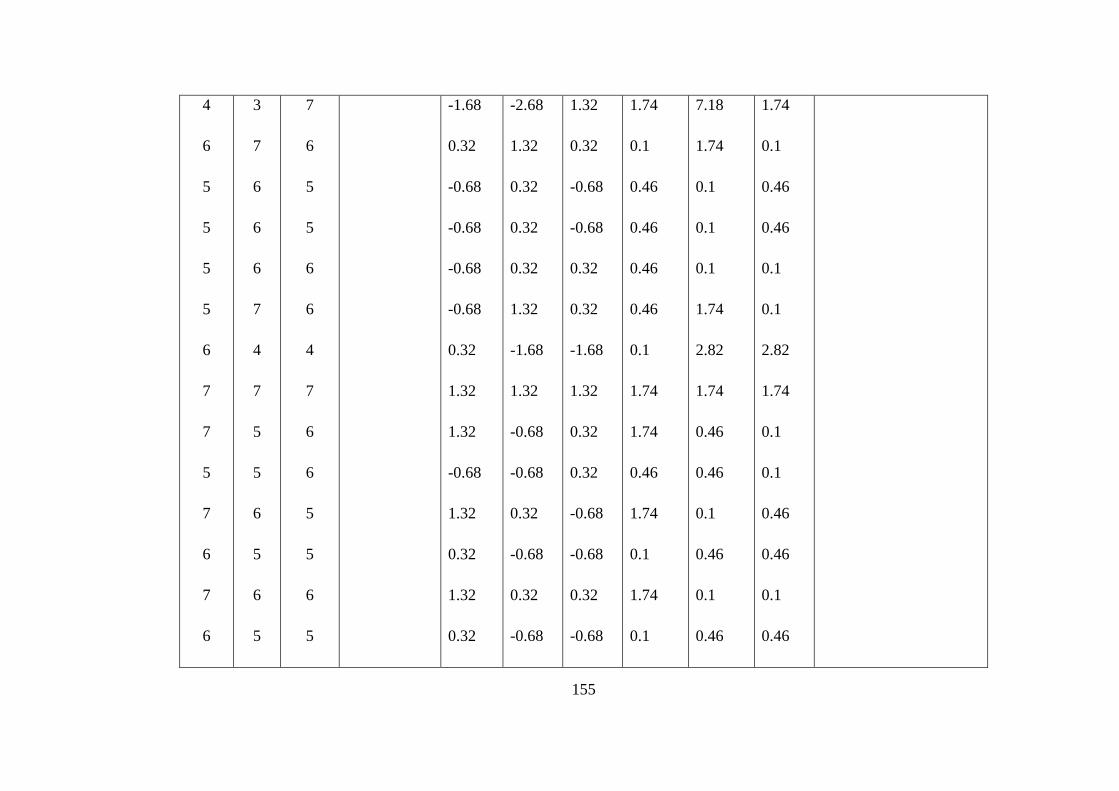
155
4
6
5
5
5
5
6
7
7
5
7
6
7
6
3
7
6
6
6
7
4
7
5
5
6
5
6
5
7
6
5
5
6
6
4
7
6
6
5
5
6
5
-1.68
0.32
-0.68
-0.68
-0.68
-0.68
0.32
1.32
1.32
-0.68
1.32
0.32
1.32
0.32
-2.68
1.32
0.32
0.32
0.32
1.32
-1.68
1.32
-0.68
-0.68
0.32
-0.68
0.32
-0.68
1.32
0.32
-0.68
-0.68
0.32
0.32
-1.68
1.32
0.32
0.32
-0.68
-0.68
0.32
-0.68
1.74
0.1
0.46
0.46
0.46
0.46
0.1
1.74
1.74
0.46
1.74
0.1
1.74
0.1
7.18
1.74
0.1
0.1
0.1
1.74
2.82
1.74
0.46
0.46
0.1
0.46
0.1
0.46
1.74
0.1
0.46
0.46
0.1
0.1
2.82
1.74
0.1
0.1
0.46
0.46
0.1
0.46
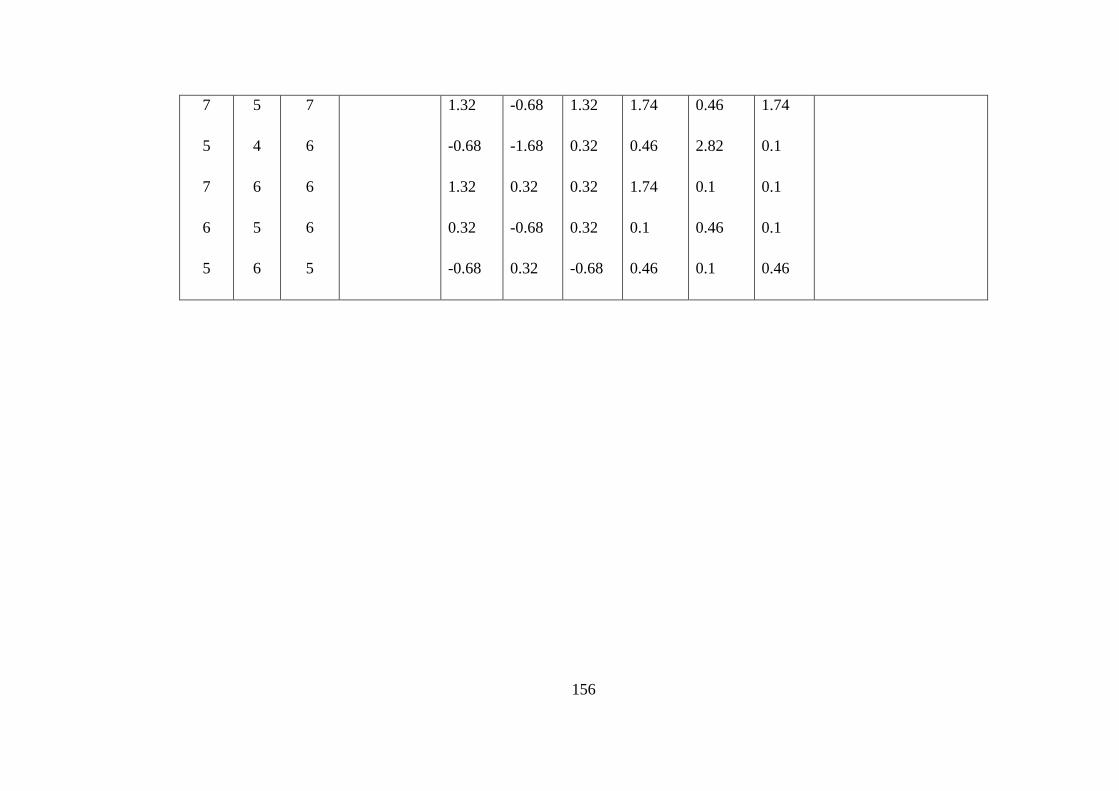
156
7
5
7
6
5
5
4
6
5
6
7
6
6
6
5
1.32
-0.68
1.32
0.32
-0.68
-0.68
-1.68
0.32
-0.68
0.32
1.32
0.32
0.32
0.32
-0.68
1.74
0.46
1.74
0.1
0.46
0.46
2.82
0.1
0.46
0.1
1.74
0.1
0.1
0.1
0.46

157
Appendix “A10”
Values of Mean and Standard deviation Nonverbal Behavior Score of Teachers while Delivering Lecture (Observation 5)
Nonverbal Behavior Score
of 108 Teachers,(X )
Value of Mean
x =n
x
D=X- X
D2
Value of Standard
deviation
nDS /)2^(
6
6
6
7
6
6
5
6
6
7
6
6
6
6
7
6
4
6
5
6
4
5
6
6
6
5
4
4
4
4
4
4
6
4
5
6
4
6
6
6
6
6
6
7
7
6
6
4
∑X=596
n=108
x =n
x
X =596/108
X =5.52
0.48
0.48
0.48
1.48
0.48
0.48
-0.52
0.48
0.481.
48
0.48
0.48
0.48
0.48
1.48
0.48
-0.52
-1.52
0.48
-0.52
0.48
-1.52
-0.52
0.48
0.48
0.48
-0.52
-1.52
-1.52
-1.52
-1.52
-1.52
-1.52
0.48
-1.52
-0.52
0.48
-1.52
0.48
0.48
0.48
0.48
0.48
0.48
1.48
1.48
0.48
0.48
-1.52
0.23
0.23
0.23
2.19
0.23
0.23
0.27
0.23
0.23
2.19
0.23
0.23
0.23
0.23
2.19
0.23
2.31
0.23
0.27
0.23
2.31
0.27
0.23
0.23
0.23
0.27
2.31
2.31
2.31
2.31
2.31
2.31
0.23
2.31
0.27
0.23
2.31
0.23
0.23
0.23
0.23
0.23
0.23
2.19
2.19
0.23
0.23
2.31
∑D2
=96.92
n = 108
S=108
92.96
S=0.95

158
Appendix “A11”
Values of Mean and Standard deviation Nonverbal Behavior Score of Teachers while Giving Directions (Observation 6)
Nonverbal Behavior
Score of 108
Teachers,(X )
Value of
Mean
x =n
x
D=X- X
D2
Value of Standard
deviation
nDS /)2^(
6
6
6
7
6
6
6
6
5
6
5
6
5
5
6
4
6
5
5
6
5
7
6
6
∑X=601
n=108
x =n
x
X =601/108
0.44
0.44
0.44
1.44
0.44
0.44
0.44
0.44
-0.56
0.44
-0.56
0.44
-0.56
-0.56
0.44
-1.56
0.44
-0.56
-0.56
0.44
-0.56
1.44
0.44
0.44
0.19
0.19
0.19
2.07
0.19
0.19
0.19
0.19
0.31
0.19
0.31
0.19
0.31
0.31
0.19
2.43
0.19
0.31
0.31
0.19
0.31
2.07
0.19
0.19
∑D2
=102.16
n = 108
S= 10816.102
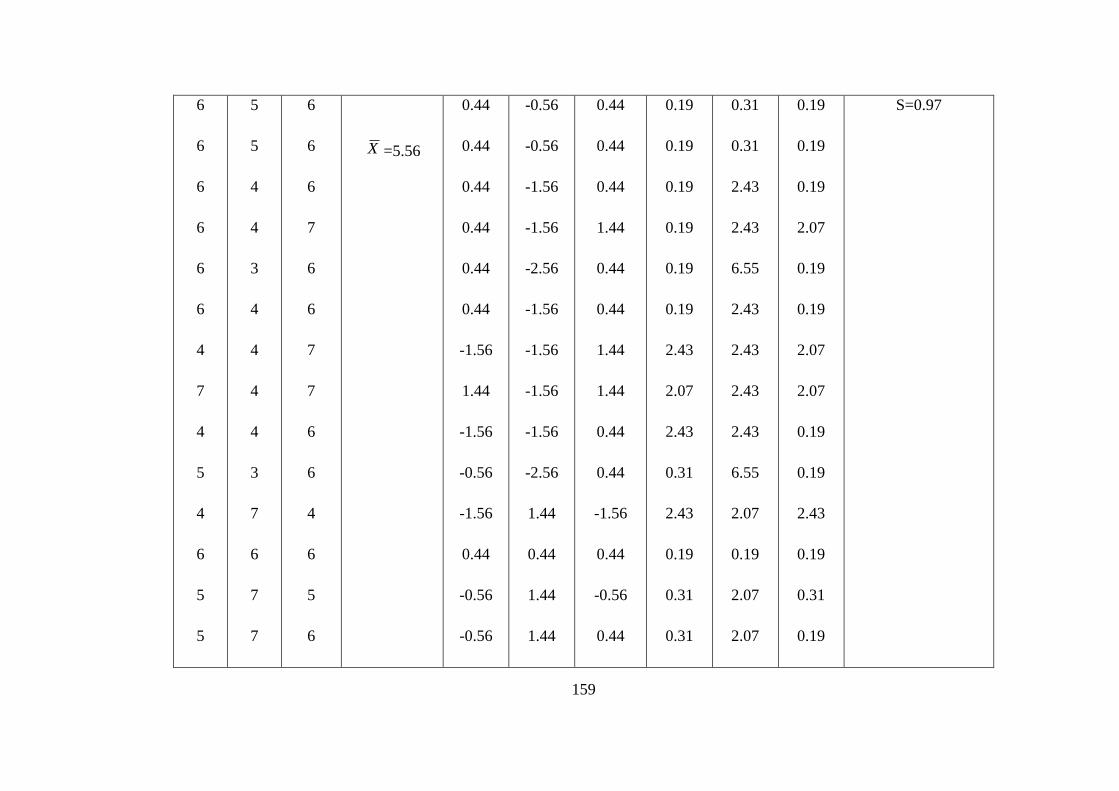
159
6
6
6
6
6
6
4
7
4
5
4
6
5
5
5
5
4
4
3
4
4
4
4
3
7
6
7
7
6
6
6
7
6
6
7
7
6
6
4
6
5
6
X =5.56
0.44
0.44
0.44
0.44
0.44
0.44
-1.56
1.44
-1.56
-0.56
-1.56
0.44
-0.56
-0.56
-0.56
-0.56
-1.56
-1.56
-2.56
-1.56
-1.56
-1.56
-1.56
-2.56
1.44
0.44
1.44
1.44
0.44
0.44
0.44
1.44
0.44
0.44
1.44
1.44
0.44
0.44
-1.56
0.44
-0.56
0.44
0.19
0.19
0.19
0.19
0.19
0.19
2.43
2.07
2.43
0.31
2.43
0.19
0.31
0.31
0.31
0.31
2.43
2.43
6.55
2.43
2.43
2.43
2.43
6.55
2.07
0.19
2.07
2.07
0.19
0.19
0.19
2.07
0.19
0.19
2.07
2.07
0.19
0.19
2.43
0.19
0.31
0.19
S=0.97

160
4
6
6
7
6
6
7
6
6
6
6
5
6
7
7
6
3
6
5
5
6
5
5
6
6
6
5
5
5
5
6
7
5
6
4
5
6
6
5
7
4
6
-1.56
0.44
0.44
1.44
0.44
0.44
1.44
0.44
0.44
0.44
0.44
-0.56
0.44
1.44
1.44
0.44
-2.56
0.44
-0.56
-0.56
0.44
-0.56
-0.56
0.44
0.44
0.44
-0.56
-0.56
-0.56
-0.56
0.44
1.44
-0.56
0.44
-1.56
-0.56
0.44
0.44
-0.56
1.44
-1.56
0.44
2.43
0.19
0.19
2.07
0.19
0.19
2.07
0.19
0.19
0.19
0.19
0.31
0.19
2.07
2.07
0.19
6.55
0.19
0.31
0.31
0.19
0.31
0.31
0.19
0.19
0.19
0.31
0.31
0.31
0.31
0.19
2.07
0.31
0.19
2.43
0.31
0.19
0.19
0.312.0
7
2.43
0.19
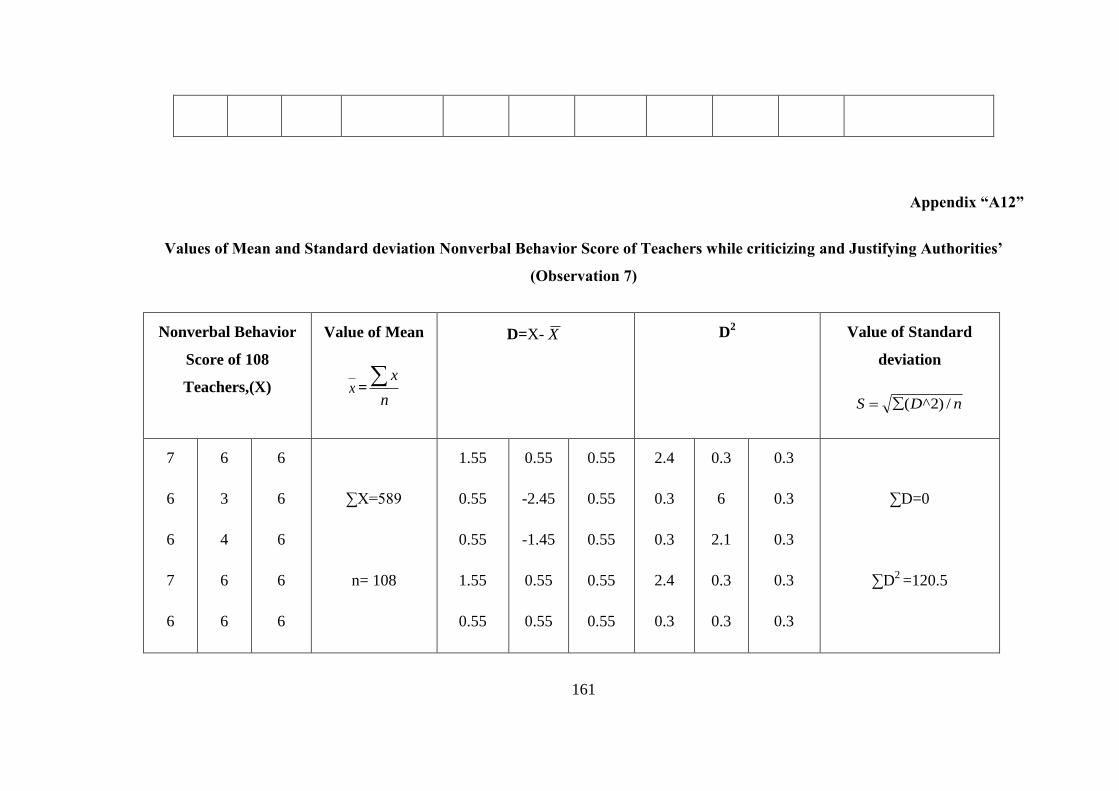
161
Appendix “A12”
Values of Mean and Standard deviation Nonverbal Behavior Score of Teachers while criticizing and Justifying Authorities’
(Observation 7)
Nonverbal Behavior
Score of 108
Teachers,(X)
Value of Mean
x =n
x
D=X- X
D2
Value of Standard
deviation
nDS /)2^(
7
6
6
7
6
6
3
4
6
6
6
6
6
6
6
∑X=589
n= 108
1.55
0.55
0.55
1.55
0.55
0.55
-2.45
-1.45
0.55
0.55
0.55
0.55
0.55
0.55
0.55
2.4
0.3
0.3
2.4
0.3
0.3
6
2.1
0.3
0.3
0.3
0.3
0.3
0.3
0.3
∑D=0
∑D2
=120.5
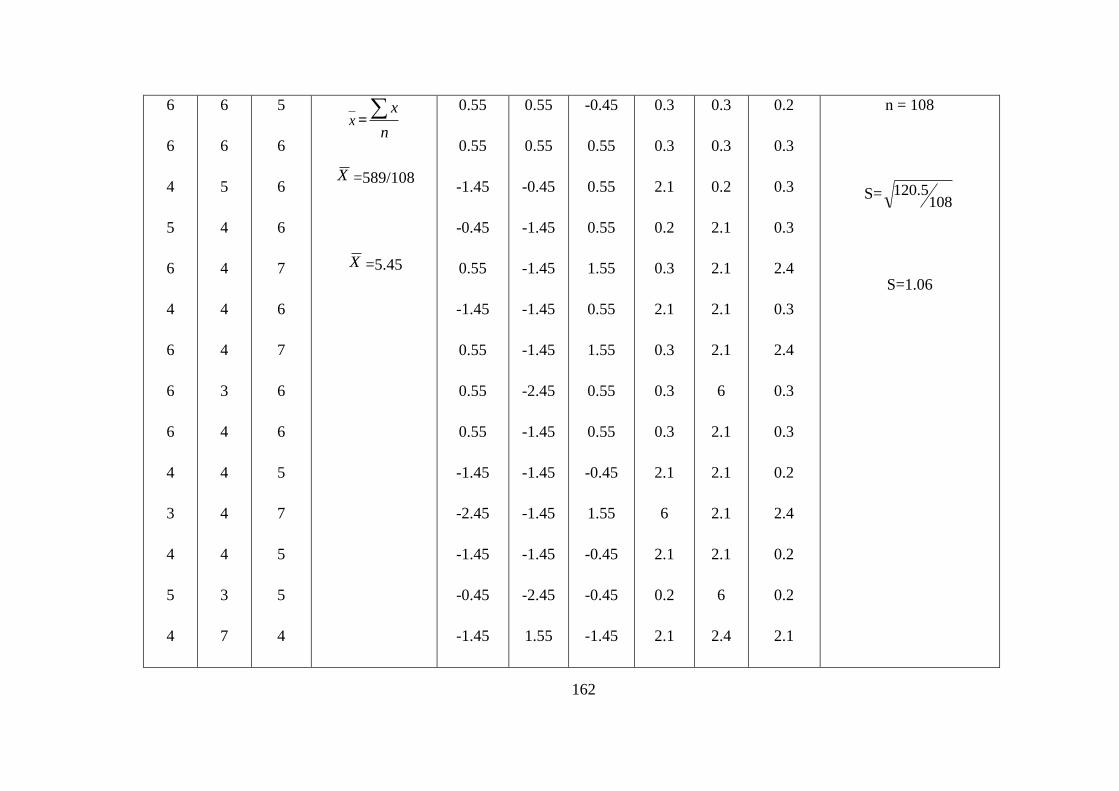
162
6
6
4
5
6
4
6
6
6
4
3
4
5
4
6
6
5
4
4
4
4
3
4
4
4
4
3
7
5
6
6
6
7
6
7
6
6
5
7
5
5
4
x =n
x
X =589/108
X =5.45
0.55
0.55
-1.45
-0.45
0.55
-1.45
0.55
0.55
0.55
-1.45
-2.45
-1.45
-0.45
-1.45
0.55
0.55
-0.45
-1.45
-1.45
-1.45
-1.45
-2.45
-1.45
-1.45
-1.45
-1.45
-2.45
1.55
-0.45
0.55
0.55
0.55
1.55
0.55
1.55
0.55
0.55
-0.45
1.55
-0.45
-0.45
-1.45
0.3
0.3
2.1
0.2
0.3
2.1
0.3
0.3
0.3
2.1
6
2.1
0.2
2.1
0.3
0.3
0.2
2.1
2.1
2.1
2.1
6
2.1
2.1
2.1
2.1
6
2.4
0.2
0.3
0.3
0.3
2.4
0.3
2.4
0.3
0.3
0.2
2.4
0.2
0.2
2.1
n = 108
S=108
5.120
S=1.06

163
6
6
5
4
6
5
7
6
6
4
6
6
6
6
5
6
6
7
4
6
6
5
5
6
5
5
4
4
6
6
7
7
5
7
7
5
6
6
6
5
6
5
0.55
0.55
-0.45
-1.45
0.55
-0.45
1.55
0.55
0.55
-1.45
0.55
0.55
0.55
0.55
-0.45
0.55
0.55
1.55
1.55
0.55
0.55
-0.45
-0.45
0.55
-0.45
-0.45
-1.45
-1.45
0.55
0.55
1.55
1.55
-0.45
1.55
1.55
-0.45
0.55
0.55
0.55
-0.45
0.55
-0.45
0.3
0.3
0.2
2.1
0.3
0.2
2.4
0.3
0.3
2.1
0.3
0.3
0.3
0.3
0.2
0.3
0.3
2.4
2.4
0.3
0.3
0.2
0.2
0.3
0.2
0.2
2.1
2.1
0.3
0.3
2.4
2.4
0.2
2.4
2.4
0.2
0.3
0.3
0.3
0.2
0.3
0.2
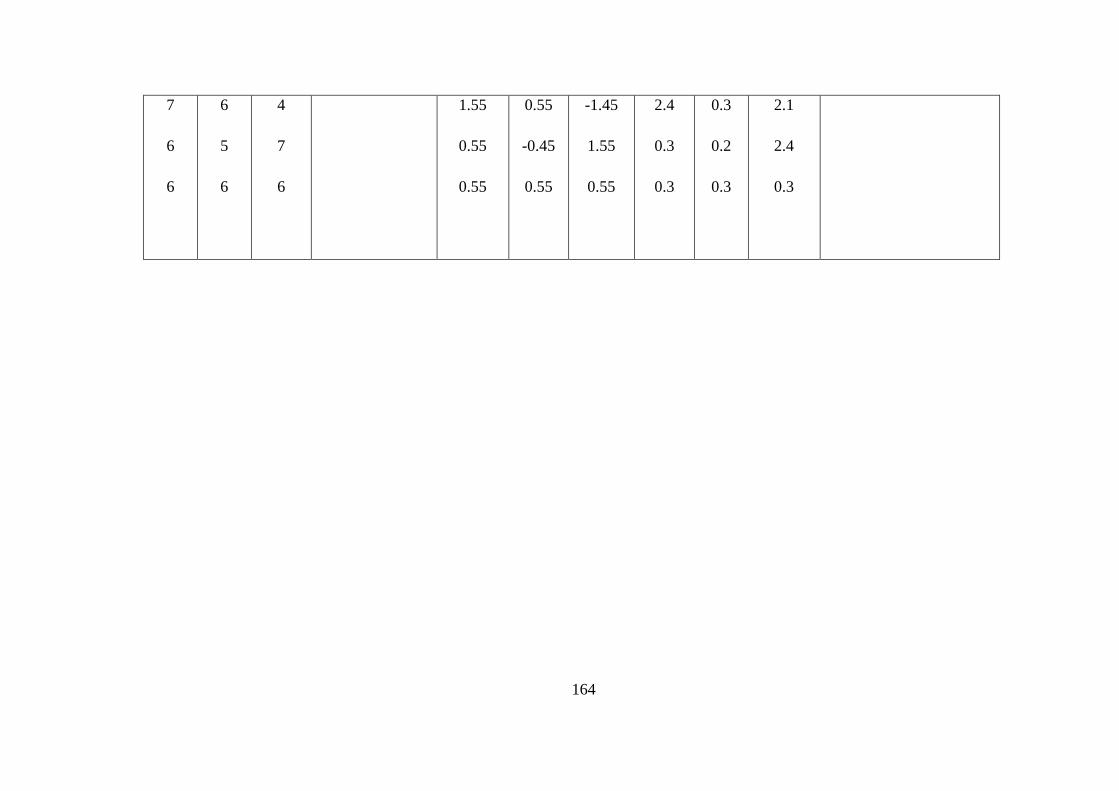
164
7
6
6
6
5
6
4
7
6
1.55
0.55
0.55
0.55
-0.45
0.55
-1.45
1.55
0.55
2.4
0.3
0.3
0.3
0.2
0.3
2.1
2.4
0.3

165
Appendix “B1”
Values of Standard error of mean and A 100(1-α)% Confidence Interval for
Population mean Nonverbal behavior score of teachers while Accepting feeling of
students
(Observation 1&2)
n
SS
x
108
96.0
xS
x
S 0.09
A 100 (1-α) % confidence interval for µ as
α = 0.05, Z α/2 = 1.96, X = 5.65, S x = 0.09
x ± Z α/2S x
5.65 ± 1.96×0.09
5.65 ±0.18
5.65 -0.18 ___________ 5.65 +0.18
5.47 ____________ 5.83
(L, U) = (5.47, 5.83)

166
Appendix “B2”
Values of Standard error of mean and A 100(1-α)% Confidence Interval for
Population mean Nonverbal behavior score of teachers while Accepting student
ideas
(Observation 3)
n
SS
x
108
95.0
xS
x
S 0.06
A 100 (1-α) % confidence interval for µ as
α = 0.05, Z α/2 = 1.96, X = 5.56, S x = 0.06
x ± Z α/2S x
5.56 ± 1.96×0.06
5.56 ±0.12
5.56 -0.12 ___________ 5.65 +0.12
5.53 ____________ 5.77
(L, U) = (5.53, 5.77)
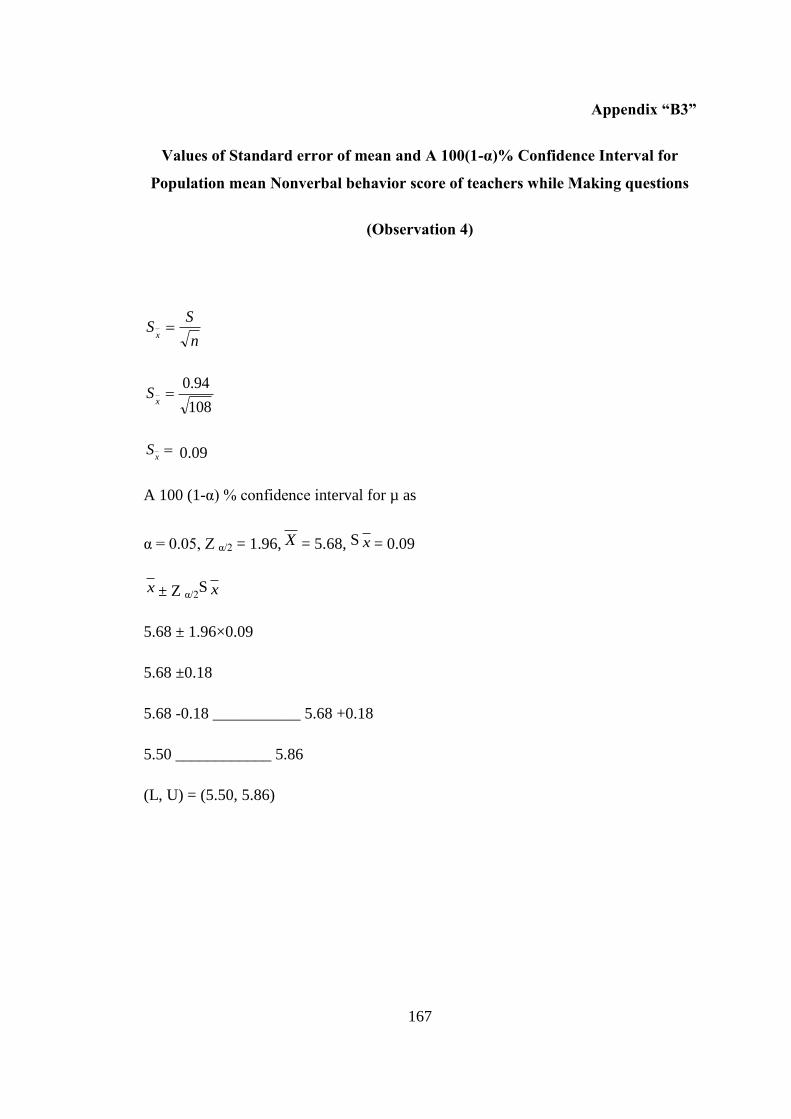
167
Appendix “B3”
Values of Standard error of mean and A 100(1-α)% Confidence Interval for
Population mean Nonverbal behavior score of teachers while Making questions
(Observation 4)
n
SS
x
108
94.0
xS
x
S 0.09
A 100 (1-α) % confidence interval for µ as
α = 0.05, Z α/2 = 1.96, X = 5.68, S x = 0.09
x ± Z α/2S x
5.68 ± 1.96×0.09
5.68 ±0.18
5.68 -0.18 ___________ 5.68 +0.18
5.50 ____________ 5.86
(L, U) = (5.50, 5.86)

168
Appendix “B4”
Values of Standard error of mean and A 100(1-α)% Confidence Interval for
Population mean Nonverbal behavior score of teachers while Delivering lecture
(Observation 5)
n
SS
x
108
95.0
xS
x
S 0.09
A 100 (1-α) % confidence interval for µ as
α = 0.05, Z α/2 = 1.96, X = 5.52, S x = 0.09
x ± Z α/2S x
5.52 ± 1.96×0.09
5.52 ±0.18
5.52 -0.18 ___________ 5.52 +0.18
5.34 ____________ 5.70
(L, U) = (5.34, 5.70)

169
Appendix “B5”
Values of Standard error of mean and A 100(1-α)% Confidence Interval for
Population mean Nonverbal behavior score of teachers while Giving directions
(Observation 6)
n
SS
x
108
97.0
xS
x
S 0.09
A 100 (1-α) % confidence interval for µ as
α = 0.05, Z α/2 = 1.96, X = 5.56, S x = 0.09
x ± Z α/2S x
5.56 ± 1.96×0.09
5.56 ±0.18
5.56 -0.18 ___________ 5.56 +0.18
5.38 ____________ 5.74
(L, U) = (5.38, 5.74)
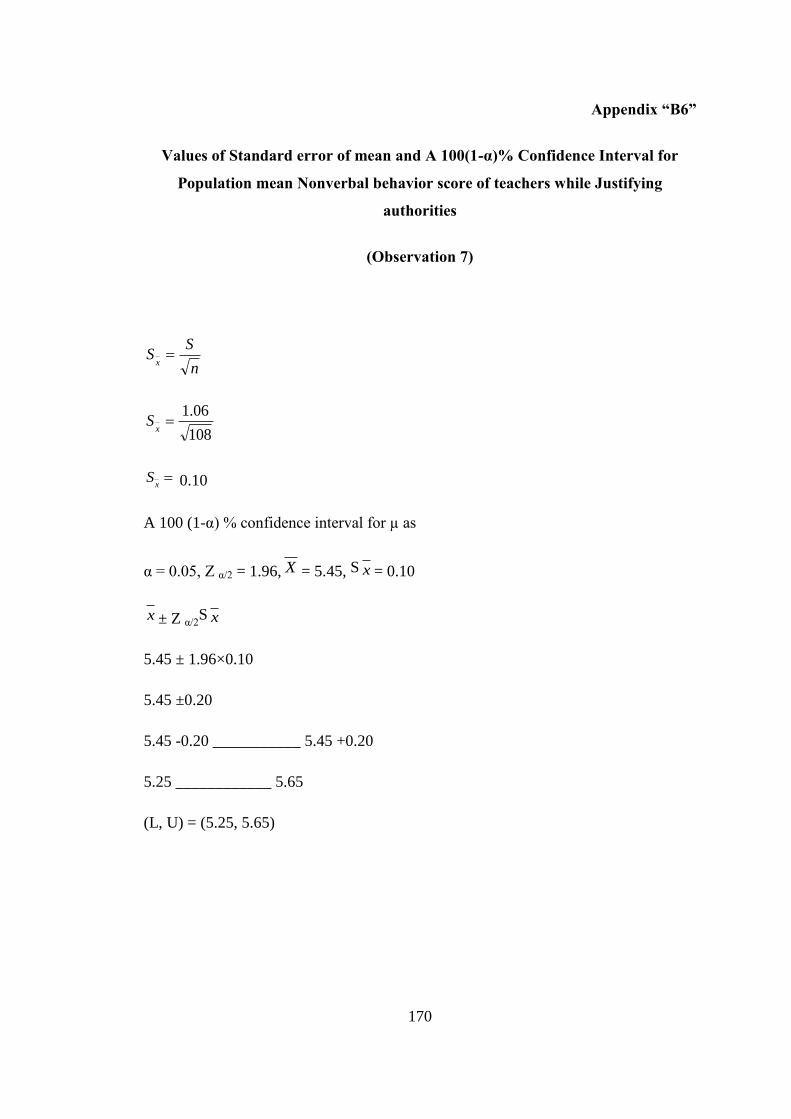
170
Appendix “B6”
Values of Standard error of mean and A 100(1-α)% Confidence Interval for
Population mean Nonverbal behavior score of teachers while Justifying
authorities
(Observation 7)
n
SS
x
108
06.1
xS
x
S 0.10
A 100 (1-α) % confidence interval for µ as
α = 0.05, Z α/2 = 1.96, X = 5.45, S x = 0.10
x ± Z α/2S x
5.45 ± 1.96×0.10
5.45 ±0.20
5.45 -0.20 ___________ 5.45 +0.20
5.25 ____________ 5.65
(L, U) = (5.25, 5.65)

171
Appendix “C1”
Values of Mean and Standard deviation Nonverbal Behavior Score of Male
Teachers while Accepting Students, Feelings (Observation 1 & 2)
Nonverbal
Score of 54
Male
Teachers,
(X)
Value of Mean
x =n
x
D=X- X
D2 Value of
Standard
deviation
nDS /)2^(
6
7
6
6
6
6
6
5
6
5
5
6
7
6
4
4
6
5
5
6
7
7
5
6
7
6
4
4
4
5
4
5
4
6
4
4
7
6
6
7
6
5
6
6
7
6
7
7
6
6
5
6
6
7
∑x= 307
n= 54
X = 307/54
X = 5.69
0.31
1.31
0.31
0.31
0.31
0.31
0.31
-0.69
0.31
-0.69
-0.69
0.31
1.31
0.31
-1.69
-1.69
0.31
-0.69
-0.69
0.31
1.31
1.31
-0.69
0.31
1.31
0.31
-1.69
-1.69
-1.69
-0.69
-1.69
-0.69
-1.69
0.31
-1.69
-1.69
1.31
0.31
0.31
1.31
0.31
-0.69
0.31
0.31
1.31
0.31
1.31
1.31
0.31
0.31
-0.69
0.31
0.31
1.31
0.10
1.72
0.10
0.10
0.10
0.10
0.10
0.48
0.10
0.48
0.48
0.10
1.72
0.10
2.86
2.86
0.10
0.48
0.48
0.10
1.72
1.72
0.48
0.10
1.72
0.10
2.86
2.86
2.86
0.48
2.86
0.48
2.86
0.10
2.86
2.86
1.72
0.10
0.10
1.72
0.10
0.48
0.10
0.10
1.72
0.10
1.72
1.72
0.10
0.10
0.48
0.10
0.10
1.72
∑D= 0
∑D2= 51.86
n = 54
S= 5486.51
S= 0.98

172
Appendix “C2”
Values of Mean and Standard deviation Nonverbal Behavior Score of Male
Teachers while Accepting Students, Ideas (Observation 3)
Nonverbal
Score of 54
Male Teachers,
(X)
Value of
Mean
x =n
x
D=X- X
D2 Value of
Standard
deviation
nDS /)2^(
6
7
6
7
6
6
5
5
6
6
6
6
6
6
5
3
6
3
5
5
6
7
4
6
7
6
4
4
4
4
4
5
3
4
4
5
6
6
5
7
6
6
5
6
6
6
7
7
7
6
6
6
7
7
∑x= 300
n= 54
X = 300/54
X = 5.56
0.44
1.44
0.44
1.44
0.44
0.44
-0.56
-0.56
0.44
0.44
0.44
0.44
0.44
0.44
-0.56
-2.56
0.44
-2.56
-0.56
-0.56
0.44
1.44
-1.56
0.44
1.44
0.44
-1.56
-1.56
-1.56
-1.56
-1.56
-0.56
-2.56
-1.56
-1.56
-0.56
0.44
0.44
-0.56
1.44
0.44
0.44
-0.56
0.44
0.44
0.44
1.44
1.44
1.44
0.44
0.44
0.44
1.44
1.44
0.19
2.07
0.19
2.07
0.19
0.19
0.31
0.31
0.19
0.19
0.19
0.19
0.19
0.19
0.31
6.55
0.19
6.55
0.31
0.31
0.19
2.07
2.43
0.19
2.07
0.19
2.43
2.43
2.43
2.43
2.43
0.31
6.55
2.43
2.43
0.31
0.19
0.19
0.31
2.07
0.19
0.19
0.31
0.19
0.19
0.19
2.07
2.07
2.07
0.19
0.19
0.19
2.07
2.07
∑D= 0
∑D2= 67.14
n = 54
S= 5414.67
S= 1.12

173
Appendix “C3”
Values of Mean and Standard deviation Nonverbal Behavior Score of Male
Teachers while Making Questions (Observation 4)
Nonverbal
Score of 54
Male
Teachers,
(X)
Value of
Mean
x =n
x
D=X- X
D2 Value of
Standard
deviation
nDS /)2^(
6
6
6
7
6
6
6
5
6
7
6
6
6
6
6
5
5
4
4
4
6
7
5
6
7
6
5
5
4
4
4
5
4
4
4
3
6
5
5
7
6
6
6
6
6
6
7
7
7
6
6
5
7
7
∑x= 303
n= 54
X = 303/54
X = 5.61
0.39
0.39
0.39
1.39
0.39
0.39
0.39
-0.61
0.39
1.39
0.39
0.39
0.39
0.39
0.39
-0.61
-0.61
-1.61
-1.61
-1.61
0.39
1.39
-0.61
0.39
1.39
0.39
-0.61
-0.61
-1.61
-1.61
-1.61
-0.61
-1.61
-1.61
-1.61
-2.61
0.39
-0.61
-0.61
1.39
0.39
0.39
0.39
0.39
0.39
0.39
1.39
1.39
1.39
0.39
0.39
-0.61
1.39
1.39
0.15
0.15
0.15
1.93
0.15
0.15
0.15
0.37
0.15
1.93
0.15
0.15
0.15
0.15
0.15
0.37
0.37
2.59
2.59
2.59
0.15
1.93
0.37
0.15
1.93
0.15
0.37
0.37
2.59
2.59
2.59
0.37
2.59
2.59
2.59
6.81
0.15
0.37
0.37
1.93
0.15
0.15
0.15
0.15
0.15
0.15
1.93
1.93
1.93
0.15
0.15
0.37
1.93
1.93
∑D= 0
∑D2= 56.72
n = 54
S= 5472.56
S= 1.02

174
Appendix “C4”
Values of Mean and Standard deviation Nonverbal Behavior Score of Male
Teachers while Delivering Lecture (Observation 5)
Nonverbal
Score of 54
Male
Teachers,
(X)
Value of
Mean
x =n
x
D=X- X
D2 Value of
Standard
deviation
nDS /)2^(
6
6
6
7
6
6
5
6
6
7
6
6
6
6
7
6
5
4
4
6
5
6
4
5
6
6
6
5
4
4
4
4
4
4
4
3
6
4
5
6
4
6
6
6
6
6
6
7
7
6
6
4
7
6
∑x= 295
n= 54
X = 295/54
X = 5.46
0.54
0.54
0.54
1.54
0.54
0.54
-0.46
0.54
0.54
1.54
0.54
0.54
0.54
0.54
1.54
0.54
-0.46
-1.46
-1.46
0.54
-0.46
0.54
-1.46
-0.46
0.54
0.54
0.54
-0.46
-1.46
-1.46
-1.46
-1.46
-1.46
-1.46
-1.46
-2.46
0.54
-1.46
-0.46
0.54
-1.46
0.54
0.54
0.54
0.54
0.54
0.54
1.54
1.54
0.54
0.54
-1.46
1.54
0.54
0.29
0.29
0.29
2.37
0.29
0.29
0.21
0.29
0.29
2.37
0.29
0.29
0.29
0.29
2.37
0.29
0.21
2.13
2.13
0.29
0.21
0.29
2.13
0.21
0.29
0.29
0.29
0.21
2.13
2.13
2.13
2.13
2.13
2.13
2.13
6.05
0.29
2.13
0.21
0.29
2.13
0.29
0.29
0.29
0.29
0.29
0.29
2.37
2.37
0.29
0.29
2.13
2.37
0.29
∑D= 0
∑D2= 57.34
n = 54
S= 5434.57
S= 1.03
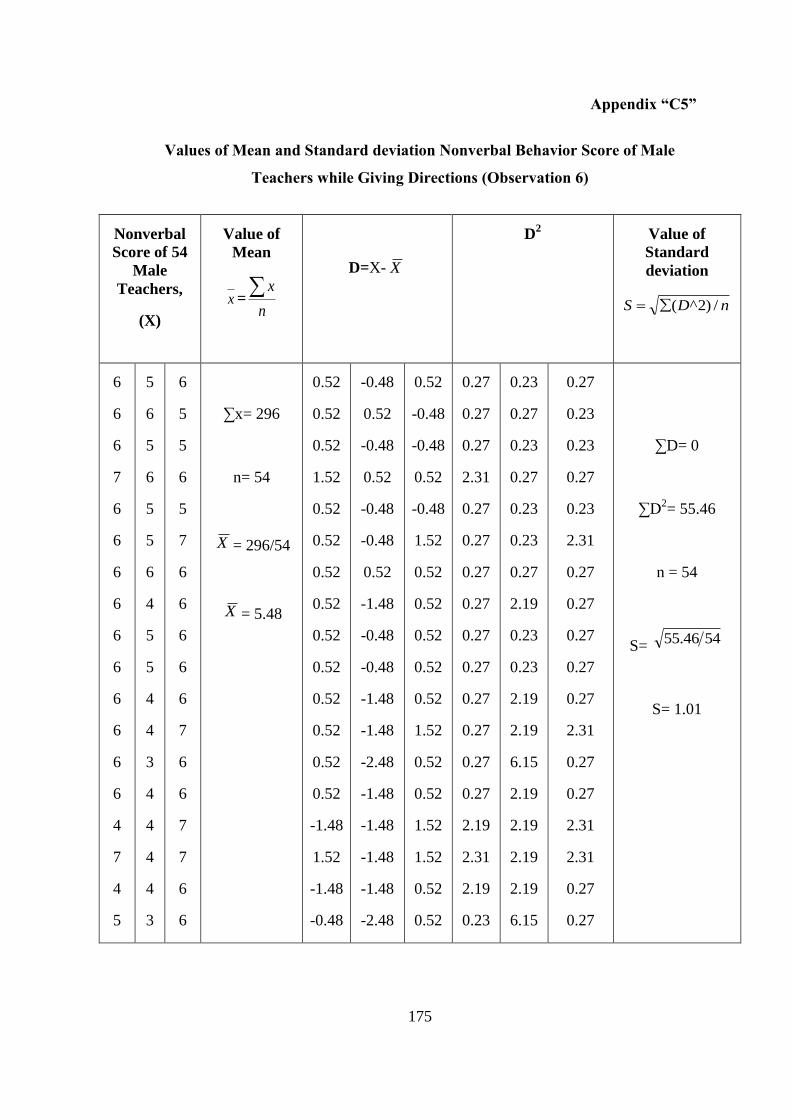
175
Appendix “C5”
Values of Mean and Standard deviation Nonverbal Behavior Score of Male
Teachers while Giving Directions (Observation 6)
Nonverbal
Score of 54
Male
Teachers,
(X)
Value of
Mean
x =n
x
D=X- X
D2 Value of
Standard
deviation
nDS /)2^(
6
6
6
7
6
6
6
6
6
6
6
6
6
6
4
7
4
5
5
6
5
6
5
5
6
4
5
5
4
4
3
4
4
4
4
3
6
5
5
6
5
7
6
6
6
6
6
7
6
6
7
7
6
6
∑x= 296
n= 54
X = 296/54
X = 5.48
0.52
0.52
0.52
1.52
0.52
0.52
0.52
0.52
0.52
0.52
0.52
0.52
0.52
0.52
-1.48
1.52
-1.48
-0.48
-0.48
0.52
-0.48
0.52
-0.48
-0.48
0.52
-1.48
-0.48
-0.48
-1.48
-1.48
-2.48
-1.48
-1.48
-1.48
-1.48
-2.48
0.52
-0.48
-0.48
0.52
-0.48
1.52
0.52
0.52
0.52
0.52
0.52
1.52
0.52
0.52
1.52
1.52
0.52
0.52
0.27
0.27
0.27
2.31
0.27
0.27
0.27
0.27
0.27
0.27
0.27
0.27
0.27
0.27
2.19
2.31
2.19
0.23
0.23
0.27
0.23
0.27
0.23
0.23
0.27
2.19
0.23
0.23
2.19
2.19
6.15
2.19
2.19
2.19
2.19
6.15
0.27
0.23
0.23
0.27
0.23
2.31
0.27
0.27
0.27
0.27
0.27
2.31
0.27
0.27
2.31
2.31
0.27
0.27
∑D= 0
∑D2= 55.46
n = 54
S= 5446.55
S= 1.01

176
Appendix “C6”
Values of Mean and Standard Deviation Nonverbal Behavior Score of Male
Teachers while Justifying Authorities (Observation 7)
Nonverbal
Score of 54
Male
Teachers,
(X)
Value of
Mean
x =n
x
D=X- X
D2 Value of
Standard
deviation
nDS /)2^(
7
6
6
7
6
6
6
4
5
6
4
6
6
6
4
3
4
5
6
3
4
6
6
6
6
5
4
4
4
4
3
4
4
4
4
3
6
6
6
6
6
5
6
6
6
7
6
7
6
6
5
7
5
5
∑x= 284
n= 54
X = 284/54
X = 5.26
1.74
0.74
0.74
1.74
0.74
0.74
0.74
-1.26
-0.26
0.74
-1.26
0.74
0.74
0.74
-1.26
-2.26
-1.26
-0.26
0.74
-2.26
-1.26
0.74
0.74
0.74
0.74
-0.26
-1.26
-1.26
-1.26
-1.26
-2.26
-1.26
-1.26
-1.26
-1.26
-2.26
0.74
0.74
0.74
0.74
0.74
-0.26
0.74
0.74
0.74
1.74
0.74
1.74
0.74
0.74
-0.26
1.74
-0.26
-0.26
3.03
0.55
0.55
3.03
0.55
0.55
0.55
1.59
0.07
0.55
1.59
0.55
0.55
0.55
1.59
5.11
1.59
0.07
0.55
5.11
1.59
0.55
0.55
0.55
0.55
0.07
1.59
1.59
1.59
1.59
5.11
1.59
1.59
1.59
1.59
5.11
0.55
0.55
0.55
0.55
0.55
0.07
0.55
0.55
0.55
3.03
0.55
3.03
0.55
0.55
0.07
3.03
0.07
0.07
∑D= 0
∑D2= 70.50
n = 54
S=5450.70
S= 1.14

177
Appendix “D1”
Values of Mean and Standard Deviation Nonverbal Behavior Score of Female
Teachers while Accepting Students, Feelings (Observation 1 & 2)
Nonverbal
Score of 54
Female
Teachers,
(X)
Value of Mean
x =n
x
D=X- X
D2 Value of
Standard
deviation
nDS /)2^(
5
4
5
5
6
6
6
6
7
7
6
7
6
6
5
6
6
6
6
7
6
5
7
6
5
5
6
6
5
6
7
6
6
6
6
6
5
4
5
6
4
4
6
6
4
5
3
6
3
6
7
6
5
6
∑x= 303
n= 54
X = 303/54
X = 5.61
-0.61
-1.61
-0.61
-0.61
0.39
0.39
0.39
0.39
1.39
1.39
0.39
1.39
0.39
0.39
-0.61
0.39
0.39
0.39
0.39
1.39
0.39
-0.61
1.39
0.39
-0.61
-0.61
0.39
0.39
-0.61
0.39
1.39
0.39
0.39
0.39
0.39
0.39
-0.61
-1.61
-0.61
0.39
-1.61
-1.61
0.39
0.39
-1.61
-0.61
-2.61
0.39
-2.61
0.39
1.39
0.39
-0.61
0.39
0.37
2.59
0.37
0.37
0.15
0.15
0.15
0.15
1.93
1.93
0.15
1.93
0.15
0.15
0.37
0.15
0.15
0.15
0.15
1.93
0.15
0.37
1.93
0.15
0.37
0.37
0.15
0.15
0.37
0.15
1.93
0.15
0.15
0.15
0.15
0.15
0.37
2.59
0.37
0.15
2.59
2.59
0.15
0.15
2.59
0.37
6.81
0.15
6.81
0.15
1.93
0.15
0.37
0.15
∑D= 0
∑D2= 48.72
n = 54
S= 5472.48
S= 0.95

178
Appendix “D2”
Values of Mean and Standard deviation Nonverbal Behavior Score of Female
Teachers while Accepting Students, Ideas (Observation 3)
Nonverbal
Score of 54
Female
Teachers,
(X)
Value of
Mean
x =n
x
D=X- X
D2 Value of Standard
deviation
nDS /)2^(
5
4
4
5
6
6
6
6
6
7
6
7
6
5
5
6
6
6
7
6
6
6
7
6
6
6
5
6
5
6
6
6
5
6
5
5
5
4
4
6
6
4
6
6
5
5
4
6
4
6
6
6
6
5
∑x= 301
n= 54
X = 301/54
X = 5.57
-0.57
-1.57
-1.57
-0.57
0.43
0.43
0.43
0.43
0.43
1.43
0.43
1.43
0.43
-0.57
-0.57
0.43
0.43
0.43
1.43
0.43
0.43
0.43
1.43
0.43
0.43
0.43
-0.57
0.43
-0.57
0.43
0.43
0.43
-0.57
0.43
-0.57
-0.57
-0.57
-1.57
-1.57
0.43
0.43
-1.57
0.43
0.43
-0.57
-0.57
-1.57
0.43
-1.57
0.43
0.43
0.43
0.43
-0.57
0.32
2.46
2.46
0.32
0.18
0.18
0.18
0.18
0.18
2.04
0.18
2.04
0.18
0.32
0.32
0.18
0.18
0.18
2.04
0.18
0.18
0.18
2.04
0.18
0.18
0.18
0.32
0.18
0.32
0.18
0.18
0.18
0.32
0.18
0.32
0.32
0.32
2.46
2.46
0.18
0.18
2.46
0.18
0.18
0.32
0.32
2.46
0.18
2.46
0.18
0.18
0.18
0.18
0.32
∑D= 0
∑D2= 34.94
n = 54
S= 5494.34
S= 0.80

179
Appendix “D3”
Values of Mean and Standard deviation Nonverbal Behavior Score of Female
Teachers while Making Questions (Observation 4)
Nonverbal
Score of 54
Female
Teachers,
(X)
Value of
Mean
x =n
x
D=X- X
D2 Value of
Standard
deviation
nDS /)2^(
6
5
5
5
5
6
7
7
5
7
6
7
6
7
5
7
6
5
7
6
6
6
7
4
7
5
5
6
5
6
5
5
4
6
5
6
6
5
5
6
6
4
7
6
6
5
5
6
5
7
6
6
6
5
∑x= 310
n= 54
X = 310/54
X = 5.74
0.26
-0.74
-0.74
-0.74
-0.74
0.26
1.26
1.26
-0.74
1.26
0.26
1.26
0.26
1.26
-0.74
1.26
0.26
-0.74
1.26
0.26
0.26
0.26
1.26
-1.74
1.26
-0.74
-0.74
0.26
-0.74
0.26
-0.74
-0.74
-1.74
0.26
-0.74
0.26
0.26
-0.74
-0.74
0.26
0.26
-1.74
1.26
0.26
0.26
-0.74
-0.74
0.26
-0.74
1.26
0.26
0.26
0.26
-0.74
0.07
0.55
0.55
0.55
0.55
0.07
1.59
1.59
0.55
1.59
0.07
1.59
0.07
1.59
0.55
1.59
0.07
0.55
1.59
0.07
0.07
0.07
1.59
3.03
1.59
0.55
0.55
0.07
0.55
0.07
0.55
0.55
3.03
0.07
0.55
0.07
0.07
0.55
0.55
0.07
0.07
3.03
1.59
0.07
0.07
0.55
0.55
0.07
0.55
1.59
0.07
0.07
0.07
0.55
∑D= 0
∑D2= 38.50
n = 54
S= 5450.38
S= 0.84
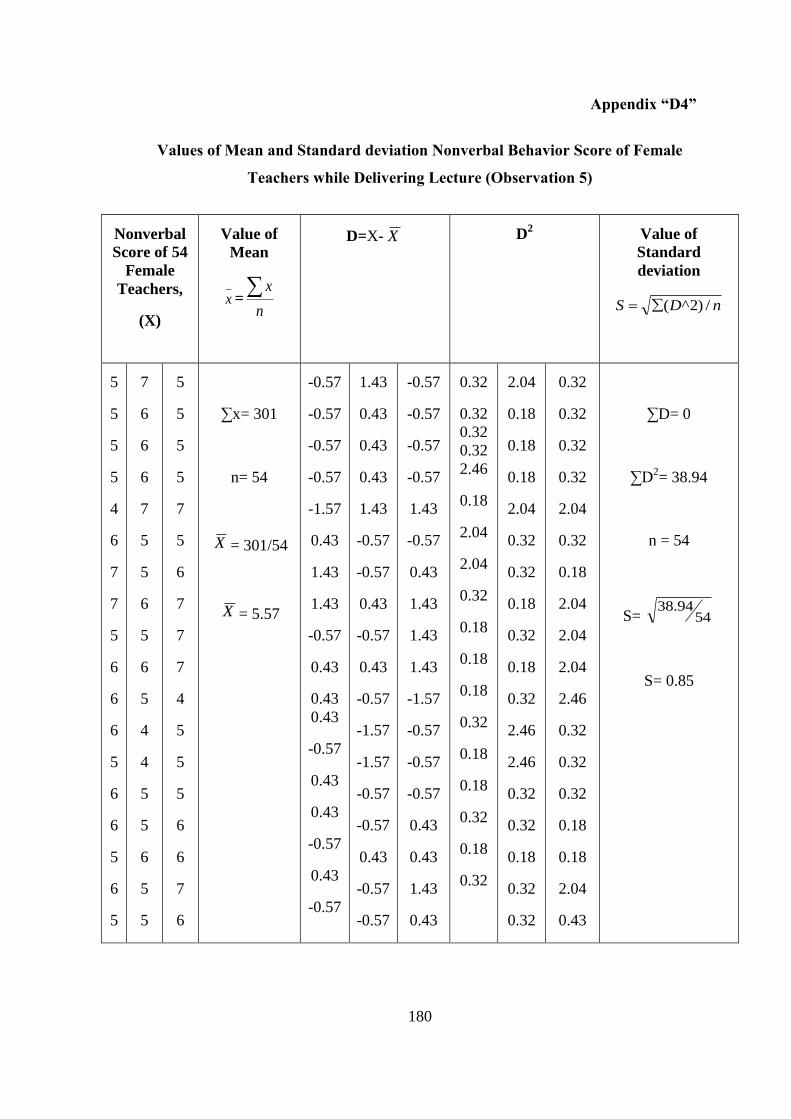
180
Appendix “D4”
Values of Mean and Standard deviation Nonverbal Behavior Score of Female
Teachers while Delivering Lecture (Observation 5)
Nonverbal
Score of 54
Female
Teachers,
(X)
Value of
Mean
x =n
x
D=X- X
D2 Value of
Standard
deviation
nDS /)2^(
5
5
5
5
4
6
7
7
5
6
6
6
5
6
6
5
6
5
7
6
6
6
7
5
5
6
5
6
5
4
4
5
5
6
5
5
5
5
5
5
7
5
6
7
7
7
4
5
5
5
6
6
7
6
∑x= 301
n= 54
X = 301/54
X = 5.57
-0.57
-0.57
-0.57
-0.57
-1.57
0.43
1.43
1.43
-0.57
0.43
0.43
0.43
-0.57
0.43
0.43
-0.57
0.43
-0.57
1.43
0.43
0.43
0.43
1.43
-0.57
-0.57
0.43
-0.57
0.43
-0.57
-1.57
-1.57
-0.57
-0.57
0.43
-0.57
-0.57
-0.57
-0.57
-0.57
-0.57
1.43
-0.57
0.43
1.43
1.43
1.43
-1.57
-0.57
-0.57
-0.57
0.43
0.43
1.43
0.43
0.32
0.32
0.32
0.32
2.46
0.18
2.04
2.04
0.32
0.18
0.18
0.18
0.32
0.18
0.18
0.32
0.18
0.32
2.04
0.18
0.18
0.18
2.04
0.32
0.32
0.18
0.32
0.18
0.32
2.46
2.46
0.32
0.32
0.18
0.32
0.32
0.32
0.32
0.32
0.32
2.04
0.32
0.18
2.04
2.04
2.04
2.46
0.32
0.32
0.32
0.18
0.18
2.04
0.43
∑D= 0
∑D2= 38.94
n = 54
S= 5494.38
S= 0.85

181
Appendix “D5”
Values of Mean and Standard deviation Nonverbal Behavior Score of Female
Teachers while Giving Directions (Observation 6)
Nonverbal
Score of 54
Female
Teachers,
(X)
Value of
Mean
x =n
x
D=X- X
D2 Value of
Standard
deviation
nDS /)2^(
4
6
5
5
4
6
6
7
6
6
7
6
6
6
6
5
6
7
7
6
7
7
7
6
3
6
5
5
6
5
5
6
6
6
5
5
4
6
5
6
5
5
6
7
5
6
4
5
6
6
5
7
4
6
∑x= 305
n= 54
X = 305/54
X = 5.65
-1.65
0.35
-0.65
-0.65
-1.65
0.35
0.35
1.35
0.35
0.35
1.35
0.35
0.35
0.35
0.35
-0.65
0.35
1.35
1.35
0.35
1.35
1.35
1.35
0.35
-2.65
0.35
-0.65
-0.65
0.35
-0.65
-0.65
0.35
0.35
0.35
-0.65
-0.65
-1.65
0.35
-0.65
0.35
-0.65
-0.65
0.35
1.35
-0.65
0.35
-1.65
-0.65
0.35
0.35
-0.65
1.35
-1.65
0.35
2.72
0.12
0.42
0.42
2.72
0.12
0.12
1.82
0.12
0.12
1.82
0.12
0.12
0.12
0.12
0.42
0.12
1.82
1.82
0.12
1.82
1.82
1.82
0.12
7.02
0.12
0.42
0.42
0.12
0.42
0.42
0.12
0.12
0.12
0.42
0.42
2.72
0.12
1.82
0.12
1.82
1.82
0.12
1.82
1.82
0.12
2.72
0.42
0.12
0.12
0.42
1.82
2.72
0.12
∑D= 0
∑D2= 46.18
n = 54
S= 5418.46
S= 0.92

182
Appendix “D6”
Values of Mean and Standard deviation Nonverbal Behavior Score of Female
Teachers while Justifying Authorities (Observation 7)
Nonverbal
Score of 54
Female
Teachers,
(X)
Value of
Mean
x =n
x
D=X- X
D2 Value of
Standard
deviation
nDS /)2^(
4
6
6
5
4
6
5
7
6
6
4
6
6
6
6
7
6
6
7
5
6
6
7
4
6
6
5
5
6
5
5
4
4
6
5
6
4
6
6
7
7
5
7
7
5
6
6
6
5
6
5
4
7
6
∑x= 305
n= 54
X = 305/54
X = 5.65
-1.65
0.35
0.35
-0.65
-1.65
0.35
-0.65
1.35
0.35
0.35
-1.65
0.35
0.35
0.35
0.35
1.35
0.35
0.35
1.35
-0.65
0.35
0.35
1.35
1.35
0.35
0.35
-0.65
-0.65
0.35
-0.65
-0.65
-1.65
-1.65
0.35
-0.65
0.35
-1.65
0.35
0.35
1.35
1.35
-0.65
1.35
1.35
-0.65
0.35
0.35
0.35
-0.65
0.35
-0.65
-1.65
1.35
0.35
2.72
0.12
0.12
0.42
2.72
0.12
0.42
1.82
0.12
0.12
2.72
0.12
0.12
0.12
0.12
1.82
0.12
0.12
1.82
0.42
0.12
0.12
1.82
2.72
0.12
0.12
0.42
0.42
0.12
0.42
0.42
2.72
2.72
0.12
0.42
0.12
2.72
0.12
0.12
1.82
1.82
0.42
1.82
1.82
0.42
0.12
0.12
0.12
0.42
0.12
0.42
2.72
1.82
0.12
∑D= 0
∑D2= 46.18
n = 54
S= 5418.46
S= 0.92

183
Appendix “E1”
Comparison between Nonverbal Behavior Scores of Male and Female Teachers
While Accepting Students Feelings (Observation 1&2)
Since n1, n2 ≥ 30, to compare the nonverbal behavior scores of male and
female teachers, the most suitable test was applied by using the following formula
FemaleS
MaleS
Femalex
Malex
22
12
2
1 ,
1x 5.69, 2x 5.61, n1= 54, n2 = 54
12S 0.96, 2
2S 0.90, ,01 02 , 021
43.0
54
90,0
54
96.0
)0()61.569.5(
Z
Z
2
2
2
1
2
1
2121 )()(
n
S
n
S
xxZ

184
Appendix “E2”
Comparison between Nonverbal Behavior Scores of Male and Female Teachers
While Accepting Students Ideas (Observation 3)
Since n1, n2 ≥ 30, to compare the nonverbal behavior scores of male and
female teachers, the most suitable test was applied by using the following formula
FemaleS
MaleS
Femalex
Malex
22
12
2
1 ,
1x 5.56, 2x 5.57, n1= 54, n2 = 54
12S 1.25, 2
2S 0.64, ,01 02 , 021
05.0
19.0
01.0
54
64.0
54
25.1
)0()57.556.5(
Z
Z
Z
2
2
2
1
2
1
2121 )()(
n
S
n
S
xxZ

185
Appendix “E3”
Comparison between Nonverbal Behavior Scores of Male and Female Teachers
While Asking Questions (Observation 4)
Since n1, n2 ≥ 30, to compare the nonverbal behavior scores of male and
female teachers, the most suitable test was applied by using the following formula
FemaleS
MaleS
Femalex
Malex
22
12
2
1 ,
1x 5.61, 2x 5.74, n1= 54, n2 = 54
12S 1.04, 2
2S 0.71, ,01 02 , 021
72.0
18.0
13.0
54
71.0
54
04.1
)0()74.561.5(
Z
Z
Z
2
2
2
1
2
1
2121 )()(
n
S
n
S
xxZ
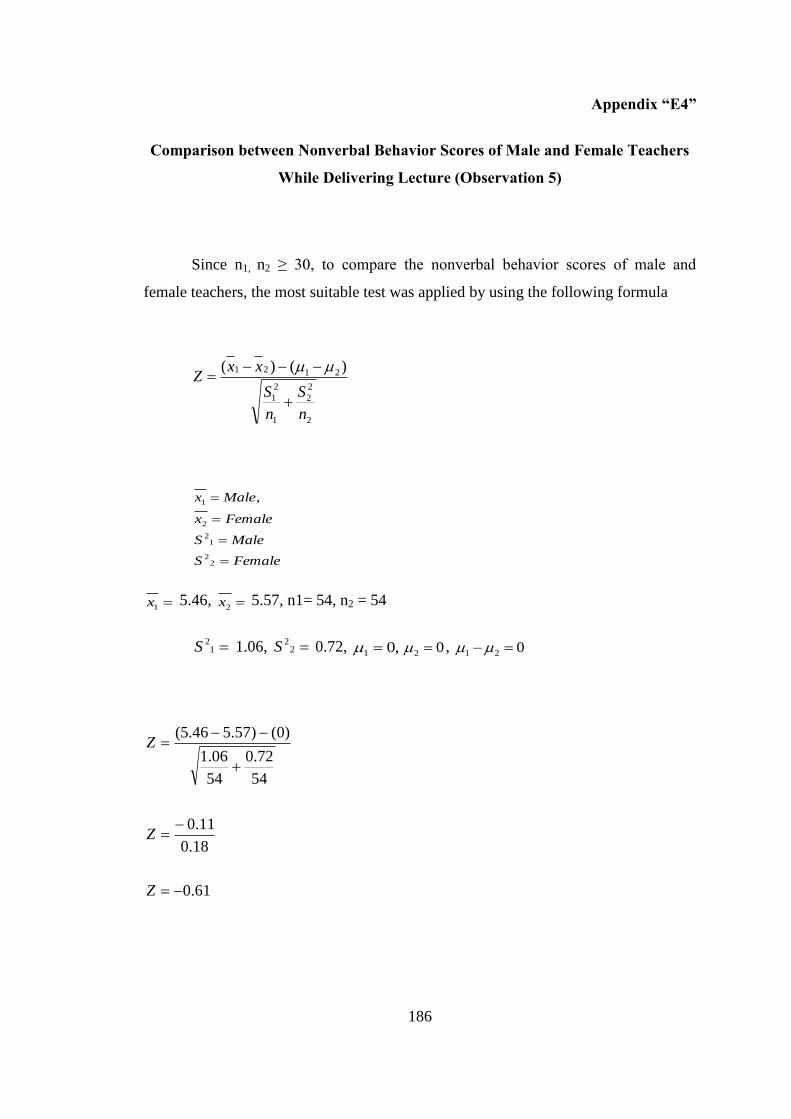
186
Appendix “E4”
Comparison between Nonverbal Behavior Scores of Male and Female Teachers
While Delivering Lecture (Observation 5)
Since n1, n2 ≥ 30, to compare the nonverbal behavior scores of male and
female teachers, the most suitable test was applied by using the following formula
FemaleS
MaleS
Femalex
Malex
22
12
2
1 ,
1x 5.46, 2x 5.57, n1= 54, n2 = 54
12S 1.06, 2
2S 0.72, ,01 02 , 021
61.0
18.0
11.0
54
72.0
54
06.1
)0()57.546.5(
Z
Z
Z
2
2
2
1
2
1
2121 )()(
n
S
n
S
xxZ

187
Appendix “E5”
Comparison between Nonverbal Behavior Scores of Male and Female Teachers
While Giving Directions (Observation 6)
Since n1, n2 ≥ 30, to compare the nonverbal behavior scores of male and
female teachers, the most suitable test was applied by using the following formula
FemaleS
MaleS
Femalex
Malex
22
12
2
1 ,
1x 5.48, 2x 5.57, n1= 54, n2 = 54
12S 1.03, 2
2S 0.72, ,01 02 , 021
2
2
2
1
2
1
2121 )()(
n
S
n
S
xxZ
62.0
15.0
09.0
54
72.0
54
03.1
)0()57.548.5(
Z
Z
Z

188
Appendix “E6”
Comparison between Nonverbal Behavior Scores of Male and Female Teachers
While Criticizing and Justifying Authorities (Observation 7)
Since n1, n2 ≥ 30, to compare the nonverbal behavior scores of male and
female teachers, the most suitable test was applied by using the following formula
FemaleS
MaleS
Femalex
Malex
22
12
2
1 ,
1x 5.26, 2x 5.65, n1= 54, n2 = 54
12S 1.31, 2
2S 0.85, ,01 02 , 021
95.1
20.0
39.0
54
85.0
54
31.1
)0()65.526.5(
Z
Z
Z
2
2
2
1
2
1
2121 )()(
n
S
n
S
xxZ

189
Appendix “F1”
Mean and Standard deviation of Nonverbal Scores of Teachers performing his
job in Government Schools while Accepting Students Feelings (Observation 1 &
2)
Non verbal
Scores of 36
Government
Teachers
Value of
Mean
X = nx
D=X- X D2
Value of Standard
deviation
nDS /)2^(
6
7
6
6
6
6
6
5
6
5
5
6
7
6
4
4
6
5
5
4
5
5
6
6
6
6
7
7
6
7
6
6
5
6
6
6
∑X=207
n=36
X = nx
X =207/36
X =5.75
0.25
1.25
0.25
0.25
0.25
0.25
0.25
-0.75
0.25
-0.75
-0.75
0.25
1.25
0.25
-1.75
-1.75
0.25
-0.75
-0.75
-1.75
-0.75
-0.75
0.25
0.25
0.25
0.25
1.25
1.25
0.25
1.25
0.25
0.25
-0.75
0.25
0.25
0.25
0.06
1.56
0.06
0.06
0.06
0.06
0.06
0.56
0.06
0.56
0.56
0.06
1.56
0.06
3.06
3.06
0.06
0.56
0.56
3.06
0.56
0.56
0.06
0.06
0.06
0.06
1.56
1.56
0.06
1.56
0.06
0.06
0.56
0.06
0.06
0.06
∑D2
=22.66
n = 36
S=36
66.22
S=0.79

190
Appendix “F2”
Mean and Standard deviation of Nonverbal Scores of Teachers performing his
job in Government Schools while Accepting Students Ideas (Observation 3)
Nonverbal
Behavior
Score of 36
Government
Teachers,(X)
Value of
Mean
X = nx
D=X- X
D2
Value of Standard
deviation
nDS /)2^(
6
7
6
7
6
6
5
5
6
6
6
6
6
6
5
3
6
3
5
4
4
5
6
6
6
6
6
7
6
7
6
5
5
6
6
6
∑x=203
n=36
X = nx
X =203/36
X =5.64
0.36
1.36
0.36
1.36
0.36
0.36
-0.64
-0.64
0.36
0.36
0.36
0.36
0.36
0.36
-0.64
-2.64
0.36
-2.64
-0.64
-1.64
-1.64
-0.64
0.36
0.36
0.36
0.36
0.36
1.36
0.36
1.36
0.36
-0.64
-0.64
0.36
0.36
0.36
0.13
1.85
0.13
1.85
0.13
0.13
0.41
0.41
0.13
0.13
0.13
0.13
0.13
0.13
0.41
6.97
0.13
6.97
0.41
2.69
2.69
0.41
0.13
0.13
0.13
0.13
0.13
1.85
0.13
1.85
0.13
0.41
0.41
0.13
0.13
0.13
∑D2
=32.32
n = 36
S=36
32.32
S=0.95

191
Appendix “F3”
Mean and Standard deviation of Nonverbal Scores of Teachers performing his
job in Government Schools while Making Questions (Observation 4)
Non verbal
Scores of 36
Government
Teachers
(X)
Value of
Mean
X = nx
D=X- X
D2
Value of Standard
deviation
nDS /)2^(
6
6
6
7
6
6
6
5
6
7
6
6
6
6
6
5
5
4
6
5
5
5
5
6
7
7
5
7
6
7
6
7
5
7
6
5
∑X=212
n=36
X = nx
X =212/36
X =5.89
0.11
0.11
0.11
1.11
0.11
0.11
0.11
-0.89
1.11
0.11
0.11
0.11
0.11
0.11
0.11
-0.89
-0.89
-1.89
0.11
-0.89
-0.89
-0.89
-0.89
0.11
1.11
1.11
-0.89
1.11
0.11
1.11
0.11
1.11
-0.89
1.11
0.11
-0.89
0.01
0.01
0.01
1.23
0.01
0.01
0.01
0.79
0.01
1.23
0.01
0.01
0.01
0.01
0.01
0.79
0.79
3.57
0.01
0.79
0.79
0.79
0.79
0.01
1.23
1.23
0.79
1.23
0.01
1.23
0.01
1.23
0.79
1.23
0.01
0.79
∑D2
=32.19
n = 36
S=36
19.32
S=0.95
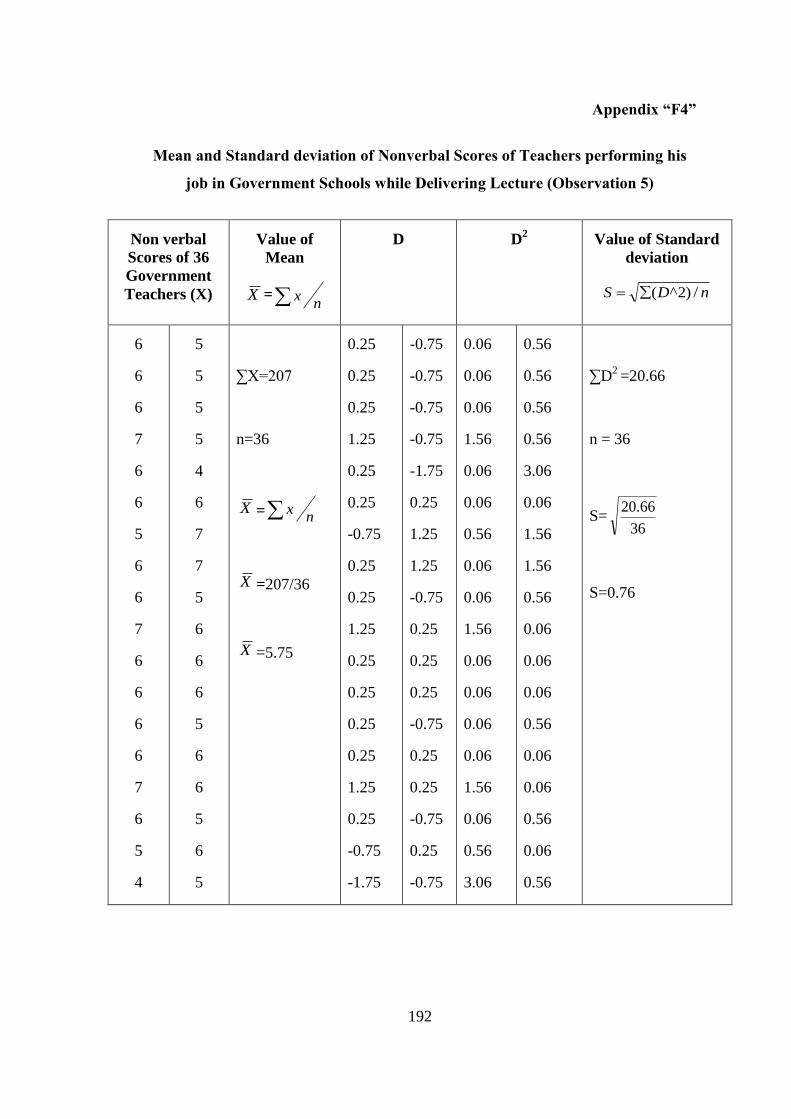
192
Appendix “F4”
Mean and Standard deviation of Nonverbal Scores of Teachers performing his
job in Government Schools while Delivering Lecture (Observation 5)
Non verbal
Scores of 36
Government
Teachers (X)
Value of
Mean
X = nx
D D2
Value of Standard
deviation
nDS /)2^(
6
6
6
7
6
6
5
6
6
7
6
6
6
6
7
6
5
4
5
5
5
5
4
6
7
7
5
6
6
6
5
6
6
5
6
5
∑X=207
n=36
X = nx
X =207/36
X =5.75
0.25
0.25
0.25
1.25
0.25
0.25
-0.75
0.25
0.25
1.25
0.25
0.25
0.25
0.25
1.25
0.25
-0.75
-1.75
-0.75
-0.75
-0.75
-0.75
-1.75
0.25
1.25
1.25
-0.75
0.25
0.25
0.25
-0.75
0.25
0.25
-0.75
0.25
-0.75
0.06
0.06
0.06
1.56
0.06
0.06
0.56
0.06
0.06
1.56
0.06
0.06
0.06
0.06
1.56
0.06
0.56
3.06
0.56
0.56
0.56
0.56
3.06
0.06
1.56
1.56
0.56
0.06
0.06
0.06
0.56
0.06
0.06
0.56
0.06
0.56
∑D2
=20.66
n = 36
S=36
66.20
S=0.76

193
Appendix “F5”
Mean and Standard deviation of Nonverbal Scores of Teachers performing his
job in Government Schools while Giving Directions (Observation 6)
Nonverbal
Behavior
Score of 36
Government
Teachers,(X)
Value of Mean
X = nx
D=X- X
D2
Value of Standard
deviation
nDS /)2^(
6
6
6
7
6
6
6
6
6
6
6
6
6
6
4
7
4
5
4
6
5
5
4
6
6
7
6
6
7
6
6
6
6
5
6
7
∑X=209
n=36
X = nx
X =209/36
X =5.81
0.19
0.19
0.19
1.19
0.19
0.19
0.19
0.19
0.19
0.19
0.19
0.19
0.19
0.19
-1.81
1.19
-1.81
-0.81
-1.81
0.19
-0.81
-0.81
-1.81
0.19
0.19
1.19
0.19
0.19
1.19
0.19
0.19
0.19
0.19
-0.81
0.19
1.19
0.04
0.04
0.04
1.42
0.04
0.04
0.04
0.04
0.04
0.04
0.04
0.04
0.04
0.04
3.28
1.42
3.28
0.66
3.28
0.04
0.66
0.66
3.28
0.04
0.04
1.42
0.04
0.04
1.42
0.04
0.04
0.04
0.04
0.66
0.04
1.42
∑D2
=23.78
n = 36
S=36
78.23
S=0.91

194
Appendix “F6”
Mean and Standard deviation of Nonverbal Scores of Teachers performing his
job in Government Schools while Criticizing Authorities (Observation 7)
Nonverbal
Behavior Score of
36 Government
Teachers,(X)
Value of
Mean
X = nx
D=X- X
D2
Value of Standard
deviation
nDS /)2^(
7
6
6
7
6
6
6
4
5
6
4
6
6
6
4
3
4
5
4
6
6
5
4
6
5
7
6
6
4
6
6
6
6
7
6
6
∑X=199
n= 36
X = nx
X =199/36
X =5.53
1.47
0.47
0.47
1.47
0.47
0.47
0.47
-1.53
-0.53
0.47
-1.53
0.47
0.47
0.47
-1.53
-2.53
-1.53
-0.53
-1.53
0.47
0.47
-0.53
-1.53
0.47
-0.53
1.47
0.47
0.47
-1.53
0.47
0.47
0.47
0.47
1.47
0.47
0.47
2.16
0.22
0.22
2.16
0.22
0.22
0.22
2.34
0.28
0.22
2.34
0.22
0.22
0.22
2.34
6.40
2.34
0.28
2.34
0.22
0.22
0.28
2.34
0.22
0.28
2.16
0.22
0.22
2.34
0.22
0.22
0.22
0.22
2.16
0.22
0.22
∑D2
=36.94
n = 36
S=36
94.36
S=1.01

195
Appendix “G1”
Mean and Standard deviation of Nonverbal Scores of Teachers performing his
job in Private Schools while Accepting Students Feelings (Observation 1 & 2)
Nonverbal
Behavior
Score of 36
Private
Teachers,(X)
Value of Mean
X = nx
D=X- X
D2
Value of Standard
deviation
nDS /)2^(
5
6
7
7
5
6
7
6
4
4
4
5
4
5
4
6
4
4
6
7
6
5
7
6
5
5
6
6
5
6
7
6
6
6
6
6
∑X=200
n=36
X = nx
X =200/36
X =5.56
-0.56
0.44
1.44
1.44
-0.56
0.44
1.44
0.44
-1.56
-1.56
-1.56
-0.56
-1.56
-0.56
-1.56
0.44
-1.56-
1.56
0.44
1.44
0.44
-0.56
1.44
0.44
-0.56
-0.56
0.44
0.44
-0.56
0.44
1.44
0.44
0.44
0.44
0.44
0.44
0.31
0.19
2.07
2.07
0.31
0.19
2.07
0.19
2.43
2.43
2.43
0.31
2.43
0.31
2.43
0.19
2.43
2.43
0.19
2.07
0.19
0.31
2.07
0.19
0.31
0.31
0.19
0.19
0.31
0.19
2.07
0.19
0.19
0.19
0.19
0.19
∑D2
=34.76
n = 36
S=36
76.34
S=0.98
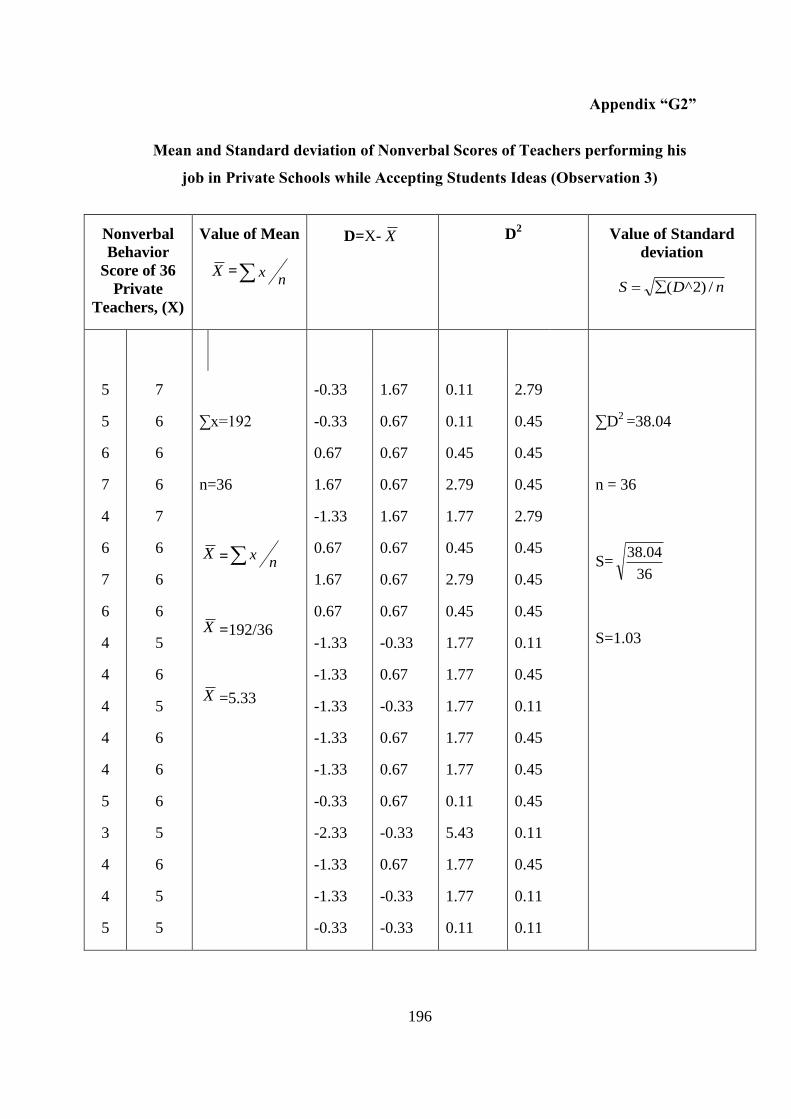
196
Appendix “G2”
Mean and Standard deviation of Nonverbal Scores of Teachers performing his
job in Private Schools while Accepting Students Ideas (Observation 3)
Nonverbal
Behavior
Score of 36
Private
Teachers, (X)
Value of Mean
X = nx
D=X- X
D2 Value of Standard
deviation
nDS /)2^(
5
5
6
7
4
6
7
6
4
4
4
4
4
5
3
4
4
5
7
6
6
6
7
6
6
6
5
6
5
6
6
6
5
6
5
5
∑x=192
n=36
X = nx
X =192/36
X =5.33
-0.33
-0.33
0.67
1.67
-1.33
0.67
1.67
0.67
-1.33
-1.33
-1.33
-1.33
-1.33
-0.33
-2.33
-1.33
-1.33
-0.33
1.67
0.67
0.67
0.67
1.67
0.67
0.67
0.67
-0.33
0.67
-0.33
0.67
0.67
0.67
-0.33
0.67
-0.33
-0.33
0.11
0.11
0.45
2.79
1.77
0.45
2.79
0.45
1.77
1.77
1.77
1.77
1.77
0.11
5.43
1.77
1.77
0.11
2.79
0.45
0.45
0.45
2.79
0.45
0.45
0.45
0.11
0.45
0.11
0.45
0.45
0.45
0.11
0.45
0.11
0.11
∑D2
=38.04
n = 36
S=36
04.38
S=1.03

197
Appendix “G3”
Mean and Standard deviation of Nonverbal Scores of Teachers performing his
job in Private Schools while Making Questions (Observation 4)
Nonverbal
Behavior
Score of 36
Private
Teachers, (X)
Mean Value
X = nx
D=X- X
D2
Value of Standard
deviation
nDS /)2^(
4
4
6
7
5
6
7
6
5
5
4
4
4
5
4
4
4
3
7
6
6
6
7
4
7
5
5
6
5
6
5
5
4
6
5
6
∑x=188
n = 36
X =188/36
X =5.22
-1.22
-1.22
0.78
1.78
-0.22
0.78
1.78
0.78
-0.22
-0.22
-1.22
-1.22
-1.22
-0.22
-1.22
-1.22
-1.22
-2.22
1.78
0.78
0.78
0.78
1.78
-1.22
1.78
-0.22
-0.22
0.78
-0.22
0.78
-0.22
-0.22
-1.22
0.78
-0.22
0.78
1.49
1.49
0.61
3.17
0.05
0.61
3.17
0.61
0.05
0.05
1.49
1.49
1.49
0.05
1.49
1.49
1.49
4.93
3.17
0.61
0.61
0.61
3.17
1.49
3.17
0.05
0.05
0.61
0.05
0.61
0.05
0.05
1.49
0.61
0.05
0.61
∑D2
=42.28
n = 36
S=36
28.42
S=1.08

198
Appendix “G4”
Mean and Standard deviation of Nonverbal Scores of Teachers performing his
job in Private Schools while Delivering Lecture (Observation 5)
Nonverbal
Behavior
Score of 36
Private
Teachers,(X )
Value of Mean
X = nx
D=X- X
D2
Value of Standard
deviation
nDS /)2^(
4
6
5
6
4
5
6
6
6
5
4
4
4
4
4
4
4
3
7
6
6
6
7
5
5
6
5
6
5
4
4
5
5
6
5
5
∑X=182
n=36
X = nx
X =182/36
X =5.06
-1.06
0.94
-0.06
0.94
-1.06
-0.06
0.94
0.94
0.94
-0.06
-1.06
-1.06
-1.06
-1.06
-1.06
-1.06
-1.06
-2.06
1.94
0.94
0.94
0.94
1.94
-0.06
-0.06
0.94
-0.06
0.94
-0.06
-1.06
-1.06
-0.06
-0.06
0.94
-0.06
-0.06
1.12
0.88
0.004
0.88
1.12
0.004
0.88
0.88
0.88
0.004
1.12
1.12
1.12
1.12
1.12
1.12
1.12
4.24
3.76
0.88
0.88
0.88
3.76
0.004
0.004
0.88
0.004
0.88
0.004
1.12
1.12
0.004
0.004
0.88
0.004
0.004
∑D2
=33.80
n = 36
S=36
80.33
S=0.97

199
Appendix “G5”
Mean and Standard deviation of Nonverbal Scores of Teachers performing his
job in Private Schools while Giving Directions (Observation 6)
Nonverbal
Behavior Score
of 36 Private
Teachers,(X )
Value of
Mean
X = nx
D=X- X
D2
Value of Standard
deviation
nDS /)2^(
5
6
5
6
5
5
6
4
5
5
4
4
3
4
4
4
4
3
7
6
7
7
7
6
3
6
5
5
6
5
5
6
6
6
5
5
∑X=185
n=36
X = nx
X =185/36
X =5.14
-0.14
0.86
-0.14
0.86
-0.14
-0.14
0.86
-1.14
-0.14
-0.14
-1.14
-1.14
-2.14
-1.14
-1.14
-1.14
-1.14
-2.14
1.86
0.86
1.86
1.86
1.86
0.86
-2.14
0.86
-0.14
-0.14
0.86
-0.14
-0.14
0.86
0.86
0.86
-0.14
-0.14
0.02
0.74
0.02
0.74
0.02
0.02
0.74
1.30
0.02
0.02
1.30
1.30
4.58
1.30
1.30
1.30
1.30
4.58
3.46
0.74
3.46
3.46
3.46
0.74
4.58
0.74
0.02
0.02
0.74
0.02
0.02
0.74
0.74
0.74
0.02
0.02
∑D2
=44.32
n = 36
S=36
32.44
S=1.11

200
Appendix “G6”
Mean and Standard deviation of Nonverbal Scores of Teachers performing his
job in Private Schools while Criticizing Authorities (Observation 7)
Nonverbal
Behavior Score
of 36 Private
Teachers,(X)
Value of Mean
X = nx
D=X- X
D2
Value of Standard
deviation
nDS /)2^(
6
3
4
6
6
6
6
5
4
4
4
4
3
4
4
4
4
3
7
5
6
6
7
4
6
6
5
5
6
5
5
4
4
6
5
6
∑X=178
n= 36
X = nx
X =178/36
X =4.94
1.06
-1.94
-0.94
1.06
1.06
1.06
1.06
0.06
-0.94
-0.94
-0.94
-0.94
-1.94
-0.94
-0.94
-0.94
-0.94
-1.94
2.06
0.06
1.06
1.06
2.06
-0.94
1.06
1.06
0.06
0.06
1.06
0.06
0.06
-0.94
-0.94
1.06
0.06
1.06
1.12
3.76
0.88
1.12
1.12
1.12
1.12
0.004
0.88
0.88
0.88
0.88
3.76
0.88
0.88
0.88
0.88
3.76
4.24
0.004
1.12
1.12
4.24
0.88
1.12
1.12
0.004
0.004
1.12
0.004
0.004
0.88
0.88
1.12
0.004
1.12
∑D2
=43.79
n = 36
S=36
79.43
S=1.10

201
Appendix “H1”
Mean and Standard deviation of Nonverbal Scores of Teachers performing his
job in Semi Government & Private Standard Schools while Accepting Students
Feelings
(Observation 1 & 2)
Nonverbal
Behavior
Score of 36
Teachers,(X)
Value of Mean
X = nx
D=X- X
D2
Value of Standard
deviation
nDS /)2^(
7
6
6
7
6
5
6
6
7
6
7
7
6
6
5
6
6
7
5
4
5
6
4
4
6
6
4
5
3
6
3
6
7
6
5
6
∑X=203
n=36
X = nx
X =203/36
X =5.64
1.36
0.36
0.36
1.36
0.36
-0.64
0.36
0.36
1.36
0.36
1.36
1.36
0.36
0.36
-0.64
0.36
0.36
1.36
-0.64
-1.64
-0.64
0.36
-1.64
-1.64
0.36
0.36
-1.64
-0.64
-2.64
0.36
-2.64
0.36
1.36
0.36
-0.64
0.36
1.85
0.13
0.13
1.85
0.13
0.41
0.13
0.13
1.85
0.13
1.85
1.85
0.13
0.13
0.41
0.13
0.13
1.85
0.41
2.69
0.41
0.13
2.69
2.69
0.13
0.13
2.69
0.41
6.97
0.13
6.97
0.13
1.85
0.13
0.41
0.13
∑D2
=42.32
n = 36
S=36
32.42
S=1.08

202
Appendix “H2”
Mean and Standard deviation of Nonverbal Scores of Teachers performing his
job in Semi Government & Standard Private Schools while Accepting Students
Ideas (Observation 3)
Nonverbal
Behavior
Score of 36
Teachers,
(X)
Value of
Mean
X = nx
D=X- X
D2
Value of Standard
deviation
nDS /)2^(
6
6
5
7
6
6
5
6
6
6
7
7
7
6
6
6
7
7
5
4
4
6
6
4
6
6
5
5
4
6
4
6
6
6
6
5
∑X=206
n=36
X = nx
X =206/36
X =5.72
0.28
0.28
-0.72
1.28
0.28
0.28
-0.72
0.28
0.28
0.28
1.28
1.28
1.28
0.28
0.28
0.28
1.28
1.28
-0.72
-1.72
-1.72
0.28
0.28
-1.72
0.28
0.28
-0.72
-0.72
-1.72
0.28
-1.72
0.28
0.28
0.28
0.28
-0.72
0.08
0.08
0.52
1.64
0.08
0.08
0.52
0.08
0.08
0.08
1.64
1.64
1.64
0.08
0.08
0.08
1.64
0.52
0.52
2.96
2.96
0.08
0.08
2.96
0.08
0.08
0.52
0.52
2.96
0.08
2.96
0.08
0.08
0.08
0.08
0.52
∑D2
=29.28
n = 36
S=36
28.29
S=0.90

203
Appendix “H3”
Mean and Standard deviation of Nonverbal Scores of Teachers performing his
job in Semi Government & Standard Private Schools while Making Questions
(Observation 4)
Nonverbal
Behavior
Score of 36
Teachers, (X)
Mean Value
X = nx
D=X- X
D2
Value of Standard
deviation
nDS /)2^(
6
5
5
7
6
6
6
6
6
6
7
7
7
6
6
5
7
7
6
5
5
6
6
4
7
6
6
5
5
6
5
7
6
6
6
5
∑x=213
n = 36
X =213/36
X =5.92
0.08
-0.92
-0.92
1.08
0.08
0.08
0.08
0.08
0.08
0.08
1.08
1.08
1.08
0.08
0.08
-0.92
1.08
1.08
0.08
-0.92
-0.92
0.08
0.08
-1.92
1.08
0.08
0.08
-0.92
-0.92
0.08
-0.92
1.08
0.08
0.08
0.08
-0.92
0.01
0.85
0.85
1.17
0.01
0.01
0.01
0.01
0.01
0.01
1.17
1.17
1.17
0.01
0.01
0.85
1.17
1.17
0.01
0.85
0.85
0.01
0.01
3.69
1.17
0.01
0.01
0.85
0.85
0.01
0.85
1.17
0.01
0.01
0.01
0.85
∑D2
=20.88
n = 36
S=36
88.20
S=0.76

204
Appendix “H4”
Mean and Standard deviation of Nonverbal Scores of Teachers performing his
job in Semi Government & Private Standard Schools while Delivering Lecture
(Observation 5)
Nonverbal
Behavior
Score of 36
Teachers,(X )
Value of Mean
X = nx
D=X- X
D2
Value of Standard
deviation
nDS /)2^(
6
4
5
6
4
6
6
6
6
6
6
7
7
6
6
4
7
6
5
5
5
5
7
5
6
7
7
7
4
5
5
5
6
6
7
6
∑X=207
n=36
X = nx
X =207/36
X =5.75
0.25
-1.75
-0.75
0.25
-1.75
0.25
0.25
0.25
0.25
0.25
0.25
1.25
1.25
0.25
0.25
-1.75
1.25
0.25
-0.75
-0.75
-0.75
-0.75
1.25
-0.75
0.25
1.25
1.25
1.25
-1.75
-0.75
-0.75
-0.75
0.25
0.25
1.25
0.25
0.06
3.06
0.56
0.06
3.06
0.06
0.06
0.06
0.06
0.06
0.06
1.56
1.56
0.06
0.06
3.06
1.56
0.06
0.56
0.56
0.56
0.56
1.56
0.56
0.06
1.56
1.56
1.56
3.06
0.56
0.56
0.56
0.06
0.06
1.56
0.06
∑D2
=30.66
n = 36
S=36
66.30
S=0.92

205
Appendix “H5”
Mean and Standard deviation of Nonverbal Scores of Teachers performing his
job in semi Government & Private Standard Schools while Giving Directions
(Observation 6)
Nonverbal
Behavior
Score of 36
Teachers,(X )
Value of Mean
X = nx
D=X- X
D2
Value of Standard
deviation
nDS /)2^(
6
5
5
6
5
7
6
6
6
6
6
7
6
6
7
7
6
6
4
6
5
6
5
5
6
7
5
6
4
5
6
6
5
7
4
6
∑X=207
n=36
X = nx
X =207/36
X =5.75
0.25
-0.75
-0.75
0.25
-0.75
1.25
0.25
0.25
0.25
0.25
0.25
1.25
0.25
0.25
1.25
1.25
0.25
0.25
-1.75
0.25
-0.75
0.25
-0.75
-0.75
0.25
1.25
-0.75
0.25
-1.75
-0.75
0.25
0.25
-0.75
1.25
-1.75
0.25
0.06
0.56
0.56
0.06
0.56
1.56
0.06
0.06
0.06
0.06
0.06
1.56
0.06
0.06
1.56
1.56
0.06
0.06
3.06
0.06
0.56
0.06
0.56
0.56
0.06
1.56
0.56
0.06
3.06
0.56
0.06
0.06
0.56
1.56
3.06
0.06
∑D2
=24.66
n = 36
S=36
66.24
S=0.83

206
Appendix “H6”
Mean and Standard deviation of Nonverbal Scores of Teachers performing his
job in Semi Government & Private Standard Schools while Criticizing
Authorities (Observation 7)
Nonverbal
Behavior
Score of 36
Teachers,(X)
Value of
Mean
X = nx
D=X- X
D2
Value of Standard
deviation
nDS /)2^(
6
6
6
6
6
5
6
6
6
7
6
7
6
6
5
7
5
5
4
6
6
7
7
5
7
7
5
6
6
6
5
6
5
4
7
6
∑X=212
n= 36
X = nx
X =212/36
X =5.89
0.11
0.11
0.11
0.11
0.11
-0.89
0.11
0.11
0.11
1.11
0.11
1.11
0.11
0.11
-0.89
1.11
-0.89
-0.89
-1.89
0.11
0.11
1.11
1.11
-0.89
1.11
1.11
-0.89
0.11
0.11
0.11
-0.89
0.11
-0.89
-1.89
1.11
0.11
0.01
0.01
0.01
0.01
0.01
0.79
0.01
0.01
0.01
1.23
0.01
1.23
0.01
0.01
0.79
1.23
0.79
0.79
3.57
0.01
0.01
1.23
1.23
0.79
1.23
1.23
0.79
0.01
0.01
0.01
0.79
0.01
0.79
3.57
1.23
0.01
∑D=0
∑D2
23.48
n = 36
S=36
48.23
S=0.81
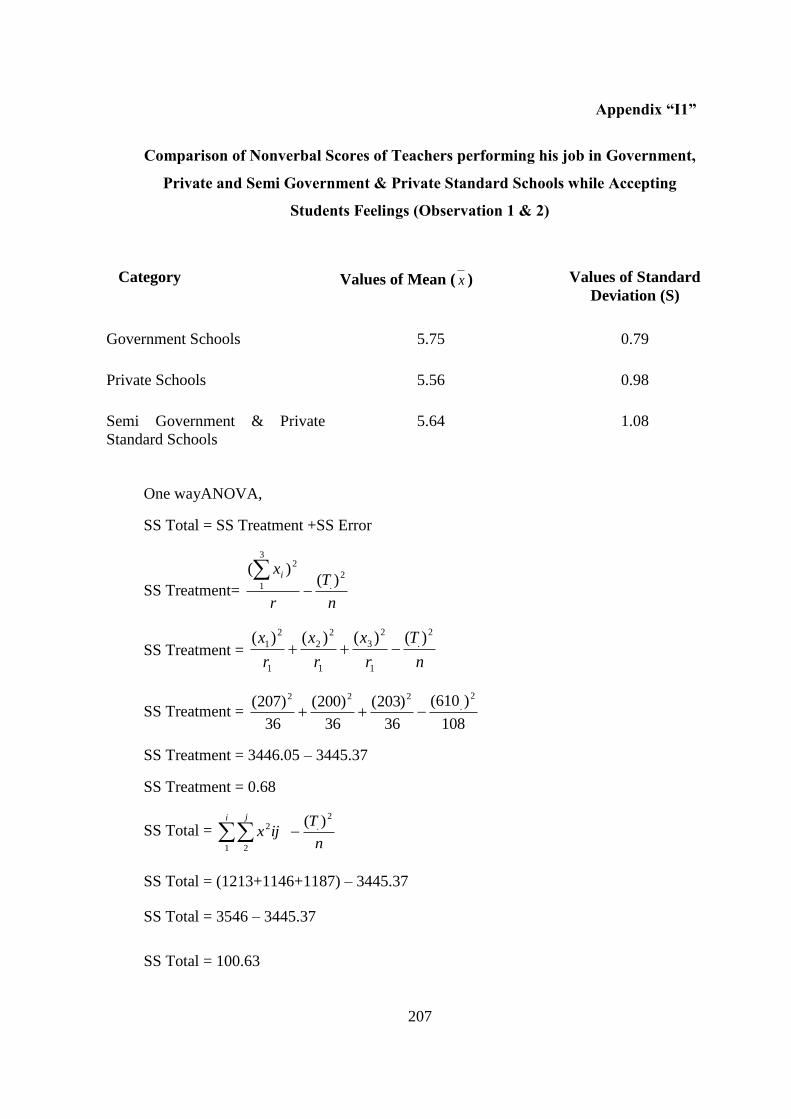
207
Appendix “I1”
Comparison of Nonverbal Scores of Teachers performing his job in Government,
Private and Semi Government & Private Standard Schools while Accepting
Students Feelings (Observation 1 & 2)
One wayANOVA,
SS Total = SS Treatment +SS Error
SS Treatment= n
T
r
xi 2
.
23
1 )()(
SS Treatment = n
T
r
x
r
x
r
x2
.
1
2
3
1
2
2
1
2
1 )()()()(
SS Treatment = 108
)610(
36
)203(
36
)200(
36
)207(2
.
222
SS Treatment = 3446.05 – 3445.37
SS Treatment = 0.68
SS Total = n
Tijx
i j 2
.
1 2
2 )(
SS Total = (1213+1146+1187) – 3445.37
SS Total = 3546 – 3445.37
SS Total = 100.63
Category Values of Mean ( x )
Values of Standard
Deviation (S)
Government Schools 5.75 0.79
Private Schools 5.56 0.98
Semi Government & Private
Standard Schools
5.64
1.08
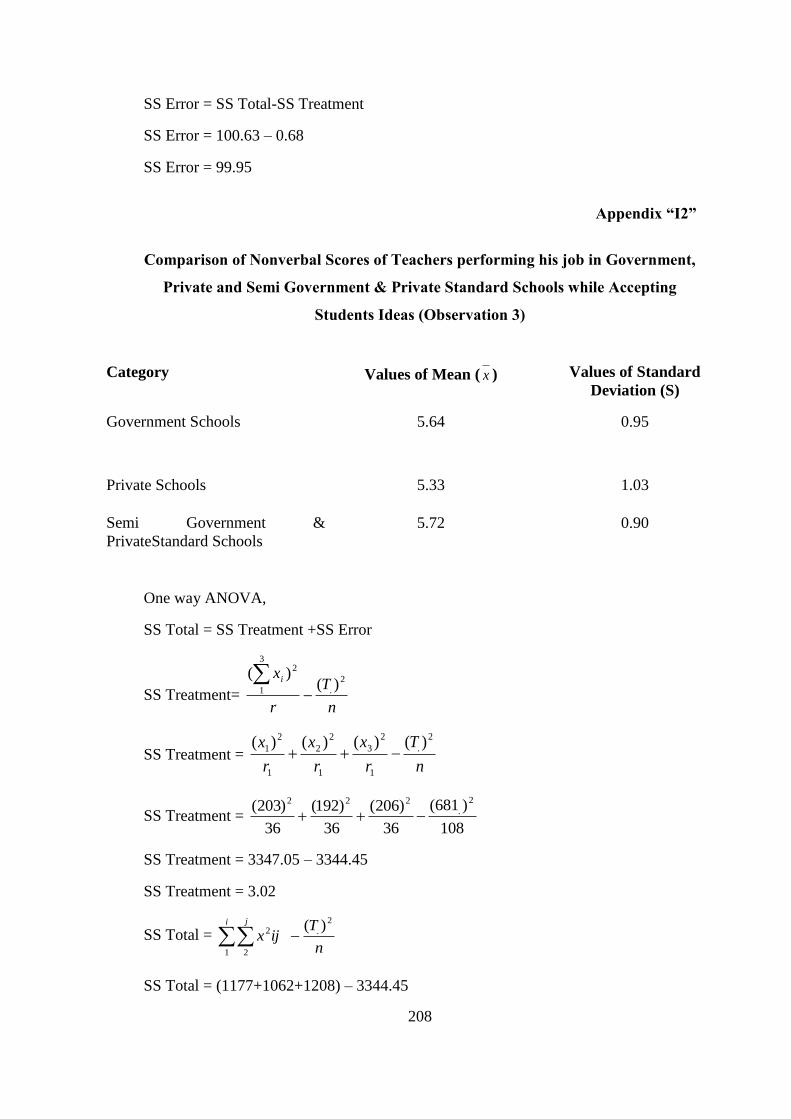
208
SS Error = SS Total-SS Treatment
SS Error = 100.63 – 0.68
SS Error = 99.95
Appendix “I2”
Comparison of Nonverbal Scores of Teachers performing his job in Government,
Private and Semi Government & Private Standard Schools while Accepting
Students Ideas (Observation 3)
One way ANOVA,
SS Total = SS Treatment +SS Error
SS Treatment= n
T
r
xi 2
.
23
1 )()(
SS Treatment = n
T
r
x
r
x
r
x2
.
1
2
3
1
2
2
1
2
1 )()()()(
SS Treatment = 108
)681(
36
)206(
36
)192(
36
)203(2
.
222
SS Treatment = 3347.05 – 3344.45
SS Treatment = 3.02
SS Total = n
Tijx
i j 2
.
1 2
2 )(
SS Total = (1177+1062+1208) – 3344.45
Category Values of Mean ( x ) Values of Standard
Deviation (S)
Government Schools
5.64 0.95
Private Schools 5.33 1.03
Semi Government &
PrivateStandard Schools
5.72
0.90

209
SS Total = 3447 – 3344.45
SS Total = 102.55
SS Error = SS Total-SS Treatment
SS Error = 102.55 – 3.02
SS Error = 99.53
Appendix “I3”
Comparison of Nonverbal Scores of Teachers performing his job in Government,
Private and Semi Government & Private Standard Schools while Making
Questions (Observation 4)
One way ANOVA,
SS Total = SS Treatment +SS Error
SS Treatment= n
T
r
xi 2
.
23
1 )()(
SS Treatment = n
T
r
x
r
x
r
x2
.
1
2
3
1
2
2
1
2
1 )()()()(
SS Treatment = 108
)613(
36
)213(
36
)188(
36
)212(2
.
222
SS Treatment = 3490.47 – 3479.34
SS Treatment = 11.13
Category Values of Mean ( x ) Values of Standard
Deviation (S)
Government Schools
5.89 0.95
Private Schools
5.22 1.08
Semi Government &
PrivateStandard Schools
5.92
0.76

210
SS Total = n
Tijx
i j 2
.
1 2
2 )(
SS Total = (1270+1024+1281) – 3479.34
SS Total = 3575 – 3479.34
SS Total = 95.66
SS Error = SS Total-SS Treatment
SS Error = 95.66 – 11.13
SS Error = 84.53
Appendix “I4”
Comparison of Nonverbal Scores of Teachers performing his job in Government,
Private and Semi Government & Private Standard Schools while Delivering
Lecture
(Observation 5)
One way ANOVA,
SS Total = SS Treatment +SS Error
SS Treatment= n
T
r
xi 2
.
23
1 )()(
Category Values of Mean ( x ) Values of Standard
Deviation (S)
Government Schools
5.75 0.76
Private Schools
5.06 0.97
Semi Government &
PrivateStandard Schools
5.75
0.92

211
SS Treatment = n
T
r
x
r
x
r
x2
.
1
2
3
1
2
2
1
2
1 )()()()(
SS Treatment = 108
)596(
36
)207(
36
)182(
36
)207(2
.
222
SS Treatment = 3300.61 – 3289.04
SS Treatment = 11.57
SS Total = n
Tijx
i j 2
.
1 2
2 )(
SS Total = (1211+954+1221) – 3289.04
SS Total = 3386 – 3289.04
SS Total = 96.96
SS Error = SS Total-SS Treatment
SS Error = 96.96 – 11.57
SS Error = 85.39
Appendix “I5”
Comparison of Nonverbal Scores of Teachers performing his job in Government,
Private and Semi Government & Private Standard Schools while Giving
Directions
(Observation 6)
Category Values of Mean ( x ) Values of Standard
Deviation (S)
Government Schools
5.81 0.91
Private Schools
5.14 1.11

212
One way ANOVA,
SS Total = SS Treatment +SS Error
SS Treatment= n
T
r
xi 2
.
23
1 )()(
SS Treatment = n
T
r
x
r
x
r
x2
.
1
2
3
1
2
2
1
2
1 )()()()(
SS Treatment = 108
)601(
36
)207(
36
)185(
36
)209(2
.
222
SS Treatment = 3354.31 – 3344.45
SS Treatment = 9.86
SS Total = n
Tijx
i j 2
.
1 2
2 )(
SS Total = (1237+995+1215) – 3344.45
SS Total = 3447 – 3344.45
SS Total = 102.55
SS Error = SS Total-SS Treatment
SS Error = 102.55 – 9.86
SS Error = 92.69
Semi Government &
PrivateStandard Schools
5.75
0.83
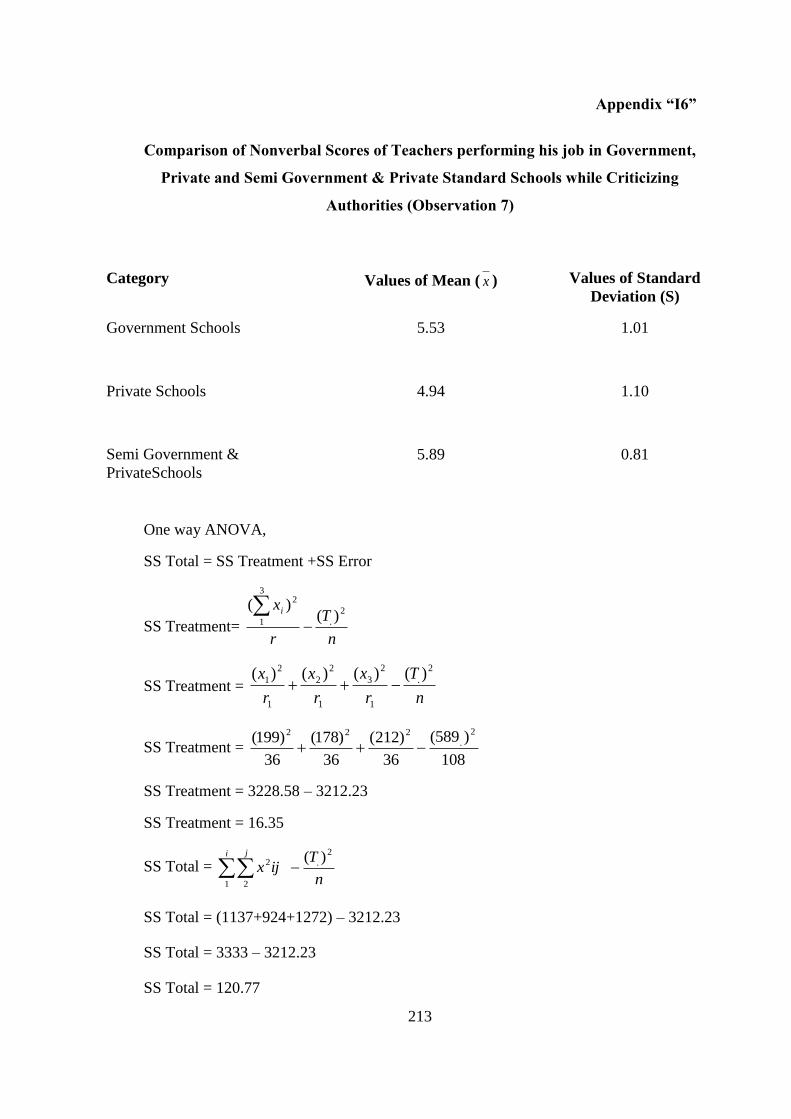
213
Appendix “I6”
Comparison of Nonverbal Scores of Teachers performing his job in Government,
Private and Semi Government & Private Standard Schools while Criticizing
Authorities (Observation 7)
One way ANOVA,
SS Total = SS Treatment +SS Error
SS Treatment= n
T
r
xi 2
.
23
1 )()(
SS Treatment = n
T
r
x
r
x
r
x2
.
1
2
3
1
2
2
1
2
1 )()()()(
SS Treatment = 108
)589(
36
)212(
36
)178(
36
)199(2
.
222
SS Treatment = 3228.58 – 3212.23
SS Treatment = 16.35
SS Total = n
Tijx
i j 2
.
1 2
2 )(
SS Total = (1137+924+1272) – 3212.23
SS Total = 3333 – 3212.23
SS Total = 120.77
Category Values of Mean ( x ) Values of Standard
Deviation (S)
Government Schools
5.53 1.01
Private Schools
4.94 1.10
Semi Government &
PrivateSchools
5.89
0.81

214
SS Error = SS Total-SS Treatment
SS Error = 120.77 – 16.35
SS Error = 104.42
Appendix “J”
Nonverbal Scores of All the Teachers
21,22,23.24,24,25,26,26,26,27,27,27,28,28,28,28,29,29,29,29,29,30,30,30,30,30,30,3
0,30,30,30,31,31,31,31,32,32,32,32,32,32,32,32,32,32,33,33,33,33,33,34,34,34,34,34,
35,35,35,35,35,35,35,35,35,35,35,35,35,36,36,36,36,36,36,36,36,36,36,36,36,36,36,3
6,36,37,37,37,37,37,37,37,37,38,38,38,39,39,39,39, 39,39,39,39,40,41,41,42,42
Now to construct frequency distribution of nonverbal scores of teachers, we must
have adopted the following steps
1. Decide about the number of classes
K= 1+3.3logN
K=1+3.3Log108
K=7.71
K=8
2. Determination of Range
R=Xm-X0
R=42-21
R=21
3. Size of the Class
h=K
R
h=71.7
21
h=2.72
h=3
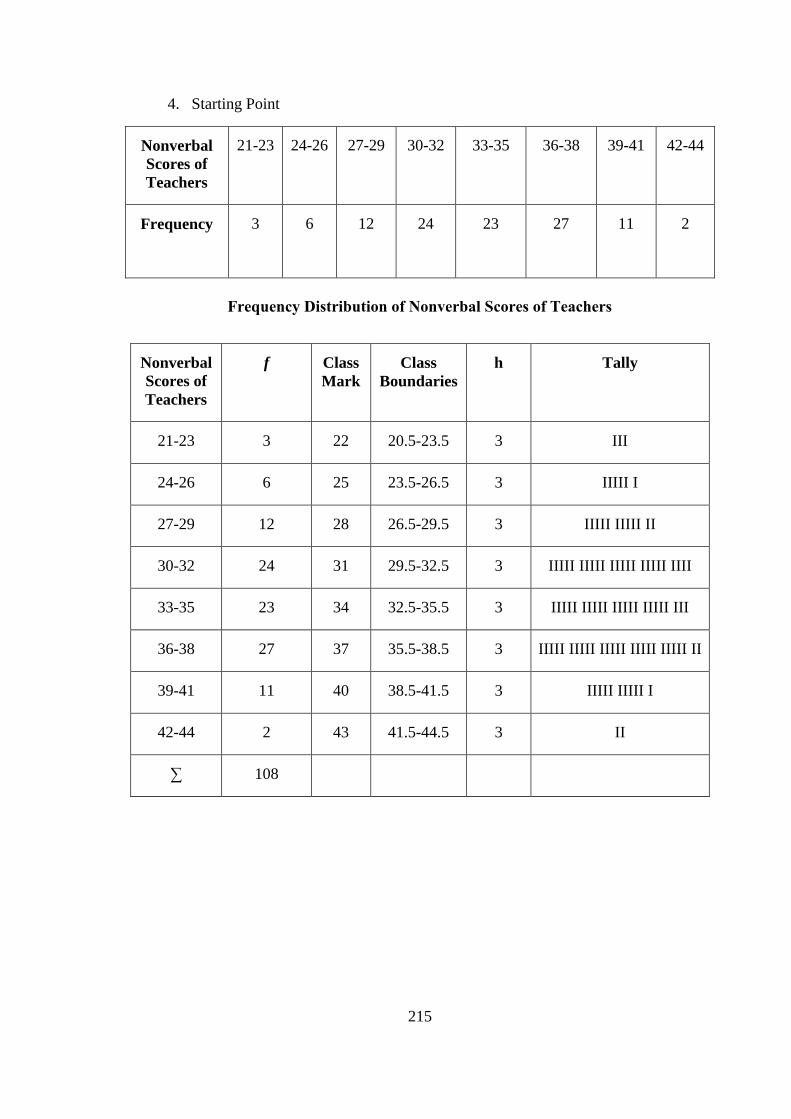
215
4. Starting Point
Nonverbal
Scores of
Teachers
21-23 24-26 27-29 30-32 33-35 36-38 39-41 42-44
Frequency 3 6 12 24 23 27 11 2
Frequency Distribution of Nonverbal Scores of Teachers
Nonverbal
Scores of
Teachers
f Class
Mark
Class
Boundaries
h Tally
21-23 3 22 20.5-23.5 3 III
24-26 6 25 23.5-26.5 3 IIIII I
27-29 12 28 26.5-29.5 3 IIIII IIIII II
30-32 24 31 29.5-32.5 3 IIIII IIIII IIIII IIIII IIII
33-35 23 34 32.5-35.5 3 IIIII IIIII IIIII IIIII III
36-38 27 37 35.5-38.5 3 IIIII IIIII IIIII IIIII IIIII II
39-41 11 40 38.5-41.5 3 IIIII IIIII I
42-44 2 43 41.5-44.5 3 II
∑ 108

216
Appendix “K”
Total Students Average Educational Accomplishment
52,53,54,54,54,55,55,56,56,56,57,57,57,58,60,61,61,62,62,62,62,63,63,64,64,65,65,6
6,66,66,66,66,67,67,67,68,68,68,68,68,69,69,70,71,71,71,72,72,72,72,73,73,74,74,74,
75,76,77,77,77,77,77,78,78,78,79,80,80,80,80,80,81,81,81,81,82,82,83,83,83,84,85,8
5,86,86,86,86,86,87,88,88,88,89,89,90,90,91,91,92,93,93,94,95,97,97,100,100,100
Now to construct frequency distribution of students‟ educational accomplishment, we
must have adopted the following steps
1. Decide about the number of classes
K= 1+3.3logN
K=1+3.3Log1296
K=11.27
K=12
2. Determination of Range
R=Xm-X0
R=100-52
R=48
3. Size of the Class
h=K
R
h=27.11
48
h=4.26
h=5

217
Frequency Distribution of Students’ Educational Accomplishment
Students’
Educational
Accomplishment
f Class
Mark
Class
Boundaries
h Tally
50-54 5 52 49.5-54.5 5 IIIII
55-59 9 57 54.5-59.5 5 IIIII IIII
60-64 11 62 59.5-64.5 5 IIIII IIIII I
65-69 17 67 64.5-69.5 5 IIIII IIIII IIIII II
70-74 13 72 69.5-74.5 5 IIIII IIIII III
75-79 11 77 74.5-79.5 5 IIIII IIIII I
80-84 15 82 79.5-84.5 5 IIIII IIIII IIIII
85-89 13 87 84.5-89.5 5 IIIII IIIII III
90-94 8 92 89.5-94.5 5 IIIII III
95-99 3 97 94.5-99.5 5 III
100-104 3 102 99.5-104.5 5 III
∑ 108

218
Appendix “L”
Relationship between Nonverbal Behaviour Scores of Teachers and Students Average Educational Accomplishment
Behaviour Scores
(X)
Students
Accomplishment (Y)
X2
Y2
XY
37
38
36
41
36
36
34
31
35
37
29
30
32
39
29
34
39
33
28
27
37
32
32
39
33
35
35
36
37
37
100
97
94
92
91
89
77
74
86
80
69
66
69
81
72
86
82
80
72
66
93
88
84
87
81
90
74
73
80
85
1369
1444
1296
1681
1296
1296
1156
961
1225
1369
841
900
1024
1521
841
1156
1521
1089
784
729
1369
1024
1024
1521
1089
1225
1225
1296
1369
1369
10000
9409
8836
8464
8281
7921
5929
5476
7396
6400
4761
4356
4761
6561
5184
7396
6724
6400
5184
4356
8649
7744
7056
7569
6561
8100
5476
5329
6400
7225
3700
3686
3384
3772
3276
3204
2618
2294
3010
2960
2001
1980
2208
3159
2088
2924
3198
2640
2016
1782
3441
2816
2688
3393
2673
3150
2590
2628
2960
3145

219
33
36
37
36
30
28
30
26
29
30
30
30
29
30
37
40
24
25
22
27
23
26
24
21
41
36
37
36
42
31
32
28
39
42
39
36
35
35
38
38
29
30
30
36
35
27
32
39
71
76
80
67
63
58
60
56
54
57
55
54
53
61
77
90
57
68
62
67
61
66
56
52
91
100
86
80
100
78
83
72
95
97
93
89
86
85
88
83
54
57
55
78
75
62
78
71
1089
1296
1369
1296
900
784
900
676
841
900
900
900
841
900
1369
1600
576
625
484
729
529
676
576
441
1681
1296
1369
1296
1764
961
1024
784
1521
1764
1521
1296
1225
1225
1444
1444
841
900
900
1296
1225
729
1024
1521
5041
5776
6400
4489
3969
3364
3600
3136
2916
3249
3025
2916
2809
3721
5929
8100
3249
4624
3844
4489
3721
4356
3136
2704
8281
10000
7396
6400
10000
6084
6889
5184
9025
9409
8649
7921
7396
7225
7744
6889
2916
3249
3025
6084
5625
3844
6084
5041
2343
2736
2960
2412
1890
1624
1800
1456
1566
1710
1650
1620
1537
1830
2849
3600
1368
1700
1364
1809
1403
1716
1344
1092
3731
3600
3182
2880
4200
2418
2656
2016
3705
4074
3627
3204
3010
2975
3344
3154
1566
1710
1650
2808
2625
1674
2496
2769

220
35
39
35
39
35
36
33
36
36
35
31
34
32
32
32
32
30
36
31
33
32
34
26
34
28
36
35
35
35
34
77
83
88
86
81
79
81
82
77
74
68
67
66
62
64
62
65
66
68
65
68
63
68
64
56
77
72
77
73
71
1225
1521
1225
1521
1225
1296
1089
1296
1296
1225
961
1156
1024
1024
1024
1024
900
1296
961
1089
1024
1156
676
1156
784
1296
1225
1225
1225
1156
5929
6889
7744
7396
6521
6241
6561
6724
5929
5476
4624
4489
4356
3844
4096
3844
4225
4356
4624
4225
4624
3969
4624
4096
3136
5929
5184
5929
5329
5041
2695
3237
3080
3354
2835
2844
2673
2952
2772
2590
2108
2278
2112
1984
2048
1984
1950
2376
2108
2145
2176
2142
1768
2176
1568
2772
2520
2695
2555
2414
3591 x 8065 y 1215592 x 6188212 y 272748 xy

221
Correlation co-efficient calculated by using the following formula
r =
2222 )()( yynxxn
yxxyn
618821,8065,121559,3591 22 yyxx , n =108
272748xy
r = 22 )8065(618821108)3591(121559108
80653591272748108
r = 68.645654
495369
r = 0.77
03.0error of chances The
39.10
27.0error of chances The
108
)77.0(167.0error of chances The
2
Putting value of r = 6
Values of r = 6×0.03=0.18, which is statistically significant
ationshipPerfectrelrif
tionshipStrongrelarif
hiptrelationsIntermediarif
onshipWeakrelatirif
onshipWeakrelatirif
,1,
,175.0,
,75.025.0,
,25.00,
,0,
Related Documents