Subsurface Sensing Technologies and Applications Vol. 3, No. 3, July 2002 (2002) Image Processing-Based Mine Detection Techniques: A Review Joonki Paik,* Cheolha P. Lee, and Mongi A. Abidi Imaging, Robotics, and Intelligent Systems Laboratory, Department of Electrical and Computer Engineering, The University of Tennessee, Knoxville Receiûed October 2, 2001; reûised February 8, 2002 Various mine detection techniques are reviewed with particular emphasis on signal and image processing methods. Based on the target, mines are classified into two types; anti-tank mine (ATM) and anti-personnel mine (APM). Because of the variety of mine types, current mine detection techniques are diversified. The assumption is made that most mine detection tech- niques consist of sensor, signal processing, and decision processes. For the sensor part, ground penetration radar (GPR), infrared (IR), and ultrasound (US) sensors are reviewed and their characteristics are summarized for the corresponding output signals. For the signal processing and decision parts, a set of image processing techniques including filtering, enhancement, feature extraction, and segmentation are surveyed. Segmentation is used to extract mine signal from various competing signals. For most image processing techniques covered by this paper, mine detection related experimental results are included or reproduced from existing works. Key Words. Mine detection, anti-personnel mine, anti-tank mine, unexploded ordinance, ground penetrating radar, infrared sensor, ultrasound sensor, image processing, filtering, segmentation, enhancement. 1. Introduction More than 26,000 people are killed or maimed by mines every year, which is equivalent to one victim every 20 min. For example, in Cambodia one out of every 236 people is a landmine amputee. The casualty ratio rises to one out of every 140 people in Angola, which has more mines than people. In addition to fatal casualties and enormous financial losses, mines *To whom all correspondence should be addressed. Post: 331 Ferris Hall, 1508 Middle Drive, The University of Tennessee, Knoxville, TN 37996-2100; fax: (865) 974-5459; e-mail: [email protected] 153 1566-0184020700-01530 2002 Plenum Publishing Corporation

Welcome message from author
This document is posted to help you gain knowledge. Please leave a comment to let me know what you think about it! Share it to your friends and learn new things together.
Transcript

Subsurface Sensing Technologies and Applications Vol. 3, No. 3, July 2002 (2002)
Image Processing-Based Mine Detection Techniques:A Review
Joonki Paik,* Cheolha P. Lee, and Mongi A. Abidi
Imaging, Robotics, and Intelligent Systems Laboratory, Department ofElectrical and Computer Engineering, The University of Tennessee,Knoxville
Receiûed October 2, 2001; reûised February 8, 2002
Various mine detection techniques are reviewed with particular emphasis on signal and imageprocessing methods. Based on the target, mines are classified into two types; anti-tank mine(ATM) and anti-personnel mine (APM). Because of the variety of mine types, current minedetection techniques are diversified. The assumption is made that most mine detection tech-niques consist of sensor, signal processing, and decision processes. For the sensor part, groundpenetration radar (GPR), infrared (IR), and ultrasound (US) sensors are reviewed and theircharacteristics are summarized for the corresponding output signals. For the signal processingand decision parts, a set of image processing techniques including filtering, enhancement,feature extraction, and segmentation are surveyed. Segmentation is used to extract mine signalfrom various competing signals. For most image processing techniques covered by this paper,mine detection related experimental results are included or reproduced from existing works.
Key Words. Mine detection, anti-personnel mine, anti-tank mine, unexploded ordinance,ground penetrating radar, infrared sensor, ultrasound sensor, image processing, filtering,segmentation, enhancement.
1. Introduction
More than 26,000 people are killed or maimed by mines every year,which is equivalent to one victim every 20 min. For example, in Cambodiaone out of every 236 people is a landmine amputee. The casualty ratio risesto one out of every 140 people in Angola, which has more mines thanpeople. In addition to fatal casualties and enormous financial losses, mines
*Towhom all correspondence should be addressed. Post: 331 FerrisHall, 1508Middle Drive, TheUniversity of Tennessee, Knoxville, TN 37996-2100; fax: (865) 974-5459; e-mail: [email protected]
153
1566-0184�02�0700-0153�0 2002 Plenum Publishing Corporation

154 Paik, Lee, and Abidi
Table 1. Worldwide Landmine Distribution and Clearance Status
Mines (million) Mined ClearedCleared area area
Countries UNa USSDb mines (km2) (km2) Casualtiesc
Afghanistan 10 7 158,000 550∼780 202 300∼360�monthAngola 15 15 10,000 Unknown 2.4 120∼200�monthBosnia 3 1 49,010 300 84 50�monthCambodia 6 6 83,000 3000 73.3 38,786 or 100�monthCroatia 3 0.4 8000 11,910 30 677Egypt 23 22.5 11,000,000 3,910 924 8301Eritrea 1 1 Unknown Unknown 2.48 2000Iran 16 16 200,000 40,000 0 6000Iraq 20 10 37,000 Unknown 1.25 6715Laos NA NA 251 43,098 Unknown 10,649 or 16∼18�monthMozambique 3 1 58,000 Unknown 28 1759Somalia 1 1 32,511 Unknown 127 4500Sudan 1 1 Unknown 800,000 0 700,000Vietnam 3.5 3.5 58,747 Unknown 65 180�month
aUN Landmine Database 1997 [1].bUS State Department Report ‘‘Hidden Killer 1998. The Global Landmine Crisis’’ [2].cCasualty reporting varies drastically among countries; estimates provided by UN or the hostgovernment.
ruin large areas of fertile farmland and waterways. In Cambodia, approxi-mately 40% of the rice fields have been mined and abandoned [1]. Mosttragic is that many victims are children and most mine-afflicted countries arepoverty stricken, as well. Worldwide landmine distribution and its clearancestatus are summarized in Table 1.
Because of the potentially catastrophic results of unintentional mineencounters, the process of detecting and removing mines, called demining,is particularly important. Manual demining is extremely dangerous; onedeminer has been killed for every 2,000 mines removed, with even morecivilian victims. The cost to purchase and lay a typical antipersonnel mineranges from $3 to $30, while the cost to remove a single mine ranges from$300 to $1000. The European Commission and the United States haveinvested 138 million dollars for demining actions during last two years, butthese cleared mines are just the tip of the iceberg [1]. In 1994, approximately200,000 mines were removed, while two million new mines were planted.Many experts believe that it would take more than ten centuries to removeevery mine in the world with the current clearance rate, even if no additionalmines were planted [3].
Because mines can be made of both metallic and nonmetallic mater-ials, detection using only conventional metal detectors cannot give a promis-ing result. Report also indicate metal detectors are subject to many false

Image Processing-Based Mine Detection Techniques: A Review 155
alarms in the former battlefield due to the presence of small fragments ofmunitions. Although manual detection, called probing, works well for a widevariety of mines, high labor cost and the slow pace involved are encouragingdevelopment of other techniques. Although some military demining equip-ment has been developed and used during the Gulf War by the US Army,civilian related demining, called humanitarian demining, is quite differentfrom the military work. The object of humanitarian demining is to find andremove abandoned landmines without any hazard to the environment.These landmines were intended for military use when they were planted, buttheir duty has expired. Furthermore, humanitarian demining equipment isrequired to be more accurate than military-purpose equipment because themilitary can afford a certain degree of casualty risk. The UN requires aprobability of 99.96% mine detection accuracy to find a 4 cm radius objectat a 10 cm depth, and localization ability of up to a 0.5 m radius [1].
To meet the strict requirements for humanitarian demining, varioustechniques in the area of sensor physics, signal processing, and robotics havebeen studied during the last decade. This paper surveys a wide variety ofdemining technologies with emphasis on various sensors and related signalprocessing techniques. The scope of this paper will be limited to humani-tarian demining rather than the military approach.
Most mine detection techniques consist of sensor, signal processing,and decision processes. For the sensor part, ground penetration radar(GPR), infrared (IR), and ultrasound (US) sensors are reviewed and theircharacteristics are summarized for the corresponding output signals. Forthe signal processing and decision parts, a commonly used set of imageprocessing techniques including filtering, enhancement, feature extraction,and segmentation are surveyed. Segmentation is used to extract a mine sig-nal from various competing signals. Two sets of minefield data collectedfrom test minefields were used to show how the mine detection algorithmswork with inhomogeneous background [4,5].
This paper is organized as follows. In Section 2 various types ofmines are classified based on the target. Section 3 summarizes three differentsensor technologies; GPR, IR, and US sensors. In Section 4 signal andimage processing techniques for mine detection are reviewed with a compre-hensive set of experimental results. Section 5 provides several examples,which show how general image processing algorithms can be applied to aspecific mine detection case, and Section 6 concludes the paper.
2. Classification of Mines
Various types of mines have been manufactured and laid. Accordingto the potential target, mines can be classified into antitank mines (ATM)

156 Paik, Lee, and Abidi
Table 2. Typical Specifications of Three Different Types of Mines [6]
Type UXUa ATM APMTarget Unspecified, general Vehicle HumanWeight Various Heavy (6∼11 kg) Light (0.1∼4 kg)Size (in diameter) Various Large (13∼40 cm) Small (6∼15 cm)Case material Mostly metal Metal, plastic PlasticDetonation pressure Unpredictable 120 kgb 0.5 kgb
aSome references define UXO in a more general category, including all kinds of mines.bThe values present the minimum pressure to detonate the most sensitive mine in each category.
and antipersonnel mines (APM). Typical specifications for two differenttypes of mines together with unexploded ordinance (UXO) are summarizedin Table 2. Generally, UXO represents misfired shells or unexploded bombsthat still remain for some reason. UXOs are usually found beneath the for-mer battlefields. Since UXO has a collective meaning including various typesof mines, we will present details for only ATMs and APMs in this section.
2.1. Anti-Tank Mine (ATM)
Most ATMs are made of metallic material, and their size is biggerthan that of APMs as indicated in Table 2. Since they have been designedto destroy vehicles, their detonation pressure is very high and they generatelarge metallic splinters after explosion. Two typical ATMs are shown inFigure 1. The TM-62M is a larger-sized metallic case mine with a diameterof 31 cm [6]. This device’s detonator is so insensitive that a human canapproach without explosion. The TMA-2 is a different type of ATM built
Figure 1. Two typical ATMs; (a) TM-62M and (b) TMA-2 [6].

Image Processing-Based Mine Detection Techniques: A Review 157
Table 3. Specifications for Two Different ATMs (TM-62M and TMA-2)
Model No. TM-62M TMA-2Dimensions Height 112 mm, diameter 316 mm Height 140 mm, width 260B200 mmWeight 8.47 kg 7.5 kgCase Steel PlasticSensitivity 200 kg 120 kgManufact. nation Former Soviet Union Former Yugoslavia
in a plastic case. Table 3 summarizes specifications for the TM-62M andTMA-2.
2.2. Anti-Personnel Mine (APM)
APMs are the most difficult type of mine to find and remove, andmost civilian victims have been injured by this type of mine. Most APMsare made of nonmetallic material, and they are much smaller than ATMs.APMs’ detonators are so sensitive that less than 10 kg of pressure canmake them explode. APMs can be divided into three types; (i) blasting,(ii) bounding fragmentation, and (iii) directional fragmentation [6,7]. Theblasting type mines are the most common targets for humanitarian demin-ing work.
A blasting mine is relatively smaller and lighter than other types ofmine. Blasting mines are usually buried underground, but some models canbe scattered by an airplane or floated on a river. For this reason, they canbe found on the surface, underground, and at the riverside. Because of itssimple mechanism and low material cost, small military groups can easilymanufacture this type of mine. Such haphazard manufacturing and deploy-ment of the blasting-type APM has resulted in serious mine problemsespecially for poorer countries that cannot afford to invest in deminingwork.
The bounding fragmentation type mines are relatively larger than theblasting type. This type of mine can destroy a larger area, while the blastingtype mines can damage only a target within a limited distance. Boundingfragment mines are either buried underground or deployed on the surface.Direct pressure or a trip wire activates their detonators. Once the trigger isactivated, they bounce up to a given altitude and explode with their lethalfragments spreading into an area of up to 30 m radius.
Most directional fragmentation type mines are deployed on the sur-face, and during explosion they spread their fragments in a specific direc-tion. Some models’ lethal range reaches over 200 m. Since they aredetonated by manual operation as well as a trip wire, sometimes this type

158 Paik, Lee, and Abidi
(a) (b) (c) (d)
Figure 2. Typical APMs; (a) PRB-M35, (b) PMN, (c) VALMARA-69, and (d) MON-100 [6].
of mine is considered as an active weapon. Some notable APMs are shownin Figure 2, and Table 4 summarizes their specifications.
Both the PRB-M35 and PMN fall within the realm of blasting-typemines, which can be detonated by 8 kg of pressure. The PRB-M35 is one ofthe smallest mines with diameter of approximately 6 cm, which is as smallas the diameter of a Coke can. If these mines are buried or scattered on theground covered with vegetation, they are very difficult to find and eliminate.Even lighter mines can be spread by floating on water, and their distributionis unpredictable after heavy rains or flooding. The PMN is another exampleof a cheap, nonmetallic mine with a cover made of rubber plate. TheValmara-69 is a bounding fragmentation type mine. Once detonated, thedevice propels upward and explodes with over 2,000 fragments spread overan area 27 meters in radius. The MON-100 is a directional fragmentationtype mine. Its lethal range reaches over 100 m covering a 9.5 m arc.
Table 4. Specifications for APMs in Figure 2 [4]
Model No. PRB-M35 PMN VALMARA-69 MON-100Type Blasting Blasting Bounding fragment Directional fragmentDimension
height 58 mm 56 mm 105 mm 82 mmdiameter 64 mm 112 mm 130 mm 236 mm
Weight 158 g 600 g 3.3 kg 5.0 kgCase Plastic Rubber Plastic SteelSensitivity 8 kg 8 kg 10.8 kg directly, Depends on fuses
6 kg through trip wireLethal range NA NA Radius 27 m 100 m by 9.5m arcManufact. Belgium Former Soviet Italy Former Sovietnation Union Union

Image Processing-Based Mine Detection Techniques: A Review 159
3. Sensor Technology
Since World War II, various kinds of sensors have been employed fordetecting mines. In this section we introduce three different types of sensorsthat have made major contributions in the mine detection field. Brief specifi-cations and low-level, hardware-related signal processing techniques to oper-ate each sensor will also be provided. Hardware-independent, high-levelsignal and image processing techniques will be discussed in the next section.
3.1. Ground Penetrating Radar (GPR)
GPR consists of an active sensor, which emits electromagnetic (EM)waves through a wideband antenna and collects signals reflected from itssurroundings. The principle of GPR is almost the same as in a seismic wavemeasurement system except for the carrier signal. The commonly used fre-quency band of the GPR, EM wave is between 100 MHz and 100 GHz [7].This band is wide enough to carry the necessary information.
Reflection occurs when the emitted signal encounters a surfacebetween two electrically different materials. The direction and intensity ofthe reflection depend on the roughness of the surface and electrical proper-ties of the medium material [7]. A rough surface reflects the incident wavein a diffused manner, while a smooth surface tends to reflect the wave inone direction, where the angle between the surface normal and the reflectedwave is the same to the angle between the surface normal and the incidentwave. The electrical properties of the medium determines the amount ofrefraction and absorption of the EM waves and subsequently affects thedirection and intensity of the reflection.
The penetration depth of the wave into soil usually depends on twofactors, the humidity in the soil and the wavelength of the EM wave [7]. Thecontent of water in the soil significantly reduces the depth of penetrationof a wave with relatively shorter wavelength. Based on the reflection andpenetration properties, GPR works best with low-frequency EM waves indry sand. Low-frequency signals, however, tend to make low-resolutionmaps of data, which decreases the accuracy of mine detection. Since the EMwaves cannot penetrate water, GPR cannot detect underwater mines, whichare common in many countries [9].
GPR provides information on both the existence and location ofmines. The presence of an object is detected by checking for interruptionthrough the round trip path of the signal. The distance between the sensorand an object is measured by using the time delay, ∆t, between the emittingand receiving moments of the signal as
RGû
2∆t (1)
160 Paik, Lee, and Abidi
where û represents the velocity of the EM wave in the medium, and R thedistance of the object from the sensor [7]. Since many parameters of the EMwaves, including the velocity, vary according to the content of soil, soilparameters should be estimated prior to taking the measurement [10].
3.1.1. A, B, and C-Scan
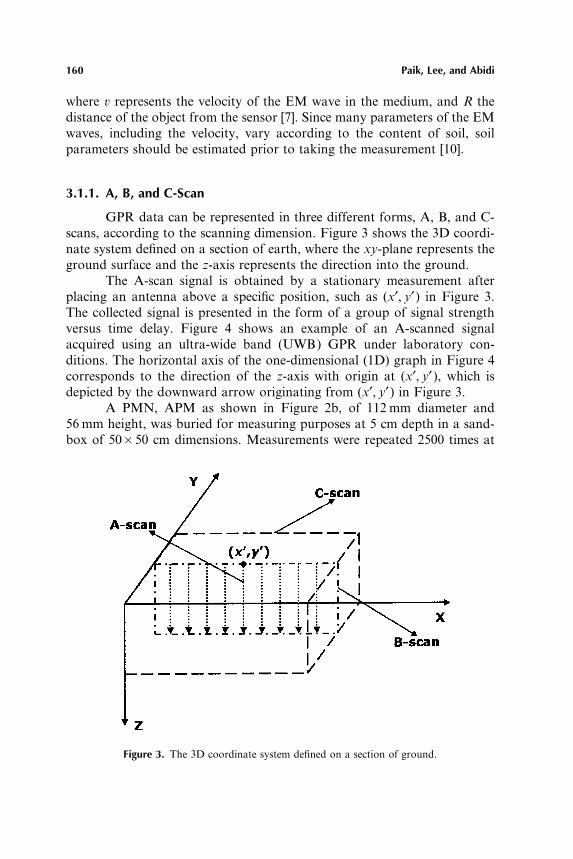
GPR data can be represented in three different forms, A, B, and C-scans, according to the scanning dimension. Figure 3 shows the 3D coordi-nate system defined on a section of earth, where the xy-plane represents theground surface and the z-axis represents the direction into the ground.
The A-scan signal is obtained by a stationary measurement afterplacing an antenna above a specific position, such as (x′, y′ ) in Figure 3.The collected signal is presented in the form of a group of signal strengthversus time delay. Figure 4 shows an example of an A-scanned signalacquired using an ultra-wide band (UWB) GPR under laboratory con-ditions. The horizontal axis of the one-dimensional (1D) graph in Figure 4corresponds to the direction of the z-axis with origin at (x′, y′ ), which isdepicted by the downward arrow originating from (x′, y′ ) in Figure 3.
A PMN, APM as shown in Figure 2b, of 112 mm diameter and56 mm height, was buried for measuring purposes at 5 cm depth in a sand-box of 50B50 cm dimensions. Measurements were repeated 2500 times at
Figure 3. The 3D coordinate system defined on a section of ground.
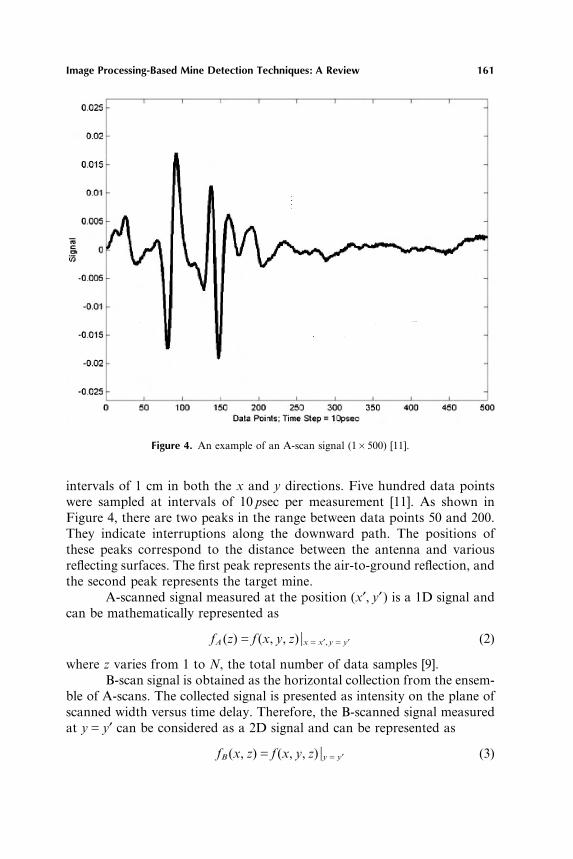
Image Processing-Based Mine Detection Techniques: A Review 161
Figure 4. An example of an A-scan signal (1B500) [11].
intervals of 1 cm in both the x and y directions. Five hundred data pointswere sampled at intervals of 10 psec per measurement [11]. As shown inFigure 4, there are two peaks in the range between data points 50 and 200.They indicate interruptions along the downward path. The positions ofthese peaks correspond to the distance between the antenna and variousreflecting surfaces. The first peak represents the air-to-ground reflection, andthe second peak represents the target mine.
A-scanned signal measured at the position (x′, y′ ) is a 1D signal andcan be mathematically represented as
fA (z)Gf (x, y, z) �xGx′,yGy′ (2)
where z varies from 1 to N, the total number of data samples [9].B-scan signal is obtained as the horizontal collection from the ensem-
ble of A-scans. The collected signal is presented as intensity on the plane ofscanned width versus time delay. Therefore, the B-scanned signal measuredat yGy′ can be considered as a 2D signal and can be represented as
fB (x, z)Gf (x, y, z) �yGy′ (3)

162 Paik, Lee, and Abidi
Figure 5. An example of a B-scan (500B50) [11].
where x, the horizontal position of measurement, varies from 1 to L, themaximum width of the antenna locus, and z varies from 1 to N, the numberof data samples at each measurement [9]. A 2D B-scanned signal is depictedby the vertical plane containing multiple A-scans in Figure 3.
Figure 5 shows the B-scanned signal for the same object of the A-scan shown in Figure 4. One B-scan consists of 50 A-scans. The verticalaxis corresponds to the horizontal axis of A-scan shown in Figure 4, andthe horizontal axis represents the scanned width, which is the number of A-scans. The intensity or color of each pixel indicates the signal strength, andcorresponds to the vertical axis of Figure 4. The horizontal line at datapoint 100 in the vertical axis corresponds to the air-to-ground surface, andthe hyperbola shaped object at data point 150 in the vertical axis corre-sponds to the target mine. The A-scan could detect only the existence of thetwo objects in Figure 4, but the B-scan can distinguish a mine-like targetfrom the air-to-ground surface and can give more information about theposition of the object as shown in Figure 5.

Image Processing-Based Mine Detection Techniques: A Review 163
C-scan signal is obtained from the ensemble of B-scans, measured byrepeated line scans along the plane. The collected C-scanned signal forms a3D signal, which is depicted by the hexahedron shown in Figure 3. In the3D coordinate system, the x and y axes respectively represent the horizontaland the vertical positions of the target, and the z-axis represents the depthof the target. A 3D C-scan signal can be represented as
fC (x, y, z) (4)
where x and y vary from 1 to L and 1 to M, respectively, and z varies from1 to N [9]. L and M represent the planar size of the scanned area, and Nrepresents the total number of data samples taken at each measurement.Since visualization of a three-dimensional data is not easy, a C-scan is usu-ally represented by a collection of horizontal slices for a specific data point,that is xy-planes at each specific position on the z-axis. Each slice corre-sponds to a certain depth level, which is equivalent to the vertical axis ofthe B-scan.
Figure 6 shows the C-scan of the same object used to obtain Figure4 and Figure 5. Figure 4 was acquired at the point (25,25) heading down.Figure 5 was acquired at the line yG25 also heading down. Figure 6a wasacquired at 1.33 nsec after the signal emission, and the subsequent imagesare acquired at intervals of 0.03 nsec. Although we cannot clearly define theair-to-ground boundary from these images, we can distinguish the targetmine from its background, and can roughly figure out the shape of thetarget. Figure 6d shows the top of the PMN, APM consisting of a smalldetonating cap and a large cylindrical case. Figure 6i shows the bottom partof the target. The measured size of the target is larger than its real size.
(a) (b) (c) (d) (e) (f)
(g) (h) (i) (j) (k) (l)
Figure 6. An example of a C-scan (50B50) [11]; consisting of horizontal slices at data points133 to 166 at intervals of 3 depth points.

164 Paik, Lee, and Abidi
The diameter of a PMN is 112 mm, and the size of the scanned area is50B50 cm. This magnification distortion in C-scan can be reduced by fusingthe corresponding B-scan data [10].
3.1.2. Preprocessing
In this subsection low-level signal processing techniques related toGPR are presented. As Figure 5 indicates, a target tends to show a hyper-bolic shape in the B-scan because the EM wave propagates in an omni-directional manner.
Figure 7 shows the B-scan acquisition process. An antenna movesalong a parallel line to the surface, and acquires the reflected signal fromthe object at regular intervals. Each vertical line indicates an A-scan, andblack dots represent the position of the impulse, which indicates the exist-ence of the object. Since the object is the closest to position A, the measuredtime delay at A is as short as d, while the time delay measured at B or C isequal to dC∆t. The time delay ∆t gives information about the position ofthe object. This delay can also vary due to the local soil conditions becausethe electrical properties of the medium affects the velocity of the EM wave.
The curvature of the hyperbola gives information about the existenceand position of the object and the soil condition. Hyperbolas can bedetected by using the Hough transformation. In detecting hyperbolas, eachhyperbola must be separated from the background clutter [10]. Althoughthe Hough transformation may detect the existence of hyperbolas, it does
Figure 7. A schematic diagram of the B-scan acquisition process [10].
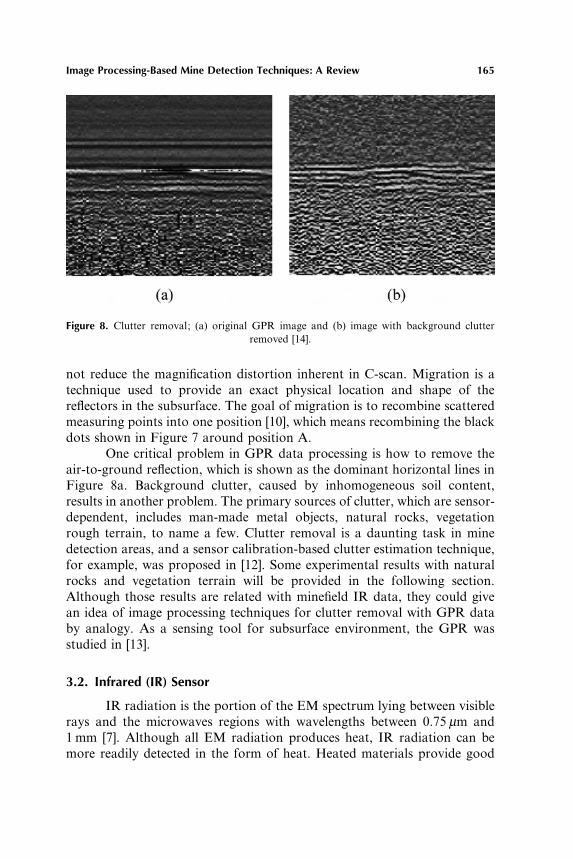
Image Processing-Based Mine Detection Techniques: A Review 165
Figure 8. Clutter removal; (a) original GPR image and (b) image with background clutterremoved [14].
not reduce the magnification distortion inherent in C-scan. Migration is atechnique used to provide an exact physical location and shape of thereflectors in the subsurface. The goal of migration is to recombine scatteredmeasuring points into one position [10], which means recombining the blackdots shown in Figure 7 around position A.
One critical problem in GPR data processing is how to remove theair-to-ground reflection, which is shown as the dominant horizontal lines inFigure 8a. Background clutter, caused by inhomogeneous soil content,results in another problem. The primary sources of clutter, which are sensor-dependent, includes man-made metal objects, natural rocks, vegetationrough terrain, to name a few. Clutter removal is a daunting task in minedetection areas, and a sensor calibration-based clutter estimation technique,for example, was proposed in [12]. Some experimental results with naturalrocks and vegetation terrain will be provided in the following section.Although those results are related with minefield IR data, they could givean idea of image processing techniques for clutter removal with GPR databy analogy. As a sensing tool for subsurface environment, the GPR wasstudied in [13].
3.2. Infrared (IR) Sensor
IR radiation is the portion of the EM spectrum lying between visiblerays and the microwaves regions with wavelengths between 0.75 µm and1 mm [7]. Although all EM radiation produces heat, IR radiation can bemore readily detected in the form of heat. Heated materials provide good

166 Paik, Lee, and Abidi
sources of infrared radiation. For this reason, IR radiation is also referredto as thermal radiation. Since visualization is easier than with other sensors,IR has been widely used for mine detection. Another advantage of IR isthat this process does not need as much serious preprocessing as GPR.However, the performance of IR is highly dependent on the environment atthe moment of measurement.
There are two different methods for sensing IR waves. The passiveIR system senses only natural radiation from the object, while the active IRsystem provides an extra heat source and receives the artificial radiationcreated by that heat source [15].
3.2.1. Detectors
The IR detector is a transducer that converts the energy of EM radi-ation into an electrical signal. There are two types of IR detectors, thephoton and the thermal detectors [16]. The photon detector or counter essen-tially measures the rate of quantum absorption, whereas the thermal detec-tor measures the rate of energy absorption [16]. Therefore, the photondetector is the selective IR detector, responding only to those photons withsufficiently short wavelengths. The response at other wavelength ranges isproportional to the rate at which photons of that wavelength are absorbed.Thermal detectors respond to only the intensity of absorbed radiant powerregardless of the spectral content [16]. Thus, they respond equally well toradiant energy of all wavelengths.
3.2.2. Dynamic Thermography
The general concept of using IR thermography for mine detection isbased on the fact that mines may have different thermal properties from thesurrounding material. If the response is due to an energy flux that varieswith time, the objects will follow a temperature curve that will not coincidewith the soil. When this contrast is made by alteration of the heat flow dueto the presence of the buried mine, it is called the ûolume effect [17]. On theother hand, when the contrast results from the disturbed soil layer createdby the burying operation, this is called the surface effect [17]. The surfaceeffect is detectable for only a limited time after burial. During this detectableperiod the thermal contrast is quite distinctive. Two different effects are

Image Processing-Based Mine Detection Techniques: A Review 167
Figure 9. Thermal effects; (a) volume effect and (b) surface effect.
shown in Figure 9. Once a sequence of images has been acquired, variousprocessing techniques can be applied to enhance the contrast between thepotential targets and background. This is called dynamic thermography [18].In order to obtain sample data, seven different types of mines were laid onor under an approximately 20B20 cm test area. Specific types of mines andtheir locations (ground truth) are summarized in Table 5. Figure 10 shows
Table 5. Summary of Various Types of Mines and their Placement [4]
Type of mine M15 M19 PGMDM RAAM FFV028 TN62 VS16Type of placement Under- Under- Surface Surface Under- Under- Under-
ground ground ground ground groundGround trutha 67.50 139.42 191.42 222.42 75.109 131.109 204.112
aThis parameter represents the positon on a 256B256 digitized grid.
Figure 10. The contrast enhanced, first image frame of a 256B256 IR image sequence fordetecting mines as described in Table 5 [4].
168 Paik, Lee, and Abidi
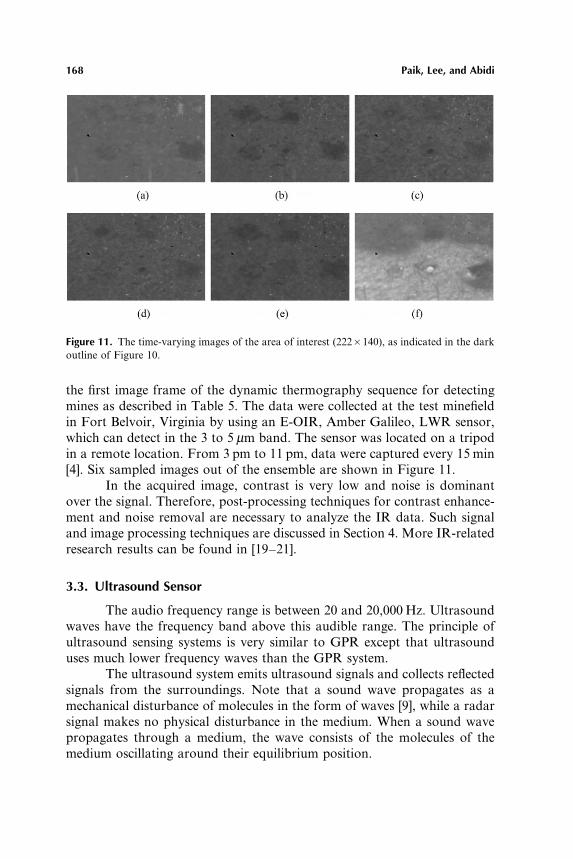
Figure 11. The time-varying images of the area of interest (222B140), as indicated in the darkoutline of Figure 10.
the first image frame of the dynamic thermography sequence for detectingmines as described in Table 5. The data were collected at the test minefieldin Fort Belvoir, Virginia by using an E-OIR, Amber Galileo, LWR sensor,which can detect in the 3 to 5 µm band. The sensor was located on a tripodin a remote location. From 3 pm to 11 pm, data were captured every 15 min[4]. Six sampled images out of the ensemble are shown in Figure 11.
In the acquired image, contrast is very low and noise is dominantover the signal. Therefore, post-processing techniques for contrast enhance-ment and noise removal are necessary to analyze the IR data. Such signaland image processing techniques are discussed in Section 4. More IR-relatedresearch results can be found in [19–21].
3.3. Ultrasound Sensor
The audio frequency range is between 20 and 20,000 Hz. Ultrasoundwaves have the frequency band above this audible range. The principle ofultrasound sensing systems is very similar to GPR except that ultrasounduses much lower frequency waves than the GPR system.
The ultrasound system emits ultrasound signals and collects reflectedsignals from the surroundings. Note that a sound wave propagates as amechanical disturbance of molecules in the form of waves [9], while a radarsignal makes no physical disturbance in the medium. When a sound wavepropagates through a medium, the wave consists of the molecules of themedium oscillating around their equilibrium position.

Image Processing-Based Mine Detection Techniques: A Review 169
Table 6. Speed of Sound in Different Media [9]
Material Steel Lead Water Soft tissue BonesSpeed of sound [m�s] 5000 1300 1460 1500 2500–4900
The speed of sound is dependent on the physical properties, density,and elasticity of the medium. The speed of sound propagation, denoted byc, is given as
cGf · λ [m�sec] (5)
where λ represents the wavelength of the wave, and f the frequency. Some-times c is called a material constant because it is constant for a certainmaterial [9].
In a uniform homogeneous medium, the ultrasound wave propagatesalong a straight line and is reflected and refracted when the wave encountersa boundary between two different media. At the boundary, the speed of thewave and the density of the medium affect the behavior of propagation. Inmine detection, the frequency of the ultrasound wave decides the penetra-tion depth as is also true for GPR. The lower frequency wave tends topenetrate better than the high frequency wave [9].
The ultrasound wave propagates well in humid or underwater con-ditions, but it is significantly attenuated in air, while the EM wave of GPRbehaves oppositely in the same conditions [7]. Table 6 summarizes the speedof sound propagation in different materials. The denser the material is, thegreater the speed. The ultrasound signal can be visualized using A, B, andC-scans, as with GPR.
4. Signal and Image Processing Techniques
In general mine detecting processes, 2D information for minelocation is the most important. Independent of the sensor used, the sensoroutput can be represented in the form of 2D data, which can be consideredan image. A slice in the ensemble of C-scanned GPR data shown in Figure6, for example, can be considered as a 2D image, where local contrast inpixel intensity provides a clue for potential existence and location of mines.
2D data from the sensors are highly subject to degradation due tovarious factors, such as: (i) noise due to unpredictable combination of soilcontents, (ii) low-resolution due to the limited performance of a sensor, and(iii) low-contrast due to the limited dynamic range of the sensor output. Forthis reason, the data must be enhanced by using various signal and imageprocessing techniques.

170 Paik, Lee, and Abidi
In this section notable hardware or sensor-independent signal andimage processing algorithms are summarized and their applications to minedetection are also described.
4.1. Filtering
Noise is unavoidable in the output of most sensors. In this subsectiontwo filtering techniques, the Wiener filter and the alternating sequential filterimplemented for the purpose of noise removal, are reviewed for the purposeof noise removal. The Wiener filter is also known as the minimum meansquare error (MMSE) filter in the image processing area [21,23]. The alter-nating sequential filter is based on gray-scale morphology [16].
4.1.1. Wiener Filter
The Wiener filter is a signal-dependent filter that restores the originalsignal by minimizing the mean square error between the estimated and theoriginal signals. Let f (m, n) and g(m, n) be arbitrary, zero mean, randomsequences with sizes M1BM2 and N1BN2 , respectively. If we assume thatg(m, n) is the output of the deterministic linear system with impulse responseh(m, n) and additive noise η(m, n), then
g(m, n)G∑i∑j
h(m, n; i, j ) f (i, j )Cη(m, n) (6)
This equation can be rewritten in the matrix-vector expression as
gGHfCη (7)
where g and η represent N1N2B1 vectors, f an M1M2B1 vector, and H anN1N2BM1M2 block matrix [23].
Consider the linear estimation problem, for which the original unde-graded image, f, is to be estimated, given the noisy degraded observation,g. Intuitively, we may think that the following is the solution of the linearequation in (7).
fGH−1(gAη) (8)
Whether it is possible to compute H−1 or not, the estimate given inEq. (8) is meaningless because g and η represent only one sample of thecorresponding random sequence. In other words, in order to estimate arandom sequence, it is reasonable to use statistical characteristics of givensequences as well as the information of the given sample sequence. The most
Image Processing-Based Mine Detection Techniques: A Review 171
popular way to estimate a random sequence is to compute the best linearestimate of f from,
fGGg (9)
which minimizes the average mean square error,
1
M1M2
E [( fAf )T ( fAf )] (10)
In Eq. (9), G represents an M1M2BN1N2 block matrix, and E [ · ], inEq. (10), represents the averaging operation of the corresponding randomsequence. By the orthogonality property of the random sequences, the esti-mate f, that minimizes Eq. (10), must satisfy
E{( fAf )gT}G0 (11)
Substituting Eq. (9) into Eq. (11) for f gives
RfgAGRggG0 (12)
where Rfg and Rgg , respectively, represent the cross covariance matrix of fand g and the auto-covariance matrix of g, such that
RfgGE{ fgT} and RggGE{ggT} (13)
Using the relationships in (7) and (13), and assuming that f is uncor-related with η, we can obtain the linearly estimated matrix, G, from (12) as
GGRfgR−1ggGRffH
T(HRffHTCRηη)
−1 (14)
which is called the Wiener filter.If the degradation operation occurs in a space-invariant manner, H
becomes a doubly block Toeplitz matrix. According to their definitions,both Rff and Rηη are also doubly block Toeplitz. If we assume a doublyblock circulant approximation for each doubly block Toeplitz matrix andassume that M1GM2GN1GN2GN, Eq. (14) can be diagonalized by thetwo-dimensional DFT. Let F be the NBN DFT matrix, then the diagonaliz-ation process can be described as
DGGDffD*H (DHDffD*HCDηη)−1 (15)
where DGGFGF*, DffGFRffF*, DHGFHF*, and DηηGFRηηF* [23]. The(k, l )th diagonal element of DG in (15) can be obtained as
G(k, l )GSff (k, l )H*(k, l )
�H (k, l ) �2Sff (k, l )CSηη (k, l )G
H*(k, l )
�H (k, l ) �2CSηη (k, l )
Sff (k, l )
(16)
172 Paik, Lee, and Abidi
where G and H, respectively, represent the two-dimensional DFTs of theimpulse responses of the Wiener filter and the degradation system. Sff andSηη represent spectral density functions of f and η, which are the two-dimen-sional DFTs of Rff and Rηη , respectively.
In many applications with degradation due to only noise, we canassume that the impulse response of the linear system is the unit impulse as
h(m, n)Gδ (m, n) (17)
or equivalently, its Fourier transform is the unity as
H(k, l )G1 for all (k, l ) (18)
If (18) is satisfied, the Wiener filter derived in (16) can be simplifiedas
G(k, l )GSff (k, l )
Sff (k, l )CSηη (k, l )(19)
The two-dimensional DFT of the estimate is obtained as
FfGFGgGFGF*FfGDGg (20)
which requires only N2 complex multiplications. Therefore, a randomsequence can be estimated from the space-invariant degraded observationby using the frequency-domain Wiener filter.
4.1.2. Gray-Scale Morphology
Mathematical morphology has been applied primarily for binaryimage processing. Basic or the first level functions, such as dilation anderosion, are performed by structure elements with various shapes and sizes.Repetition of the basic functions forms the second level functions, such asopening and closing. By appropriately combining those operations, a region-based processing, such as boundary extraction, region filling, and thinning,can be realized. Gray-scale morphology can provide more complicated pro-cessing, such as gradient extraction, contrast enhancement, and region-based segmentation (watershed algorithm) as well as noise removal andsmoothing which are typical applications of binary morphology.
In order to explain morphological operators, the structuring elementshould be defined first. A structuring element can be considered as a simplematrix or a small window that represents a certain local property of thewhole image. A structuring element defines the region of support aroundthe origin, and it adds an offset value to each pixel on the defined region ofsupport [24].

Image Processing-Based Mine Detection Techniques: A Review 173
Figure 12. Structure elements for morphological operations; (a) 5B5 octagonal window withuniform offset, (b) 5B5 diamond neighborhood with uniform offset, and (c) 5B5 rectangularneighborhood with pyramidal offset.
Figure 12a shows an octagonally shaped structuring element. Theoctagonal structuring element is widely used for mine detection because theoctagon most resembles the round shape of mines. The origin has 5B5neighboring pixels except at the four corners. Figure 12b shows a diamond-shaped structuring element. It has relatively fewer neighboring pixels thanthe octagonal element. Figure 12c shows a rectangular-shaped structuringelement with pyramidal offset distribution. The origin has the highest offsetvalue while boundary pixels have relatively lower offsets. If a structuringelement has uniform offset values, it is called a flattop filter.
The basic operators, dilation, erosion, opening, and closing, will beintroduced in the following section.
A. Morphological Operators. Here we define some morphologicaloperators by comparing with simple, linear 2D filtering [21]. The 2D discreteconvolution of an MBN image f and the impulse response of a filter h isdefined as
h(m, n)* f (m, n)G1
MN∑
MA1
kG0∑
NA1
lG0
h(mAk, nAl ) f (k, l ) (21)
for mG0, . . . , MA1, and nG0, . . . , NA1. On the other hand dilation ofan image f by a structuring element b is defined as
δb ( f )G( f⊕ b)(m, n)
Gmax{ f (mAk, nAl )Cb(k, l ) � (mAk, nAl )∈Df ; (k, l )∈Db} (22)
where Df and Db represent the domains of f and b, respectively.In (22), the displacement parameter condition, (mAk, nAl )∈Df ,
implies that the structuring element should completely be contained by the

174 Paik, Lee, and Abidi
set being dilated. This operation can be compared with the 2D convolutiongiven in (21), where the max operation corresponds to summations in theconvolution and addition of f and b corresponds to the multiplication of fand h in the convolution. f (mAk, nAl ) represents f (k, l ) flipped with respectto the origin and then shifted by (m, n).
Since dilation is based on choosing the maximum value of xCb in aneighborhood defined by the specific structuring element, it has two effects:(i) the output image tends to be brighter than the input if all offset valuesare positive, and (ii) the dark details of the input image are either reducedor eliminated if the structuring element is larger than the dark area.
Erosion of an image f by a structuring element b is defined as
εb ( f )G( f � b)(m, n)
Gmin{f (mCk, nCl )Ab(k, l ) � (mCk, nCl )∈Df; (k, l )∈Db}, (23)
where Df and Db are the domains of f and b, respectively.In Eqs. (22) and (23) the dilation and erosion functions are dual
under the same condition. The function f (mCk, nCl ) represents f (m, n)shifted by (−k, −l ). Since erosion is based on choosing the minimum valueof fAb in the neighborhood defined by the structuring element, its effectsare opposite to dilations. In other words if all the offset values of the struc-turing element are positive, the output image tends to be darker than theinput. And the bright details of the input image are either reduced or elimin-ated if the size of the bright area is smaller than the structuring element.
The opening of an image function f by the structuring element b isdefined as
γb ( f )Gf ° bG( f � b)⊕ b (24)
which is equivalent to the erosion of f by b followed by the dilation by b.The opening operation is used to remove small bright details, while
keeping the overall gray levels unchanged and relatively larger bright fea-tures undisturbed. The initial erosion removes small bright details, and atthe same time makes the image darker. The subsequent dilation increasesthe brightness of the image without reintroducing the bright details, whichhave been removed by the previous erosion.
The closing of an image function f by the structuring element b isdefined as
ϕb ( f )Gf • bG( f⊕ b) � b (25)
which is equivalent to the dilation of f by b followed by the erosion by b.The closing operation is dual with respect to the opening operation. Theclosing effects are opposite to the combined effects of dilation and erosion.

Image Processing-Based Mine Detection Techniques: A Review 175
Figure 13. Experimental results of gray-scale morphological operations; (a) original image,(b) dilated image, (c) eroded image, (d) opened image, and (e) closed image.
Closing is generally used to remove small dark details, while keeping theoverall gray levels unchanged and relatively larger, dark features undis-turbed. The initial dilation removes small dark details and at the same timemakes the image brighter. The subsequent erosion decreases the brightnessof the image without reintroducing the dark details, which have beenremoved by the previous dilation. Figure 13 shows simulation results ofmorphological operations using a 5B5 flat octagonal structuring element.Brief intensity values statistics are also summarized in Table 7.
In Figure 13b and e, bright details are enhanced, and dark areas areshrunk due to the removal of dark pixels. On the other hand, the averageintensity value is significantly increased in (b), but not in (e). In (c) and (d),dark details are enhanced, and bright areas are shrunk due to the removalof bright pixels. The average intensity value is significantly decreased in (c),but not in (d).
B. Morphological Gradient. The main goal of the morphologicalgradient transformation is to highlight gray level contours. When 2D imagefunction f is continuously differentiable, its gradient can be obtained as
g( f )G1�∂f∂x�2
C�∂f∂y�2
(26)
One simple way to approximate the gradient is to calculate the differ-ence between the highest and the lowest pixel intensity values within a pre-specified window, centered at the point of interest, say (x, y) [25]. In other
Table 7. Statistics for Intensity Values from Figure 13. For 8-bit Gray-scaleMapping, the Maximum Gray Value of a Pixel is Equal to 255 and the
Minimum 0
Image (a) (b) (c) (d) (e)Average 98.7 120.7 78.3 92.2 105.3Minimum 3 9 3 3 9Maximum 238 238 213 213 238

176 Paik, Lee, and Abidi
Figure 14. Morphological gradient; (a) the original image and (b) the corresponding gradientimage.
words, it is the difference between the dilated function δ ( f ) and the erodedfunction ε ( f ), expressed as
g( f )Gδ ( f )Aε ( f ) (27)
Morphological gradient obtained by simulation is shown in Figure 14.
C. Smoothing and Noise Reduction Using the Alternating Sequen-tial Filter. The combination of opening and closing operations can removenoise and smooth the texture in an image. This is called the alternatingsequential filter (ASF). Usually, the ASF performs well with repetitionrather than a single operation. There are two different types of ASFs. Thefirst type, known as the white ASF is defined as
Φn ( f )Gϕ1γ1ϕ2γ2ϕ3γ3 . . . ϕnγn (28)
where ϕ denotes the opening operation, γ denotes the closing operation, andeach subscript represents the size of the corresponding structure element[16].
Equation (28) can be rewritten as
Φn ( f )Gγn (ϕn . . . (γ2(ϕ2(γ1(ϕ1( f )))))) (29)
The white ASF performs both opening and closing on the objectimage with the smallest structural element, respectively. The filter then per-forms another opening and closing with the larger structural element, andthis process keeps repeating.
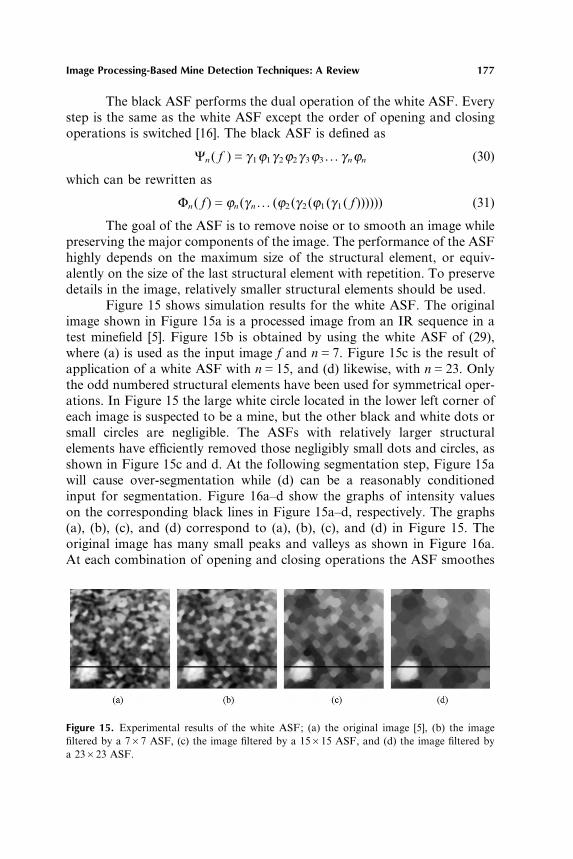
Image Processing-Based Mine Detection Techniques: A Review 177
The black ASF performs the dual operation of the white ASF. Everystep is the same as the white ASF except the order of opening and closingoperations is switched [16]. The black ASF is defined as
Ψn ( f )Gγ1ϕ1γ2ϕ2γ3ϕ3 . . . γnϕn (30)
which can be rewritten as
Φn ( f )Gϕn (γn . . . (ϕ2(γ2(ϕ1(γ1( f )))))) (31)
The goal of the ASF is to remove noise or to smooth an image whilepreserving the major components of the image. The performance of the ASFhighly depends on the maximum size of the structural element, or equiv-alently on the size of the last structural element with repetition. To preservedetails in the image, relatively smaller structural elements should be used.
Figure 15 shows simulation results for the white ASF. The originalimage shown in Figure 15a is a processed image from an IR sequence in atest minefield [5]. Figure 15b is obtained by using the white ASF of (29),where (a) is used as the input image f and nG7. Figure 15c is the result ofapplication of a white ASF with nG15, and (d) likewise, with nG23. Onlythe odd numbered structural elements have been used for symmetrical oper-ations. In Figure 15 the large white circle located in the lower left corner ofeach image is suspected to be a mine, but the other black and white dots orsmall circles are negligible. The ASFs with relatively larger structuralelements have efficiently removed those negligibly small dots and circles, asshown in Figure 15c and d. At the following segmentation step, Figure 15awill cause over-segmentation while (d) can be a reasonably conditionedinput for segmentation. Figure 16a–d show the graphs of intensity valueson the corresponding black lines in Figure 15a–d, respectively. The graphs(a), (b), (c), and (d) correspond to (a), (b), (c), and (d) in Figure 15. Theoriginal image has many small peaks and valleys as shown in Figure 16a.At each combination of opening and closing operations the ASF smoothes
Figure 15. Experimental results of the white ASF; (a) the original image [5], (b) the imagefiltered by a 7B7 ASF, (c) the image filtered by a 15B15 ASF, and (d) the image filtered bya 23B23 ASF.

178 Paik, Lee, and Abidi
Figure 16. Intensity value on the black line in Figure 15.
every object that is smaller than the corresponding structural element. Whenthe ASF is used with a 7B7 structuring element, there remain a number ofsmall peaks and valleys, which are circled in Figure 16b. Those circled peaksand valleys disappeared when the ASF is used with a 15B15 structuringelement, as shown in Figure 16c. Even if the size of the structuring elementis increased to 23B23, the desired large white circle still remains, as shownin Figure 16d. As shown in Table 8, the average gray value of the filteredimage has not significantly changed, while the dynamic range, which can beconsidered as the difference between the maximum and minimum intensityvalues, has been reduced somewhat.
Table 8. Statistics for Intensity Values in Image of Figure 16
Image (a) (b) (c) (d)Average 144.3 143.8 143.0 141.5Minimum 0 20 57 68Maximum 255 252 245 239

Image Processing-Based Mine Detection Techniques: A Review 179
The primary advantage of the ASF is that this filter can select the sizeof the object to be detected by determining the maximum size of structuralelements. Another important property of the ASF is that it does not affectthe overall statistics of the image.
4.2. Feature Extraction
Both GPR and IR sensors produce huge amounts of data for C-scanned image sequences and dynamic thermography, respectively. Combi-nation of two or more different types of sensors results in multiple, hetero-geneous data. Extraction of the desired features from the large-scale,heterogeneous data is a daunting task.
That orthogonal transformations can serve as a tool for removingredundant data and analyzing the desired property in large-scale data iswell known. The discrete cosine transform (DCT) used in image and videocompression is one example of this type of transformation, and the discreteFourier transform or singular value decomposition is another. In this sub-section two orthogonal transformations are presented that have producedpromising feature extraction results in the mine detection area.
4.2.1. Karhunen–Loeve (KL) Transformation
The principle behind the KL transform is a series expansion of thecontinuous random process. The discrete counterpart, also known as theHotelling transform, was studied by Hotelling, who established the theoryof the orthogonal transform for a discrete random vector. Given a realrandom vector, the orthonormalized eigenvectors of the vector’s autocorrel-ation matrix serve as the basis vectors of the KL transform. According tomatrix theory, the coefficients of the KL transform are equivalent to theeigenvalues of the autocorrelation matrix. Since most energy of the inputrandom signal concentrates on the first few coefficients, the KL transformis also called the principal component analysis [21,23].
If the KL transform is extended for 2D random images, a reducedset of basis images can represent the input random image with minimizedrepresentation error. Since the input image of the KL transform is assumedto be a 2D random process, the KL transform is suitable for analysis oftime-varying image sequences produced by mine detecting sensors. Kempenet al. adopted the KL transform to analyze dynamic infrared imagesequences for antipersonnel mine detection [18].
Consider a dynamic image sequence denoted by fmn , for mG1, . . . ,M, and nG1, . . . , N, where M and N respectively represent the number of

180 Paik, Lee, and Abidi
Figure 17. An image sequence with M pixels and N images.
pixels in an image and the number of images in a sequence. Figure 17 showsa typical image sequence with N images and M pixels, where a vector corre-sponding to one pixel position along an image sequence is called a dynamicpixel or a dixel. A dixel represents the dynamic thermal evolution of a pointin N dimensional space [18].
Note that dixels originating from the same object tend to form acluster. In the KL transform domain, the basis vectors corresponding tothe major transform coefficients represent the directions that maximize thedistinction between clusters [25]. The dixel vector is defined as dmG
[ fm1 fm2 . . . fmn ]T in the dimensional Euclidean space, where the subscript m
represents the position of the pixel in each image. For example, if there areonly two images in the input image sequence, each dixel is represented by a2D vector, as dmG [ fm1 fm2 [
T, mG1, . . . , M. The M different dixel vectorsform the dixel cloud, as shown in Figure 18.
The normalized image sequence is obtained as
fmnGfmnAµn (32)
where
µnGE [ fmn]G1
M∑M
mG1
fmn

Image Processing-Based Mine Detection Techniques: A Review 181
Figure 18. A dixel-cloud in the 2D dixel space [16].
A unity vector uG[u(1) u(2) . . . u(N )]T, ��u��G1, can convert the dixel vectordm into a scalar quantity rm , expressed as
rmGdTmu (33)
Note that the mean value of rm is equal to zero due to the normalizationgiven in (32).
The goal of the KL transform is to find the optimum u, which maxi-mizes the variance of rm , that is
E [r2m]GE [uTdmdT
mu]GuTCu (34)
where C denotes the covariance matrix of dm , as CGE [dmdTm].. Intuitively,
the variance of rm can be considered as the degree of spread of dixels, andum , the corresponding direction. A 2D dixel space is shown in Figure 18,where u1 represents the optimum unit vector corresponding to the maximumvariance of r1 . As shown in the figure, the samples are most widely distri-buted in the direction of u1, and then in the direction of u2 .
To find the optimum direction, the constrained optimization problemmust be solved as
maximize E [r2m] subject to uTuG1 (35)

182 Paik, Lee, and Abidi
The solution of (35) is obtained by solving the following equation with theLagrange multiplier as
∇h(u)Aλ∇g(u)G0 (36)
where
h(u)GuTCu (37)
and
g(u)GuTuA1 (38)
According to (37), ∇h(u) can be computed as
∇h(u)G ∑N
iG1�δu(i)
∂∂u(i)
h� (39)
Since C is a symmetric matrix
∂∂u(i)
hG� ∂∂u(i)
uT�CuCuTC � ∂∂u(i)
u�GeT
i CuCuTCeiG2eTi u (40)
where ei represents the i th unit vector. According to (38), ∇g(u) in (36) canbe computed as
∂∂u(i)
gG� ∂∂u(i)
uT�uCuT � ∂∂u(i)
u� (41)
GeTi uCuTeiG2eT
i u
From (40) and (41), (36) is rewritten as
∇h(u)Aλ∇g(u)G ∑N
iG1
[δu(i)eTi (CuAλu)]
G[δu(1) δu(2) . . . δu(N )][CuAλu]G0 (42)
which is only possible if CuGλu. This results in an eigen analysis problem,where λ is the eigenvalue and u is the corresponding eigenvector. ui , iG1,. . . , N, represents N possible solutions. Since CuiGλ iu, (37) can be reducedto
h(ui)GuTi CuiGuT
i λ iuiGλ i (43)
Equation (43) indicates that the eigenvector ui , corresponding to thelargest eigenvalue λ i , represents the direction for which the quadratic
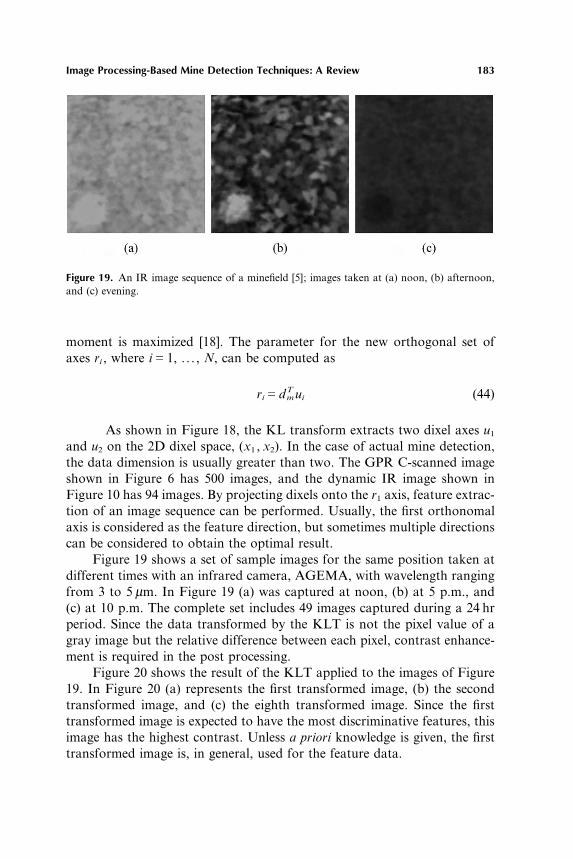
Image Processing-Based Mine Detection Techniques: A Review 183
Figure 19. An IR image sequence of a minefield [5]; images taken at (a) noon, (b) afternoon,and (c) evening.
moment is maximized [18]. The parameter for the new orthogonal set ofaxes ri , where iG1, . . . , N, can be computed as
riGdTmui (44)
As shown in Figure 18, the KL transform extracts two dixel axes u1and u2 on the 2D dixel space, (x1 , x2). In the case of actual mine detection,the data dimension is usually greater than two. The GPR C-scanned imageshown in Figure 6 has 500 images, and the dynamic IR image shown inFigure 10 has 94 images. By projecting dixels onto the r1 axis, feature extrac-tion of an image sequence can be performed. Usually, the first orthonomalaxis is considered as the feature direction, but sometimes multiple directionscan be considered to obtain the optimal result.
Figure 19 shows a set of sample images for the same position taken atdifferent times with an infrared camera, AGEMA, with wavelength rangingfrom 3 to 5 µm. In Figure 19 (a) was captured at noon, (b) at 5 p.m., and(c) at 10 p.m. The complete set includes 49 images captured during a 24 hrperiod. Since the data transformed by the KLT is not the pixel value of agray image but the relative difference between each pixel, contrast enhance-ment is required in the post processing.
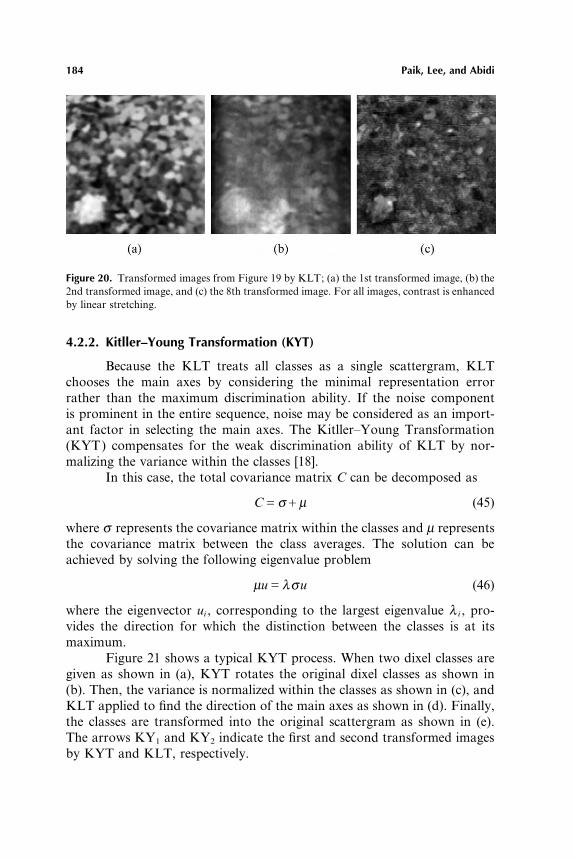
Figure 20 shows the result of the KLT applied to the images of Figure19. In Figure 20 (a) represents the first transformed image, (b) the secondtransformed image, and (c) the eighth transformed image. Since the firsttransformed image is expected to have the most discriminative features, thisimage has the highest contrast. Unless a priori knowledge is given, the firsttransformed image is, in general, used for the feature data.
184 Paik, Lee, and Abidi
Figure 20. Transformed images from Figure 19 by KLT; (a) the 1st transformed image, (b) the2nd transformed image, and (c) the 8th transformed image. For all images, contrast is enhancedby linear stretching.
4.2.2. Kitller–Young Transformation (KYT)
Because the KLT treats all classes as a single scattergram, KLTchooses the main axes by considering the minimal representation errorrather than the maximum discrimination ability. If the noise componentis prominent in the entire sequence, noise may be considered as an import-ant factor in selecting the main axes. The Kitller–Young Transformation(KYT) compensates for the weak discrimination ability of KLT by nor-malizing the variance within the classes [18].
In this case, the total covariance matrix C can be decomposed as
CGσCµ (45)
where σ represents the covariance matrix within the classes and µ representsthe covariance matrix between the class averages. The solution can beachieved by solving the following eigenvalue problem
µuGλσu (46)
where the eigenvector ui , corresponding to the largest eigenvalue λ i , pro-vides the direction for which the distinction between the classes is at itsmaximum.
Figure 21 shows a typical KYT process. When two dixel classes aregiven as shown in (a), KYT rotates the original dixel classes as shown in(b). Then, the variance is normalized within the classes as shown in (c), andKLT applied to find the direction of the main axes as shown in (d). Finally,the classes are transformed into the original scattergram as shown in (e).The arrows KY1 and KY2 indicate the first and second transformed imagesby KYT and KLT, respectively.

Image
Processing-Based
Mine
Detection
Techniques:A
Review
185
Figure 21. A typical KYT Process; (a) two dixel classes, (b) rotated dixel classes, (c) rotated dixel classes with variance normalized,(d) main axes obtained by the KLT, and (e) original scattergram with the main axes by inverse rotation [18].

186 Paik, Lee, and Abidi
Although some concepts of KYT are similar to KLT in the sense ofthe eigenvalue problem, some additional information should be determinedto perform this transformation. Such additional information includes, forexample, the class average, variance, and relative weight. These classes aredetermined by delimiting the dixel clouds manually.
4.3. Contrast Enhancement
Since the contrast between the background and the mine target isnot usually high enough, the raw sensor image can hardly give satisfactoryinformation. The purpose of contrast enhancement is to enhance the differ-ence between the mine target and the background to distinguish betweenthem. Two methods, morphological contrast enhancement and histogramequalization, are introduced in this subsection.
4.3.1. Morphological Contrast Enhancement
Morphological filtering for enhancing mine images has been pro-posed by Ederra in [16]. The first step of Ederra’s algorithm is to find peaksand valleys from the original image. Peaks represent the brighter parts of agray-scale image, while valleys represent the darker part. Peaks are obtainedby subtracting the morphologically opened image from the original image,and valleys by subtracting the original image from the morphologicallyclosed image as
p( f )GfAγ ( f ) and û( f )Gϕ( f )Af (47)
where f represents the original, p( f ) the peaks, û( f ) the valleys, γ ( f ) theopened, and ϕ( f ) the closed images. Contrast can be enhanced by multiply-ing the peaks and valleys by constants as
p′( f )Gc1p( f ) (48)
where
c1G�max( f )Amax(I ) �
max[p( f )]
and I indicates the dynamic range of the gray-scale image. For example, an8-bit gray level image has a dynamic range [0, 255], where max(I )G255 andmin(I )G0. Then
û′( f )Gc2û( f ) (49)
where
c2G�min( f )Amin(I ) �
max[û( f )]
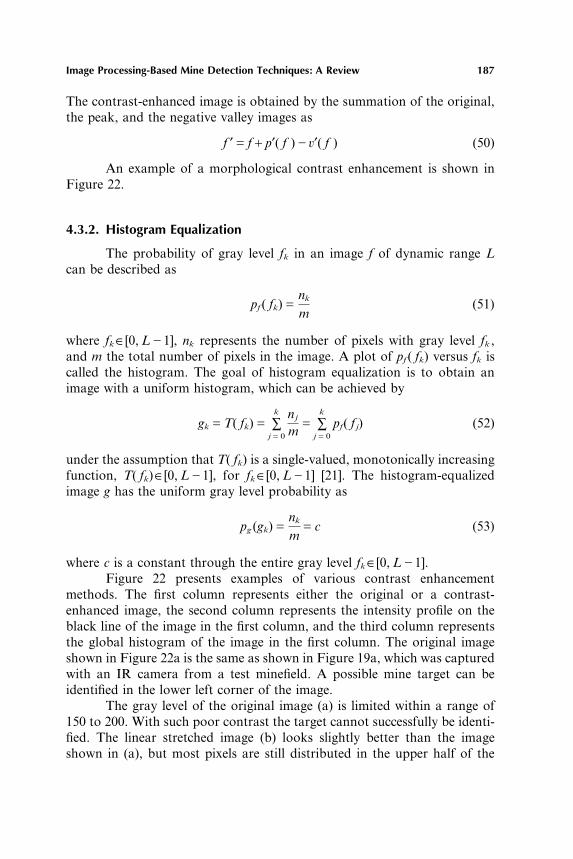
Image Processing-Based Mine Detection Techniques: A Review 187
The contrast-enhanced image is obtained by the summation of the original,the peak, and the negative valley images as
f ′GfCp′( f )Aû′( f ) (50)
An example of a morphological contrast enhancement is shown inFigure 22.
4.3.2. Histogram Equalization
The probability of gray level fk in an image f of dynamic range Lcan be described as
pf ( fk)Gnk
m(51)
where fk∈[0, LA1], nk represents the number of pixels with gray level fk ,and m the total number of pixels in the image. A plot of pf ( fk) versus fk iscalled the histogram. The goal of histogram equalization is to obtain animage with a uniform histogram, which can be achieved by
gkGT( fk)G ∑k
jG0
nj
mG ∑
k
jG0
pf( fj) (52)
under the assumption that T( fk) is a single-valued, monotonically increasingfunction, T( fk)∈[0, LA1], for fk∈[0, LA1] [21]. The histogram-equalizedimage g has the uniform gray level probability as
pg (gk)Gnk
mGc (53)
where c is a constant through the entire gray level fk∈[0, LA1].Figure 22 presents examples of various contrast enhancement
methods. The first column represents either the original or a contrast-enhanced image, the second column represents the intensity profile on theblack line of the image in the first column, and the third column representsthe global histogram of the image in the first column. The original imageshown in Figure 22a is the same as shown in Figure 19a, which was capturedwith an IR camera from a test minefield. A possible mine target can beidentified in the lower left corner of the image.
The gray level of the original image (a) is limited within a range of150 to 200. With such poor contrast the target cannot successfully be identi-fied. The linear stretched image (b) looks slightly better than the imageshown in (a), but most pixels are still distributed in the upper half of the

188 Paik, Lee, and Abidi
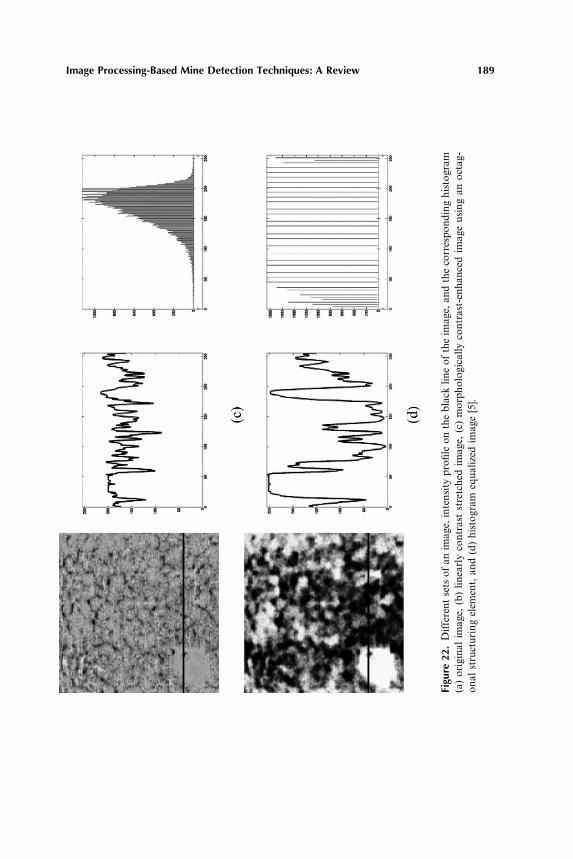
Image Processing-Based Mine Detection Techniques: A Review 189
Figu
re22
.D
iffe
rent
sets
ofan
imag
e,in
tens
ity
profi
leon
the
blac
klin
eof
the
imag
e,an
dth
eco
rres
pond
ing
hist
ogra
m(a
)or
igin
alim
age,
(b)
linea
rly
cont
rast
stre
tche
dim
age,
(c)
mor
phol
ogic
ally
cont
rast
-enh
ance
dim
age
usin
gan
octa
g-on
alst
ruct
urin
gel
emen
t,an
d(d
)hi
stog
ram
equa
lized
imag
e[5
].

190 Paik, Lee, and Abidi
gray level range, and the target is still difficult to identify. The morphologi-cally contrast-enhanced image shown in (c) was obtained by Eq. (50) usinga 7B7 octagonal structuring element, but the gray level was not sufficientlyenhanced. Small peaks and valleys can be easily removed by ASF, buteventually a wider range of gray level is desired. The histogram-equalizedimage given in (d) shows the best result. This histogram shows almost uni-form distribution except for critically high or low levels. ASF can easilyremove small peaks and valleys, making the target area readily identifiable.
4.4. Segmentation Using Watershed
There are two different approaches to image segmentation. The firstis the boundary-based approach, which detects local changes. The second isthe region-based approach, which searches for pixel and region similarities.The watershed algorithm falls in the latter, region-based approach, and isused when edge information is not good enough to segment the image.Although this algorithm’s concept originated from geology, it has also beenintroduced in the context of mathematical morphology.
Image data can be interpreted as a topographic surface where thegray levels represent altitudes. A catchments basin is defined as a region inwhich all points flow down and converge. The high-altitude region, corre-sponds to the watersheds, and the low-altitude region corresponds to thecatchments basins. If we consider a local region where all rainwater flowsto a single location, this might not seem to be applicable to intensity-basedimages, but it makes sense if the object is a gradient magnitude image. Inthis case, the catchments basins correspond to the homogeneous gray, levelregion, and the watersheds corresponds to the high-gradient region.
4.4.1. Basic Concept
There are two different approaches to watershed image segmen-tation. The first approach starts with finding a downstream path from eachpixel of the image to the regional minimum. The regional minimum isdefined as a point, which does not have a descending path in its neighbor-hood. We can define a point on a digital surface S as s(x, f (x)), s∈Z2BZ,where x∈Z2 represents the 2D location of the point and f (x)∈Z the altitudeof the point. A path on surface S can be defined as a sequence of points{si (xi , f (xi))}. If two points si and sj are on a descending path,
f (xi)⁄ f (xj) for i ¤ j (54)
is always true.

Image Processing-Based Mine Detection Techniques: A Review 191
In other words, a point s∈S belongs to a minimum if there is noexisting downstream path starting from s. A catchments basin is defined asa set of pixels for which all the downstream paths end up at the same mini-mum altitude. Each catchments basin represents a region of the segmentedimage. There are no general rules to uniquely define the downstream pathson digital surfaces, while its continuous counterpart is well-determined bycalculating local gradients.
The second approach is dual to the first. Instead of identifying thedownstream paths, the catchment basins are filled from the bottom [26,27].It is assumed that there is a hole in each local minimum, and the topo-graphic surface is immersed in water step by step. If two catchments basinsmerge as a result of further immersion, a dam is built all the way to thehighest surface altitude. The dam represents the watershed line. When theflooding reaches the highest level, only the dam, called the watershed line,remains.
4.4.2. Geodesic Functions
A digital, gray-tone image can be represented by a function,f: Z2→Z. The point of the space Z2 can be considered as the vertices of arectangular or hexagonal grid, and f (x) the gray value of the image at pointx. From now on, all spaces will be assumed as Z2 unless otherwise stated.
A section of f at level i is defined as
Xi ( f )G{ f (x) ¤ i} and Zi ( f )G{ f (x) ¤ 1} (55)
Their complementary relationship is also given as
Xi ( f )GZCiA1( f ) (56)
The distance between a point y in a region Y and the nearest pointof YC is defined as
d(y)Gdist(y, YC) for y∈Y (57)
where YC represents the complementary set of Y. A section of d at level i isgiven as
Xi (d )G{y: d(y) ¤ i}GY � Bi (58)
where Bi is a disk of radius i, and � represents morphological erosion[27,28].

192 Paik, Lee, and Abidi
Figure 24. An example of geodesic distance function; (a) the black dot represents a point xand the white H-shaped represents a region X, and (b) geodesic distance function from x withinX ; brightness is proportional to the geodesic distance.
Figure 23 shows an example of a distance function. A set of pointsY and the complementary set YC are given as the white and black areas in(a), respectively. The distance function of every point of Y to YC is shownin (b). The brightest area indicates the pixels with the maximum distance tothe complementary set.
Geodesic distance is the distance between two points within a setwhere the two points belong. The geodesic distance function, dX (x, y), isdefined as the length of the shortest path between x and y, where bothpoints exist in the set X. Figure 24 shows an example of geodesic distancefunction. There is a point x in the set X in (a). The black dot represents a
Figure 23. An example of a distance function; (a) a binary image and (b) its distance function.

Image Processing-Based Mine Detection Techniques: A Review 193
pixel x, and the white H-shaped region represents the set X. The geodesicdistance function from the point x to an arbitrary point y in the set X isrepresented as a gray level as shown in (b). The brighter values representthe longer distances. The dotted line indicates the same Euclidean distance.Since the paths toward the right-hand part of the H-shaped region have totake a bypass, the distance to the upper left-hand part of the H-shapedregion is relatively shorter than to the right-hand part, while the Euclideandistance is the same.
4.4.3. Reconstruction
Letting Y be any set, included in X, the set of all the points in X ata finite geodesic distance from Y can be computed as
RX (Y )G{x∈X: ∃y∈Y, dX (x, y) ≠S} (59)
RX (Y ) is called the X-reconstructed set by the marker set Y [28,29]. This setconsists of all the connected components of X, centered at Y.
Two gray image functions f and g are considered in the same waywith the condition f⁄g. The corresponding sections of these two functionsat level i are Xi (g) and Xi ( f ). Since f⁄g, Xi ( f ) is obviously included inXi (g). For every level i, a new set can be obtained by reconstructing Xi (g)using Xi ( f ) as a marker. The new sets, RXi (g) (Xi ( f )), define a group ofembedded sections of a new function, called the reconstruction of g by f,and is denoted as Rg ( f ). The dual reconstruction of g by f, under the con-dition f ¤ g, is denoted as R*g ( f ). This procedure is obtained by recon-structing the sections Zi (g) using Z( f ) as a marker. Xi ( f ) and Zi ( f ) arecomplementary to each other as indicated in (56). This procedure and itsdual reconstruction processes extract the regional maximum and minimum,respectively.
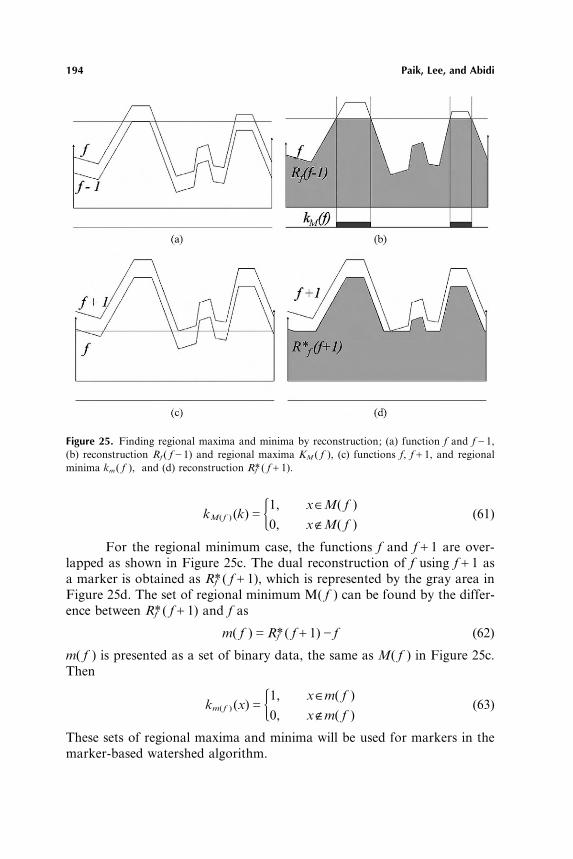
In order to find the regional maximum, the function f and fA1 areoverlapped. Figure 25a shows the vertical slice of the overlapped functions.Then, the reconstruction of f using fA1 as a marker is obtained as Rf ( fA1).This is the white area shown in Figure 25b. Since the profile shown in Figure25 is a slice of a two-dimensional gray level image, the actual shape ofRf ( fA1) has a volume. The set of local maximum M( f ) can be found bythe difference between the function f and Rf ( fA1) as
M( f )GfARf ( fA1) (60)
M( f ) can be considered as the dark gray area shown in Figure 25b,and has the following relationships
194 Paik, Lee, and Abidi
Figure 25. Finding regional maxima and minima by reconstruction; (a) function f and fA1,(b) reconstruction Rf ( fA1) and regional maxima KM ( f ), (c) functions f, fC1, and regionalminima km ( f ), and (d) reconstruction R*f ( fC1).
kM( f ) (k)G�1, x∈M( f )
0, x∉M( f )(61)
For the regional minimum case, the functions f and fC1 are over-lapped as shown in Figure 25c. The dual reconstruction of f using fC1 asa marker is obtained as R*f ( fC1), which is represented by the gray area inFigure 25d. The set of regional minimum M( f ) can be found by the differ-ence between R*f ( fC1) and f as
m( f )GR*f ( fC1)Af (62)
m( f ) is presented as a set of binary data, the same as M( f ) in Figure 25c.Then
km( f ) (x)G�1, x∈m( f )
0, x∉m( f )(63)
These sets of regional maxima and minima will be used for markers in themarker-based watershed algorithm.
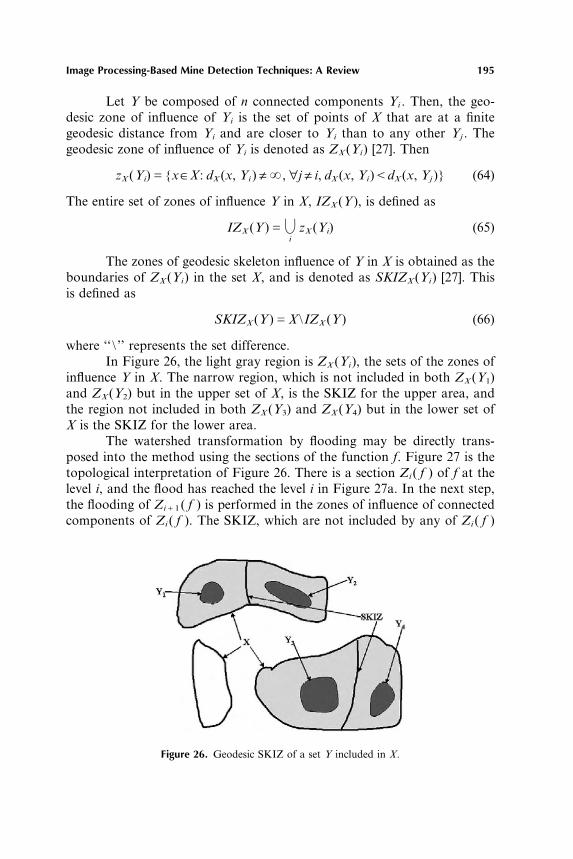
Image Processing-Based Mine Detection Techniques: A Review 195
Let Y be composed of n connected components Yi . Then, the geo-desic zone of influence of Yi is the set of points of X that are at a finitegeodesic distance from Yi and are closer to Yi than to any other Yj . Thegeodesic zone of influence of Yi is denoted as ZX (Yi) [27]. Then
zX (Yi)G{x∈X: dX (x, Yi ) ≠S, ∀j ≠ i, dX (x, Yi)FdX (x, Yj )} (64)
The entire set of zones of influence Y in X, IZX (Y ), is defined as
IZX (Y )G*i
zX (Yi) (65)
The zones of geodesic skeleton influence of Y in X is obtained as theboundaries of ZX (Yi) in the set X, and is denoted as SKIZX (Yi) [27]. Thisis defined as
SKIZX (Y )GX \IZX (Y ) (66)
where ‘‘ \ ’’ represents the set difference.In Figure 26, the light gray region is ZX (Yi), the sets of the zones of
influence Y in X. The narrow region, which is not included in both ZX (Y1)and ZX (Y2) but in the upper set of X, is the SKIZ for the upper area, andthe region not included in both ZX (Y3) and ZX (Y4) but in the lower set ofX is the SKIZ for the lower area.
The watershed transformation by flooding may be directly trans-posed into the method using the sections of the function f. Figure 27 is thetopological interpretation of Figure 26. There is a section Zi ( f ) of f at thelevel i, and the flood has reached the level i in Figure 27a. In the next step,the flooding of ZiC1( f ) is performed in the zones of influence of connectedcomponents of Zi ( f ). The SKIZ, which are not included by any of Zi ( f )
Figure 26. Geodesic SKIZ of a set Y included in X.
196 Paik, Lee, and Abidi
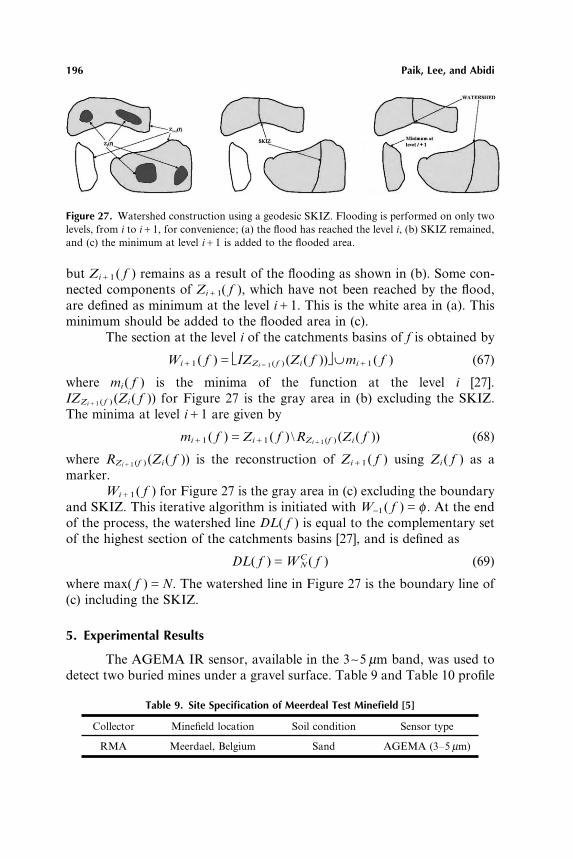
Figure 27. Watershed construction using a geodesic SKIZ. Flooding is performed on only twolevels, from i to iC1, for convenience; (a) the flood has reached the level i, (b) SKIZ remained,and (c) the minimum at level iC1 is added to the flooded area.
but ZiC1( f ) remains as a result of the flooding as shown in (b). Some con-nected components of ZiC1( f ), which have not been reached by the flood,are defined as minimum at the level iC1. This is the white area in (a). Thisminimum should be added to the flooded area in (c).
The section at the level i of the catchments basins of f is obtained by
WiC1( f )GIZZiG1( f ) (Zi ( f ))∫∪miC1( f ) (67)
where mi ( f ) is the minima of the function at the level i [27].IZZiC1( f ) (Zi ( f )) for Figure 27 is the gray area in (b) excluding the SKIZ.The minima at level iC1 are given by
miC1( f )GZiC1( f ) \RZiC1(f ) (Zi ( f )) (68)
where RZiC1(f ) (Zi ( f )) is the reconstruction of ZiC1( f ) using Zi ( f ) as amarker.
WiC1( f ) for Figure 27 is the gray area in (c) excluding the boundaryand SKIZ. This iterative algorithm is initiated with W−1 ( f )Gφ . At the endof the process, the watershed line DL( f ) is equal to the complementary setof the highest section of the catchments basins [27], and is defined as
DL( f )GWCN ( f ) (69)
where max( f )GN. The watershed line in Figure 27 is the boundary line of(c) including the SKIZ.
5. Experimental Results
The AGEMA IR sensor, available in the 3∼5 µm band, was used todetect two buried mines under a gravel surface. Table 9 and Table 10 profile
Table 9. Site Specification of Meerdeal Test Minefield [5]
Collector Minefield location Soil condition Sensor type
RMA Meerdael, Belgium Sand AGEMA (3–5 µm)
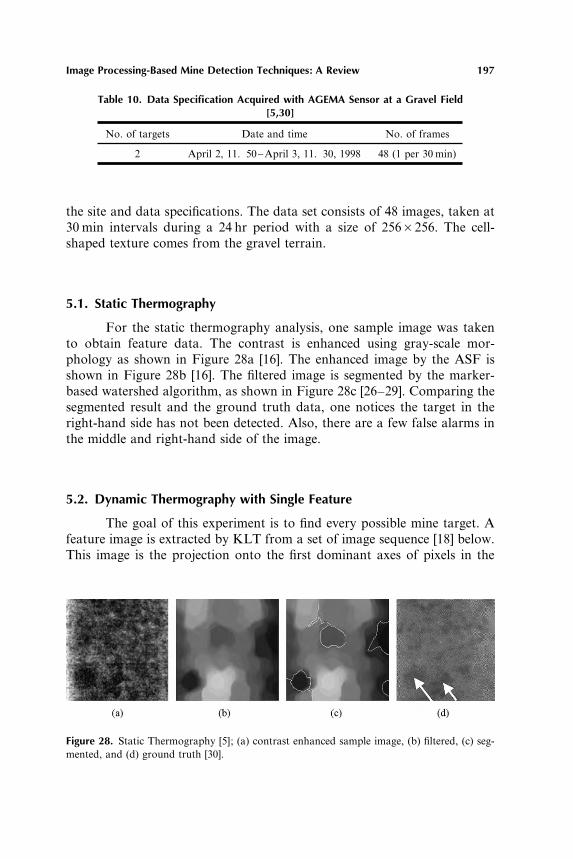
Image Processing-Based Mine Detection Techniques: A Review 197
Table 10. Data Specification Acquired with AGEMA Sensor at a Gravel Field[5,30]
No. of targets Date and time No. of frames
2 April 2, 11. 50∼April 3, 11. 30, 1998 48 (1 per 30 min)
the site and data specifications. The data set consists of 48 images, taken at30 min intervals during a 24 hr period with a size of 256B256. The cell-shaped texture comes from the gravel terrain.
5.1. Static Thermography
For the static thermography analysis, one sample image was takento obtain feature data. The contrast is enhanced using gray-scale mor-phology as shown in Figure 28a [16]. The enhanced image by the ASF isshown in Figure 28b [16]. The filtered image is segmented by the marker-based watershed algorithm, as shown in Figure 28c [26–29]. Comparing thesegmented result and the ground truth data, one notices the target in theright-hand side has not been detected. Also, there are a few false alarms inthe middle and right-hand side of the image.
5.2. Dynamic Thermography with Single Feature
The goal of this experiment is to find every possible mine target. Afeature image is extracted by KLT from a set of image sequence [18] below.This image is the projection onto the first dominant axes of pixels in the
Figure 28. Static Thermography [5]; (a) contrast enhanced sample image, (b) filtered, (c) seg-mented, and (d) ground truth [30].
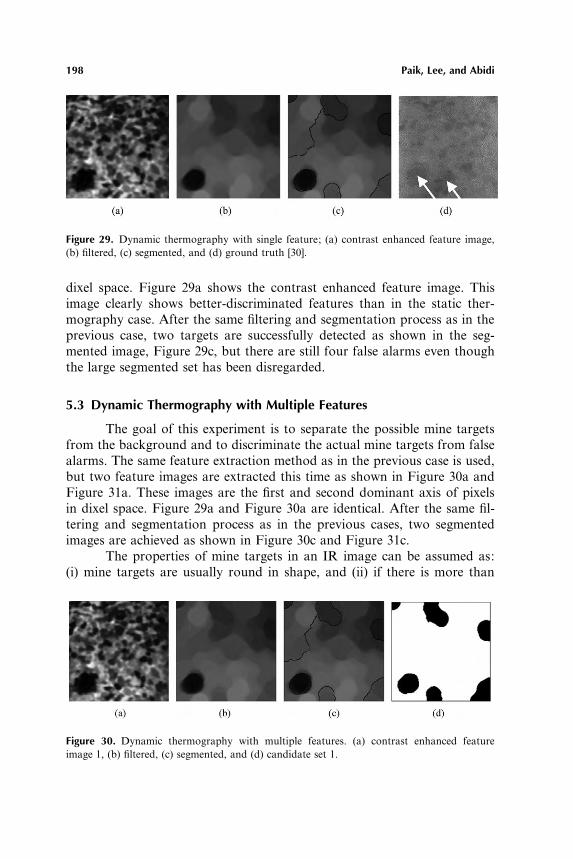
198 Paik, Lee, and Abidi
Figure 29. Dynamic thermography with single feature; (a) contrast enhanced feature image,(b) filtered, (c) segmented, and (d) ground truth [30].
dixel space. Figure 29a shows the contrast enhanced feature image. Thisimage clearly shows better-discriminated features than in the static ther-mography case. After the same filtering and segmentation process as in theprevious case, two targets are successfully detected as shown in the seg-mented image, Figure 29c, but there are still four false alarms even thoughthe large segmented set has been disregarded.
5.3 Dynamic Thermography with Multiple Features
The goal of this experiment is to separate the possible mine targetsfrom the background and to discriminate the actual mine targets from falsealarms. The same feature extraction method as in the previous case is used,but two feature images are extracted this time as shown in Figure 30a andFigure 31a. These images are the first and second dominant axis of pixelsin dixel space. Figure 29a and Figure 30a are identical. After the same fil-tering and segmentation process as in the previous cases, two segmentedimages are achieved as shown in Figure 30c and Figure 31c.
The properties of mine targets in an IR image can be assumed as:(i) mine targets are usually round in shape, and (ii) if there is more than
Figure 30. Dynamic thermography with multiple features. (a) contrast enhanced featureimage 1, (b) filtered, (c) segmented, and (d) candidate set 1.
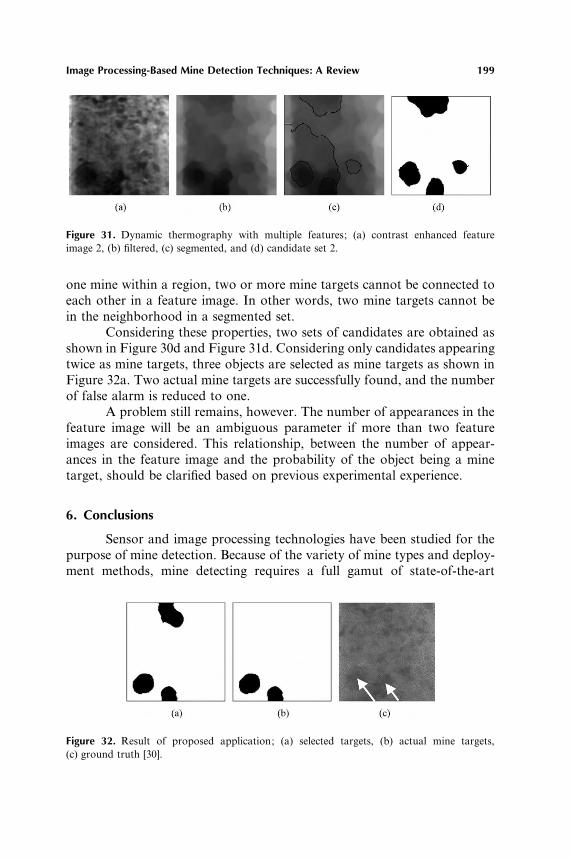
Image Processing-Based Mine Detection Techniques: A Review 199
Figure 31. Dynamic thermography with multiple features; (a) contrast enhanced featureimage 2, (b) filtered, (c) segmented, and (d) candidate set 2.
one mine within a region, two or more mine targets cannot be connected toeach other in a feature image. In other words, two mine targets cannot bein the neighborhood in a segmented set.
Considering these properties, two sets of candidates are obtained asshown in Figure 30d and Figure 31d. Considering only candidates appearingtwice as mine targets, three objects are selected as mine targets as shown inFigure 32a. Two actual mine targets are successfully found, and the numberof false alarm is reduced to one.
A problem still remains, however. The number of appearances in thefeature image will be an ambiguous parameter if more than two featureimages are considered. This relationship, between the number of appear-ances in the feature image and the probability of the object being a minetarget, should be clarified based on previous experimental experience.
6. Conclusions
Sensor and image processing technologies have been studied for thepurpose of mine detection. Because of the variety of mine types and deploy-ment methods, mine detecting requires a full gamut of state-of-the-art
Figure 32. Result of proposed application; (a) selected targets, (b) actual mine targets,(c) ground truth [30].

200 Paik, Lee, and Abidi
technologies, which includes sensors, signal and image processing, real-timehardware, and numerical optimization techniques, to name a few.
As the image processing techniques have received more attention inthe related application areas, various image processing methods have beenproposed for mine detection. This paper reviewed and summarized the up-to-date signal and image processing techniques that have been applied tothe mine detection area.
Mines can be classified into: (i) anti-personnel and (ii) anti-tankmines, based on the target. Together with these two major types of mine,three different sensors: GPR, IR, and US sensors, have been introducedand summarized.
After the sensing process, a final decision on mine existence is madewith the help of image processing. Various sensors give different signals.The sensor output is considered as a two or a higher dimensional signal,and image processing techniques are applied to enhance and identify theshape of a target mine.
Image processing techniques for mine detection have been classifiedinto filtering, feature extraction, and contrast enhancement categories. Forremoving noise and undesired components in the sensor image, two differ-ent filters were introduced. The Wiener filter is a signal-dependent filter thatrestores the original signal by minimizing the mean square error betweenthe estimated and the original signals. The morphological filter canefficiently remove noise by combining multiple morphological operations,and can also provide more complicated processing such as gradient extrac-tion, contrast enhancement, and segmentation.
Extracting mine-like shapes from the sensor image is a crucial taskin the mine detection process. The Karhunen–Loeve transformation takesdynamic infrared image sequences, and represents the input image using areduced set of basis images with minimized representation error. TheKitller–Young transformation compensates for the weak noise discrimi-nation ability of KLT by normalizing the variance within the classes. Thereason for choosing IR data is not that IR is more popular or importantthan EM, but that IR data is easier to explain how to apply general imageprocessing techniques. Although we provided experimental results withemphasis on IR data, it is straightforward to extend the similar image pro-cessing techniques to EM or US data.
The most serious problem in mine-detection applications is the ambi-guity of the target signal due to low contrast. In order to enhance contrast,morphological contrast enhancement and histogram equalization methodshave been surveyed. Although these two methods are used in general imageprocessing applications, specific mine signals have been used to evaluateperformance of the two methods.

Image Processing-Based Mine Detection Techniques: A Review 201
Many research groups have developed new detection devices withmultiple sensors, and also the corresponding technology, called sensorfusion, to combine outputs from multiple sensors. This survey will serve asa signal and image processing background to better aid in understanding ofexisting technologies and in developing new technologies for mine detection.
References
1. The United Nations Mine Action Services, http:��www.un.org�Depts�dpko�mine2. U.S. Department of State, 1998, Hidden killers 1998: The global landmine crisis, Bureau
of Political–Military Affairs, Office of Humanitarian Demining Programs.3. Sieber, A., 1995, Localization and identification of anti-personnel mines, European Com-
mission Joint Research Center International Workshop.4. E-OIR of USA, 1998, Fort Belvoir Minefield in Virginia.5. The Royal Military Academy of Belgium, 1998, Meerdaal test minefield in Belgium.6. Landmine database of the Norwegian peoples aid mine actions in Angola; http:��
www.angola.npaid.org�7. Machler, P., 1995, Detection technologies for anti-personnel mines, Proc. Symposium on
Autonomous Vehicles in Mine Countermeasures, v. 6, p. 150–54.8. Kempen, L., 1997, Physical principles for anti-personnel mine detection: A survey of three
sensing principles: Technical Report, IRIS-TR-0047, Department of Electronics and Infor-mation Processing, Vrije Universiteit Brussel.
9. Ekstein, R., 1997, Anti-personnel mine detection signal processing and detection principles,MS Thesis, Department of Electronics and Information Processing, Vrije UniversiteitBrussel.
10. L. Kempen, L. and Sahli, H., 1999, Ground penetrating radar data processing: A selectivesurvey of the state of the art literature: Technical Report, IRIS-TR-0060, Department ofElectronics and Information Processing, Vrije Universiteit Brussel.
11. UWBGPR measurement at the Royal Military Academy, 1999, Belgium.12. Brooks, J., Kempen, L., and Sahli, H., 1999, Ground penetration radar data processing:
Clutter characterization and remova: Technical Report, IRIS-TR-0059, Department ofElectronics and Information Processing, Vrije Universiteit Brussel.
13. Peters Jr., L., Daniels, J., and Young, J., 1994, Ground penetrating radar as subsurfaceenvironmental sensing tools, Proc. IEEE International Conference, v. 82, no. 12, p. 1802–1822.
14. Acheroy, M., Piette, M., Baudoin, Y., and Salmon, J., 2000, Belgian project on Humani-tarian Demining (HUDEM) Sensor Design and Signal Processing Aspects.
15. Kempen, L., Katarzin, A., Pizurion, Y., Corneli, C., and Sahli, H., 1999, Digital signal�image processing for mine detection, Part 2: Ground based approach, Proc. Euro Confer-ence on Sensor Systems and Signal Processing Techniques applied to the Detection ofMines and Unexploded Ordnance, p. 54–59.
16. Ederra, G., 1999, Mathematical morphology techniques applied to anti-personnel minedetection, MS Thesis, Department of Electronics and Information Processing, Vrije Univ-ersiteit Brussel.
17. Bruschini, C. and Gros, B., 1997, A Survey of current sensor technology research forthe detection of landmines, Proc. International Workshop on Sustainable HumanitarianDemining, v. 6, p. 18–27.

202 Paik, Lee, and Abidi
18. Kempen, L., Kaczmarec, M., Sahli, H., and Cornelis, J., 1998, Dynamic infrared imagesequence analysis for anti-personnel mine detection, Proc. IEEE Benelux Signal ProcessingChapter, Signal Processing Symposium, p. 215–218.
19. Russell, K., McFee, J., and Sirovyak, W., 1997, Remote performance prediction for infra-red imaging of buried mines, Proc. SPIE Detection and Remediation Technologies forMines and Minelike Targets II, v. 3079, p. 762–769.
20. Thermal neutron analysis, Ancore Inc., http:��www.ancore.com21. Schachne, M., Kempen, L., Milojevic, D., Sahli, H., Ham, Ph., Acheroy, M., and Cornelis,
J., 1998, Mine detection by means of dynamic thermography: Simulation and experiments,Proc. IEE 2nd International Conference on the Detection of Abandoned Landmines,p. 124–128.
22. Gonzalez, R. and Woods, R., 1992, Digital image processing, Addison-Wesley.23. Jain, A. K., 1989, Fundamentals of digital image processing, Prentice-Hall.24. Heijimans, H., 1994, Morphological image operators, Academic Press.25. Theodoridis, S. and Koutroumbas, K. 1998, Pattern recognition, Academic Press.26. Beucher, S. and Lantuejoul, C., 1979, Use of watershed in contour detection, Proc. Inter-
national Workshop on Image Processing: Real Time Edge and Motion Detection andEstimation.
27. Beucher, S., 1991, The watershed transformation applied to image segmentation, Proc.10th Conference on Signal and Image Processing in Microscopy and Microanalysis.
28. Dougherty, E., 1992, Mathematical morphology in image processing, Marcel Dekker.29. Roerdink, J. and Meijster, A., 2000, The watershed transform: Definitions, algorithms,
and parallel strategies: Fundamenta Informaticae, v. 41, p. 187–228.30. Verlinde, P., Acheroy, M., and Baudoin, Y., 2001, The Belgian Humanitarian Demining
Project (HUDEM) and the European Research Context, Proc. Chiba University Workshopon Humanitarian Demining.
Related Documents