Roberto Basili, Fabrizio Sebastiani, Giovanni Semeraro (Eds.) Proceedings of the Fourth Italian Information Retrieval Workshop IIR 2013 National Council of Research campus, Pisa, Italy 16 – 17 January 2013 http://iir2013.isti.cnr.it/

Welcome message from author
This document is posted to help you gain knowledge. Please leave a comment to let me know what you think about it! Share it to your friends and learn new things together.
Transcript

Roberto Basili, Fabrizio Sebastiani, Giovanni Semeraro (Eds.)
Proceedings of the Fourth Italian Information Retrieval Workshop
IIR 2013
National Council of Research campus, Pisa, Italy 16 – 17 January 2013 http://iir2013.isti.cnr.it/

This volume is published and copyrighted by:
Roberto Basili
Fabrizio Sebastiani
Giovanni Semeraro
ISSN 1613‐0073
Copyright © 2013 for the individual papers by the papers' authors. Copying permitted only for
private and academic purposes. Re‐publication of material from this volume requires permission
by the copyright owners.

Table of Contents
Preface . . . . . . . . . . . . . . . . . . . . . . . . . . . . . . . . . . . . . . . . . . . . . . . . . . . . . . . . . . . . . . . . . . . . v Organization . . . . . . . . . . . . . . . . . . . . . . . . . . . . . . . . . . . . . . . . . . . . . . . . . . . . . . . . . . . . . . . . vi
THEORY
Are There New BM25 Expectations? Emanuele Di Buccio, Giorgio Maria Di Nunzio . . . . . . . . . . . . . . . . . . . . . . . . . . . . . . . . . . .
1
The Bivariate 2-Poisson Model for IR Giambattista Amati, Giorgio Gambosi . . . . . . . . . . . . . . . . . . . . . . . . . . . . . . . . . . . . . . . . .
13
QUERY LANGUAGES & OPERATIONS
A Query Expansion Method based on a Weighted Word Pairs Approach Luca Greco, Massimo De Santo, Paolo Napoletano, Francesco Colace . . . . . . . . . . . . . . . .
17
A Flexible Extension of XQuery Full-Text Emanuele Panzeri, Gabriella Pasi . . . . . . . . . . . . . . . . . . . . . . . . . . . . . . . . . . . . . . . . . . . . .
29
Towards a Qualitative Analysis of Diff Algorithms Gioele Barabucci, Paolo Ciancarini, Angelo Di Iorio, Fabio Vitali . . . . . . . . . . . . . . . . . . . . .
33
On Suggesting Entities as Web Search Queries Diego Ceccarelli, Sergiu Gordea, Claudio Lucchese, Franco Maria Nardini, Raffaele Perego
37
IMAGE RETRIEVAL
Visual Features Selection Giuseppe Amato, Fabrizio Falchi, Claudio Gennaro . . . . . . . . . . . . . . . . . . . . . . . . . . . . . . .
41
Experimenting a Visual Attention Model in the Context of CBIR Systems Franco Alberto Cardillo, Giuseppe Amato, Fabrizio Falchi . . . . . . . . . . . . . . . . . . . . . . . . . .
45
EVALUATION
Cumulated Relative Position: A Metric for Ranking Evaluation Marco Angelini, Nicola Ferro, Kalervo Järvelin, Heikki Keskustalo, Ari Pirkola, Giuseppe Santucci, Gianmaria Silvello . . . . . . . . . . . . . . . . . . . . . . . . . . . . . . . . . . . . . . . . .
57
Visual Interactive Failure Analysis: Supporting Users in Information Retrieval Evaluation Marco Angelini, Nicola Ferro, Giuseppe Santucci, Gianmaria Silvello . . . . . . . . . . . . . . . . .
61
SOCIAL MEDIA AND INFORMATION RETRIEVAL
Myusic: a Content-based Music Recommender System based on eVSM and Social Media Cataldo Musto, Fedelucio Narducci, Giovanni Semeraro, Pasquale Lops, Marco de Gemmis . . . . . . . . . . . . . . . . . . . . . . . . . . . . . . . . . . . . . . . . . . . . . . . . . . . . . . . .
65
A Preliminary Study on a Recommender System for the Million Songs Dataset Challenge Fabio Aiolli . . . . . . . . . . . . . . . . . . . . . . . . . . . . . . . . . . . . . . . . . . . . . . . . . . . . . . . . . . . . . . .
73
Distributional Models vs. Linked Data: Exploiting Crowdsourcing to Personalize Music Playlists
Cataldo Musto, Fedelucio Narducci, Giovanni Semeraro, Pasquale Lops, Marco de Gemmis . . . . . . . . . . . . . . . . . . . . . . . . . . . . . . . . . . . . . . . . . . . . . . . . . . . . . . . .
84
SEMANTICS, NATURAL LANGUAGE AND APPLICATIONS
Opinion and Factivity Analysis of Italian Political Discourse Rodolfo Delmonte, Rocco Tripodi, Daniela Gifu . . . . . . . . . . . . . . . . . . . . . . . . . . . . . . . . . .
88
Distributional Semantics for Answer Re-ranking in Question Answering Piero Molino, Pierpaolo Basile, Annalina Caputo, Pasquale Lops, Giovanni Semeraro . . . . .
100
INSEARCH: A platform for Enterprise Semantic Search Diego De Cao, Valerio Storch, Danilo Croce, Roberto Basili . . . . . . . . . . . . . . . . . . . . . . . . .
104
Wikipedia-based Unsupervised Query Classification Milen Kouylekov, Luca Dini, Alessio Bosca, Marco Trevisan . . . . . . . . . . . . . . . . . . . . . . . . .
116

Preface
The purpose of the Italian Information Retrieval (IIR) workshop series is to provide a forum for stimulating
and disseminating research in information retrieval, where Italian researchers (especially young ones) and
researchers affiliated with Italian institutions can network and discuss their research results in an informal
way. IIR 2013 took place in Pisa, Italy, at the National Council of Research campus on January 16-17, 2013,
following the first three successful editions in Padua (2010), Milan (2011) and Bari (2012).
The contributions to IIR 2013 mainly address six relevant topics:
theory
query languages and operations
image retrieval
evaluation
social media and information retrieval
semantics, natural language and applications
Most submitted papers were from PhD students and early stage researchers. All the 24 submissions, both
full and short original papers presenting new research results, as well as extended abstracts containing
descriptions of ongoing projects or presenting already published results, were reviewed by two members of
the Program Committee and 18 contributions were selected for presentation on the basis of originality,
technical depth, style of presentation, and impact. Additionally to the presentations of these 18 submitted
papers, IIR 2013 featured two special events. The first was an invited talk by Renato Soru, CEO of Tiscali
SpA, in which the speaker addressed past, present, and future efforts by Tiscali to enter the Web search
market. In particular, Soru highlighted some new features of “istella”, the soon-to-be-announced Web
search engine by Tiscali, mainly addressed at covering the Italian Web space, with a special emphasis on
making Italy’s cultural heritage digitally available to a wide audience. The second special event was a panel
on EVALITA, an evaluation campaign which has been running biennially since 2007 and whose main goal is
the evaluation of natural language processing tools for Italian. Several EVALITA task organizers have
presented the main results obtained in the recent editions of the campaign and have discussed the
unresolved challenges that still lie ahead of researchers, with the aim of generating awareness about the
state-of-the-art in Italian NLP among IR researchers and of strengthening the relationships between the
two communities.
The present proceedings include the papers that were presented at IIR 2013. We hope they represent an
interesting contribution to IR research in Italy, and to IR research in general.
The Workshop Organisers
Roberto Basili University of Roma “Tor Vergata” (Program co-Chair)
Fabrizio Sebastiani ISTI-CNR (General Chair)
Giovanni Semeraro University of Bari Aldo Moro (Program co-Chair)
v

Organization
General Chair
Fabrizio Sebastiani (ISTI-CNR)
Program Chairs
Roberto Basili (University of Rome “Tor Vergata”)
Giovanni Semeraro (University of Bari Aldo Moro)
IIR Steering Committee
Gianni Amati (Fondazione Ugo Bordoni)
Claudio Carpineto (Fondazione Ugo Bordoni)
Massimo Melucci (University of Padua)
Stefano Mizzaro (University of Udine)
Gabriella Pasi (University of Milano Bicocca)
Giovanni Semeraro (University of Bari Aldo Moro)
Program Committee
Giambattista Amati (Fondazione Ugo Bordoni)
Giuseppe Amodeo (Almawave srl)
Pierpaolo Basile (University of Bari Aldo Moro)
Giacomo Berardi (ISTI-CNR, Pisa)
Gloria Bordogna (IDPA-CNR Dalmine, Bergamo)
Claudio Carpineto (Fondazione Ugo Bordoni)
Fabio Crestani (Università della Svizzera Italiana)
Danilo Croce (University of Roma “Tor Vergata”)
Marco de Gemmis (University of Bari Aldo Moro)
Pasquale De Meo (VU University, Amsterdam)
Giorgio Maria Di Nunzio (University of Padua)
Giorgio Gambosi (University of Roma “Tor Vergata”)
vi

Marco Gori (University of Siena)
Antonio Gulli (Microsoft)
Pasquale Lops (University of Bari Aldo Moro)
Marco Maggini (University of Siena)
Massimo Melucci (University of Padua)
Stefano Mizzaro (University of Udine)
Alessandro Moschitti (University of Trento)
Salvatore Orlando (University of Venezia)
Gabriella Pasi (University of Milano Bicocca)
Raffaele Perego (ISTI-CNR, Pisa)
Francesco Ricci (Free University of Bozen-Bolzano)
Fabrizio Silvestri (ISTI-CNR, Pisa)
Organizing Committee
Adriana Lazzaroni, IIT-CNR (Local Arrangements Chair)
Patrizia Andronico, IIT-CNR
Giacomo Berardi, ISTI-CNR (Webmaster)
Catherine Bosio, ISTI-CNR
Raffaella Casarosa, IIT-CNR
Giulio Galesi, ISTI-CNR
Additional Reviewers
Annalina Caputo (University of Bari Aldo Moro)
Piero Molino (University of Bari Aldo Moro)
Fedelucio Narducci (University of Milano Bicocca)
vii
Are There New BM25 “Expectations”?
Emanuele Di Buccio and Giorgio Maria Di Nunzio
Dept. of Information Engineering – University of Padua[dibuccio,dinunzio]@dei.unipd.it
Abstract. In this paper, we present some ideas about possible directionsof a new interpretation of the Okapi BM25 ranking formula. In particular,we have focused on a full bayesian approach for deriving a smoothedformula that takes into account a-priori knowledge on the probability ofterms. In fact, most of the efforts in improving the BM25 were done incapturing the language model (frequencies, length, etc.) but missed thefact that the constant equal to 0.5 used as a correction factor can be oneof the parameters that can be modelled in a better way. This approachhas been tested on a visual data mining tool and the initial results areencouraging.
1 Introduction
The relevance weighting model, also known as RSJ by the name of its creators(Roberston and Sparck-Jones), has been one of the most influential model in thehistory of Information Retrieval [1]. It is a probabilistic model of retrieval thattries to answer the following question:
What is the probability that this document is relevant to this query?
‘Query’ is a particular instance of an information need, and ‘document’ a partic-ular content description. The purpose of this question is to rank the documentsin order of their probability of relevance according the Probability Ranking Prin-ciple [2]:
If retrieved documents are ordered by decreasing probability of relevanceon the data available, then the system’s effectiveness is the best to begotten for the data.
The probability of relevance is achieved by assigning weights to terms, the RSJweight hereafter named as wi, according to the following formula:
wi = logpi
(1− p1)
(1− qi)qi
, (1)
where pi is the probability that the document contains the term ti given thatthe document is relevant, and qi is the probability that the document containsthe term ti given that the document is not relevant. If the estimates of these
1

probabilities are computed by means of a maximum likelihood estimation, weobtain the following results:
pi =riR
(2)
qi =ni − riN −R
(3)
where ri is the number of relevant documents that contain term ti, ni the numberof documents that contain term ti, R and N the number of relevant documentsand the total number of documents, respectively. However, this estimation leadsto arithmetical anomalies; for example, if a term is not present in the set ofrelevant documents, its probability pi is equal to zero and the logarithm of zerowill return a minus infinity. In order to avoid this situation, a kind of smoothingis applied to the probabilities. By substituting Equation 2 and 3 in Equation 1and adding a constant to smooth probabilities, we obtain:
wi = logri + 0.5
(R− ri + 0.5)
(N −R− ni + ri + 0.5)
ni − ri + 0.5, (4)
which is the actual RSJ score for a term. The choice of the constant 0.5 mayresemble some Bayesian justification related to the binary independence model.1
This idea is wrong, as Robertson and Sparck Jones explained in [3], and the realjustification can be traced back to the work of Cox [4].
The Okapi BM25 weighting schema takes a step further and introduces theproperty of eliteness [5]:
Assume that each term represent a concept, and that a given documentis about that concept or not. A term is ‘elite’ in the document or not.
BM25 estimates the full eliteness weight for a term from the RSJ score, thenapproximates the term frequency behaviour with a single global parameter con-trolling the rate of approach. Finally, it makes a correction for document length.For a full explanation of how to interpret eliteness and integrate it into the BM25formula read [6–9]. The resulting formula is summarised in the following way:
w′i = f(tfi) · wi (5)
where wi is the RSJ weight, and f(tfi) is a function of the frequency of the termti parametrized by global parameters.
In this paper, we concentrate on the RSJ weight and in particular to a fullBayesian approach for smoothing the probabilities and on a visual data analysisto assess the effectiveness of these new smoothed probabilities. In Section 2, wepresent the Bayesian framework, then in Section 3 we describe the visualisationapproach; in Section 4, we describe the initial experiments on this approach.Some final remarks are given in Section 5.
1 In this model; documents are represented as binary vectors: a term may be eitherpresent or not in a document and have a ‘natural’ a priori probability of 0.5.
2
2 Bayesian Framework
In Bayesian inference, a problem is described by a mathematical model M withparameters θ and, when we have observed some data D, we use Bayes’ rule todetermine our beliefs across different parameter values θ [10]:
P (θ|D,M) =P (D|θ,M)P (θ|M)
P (D|M), (6)
the posterior distribution of our belief on θ is equal to a likelihood functionP (D|θ,M), the mathematical model of our problem, multiplied by a prior dis-tribution P (θ|M), our belief in the values of the parameters of the model, andnormalized by the probability of the data P (D|M). We control the prior bychoosing its distributional form along with its parameters, usually called hyper-parameters. Since the product between P (D|θ,M) and P (θ|M) can be hardto calculate, one solution is to find a “conjugate” prior of the likelihood func-tion [10].
In the case of a likelihood function which belongs to the exponential family,there always exists a conjugate prior. Naıve Bayes (NB) models have a likeli-hood of this type and, since the RSJ weight is related to the Binary Indepen-dence Model which is a multi-variate Bernoulli NB model, we can easily derivea formula to estimate the parameter θ. The multi-variate Bernoulli NB modelrepresents a document d as a vector of V (number of words in the vocabulary)Bernoulli random variables d = (t1, ..., ti, ..., tV ) such that:
ti ∼ Bern(θti) . (7)
We can write the probability of a document by using the NB assumption as:
P (d|θ) =V∏k=1
ti =V∏k=1
θxki (1− θi)1−xk , (8)
where xi is a binary value that is equal either to 1 when the term ti is presentin the document or to 0 otherwise. With a Maximum Likelihood estimation, wewould end up with the result shown in Equation 2 and 3; instead, we want tointegrate the conjugate prior which in this case of a Bernoulli random variableis the beta function:
betai = θα−1i (1− θi)β−1 , (9)
where i refers to the ith random variable ti. Therefore, the new estimate of theprobability of a term ti that takes into account the prior knowledge is givenby the posterior mean of Eq. 6 (see [10] for the details of this result). For therelevant documents we obtain:
θti|rel =ri + α
R+ α+ β= pi , (10)
where pi is the new estimate of the probability pi. Accordingly, the probabilityof a term in the non-relevant documents is:
θti|rel =ni − ri + α
N −R+ α+ β= qi . (11)
3

With this formula, we can recall different smoothing approaches; for example,with α = 0 and β = 0 we obtain the Maximum Likelihood Estimation, withα = 1, β = 1 the Laplace smoothing. We can even recall the RSJ score byassigning α = 0.5 and β = 0.5.
3 Probabilistic Visual Data Mining
Now that we have new estimates for the probabilities pi and qi, we need a wayto assess how the parameters α and β influence the effectiveness of the retrievalsystem. In [11, 12], we presented a visual data mining tool for analyzing thebehavior of various smoothing methods, to suggest possible directions for findingthe most suitable smoothing parameters and to shed the light into new methodsof automatic hyper-parameters estimation. Here, we use the same approach foranalyzing a simplified version of the BM25 (that is Equation 5 ignoring the termfrequency function).
In order to explain the visual approach, we present the problem of retrievalin terms of a classification problem: classify the documents as relevant or nonrelevant. Given a document d and a query q, we consider d relevant if:
P (rel|d, q) > P (rel|d, q) , (12)
that is when the probability of being relevant is higher compared to the proba-bility of not being relevant. By using Bayes rule, we can invert the problem anddecide that d is relevant when:
P (d|rel, q)P (rel|q) > P (d|rel, q)P (rel|q) . (13)
Note that we are exactly in the same situation of Equation (2.2) of [9] where:
P (rel|d, q) ∝ P (d|rel, q)P (rel|q)P (d|rel, q)P (rel|q)
. (14)
In fact, if we divide both members of Equation 13 by P (d|rel, q)P (rel|q) (weassume that this quantity is strictly greater than zero), we obtain:
P (d|rel, q)P (rel|q)P (d|rel, q)P (rel|q)
> 1 , (15)
where the ranking of the documents is given by the value of the ratio on the left(as in the BM25); moreover, we can classify a document as ‘relevant’ if this ratiois greater than one.
The main idea of the two-dimensional visualization of probabilistic modelis to maintain the two probabilities separated and use the two numbers as twocoordinates, X and Y, on the cartesian plane:
P (d|rel, q)P (rel|q)︸ ︷︷ ︸X
> P (d|rel, q)P (rel|q)︸ ︷︷ ︸Y
. (16)
4

If we take the logs, a monotonic transformation that maintains the order, and ifwe model the document as a multivariate binomial (as in the Binary Indepen-dence Model [1]), we obtain for the coordinate X:∑
i∈Vxi log
(pi
1− pi
)+∑i∈V
log(1− pi)︸ ︷︷ ︸P (d|rel,q)
+ log(P (rel|q))︸ ︷︷ ︸P (rel|q)
. (17)
Since we are using the Bayesian estimate pi, we can modulate it by adjustingthe hyper parameters α and β of Equation 10. If we want to consider the termsthat appear in the query, the first sum is computed over the terms i ∈ q, whichcorresponds to Equation (2.6) of [9].
We intentionally maintained explicit the two addends that are independentof the document, respectively
∑i∈V log(1 − pi) and log(P (rel|q)). These two
addends do not influence the ordering among documents (it is a constant factorindependent of the document) but they can (and they actually do) affect theclassification performance. If we rewrite the complete inequality and substitutethese addends with constants we obtain: 2
∑i∈q
xi log
(pi
1− pi
)+ c1 >
∑i∈q
xi log
(qi
1− qi
)+ c2 (18)
∑i∈q
xi log
(pi
1− pi
)−∑i∈q
xi log
(qi
1− qi
)> c2 − c1 (19)
∑i∈q
xi log
(pi
1− pi1− qiqi
)︸ ︷︷ ︸
RSJ
> c2 − c1 (20)
that is exactly the same formulation of the RSJ weight with new estimates for piand qi, plus some indication about whether we classify a document as relevantor not.
3.1 A simple example
Let us consider a collection of 1,000 documents, suppose that we have a querywith two terms, q = {t1, t2}, and the following estimates:
p1 =3 + α
10 + α+ β, q1 =
17 + α
990 + α+ β,
p2 =2 + α
10 + α+ β, q2 =
15 + α
990 + α+ β,
which means that we have
2 Note that we need to investigate how this reformulation is related to Cooper’s linkeddependence assumption [13].
5

– 10 relevant document (R = 10) for this query;– 20 documents that contain term t1 (n1 = 20) and three of them are known
to be relevant (r1 = 3);– 17 documents that contain term t2 (n2 = 17) and two of them are known to
be relevant (r2 = 2).
For the log odds, we have:
φ1 = log
(p1
1− p1
)= log
(3 + α
7 + β
), ψ1 = log
(q1
1− q1
)= log
(17 + α
973 + β
),
φ2 = log
(p2
1− p2
)= log
(2 + α
8 + β
), ψ2 = log
(q2
1− q2
)= log
(15 + α
975 + β
).
Suppose that we want to rank two document d1 and d2, where d1 contains bothterms t1 and t2, while d2 contains only term t1. Let us draw the points in thetwo-dimensional space, we assume the two constants c1 and c2 equal to zero:
Xd1 = x1,d1 ∗ φ1 + x2,d1 ∗ φ2 = 1 ∗ φ1 + 1 ∗ φ2 ' −2.86,
Yd1 = x1,d1 ∗ ψ1 + x2,d1 ∗ ψ2 = 1 ∗ ψ1 + 1 ∗ ψ2 ' −11.77,
Xd2 = x1,d2 ∗ φ1 + x2,d2 ∗ φ2 = 1 ∗ φ1 + 0 ∗ φ2 ' −1.10,
Yd2 = x1,d2 ∗ ψ1 + x2,d2 ∗ ψ2 = 1 ∗ ψ1 + 0 ∗ ψ2 ' −5.80
where xi,dj = 1 if term ti occurs in document dj , xi,dj = 0 otherwise.In Figure 1, the two points (Xd1 , Yd1) and (Xd2 , Yd2) are shown. The line
is a graphical help to indicate which point is ranked first: the closer the point,the higher the document in the rank. The justification of this statement is notpresented in this paper for space reasons, refer to [14] for further details. Whatis important here is the possibility to assess the influence of the parameter α andβ on the RSJ score. The objective is to study whether these two parameters candrastically change the ranking of the documents or not. In graphical terms, if wecan “rotate” the points such that the closest to the line becomes the furthest.
Moreover, there are some considerations we want to address:
– when the number of terms in the query is small, it is very difficult to noteany change in the ranking list. Remember that with ‘n’ query terms, we canonly have 2n points (or RSJ scores). In the event of a query constituted of asingle term, all the documents that contain that query term collapse in onepoint.
– the Okapi BM25 weight ‘scatters’ the documents that are collapsed in onepoint in the space by multiplying the RSJ score with a scaling factor f(tfi)proportional to the frequency of the term in the document. Therefore, weexpect this Bayesian approach to be more effective on the BM25 rather thanon the simple RSJ score.
3.2 Visualization Tool
The visualisation tool was designed and developed in R [15]. It consists of threepanels:
6

−20 −15 −10 −5 0
−20
−15
−10
−5
0
X
Y
Fig. 1: Example for the documents d1 and d2 represented respectively by thepoints (Xd1 , Yd1) and (Xd2 , Yd2).
– View Panel : this displays the two-dimensional plot of the dataset accordingto the choices of the user.
– Interaction Panel : this allows for the interaction between the user and theparameters of the probabilistic models.
– Performance Panel : this displays the performance measures of the model.
Figure 2 shows the main window with the three panels. In the centre-right,there is the main view panel, the actual two-dimensional view of the documentsas points, blue and red for relevant and non-relevant, respectively. The greenline represents the ranking line, the closer the point the higher the rank in theretrieval list. At the top and on the left, there is the interaction panel wherethe user can choose different options: the type of the model (Bernoulli in ourcase), the type of smoothing (conjugate prior), the value of the parameters αand β. The bottom of the window is dedicated to the performance in terms ofclassification (not used in this experiment).
7

Fig. 2: Two-dimensional visualization tool: Main window.
4 Preliminary Experiments
Preliminary experiments were carried out on some topics of the TREC2001 Ad-hoc Web Track test collection.3 The content of each document was processedduring indexing except for the text contained inside the <script></script>
and the <style></style> tags. When parsing, the title of the document wasextracted and considered as the beginning of the document content. Stop wordswere removed during indexing.4 For each topic we considered the set of docu-ments in the pool, therefore those for which explicit assessment are available.
We considered two different experimental settings: (i) query-term based rep-resentation and (ii) collection vocabulary-based representation of the documents.In the former case, each document was represented by means of the descriptorextracted from the title of the TREC topics, used as queries: therefore V con-sisted of query terms; in the latter case V consisted of the entire collectionvocabulary — both settings did not consider stopwords as part of V .
3 http://trec.nist.gov/data/t10.web.html4 The stop words list is that available at the url
http://ir.dcs.gla.ac.uk/resources/linguistic utils/stop words
8

Fig. 3: Query 528: changed parameter alpha. Documents are stretched along thex-axis and rotate anti-clockwise.
In this paper, we report the experiments on topic 528. We selected this querybecause it contains five terms and it is easier to show the effect of the hyper-parameters. In Figure 2, the cloud of points generated by the two-dimensionalapproach is shown. Parameters α and β are set to the standard RSJ score con-stant 0.5. The line corresponds to the decision line of a classifier, and it alsocorrespond to the ‘ranking’ line: imagine this line spanning the plane from rightto left, each time the line touches a document, the document is added to the listof retrieved documents.
In Figure 3, the hyper-parameter α was increased and β was left equal to0.5. When we increase α, the probability pi tends to one, and the effect, in termsof the two dimensional plot, is that points rotate anti-clockwise. In Figure 4,the opposite effect is obtained by increasing β and leaving α equal to 0.5. Inboth situations, the list of ranked documents was significantly different from theoriginal list produced by using the classical RSJ score.
9

Fig. 4: Query 528: changed parameter beta. Documents are stretched along thex-axis and rotate clockwise.
5 Conclusions
This paper presents a new direction for the study of the Okapi BM25 model. Inparticular, we have focused on a full Bayesian approach for deriving a smoothedformula that takes into account our a-priori knowledge on the probability ofterms. In fact, we think that many of the efforts in improving the BM25 weredone mostly in capturing the language model (frequencies, length, etc.) butmissed the fact that the 0.5 correction factor could be one of the parametersthat can be modelled in a better way.
By starting from a slightly different approach, the classification of documentsinto relevant and non relevant classes, we derived the exact same formula of theRSJ weight but with more degrees of interaction. The two-dimensional visual-ization approach helped in understanding why some of the constants factors canbe taken into account for the case of the classification and, more important, howthe hyper-parameters can be tuned to obtain a better ranking.
After this preliminary experiment, we can draw some considerations: for thefirst time, it was possible to visualize the cluster of points that are generated bythe RSJ scores; it was clear that very short queries tend to create a very small
10

number of points making it hard to perform a good retrieval; hyper-parametersdo make a difference in both classification and retrieval.
There are still many open research questions we want to investigate in thefuture:
– so far, we have assumed that all the beta priors associated to each termuse exactly the same values for hyper-parameters α and β. A more selectiveapproach may be more effective;
– the coordinate of the points in the two-dimensional plot take into accountthe two constants of Equation 17. In particular, the addend
∑i∈V log(1− pi)
may be the cause of the ‘rotation’ of the points, hence the radical change ofthe ranking list;
– The current approach assumes that the value of R and ri are known foreach term in the query: indeed these values are adopted to estimate thecoordinates of each document. A further research question is the effect ofestimation based on feedback data on the capability of the probabilisticvisual data mining approach adopted in this paper.
Acknowledgments. This work has been partially supported by the QON-TEXT project under grant agreement N. 247590 (FP7/2007-2013).
References
1. Robertson, S.E., Sparck Jones, K.: Relevance weighting of search terms. In Willett,P., ed.: Document retrieval systems. Taylor Graham Publishing, London, UK, UK(1988) 143–160
2. Robertson, S.E.: The Probability Ranking Principle in IR. Journal of Documen-tation 33 (1977) 294–304
3. Jones, K.S., Walker, S., Robertson, S.E.: A probabilistic model of informationretrieval: development and comparative experiments. Inf. Process. Manage. 36(2000) 779–808
4. Cox, D., Snell, D.: The Analysis of Binary Data. Monographs on Statistics andApplied Probability Series. Chapman & Hall (1989)
5. Robertson, S.: Understanding inverse document frequency: On theoretical argu-ments for idf. In: Journal of Documentation. Volume 60. (2004)
6. Robertson, S.E., Walker, S.: Some simple effective approximations to the 2-poissonmodel for probabilistic weighted retrieval. In Croft, W.B., van Rijsbergen, C.J.,eds.: SIGIR, ACM/Springer (1994) 232–241
7. Robertson, S.E., Walker, S., Jones, S., Hancock-Beaulieu, M., Gatford, M.: Okapiat TREC-3. In: Proceedings of the Third Text REtrieval Conference (TREC),Gaithesburg, USA (1994)
8. Robertson, S.E., Walker, S.: On relevance weights with little relevance information.SIGIR Forum 31 (1997) 16–24
9. Robertson, S.E., Zaragoza, H.: The probabilistic relevance framework: Bm25 andbeyond. Foundations and Trends in Information Retrieval 3 (2009) 333–389
10. Kruschke, J.K.: Doing Bayesian Data Analysis: A Tutorial with R and BUGS. 1edn. Academic Press/Elsevier (2011)
11

11. Di Nunzio, G., Sordoni, A.: How well do we know bernoulli? In: IIR. Volume 835of CEUR Workshop Proceedings., CEUR-WS.org (2012) 38–44
12. Di Nunzio, G., Sordoni, A.: A visual tool for bayesian data analyisis: The impact ofsmoothing on naıve bayes text classifiers. In: Proceeding of the 35th InternationalACM SIGIR 2012. Volume 1002., Portland, Oregon, USA (2012)
13. Cooper, W.S.: Some inconsistencies and misnomers in probabilistic informationretrieval. In: Proceedings of the 14th annual international ACM SIGIR conferenceon Research and development in information retrieval. SIGIR ’91, New York, NY,USA, ACM (1991) 57–61
14. Di Nunzio, G.: Using scatterplots to understand and improve probabilistic modelsfor text categorization and retrieval. Int. J. Approx. Reasoning 50 (2009) 945–956
15. Di Nunzio, G., Sordoni, A.: A Visual Data Mining Approach to Parameters Op-timization. In Zhao, Y., Cen, Y., eds.: Data Mining Applications in R. Elsevier(2013, In Press)
12
The Bivariate 2-Poisson model for IR
Giambattista Amati1 and Giorgio Gambosi2
1 Fondazione Ugo Bordoni, Rome, Italy [email protected] Enterprise Engineering Department of University of Tor Vergata, Rome, Italy
1 Introduction
Harter’s 2-Poisson model of Information Retrieval is a univariate model of the raw termfrequencies, that does not condition the probabilities on document length [2]. A bivariatestochastic model is thus introduced to extend Harter’s 2-Poisson model, by conditioning theterm frequencies of the document to the document length. We assume Harter’s hypothesis:the higher the probability f(X = x|L = l) of the term frequency X = x is in a documentof length l, the more relevant that document is. The new generalization of the 2-Poissonmodel has 5 parameters that are learned term by term through the EM algorithm over termfrequencies data.We explore the following frameworks:
– We assume that the observation 〈x, l〉 is generated by a mixture of k Bivariate Poisson(k-BP) distributions (with k ≥ 2) with or without some conditions on the form for themarginal of the document length, that can reduce the complexity of the model. We herereduce for the sake of simplicity to k = 2. In the case of the 2-BP we also assume thehypothesis that the marginal distribution of l is a Poisson. The elite set is generated bythe BP of the mixture with higher value for the mean of term frequencies, λ1.
– The covariate variable Z3 of length and term frequency λ3 could be learned from co-variance [3, page 103]. Instead, we here consider Z3 a latent random variable which islearned by extending the EM algorithm in a standard way.
– Our plan is to compare the effectiveness of the bivariate 2-Poisson model with respect tostandard models of IR, and in particular with some additional baselines that are obtainedin our framework as follows:• applying the Double Poisson Model, which is the 2-BP with the marginal distribu-
tions that are independent.• Reducing to the univariate case (standard 2-Poisson model) by normalizing the term
frequency x to a smoothed value tfn. For example, we can use the Dirichlet smooth-ing:
tfn =x + µ · pl + µ
· µ′
where µ and µ′ are parameters and p is the term prior.
13

2 The Bivariate 2-Poisson distribution
In order to define the bivariate 2-Poisson model we need first to remind the definition ofa bivariate Poisson model, that can be introduced in several ways, for example as limit of abivariate binomial, as a convolution of three univariate Poisson distributions, as a compound-ing of a Poisson with a bivariate binomial. We find that the trivariate reduction method of theconvolution more convenient to easily extend Harter’s 2-Poisson model to the bivariate case.Let us consider the random variables Z1, Z2, Z3 distributed according to Poisson distribu-tions P (λi), that is:
p(Zi = x|λi) = e−λiλxix!
and the random variables X = Z1 + Z3 e Y = Z2 + Z3 distributed according to a bivariatePoisson distribution, BP (Λ), where Λ = (λ1, λ2, λ3):
p(X = x, Y = y|Λ) = e−(λ1+λ2+λ3)λx1x!λy2y!
min(x,y)∑i=0
(x
i
)(y
i
)i!(
λ3
λ1λ2
)iThe corresponding marginal distributions turn out to be Poisson
p(X = x|Λ) =∞∑y=0
p(X = x, Y = y|Λ) = P(λ1 + λ3)
p(Y = y|Λ) =∞∑x=0
p(X = x, Y = y|Λ) = P(λ2 + λ3)
with covariance Cov(X,Y ) = λ3.Let us now consider the mixture 2BP (Λ1, Λ2, α), where Λ1 = (λ1
1, λ12, λ
13) and Λ2 =
(λ21, λ
22, λ
23), of two bivariate Poisson distributions
p(x, y|Λ1, Λ2, α) = α·BP(Λ1) + (1− α) · BP(Λ2)
The corresponding marginal distributions are 2-Poisson
p(x|Λ1, Λ2, α) = α · P(λ11 + λ1
3) + (1− α) · P(λ21 + λ2
3) = 2P(λ11 + λ1
3, λ21 + λ2
3, α)
p(y|Λ1, Λ2, α) = α · P(λ12 + λ1
3) + (1− α) · P(λ22 + λ2
3) = 2P(λ12 + λ1
3, λ22 + λ2
3, α)
In our case, we consider the random variables x, number of occurrences of the term in thedocument, and L− = l − x, document length out of the term occurrences, and set X = xand Y = L− = l − x (hence, Y could possibly be 0): as a consequence, we have x = X =Z1 + Z3, L− = Y = Z2 + Z3, and l = X + Y = Z1 + Z2 + 2Z3.Moreover, we want x to be distributed as a 2-Poisson and L− to be distributed as a Poisson.By assuming λ1
2 = λ22 = λ2 and λ1
3 = λ23 = λ3 we obtain
p(x|Λ1, Λ2, α) = α · P(λ11 + λ3) + (1− α)·P(λ2
1 + λ3) = 2P(λ11 + λ3, λ
21 + λ3)
p(L−|Λ1, Λ2, α) = α · P(λ2 + λ3) + (1− α)·P(λ2 + λ3) = P(λ2 + λ3)
14

This implies that, apart fromα, we assume five latent variables in the model,Z11 , Z
21 , Z2, Z3,W
each Z is Poisson distributed with parameters λ11, λ
21, λ2, λ3 respectively and W is a binary
random variable Bernoulli distributed with parameter α. The resulting bivariate distributionis
p(x, L−|Λ1, Λ2, α) = α · p1(x, L−|λ1, λ2, λ3) + (1− α) · p2(x, L−|λ21, λ2, λ3)
= α·BP(λ11, λ2, λ3) + (1− α) ·BP (λ2
1, λ2, λ3)
3 EM algorithm for the Bivariate Poisson
Given a set of observations X = {x1, . . . ,xn}, with xi = (xi, li), we wish to apply maxi-mum likelihood to estimate the set of parametersΛ of a bivariate Poisson distribution p(x|Θ)fitting such data. We wish to derive the value of Θ by maximizing the log-likelihood, that iscomputing
Θ∗ = arg maxΘ
logL(Θ|X ) = arg maxΘ
logn∏i=1
p(xi|Θ)
In our case (see also [1]), we are interested to a mixture of 2 Bivariate Poisson with latentvariables Z1
1 , Z21 , Z2, Z3, since with respect to the general case we have now Z1
2 = Z22 = Z2
and Z13 = Z2
3 = Z3. Then, for each observed pair of values xi = (xi, li), wi = 1 if xi isgenerated by the first component, and wi = 2 if generated by the second one. Accordingly:
zi = (z1i1, z
2i1, zi2, zi3) are such that xi =
{z1i1 + zi3 if wi = 1z2i1 + zi3 if wi = 2
and li = zi2 + zi3
EM algorithm requires, in our case, to consider the complete dataset
(X ,Z) = {(x1, z1, w1) , . . . , (xn, zn, wn)}
and the set of parameters is Θ = Λ1 ∪ Λ2 ∪ {α}, with Λk ={λk1 , λ2, λ3
}. Let also Λ =
Λ1 ∪ Λ2.
3.1 Maximization
Let us consider the k-th M-step for Θ. We can show the following estimates:
α(k) =1n
n∑i=1
p(k−1)i where p(k−1)
i =α(k−1)p(xi|Λk−1
1 )
α(k−1)p(xi|Λ(k−1)1 ) + (1− α(k−1))p(xi|Λ(k−1)
2 )
and p is the Bivariate Poisson with parameters Λi, and
λ11(k)
=∑ni=1 b
11i
(k−1)p(k−1)i∑n
i=1 p(k−1)i
λ21(k)
=∑ni=1 b
21i
(k−1)(1− p(k−1)i )∑n
i=1(1− p(k−1)i )
λ(k)2 =
1n
n∑i=1
b2i(k−1) λ
(k)3 =
1n
n∑i=1
b3i(k−1)
15

where bjhi(k)
= E[Zjh|W = j,xi, Λ(k)] and bhi(k) = E[Zh|xi, Λ(k)] with h = 1, 2, 3.
3.2 Expectation
We can show that the expectations bj1i(k)
and bhi(k) are:
b3i(k) =
min (xi,li)∑r=0
r · p(Z3 = r|xi, Λ) where Λ(k) = Λ(k)1 ∪ Λ(k)
2
=min (xi,li)∑r=0
r(1− α)p(Z3 = r,xi|W = 2, Λ(k)) + αp(Z3 = r,xi|W = 1, Λ(k))
p(xi|Λ(k))
b11i(k)
= E[X1|W = 1,xi]− E[Z3|W = 1,xi] = xi − b13i(k)
b21i(k)
= E[X|W = 2,xi, Λ(k)]− E[Z3|W = 2,xi, Λ(k)] = xi − b23i(k)
b2i(k) = E[Y |xi, Λ(k)]− E[Z3|xi, Λ(k)] = li − b3i(k)
where
p(Z3 = r,xi|W = j, Λ(k)) = P0(r|λ3(k)) · P0(x− r|λj1
(k)) · P0(l − r|λ2
(k))
and P0 is the univariate Poisson, p(xi|Λ(k)) is the mixture of the bivariate Poisson. Efficientimplementation of the bivariate Poisson through recursion can be found in [4].
4 Conclusions
We have implemented the EM algorithm for the univariate 2-Poisson and we are currentlyextending the implementation to the bivariate case.The implementation will be soon available together with the results of the experimentationat the web site http://tinyurl.com/cfcm8ma.
References
1. BRIJS, T., KARLIS, D., SWINNEN, G., VANHOOF, K., WETS, G., AND MANCHANDA, P. Amultivariate poisson mixture model for marketing applications. Statistica Neerlandica 58, 3 (2004),322–348.
2. HARTER, S. P. A probabilistic approach to automatic keyword indexing. part I: On the distributionof specialty words words in a technical literature. Journal of the ASIS 26 (1975), 197–216.
3. KOCHERLAKOTA, S., AND KOCHERLAKOTA, K. Bivariate discrete distributions. Marcel DekkerInc., New York, 1992.
4. TSIAMYRTZIS, P., AND KARLIS, D. Strategies for efficient computation of multivariate poissonprobabilities. Communications in Statistics-Simulation and Computation 33, 2 (2004), 271–292.
16

A Query Expansion Method based on aWeighted Word Pairs Approach
Francesco Colace1, Massimo De Santo1, Luca Greco1 and Paolo Napoletano2
1 DIEM,University of Salerno, Fisciano,Italy,desanto@unisa, [email protected], [email protected]
2 DISCo,University of Milano-Bicocca, [email protected]
Abstract. In this paper we propose a query expansion method to im-prove accuracy of a text retrieval system. Our technique makes use ofexplicit relevance feedback to expand an initial query with a structuredrepresentation called Weighted Word Pairs. Such a structure can be au-tomatically extracted from a set of documents and uses a method forterm extraction based on the probabilistic Topic Model. Evaluation hasbeen conducted on TREC-8 repository and performances obtained us-ing standard WWP and Kullback Leibler Divergency query expansionapproaches have been compared.
Keywords: Text retrieval, query expansion, probabilistic topic model
1 Introduction
Over the years, several text retrieval models have been proposed: set-theoretic(including boolean), algebraic, probabilistic models [1], etc. Although each methodhas its own properties, there is a common denominator: the bag of words repre-sentation of documents.
The “bag of words” assumption claims that a document can be consideredas a feature vector where each element indicates the presence (or absence) of aword, so that the information on the position of that word within the documentis completely lost [1]. The elements of the vector can be weights and computedin different ways so that a document can be considered as a list of weighted fea-tures. The term frequency-inverse document (tf-idf) model is a commonly usedweighting model: each term in a document collection is weighted by measuringhow often it is found within a document (term frequency), offset by how often itoccurs within the entire collection (inverse document frequency). Based on thismodel, also a query can be viewed as a document, so it can be represented as avector of weighted words.
The relevance of a document to a query is the distance between the cor-responding vector representations in the features space. Unfortunately, queriesperformed by users may not be long enough to avoid the inherent ambiguity oflanguage (polysemy etc.). This makes text retrieval systems, that rely on the
17

bags of words model, generally suffer from low precision, or low quality docu-ment retrieval. To overcome this problem, scientists proposed methods to expandthe original query with other topic-related terms extracted from exogenous (e.g.ontology, WordNet, data mining) or endogenous knowledge (i.e. extracted onlyfrom the documents contained in the collection) [2, 3, 1]. Methods based on en-dogenous knowledge, also known as relevance feedback, make use of a number oflabelled documents, provided by humans (explicit) or automatic/semi-automaticstrategies, to extract topic-related terms and such methods have demonstratedto obtain performance improvements of up to 40% [4]
In this paper we propose a new query expansion method that uses a struc-tured representation of documents and queries, named Weighted Word Pairs,that is capable of reducing the effect of the inherent ambiguity of language soachieving better performance than a method based on a vector of weighted words.The Weighted Word Pairs representation is automatically obtained from docu-ments, provided by a minimal explicit feedback, by using a method of term ex-traction[5][6][7] based on the Latent Dirichlet Allocation model [8] implementedas the Probabilistic Topic Model [9]. Evaluation has been conducted on TREC-8 repository: results obtained employing standard WWP and Kullback Leiblerdivergency have been compared.
This article is structured as follows: Section 2 gives an overview on relatedworks and approaches to query expansion in text retrieval; in Section 3 a generalframework for query expansion is discussed; Section 4 describes in detail ourfeature extraction method; in Section 5 performance evaluation is presented.
2 Related works
It is well documented that the query length in typical information retrievalsystems is rather short (usually two or three words) [10] which may not be longenough to avoid the inherent ambiguity of language (polysemy etc.), and whichmakes text retrieval systems, that rely on a term-frequency based index, suffergenerally from low precision, or low quality of document retrieval.
In turn, the idea of taking advantage of additional knowledge, by expand-ing the original query with other topic-related terms, to retrieve relevant doc-uments has been largely discussed in the literature, where manual, interactiveand automatic techniques have been proposed [2][1]. The idea behind these tech-niques is that, in order to avoid ambiguity, it may be sufficient to better specify“the meaning” of what the user has in mind when performing a search, or inother words “the main concept” (or a set of concepts) of the preferred topic inwhich the user is interested. A better specialization of the query can be obtainedwith additional knowledge, that can be extracted from exogenous (e.g. ontology,WordNet, data mining) or endogenous knowledge (i.e. extracted only from thedocuments contained in the repository) [3, 1].
In this paper we focus on those techniques which make use of the RelevanceFeedback (in the case of endogenous knowledge) which takes into account theresults that are initially returned from a given query and so uses the information
18

about the relevance of each result to perform a new expanded query. In the lit-erature we can distinguish between three types of procedures for the assignmentof the relevance: explicit feedback, implicit feedback, and pseudo feedback.
Most existing methods, due to the fact that the human labeling task is enor-mously annoying and time consuming [11], make use of the pseudo relevancefeedback (top k retrieved are assumed to be relevant). Nevertheless, fully auto-matic methods suffer from obvious errors when the initial query is intrinsicallyambiguous. As a consequence, in the recent years, some hybrid techniques havebeen developed which take into account a minimal explicit human feedback [4,12] and use it to automatically identify other topic related documents.
However, whatever the technique that selects the set of documents represent-ing the feedback, the expanded terms are usually computed by making use ofwell known approaches for term selection as Rocchio, Robertson, CHI-Square,Kullback-Lieber etc [13]. In this case the reformulated query consists in a simple(sometimes weighted) list of words. Although such term selection methods haveproven their effectiveness in terms of accuracy and computational cost, severalmore complex alternative methods have been proposed, which consider the ex-traction of a structured set of words instead of simple list of them: a weightedset of clauses combined with suitable operators [14], [15], [16].
3 A general Query Expansion framework
A general query expansion framework can be described as a modular systemincluding:
– the Information Retrieval (IR) module;– the Feedback (F) module;– the Feature Extraction (FE) module;– the Query Reformulation (QR) module.
Such a framework is represented in Figure 1 and can be described as follows.The user initially performs a search task on the dataset D by inputting a queryq to the IR system and obtains a set of documents RS = (d1, · · · ,dN ) as aresult. The module F, thanks to the explicit feedback of the user, identifies asmall set of relevant documents (called Relevance Feedback) RF = (d1, · · · ,dM )from the hit list of documents RS returned by the IR system. Given the set ofrelevant document RF , the module FE extracts a set of features g that mustbe added to the initial query q. The extracted features can be weighted wordsor more complex structures such as weighted word pairs. So the obtained set gmust be adapted by the QR module to be handled by the IR system and thenadded to the initial query. The output of this module is a new query qe whichincludes both the initial query and the set of features extracted from the RF .The new query is then performed on the collection so obtaining a new resultset RS ′ = (d′1, · · · ,d′N ) different from the one obtained before. Consideringthe framework described above is possible to take into account any technique offeature extraction that makes use of the explicit relevant feedback and any IR
19

Fig. 1. General framework for Query Expansion.
Fig. 2. Graphical representation of a Weighted Word Pairs structure.
systems suitable to handle the resulting expanded query qe. In this way it ispossible to implement several techniques and make objective comparisons withthe proposed one.
4 WWP feature selection method
The aim of the proposed method is to extract from a set of documents a compactrepresentation, named Weighted Word Pairs (WWP), which contains the mostdiscriminative word pairs to be used in the text retrieval task. The FeatureExtraction module (FE) is represented in Fig. 3. The input of the system is theset of documents RF = (d1, · · · ,dM ) and the output is a vector of weightedword pairs g = {w′1, · · · , w′|Tp|}, where Tp is the number of pairs and w′n is the
weight associated to each pair (feature) tn = (vi, vj).A WWP structure can be suitably represented as a graph g of terms (Fig.
2). Such a graph is made of several clusters, each containing a set of words vs(aggregates) related to an aggregate root (ri), a special word which representsthe centroid of the cluster. How aggregate roots are selected will be clear fur-ther. The weight ρis can measure how a word is related to an aggregate rootand can be expressed as a probability: ρis = P (ri|vs). The resulting structureis a subgraph rooted on ri. Moreover, aggregate roots can be linked together
20

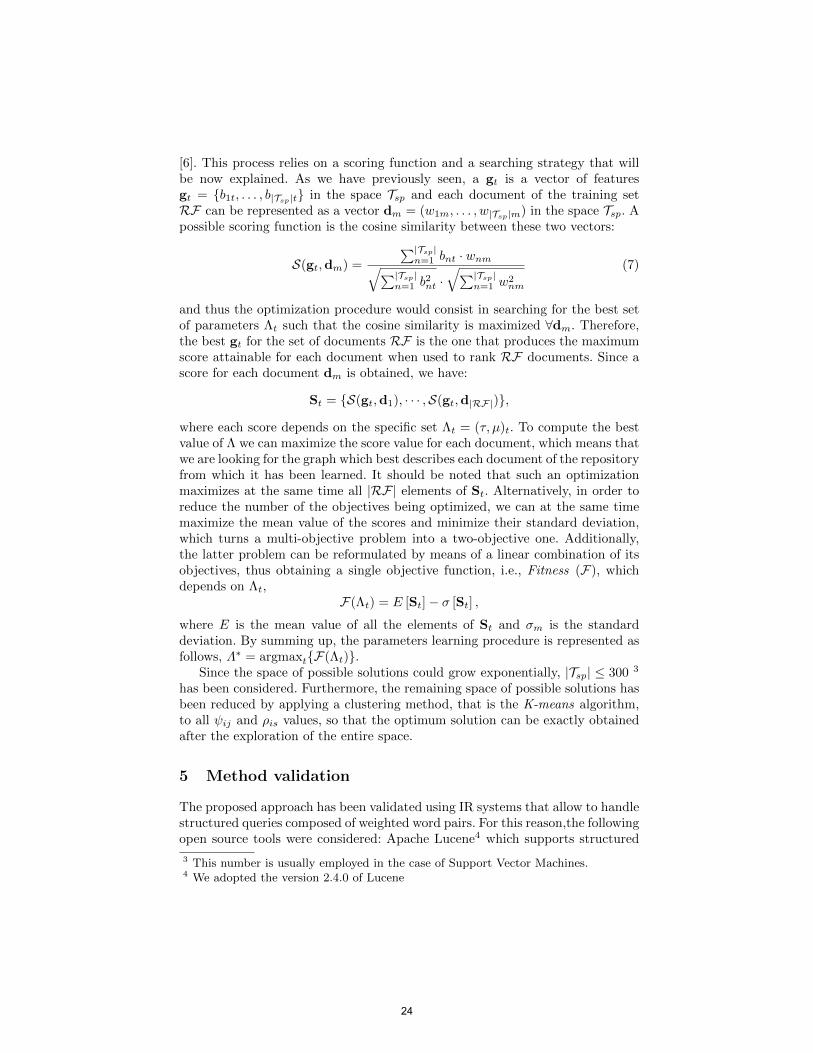
Fig. 3. Proposed feature extraction method. A Weighted Word Pairs g structure isextracted from a corpus of training documents.
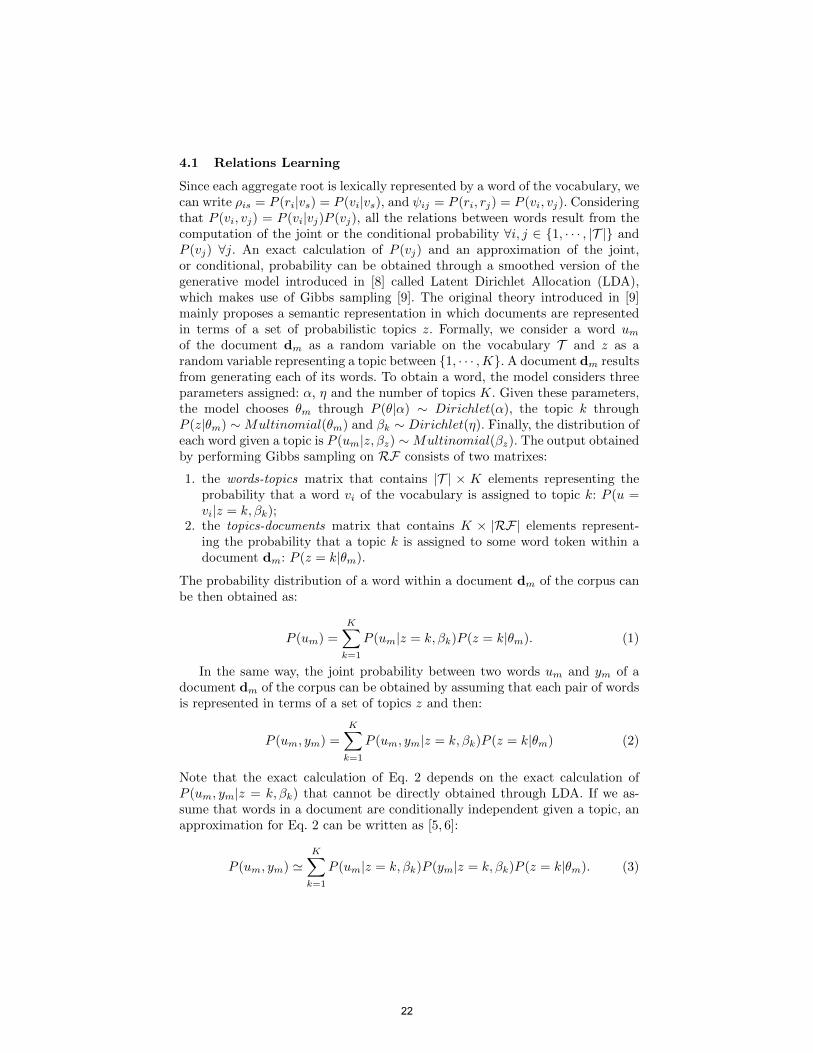
building a centroids subgraph. The weight ψij can be considered as the degreeof correlation between two aggregate roots and can also be expressed as a proba-bility: ψij = P (ri, rj). Being each aggregate root a special word, it can be statedthat g contains directed and undirected pairs of features lexically denoted aswords. Given the training set RF of documents, the term extraction procedureis obtained first by computing all the relationships between words and aggregateroots ( ρis and ψij), and then selecting the right subset of pairs Tsp from all thepossible ones Tp.
A WWP graph g is learned from a corpus of documents as a result of two im-portant phases: the Relations Learning stage, where graph relation weights arelearned by computing probabilities between word pairs (see Fig. 3); the Struc-ture Learning stage, where an initial WWP graph, which contains all possiblerelations between aggregate roots and aggregates, is optimized by performingan iterative procedure. Given the number of aggregate roots H and the desiredmax number of pairs as constraints, the algorithm chooses the best parametersettings µ = (µ1, . . . , µH) and τ defined as follows:
1. µi: the threshold that establishes, for each aggregate root i, the number ofaggregate root/word pairs of the graph. A relationship between the word vsand the aggregate root ri is relevant if ρis ≥ µi.
2. τ : the threshold that establishes the number of aggregate root/aggregate rootpairs of the graph. A relationship between the aggregate root vi and aggre-gate root rj is relevant if ψij ≥ τ .
21
4.1 Relations Learning
Since each aggregate root is lexically represented by a word of the vocabulary, wecan write ρis = P (ri|vs) = P (vi|vs), and ψij = P (ri, rj) = P (vi, vj). Consideringthat P (vi, vj) = P (vi|vj)P (vj), all the relations between words result from thecomputation of the joint or the conditional probability ∀i, j ∈ {1, · · · , |T |} andP (vj) ∀j. An exact calculation of P (vj) and an approximation of the joint,or conditional, probability can be obtained through a smoothed version of thegenerative model introduced in [8] called Latent Dirichlet Allocation (LDA),which makes use of Gibbs sampling [9]. The original theory introduced in [9]mainly proposes a semantic representation in which documents are representedin terms of a set of probabilistic topics z. Formally, we consider a word umof the document dm as a random variable on the vocabulary T and z as arandom variable representing a topic between {1, · · · ,K}. A document dm resultsfrom generating each of its words. To obtain a word, the model considers threeparameters assigned: α, η and the number of topics K. Given these parameters,the model chooses θm through P (θ|α) ∼ Dirichlet(α), the topic k throughP (z|θm) ∼Multinomial(θm) and βk ∼ Dirichlet(η). Finally, the distribution ofeach word given a topic is P (um|z, βz) ∼Multinomial(βz). The output obtainedby performing Gibbs sampling on RF consists of two matrixes:
1. the words-topics matrix that contains |T | × K elements representing theprobability that a word vi of the vocabulary is assigned to topic k: P (u =vi|z = k, βk);
2. the topics-documents matrix that contains K × |RF| elements represent-ing the probability that a topic k is assigned to some word token within adocument dm: P (z = k|θm).
The probability distribution of a word within a document dm of the corpus canbe then obtained as:
P (um) =
K∑k=1
P (um|z = k, βk)P (z = k|θm). (1)
In the same way, the joint probability between two words um and ym of adocument dm of the corpus can be obtained by assuming that each pair of wordsis represented in terms of a set of topics z and then:
P (um, ym) =K∑
k=1
P (um, ym|z = k, βk)P (z = k|θm) (2)
Note that the exact calculation of Eq. 2 depends on the exact calculation ofP (um, ym|z = k, βk) that cannot be directly obtained through LDA. If we as-sume that words in a document are conditionally independent given a topic, anapproximation for Eq. 2 can be written as [5, 6]:
P (um, ym) 'K∑
k=1
P (um|z = k, βk)P (ym|z = k, βk)P (z = k|θm). (3)
22

Moreover, Eq. 1 gives the probability distribution of a word um within a doc-ument dm of the corpus. To obtain the probability distribution of a word uindependently of the document we need to sum over the entire corpus:
P (u) =M∑
m=1
P (um)δm (4)
where δm is the prior probability for each document (∑|RF|
m=1 δm = 1). If weconsider the joint probability distribution of two words u and y, we obtain:
P (u, y) =M∑
m=1
P (um, yv)δm (5)
Concluding, once we have P (u) and P (u, y) we can compute P (vi) = P (u = vi)and P (vi, vj) = P (u = vi, y = vj), ∀i, j ∈ {1, · · · , |T |} and so the relationslearning can be totally accomplished.
4.2 Structure Learning
Once each ψij and ρis is known ∀i, j, s, aggregate root and word levels have tobe identified in order to build a starting WWP structure to be optimized asdiscussed later. The first step is to select from the words of the indexed corpus aset of aggregate roots r = (r1, . . . , rH), which will be the nodes of the centroidssubgraph. Aggregate roots are meant to be the words whose occurrence is mostimplied by the occurrence of other words of the corpus, so they can be chosenas follows:
ri = argmaxvi
∏j 6=i
P (vi|vj) (6)
Since relationships’ strenghts between aggregate roots can be directly ob-tained from ψij , the centroids subgraph can be easily determined. Note that notall possible relationships between aggregate roots are relevant: the threshold τcan be used as a free parameter for optimization purposes. As discussed before,several words (aggregates) can be related to each aggregate root, obtaining Haggregates’ subgraphs. The threshold set µ = (µ1, . . . , µH) can be used to selectthe number of relevant pairs for each aggregates’ subgraph. Note that a rela-tionship between the word vs and the aggregate root ri is relevant if ρis ≥ µi,but the value ρis cannot be directly used to express relationships’ strenghts be-tween aggregate roots and words. In fact, being ρis a conditional probability,it is always bigger than ψis which is a joint probability. Therefore, once pairsfor the aggregates’ subgraph are selected using ρis, relationships’ strenght arerepresented on the WWP structure through ψis.Given H and the maximum number of pairs as constraints (i.e. fixed by theuser), several WWP structure gt can be obtained by varying the parametersΛt = (τ, µ)t. As shown in Fig.3, an optimization phase is carried out in or-der to search the set of parameters Λt which produces the best WWP graph
23
[6]. This process relies on a scoring function and a searching strategy that willbe now explained. As we have previously seen, a gt is a vector of featuresgt = {b1t, . . . , b|Tsp|t} in the space Tsp and each document of the training setRF can be represented as a vector dm = (w1m, . . . , w|Tsp|m) in the space Tsp. Apossible scoring function is the cosine similarity between these two vectors:
S(gt,dm) =
∑|Tsp|n=1 bnt · wnm√∑|Tsp|
n=1 b2nt ·
√∑|Tsp|n=1 w
2nm
(7)
and thus the optimization procedure would consist in searching for the best setof parameters Λt such that the cosine similarity is maximized ∀dm. Therefore,the best gt for the set of documents RF is the one that produces the maximumscore attainable for each document when used to rank RF documents. Since ascore for each document dm is obtained, we have:
St = {S(gt,d1), · · · ,S(gt,d|RF|)},
where each score depends on the specific set Λt = (τ, µ)t. To compute the bestvalue of Λ we can maximize the score value for each document, which means thatwe are looking for the graph which best describes each document of the repositoryfrom which it has been learned. It should be noted that such an optimizationmaximizes at the same time all |RF| elements of St. Alternatively, in order toreduce the number of the objectives being optimized, we can at the same timemaximize the mean value of the scores and minimize their standard deviation,which turns a multi-objective problem into a two-objective one. Additionally,the latter problem can be reformulated by means of a linear combination of itsobjectives, thus obtaining a single objective function, i.e., Fitness (F), whichdepends on Λt,
F(Λt) = E [St]− σ [St] ,
where E is the mean value of all the elements of St and σm is the standarddeviation. By summing up, the parameters learning procedure is represented asfollows, Λ∗ = argmaxt{F(Λt)}.
Since the space of possible solutions could grow exponentially, |Tsp| ≤ 300 3
has been considered. Furthermore, the remaining space of possible solutions hasbeen reduced by applying a clustering method, that is the K-means algorithm,to all ψij and ρis values, so that the optimum solution can be exactly obtainedafter the exploration of the entire space.
5 Method validation
The proposed approach has been validated using IR systems that allow to handlestructured queries composed of weighted word pairs. For this reason,the followingopen source tools were considered: Apache Lucene4 which supports structured
3 This number is usually employed in the case of Support Vector Machines.4 We adopted the version 2.4.0 of Lucene
24

query based on a weighted boolean model and Indri5 which supports an extendedset of probabilistic structured query operators based on INQUERY. The perfor-mance comparison was carried out testing the following FE/IR configurations:
– IR only. Unexpanded queries were performed using first Lucene and thenLemur as IR modules. Results obtained in these cases are referred as baseline.
– FE(WWP) + IR. Our WWP-based feature extraction method was usedto expand initial query and feed Lucene and Lemur IR modules.
– FE(KLD) + IR. Kullback Leibler Divergency based feature extraction wasused to expand initial query and feed Lucene and Lemur IR modules.
5.1 Datasets and Ranking Systems
The dataset from TREC-8 [17] collections (minus the Congressional Record) wasused for performance evaluation. It contains about 520,000 news documents on50 topics (no.401-450) and relevance judgements for the topics. Word stoppingand word stemming with single keyword indexing were performed. Query termsfor each topic’s initial search (baseline) were obtained by parsing the title fieldof a topic. For the baseline and for the first pass ranking (needed for feedbackdocument selection) the default similarity measures provided by Lucene andLemur has been used. Performance was measured with TREC’s standard eval-uation measures: mean average precision (MAP), precision at different levels ofretrieved results (P@5,10...1000), R-precision and binary preference (BPREF).
5.2 Parameter Tuning
The two most important parameters involved in the computation of WWP, giventhe number of documents for training, are the number of aggregate roots H andthe number of pairs. The number of aggregate roots can be chosen as a trade offbetween retrieval performances and computational times, our choice was H = 4since it seemed to be the best compromise (about 6 seconds per topic)6. However,we want to emphasize method effectiveness more than algorithm efficiency sincealgorithm coding has not been completely optimized yet.
Fig. 5.2 shows results of baseline and WWP method when changing numberof pairs from 20 to 100 where the number of documents is fixed to 3: in thisanalysis, Lucene IR module is used . According to the graph, our system alwaysprovides better performances than baseline; the change in number of pairs hasa great impact especially on precision at 5 where 60 pairs achieve the best re-sults. Anyway, if we consider precision at higher levels together with map values,50 pairs seem to be a better choice also for shorter computational times. Fig.5.2 shows results of baseline and our method when changing number of trainingdocuments (Lucene IR Module used): here we can see that the overall be-haviour of the system is better when choosing 3 relevant documents for training.
5 We adopted the version 5... that is part of the Lemur Toolkit6 Results were obtained using an Intel Core 2 Duo 2,40 GHz PC with 4GB RAM
with no other process running.
25

Once again the system outperforms baseline especially at low precision levels.Discussed analysis led us to choose the following settings for the experimentalstage: 4 aggregate roots, 50 pairs, 3 training documents.
Fig. 4. WWP performance when changing number of pairs.
Fig. 5. WWP performance when changing number of training documents
5.3 Comparison with other methods
In Table 1 WWP method is compared with baseline and Kullback-Leibler diver-gence based method [13] when using both Lucene and Lemur as IR modules.Here we see that WWP outscores KLD, and baseline especially for low levelprecision while having good performances for other measures. However theseresults are obtained without removing feedback documents from the dataset so
26

IR Lucene Lemur
FE - KLD WWP - KLD WWP
relret 2267 2304 3068 2780 2820 3285
map 0,1856 0,1909 0,2909 0,2447 0,2560 0,3069
Rprec 0,2429 0,2210 0,3265 0,2892 0,2939 0,3324
bpref 0,2128 0,2078 0,3099 0,2512 0,2566 0,3105
P@5 0,3920 0,5200 0,7600 0,4760 0,5720 0,7360
P@10 0,4000 0,4300 0,6020 0,4580 0,4820 0,5800
P@100 0,1900 0,1744 0,2612 0,2166 0,2256 0,2562
P@1000 0,0453 0,0461 0,0614 0,0556 0,0564 0,0657
Table 1. Results comparison for unexpanded query, KLD and WWP (FE) usingLucene and Lemur as IR modules.
IR Lucene Lemur
FE - KLD WWP - KLD WWP
relret 2117 2178 2921 2630 2668 3143
map 0,1241 0,1423 0,2013 0,1861 0,1914 0,2268
Rprec 0,1862 0,1850 0,2665 0,2442 0,2454 0,2825
bpref 0,1546 0,1716 0,2404 0,1997 0,2044 0,2471
P@5 0,2360 0,3920 0,4840 0,3880 0,4120 0,5120
P@10 0,2580 0,3520 0,4380 0,3840 0,3800 0,4560
P@100 0,1652 0,1590 0,2370 0,1966 0,2056 0,2346
P@1000 0,0423 0,0436 0,0584 0,0526 0,0534 0,0629
Table 2. Results comparison for unexpanded query, KLD and WWP using Lucene orLemur with RSD.
a big improvement in low level precision may appear a little obvious. Anotherperformance evaluation was carried out using only the residual collection (RSD)where feedback documents are removed. Results for this evaluation are shownin table 2 where we see performance improvements also with residual collection.
6 Conclusions
In this work we have demonstrated that a Weighted Word Pairs hierarchical rep-resentation is capable of retrieving a greater number of relevant documents thana less complex representation based on a list of words. These results suggestthat our approach can be employed in all those text mining tasks that con-sider matching between patterns represented as textual information and in textcategorization tasks as well as in sentiment analysis and detection tasks. Theproposed approach computes the expanded queries considering only endogenous
27

knowledge. It is well known that the use of external knowledge, for instanceWord-Net, could clearly improve the accuracy of information retrieval systemsand we consider this integration as a future work.
References
1. Christopher D. Manning, P.R., Schtze, H.: Introduction to Information Retrieval.Cambridge University (2008)
2. Efthimiadis, E.N.: Query expansion. In Williams, M.E., ed.: Annual Review ofInformation Systems and Technology. (1996) 121–187
3. Bhogal, J., Macfarlane, A., Smith, P.: A review of ontology based query expansion.Information Processing & Management 43(4) (2007) 866 – 886
4. Okabe, M., Yamada, S.: Semisupervised query expansion with minimal feedback.IEEE Transactions on Knowledge and Data Engineering 19 (2007) 1585–1589
5. Napoletano, P., Colace, F., De Santo, M., Greco, L.: Text classification using agraph of terms. In: Complex, Intelligent and Software Intensive Systems (CISIS),2012 Sixth International Conference on. (july 2012) 1030 –1035
6. Clarizia, F., Greco, L., Napoletano, P.: An adaptive optimisation method for auto-matic lightweight ontology extraction. In Filipe, J., Cordeiro, J., eds.: EnterpriseInformation Systems. Volume 73 of Lecture Notes in Business Information Pro-cessing. Springer Berlin Heidelberg (2011) 357–371
7. Clarizia, F., Greco, L., Napoletano, P.: A new technique for identification of rel-evant web pages in informational queries results. In: Proceedings of the 12thInternational Conference on Enterprise Information Systems: Databases and In-formation Systems Integration. (8-12 June 2010) 70–79
8. Blei, D.M., Ng, A.Y., Jordan, M.I.: Latent dirichlet allocation. Journal of MachineLearning Research 3(993–1022) (2003)
9. Griffiths, T.L., Steyvers, M., Tenenbaum, J.B.: Topics in semantic representation.Psychological Review 114(2) (2007) 211–244
10. Jansen, B.J., Spink, A., Saracevic, T.: Real life, real users, and real needs: a studyand analysis of user queries on the web. Inform. Proces. & Manag. 36(2) (2000)207–227
11. Ko, Y., Seo, J.: Text classification from unlabeled documents with bootstrappingand feature projection techniques. Inf. Process. Manage. 45 (2009) 70–83
12. Dumais, S., Joachims, T., Bharat, K., Weigend, A.: SIGIR 2003 workshop report:implicit measures of user interests and preferences. 37(2) (2003) 50–54
13. Carpineto, C., de Mori, R., Romano, G., Bigi, B.: An information-theoretic ap-proach to automatic query expansion. ACM Trans. Inf. Syst. 19 (2001) 1–27
14. Callan, J., Croft, W.B., Harding, S.M.: The inquery retrieval system. In: In Pro-ceedings of the Third International Conference on Database and Expert SystemsApplications, Springer-Verlag (1992) 78–83
15. Collins-Thompson, K., Callan, J.: Query expansion using random walk models.In: Proceedings of the 14th ACM international conference on Information andknowledge management. CIKM ’05, New York, NY, USA, ACM (2005) 704–711
16. Lang, H., Metzler, D., Wang, B., Li, J.T.: Improved latent concept expansion usinghierarchical markov random fields. In: Proceedings of the 19th ACM internationalconference on Information and knowledge management. CIKM ’10, New York, NY,USA, ACM (2010) 249–258
17. Voorhees, E.M., Harman, D.: Overview of the eighth text retrieval conference(trec-8) (2000)
28
A flexible extension of XQuery Full-Text
Emanuele Panzeri and Gabriella Pasi
University of Milano-BicoccaViale Sarca 336, 20126 Milano, Italy{panzeri,pasi}@disco.unimib.it
Abstract. This paper presents the implementation of an extension ofthe XQuery Full-Text language on top of the BaseX query engine. Theproposed extension adds to the language two new flexible axes that allowusers to express structural constraints that are evaluated in an approx-imate way with respect to a considered path; the constraints evaluationproduces a scored set of elements. The implementation and the efficiencyevaluations of the constraints are reported in this paper.
1 Introduction
Recent works have been dedicated at improving standard XML query languages,such as XQuery and XPath, by enriching their expressiveness in both contentconstraints [1, 8] and structural constraints [2, 6] evaluation. While the workreported in [1] has been adopted by W3C in the XQuery Full-Text extension[7],no approximate matching for structural-based constraints has been standardizedby W3C yet. The adoption of structured query models (such as XQuery) toinquiry highly structured document repositories or XML databases forces usersto be well aware of the underlying structure; non of the previous approachesallows users to directly specify flexible structural constraints the evaluation ofwhich produces weighted fragments. The XQuery Full-Text language extensionproposed in [5] was the first proposal to introduce a set of flexible constraintswith an approximate matching. The extension allows users to formulate querieswhere the relative position of important nodes can be specified independentlyfrom an exact knowledge of the underlying structure. The extension gives to theuser the ability to express structural constraints with approximate matching andto obtain a weighted set of fragments; users can also define a score combinationusing standard XQuery operators and obtain a customized element ranking.
In this work we present the implementation of the flexible constraints, as de-fined and motivated in [5], named Near and Below, that allow users to explicitlyspecify their tolerance to an approximate structural matching. The implementa-tion, performed on top of the BaseX query engine [4], integrates and extends thefragment scoring introduced by the FullText extension by taking into accountalso the structural scores computed by the approximate constraint evaluation.
2 The XQuery Full-Text extension in a nutshell
For each element matched by the Below and Near, a score is computed by theapproximate matching; the score is in the interval ]0, 1] where 1 represents a full
29

satisfaction of the constraint evaluation, while values less than 1 are assigned totarget nodes far from the context node.
The constraint Below is defined as an XPath axis (like, for example, thechildren, self, etc axes) the evaluation of which is aimed at identifying el-ements that are direct descendants of a node. The Below constraint is spec-ified as: c/below::t, where c is the context node, and t is the target node.The score computed by the Below axis evaluation, is computed by the formula:wbelow(c, t) = 1
|desc arcs(c,t)| . Where desc arcs(c, t) is a function that returns the
set of unique descending arcs from c to t.The constraint Near is specified as a flexible axis of a path expression; it
allows to identify XML elements connected through any path to the contextnode. The axis allows to define a maximum distance n that acts as a thresholdon the number of arcs between the context node and the target node; nodes thedistance of which is more then n arcs are filtered out from the possible results.The Near syntax is: c/near(n)::t and the score for its evaluation is computed
as: wnear(c, t, n) =
{ 1|arcs(c,t)| if |arcs(c, t)| ≤ n
0 else.where c is the context node, t
is the current target node, n is the maximum allowed distance and arcs(c, e)returns the set of arcs in the shortest path between c and t.
3 Implementation
The new axes have been integrated into the BaseX XQuery engine by extendingboth its language interpreter and its XQuery evaluation processor to includea new score-structure Score Variable definition. BaseX has been chosen forbeing the first system (and the only one, to the best of our knowledge) to im-plement the full XQuery Full-Text language. As described in [3], BaseX adoptsan efficient indexing schema for XML documents. The XQuery FLOWR clauseshave been made capable to identify the new structural score variable, and to al-low its usage in sorting, ordering and results display. As an example the XQueryfor clause has been extended as follows:
ForClause ::="for" "$" VarName TypeDeclaration? PositionalVar? FTScoreVar?
StructScoreVar? "in" ExprSingle ("," "$" VarName TypeDeclaration?
PositionalVar? FTScoreVar? "in" ExprSingle)*
StructScoreVar ::= "score-structure" "$" VarName
where Varname is a valid variable name; TypeDeclaration is a variable typedeclaration; and ExprSingle is the actual query for node selection as defined inthe XQuery language. From the user point of view this approach offers unlimitedpossibilities of the usage of the new Structure Score Variable: the user can defineaggregation functions using the default XQuery constructs.
Fig. 1a shows an example of the Near constraint application: the queryperson//act/near::title is evaluated and the three gray title nodes arematched with a score of 0.3, for the act/movie/title node, and 0.25 for theother two nodes. In Fig. 1b the evaluation of the query person/below::name isshown: three name nodes are retrieved; person/name node with a score of 1 and0.3 for the other nodes.
30

(a) (b)
Fig. 1: Example of (a) Near and (b) Below constraint evaluation.
4 Evaluation
The performed evaluations compare the efficiency of all the new axes constraintswith the standard XPath/XQuery counterparts (if available): in particular forthe Below axis evaluation we executed each query using both the Below and thedescendant axes. Concerning the Near axis evaluation, instead, no counterpartcould be identified due to the innovative nature of the proposed axis.
The axes evaluations have been performed by using the IMDB INEX Data-Centric collection. Performance tests have been executed with an increasing sizeof the evaluated collection to verify the overhead introduced by the flexible axisevaluation in comparison with standard (if applicable) XPath axes constraints.Due to the nature of the BaseX indexing system that caches queries, result set,and opened databases, the evaluations have been performed by unloading theBaseX system between each run. All evaluation tests have been executed 5 times,and the average timings (removing the worst and the best results) are presented.
Below axis evaluation: The Below axis has been compared with the stan-dard descendant axis: both axes have been evaluated by executing the testwithout any query optimization introduced by BaseX. Five queries containingthe Below axis have been evaluated against each collection by measuring its ex-ecution time. The same query, with the Below axis replaced by the descendant
axis has then been executed and its timings compared. In Fig. 2 the evaluationresults are sketched: not surprisingly the Below axis evaluation takes more timethan the equivalent descendant axis to obtain the query results, due to thecomputation of the structural score. The Below axis evaluation takes in average36% more time than the execution of the descendant counterpart.
Near axis evaluation: The Near axis evaluation has been performed byusing the same IMDb collection used for the evaluation of the Below axis. Thequeries used during the evaluation process have been defined so as to require theBaseX engine to retrieve all the XML elements without neither adopting anyoptimization strategy nor any query re-writing; this aspect forced the BaseXsystem to perform a sequential analysis of the target nodes, and thus to provide acomplete execution of the Near axis evaluation. Furthermore the BaseX Full-Textindex has been avoided, further enforcing the complete iteration over any targetnode without using any BaseX pre-pruning strategy. These aspects allowed tomeasure the efficiency of the Near axis evaluation implementation.
31

Fig. 2: Comparison between Below and descendant axis evaluation.
5 Conclusions and Future Work
The Below and Near axes, semantically and syntactically defined in [5] havebeen implemented and evaluated on top of the BaseX system, where both thequery interpreter and the evaluation engine have been extended to identify andevaluate the new axes. The obtained results confirm that, although the flexibleevaluation of both axes requires relatively longer times, the proposed flexibleevaluation and the subsequent XML element ranking based on both textual andstructural constraints can be successfully introduced into the XQuery language.Ongoing works are being conducted related to the definition, alongside the BaseXdata structures, of ad-hoc indexes to better evaluate the new flexible constraintsby adopting efficient pruning techniques during target node identification, thusfurther improving the axis evaluation performance.
References
1. S. Amer-Yahia, C. Botev, and J. Shanmugasundaram. TeXQuery: A Full-TextSearch Extension to XQuery. In WWW ’04, pages 583–594. ACM, 2004.
2. S. S. Bhowmick, C. Dyreson, E. Leonardi, and Z. Ng. Towards non-directionalXpath evaluation in a RDBMS. In CIKM ’09, pages 1501–1504, 2009.
3. C. Grun. Storing and Querying Large XML Instances. PhD thesis, UniversitatKonstanz, December 2010.
4. C. Grun, S. Gath, A. Holupirek, and M. H. Scholl. XQuery Full Text Implementationin BaseX. In XSym ’09, pages 114–128, 2009.
5. E. Panzeri and G. Pasi. An Approach to Define Flexible Structural Constraints inXQuery. In AMT, pages 307–317, 2012.
6. B. Truong, S. Bhowmick, and C. Dyreson. Sinbad:towards structure-independentquerying of common neighbors xml databases. In DASFAA’12, pages 156–171. 2012.
7. W3C. XQuery/XPath FullText. www.w3.org/TR/xpath-full-text-10, March 2011.8. C. Yu and H. V. Jagadish. Querying Complex Structured Databases. In VLDB ’07,
pages 1010–1021, 2007.
32
Towards a qualitative analysis of diff algorithms
Gioele Barabucci, Paolo Ciancarini, Angelo Di Iorio, and Fabio Vitali
Department of Computer Science and Engineering, University of Bologna
Abstract. This paper presents an ongoing research on the qualitativeevaluation of diff algorithms and the deltas they produce. Our analysisfocuses on qualities that are seldom studied: instead of evaluating thespeed or the memory requirements of an algorithm, we focus on howmuch natural, compact and fit for use in a certain context the produceddeltas are. This analysis started as a way to measure the naturalnessof the deltas produced by JNDiff, a diff algorithm for XML-based liter-ary documents. The deltas were considered natural if they expressed thechanges in a way similar to how a human expert would do, an analysisthat could only be carried out manually. Our research efforts have ex-panded into the definition of a set of metrics that are, at the same time,more abstract (thus they capture a wider range of information about thedelta) and completely objective (so they can be computed by automatictools without human supervision).
1 Challenges in evaluating diff algorithms and deltas
The diff algorithms have been widely studied in literature and applied to very dif-ferent domains (source code revision, software engineering, collaborative editing,law making, etc.) and data structures (plain text, trees, graphs, ontologies, etc.).Their output is usually expressed as edit scripts, also called deltas or patches. Adelta is a set of operations that can be applied to the older document in orderto obtain the newer one. Deltas are hardly ever unique, since multiple differ-ent sequences of operations can be devised, all capable of generating the newerdocument from the older one.
Each algorithm uses its own strategies and data-structures to calculate the“best” delta. Some of them are very fast, others use a limited amount of memory,others are specialized for use in a specific domain and data format. Surprisinglyenough, the evaluation of the quality of the deltas has received little attention.
The historical reason is that most algorithms have been proposed by thedatabase community focusing more on efficiency rather than quality. Anotherreason is that the produced deltas are not easily comparable: not only eachalgorithm choose different sequences of changes, but they even use their owninternal model and recognize their own set of changes. For example, some algo-rithms detect moves while others do not, or the same name is used for differentoperations. Given this degree of heterogeneity, it is hard to evaluate the qualityof these algorithms in an automatic and objective way.
Nonetheless, we believe that such an evaluation is essential for the final usersand can effectively support them in selecting the best algorithm for their needs.
33

It is important, for instance, that the operations contained in a delta reflectmeaningful changes to the documents, i.e., the detected changes are as close aspossible to the editing operations that were actually performed by the authoron the original document. Our research started by studying a way to make thisquality more explicit.
2 A first manual approach: naturalness in JNDiff
In [2] we proposed an explicit metric useful in the evaluation, design and im-plementation of algorithms for diffing literary XML documents: the naturalness.Naturalness indicates how much an edit script resembles the changes effectivelyperformed by the author on a document.
In relation to naturalness, in [2] we:
– discussed an extensible set of natural operations that diff algorithms shouldbe able to detect, focusing on text-centric documents;
– presented an algorithm (NDiff) that detects many of these natural changes;– described JNDiff, a Java implementation of the NDiff algorithm together
with tools to apply the delta produced and highlight modifications;– presented a case study in detecting changes in XML-encoded legislative bills,
and described the benefits of natural deltas in improving the editing andpublishing workflow of such documents.
In our view, naturalness is a property connected to the human application andinterpretation of document editing, i.e., it can be fully validated only by peoplethat know the editing process. That is why we started researching into othermore objective ways to indirectly measure the naturalness.
The first approximation was to examine how close was the generated delta tothe description of the changes given by an expert. The first step to calculate suchapproximation is to create a gold standard (an ideal edit script) by comparingpairs of document versions, both visually and structurally. The second step isto identify clusters of changes in the delta of each algorithm that correspond tothe changes in the gold standard, and to assign a similarity value to each one,depending on a number of parameters. Most of these operations are manual: wemanually generate the gold standard, then we manually link the changes in thedelta to the clusters, dealing with different output formats.
The key part of the second step consists in assigning a score to each clusterof edit operations to assess its naturalness, taking into account these aspects:
1. Minimality of the cluster : we consider a cluster composed of a few sophisti-cated changes more natural than a cluster composed of many basic changes.
2. Minimality of the number of nodes: we rate as more natural clusters thataffect fewer nodes, either elements or text characters: this penalizes impreciseedit scripts and rewards scripts in which only the needed nodes are modified.
3. Minimality of the length of text nodes: we regard as more natural the editscripts in which the basic unit for text modifications are the single words,not whole paragraphs; the insertion/removal of big chunks of text where onlyfew characters have been changed is considered verbose and not natural.
34

The score of the i-th cluster of the delta is calculated as the inverse of a weightedsum of the above mentioned parameters. Further coefficients me, mn and mc areneeded to balance the weights (because, for instance, the number of charactersis on average much higher than the number of edit actions or of affected nodes).
nat (∆, i) = (we ×me × EDITSi + wn ×mn ×NODESi + wc ×mc × CHARSi)−1
Eventually, after various experiments on real-world documents, we instanti-ated the general formula as:
nat(∆, i) = (0.2 × EDITSi + 0.1 ×NODESi + 0.0077 × CHARSi)−1
3 Automated analysis
The JNDiff naturalness formula as presented has two main issues. First, itsevaluation is impossible to automate as it requires the identification of a goldstandard for each cluster of each delta and the ability to match the generatedchanges to the corresponding changes in the gold standard. Second, differentusers have different requests and expectations for a diff system and a singlemetric is not enough to show how well these requests are matched. Not onlythese requests are different, often they also conflict with each other: for examplein certain cases a cursory summary of what has changed is enough, while inothers an extreme level of detail is needed.
The idea of measuring objective indicators on the delta, on the other hand,is promising. The same idea of naturalness could be generalized and seen as oneof the many qualities of a delta.
In order to define metrics for analyzing deltas under multiple aspects andin an objective way, one has to rely on properties that can be extracted andelaborated by automatic tools without resorting to human evaluations. To reachthis goal we elaborated a universal delta model that works on linear texts, treesand graphs. This universal delta model is based on the concept of iterativerecognition of more meaningful changes starting from simple changes. Using thismodel we extracted the properties shown in table 1.
By themselves, the values of these properties say little about the variousqualities of the delta. However, once these properties have been extracted theyform the base upon which we build several metrics, each of which focused ona single aspect of the analyzed delta. For instance the measure of how muchredundant information has been included in a delta (the so called concisenessmetric) uses two properties of deltas: the number of modified elements and thenumber of referenced-yet-not-modified elements. We derived four key metrics,described in table 2.
Preliminary experiments showed that these metrics are useful to characterizediff algorithms. In particular, we compared the deltas produced by three well-known XML diff tools (JNDiff [2], XyDiff [1] and Faxma [3]) on a small datasetof real documents. The metrics highlighted, for example, the tendency of some
35
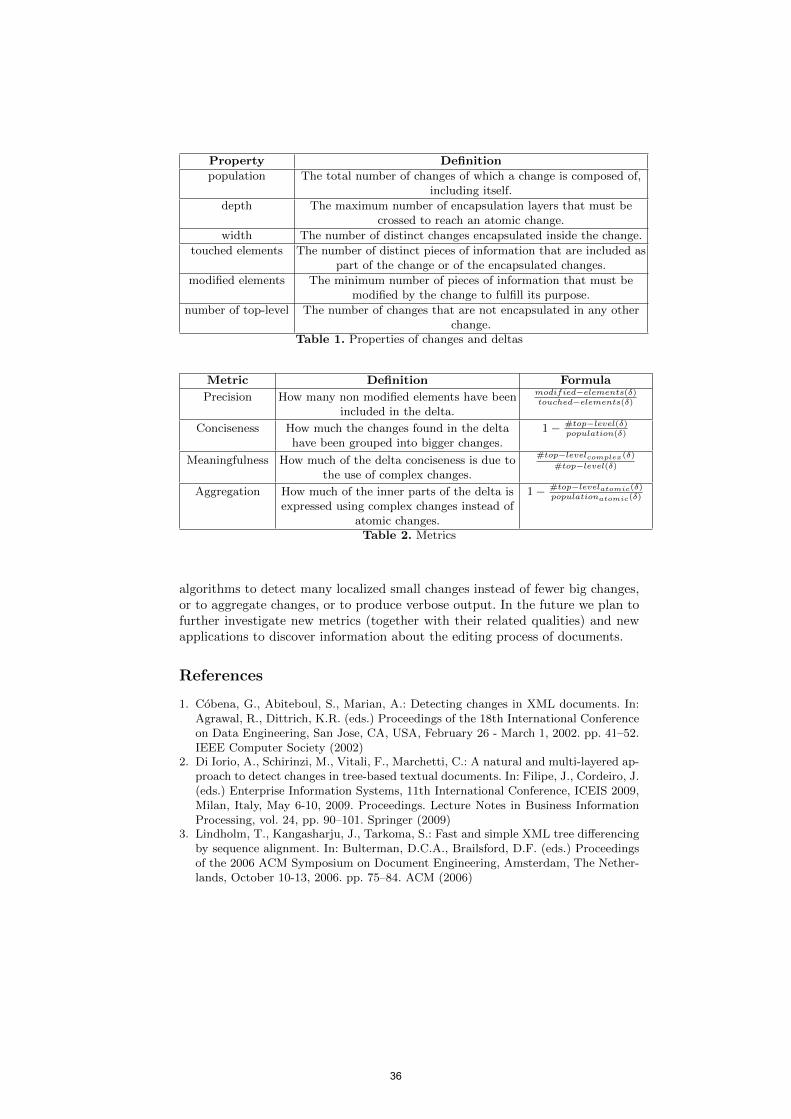
Property Definition
population The total number of changes of which a change is composed of,including itself.
depth The maximum number of encapsulation layers that must becrossed to reach an atomic change.
width The number of distinct changes encapsulated inside the change.
touched elements The number of distinct pieces of information that are included aspart of the change or of the encapsulated changes.
modified elements The minimum number of pieces of information that must bemodified by the change to fulfill its purpose.
number of top-level The number of changes that are not encapsulated in any otherchange.
Table 1. Properties of changes and deltas
Metric Definition Formula
Precision How many non modified elements have beenincluded in the delta.
modified−elements(δ)touched−elements(δ)
Conciseness How much the changes found in the deltahave been grouped into bigger changes.
1 − #top−level(δ)population(δ)
Meaningfulness How much of the delta conciseness is due tothe use of complex changes.
#top−levelcomplex(δ)
#top−level(δ)
Aggregation How much of the inner parts of the delta isexpressed using complex changes instead of
atomic changes.
1 − #top−levelatomic(δ)populationatomic(δ)
Table 2. Metrics
algorithms to detect many localized small changes instead of fewer big changes,or to aggregate changes, or to produce verbose output. In the future we plan tofurther investigate new metrics (together with their related qualities) and newapplications to discover information about the editing process of documents.
References
1. Cobena, G., Abiteboul, S., Marian, A.: Detecting changes in XML documents. In:Agrawal, R., Dittrich, K.R. (eds.) Proceedings of the 18th International Conferenceon Data Engineering, San Jose, CA, USA, February 26 - March 1, 2002. pp. 41–52.IEEE Computer Society (2002)
2. Di Iorio, A., Schirinzi, M., Vitali, F., Marchetti, C.: A natural and multi-layered ap-proach to detect changes in tree-based textual documents. In: Filipe, J., Cordeiro, J.(eds.) Enterprise Information Systems, 11th International Conference, ICEIS 2009,Milan, Italy, May 6-10, 2009. Proceedings. Lecture Notes in Business InformationProcessing, vol. 24, pp. 90–101. Springer (2009)
3. Lindholm, T., Kangasharju, J., Tarkoma, S.: Fast and simple XML tree differencingby sequence alignment. In: Bulterman, D.C.A., Brailsford, D.F. (eds.) Proceedingsof the 2006 ACM Symposium on Document Engineering, Amsterdam, The Nether-lands, October 10-13, 2006. pp. 75–84. ACM (2006)
36
On Suggesting Entities as Web Search QueriesExtended Abstract
Diego Ceccarelli1,2,3, Sergiu Gordea4, Claudio Lucchese1,Franco Maria Nardini1, and Raffale Perego1
1 ISTI-CNR, Pisa, Italy – {firstname.lastname}@isti.cnr.it2 IMT Institute for Advanced Studies Lucca, Lucca, Italy
3 Dipartimento di Informatica, Universita di Pisa, Pisa, Italy4 AIT GmbH, Wien, Austria – [email protected]
Abstract. The Web of Data is growing in popularity and dimension,and named entity exploitation is gaining importance in many researchfields. In this paper, we explore the use of entities that can be extractedfrom a query log to enhance query recommendation. In particular, weextend a state-of-the-art recommendation algorithm to take into accountthe semantic information associated with submitted queries. Our novelmethod generates highly related and diversified suggestions that we as-sess by means of a new evaluation technique. The manually annotateddataset used for performance comparisons has been made available tothe research community to favor the repeatability of experiments.
1 Semantic Query Recommendation
Mining the past interactions of users with the search system recorded in querylogs is an effective approach to produce relevant query suggestions. This is basedon the assumption that information searched by past users can be of interestto others. The typical interaction of a user with a Web search engine consistsin translating her information need in a textual query made of few terms. Webelieve that the “Web of Data” can be profitably exploited to make this processmore user-friendly and alleviate possible vocabulary mismatch problems.We adopt the Search Shortcuts (SS) model proposed in [1, 2]. The SS algo-rithm aims to generate suggestions containing only those queries appearing asfinal in successful sessions. The goal is to suggest queries having a high poten-tiality of being useful for people to reach their initial goal. The SS algorithmworks by efficiently computing similarities between partial user sessions (the onecurrently performed) and historical successful sessions recorded in a query log.Final queries of most similar successful sessions are suggested to users as searchshortcuts.
A virtual document is constructed by merging successful session, i.e., endingwith a clicked query. We annotate virtual documents to extract relevant namedentities. Common annotation approaches on query logs consider a single queryand try to map it to an entity (if any). If a query is ambiguous, the risk isto always map it to the most popular entity. On the other hand, in case of
37

ambiguity, we can select the entity with the highest likelihood of representingthe semantic context of a query.
We define Semantic Search Shortcuts (S3) the query recommender systemexploiting this additional knowledge. Please note that S3 provides a list of re-lated entities, differently from traditional query recommenders as SS that for agiven query produce a flat list of recommendations. We assert that entities canpotentially deliver to users much more information than raw queries.
In order to compute the entities to be suggested, given an input query q,we first retrieve the top-k most relevant virtual documents by processing thequery over the SS inverted index built as described above. The result set Rq
contains the top-k relevant virtual documents along with the entities associatedwith them. Given an entity e in the result set, we define two measures:
score(e,VD) =
{conf(e)× score(VD), if e ∈ VD.entities0 otherwise
score(e, q) =∑VD∈Rq
score(e,VD)
where conf(e) is the confidence of the annotator in mapping the entity e in thevirtual document VD, while score(VD) represents the similarity score returnedby the information retrieval system. We rank the entities appearing in Rq usingtheir score w.r.t. the query.
2 Experimental Evaluation
We used a large query log coming from the Europeana portal1, containing a sam-ple of users’ interactions covering two years (from August 27, 2010 to January,17, 2012). We preprocessed the entire query log to remove noise (e.g., queriessubmitted by software robots, mispells, different encodings, etc). Finally, we ob-tained 139,562 successful sessions. An extensive characterization of the querylog can be found in [3]. To assess our methodology we built a dataset consistingof 130 queries split in three disjoint sets: 50 short queries (1 term), 50 mediumqueries (on average, 4 terms), 30 long terms (on average, 9 terms). For eachquery in the three sets, we computed the top-10 recommendations produced bythe SS query recommender system and we manually mapped them to entitiesby using a simple interface providing an user-friendly way to associate entitiesto queries2.
We are interested in evaluating two aspects of the set of suggestions provided.These are our main research questions:
1 We acknowledge the Europeana Foundation for providing us the query logs used inour experimentation. http://www.europeana.eu/portal/
2 Interested readers can download the dataset from: http://hpc.isti.cnr.it/
˜ceccarelli/doku.php/sss.
38

Relatedness : How much information related to the original query a set ofsuggestions is able to provide?
Diversity : How many different aspects of the original query a set of suggestionsis able to cover?
To evaluate these aspects, we borrow from the annotators the concept ofsemantic relatedness between two entities proposed by Milne and Witten [4]:
rel(e1, e2) = 1− log(max(|IL(e1)|,|IL(e2)|))−log(|IL(e1)∪IL(e2)|)log(|KB|)−log(min(|IL(e1)|,|IL(e2)|))
where e1 and e2 are the two entities of interest, the function IL(e) returns theset of all entities that link to the entity e in Wikipedia, and KB is the wholeset of entities in the knowledge base. We extend this measure to compute thesimilarity between two set of entities (the function IL gets a set of entities andreturns all the entities that link at least on entity in the given set). At the sametime, given two sets of entities E1, E2, we define the diversity as div(E1, E2) =1 − rel(E1, E2). Given a query q, let Eq be the set of entities that have beenmanually associated with the query. We define the relatedness and the diversityof a list of suggestions Sq as:
Definition 1 The average relatedness of a list of suggestions is computed as:
rel(Sq) =
∑s∈Sq
rel(Es \ Eq, Eq)
|Sq|
where Es represents the set of entities mapped to a suggestion s (could containmore than one entity in the manual annotated dataset). Please note that weremove the entities of the original query from each set of suggestions as we arenot interested in suggesting something that do not add useful content w.r.t. thestarting query (Es \ Eq).
Definition 2 The average diversity of a list of suggestions is defined as:
div(Sq) =
∑s∈Sq
div(Es, ESq\s)
|Sq|
For each suggestion, we intend to evaluate how much information it addsw.r.t the other suggestions. ESq\s denotes the union of the entities belonging toall the suggestions except the current suggestion s.
Experimental Results: For each set of queries in the dataset described above(short, medium and long), we compared the average relatedness and the averagediversity of the recommendations generated by SS and by S3.
Figure 1 shows the average relatedness computed for each query q belongingto a particular set of queries. Results confirm the validity of our intuition as,for all the three sets, the results obtained by S3 are always better than theresults obtained by considering the SS suggestions. It is worth to observe thatthe longer the queries the more difficult the suggestion of related queries. This
39
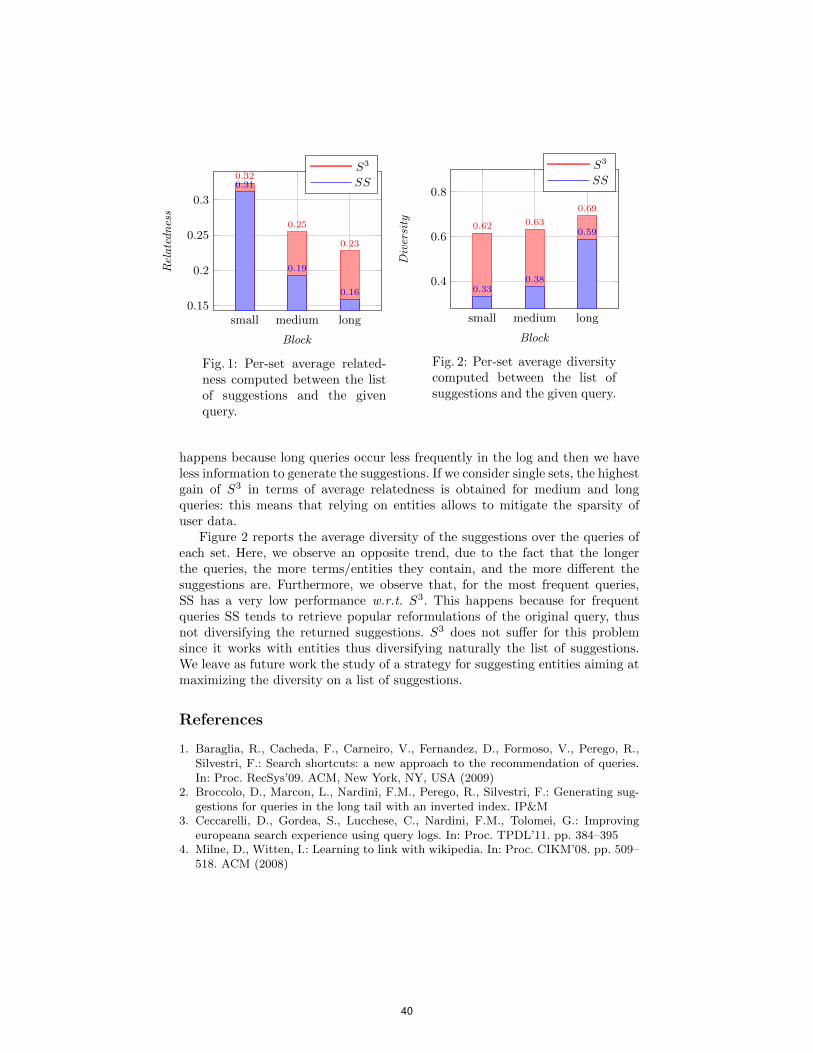
small medium long0.15
0.2
0.25
0.3
0.32
0.25
0.23
0.31
0.19
0.16
Block
Relatedness
S3
SS
Fig. 1: Per-set average related-ness computed between the listof suggestions and the givenquery.
small medium long
0.4
0.6
0.8
0.62 0.63
0.69
0.330.38
0.59
Block
Diversity
S3
SS
Fig. 2: Per-set average diversitycomputed between the list ofsuggestions and the given query.
happens because long queries occur less frequently in the log and then we haveless information to generate the suggestions. If we consider single sets, the highestgain of S3 in terms of average relatedness is obtained for medium and longqueries: this means that relying on entities allows to mitigate the sparsity ofuser data.
Figure 2 reports the average diversity of the suggestions over the queries ofeach set. Here, we observe an opposite trend, due to the fact that the longerthe queries, the more terms/entities they contain, and the more different thesuggestions are. Furthermore, we observe that, for the most frequent queries,SS has a very low performance w.r.t. S3. This happens because for frequentqueries SS tends to retrieve popular reformulations of the original query, thusnot diversifying the returned suggestions. S3 does not suffer for this problemsince it works with entities thus diversifying naturally the list of suggestions.We leave as future work the study of a strategy for suggesting entities aiming atmaximizing the diversity on a list of suggestions.
References
1. Baraglia, R., Cacheda, F., Carneiro, V., Fernandez, D., Formoso, V., Perego, R.,Silvestri, F.: Search shortcuts: a new approach to the recommendation of queries.In: Proc. RecSys’09. ACM, New York, NY, USA (2009)
2. Broccolo, D., Marcon, L., Nardini, F.M., Perego, R., Silvestri, F.: Generating sug-gestions for queries in the long tail with an inverted index. IP&M
3. Ceccarelli, D., Gordea, S., Lucchese, C., Nardini, F.M., Tolomei, G.: Improvingeuropeana search experience using query logs. In: Proc. TPDL’11. pp. 384–395
4. Milne, D., Witten, I.: Learning to link with wikipedia. In: Proc. CIKM’08. pp. 509–518. ACM (2008)
40
Visual Features Selection
Giuseppe Amato, Fabrizio Falchi, and Cladio Gennaro
ISTI-CNR, via G. Moruzzi 1, 56124 Pisa, Italy{giuseppe.amato,fabrizio.falchi,claudio.gennaro}@isti.cnr.it
Abstract. The state-of-the-art algorithms for large visual content recog-nition and content based similarity search today use the “Bag of Fea-tures” (BoF) or “Bag of Words” (BoW) approach. The idea, borrowedfrom text retrieval, enables the use of inverted files. A very well knownissue with the BoF approach is that the query images, as well as thestored data, are described with thousands of words. This poses obviousefficiency problems when using inverted files to perform efficient imagematching. In this paper, we propose and compare various techniques toreduce the number of words describing an image to improve efficiency.
Keywords: bag of features, bag of words, local features, content basedimage retrieval, landmark recognition
1 INTRODUCTION
During the last decade, the use of local features, as for instance SIFT [Lowe, 2004],has obtained an increasing appreciation for its good performance in tasks of im-age matching, object recognition, landmark recognition, and image classification.The total number of local features extracted from an image depends on its visualcontent and size. However, the average number of features extracted from an im-age is in the order of thousands. The BoF approach [Sivic and Zisserman, 2003]quantizes local features extracted from images representing them with the clos-est local feature chosen from a fixed visual vocabulary of local features (visualwords). Matching of images represented with the BoF approach is performedwith traditional text retrieval techniques.
However a query image is associated with thousands of visual words. There-fore, the search algorithm on inverted files has to access thousands of differentposting lists. As mentioned in [Zhang et al., 2009], ”a fundamental difference be-tween an image query (e.g. 1500 visual terms) is largely ignored in existing indexdesign. This difference makes the inverted list inappropriate to index images.”From the very beginning [Sivic and Zisserman, 2003] some words reduction tech-niques were used (e.g. removing 10% of the more frequent images).
To improve efficiency, many different approaches have been considered in-cluding GIST descriptos [Douze et al., 2009], Fisher Kernel [Zhang et al., 2009]and Vector of Locally Aggregated Descriptors (VLAD) [Jegou et al., 2010]. How-ever, their usage does not allow the use of traditional text search engine whichhas actually been another benefit of the BoF approach.
41

2 Giuseppe Amato, Fabrizio Falchi, and Cladio Gennaro
In order to mitigate the above problems, this paper proposes, discusses, andevaluates some methods to reduce the number of visual words assigned to images.This paper is a summary of a longer paper that will presented at VISAPP 2013[Amato et al., 2013].
2 PROPOSED APPROACH
The goal of the BoF approach is to substitute each description of the regionaround an interest points (i.e., each local features ) of the images with visualwords obtained from a predefined vocabulary in order to apply traditional textretrieval techniques to content-based image retrieval. At the end of the process,each image is described as a set of visual words. The retrieval phase is thenperformed using text retrieval techniques considering a query image as disjunc-tive text-query. Typically, the cosine similarity measure in conjunction with aterm weighting scheme is adopted for evaluating the similarity between any twoimages.
The proposed words reduction criteria are: random, scale, tf, idf, tf*id. Eachproposed criterion is based on the definition of a score that allows us to assigneach local feature or word, describing an image, an estimate of its importance.Thus, local features or words can be ordered and only the most important onescan be retained. The percentage of information to discard is configurable througha score threshold, allowing trade-off between efficiency and effectiveness. Therandom criterion was used as a baseline. It assigns random score to features.The scale criterion is based on the information about the size of the region fromwhich the local features was extracted: the larger the region, the higher the score.
The retrieval engine used in the experiments is built as following:
1. For each image in the dataset the SIFT local features are extracted for theidentified regions around interest points.
2. A vocabulary of words is selected among all the local features using thek-means algorithm.
3. The Random or Scale reduction techniques are performed (if requested).
4. Each image is described following the BoF approach, i.e., with the ID of thenearest word in the vocabulary to each local feature.
5. The tf, idf, or tf*idf reduction technique are performed (if requested).
6. Each image of the test set is used as a query for searching in the trainingset. The similarity measure adopted for comparing two images is the Cosinebetween the query vector and the image vectors corresponding to the setof words assigned to the images. The weight assigned to each word of thevectors are calculated using tf*idf measure.
7. In case the system is requested to identify the content of the image, thelandmark of the most similar image in the dataset (which is labeled) isassigned to the query image.
42

Visual Features Selection 3
3 Experimental results
The quality of the retrieved images is typically evaluated by means of precisionand recall measures. As in many other papers, we combined these information bymeans of the mean Average Precision (mAP), which represents the area belowthe precision and recall curve.
For evaluating the performance of the various reduction techniques approaches,we use the Oxford Building datasets that was presented in [Philbin et al., 2007]and has been used in many other papers. The dataset consists of 5,062 images of55 buildings in Oxford. The ground truth consists of 55 queries and related setsof results divided in best, correct, ambiguous and not relevant. The vocabularyused has one million words.
0
0.1
0.2
0.3
0.4
0.5
0.6
100 1000
mA
P
Avg Words per Image
tf*idf
idf
tf
scale
random
Fig. 1. Mean average precision of the various selection criteria obtained on the OxfordBuildings 5k dataset.
We first report the results obtained in a content based image retrieval scenariousing the Oxford Building dataset using the ground truth given by the authors[Philbin et al., 2007]. In Figure 1 we report the mAP obtained On the x-axiswe reported the average words per image obtained after the reduction. Notethat the x-axis is logarithmic. We first note that all the reduction techniquessignificantly outperform naive random approach and that both the idf and scaleapproaches are able to achieve very good mAP results (about 0.5) while reducingthe average number of words per image from 3,200 to 800. Thus, just taking the25% of the most relevant words, we achieve the 80% of the effectiveness. Thecomparison between the idf and scale approaches reveals that scale is preferablefor reduction up to 500 words per image. Thus, it seems very important todiscard small regions of interest up to 500 words.
While the average number of words is useful to describe the length of theimage description, it is actually the number of distinct words per image that have
43

4 Giuseppe Amato, Fabrizio Falchi, and Cladio Gennaro
0
0.1
0.2
0.3
0.4
0.5
0.6
100 1000
mA
P
Avg Distinct Words per Image
tf*idf
idf
tf
scale
random
Fig. 2. Mean average precision of the various selection criteria obtained on the OxfordBuildings 5k dataset.
more impact on the efficiency of searching using inverted index. Thus, in Figure2 we report mAP with respect to the average number of distinct words. In thiscase the results obtained by tf*idf and tf are very similar to the ones obtainedby idf. In fact, considering tf in the reduction results in a smaller number ofaverage distinct words per image for the same vales of average number of words.
References
[Amato et al., 2013] Amato, G., Falchi, F., and Gennaro, C. (2013). On reducing thenumber of visualwords in the bag-of-features representation. In VISAPP 2013 -Proceedings of the International Conference on Computer Vision Theory and Appli-cations.
[Douze et al., 2009] Douze, M., Jegou, H., Sandhawalia, H., Amsaleg, L., and Schmid,C. (2009). Evaluation of gist descriptors for web-scale image search. In Proceedings ofthe ACM International Conference on Image and Video Retrieval, CIVR ’09, pages19:1–19:8, New York, NY, USA. ACM.
[Jegou et al., 2010] Jegou, H., Douze, M., and Schmid, C. (2010). Improving bag-of-features for large scale image search. Int. J. Comput. Vision, 87:316–336.
[Lowe, 2004] Lowe, D. G. (2004). Distinctive image features from scale-invariant key-points. International Journal of Computer Vision, 60(2):91–110.
[Philbin et al., 2007] Philbin, J., Chum, O., Isard, M., Sivic, J., and Zisserman, A.(2007). Object retrieval with large vocabularies and fast spatial matching. In Pro-ceedings of the IEEE Conference on Computer Vision and Pattern Recognition.
[Sivic and Zisserman, 2003] Sivic, J. and Zisserman, A. (2003). Video google: A textretrieval approach to object matching in videos. In Proceedings of the Ninth IEEEInternational Conference on Computer Vision - Volume 2, ICCV ’03, pages 1470–,Washington, DC, USA. IEEE Computer Society.
[Zhang et al., 2009] Zhang, X., Li, Z., Zhang, L., Ma, W.-Y., and Shum, H.-Y. (2009).Efficient indexing for large scale visual search. In Computer Vision, 2009 IEEE 12thInternational Conference on, pages 1103 –1110.
44
Experimenting a Visual Attention Model in theContext of CBIR systems
Franco Alberto Cardillo, Giuseppe Amato, and Fabrizio Falchi
Istituto di Scienza e Tecnologie dell’InformazioneConsiglio Nazionale delle Richerche, Pisa, Italy
[email protected], [email protected],
Abstract. Many novel applications in the field of object recognitionand pose estimation have been built relying on local invariant featuresextracted from selected key points of the images. Such keypoints usuallylie on high-contrast regions of the image, such as object edges. However,the visual saliency of the those regions is not considered by state-of-theart detection algorithms that assume the user is interested in the wholeimage. Moreover, the most common approaches discard all the color in-formation by limiting their analysis to monochromatic versions of theinput images. In this paper we present the experimental results of theapplication of a biologically-inspired visual attention model to the prob-lem of local feature selection in landmark and object recognition tasks.The model uses color-information and restricts the matching between theimages to the areas showing a strong saliency. The results show that theapproach improves the accuracy of the classifier in the object recogni-tion task and preserves a good accuracy in the landmark recognition taskwhen a high percentage of visual features is filtered out. In both cases thereduction of the average numbers of local features result in high efficiencygains during the search phase that typically requires costly searches ofcandidate images for matches and geometric consistency checks.
1 Introduction
Given an image as query, a Content-Based Image Retrieval (CBIR) system re-turns a list of images ranked according to their visual similarity with the queryimage. When queried, it extracts the same features from the query image andcompare their values with those stored in the index, choosing the most similarimages according to a specified similarity measure. Many CBIR systems supportgeneral visual similarity searches using global features such as color and edge his-tograms. The adoption of descriptions based on local features based (e.g., SIFTand SURF), from the computer vision field, provided multimedia informationsystems with the possibility to build applications for different tasks, like, e.g.,object recognition and pose estimation.
However, the number of local visual features extracted from cluttered, real-world images is usually in the order of thousands. When the number is ‘too’ large,
45
2 Franco Alberto Cardillo, Giuseppe Amato, and Fabrizio Falchi
the overall performance of a CBIR system may decline. If too many features areextracted from ‘noise’, i.e., regions that are not relevant, not only the CBIRbecomes slower in its computations, but also its matching accuracy declines dueto many false matches among the features. The reduction of the number of visualfeatures used in the image descriptions can thus be considered a central pointin reaching a good overall performance in a CBIR system. If only the keypointsextracted from relevant regions are kept a great improvement might be reachedboth in the timings and the accuracy of the system.
In this work we present an approach concerning the application of a biologically-inspired visual attention model for filtering out part of the features in the images.The human visual system is endowed with attentional mechanisms able to selectonly those areas in the field of view that are likely to contain relevant informa-tion. The basic assumption of our experimental work is that the user chooses thequery image according to its most salient areas and expects the CBIR systemto return images with a similar appearance in their salient areas. The model weimplemented has a strong biological inspiration: it uses an image encoding thatrespects what is known about the early visual system by mimicking the biolog-ical processes producing the neural representation of the image formed by ourbrain. Since the biological inspiration does not bias the system towards specificfeatures, the approach can be used in generic image recognition tasks.
In order to assess quantitatively the performance of the visual attentionmodel, we tested it on two tasks: a landmark recognition task and an objectrecognition task using two publicly available datasets. The results show thatthe filtering of the features based on the image saliency is able to drasticallyreduce the number of keypoints used by the system with an improvement or justa slightly decrease in the accuracy of the classifier in, respectively, the objectrecognition task and the landmark recognition task.
The rest of this paper is organized as follows. The next section briefly dis-cusses the biological inspiration of our model. Section 4 describes the model ofvisual attention and its relationships with the biological facts introduced in sec-tion 3. Section 5 presents the datasets we used in the current experimentationand the results we obtained. The last section discusses the pros and the consof our approach and briefly delineates some research lines we will follow in thefuture.
2 Previous Works
Visual attention has been used to accomplish different tasks in the context ofContent Based Image Retrieval. For example, some works used attention as amean to re-rank the images returned after a query. However, since our focus ison image filtering, we will restrict our analysis to two recent approaches thatintroduce an attentional mechanism for reducing the number of features used bya CBIR system with the goal of improving both its speed and its accuracy.
[Marques et al., 2007] proposes a segmentation method that exploits visualattention in order to select regions of interest in a CBIR dataset with the idea of
46

Experimenting a Visual Attention Model in the Context of CBIR systems 3
using only those regions in the image similarity function. They use the saliencymap produced by the Itti-Koch model [Itti et al., 1998] for the selection of themost salient points of an image. The selected points are then used for segment-ing the image using a region growing approach. The segmentation algorithm isguided by the saliency computed by the Stentiford model of visual attention,whose output allows an easier and more precise segmentation than Itti-Koch’smodel. They experimented their methods on a dataset containing 110 images ofroad signs, red soda cans, and emergency triangles. Since that dataset is wellknown and used in other published experimentations, we used it in order to testour filtering approach.
[Gao and Yang, 2011] propose a method for filtering SIFT keypoints usingsaliency maps. The authors use two different algorithms for computing the imagesaliency, the Itti-Koch model (for local-contrast analysis) and a frequency-basedmethod (for global-contrast analysis) that analyzes the Fourier spectrum of theimage [Hou and Zhang, 2007]. The final saliency, corresponding to the simplesum of the saliency maps computed by the two methods, is used to start a seg-mentation algorithm based on fuzzy growing. They experimented their methodon a dataset composed by 10 classes with more than 10 images per class, ex-tracted from the ALOI image dataset and the Caltech 256 photo gallery. Theoriginal images were modified using various transformations. The authors showthat their method has a precision that is lower than standard SIFT and compa-rable to PCA-SIFT (a filtering approach based on Principal Component Anal-ysis). Even if the accuracy is not improved by the filtering, their approach ismuch faster than the other two and is thus suitable for use in CBIR systems.
In this work we experiment and evaluate a model of visual attention bothon the dataset described above and on a more complex dataset. The harderdataset contains a large number of real, cluttered photographies of monumentslocated in Pisa. The dataset contains pictures downloaded from Internet (e.g.,flickr images) that have not undergone any modification.
3 Biological Inspiration
When we open our eyes we see a colorful and meaningful three-dimensional worldsurrounding us. Such visual experience results from a sequence of transforma-tions performed on the light stimuli that starts in our eyes. The light is focusedon the retinal surface, then processed and transferred to our thalamus, and fi-nally routed to the cerebral cortex. The initial transformation is accomplishedby the retina, starting from the photoreceptors. Photoreceptors are connectedto bipolar cells in the middle retinal layer, which are then connected to thethird and final layer (the retinal output), populated by ganglion cells. Ganglioncells have a structured receptive field, i.e., they are connected to well-definedareas in the retina and do not react to the simple presence of a light stimulus.In particular, ganglion cells have a receptive field with a center–surround orga-nization [Kuffler, 1953]. For example, an on–center, off–surround ganglion cellreaches its maximum activity level when the light hits and fills the central part
47

4 Franco Alberto Cardillo, Giuseppe Amato, and Fabrizio Falchi
of the receptive-field and no light stimuli are present in the surround area. Theoutput of the ganglion cells reaches the striate cortex or area V1. In this layer,the cells start computing complex features; for example, V1 cells show prefer-ence for specific orientations. Colors are the results of a complex processing thattakes place at various stages in the processing pipeline described above. Cellsdescribed by the opponent process theory can be found as early as in the lastretinal layers: it is possible to find bipolar, ganglion (and later LGN cells) thathave a preferred wavelength with a center-surround organization. In particular,there are (R+, G-) cells, excited by a red centre and inhibited by a green sur-round, and (G+, R-), (B+, Y-), (Y+, B-), where ‘Y’ stands for yellow and ‘B’for blue. These cells, together with the achromatic channel composed by (Wh+,Bl-) and (Wh-, Bl+) cells (where ‘Wh’ stands for White and ‘Bl’ stands forBlack), allow our visual system to represent million of colors by combining theactivation patterns of the photoreceptors. Furthermore, this antagonism in colorprocessing makes the visual system responsive to discontinuities, as edges, thatare what best describe the shape of an object.
3.1 Visual Attention
The visual stimuli we receive contain a overwhelming amount of visual informa-tion, that is simply too ’large’ for our brain to process. Evolution has endowedhumans with a series of filters able to reduce the large amount of the incoming in-formation. A recent definition of visual attention can be found in [Palmer, 1999].Visual attention is defined as those processes that enable an observer to recruitresources for processing selected aspects of the retinal image more fully than non-selected aspects. Evidence gathered in several psychological experiments showsthat our attentional system can be roughly subdivided into two main compo-nents that operate very differently and at different stages. The first system, calledpreattentive, starts operating as soon as the light strikes the retinal photorecep-tors. It processes basic visual features, like color, orientation, size or movements,in parallel and over the entire field of view. This system is responsible of thevisual pop-out effect, i.e., the situations where an image area attracts our at-tention due to its differences with the rest of the other image parts. The secondsystem, called attentive, correspond to focused attention. When the target isnot recognized by the preattentive system, the attentive processing starts anduses information computed by the preattentive system in order to select spatialregions that might contain the target object. It necessarily operates sequentiallysince it needs to focus several spatial regions looking for specific object features.
According to the ”Feature Integration Theory” [Treisman and Gelade, 1980](FIT), the parallel, preattentive processes build an image representation withrespect to a single feature and encode the information in feature maps (color,orientation, spatial frequency, . . . ). The maps are combined and the their peaksof activity are inspected guided by a global map that summarize the informa-tion computed in the various dimensions. One of the most influential detailedmodels was proposed in [Koch and Ullman, 1985]. Such model is similar to FITin the description of the preattentive and attentive stages, but proposes some
48

Experimenting a Visual Attention Model in the Context of CBIR systems 5
Fig. 1. Example of the application of the visual attention model. Left: original image;Right: saliency map computed by the model: the brighter the pixel the more salientthe area surrounding it is.
intermediate structures able to give a plausible answer to the attentional shifts,both in visual pop-out and in conjunctive search.
4 The Computational Model
In this experimentation we implemented a bottom-up model of Visual Atten-tion that extends [Itti et al., 1998]. It is part of larger model that includes top-down attentional mechanisms for object learning and mechanisms. The modelperforms a multiresolution analysis of an input image and produces a saliencymap assigning a weight to each image pixel (area) according to the computedsaliency. The model is biologically-inspired: it encodes the image according towhat is known about the retinal and early cortical processing and elaboratesthe channels with algorithms that resemble the biological processes, even if onlyat a functional level. Biologically-inspired models use a less sophisticated imageencoding and processing than other approaches, but are not biased towards anyspecific visual feature. Less general approaches, that focus on specific featuresor measures for computing the saliency, are well suited for application domainscharacterized by a low variability in object appearance, but may fail when thecontent of the images is not restricted to any specific category. The bottom-upmodel performs a multiresolution image analysis by using in each processing stepa pyramidal representation of the input image. After encoding the input valuesusing five different channels for intensity and colors and four channels for theoriented features, it builds feature maps using a center-surround organizationand computes the visual conspicuity of each level in every pyramid. For eachlevel of the conspicuity pyramids, the model builds a local saliency map thatshows the saliency of the image areas at a given scale. The level saliency mapsare then merged into a unique, low-resolution global saliency map encoding theoverall saliency of image areas.
The input images are encoded using the Lab color space, where for each pixelthe channels L, a, and b corresponds, respectively, to the dimensions intensity
49

6 Franco Alberto Cardillo, Giuseppe Amato, and Fabrizio Falchi
(luminance), red-green, and blue-yellow. The Lab values are then split into fivedifferent channels: intensity, red, green, blue, and yellow. Each channel extractedfrom the image is then encoded in an image pyramid following to the algorithmdescribed in [Adelson et al., 1984,Greenspan et al., 1994].
4.1 Visual Features
The set of feature used by the model includes intensity and color, computedaccording to the center-surround receptive-field organization characterizing gan-glion and LGN cells, and oriented lines, computed in area V1. The raw l, a, bvalues are used to extract the color channels II, IR, IG, IB, and IY that corre-spond, respectively, to intensity, red, green, blue, and yellow. Local orientationmaps are computed on the intensity pyramid by convolving the intensity im-age in each layer with a set of oriented Gabor filters at four different orienta-tions θ ∈
{0, π4 ,
π2 ,
32π
}. Such filters provide a good model of the receptive fields
characterizing cortical simple cells [Jones and Palmer, 1987], as discussed in theprevious section. The filters used in the model implementation are expressed
as follows [Daugman, 1985]:F (x, y, , θ, ψ) = exp(−x2o+γ
2y2o2σ2 ) cos(2π
λ xo +ψ) wherexo = x cos θ + y sin θ yo = −x sin θ + y cos θ. Each image in the intensity im-age is convolved with Gabor filters of fixed size, in the current implementa-tion they are 15 × 15 pixels wide. The rest of the parameters is set as follows:γ = 0.3, σ = 3.6, λ = 4.6, since those values are compatible with actual mea-surements taken from real cells [Serre et al., 2007].
The model uses the center-surround organization as found in the ganglioncells for color and intensity information. The channel for intensity, for example,is encoded in two different contrast maps, the first one for the on-center/off-surround receptive fields, the second one for the off-centre/on-surround oppo-nency. Both types of cells present a null response on homogeneous areas, wherethe stimuli coming from the centre and the surround of the receptive field com-pensate each other.
The original model [Itti et al., 1998] uses double-opponent channels, meaningthat the red-green and green-red image encoding are represented by a same map.We used single-opponent channels since such choice allows us to distinguish, forexample, strong dark stimuli from strong light ones. In order to respect thebiological inspiration we use radial symmetric masks and we do not performacross-scale subtraction as in the original model. Basically, given two pyramidsof two different features f and f?, corresponding to the excitatory and the in-hibitory features of the contrast map, the feature corresponding to the centerof the receptive field is convolved with a Gaussian kernel G0 that provides theexcitatory response. The feature corresponding to the surround of the receptivefield is convolved with two different Gaussians G1, G2 with different sizes, thatvirtually provide the response of ganglion cells with different sizes of their re-ceptive fields. The results of the convolutions correspond to the inhibitory partof the receptive field.
The feature maps are computed for the following couples of ordered oppo-nent features: (R,G) and (G,R), encoding, respectively, red-on/green-off cells
50

Experimenting a Visual Attention Model in the Context of CBIR systems 7
and green-on/red-off opponencies; (B, Y ) and (Y,B), encoding, respectively,blue-on/yellow-off and yellow-on/blue-off opponencies. Furthermore, we encodecenter-surround differences for intensity in separate feature maps: Ion,off , Ioff,on.The two maps encode, respectively, on-centre/off-surround and off-centre/on-surround cells for intensity. The feature maps are hereafter denoted with RG,GR, BY , Y B, Ion,off , and Ioff,on. Since the oriented features are extractedusing differential operators, they do not need to be processed as the other maps.
Before building the saliency maps for each level of the image pyramid, weneed to merge the feature contrast maps in the same dimension: color, intensity,and orientation. This step is inspired by the FIT model, where parallel separablefeatures are computed in parallel, each one competing with features in the samedimension. For example, in order to build the feature conspicuity map for color,we need to merge in a single map the two contrast maps RG (obtained bymerging the R-G and G-R opponent channels) and BY. Simple summation orthe creation of a map with the average values among the various contrast mapsare not suited for the goal of creating a saliency map. For example, a red spotamong many green spot should be given a higher saliency value than the greenones: with a merging algorithm based on simple summation or on the averagered and green spot would receive the same weight. There are several strategiesthat could be used for modifying a map according to its relevance. Each strategytries to decrease the values in maps that contain many peaks of activation and toenhance the values in maps that have few regions of activity. We implemented amerging step based on Summed Area Tables (SATs). Each pixel (r, c) in a SATcontains the sum of the pixel values in the subimage with corners located atimage coordinates (0, 0) and (r, c), where the origin is the upper left corner.
In order to enhance maps with small spots of activity, for each pixel (r, c),we read the SAT value for a squared box centered at (r, c) with size equal to1% the minimum dimension of the feature map and the SAT value for the entireimage. Then we set the value for the feature conspicuity map using the followingformula: FCM(r, c) = cSAT +2·cSAT ·tanh (cSAT − sSAT ), where r and c are thecoordinates in the feature contrast map FCM , cSAT and sSAT are, respectively,the sum of the values in the box representing the center and the surround valuesread from the SAT. This normalization procedure is repeated several times inorder to inhibit weak regions while enhancing peaks of activity.
4.2 Saliency map
The final saliency map is created at the lowest resolution of the pyramid. Sev-eral options are available and we chose to set the value of each pixel p withthe maximum value of the areas in the image pyramid that are mapped ontop by the subsampling procedure. With respect to other solutions (average overthe maps, summation) the max pooling operation allows us to keep and high-light in the global saliency map also areas that are very salient at only a singlescale. By looking at pixels in the saliency map with high values, we can navigatethrough the pyramidal hierarchy to access the level where the maximum activa-tion is present and analyze the salient region. However, in this paper we limit
51

8 Franco Alberto Cardillo, Giuseppe Amato, and Fabrizio Falchi
our experimentation to the bottom-up part that limits its computations to thebottom-up part.
5 Experimentations
We tested the proposed VA-based filtering approach on one landmark recognitionand one objection recognition tasks using two different datasets:
– the publicly available dataset containing 1227 photos of 12 landmarks (ob-ject classes) located in Pisa (also used in the works [Amato et al., 2011],and [Amato and Falchi, 2011], [Amato and Falchi, 2010]), hereafter namedPISA-DATASET. The dataset is divided in a training set (Tr) consisting of226 photos (20% of the dataset) and a test set (Te) consisting of 921 photos(80% of the dataset).
– The publicly available dataset containing 258 photos belonging to threeclasses (cans, road signs, and emergency triangles), hereafter named STIM-DATASET. The dataset is similarly split into a training and a test set con-taining, respectively, 206 and 52 photos.
The experiments were conducted using the Scale Invariant Feature Transfor-mation (SIFT) [Lowe, 2004] algorithm that represents the visual content of animage using scale-invariant local features extracted from regions around selectedkeypoints. Such keypoints usually lie on high-contrast regions of the image, suchas object edges. Image matching is performed by comparing the description ofthe keypoints in two images searching for matching pairs. The candidate pairs formatches are verified to be consistent with a geometric transformation (e.g., affineor homography) using the RANSAC algorithm [Fischler and Bolles, 1981]. Thepercentage of verified matches is used to argue whether or not the two imagescontain the very same rigid object.
The number of local features in the description of the images is typically inthe order of thousands. This results in efficiency issues on comparing the contentof two images described with the SIFT descriptors. For this reason we applieda filtering strategy selecting only the SIFT keypoints extracted from regionswith a high saliency. Each image in the dataset was processed by the VA modelproducing a saliency map. Since the resolution of the saliency map is very low,each saliency map has been resized to the dimension of the input image.
5.1 PISA-DATASET
In order to study how many SIFT keypoints could be filtered out by the index, weapplied several thresholds on the saliency levels stored in the saliency map. Thethresholds range from 0.3 to 0.7 the maximum saliency value (normalized to 1).The 0.3 threshold did not modify at all any of the saliency maps, meaning thatall of the saliency maps had values larger than 0.3. SIFT keypoints were filteredout only when they corresponded to points in the saliency map with a valuebelow the given threshold. In order to see how effective the filtering by the VA
52
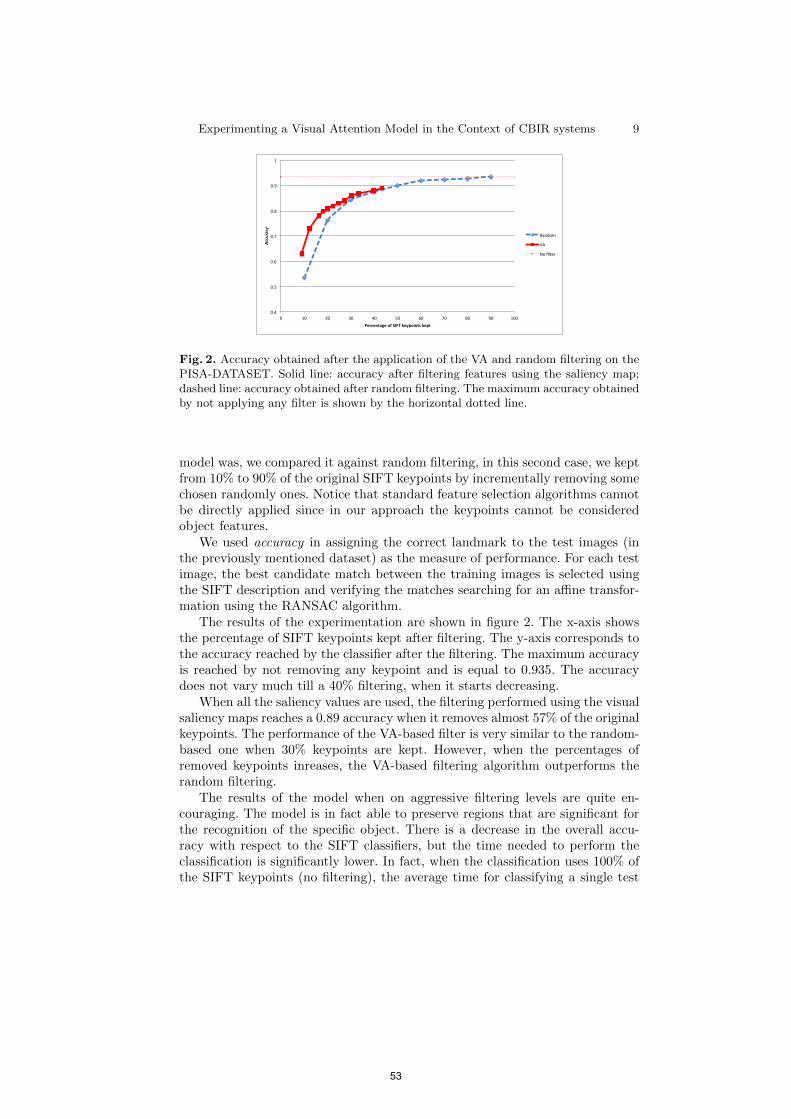
Experimenting a Visual Attention Model in the Context of CBIR systems 9
0.4
0.5
0.6
0.7
0.8
0.9
1
0 10 20 30 40 50 60 70 80 90 100
Accuracy
Percentage of SIFT keypoints kept
Random
VA
No filter
Fig. 2. Accuracy obtained after the application of the VA and random filtering on thePISA-DATASET. Solid line: accuracy after filtering features using the saliency map;dashed line: accuracy obtained after random filtering. The maximum accuracy obtainedby not applying any filter is shown by the horizontal dotted line.
model was, we compared it against random filtering, in this second case, we keptfrom 10% to 90% of the original SIFT keypoints by incrementally removing somechosen randomly ones. Notice that standard feature selection algorithms cannotbe directly applied since in our approach the keypoints cannot be consideredobject features.
We used accuracy in assigning the correct landmark to the test images (inthe previously mentioned dataset) as the measure of performance. For each testimage, the best candidate match between the training images is selected usingthe SIFT description and verifying the matches searching for an affine transfor-mation using the RANSAC algorithm.
The results of the experimentation are shown in figure 2. The x-axis showsthe percentage of SIFT keypoints kept after filtering. The y-axis corresponds tothe accuracy reached by the classifier after the filtering. The maximum accuracyis reached by not removing any keypoint and is equal to 0.935. The accuracydoes not vary much till a 40% filtering, when it starts decreasing.
When all the saliency values are used, the filtering performed using the visualsaliency maps reaches a 0.89 accuracy when it removes almost 57% of the originalkeypoints. The performance of the VA-based filter is very similar to the random-based one when 30% keypoints are kept. However, when the percentages ofremoved keypoints inreases, the VA-based filtering algorithm outperforms therandom filtering.
The results of the model when on aggressive filtering levels are quite en-couraging. The model is in fact able to preserve regions that are significant forthe recognition of the specific object. There is a decrease in the overall accu-racy with respect to the SIFT classifiers, but the time needed to perform theclassification is significantly lower. In fact, when the classification uses 100% ofthe SIFT keypoints (no filtering), the average time for classifying a single test
53
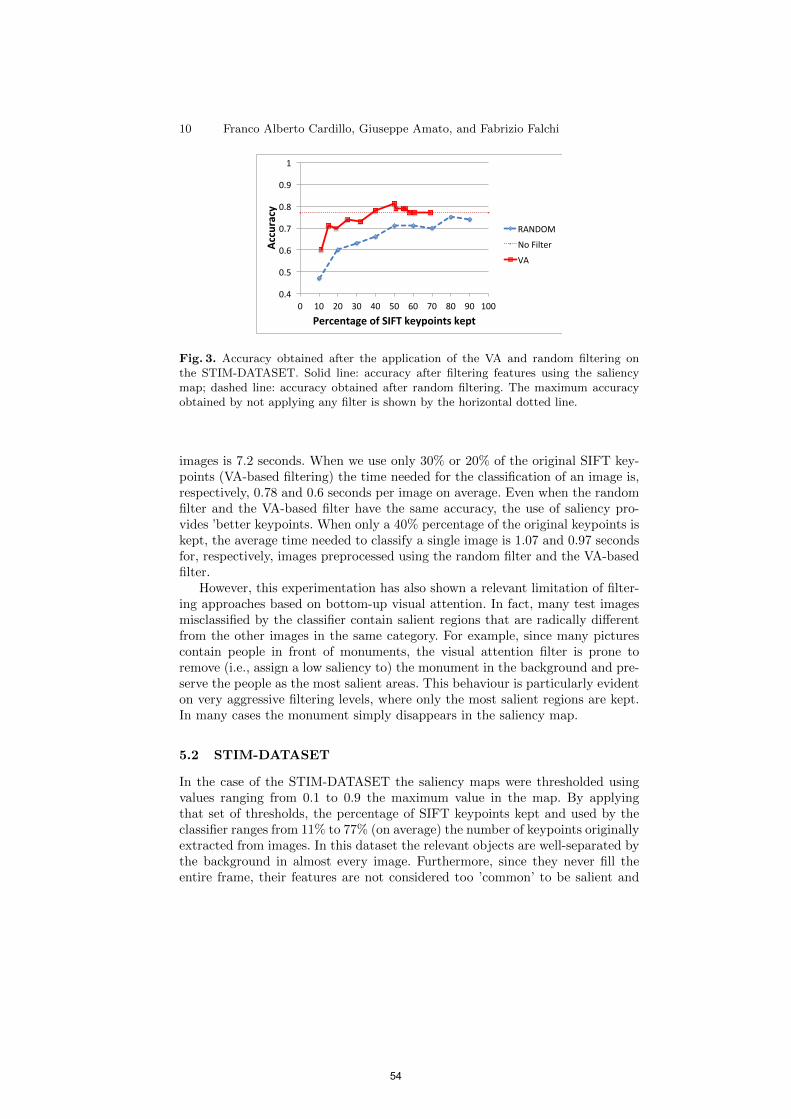
10 Franco Alberto Cardillo, Giuseppe Amato, and Fabrizio Falchi
0.4
0.5
0.6
0.7
0.8
0.9
1
0 10 20 30 40 50 60 70 80 90 100
Accuracy
Percentage of SIFT keypoints kept
RANDOM
No Filter
VA
Fig. 3. Accuracy obtained after the application of the VA and random filtering onthe STIM-DATASET. Solid line: accuracy after filtering features using the saliencymap; dashed line: accuracy obtained after random filtering. The maximum accuracyobtained by not applying any filter is shown by the horizontal dotted line.
images is 7.2 seconds. When we use only 30% or 20% of the original SIFT key-points (VA-based filtering) the time needed for the classification of an image is,respectively, 0.78 and 0.6 seconds per image on average. Even when the randomfilter and the VA-based filter have the same accuracy, the use of saliency pro-vides ’better keypoints. When only a 40% percentage of the original keypoints iskept, the average time needed to classify a single image is 1.07 and 0.97 secondsfor, respectively, images preprocessed using the random filter and the VA-basedfilter.
However, this experimentation has also shown a relevant limitation of filter-ing approaches based on bottom-up visual attention. In fact, many test imagesmisclassified by the classifier contain salient regions that are radically differentfrom the other images in the same category. For example, since many picturescontain people in front of monuments, the visual attention filter is prone toremove (i.e., assign a low saliency to) the monument in the background and pre-serve the people as the most salient areas. This behaviour is particularly evidenton very aggressive filtering levels, where only the most salient regions are kept.In many cases the monument simply disappears in the saliency map.
5.2 STIM-DATASET
In the case of the STIM-DATASET the saliency maps were thresholded usingvalues ranging from 0.1 to 0.9 the maximum value in the map. By applyingthat set of thresholds, the percentage of SIFT keypoints kept and used by theclassifier ranges from 11% to 77% (on average) the number of keypoints originallyextracted from images. In this dataset the relevant objects are well-separated bythe background in almost every image. Furthermore, since they never fill theentire frame, their features are not considered too ’common’ to be salient and
54

Experimenting a Visual Attention Model in the Context of CBIR systems 11
are not suppressed by the attentional mechanism. From the graph shown in Fig. 3it is clear that the VA-based filtering is able both to improve the accuracy and todecrease the time needed for the classification. By using only half the keypointsselected by the VA model, the classifier reaches 81% accuracy much greater thanthat obtained using 100% of the original keypoints or 90% randomly selected,that are equal to, respectively, 0.77 and 0.74.
6 Conclusions
In this paper we have presented a filtering approach based on a visual attentionmodel that can be used to improve the performance of large-scale CBIR systemsand object recognition algorithms. The model uses a richer image representationthan other common and well-known models and is able to process a single imagein a short time thanks to many approximations used in various processing steps.
The results show that a VA-based filtering approach allows to reach a betteraccuracy on object recognition tasks where the objects stand out clearly fromthe background, like in the STIM-DATASET. In these cases a VA-based filteringapproach reduces significantly the number of keypoints to be considered in thematching process and allows to reach a greater number of correct classifications.The results on the PISA-DATASET are encouraging: a faster response in theclassification step is obtained with only a minor decrease in accuracy. However,the results need a deeper inspection in order to gain a better understanding ofthe model on cluttered scene where the object (or landmark) to be detected doesnot correspond to the most salient image areas.
After this experimentation, we still think that bottom-up attention might beuseful in the context of image similarity computations. In the context of land-mark recognition, Better results could be obtained if the bottom-up processesreceive a kind of top-down modulation signal able to modify the computationof the image saliency according the searched object. In fact, without such kindof modulation, if a query image contains only a single object, that same objectmight not be salient in any other image in the dataset.
The experimentation suggests at least two research lines. The short termgoal is to evaluate the model for searching and retrieving images visually similarto a given query image. However, such goal requires the construction of a gooddataset enabling a quantitative evaluation of the results. Except in very simplecases, it is not very clear when and how to consider two images visually similar.The long term goal is to introduce a form of top-down attentional modulationthat enables object searches in very large datasets. Since CBIR systems usuallyrelies upon an image index, it is far from clear how the most common indexstructures might be modified for allowing the introduction of that modulation.
References
[Adelson et al., 1984] Adelson, E., Anderson, C., Bergen, J., Burt, P., and Ogden, J.(1984). Pyramid methods in image processing. RCA Engineer, 29(6):33–41.
55

12 Franco Alberto Cardillo, Giuseppe Amato, and Fabrizio Falchi
[Amato and Falchi, 2010] Amato, G. and Falchi, F. (2010). kNN based image classi-fication relying on local feature similarity. In SISAP ’10: Proceedings of the ThirdInternational Conference on SImilarity Search and APplications, pages 101–108, NewYork, NY, USA. ACM.
[Amato and Falchi, 2011] Amato, G. and Falchi, F. (2011). Local feature based imagesimilarity functions for kNN classfication. In Proceedings of the 3rd InternationalConference on Agents and Artificial Intelligence (ICAART 2011), pages 157–166.SciTePress. Vol. 1.
[Amato et al., 2011] Amato, G., Falchi, F., and Gennaro, C. (2011). Geometric con-sistency checks for knn based image classification relying on local features. In SISAP’11: Fourth International Conference on Similarity Search and Applications, SISAP2011, Lipari Island, Italy, June 30 - July 01, 2011, pages 81–88. ACM.
[Daugman, 1985] Daugman, J. (1985). Uncertainty relations for resolution in space,spatial frequency, and orientation optimized by two-dimensional visual cortical filters.Journal of the Optical Society of America A, 2:1160–1169.
[Fischler and Bolles, 1981] Fischler, M. A. and Bolles, R. C. (1981). Random sampleconsensus: A paradigm for model fitting with applications to image analysis andautomated cartography. Commun. ACM, 24(6):381–395.
[Gao and Yang, 2011] Gao, H.-p. and Yang, Z.-q. (2011). Integrated visual saliencybased local feature selection for image retrieval. In Intelligence Information Process-ing and Trusted Computing (IPTC), 2011 2nd International Symposium on, pages47 –50.
[Greenspan et al., 1994] Greenspan, H., Belongie, S., Perona, P., Goodman, R., Rak-shit, S., and Anderson, C. (1994). Overcomplete steerable pyramid filters and rotationinvariance. In Proceedings of the IEEE Conference on Computer Vision and PatternRecognition (CVPR94), pages 222–228.
[Hou and Zhang, 2007] Hou, X. and Zhang, L. (2007). Saliency detection: A spectralresidual approach. In Computer Vision and Pattern Recognition, 2007. CVPR ’07.IEEE Conference on, pages 1 –8.
[Itti et al., 1998] Itti, L., Koch, C., and Niebur, E. (1998). A model of saliency-basedvisual attention for rapid scene analysis. IEEE Transactions on Pattern Analysis andMachine Intelligence, 20(11):1254–1259.
[Jones and Palmer, 1987] Jones, J. and Palmer, L. (1987). An evaluation of the two-dimensional gabor filter model of simple receptive fields in cat striate cortex. Journalof Neurophysiology, 58:1233–1258.
[Koch and Ullman, 1985] Koch, C. and Ullman, S. (1985). Shifts in selective visualattention: towards the underlying neural circuitry. Human Neurobiology, 4:219–227.
[Kuffler, 1953] Kuffler, W. (1953). Discharge patterns and functional organization ofmammalian retina. Journal of Neurophysiology, 16:37–68.
[Lowe, 2004] Lowe, D. G. (2004). Distinctive image features from scale-invariant key-points. International Journal of Computer Vision, 60(2):91–110.
[Marques et al., 2007] Marques, O., Mayron, L. M., Borba, G. B., and Gamba, H. R.(2007). An attention-driven model for grouping similar images with image retrievalapplications. EURASIP J. Appl. Signal Process., 2007(1):116–116.
[Palmer, 1999] Palmer, S. (1999). Vision Science, Photons to phenomenology. TheMIT Press.
[Serre et al., 2007] Serre, T., Wolf, L., Bileschi, S., Riesenhuber, M., and Poggio, T.(2007). Robust object recognition with cortex-like mechanisms. IEEE Transactionson Pattern Analysis and Machine Intelligence, 29(3):411–426.
[Treisman and Gelade, 1980] Treisman, A. and Gelade, G. (1980). A feature-integration theory of attention. Cognitive Psychology, 12(1):97–136.
56
Cumulated Relative Position: A Metric forRanking Evaluation (Extended Abstract)?
Marco Angelini3, Nicola Ferro1, Kalervo Jarvelin2, Heikki Keskustalo2, AriPirkola2, Giuseppe Santucci3, and Gianmaria Silvello1
1 University of Padua, Italy{ferro,silvello}@dei.unipd.it2 University of Tampere, Finland
{kalervo.jarvelin,heikki.keskustalo,ari.pirkola}@uta.fi3 “La Sapienza” University of Rome, Italy{angelini,santucci}@dis.uniroma1.it
Abstract. The development of multilingual and multimedia informa-tion access systems calls for proper evaluation methodologies to ensurethat they meet the expected user requirements and provide the desiredeffectiveness. In this paper, we propose a new metric for ranking evalu-ation, the CRP.
1 Introduction and Motivations
The development of information access systems calls for proper evaluation method-ologies in particular for what is concerned with the evaluation of rankings. Arange of evaluation metrics, such as MAP and nDCG, are widely used and theyare particularly suitable to the evaluation of Information Retrieval (IR) tech-niques in terms of the quality of the output ranked lists, and often to somedegree suitable to the evaluation of user experience regarding retrieval. Unfor-tunately, the traditional metrics do not take deviations from optimal documentranking sufficiently into account. We think that a proper evaluation metric forranked result lists in IR should: (a) explicitly handle graded relevance includingnegative gains for unhelpful documents, and (b) explicitly take into account doc-ument misplacements in ranking either too early or too late given their degreeof relevance and the optimal ranking. In the present paper, we propose such anew evaluation metric, the Cumulated Relative Position (CRP).
We start with the observation that a document of a given degree of relevancemay be ranked too early or too late regarding the ideal ranking of documentsfor a query. Its relative position may be negative, indicating too early ranking,zero indicating correct ranking, or positive, indicating too late ranking. By cu-mulating these relative rankings we indicate, at each ranked position, the neteffect of document displacements, the CRP. CRP explicitly handles: (a) graded
? The extended version of this abstract has been published in [1].
57

relevance, and (b) document misplacements either too early or too late giventheir degree of relevance and the ideal ranking. Thereby, CRP offers several ad-vantages in IR evaluation: (i) at any number of retrieved documents examined(rank) for a given query, it is obvious to interpret and it gives an estimate ofranking performance; (ii) it is not dependent on outliers since it focuses on theranking of the result list; (iii) it is directly user-oriented in reporting the devia-tion from ideal ranking when examining a given number of documents; the effortwasted in examining a suboptimal ranking is made explicit.
2 Definition of Cumulated Relative Position
We define the set of relevance degrees as (REL,≤) such that there is an orderbetween the elements of REL. For example, for the set REL = {nr, pr, fr, hr},nr stands for “non relevant”, pr for “partially relevant”, fr for “fairly relevant”,hr stands for “highly relevant”, and it holds nr ≤ pr ≤ fr ≤ hr.
We define a function RW : REL → Z as a monotonic function which mapseach relevance degree (rel ∈ REL) into an relevance weight (wrel ∈ Z), e.g.RW(hr) = 3. This function allows us to associate an integer number to a rele-vance degree.
We define with D the set of documents we take into account, with N ∈ Na natural number, and with DN the set of all possible vectors of length Ncontaining different orderings of the documents in D. We can also say that avector in DN represents a ranking list of length N of the documents D retrievedby an IR system. Let us consider a vector v ∈ DN , a natural number j ∈ [1, N ],and a relevance degree rel ∈ REL, then the ground truth function is defined as:
GT :DN × N→ REL
v[j] 7→ rel(1)
Equation 1 allows us to associate a relevance degree to the document d ∈ Dretrieved at position j of the vector v, i.e. it associates a relevance judgment toeach retrieved document in a ranked list.
In the following, we define with r ∈ DN the vector of documents retrievedand ranked by a run r, with i ∈ DN the ideal vector containing the best rankingof the documents in the pool (e.g. all highly relevant documents are groupedtogether in the beginning of the vector followed by fairly relevant ones and soon and so forth), and with w ∈ DN the worst-case vector containing the worstrank of the documents retrieved by the pool (e.g. all the relevant documents areput in the end of the vector in the inverse relevance order).
From function GT we can point out a set called relevance support defined as:
RS(v, rel) = {j ∈ [1, N ] | GT(v, j) = rel} (2)
which, given a vector v ∈ DN – it can be a run vector r, the ideal vector i,or the worst-case vector w – and a relevance degree rel, contains the indexes j
58

of the documents of v with which the given relevance degree (rel) relevance isassociated.
Given the ideal vector i and a relevance degree rel, we can define the mini-mum rank in i as the first position in which we find a document with relevancedegree equal to rel. In the same way, we can define the maximum rank in i asthe last position in which we find a document with relevance degree equal to rel.In formulas, they become:
mini(rel) = min(RS(i, rel)
)maxi(rel) = max
(RS(i, rel)
) (3)
Given a vector v and a document at position j ∈ [1, N ], we can define theRelative Position (RP) as:
RP(v, j) =
0 if mini
(GT(v, j)
)≤ j ≤ maxi
(GT(v, j)
)j −mini(GT
(v, j)
)if j < mini
(GT(v, j)
)j −maxi(GT
(v, j)
)if j > maxi
(GT(v, j)
) (4)
RP allows for pointing out misplaced documents and understanding howmuch they are misplaced with respect to the ideal case i . Zero values denotedocuments which are within the ideal interval, positive values denote documentswhich are ranked below their ideal interval, and negative values denote docu-ments which are above their ideal interval. Note that the greater the absolutevalue of RP(v, j) is, the bigger is the distance of the document at position jfrom its ideal interval. From equation 4, it follows that RP(i, j) = 0, ∀j ∈ [1, N ].
Given a vector v and a document at position j ∈ [1, N ], we can define theCumulated Relative Position (CRP) as:
CRP(v, j) =
j∑k=1
RP(v, k) (5)
For each position j, CRP sums the values of RP up to position j included.From equation 5, it follows that CRP(i, j) = 0, ∀j ∈ [1, N ].
We can point out the following properties for CRP:
– CRP can only be zero or negative before reaching the rank of the recall base(R);
– the faster the CRP curve goes down before R, the worse the run is;– after R the CRP curve is non-decreasing;– after that the last relevant document has been encountered, CRP remains
constant;– the sooner we reach the x-axis (balance point: br), the better the run is.
In Figure 1 we can see a sketch of the CRP for a topic of a run. For a giventopic there are two fixed values which are the rank of recall base (R) and the
59

CRP
RankIdeal
Worst
= Rank of the Recall Base (fixed)
= Rank of the Balance Point of the run
= Number of Retrieved Documents (fixed)
Run
= Loss Value of the run (CRP@R)
= Rank of the Turn-Around Point of the run
= Loss Value of the worst-case
min R br
CRP(r, R)
min
R
brCRP(r, R)
N
CRP(w, R)
CRP(w, R)
N
0 100 200 300 400 500 600 700 800 900 1000−1
−0.5
0
0.5
1
1.5x 10⁴
Rank
Cum
ulat
ed R
elat
ive
Posi
tion
Cumulated Relative Position − Run APL985LC−360.txt; Topic 360
Fig. 1. Cumulative Relative Position sketch for a topic of a given run (on the left) andthe CRP curve of a real run taken from TREC7.
number of retrieved documents (N); this allows us to compare systems on theR basis.
The principal indicator describing the CRP curve of a topic for a given runwhich is the recovery value (ρ) defined as the ratio between R and br: ρ = R
br.
The recovery-value is always between 0 and 1 (0 < ρ ≤ 1) where ρ = 1indicates a perfect ranking and ρ→ 0 a progressively worse ranking. Please notethat ρ→ 0 when br →∞.
3 Final Remarks
We think that the CRP offers several advantages in IR evaluation because (a)it is obvious to interpret and it gives an estimate of ranking performance as asingle measure; (b) it is independent on outliers since it focuses on the ranking ofthe result list; (c) it directly reports the effort wasted in examining suboptimalrankings; (d) it is based on graded relevance.
Acknowledgements The work reported in this paper has been supported bythe PROMISE network of excellence (contract n. 258191) project as a part ofthe 7th Framework Program of the European commission (FP7/2007-2013).
References
1. M. Angelini, N. Ferro, K. Jarvelin, H. Keskustalo, A. Pirkola, G. Santucci, andG. Silvello. Cumulated Relative Position: A Metric for Ranking Evaluation. In In-formation Access Evaluation meets Multilinguality, Multimodality, and Visual An-alytics. Proc. of the 3rd Int. Conf. of the CLEF Initiative (CLEF 2012). LectureNotes in Computer Science (LNCS) 7488, Springer, Heidelberg, Germany, 2012.
60

Visual Interactive Failure Analysis: SupportingUsers in Information Retrieval Evaluation
(Extended Abstract)?
Marco Angelini2, Nicola Ferro1, Giuseppe Santucci2, and Gianmaria Silvello1
1 University of Padua, Italy{ferro,silvello}@dei.unipd.it
2 “La Sapienza” University of Rome, Italy{angelini,santucci}@dis.uniroma1.it
Abstract. Evaluation has a crucial role in Information Retrieval (IR)and developing tools to support researchers and analysts when analyzingresults and investigating strategies to improve IR system performancecan help make the analysis easier and more effective. To this purposewe present a Visual Analytics-based approach to support the analyst inperforming failure and what-if analysis.
1 Introduction
Designing, developing, and testing an IR system is a challenging task, especiallywhen it comes to understanding and analysing the behaviour of the system underdifferent conditions in order to tune or to improve it as to achieve the level ofeffectiveness needed to meet the user expectations.
Failure analysis is especially resource demanding in terms of time and humaneffort, since it requires inspecting, for several queries, system logs, intermediateoutput of system components, and, mostly, long lists of retrieved documentswhich need to be read one by one in order to try to figure out why they havebeen ranked in that way with respect to the query at hand.
Considering this, it is important to define new ways to help IR researchers,analysts and developers to understand the limits and strengths of the IR systemunder investigation. Visual analytics techniques can give assistance to this pro-cess by providing graphic tools which interacting with IR techniques may easethe work of the users.
The goal of this paper is to exploit a visual analytics approach to designa methodology and develop an interactive visual system which support IR re-searchers and developers in conducting experimental evaluation and improvingtheir systems by: (i) reducing the effort needed to conduct failure analysis; (ii)allowing them to anticipate what the impact of a modification to their systemcould be before needing to actually implement it.
? The extended version of this abstract has been published in [1].
61

Fig. 1. The Visual Analytics prototype.
2 Failure Analysis
As far as the failure analysis is concerned, we introduce a ranking model thatallows us to understand what happens when you misplace documents with dif-ferent relevance grades in a ranked list. The proposed ranking model is able toquantify, rank by rank, the gain/loss obtained by an IR system with respect toboth the ideal ranking, i.e. the best ranked list that can be produced for a giventopic, and the optimal ranking, i.e. the best ranked list that can be producedusing the documents actually retrieved by the system.
Starting from the Discounted Cumulative Gain (DCG) measures, we intro-duce two functions: the relative position, which quantifies how much a documenthas been misplaced with respect to its ideal (optimal) position, and the deltagain, which quantifies how much each document has gained/lost with respect toits ideal (optimal) DCG. On top of this ranking model, we propose a visualiza-tion, see Figure 1, where the DCG curves for the experiment ranking, the idealranking, and the optimal ranking are displayed together with two bars, on theleft, representing the relative position and the delta gain. Please note that anequivalent graph can be obtained by using nDCG in the place of DCG.
The proposed ranking model and the related visualization are quite innova-tive because, usually, information visualization and visual analytics are exploitedto improve the presentation of the results of a system to the end user, ratherthan applying them to the exploration and understanding of the performancesand behaviour of an IR system. Secondly, comparisons are usually made withrespect to ideal ranking only while our method allows user to compare a systemalso which respect to the optimal ranking produced with the system results, thusgiving the possibility of better interpreting the obtained results [2].
62

Fig. 2. Data pipeline.
3 What-If Analysis
When it comes to the what-if analysis, i.e. allowing users to anticipate the impactof a modification, we allow them to simulate what happens when you change theranking of a given document for a certain topic not only in terms of which otherdocuments will change their rank for that topic but also in terms of the effectthat this change has on the ranking of the other topics. In other terms, we tryto give the user an estimate of the “domino effect” that a change in the rankingof a single document can have. Moreover, when you simulate the move of asingle document (and all the related documents), you produce a new rankingfor a given topic which corresponds to a new version of your system, in ourcase a bug fixing in a component of the system. However, this new version ofthe system will now behave differently when ranking documents for the othertopics in your experimental collection. Therefore, a change in the system whichpositively affects the performances on topic t1 may have the side-effect to bedetrimental for the performances on topic t2 and we would like to give users anestimate also of this kind of “domino effect”.
Therefore, the overall goal is to have an initial raw estimate of the effect ofa planned modification before actually implementing it in terms of effect bothfor the topic under examination and for the other topics. This gives researchersand developers the possibility of exploring several alternatives before having toimplement them and of determining a reasonable trade-off between the effortand costs for given modifications and the expected improvements.
Figure 2 shows the block diagram describing the pipeline of the data ex-changed in the whole process. We consider the general-purpose IR scenario com-posed by a set of topics T , a collection of documents D, and a ranking modelRM; an IR system for a given topic tk ∈ T retrieves a set of documents Dj ⊆ D.
63

The ranking model RM generates for each topic tk ∈ T a ranked documentlist RLj . The whole set of ranked lists constitute the input for building theClustering via Learning to Rank Model that is in charge of generating, for eachdocument, a similarity cluster. The Visualization deals with one topic t at time:it takes as input the ranked document list for the topic t and the ideal rankedlist, obtained choosing the most relevant documents in the collection D for thetopic t and ordering them in the best way. While visually inspecting the rankedlist, it is possible to simulate the effect of interactively reordering the list, movinga target document d and observing the effect on the ranking while this shift ispropagated to all the documents of the cluster containing the documents similarto d. This cluster of documents simulates the “domino effect” within the giventopic t.
When the analyst is satisfied with the results, i.e. when he has produced anew ranking of the documents that corresponds to the effect that is expectedby modifications that are planned for the system, he can feed the Clusteringvia Learning to Rank Model with the newly produced ranked list, obtain a newmodel which takes into account the just introduced modifications, and inspectingthe effects of this new model for other topics. This re-learning phase simulatesthe “domino effect” on the other topics different from t caused by a possiblemodification in the system.
4 Final Remarks
This paper presented a fully-fledged analytical and visualization model to sup-port interactive exploration of IR experimental results. The overall goal of thepaper has been to provide users with tools and methods to investigate the perfor-mances of a system and explore different alternatives for improving it avoidinga continuous iteration of trials-and-errors to see if the proposed modificationsactually provide the expected improvements.
Acknowledgements The work reported in this paper has been supported bythe PROMISE network of excellence (contract n. 258191) project as a part ofthe 7th Framework Program of the European commission (FP7/2007-2013).
References
1. M. Angelini, N. Ferro, G. Santucci, and G. Silvello. Visual Interactive Failure Anal-ysis: Supporting Users in Information Retrieval Evaluation. In J. Kamps, W. Kraaij,and N. Fuhr, editors, Proc. 4th Symposium on Information Interaction in Context(IIiX 2012). ACM Press, New York, USA, 2012.
2. E. Di Buccio, M. Dussin, N. Ferro, I. Masiero, G. Santucci, and G. Tino. To Re-rank or to Re-query: Can Visual Analytics Solve This Dilemma? In Multilingual andMultimodal Information Access Evaluation. Proc. of the 2nd Int. Conf. of the Cross-Language Evaluation Forum (CLEF 2011), pages 119–130. LNCS 6941, Springer,Heidelberg, Germany, 2011.
64
Myusic: a Content-based Music RecommenderSystem based on eVSM and Social Media
Cataldo Musto1, Fedelucio Narducci2, Giovanni Semeraro1,Pasquale Lops1, and Marco de Gemmis1
1 Department of Computer ScienceUniversity of Bari Aldo Moro, Italy
[email protected] Department of Information Science, Systems Theory, and Communication
University of Milano-Bicocca, [email protected]
Abstract. This paper presents Myusic, a platform that leverages socialmedia to produce content-based music recommendations. The design ofthe platform is based on the insight that user preferences in music canbe extracted by mining Facebook profiles, thus providing a novel and ef-fective way to sift in large music databases and overcome the cold-startproblem as well. The content-based recommendation model implementedin Myusic is eVSM [4], an enhanced version of the vector space modelbased on distributional models, Random Indexing and Quantum Nega-tion. The effectiveness of the platform is evaluated through a preliminaryuser study performed on a sample of 50 persons. The results showed that74% of users actually prefer recommendations computed by social media-based profiles with respect to those computed by a simple heuristic basedon the popularity of artists, and confirmed the usefulness of performinguser studies because of the different outcomes they can provide withrespect to offline experiments.
1 Introduction and Related Work
One of the main issues of the so-called personalization pipeline is preference ac-quisition and elicitation. That step has always been considered the bottleneckin recommendation process since classical approaches for gathering user prefer-ences are usually time consuming or intrusive. The widespread diffusion of socialnetworks in the age of Web 2.0 offers a new interesting chance to overcome thatproblem, since users spend 22% of their time on social networks3 and 30 bil-lion pieces of content are shared on Facebook every month [3]. In this scenario,to harvest social media is a recent trend in the area of Recommender Systems(RSs): it can merge the un-intrusiveness of implicit user modeling with the accu-racy of explicit techniques, since the information left by users is freely providedand actually reflects real preferences.
3 http://blog.nielsen.com/nielsenwire/social/
65

This paper presents Myusic, a tool that provides users with music recom-mendations. The goal of the system is to catch user preferences in music andfilter the huge amount of data stored in platforms such as iTunes or Amazonin order to produce personalized suggestions about artists users could like. Thefiltering model behind Myusic is eVSM, an enhanced extension of VSM based ondistributional models, Random Indexing and Quantum Negation. As introducedin [4], eVSM provides a lightweight semantic representation based on distribu-tional models, where each artist (and the user profile, as well) is modeled as avector in a semantic vector space, according to the tags used to describe herand the co-occurrences between the tags themselves. The model is based on theassumption that a user profile can be built by combining the tag-based repre-sentation (obtained by crawling Last.fm platform) of the artists she is interestedin. Next, classical similarity measures can be exploited to match item descrip-tions with content-based user profiles. A prototype version of Myusic was madeavailable online for two months in order to design a user study and evaluate theeffectiveness of the model as well as its impact on real users.
Generally speaking, this work concerns to the area of music recommendation.The commonly used technique for providing recommendations is collaborativefiltering, implemented in very well known services, such as MyStrands4, Last.fm5
or iTunes Genius. An early attempt to recommend music using collaborativefiltering was done by Shardanand [8]. Another trend is to use content-basedrecommendation strategies, which analyze diverse sets of low-level features (e.g.harmony, rhythm, melody), or high-level features (metadata or content-baseddata available in social media) [2] to provide recommendations. The use of LinkedData for music recommendation is investigated in [6]. Recently, Bu et al. [1]followed the recent trend of harvesting information coming from social media forpersonalization tasks and proposed its application for music recommendation.Finally, Wang et al. [9] showed the usefulness of tags with respect to othercontent-based sources.
The paper is organized as follows: the architecture of the systems is sketchedin Section 2; Section 3 focuses on the results of a preliminary experimentalevaluation and finally Section 4 contains conclusions and directions for futureresearch.
2 Myusic: content-based music recommendations
The general architecture of Myusic is sketched in Figure 1. We can identify fourmain components:
Crawler. The Crawler module queries Last.fm through its public APIs tobuild a corpus of available artists. For each artist, the name, a picture, the titleof the most popular tracks, their playcount and a set of tags that describe thatartist are crawled. All the crawled data are locally stored.
4 http://www.mystrands.com5 http://www.last.fm
66

Fig. 1. Myusic architecture
Extractor. The Extractor module connects to Facebook, extracts artiststhe user likes (Favourite Music section in the Facebook profile, see Figure 2), andmaps them to the data gathered from Last.fm in order to build a preliminary setof artists the user likes. This information is locally modeled in her own profile tolet her receive recommendations even in her first interaction with Myusic, thusavoiding the cold-start. Implicit information coming from the links posted bythe user and the events she attended are extracted, as well.
Fig. 2. User Preferences from a Facebook profile
Profiler. The process of building user profiles is performed in two steps.First, a weight is assigned to each artist returned by the Extractor. Theweight of a specific artist is defined according to a simple heuristic: if a userposted a song, that information can be considered as a light evidence of herpreference for that artist, while the fact that she explicitly clicked on ”Like”on her Facebook page can be considered as a strong evidence. For example,
67

on a 5-point Likert scale, a score equal to 3 is assigned to the artists whosename appear among the links posted by the user, while a score equal to 4 isassigned to those occurring in her favorite Facebook pages. If an artist occursin both lists (that is to say, the user likes it and posted a song, as well), 5 outof 5 is assigned as score. Next, a profiling model has to be chosen. The eVSMframework provides four different profiling models [5]: a basic profile (referred toas RI ), a simple variant that exploits negative user feedbacks (called QN ), andtwo weighted counterparts which give greater weight to the artists a user likedthe most (respectively, W-RI and W-QN). Regardless the profiling model, ineVSM user profiles are defined in eVSM by means of two vectors, p+u and p−u,which represent user preferences and negative feedbacks, respectively. They aredefined as follows:
p+u =
|I+u |∑
i=1
ai ∗ r(u, ai) (1)
p−u =
|I−u |∑
i=1
ai ∗ (MAX − r(u, ai)) (2)
where I+u is the set of user favorite artists, I−u is the set of artists the userdislikes, MAX is the highest rating that can be assigned to an item, r(u, ai) isthe score assigned to the artist ai and ai is the vector space representation of theartist. Since each artist is described through a set of tags t1 . . . tn extracted fromLast.fm, the vector space representation is a weighted vector ai = (wt1 , . . . , wtn)where wti is the weight of the tag ti. Generally speaking, W-QN model combinesp+u with p−u through a Quantum Negation operator implemented in eVSMframework, while W-RI model exploits only the information coming from p+u
and does not take into account negative feedback. Finally, RI and QN follow thesame insight of their weighted counterpart with the difference that they do notexploit the user rating r(u, ai), thus a uniform weight is given to each artist.
Recommender. Given a semantic vector space representation based on dis-tributional models for both artists and user profiles, through similarity measuresit is possibile to produce as output a ranked list of suggested artists. The cosinesimilarity for all the possible couples (pu,a) is computed, where pu is the vectorspace representation of user u, while a is the vector describing the artist a. Fig-ure 3 shows an example of recommendation list. The platform allows the userto express feedbacks on recommendations. Positive and negative feedbacks areused to respectively update positive and negative profile vectors and to triggerthe recommendation process again.
3 Experimental Evaluation
The goal of the experimental evaluation is to validate the design of the platformby carrying out a user study whose goal is to analyze the impact and the effective-
68
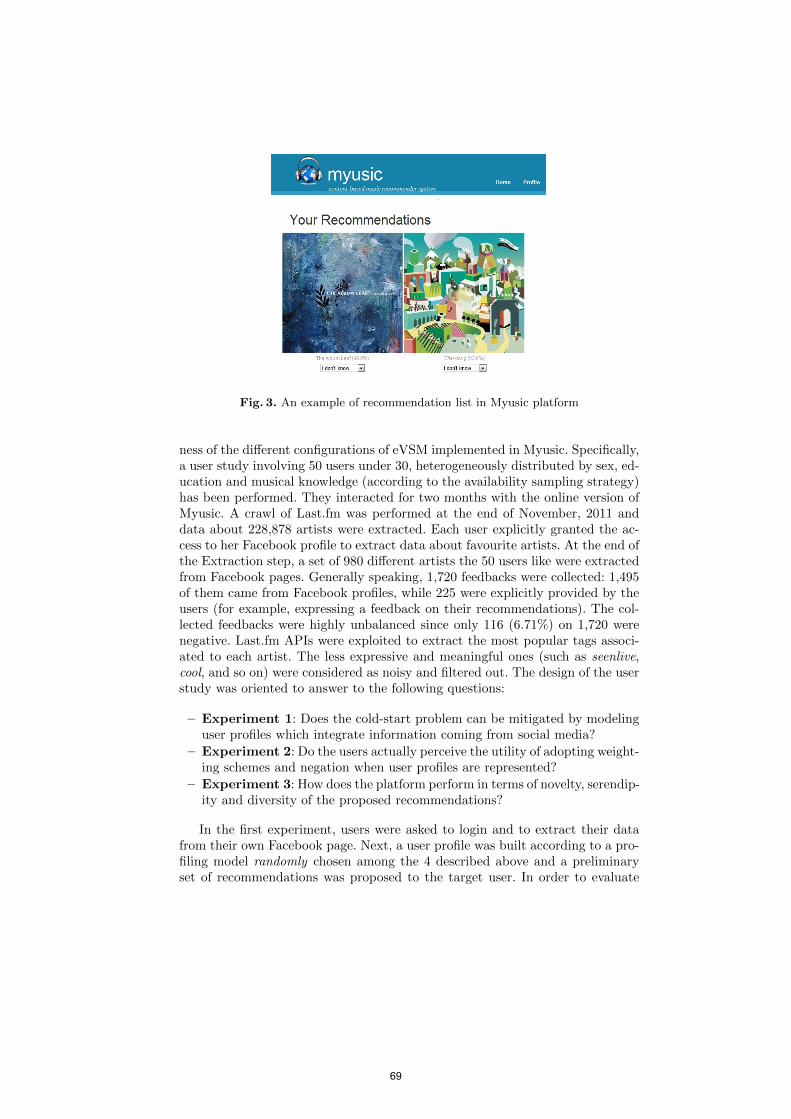
Fig. 3. An example of recommendation list in Myusic platform
ness of the different configurations of eVSM implemented in Myusic. Specifically,a user study involving 50 users under 30, heterogeneously distributed by sex, ed-ucation and musical knowledge (according to the availability sampling strategy)has been performed. They interacted for two months with the online version ofMyusic. A crawl of Last.fm was performed at the end of November, 2011 anddata about 228,878 artists were extracted. Each user explicitly granted the ac-cess to her Facebook profile to extract data about favourite artists. At the end ofthe Extraction step, a set of 980 different artists the 50 users like were extractedfrom Facebook pages. Generally speaking, 1,720 feedbacks were collected: 1,495of them came from Facebook profiles, while 225 were explicitly provided by theusers (for example, expressing a feedback on their recommendations). The col-lected feedbacks were highly unbalanced since only 116 (6.71%) on 1,720 werenegative. Last.fm APIs were exploited to extract the most popular tags associ-ated to each artist. The less expressive and meaningful ones (such as seenlive,cool, and so on) were considered as noisy and filtered out. The design of the userstudy was oriented to answer to the following questions:
– Experiment 1: Does the cold-start problem can be mitigated by modelinguser profiles which integrate information coming from social media?
– Experiment 2: Do the users actually perceive the utility of adopting weight-ing schemes and negation when user profiles are represented?
– Experiment 3: How does the platform perform in terms of novelty, serendip-ity and diversity of the proposed recommendations?
In the first experiment, users were asked to login and to extract their datafrom their own Facebook page. Next, a user profile was built according to a pro-filing model randomly chosen among the 4 described above and a preliminaryset of recommendations was proposed to the target user. In order to evaluate
69
the effectiveness of the Extractor we compared the recommendation list gen-erated through eVSM to a baseline represented by a list produced by simplyranking the most popular artists. Next, we asked users to tell which list theypreferred. Obviously, they were not aware about which list was the baseline andwhich one was built through eVSM. A plot that summarizes users’ answers isprovided in Figure 4-a. It is straightforward to note that users actually prefersocial media-based recommendations, since 74% of them preferred that strat-egy with respect to a simple heuristic based on popularity of the artists storedin database. However, even if the results gained by this profiling technique wereoutstanding, it is necessary to understand why 26% of the users simply preferredthe most popular artists. Probably, there is a correlation between users’ knowl-edge in music and the list they choose. It is likely that users with very generictastes prefer a list of popular singers. Similarly, it is likely that users with apoor knowledge in music might prefer a list of well-known singers with respectto a list where most of the artists, even if related to their tastes, were unknown.A larger evaluation with users, split according to their musical knowledge, maybe helpful to understand the dynamics behind users’ choices. Similarly, it wouldbe good to investigate the impact of the amount of the information extractedfrom Facebook profiles with the accuracy of the recommendations. The secondexperiment was performed in two steps. In the first step users were asked to loginand to extract their data from their own Facebook page, as in Experiment 1.Next, two profiles were built by following the RI and the W-RI profiling models,respectively. Finally, recommendations were generated from both profiles, andusers were asked to choose the configuration they preferred. As in Experiment 1,they were not aware about which recommendations were generated by exploit-ing their weighted profile and which ones were produced through its unweightedcounterpart. Results of this experiments are shown in Figure 4-b. Differentlyfrom the results obtained from an in-vitro experiment performed in a scenarioof movie recommendation [5], users did not perceive as useful the introductionof a weighting scheme designed to give higher significance to the artists the userlikes the most. On the contrary, the RI profiling model was the preferred onefor 70% of the users involved in the experiment. Similarly, in the second step ofthe experiment the RI profiling model was compared to the QN one, in order toevaluate the impact on user perception of modeling negative preferences. Alsoin this case the results were conflicting with the outcomes that emerged fromthe in-vitro experiment since 65% of the users preferred the recommendationsgenerated through the profiling technique that does not model negative pref-erences. Even if the results of Experiment 2 did not confirmed the outcomesof the offline evaluation of eVSM they are actually interesting. First, they con-firmed the usefulness of combining offline experiments with user studies thanksto the different outcomes they can provide. Indeed, in user-centered applicationssuch as content-based recommender systems, user perception and user feedbacksplay a central role and these factors need to be taken into account. In general,further investigation is needed because most of these results may be due to aspecific bias of the designed experiment. As stated above, the extraction of data
70

from Facebook pages crawls information about what a specific user likes, so veryfew negative feedback were collected (less than 7%). Consequently, the negativepart of the user profile was very poor and this might justify the results. It islikely that collecting more negative feedbacks would be enough to confirm theusefulness of negative information. Finally, in Experiment 3 users were askedto express their preference on the recommendations produced through the RIprofiling model (since it emerged as the best one from the previous experiment)in terms of novelty, accuracy and diversity. The results of this experiment aresketched in Figure 4-c. In general, the results are encouraging since most of theusers expressed a positive opinion about the system. Specifically, Myusic has apositive impact on final users in terms of trust, since the opinion of 92% of theusers ranges from Good to Very Good. This is likely due to the good accuracyof the recommendations produced by the system. Indeed, more than 80% ofthe users considered as accurate or very accurate the suggestions of the system.Similarly, also the outcomes concerning diversity were positive, since more than60% labeled the level of diversity among the recommendations as Very Good.The only aspect that needs improvements regards the novelty of recommenda-tions since 34% of the users labeled as not novel the suggestions produced bythe system. This outcome was somehow expected since overspecialization it is atypical problem of content-based recommender systems (CBRS). However, evenif these results lead us to carry on this research, they have to be considered aspreliminary since this evaluation needs to be extended by comparing results ofeVSM with other state of the art models, such as LSI, VSM or collaborativefiltering.
4 Conclusions and Future Directions
In this paper we proposed Myusic, a music recommendation platform. It im-plements a content-based recommender system based on eVSM, an enhancedversion of classical VSM. The most distinguishing aspect of Myusic is the ex-ploitation of Facebook profiles for acquiring user preferences. An experimentalevaluation carried out by involving real users demonstrated that leveraging so-cial media is an effective way for overcoming the cold-start problem of CBRS. Onthe other hand, the exploitation of relevance feedback and user ratings generallydid not improve the predictive accuracy of Myusic. Users showed to trust thesystem, and Myusic also achieved good results in terms of accuracy and diversityof recommendations. Those results encouraged keeping on this research. In thefuture we will investigate the adoption of recommendation strategies tailored onthe music background of each user, even by learning accurate interaction modelsin order to classify users [7]. Furthermore, we will try to introduce more unex-pected suggestions. Experiments showed that novelty needs to be improved.
References
1. S. Bu, J.and Tan, C. Chen, C. Wang, H. Wu, L. Zhang, and X. He. Music recom-mendation by unified hypergraph: combining social media information and music
71
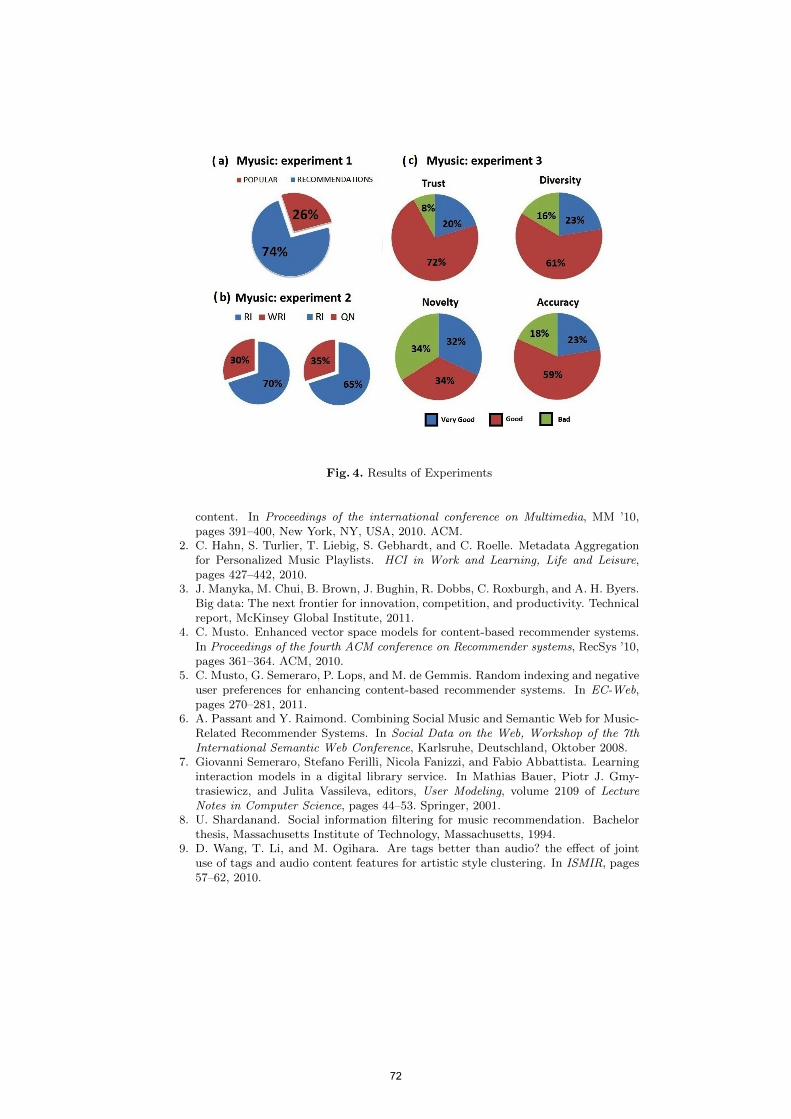
Fig. 4. Results of Experiments
content. In Proceedings of the international conference on Multimedia, MM ’10,pages 391–400, New York, NY, USA, 2010. ACM.
2. C. Hahn, S. Turlier, T. Liebig, S. Gebhardt, and C. Roelle. Metadata Aggregationfor Personalized Music Playlists. HCI in Work and Learning, Life and Leisure,pages 427–442, 2010.
3. J. Manyka, M. Chui, B. Brown, J. Bughin, R. Dobbs, C. Roxburgh, and A. H. Byers.Big data: The next frontier for innovation, competition, and productivity. Technicalreport, McKinsey Global Institute, 2011.
4. C. Musto. Enhanced vector space models for content-based recommender systems.In Proceedings of the fourth ACM conference on Recommender systems, RecSys ’10,pages 361–364. ACM, 2010.
5. C. Musto, G. Semeraro, P. Lops, and M. de Gemmis. Random indexing and negativeuser preferences for enhancing content-based recommender systems. In EC-Web,pages 270–281, 2011.
6. A. Passant and Y. Raimond. Combining Social Music and Semantic Web for Music-Related Recommender Systems. In Social Data on the Web, Workshop of the 7thInternational Semantic Web Conference, Karlsruhe, Deutschland, Oktober 2008.
7. Giovanni Semeraro, Stefano Ferilli, Nicola Fanizzi, and Fabio Abbattista. Learninginteraction models in a digital library service. In Mathias Bauer, Piotr J. Gmy-trasiewicz, and Julita Vassileva, editors, User Modeling, volume 2109 of LectureNotes in Computer Science, pages 44–53. Springer, 2001.
8. U. Shardanand. Social information filtering for music recommendation. Bachelorthesis, Massachusetts Institute of Technology, Massachusetts, 1994.
9. D. Wang, T. Li, and M. Ogihara. Are tags better than audio? the effect of jointuse of tags and audio content features for artistic style clustering. In ISMIR, pages57–62, 2010.
72

A Preliminary Study on a Recommender System for theMillion Songs Dataset Challenge
Fabio Aiolli
University of Padova, Italy, email: [email protected]
Abstract. In this paper, the preliminary study we have conducted on the MillionSongs Dataset (MSD) challenge is described. The task of the competition was tosuggest a set of songs to a user given half of its listening history and completelistening history of other 1 million people. We focus on memory-based collab-orative filtering approaches since they are able to deal with large datasets in anefficient and effective way. In particular, we investigated on i) defining suitablesimilarity functions, ii) studying the effect of the “locality” of the collaborativescoring function, that is, how many of the neirest neighboors (and how much) theyinfluence the score computation, and iii) aggregating multiple ranking strategiesto define the overall recommendation. Using this technique we won the MSDchallenge which counted about 150 registered teams.
1 Introduction
The Million Song Dataset Challenge [9] was a large scale, music recommendation chal-lenge, where the task was the one to predict which songs a user will listen to, providedthe listening history of the user. The challenge was based on the Million Song Dataset(MSD), a freely-available collection of meta data for one million of contemporary songs(e.g. song titles, artists, year of publication, audio features, and much more) [4]. Aboutone hundred and fifty teams participated to the challenge. The subset of data actuallyused in the challenge was the so called Taste Profile Subset that consists of more than48 million triplets (user,song,count) gathered from user listening histories. Data consistsof about 1.2 million users and covers more than 380,000 songs in MSD. The user-itemmatrix is very sparse as the fraction of non-zero entries (the density) is only 0.01%.
The task of the challenge was to recommend the most appropriate songs for a usergiven half of her listening history and the complete history of another 1 million users.Thus, the challenge focused on the ordering of the songs on the basis of the relevancefor a given user, and this makes the particular problem different from the more classicalproblem of predicting rates a user will give to unseen items [6, 11]. For example, pop-ular tasks like the Netflix [3] and Movielens fall in this last case. A second importantcharacteristic of the MSD problem is that we do not have explicit or direct feedbackabout what users like and how much they like it. In fact, we only have information ofthe form “user u listened to song i” without any knowledge about wether user u ac-tually liked song i or not. A third important aspect of the MSD data is the presenceof meta data concerning songs including title, artist, year of publication, etc. An inter-esting question then was wether this additional information could help or not. Finally,
73

given the huge size of the datasets involved, time and memory efficiency of the methodused turned out to be another very important issue in the challenge.
Collaborative Filtering (CF) is a technology that uses the item by user matrix todiscover other users with similar tastes as the active user for which we want to makethe prediction. The intuition is that if other users, similar to the active user, alreadypurchased a certain item, then it is likely that the active user will like that item as well.A similar (dual) consideration can be made by changing the point of view. If we knowthat a set of items are often purchased together (they are similar in some sense), then, ifthe active user has bought one of them, probably he/she will be interested to the otheras well. In this paper, we show that, even if this second view has been far more usefulto win the MSD competition, the first view also brings useful and diverse informationthat can be aggregated in order to boost the performance of the recommendation.
In Section 2, collaborative filtering is described and proposed as a first approach tosolve the problem of MSD. In particular, we briefly discuss the most popular state-of-the-art techniques: model based and memory based CF methods. In the same section,we propose a variant of memory based CF particularly suitable to tasks with implicitfeedback and binary ratings, and we propose a new parameterized similarity functionthat can be adapted to different applicative domains. Finally, in Section 3, empiricalresults of the proposed techniques are presented and discussed.
2 A Collaborative Filtering approach to the MSD task
Collaborative Filtering techniques use a database in the form of a user-item matrix Rof preferences. In a typical Collaborative Filtering scenario, a set U of n users and aset I of m items exist and the entries of R = {rui} ∈ Rn×m represent how muchuser u likes item i. In this paper, we assume rui ∈ {0, 1} as this was the setting of theMSD challenge1. Entries rui represent the fact that user u have listened to (or wouldlike to listen to) the song i. In the following we refer to items or songs interchangeably.The MSD challenge task has been more properly described as a top-τ recommendationtask. Specifically, for any active user u, we want to identify a list of τ (τ = 500 in thechallenge) items Iu ⊆ I that he/she will like the most. Clearly, this set must be disjointwith the set of items already rated (purchased, or listened to) by the active user.
2.1 Model-based Collaborative Filtering
Model-based CF techniques construct a model of the information contained in the ma-trix R. There are many proposed techniques of this type, including Bayesian models,Clustering models, Latent Factor models, and Classification/Regression models.
In recent literature about CF, matrix factorization techniques [8] have become avery popular and effective choice to implement the CF idea. In this kind of models onetries to learn a linear embedding of both users and items into a smaller dimensional
1 Note that in this definition we neglet the information given by the count attribute of the tripletsindicating how many times the song has been listened to by a user. In fact, at the start of thecompetition, the organizers warned us on the fact that this attribute could be unreliable andabsolutely not correlated with likings.
74
space. More formally, in its basic form, one needs to find two matrices P ∈ Rn×k andQ ∈ Rk×m, such that R = PQ, in such a way to minimize a loss over training data. Acommon choice for this loss is the root mean square error (RMSE).
Despite the fact that matrix factorization is recognized as a state-of-the-art techniquein CF, we note that it has some drawbacks that make it unsuitable for the MSD task.First of all, learning the model is generally computationally very expansive and this is aproblem when the size of the matrix R is very large as it was in our case. Second, sinceit is tipically modelled as a regression problem, it does not seem very good for implicitfeedback tasks. In this cases we only have binary values of relevance and the value 0cannot properly be considered the same as unrelevant since the no-action on an itemcan be due to many other reasons beyond not liking it (the user can be unaware of theexistence of the item, for example). Finally, baseline provided by the organizers of thechallenge and other teams entries, both based on matrix factorization techniques, haveshown quite poor results for this particular task, thus confirming our previous claims.
2.2 Memory-based Collaborative Filtering
In memory-based Collaborative Filtering algorithms, also known as Neighborhood Mod-els, the entire user-item matrix is used to generate a prediction. Generally, given a newuser for which we want to obtain the prediction, the set of items to suggest are com-puted looking at similar users. This strategy is typically referred to as user-based rec-ommendation. Alternatively, in the item-based recommendation strategy, one computesthe most similar items for the items that have been already purchased by the active user,and then aggregates those items to form the final recommendation. There are many dif-ferent proposal on how to aggregate the information provided by similar users/items(see [11] for a good survey). However, most of them are tailored to classical recom-mendation systems and they are not promptly compliant with the implicit feedbacksetting where only binary relevance values are available. More importantly, computingthe neirest neighbors requires the computation of similarities for every pair of users orsongs. This is simply infeasible in our domain given the huge size of the datasets in-volved. So, we propose to use a simple weighted sum strategy the considers positiveinformation only. A deeper analysis of this simple strategy will allows us to highlightan interesting duality which exists between user-based and item-based recommendationalgorithms.
In the user-based type of recommendation, the scoring function, on the basis ofwhich the recommendation is made, is computed by
hUui =∑v∈U
f(wuv)rvi =∑v∈U(i)
f(wuv),
that is, the score obtained on an item for a target user is proportional to the similaritiesbetween the target user u and other users v that have purchased the item i (v ∈ U(i)).This score will be higher for items which are often rated by similar users.
On the other hand, within a item-based type of recommendation [5, 10], the targetitem i is associated with a score
hSui =∑j∈I
f(wij)ruj =∑
j∈I(u)
f(wij),
75
and hence, the score is proportional to the similarities between item i and other itemsalready purchased by the user u (j ∈ I(u)).
Note that, the two formulations above do not have a normalization factor. A nor-malization with the sum of the similarities with the neighbors is tipically performed inneighboorhood models for tasks with explicit rates. In our case, we wanted to considerpositive information only in the model. As we see in the following, an effect similar tothe normalization is given by the function f(w). The proposed strategy seems appro-priate in our setting and makes the prediction much faster as we only need to computepair similarities with only a few other (in the order of tens in our task) users/items.
The function f(w) can be assumed monotonic not decreasing and its role is to em-phasize/deemphasize similarity contributions in such a way to adjust the locality of thescoring function, that is how many of the nearest users/items really matter in the com-putation. As we will see, a correct setting of this function turned out to be very usefulwith the challenge data.
Interestingly, in both cases, we can decompose the user and item contributions in alinear way, that is, we can write hUui = w>u ri, wu ∈ Rn, and hSui = w>i ru, wi ∈ Rm.In other words, we are defining an embedding for items (in user based recommendationsystems) and for users (in item based recommendation systems). In the specific caseabove, this corresponds to choose the particular vector ri as the vector with n entriesin {0, 1}, where r
(u)i = rui. Similarly, for the representation of users in item-based
scoring, we choose ru as the vector withm entries in {0, 1}, such that r(i)u = rui. In thepresent paper we mainly focus on exploring how we can learn the vectors wi and wu ina principled way by using the entire user-item preference matrix on-the-fly when a newrecommendation has to be done. Alternatively, we could also try to learn the weightvectors from data by noticing that a recommendation task can be seen as a multilabelclassification problem where songs represent the labels and users represent the exam-ples. We have performed preliminary experiments in this sense using the preferencelearning approach described in [1]. The results were promising but the problem in thiscase was the computational requirements of a model-based paradigm like this. For thisreason we decided to postpone a further analysis of this setting to future works.
2.3 User-based and Song-based similarity
In large part of CF literature the cosine similarity is the standard measure of correlationand not much work has been done until now to adapt the similarity to a given problem.Our opinion is that it cannot exist a single similarity measure that can fit all possibledomains where collaborative filtering is used. With the aim to bridge this gap, in thissection, we try to define a parametric family of user-based and item-based similaritiesthat can fit different problems.
In the challenge, we have not relevance grades since the ratings are binary values.This is a first simplification we can exploit in the definition of the similarity functions.The similarity function that is commonly used in this case, both for the user-based caseand the item-based case, is the cosine similarity. In the case of binary grades the cosinesimilarity can be simplified as in the following. Let I(u) be the set of items rated by a
76
generic user u, then the cosine similarity between two users u, v is defined by
wuv =|I(u) ∩ I(v)||I(u)| 12 |I(v)| 12
and, similarly for items, by setting U(i) the set of users which have rated item i, weobtain:
wij =|U(i) ∩ U(j)||U(i)| 12 |U(j)| 12
.
The cosine similarity has the nice property to be symmetric but, as we show inthe experimental section, it might not be the better choice. In fact, especially for theitem case, we are more interested in computing how likely it is that an item will beappreciated by a user when we already know that the same user likes another item. Itis clear that this definition is not symmetric. As an alternative to the cosine similarity,we can resort to the conditional probability measure which can be estimated with thefollowing formulas:
wuv = P (u|v) = |I(u) ∩ I(v)||I(v)|
and
wij = P (i|j) = |U(i) ∩ U(j)||U(j)|
Previous works (see [7] for example) pointed out that the conditional probabilitymeasure of similarity, P (i|j), has the limitation that items which are purchased fre-quently tend to have higher values not because of their co-occurrence frequency butinstead because of their popularity. In our opinion, this might not be a limitation ina recommendation setting like ours. Perhaps, this could be an undesired feature whenwe want to cluster items. In fact, this correlation measure has not to be thought of asa real similarity measure. As we will see, experimental results seem to confirm thishypothesis, at least in the item-based similarity case.
Now, we are able to propose a parametric generalization of the above similaritymeasures. This parametrization permits ad-hoc optimizations of the similarity functionfor the domain of interest. For example, this can be done by validating on available data.Specifically, we propose to use the following combination of conditional probabilities:
wuv = P (v|u)αP (u|v)1−α wij = P (j|i)αP (i|j)1−α (1)
where α ∈ [0, 1] is a parameter to tune. As above, we estimate the probabilities byresorting to the frequencies in the data and derive the following:
wuv =|I(u) ∩ I(v)||I(u)|α|I(v)|1−α
wij =|U(i) ∩ U(j)||U(i)|α|U(j)|1−α
. (2)
It is easy to note that the standard similarity based on the conditional probabilityP (u|v) (resp. P (i|j)) is obtained setting α = 0, the other inverted conditional P (v|u)(resp. P (j|i)) is obtained setting α = 1, and, finally, the cosine similarity case is ob-tained when α = 1
2 . This analysis also suggests an interesting interpretation of thecosine similarity on the basis of conditionals.
77

2.4 Locality of the Scoring Function
In Section 2 we have seen how the final recommendation is computed by a scoringfunction that aggregates the scores obtained using individual users or items. So, it isimportant to determine how much each individual scoring component influences theoverall scoring. This is the role of the function f(w). In the following experiments weuse the exponential family of functions, that is f(w) = wq where q ∈ N. The effectof this exponentiation is the following. When q is high, smaller weights drop to zerowhile higher ones are (relatively) emphasized. At the other extreme, when q = 0, theaggregation is performed by simply adding up the ratings. We can note that, in the user-based type of scoring function, this corresponds to take the popularity of an item as itsscore, while, in the case of item-based type of scoring function, this would turn out in aconstant for all items (the number of ratings made by the active user).
2.5 Ranking Aggregation
There are many sources of information available regarding songs. For example, it couldbe useful to consider the additional meta-data which are also available and to constructalternative rankings based on that. It is always difficult to determine a single strategywhich is able to correctly rank the songs. An alternative is to use multiple strategies,generate multiple rankings, and finally combine those rankings. Typically, these differ-ent strategies are individually precision oriented, meaning that each strategy is able tocorrectly recommend a few of the correct songs with high confidence but, it may be that,other songs which the user likes, cannot be suggested by that particular ranker. Hope-fully, if the rankers are different, then the rankers can recommend different songs. Ifthis is the case, a possible solution is to predict a final recommendation that contains allthe songs for which the single strategies are more confident. The stochastic aggregationstrategy that we used in the challenge can be described in the following way. We assumewe are provided with the list of songs, not yet rated by the active user, given in orderof confidence, for all the basic strategies. On each step, the recommender randomlychoose one of the lists according to a probability distribution pi over the predictorsand recommends the best scored item of the list which has not yet been inserted in thecurrent recommendation. In our approach the best pi values are simply determined byvalidation on training data.
3 Experiments and Results
In the MSD challenge we have: i) the full listening history for about 1M users, ii)half of the listening history for 110K users (10K validation set, 100K test set), and wehave to predict the missing half. Further, we also prepared a ”home-made” validationsubset (HV) of the original training data of about 900K users of training (HVtr, withfull listening history). The remaining 100K user’s histories has been split in two halves(HVvi the visible one, HVhi the hidden one).
The experiments presented in this section are based on this HV data and comparedifferent similarities and different approaches. The baseline is represented by the simple
78

popularity based method which recommends the most popular songs not yet listened toby the user. Besides the baseline, we report experiments on both the user-based andsong-based scoring functions, and an example of the application of ranking aggrega-tion. Given the size of the datasets involved we do not stress on the significance of thepresented results. This is confirmed by the fact that the presented results do not differsignificantly from the results obtained over the indipendent set of users used as the testset in the challenge.
3.1 Taste Profile Subset Stats
For completeness, in this section, we report some statistics about the original trainingdata. In particular, the following table shows the minimum, maximum, and average,number of users per song and songs per user. The median value is also reported.
Data Statistics min max ave medianusers per song 1 110479 125.794 13songs per user 10 4400 47.45681 27
We can see that the large majority of songs have only few users which listened to it(less than 13 users for half of the songs) and the large majority of users have listened tofew songs (less than 27 for half of the users). These characteristics of the dataset makethe top-τ recommendation task quite challenging.
3.2 Truncated Mean Average Precision
Conformingly to the challenge, we used the truncated mAP (mean average precision) asthe evaluation metric [9]. Let y denote a ranking over items, where y(p) = i means thatitem i is ranked at position p. The mAP metric emphasizes the top recommendations.For any k ≤ τ , the precision at k (πk) is defined as the proportion of correct recom-mendations within the top-k of the predicted ranking (assuming the ranking y does notcontain the visible songs),
πk(u, y) =1
k
k∑p=1
ruy(p)
For each user the (truncated) average precision is the average precision at each recallpoint:
AP (u, y) =1
τu
τ∑p=1
πk(u, y)ruy(p)
where τu is the smaller between τ and the number of user u’s positively associatedsongs. Finally, the average of AP (u, yu)’s over all users gives the mean average preci-sion (mAP).
79

3.3 Results
The result obtained on the HV data with the baseline (recommendation by popularity) ispresented in Table 1(a). With this strategy, each song i simply gets a score proportionalto the number of users |U(i)| which listened to the song.
In Table 1, we also report on experiments that show the effect of the locality param-eter q for different strategies: item based and user based (both conditional probabilityand cosine versions). As we can see, beside the case IS with cosine similarity (Table1c), a correct setting of the parameter q drammatically improves the effectiveness onHV data. We can clearly see that the best performance is reached with the conditionalprobability on an item based strategy (Table 1b).
Method mAP@500Baseline (Recommendation by Popularity) 0.02262
(a)
IS (α = 0) mAP@500q=1 0.12224q=2 0.16581q=3 0.17144q=4 0.17004q=5 0.16830
(b)
IS (α = 12
) mAP@500q=1 0.16439q=2 0.16214q=3 0.15587q=4 0.15021q=5 0.14621
(c)
US (α = 0) mAP@500q=1 0.08030q=2 0.10747q=3 0.12479q=4 0.13298q=5 0.13400q=6 0.13187q=7 0.12878
(d)
US (α = 12
) mAP@500q=1 0.07679q=2 0.10436q=3 0.12532q=4 0.13779q=5 0.14355q=6 0.14487q=7 0.14352
(e)Table 1: Results obtained by the baseline, item-based (IS) and user-based (US) CFmethods varying the locality parameter (exponent q) of the similarity function.
In Figure 1, results obtained fixing the parameter q and varying the parameter α forboth user-based and item-based recommendation strategies are given. We see that, inthe item-based case, the results improve when setting a non-trivial α. In fact, the bestresult has been obtained for α = 0.15.
Finally, in Table 2, two of the best performing rankers are combined, and theirrecommendation aggregated, by using the stochastic algorithm described in Section 2.5.In particular, in order to maximize the diversity of the two rankers, we aggregated anitem-based ranker with a user-based ranker. We can see that the combined performanceimproves further on validation data. Building alternative and effective rankers based onavailable meta-data is not a trivial task and it was not the focus of our current study. Forthis we decided to postpone this additional analysis to a near future.
3.4 Comparison with other approaches
We end this section by comparing our with other approaches that have been used inthe challenge. Best ranked teams all used variants of memory based CF, besides the
80

0.155
0.16
0.165
0.17
0.175
0.18
0 0.1 0.2 0.3 0.4 0.5
mA
P@
500
α
(a) IS with 0 ≤ α ≤ 0.5, q = 3, best-mAP@500: 0.177322(α = 0.15)
0.13
0.132
0.134
0.136
0.138
0.14
0.142
0.144
0 0.2 0.4 0.6 0.8 1
mA
P@
500
α
(b) US with 0 ≤ α ≤ 1, q = 5, best-mAP@500: 0.143551(α = 0.6)
Fig. 1: Results obtained by item-based (IS) and user-based (US) CF methods varyingthe α parameter.
81
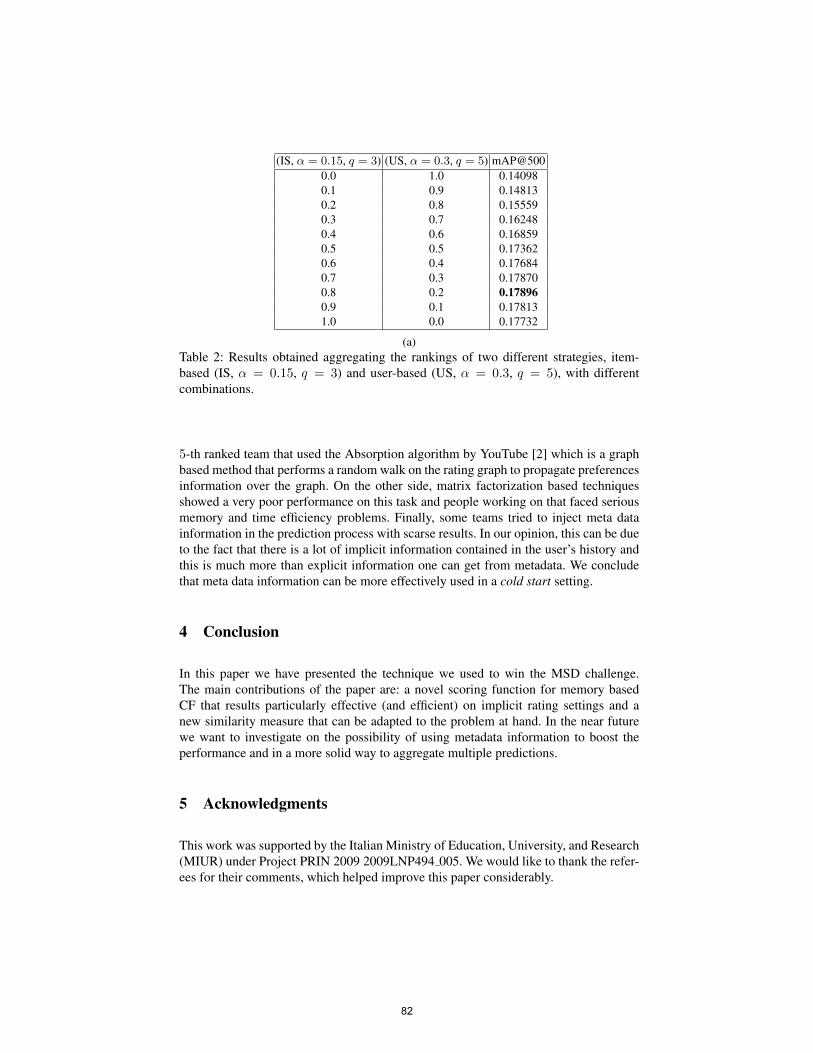
(IS, α = 0.15, q = 3) (US, α = 0.3, q = 5) [email protected] 1.0 0.140980.1 0.9 0.148130.2 0.8 0.155590.3 0.7 0.162480.4 0.6 0.168590.5 0.5 0.173620.6 0.4 0.176840.7 0.3 0.178700.8 0.2 0.178960.9 0.1 0.178131.0 0.0 0.17732
(a)Table 2: Results obtained aggregating the rankings of two different strategies, item-based (IS, α = 0.15, q = 3) and user-based (US, α = 0.3, q = 5), with differentcombinations.
5-th ranked team that used the Absorption algorithm by YouTube [2] which is a graphbased method that performs a random walk on the rating graph to propagate preferencesinformation over the graph. On the other side, matrix factorization based techniquesshowed a very poor performance on this task and people working on that faced seriousmemory and time efficiency problems. Finally, some teams tried to inject meta datainformation in the prediction process with scarse results. In our opinion, this can be dueto the fact that there is a lot of implicit information contained in the user’s history andthis is much more than explicit information one can get from metadata. We concludethat meta data information can be more effectively used in a cold start setting.
4 Conclusion
In this paper we have presented the technique we used to win the MSD challenge.The main contributions of the paper are: a novel scoring function for memory basedCF that results particularly effective (and efficient) on implicit rating settings and anew similarity measure that can be adapted to the problem at hand. In the near futurewe want to investigate on the possibility of using metadata information to boost theperformance and in a more solid way to aggregate multiple predictions.
5 Acknowledgments
This work was supported by the Italian Ministry of Education, University, and Research(MIUR) under Project PRIN 2009 2009LNP494 005. We would like to thank the refer-ees for their comments, which helped improve this paper considerably.
82

References
1. Fabio Aiolli and Alessandro Sperduti. A preference optimization based unifying frameworkfor supervised learning problems. In Johannes Furnkranz and Eyke Hullermeier, editors,Preference Learning, pages 19–42. Springer-Verlag, 2010.
2. Shumeet Baluja, Rohan Seth, D. Sivakumar, Yushi Jing, Jay Yagnik, Shankar Kumar, DeepakRavichandran, and Mohamed Aly. Video suggestion and discovery for youtube: taking ran-dom walks through the view graph. In Proceedings of the 17th international conference onWorld Wide Web, WWW ’08, pages 895–904, New York, NY, USA, 2008. ACM.
3. James Bennett, Stan Lanning, and Netflix Netflix. The netflix prize. In In KDD Cup andWorkshop in conjunction with KDD, 2007.
4. Thierry Bertin-Mahieux, Daniel P.W. Ellis, Brian Whitman, and Paul Lamere. The millionsong dataset. In Proceedings of the 12th International Conference on Music InformationRetrieval (ISMIR 2011), 2011.
5. Mukund Deshpande and George Karypis. Item-based top-n recommendation algorithms.ACM Trans. Inf. Syst., 22(1):143–177, 2004.
6. Christian Desrosiers and George Karypis. A comprehensive survey of neighborhood-basedrecommendation methods. In Recommender Systems Handbook, pages 107–144. 2011.
7. George Karypis. Evaluation of item-based top-n recommendation algorithms. In CIKM,pages 247–254, 2001.
8. Yehuda Koren and Robert M. Bell. Advances in collaborative filtering. In RecommenderSystems Handbook, pages 145–186. 2011.
9. Brian McFee, Thierry Bertin-Mahieux, Daniel P.W. Ellis, and Gert R.G. Lanckriet. The mil-lion song dataset challenge. In Proceedings of the 21st international conference companionon World Wide Web, WWW ’12 Companion, pages 909–916, New York, NY, USA, 2012.ACM.
10. Badrul M. Sarwar, George Karypis, Joseph A. Konstan, and John Riedl. Item-based collab-orative filtering recommendation algorithms. In WWW, pages 285–295, 2001.
11. Xiaoyuan Su and Taghi M. Khoshgoftaar. A survey of collaborative filtering techniques.Advances in Artificial Intelligence, January 2009.
83

Distributional models vs. Linked Data:exploiting crowdsourcing to personalize
music playlists
Cataldo Musto1, Fedelucio Narducci2, Giovanni Semeraro1,Pasquale Lops1, and Marco de Gemmis1
1 Department of Computer ScienceUniversity of Bari Aldo Moro, Italy
[email protected] Department of Information Science, Systems Theory, and Communication
University of Milano-Bicocca, [email protected]
Abstract. This paper presents Play.me, a system that exploits socialmedia to generate personalized music playlists. First, we extracted userpreferences in music by mining Facebook profiles. Next, given this prelim-inary playlist based on explicit preferences, we enriched it by adding newartists related to those the user already likes. In this work two differentenrichment techniques are compared: the first one relies on knowledgestored on DBpedia while the latter is based on the similarity calculationsbetween semantic descriptions of the artists. A prototype version of thetool was made available online in order to carry out a preliminary userstudy to evaluate the best enrichment strategy. This paper summarizesthe results presented in EC-Web 2012 [3].
1 Introduction and Related Work
According to a recent study3, 31,000 hours of music (and 28 million songs) arecurrently available on iTunes Store. As a consequence, the problem of informa-tion overload is currently felt for online music libraries and multimedia content,as well. However, the recent spread of social networks provides researchers witha rich source to draw to overcome the typical bottleneck represented by userpreferences elicitation.
Given this insight, in this work we propose Play.me, a system that leveragessocial media for personalizing music playlists. The filtering model is based onthe assumption that information about music preferences can be gathered fromFacebook profiles. Next, explicit Facebook preferences may be enriched withnew artists related to those the user already likes. In this paper we comparetwo different enrichment techniques: the first leverages the knowledge stored onDBpedia while the second is based on similarity calculations between semanticsdescriptions of artists. The final playlist is then ranked and finally presented
3 http://www.digitalmusicnews.com/permalink/2012/120425itunes
84
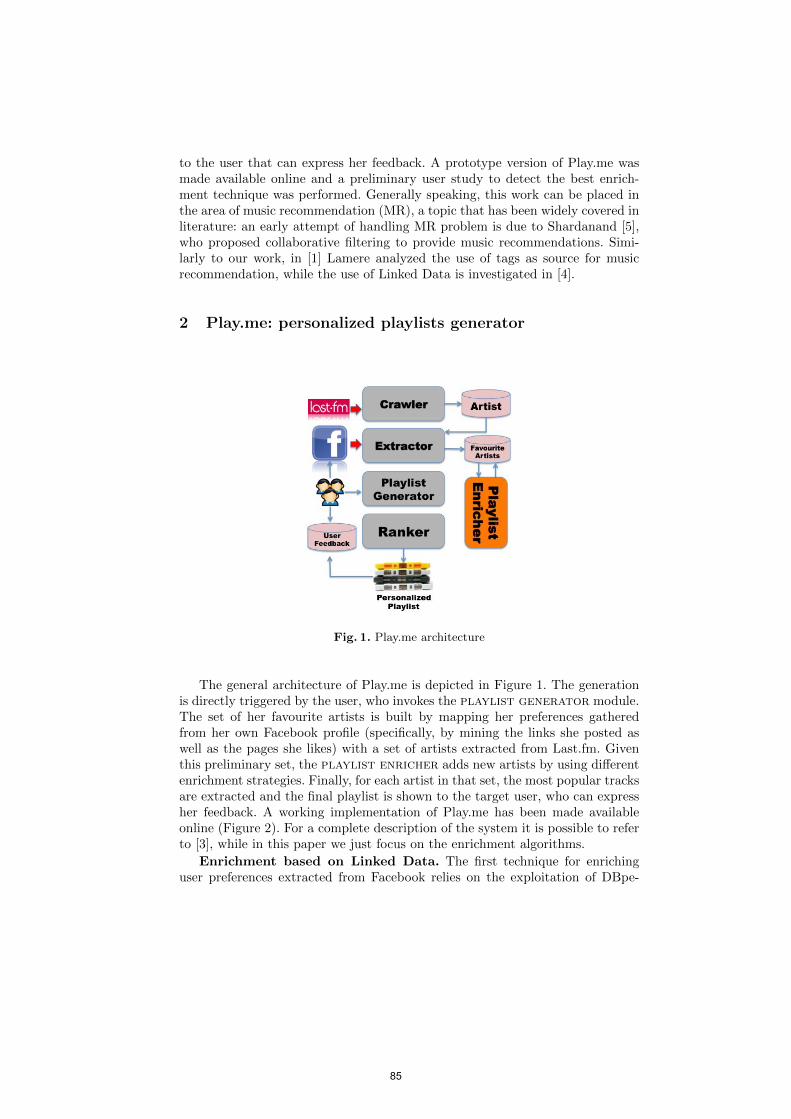
to the user that can express her feedback. A prototype version of Play.me wasmade available online and a preliminary user study to detect the best enrich-ment technique was performed. Generally speaking, this work can be placed inthe area of music recommendation (MR), a topic that has been widely covered inliterature: an early attempt of handling MR problem is due to Shardanand [5],who proposed collaborative filtering to provide music recommendations. Simi-larly to our work, in [1] Lamere analyzed the use of tags as source for musicrecommendation, while the use of Linked Data is investigated in [4].
2 Play.me: personalized playlists generator
Fig. 1. Play.me architecture
The general architecture of Play.me is depicted in Figure 1. The generationis directly triggered by the user, who invokes the playlist generator module.The set of her favourite artists is built by mapping her preferences gatheredfrom her own Facebook profile (specifically, by mining the links she posted aswell as the pages she likes) with a set of artists extracted from Last.fm. Giventhis preliminary set, the playlist enricher adds new artists by using differentenrichment strategies. Finally, for each artist in that set, the most popular tracksare extracted and the final playlist is shown to the target user, who can expressher feedback. A working implementation of Play.me has been made availableonline (Figure 2). For a complete description of the system it is possible to referto [3], while in this paper we just focus on the enrichment algorithms.
Enrichment based on Linked Data. The first technique for enrichinguser preferences extracted from Facebook relies on the exploitation of DBpe-
85

Fig. 2. Play.me screenshot
dia4. Our approach is based on the assumption that each artist can be mappedto a DBpedia node. The inceptive idea is that the similarity between two artistscan be computed according to the number of properties they share (e.g. twoItalian bands playing rock music are probably similar). Thus, we decided touse dbpedia-owl:genre (describing the genre played by the artist) and dc-terms:subject, that provides information about the musical category. Oper-ationally, we queried a SPARQL endpoint to extract the artists that share asmany properties as possible with the target one. Finally, we ranked them accord-ing to their playcount in Last.fm. The first m artists returned by the endpointare considered as related and added to the set of the favourite artists.
Enrichment based on Distributional Models. Each artist in Play.me isdescribed through a set of tags (extracted from Last.fm), where each tag providesinformation about the genre played by the artist or describes features typical ofher songs (e.g. melanchonic). According to the insight behind distributionalmodels [2], each artist can be modeled as a point in a semantic vector space, andthe position depends on the tags used to describe her and the co-occurrencesbetween the tags themselves. The rationale behind this strategy is that therelatedness between two artists can be calculated by comparing their vector-space representation through the classical cosine similarity. So, we compute thecosine similarity between the target artist and all the other ones in the dataset,and the m with the highest scores are added to the list of favourite ones.
3 Experimental Evaluation
In the experimental evaluation we tried to identify the technique able to generatethe most relevant playlists. We carried out an experiment by involving 30 usersagainst a Last.fm crawl containing data on 228k artists. In order to identify thebest enrichment technique, we asked users to use the application for three weeks.In the first two weeks the system was set with a different enrichment technique,while in the last a simple baseline based on the most popular artists was used.Given the playlist generated by the system, users were asked to express their
4 http://dbpedia.org
86

feedback only on the tracks generated by the enrichment process. Results arereported in Table 1. The parameter m refers to the number of artists added by theenrichment algorithm for each one extracted from Facebook. It is worth to notice
Table 1. Results: each score represent the ratio of positive feedbacks.
Artists
Strategy m=1 m=2 m=3
Linked Data 65.9% 64.6% 63.2%
Distributional Models 76.3% 75.2% 69.7%
Popularity 58%
that both enrichment strategies outperform the baseline. This means that thesocial network data actually reflect user preferences. The enrichment techniquethat gained the best performance is that based on distributional models. However,even though this technique gained the best results, a deeper analysis can providedifferent outcomes. Indeed, with m=3 the gap between the approaches dropsdown: this means that a pure content-based representation introduces more noisethan DBpedia, whose effectiveness stays constant. The good results obtained bythe baseline can be justified by the low diversity of the users involved in theevaluation. More details about the experimental settings are reported in [3].
4 Conclusions and Future Work
In this work we presented Play.me, a system for building music playlists based onsocial media. Specifically, we compared two techniques for enriching the playlists,the first based on DBpedia and the second based on similarity calculations invector spaces. From the experimental session it emerged that the approach basedon distributional models was able to produce the best playlists. Generally speak-ing, there is still space for future work since the enrichment might be tuned byanalyzing different DBpedia properties or different tags. Furthermore, context-aware personalized playlists could be a promising research direction.
References
1. P. Lamere. Social Tagging and Music Information Retrieval. Journal of New MusicResearch, 37(2):101–114, 2008.
2. A. Lenci. Distributional approaches in linguistic and cognitive research. ItalianJournal of Linguistics, (1):1–31, 2010.
3. C. Musto, G. Semeraro, P. Lops, M. de Gemmis, and F. Narducci. Leveraging socialmedia sources to generate personalized music playlists. In EC-Web 2012.
4. A. Passant and Y. Raimond. Combining Social Music and Semantic Web for Music-Related Recommender Systems. In Social Data on the Web, ISWC Workshop, 2008.
5. U. Shardanand. Social information filtering for music recommendation. Bachelorthesis, Massachusetts Institute of Technology, Massachusetts, 1994.
87

Opinion and Factivity Analysis of Italian political discourse
Rodolfo Delmonte1, Daniela Gîfu2, Rocco Tripodi1
1 Ca’Foscari University, Department Language Science, Ca’ Bembo, dd. 1075, 30123, Venice
[email protected], [email protected] 2„Alexandru Ioan Cuza“ University, Faculty of Computer Science,
16, General Berthelot St., 700483, Iaşi [email protected]
Abstract. The success of a newspaper article for the public opinion can be measured by the degree in which the journalist is able to report and modify (if needed) attitudes, opinions, feelings and political beliefs. We present a symbolic system for Italian, derived from GETARUNS, which integrates a range of natural language processing tools with the intent to characterise the print press discourse from a semantic and pragmatic point of view. This has been done on some 500K words of text, extracted from three Italian newspapers in order to characterize their stance on a deep political crisis situation. We tried two different approaches: a lexicon-based approach for semantic polarity using off-the-shelf dictionaries with the addition of manually supervised domain related concepts; another one is a feature-based semantic and pragmatic approach, which computes propositional level analysis with the intent to better characterize important component like factuality and subjectivity. Results are quite revealing and confirm the otherwise common knowledge about the political stance of each newspaper on such topic as the change of government that took place at the end of last year, 2011.
Keywords: journalist opinion, sentiment analysis, political discourse, lexical-semantic, syntax, print press, Government of Italy.
1 Introduction
In this paper, we discuss paradigms for evaluating linguistic interpretation of discourses as applied by a light scaled version the system for text understanding called GETARUNS. We focus on three aspects critical to a successful evaluation: creation of large quantities of reasonably good training data, lexical-semantic and syntactic analysis. Measuring the polarity of a text is usually done by text categorization methods which rely on freely available resources. However, we assume that in order to properly capture opinion and sentiment [6,10,11,17] expressed in a text or dialog, any system needs a linguistic text processing approach that aims at producing semantically viable representation at propositional level. In particular, the idea that the task may be solved by the use of Information Retrieval tools like Bag of
88

Words Approaches (BOWs) is insufficient. BOWs approaches are sometimes also camouflaged by a keyword based Ontology matching and Concept search [10], based on SentiWordNet (Sentiment Analysis and Opinion Mining with WordNet) [2]– more on this resource below -, by simply stemming a text and using content words to match its entries and produce some result [16]. Any search based on keywords and BOWs is fatally flawed by the impossibility to cope with such fundamental issues as the following ones, which Polanyi and Zaenen [12] named contextual valence shifters: - presence of negation at different levels of syntactic constituency; - presence of lexicalized negation in the verb or in adverbs; - presence of conditional, counterfactual subordinators; - double negations with copulative verbs; - presence of modals and other modality operators.
It is important to remember that both PMI and LSA analysis [16] systematically omit function or stop words from their classification set of words and only consider content words. In order to cope with these linguistic elements we propose to build a propositional level analysis directly from a syntactic constituency or chunk-based representation. We implemented these additions on our system called GETARUNS (General Text And Reference Understanding System) which has been used for semantic evaluation purposes in the challenge called RTE and other semantically heavy tasks [1,4]. The output of the system is an xml representation where each sentence of a text or dialog is a list of attribute-value pairs. In order to produce this output, the system makes use of a flat syntactic structure and a vector of semantic attributes associated to the verb compound at propositional level and memorized. Important notions required by the computation of opinion and sentiment are also the distinction of the semantic content of each proposition into two separate categories: objective vs. subjective.
This distinction is obtained by searching for factivity markers again at propositional level [14]. In particular we take into account: modality operators like intensifiers and diminishes, modal verbs, modifiers and attributes adjuncts at sentence level, lexical type of the verb (from ItalWordNet classification, and our own), subject’s person (if 3rd or not), and so on.
As will become clear below, we are using a lexicon-based [9,15] rather than a classifier-based approach, i.e. we make a fully supervised analysis where semantic features are associated to lemma and concept of the domain by creating a lexicon out of frequency lists. In this way the semantically labelled lexicon is produced in an empirical manner and fits perfectly the classification needs.
The paper is structured as follows. Section 2 comments on the role of print press discourse; Section 3 describes the system for multi-dimensional political discourse analysis. Section 4 presents comparative analysis of print press discourses collected during the Berlusconi’s resignation in favour of Monti’s nominating the President of Italian Government (October 12 – December 12, 2011). Finally, section 5 highlights interpretations anchored in our analysis and presents a conclusion.
89

2 Print press discourse
Mirror of contemporary society, located in permanent socio-cultural revaluation, the texts of print press can disrupt or use a momentary political power. In contemporary society, the struggles stake is no longer the social use of technology, but it is the huge production and dissemination of representations, informations and languages.
At present, the legitimacy of competence and credibility or reputation of political authority is increasingly in competition with mediatic credibility and the charisma already confirmed in public space. In political life we see how „heavy” actors are imposed, benefiting preferential treatment in their publicity and/or how insignificant actors, with reduced visibility, are ignored, even marginalized, notwithstanding their possibly higher reputation. Most of the times, launching the new actors is accompanied by changing others, intermediate body, the militants, condemned not only to mediatic silence, but simply silenced: in this way, the role of opinion leaders is drastically reduced.
Print press, in its various forms, assigns political significance to institutional activities and events in their succession; it forms the political life of a nation, from objective information to become the subject of public debate. In this case, the role of print press is double: 1. secure information as a credible discourse to end a rumor; 2. enter politics in language forms, so they become consistently interpretable in a symbolic system of representations.
The press is designed to legitimize the actions of politicians, attending their visibility efforts, confirming or increasing their reputation. Print press includes essentially political discourses, containing both a specific orientation and a political commitment. The reader has the possibility to choose what and when to read, leaving time to reflection, too. Disproportionality is a risk to the reality described.
No wonder why the people in power, if they intend to govern in peace, try to curb the enthusiasm of the media. Most of the times, through excellence in the elections, the print press is focused on topical issues, leading topics of public interest and events of internal and external social life. However, the perception of social reality depends on how it is presented. So the newspaper, like any commercial product, is dependent on aesthetic presentations that may distort any event-selection alternative to news items which are sensational and, often, negative (i.e. our comparative study).
3 The System GETARUNS
In this section we will present a detailed description of the symbolic system for Italian that we used in this experiment. The system is derived from GETARUNS, a multilingual system for deep text understanding with limited domain dependent vocabulary and semantics, that works for English, German and Italian and has been documented in the past 20 years or so with lots of publications and conference presentations[3,5]. The deep version of the system has been scaled down in the last ten years to a version that can be used with unlimited text and vocabulary, again for English and Italian. The two versions can work in sequence in order to prevent
90
failures of the deep version. Or they work separately to produce less constrained interpretations of the text at hand.
The "shallow" scaled version of GETARUNS has been adapted for the Opinion and Sentiment analysis and results have already been published for English [6]. Now, the current version which is aimed at Italian has been made possible by the creation of the needed semantic resources, in particular a version of SentiWordNed adapted to Italian and heavily corrected and modified. This version (see 3.0) uses weights for the English WordNet and the mapping of sentiment weights has been done automatically starting from the linguistic content of WordNet glosses. However, this process has introduced a lot of noise in the final results, with many entries totally wrong. In addition, there was a need to characterize uniquely only those entries that have a "generic" or "commonplace" positive, or negative meaning associated to them. This was deemed the only possible solution to the problem of semantic ambiguity, which could only be solved by introducing a phase of Word Sense Disambiguation which was not part of the system. So, we decided to erase all entries that had multiple concepts associated to the same lemma, and had conflicting sentiment values. We also created and added an ad hoc lexicon for the majority of concepts (some 3000) contained in the text we analysed, in order to reduce the problem of ambiguity. This was done again with the same approach, i.e. labelling only those concepts which were uniquely intended as one or the other sentiment, restricting reference to the domain of political discourse.
The system has been lately documented by our participation in the EVALITA (Evaluation of NLP and Speech Tools for Italian) challenge1. It works in a usual NLP pipeline: the system tokenizes the raw text and then searches for Multiwords. The creation of multiwords is paramount to understanding specific domain related meanings associated to sequences of words. This computation is then extended to NER (Named Entity Recognition), which is performed on the basis of a big database of entities, lately released by JRC (Joint Research Centre) research centre.2 Of course we also use our own list of entities and multiwords.
Words that are not recognized by simple matching procedures in the big wordform dictionary (500K entries), are then passed to the morphological analyser. In case also this may fail, the guesser is activated, which will at first strip the word of its affixes. It will start by stripping possible prefixes and then analysing the remaining portion; then it will continue by stripping possible suffixes. If none of these succeeds, the word will be labelled as foreign word if the final character is not a vowel; a noun otherwise. We then perform tagging and chunking. In order to proceed to the semantic level, each nominal expression is classified at first on the basis of the assigned tag: proper nouns are used in the NER task. The remaining nominal expressions are classified using the classes derived from ItalWordNet (Italian WordNet)3. In addition to that, we have compiled specialized terminology databases for a number of common domains including: medical, political, economic, and military. These lexica are used to add a specific class label to the general ones derived from ItalWordNet. And in case the word or multiword is not present there, to uniquely classify them. The output of this
1 http://www.evalita.it/ 2 http://irmm.jrc.ec.europa.eu/ 3 http://www.ilc.cnr.it/iwndb/iwndb_php/
91

semantic classification phase is a vector of features associated to the word and lemma, together with the sentence index and sentence position. These latter indices will then be used to understand semantic relations intervening in the sentence between the main governing verb and the word under analysis. Semantic mapping is then produced by using the output of the shallow parsing and the functional mapping algorithm which produce a simplified labelling of the chunks into constituent structure. These structures are produced in a bottom-up manner and subcategorization information is only used to choose between the assignments of functional labels for argumenthood. In particular, choosing between argument labels like SUBJ, OBJ2, OBL which are used for core arguments, and ADJ which is used for all adjuncts requires some additional information related to the type of governing verb.
The first element for Functional Mapping is the Verbal Complex, which contains all the sequence of linguistic items that may contribute to its semantic interpretation, including all auxiliaries, modals, adverbials, negation, clitics. We then distinguish passive from active diathesis and we use the remaining information available in the feature vector to produce a full-fledged semantic classification at propositional level. The semantic mapping includes, beside diathesis: - Change in the World; Subjectivity and Point of View; Speech Act; Factitiviy; Polarity.
4 A comparative study
Whereas the aims of syntax and semantics in this system are relatively clear, the tasks of pragmatics are still hard to extract automatically. But, we have to recognize the huge relevance of pragmatics in analyzing political texts. 4.1 The corpus
For the elaboration of preliminary conclusions on the process of the change of the Italian government and president of government, we collected, stored and processed - partially manually, partially automatically -, relevant texts published by three national on-line newspapers having similar profiles4.
For analytical results to be comparable to those taken so far by second author [20,21], we needed a big corpus, especially considering five rigorous criteria that we list below: 1. Type of message
Selection of newspapers was made taking into account the type of opinions circulated by the Editorial: pro, against Berlusconi and impartial. The following newspapers were thus selected:
a) Corriere della Sera - www.corriere.it (called The People Newspaper). b) Libero - www.liberoquotidiano.it (pro Berlusconi). c) La Republica – www.repubblica.it (against Berlusconi).
2. Period of time
4 www.corriere.it, www.liberoquotidiano.it, www.repubblica.it
92
The interval time chosen should be large enough to capture the lexical-semantic and syntactic richness found in the Italian press. It was divided into three time periods. We specify them here below with their abbreviations, used during analysis.
A month before the resignation of Berlusconi (12 November 2011), abbreviated to OMBB: October 12 to November 11, 2011
The period between the presentation of Berlusconi's resignation and the appointment of Mario Monti as premier of the Italian Government, abbreviated with PTMB: 12 to 16 November 2011
A month after the resignation of Berlusconi, abbreviated with OMAB: November 17 to December 12, 2011.
Two keywords were commonly used to select items from the Italian press, that is the name of the two protagonists: (Silvio) Berlusconi (and appellations found in newspaper articles: Silvio, Il Cavaliere, Il Caimano) and (Mario) Monti.
We tried to select an archive rich enough for each of the three newspapers (meaning dozens of articles per day), the selected period of time as the one of interest, between average values. Text selection was made taking into account the subcriterion Ordina per rilevanza (order articles by relevance) that each web page of the corresponding newspapers made available. We then introduced a new subcriterion of selection: storing articles in the first three positions of each web page for every day of the research period. In particular we collected on average 250 articles per newspaper, that is 750 articles overall. Also number of tokens are on average 150K tokens per newspaper, i.e. 450K tokens overall. Computation time on a tower MacPro equipped with 6 Gb RAM and 1 Xeon quad-core was approximately 2 hours.
4.2 The syntactic and semantic analysis
In Fig. 1 below, we present comparative semantic polarity and subjectivity analyses of the texts extracted from the three Italian newspapers. On the graph we show differences in values for four linguistic variables: they are measured as percent value over the total number of semantic linguistic variables selected from the overall analysis and distributed over three time periods on X axis. To display the data we use a simple difference formula, where Difference value is subtracted from the average of the values of the other two newpapers for that class. Differences may appear over or below the 0 line. In particular, values above the 0x axis mean they assume positive or higher than values below the 0x axis, which have a negative import. The classes chosen are respectively: 1. propositional level polarity with NEGATIVE value; 2. factivity or factuality computed at propositional level, which contains values for non factual descriptions; 3. subjectivity again computed at propositional level; 4. passive diathesis. We can now evaluate different attitudes and styles of the three newspapers with respect to the three historical periods: in particular we can now appreciate whether the articles report facts objectively without the use of additional comments documenting the opinion of the journalist. Or if it is rather the case that the subjective opinion of the journalist is present only in certain time spans and not in others.
93

Fig. 1. Comparative semantic polarity analysis of three Italian newspapers.
So for instance, Corriere, the blue or darker line, has higher nonfactive values in two time spans, OMBB and PTMB; Repubblica values soar in OMAB. In the same period Libero has the lowest values; whereas in OMBB, Libero and Corriere have the highest values when compared with Repubblica. PTMB clearly shows up as a real intermediate period of turmoil which introduces a change: here Repubblica becomes more factual whereas Libero does the opposite. Subjectivity is distributed very much in the same way as factuality, in the three time periods even though with lesser intensity. Libero is the most factual newspaper, with the least number of subjective clauses. Similar conclusion can be drawn from the use of passive clauses, where we see again that Libero has the lowest number. The reasons for Libero having the lowest number of nonfactive clauses in OMAB, needs to be connected with the highest number of NEGATIVE polarity clauses, which is related to the nomination of Monti instead of Berlusconi, and is felt and is communicated to its readers as less reliable, trustable, trustworthy. Uncertainty is clearly shown in the intermediate period, PTMB, where Corriere has again the highest number of nonfactual clauses.
4.3 The pragmatic analysis
We show in this section the results outputted by GETARUNS when analysing the streams of textual data belonging to the three sections of the corpus (presented in section 4.1). In Fig. 2 we represent comparative differences between the three newspaper in the use of three linguistic variables for each time period. In particular, we plotted the following classes of pragmatic linguistic objects: 1. references to Berlusconi as entity (Silvio, Silvio_Berlusconi, Berlusconi, Cavaliere, Caimano); 2. references to Monti as entity (Monti, prof_Monti, professore, Mario_Monti,
94
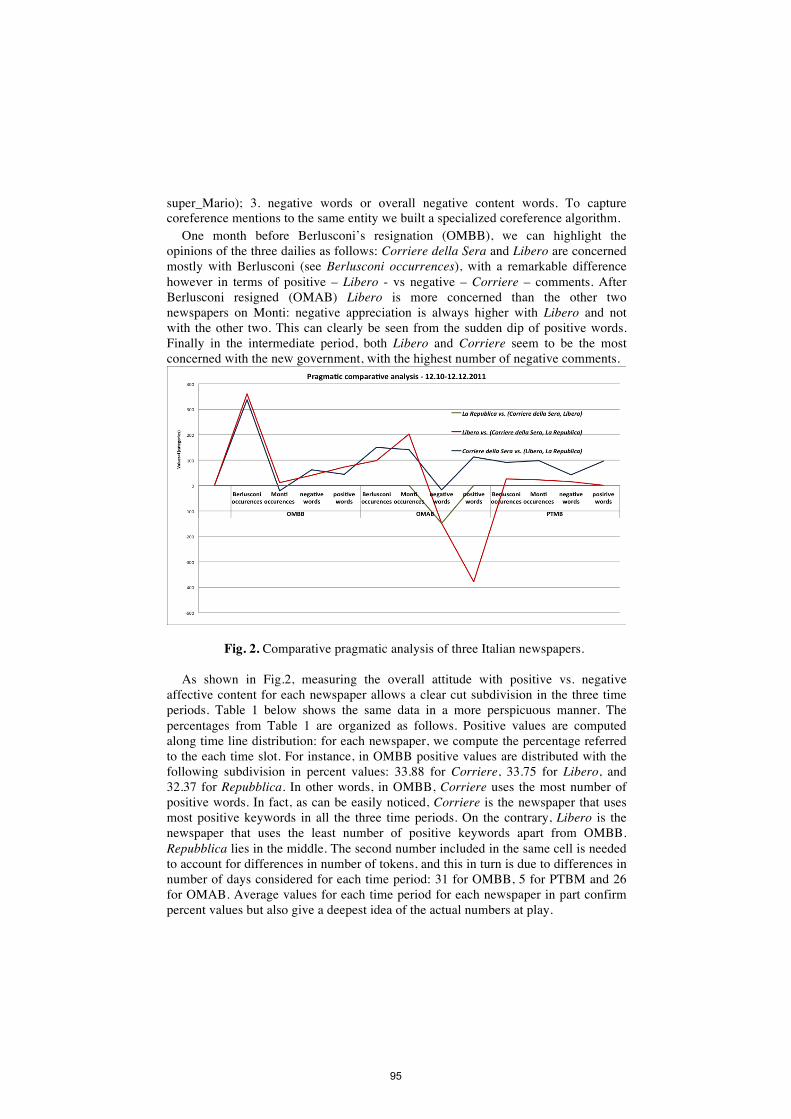
super_Mario); 3. negative words or overall negative content words. To capture coreference mentions to the same entity we built a specialized coreference algorithm.
One month before Berlusconi’s resignation (OMBB), we can highlight the opinions of the three dailies as follows: Corriere della Sera and Libero are concerned mostly with Berlusconi (see Berlusconi occurrences), with a remarkable difference however in terms of positive – Libero - vs negative – Corriere – comments. After Berlusconi resigned (OMAB) Libero is more concerned than the other two newspapers on Monti: negative appreciation is always higher with Libero and not with the other two. This can clearly be seen from the sudden dip of positive words. Finally in the intermediate period, both Libero and Corriere seem to be the most concerned with the new government, with the highest number of negative comments.
Fig. 2. Comparative pragmatic analysis of three Italian newspapers. As shown in Fig.2, measuring the overall attitude with positive vs. negative
affective content for each newspaper allows a clear cut subdivision in the three time periods. Table 1 below shows the same data in a more perspicuous manner. The percentages from Table 1 are organized as follows. Positive values are computed along time line distribution: for each newspaper, we compute the percentage referred to the each time slot. For instance, in OMBB positive values are distributed with the following subdivision in percent values: 33.88 for Corriere, 33.75 for Libero, and 32.37 for Repubblica. In other words, in OMBB, Corriere uses the most number of positive words. In fact, as can be easily noticed, Corriere is the newspaper that uses most positive keywords in all the three time periods. On the contrary, Libero is the newspaper that uses the least number of positive keywords apart from OMBB. Repubblica lies in the middle. The second number included in the same cell is needed to account for differences in number of tokens, and this in turn is due to differences in number of days considered for each time period: 31 for OMBB, 5 for PTBM and 26 for OMAB. Average values for each time period for each newspaper in part confirm percent values but also give a deepest idea of the actual numbers at play.
95

Newspaper / time period
Corriere della Sera Libero La Republica
positive negative positive negative positive negative
OMBB 33.95%
52.1 35.49% 21.48
33.74% 51.9
32.6% 19.77
32.34% 49.77
31.91% 18.58
PTMB 42.36%
61.2 44.49%
21.8 24.4% 34.2
25.98% 11.4
33.24% 45.8
29.53% 16
OMAB 35.14% 54.88
32.68% 20.42
25.39% 39.58
28.21% 18
39.47% 49.12
39.12% 19.53
Table 1. Sentiment analysis of three Italian newspapers Negative opinions are computed in the same way. These data can be interpreted as
follow: One month before Berlusconi’s resignation (OMBB), both Libero and Corriere
della Sera have more positive contents than La Repubblica, which can be interpreted as follows: Berlusconi’s Government is considered a good one; in addition, Libero, has the lowest percentage of negative opinions about the current economic situation. In the intermediate period between Berlusconi's resignation and nomination of the new Prime Minister, Mario Monti (PTMB) we see that Corriere has by far the highest percentage of positive opinions, whereas Libero has the lowest. The other period, one month after the nomination of new prime minister, Mario Monti, (OMAB), we assist to a change of opinions. Corriere della Sera becomes more positive than other newspapers and also negative opinions are much higher: the new prime minister seems a good chance for the Italian situation; however, the economic situation is very bad. Libero – the newspaper owned by Berlusconi - becomes a lot less positive and less negative than the other two. This situation changes in the following time period, where Libero increases in positivity – but remains always the lowest value – and in negativity, but remains below the other two newspaper, on average. This can be regarded as a distinctive stylistic feature of Libero newspaper. As a whole, we can see that Repubblica is the one that undergoes less changes, if compared to Libero and Corriere which are the ones that undergo most changes in affective attitude.
We already saw in the Fig. 1 above that Libero is the newspaper with the highest number of nonfactual and subjective clauses in the OMAB time period: if we now add this information to the one derived from the use of positive vs. negative words, we see that the dramatic change in the political situation is no longer shown by the presence of a strong affective vocabulary, but by the modality of presenting important concepts related to the current political and economic situation, which becomes vague and less factual after Berlusconi resigned.
Eventually, we were interested in identifying semantic linguistic common area (identification of common words), also called common lexical fields, and their affective import (positive or negative). From previous tables, it can be easily noticed that all three newspapers use words with strong negative import, but with different frequency. Of course, this may require some specification, seeing the political context analyzed. So we decided to focus on a certain number of specialized concepts and
96

associated keywords that we extracted from the analysis to convey the overall attitude and feeling of the political situation. We collected in Table 2 below all words related to “Crisis Identification” (CIW for short) and noted down their absolute frequency of occurrence for each time interval.
CIW
OMBB Corriere Libero Repub.
1. crisis 124 71 94 sacrifice 4 14 4 rigour 5 4 4
austerity 0 6 6 2. battle 6 12 14
dissent 2 8 8 dictator/ship 2 10 18 3. fail/ure 8 13 9
collapse 10 6 12 drama/tic 12 14 18 dismiss/al 45 39 20
CIW OMAB Corriere Libero Repub.
1. crisis 50 21 110 sacrifice 9 23 16 rigour 23 18 10
austerity 6 2 0 2. battle 14 4 8
dissent 0 4 0 dictator/ship 2 6 2 3. fail/ure 21 8 15
collapse 8 2 4 drama/tic 4 0 8 dismiss/al 3 2 15
Table 2. Crisis Identification words in two time periods If we look at the list as being divided up into three main conceptualizations, we
may regard the first one as denouncing the critical situation, the second one as trying to indicate some causes; and the last one as being related to the reaction to the crisis. It is now evident what the bias of each newspaper is, in relation to the incoming crisis:
- Corriere della Sera feels the “crisis” a lot deeper before Berlusconi’s resignation, than afterwards when Monti arrives; the same applies to Libero. La Repubblica feels the opposite way. However, whereas “austerity” is never used by La Repubblica after B.’s resignation and it was used before it, this is the opposite of what Corriere della Sera does, the word appears only after B’s resignation, never before. As to the companion word “sacrifice”, Libero is the one that uses it the most, and as expected its appearance increases a lot after B.’s resignation, together with the companion word “rigour” that has the same behaviour. This word confirms Corriere’s attitude towards Monti’s nomination: it will bring “austerity, rigour and sacrifice”.
- in the second half, the other interesting couple of concepts is linked to “battle, dissent, dictator”. In particular, “battle” is used in the opposite way by Corriere della Sera when compared to the other two newspapers: the word appears more than the double in the second period, giving the impression that the new government will have to fight a lot more than the previous one. As to “dissent”, all three newspapers use it in the same manner: it disappears in both Corriere della Sera and La Repubblica, and it is halved in Libero. Eventually the “dictator/ship” usually related to B. or to B.’s government: it is a critical concept for La Repubblica in the first period, and it almost disappears in the second one.
- as to the third part of the list, whereas Libero felt the situation “dramatic” before B.’s resignation, the dramaticity disappears afterwards. The same applies in smaller percentage to the other two newspapers. Another companion word, “collapse” has the
97
same behaviour: Monti’s arrival is felt positively. However, the fear and the rumours of “failure” is highly felt by Corriere della Sera and La Repubblica, less so by Libero. This is confirmed by the abrupt disappearance of the concept of “dismiss/al” which dips to the lowest with Libero.
5 Conclusion The analysis we proposed in this paper aims at testing if a linguistic perspective anchored in natural language processing techniques (in this case, the scaled version of GETARUNS system) could be of some use in evaluating political discourse in print press. If this proves to be feasible, then a linguistic approach would become a very relevant to an applicative perspective, with important effects in the optimization of the automatic analysis of political discourse.
However, we are aware that this study only sketches a way to go, and a lot more should be studied until a reliable discourse interpreting technology will become a tool in researcher’s hands. We should also be aware of the dangers of false interpretation. For instance, if we take as example the three newspapers we used in our experiments, differences at the level of lexicon and syntax, which we have highlighted as differentiating them, should be attributed only partially to their idiosyncratic rhetorical styles, because these differences could also have editorial roots. Theoretically, at least, Corriere della Sera, should embody an impartial opinion, Libero, pro Berlusconi and La Repubblica, against him. But differences are more subtle, and in fact, in some cases, we could likewise classify Libero as being impartial, Corriere della Sera as being pro current government and La Repubblica as the only one being more critical on the current government disregarding its political stance. It remains yet to be decided the impact that the use of certain syntactic structures could have over a wider audience of political discourse. In other words, this study may show that automatic linguistic processing is able to detect tendencies in the manipulation of the interlocutor with the hidden role of detouring the attention of the audience from the actual communicated content in favor of the speaker’s intentions.
Different intensities of emotional levels have been clearly highlighted, but we intend to organize a much more fine-grained scale of emotional expressions. It is a well-known fact that the audience can be easily manipulated (e.g., the social and economic class) by a social actor (journalist, political actor) when their themes are treated with excessive emotional tonalities (in our study, common negative words). In the future, we intend to extend the specialized lexicon for political discourse in order to individuate more specific uses of words in context, of those words which are ambiguous between different semantic classes, or between classes in the lexicon and outside the lexicon (in which case they would not have to be counted). We believe that GETARUNS has a range of features that make it attractive as a tool to assist any kind of communication campaign. We wish it to be rapidly adapted to new domains and to new languages (i.e. Romanian), and be endowed with a user-friendly web interface that offers a wide range of functionalities. The system helps to outline distinctive features which bring a new and, sometimes, unexpected vision upon the discursive feature of journalists’ writing.
98

Acknowledgments: In performing this research, the second author was supported by the POSDRU/89/1.5/S/63663 grant.
References 1. Bos, Johan & Delmonte, Rodolfo (eds.): “Semantics in Text Processing (STEP), Research
in Computational Semantics”, Vol.1, College Publications, London (2008). 2. Esuli, A. and F. Sebastiani. Sentiwordnet: a publicly available lexical resource for opinion
mining. In Proceedings of the 5th Conference on Language Resources and Evaluation LREC, 6, 2006.
3. Delmonte, R. (2007). Computational Linguistic Text Processing – Logical Form, Logical Form, Semantic Interpretation, Discourse Relations and Question Answering, Nova Science Publishers, New York.
4. Delmonte, R., Tonelli, S., Tripodi, R.: Semantic Processing for Text Entailment with VENSES, published at http://www.nist.gov/tac/publications/2009/papers.html in TAC 2009 Proceedings Papers (2010).
5. Delmonte, R. (2009). Computational Linguistic Text Processing – Lexicon, Grammar, Parsing and Anaphora Resolution, Nova Science Publishers, New York.
6. Delmonte R. and Vincenzo Pallotta, 2011. Opinion Mining and Sentiment Analysis Need Text Understanding, in "Advances in Distributed Agent-based Retrieval Tools", “Advances in Intelligent and Soft Computing”, Springer, 81-96.
7. Gîfu, D. and Cristea, D.: Multi-dimensional analysis of political language, in J. J. (Jong Hyuk) Park, V. Leung, T. Shon, Cho-Li Wang (eds.) In Proc. of 7th FTRA International Conference on Future Information Technology, Application, and Service – FutureTech-2012, Vancouver, vol. 1, Springer (2012).
8. Hobbs, J. R., Stickel, M., Appelt, D., and Martin, P.: “Interpretation as Abduction”, SRI International Artificial Intelligence Centre Technical Note 499 (1990).
9. Pennebaker, James W., Booth, Roger J., Francis, Martha E.: “Linguistic Inquiry and Word Count” (LIWC), at http://www.liwc.net/.
10. Kim, S.-M. and E. Hovy. Determining the sentiment of opinions. In Proceedings of the 20th international conference on computational linguistics (COLING 2004), page 1367–1373, August 2004.
11. Pang, B. and L. Lee. A sentimental education: sentiment analysis using subjectivity summarization based on minimum cuts. In Proceedings of the 42nd annual meeting of the Association for Computational Linguistics (ACL), page 271–278, 2004.
12. Polanyi, Livia and Zaenen, Annie: “Contextual valence shifters”. In Janyce Wiebe, editor, Computing Attitude and Affect in Text: Theory and Applications. Springer, Dordrecht, 1–10 (2006).
13. Pollack, M., Pereira, F.: “Incremental interpretation”. In Artificial Intelligence 50, 37-82 (1991).
14. Saurì R., Pustejovsky, J.: “Are You Sure That This Happened? Assessing the Factuality Degree of Events in Text”, Computational Linguistics, 38, 2, 261-299 (2012).
15. Taboada, M., Brooke, J., Tofiloski, M., Voll, K. & Stede, M.: “Lexicon-based methods for sentiment analysis”. In Computational Linguistics 37(2): 267-307 (2011).
16. Turney, P.D. and M.L. Littman. Measuring praise and criticism: Inference of semantic orientation from association. ACM Transactions on Information Systems (TOIS), pages 15–346, 2003.
17. Wiebe, Janyce, Wilson, Theresa, Cardie, Claire: “Annotating expressions of opinions and emotions in language”. In Language Resources and Evaluation, 39(2):165–210 (2005).
99

Distributional Semantics for Answer Re-rankingin Question Answering?
Piero Molino, Pierpaolo Basile, Annalina Caputo,Pasquale Lops, and Giovanni Semeraro
Dept. of Computer Science - University of Bari Aldo MoroVia Orabona, 4 - I-70125, Bari (ITALY)
{piero.molino, pierpaolo.basile, annalina.caputo, pasquale.lops,giovanni.semeraro}@uniba.it
Abstract. This paper investigates the role of Distributional SemanticModels (DSMs) into a Question Answering (QA) system. Our purposeis to exploit DSMs for answer re-ranking in QuestionCube, a frameworkfor building QA systems. DSMs model words as points in a geometricspace, also known as semantic space. Words are similar if they are closein that space. Our idea is that DSMs approaches can help to computerelatedness between users’ questions and candidate answers by exploitingparadigmatic relations between words, thus providing better answer re-ranking. Results of the evaluation, carried out on the CLEF2010 QAdataset, prove the effectiveness of the proposed approach.
1 Introduction
Distributional Semantics Models (DSMs) represent word meanings through lin-guistic contexts. The meaning of a word can be inferred by the linguistic contextsin which the word occurs. The philosophical insight of distributional models canbe ascribed to Wittgenstein’s quote “the meaning of a word is its use in thelanguage”. The idea behind DSMs can be summarized as follows: if two wordsshare the same linguistic contexts they are somehow similar in the meaning. Forexample, analyzing the sentences “drink wine” and “drink beer”, we can assumethat the words “wine” and “beer” have similar meaning. Using that assumption,the meaning of a word can be expressed by the geometrical representation in asemantic space. In this space a word is represented by a vector whose dimensionscorrespond to linguistic contexts surrounding the word. The word vector is builtanalyzing (e.g. counting) the contexts in which the term occurs across a corpus.Some definitions of contexts may be the set of co-occurring words in a document,in a sentence or in a window of surrounding terms.? This paper summarizes the main results already published in Molino, P., Basile, P.,Caputo, A., Lops, P., Semeraro, G.: Exploiting Distributional Semantic Models inQuestion Answering. In: Sixth IEEE International Conference on Semantic Com-puting, ICSC 2012, Palermo, Italy, September 19-21, 2012. IEEE Computer Society2012, ISBN 978-1-4673-4433-3.
100
2 Molino, P., Basile, P., Caputo, A., Lops, P., Semeraro, G.
This paper aims at exploiting DSMs for performing a task to which they havenever been applied before, i.e. candidate answers re-ranking in Question Answer-ing (QA), exploring how to integrate them inside a pre-existent QA system. Ourinsight is based on the ability of these spaces to capture paradigmatic relationsbetween words which should result in a list of candidate answers related to theuser’s question.
In order to test the effectiveness of the DSMs for QA, we rely on a pre-existentQA framework called QuestionCube1 [2]. QuestionCube is a general frameworkfor building QA systems which exploits NLP algorithms, for both English andItalian, in order to analyze questions and documents with the purpose of allow-ing candidate answers obtained from the retrieved documents to be re-ranked bya pipeline of scorers. Scores assign a score to a candidate answer taking into ac-count several linguistic and semantic features. Our strategy for exploiting DSMsconsists in adding a new scorer to this pipeline, based on vector spaces built us-ing DSMs. In particular, we propose four types of spaces: a classical Term-Termco-occurrence Matrix (TTM) used as baseline, Latent Semantic Analysis (LSA)applied to TTM, Random Indexing (RI) approach to reduce TTM dimension,and finally an approach which combines LSA and RI. The scorer will assign ascore based on the similarity between the question and the candidate answersinside the DSMs.
2 Methodology
QuestionCube is a multilingual QA framework built using NLP and IR tech-niques. Question analysis is carried out by a full-featured NLP pipeline. Thepassage search step is carried out by Lucene, a standard off-the-shelf retrievalframework that allows TF-IDF and BM25 weighting. The question re-rankingcomponent is designed as a pipeline of different scoring criteria. We derive aglobal re-ranking function combining the scores with CombSum. More detailson the framework and a description of the main scorers is reported in [2]. Theonly scorers employed in the evaluation are: Terms Scorer, Exact SequenceScorer and Density Scorer, a scorer that assign a score to a passage basedon the distance of the question terms inside it. All the scorers have an enhancedversion which adopts the combination of lemmas and PoS tags as features.
Our DSMs are constructed over a co-occurrence matrix. The linguistic con-text taken into account is a window w of co-occurring terms. Given a referencecorpus2 and its vocabulary V , a n×n co-occurrence matrix is defined as the ma-trix M = (mij) whose coefficients mij ∈ R are the number of co-occurrences ofthe words ti and tj within a predetermined distance w. The term× term matrixM, based on simple word co-occurrences, represents the simplest semantic space,called Term-Term co-occurrence Matrix (TTM). In literature, several methods toapproximate the original matrix by rank reduction have been proposed. The aimof these methods varies from discovering high-order relations between entries to1 www.questioncube.com2 In our case the collection of documents indexed by the QA system.
101
Distributional Semantics for Answer Re-ranking in Question Answering 3
improving efficiency by reducing its noise and dimensionality. We exploit threemethods for building our semantic spaces: Latent Semantic Analysis (LSA),Random Indexing [1] (RI) and LSA over RI (LSARI). LSARI applies the SVDfactorization to the reduced approximation of M obtained through RI. All thesemethods produce a new matrix M, which is a n × k approximation of the co-occurrence matrix M with n row vectors corresponding to vocabulary terms,while k is the number of reduced dimensions. We integrate the DSMs into theframework creating a new scorer, the Distributional Scorer, that representsboth question and passage by applying addition operator to the vector represen-tation of terms they are composed of. Furthermore, it is possible to compute thesimilarity between question and passage exploiting the cosine similarity betweenvectors using the different matrices.
3 Evaluation
The goal of the evaluation is twofold: (1) proving the effectiveness of DSMsinto our question answering system and (2) providing a comparison between theseveral DSMs.
The evaluation has been performed on the ResPubliQA 2010 Dataset adoptedin the 2010 CLEF QA Competition [3]. The dataset contains about 10,700documents of the European Union legislation and European Parliament tran-scriptions, aligned in several languages including English and Italian, with 200questions. The adopted metric is the accuracy a@n (also called success@n), cal-culated considering only the first n answers. If the correct answer occurs in thetop n retrieved answers, the question is marked as correctly answered. In par-ticular, we take into account several values of n =1, 5, 10 and 30. Moreover, weadopt the Mean Reciprocal Rank (MRR) as well, that considers the rank of thecorrect answer. The framework setup used for the evaluation adopts Lucene asdocument searcher, and uses a NLP Pipeline made of a stemmer, a lemmatizer,a PoS tagger and a named entity recognizer. The different DSMs and the classicTTM have been used as scorers alone, which means no other scorers are adoptedin the scorers pipeline, and combined with the standard scorer pipeline consist-ing of the Simple Terms (ST), the Enhanced Terms (ET), the Enhanced Density(ED) and the Exact Sequence (E) scores. Moreover, we choosed empirically theparameters for the DSMs: the window w of terms considered for computing theco-occurrence matrix is 4, while the number of reduced dimensions consideredin LSA, RI and LSARI is equal to 1,000.
The performance of the standard pipeline, without the distributional scorer,is shown as a baseline. The experiments have been carried out both for Englishand Italian. Results are shown in Table 1, witch reports the accuracy a@n com-puted considering a different number of answers, the MRR and the significanceof the results with respect to both the baseline (†) and the distributional modelbased on TTM (‡). The significance is computed using the non-parametric Ran-domization test. The best results are reported in bold.
102

4 Molino, P., Basile, P., Caputo, A., Lops, P., Semeraro, G.
Table 1. Evaluation Results for both English and Italian
English Italian
Run a@1 a@5 a@10 a@30 MRR a@1 a@5 a@10 a@30 MRRalon
e
TTM 0.060 0.145 0.215 0.345 0.107 0.060 0.140 0.175 0.280 0.097
RI 0.180 0.370 0.425 0.535 0.267‡ 0.175 0.305 0.385 0.465 0.241‡
LSA 0.205 0.415 0.490 0.600 0.300‡ 0.155 0.315 0.390 0.480 0.229‡
LSARI 0.190 0.405 0.490 0.620 0.295‡ 0.180 0.335 0.400 0.500 0.254‡
combine
d
baseline 0.445 0.635 0.690 0.780 0.549 0.445 0.635 0.690 0.780 0.549
TTM 0.535 0.715 0.775 0.810 0.614 0.405 0.565 0.645 0.740 0.539†
RI 0.550 0.730 0.785 0.870 0.637†‡ 0.465 0.645 0.720 0.785 0.555†
LSA 0.560 0.725 0.790 0.855 0.637† 0.470 0.645 0.690 0.785 0.551†
LSARI 0.555 0.730 0.790 0.870 0.634† 0.480 0.635 0.690 0.785 0.557†‡
Considering each distributional scorer on its own, the results prove that allthe proposed DSMs are better than the TTM, and the improvement is alwayssignificant. The best improvement for the MRR in English is obtained by LSA(+180%), while in Italian by LSARI (+161%). Taking into account the distribu-tional scorers combined with the standard scorer pipeline, the results prove thatall the combinations are able to overcome the baseline. For English we obtain animprovement in MRR of about 16% with respect to the baseline and the resultobtained by the TTM is significant. For Italian, we achieve a even higher im-provement in MRR of 26% with respect to the baseline using LSARI. The slightdifference in performance between LSA and LSARI proves that LSA applied tothe matrix obtained by RI produces the same result of LSA applied to TTM,but requiring less computation time, as the matrix obtained by RI contains lessdimensions than the TTM matrix.
Finally, the improvement obtained considering each distributional scorers onits own shows a higher improvement than their combination with the standardscorer pipeline. This suggests that a more complex method to combine scorersshould be used in order to strengthen the contribution of each of them. To thispurpose, we plan to investigate some learning to rank approaches as future work.
References
1. Kanerva, P.: Sparse Distributed Memory. MIT Press (1988)2. Molino, P., Basile, P.: QuestionCube: a Framework for Question Answering. In:
Amati, G., Carpineto, C., Semeraro, G. (eds.) IIR. CEUR Workshop Proceedings,vol. 835, pp. 167–178. CEUR-WS.org (2012)
3. Penas, A., Forner, P., Rodrigo, A., Sutcliffe, R.F.E., Forascu, C., Mota, C.: Overviewof ResPubliQA 2010: Question Answering Evaluation over European Legislation. In:Braschler, M., Harman, D., Pianta, E. (eds.) Working notes of ResPubliQA 2010Lab at CLEF 2010 (2010)
103

INSEARCHA platform for Enterprise Semantic Search
Diego De Cao, Valerio Storch, Danilo Croce, and Roberto Basili
Department of Enterprise EngineeringUniversity of Roma, Tor Vergata
00133 Roma, Italy{decao,storch,croce,basili}@info.uniroma2.it
Abstract. This paper discusses the system targeted in the INSEARCHEU project. It embodies most of the state-of-the-art techniques for Enter-prise Semantic Search: highly accurate lexical semantics, semantic webtools, collaborative knowledge management and personalization. An ad-vanced information retrieval system has been developed integrating ro-bust semantic technologies and industry-standard software architecturesfor proactive search as well as personalized domain-specific classificationand ranking functionalities.
1 Introduction
Innovation is an unstructured process in most of Small and Medium Sized Enter-prises (SMEs). The so called “Innovation Management Techniques”, consideredby the European Commission as an useful driver to improve competitiveness, arestill underutilized by SMEs. Such techniques include Knowledge Management,Market Intelligence, Creativity Development, Innovation Project Managementand Business Creation. However, within these techniques, the Creativity Devel-opment techniques are the less used among SMEs1. The only activity performedby almost all SMEs is the search for external information, in different sourcessuch as the web, patent databases, in trade fairs or discussing with clients andpartners. The main source of information for SMEs is the Internet search [7],an activity realized by more than 90% of SMEs when dealing with innovation.Knowledge and information are often distributed in heterogeneous and unstruc-tured sources across networked systems and organizations. Search for entities(such as competitors or new products) is not always sufficient as search forknowledge, as the one related to novel processes or brands and marketing anal-ysis (whereas connected to large scale opinion mining), is based upon richerinformation.
The system targeted in the INSEARCH EU project2 embodies most of theideas of the currently en vogue Enterprise Semantic Search technologies [4]. In
1 European Commission, DG Enterprise Innovation management and the knowledgedriven economy - January 2004
2 FP7-SME-2010-1, Research for the benefit of specific groups, GA n. 262491
104
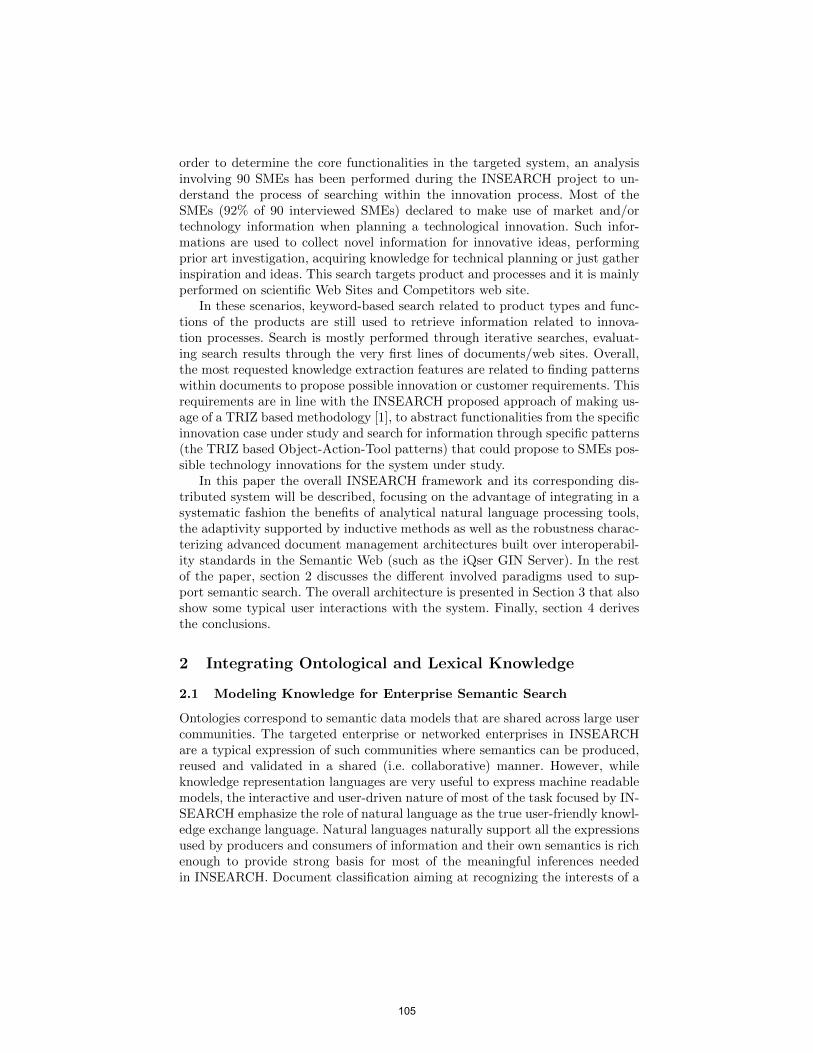
order to determine the core functionalities in the targeted system, an analysisinvolving 90 SMEs has been performed during the INSEARCH project to un-derstand the process of searching within the innovation process. Most of theSMEs (92% of 90 interviewed SMEs) declared to make use of market and/ortechnology information when planning a technological innovation. Such infor-mations are used to collect novel information for innovative ideas, performingprior art investigation, acquiring knowledge for technical planning or just gatherinspiration and ideas. This search targets product and processes and it is mainlyperformed on scientific Web Sites and Competitors web site.
In these scenarios, keyword-based search related to product types and func-tions of the products are still used to retrieve information related to innova-tion processes. Search is mostly performed through iterative searches, evaluat-ing search results through the very first lines of documents/web sites. Overall,the most requested knowledge extraction features are related to finding patternswithin documents to propose possible innovation or customer requirements. Thisrequirements are in line with the INSEARCH proposed approach of making us-age of a TRIZ based methodology [1], to abstract functionalities from the specificinnovation case under study and search for information through specific patterns(the TRIZ based Object-Action-Tool patterns) that could propose to SMEs pos-sible technology innovations for the system under study.
In this paper the overall INSEARCH framework and its corresponding dis-tributed system will be described, focusing on the advantage of integrating in asystematic fashion the benefits of analytical natural language processing tools,the adaptivity supported by inductive methods as well as the robustness charac-terizing advanced document management architectures built over interoperabil-ity standards in the Semantic Web (such as the iQser GIN Server). In the restof the paper, section 2 discusses the different involved paradigms used to sup-port semantic search. The overall architecture is presented in Section 3 that alsoshow some typical user interactions with the system. Finally, section 4 derivesthe conclusions.
2 Integrating Ontological and Lexical Knowledge
2.1 Modeling Knowledge for Enterprise Semantic Search
Ontologies correspond to semantic data models that are shared across large usercommunities. The targeted enterprise or networked enterprises in INSEARCHare a typical expression of such communities where semantics can be produced,reused and validated in a shared (i.e. collaborative) manner. However, whileknowledge representation languages are very useful to express machine readablemodels, the interactive and user-driven nature of most of the task focused by IN-SEARCH emphasize the role of natural language as the true user-friendly knowl-edge exchange language. Natural languages naturally support all the expressionsused by producers and consumers of information and their own semantics is richenough to provide strong basis for most of the meaningful inferences neededin INSEARCH. Document classification aiming at recognizing the interests of a
105

user in accessing a text (e.g. a patent) requires a strongly linguistic basis as textsare mostly free and unstructured, as in [13]. In retrieval, against user queries,document ranking functions are inherently based on lexical preferences models,whose traditional TF-IDF models are just shallow surrogates. Moreover, the richnature of the patterns targeted by INSEARCH (e.g. Object-Action-Tool tripleforeseen by the TRIZ methodology) is strongly linguistic, as the same informa-tion is usually expressed in text with a huge freedom, and as for the languagevariability itself. Consider as an example that if a tool like a packing machine isadopted for the manufacturing of coffee boxes, several sentences can make ref-erence to them, e.g. packing machine applied to coffee, coffee is packed throughdedicated machines or dedicated machines are used to pack small coffee boxes of10 inch.
Organizing knowledge through the SKOS concept scheme. Users areable to access, create or refine descriptions of a domain in the form of “tree oftopics”, or simply topic-trees (modeled as SKOS [18] concept schemes) whichwill support their contextual search throughout the system. These topics actas collectors for documents which expose all those textual contents that can benaturally associated to their definition. They are under all aspects a controlledhierarchical vocabulary of tags offered to a community of users. Behind everytag a large term vocabulary is used in order to exploit the corresponding topicsemantics during search activities. Topic-document associations may be discov-ered through information push by the mass: users inside a community contributetheir bookmarks to the system. On the other hand, it can be achieved by thesystem itself, by machine learning from the above information, automaticallycreating topic associations for massive amount of documents which are gatheredthrough the multichannel multimodal document discovery and acquisition com-ponent, as discussed in [13]. Examples of SKOS topic for the specific domainof the Innovation Engineering domain are reported in Fig. 1. Main SKOS con-cepts are Research and Intellectual Properties (organizing scientific pa-pers or patents) and Tecnology. The latter can be specified with the conceptbiotecnology or material and so on. Apart from their role of document con-tainers, topics may be described by enriching them with annotations, commentsand multiple lexicalizations for the various languages supported by INSEARCH,so that their usage is informally clarified to human users, possibly enforcing theirconsistent adoption across the community.
User Management. In INSEARCH, standard models and technologies of theRDF [10] family have been adopted to allow each user to view his own SKOSontology. It requires to model the information associated to user management,domain modeling and user data. The three different aspects have been physicallymodularized by partitioning the triples content, and each of these partitions isin turn divided into smaller segments to further account for specific data organi-zation requirements such as provenance and access privileges. The partitions areobtained through the use of RDF named graphs, so that, whenever appropriate,the knowledge server may benefit of a single shared data space, or is able con-versely to manage each partition (or set of partitions) as a separate dataset. The
106
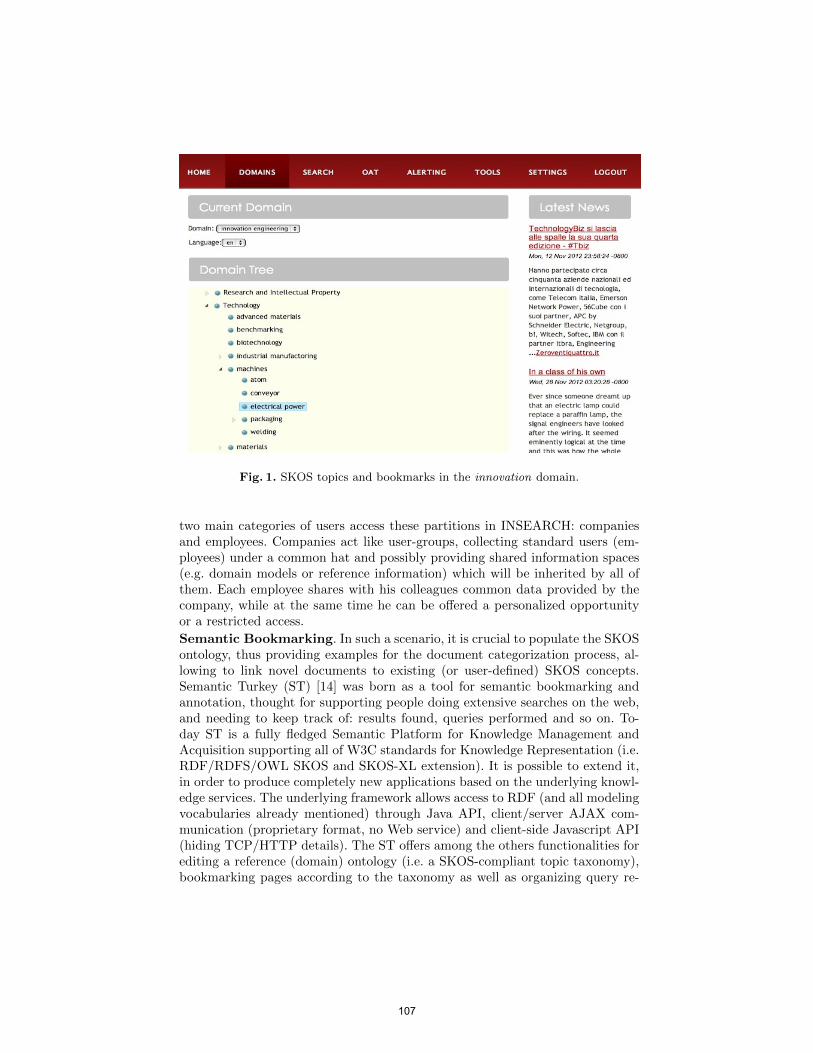
Fig. 1. SKOS topics and bookmarks in the innovation domain.
two main categories of users access these partitions in INSEARCH: companiesand employees. Companies act like user-groups, collecting standard users (em-ployees) under a common hat and possibly providing shared information spaces(e.g. domain models or reference information) which will be inherited by all ofthem. Each employee shares with his colleagues common data provided by thecompany, while at the same time he can be offered a personalized opportunityor a restricted access.
Semantic Bookmarking. In such a scenario, it is crucial to populate the SKOSontology, thus providing examples for the document categorization process, al-lowing to link novel documents to existing (or user-defined) SKOS concepts.Semantic Turkey (ST) [14] was born as a tool for semantic bookmarking andannotation, thought for supporting people doing extensive searches on the web,and needing to keep track of: results found, queries performed and so on. To-day ST is a fully fledged Semantic Platform for Knowledge Management andAcquisition supporting all of W3C standards for Knowledge Representation (i.e.RDF/RDFS/OWL SKOS and SKOS-XL extension). It is possible to extend it,in order to produce completely new applications based on the underlying knowl-edge services. The underlying framework allows access to RDF (and all modelingvocabularies already mentioned) through Java API, client/server AJAX com-munication (proprietary format, no Web service) and client-side Javascript API(hiding TCP/HTTP details). The ST offers among the others functionalities forediting a reference (domain) ontology (i.e. a SKOS-compliant topic taxonomy),bookmarking pages according to the taxonomy as well as organizing query re-
107
sults according to the hierarchical structure the SKOS taxonomy. Users may surfthe web with a standards compliant web browser, associating information foundon web documents to concepts from the current knowledge organization sys-tems (KOS). The core framework of ST has been totally reused in INSEARCHwithout specific customization. However, novel dedicated services have been de-veloped and plugged, flanking the main ones, to meet the specific INSEARCHrequirements (see also the discussion in next section on architecture). In par-ticular, the annotation mechanism is merged into the multiuser environment ofthe INSEARCH platform, so that the system may exploit contributions fromdifferent users, whenever the power of mass-contribution is exploitable.
2.2 Robust Modeling of Lexical Information
Computational models of natural language semantics have been traditionallybased on symbolic logic representations naturally accounting for the meaning ofsentences, through the notion of compositionality (as the Montague’s approachin [12] or [3]). While formally well defined, logic-based approaches have limi-tations in the treatment of ambiguity, vagueness and other cognitive aspectssuch as uncertainty, intrinsically connected to natural language communication.These problems inspired recently research on distributional models of lexi-cal semantics (e.g. Firth [8] or Schutze [15]). In line with Wittgenstein’s laterphilosophy, these latter characterize lexical meanings in terms of their contextof use [17]. Distributional models, as recently surveyed in [16], rely on the no-tion of Word Space, inspired by Information Retrieval, and manage semanticuncertainty through mathematical notion grounded in probability theory andlinear algebra. Points in normed vector space represent semantic concepts, suchas words or topics, and can be learned from corpora, in such a way that similar,or related, concepts are near to one another in the space. Methods for construct-ing representations for phrases or sentences through vector composition haverecently received a wide attention in literature (e.g. [11]). While, vector-basedmodels typically represent isolated words and ignore grammatical structure [16],the so-called compositional distributional semantics (DCS) has been re-cently introduced and still object of rich on-going research (e.g. [11, 5], [9], [2]).Notice that several applications, such as the one targeted by INSEARCH, aretight to structured concepts, that are more complex than simple words. An ex-ample are the TRIZ inspired Object-Action-Tool (OAT) triples that describeObject(s) that receive(s) an Action from Tool(s), such as those written in sen-tences like “. . . [the coffee]Object in small quantities [is prepared ]Action by the[packing machine itself ]Tool . . . ” or “. . . for [preparing ]Action [the coffee]Object
by extraction with [hot water ]Tool, . . . ”.Here physical entities (such as coffee or hot water) play the role of Objects
or Tools according to the textual contexts they are mentioned in. Compositionalmodels based on distributional analysis provide lexical semantic information thatis consistent both with the meaning assignment typical of human subjects towords and to their sentential or phrasal contexts. It should support synonymyand similarity judgments on phrases, rather than only on single words. The
108
Fig. 2. An high level view of the INSEARCH functionalities and services.
objective should be assigning high values of similarity to expressions, such as“. . . buy a car . . . ” vs. “. . . purchase an automobile . . . ”, while lower values tooverlapping expressions such as “. . . buy a car . . . ” vs. “. . . buying time . . . ”.Distributional compositional semantics methods provide models to define: (1)ways to represent lexical vectors v and o, for words v, o occurring in a phrase(r, v, o) (where r is a syntactic relation, such as verb-direct object), and (2)metrics for comparing different phrases according to the basic representations,i.e. the vectors v, o.
While a large literature already exist (e.g. [11]) the user can find more detailsabout the solution adopted in INSEARCH in [2]. Compositional distributionalsemantic models are used to guide the user modeling of ontological concepts of in-terest (such as the SKOS topics), feed the document categorization process (thatis sensitive to OAT patterns through vector based representation of their com-position), concept spotting in text as well as query completion in INSEARCH.The adopted methods are discussed in [2] and [6].
3 The INSEARCH architecture
The INSEARCH overall architecture is designed as a set of interacting serviceswhose overall logic is integrated within the iQser GIN Server for informationecosystems. The comprehensive logical view of the system is depicted in Fig. 2.
The core GIN services are in the main central box. External Analyzers areshown on the left, as they are responsible for text and language processing or, asin the case of the Content vectorization module, for the semantic enrichment ofinput documents. GIN specific APIs are responsible for interfacing heterogenouscontent providers and managing other specific data gathering processes (e.g.specific crawlers). Client Connector APIs are made available by GIN for a variety
109

of user level functionalities, such as User Management, Semantic Bookmarkingor Contextual searches that are managed via appropriate GIN interface(s). Atthe client level in fact, the basic search features from web sources and patents,are extended with:– Navigation in linked search results and Recommendations for uploaded or
pre-defined contents through bookmarks or SKOS topics of interest. Recom-mendations are strongly driven by the semantically linked content, estab-lished by the core analysis features of the GIN server.
– Semantic bookmarking is supported allowing sophisticated content manage-ment, including the upload of documents, the triggering of web crawlingstages, the definition and lexicalization of interests, topics and concepts de-scribed in SKOS. Interesting information items are used for upgrading rec-ommendations, topics and concepts and prepare contextual searches.
– Personalization allows user management functions at the granularity of com-panies as well as people.On the backend side, we emphasize that the current server supports the
integration with Alfresco3 as the document and content management system,whereas the defined interests are also managed as Alfresco’s content. While theintegration of Web sources is already supported by a dedicated crawler, alsopatents are targeted with an interface to the patent content provider WIPO4.
Contextual Semantic search is also supported through vector space meth-ods. Vectorization is applied to incoming documents with an expansion of tradi-tional bag-of-word models based on topic models and Latent Semantic Analysis(as discussed in Section 2.2). Moreover, the available vector semantics supportsdistributional compositional functions that model the representation and infer-ences regarding TRIZ-like OAT patterns, so that natural language processingand querying based on domain specific patterns are consistently realized. Basicfeature extraction services and morphosyntactic analyzers (such as lemmatiza-tion and part of speech tagging) are already in place as external GIN analyzers.
The main functionalities currently integrated in INSEARCH are thus:– Website monitoring: Observe changes in given pages/domains, which are
added by the user and implemented as bookmarklets– Assisted Search: such as in Query completion, e.g. support the user in the
designing proper queries about company’s products or markets .– Document analysis: Intelligent Document Analysis is applied to asses their
relevance to high-level topics predefined by the user in the SKOS taxonomy.Relevance to individual topics is provided through automatic classificationdriven by weighted membership scores of results with respect to individualtopics.
– Patent and scientific paper search: Search for patents and/or scientificpapers in existing databases (e.g. European patent office) is supported.
– OAT-Pattern analysis: TRIZ-inspired Object-Action-Tool (OAT) triplesare searched in documents: these patterns play the role of suggestions fortools, which provide a certain function specified by the object and the action.
3 http://www.alfresco.com/4 http://www.wipo.int/portal/index.html.en
110
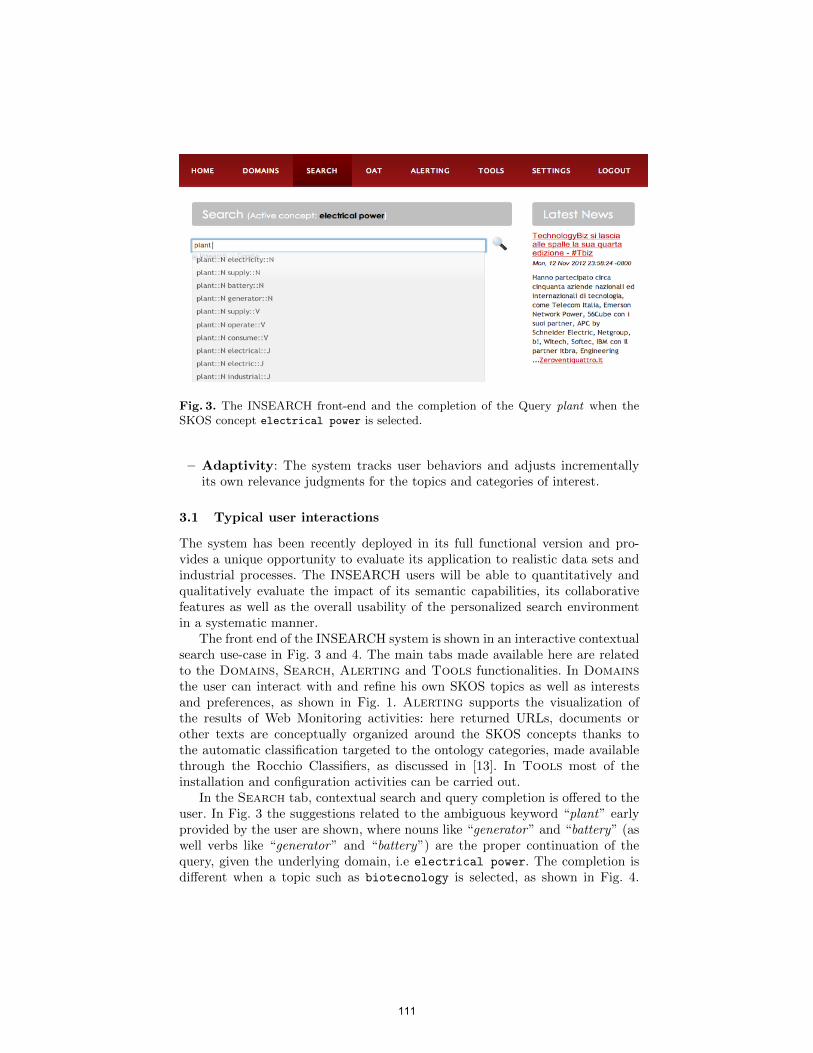
Fig. 3. The INSEARCH front-end and the completion of the Query plant when theSKOS concept electrical power is selected.
– Adaptivity: The system tracks user behaviors and adjusts incrementallyits own relevance judgments for the topics and categories of interest.
3.1 Typical user interactions
The system has been recently deployed in its full functional version and pro-vides a unique opportunity to evaluate its application to realistic data sets andindustrial processes. The INSEARCH users will be able to quantitatively andqualitatively evaluate the impact of its semantic capabilities, its collaborativefeatures as well as the overall usability of the personalized search environmentin a systematic manner.
The front end of the INSEARCH system is shown in an interactive contextualsearch use-case in Fig. 3 and 4. The main tabs made available here are relatedto the Domains, Search, Alerting and Tools functionalities. In Domainsthe user can interact with and refine his own SKOS topics as well as interestsand preferences, as shown in Fig. 1. Alerting supports the visualization ofthe results of Web Monitoring activities: here returned URLs, documents orother texts are conceptually organized around the SKOS concepts thanks tothe automatic classification targeted to the ontology categories, made availablethrough the Rocchio Classifiers, as discussed in [13]. In Tools most of theinstallation and configuration activities can be carried out.
In the Search tab, contextual search and query completion is offered to theuser. In Fig. 3 the suggestions related to the ambiguous keyword “plant” earlyprovided by the user are shown, where nouns like “generator” and “battery” (aswell verbs like “generator” and “battery”) are the proper continuation of thequery, given the underlying domain, i.e electrical power. The completion isdifferent when a topic such as biotecnology is selected, as shown in Fig. 4.
111

Fig. 4. The INSEARCH front-end and the completion of the Query plant when theSKOS concept biotecnology is selected.
The different completion is made available by the lexicalization of each concept:these lexical preferences are projected in an underlying Word Space (discussed inSection 2.2) that provides the geometrical representation of all words appearingin the indexed documents. Given the vectors representing all query terms andthe lexical preferences of the selected SKOS concepts, the most similar (i.e.nearest) words are selected and proposed for the completion. This adaptivity isachieved also to provide novel information to the final users. In the front-endinterface, a list of news is proposed. These are continually downloaded from theweb and retrieved using the lexical preferences specified by the user during hisown registration as well as the selected SKOS concepts. Notice that news aresensitive to the different SKOS concepts during the session, as in Fig. 3 and 4.
Once the query is submitted, documents are retrieved, automatically classi-fied and clustered with respect to the existing SKOS concepts, as in Fig. 5. Thisclustering phase allows users to browse documents exploring their relatednessto specific SKOS concepts, such as electrical power or research. The userinterface also allows to implement a relevance feedback strategy to improve thequality and adaptivity of text classifiers by simply clicking over the “thumbs up”or “thumbs down” icons. They allow to accept or reject each concept/documentassociation, that reflects the underlying text classification. When the user ac-cepts a classification, the Rocchio classifier associated with the correspondingconcept is incrementally fed with the document, that becomes a positive exam-ple. On the contrary, the selected document is provided as a negative example,by clicking on the “thumbs down” icon.
Finally, the Object-Action-Tool (OAT) pattern-based search is shown in Fig.6. The user is allowed to retrieve documents specifying specific actions (pack),objects (coffee boxes) or tools (dedicated machine). During the data-gathering
112

Fig. 5. The INSEARCH front-end the presentation schema of retrieved documents forthe query plant when the SKOS concept electrical power is selected. Here 6 and 3documents are related to the electrical power and research concept, respectively.The “Thumbs up”/“Thumbs down” icons allow to implement a relevance feedbackstrategy.
phase, the OAT pattern extraction module (see Fig. 2) extracts all patterns fromthe documents, by exploiting a set of pre-defined morphosyntactic patterns, suchas Subject-Verb-Object. The extracted OAT patterns are used during theindexing phase, thus enabling semi-structured queries through (possible incom-plete) OAT patterns. Fig. 6 summarizes a session where the user is interested indocuments related to the action control and object nuclear fission. Initially thesystem suggests a set of possible tools, such as method, system or product. Theuser can select one or more tools to browse the related documents.
4 Conclusions
In the innovation process, the search of external information represents a crucialactivity for the most of Small and Medium Sized Enterprises. In this paper thesystem targeted in the INSEARCH EU project is discussed. It embodies most ofthe state-of-the-art techniques for Enterprise Semantic Search: highly accuratelexical semantics, semantic web tools, collaborative knowledge management andpersonalization. The outcome is an advanced integration of analytical natural
113

Fig. 6. The INSEARCH front-end for the Object-Action-Tool (OAT) triple-basedsearch schema
language analysis tools, robust adaptive methods and semantic document man-agement systems relying over the Semantic Web standards. The knowledge basespersonalization as well as the semantic nature of the recommending function-alities (e.g. query completion, contextual search and Object-Action-Tool triple-based search) will be evaluated in systematic benchmarking activities, carriedat the enterprise premises, within realistic and representative scenarios.
114

Acknowledgment The authors would like to thank all the partners of the IN-SEARCH consortium as they made this research possible. In particular, we thankArmando Stellato and Daniele Previtali from UNITOR, Jorg Wurzer from iQSer,Paolo Salvatore from CiaoTech, Sebastian Dunninger, Stefan Huber from Kus-ftein, Antje Schlaf from INFAI, Mirko Clavaresi from Innovation Engineering,Cesare Rapparini from ICA and Hank Koops from Compano.
References
1. Altshuller, G.: 40 principles, TRIZ keys to technical innovation. No. 1 in Triz tools,Technical Innovation Center, Worcester, Mass., 1. ed edn. (1998)
2. Annesi, P., Storch, V., Basili, R.: Space projections as distributional models forsemantic composition. In: Gelbukh, A.F. (ed.) CICLing (1). LNCS, vol. 7181, pp.323–335. Springer (2012)
3. B. Coecke, M.S., Clark, S.: Mathematical foundations for a compositional dis-tributed model of meaning. Lambek Festschirft, Linguistic Analysis 36 (2010)
4. Baeza-Yates, R., Ciaramita, M., Mika, P., Zaragoza, H.: Towards semantic search.Natural Language and Information Systems pp. 4–11 (2008)
5. Baroni, M., Zamparelli, R.: Nouns are vectors, adjectives are matrices: representingadjective-noun constructions in semantic space. In: Proceedings of EMNLP 2010.pp. 1183–1193. Stroudsburg, PA, USA (2010)
6. Basili, R., Giannone, C., De Cao, D.: Learning domain-specific framenets fromtexts. In: Proceedings of the ECAI Workshop on Ontology Learning and Popula-tion. ECAI, ECAI, Patras, Greece (July 2008)
7. Cocchi, L., Bohm, K.: Deliverable 2.2: Analysis of functional and market informa-tion. TECH-IT-EASY (2009)
8. Firth, J.: A synopsis of linguistic theory 1930-1955. In: Studies in Linguistic Analy-sis. Philological Society, Oxford (1957), reprinted in Palmer, F. (ed. 1968) SelectedPapers of J. R. Firth, Longman, Harlow.
9. Grefenstette, E., Sadrzadeh, M.: Experimental support for a categorical composi-tional distributional model of meaning. CoRR abs/1106.4058 (2011)
10. Klyne, G., Carroll, J.J.: Resource Description Framework (RDF): Concepts andAbstract Syntax (2004)
11. Mitchell, J., Lapata, M.: Vector-based models of semantic composition. In: In Pro-ceedings of ACL-08: HLT. pp. 236–244 (2008)
12. Montague, R.: Formal Philosophy: Selected Papers of Richard Montague. YaleUniversity Press (1974)
13. Moschitti, A., Basili, R.: Complex linguistic features for text classification: a com-prehensive study. In: Proc. of the ECIR. pp. 181–196. Springer Verlag (2004)
14. Pazienza, M.T., Scarpato, N., Stellato, A., Turbati, A.: Semantic turkey: Abrowser-integrated environment for knowledge acquisition and management. Se-mantic Web journal 3(2) (2012)
15. Schutze, H.: Automatic Word Sense Discrimination. Computational Linguistics 24,97–124 (1998)
16. Turney, P.D., Pantel, P.: From frequency to meaning: Vector space models of se-mantics. Journal of artificial intelligence research 37, 141 (2010)
17. Wittgenstein, L.: Philosophical Investigations. Blackwells, Oxford (1953)18. World Wide Web Consortium: SKOS Simple Knowledge Organization System Ref-
erence (Aug 2009)
115

Wikipedia based Unsupervised QueryClassification
Milen Kouylekov, Luca Dini, Alessio Bosca, and Marco Trevisan
CELI S.R.L., Torino, Italy{kouylekov,dini,bosca,trevisan}@celi.it
Abstract. In this paper we present an unsupervised approach to QueryClassification. The approach exploits the Wikipedia encyclopedia as acorpus and the statistical distribution of terms, from both the categorylabels and the query, in order to select an appropriate category. Wehave created a classifier that works with 55 categories extracted fromthe search section of the Bridgeman Art Library website. We have alsoevaluated our approach using the labeled data of the KDD-Cup 2005Knowledge Discovery and Data Mining competition (800,000 real userqueries into 67 target categories) and obtained promising results.
Keywords: Query Classification, Wikipedia, Vector Models
1 Introduction
In Information Science logs analysis and more specifically Query Classification(QC) has been used to help detecting users web search intent. Query classifica-tion studies have shown the difficulty of achieving accurate classification due tothe inevitably short queries. A common practice is to enrich query with externalinformation, and to use an intermediate taxonomy to bridge the enriched queryand the target categories. A good summary of such approaches is made by theKDDCUP 2005 organizers [2005]). Associating external information to queriesis costly as it involves crowing the web. The goal of our approach is to create anlightweight unsupervised language independent approach to query classificationusing the rich content provided by the Wikipedia, a resource easily accessible inmany languages.
In Section 2 we present this approach. In Section 3 we provide a evaluationof its capabilities.
2 Unsupervised Query Classification Approach
Our approach is based on the vector space model (VSM). The core of the VSM isrepresenting text documents as vectors of identifiers, such as index terms. Eachelement of the vectors corresponds to a separate term found in the document. Ifa term occurs in the document, its value in the vector is non-zero. The dimen-sionality of the vector is the number of words in the vocabulary (the number
116

of distinct words occurring in the corpus). In VSM, weights associated with theterms are calculated based on a heuristic functions. Some of the more popularapproaches are term frequency and inverse document frequency.
Using the VSM a similarity function between the vectors of two documentsand a query can be defined. The standard function used is the cosine similaritycoefficient, which measures the angle between two vectors.
We have adapted the vector space model to the query classification taskusing the following approach: First, we associate a document that describes thecategory with each category Ck. We name this document category documentCD. For example a CD for the category Basketball must contain informationabout: the rules of the game, National Basketball Association, FIBA and famousplayers etc. A CD for the Arts must contain information about i) paining; ii)sculptures; 3) art museums etc. In the second stage of the approach we associateto each query a set of relevant documents found in a document collection. Wedefine the category score of query q for category Ck as the maximum valueof the cosine similarity between term vectors of the CD of the category anda document relevant to the query Qi. For example we expect to find a lot ofcommon terms between a document relevant to the query Michael Jordan andthe CD for category Basketball and few common terms with the CD of thecategory Art. Finally as output the approach returns the categories which CDhas the highest cosine similarity with a relevant document of the query.
We use relevant documents for a query and not the query because we comparethe query terms with CD documents that are not relevant to the query itself.For example the CD of the category Arts does not contain a mentioning of PabloPicasso but the intersection between it and documents relevant to Pablo Picassocontain a lot of common terms like painting, art, surrealism etc.
In order to make our approach feasible we need a document collection thatcontains sufficient number of documents in order to: 1) Find a big enough CDdocument for each category. 2) Find documents relevant to the classified queries.
The advantage of the proposed approach is that it does not require trainingdata and it is language dependent. The approach will befit greatly from a shortcategory description as this will allow a more correct selection of a CD.
3 Experiments
In our experiments we used the Wikipedia, a free, web-based, collaborative,multilingual encyclopedia1. We assign as CD for the category with the nameX the Wikipedia page with the same title. For example the Wikipedia Pagewith title Basketball can be used as a CD for the category Basketball. The pagedescribes almost all the important aspect of the game and has a lot of terms incommon with documents relevant to queries like: Michael Jordan, NBA Playoffsand Chicago Bulls. Respectively the page with the title Hardware contains a lotof terms in common with documents relevant for queries like: intel processors,computer screens and nvida vs intel.
1 http://wwww.wikipedia.org
117

For some categories the CD assigned by the approach contains short textsthat are not sufficient for a complete overview of the category. We expand theCD for these categories by concatenating the texts of the pages that contain thename of the category as sub part of the page title. For example the CD for thecategory Arts can be expanded by concatenating the text of the pages: Liberalarts, Visual arts, Arts College, Art Education, Islamic Arts etc. If the approachdoes not find a page with the same title as the category it assigns as CD for thecategory the concatenation of pages with the name of the category as sub partof the page title or pages that contain the category name in the first sentence ofthe page text.
3.1 Bridgeman Art Library
Our first evaluation is done using the taxonomy and query dataset createdfor the ART domain in the Galateas Project [2011]. The domain is definedby the contents of the Bridgeman Art Library(BAL) website2. To understandtheir use and meaning the categories have been grouped by BAL domain ex-perts into three groups: Topics (Land and Sea, Places, Religion and Belief, An-cient and World Cultures etc. 23), Materials (Metalwork, Silver, Gold & SilverGilt, Lacquer & Japanning, Enamels etc. 10), and Objects (Crafts and Design,Manuscripts, Maps, Ephemera, Posters, Magazines, Choir Books etc. 22) (total:55 top-categories).
Our approach was evaluated on the 100 queries annotated by the three an-notators into upto 3 categories. The queries were in four languages English ,French, German, Dutch and Italian. We have created a classification instancefor each language by manually translating the name of the categories in eachlanguage. For each of these queries we automatically assign the top 3 categoriesreturned by the classifier. Example:
Query: navajo turquoiseCategory1: Semi-precious Stones Score: 0.228Category2: Silver, Gold & Silver Gilt: 0.1554Category3: Botanical Score: 0.1554
In this example the category assigned to the query is Category1 Semi-preciousStones. The results of the evaluation are summarized in Table 1.
Precison F-Measure
Bridgeman Art Library 16.1 14.5
KDD Cup Results 29.0 32.2Table 1. Results
2 http://www.bridgemanart.com/
118

3.2 KDD Cup 2005
To evaluate our approach we have experimented also with the KDD-Cup 2005data [2005]. The data is from query classification task selected by the organizersas interesting to participants from both academia and industry. The task of thecompetition consists in classifying Internet user search queries. The participantshad to categorize 800,000 queries into 67 predefined categories. The meaningand intention of search queries is subjective. A search query Saturn might meanSaturn car to some people and Saturn the planet to others. The participantshad to tag each query with up to 5 categories. The systems participating in thecompetition were ranked by the organizers on the obtained average F-Measure.
We have evaluated our approach against a gold standard provided by theorganizers (800 queries). Our approach obtained an average F-Measure of 32.2(Table 1). The state of the art system [2006] in the competition achieves F-Measure of 46.1.
4 Discussion
The results obtained are encouraging having in prospective the unsupervisednature of the approach. One of the main difficulties were the generic names ofcategories like Icons and The Arts and Entertainment. The documents for thesecategories contained terms that were not relevant to the art domain. Also asignificant problem for the system posed queries that are named entities. Thesequeries were classified based on their descriptions into categories relevant to theirpeculiarities and not in People and Society, Personalities and Places categories.A possible solution to this problem will be to map DBPedia3 hierarchy to thedomain categories and use it as a additional source of knowledge.
The results we obtained is encouraging particularly because we did not asso-ciated additional information to each queries apart of the documents obtainedusing Wikipedia. Many of the queries did not produce relevant Wikipedia docu-ments, which is one of the main limitations of our approach. Additional domaincorpora will decrease its effect.
References
[2005] Ying Li, Zijian Zheng, and Honghua (Kathy) Dai. Kdd cup-2005 report: facinga great challenge. ACM SIGKDD Explorations Newsletter Homepage archive, 7(2),2005.
[2006] Dou Shen, Jian-Tao Sun, Qiang Yang, and Zheng Chen. Building bridges forweb query classification. In SIGIR06, 2006.
[2011] Eduard Barbu, Raphaella Bernardi, T.D. Le, Milen Kouylekov, V. Petras, Mas-simo Poesio, Juliane. Stiller, E. Vald, D7.1 First Evaluation Report of Topic Com-putation and TLIKE , Galateas Project http://www.galateas.eu
3 http://dbpedia.org/
119
Related Documents