ICT, R&D and Non-R&D intangible capital: complementary relations and industry productivity grow in European countries C. Corrado, (The Conference Board), New York J. Haskel, (Imperial College, CEPR and IZA), London C. Jona-Lasinio, (ISTAT and LLEE), Rome M. Iommi, (ISTAT and LLEE), Rome World KLEMS Third Conference RIETI 19-20 May 2014, Tokyo C. Jona-Lasinio INTAN-Invest 1 / 23

ICT, R&D and Non-R&D intangible capital: complementary relations and industry productivity growth in European countries
Jul 14, 2015
Welcome message from author
This document is posted to help you gain knowledge. Please leave a comment to let me know what you think about it! Share it to your friends and learn new things together.
Transcript
ICT, R&D and Non-R&D intangible capital:complementary relations and industry productivity growth
in European countries
C. Corrado, (The Conference Board), New YorkJ. Haskel, (Imperial College, CEPR and IZA), London
C. Jona-Lasinio, (ISTAT and LLEE), RomeM. Iommi, (ISTAT and LLEE), Rome
World KLEMS Third Conference
RIETI 19-20 May 2014, Tokyo
C. Jona-Lasinio INTAN-Invest 1 / 23
Introduction
• Our aim• INTAN-Invest Harmonised Measures of Intangible Investment• ICT, R&D and Non-R&D Intangible Capital:
• New sources of growth in EU countries-industries• Complementary relations and productivity growth
• Summing up and next research steps
C. Jona-Lasinio INTAN-Invest 2 / 23
Our aim
• Provide descriptive evidence on the dynamics and intensity ofintangible investments in a sample of European countries in1995-2010.
• Assess the impact of intangible capital on European industryproductivity growth focusing on the contribution of 3 assetcategories and their synergies:• ICT, R&D and Non R&D Intangibles
C. Jona-Lasinio INTAN-Invest 3 / 23
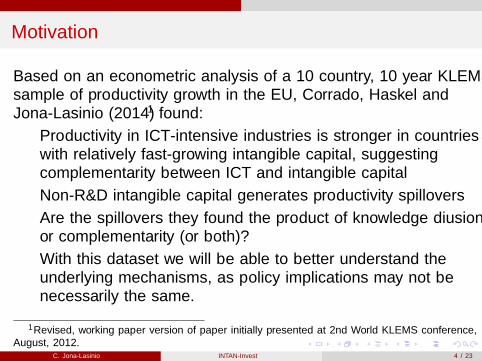
Motivation
Based on an econometric analysis of a 10 country, 10 year KLEMSsample of productivity growth in the EU, Corrado, Haskel andJona-Lasinio (2014) 1 found:• Productivity in ICT-intensive industries is stronger in countrieswith relatively fast-growing intangible capital, suggestingcomplementarity between ICT and intangible capital
• Non-R&D intangible capital generates productivity spillovers• Are the spillovers they found the product of knowledge diffusionor complementarity (or both)?
• With this dataset we will be able to better understand theunderlying mechanisms, as policy implications may not benecessarily the same.
1Revised, working paper version of paper initially presented at 2nd World KLEMS conference,August, 2012.
C. Jona-Lasinio INTAN-Invest 4 / 23
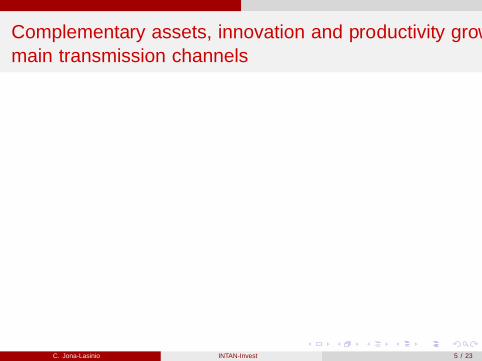
Complementary assets, innovation and productivity growth:main transmission channels
PRODUCTIVITY+
ICT+
Non+R&D+INTG+
R&D+
INNOVATION+
C. Jona-Lasinio INTAN-Invest 5 / 23
The data
• INTAN-Invest harmonized cross country industry estimates ofintangible investments (www.INTAN-Invest.net)• Country coverage: Austria, Belgium, Denmark, Finland,France, Germany, Greece, Ireland, Italy, Netherlands,Portugal, Spain, Sweden, United Kingdom.
• Industry coverage: NACE Rev2 sectors A through N(excluding real estate) plus sectors R and S.
• Time coverage: 1995-2010• EUKLEMS (2012 release)
C. Jona-Lasinio INTAN-Invest 6 / 23
Intangible investments (chain linked volumes):compounded average rates of growth 1995-2010
0.00#
1.00#
2.00#
3.00#
4.00#
5.00#
6.00#
7.00#
8.00#
9.00#
10.00# Manufacturing+ Services+
C. Jona-Lasinio INTAN-Invest 7 / 23

R&D intensity: average values 1995-2010
Map 1 – Value added share of R&D: Manufacturing and Services (Percentage values)
Source: EUROSTAT
[1.03,2.16](2.16,3.29](3.29,4.42](4.42,5.54](5.54,6.67](6.67,7.80](7.80,8.92](8.92,10.05](10.05,11.18]
VA share of R&D - Manufacturing (Average shares 1995-2010)
[0.26,0.41](0.41,0.55](0.55,0.70](0.70,0.85](0.85,1.00](1.00,1.15](1.15,1.30](1.30,1.44](1.44,1.59]
VA share of R&D - Services (Average shares 1995-2010)
C. Jona-Lasinio INTAN-Invest 8 / 23
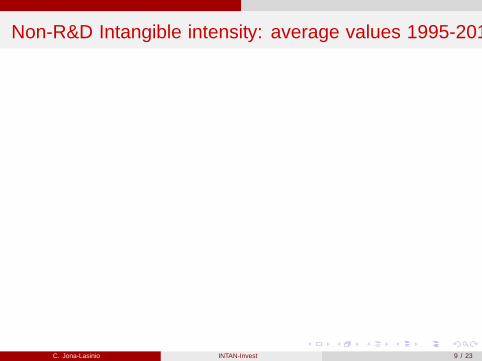
Non-R&D Intangible intensity: average values 1995-2010
Map 2 – Value added share of Non-R&D intangibles: Manufacturing and Services (Percentage values)
Source: INTAN –Invest
[3.72,4.41](4.41,5.11](5.11,5.81](5.81,6.51](6.51,7.21](7.21,7.91](7.91,8.61](8.61,9.31](9.31,10.01]
VA share of Non R&D Intangibles - Manufacturing (Average shares 1995-2010)
[4.90,5.80](5.80,6.71](6.71,7.62](7.62,8.52](8.52,9.43](9.43,10.33](10.33,11.24](11.24,12.15](12.15,13.05]
VA share of Non R&D Intangibles - Services (Average shares 1995-2010)
C. Jona-Lasinio INTAN-Invest 9 / 23
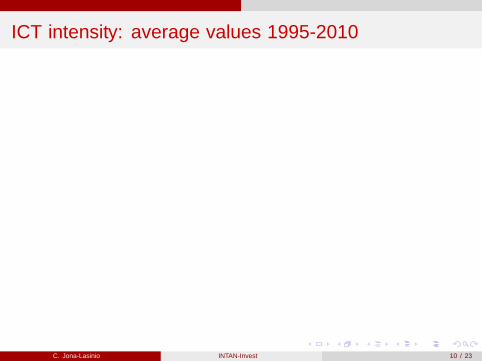
ICT intensity: average values 1995-2010
Map 3 – Value added share of ICT: Manufacturing and Services
(Percentage values)
Source: EUKLEMS
[0.40,0.77](0.77,1.13](1.13,1.50](1.50,1.86](1.86,2.23](2.23,2.59](2.59,2.96](2.96,3.33](3.33,3.69]
VA share of ICT - Manufacturing (Average shares 1995-2010)
[1.32,2.02](2.02,2.72](2.72,3.41](3.41,4.11](4.11,4.81](4.81,5.51](5.51,6.21](6.21,6.91](6.91,7.60]
VA share of ICT - Services (Average shares 1995-2010)
C. Jona-Lasinio INTAN-Invest 10 / 23
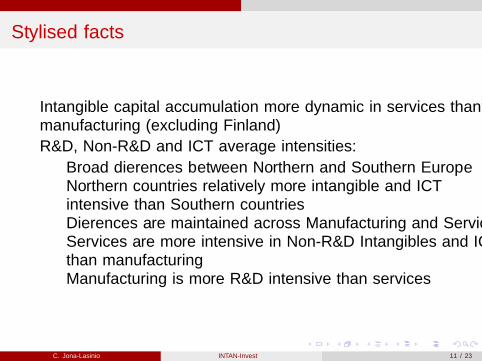
Stylised facts
• Intangible capital accumulation more dynamic in services thanmanufacturing (excluding Finland)
• R&D, Non-R&D and ICT average intensities:• Broad differences between Northern and Southern Europe• Northern countries relatively more intangible and ICTintensive than Southern countries
• Differences are maintained across Manufacturing and Services• Services are more intensive in Non-R&D Intangibles and ICTthan manufacturing
• Manufacturing is more R&D intensive than services
C. Jona-Lasinio INTAN-Invest 11 / 23
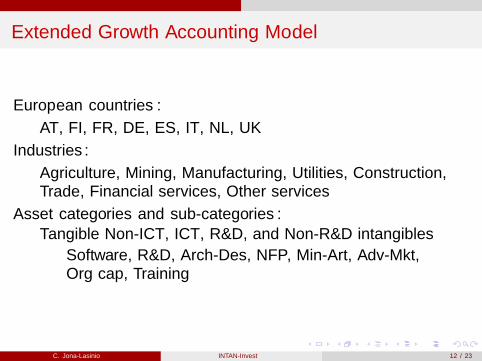
Extended Growth Accounting Model
European countries:• AT, FI, FR, DE, ES, IT, NL, UK
Industries:• Agriculture, Mining, Manufacturing, Utilities, Construction,Trade, Financial services, Other services
Asset categories and sub-categories:• Tangible Non-ICT, ICT, R&D, and Non-R&D intangibles
• Software, R&D, Arch-Des, NFP, Min-Art, Adv-Mkt,Org cap, Training
C. Jona-Lasinio INTAN-Invest 12 / 23
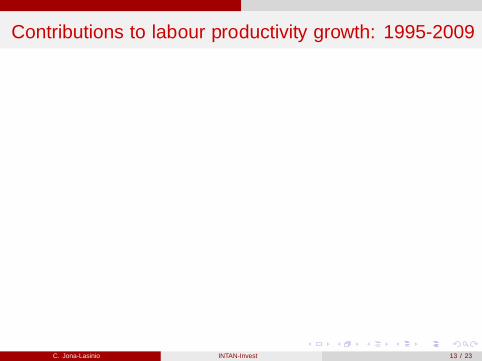
Contributions to labour productivity growth: 1995-2009
!1.00%
!0.50%
0.00%
0.50%
1.00%
1.50%
2.00%
2.50%
3.00%
Italy% Spain% Germany% France% Netherlands% Austria% United%Kingdom%
Finland%
Labour%Quality% Tangible%Capital%Deepening% Intangible%Capital%Deepening% TFP%Growth%
C. Jona-Lasinio INTAN-Invest 13 / 23
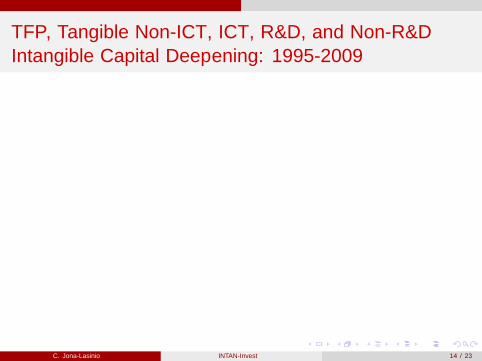
TFP, Tangible Non-ICT, ICT, R&D, and Non-R&DIntangible Capital Deepening: 1995-2009
!1.50&
!1.00&
!0.50&
0.00&
0.50&
1.00&
1.50&
2.00&
Italy& Spain& Germany& France& Netherlands& Austria& United&Kingdom&
Finland&
Tang%noICT%% ICT% R&D%(1)% Non%R&D%Intang% TFP%Growth%
C. Jona-Lasinio INTAN-Invest 14 / 23
GA - Main results (1)
• More intangible-intensive economies are the faster growthperformers. More tangible-intensive countries are the slowergrowth performers.
• ICT exceeds tangible non-ICT capital contribution in the bestperformers. The opposite holds in the slow growing economies.
• R&D and Non-R&D intangibles are relevant sources of growthin almost all sample countries but• ICT, R&D and Non-R&D intangible capital contribution ishigher than tangible non-ICT capital contribution in fastgrowing countries;
• Overall contribution of R&D and Non-R&D intangibles isrelatively low in the slow growing economies;
• Non-R&D intangible contributes more than R&D capitaldeepening.
C. Jona-Lasinio INTAN-Invest 15 / 23
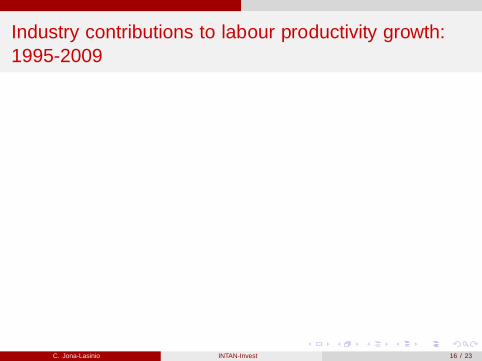
Industry contributions to labour productivity growth:1995-2009
!0.50%
0.00%
0.50%
1.00%
1.50%
2.00%
2.50%
IT% ES% DE% FR% NLD% AT% FI% UK%
Agriculture&Fishing/ Manufacturing/ Other/industries/(2)/ Trade/ Financial/Services/ Other/Services/
C. Jona-Lasinio INTAN-Invest 16 / 23
R&D and Non-R&D Intangible Capital Deepening:contributions to industry productivity growth 1995-2009
0.00#
0.50#
1.00#
1.50#
2.00#
2.50#
Manufacturing+ Trade+ Financial+Services+ Other+Services+
C. Jona-Lasinio INTAN-Invest 17 / 23
GA - Main results (2)
• High heterogeneity of industry contributions to productivitygrowth• Manufacturing (R&D intensive) is the driving sector in FI,Services (Non-R&D Intangible intensive) in NLD, AT and UK
• On average, Non-R&D Intangible capital provides a highercontribution than R&D and mainly in the service sectors
• ICT and Non-R&D Intangibles are the main drivers of servicesproductivity growth.
C. Jona-Lasinio INTAN-Invest 18 / 23
ICT, R&D, and Non-R&D intangibles: what synergies?
• Intangible assets may have a stronger effect on productivitygrowth when interacted with other variables, particularly with ICT.
• Main assumption is that intangible assets complement ICT capitalso that to realize the potential benefits of computerization,investments in additional assets such as new organizationalprocesses and structures and more trained workers are necessary(Bresnahan, Brynjolfsson, and Hitt (2002)
• Productivity growth is higher once the complementary role ofintangibles is accounted for (Dahl, Kongsted, and Sorensen(2011); Black and Lynch (2003), Caroli and Van Reenen (2001)and Dearden, Reed and Van Reenen (2006)).
C. Jona-Lasinio INTAN-Invest 19 / 23

ICT vs Non-R&D Intangibles-2
-10
12
Dln
KH-N
onR
&D In
tang
ible
s
-2 -1 0 1 2DlnKH-ICT
“Fr” “De” “Se” “Dk” “Fi” “Uk” “It” “Es” “Nl” “At”Fitted values
C. Jona-Lasinio INTAN-Invest 20 / 23
ICT vs R&D-1
-.50
.51
Dln
KH-R
&D
-2 -1 0 1 2DlnKH-ICT
“Fr” “De” “Se” “Dk” “Fi” “Uk” “It” “Es” “Nl” “At”Fitted values
C. Jona-Lasinio INTAN-Invest 21 / 23
Summing up
• Non-R&D intangibles and ICT are relevant sources of productivitygrowth in advanced economies
• Strong correlation between Non-R&D intangibles and ICTsuggests they are strategic policy variables
• The analysis of the transmission channels through whichintangible capital and its synergies with ICT affect industryproductivity growth are future key research issues.
C. Jona-Lasinio INTAN-Invest 22 / 23
Backup slides
C. Jona-Lasinio INTAN-Invest 23 / 23
Related Documents


![INTANGIBLE VALUE –FACT OR FICTION - AI Home | … · [IAS 38.8] 3. INTANGIBLE VALUE –FACT OR FICTION ... 2.36 INTANGIBLE PROPERTY (INTANGIBLE ASSETS): Non-physical assets, …](https://static.cupdf.com/doc/110x72/5af0812f7f8b9ac2468e1bc2/intangible-value-fact-or-fiction-ai-home-ias-388-3-intangible-value.jpg)