Alaska River Breakup Historic Comparison & 2016 Spring Outlook What we can expect? Crane Johnson & Rick Thoman, National Weather Service Welcome

Welcome message from author
This document is posted to help you gain knowledge. Please leave a comment to let me know what you think about it! Share it to your friends and learn new things together.
Transcript

Alaska River Breakup Historic Comparison & 2016
Spring OutlookWhat we can expect?
Crane Johnson & Rick Thoman, National Weather Service
Welcome

• Breakup process• Recap of 2015 Alaska Breakup• Current 2016 conditions• Climate Outlook• A look at trends: past, present and
future• Spring 2016 Breakup Outlook
Outline

Types of Breakup Process
Dynamic breakup Thermal breakup• Ice remains hard and
resistant to breaking up
• Ice moves when pushed by ice from upstream
• Ice jams form that can cause upstream flooding
• Extreme cases are Kenai River in January 1969 and January 2007 and Yukon River in May 2009 and 2013.
• Ice becomes very rotten (candled) before ice from upstream arrives
• Rotten ice is weak and has less resistance to breaking into very small pieces
• No significant ice jams form
• Extreme case would occur with very little snow melt inflow and warm sunny weather to rot the ice
Most Breakups are a Blend

Breakup OverviewThe transition from an ice covered river to ice-free open water
Thermal
Upstream of Coffee’s Bend site of mid-winter ice jam on the Kuskokwim River.
May 5th 2015

Breakup OverviewThe transition from an ice covered river to ice-free open water
Dynamic or Mechanical
Galena Flooding May 28, 2013
Bishop Rock May 27, 2013

1 Ice Jam
2 - 5 Ice Jams
5 - 10 Ice Jams
> 10 Ice Jams
Ice Jam Locations in Alaska
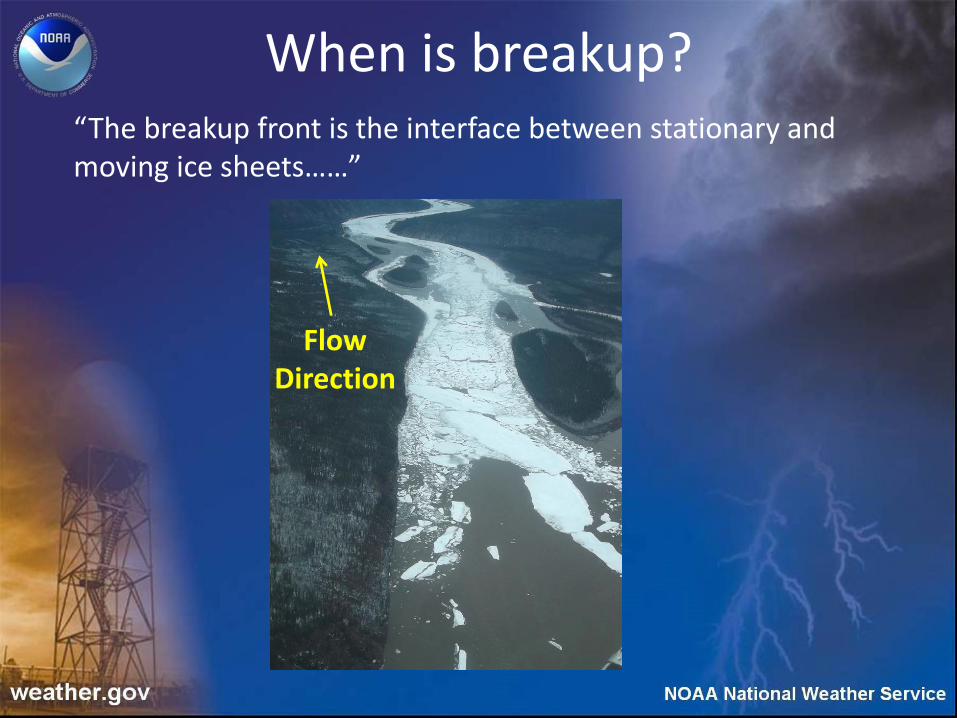
When is breakup?“The breakup front is the interface between stationary and moving ice sheets……”
Flow Direction
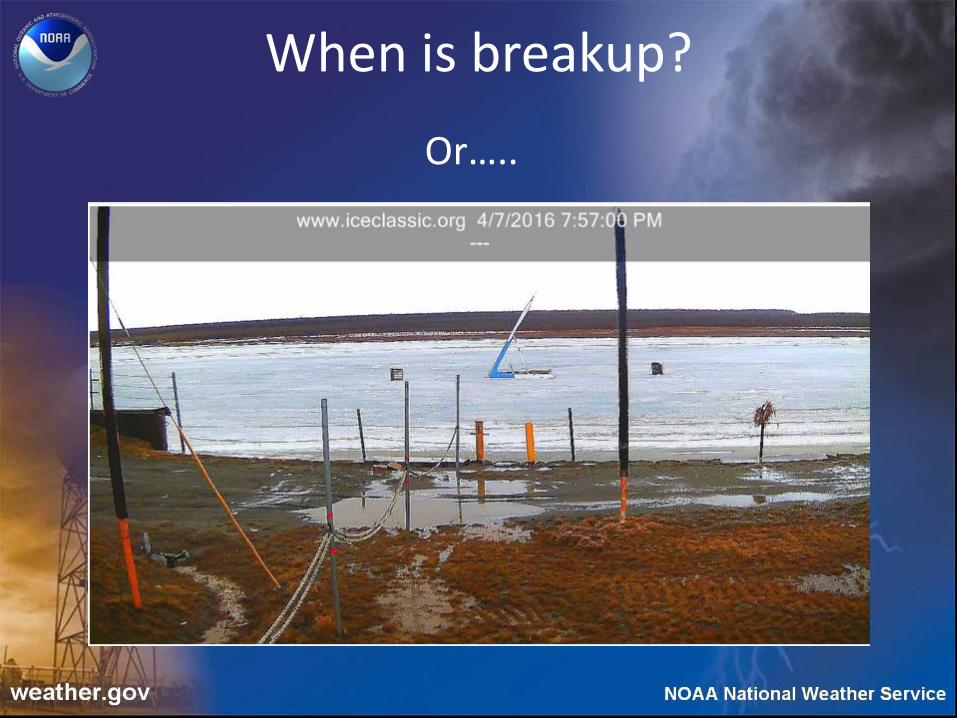
When is breakup?
Or…..
Recap of 2015 – at this point
• Spring snow conditions– General trend from well below normal in Southwest Alaska
to well above normal in Northeast Alaska and the Northern Yukon Territory
• Spring ice thickness– Thinner than normal on lower Kuskokwim trending to
normal to above normal in the interior and Northslope
– Large aufeis field developed on the Sag River with flooding of the Dalton Highway in March
• Weather outlook in mid to late April?– Increased chances of above normal temperatures
through April 30

Snow Pack on April 1, 2015

2015 Spring Temperatures

2015 Initial Outlook Low to Low-Moderate
Mid April the Sag River is added to NWS Flood Outlook:
2015 Breakup Summary
• Kuskokwim River experienced a thermal breakup and most locations were ice free earlier than normal.
• Yukon experienced a mostly thermal breakup with average timing or slightly ahead of average dates
– One minor ice jam below Emmonak with water levels rising to bank full (1 watch and 1 warning issued)
– Minor flooding in Fort Yukon 1 week after breakup. Flooding caused by snowmelt from the Porcupine basin (Warning issued)
• Wide spread flooding on the Northslope
– Sag, Kuparuk and Colville Rivers all flooded (numerous watches and warnings issued)

Sag River 2015
• Major Flooding on the Sag River• Dalton Highway Closed for 3 weeks• Damages estimated at 15 million+
Photo Credit: AK DOT&PF
May 20th 2015Image Credit: NASA Worldview

2016 Snow Water Equivalent

2016 Snow Coverage
April 10th 2016, US National Ice Center
= Snow Covered

2016 Winter Temperatures
Freezing Degree Days - Percent of Normal
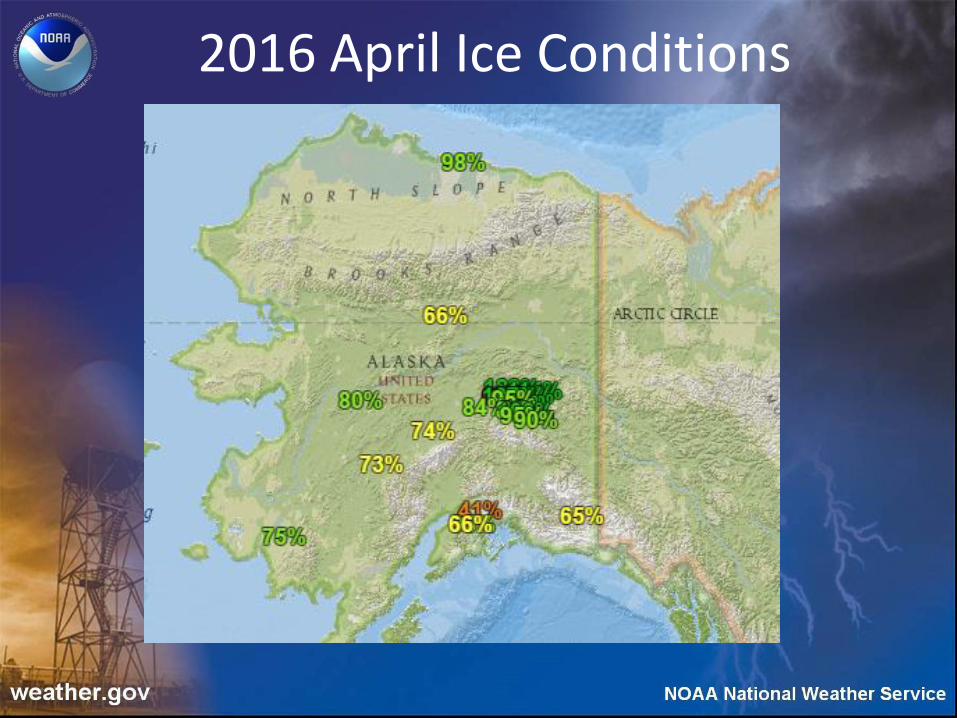
2016 April Ice Conditions

2016 Winter Ice Anomalies
• Large aufeis field has formed on the Sag River, similar to last year
• Dust and sand reported on the lower Kuskokwim River
• Mid winter breakup and refreeze on the Yukon River between Eagle and Circle
• Areas of open water through the winter reported
• Early areas of open water, especially in Southcentral and Kenai
• Consistent reports of weaker than normal ice for this time of year.

2016 Sag River Aufeis
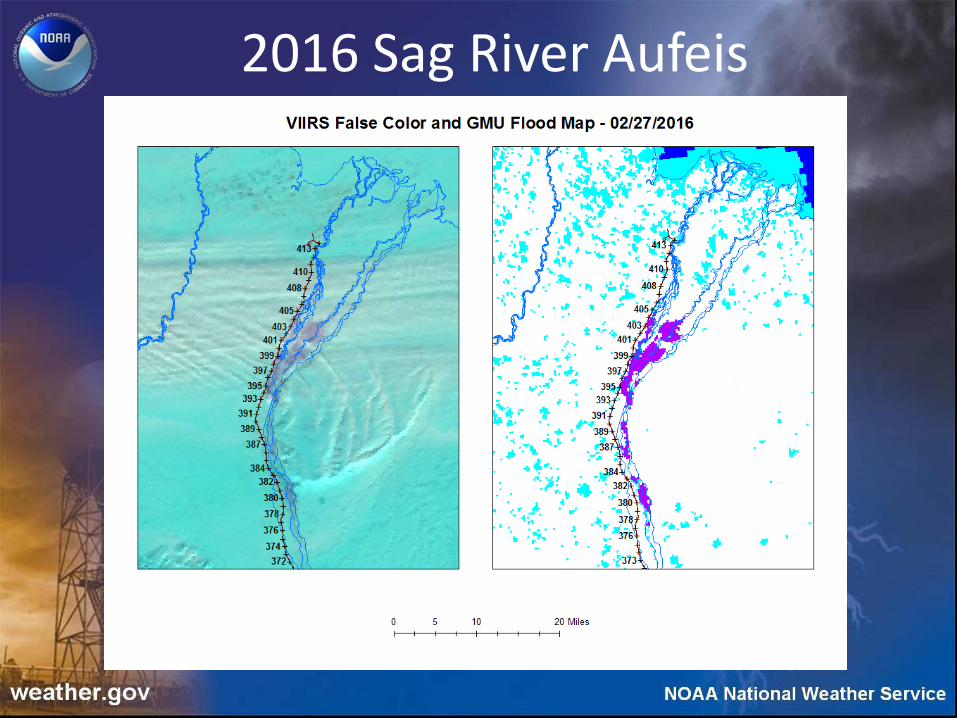
2016 Sag River Aufeis

2016 Sag River Aufeis

2016 Temperatures
January – March Temperatures
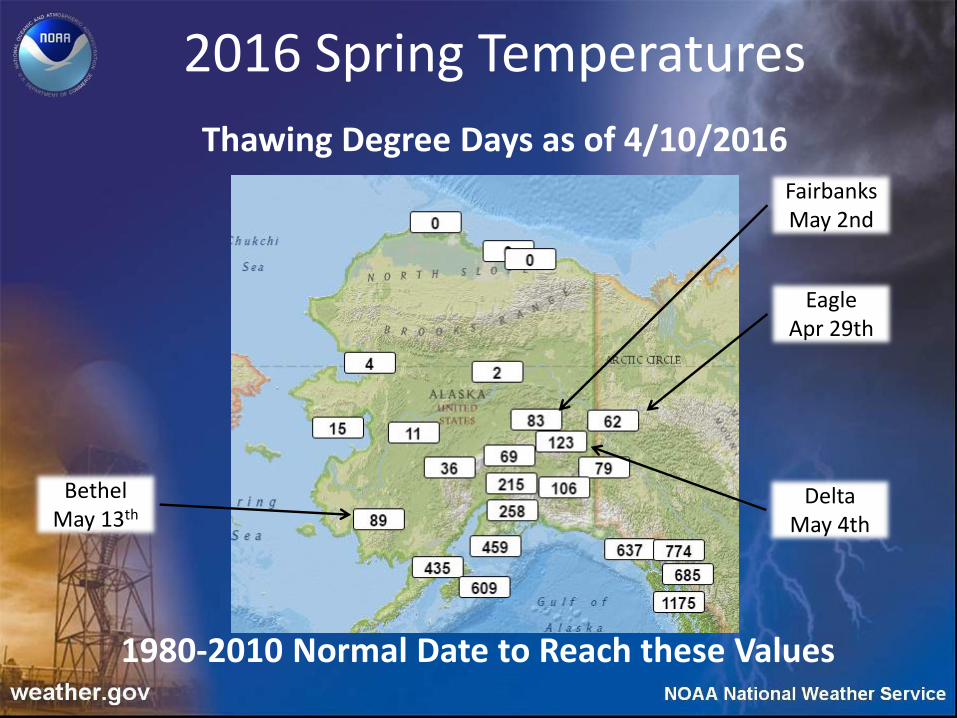
2016 Spring Temperatures
Thawing Degree Days as of 4/10/2016
Bethel May 13th
Eagle Apr 29th
Delta May 4th
Fairbanks May 2nd
1980-2010 Normal Date to Reach these Values

Tools for Forecasting Break-up
• The past
– Long term trends and changes
• Ice and Snow conditions
– River Observations throughout the winter
• Models of spring temperatures
– Break-up timing and severity are strongly (not totally) controlled by temperatures during the spring

Temperature and Break-up on the Climate Scale
Happily, temperatures ARE predictable at longer times – Statistical (past relationships)
• Relationship of spring temperatures to oceanic climate drivers• Long term trend
– Dynamic modeling (future from physics)• Weather models (weekly to month)• Monthly to Seasonal scale models from many different centers and
research groups (available monthly)• Weekly to Monthly
– NOAA’s Climate Forecast System updated daily
– Official Forecasts • Alaska: Climate Prediction Center (weekly to seasonal)• Environment Canada: Monthly and Seasonal

Years of Early Break-upApril Temperature Departures

Years of Late Break-upApril Temperature Departures

Years with Significant Ice Jam Flooding on the Yukon River (1979-2014)
1979, 1992, 1994, 1995, 2009, 2013

Timing of break-up has changed

Climate Indices Break-up Timing or Severity
• Indices without identified skill
– Pacific Decadal Oscillation Index
– ENSO (El Niño or La Niña)
• Indices with some identified skill
– Late Winter Western Pacific SSTs

Correlation of Temperature and western Pacific Sea Surface Temperatures
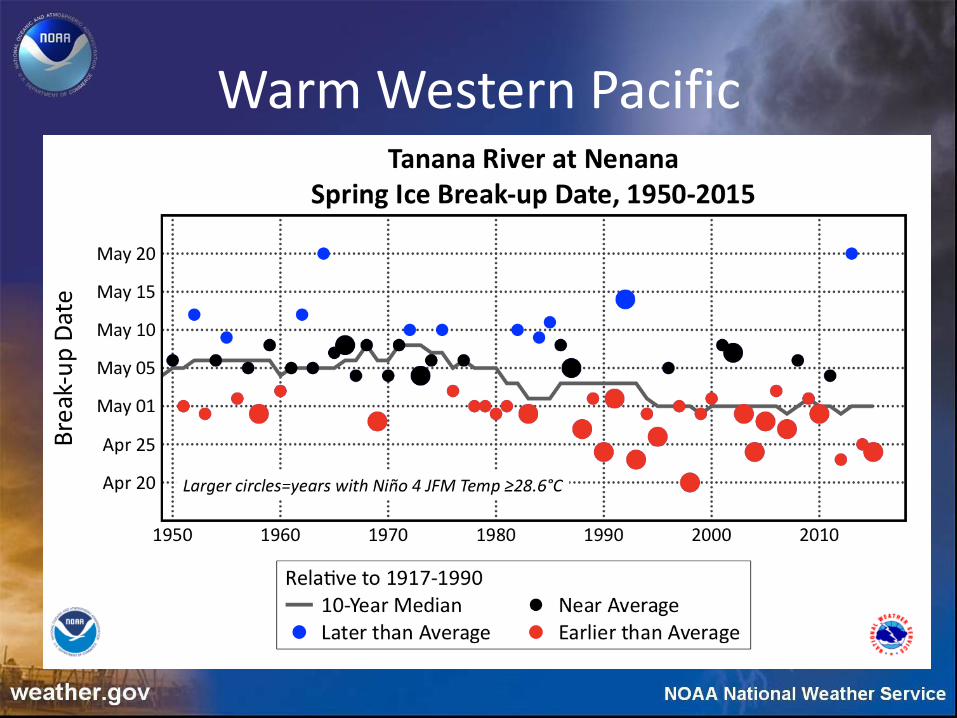
Warm Western Pacific

Constructed Analogs: Global SSTs
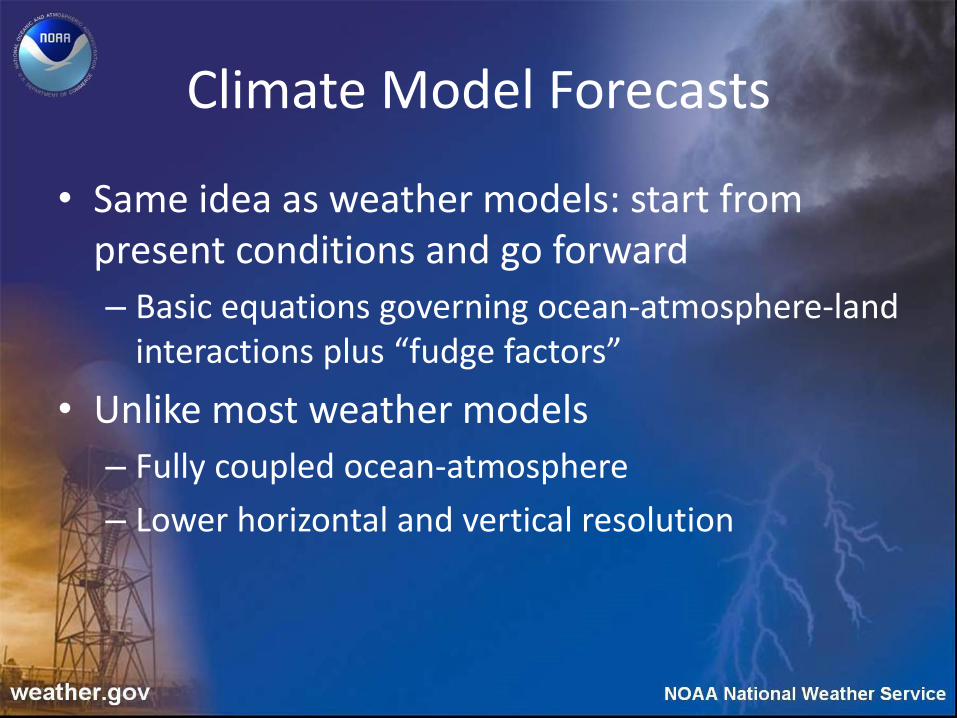
Climate Model Forecasts
• Same idea as weather models: start from present conditions and go forward
– Basic equations governing ocean-atmosphere-land interactions plus “fudge factors”
• Unlike most weather models
– Fully coupled ocean-atmosphere
– Lower horizontal and vertical resolution

End of April and Early May
Climate Forecast System Weeks 3 and 4Temperature anomalies (1999-2010 model climatology)
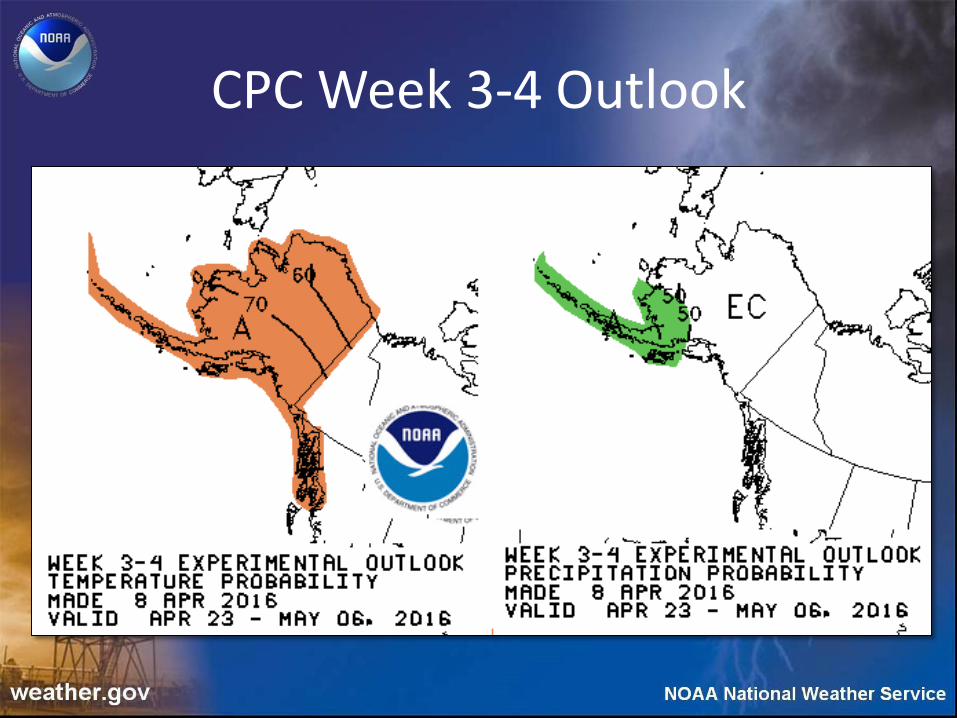
CPC Week 3-4 Outlook
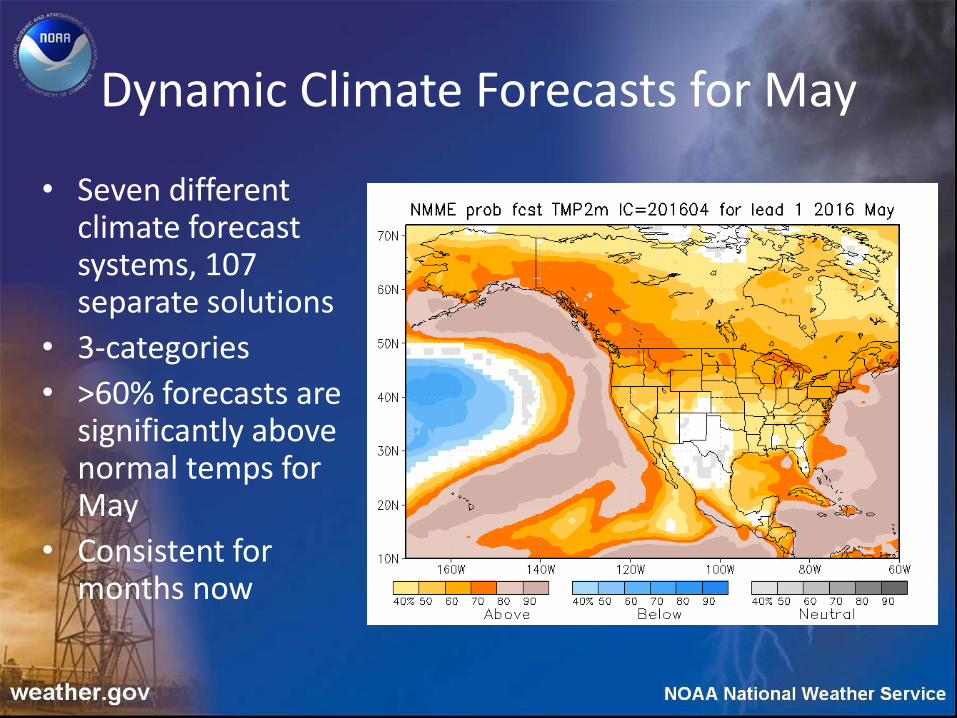
Dynamic Climate Forecasts for May
• Seven different climate forecast systems, 107 separate solutions
• 3-categories
• >60% forecasts are significantly above normal temps for May
• Consistent for months now

What does that mean?2016 Outlook
• Trending towards thermal breakup on the Yukon, Kuskokwim Rivers and other interior rivers
• Breakup will likely be early at most locations, possibly the earliest on record at some locations
• Current outlook is for mod to high likelihood of flooding along the Sag River. Impacts to the road will depend on May temperatures and mitigation efforts.

Caveat for a Thermal Breakup• Normally spring breakup is dynamic and moves from the
headwaters of a river downstream in a linear fashion. • A thermal breakup occurs when there is not enough snowmelt
to push ice downstream and even though ice strength deteriorates significantly, breakup may actually occur later than normal.
• During a thermal breakup no coherent breakup front develops in this scenario and multiple locations begin to see ice movement simultaneously.
• Ice Jam flooding from a thermal breakup is rarely serious, but is still possible.
• Timing of breakup during a thermal breakup may range from several days earlier to several days later than normal and is often inconsistent up and down a reach of river.

Flood Outlook Potential
http://aprfc.arh.noaa.gov

Breakup Map
http://aprfc.arh.noaa.gov
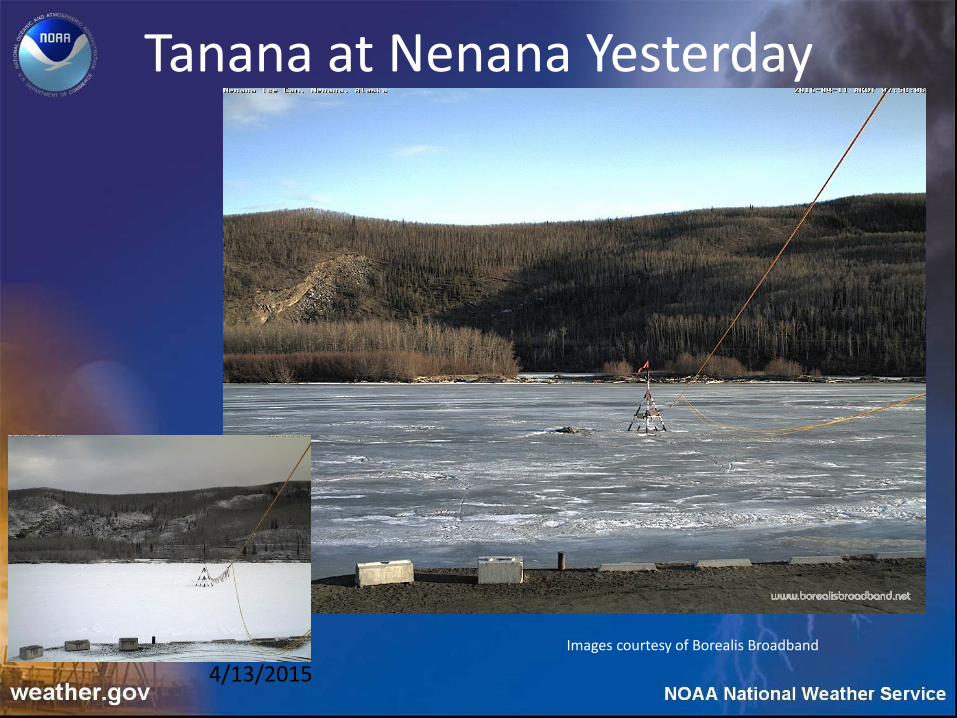
Tanana at Nenana Yesterday
Images courtesy of Borealis Broadband
4/13/2015

Questions?
http://aprfc.arh.noaa.gov/907-266-5160
Supplemental Slides

2008 2009 2010
2011 2012 2013
2014 2015 2016
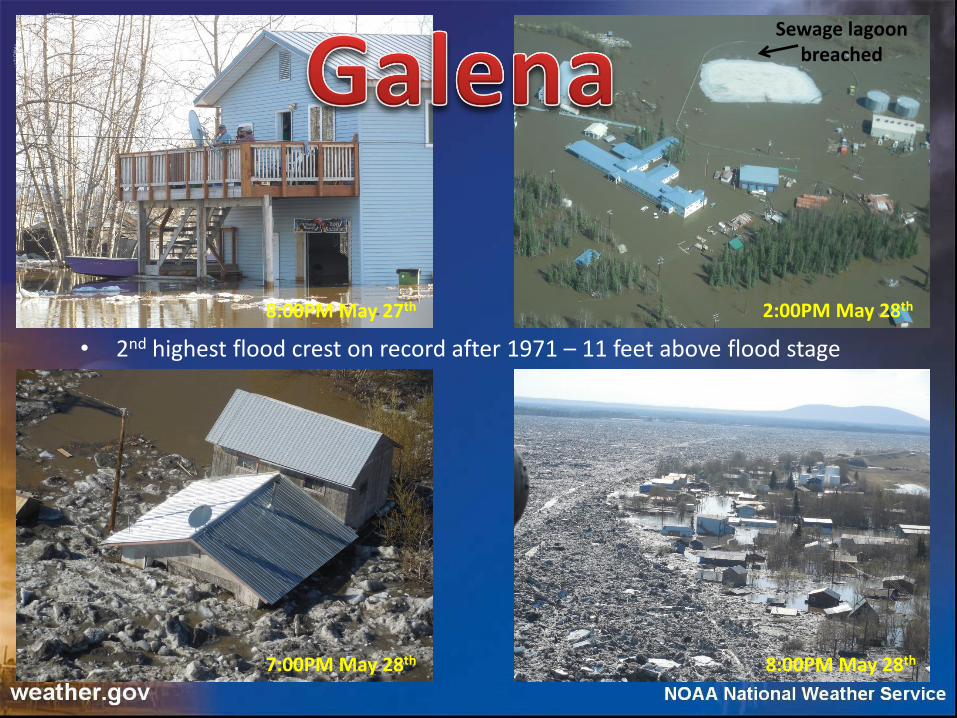
• 2nd highest flood crest on record after 1971 – 11 feet above flood stage
2:00PM May 28th
8:00PM May 28th
8:00PM May 27th
7:00PM May 28th
Sewage lagoon breached

2016 Sag River Aufeis
Terra-SAR X Imagery Acquired by AK DOT&PF3m Pixels
Related Documents


