1 The Widespread Ice Jam Flooding and Wintry Mixed Precipitation Event on January 12-13, 2018 Overview – Vermont and northern New York are typically thought of as having long, cold and snowy winters. While this generally may be true, large variability in temperature and snowfall distribution are often seen winter to winter, and even intraseasonally within each winter. Most winters in fact have a few periods during which temperatures are mild enough so as to give thawing conditions, leading to partial snowmelt and ice breakup. On rare occasions the region will see an extreme thaw during which a large percentage of the snowpack will melt into rivers and streams, causing rapid rises on those waterways and producing areas of flooding. Such was the case during 12-14 January 2018. Indications that substantial snow and rain would arrive into New York and New England were evident several days prior as computer models suggested a storm system would track through the Great Lakes into the St. Lawrence Valley, tapping copious amounts of moisture from the Gulf of Mexico. Initially the focus was on the winter threat of snow and mixed precipitation. However, as the storm neared it became evident that temperatures would be very mild, and for a long enough period of time so as to melt a considerable percentage of the existing snowpack. This would in turn lead to sharp river rises, potential ice breakup and flooding.

Welcome message from author
This document is posted to help you gain knowledge. Please leave a comment to let me know what you think about it! Share it to your friends and learn new things together.
Transcript

1
The Widespread Ice Jam Flooding and Wintry Mixed
Precipitation Event on January 12-13, 2018
Overview –
Vermont and northern New York are typically thought of as having long, cold and snowy winters. While
this generally may be true, large variability in temperature and snowfall distribution are often seen
winter to winter, and even intraseasonally within each winter. Most winters in fact have a few periods
during which temperatures are mild enough so as to give thawing conditions, leading to partial
snowmelt and ice breakup. On rare occasions the region will see an extreme thaw during which a large
percentage of the snowpack will melt into rivers and streams, causing rapid rises on those waterways
and producing areas of flooding. Such was the case during 12-14 January 2018.
Indications that substantial snow and rain would arrive into New York and New England were evident
several days prior as computer models suggested a storm system would track through the Great Lakes
into the St. Lawrence Valley, tapping copious amounts of moisture from the Gulf of Mexico. Initially the
focus was on the winter threat of snow and mixed precipitation. However, as the storm neared it
became evident that temperatures would be very mild, and for a long enough period of time so as to
melt a considerable percentage of the existing snowpack. This would in turn lead to sharp river rises,
potential ice breakup and flooding.
2
Figure 1a: High temperatures during 12-13 January, 2018

3
Figure 1b: Total rainfall during the same period.
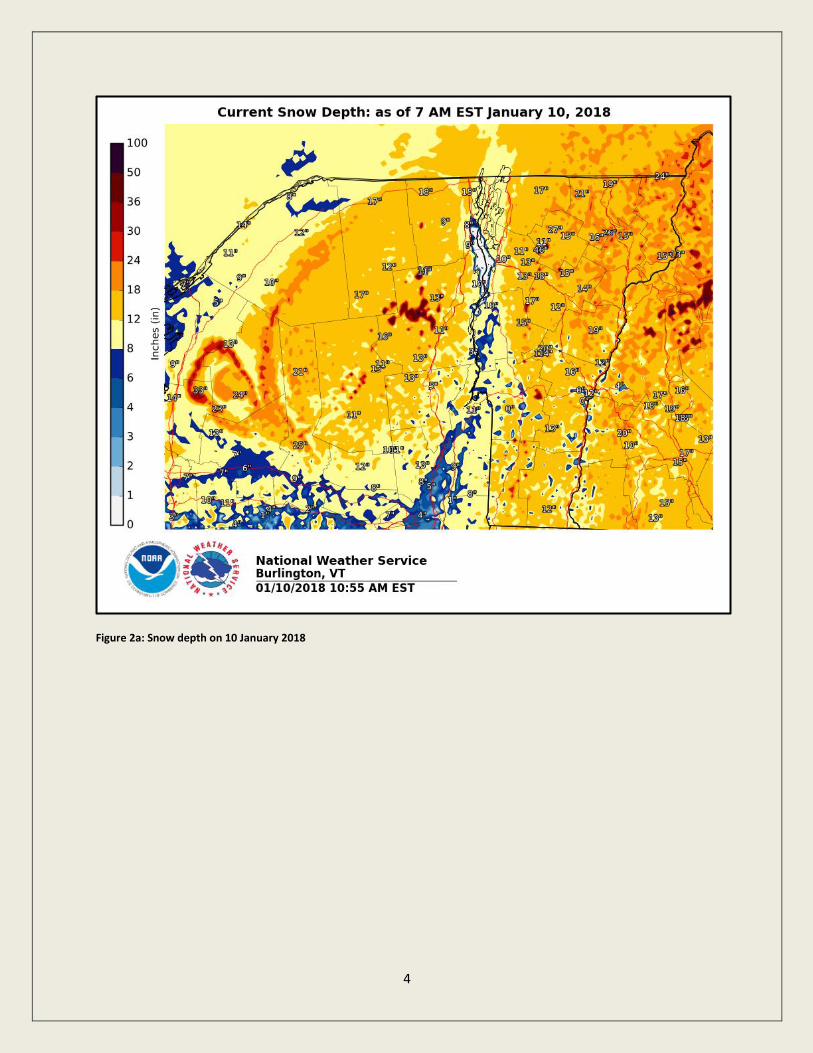
One way meteorologists at NWS Burlington gage the magnitude of a thaw is through a numeric factor
called thawing degree hours. Essentially one thawing degree hour is defined as one hour in which the
temperature is one degree above freezing, or 33 ˚F. If the observation at the top of the hour is 40 ˚F,
then there would be 8 thawing degree hours and so on. As a general rule of thumb for ice breakup the
thaw should last more than 12 hours and the total thawing degree hours should reach or exceed 300.
As NWS Burlington staff analyzed the incoming data it became readily apparent that very mild
temperatures would lead to a significant thaw, pushing the total thawing degree hours well over the 300
mark. Flood Watches for elevated river flows and ice jams were issued promptly thereafter in the early
morning hours of January 12.
As milder temperatures and steadier rains arrived through the morning and afternoon on the 12th, rapid
melting of the snowpack began to occur. The melting of snow is a complex process which mainly occurs
due to condensation from the air (a heating process) and wind. Surprisingly, rainfall does little in and of
itself to directly melt snow with most of the water running directly through the pack! With large
amounts of water from the moderate to heavy rainfall and snowmelt running off, levels of streams and
rivers rose rapidly leading to significant break-up of river ice and localized severe flooding.
4
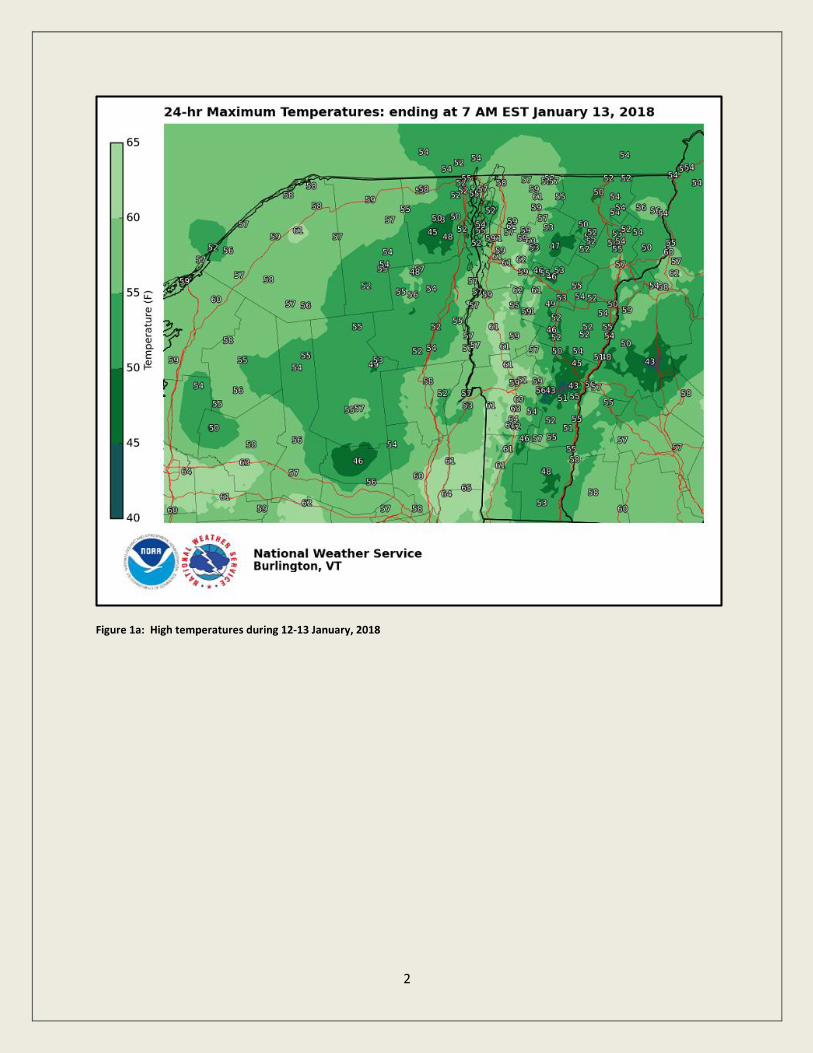
Figure 2a: Snow depth on 10 January 2018

5
Figure 2b: Snow depth on 13 January 2018
6
Figure 2c: Total thawing degree hours 11-13 January 2018

7
Figure 2d: Hydrograph of the Ausable River at Au Sable Forks, NY showing the large ice jam that formed in that location on
12 January 2018.
How River Ice and Ice Jams Form –
The phenomenon of ice jams and resultant flooding from impounded water blocked by ice is a common
occurrence on portions of many rivers and streams across Canada and the northern portions of the
United States. Typically they occur during late winter and early spring when persistent warmth and a
higher sun angle act to melt snow and rot, or weaken the ice. However, they can occur at any time when
conditions are right. A short and instructive discussion on the formation of river ice and ice jams follows.
River ice formation is a complex process that hinges on many parameters. In general,
colder conditions and slower river flow favor ice formation while warmer conditions and
faster flow will inhibit ice formation. As temperatures drop in the winter, the water in
rivers and streams also cools. The water often becomes what is known as “supercooled”,
meaning its temperature drops just below freezing while remaining in the liquid state.
During the first bitter cold snap of the season, ice crystals from the air get entrained into

8
the supercooled water, freezing and aggregating into larger ice particles. This is known
as frazil ice. Once the frazil particles form, they adhere to each other, forming “flocs” or
clusters. These clusters rise to the surface of the water and collect into ice pans, which
are sometimes called pancake ice.
The ice pans float down the river, gradually accumulating more ice crystals as they do so.
They will often begin to collect wherever the river flow slows, such as along river banks,
bends, and constrictions. As the cold weather continues, the ice pans will freeze together
to form one continuous ice sheet. If there is enough frazil ice, this may actually result in
a freeze-up jam as ice rapidly collects along the river. Once the ice sheet has formed, it
will gradually grow downward as more ice forms at the ice/water interface. Frazil ice will
also continue to form, especially if there are any open stretches along the river. This
frazil ice can collect on the bottom of the existing ice sheet, resulting in a hanging dam.
The frazil may also collect on the river bottom, creating anchor ice. Hanging dams and
anchor ice are often hard to discern under an existing ice sheet and they can worsen ice
break up later in the season.
River ice break up usually occurs in the spring, but January thaws and rain events can
cause a mid-winter break up. Melting snow and rainfall results in runoff which flows into
rivers and streams. This in turn causes river flows to increase and levels to rise. If there is
enough runoff, these increasing rises and flows will eventually be strong enough to lift
the ice cover, break it up, and transport it downstream. A general rule of thumb is that a
river needs to rise 1.5 to 3 times the thickness of the ice cover to have enough power to
lift and transport the ice.
Ice jams form when the amount of ice in the river exceeds the river’s transport capacity.
The easiest way to picture this is to liken the river to a highway. If there are only a few
cars on the highway, traffic can flow freely. However, as more and more cars enter the
roadway, traffic slows. This is particularly true in areas where traffic flow is constricted
or hampered in some way, such as a construction zone, merging traffic from an on-ramp,
or a sudden, sharp turn in the roadway.
River ice acts much the same way as traffic on the highway. The broken ice pieces will
flow freely until they either exceed the transport capacity of the river (i.e. rush hour) or if
they encounter a place where the river’s flow slows. This decrease in flow velocity can
occur due to natural causes; a bend in the river, a narrowing of the river channel, or a
decrease in the slope of the water surface, for example. River flows can also slow due to
manmade structures, such as bridge abutments. While islands and sandbars don’t
necessarily cause ice jams to occur, they are a sign that there is a decrease in river flow
speed along that stretch of the river thus making it more prone to ice jams.
Once an ice jam forms, it will lock in place until there is enough water upstream to force
it to release. Flooding behind an ice jam can occur very quickly as water backs up

9
upstream. The ultimate size of the jam and the severity of the flooding behind it depend
on the flow conditions, the available ice supply from upstream, strength and size of the
ice pieces, and the characteristics of the flood area. Sometimes water may find a way
around the jam by exiting the river channel, or it may find a way to flow through the
jam. If this occurs, or if river flows drop behind the jam (from cooler temperatures
reducing snowmelt, for example) it may remain in place for a prolonged period. If river
levels drop enough the ice may settle lower into the river channel, perhaps even
becoming grounded. If the weather turns cold again the ice jam can freeze solidly in
place. This area will then be far more prone to flooding and additional ice jamming when
break up occurs in the spring. When an ice jam does eventually release, it can do so very
suddenly with little to no warning. It may release a surge of water which could cause
flooding downstream. Often, the ice scours the river channel, changing the river bed and
river flow for the following ice break up season.
The Flooding –
Of the many locations that reported flooding, perhaps the most severe occurred in Swanton, VT and
Plattsburgh, NY. In Swanton, an unusually large ice jam on the Missisquoi River became lodged in town
and upstream several miles from the Depot Street Bridge, affecting approximately 1.5 miles of State
Route 78 and flooding several homes. A number of people were evacuated due to the high water.
Eventually, receding water levels allowed some people to return to their homes the following week to
assess damages. In the City of Plattsburgh, a large ice jam formed on the Saranac River near the SUNY
Plattsburgh campus. High water impounded by the jam led to severe flooding of the Underwood Estates
Mobile Home Park affecting approximately 50 homes, several of which were severely damaged.
Fortunately, timely evacuations prevented any casualties.
Figure 3: Left: Ice jam flooding along State Route 78 in Swanton along the Missisquoi River (photo credit NWS Burlington);
Right: High water at the Underwood Estates Mobile Home park in Plattsburgh, NY along the Saranac River (photo credit
Clinton County Emergency Services).
10
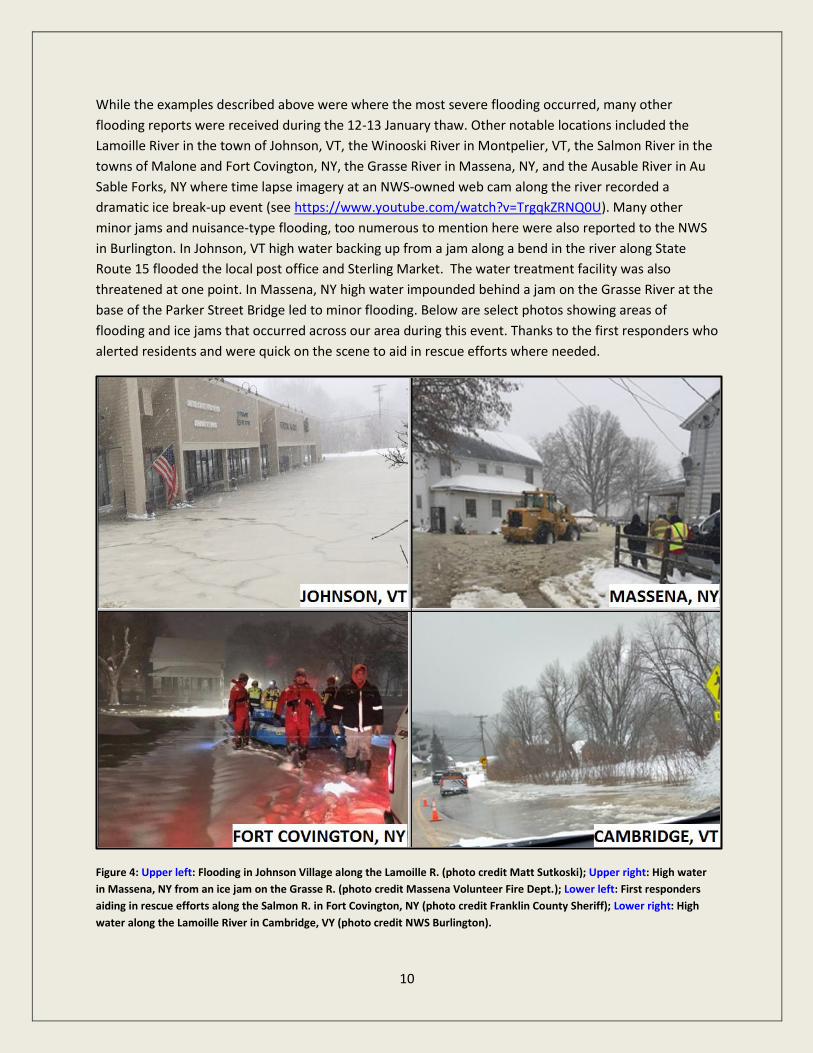
While the examples described above were where the most severe flooding occurred, many other
flooding reports were received during the 12-13 January thaw. Other notable locations included the
Lamoille River in the town of Johnson, VT, the Winooski River in Montpelier, VT, the Salmon River in the
towns of Malone and Fort Covington, NY, the Grasse River in Massena, NY, and the Ausable River in Au
Sable Forks, NY where time lapse imagery at an NWS-owned web cam along the river recorded a
dramatic ice break-up event (see https://www.youtube.com/watch?v=TrgqkZRNQ0U). Many other
minor jams and nuisance-type flooding, too numerous to mention here were also reported to the NWS
in Burlington. In Johnson, VT high water backing up from a jam along a bend in the river along State
Route 15 flooded the local post office and Sterling Market. The water treatment facility was also
threatened at one point. In Massena, NY high water impounded behind a jam on the Grasse River at the
base of the Parker Street Bridge led to minor flooding. Below are select photos showing areas of
flooding and ice jams that occurred across our area during this event. Thanks to the first responders who
alerted residents and were quick on the scene to aid in rescue efforts where needed.
Figure 4: Upper left: Flooding in Johnson Village along the Lamoille R. (photo credit Matt Sutkoski); Upper right: High water
in Massena, NY from an ice jam on the Grasse R. (photo credit Massena Volunteer Fire Dept.); Lower left: First responders
aiding in rescue efforts along the Salmon R. in Fort Covington, NY (photo credit Franklin County Sheriff); Lower right: High
water along the Lamoille River in Cambridge, VY (photo credit NWS Burlington).

11
The Wintry Mix –
In this section we will examine the winter aspect of this event, including the complex thermal profiles
and associated different precipitation types. This event featured widespread wintry precipitation
starting during the late afternoon hours on January 12th and continuing into mid-morning January 13th,
as a sharp cold front quickly pushed across the North Country. The Burlington temperature at 5 PM was
a record high of 61 degrees, but fell to 28 degrees by midnight, creating a flash freezing and hazardous
travel, as rain changed to snow, sleet, and freezing rain. Figure 5 displays the temperature, dewpoint,
and humidity values at Burlington International Airport on January 12th through the 13th, highlighting the
sharp drop in temperature, which was accompanied by gusty north winds.
Figure 5: Temperature (blue line), dew point (black line), and humidity (green line) at Burlington
International Airport from 12 UTC on January 12th through 06 UTC on 14 January 2018.
The heaviest snowfall occurred over the Saint Lawrence Valley and northern Adirondacks in New
York, while a wintry mix of snow, sleet, and freezing rain prevailed in Vermont. Ice accumulation up to a
quarter of an inch was reported by the Montpelier, VT ASOS and near one third of an inch by the
Springfield, VT ASOS. This resulted in some isolated power outages across southern and central
Vermont. Figure 6 below displays the storm total snowfall.

12
Figure 6: Storm total snowfall across the North Country for 12-13 January 2018.
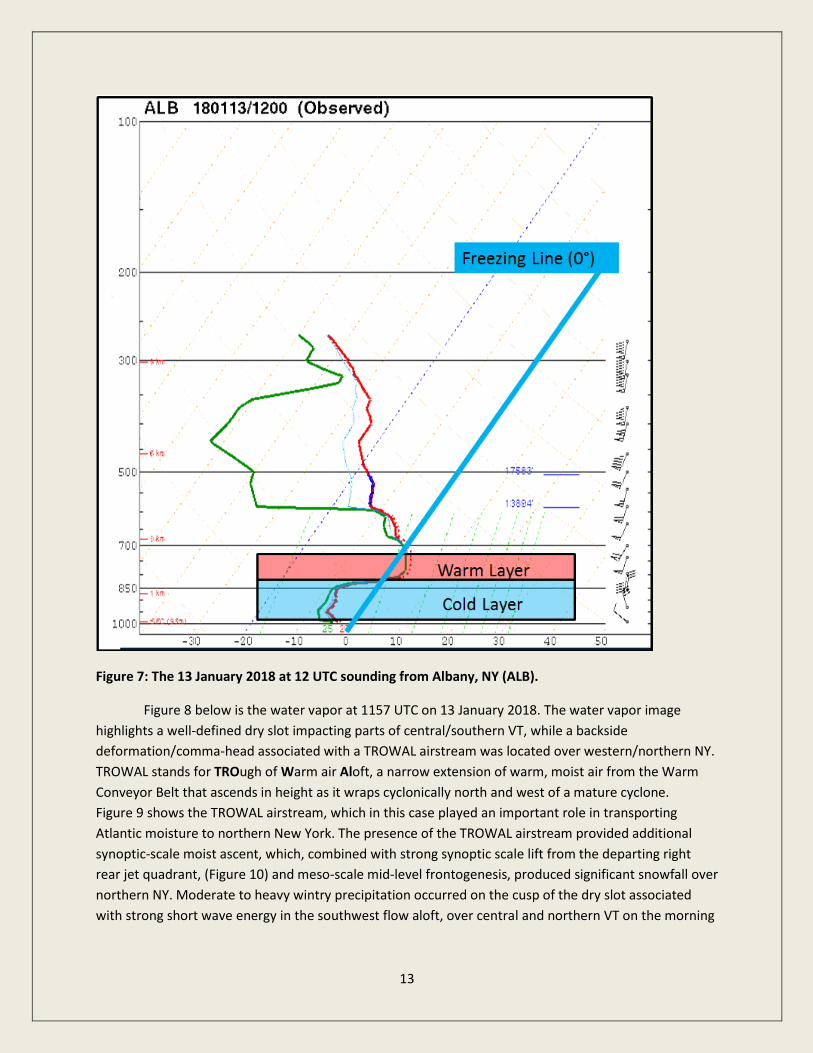
This event featured deep sub-tropical moisture with a record precipitable water value of 1.44
inches at Albany, NY and complex thermal profiles associated with a warm layer of air between 4000
and 8000 feet above the ground. Figure 7 below shows the Albany, NY sounding on 13 January 2018 at
12 UTC, highlighting the 40°F air around 5000 feet, while the surface temperature was only 27°F. This
warm layer was established by very strong south to southwest low level jet of 50 to 60 knots, while
gusty 30 knot north winds were advecting in colder air near the surface, creating a thermal direct
circulation. The precipitation started as snow, before melting into liquid rain drops in the warm layer,
before refreezing as a mixture of sleet and snow, with pockets of freezing rain depending upon
boundary layer temperatures and location.
13
Figure 7: The 13 January 2018 at 12 UTC sounding from Albany, NY (ALB).
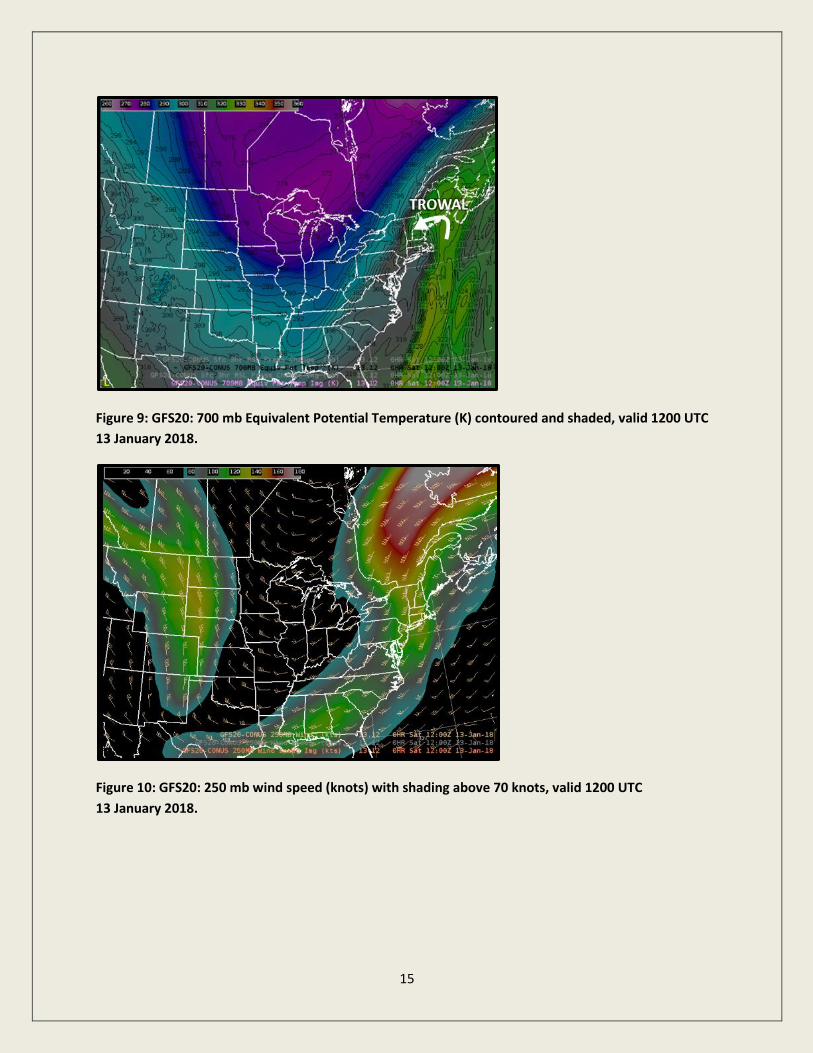
Figure 8 below is the water vapor at 1157 UTC on 13 January 2018. The water vapor image
highlights a well-defined dry slot impacting parts of central/southern VT, while a backside
deformation/comma-head associated with a TROWAL airstream was located over western/northern NY.
TROWAL stands for TROugh of Warm air Aloft, a narrow extension of warm, moist air from the Warm
Conveyor Belt that ascends in height as it wraps cyclonically north and west of a mature cyclone.
Figure 9 shows the TROWAL airstream, which in this case played an important role in transporting
Atlantic moisture to northern New York. The presence of the TROWAL airstream provided additional
synoptic-scale moist ascent, which, combined with strong synoptic scale lift from the departing right
rear jet quadrant, (Figure 10) and meso-scale mid-level frontogenesis, produced significant snowfall over
northern NY. Moderate to heavy wintry precipitation occurred on the cusp of the dry slot associated
with strong short wave energy in the southwest flow aloft, over central and northern VT on the morning

14
of January 13th. This produced a period of 1 to 2 inch snowfall rates with visibility near a quarter mile at
Burlington International Airport.
Figure 8: Water Vapor on 13 January 2018 at 1157 UTC.
15
Figure 9: GFS20: 700 mb Equivalent Potential Temperature (K) contoured and shaded, valid 1200 UTC
13 January 2018.
Figure 10: GFS20: 250 mb wind speed (knots) with shading above 70 knots, valid 1200 UTC
13 January 2018.
16
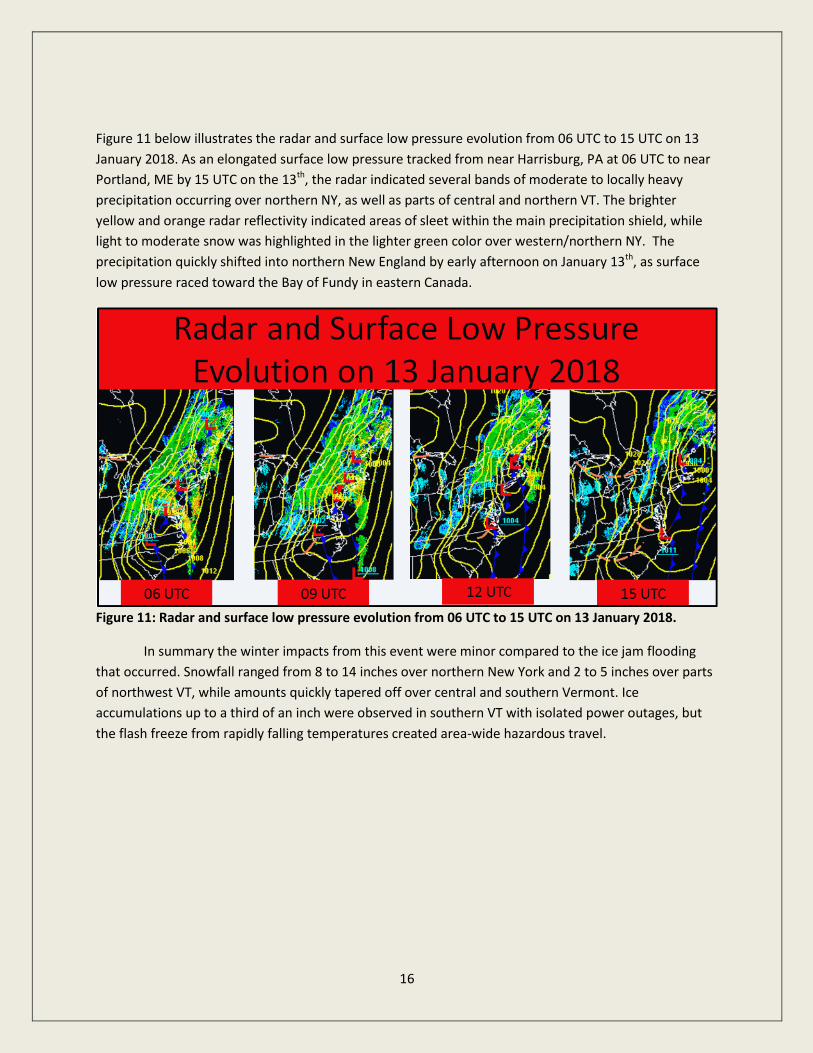
Figure 11 below illustrates the radar and surface low pressure evolution from 06 UTC to 15 UTC on 13
January 2018. As an elongated surface low pressure tracked from near Harrisburg, PA at 06 UTC to near
Portland, ME by 15 UTC on the 13th, the radar indicated several bands of moderate to locally heavy
precipitation occurring over northern NY, as well as parts of central and northern VT. The brighter
yellow and orange radar reflectivity indicated areas of sleet within the main precipitation shield, while
light to moderate snow was highlighted in the lighter green color over western/northern NY. The
precipitation quickly shifted into northern New England by early afternoon on January 13th, as surface
low pressure raced toward the Bay of Fundy in eastern Canada.
Figure 11: Radar and surface low pressure evolution from 06 UTC to 15 UTC on 13 January 2018.
In summary the winter impacts from this event were minor compared to the ice jam flooding
that occurred. Snowfall ranged from 8 to 14 inches over northern New York and 2 to 5 inches over parts
of northwest VT, while amounts quickly tapered off over central and southern Vermont. Ice
accumulations up to a third of an inch were observed in southern VT with isolated power outages, but
the flash freeze from rapidly falling temperatures created area-wide hazardous travel.
Related Documents