High-stake exams change teacher grading standards: evidence from a policy reform Pedro Freitas 1 1 Nova School of Business and Economics, Universidade Nova de Lisboa 7th April 2021 Abstract The introduction of high-stake standardized exams has been shown to be strongly associated with improvements in an average performance in international standard- ized assessments [Bergbauer et al., 2018] as well as with proficiency in mathematics and reading [Jacob and Lefgren, 2004]. Despite legitimate concerns with the incen- tives to teach to the exam and the limited set of skills under evaluation, the fact that idiosyncratic grading biases tend to vanish through the application of blind, anony- mous evaluation mechanisms have ensured their validity and continuity in multiple education systems (OECD, 2013). By means of a difference-in-difference approach, we exploit a policy reform that introduced high-stakes exams at the end of the 6th grade in Portuguese and Mathematics, in Portugal, for a short period of 4 years. We study how the introduction of these high-stake exams changed teacher grading standards and teacher scores distribution. We find that teachers in courses covered by external high-stakes exams tend to give a significantly higher percentage of failing scores and a significantly lower percentage of higher scores, an effect which shows to be stronger for Mathematics and not homogeneous for male and female students. JEL classification: I20;I28;H52 Keywords: Student assessment, Teacher scores, Student achievement, School account- ability This work used infrastructure and resources funded by Funda¸c˜ao para a Ciˆ encia e a Tecnologia (UID/ECO/00124/2013, UID/ECO/00124/2019 and Social Sciences DataLab, Project 22209),POR Lis- boa (LISBOA010145FEDER007722) and Social Sciences DataLab, Project 22209) and POR Norte (So- cial Sciences DataLab, Project 22209). Preliminary and incomplete, please do not cite. Corresponding author: [email protected] 1

Welcome message from author
This document is posted to help you gain knowledge. Please leave a comment to let me know what you think about it! Share it to your friends and learn new things together.
Transcript

High-stake exams change teacher grading standards:
evidence from a policy reform *
Pedro Freitas �1
1Nova School of Business and Economics, Universidade Nova de Lisboa
7th April 2021
Abstract
The introduction of high-stake standardized exams has been shown to be strongly
associated with improvements in an average performance in international standard-
ized assessments [Bergbauer et al., 2018] as well as with proficiency in mathematics
and reading [Jacob and Lefgren, 2004]. Despite legitimate concerns with the incen-
tives to teach to the exam and the limited set of skills under evaluation, the fact that
idiosyncratic grading biases tend to vanish through the application of blind, anony-
mous evaluation mechanisms have ensured their validity and continuity in multiple
education systems (OECD, 2013). By means of a difference-in-difference approach,
we exploit a policy reform that introduced high-stakes exams at the end of the 6th
grade in Portuguese and Mathematics, in Portugal, for a short period of 4 years.
We study how the introduction of these high-stake exams changed teacher grading
standards and teacher scores distribution. We find that teachers in courses covered
by external high-stakes exams tend to give a significantly higher percentage of failing
scores and a significantly lower percentage of higher scores, an effect which shows to
be stronger for Mathematics and not homogeneous for male and female students.
JEL classification: I20;I28;H52
Keywords: Student assessment, Teacher scores, Student achievement, School account-
ability
*This work used infrastructure and resources funded by Fundacao para a Ciencia e a Tecnologia(UID/ECO/00124/2013, UID/ECO/00124/2019 and Social Sciences DataLab, Project 22209),POR Lis-boa (LISBOA010145FEDER007722) and Social Sciences DataLab, Project 22209) and POR Norte (So-cial Sciences DataLab, Project 22209). Preliminary and incomplete, please do not cite.
�Corresponding author: [email protected]
1
1 Introduction
Students’ scores aim to mirror student proficiency at a given moment in time. Scores can
be the outcome of different types of assessments, namely the ones graded by teachers and
others based on national standardized tests. The understanding of how different types
of assessment impact students’ performance is a pivotal policy question, since scores are
commonly used as a signal and selection criteria for school and university admissions,
determining future labour market outcomes.
Among the 36 countries part of the OECD, and according to the data provided by the
PISA 2015, 30 conduct external examinations at the upper secondary level and 14 at
the lower secondary level. The existence of external examinations remains a contro-
versial topic in education policy given its potential for disruptive effects on teaching
practises, such as the disproportionate focus on teaching testing techniques [Koretz,
2019]. Other studies have been exploiting the differences across various educational
systems, measuring how the existence of external examinations impacts student per-
formance in standardized international tests. [Bergbauer et al., 2018] uses data from
PISA between 2000 and 2015, gathering results on 59 countries, concluding that higher
student outcomes are strongly associated with an accountability system that includes
standardized exit tests. This result shows to be particularly strong in countries where
the schooling system performs poorly. In a review of the existing literature [Figlio and
Loeb, 2011] concludes on the positive impacts on academic outcomes of the massification
of the external evaluation mechanisms in the 90’s and 00’s in US. [Jacob and Lefgren,
2004] addresses one of these cases, showing improvements in reading and mathematics
for the third and eight grade students in Chicago. External exams can also bring higher
transparency to the educational system, providing additional information on school and
student performance. [Nunes et al., 2015] shows that the publication of school rankings
based on the results of high stake exams decreases the number of students enrolled in
schools with poor performance, increasing their probability of closure and [Burgess et al.,
2013], for Wales, finds negative effects on school effectiveness after the abolishment of
public school table performance. All these studies go in line with the view that a thor-
ough accountability system aligns the incentives for a higher effort by the students and
teachers, improving the schooling results.
These external examinations may differ in how they weight in the student’s final assess-
ment, taking the form of low or high stake exams. Under the low-stake case they do not
factor in students’ outcomes, which may induce lower effort by the students, biasing the
performance results [Wise and DeMars, 2010] and [Zamarro et al., 2018]. These exter-
nals exams may also be heterogeneous in terms of the link between the student and the
2

grader, as in [Diamond and Persson, 2016], which shows that under a non-blind system,
teachers may inflate the scores of the students who they believe had a ”bad test day”.
Whatever the form they take, external examinations are a single measure of the latent
dimension that is the student ability, capturing it in a noisy imprecise way. [Sekhri, 2020]
finds that admission to high-ranked colleges determined by the result in a centralized
exam has little impact on the proficiency during higher education. In the same line,
[Cerdeira et al., 2018] shows that the best predictor for the proficiency during higher
education are the scores granted by the teachers during the upper secondary education
rather than the results in the exit national exams.
Nonetheless the scores assigned by teachers are also not free from possible distortions
and biases. One of the most studied of these biases is the gender differences in the dis-
tribution of the teacher scores. [Lavy, 2008], using data for Israel students in the upper
secondary education, shows that male students are negatively discriminated in teacher
scores compared with results in external evaluations. [Lavy and Sand, 2018] finds a
similar gender bias in primary education showing that this differential in teacher scores
have long lasting impacts during the students’ school life. Similar results are found for
the US by [Cornwell et al., 2013], which points that this bias emerges from the difference
on non-cognitive skills between boys and girls. Other possible bias between teacher and
external scores relates with race and ethnicity. [Burgess and Greaves, 2013], using data
for England, shows a negative bias towards black students and [Botelho et al., 2015] finds
a similar pattern for Brazilian schools. These distortions may have significant impact
since teacher scores constitute a relevant source of information, both for students and
families. [Azmat and Iriberri, 2016] provides evidence that students react to feedback
about their place in the performance distribution and [Bobba and Frisancho, 2016] con-
cludes that the students lack complete information about their ability and when this
information is provided they update their career choices with long lasting impacts.
In many education systems final student’s assessment depends on the scores granted
both by teacher and on external scores. Albeit few studies focus on how the distribution
of teacher scores is affected by the information provided by external exams. An exemp-
tion is the work by [Calsamiglia and Loviglio, 2019] which measures how much teachers
grade their students relatively to their class peers exam results.
In this work, we study how the teacher score distribution changed after the introduction
of high-stake exams in Portuguese and Mathematics at the end of the 6th grade in Por-
tugal. Between 2012 and 2015 the previous 6th grade low stakes exams were converted
into high stake ones, which mounted to 30% of the student’s final score. Additionally,
the average school results in these exams, together with the school average teacher scores
were published in several media outlets, triggering a public debate about school rank-
3

ings and efficiency 1. Exploiting a difference-and-difference approach we estimate how
the introduction of this policy impacted the teacher score distribution in the courses
covered by national exams, Portuguese and Mathematics, compared with other courses
not covered by external assessment mechanisms - English, History and Sciences.
In section 2 we detail the institutional setting behind the the introduction of high stakes
exams in the Portuguese educational system, in section 3 we elaborate on the data used,
in section 4 we present the estimation methodology, in section 5 we present the results
and section 6 concludes.
2 Institutional Setting
The Portuguese educational system is organized in 4 cycles, from the primary to the
upper secondary education. The first 4 years correspond to the first cycle, the 5th and
the 6th grade to the second cycle, the 7th, 8th and 9th grade make up the 3rd cycle
and the 10th, 11th and 12th comprehend the upper secondary level. Historically, in
Portugal, there were not any kind of external evaluations until the 12th grade, when
the national exams are used as a criteria to access higher education. In 2000 the first
low stake exams are introduced in the 4th grade in Portuguese and Mathematics, which
were anonymous and did not impact the final score.The first low stakes covered just a
sample of the whole population. This same type of test is extended to the 6th grade in
2002 and in 2005 high stake exams were instated in the 9th grade, mounting for 30% of
the final score. The other 70% of the final score was dependent on the score granted by
the teacher. The high stake nature of the exams was extended to the 6th and 4th grade
exams between in . This decision was then reversed and currently in both the 4th grade
and 6th grade there isn’t any kind of external evaluation.
In Portugal, scores, both of external examinations and of teacher scores are reported in
a scale from to 1 to 5, being 1 and 2 failing scores, 3 a passing score, 4 a good score
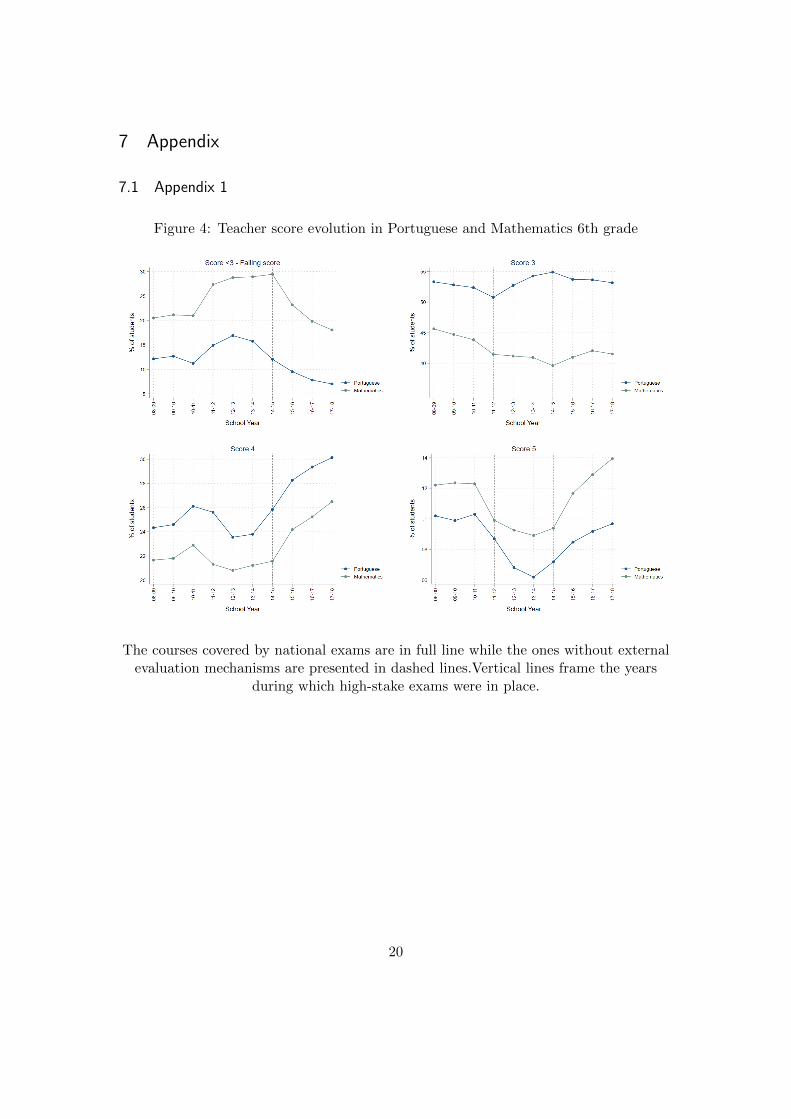
and 5 a very good score2. Between 2012 and 2015, during which high stake external
exams were in place, we observe, both in Portuguese and Mathematics, a significant
change in the distribution of teacher scores. The share of failing scores (1 or 2) increased
significantly and the share of students achieving the highest scores fell, as can be observed
in Table 13.
1These results were already published for the 9th an 12th exams, being then extended to the 6thgrade exams.
21 and 2 correspond to score below a 50% level, 3 is comprehended between 51% and 69%, 4 between70% and 89% and 5 is granted for performances above 90%.
3In Appendix 1 Figure 4 we plot the evolution of the share of students in each score across time.
4
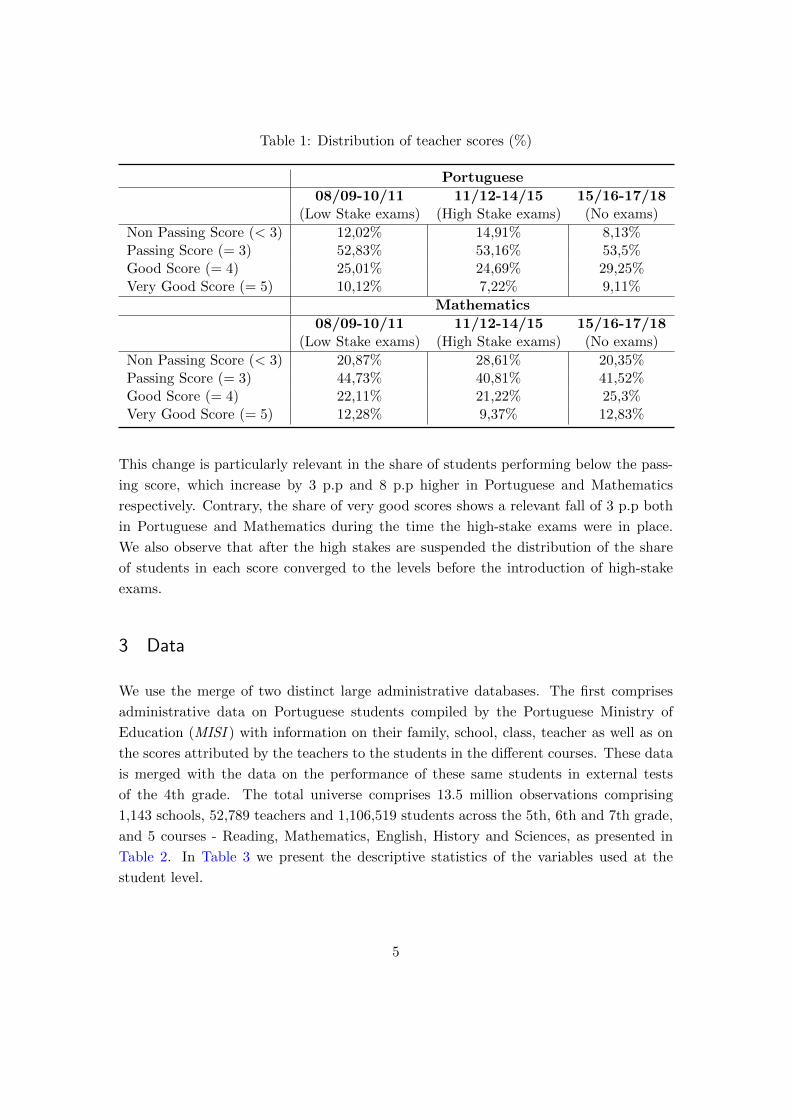
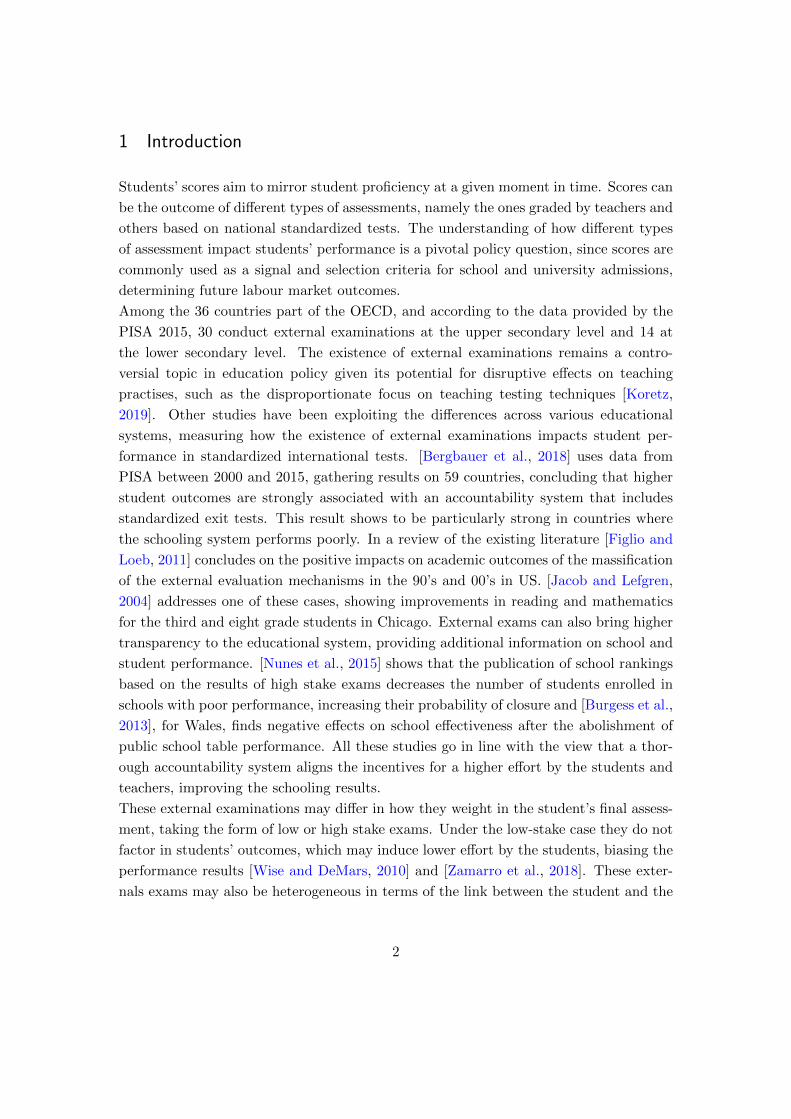
Table 1: Distribution of teacher scores (%)
Portuguese
08/09-10/11 11/12-14/15 15/16-17/18(Low Stake exams) (High Stake exams) (No exams)
Non Passing Score (< 3) 12,02% 14,91% 8,13%Passing Score (= 3) 52,83% 53,16% 53,5%Good Score (= 4) 25,01% 24,69% 29,25%Very Good Score (= 5) 10,12% 7,22% 9,11%
Mathematics
08/09-10/11 11/12-14/15 15/16-17/18(Low Stake exams) (High Stake exams) (No exams)
Non Passing Score (< 3) 20,87% 28,61% 20,35%Passing Score (= 3) 44,73% 40,81% 41,52%Good Score (= 4) 22,11% 21,22% 25,3%Very Good Score (= 5) 12,28% 9,37% 12,83%
This change is particularly relevant in the share of students performing below the pass-
ing score, which increase by 3 p.p and 8 p.p higher in Portuguese and Mathematics
respectively. Contrary, the share of very good scores shows a relevant fall of 3 p.p both
in Portuguese and Mathematics during the time the high-stake exams were in place.
We also observe that after the high stakes are suspended the distribution of the share
of students in each score converged to the levels before the introduction of high-stake
exams.
3 Data
We use the merge of two distinct large administrative databases. The first comprises
administrative data on Portuguese students compiled by the Portuguese Ministry of
Education (MISI ) with information on their family, school, class, teacher as well as on
the scores attributed by the teachers to the students in the different courses. These data
is merged with the data on the performance of these same students in external tests
of the 4th grade. The total universe comprises 13.5 million observations comprising
1,143 schools, 52,789 teachers and 1,106,519 students across the 5th, 6th and 7th grade,
and 5 courses - Reading, Mathematics, English, History and Sciences, as presented in
Table 2. In Table 3 we present the descriptive statistics of the variables used at the
student level.
5
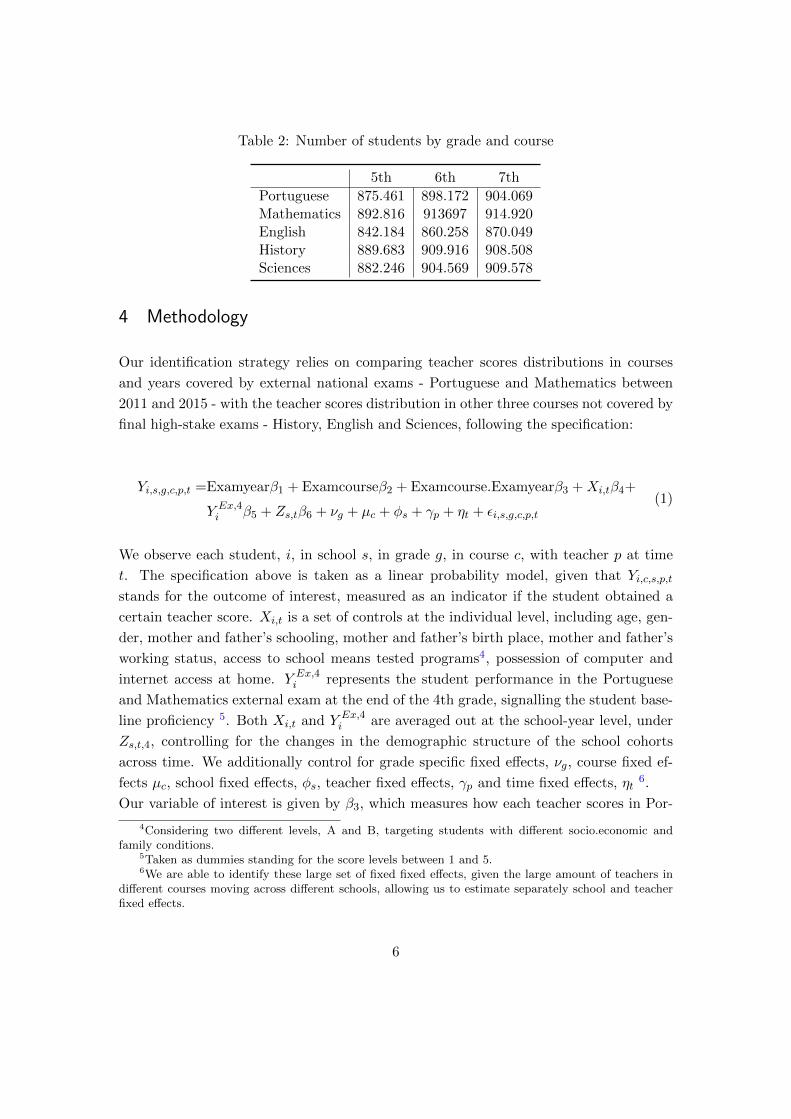
Table 2: Number of students by grade and course
5th 6th 7th
Portuguese 875.461 898.172 904.069Mathematics 892.816 913697 914.920English 842.184 860.258 870.049History 889.683 909.916 908.508Sciences 882.246 904.569 909.578
4 Methodology
Our identification strategy relies on comparing teacher scores distributions in courses
and years covered by external national exams - Portuguese and Mathematics between
2011 and 2015 - with the teacher scores distribution in other three courses not covered by
final high-stake exams - History, English and Sciences, following the specification:
Yi,s,g,c,p,t =Examyearβ1 + Examcourseβ2 + Examcourse.Examyearβ3 +Xi,tβ4+
Y Ex,4i β5 + Zs,tβ6 + νg + µc + φs + γp + ηt + εi,s,g,c,p,t
(1)
We observe each student, i, in school s, in grade g, in course c, with teacher p at time
t. The specification above is taken as a linear probability model, given that Yi,c,s,p,t
stands for the outcome of interest, measured as an indicator if the student obtained a
certain teacher score. Xi,t is a set of controls at the individual level, including age, gen-
der, mother and father’s schooling, mother and father’s birth place, mother and father’s
working status, access to school means tested programs4, possession of computer and
internet access at home. Y Ex,4i represents the student performance in the Portuguese
and Mathematics external exam at the end of the 4th grade, signalling the student base-
line proficiency 5. Both Xi,t and Y Ex,4i are averaged out at the school-year level, under
Zs,t,4, controlling for the changes in the demographic structure of the school cohorts
across time. We additionally control for grade specific fixed effects, νg, course fixed ef-
fects µc, school fixed effects, φs, teacher fixed effects, γp and time fixed effects, ηt6.
Our variable of interest is given by β3, which measures how each teacher scores in Por-
4Considering two different levels, A and B, targeting students with different socio.economic andfamily conditions.
5Taken as dummies standing for the score levels between 1 and 5.6We are able to identify these large set of fixed fixed effects, given the large amount of teachers in
different courses moving across different schools, allowing us to estimate separately school and teacherfixed effects.
6
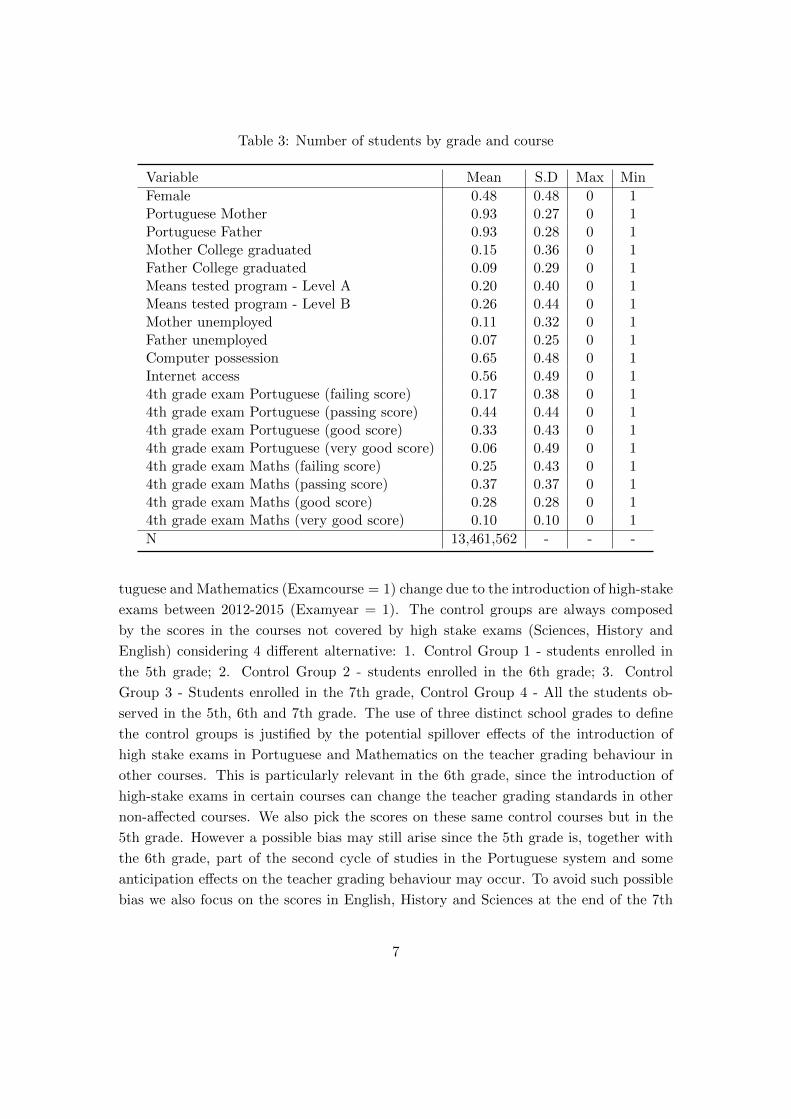
Table 3: Number of students by grade and course
Variable Mean S.D Max Min
Female 0.48 0.48 0 1Portuguese Mother 0.93 0.27 0 1Portuguese Father 0.93 0.28 0 1Mother College graduated 0.15 0.36 0 1Father College graduated 0.09 0.29 0 1Means tested program - Level A 0.20 0.40 0 1Means tested program - Level B 0.26 0.44 0 1Mother unemployed 0.11 0.32 0 1Father unemployed 0.07 0.25 0 1Computer possession 0.65 0.48 0 1Internet access 0.56 0.49 0 14th grade exam Portuguese (failing score) 0.17 0.38 0 14th grade exam Portuguese (passing score) 0.44 0.44 0 14th grade exam Portuguese (good score) 0.33 0.43 0 14th grade exam Portuguese (very good score) 0.06 0.49 0 14th grade exam Maths (failing score) 0.25 0.43 0 14th grade exam Maths (passing score) 0.37 0.37 0 14th grade exam Maths (good score) 0.28 0.28 0 14th grade exam Maths (very good score) 0.10 0.10 0 1
N 13,461,562 - - -
tuguese and Mathematics (Examcourse = 1) change due to the introduction of high-stake
exams between 2012-2015 (Examyear = 1). The control groups are always composed
by the scores in the courses not covered by high stake exams (Sciences, History and
English) considering 4 different alternative: 1. Control Group 1 - students enrolled in
the 5th grade; 2. Control Group 2 - students enrolled in the 6th grade; 3. Control
Group 3 - Students enrolled in the 7th grade, Control Group 4 - All the students ob-
served in the 5th, 6th and 7th grade. The use of three distinct school grades to define
the control groups is justified by the potential spillover effects of the introduction of
high stake exams in Portuguese and Mathematics on the teacher grading behaviour in
other courses. This is particularly relevant in the 6th grade, since the introduction of
high-stake exams in certain courses can change the teacher grading standards in other
non-affected courses. We also pick the scores on these same control courses but in the
5th grade. However a possible bias may still arise since the 5th grade is, together with
the 6th grade, part of the second cycle of studies in the Portuguese system and some
anticipation effects on the teacher grading behaviour may occur. To avoid such possible
bias we also focus on the scores in English, History and Sciences at the end of the 7th
7

grade, a grade without external evaluation mechanisms and whose teacher scores are not
expected to be impacted by the introduction of high-stake exams at the end of the 6th
grade.
To test for the validity of these different control groups, we inspect the parallel trend
hypothesis plotting the shares of each score across different school years. In Figure 1,
Figure 2 and Figure 3 we observe how teacher scores in the Portuguese and Mathematics
in the 6th grade compare with the other courses (English, History and Sciences) in the
5th, 6th and 7th grade. In all the three cases, overall, we observe no divergent trends
before the introduction of high-stake exams (in 2011/2012) and a sharp change between
treatment and control courses during the exam years. In the case of control group 1 (6th
grade scores), we note potential spillover effects due to the existence of high stake exams
in Portuguese and Mathematics to other courses not covered by exams, particularly on
the share of students with a very high score (level 5). In the second control group, the
one which comprising the students’ performance in the 5th grade in courses not covered
by national external exams, some anticipation effects on teacher grading cannot be ruled
out, namely in the share of the students with a non passing score (level 1 and 2). In the
third control group, which compiles teacher scores in the 7th grade, we do not observe
any trend in teacher scores in the control group after the introduction of high stake
exams in the 6th grade.
5 Results
5.1 Baseline results
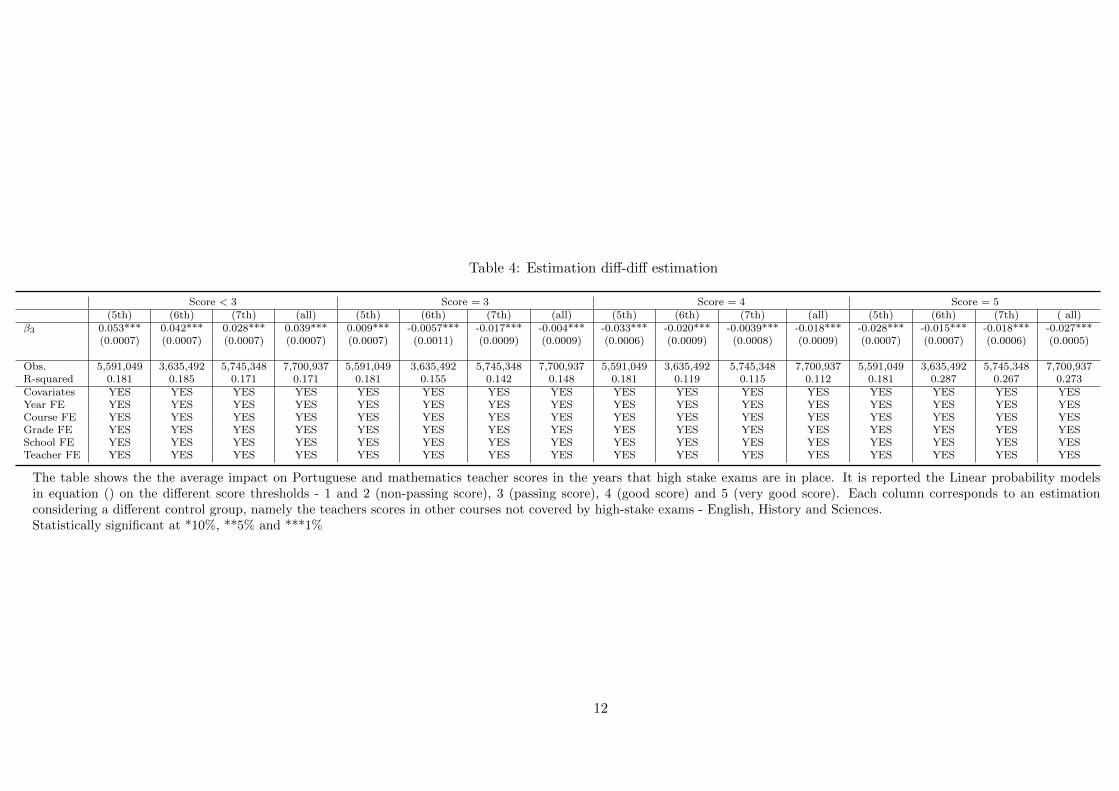
In Table 4 we observe the impacts of introducing high-stake exams in teacher scores
considering Equation (1) and assuming the 4 control groups previously pointed. We find
consistent positive increases on the probability of achieving a negative score (1 and 2)
between 3 and 5 p.p and a small decrease on the probability of achieving a score equal to
3 up to 2 p.p. The impact on the probability of achieving a good and very good score is
consistently negative, between 2 and 4 p.p on the probability of having a score of 4 and
between 1 and 3 p.p on the probability of having a score of 5. The estimated impacts
of the introduction of high stake exams is larger when we take as control other courses
not covered in national exams - History, Sciences and English - in the 5th grade (control
group 1) than when we take as control groups these same courses in the 6th and 7th
grade (Control group 2 and 3)7.
7In Table 10, in Appendix 2 are showed the results of the same specification without socio-demographic controls and the different fixed effect levels included.
8

Figure 1: Teacher score evolution in Portuguese and Mathematics 6th grade VSEnglish, History and Sciences, 6th grade
The courses covered by national exams are depicted in full line while the ones withoutexternal evaluation mechanisms are presented in dashed lines. Vertical lines frame the
years during which high-stake exams were in place.
We further restrict the analysis excluding the last three school years, after the abolition
of the high stake exams - between 2015/2016 and 2017/2018- preserving just the school
years before and during the introduction of high stake exams in 2011/2012. We observe
in Table 11 similar results across the different scores, but a higher magnitude on the
estimated impacts. We find an increase on the probability of obtaining a failing score
between 4 and 6 p.p, and a marginal effect on the probability of achieving a passing
score, close to zero. Regarding higher scores, we estimate a fall on the probability of
achieving a score of between 2 and 3 p.p. A similar magnitude is found on the probability
of achieving a very good score, equal to 5. 8.
Since the same student is observed across several courses and school grades, within stu-
dent variation of teachers scores can be explored using a student fixed approach. The
results of this specification (Table 12) are in line with the results previously found, show-
8In Table 11, in appendix 2 are showed the results of the same specification without socio-demographic controls and the different fixed effect levels included.
9
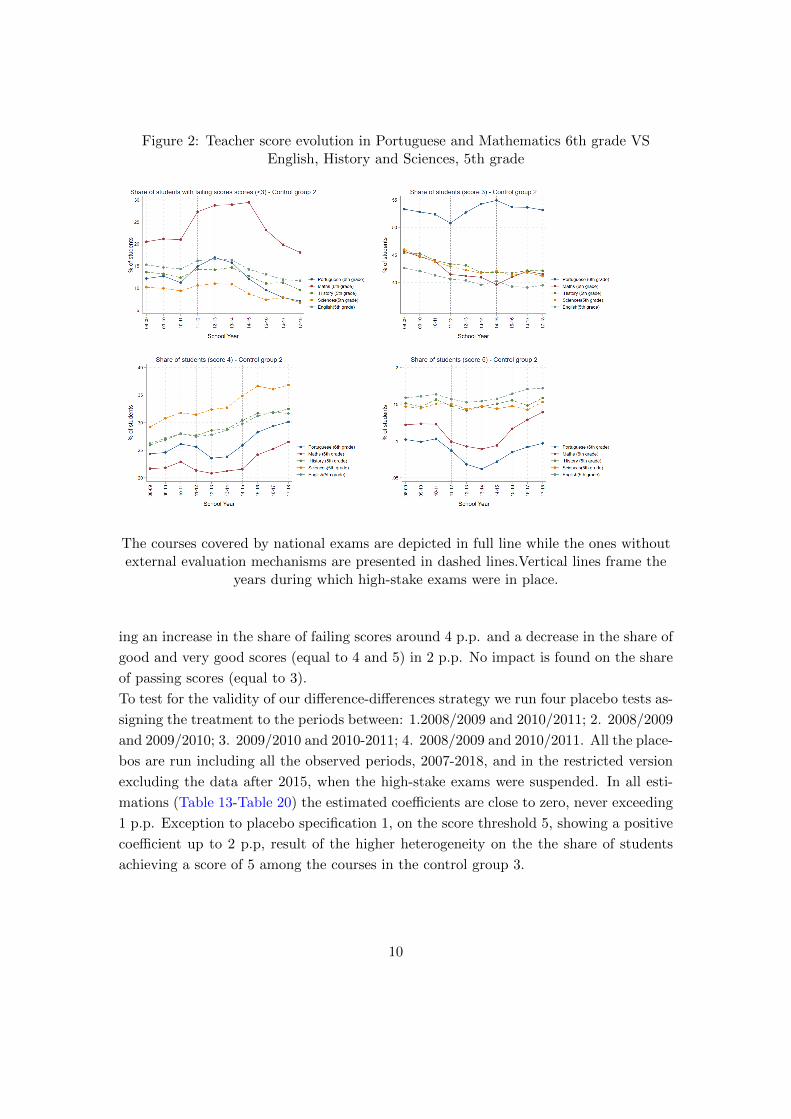
Figure 2: Teacher score evolution in Portuguese and Mathematics 6th grade VSEnglish, History and Sciences, 5th grade
The courses covered by national exams are depicted in full line while the ones withoutexternal evaluation mechanisms are presented in dashed lines.Vertical lines frame the
years during which high-stake exams were in place.
ing an increase in the share of failing scores around 4 p.p. and a decrease in the share of
good and very good scores (equal to 4 and 5) in 2 p.p. No impact is found on the share
of passing scores (equal to 3).
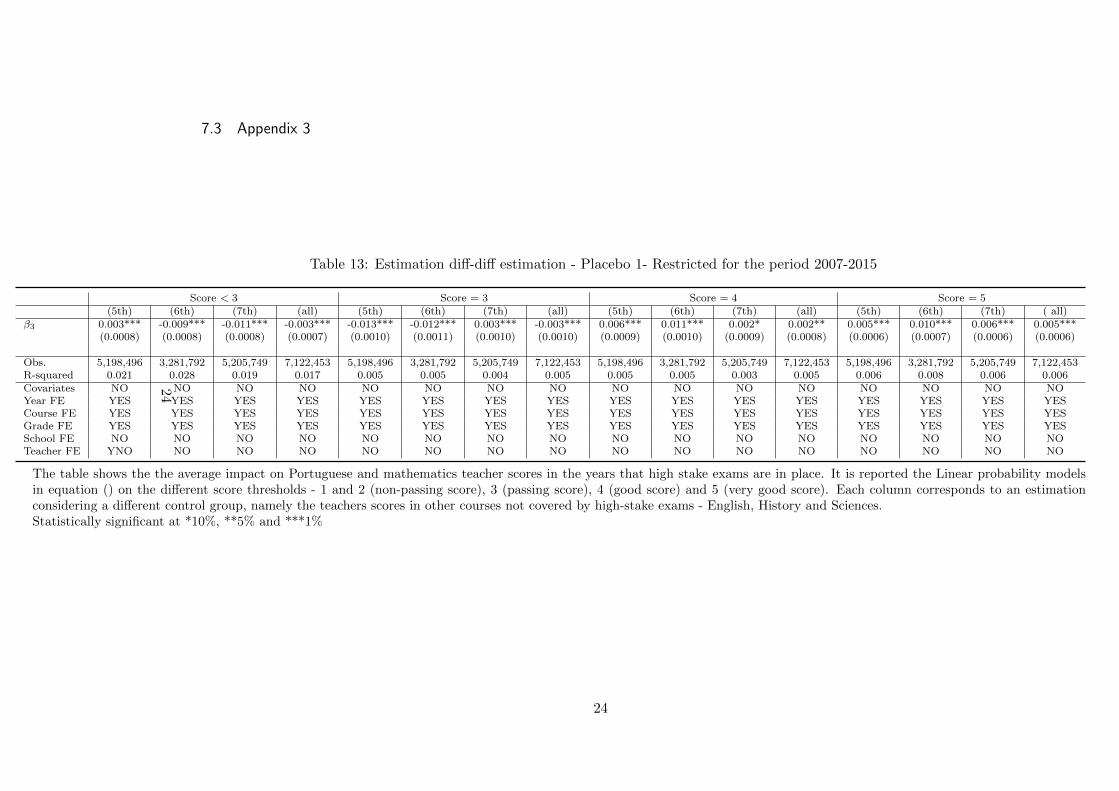
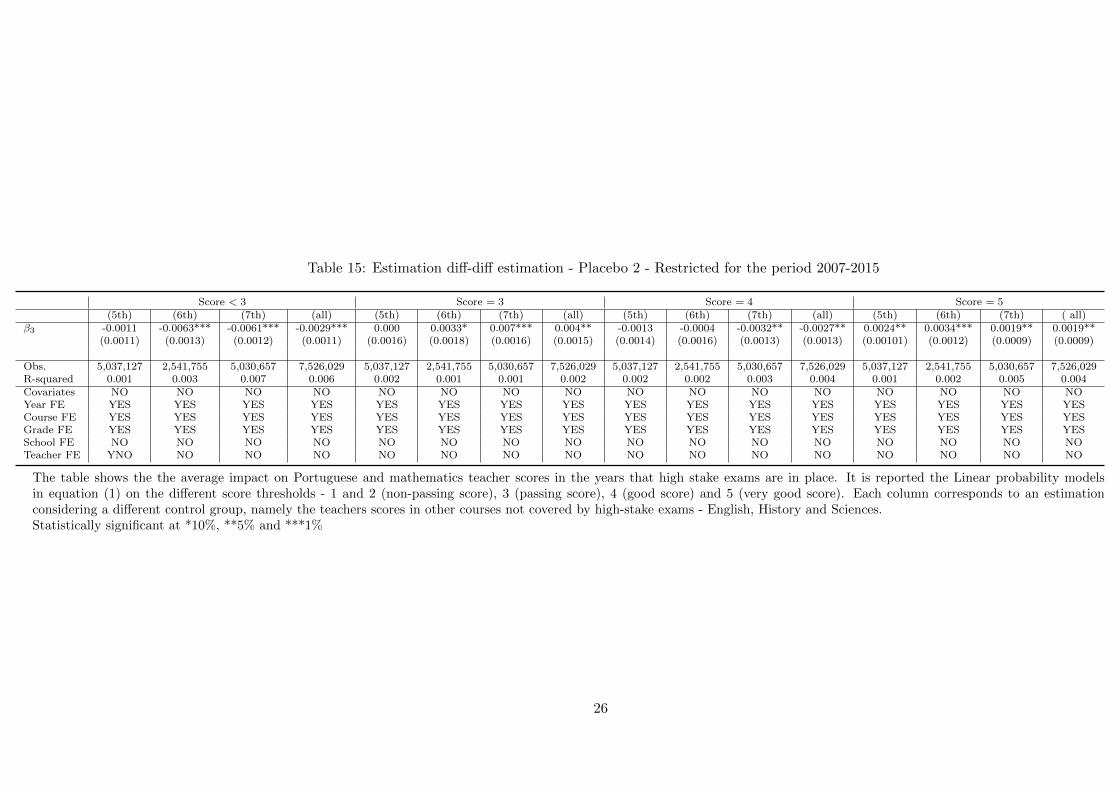
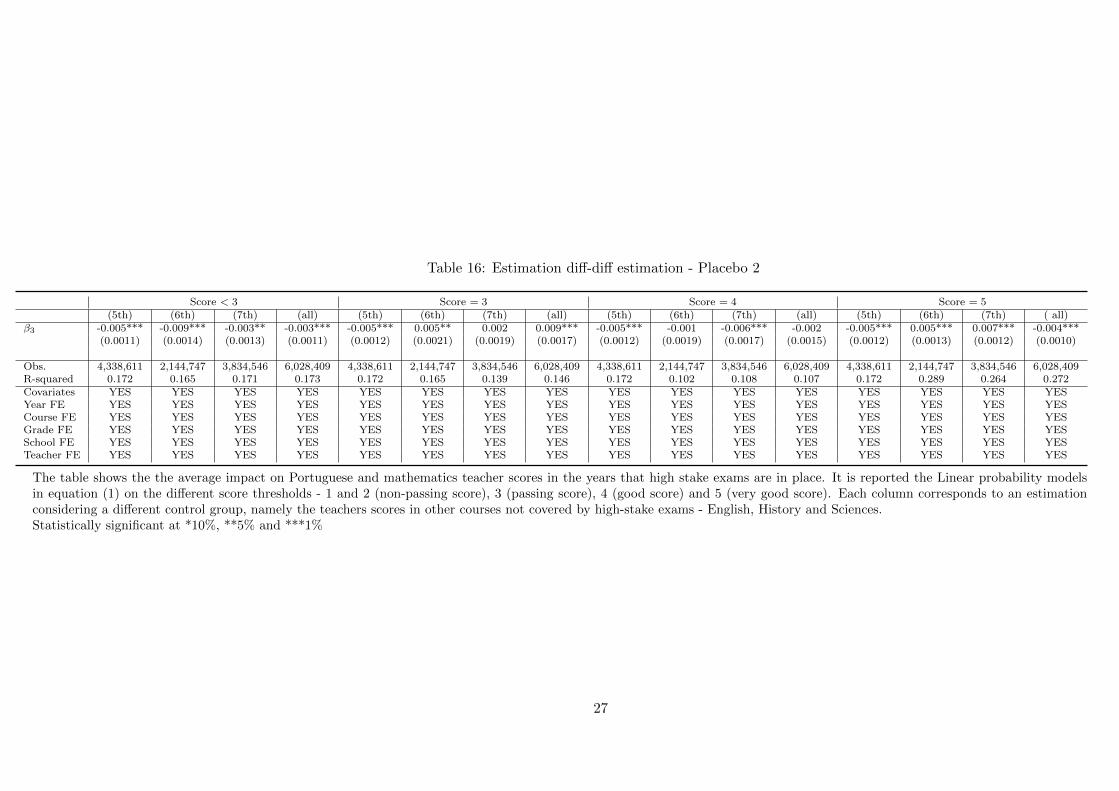
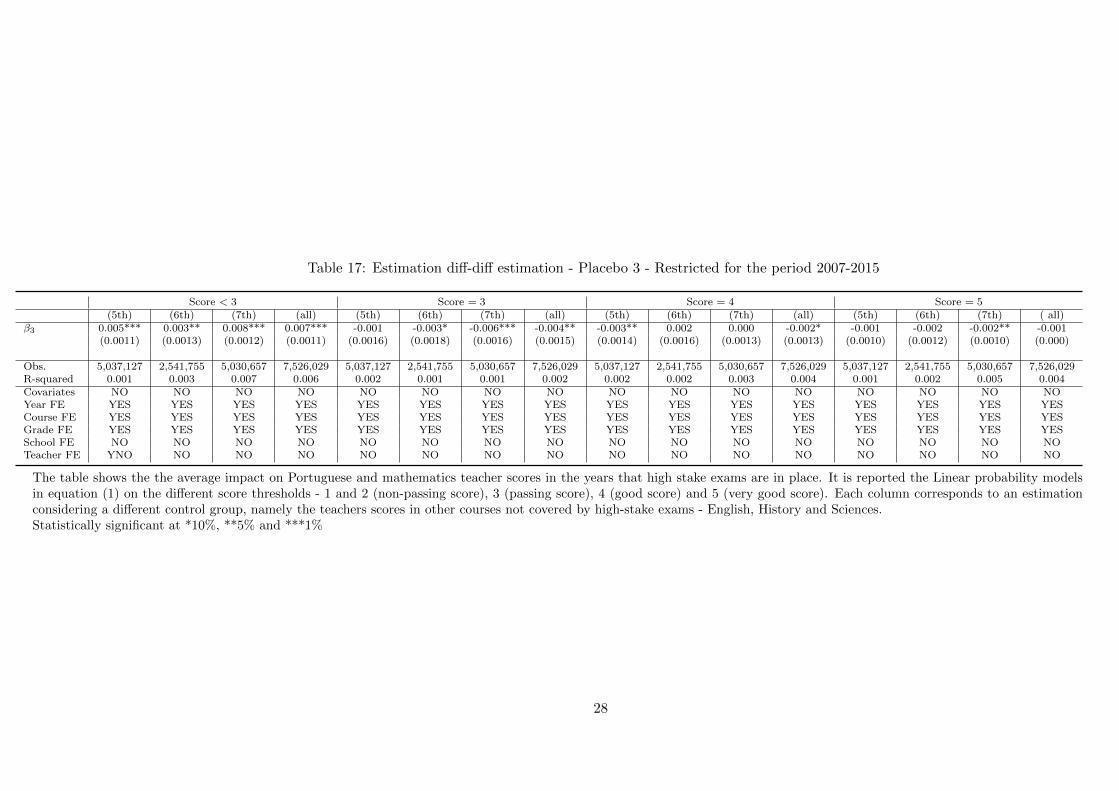
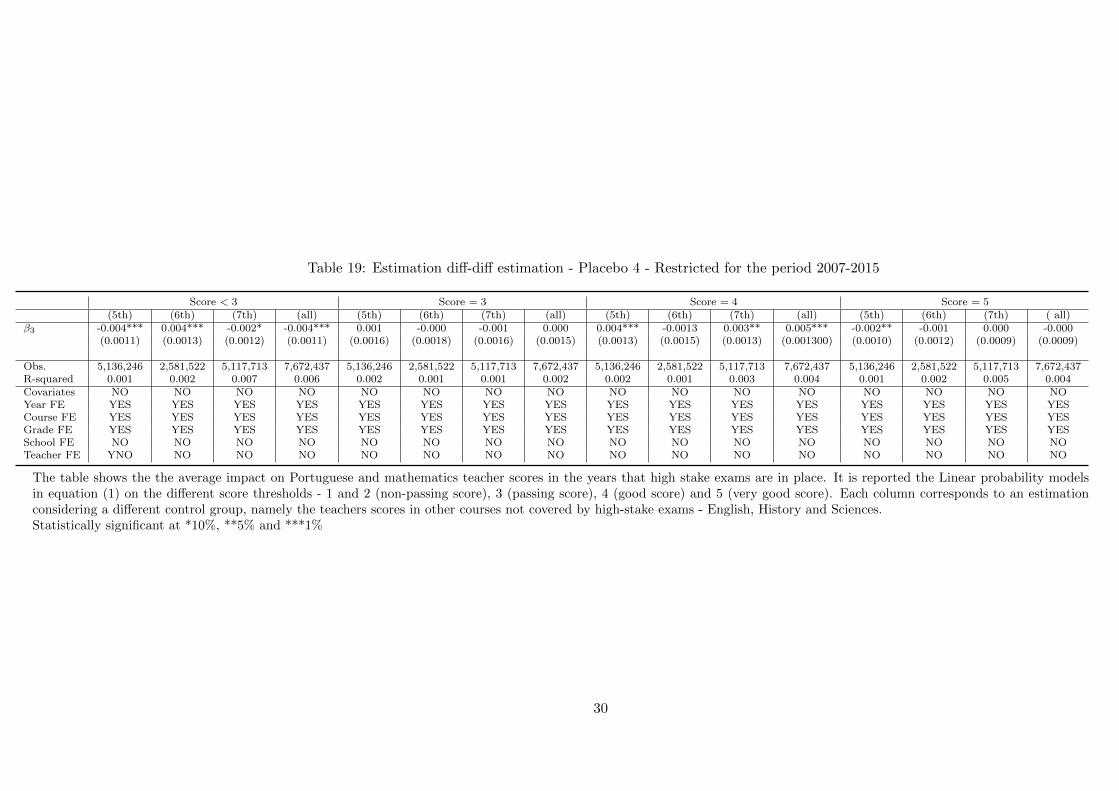
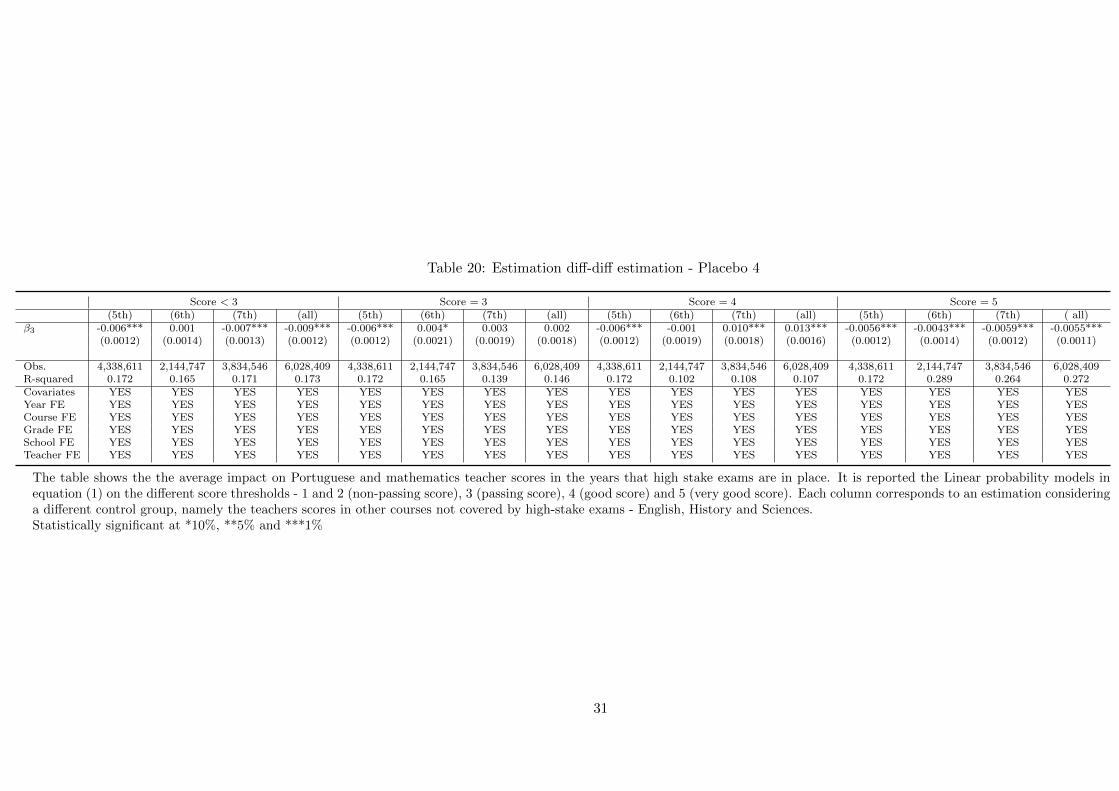
To test for the validity of our difference-differences strategy we run four placebo tests as-
signing the treatment to the periods between: 1.2008/2009 and 2010/2011; 2. 2008/2009
and 2009/2010; 3. 2009/2010 and 2010-2011; 4. 2008/2009 and 2010/2011. All the place-
bos are run including all the observed periods, 2007-2018, and in the restricted version
excluding the data after 2015, when the high-stake exams were suspended. In all esti-
mations (Table 13-Table 20) the estimated coefficients are close to zero, never exceeding
1 p.p. Exception to placebo specification 1, on the score threshold 5, showing a positive
coefficient up to 2 p.p, result of the higher heterogeneity on the the share of students
achieving a score of 5 among the courses in the control group 3.
10

Figure 3: Teacher score evolution in Portuguese and Mathematics 6th grade VSEnglish, History and Sciences, 7th grade
The courses covered by national exams are depicted in full line while the ones withoutexternal evaluation mechanisms are presented in dashed lines.Vertical lines frame the
years during which high-stake exams were in place.
11
12
Table 4: Estimation diff-diff estimation
Score < 3 Score = 3 Score = 4 Score = 5(5th) (6th) (7th) (all) (5th) (6th) (7th) (all) (5th) (6th) (7th) (all) (5th) (6th) (7th) ( all)
β3 0.053*** 0.042*** 0.028*** 0.039*** 0.009*** -0.0057*** -0.017*** -0.004*** -0.033*** -0.020*** -0.0039*** -0.018*** -0.028*** -0.015*** -0.018*** -0.027***(0.0007) (0.0007) (0.0007) (0.0007) (0.0007) (0.0011) (0.0009) (0.0009) (0.0006) (0.0009) (0.0008) (0.0009) (0.0007) (0.0007) (0.0006) (0.0005)
Obs. 5,591,049 3,635,492 5,745,348 7,700,937 5,591,049 3,635,492 5,745,348 7,700,937 5,591,049 3,635,492 5,745,348 7,700,937 5,591,049 3,635,492 5,745,348 7,700,937R-squared 0.181 0.185 0.171 0.171 0.181 0.155 0.142 0.148 0.181 0.119 0.115 0.112 0.181 0.287 0.267 0.273Covariates YES YES YES YES YES YES YES YES YES YES YES YES YES YES YES YESYear FE YES YES YES YES YES YES YES YES YES YES YES YES YES YES YES YESCourse FE YES YES YES YES YES YES YES YES YES YES YES YES YES YES YES YESGrade FE YES YES YES YES YES YES YES YES YES YES YES YES YES YES YES YESSchool FE YES YES YES YES YES YES YES YES YES YES YES YES YES YES YES YESTeacher FE YES YES YES YES YES YES YES YES YES YES YES YES YES YES YES YES
The table shows the the average impact on Portuguese and mathematics teacher scores in the years that high stake exams are in place. It is reported the Linear probability modelsin equation () on the different score thresholds - 1 and 2 (non-passing score), 3 (passing score), 4 (good score) and 5 (very good score). Each column corresponds to an estimationconsidering a different control group, namely the teachers scores in other courses not covered by high-stake exams - English, History and Sciences.Statistically significant at *10%, **5% and ***1%

13
Table 5: Estimation diff-diff estimation - Restricted for the period 2007-2015
Score < 3 Score = 3 Score = 4 Score = 5(5th) (6th) (7th) (all) (5th) (6th) (7th) (all) (5th) (6th) (7th) (all) (5th) (6th) (7th) ( all)
β3 0.058*** 0.049*** 0.043*** 0.052*** 0.009*** -0.005*** -0.008*** 0.002** -0.036*** -0.025*** -0.017*** -0.029*** -0.031*** -0.019*** -0.018*** -0.027***(0.0008) (0.0009) (0.0008) (0.0008) (0.0011) (0.0013) (0.0012) (0.0011) (0.0010) (0.0011) (0.0010) (0.00010) (0.0007) (0.0008) (0.0007) (0.0006)
Obs. 4,555,810 2,839,464 4,238,465 5,954,813 4,555,810 2,839,464 4,238,465 5,954,813 4,555,810 2,839,464 4,238,465 5,954,813 4,555,810 2,839,464 4,238,465 5,954,813R-squared 0.186 0.191 0.179 0.178 0.153 0.147 0.135 0.143 0.112 0.117 0.114 0.110 0.287 0.283 0.265 0.273Covariates YES YES YES YES YES YES YES YES YES YES YES YES YES YES YES YESYear FE YES YES YES YES YES YES YES YES YES YES YES YES YES YES YES YESCourse FE YES YES YES YES YES YES YES YES YES YES YES YES YES YES YES YESGrade FE YES YES YES YES YES YES YES YES YES YES YES YES YES YES YES YESSchool FE YES YES YES YES YES YES YES YES YES YES YES YES YES YES YES YESTeacher FE YES YES YES YES YES YES YES YES YES YES YES YES YES YES YES YES
The table shows the the average impact on Portuguese and mathematics teacher scores in the years that high stake exams are in place. It is reported the Linear probability modelsin equation () on the different score thresholds - 1 and 2 (non-passing score), 3 (passing score), 4 (good score) and 5 (very good score). Each column corresponds to an estimationconsidering a different control group, namely the teachers scores in other courses not covered by high-stake exams - English, History and Sciences.Statistically significant at *10%, **5% and ***1%
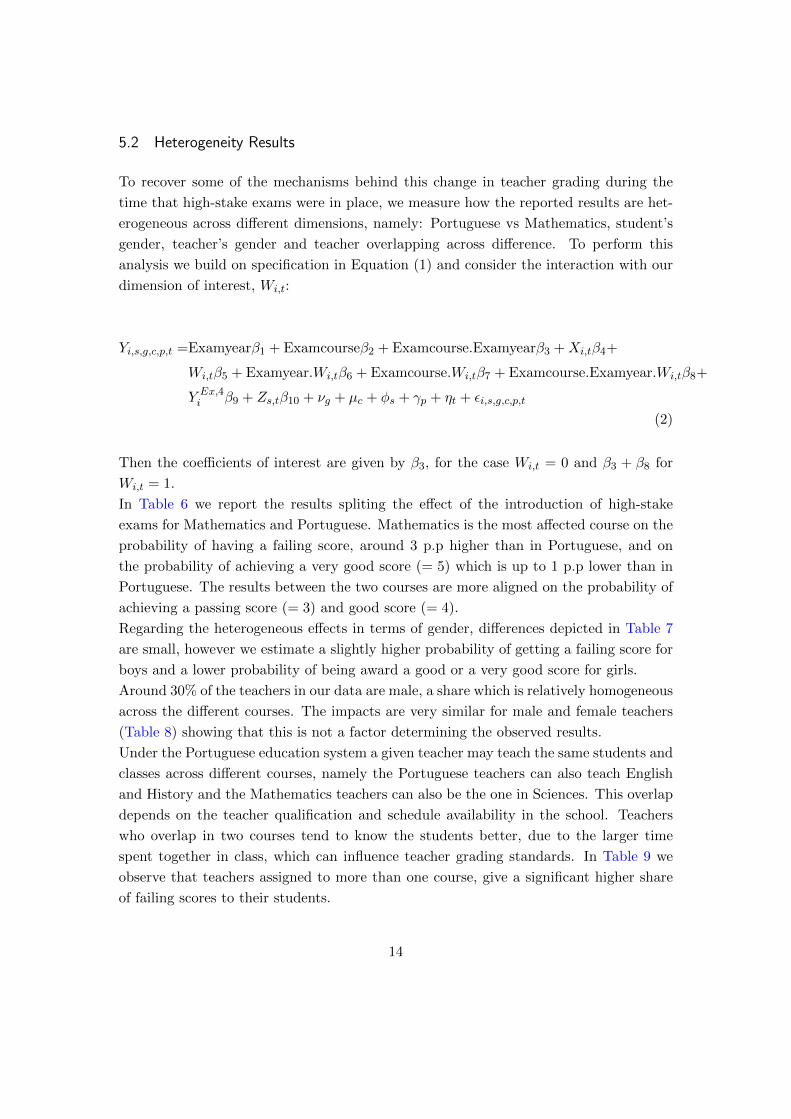
5.2 Heterogeneity Results
To recover some of the mechanisms behind this change in teacher grading during the
time that high-stake exams were in place, we measure how the reported results are het-
erogeneous across different dimensions, namely: Portuguese vs Mathematics, student’s
gender, teacher’s gender and teacher overlapping across difference. To perform this
analysis we build on specification in Equation (1) and consider the interaction with our
dimension of interest, Wi,t:
Yi,s,g,c,p,t =Examyearβ1 + Examcourseβ2 + Examcourse.Examyearβ3 +Xi,tβ4+
Wi,tβ5 + Examyear.Wi,tβ6 + Examcourse.Wi,tβ7 + Examcourse.Examyear.Wi,tβ8+
Y Ex,4i β9 + Zs,tβ10 + νg + µc + φs + γp + ηt + εi,s,g,c,p,t
(2)
Then the coefficients of interest are given by β3, for the case Wi,t = 0 and β3 + β8 for
Wi,t = 1.
In Table 6 we report the results spliting the effect of the introduction of high-stake
exams for Mathematics and Portuguese. Mathematics is the most affected course on the
probability of having a failing score, around 3 p.p higher than in Portuguese, and on
the probability of achieving a very good score (= 5) which is up to 1 p.p lower than in
Portuguese. The results between the two courses are more aligned on the probability of
achieving a passing score (= 3) and good score (= 4).
Regarding the heterogeneous effects in terms of gender, differences depicted in Table 7
are small, however we estimate a slightly higher probability of getting a failing score for
boys and a lower probability of being award a good or a very good score for girls.
Around 30% of the teachers in our data are male, a share which is relatively homogeneous
across the different courses. The impacts are very similar for male and female teachers
(Table 8) showing that this is not a factor determining the observed results.
Under the Portuguese education system a given teacher may teach the same students and
classes across different courses, namely the Portuguese teachers can also teach English
and History and the Mathematics teachers can also be the one in Sciences. This overlap
depends on the teacher qualification and schedule availability in the school. Teachers
who overlap in two courses tend to know the students better, due to the larger time
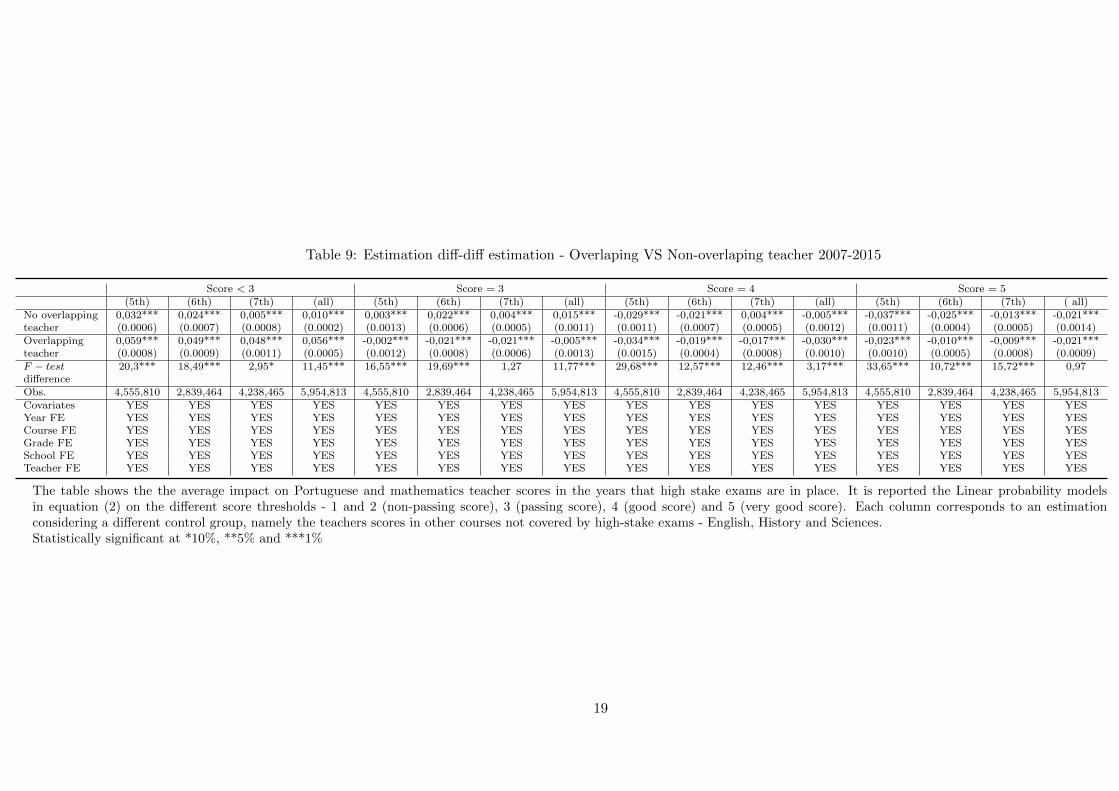
spent together in class, which can influence teacher grading standards. In Table 9 we
observe that teachers assigned to more than one course, give a significant higher share
of failing scores to their students.
14

6 Conclusion
The introduction of high-stake exams is one the mechanisms used to increase school ac-
countability. The massification of external standardized evaluation methods under the
No Child Left Behind Policy in the early 2000’s in the US triggered a heated debate
about the impacts of these accountability policies. Many argue for the disruptive effects
on teaching practises due to the existence of these standardized tests, [Koretz, 2019],
while others show the positive impacts they have on learning and students outcomes
[Bergbauer et al., 2018]. In most of the education systems, students final assessment is
a combination of the results in these standardized tests and scores assigned by teachers,
whose criteria is defined by each individual teacher. However little is known about how
these two types of assessment are related, namely how teachers adjust their grading
standards due to the introduction of these stricter accountability methods.
We exploit a policy reform in Portugal between 2012 and 2015 which changed the na-
ture of the standardized tests in Portuguese and Mathematics at the end of the 6th
grade from low-stake to high-stake, weighting 30% in the final student assessment. The
results in these high-stake tests, as well as the differences between teacher and exam
scores were published yearly in media outlets, bringing a higher degree of information
regarding school performance. The remaining courses in the 6th grade - History, Sciences
and English - were not assessed through high-stake exams. We then compare how the
teacher scores in the courses covered by high-stake exams, Portuguese and Mathematics,
changed relatively to the teacher scores in those courses which were not covered by this
accountability mechanism. We find that during the time that high-stake exams were in
place the share of students being award with failing scores in Portuguese and Mathemat-
ics significantly increased between 3 and 6 p.p, while the share of good and very good
scores decreased between 1 and 4 p.p. These results are robust across different specifica-
tions, showing that teachers become more demanding in their grading standards while
high-stake exams were in place. This change was particular clear in Mathematics and
gender differences are found. Boys are more affected by the increase on the probability
of getting a failing score and girls by the fall on the probability of achieving good and
very good scores. These results highlight how accountability mechanisms can have a
broader impact, namely on teaching practises and grading standards. On-going research
explores other sources of heterogeneity, namely if teacher seniority or the school-share
of students under means-tested programs explain the observed results.
15

16
Table 6: Estimation diff-diff estimation - Portuguese VS Mathematics 2007-2015
Score < 3 Score = 3 Score = 4 Score = 5(5th) (6th) (7th) (all) (5th) (6th) (7th) (all) (5th) (6th) (7th) (all) (5th) (6th) (7th) ( all)
Portuguese 0.039*** 0.027*** 0.014*** 0.026*** 0.023*** 0.006*** -0.004*** 0.010*** -0.036*** -0.021*** -0.005*** -0.019*** -0.026*** -0.012*** -0.005*** -0.017***(0.0008) (0.0009) (0.0008) (0.0008) (0.0012) (0.0014) (0.00128) (0.00123) (0.0011) (0.0012) (0.0011) (0.0011) (0.0007) (0.0008) (0.0007) (0.0007)
Maths 0.066*** 0.054*** 0.041*** 0.054*** -0.001 -0.018*** -0.028*** -0.014*** -0.034*** -0.019*** -0.0023** -0.018*** -0.031*** -0.018*** -0.010*** -0.022***(0.0009) (0.0010) (0.0010) (0.00097) (0.0013) (0.0014) (0.0013) (0.0013) (0.0011) (0.0012) (0.0011) (0.0011) (0.0008) (0.0008) (0.0008) (0.0007)
F − test 540.53*** 205.07*** 514.29*** 28.8*** 513.59*** 203.86*** 2.16*** 34.01*** 514.29*** 205.06*** 2.18*** 34.24** 544.09*** 204.57*** 0.42 29.79***differenceObs. 4,555,810 2,839,464 4,238,465 5,954,813 4,555,810 2,839,464 4,238,465 5,954,813 4,555,810 2,839,464 4,238,465 5,954,813 4,555,810 2,839,464 4,238,465 5,954,813Covariates YES YES YES YES YES YES YES YES YES YES YES YES YES YES YES YESYear FE YES YES YES YES YES YES YES YES YES YES YES YES YES YES YES YESCourse FE YES YES YES YES YES YES YES YES YES YES YES YES YES YES YES YESGrade FE YES YES YES YES YES YES YES YES YES YES YES YES YES YES YES YESSchool FE YES YES YES YES YES YES YES YES YES YES YES YES YES YES YES YESTeacher FE YES YES YES YES YES YES YES YES YES YES YES YES YES YES YES YES
The table shows the the average impact on Portuguese and mathematics teacher scores in the years that high stake exams are in place. It is reported the Linear probability models inequation (2) on the different score thresholds - 1 and 2 (non-passing score), 3 (passing score), 4 (good score) and 5 (very good score). Each column corresponds to an estimation consideringa different control group, namely the teachers scores in other courses not covered by high-stake exams - English, History and Sciences.Statistically significant at *10%, **5% and ***1%

17
Table 7: Estimation diff-diff estimation - Male VS Female student 2007-2015
Score < 3 Score = 3 Score = 4 Score = 5(5th) (6th) (7th) (all) (5th) (6th) (7th) (all) (5th) (6th) (7th) (all) (5th) (6th) (7th) ( all)
Male 0,056*** 0,044*** 0,031*** 0,044*** 0,000*** -0,013*** -0,024*** -0,011*** -0,031*** -0,019*** -0,002*** -0,016*** -0,024*** -0,013*** -0,011*** -0,015***Student (0.0009) (0.0009) (0.0008) (0.0006) (0.0011) (0.0002) (0.0013) (0.0012) (0.0015) (0.0017) (0.0018) (0.0002) (0.0006) (0.0005) (0.0009) (0.0004)Female 0,048*** 0,038*** 0,024*** 0,035*** 0,018*** 0,002*** -0,008*** 0,005*** -0,034*** -0,022*** -0,005*** -0,018*** -0,032*** -0,018*** -0,011*** -0,02***Student (0.0007) (0.0008) (0.0007) (0.0005) (0.0004) (0.0012) (0.0009) (0.0007) (0.0002) (0.0011) (0.0001) (0.0005) (0.0012) (0.0009) (0.0005) (0.0004)F − test 6,81*** 4,37*** 5,28*** 6,66*** 10,37*** 7,38*** 8,31*** 9,95*** 1,32 1,91 1,83 1,45 7,52*** 4,39*** 5,15*** 6,88***differenceObs. 4,555,810 2,839,464 4,238,465 5,954,813 4,555,810 2,839,464 4,238,465 5,954,813 4,555,810 2,839,464 4,238,465 5,954,813 4,555,810 2,839,464 4,238,465 5,954,813Covariates YES YES YES YES YES YES YES YES YES YES YES YES YES YES YES YESYear FE YES YES YES YES YES YES YES YES YES YES YES YES YES YES YES YESCourse FE YES YES YES YES YES YES YES YES YES YES YES YES YES YES YES YESGrade FE YES YES YES YES YES YES YES YES YES YES YES YES YES YES YES YESSchool FE YES YES YES YES YES YES YES YES YES YES YES YES YES YES YES YESTeacher FE YES YES YES YES YES YES YES YES YES YES YES YES YES YES YES YES
The table shows the the average impact on Portuguese and mathematics teacher scores in the years that high stake exams are in place. It is reported the Linear probability modelsin equation (2) on the different score thresholds - 1 and 2 (non-passing score), 3 (passing score), 4 (good score) and 5 (very good score). Each column corresponds to an estimationconsidering a different control group, namely the teachers scores in other courses not covered by high-stake exams - English, History and Sciences.Statistically significant at *10%, **5% and ***1%

18
Table 8: Estimation diff-diff estimation - Male VS Female Teacher 2007-2015
Score < 3 Score = 3 Score = 4 Score = 5(5th) (6th) (7th) (all) (5th) (6th) (7th) (all) (5th) (6th) (7th) (all) (5th) (6th) (7th) ( all)
Male 0.058*** 0.047*** 0.038*** 0.050*** 0.003*** -0.013*** -0.001*** -0.006*** -0.033*** -0.007*** -0.022*** -0.029*** -0.015*** -0.010*** -0.022***Teacher (0.0009) (0.0006) (0.0005) (0.0007) (0.0005) (0.0009) (0.0005) (0.0012) (0.0011) (0.0012) (0.0014) (0.0015) (0.0011) (0.0001) (0.0002) (0.0007)Female 0.054*** 0.043*** 0.032*** 0.044*** 0.010*** -0.005*** 0.008*** 0.001*** -0.034*** -0.011*** -0.024*** -0.029*** -0.015*** -0.010*** -0.022***Teacher (0.001) (0.0005) (0.0002) (0.0003) (0.0011) (0.0008) (0.0004) (0.0013) (0.0009) (0.0008) (0.0004) (0.0015) (0.0007) (0.0002) (0.0003) (0.0011)F − test 2.33 1.97 2.85* 2.89* 2.46 2.41 3.34** 2.90 *** 0.62 1.5 0.82 0.47 0.22 0.01 0.22 0.21differenceObs. 4,555,810 2,839,464 4,238,465 5,954,813 4,555,810 2,839,464 4,238,465 5,954,813 4,555,810 2,839,464 4,238,465 5,954,813 4,555,810 2,839,464 4,238,465 5,954,813Covariates YES YES YES YES YES YES YES YES YES YES YES YES YES YES YES YESYear FE YES YES YES YES YES YES YES YES YES YES YES YES YES YES YES YESCourse FE YES YES YES YES YES YES YES YES YES YES YES YES YES YES YES YESGrade FE YES YES YES YES YES YES YES YES YES YES YES YES YES YES YES YESSchool FE YES YES YES YES YES YES YES YES YES YES YES YES YES YES YES YESTeacher FE YES YES YES YES YES YES YES YES YES YES YES YES YES YES YES YES
The table shows the the average impact on Portuguese and mathematics teacher scores in the years that high stake exams are in place. It is reported the Linear probability modelsin equation (2) on the different score thresholds - 1 and 2 (non-passing score), 3 (passing score), 4 (good score) and 5 (very good score). Each column corresponds to an estimationconsidering a different control group, namely the teachers scores in other courses not covered by high-stake exams - English, History and Sciences.Statistically significant at *10%, **5% and ***1%
19
Table 9: Estimation diff-diff estimation - Overlaping VS Non-overlaping teacher 2007-2015
Score < 3 Score = 3 Score = 4 Score = 5(5th) (6th) (7th) (all) (5th) (6th) (7th) (all) (5th) (6th) (7th) (all) (5th) (6th) (7th) ( all)
No overlapping 0,032*** 0,024*** 0,005*** 0,010*** 0,003*** 0,022*** 0,004*** 0,015*** -0,029*** -0,021*** 0,004*** -0,005*** -0,037*** -0,025*** -0,013*** -0,021***teacher (0.0006) (0.0007) (0.0008) (0.0002) (0.0013) (0.0006) (0.0005) (0.0011) (0.0011) (0.0007) (0.0005) (0.0012) (0.0011) (0.0004) (0.0005) (0.0014)Overlapping 0,059*** 0,049*** 0,048*** 0,056*** -0,002*** -0,021*** -0,021*** -0,005*** -0,034*** -0,019*** -0,017*** -0,030*** -0,023*** -0,010*** -0,009*** -0,021***teacher (0.0008) (0.0009) (0.0011) (0.0005) (0.0012) (0.0008) (0.0006) (0.0013) (0.0015) (0.0004) (0.0008) (0.0010) (0.0010) (0.0005) (0.0008) (0.0009)F − test 20,3*** 18,49*** 2,95* 11,45*** 16,55*** 19,69*** 1,27 11,77*** 29,68*** 12,57*** 12,46*** 3,17*** 33,65*** 10,72*** 15,72*** 0,97differenceObs. 4,555,810 2,839,464 4,238,465 5,954,813 4,555,810 2,839,464 4,238,465 5,954,813 4,555,810 2,839,464 4,238,465 5,954,813 4,555,810 2,839,464 4,238,465 5,954,813Covariates YES YES YES YES YES YES YES YES YES YES YES YES YES YES YES YESYear FE YES YES YES YES YES YES YES YES YES YES YES YES YES YES YES YESCourse FE YES YES YES YES YES YES YES YES YES YES YES YES YES YES YES YESGrade FE YES YES YES YES YES YES YES YES YES YES YES YES YES YES YES YESSchool FE YES YES YES YES YES YES YES YES YES YES YES YES YES YES YES YESTeacher FE YES YES YES YES YES YES YES YES YES YES YES YES YES YES YES YES
The table shows the the average impact on Portuguese and mathematics teacher scores in the years that high stake exams are in place. It is reported the Linear probability modelsin equation (2) on the different score thresholds - 1 and 2 (non-passing score), 3 (passing score), 4 (good score) and 5 (very good score). Each column corresponds to an estimationconsidering a different control group, namely the teachers scores in other courses not covered by high-stake exams - English, History and Sciences.Statistically significant at *10%, **5% and ***1%
7 Appendix
7.1 Appendix 1
Figure 4: Teacher score evolution in Portuguese and Mathematics 6th grade
The courses covered by national exams are in full line while the ones without externalevaluation mechanisms are presented in dashed lines.Vertical lines frame the years
during which high-stake exams were in place.
20

21
7.2 Appendix 2
Table 10: Estimation diff-diff estimation
Score < 3 Score = 3 Score = 4 Score = 5(5th) (6th) (7th) (all) (5th) (6th) (7th) (all) (5th) (6th) (7th) (all) (5th) (6th) (7th) ( all)
β3 0.042*** 0.042*** 0.048*** 0.046*** -0.006*** -0.009*** -0.007*** -0.006*** -0.018*** -0.017*** -0.021*** -0.019*** -0.019*** -0.016*** -0.019*** -0.021***(0.0006) (0.0007) (0.0007) (0.0006) (0.0009) (0.0009) (0.0009) (0.0008) (0.0008) (0.0008) (0.0007) (0.0007) (0.0005) (0.0006) (0.0005) (0.0005)
Obs. 7,100,725 4,486,612 7,174,747 9,788,860 7,100,725 4,486,612 7,174,747 9,788,860 7,100,725 4,486,612 7,174,747 9,788,860 7,100,725 4,486,612 7,174,747 9,788,860R-squared 0.023 0.031 0.021 0.019 0.023 0.031 0.021 0.019 0.007 0.006 0.004 0.006 0.005 0.007 0.006 0.006Covariates NO NO NO NO NO NO NO NO NO NO NO NO NO NO NO NOYear FE YES YES YES YES YES YES YES YES YES YES YES YES YES YES YES YESCourse FE YES YES YES YES YES YES YES YES YES YES YES YES YES YES YES YESGrade FE YES YES YES YES YES YES YES YES YES YES YES YES YES YES YES YESSchool FE NO NO NO NO NO NO NO NO NO NO NO NO NO NO NO NOTeacher FE YNO NO NO NO NO NO NO NO NO NO NO NO NO NO NO NO
The table shows the the average impact on Portuguese and mathematics teacher scores in the years that high stake exams are in place. It is reported the Linear probability modelsin equation () on the different score thresholds - 1 and 2 (non-passing score), 3 (passing score), 4 (good score) and 5 (very good score). Each column corresponds to an estimationconsidering a different control group, namely the teachers scores in other courses not covered by high-stake exams - English, History and Sciences.Statistically significant at *10%, **5% and ***1%

22
Table 11: Estimation diff-diff estimation - Restricted for the period 2007-2015
Score < 3 Score = 3 Score = 4 Score = 5(5th) (6th) (7th) (all) (5th) (6th) (7th) (all) (5th) (6th) (7th) (all) (5th) (6th) (7th) ( all)
β3 0.045*** 0.046*** 0.055*** 0.051*** 0.001 -0.003*** -0.008*** -0.003*** -0.023*** -0.023*** -0.024*** -0.024*** -0.023*** -0.020*** -0.023*** -0.024***(0.0008) (0.0008) (0.0008) (0.0007) (0.0010) (0.0011) (0.0010) (0.0010) (0.0009) (0.0010) (0.0009) (0.0008) (0.0006) (0.0007) (0.0006) (0.0006)
Obs. 5,198,496 3,281,792 5,205,749 7,122,453 5,198,496 3,281,792 5,205,749 7,122,453 5,198,496 3,281,792 5,205,749 7,122,453 5,198,496 3,281,792 5,205,749 7,122,453R-squared 0.021 0.028 0.019 0.017 0.005 0.005 0.004 0.005 0.005 0.005 0.003 0.005 0.006 0.008 0.006 0.006Covariates NO NO NO NO NO NO NO NO NO NO NO NO NO NO NO NOYear FE YES YES YES YES YES YES YES YES YES YES YES YES YES YES YES YESCourse FE YES YES YES YES YES YES YES YES YES YES YES YES YES YES YES YESGrade FE YES YES YES YES YES YES YES YES YES YES YES YES YES YES YES YESSchool FE NO NO NO NO NO NO NO NO NO NO NO NO NO NO NO NOTeacher FE YNO NO NO NO NO NO NO NO NO NO NO NO NO NO NO NO
The table shows the the average impact on Portuguese and mathematics teacher scores in the years that high stake exams are in place. It is reported the Linear probability modelsin equation () on the different score thresholds - 1 and 2 (non-passing score), 3 (passing score), 4 (good score) and 5 (very good score). Each column corresponds to an estimationconsidering a different control group, namely the teachers scores in other courses not covered by high-stake exams - English, History and Sciences.Statistically significant at *10%, **5% and ***1%

23
Table 12: Estimation diff-diff estimation - Student Fixed effect
Score < 3 Score = 3 Score = 4 Score = 5(5th) (6th) (7th) (all) (5th) (6th) (7th) (all) (5th) (6th) (7th) (all) (5th) (6th) (7th) ( all)
β3 0.0356*** 0.040*** 0.043*** 0.041*** 0*** -0.005*** -0.009*** -0.004*** -0.019*** -0.019*** -0.018*** -0.017*** -0.017*** -0.016*** -0.016*** -0.019***(0.0006) (0.0006) (0.0006) (0.0006) (0.0009) (0.0008) (0.001) (0.0008) (0.0008) (0.0008) (0.0008) (0.0007) (0.0005) (0.0005) (0.0005) (0.0004)
Obs. 5591273 3635662 5745473 7701084 5591273 3635662 5745473 7701084 5591273 3635662 5745473 7701084 5591273 3635662 5745473 7701084R-squared 0,45 0,49 0,43 0,4 0,44 0,48 0,41 0,39 0,43 0,48 0,41 0,39 0,62 0,66 0,59 0,58Covariates NO NO NO NO NO NO NO NO NO NO NO NO NO NO NO NOYear FE YES YES YES YES YES YES YES YES YES YES YES YES YES YES YES YESCourse FE YES YES YES YES YES YES YES YES YES YES YES YES YES YES YES YESGrade FE YES YES YES YES YES YES YES YES YES YES YES YES YES YES YES YESSchool FE NO NO NO NO NO NO NO NO NO NO NO NO NO NO NO NOTeacher FE NO NO NO NO NO NO NO NO NO NO NO NO NO NO NO NO
The table shows the the average impact on Portuguese and mathematics teacher scores in the years that high stake exams are in place. It is reported the Linear probability modelsin equation () on the different score thresholds - 1 and 2 (non-passing score), 3 (passing score), 4 (good score) and 5 (very good score). Each column corresponds to an estimationconsidering a different control group, namely the teachers scores in other courses not covered by high-stake exams - English, History and Sciences.Statistically significant at *10%, **5% and ***1%
24
7.3 Appendix 3
Table 13: Estimation diff-diff estimation - Placebo 1- Restricted for the period 2007-2015
Score < 3 Score = 3 Score = 4 Score = 5(5th) (6th) (7th) (all) (5th) (6th) (7th) (all) (5th) (6th) (7th) (all) (5th) (6th) (7th) ( all)
β3 0.003*** -0.009*** -0.011*** -0.003*** -0.013*** -0.012*** 0.003*** -0.003*** 0.006*** 0.011*** 0.002* 0.002** 0.005*** 0.010*** 0.006*** 0.005***(0.0008) (0.0008) (0.0008) (0.0007) (0.0010) (0.0011) (0.0010) (0.0010) (0.0009) (0.0010) (0.0009) (0.0008) (0.0006) (0.0007) (0.0006) (0.0006)
Obs. 5,198,496 3,281,792 5,205,749 7,122,453 5,198,496 3,281,792 5,205,749 7,122,453 5,198,496 3,281,792 5,205,749 7,122,453 5,198,496 3,281,792 5,205,749 7,122,453R-squared 0.021 0.028 0.019 0.017 0.005 0.005 0.004 0.005 0.005 0.005 0.003 0.005 0.006 0.008 0.006 0.006Covariates NO NO NO NO NO NO NO NO NO NO NO NO NO NO NO NOYear FE YES YES YES YES YES YES YES YES YES YES YES YES YES YES YES YESCourse FE YES YES YES YES YES YES YES YES YES YES YES YES YES YES YES YESGrade FE YES YES YES YES YES YES YES YES YES YES YES YES YES YES YES YESSchool FE NO NO NO NO NO NO NO NO NO NO NO NO NO NO NO NOTeacher FE YNO NO NO NO NO NO NO NO NO NO NO NO NO NO NO NO
The table shows the the average impact on Portuguese and mathematics teacher scores in the years that high stake exams are in place. It is reported the Linear probability modelsin equation () on the different score thresholds - 1 and 2 (non-passing score), 3 (passing score), 4 (good score) and 5 (very good score). Each column corresponds to an estimationconsidering a different control group, namely the teachers scores in other courses not covered by high-stake exams - English, History and Sciences.Statistically significant at *10%, **5% and ***1%
24

25
Table 14: Estimation diff-diff estimation - Placebo 1
Score < 3 Score = 3 Score = 4 Score = 5(5th) (6th) (7th) (all) (5th) (6th) (7th) (all) (5th) (6th) (7th) (all) (5th) (6th) (7th) ( all)
β3 -0.000 -0.019*** -0.026*** -0.013*** 0.0013 -0.008*** -0.0178*** -0.0125*** 0.00129 0.0120*** 0.0180*** 0.008*** -0.000 0.009*** 0.021*** 0.013***(0.0009) (0.0010) (0.0009) (0.0009) (0.0009) (0.0016) (0.0014) (0.0013) (0.0008) (0.0015) (0.0013) (0.0012) (0.0009) (0.0010) (0.0009) (0.0008)
Obs. 5,590,847 2,965,700 5,852,539 8,477,756 5,468,582 2,882,709 5,362,444 7,948,385 5,468,582 2,882,709 5,362,444 7,948,385 5,468,582 2,882,709 5,362,444 7,948,385R-squared 0.178 0.169 0.178 0.180 0.174 0.172 0.142 0.149 0.174 0.107 0.113 0.113 0.174 0.292 0.265 0.272Covariates YES YES YES YES YES YES YES YES YES YES YES YES YES YES YES YESYear FE YES YES YES YES YES YES YES YES YES YES YES YES YES YES YES YESCourse FE YES YES YES YES YES YES YES YES YES YES YES YES YES YES YES YESGrade FE YES YES YES YES YES YES YES YES YES YES YES YES YES YES YES YESSchool FE YES YES YES YES YES YES YES YES YES YES YES YES YES YES YES YESTeacher FE YES YES YES YES YES YES YES YES YES YES YES YES YES YES YES YES
The table shows the the average impact on Portuguese and mathematics teacher scores in the years that high stake exams are in place. It is reported the Linear probability modelsin equation (1) on the different score thresholds - 1 and 2 (non-passing score), 3 (passing score), 4 (good score) and 5 (very good score). Each column corresponds to an estimationconsidering a different control group, namely the teachers scores in other courses not covered by high-stake exams - English, History and Sciences.Statistically significant at *10%, **5% and ***1%
26
Table 15: Estimation diff-diff estimation - Placebo 2 - Restricted for the period 2007-2015
Score < 3 Score = 3 Score = 4 Score = 5(5th) (6th) (7th) (all) (5th) (6th) (7th) (all) (5th) (6th) (7th) (all) (5th) (6th) (7th) ( all)
β3 -0.0011 -0.0063*** -0.0061*** -0.0029*** 0.000 0.0033* 0.007*** 0.004** -0.0013 -0.0004 -0.0032** -0.0027** 0.0024** 0.0034*** 0.0019** 0.0019**(0.0011) (0.0013) (0.0012) (0.0011) (0.0016) (0.0018) (0.0016) (0.0015) (0.0014) (0.0016) (0.0013) (0.0013) (0.00101) (0.0012) (0.0009) (0.0009)
Obs. 5,037,127 2,541,755 5,030,657 7,526,029 5,037,127 2,541,755 5,030,657 7,526,029 5,037,127 2,541,755 5,030,657 7,526,029 5,037,127 2,541,755 5,030,657 7,526,029R-squared 0.001 0.003 0.007 0.006 0.002 0.001 0.001 0.002 0.002 0.002 0.003 0.004 0.001 0.002 0.005 0.004Covariates NO NO NO NO NO NO NO NO NO NO NO NO NO NO NO NOYear FE YES YES YES YES YES YES YES YES YES YES YES YES YES YES YES YESCourse FE YES YES YES YES YES YES YES YES YES YES YES YES YES YES YES YESGrade FE YES YES YES YES YES YES YES YES YES YES YES YES YES YES YES YESSchool FE NO NO NO NO NO NO NO NO NO NO NO NO NO NO NO NOTeacher FE YNO NO NO NO NO NO NO NO NO NO NO NO NO NO NO NO
The table shows the the average impact on Portuguese and mathematics teacher scores in the years that high stake exams are in place. It is reported the Linear probability modelsin equation (1) on the different score thresholds - 1 and 2 (non-passing score), 3 (passing score), 4 (good score) and 5 (very good score). Each column corresponds to an estimationconsidering a different control group, namely the teachers scores in other courses not covered by high-stake exams - English, History and Sciences.Statistically significant at *10%, **5% and ***1%
27
Table 16: Estimation diff-diff estimation - Placebo 2
Score < 3 Score = 3 Score = 4 Score = 5(5th) (6th) (7th) (all) (5th) (6th) (7th) (all) (5th) (6th) (7th) (all) (5th) (6th) (7th) ( all)
β3 -0.005*** -0.009*** -0.003** -0.003*** -0.005*** 0.005** 0.002 0.009*** -0.005*** -0.001 -0.006*** -0.002 -0.005*** 0.005*** 0.007*** -0.004***(0.0011) (0.0014) (0.0013) (0.0011) (0.0012) (0.0021) (0.0019) (0.0017) (0.0012) (0.0019) (0.0017) (0.0015) (0.0012) (0.0013) (0.0012) (0.0010)
Obs. 4,338,611 2,144,747 3,834,546 6,028,409 4,338,611 2,144,747 3,834,546 6,028,409 4,338,611 2,144,747 3,834,546 6,028,409 4,338,611 2,144,747 3,834,546 6,028,409R-squared 0.172 0.165 0.171 0.173 0.172 0.165 0.139 0.146 0.172 0.102 0.108 0.107 0.172 0.289 0.264 0.272Covariates YES YES YES YES YES YES YES YES YES YES YES YES YES YES YES YESYear FE YES YES YES YES YES YES YES YES YES YES YES YES YES YES YES YESCourse FE YES YES YES YES YES YES YES YES YES YES YES YES YES YES YES YESGrade FE YES YES YES YES YES YES YES YES YES YES YES YES YES YES YES YESSchool FE YES YES YES YES YES YES YES YES YES YES YES YES YES YES YES YESTeacher FE YES YES YES YES YES YES YES YES YES YES YES YES YES YES YES YES
The table shows the the average impact on Portuguese and mathematics teacher scores in the years that high stake exams are in place. It is reported the Linear probability modelsin equation (1) on the different score thresholds - 1 and 2 (non-passing score), 3 (passing score), 4 (good score) and 5 (very good score). Each column corresponds to an estimationconsidering a different control group, namely the teachers scores in other courses not covered by high-stake exams - English, History and Sciences.Statistically significant at *10%, **5% and ***1%
28
Table 17: Estimation diff-diff estimation - Placebo 3 - Restricted for the period 2007-2015
Score < 3 Score = 3 Score = 4 Score = 5(5th) (6th) (7th) (all) (5th) (6th) (7th) (all) (5th) (6th) (7th) (all) (5th) (6th) (7th) ( all)
β3 0.005*** 0.003** 0.008*** 0.007*** -0.001 -0.003* -0.006*** -0.004** -0.003** 0.002 0.000 -0.002* -0.001 -0.002 -0.002** -0.001(0.0011) (0.0013) (0.0012) (0.0011) (0.0016) (0.0018) (0.0016) (0.0015) (0.0014) (0.0016) (0.0013) (0.0013) (0.0010) (0.0012) (0.0010) (0.000)
Obs. 5,037,127 2,541,755 5,030,657 7,526,029 5,037,127 2,541,755 5,030,657 7,526,029 5,037,127 2,541,755 5,030,657 7,526,029 5,037,127 2,541,755 5,030,657 7,526,029R-squared 0.001 0.003 0.007 0.006 0.002 0.001 0.001 0.002 0.002 0.002 0.003 0.004 0.001 0.002 0.005 0.004Covariates NO NO NO NO NO NO NO NO NO NO NO NO NO NO NO NOYear FE YES YES YES YES YES YES YES YES YES YES YES YES YES YES YES YESCourse FE YES YES YES YES YES YES YES YES YES YES YES YES YES YES YES YESGrade FE YES YES YES YES YES YES YES YES YES YES YES YES YES YES YES YESSchool FE NO NO NO NO NO NO NO NO NO NO NO NO NO NO NO NOTeacher FE YNO NO NO NO NO NO NO NO NO NO NO NO NO NO NO NO
The table shows the the average impact on Portuguese and mathematics teacher scores in the years that high stake exams are in place. It is reported the Linear probability modelsin equation (1) on the different score thresholds - 1 and 2 (non-passing score), 3 (passing score), 4 (good score) and 5 (very good score). Each column corresponds to an estimationconsidering a different control group, namely the teachers scores in other courses not covered by high-stake exams - English, History and Sciences.Statistically significant at *10%, **5% and ***1%

29
Table 18: Estimation diff-diff estimation - Placebo 3
Score < 3 Score = 3 Score = 4 Score = 5(5th) (6th) (7th) (all) (5th) (6th) (7th) (all) (5th) (6th) (7th) (all) (5th) (6th) (7th) ( all)
β3 0.011*** 0.008*** 0.011*** 0.013*** -0.006*** 0.004* 0.003 0.002 -0.006*** -0.001 0.001*** 0.013*** -0.006*** -0.004*** -0.005*** -0.006***(0.0012) (0.0014) (0.0014) (0.0012) (0.0012) (0.0021) (0.0019) (0.0018) (0.0012) (0.0020) (0.0018) (0.0016) (0.0012) (0.0014) (0.0012) (0.0011)
Obs. 4,338,611 2,144,747 3,834,546 6,028,409 4,338,611 2,144,747 3,834,546 6,028,409 4,338,611 2,144,747 3,834,546 6,028,409 4,338,611 2,144,747 3,834,546 6,028,409R-squared 0.172 0.165 0.171 0.173 0.172 0.165 0.139 0.146 0.172 0.102 0.108 0.107 0.172 0.289 0.264 0.272Covariates YES YES YES YES YES YES YES YES YES YES YES YES YES YES YES YESYear FE YES YES YES YES YES YES YES YES YES YES YES YES YES YES YES YESCourse FE YES YES YES YES YES YES YES YES YES YES YES YES YES YES YES YESGrade FE YES YES YES YES YES YES YES YES YES YES YES YES YES YES YES YESSchool FE YES YES YES YES YES YES YES YES YES YES YES YES YES YES YES YESTeacher FE YES YES YES YES YES YES YES YES YES YES YES YES YES YES YES YES
The table shows the the average impact on Portuguese and mathematics teacher scores in the years that high stake exams are in place. It is reported the Linear probability modelsin equation (1) on the different score thresholds - 1 and 2 (non-passing score), 3 (passing score), 4 (good score) and 5 (very good score). Each column corresponds to an estimationconsidering a different control group, namely the teachers scores in other courses not covered by high-stake exams - English, History and Sciences.Statistically significant at *10%, **5% and ***1%
30
Table 19: Estimation diff-diff estimation - Placebo 4 - Restricted for the period 2007-2015
Score < 3 Score = 3 Score = 4 Score = 5(5th) (6th) (7th) (all) (5th) (6th) (7th) (all) (5th) (6th) (7th) (all) (5th) (6th) (7th) ( all)
β3 -0.004*** 0.004*** -0.002* -0.004*** 0.001 -0.000 -0.001 0.000 0.004*** -0.0013 0.003** 0.005*** -0.002** -0.001 0.000 -0.000(0.0011) (0.0013) (0.0012) (0.0011) (0.0016) (0.0018) (0.0016) (0.0015) (0.0013) (0.0015) (0.0013) (0.001300) (0.0010) (0.0012) (0.0009) (0.0009)
Obs. 5,136,246 2,581,522 5,117,713 7,672,437 5,136,246 2,581,522 5,117,713 7,672,437 5,136,246 2,581,522 5,117,713 7,672,437 5,136,246 2,581,522 5,117,713 7,672,437R-squared 0.001 0.002 0.007 0.006 0.002 0.001 0.001 0.002 0.002 0.001 0.003 0.004 0.001 0.002 0.005 0.004Covariates NO NO NO NO NO NO NO NO NO NO NO NO NO NO NO NOYear FE YES YES YES YES YES YES YES YES YES YES YES YES YES YES YES YESCourse FE YES YES YES YES YES YES YES YES YES YES YES YES YES YES YES YESGrade FE YES YES YES YES YES YES YES YES YES YES YES YES YES YES YES YESSchool FE NO NO NO NO NO NO NO NO NO NO NO NO NO NO NO NOTeacher FE YNO NO NO NO NO NO NO NO NO NO NO NO NO NO NO NO
The table shows the the average impact on Portuguese and mathematics teacher scores in the years that high stake exams are in place. It is reported the Linear probability modelsin equation (1) on the different score thresholds - 1 and 2 (non-passing score), 3 (passing score), 4 (good score) and 5 (very good score). Each column corresponds to an estimationconsidering a different control group, namely the teachers scores in other courses not covered by high-stake exams - English, History and Sciences.Statistically significant at *10%, **5% and ***1%
31
Table 20: Estimation diff-diff estimation - Placebo 4
Score < 3 Score = 3 Score = 4 Score = 5(5th) (6th) (7th) (all) (5th) (6th) (7th) (all) (5th) (6th) (7th) (all) (5th) (6th) (7th) ( all)
β3 -0.006*** 0.001 -0.007*** -0.009*** -0.006*** 0.004* 0.003 0.002 -0.006*** -0.001 0.010*** 0.013*** -0.0056*** -0.0043*** -0.0059*** -0.0055***(0.0012) (0.0014) (0.0013) (0.0012) (0.0012) (0.0021) (0.0019) (0.0018) (0.0012) (0.0019) (0.0018) (0.0016) (0.0012) (0.0014) (0.0012) (0.0011)
Obs. 4,338,611 2,144,747 3,834,546 6,028,409 4,338,611 2,144,747 3,834,546 6,028,409 4,338,611 2,144,747 3,834,546 6,028,409 4,338,611 2,144,747 3,834,546 6,028,409R-squared 0.172 0.165 0.171 0.173 0.172 0.165 0.139 0.146 0.172 0.102 0.108 0.107 0.172 0.289 0.264 0.272Covariates YES YES YES YES YES YES YES YES YES YES YES YES YES YES YES YESYear FE YES YES YES YES YES YES YES YES YES YES YES YES YES YES YES YESCourse FE YES YES YES YES YES YES YES YES YES YES YES YES YES YES YES YESGrade FE YES YES YES YES YES YES YES YES YES YES YES YES YES YES YES YESSchool FE YES YES YES YES YES YES YES YES YES YES YES YES YES YES YES YESTeacher FE YES YES YES YES YES YES YES YES YES YES YES YES YES YES YES YES
The table shows the the average impact on Portuguese and mathematics teacher scores in the years that high stake exams are in place. It is reported the Linear probability models inequation (1) on the different score thresholds - 1 and 2 (non-passing score), 3 (passing score), 4 (good score) and 5 (very good score). Each column corresponds to an estimation consideringa different control group, namely the teachers scores in other courses not covered by high-stake exams - English, History and Sciences.Statistically significant at *10%, **5% and ***1%
Bibliography
Ghazala Azmat and Nagore Iriberri. The Provision of Relative Performance Feedback:
An Analysis of Performance and Satisfaction. Journal of Economics and Management
Strategy, 25(1), 2016. ISSN 15309134. doi: 10.1111/jems.12151.
Annika B. Bergbauer, Eric A. Hanushek, and Ludger Woessmann. Testing. NBER
Working Paper No. 24836. National Bureau of Economic Research, 2018.
Matteo Bobba and Veronica Frisancho. Learning About Oneself: The Effects of Signaling
Ability on School Choice. Working Paper, (October), 2016.
Fernando Botelho, Ricardo A. Madeira, and Marcos A. Rangel. Racial Discrimination
in Grading: Evidence from Brazil. American Economic Journal: Applied Economics,
7(4), 2015. ISSN 19457790. doi: 10.1257/app.20140352.
Simon Burgess and Ellen Greaves. Test scores, subjective assessment, and stereotyping of
ethnic minorities. Journal of Labor Economics, 31(3):535–576, 2013. ISSN 0734306X.
doi: 10.1086/669340.
Simon Burgess, Deborah Wilson, and Jack Worth. A natural experiment in school ac-
countability: The impact of school performance information on pupil progress. Journal
of Public Economics, 106, 2013. ISSN 00472727. doi: 10.1016/j.jpubeco.2013.06.005.
Caterina Calsamiglia and Annalisa Loviglio. Grading on a curve: When having good
peers is not good. Economics of Education Review, 73, 2019. ISSN 02727757. doi:
10.1016/j.econedurev.2019.101916.
Jose Miguel Cerdeira, Luis Catela Nunes, Ana Balcao Reis, and Carmo Seabra. Predic-
tors of student success in Higher Education: Secondary school internal scores versus
national exams. Higher Education Quarterly, 72(4):304–313, 2018. ISSN 14682273.
doi: 10.1111/hequ.12158.
Christopher Cornwell, David B. Mustard, and Jessica Van Parys. Noncognitive skills and
the gender disparities in test scores and teacher assessments: Evidence from primary
school. Journal of Human Resources, 48(1):236–264, 2013. ISSN 0022166X. doi:
10.3368/jhr.48.1.236.
Rebecca Diamond and Petra Persson. The Long-term Consequences of Teacher Discre-
tion in Grading of High-stakes Tests. National Bureau of Economic Research Working
Paper Series, No. 22207, 2016. doi: 10.3386/w22207. URL http://www.nber.org/
papers/w22207.
32
David Figlio and Susanna Loeb. Chapter 8 School Accountability. In Handbook of the
Economics of Education, volume 3. 2011.
Brian A. Jacob and Lars Lefgren. Remedial education and student achievement: A
regression-discontinuity analysis. Review of Economics and Statistics, 86(1):226–244,
2004. ISSN 00346535. doi: 10.1162/003465304323023778.
Daniel Koretz. The Testing Charade. 2019. doi: 10.7208/chicago/9780226408859.001.
0001.
Victor Lavy. Do gender stereotypes reduce girls’ or boys’ human capital outcomes?
Evidence from a natural experiment. Journal of Public Economics, 92(10-11):2083–
2105, 2008. ISSN 00472727. doi: 10.1016/j.jpubeco.2008.02.009.
Victor Lavy and Edith Sand. On the origins of gender gaps in human capital: Short-
and long-term consequences of teachers’ biases. Journal of Public Economics, 2018.
ISSN 00472727. doi: 10.1016/j.jpubeco.2018.09.007.
Luis C. Nunes, Ana Balcao Reis, and Carmo Seabra. The publication of school rankings:
A step toward increased accountability? Economics of Education Review, 49:15–23,
2015. ISSN 02727757. doi: 10.1016/j.econedurev.2015.07.008.
Sheetal Sekhri. Prestige matters: Wage premium and value addition in elite colleges.
American Economic Journal: Applied Economics, 12(3), 2020. ISSN 19457790. doi:
10.1257/app.20140105.
Steven L. Wise and Christine E. DeMars. Examinee noneffort and the validity of program
assessment results. Educational Assessment, 15(1), 2010. ISSN 10627197. doi: 10.
1080/10627191003673216.
Gema Zamarro, Collin Hitt, and Ildefonso Mendez. When Students Don’t Care: Re-
examining International Differences in Achievement and Non-Cognitive Skills. SSRN
Electronic Journal, 2018. ISSN 1932-8575. doi: 10.2139/ssrn.2857243.
33
Related Documents