High-Content, High-Throughput Screening for the Identification of Cytotoxic Compounds Based on Cell Morphology and Cell Proliferation Markers Heather L. Martin 1,2 , Matthew Adams 1 , Julie Higgins 1 , Jacquelyn Bond 1,3 , Ewan E. Morrison 1,3 , Sandra M. Bell 1,3 , Stuart Warriner 2,4 , Adam Nelson 2,4 , Darren C. Tomlinson 1,3,4 * 1 BioScreening Technology Group, Leeds Institutes of Molecular Medicine, University of Leeds, Leeds, United Kingdom, 2 School of Chemistry, University of Leeds, Leeds, United Kingdom, 3 Section of Ophthalmology and Neuroscience, Leeds Institutes of Molecular Medicine, University of Leeds, Leeds, United Kingdom, 4 Astbury Centre for Structural Molecular Biology, University of Leeds, Leeds, United Kingdom Abstract Toxicity is a major cause of failure in drug discovery and development, and whilst robust toxicological testing occurs, efficiency could be improved if compounds with cytotoxic characteristics were identified during primary compound screening. The use of high-content imaging in primary screening is becoming more widespread, and by utilising phenotypic approaches it should be possible to incorporate cytotoxicity counter-screens into primary screens. Here we present a novel phenotypic assay that can be used as a counter-screen to identify compounds with adverse cellular effects. This assay has been developed using U2OS cells, the PerkinElmer Operetta high-content/high-throughput imaging system and Columbus image analysis software. In Columbus, algorithms were devised to identify changes in nuclear morphology, cell shape and proliferation using DAPI, TOTO-3 and phosphohistone H3 staining, respectively. The algorithms were developed and tested on cells treated with doxorubicin, taxol and nocodazole. The assay was then used to screen a novel, chemical library, rich in natural product-like molecules of over 300 compounds, 13.6% of which were identified as having adverse cellular effects. This assay provides a relatively cheap and rapid approach for identifying compounds with adverse cellular effects during screening assays, potentially reducing compound rejection due to toxicity in subsequent in vitro and in vivo assays. Citation: Martin HL, Adams M, Higgins J, Bond J, Morrison EE, et al. (2014) High-Content, High-Throughput Screening for the Identification of Cytotoxic Compounds Based on Cell Morphology and Cell Proliferation Markers. PLoS ONE 9(2): e88338. doi:10.1371/journal.pone.0088338 Editor: Maria A. Deli, Biological Research Centre of the Hungarian Academy of Sciences, Hungary Received September 9, 2013; Accepted January 11, 2014; Published February 5, 2014 Copyright: ß 2014 Martin et al. This is an open-access article distributed under the terms of the Creative Commons Attribution License, which permits unrestricted use, distribution, and reproduction in any medium, provided the original author and source are credited. Funding: This study was supported by The Engineering and Physical Sciences Research Council (www.epsrc.ac.uk) EP/F043503/1 and The Biomedical Health Research Centre at Leeds www.bhrc.ac.uk). The funders had no role in study design, data collection and analysis, decision to publish, or preparation of the manuscript. Competing Interests: The authors have declared that no competing interests exist. * E-mail: [email protected] Introduction Drug discovery and development is a multi-billion dollar industry in which the cost of failure for potential new drugs increases with their progression towards the clinic [1]. In this process, primary screening identifies potential lead compounds from large libraries of chemical compounds, the majority of which subsequent fail because of adverse effects – predominantly toxicity. Whilst the costs of primary screening have reduced in the last two decades as automation and high-throughput technologies advance, toxicity testing is still an expensive process despite of the use of in vitro cytotoxicity assays prior to in vivo testing [2]. Cytotoxicity is not the only adverse effect that causes compound failure as poor biopharmaceutical properties such as solubility and stability also contribute [1], but cytotoxicity is more difficult to predict. If identification of compounds with potentially adverse cellular effects could be combined with lead identification in a single assay this could reduce the subsequent drug failure rate and possibly the cost of drug discovery [3]. With the development of high-content, high-throughput imaging platforms with the ability to measure a variety of complex phenotypes, such integration is possible [4] and this technology has already been extended to explore the identification of known hepatotoxic compounds with the aim of improving in vitro identification of hepatoxins [3,5–7]. The multiplex nature of these assays means they are a secondary line of investigation for potential lead compounds to eliminate those that induce liver toxicity. However, constitutive components of these assays may be useful for identifying compounds with sub- lethal adverse cellular effects or cytotoxic tendencies during primary screening fewer of these undesirable compounds are taken forward, thus potentially reducing compound attrition and the costs associated with this. High-content/high-throughput imaging is based on the pheno- typic assessment of a variety of biological activities. It requires clearly defined outputs into which individual cells may be assigned. However, the majority of published high-content screens use only two/three of the four channels available on the majority of these imaging platforms [4,8]. One of these is normally a nuclear stain such as DAPI, Hoechst 33342 or DRAQ-5 that can be utilised to examine cytotoxicity by measuring loss of cells [4,5]. Consequently one or more imaging channels are available to assess the potential of compounds to cause undesired side-effects on the target organ, particularly sub-lethal toxicity, concurrently with lead compound identification. Such assays may also be used in screens aiming to PLOS ONE | www.plosone.org 1 February 2014 | Volume 9 | Issue 2 | e88338

Welcome message from author
This document is posted to help you gain knowledge. Please leave a comment to let me know what you think about it! Share it to your friends and learn new things together.
Transcript
High-Content, High-Throughput Screening for theIdentification of Cytotoxic Compounds Based on CellMorphology and Cell Proliferation MarkersHeather L. Martin1,2, Matthew Adams1, Julie Higgins1, Jacquelyn Bond1,3, Ewan E. Morrison1,3,
Sandra M. Bell1,3, Stuart Warriner2,4, Adam Nelson2,4, Darren C. Tomlinson1,3,4*
1 BioScreening Technology Group, Leeds Institutes of Molecular Medicine, University of Leeds, Leeds, United Kingdom, 2 School of Chemistry, University of Leeds, Leeds,
United Kingdom, 3 Section of Ophthalmology and Neuroscience, Leeds Institutes of Molecular Medicine, University of Leeds, Leeds, United Kingdom, 4 Astbury Centre for
Structural Molecular Biology, University of Leeds, Leeds, United Kingdom
Abstract
Toxicity is a major cause of failure in drug discovery and development, and whilst robust toxicological testing occurs,efficiency could be improved if compounds with cytotoxic characteristics were identified during primary compoundscreening. The use of high-content imaging in primary screening is becoming more widespread, and by utilising phenotypicapproaches it should be possible to incorporate cytotoxicity counter-screens into primary screens. Here we present a novelphenotypic assay that can be used as a counter-screen to identify compounds with adverse cellular effects. This assay hasbeen developed using U2OS cells, the PerkinElmer Operetta high-content/high-throughput imaging system and Columbusimage analysis software. In Columbus, algorithms were devised to identify changes in nuclear morphology, cell shape andproliferation using DAPI, TOTO-3 and phosphohistone H3 staining, respectively. The algorithms were developed and testedon cells treated with doxorubicin, taxol and nocodazole. The assay was then used to screen a novel, chemical library, rich innatural product-like molecules of over 300 compounds, 13.6% of which were identified as having adverse cellular effects.This assay provides a relatively cheap and rapid approach for identifying compounds with adverse cellular effects duringscreening assays, potentially reducing compound rejection due to toxicity in subsequent in vitro and in vivo assays.
Citation: Martin HL, Adams M, Higgins J, Bond J, Morrison EE, et al. (2014) High-Content, High-Throughput Screening for the Identification of CytotoxicCompounds Based on Cell Morphology and Cell Proliferation Markers. PLoS ONE 9(2): e88338. doi:10.1371/journal.pone.0088338
Editor: Maria A. Deli, Biological Research Centre of the Hungarian Academy of Sciences, Hungary
Received September 9, 2013; Accepted January 11, 2014; Published February 5, 2014
Copyright: � 2014 Martin et al. This is an open-access article distributed under the terms of the Creative Commons Attribution License, which permitsunrestricted use, distribution, and reproduction in any medium, provided the original author and source are credited.
Funding: This study was supported by The Engineering and Physical Sciences Research Council (www.epsrc.ac.uk) EP/F043503/1 and The Biomedical HealthResearch Centre at Leeds www.bhrc.ac.uk). The funders had no role in study design, data collection and analysis, decision to publish, or preparation of themanuscript.
Competing Interests: The authors have declared that no competing interests exist.
* E-mail: [email protected]
Introduction
Drug discovery and development is a multi-billion dollar
industry in which the cost of failure for potential new drugs
increases with their progression towards the clinic [1]. In this
process, primary screening identifies potential lead compounds
from large libraries of chemical compounds, the majority of which
subsequent fail because of adverse effects – predominantly toxicity.
Whilst the costs of primary screening have reduced in the last two
decades as automation and high-throughput technologies advance,
toxicity testing is still an expensive process despite of the use of in
vitro cytotoxicity assays prior to in vivo testing [2]. Cytotoxicity is
not the only adverse effect that causes compound failure as poor
biopharmaceutical properties such as solubility and stability also
contribute [1], but cytotoxicity is more difficult to predict. If
identification of compounds with potentially adverse cellular
effects could be combined with lead identification in a single
assay this could reduce the subsequent drug failure rate and
possibly the cost of drug discovery [3]. With the development of
high-content, high-throughput imaging platforms with the ability
to measure a variety of complex phenotypes, such integration is
possible [4] and this technology has already been extended to
explore the identification of known hepatotoxic compounds with
the aim of improving in vitro identification of hepatoxins [3,5–7].
The multiplex nature of these assays means they are a secondary
line of investigation for potential lead compounds to eliminate
those that induce liver toxicity. However, constitutive components
of these assays may be useful for identifying compounds with sub-
lethal adverse cellular effects or cytotoxic tendencies during
primary screening fewer of these undesirable compounds are
taken forward, thus potentially reducing compound attrition and
the costs associated with this.
High-content/high-throughput imaging is based on the pheno-
typic assessment of a variety of biological activities. It requires
clearly defined outputs into which individual cells may be assigned.
However, the majority of published high-content screens use only
two/three of the four channels available on the majority of these
imaging platforms [4,8]. One of these is normally a nuclear stain
such as DAPI, Hoechst 33342 or DRAQ-5 that can be utilised to
examine cytotoxicity by measuring loss of cells [4,5]. Consequently
one or more imaging channels are available to assess the potential
of compounds to cause undesired side-effects on the target organ,
particularly sub-lethal toxicity, concurrently with lead compound
identification. Such assays may also be used in screens aiming to
PLOS ONE | www.plosone.org 1 February 2014 | Volume 9 | Issue 2 | e88338
identify compounds from chemical libraries with the propensity to
cause toxicity.
Herein, we show the development of a novel image analysis
assay that identifies compounds with that have adverse cellular
effects, often in conjunction with cytotoxic tendencies, using a
high-content/high-throughput imaging approach. This technique
has primarily been developed to be used us as an adjunct to
targeted high-content, high-throughput primary screens to aid in
the reduction of compound attrition due to adverse effects that
become evident in subsequent testing.
Methods
Human U2OS osteosarcoma cells (ATTC, VA) were main-
tained in Dulbecco’s Modified Eagle’s Medium (DMEM; PAA
Laboratories GmbH, Pasching, Austria) supplemented with 10%
foetal bovine serum (FBS; PAA) and 100 U/mL penicillin-
streptomycin (PAA) at 37uC and 5% CO2. For screening, U2OS
cells were plated into assay plates (96 well Viewpoint plates, Perkin
Elmer, MA) at a density of 4000 cells/well in DMEM containing
10% FBS using an xrd-384 Fluid X dispenser fitted with an 8
nozzle resin dispensing cassette at 300 rpm (Fluid X Ltd, Nether
Alderley, UK). Plates were allowed to equilibrate at room
temperature in a hood for 1 hr then incubated for 24 hrs at
37uC and 5% CO2 before compound addition. Assays were
developed and validated using taxol (resuspended in DMSO to
10 mg/mL; SigmaAldrich, Poole, UK), doxorubicin hydrochlo-
ride (10 mg/mL in DMSO; SigmaAldrich) and nocodazole
(2 mg/mL in DMSO; SigmaAldrich) at a variety of concentra-
tions.
The Chemical LibraryThe screened library consisted of 329 skeletally-diverse com-
pounds not previously used in cell-based assays, arrayed as 40
compound sets in duplicate in 96 well plates at a concentration of
10 mM in DMSO. Many of the compounds were natural product-
like, and were based on highly diverse scaffolds reminiscent of
either polyketide or alkaloid natural products. The synthesis of
many of these compounds has been previously described [9–11],
including an approach to natural product-like molecules of
unprecedented scaffold diversity [11]. The library was diluted
1:100 with DMEM containing 10% FBS on the day of compound
addition and added to the plated U2OS cells at final concentration
of 20 mM and a final DMSO percentage of 0.2%. Library addition
was performed using a Bravo SRT liquid handling platform
(Agilent Technologies, Wokingham, UK). Plates were assayed 24
and 48 hrs after compound addition using immunofluorescent
staining and high-content imaging approaches as detailed below.
Compound precipitation was visually assessed on addition and at
imaging.
Immunofluorescent Staining and ImagingImmunofluorescent staining of assay plates was carried out as
follows. Media was discarded and cells rinsed in phosphate
buffered saline (PBS), before fixation in 4% paraformaldehyde
(SigmaAldrich) for 15 mins. Cells were permeabilized with 0.1%
Triton X-100 (VWR, Lutterworth, UK) in PBS for 5 mins, cells
were then rinsed in PBS and blocked in 1% milk (Marvel, Premier
Foods, St Albans, UK) for 5 mins before the addition of mouse
anti-Histone H3 (phospho S10, 1:4000; Abcam ab14955; Cam-
bridge, UK) diluted in 1% milk for 1 hr at room temperature.
Following PBS rinses, cells were incubated at room temperature
for an hour in the dark with 1% milk containing goat anti-mouse
AlexaFluor 568 (1:1000; Molecular Probes, Eugene, OR) 1 mg/
mL DAPI (Molecular Probes) and 500 nM TOTO-3 iodide
(Molecular Probes). Following a final set of PBS washes, plates
were scanned and images collected with an Operetta HTS
imaging system (PerkinElmer) at 206magnification with 12 fields
of view (5106675 mm)/well. Images were then analysed with
Columbus 2.2 (PerkinElmer).
Apoptosis and Necrosis IdentificationU2OS cells were plated and compounds added as described
above, plates were then assayed 48 hrs after compound addition
using a FITC Annexin V Apoptosis detection kit (BD Biosciences,
Oxford, UK). Briefly cells were rinsed in PBS before the addition
of 40 ml 16 binding buffer containing 2 mg/mL Hoechst, 25 mg/
mL Annexin V and 2.5 mg/mL propidium iodide and incubated
in the dark for 15 mins. A further 160 ml 16 binding buffer was
then added and plates imaged immediately with the Operetta
HTS imaging system as described above.
Statistical AnalysisDuring assay development statistical analysis (Student T-tests,
Mann-Whitney U tests and Spermann Rank correlation) was
carried out using GraphPad Prism 6.00 software (GraphPad
Software, La Jolla, CA). Assay validation was assessed by Z9-factor
calculated as follows where s is the positive control and c the
negative controls:
Z0~1{3 sszsc)ð
ms{mcjj
Z-scores were also calculated using the following formula:
Z~ Sampleð value{mcÞ=sc
with hits determined as an absolute Z-score of 2 or more, as this
correlates to a P value of 0.045, and thus statistical significance
[12,13]. False positives were defined as any DMSO-treated well in
which the absolute Z score was greater than 2 whilst false negatives
were taxol-treated wells which had an absolute Z score of less than
2 on three independent, randomly distributed test plates.
Results and Discussion
Assay DevelopmentPhenotypic assessment of the adverse effects of compounds
requires endpoints which may arise from the disruption of a
variety of biological processes. For example, alterations to cell
number can arise from the induction of apoptosis, necrosis, failure
of cells to undergo mitosis, alterations to cell adhesion molecules or
activation of oncogenic processes and increased cell division.
Subsequently we sought to develop a novel image analysis
algorithm to assess three phenotypic endpoints – cell number,
the percentage of cells with morphological abnormalities and the
percentage of cells in mitosis. As we aim to identify compounds
with adverse cellular effects at an early stage of drug discovery we
have chosen not to use cells from organs commonly affected by
toxicity as these are not robustly used in high content/high
throughput primary screens. Instead U2OS cells have been chosen
for this initial study as they form well-spaced monolayers with a
good nuclear to cytoplasmic ratio that are ideally suited to high-
content, high-throughput imaging applications and are commonly
used for primary screens [14–17]. However, the approach detailed
High-Content Identification of Cytotoxic Compounds
PLOS ONE | www.plosone.org 2 February 2014 | Volume 9 | Issue 2 | e88338
below has the potential to be applied to a wide variety of cell types,
including primary cells, as Lin et al [18] have shown only around
5% of toxic compounds demonstrate tissue specific cytotoxicity in
in vitro assays. Thus the cell type would be selected based on the
target molecule/phenotype for the compound set being tested. For
example, for a compound set targeting a specific kinase, the assay
would permit a comparison to be made between multiple cell lines,
whose dependency on that kinase is known, thus enabling off-
target cytotoxic effects to be assessed and the best lead compounds
to be selected from the set. The first component of the algorithm
was designed to assess alterations in cell number and morphology,
for which it was necessary to define the normal cell morphology of
U2OS cells. To induce morphological abnormalities and a
reduction in cell number, cells were treated with taxol (2 and
0.1 mM) [19], doxorubicin (5 ng/mL) [20] or 0.2% DMSO
(as a negative/vehicle control) for 48 hours. In agreement
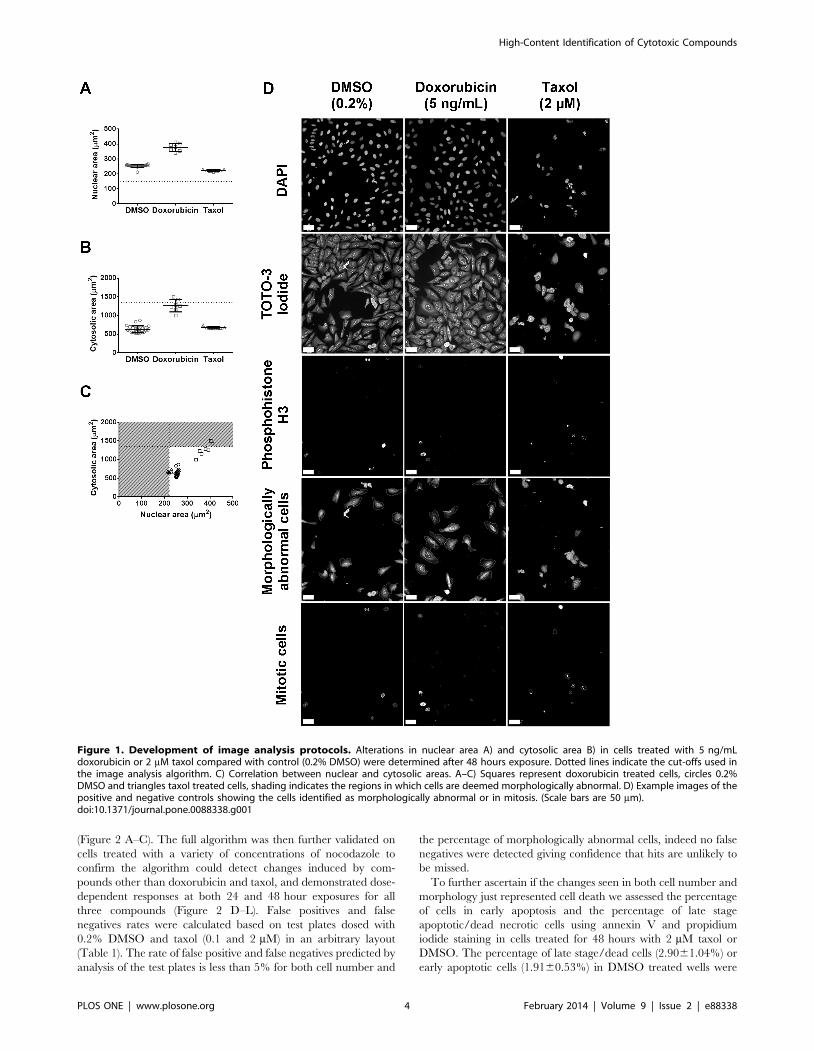
with Eom et al. [20], low dose doxorubicin increased cell size
(Figure 1 A–B), whilst both high and low dose taxol treatment
induced cell condensation and reduced cell number to differing
degrees [19]. Taxol and doxorubicin were selected as potential
positive controls, as whilst not being true cytotoxicants, they are
well-documented as having multiple cellular effects including
inhibition of cell cycle, induction of apoptosis and stabilisation of
microtubules, as well as being natural products derivatives [19–
22]. Indeed taxol (paclitaxel) was detected as having adverse effects
in the majority parameters assessed in the studies of both O’Brien
and Persson, including affecting mitochondria membrane poten-
tial [5,7]. Thus by not using pure cytotoxicants we may enhance
the algorithm’s potential to detect subtle and pre-lethal changes in
cell morphology. Using these alterations an image analysis
algorithm was created using pre-designed building blocks within
the Columbus software. Cell recognition was based on identifica-
tion of nuclei as stained with DAPI, and cytosolic extent was based
on TOTO-3 iodide staining, which was used at a sufficient
concentration to permit staining of both DNA and RNA [23] and
provided accurate identification of cell edge and discrimination
between adjacent cells in fixed cells where permeabilization has
compromised membrane integrity [24], and border objects were
excluded. This nuclear identification was used as a measure of cell
number, before extension of the algorithm to distinguish between
doxorubicin treated cells and those treated with DMSO based on
either increased cytosolic or nuclear area as determined by the
staining extent of TOTO-3-iodide and DAPI respectively (Mann
Whitney U test p,0.0001 for both cytosolic and nuclear area;
Figure 1 A–B). Cytosolic and nuclear areas correlated (Spearman
correlation p = 0.0035; Figure 1 C), meaning only one parameter
needed to be used to identify enlarged cells. Cells with a nuclear
area of less than 150 mm2 were also deemed to be abnormal. The
identification of cytotoxic compounds based on cell morphology
has been previously explored as a combined alterative to the
classical battery of in vitro cytotoxicity tests [5,7]. In these studies a
strong marker for cytotoxicity was altered nuclear morphology, in
particular nuclear size, which is in agreement with our findings
[5,7]. Both of these studies used combinatorial analysis of a variety
of endpoints to identify known hepatotoxins, such an approach is
not compatible with our aim of creating an adjunct assay to aid in
data triage and hit selection. However further analysis parameters
were required as taxol treated cells with altered morphology could
not be easily distinguished from DMSO treated cells with a size
cut-off alone and so it was necessary to add an additional
parameter. As the nuclear area (and concurrently cytosolic area) of
DMSO treated cells was similar to that of taxol treated cells
(Figure 1 A), cells with a nuclear area of between 200 and 350 mm2
were then examined to see if differences in other nuclear
morphology measures could be identified. No significant differ-
ences were identifiable (data not shown). However, even at the
lower dose of taxol significant cell death occurred (Figure 1 D) (cell
numbers were 54.6%62.4 of DMSO; Student T-test p,0.0001).
Visual examination of the images revealed that the abnormal cells
that were not being picked up were those with an increased DAPI
staining intensity. An intensity cut-off was therefore introduced at
1500 units to detect the small percentage of taxol treated cells with
abnormal morphology not picked up previously (Figure 1). These
parameters were then combined in a single image algorithm that
identifies both alterations in cell number and the percentage of
cells with abnormal morphology. Thus morphologically abnormal
cells were defined as those cells with a cytoplasmic area of greater
than 1350 mm2, a reduced nuclear area of less than 150 mm2 or
with a mean DAPI intensity of greater than 1500 units. The
reliability of these definitions was confirmed by visual inspection.
A second algorithm component was added to identify mitotic
cells, defined as those cells with a maximum nuclear phosphohis-
tone H3 intensity of greater than 1200 units (the maximum
nuclear intensity for negative control cells was 22561.8 units).
This approach has been used previously to identify and
character ize inhibi tors of the Aurora kinases [25] . I t
gives information on compounds with sub-lethal effects including
cytostatic effects, as compounds that induce alterations in cellular
metabolism often induce changes to the number of cells
undergoing mitosis and are likely to be detected in addition to
those having a direct influence on mitosis [26]. Such compounds
are commonly rejected during in vitro cytotoxicity tests, which
assess ATP production and metabolic status amongst other
endpoints, so their identification and removal at an earlier stage
is beneficial in efficacy and financial terms [2].
Assay ValidationThe three endpoints in the image algorithm presented here can
be split into individual algorithms based on the three channels
used and added to a targeted primary screen as required,
dependent on the number of free imaging channels. Z’ factors
were therefore individually calculated for the 3 phenotypic
endpoints after both 24 and 48 hour exposures (Table 1) and
were within acceptable ranges for cell number and percentage of
morphologically abnormal cells [13], especially as moderate Z’
factors can yield good quality data in a high-content setting [12].
However, whilst within range for the Z’ factors were, in cases,
lower than the ideal 0.5 cut-off especially for cell number at the 24
exposure. Low Z’ factors arise from two main sources large
variability within the dataset or a small separation window
between the positive and negative controls. In the case of cell
numbers after 24 hour treatment there is contribution from both
sources as the coefficient of variance of the taxol treated wells is
21%, this is similar to that at 48 hours however at the latter
timepoint the signal window is approximately 2.5 times larger
giving the improved Z’ factor. As low Z’ factors influence our
proposed hit detection method we calculated the Z scores for all
the 2 mM taxol treated wells after 24 hours and all wells had a
score of 26.5 or less indicating that the assay had good sensitivity
as the variability was in the positive controls rather than the
negative ones used in the Z score calculation. The Z’ factor values
for assessment of phosphohistone H3 levels were deemed to be
sub-optimal for screening, as they were below 0 indicating signal
overlap, [12,13] this parameter was not evaluated as part of the
test screen, but images from hit compounds were examined for
increased numbers of mitotic cells. These data indicated that the
two concentrations of taxol (0.1 and 2 mM) and 0.2% DMSO
would be appropriate positive and negative controls respectively
High-Content Identification of Cytotoxic Compounds
PLOS ONE | www.plosone.org 3 February 2014 | Volume 9 | Issue 2 | e88338
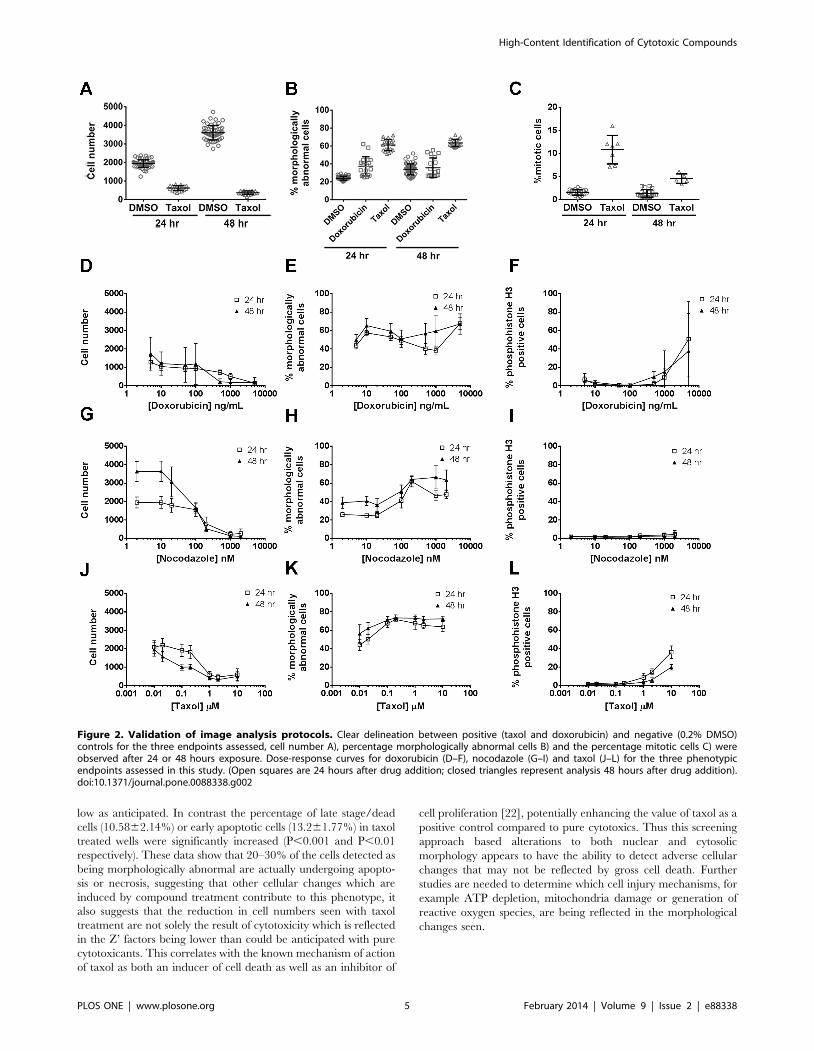
(Figure 2 A–C). The full algorithm was then further validated on
cells treated with a variety of concentrations of nocodazole to
confirm the algorithm could detect changes induced by com-
pounds other than doxorubicin and taxol, and demonstrated dose-
dependent responses at both 24 and 48 hour exposures for all
three compounds (Figure 2 D–L). False positives and false
negatives rates were calculated based on test plates dosed with
0.2% DMSO and taxol (0.1 and 2 mM) in an arbitrary layout
(Table 1). The rate of false positive and false negatives predicted by
analysis of the test plates is less than 5% for both cell number and
the percentage of morphologically abnormal cells, indeed no false
negatives were detected giving confidence that hits are unlikely to
be missed.
To further ascertain if the changes seen in both cell number and
morphology just represented cell death we assessed the percentage
of cells in early apoptosis and the percentage of late stage
apoptotic/dead necrotic cells using annexin V and propidium
iodide staining in cells treated for 48 hours with 2 mM taxol or
DMSO. The percentage of late stage/dead cells (2.9061.04%) or
early apoptotic cells (1.9160.53%) in DMSO treated wells were
Figure 1. Development of image analysis protocols. Alterations in nuclear area A) and cytosolic area B) in cells treated with 5 ng/mLdoxorubicin or 2 mM taxol compared with control (0.2% DMSO) were determined after 48 hours exposure. Dotted lines indicate the cut-offs used inthe image analysis algorithm. C) Correlation between nuclear and cytosolic areas. A–C) Squares represent doxorubicin treated cells, circles 0.2%DMSO and triangles taxol treated cells, shading indicates the regions in which cells are deemed morphologically abnormal. D) Example images of thepositive and negative controls showing the cells identified as morphologically abnormal or in mitosis. (Scale bars are 50 mm).doi:10.1371/journal.pone.0088338.g001
High-Content Identification of Cytotoxic Compounds
PLOS ONE | www.plosone.org 4 February 2014 | Volume 9 | Issue 2 | e88338
low as anticipated. In contrast the percentage of late stage/dead
cells (10.5862.14%) or early apoptotic cells (13.261.77%) in taxol
treated wells were significantly increased (P,0.001 and P,0.01
respectively). These data show that 20–30% of the cells detected as
being morphologically abnormal are actually undergoing apopto-
sis or necrosis, suggesting that other cellular changes which are
induced by compound treatment contribute to this phenotype, it
also suggests that the reduction in cell numbers seen with taxol
treatment are not solely the result of cytotoxicity which is reflected
in the Z’ factors being lower than could be anticipated with pure
cytotoxicants. This correlates with the known mechanism of action
of taxol as both an inducer of cell death as well as an inhibitor of
cell proliferation [22], potentially enhancing the value of taxol as a
positive control compared to pure cytotoxics. Thus this screening
approach based alterations to both nuclear and cytosolic
morphology appears to have the ability to detect adverse cellular
changes that may not be reflected by gross cell death. Further
studies are needed to determine which cell injury mechanisms, for
example ATP depletion, mitochondria damage or generation of
reactive oxygen species, are being reflected in the morphological
changes seen.
Figure 2. Validation of image analysis protocols. Clear delineation between positive (taxol and doxorubicin) and negative (0.2% DMSO)controls for the three endpoints assessed, cell number A), percentage morphologically abnormal cells B) and the percentage mitotic cells C) wereobserved after 24 or 48 hours exposure. Dose-response curves for doxorubicin (D–F), nocodazole (G–I) and taxol (J–L) for the three phenotypicendpoints assessed in this study. (Open squares are 24 hours after drug addition; closed triangles represent analysis 48 hours after drug addition).doi:10.1371/journal.pone.0088338.g002
High-Content Identification of Cytotoxic Compounds
PLOS ONE | www.plosone.org 5 February 2014 | Volume 9 | Issue 2 | e88338
Test ScreenThe staining and image analysis protocols developed here were
then applied to a library of 329 compounds, rich in natural
product-like molecules, which have not been previously assayed.
These compounds screened in quadruplicate at a final concentra-
tion of 20 mM with both 24 and 48 hour exposures. This is one
fifth the concentration of previous studies [5,7] as higher
concentrations could not be used as U2OS cells were sensitive to
DMSO at concentrations above the 0.2% used in these
experiments. Eight positive and eight negative controls were used
per screening plate. The main positive controls used were 100 nM
and 2 mM taxol, with additional controls of 5 ng/mL doxorubicin
and 100 nM nocodazole were also included. Z-scores were
calculated for each of the two main phenotypic endpoints based
on the negative controls (0.2% DMSO) for the screening batch (9
plates, 72 negative controls/batch and 18 of each positive control/
batch (72 positive controls overall/batch)). As our screening
concentrations were lower than previous studies and subtle effects
more likely compounds were defined as hits if their absolute Z-
score was greater than 2, a less stringent cut-off than the usual 3
[27] whilst retaining statistical significance (a Z score of 2
correlates to a p value of 0.045). By visual examination a single
compound precipitated out and was subsequently excluded from
further analysis. Thirty-four compounds which reduced cell
number after 48 hours exposure (Table S1), but only one
compound, number 137, that induced cell loss at both exposure
times (Figure 3A–B). Compound 137 also increased the percentage
of morphologically abnormal cells at both exposure times
(Figure 3C). A correlation between altered cell number and
morphological abnormality was also seen with compounds 151
and 160 after 48 hours exposure. Additionally five compounds,
(42,110,141,168, and 301) increased the percentage of morpho-
logically abnormal cells after 48 hours, but did not alter cell
number (Figure 3C). Visual examination of images showed that
compounds 110 and 168 showed multiple instances of two cells
with small nuclei in close proximity, suggesting there may be
alterations to daughter cells moving apart after cytokinesis or
inhibited cell growth after cytokinesis (Figure 3D), such a
phenotype would not be detected in cytotoxic assays and may
have undesired side-effects if the compound was taken forward.
The most active hit, compound 137, was then tested for dose-
dependent responses which were evident at the top doses of 10 and
20 mM respectively (Figure 3 E–F). Thus, the algorithm created
here has the capacity to detect compounds with adverse cellular
effects as both outright cell loss or as a sub-lethal alteration to cell
morphology/cell proliferation from a novel and structurally
diverse chemical library with a hit rate of 10% and 3.6%
respectively. This is the first report we are aware of that uses non-
liver derived cell line to examine cytotoxicity by high content
imaging in conjunction with a novel unenriched chemical library.
So whilst the hit rates are lower than those reported by O’Brien
and Persson [5,7], the studies are not directly comparable as our
library predominantly consists of compounds with natural
product-like backbones and is not enriched for cytotoxicity
compounds. In addition the maximal concentration and exposure
time used in our study were also lower than the previous studies.
ConclusionIn this study we sought to generate a novel high-content image
analysis algorithm for use in primary screening assays to identify
compounds with adverse cellular effects, by detecting abnormal-
ities in cell morphology and mitotic delay/arrest which are
indicators of likely cytotoxicity. The assay was initially optimised
using agents known to have adverse cellular effects including
cytotoxicity, showing a low false negative rate, and then tested
using a previously untested chemical library rich in natural
product-like molecules to validate the approach. Our study
suggests that using alterations to cell morphology, particularly
nuclear morphology, to identify adverse cellular effects during
primary screening will be a valid approach to the triage of
compounds to identify those likely to fail at later stages in the drug
discovery pipeline. This is in concordance with the studies of
O’Brien and Persson [5,7] using known hepatotoxicants and
HepG2 cells showing that nuclei morphology, specifically nuclear
area, was a sensitive endpoint. However, additional testing of this
endpoint with a wider selection of compounds for which the
mechanism of action has been identified is required to further
strengthen the validation of this assay. This would in conjunction
with assessments of ATP status and mitochondrial damage help to
determine which mechanisms of cellular injury this endpoint can
detect. The algorithm components described here does not seek to
provide detailed mechanistic data, or identify lead compounds
(unless cytotoxicity is the desired endpoint), but they do have the
power to provide valuable data on compound induced adverse
effects as adjuncts in primary screens. This algorithm is designed
for screens where adverse cellular effects are not the primary
output as a number of high-content, high-throughput screens
looking at detecting known hepatotoxins have already been
published [3,5,7]. These studies utilise high content imaging to
its full capacity showing the power of this technology for detecting
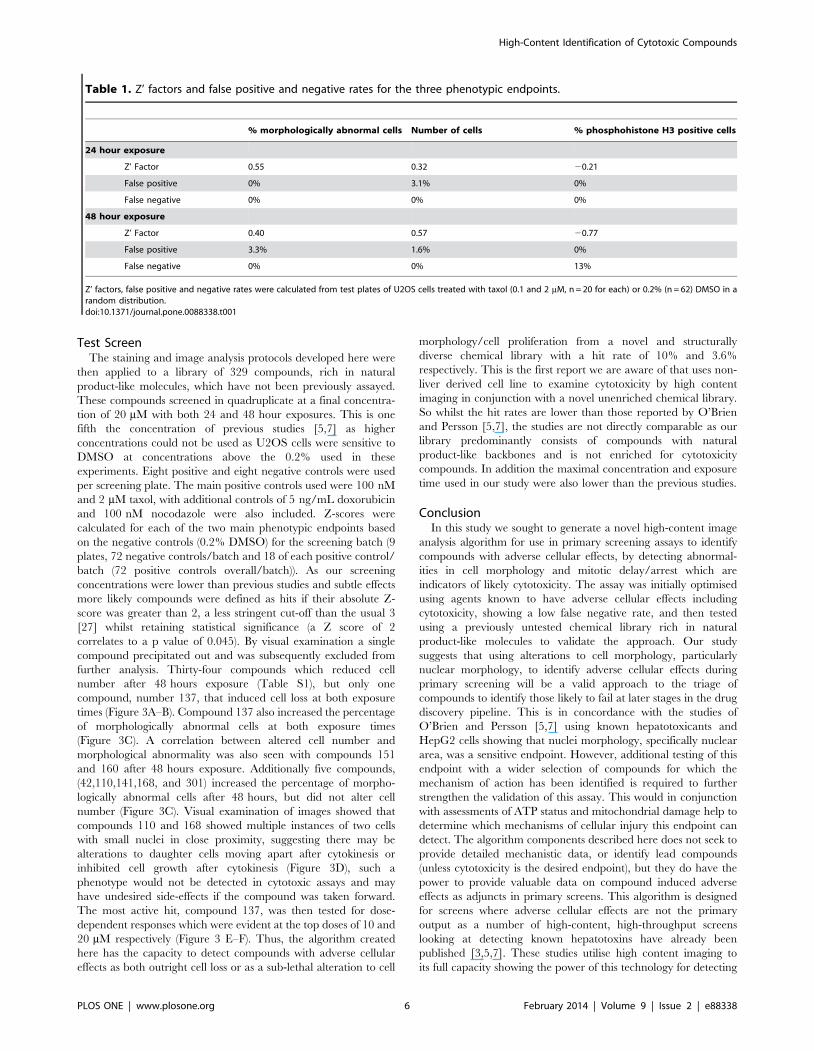
Table 1. Z’ factors and false positive and negative rates for the three phenotypic endpoints.
% morphologically abnormal cells Number of cells % phosphohistone H3 positive cells
24 hour exposure
Z’ Factor 0.55 0.32 20.21
False positive 0% 3.1% 0%
False negative 0% 0% 0%
48 hour exposure
Z’ Factor 0.40 0.57 20.77
False positive 3.3% 1.6% 0%
False negative 0% 0% 13%
Z’ factors, false positive and negative rates were calculated from test plates of U2OS cells treated with taxol (0.1 and 2 mM, n = 20 for each) or 0.2% (n = 62) DMSO in arandom distribution.doi:10.1371/journal.pone.0088338.t001
High-Content Identification of Cytotoxic Compounds
PLOS ONE | www.plosone.org 6 February 2014 | Volume 9 | Issue 2 | e88338
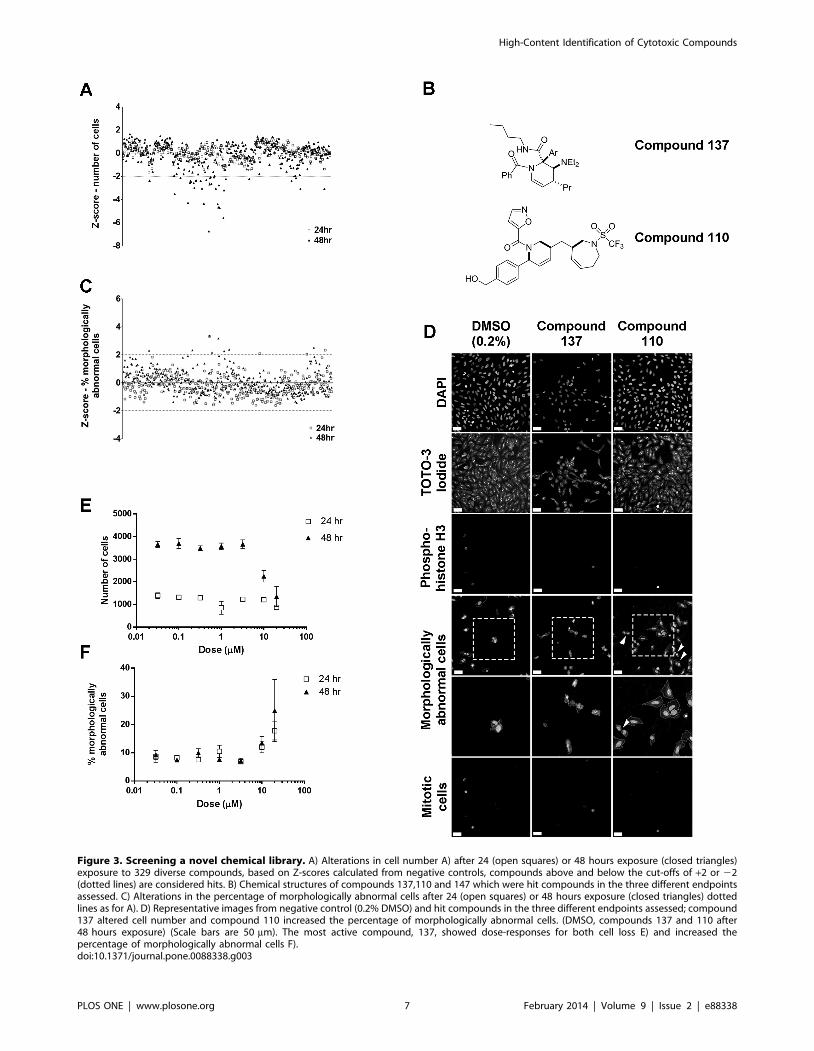
Figure 3. Screening a novel chemical library. A) Alterations in cell number A) after 24 (open squares) or 48 hours exposure (closed triangles)exposure to 329 diverse compounds, based on Z-scores calculated from negative controls, compounds above and below the cut-offs of +2 or 22(dotted lines) are considered hits. B) Chemical structures of compounds 137,110 and 147 which were hit compounds in the three different endpointsassessed. C) Alterations in the percentage of morphologically abnormal cells after 24 (open squares) or 48 hours exposure (closed triangles) dottedlines as for A). D) Representative images from negative control (0.2% DMSO) and hit compounds in the three different endpoints assessed; compound137 altered cell number and compound 110 increased the percentage of morphologically abnormal cells. (DMSO, compounds 137 and 110 after48 hours exposure) (Scale bars are 50 mm). The most active compound, 137, showed dose-responses for both cell loss E) and increased thepercentage of morphologically abnormal cells F).doi:10.1371/journal.pone.0088338.g003
High-Content Identification of Cytotoxic Compounds
PLOS ONE | www.plosone.org 7 February 2014 | Volume 9 | Issue 2 | e88338
adverse cellular effects. However, these approaches will not
currently replace in vitro toxicity testing in toto as they have not
yet been validated in cell types other than liver with compounds
displaying toxicity that is not solely hepatotoxicity, admittedly the
most difficult type of compound-induced toxicity to predict [28],
and therefore a need for traditional toxicity testing still exists. It
may only be a matter of time before such assays are routinely used
for in vitro toxicity testing as considerable overlap occurs between
the toxicity of hepatotoxic, nephrotoxic and cardiotoxic com-
pounds in the cell lines commonly used to assess such adverse
effects [18]. We feel that the current study further supports the use
of a high-content approach to identifying cytotoxic compounds by
use of a non-traditional cell-line in toxicity testing and a novel
compound library. As the algorithms generated in this study are
not as multiplexed as previous work [5,7] they may be included in
the design of primary screening assays to incorporate some degree
of testing for adverse effects to potentially limit the number of
compounds taken forwards from a primary screen that subse-
quently display adverse cellular effects, thereby minimising lead
compound failure and reducing the costs associated with this. The
assay presented here is an important step towards this aim,
however, further work is now required to assess the performance of
the assay in detecting adverse effects in a wider variety of cell lines
treated with compounds with a greater range of toxic mechanisms,
and in combination with targeted primary screens.
Supporting Information
Table S1 Identification of hit compounds from the testscreen. Structures of the screen library detected as have an
absolute Z score greater than 2 for one or more of the phenotypes
assessed; cell number, increased percentage of morphologically
abnormal cells or the percentage of cells in mitosis.
(DOCX)
Acknowledgments
We would like to thank Dr. Chris Empson for arraying the chemical library
used in this study.
Author Contributions
Conceived and designed the experiments: DCT AN SW JB EEM SMB
MA HLM. Performed the experiments: HLM JH. Analyzed the data:
HLM MA. Contributed reagents/materials/analysis tools: MA SW AN.
Wrote the paper: HLM JB EEM SMB AN DCT.
References
1. Paul SM, Mytelka DS, Dunwiddie CT, Persinger CC, Munos BH, et al. (2010)
How to improve R&D productivity: the pharmaceutical industry’s grand
challenge. Nat Rev Drug Discov 9: 203–214.
2. Slater K (2001) Cytotoxicity tests for high-throughput drug discovery. Curr
Opin Biotechnol 12: 70–74.
3. Haney SA, LaPan P, Pan J, Zhang J (2006) High-content screening moves to the
front of the line. Drug Discov Today 11: 889–894.
4. Korn K, Krausz E (2007) Cell-based high-content screening of small-molecule
libraries. Current Opinion in Chemical Biology 11: 503–510.
5. O’Brien PJ, Irwin W, Diaz D, Howard-Cofield E, Krejsa CM, et al. (2006) High
concordance of drug-induced human hepatotoxicity with in vitro cytotoxicity
measured in a novel cell-based model using high content screening. Arch
Toxicol 80: 580–604.
6. Zanella F, Lorens JB, Link W (2010) High content screening: seeing is believing.
Trends in Biotechnology 28: 237–245.
7. Persson M, Løye AF, Mow T, Hornberg JJ (2013) A high content screening
assay to predict human drug-induced liver injury during drug discovery. Journal
of Pharmacological and Toxicological Methods 68: 302–313.
8. Moffat J, Grueneberg DA, Yang X, Kim SY, Kloepfer AM, et al. (2006) A
Lentiviral RNAi Library for Human and Mouse Genes Applied to an Arrayed
Viral High-Content Screen. Cell 124: 1283–1298.
9. Murrison S, Maurya SK, Einzinger C, McKeever-Abbas B, Warriner S, et al.
(2011) Synthesis of Skeletally Diverse Alkaloid-Like Small Molecules. European
Journal of Organic Chemistry 2011: 2354–2359.
10. O’Leary-Steele C, Pedersen PJ, James T, Lanyon-Hogg T, Leach S, et al. (2010)
Synthesis of Small Molecules with High Scaffold Diversity: Exploitation of
Metathesis Cascades in Combination with Inter- and Intramolecular Diels–
Alder Reactions. Chemistry – A European Journal 16: 9563–9571.
11. Morton D, Leach S, Cordier C, Warriner S, Nelson A (2009) Synthesis of
Natural-Product-Like Molecules with Over Eighty Distinct Scaffolds. Ange-
wandte Chemie International Edition 48: 104–109.
12. Bray MA CA (2012) Advanced Assay Development Guidelines for Image-Based
High Content Screening and Analysis. In: Sittampalam GS G-EN, Arkin M, et
al, editor. http://www.ncbi.nlm.nih.gov/books/NBK126174/.
13. Zhang J-H, Chung TDY, Oldenburg KR (1999) A Simple Statistical Parameter
for Use in Evaluation and Validation of High Throughput Screening Assays.
Journal of Biomolecular Screening 4: 67–73.
14. Ghosh RN, DeBiasio R, Hudson CC, Ramer ER, Cowan CL, et al. (2005)
Quantitative Cell-Based High-Content Screening for Vasopressin Receptor
Agonists Using TransfluorHTechnology. Journal of Biomolecular Screening 10:
476–484.
15. Mukherji M, Bell R, Supekova L, Wang Y, Orth AP, et al. (2006) Genome-wide
functional analysis of human cell-cycle regulators. Proceedings of the NationalAcademy of Sciences 103: 14819–14824.
16. Torres-Guzman R, Chu S, Velasco JA, Lallena MJ (2013) Multiparametric Cell-Based Assay for the Evaluation of Transcription Inhibition by High-Content
Imaging. Journal of Biomolecular Screening 18: 556–566.17. Adams M, Cookson VJ, Higgins J, Martin HL, Tomlinson DC, et al. (2013) A
High-Throughput Assay to Identify Modifiers of Premature Chromosome
Condensation. Journal of Biomolecular Screening.18. Lin Z, Will Y (2012) Evaluation of Drugs With Specific Organ Toxicities in
Organ-Specific Cell Lines. Toxicological Sciences 126: 114–127.19. Kim JH, Chin BR, Kim SY, Kim JR, H.; BS (2003) Differential sensitivity of
Taxol-induced apoptosis in U2OS and SaOS2 osteogenic sarcoma cells. Cancer
Res Treat 35: 148–153.20. Eom Y-W, Kim MA, Park SS, Goo MJ, Kwon HJ, et al. (2005) Two distinct
modes of cell death induced by doxorubicin: apoptosis and cell death throughmitotic catastrophe accompanied by senescence-like phenotype. Oncogene 24:
4765–4777.21. Pang B, Qiao X, Janssen L, Velds A, Groothuis T, et al. (2013) Drug-induced
histone eviction from open chromatin contributes to the chemotherapeutic
effects of doxorubicin. Nat Commun 4: 1908.22. Jordan MA, Toso RJ, Thrower D, Wilson L (1993) Mechanism of mitotic block
and inhibition of cell proliferation by taxol at low concentrations. Proceedings ofthe National Academy of Sciences 90: 9552–9556.
23. Suzuki T, Fujikura K, Higashiyama T, Takata K (1997) DNA Staining for
Fluorescence and Laser Confocal Microscopy. Journal of Histochemistry &Cytochemistry 45: 49–53.
24. Elmehdawi F, Wheway G, Szymanska K, Adams M, High AS, et al. (2013)Human Homolog of Drosophila Ariadne (HHARI) is a marker of cellular
proliferation associated with nuclear bodies. Experimental Cell Research 319:161–172.
25. Barabasz A, Foley B, Otto JC, Scott A, Rice J (2006) The use of high-content
screening for the discovery and characterization of compounds that modulatemitotic index and cell cycle progression by differing mechanisms of action. Assay
Drug Dev Technol 4: 153–163.26. Martinez-Diez M, Santamaria G, Ortega AD, Cuezva JM (2006) Biogenesis and
dynamics of mitochondria during the cell cycle: significance of 39UTRs. PLoS
One 1: e107.27. Birmingham A, Selfors LM, Forster T, Wrobel D, Kennedy CJ, et al. (2009)
Statistical methods for analysis of high-throughput RNA interference screens.Nat Methods 6: 569–575.
28. Kaplowitz N (2005) Idiosyncratic drug hepatotoxicity. Nat Rev Drug Discov 4:489–499.
High-Content Identification of Cytotoxic Compounds
PLOS ONE | www.plosone.org 8 February 2014 | Volume 9 | Issue 2 | e88338
Related Documents