GIS/Mapping Case Studies Written by Stephanie Lindenbaum for the OSI Information Program © 2006 Open Society Institute. This work is licensed under the Creative Commons Attribution-Share- Alike 2.5 License. To view a copy of this license, visit http://creativecommons.org/licenses/by- sa/2.5/ or send a letter to Creative Commons, 543 Howard Street, 5th Floor, San Francisco, Califor- nia, 94105, USA.

Welcome message from author
This document is posted to help you gain knowledge. Please leave a comment to let me know what you think about it! Share it to your friends and learn new things together.
Transcript

�
GIS/Mapping Case Studies
Written by Stephanie Lindenbaum for the OSI Information Program
© 2006 Open Society Institute. This work is licensed under the Creative Commons Attribution-Share-Alike 2.5 License. To view a copy of this license, visit http://creativecommons.org/licenses/by-sa/2.5/ or send a letter to Creative Commons, 543 Howard Street, 5th Floor, San Francisco, Califor-nia, 94105, USA.
�
Contents
Introduction................................................................................................................. 2
Case.Study:.Canari.–.The.Caribbean.Natural.Resources.Institute.................. 6
Case.Study:.Eyebeam.R&D.–.ForwardTrack,.FundRace.org............................�0
Case.Study:.Free.Press.............................................................................................�5
Case.Study:.GreenInfo.............................................................................................�9
Case.Study:.Human.Rights.Watch.Off.Target.project.......................................23
Case Study: Kofiase, Ashanti Region, Ghana – Conflict Management............27
Case.Study:.Southern.Echo,.Inc..............................................................................3�
Case Study: Stamen Design – MoveOn.org........................................................36
Case.Study:.Relationship.mapping.........................................................................40
Appendix: GIS tools..................................................................................................44
2
Introduction
GIS (Graphical Information Systems) and Mapping technologies have grown in popularity in recent years, proportional to their decrease in cost. With the recent advent of GoogleMaps, YahooMaps and Microsoft’s Virtual Earth API all available for free on the web, both advanced programmers and individuals with more rudimentary skills have taken on mapping projects in an effort to display complex data, catalyze activism and even merely show off and play around. Many of the people with whom I spoke over the course of this study acknowledged that they felt an initial outside push to adopt mapping technologies; rarely did an organization decide to undertake a mapping project purely based on internal needs or ideas. Rather, many organizations felt prodded by their board members, recognized desperate needs to gain attention or legitimacy, or simply wanted to keep up with the Jones’, mainly other non-profits.
Central to the issue at hand is the distinction between GIS – a more complex, and frequently expensive tool to.facilitate.the.mapping.and.manipulation.of.data.sets,.and.mapping,.which.usually.presents.points.on.a.map.with little, if any, analysis or connection between them. Free tools like Google’s mapping API allows a user to create and annotate a map, but little more. In contrast, GIS tools may create simple but informative static maps or scale to an exponential degree, mapping pages and pages of intricate data. The most popular GIS software, ArcView, and its family of related tools, may cost upwards of $5,000 for a license, and its complexity has inspired a host of companion movements. These include GISCorps, a set of volunteers deployed to assist in emergency GIS projects worldwide (Tsunami-ravaged Indonesia and post-Katrina New Orleans have hosted GISCorps volunteer experts), Quantum.GIS, an Open Source version of ArcView, and MapServer, an Open Source spatial mapping development environment. Other tools like Wayfaring.offer.users.the.opportunity.to.create free maps without any programming required.
Recently,.a.number.of.these.tools.and.efforts.were.brought.together.under.a.single.roof,.the.Open.Source.GeoSpatial.Foundation.(http://osgeo.org)...OSGeo.gathers.most.of.the.leaders.of.the.open.source.mapping.and GIS movement; it also currently provides a home for seven major projects. These include GISCorps, a set of volunteers deployed to assist in emergency GIS projects worldwide (Tsunami-ravaged Indonesia and post-Katrina New Orleans have hosted GISCorps volunteer experts); Quantum GIS and uDig, open source equivalents of ArcView; along with MapServer and GeoServer, standards based web mapping servers. Other tools like Wayfaring offer users the opportunity to create maps online without any advanced GIS knowledge. The stated purpose of the foundation is to “to support and build the highest-quality open source geospatial software”, as well as “to encourage the use and collaborative development of community-led projects.” As of April 2006, OSGeo is still a young organization and is in the process of defining its method of operating and governance structure. The above website will provide more timely information on the foundation.
GIS and mapping projects, particularly in conjunction with the PGIS, or Participatory GIS movement, are quite popular, perhaps more widespread than expected, in the developing world, particularly in land tenure-oriented projects. According to Giacomo Rambaldi, an Italian academic currently working with the Technical Centre for Agricultural and Rural Cooperation in Wageningen, the Netherlands, GIS appears frequently in academic work, but in academia’s inherently “extractive” nature, the benefits of employing the technology are greater to the researcher.than.to.the.subject..PGIS�,.on.the.other.hand,.employs.GIS.almost.secondarily,.as.a.tool.to.facilitate.and encourage participation in policy, resource allocation, or advocacy work. The technologies, say the PGIS movement, help to increase trust between communities and intermediaries or officials, which is the basis for sound policy and other public practices. Rambaldi and his colleagues have assembled a comprehensive, current website with articles, links and findings from September’s PGIS conference in Nairobi. His most recent project is a checklist of ethics and non-negotiable issues for donor agencies interested in PGIS. A list of GIS tools from the IAPAD website is presented as an appendix to this document.
case studies
The case studies selected for this project represent a cross-section of those surveyed. As mentioned above,
� Rambaldi also identified Public Participation GIS (PPGIS) as more urban and tailored to US participants, spear-headed by URISA, the Urban and Regional Information Systems Association. In contrast, PGIS is more of a practice in developing countries and actively promotes the participation of indigenous or marginalized communities.
3
most of the GIS projects undertaken in the Global South revolve around resource allocation and management, but in this study I aimed to seek out advocacy work employing GIS. Therefore, a majority of the ten case studies presented take place in North America. Although this is somewhat regrettable from a diversity-in-geography standpoint, the studies all vary in focus, technology, organizational goals and staffing.
Some of the more interesting case studies that did not make it into the survey as full examples are summarized below. As with the longer case studies, contact information and screen shots are included, but it should be noted.that.in.many.instances,.the.contact.was.either.unwilling.or.unable.to.return.calls.and.emails..Still,.their.notable nature begged inclusion, if only briefly.
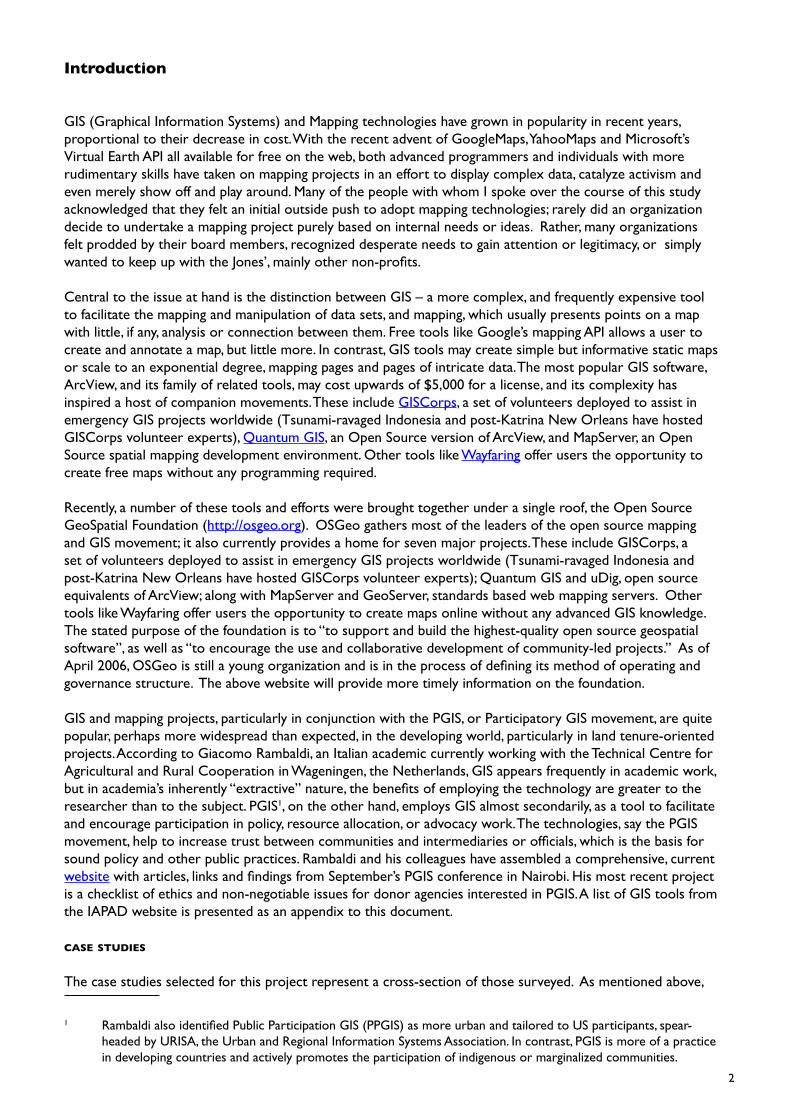
chicago crime maps
.WashingtonPost.com web developer Adrian Holovaty’s chicagocrime.org allows.users.to.enter.an.address.in.the.Chicago.metro.area.and.search.for.incidence.of.types.of.crime,.combining.current.data.from.the.Chicago Police Department’s publicly available database of reported crime. The.project.was.named.“the.most.influential mashup” of 2005 by the New York Times and has also been recognized with a Batten Award for Innovations in Journalism. Although it is not affiliated with the CPD, by using the Department’s Citizen ICAM Web.Site.data,.chicagocrime.org.offers.Chicago.residents.to.access.and.conceptualize the relative safety of their.neighborhoods.
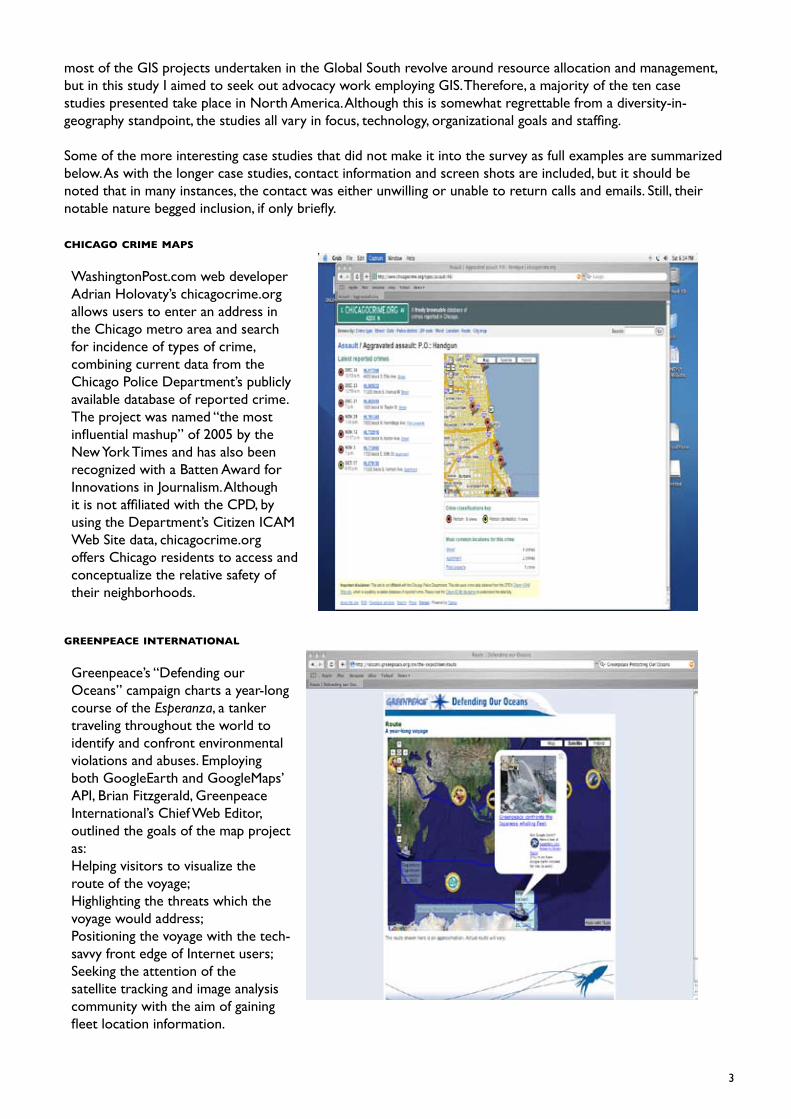
greenpeace international
.Greenpeace’s “Defending our Oceans” campaign charts a year-long course.of.the.Esperanza,.a.tanker.traveling throughout the world to identify and confront environmental violations and abuses. Employing both GoogleEarth and GoogleMaps’ API, Brian Fitzgerald, Greenpeace International’s Chief Web Editor, outlined.the.goals.of.the.map.project.as:Helping visitors to visualize the route of the voyage;Highlighting.the.threats.which.the.voyage would address;Positioning the voyage with the tech-savvy front edge of Internet users;Seeking.the.attention.of.the.satellite.tracking.and.image.analysis.community.with.the.aim.of.gaining.fleet location information.

4
Although the organization has yet to receive feedback on the map, internally Greenpeace has been pleased to interact, as they see it, on a more technologically advanced plane.
philippine association for intercultural development
Prominently featured at IAPAD’s PGIS conference, Dave DeVera represented a strong and powerful NGO sector.in.the.Philippines,.which.has.essentially.garnered.enough.legitimacy.to.operate.fundamentally.within.the government framework. After the Indigenous People’s Rights Acts, accommodating the right of self-determination.of.indigenous.peoples,.many.NGOs.set.forth.the.task.of.mapping.boundaries.and.geographic.areas according to the knowledge and expertise of indigenous groups. Yet as recently as four or five years ago, the Philippine government established a law stating that only official geodedic engineers were authorized to the use surveying instruments, therefore putting ad hoc and informal mappers out of practice and even criminalizing their activity.
With lobbying groups like DeVera’s advocating on behalf of indigenous peoples and community mapping, eight percent of federal land has been awarded certificates or titles of ancestral domain to indigenous people. Participatory.mapping.projects,.although.undertaken.principally.by.NGOs.on.behalf.of.indigenous.rural.groups,.have emerged as the only negotiating tool for disenfranchised, previously landless peoples.
red road
The.Red Road HIV/AIDS Network Society was established in 1999 as an offshoot of the British Columbia Aboriginal HIV/AIDS Task Force, designed to mobilize organizations and projects focused on the pandemic and its affected audiences. While the Task Force aimed to increase and improve the network of those living with and working on HIV/AIDS, the Red Road, as a strategy, is “a pathway to increase the quality of life of all Aboriginal People.”In order to reach all Aboriginal people living with HIV/AIDS in British Columbia, Red Road understood that combining traditional and non-Aboriginal values, tactics and treatments would necessitate an innovative approach. Careful not to limit its focus to only care-giving, fundraising, training or information campaigns, Red Road instead opted to concentrate on all of these activities at once. The organization, along with GIS expert and Aboriginal activist Steven DeRoy, decided to look towards mapping as a solution to their multiple needs and endeavors.
DeRoy, a native Anishinabe (Ojibway).from.the.Ebb.&.Flow First Nation in Manitoba, came to Red Road after having spent.nearly.three.years.with the Aboriginal Mapping Network,.a.land.management.and conservation group based in Vancouver. Although his expertise ranged from technical training to map development for resource-based projects, Red Road signaled his first foray into health-related mapping. In order to ensure that Red Road’s maps were truly interactive, DeRoy faced.the.challenge.of.educating.nearly everyone in his world – from Red Road’s staff to its elders.and.constituents.–.on.the.power.and.capabilities.of.the.maps.he.had.set.out.to.create.
As a companion piece to Red Road’s interactive maps, DeRoy developed an introductory GIS document,
5
available both on the organization’s website and in downloadable Powerpoint format. Defining GIS technology as “providing the ability to see spatial relationships between data layers that may not be apparent to us when we visually compare databases and maps,” the introduction also explains the resources contained within Red Road’s map, and the facility with which users can not only access local information on HIV/AIDS, but also recognize available resources in neighboring communities.
After conducting a user survey, DeRoy learned aware that simplified but robust web-based technology had its limitations with Red Road’s stakeholders, and developed a printable map guide to Aboriginal, health and support services around Vancouver. Responding to additional user feedback, Red Road plans to create three new guides in 2005-6, highlighting heath and HIV/AIDS services in Vancouver Island, and in Interior and Northern British Columbia.
washington kurdish institute
Mike Amitay, currently an OSI Senior Policy Analyst, oversaw an innovative GIS project during his tenure as Director of the Washington Kurdish Institute, a DC-based think-tank and advocacy group. Dedicated to raising awareness of Kurdish issues, WKI conducted a study to examine the long-term effects of chemical weapons on civilian populations, chiefly the Kurds, a voiceless minority throughout the Middle East.
WKI mapped sites of known chemical attacks and also conducted medical surveys in 2000 Kurdish households. On top of the static maps, WKI worked with ArcView to overlay the survey data, along with other health data and information on water supplies and other environmental samples. This multi-layered geographic representation “helped [WKI] to discern patterns that led to other queries,” says Amitay. “We might not have been able to [draw conclusions], having information on different sheets of paper… Graphic representations are quite powerful. With maps, you’re forcing people to deal with the location of the presence of things. It’s a great medium.”.
As the organization has not had the ability to hire a full-time map developer, the maps themselves have not been completed, even one year after the project began. But WKI and Amitay are confident that the maps, when complete, will help clarify many issues and questions, and undoubtedly raise new ones as well..

6
OSI – GIS/Mapping ProjectCase Study: Canari – The Caribbean Natural Resources InstitutePerson Contacted: Allan Smith
Issue: A participatory resource management group in the Caribbean is effective but shies away from advanced technologies, believing them more exclusive than inclusive, and thus counter to its efforts. solutIon: One of the group’s trainers becomes an “accidental techie” when he begins to recognize community knowledge and input as key elements of Participatory GIS.
(Adapted from an interview with Allan Smith, CANARI Research Associate, and from “Participatory.coastal.resource.mapping.in.Saint.Lucia:.local.applications.and.regional.implications,”.by Smith.)
The Caribbean Natural Resources Institute (CANARI) is an independent technical and research organization based in Trinidad and Tobago. It “analyzes and promotes participatory management of natural resources in the islands of the Caribbean,” and has been operating for more than twenty years. CANARI focuses on three elements: research, analysis and advocacy as integral to the overarching goal of participatory management. I spoke with Allan Smith, an associate of the organization who runs a small research facility for them on St. Lucia. Although Smith’s original area of expertise is seaweed management, he has become the de facto GIS manager for the organization, attending the PGIS conference in Nairobi in September 2005.
Smith first came across digital mapping and GIS programs in 1997, while discussing participatory forestry projects with a British Government advisor working in the Caribbean. Smith had been predominantly focusing on research that integrates community knowledge, government expertise and scientific data, but finding little use for the GIS systems that were currently being promoted. The UK advisor mentioned a program called Map Maker, which had been used for similar management projects in Zimbabwe. Smith contacted MapMaker at their headquarters in Scotland, via their website, and has continued to use the product through the present date.
Smith.agrees.that.the.problem.with.the.employment.of.GIS.is.often.the.“appropriate.technology”.issue,.noting.that most frequently, the technology appears before the need arises. “My presentation in Kenya was one of the few where the project was developed within a community - many of the others described external researchers “going into the community”. Although MapMaker is a lower-cost GIS program, Smith cites its robustness, and its compatibility with other tools as a selling point. ESRI (founded as the Environmental Systems Research Institute), and the producers of the most well-known GIS software, ArcView, ArcGIS and others was deemed too expensive, too centralized, and Smith has been pleased to avoid the “hegemony of ESRI.” Most importantly, he notes, any GIS program is meaningless without maps over which to lay specific data through layers and vectors. Most NGOs are not aware, Smith adds, that in most cases GIS is not only beyond people’s technical and financial capacity, but it is superfluous without a simple mapping capability.
CANARI, with its ability to interact with, educate and learn from diverse communities around the Caribbean, has quickly become known for its training expertise in participatory resource mapping and GIS. Most of its trainings involve a basic awareness of the tools involved in digital mapping, and Smith usually encourages villages to create their own development and participatory management-oriented projects and plans, and then to use these tools to present these plans in a manner relevant to the village itself.
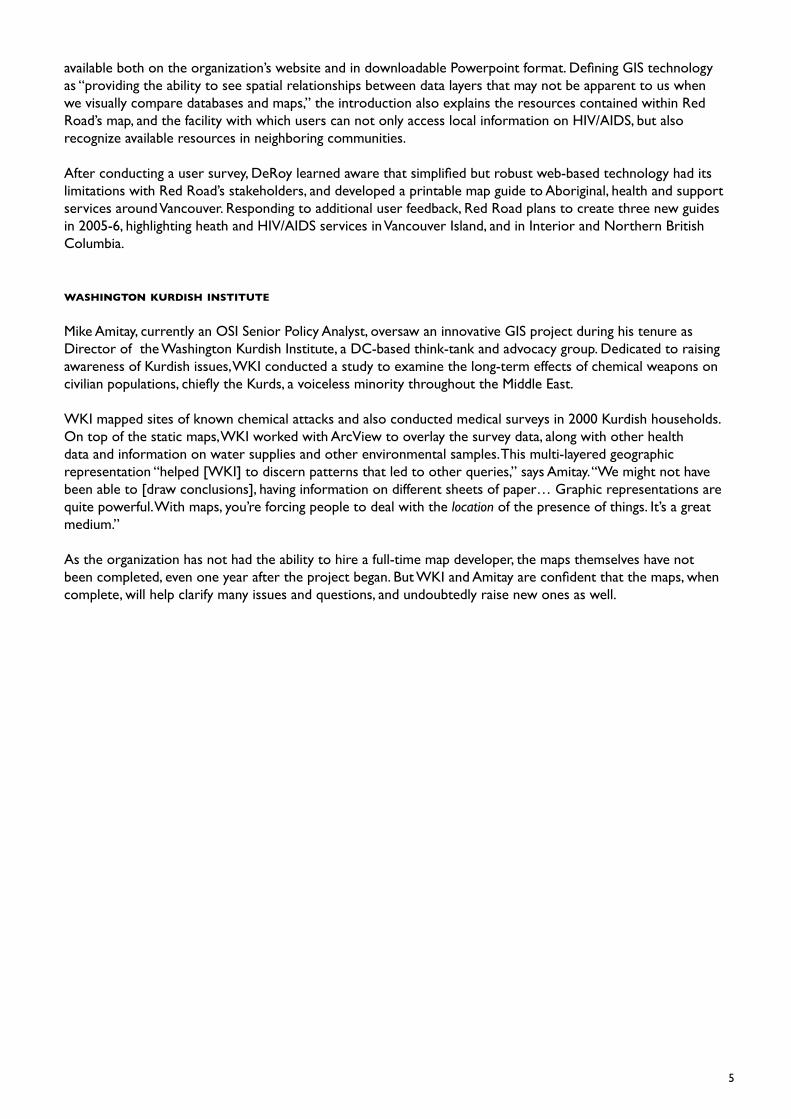
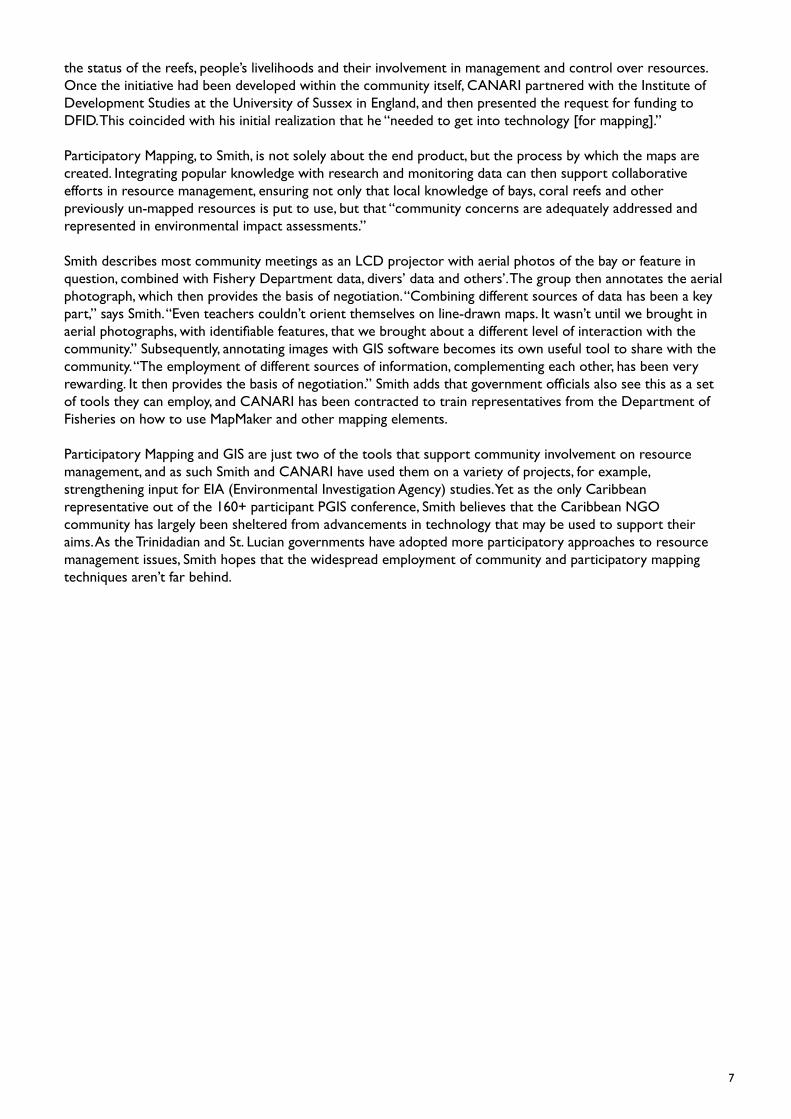
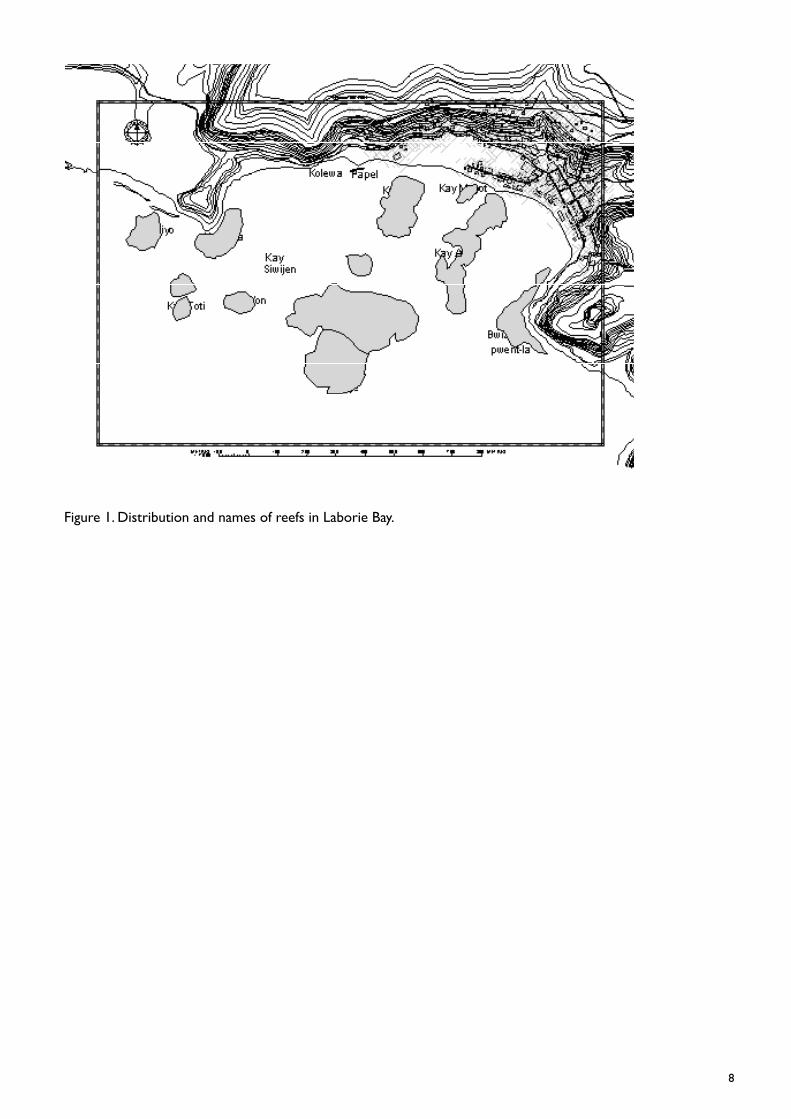
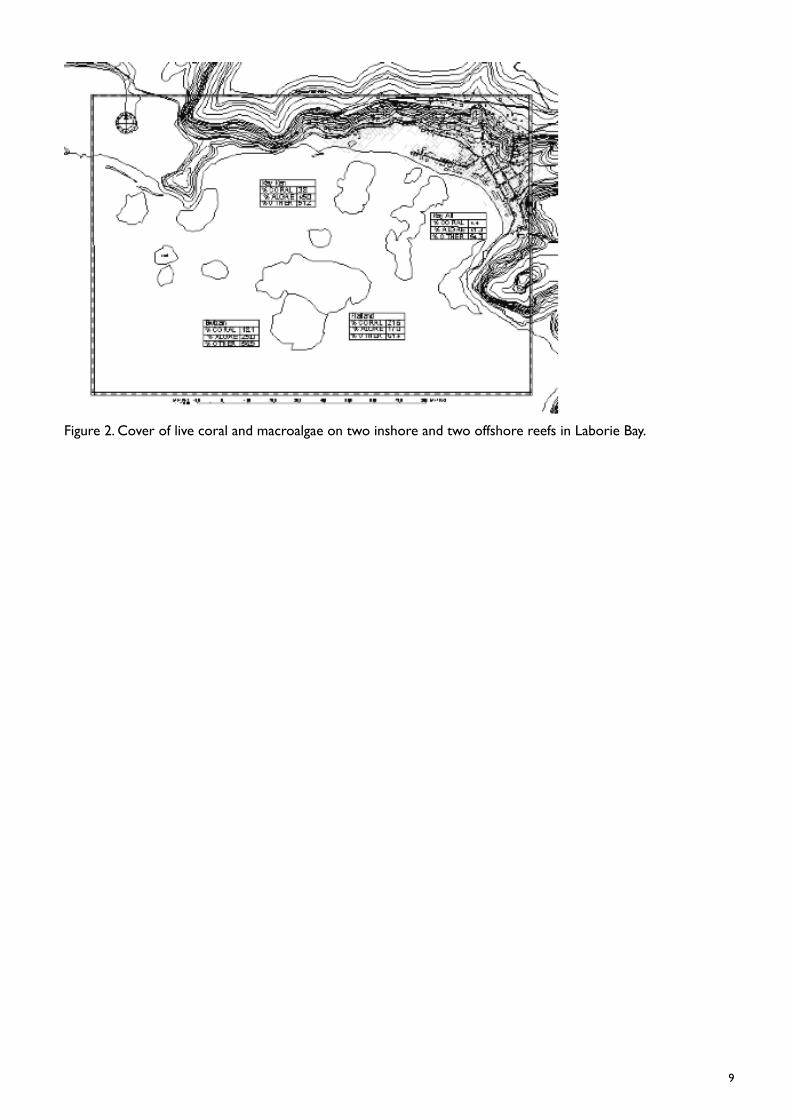
Smith’s PGIS presentation focused on a three-year CANARI project conducted in Laborie, on the south coast of St. Lucia, funded by the UK Department for International Development (DFID), in which community knowledge and scientific surveys were combined to develop the first maps of the reefs and their uses in Laborie Bay. With support from the US National Fish and Wildlife Foundation and UNDP, CANARI and a community development foundation conducted training for high school students in basic mapping, GIS and water quality monitoring. Smith employed Map Maker’s Gratis version and tried to encourage the use of the tools for community development and empowerment. Documenting locals concerns and issues, allowing them to see that community knowledge can be used to create what would become official documents was “tremendously.important.and.empowering.”
CANARI and community members worked together to develop a project based on the relationship between
7
the status of the reefs, people’s livelihoods and their involvement in management and control over resources. Once the initiative had been developed within the community itself, CANARI partnered with the Institute of Development Studies at the University of Sussex in England, and then presented the request for funding to DFID. This coincided with his initial realization that he “needed to get into technology [for mapping].”
Participatory Mapping, to Smith, is not solely about the end product, but the process by which the maps are created. Integrating popular knowledge with research and monitoring data can then support collaborative efforts.in.resource.management,.ensuring.not.only.that.local.knowledge.of.bays,.coral.reefs.and.other.previously un-mapped resources is put to use, but that “community concerns are adequately addressed and represented in environmental impact assessments.”
Smith.describes.most.community.meetings.as.an.LCD.projector.with.aerial.photos.of.the.bay.or.feature.in.question, combined with Fishery Department data, divers’ data and others’. The group then annotates the aerial photograph, which then provides the basis of negotiation. “Combining different sources of data has been a key part,” says Smith. “Even teachers couldn’t orient themselves on line-drawn maps. It wasn’t until we brought in aerial photographs, with identifiable features, that we brought about a different level of interaction with the community.” Subsequently, annotating images with GIS software becomes its own useful tool to share with the community. “The employment of different sources of information, complementing each other, has been very rewarding. It then provides the basis of negotiation.” Smith adds that government officials also see this as a set of tools they can employ, and CANARI has been contracted to train representatives from the Department of Fisheries on how to use MapMaker and other mapping elements.
Participatory Mapping and GIS are just two of the tools that support community involvement on resource management, and as such Smith and CANARI have used them on a variety of projects, for example, strengthening input for EIA (Environmental Investigation Agency) studies. Yet as the only Caribbean representative out of the 160+ participant PGIS conference, Smith believes that the Caribbean NGO community has largely been sheltered from advancements in technology that may be used to support their aims. As the Trinidadian and St. Lucian governments have adopted more participatory approaches to resource management.issues,.Smith.hopes.that.the.widespread.employment.of.community.and.participatory.mapping.techniques aren’t far behind.
�
Figure 1. Distribution and names of reefs in Laborie Bay.
9
.Figure 2. Cover of live coral and macroalgae on two inshore and two offshore reefs in Laborie Bay.
�0
OSI – GIS/Mapping ProjectCase Study: Eyebeam R&D – ForwardTrack, FundRace.orgPerson Contacted: Michael Frumin
Issue: Are letter-writing campaigns and online petitions dead?solutIon: An apolitical non-profit media arts organization develops tools to aid the American public in conceptualizing and understanding political concepts.
(Adapted from an interview with Michael Frumin, Technical Director of R&D)
Eyebeam, a non-profit arts and technology center based in New York City, has been nurturing and developing new media technologies since its founding in 1996. Eyebeam runs educational and artist-in-residence programs, along with curatorial space and a research and development lab, dedicated to the identification and expansion of innovative technologies. As the nexus between sociopolitical activity and culture has strengthened in recent years, Eyebeam’s R&D department has begun to consider the influence that technologies may have on social dialogue. Although the organization does not espouse any particular political ideology, it has become interested in exploring how the tools it develops can promote a generally active and educated political culture.
This.brief.case.study.takes.a.closer.look.at.two.projects.undertaken.by.Eyebeam,.as.discussed.with.Eyebeam.R&D’s Technical Director, Michael Frumin. Although using ArcView is a commodity skill, says Frumin, “programming dynamic and interactive maps and GIS applications, particularly for the web, is not.” As such, it makes sense for the non-profit community to embrace the capabilities of mapping, and for programmer-mappers in turn to collaborate with these non-profits.
fundrace.org
In early 2004, Frumin, Jonah Peretti, and Eyebeam’s Contagious Media Research Group set out to prove a point. During the presidential campaign season, numerous issues had been thrust before the American public, so many so that over-saturation was a danger. Without an explicit effort to draw connections between populations and issues, however, indifference threatened to render these topics empty, and ignored by all but a few focused interest groups. Frumin considered campaign finance reform as one of these issues; central to the campaign, and yet far from most Americans’ immediate attention.
Related to this, and equally important to Eyebeam, was the concept of data availability and presentation. Through the Federal Election Commission (FEC), anyone can access data documenting all campaign finance records, yet with the information available in formats incomprehensible to the average reader, few if any individuals were likely to read this public data on their own. Eyebeam saw the potential in this question – is there.a.way.to.use.a.source.of.public.data.and.reuse.it.or.present.it.in.a.technological.way.to.remind.people.how meaningful it is to them? Demographic and census figures, street and geographic information and other data sets have all been made free and available by the US government, a resource that makes Americans “lucky,” says Frumin. Actually utilizing it, however, is another matter.
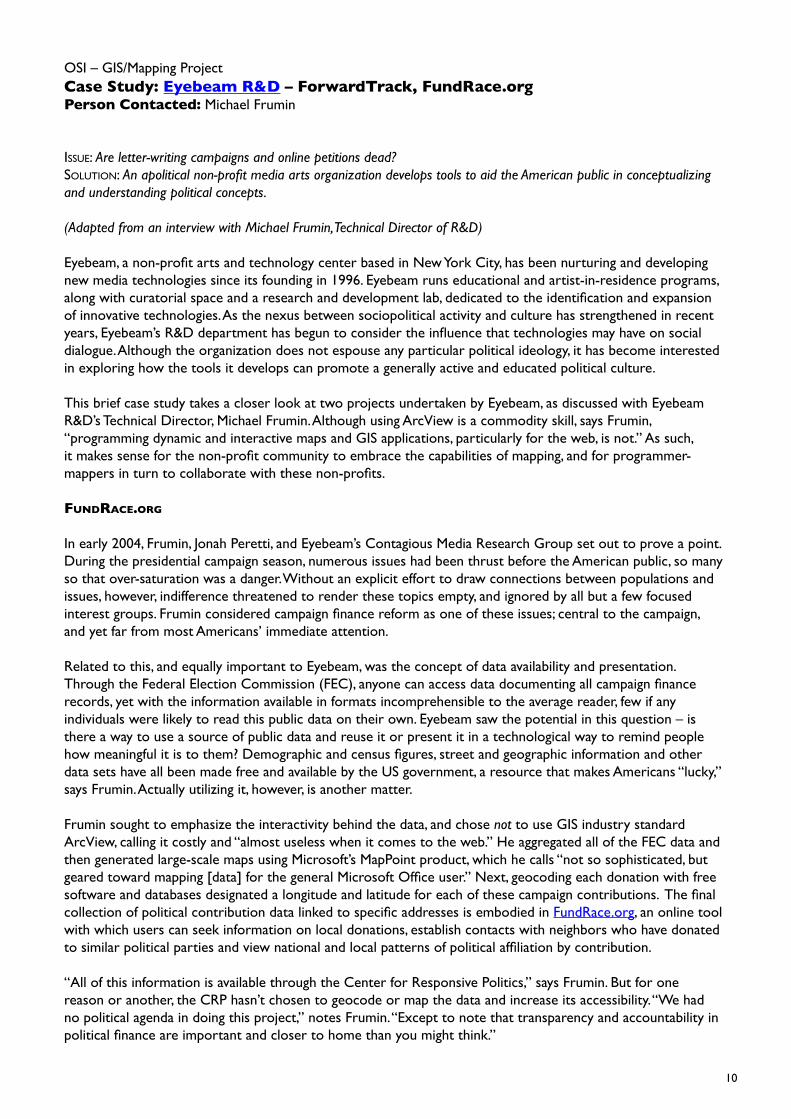
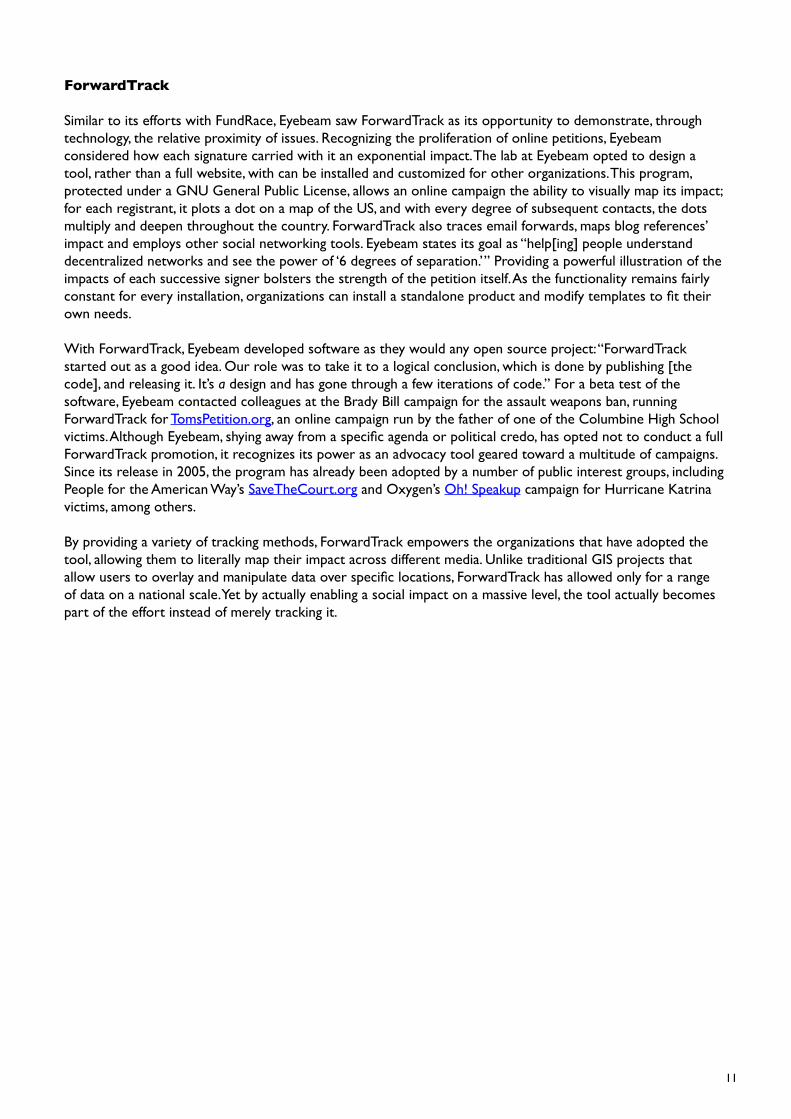
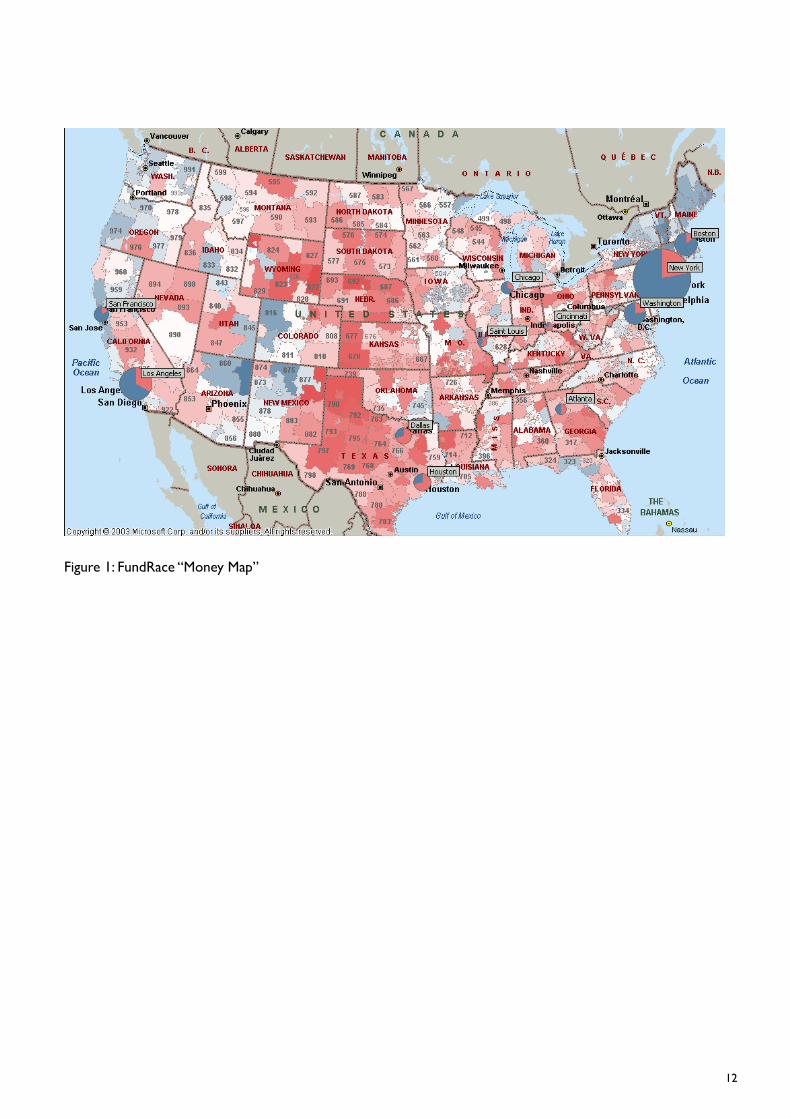
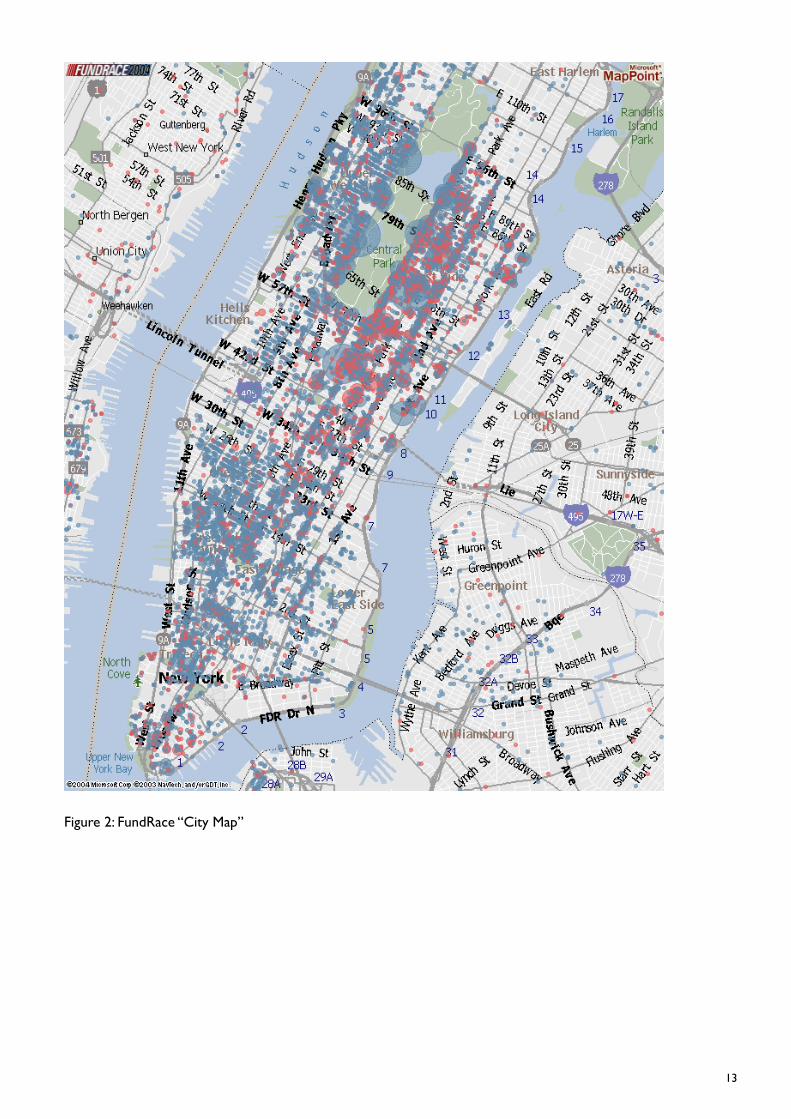
Frumin sought to emphasize the interactivity behind the data, and chose not.to.use.GIS.industry.standard.ArcView, calling it costly and “almost useless when it comes to the web.” He aggregated all of the FEC data and then generated large-scale maps using Microsoft’s MapPoint product, which he calls “not so sophisticated, but geared toward mapping [data] for the general Microsoft Office user.” Next, geocoding each donation with free software and databases designated a longitude and latitude for each of these campaign contributions. The final collection of political contribution data linked to specific addresses is embodied in FundRace.org,.an.online.tool.with which users can seek information on local donations, establish contacts with neighbors who have donated to similar political parties and view national and local patterns of political affiliation by contribution.
“All of this information is available through the Center for Responsive Politics,” says Frumin. But for one reason or another, the CRP hasn’t chosen to geocode or map the data and increase its accessibility. “We had no political agenda in doing this project,” notes Frumin. “Except to note that transparency and accountability in political finance are important and closer to home than you might think.”
��
ForwardTrack
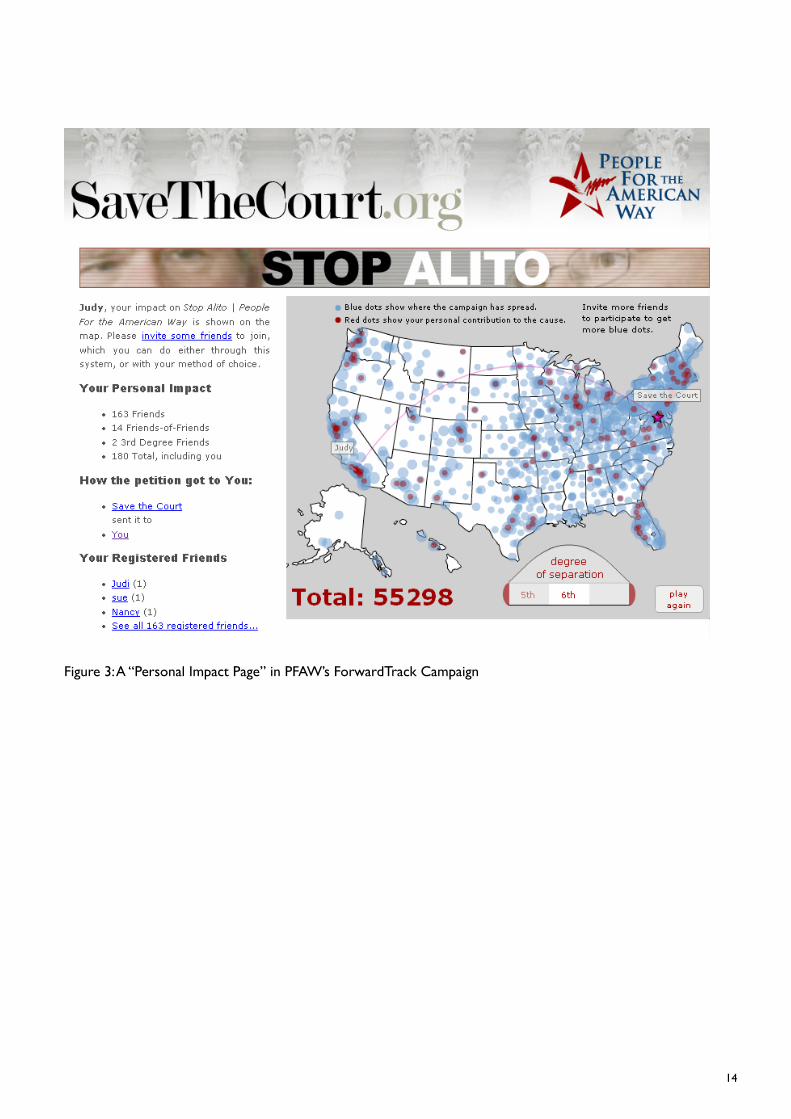
Similar.to.its.efforts.with.FundRace,.Eyebeam.saw.ForwardTrack.as.its.opportunity.to.demonstrate,.through.technology, the relative proximity of issues. Recognizing the proliferation of online petitions, Eyebeam considered how each signature carried with it an exponential impact. The lab at Eyebeam opted to design a tool, rather than a full website, with can be installed and customized for other organizations. This program, protected under a GNU General Public License, allows an online campaign the ability to visually map its impact; for each registrant, it plots a dot on a map of the US, and with every degree of subsequent contacts, the dots multiply and deepen throughout the country. ForwardTrack also traces email forwards, maps blog references’ impact.and.employs.other.social.networking.tools..Eyebeam.states.its.goal.as.“help[ing].people.understand.decentralized networks and see the power of ‘6 degrees of separation.’” Providing a powerful illustration of the impacts of each successive signer bolsters the strength of the petition itself. As the functionality remains fairly constant for every installation, organizations can install a standalone product and modify templates to fit their own.needs.
With ForwardTrack, Eyebeam developed software as they would any open source project: “ForwardTrack started.out.as.a.good.idea..Our.role.was.to.take.it.to.a.logical.conclusion,.which.is.done.by.publishing.[the.code], and releasing it. It’s a.design.and.has.gone.through.a.few.iterations.of.code.”.For.a.beta.test.of.the.software, Eyebeam contacted colleagues at the Brady Bill campaign for the assault weapons ban, running ForwardTrack.for.TomsPetition.org,.an.online.campaign.run.by.the.father.of.one.of.the.Columbine.High.School.victims. Although Eyebeam, shying away from a specific agenda or political credo, has opted not to conduct a full ForwardTrack promotion, it recognizes its power as an advocacy tool geared toward a multitude of campaigns. Since.its.release.in.2005,.the.program.has.already.been.adopted.by.a.number.of.public.interest.groups,.including.People for the American Way’s SaveTheCourt.org and Oxygen’s Oh!.Speakup.campaign.for.Hurricane.Katrina.victims, among others.
By providing a variety of tracking methods, ForwardTrack empowers the organizations that have adopted the tool, allowing them to literally map their impact across different media. Unlike traditional GIS projects that allow users to overlay and manipulate data over specific locations, ForwardTrack has allowed only for a range of data on a national scale. Yet by actually enabling a social impact on a massive level, the tool actually becomes part.of.the.effort.instead.of.merely.tracking.it.
�2
Figure 1: FundRace “Money Map”
�3
Figure 2: FundRace “City Map”
�4
Figure 3: A “Personal Impact Page” in PFAW’s ForwardTrack Campaign

�5
OSI – GIS/Mapping ProjectCase Study: Free PressPerson Contacted: Ben Byrne
Issue: A small non-profit, non-partisan organization dedicated to the establishment and maintenance of a democratic media aims to involve the public in media-related policymaking, and to let policymakers see how passionate and involved the public actually is.solutIon: Develop a database of community Internet projects nationwide and present it to Congressional leaders via a readable, informative interactive map.
(Adapted from an interview with Free Press’ Creative and Technical Manager, Ben Byrne.)
Founded in 2002, Free Press is a small but voluble non-profit organization based in Northampton, Massachusetts focusing on public participation in media policy. With an outpost in Washington DC, Free Press also monitors policy debate on, among other topics, the democratic nature of American public media and the availability and ownership of internet access, and “free” radio and television. Drawing on the strength of its supporters nationwide, Free Press frequently presents white papers and petitions to Congressional staffers in order to inform policy on these media-related issues.
In 2005 Ben Byrne, Free Press’ Creative and Technical Manger, was tasked with the project of building a database of community Internet projects around the country. Byrne felt this was in line with much of Free Press’ work, with a strong “advocacy-oriented motive.” Yet his colleagues impressed upon him the importance of presenting this database in an accessible format. “State legislatures and members of Congress weren’t aware of going on, in terms of how many people and communities were developing their own free Internet networks, and we worried that they would make policy decisions that might actually hamper this progress,” says Byrne.
Working with a limited budget, Byrne sought to present the database in a way that would demonstrate the variety of approaches and locations involved in community Internet. The Washington office in particular impressed upon him the need to generate an innovative representation of data, knowing full well that most Congressmen or their staffers don’t have the time or inclination to read charts with 300+ entries.
Byrne ran some Google searches for map-making software and came upon John Emerson (formerly a designer with Human Rights Watch)’s DIY map, a freeware product designed to assist in the production of activism-oriented maps. “I’m the web guy, so the challenge fell to me,” says Byrne. “I’m a graphic designer who has taught myself databases for the web site, but mapping is a whole other specialty.” Without the funds to acquire an ArcView license for the organization, Byrne felt that Free Press, which had coincidentally worked with Emerson on previous projects, would actually take to the notion of a free, Flash-based map more than a complicated GIS project,.anyway.Once he got over the initial learning curve, Byrne found the DIY maps fairly simple to use. In order to customize the maps and have them meet Free Press’ functionality requirements, the organization ended up paying a small sum to Emerson for tailored adjustments, but far less than an official GIS license would have cost. “We were using the maps in a way that hadn’t been intended, but John was more than happy to make upgrades.” Emerson has since posted revision notes on his site, which Byrne is pleased to see. “If one of our grassroots activists wanted to be able to create his or her own maps, I’d point them to John’s website – he does.a.thorough.job.”
At Free Press, Byrne has yet to hear what sort of concrete impact the map has made, but internally he has received a great deal of positive feedback on the project. The Washington-based has been “ecstatic” with the map and its functionality, claiming it has been seen as effective in public policy circles. In Northampton, the organization has felt encouraged enough by the map to replicate and modify it for other projects and parts of the organization’s web portal, freepress.net.
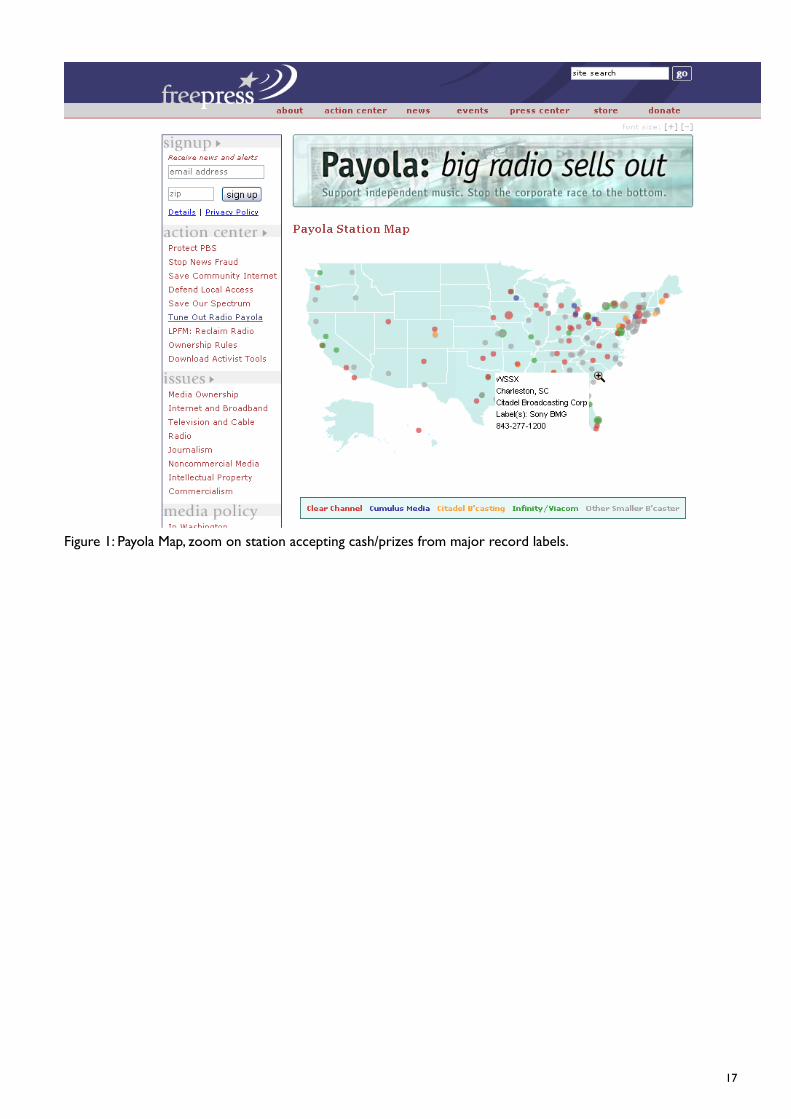
By trying to illustrate “Community Internet: Broadband as a public service,” Byrne believes that he has presented an image that is “must more vibrant than a document.” After a good deal of trial and error and poring over Emerson’s documentation, he “understood the basic architecture [and] can connect it to other maps.on.the.site,”.for.instance.a.new.map.on.Radio.Payola..

�6
Yet aside from being cost effective, Byrne questions how well the DIY maps will serve Free Press for newer mapping projects. “We are putting together the ‘Action Squad,’ a whole cadre of people that are much more active than ‘point and click’ activists. It would be great to have an interactive map, linking people, but I’m not sure how well the DIY map is going to handle this new project.” Acknowledging that the software is “not the most robust tool in the world,” Byrne still admits that in employing it, Free Press is “a lot further along than we were.before.”
For the community Internet map, Byrne has trained Free Press interns to fact-check and update data, but largely remains the sole employee with the ability to maintain the map. Yet without having to develop their own program or to hire an outside consultant to create the maps for them, Byrne believes that Free Press has come out ahead. “We know that there is a tendency to say ‘that’s cool, let’s do it,’ but just because [a technology] may be cool doesn’t mean it’s a good use of resources.” Byrne is currently investigating the GoogleMaps API, but insists that he’ll adopt it only if it can do exactly what he wants and in a cost effective manner. Maybe one of our grassroots activists wondered how to use it. I’d point them to john’s website – he does a thorough job. I wouldn’t write code for them to make it work. We’re happy to give guidance.
�7
Figure 1: Payola Map, zoom on station accepting cash/prizes from major record labels.

��
Figure 2: Community Internet Map, zoom on a municipal broadband network in Nevada; the Community Internet Glossary, accompanying the map on freepress.net, defines FTTH as “Fiber to the Home: The installation of optical fiber from a telephone switch directly into a subscriber’s home.”

�9
OSI – GIS/Mapping ProjectCase Study: GreenInfoPerson Contacted:.Larry.Orman
Issue: Can small non-profit organizations manage GIS projects on their own? solutIon: A ten-year-old GIS and mapping consultancy organization reflects upon the usage of computer-based mapping by a wide range of organizations.
(Adapted from an interview with Larry Orman, GreenInfo’s Executive Director.)
Larry Orman, Executive Director of GreenInfo (http://www.greeninfo.org), knows GIS. Having established the organization in 1995 as a way to bring GIS into the vernacular of various organizations, he has worked with groups ranging in focus from environmental and land management work to public transit. Over the years, Orman has witnessed the explosion of GIS, particularly in his purview of largely California-based organizations, and as such has developed strong opinions on the efficacy of GIS and on its relevance to nonprofits.
trends
Many organizations that have approached GreenInfo (the organization no longer focuses exclusively on environmental mapping, but feels it would be confusing at this point in its history to change its name) for consultancy services simply want a map with a census variable identified, or a special land site shown. A few are more analytic and hope to address and assess a particular question at great depth, the majority lie in the middle, as groups who need data analysis and maps that display the information in compelling visual terms. There.is.“no.real.model.of.what.people.are.doing.[with.maps],”.says.Orman..Different.sectors.are.engaged.in.vastly different levels of map making and map analysis. “The key is to segregate by capacity. Local health clinics might be interested in customer analysis, but have no ability to do anything with that analysis,” says Orman.
Orman believes interactive mapping is particularly challenging for smaller nonprofits, as there is a lot of focus now on whether maps are going to be served on the Internet. “You can’t define these [web mapping] projects by what the technology can do, rather it’s whether the users get any significant interaction with them…” The organization’s.contact.with.the.technology,.therefore,.is.a.more.meaningful.issue.than.whether.or.not.they.can.afford or create the maps in the first place. “There’s a real tendency to look at the tool side, and less so on the user experience. [GIS tools like] Map Server takes significant skill to put up, but don’t always create value to the ultimate users. Groups looking to use the web for mapping have to have a critical eye on whether that’s the right.choice.for.their.resources.”
For many groups, the availability of GIS is already pretty well known, or at least to a point. “As a starting place, groups come in and say ‘this is what we think we want,’ but what they typically don’t know is how to frame their issue to be subject to geographic analysis. They typically have a point of view they want to reinforce.” GreenInfo consequently engages in a good deal of communications and marketing consulting: “Who needs to see this? What sort of impact do we need to make upon them? Having to bring it all down to one or a couple of maps forces you to think about what your message is,” says Orman. If an organization is unable or unwilling to put one-third to one-half of a project budget toward this communications analysis, notes Orman, they likely do not have the funds or dedication to devote to the project as a whole. “It can be a huge mistake to put this technology into a project if you’re not clear about how to present your results well at the end. Many groups look at GIS capacity as computers, software and data, but with GIS the most expensive thing is a person – not just their salary, but to have a person dedicated for a long period of time. This investment in GIS is a life cycle – at some point, someone else has to come in and take over when an employee leaves, and it takes a lot of sophistication.to.maintain.the.system.to.ensure.transferability.”
“GIS is not for everybody… We at GreenInfo don’t encourage too many groups to have internal GIS capacity because the track record [for this] has been poor throughout the years. Some have the people to run a good system. But usually after two years, especially for smaller groups, the funding is gone and they’ve developed their GIS in a very idiosyncratic way. We sit back and wait… and eventually they tend to rely on us or other consulting.groups.”
20
gis vs googlemaps vs microsoft virtual earth
GreenInfo.has.been.encouraging.some.of.their.client.groups.–.who.largely.remain.in.the.GreenInfo.network.years after their initial project is begun – to look at GoogleEarth, which they see as expanding what groups can do on their own. Yet on the whole this sort of free software doesn’t address the need of the action-oriented organizations, which is to create both web-based and interactive maps and.physical.tangible.maps.as.well..“If.you look at many nonprofits’ websites you may find static maps of their advocacy issues, but you often won’t find any good ones. While it’s ‘cool’ to have interactive stuff right now, a lot of these sites produce very poor printed maps. For most people having a really good paper map is by far the most effective use of a geographic image.” According to Orman, Microsoft and Google are increasing the arena of people who think geography is something.worth.heeding,.but.in.terms.of.GIS.functionality,.the.free.products.face.serious.limitations.
To some extent, says Orman, the advent of popular free mapping software is part of a longer term “developmental cycle.” Although it will take years for the technology to be both accessible and of a consistently high quality, Orman sees the current situation as a good thing. “It’s not bad that people are making terrible decisions about data or are making terrible maps on various interactive web sites. They’re learning about geography... In that sense, it’s good for people to have [any] tools. But to apply true GIS analysis to issues and communication, you still need to work directly with someone who can customize GIS for your own purposes.”
successful examples
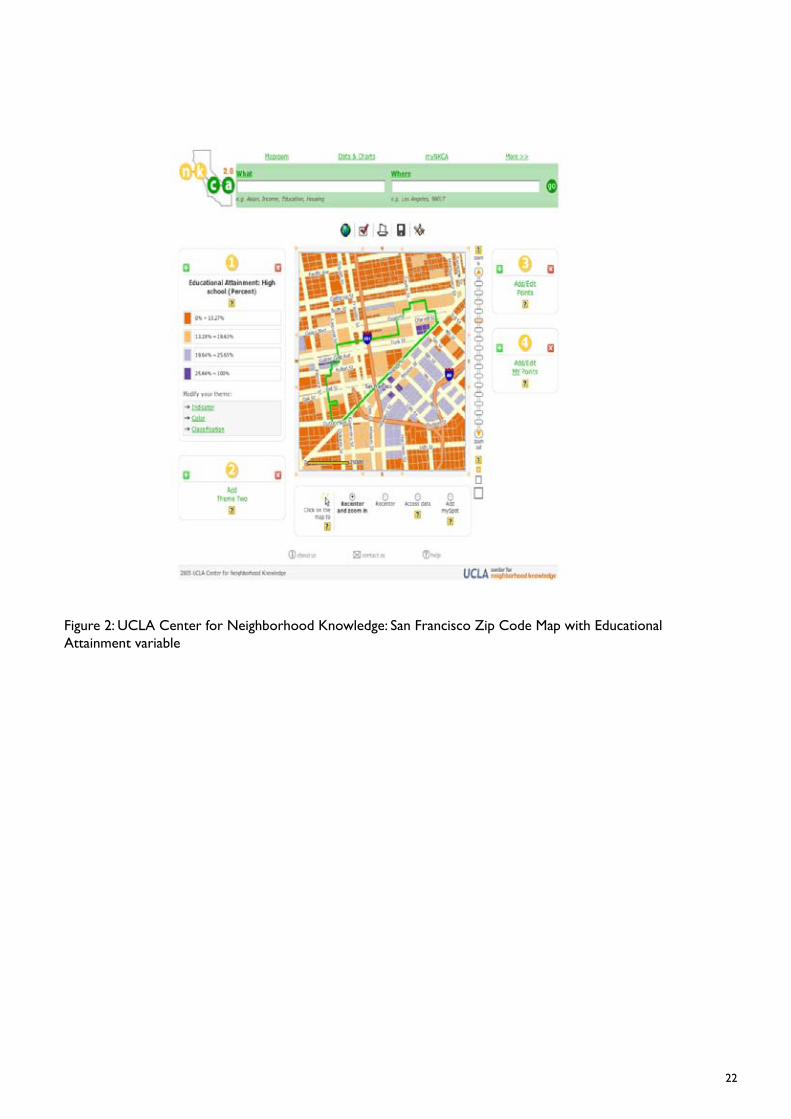
Orman cites a number of university-based groups who are conducting intelligent projects with GIS. Many academics have work connected to governmental and public-interest groups, and Orman sees a good deal of two-way exchange between the public and academic worlds. One such group is Neighborhood.Knowledge.California, based at University of California, Los Angeles, which has created an interactive website that maps a.number.of.demographic.data.sets.for.the.purpose.of.neighborhood.research..The.project.states.its.goal.as.“promoting greater equity in housing and banking policy by providing a set of web-based tools for documenting and analyzing trends,” and through its very colorful, clear site, offers the ability to search by variable (ethnicity, education level, income, etc) or by zip code. As an endeavor of the UCLA School of Public Affairs, the project not only forces demographic, educational and health issues into the policy arena, but as an interactive tool, it also encourages participation at every level.
The.Policy Analysis for California Education, or PACE, program at University of California, Berkeley has also undertaken a mapping project, “Mapping the Availability of Center-Based Care in Latino Communities.” Orman cites this particular project as a significant movement in university research, which traditionally has been “quite sophisticated at method and research, but weak in presentation.” PACE has employed GIS as one element in their.research,.which.typically.feeds.into.policy.debates..Rather.than.relying.upon.the.maps.as.an.end.result.of.their research, PACE has essentially chosen to use the maps to bolster their work and to encourage interest in their.research.topics.
The Transportation and Land Use Coalition, a GreenInfo client, sought to track the relative accessibility of public services (hospitals, schools, parks) throughout a number of counties in North-Central California via public transportation. In accordance with Orman’s descriptions of elements common in successful mapping projects, TALC’s Roadblocks.to.Health had already identified its research goals and did expected the mapping not to reveal, but rather illustrate, its findings. Users wishing to learn more about the organization’s research can visit the website and download the entire report, or view and print static maps focusing on supermarkets or community clinics in Contra Costa, Alameda or Santa Clara counties.
Despite the finite nature of this particular report, Orman sees the TALC project as a strong example of GreenInfo engagement, and sees an additional strength of the GIS group in its ability to develop a long-term mapping strategy: “Take a group like us to do the heavy lifting- then an organization needs only to periodically refresh data and internal training.” Orman sees this as an “appropriate level of engagement” for an NGO, with the ability to manage content but rely on programmers like GreenInfo for more complex tasks.
Web-based mapping, says Orman, is a good first step: “It can be useful for a first draft or to demonstrate to a public what an organization does at a basic level. Beyond that, at this point, it’s probably going to be too expensive to keep up, relative to its value to users.” But over time this cost-benefit relationship will likely

2�
improve. “Clearly, we are entering an age in which geography is part of the conversation much more than it was fifteen years ago. It’s unclear where this leads, but it’s a very encouraging prospect that geographic place is now so.central.on.the.web.”
Figure 1: Transit-Accessible Areas for Hospitals in Alameda County from TALC’s ..........Roadblocks to Health study
22
.
Figure 2: UCLA Center for Neighborhood Knowledge: San Francisco Zip Code Map with Educational Attainment variable
23
OSI – GIS/Mapping ProjectCase Study: Human Rights Watch Off Target projectContact: Marc Garlasco, and John Emerson
Issue: Human Rights Watch has cultivated a powerful reputation in the activist world, but governments who claim their data are “a campaign of slander based on pure fantasy and imagination” rarely take its reports seriously.solutIon: Recruit a skilled military and GIS expert with significant experience and contacts within the US Department of Defense to employ maps and bolster HRW’s reports and analysis.
(adapted from interviews with Marc Garlasco, HRW’s Senior Military Analyst and John Emerson, graphic artist and activist)
Human Rights Watch, the independent, international nongovernmental organization, set out in 2003 to examine potential violations of international human rights law committed during the Iraq War. Considering violations perpetrated by US, British and Iraqi military units alike, HRW did not intend to pass judgment on the causes or justifications for the war itself, but focused on the progress made by both sides of the conflict to mitigate civilian casualties. After having documented US military tactics in both the Afghanistan and Yugoslavian armed conflicts, HRW hoped to consider whether the US had lessened its use of cluster bombs in civilian-populated areas,.or.whether.increases.in.these.cluster.munitions.actually.corroborated.lay.reports.of.killings.and.injuries.to Iraqi civilians.
As most HRW reports are commissioned in-house, they wanted to be able to go beyond publishing a text-based report, and create an impacting visual representation of the findings of its reports. Its catalyst for change, then, came in the guise of Senior Researcher Marc Garlasco. In early 2003 Garlasco had been in the last of his seven years at the Pentagon, where as a Senior Intelligence Analyst he covered Iraq and oversaw high-value targeting during the Iraq War. Having also recommended thousands of aimpoints on targets during Iraqi and Serbian operations during his tenure with the US military, Garlasco had intimate knowledge on the subject. Through.the.Department.of.Defense,.Garlasco.had.been.assisting.the.HRW.report.with.data.that.enabled.them to pinpoint the locations of the airstrikes, and in April 2003 left his work at the Government to join Human Rights Watch full-time.
Garlasco.had.relied.on.GIS.programs.and.satellite.imagery.at.the.Pentagon,.and.introduced.the.technology.to.his new colleagues at HRW, who were a little reluctant to spend such great amounts of money for ArcView program licenses. Yet, as Garlasco notes, “They were amenable [to using ArcView] once I showed them it would have a huge impact. Once I got their buy-in, [we decided to show] other people within the organization – to show them and convince them.” Speaking with HRW’s Asia Division, and convincing them that GIS software would prove helpful for their deforestation projects, Garlasco says he felt like “the champion of this cause within the organization,” but also knew that HRW’s interest in mapping software might ultimately extend beyond his own use in the Iraq study.
For the study, entitled “Off Target: The Conduct of the War and Civilian Casualties in Iraq,” HRW cited two objectives:
To identify and investigate potential violations of international humanitarian law (IHL) by the parties to the conflict, and To identify patterns of combat by those parties which may have caused civilian casualties and suffering that could have been avoided if additional precautions had been taken. (page 15)
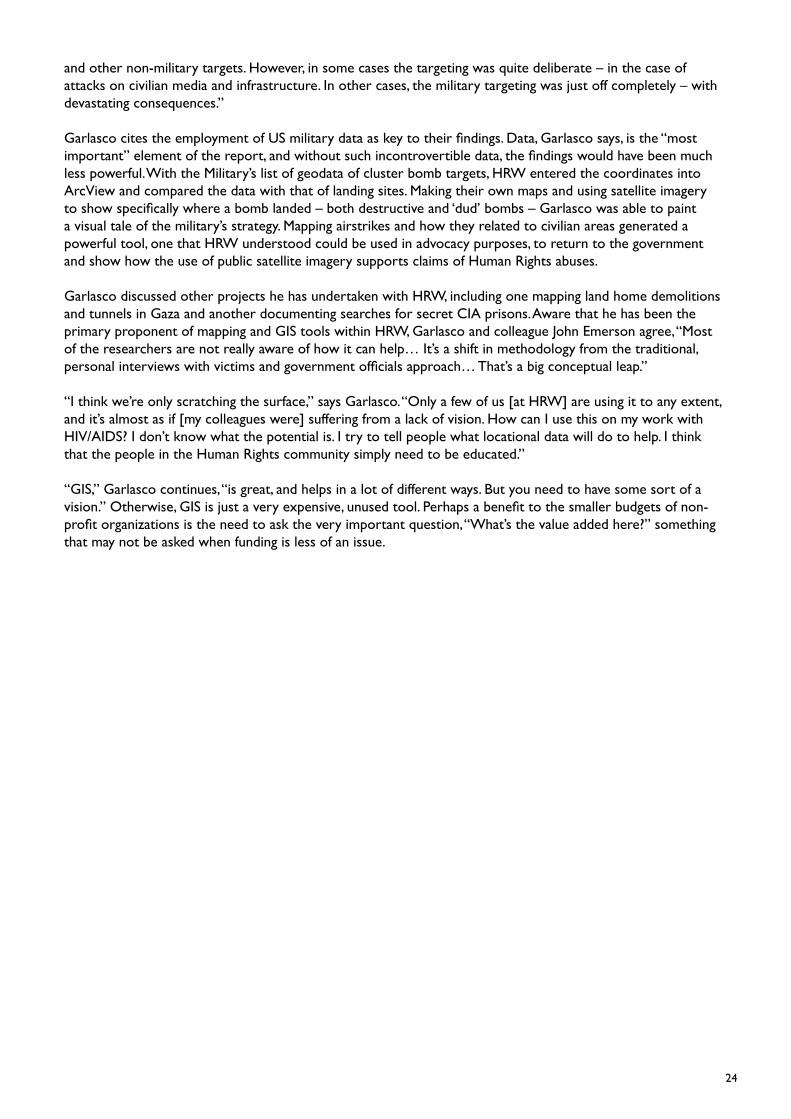
Garlasco and colleagues traveled to Iraq and visited several sites in and around Baghdad and Fallujah. Using a GPS handheld device, the HRW crew marked locations of bomb craters, cluster bomb drops and other collateral damage and interviewed both Iraqis and US military personnel for additional battle damage assessments. Back in New York, Garlasco mapped this data and drew conclusions for the report, which he co-authored, about the impact of the attacks on the civilian population. He had hired graphic artist John Emerson to help diagram some of the findings from pre-war satellite photos and shared his first-hand data collection as well. According to Emerson, “In many cases, US targeting was clearly oriented to avoid hospitals, schools
•
•
24
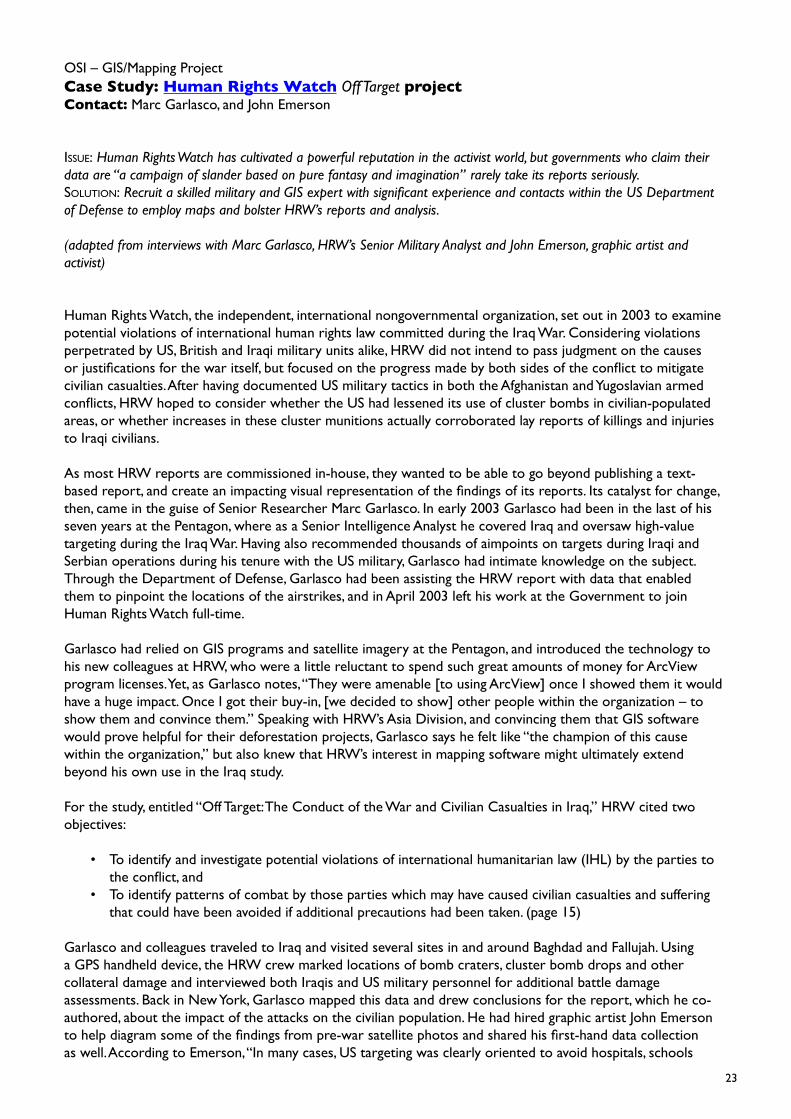
and other non-military targets. However, in some cases the targeting was quite deliberate – in the case of attacks on civilian media and infrastructure. In other cases, the military targeting was just off completely – with devastating consequences.”
Garlasco cites the employment of US military data as key to their findings. Data, Garlasco says, is the “most important” element of the report, and without such incontrovertible data, the findings would have been much less powerful. With the Military’s list of geodata of cluster bomb targets, HRW entered the coordinates into ArcView and compared the data with that of landing sites. Making their own maps and using satellite imagery to show specifically where a bomb landed – both destructive and ‘dud’ bombs – Garlasco was able to paint a visual tale of the military’s strategy. Mapping airstrikes and how they related to civilian areas generated a powerful tool, one that HRW understood could be used in advocacy purposes, to return to the government and.show.how.the.use.of.public.satellite.imagery.supports.claims.of.Human.Rights.abuses.
Garlasco.discussed.other.projects.he.has.undertaken.with.HRW,.including.one.mapping.land.home.demolitions.and tunnels in Gaza and another documenting searches for secret CIA prisons. Aware that he has been the primary proponent of mapping and GIS tools within HRW, Garlasco and colleague John Emerson agree, “Most of the researchers are not really aware of how it can help… It’s a shift in methodology from the traditional, personal interviews with victims and government officials approach… That’s a big conceptual leap.”
“I think we’re only scratching the surface,” says Garlasco. “Only a few of us [at HRW] are using it to any extent, and it’s almost as if [my colleagues were] suffering from a lack of vision. How can I use this on my work with HIV/AIDS? I don’t know what the potential is. I try to tell people what locational data will do to help. I think that.the.people.in.the.Human.Rights.community.simply.need.to.be.educated.”
“GIS,” Garlasco continues, “is great, and helps in a lot of different ways. But you need to have some sort of a vision.” Otherwise, GIS is just a very expensive, unused tool. Perhaps a benefit to the smaller budgets of non-profit organizations is the need to ask the very important question, “What’s the value added here?” something that.may.not.be.asked.when.funding.is.less.of.an.issue..
25
Figure 2: Baghdad: Attacks on State Media
26
Figure 2: Basra, Iraq: UK Cluster Munition Strikes on Hay al-Zaitun

27
OSI – GIS/Mapping ProjectCase Study: Kofiase, Ashanti Region, Ghana – Conflict ManagementPerson Contacted:.Peter.Kwaku.Kyem
Issue: How can native groups come to terms with state officials in the management of forests in the Ashanti region of Ghana?Solution: A Ghanaian-born, US-based GIS Expert works with local groups to develop mutually agreeable maps that provided a forum for foresters and representatives of local community groups to jointly plan and collaborate to protect local forests.
(Adapted from a series of interviews with Dr. Kyem and from his article, “Promoting Local Community Participation in Forest Management through the Application of a Geographic Information System: a PPGIS experience from Southern Ghana “)
Dr. Peter Kyem, a professor of geography and GIS technology at Central Connecticut State University in New Britain, was acutely aware of the reputation that academics had gained for swooping into the developing world, conducting research, and quickly leaving. Yet for his own PhD research, Kyem could not resist the urgent need for transferring his skills to people in his own homeland, Ghana. Eschewing his hometown of Bibiani to work instead in the larger Ashanti region of the country, Kyem sought to carry out a study on alternative uses of GIS..The.participatory.GIS.(PGIS).project.was.intended.to.foster.local.capacity.building.in.GIS.applications..The.project.was.also.implemented.to.study.the.myriad.issues.surrounding.ownership.of.forested.lands.and.apply.map-based approaches to resolve conflicts and facilitate discussions between local farmers and foresters in the rehabilitation.and.protection.of.local.forests.
The Ghanaian system of forest reserves was established to protect cocoa farms in southern parts of the country from harsh, dry winds from the north, and to also ensure a future supply of timber. Yet the law establishing the forest reserves maintained local ownership of the lands despite state tenure of the forest reserves. Over time, as urban areas grew, the demand for forest resources increased exponentially. This aside, unfavorable environmental conditions and frequent forest fires drove native communities to seek greater control of local forest land, turning some protected forests into food farms. Conflicts have thus arisen over land use across Southern Ghana, pitting local farmers against forestry officials and people with a greater commercial interest in the forest. In 1990, the Ghanaian government adopted a new land use policy that sought to integrate local.community.groups.into.the.management.of.the.forests.but.mistrust.between.local.farmers.and.foresters.threatened.this.new.partnership.
Motivated by the proposed favorable changes in official forest management practice and the presence of GIS.and.remote.sensing.facilities.within.the.Forestry.Department,.Kyem.and.his.colleagues.designed.a.PGIS.project and implemented it in the area to facilitate the establishment of collaborative forest management institutions in the country. Kyem first identified stakeholders within the town of Kofiase and used them to establish a Collaborative Forest Management Committee (CFMC). The group comprised of fifteen natives and six professional foresters, who together represented various interest groups all with interest in the outcome of the forest management project. After this, a series of participatory exercises were planned for members of.the.forest.committee,.including.stakeholder.analysis,.historical.and.participatory.mapping,.ranking.and.brainstorming. Each stakeholder analysis activity helped to gauge interest in different elements of the project, allowing discussion to include, for example, the low level of official input by locals, despite their relatively high understanding of and experience in local forestry issues. The CFMC thus initiated a dialogue between contentious groups where only hostile conversation had previously existed. Building upon this foundation, Kyem explained the concepts behind participatory GIS mapping and instructed the group in the interpretation of GIS-designed maps.
Members of the forest committee were then led to draw maps of their community and its surroundings on the clay ground to depict the geographical location of their village, then the forest, its land cover categories and the location of known resources within the reserve. The maps were later transferred onto a paper flip chart, and finally digitized into the GIS program where it was fitted with geographic coordinates to facilitate further discussions. “I did much of the mapping, but I explained every aspect of the process to the participants,” Kyem

2�
says..“I.remained.neutral.and.tried.to.show.them.how.the.maps.were.a.neutral.tool,.but.that.when.we.plugged.the subjective information into the ArcView GIS program, they could see the manifestation of their own ideas and.preferences.”.
Earlier in the discussions, the brainstorming exercise had revealed two serious threats against the local forest. These were annual wild fires that had degraded much of the forest and a dispute between a local businessman and his supporters who wanted to log the forest and several inhabitants of Kofiase who were against the logging. As part of the participatory mapping exercise, Kyem led the group to prepare a fire hazard risk map of the forest for use in monitoring fire outbreaks within the reserve. By this time, the mapping exercises had.prepared.the.grounds.for.negotiation.between.the.two.factions.in.the.forest.logging.dispute..Kyem.had.therefore invited the groups to a series of meetings to attempt a management of the conflict with GIS. Using physical, tangible maps to illustrate the conflict allowed the groups to see not only where they diverged, but also locations within the forest where they shared common interests. “As a conflict management tool, we found that one great advantage the GIS held was with the farmers – when they focused their minds on the maps, the bickering stopped. They realized they couldn’t talk without substantiating their words with data… Cross-classifying data to create a conflict map of preferences from both parties helped to redirect the focus of discussions.on.areas.in.the.forest.where.disagreement.occurred.between.the.two.groups..”.
To evaluate the PGIS project, Kyem prepared questionnaires and gave them to members of the forest committee to survey expected contributions of GIS and participants’ feelings about the efficacy and relevance of the technology. The evaluation revealed that although the majority of committee members had expressed reluctance or disdain for GIS prior to the project, the simple and effective applications of the technology led to a complete reversal, and most participants expressed satisfaction with the role GIS played in the exercise. They were also pleased that GIS helped to enrich the communications among the adversarial factions in the committee.
After fifteen months in Ghana, Kyem returned to the US, distributing maps to the entire CFMC prior to his departure. Having hard copy maps in their possession permitted each group to recognize both the firmness of their own needs and the relative similarity of their positions. The relative neutrality of the maps, with their depiction and analysis of empirical facts, helped to reinforce and give value to the cultural and social beliefs of the involved parties. The villagers called this a form of “empowerment,” paving the way for their inclusion in forestry management and protection. The GIS helped to catalyze the collaborative and consensus building processes.for.the.project,.but.did.not.function.as.a.substitute.for.them..It.also.helped.not.to.limit.the.issues.at.stake exclusively to land and resource management.
Unfortunately, upon Kyem’s return to Ghana two years later, he found that the local committee had fragmented and no final resolution had been met between local farmers and the Department of Forestry. Many of the committee.members,.particularly.the.youth.who.had.been.eager.to.cut.down.forest.timber.for.economic.opportunity, had moved to larger cities and others who remained had begun to abuse the power bestowed upon them as members of the forest committee. Although Kyem still sees the Kofiase work as a great example of PGIS work, he feels that the success of the project would have been ensured in the longer term had there been involvement from a local NGO. Harnessing the enthusiasm of a local nonprofit organization dedicated to the cause would have seen the problem through to its resolution. The organization would have also utilized the GIS and mapping technologies for additional scenarios that could have empowered the underprivileged groups within the community. As Kyem suggests, ideally the stakeholders in the situation would use the technology as supportive of their cause: “We have to think like activists.”

29
Figure 1: Aboma Forest Reserve- Landcover Types.

30
Figure 2: Aboma Forest Reserve- Cross-classified Map for Logging and Forest Preservation Objectives

3�
OSI – GIS/Mapping ProjectCase Study: Southern Echo, Inc.Person Contacted: Mike Sayer
iSSue: A grassroots organization based in Mississippi has access to census data and other government figures, but no way to utilize this information for its community empowerment work.Solution: A grant from a technology non-profit offers the group training and advanced GIS software so that it can visualize its data and, in turn, train other grassroots organizations throughout the South.
(adapted from an interview with Michael Sayer, Southern Echo Executive Director)
“GIS made sense to us because of the uses to which we put it. The manual we made for [a regional conference] – we had 25-30 pages of maps and charts – it enabled people to visualize issues they’d never be able to understand with straight text. In a culture in which reading skills have been systematically diminished, visualization is very powerful for people.”.
– Mike Sayer
Southern Echo is a non-profit organization based in Jackson, Mississippi. Founded in 1989, Echo defines itself as “committed to building new, accountable grassroots leadership and organization, based on an inter-generational model, through training, technical and legal assistance.” The organization has predominantly focused on black and low-income communities throughout eleven states in the Deep South, concentrating on rural counties in the state of Mississippi. According to Michael Sayer, Echo’s Co-Founder, Senior Organizer and Training Coordinator, the organization’s primary activity has been in community organizing, empowering communities through local representative groups.
The majority of Echo’s constituents are low-income citizens, most of whom have been disenfranchised by constitutional provisions, court decisions, force and violence, and economic and social intimidation. Echo has sought to empower these communities by offering them a chance to build up grassroots organizations and leadership at the local level, and ensure that their voices are heard by State and Federal governing bodies. In 1991-2, through many public hearings held by the Mississippi state legislature, Echo encouraged hundreds of black citizens, who had had no prior opportunity to participate in policy creation, to participate and publicly express unity around a common strategy and set of outcomes. Echo’s redistricting work grew out of this organizing work, designed to empower the community. As Sayer points out, “The primary goal was empowerment:.the.creation.of.fair.districts.in.which.the.black.community.had.a.reasonable.opportunity.to.elect representatives who would be accountable to the community was a means to that end.” According to Sayer, “The creation of visuals – i.e. redistricting maps – was not original or unusual. All redistricting must include maps of the proposed districts, and especially of the plans that are finally adopted. What was ‘original’ about our approach was enabling grassroots communities to come onto the playing field knowledgeable about their right to participate, the rules of the games, how redistricting was done, and to be involved in the decision-making process that led to the adoption of redistricting plans as public policy.” The redistricting maps for the state legislature and congressional seats were presented first to the community, and then to the state legislature.
Sayer and his colleague, Echo Co-Founder Hollis Watkins, constructed massive state maps by hand, outlining census block-level detail and accounting for the true number of voting-age black Mississippians. The central issue was to could create a district in which black Mississippians, where they were a clear majority of the population in the Delta region of the state, could have a reasonable opportunity to elect a representative who.would.be.accountable.to.their.needs.and.interests..Working.through.the.night,.the.two.men.ultimately.presented their accurate map at the state and local level, with positive results. The relative success suggested that these efforts could be replicated for other legislative districts, but the scope of the project was so vast, neither Southern Echo nor any other grassroots group would be able to map them again by hand. By 2001, Echo decided that they needed access to advanced technology to accomplish their mission.
Echo submitted a grant application to the Progressive Technology Project (PTP) for $50,000 – the largest proposal they’d received at that time. PTP awarded the grant based on what Echo had been doing and what
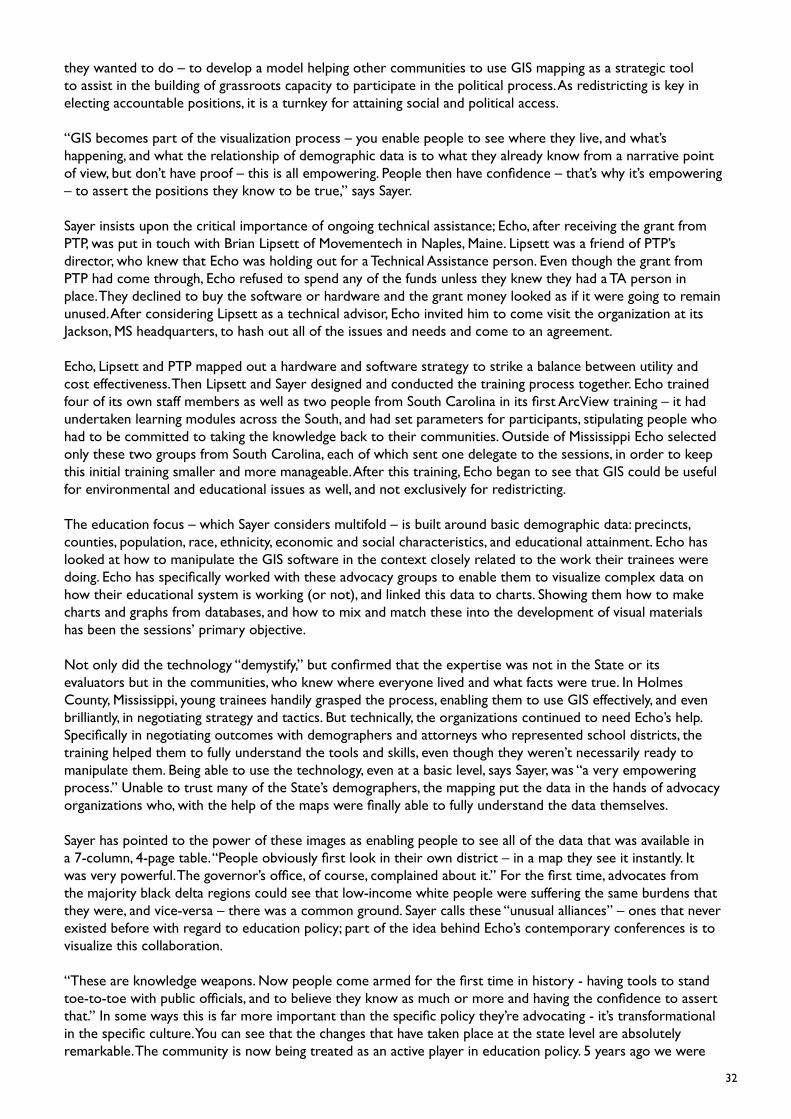
32
they wanted to do – to develop a model helping other communities to use GIS mapping as a strategic tool to assist in the building of grassroots capacity to participate in the political process. As redistricting is key in electing.accountable.positions,.it.is.a.turnkey.for.attaining.social.and.political.access...
“GIS becomes part of the visualization process – you enable people to see where they live, and what’s happening, and what the relationship of demographic data is to what they already know from a narrative point of view, but don’t have proof – this is all empowering. People then have confidence – that’s why it’s empowering –.to.assert.the.positions.they.know.to.be.true,”.says.Sayer.
Sayer insists upon the critical importance of ongoing technical assistance; Echo, after receiving the grant from PTP, was put in touch with Brian Lipsett of Movementech in Naples, Maine. Lipsett was a friend of PTP’s director, who knew that Echo was holding out for a Technical Assistance person. Even though the grant from PTP had come through, Echo refused to spend any of the funds unless they knew they had a TA person in place..They.declined.to.buy.the.software.or.hardware.and.the.grant.money.looked.as.if.it.were.going.to.remain.unused. After considering Lipsett as a technical advisor, Echo invited him to come visit the organization at its Jackson, MS headquarters, to hash out all of the issues and needs and come to an agreement.
Echo,.Lipsett.and.PTP.mapped.out.a.hardware.and.software.strategy.to.strike.a.balance.between.utility.and.cost effectiveness. Then Lipsett and Sayer designed and conducted the training process together. Echo trained four of its own staff members as well as two people from South Carolina in its first ArcView training – it had undertaken.learning.modules.across.the.South,.and.had.set.parameters.for.participants,.stipulating.people.who.had to be committed to taking the knowledge back to their communities. Outside of Mississippi Echo selected only.these.two.groups.from.South.Carolina,.each.of.which.sent.one.delegate.to.the.sessions,.in.order.to.keep.this initial training smaller and more manageable. After this training, Echo began to see that GIS could be useful for environmental and educational issues as well, and not exclusively for redistricting.
The.education.focus.–.which.Sayer.considers.multifold.–.is.built.around.basic.demographic.data:.precincts,.counties,.population,.race,.ethnicity,.economic.and.social.characteristics,.and.educational.attainment..Echo.has.looked at how to manipulate the GIS software in the context closely related to the work their trainees were doing. Echo has specifically worked with these advocacy groups to enable them to visualize complex data on how.their.educational.system.is.working.(or.not),.and.linked.this.data.to.charts..Showing.them.how.to.make.charts and graphs from databases, and how to mix and match these into the development of visual materials has been the sessions’ primary objective.
Not only did the technology “demystify,” but confirmed that the expertise was not in the State or its evaluators but in the communities, who knew where everyone lived and what facts were true. In Holmes County, Mississippi, young trainees handily grasped the process, enabling them to use GIS effectively, and even brilliantly, in negotiating strategy and tactics. But technically, the organizations continued to need Echo’s help. Specifically in negotiating outcomes with demographers and attorneys who represented school districts, the training helped them to fully understand the tools and skills, even though they weren’t necessarily ready to manipulate them. Being able to use the technology, even at a basic level, says Sayer, was “a very empowering process.” Unable to trust many of the State’s demographers, the mapping put the data in the hands of advocacy organizations who, with the help of the maps were finally able to fully understand the data themselves.
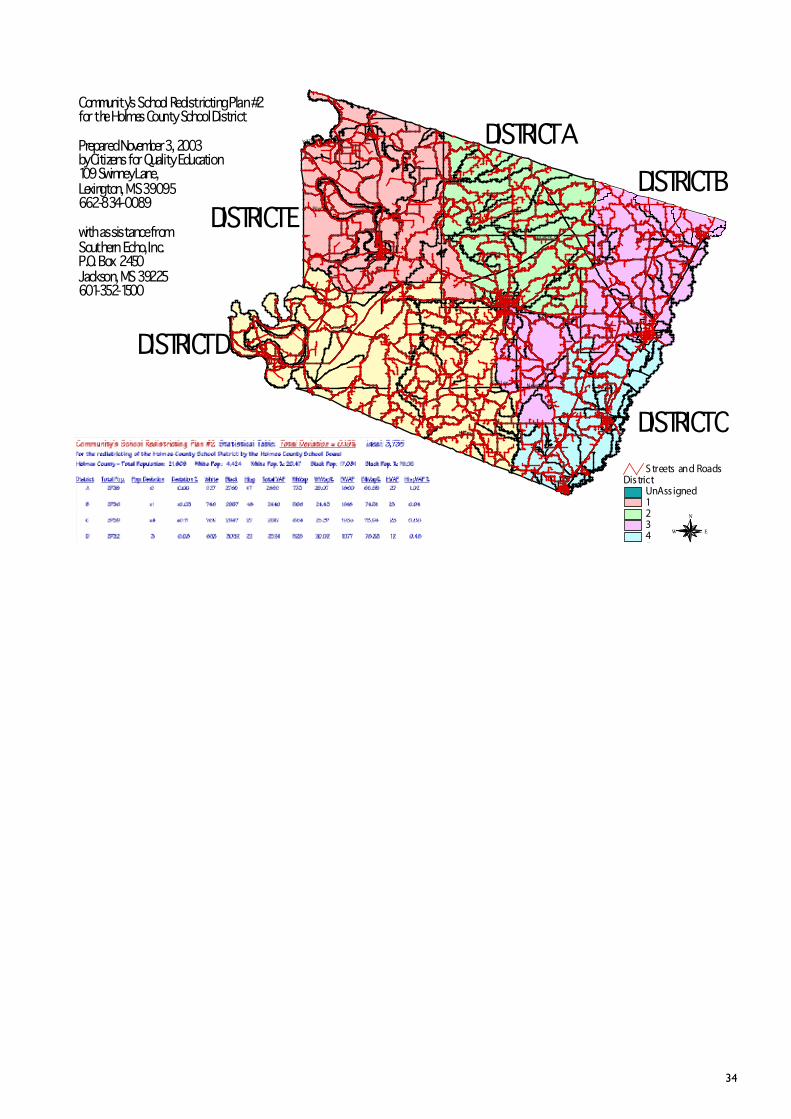
Sayer has pointed to the power of these images as enabling people to see all of the data that was available in a 7-column, 4-page table. “People obviously first look in their own district – in a map they see it instantly. It was very powerful. The governor’s office, of course, complained about it.” For the first time, advocates from the majority black delta regions could see that low-income white people were suffering the same burdens that they were, and vice-versa – there was a common ground. Sayer calls these “unusual alliances” – ones that never existed before with regard to education policy; part of the idea behind Echo’s contemporary conferences is to visualize this collaboration.
“These are knowledge weapons. Now people come armed for the first time in history - having tools to stand toe-to-toe with public officials, and to believe they know as much or more and having the confidence to assert that.” In some ways this is far more important than the specific policy they’re advocating - it’s transformational in the specific culture. You can see that the changes that have taken place at the state level are absolutely remarkable. The community is now being treated as an active player in education policy. 5 years ago we were

33
treated dismissively. 10 years ago we were treated with hostility. 15 years ago we were persona non grata..Now.we’re treated as players with a significant role to play because the organizing process has taken hold. And the alliance across race and class lines had been the establishment’s worst nightmare. We’d have to adapt and adjust rapidly to the opportunities so we could take advantage of them rather than being too taken aback.”
Sayer acknowledges that without the activists interested in the movements – redistricting, public education, environmental stewardship – the maps would be meaningless. Yet the fact that the data used in all of their projects and their trainees’ projects was all publicly available speaks to the incontrovertible nature of the maps. “We’re way beyond ‘the rhetoric of protest,’” says Sayer. “It’s not about good guys and bad guys, we’re talking about what policies are needed and how we get there. It’s a material shift in the center of gravity of the subject. We were fighting to get on the playing field and now they’re asking us our opinions on the policies.”
34
DistrictUnAss igned12345
S treets and Roads
N
EW
S
Community's School Redistricting Plan #2for the Holmes County School District
Prepared November 3, 2003by Citizens for Quality Education109 Swinney Lane, Lexington, MS 39095662-834-0089
with assistance from Southern Echo, Inc.P.O. Box 2450Jackson, MS 39225601-352-1500
DISTRICT B
DISTRICT A
DISTRICT C
DISTRICT E
DISTRICT D I -55
Emory
Ebe
neze
r
Howar d
Brozv
ille
Hebr on
Love
Hill
side L
evee
B el mont
Helm Salem
Bowlin
g Gre
en
S tat e Hig hway 12
Old W ilson
B ee Lake
P rovid ence
Doe
St ate Par k
Jones
St ate High way 14
Old Hwy 49
F owler
Ho pe W ell
W ash Bailey
Newpor t
Beulah
Gr ov
e
State Highway 17
E benezer -C oxbur g
New Hope
Meeks
Springhill
Ellis
United
Stat
es High
way 5
1
Ables
R at hell
C ast al ian Spr in gs
Str oud
Eddisville
C ooper
Holem
an
Blissdale
Holly G rove-M eek s
Chinqup
in
Franklin
Thorton T
olarsville
R andl e
E pps
Sand Hill
E gypt
Chr istmas P
lace
Jam es
C oxbur g
BristerEllington
Blistar
R ockpor tDawson
Pinchback
B ent ley
Galil ee
W ells
United States H
ighway 49
E
C hur ch
Mann
Tru
ly
J ef fer son
Phillip
s
Dam ascu s
Huckleberry
Rosebank Mt Olive
Pilgrim Rest
Sweetwater
Phillipston
Douglas
Richard T
ravis
St r an
Dav
is
E benezer- Pickens
Pr ice
Lin den
Bell B ot tom
Ar eniac M allor yPin e
H D
avis
Quafalom
a
Hurt
Bell
V R oger s
K imbr ou gh
Oak Grove
Pilgr im
F ield
Front
Jef f Dodd
Eulogy
1st
Noel
Hart
W ren
Y el low B luff
Okla ho ma
Shady Grove
Chis
olm
Sudbeck
R andletown
Bush
Stoc
kyard
Cr eek
Milestone
Shu te
Pea RidgeG
riffin
Dixon
Main
Carroll
Pullet
Pierce
Fall s
Molly M oore
Jesse Crawford
Peacock
Floyd
Outside Horseshoe
High C ott on
Queenie M Johnson
Upper Lou isville
Teal
Langfor d
R ayner
Eastern
R C Malone
Banks
Race Track
M el ton
County Line
D C C
onn
Owl
Doc Dav is
J ohnson
J C unningham
B oulevar dSt okes
Clark
Rogers
Y azoo R iver L evee
Lewis
L ower L ouisville
Rushbrook
Willi ams
Slack
Th omas
Meggs
Madison
Ferguson
Deer
B Pa rk s
Ro sch
McGee
Vine
Watkins
Bison
Bain
Marcella O
rego
n
L ongland
Campbell
Mt O
live
B ig Ma n
Pipeline
C ut
Hathcock
Inside Bee Lake
A cona
W r ight
Hathorne
Pettus
Simpson
Swinney
Old W
heeling
La cy
A ld y
Rat liff
Howard Price
Lewis
35
N
EW
S
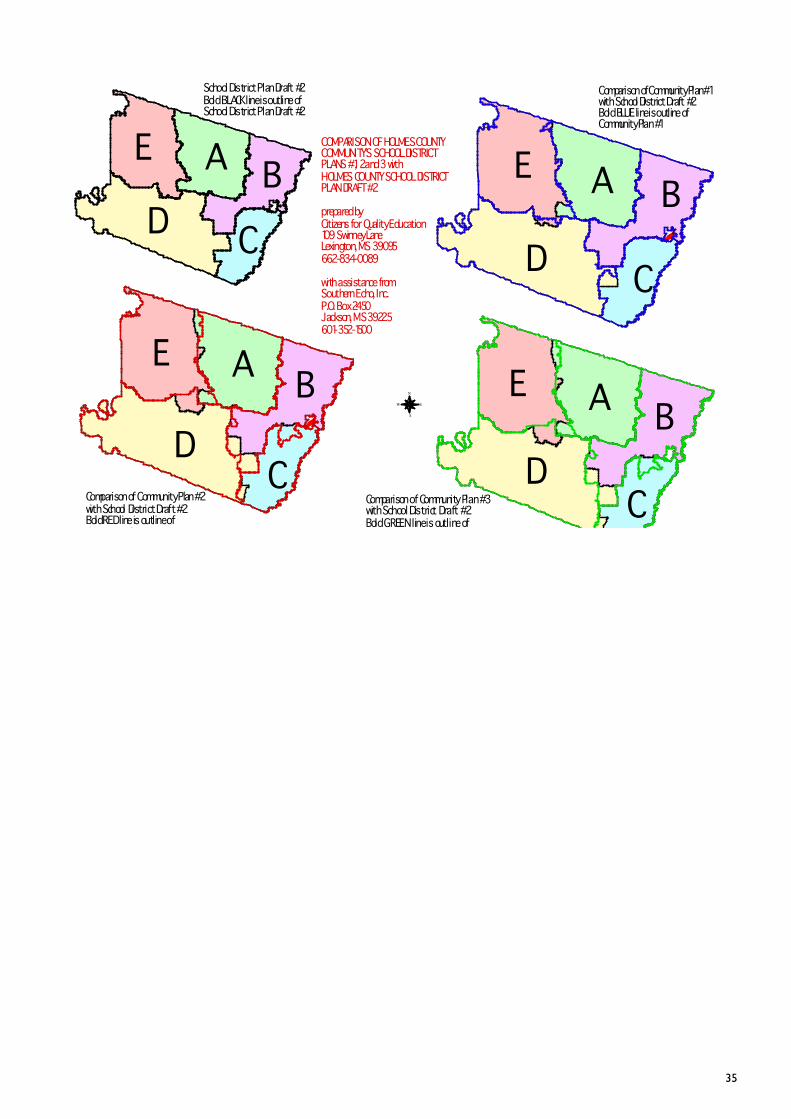
Comparison of Community Plan #1with School District Draft #2Bold BLUE line is outline ofCommunity Plan #1
Comparison of Community Plan #2with School District Draft #2Bold RED line is outline ofCommunity Plan #2
Comparison of Community Plan #3with School District Draft #2Bold GREEN line is outline ofCommunity Plan #3
School District Plan Draft #2Bold BLACK line is outline ofSchool District Plan Draft #2
COMPARISON OF HOLMES COUNTYCOMMUNITY'S SCHOOL DISTRICTPLANS #1, 2 and 3 withHOLMES COUNTY SCHOOL DISTRICTPLAN DRAFT #2
prepared byCitizens for Quality Education109 Swinney LaneLexington, MS 39095662-834-0089
with assistance fromSouthern Echo, Inc.P.O. Box 2450Jackson, MS 39225601-352-1500
A B
CD
E E
D C
BA
E
DC
BA E
DC
BA
36
OSI – GIS/Mapping ProjectCase Study: Stamen Design – MoveOn.orgPersons Contacted:.Eric.Rodenbeck,.and.Eli.Pariser
Issue: Two large advocacy organizations fear that their communities have become fragmented throughout the country. How can they re-mobilize their support?solutIon: Hire an innovative San Francisco-based graphic design firm to create dynamic maps facilitating live chats and documenting user experiences at rallies and marches..
(Adapted from interviews with Eric Rodenbeck, Stamen Design founder and lead designer and Eli Pariser, MoveOn’s Executive Director)
Stamen Design, a boutique graphic design firm in California, spent a good portion of its time engaged in experimental work, exploring the boundaries of technology and design. Having worked on a number of data visualizations, including a mapping of the images in the data set of the Flickr website, Stamen developed a “narrative map” of its San Francisco street corner and posted it online. Utilizing real-time data, the site explored interactivity in a type of socio-technological study and caught the eye of MoveOn, a family of political action-oriented organizations.
Since its inception in 1998, MoveOn has been using the web in innovative ways previously unknown to nonprofit organizations. From launching online petitions to soliciting campaign donations through secure web servers, MoveOn has consistently look for methods of connecting and strengthening their supporter base, and in demonstrating the efficacy of their advocacy aims. They initially contacted Stamen to help realize an idea they had devised for a phone operation prior to the Iraq war, the “Virtual March on Washington.”
MoveOn assigned participants specific one-minute times at which to call their senators requesting that they vote against US involvement in the war. From 9-5 on the designated day, MoveOn members telephoned their senators literally every minute, non-stop. Stamen followed MoveOn’s ideas and developed a map which ran live online throughout the day. Every minute the map requested a different series of call subjects and then displayed the location of each caller on a US map, along with the content of their call. As Eli Pariser, MoveOn’s Executive Director, notes, “People have trouble conceptualizing what 100,000 people looks like, or what ‘all across the country’ truly means.” The visualization of the sheer enormity of the numbers of participants got people to pay attention to MoveOn’s message, more powerfully than mere statistics on the activity.
Stamen acknowledges that as opposed to their own studies of the boundaries of technology’s capacity, MoveOn’s project was much more deliberate, even defiant. Designed to demonstrate broad opposition to the Bush administration’s enthusiasm over an Iraqi conflict, MoveOn and Stamen’s map project received tremendous feedback, largely from the media and from the organization’s own supporters.
Over the course of the next two years, Stamen developed at least two dozen maps for MoveOn. “We rarely developed a list of specs,” says Rodenbeck, Stamen’s founder and lead designer. “MoveOn would come to us with an event and together we worked on a way to figure out how to map it or visualize it.” These events ranged from candlelight vigils prior to the Iraq war to house parties with activist film screenings to bake sales. User participation in some of the interactive maps hit over 27,000.
With each project the maps became more advanced and increasingly responsive. During one planning meeting Wes Boyd, MoveOn’s Founder and Executive Director, wondered allowed whether it would be possible to increase the interactivity between the members and the organization as a whole. Stamen had already been working to improve upon the complexity and capability of the maps, and were ready to establish a “town hall” mechanism, by which announcers at MoveOn headquarter, via a live audio stream integrated into the map, would announce a question and provide a form for response. This live feedback visualization enabled members not only to pose questions to filmmakers, politicians and pundits but allowed them to view others’ questions as well. As Rodenbeck says, “this let the community see itself in a way it couldn’t before, which is a remarkable feeling. Not only is there a ‘I’m that dot in San Francisco’ response, but also ‘I can see that there’s something [similar] going on in Reno, Boston – all over the country.’”
37
In a twist on the project’s interactivity, Stamen eventually added another function to their MoveOn maps, enabling users to respond to the maps themselves. They were therefore able to use the map as a feedback mechanism for map capabilities. Although a frequent user request was to improve upon the ability for members to communicate with other people on the map, MoveOn made it clear that it wished to facilitate local, personal meet-ups rather than virtual ones. The power in the mapping project lay not in its ability to establish regional groups but to solidify the community on a national level.
Working alongside MoveOn in the development of each subsequent map, Stamen ultimately ceded control over the technology, passing it on to MoveOn staff to create and manipulate future maps in-house. Pariser believes this has met MoveOn’s goals to make their online tools available to all prospective partners in their advocacy work. He acknowledges, however, that mapping is still somewhat embryonic in his world: “I think it’s useful in this context to give people a sense of the breadth of the campaigns, but I’m not sure if we’re doing more [than that]. There’s a lot of room for innovation, and it’s a powerful toolset that I don’t think we’ve fully figured out.”

3�
Figure.�:.West.Coast,.7:43pm.PDT.East.Coast,.5:�9pm.PDTQuestion was asked of participants: “As someone who hasn’t been to an event like this before, tell us – in one sentence.–.why.you.came.”.Participant.answers.were.displayed.on.the.map.in.real.time..

39
Figure.2:.West.Coast,.7:43pm.PDTAn example of the mechanism used to solicit feedback from conference participants.
Figure.3:.West.Coast,.7:52pm.PDTParticipant responses to questions are displayed on the map in real time.
A full set of screenshots describing the initial use of the mapping application is available at:http://clients.stamen.com/moveon_screenshots/

40
OSI – GIS/Mapping ProjectCase Study: Relationship mappingPerson Contacted: Ali Gharavi, Center for Victims of Torture.
Issue: The Center for Victims of Torture tried to comprehend how torture continues to be widespread throughout the world – how, indeed was this possible?solutIon: The group developed a new concept, ‘tactical mapping,’ which allows for a visualization of the many and complex relationships. Only then did they understand how mutually reinforcing the abusive relationships were as well as the many potential points for intervention.
(Adapted from interviews with Ali Gharavi, Technology Director, and Nancy Pearson, Training Manager, at Center for Victims of Torture)
The.Center.for.Victims.of.Torture.initiated.its.New.Tactics.in.Human.Rights.project.as.an.effort.to.lend.creativity and new perspectives to Human Rights issues. The New Tactics approach emerged out of CVT’s experiences working with the Human Rights community, and the recognition that “no single approach can disrupt the complex systems that sustain human rights abuses.”
Rather, by assisting the actors – and those trying to sever abusive relationships and links – to comprehend the multitude of contacts and parties involved, CVT believes they are then well positioned to create new and innovative strategies and tactics to combat torture and other human rights abuses.
Ali Gharavi, CVT’s Director of Technology, understands that this concept – tactical mapping – can sound both foreign and irrelevant to many of the Center’s constituents and partners. Having come from an engineering and software development background himself, Gharavi sees mapping as very much in line with strategic and analytical.processes:.“[Tactical.mapping].is.intriguing.because.a.user.should.be.able.to,.say,.create.software.that.renders this relationship and lets you navigate through the issue.” Essentially, tactical mapping borrows from engineering’s complex relationships and employs a visualization of these connections for an activist issue.
CVT understands that complex and technical issues frequently scare away non-technical groups and NGOs, and.therefore.has.tried.to.make.tactical.mapping.as.user.friendly.and.simple.as.possible..“We.use.the.tactical.mapping as a basic exercise – one of the first things we ask training groups to do is to create a tactical map of their own situation. They map out the terrain in which they’re working—identifying people, organizations, government and private institutions, etc—and then what activities bring them to other groups, and how you achieve certain results by interacting with these groups.”
In order to be “as low-tech as possible” but remain relevant and engaging for each group, CVT has conducted tactical mapping with pen and paper, flip charts and markers, and computer-based with Microsoft Powerpoint or Visio. “Basically, we’re mostly using Visio at the moment. You don’t want to be overly technical and preclude some people from using it, but it can be simple enough. We’re now in the process of engaging with partners in.a.number.of.pilot.projects.applying.the.tactical.mapping.process.in.countries.ranging.from.Turkey,.Liberia.to Mongolia. Through these varied applications, we’re seeking to come up with an electronic replicable tool to capture their paper-based maps electronically and then render them in a different perspective.”
The response to New Tactics has been overwhelmingly positive – Gharavi sees the tool as popular in part due to its simplicity, and in part because it is “one of the most tangibly appreciative things that people talk back to us about.” By creating a visual representation of what had previously been a nebulous concept, the project has “triggered.new.ideas.in.people.and.led.to.a.better.understanding.of.their.own.situations.”
“CVT started by gathering a group of experts in the field of torture prevention, sitting down and identifying all of the players in a scenario,” says Gharavi. “It started by identifying the relationship seeking to be changed: the perpetrator and the victim. Then following that relationship to the team of torturers, the police station, the judicial system, the government, the victim’s family and his doctor, etc. It starts pretty localized and then grows –for example, in Turkey, they looked at this skeleton of relationship networks and saw that there was one area with a missing link, one part that had gone unnoticed. This was the medical field – so the advocacy group then approached the national doctors’ association and together they came up with new and important ways of documenting.the.torture.that.had.gone.on.”.

4�
Gharavi agrees that it is difficult, frequently, for people.to.suspend.disbelief.and.accept.that.their.position relates to another’s that had initially appeared very foreign. “If you’re a farmer in Botswana, it’s hard to get you to listen about women’s rights issues in Myanmar,” but after the first leap of faith, it becomes one of the easiest concepts in identifying potential activity for Human Rights activists, and one of the easiest concepts to.grab.onto..“The.primary.purpose.of.the.New.Tactics.Project.is.to.get.people.to.think.more.strategically.and.to.get.more.insight.and.tactics.–.action.from.a.new.angle.”
In figure 1 below, the different colors of the map represent different relational groupings. For example, as Gharavi stated above, the orange colored circles and arrows represent the relationship between the torturer, the torture team, the medical doctor that examines the victim in the police station where the torture is occurring.and.connecting.back.to.the.police.education.and.training.institutions.which.train.the.police.for.the.field. These are all direct relational links to each other. The additional arrows represent other relational linkages flowing to and from these potential points of intervention and/or influence.
The tactical mapping process provides additional insights into other layers that can be explored, revealed and identified. For example, taking this initial map, an organization might choose to create a tactical map to follow the relationship flow in a specific police station in their community known or suspected to have a high incidence of torture. The organization may then identify a variety of tactics that “target” that police station for intervention or influence. For example, they identify the need to utilize tactics to gain entry into the police station, documentation.tactics.regarding.the.number.of.incidents.of.torture,.or.the.chain.of.command,.or.personal.and.institutional connections to governmental institutions for creating.access.and.policy.changes...Other.tactics.could.be.identified regarding how this information can best be shared in order to influence identified parties through media and public pressure. The tactical map allows organizations to identify the many potential points of intervention and influence where.tactics.might.best.be.applied.to.reach.their.goal..In.this.way, they can more clearly develop, pursue and adjust their strategy while choosing a variety of tactics to be employed.and.“targeted”.toward.impacting.those.relationships.in.the.direction.of.their.strategic.goal.
Comments.on.tactical.mapping.from.participants.in.the
New Tactics Asia Regional Training Workshop, August 2005
The new learning of tactical mapping is useful to me and could improve the structure of my daily work.
Tactical mapping was very good. That helped me to clarify who is my target [and] what is more effective.
It is a great opportunity to be here, for re-examining my tactic as well as learning new tactics from other people. Tactical mapping is very important for me to take back home to start a new program..
We have found the Tactical Map an impressive instrument for charting a fresh terrain which will be used to update our strategy. Using it, we have been able to improve the listing of our project allies more than 300%. The bird’s eye view of the clusters permits a visual appraisal that promotes quick judgment, as it offers a vantage point for planners to easily see how to build essential relationships. In our case, it has reinforced our strategy.
—New Tactics On-line Discussion Workshop participant from Nigeria, November 2005
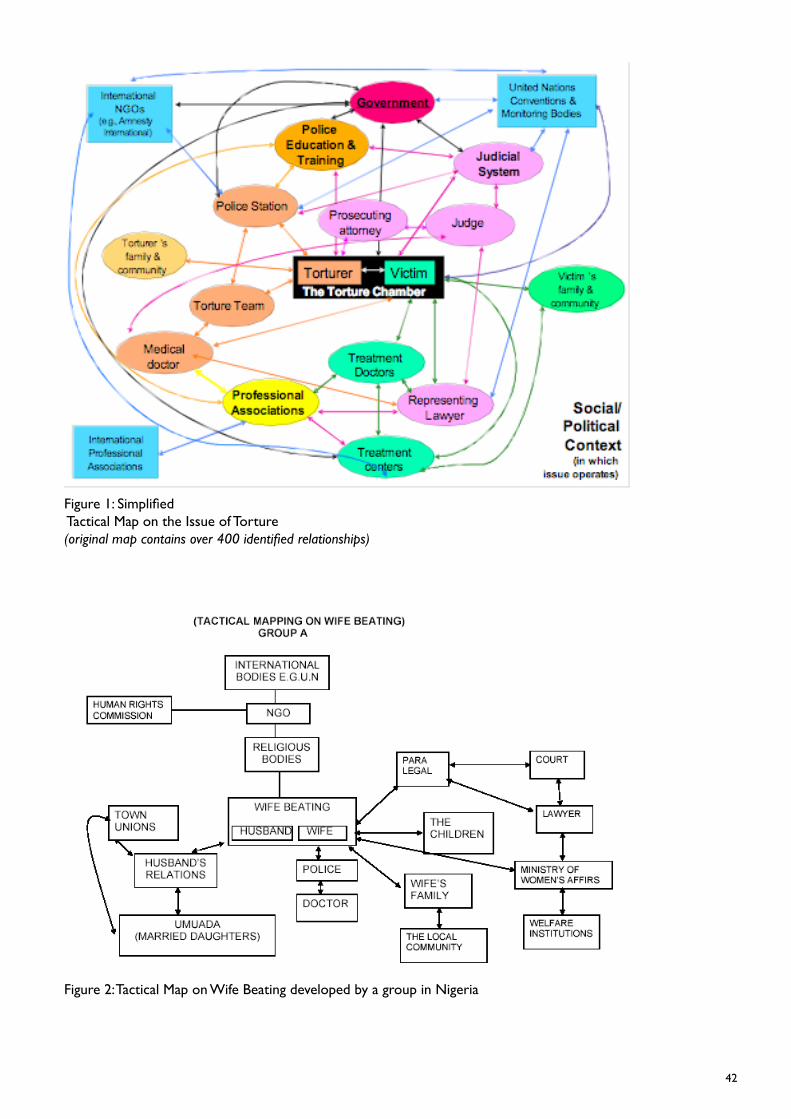
42
Figure 1: Simplified Tactical Map on the Issue of Torture (original map contains over 400 identified relationships)
Figure 2: Tactical Map on Wife Beating developed by a group in Nigeria

43
.
Figure 3: Example of a “Low tech” tactical map
This map was created on domestic violence at the Asia Regional Training Workshop in Chiang Mai, Thailand, August 2005. Using the tactical mapping process in small groups of ten people, the New Tactics project utilized a “low tech” method of moveable pieces of paper. This allowed the group to discuss the relational elements and move around these identified relational aspects until they were satisfied. Then they added the directional arrows for further clarification of how these related to each other. For an organization working on such an issue, taking this kind of “low tech” information from their brainstorming session and creating a computerized map would allow them to shift and change these relationships for future development and examination. They could maintain their original map, thus allowing another.layer.of.mapping.their.own.strategic.process.regarding.their.issue.
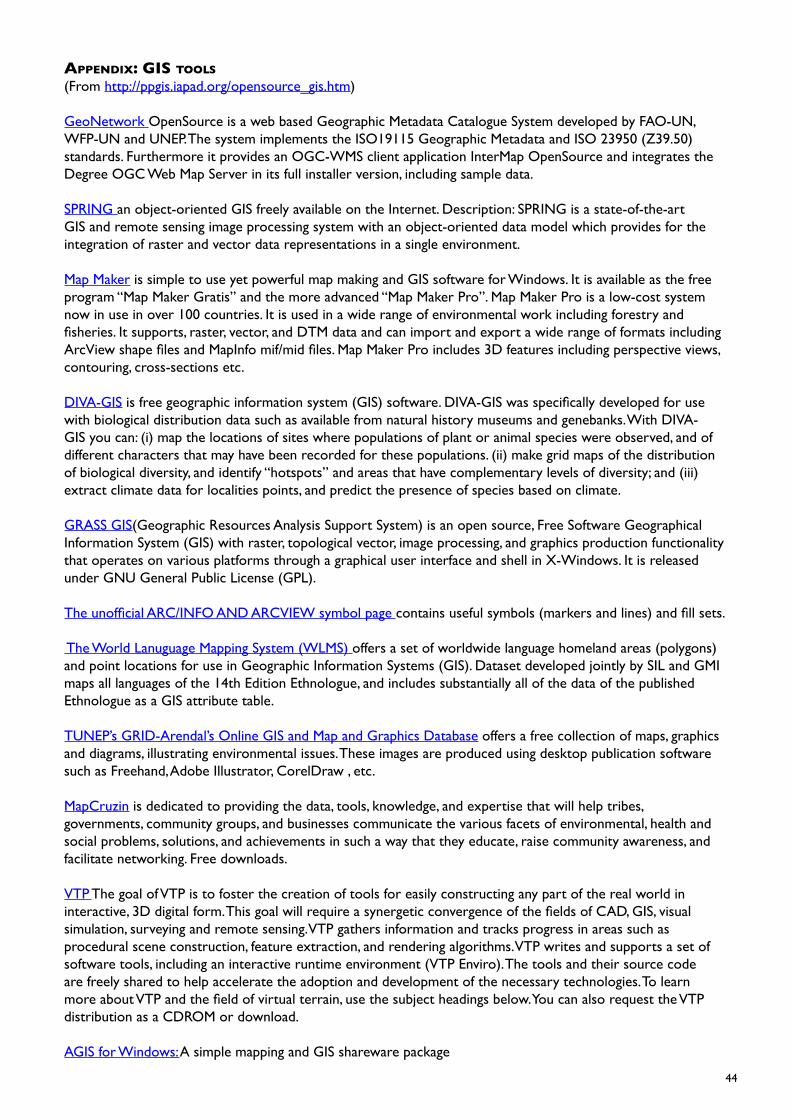
44
appendix: GIS tools
(From.http://ppgis.iapad.org/opensource_gis.htm). .GeoNetwork.OpenSource is a web based Geographic Metadata Catalogue System developed by FAO-UN, WFP-UN and UNEP. The system implements the ISO19115 Geographic Metadata and ISO 23950 (Z39.50) standards. Furthermore it provides an OGC-WMS client application InterMap OpenSource and integrates the Degree OGC Web Map Server in its full installer version, including sample data.
SPRING.an object-oriented GIS freely available on the Internet. Description: SPRING is a state-of-the-art GIS and remote sensing image processing system with an object-oriented data model which provides for the integration of raster and vector data representations in a single environment.
Map Maker is simple to use yet powerful map making and GIS software for Windows. It is available as the free program “Map Maker Gratis” and the more advanced “Map Maker Pro”. Map Maker Pro is a low-cost system now in use in over 100 countries. It is used in a wide range of environmental work including forestry and fisheries. It supports, raster, vector, and DTM data and can import and export a wide range of formats including ArcView shape files and MapInfo mif/mid files. Map Maker Pro includes 3D features including perspective views, contouring, cross-sections etc.
DIVA-GIS is free geographic information system (GIS) software. DIVA-GIS was specifically developed for use with biological distribution data such as available from natural history museums and genebanks. With DIVA-GIS you can: (i) map the locations of sites where populations of plant or animal species were observed, and of different characters that may have been recorded for these populations. (ii) make grid maps of the distribution of biological diversity, and identify “hotspots” and areas that have complementary levels of diversity; and (iii) extract climate data for localities points, and predict the presence of species based on climate.
GRASS GIS(Geographic Resources Analysis Support System) is an open source, Free Software Geographical Information System (GIS) with raster, topological vector, image processing, and graphics production functionality that operates on various platforms through a graphical user interface and shell in X-Windows. It is released under GNU General Public License (GPL).
The unofficial ARC/INFO AND ARCVIEW symbol page.contains useful symbols (markers and lines) and fill sets.
.The World Lanuguage Mapping System (WLMS).offers.a.set.of.worldwide.language.homeland.areas.(polygons).and point locations for use in Geographic Information Systems (GIS). Dataset developed jointly by SIL and GMI maps.all.languages.of.the.�4th.Edition.Ethnologue,.and.includes.substantially.all.of.the.data.of.the.published.Ethnologue.as.a.GIS.attribute.table.
TUNEP’s GRID-Arendal’s Online GIS and Map and Graphics Database.offers.a.free.collection.of.maps,.graphics.and diagrams, illustrating environmental issues. These images are produced using desktop publication software such as Freehand, Adobe Illustrator, CorelDraw , etc.
MapCruzin is dedicated to providing the data, tools, knowledge, and expertise that will help tribes, governments, community groups, and businesses communicate the various facets of environmental, health and social problems, solutions, and achievements in such a way that they educate, raise community awareness, and facilitate.networking..Free.downloads.
VTP.The.goal.of.VTP.is.to.foster.the.creation.of.tools.for.easily.constructing.any.part.of.the.real.world.in.interactive, 3D digital form. This goal will require a synergetic convergence of the fields of CAD, GIS, visual simulation, surveying and remote sensing. VTP gathers information and tracks progress in areas such as procedural scene construction, feature extraction, and rendering algorithms. VTP writes and supports a set of software tools, including an interactive runtime environment (VTP Enviro). The tools and their source code are freely shared to help accelerate the adoption and development of the necessary technologies. To learn more about VTP and the field of virtual terrain, use the subject headings below. You can also request the VTP distribution as a CDROM or download.
AGIS for Windows:.A simple mapping and GIS shareware package
45
Community Map Builder.The Community Map Builder will provide an Open Source framework which will allow communities to jointly build geographic databases and share them over the web. It will be particularly useful.where.geographic.knowledge.is.spread.across.a.large.group.of.people.”
OpensourceGIS.offers a Global index of Open Source / Free GIS related software
Related Documents